
northerntrust.com | © 2026 Northern Trust Corporation October 21, 2026 THIRD QUARTER 2026 EARNINGS REVIEW
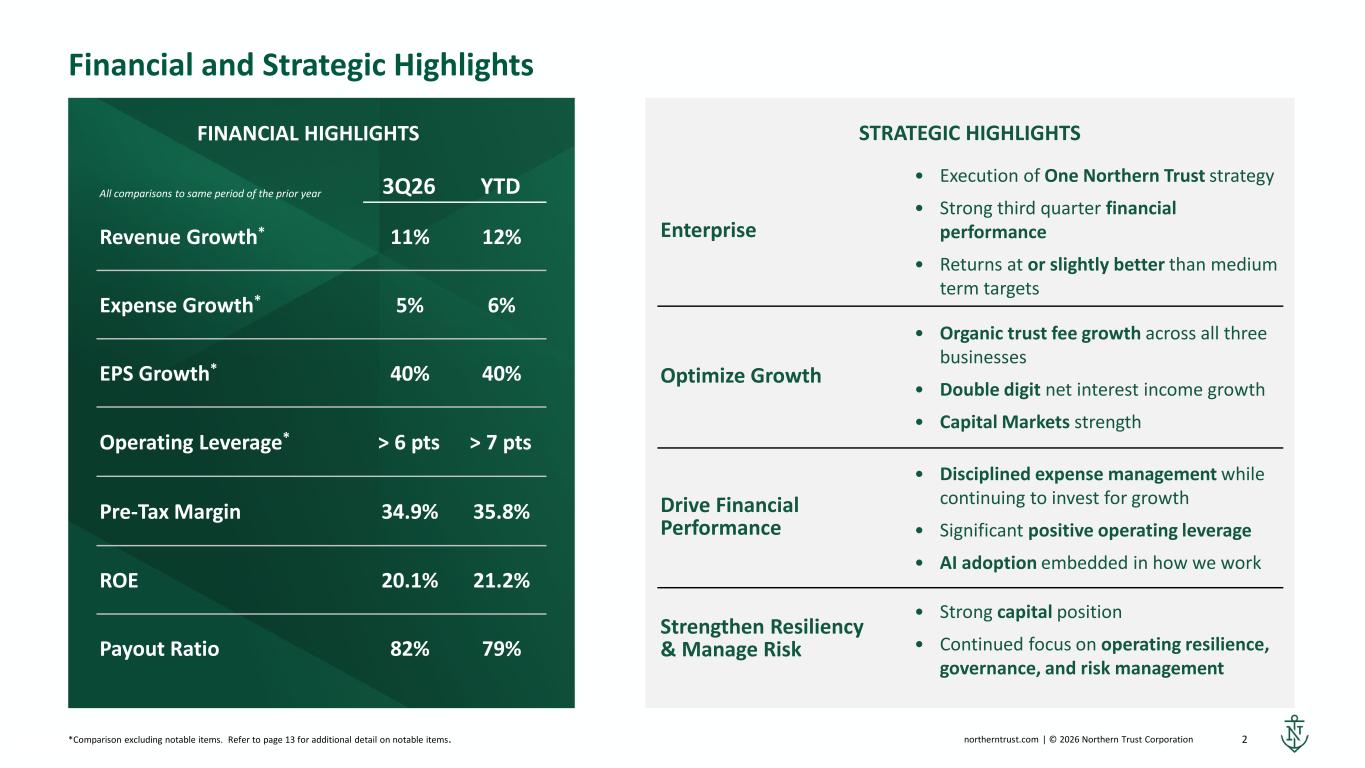
STRATEGIC HIGHLIGHTS Enterprise • Execution of One Northern Trust strategy • Strong third quarter financial performance • Returns at or slightly better than medium term targets Optimize Growth • Organic trust fee growth across all three businesses • Double digit net interest income growth • Capital Markets strength Drive Financial Performance • Disciplined expense management while continuing to invest for growth • Significant positive operating leverage • AI adoption embedded in how we work Strengthen Resiliency & Manage Risk • Strong capital position • Continued focus on operating resilience, governance, and risk management All comparisons to same period of the prior year 3Q26 YTD Revenue Growth* 11% 12% Expense Growth* 5% 6% EPS Growth* 40% 40% Operating Leverage* > 6 pts > 7 pts Pre-Tax Margin 34.9% 35.8% ROE 20.1% 21.2% Payout Ratio 82% 79% Financial and Strategic Highlights FINANCIAL HIGHLIGHTS 2northerntrust.com | © 2026 Northern Trust Corporation*Comparison excluding notable items. Refer to page 13 for additional detail on notable items.

northerntrust.com | © 2026 Northern Trust Corporation 3 FINANCIAL HIGHLIGHTS
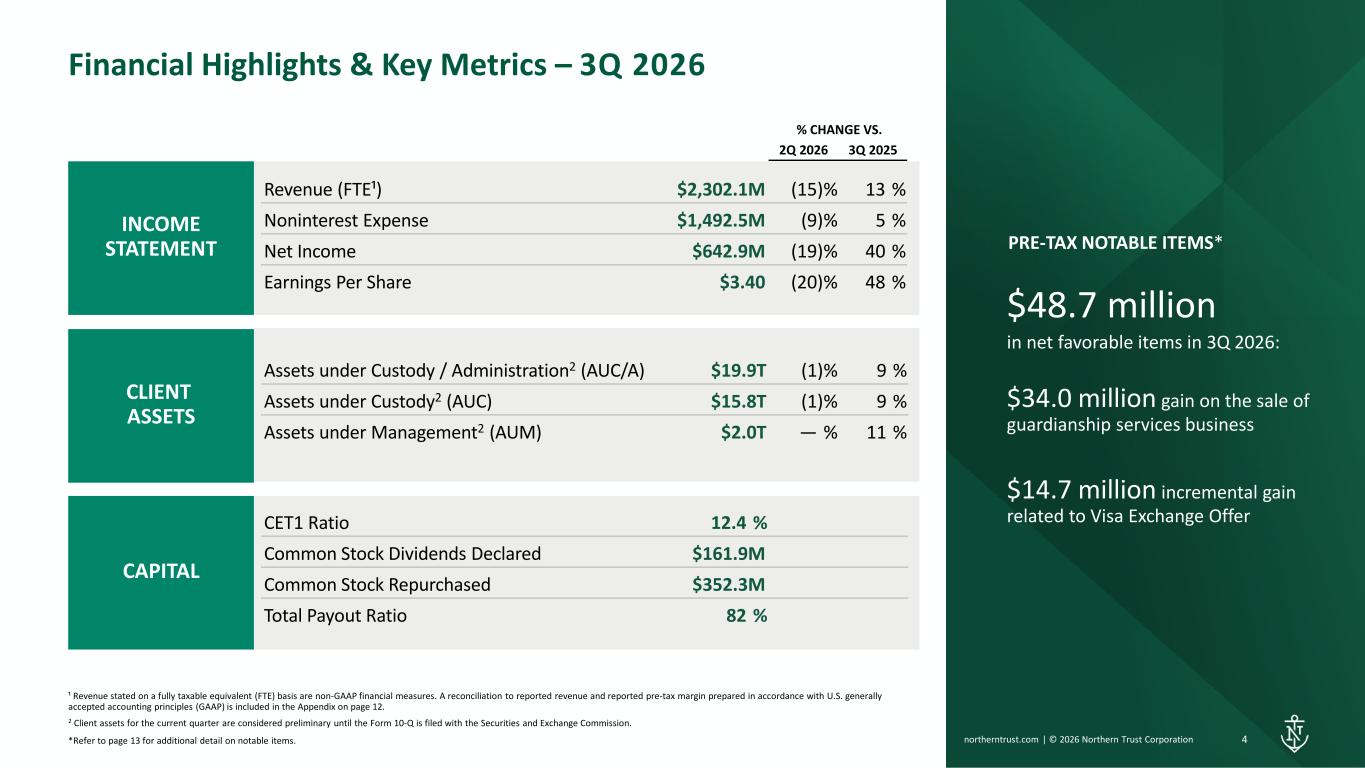
4northerntrust.com | © 2026 Northern Trust Corporation Financial Highlights & Key Metrics – 3Q 2026 % CHANGE VS. 2Q 2026 3Q 2025 Revenue (FTE¹) $2,302.1M (15)% 13 % Noninterest Expense $1,492.5M (9)% 5 % Net Income $642.9M (19)% 40 % Earnings Per Share $3.40 (20)% 48 % ¹ Revenue stated on a fully taxable equivalent (FTE) basis are non-GAAP financial measures. A reconciliation to reported revenue and reported pre-tax margin prepared in accordance with U.S. generally accepted accounting principles (GAAP) is included in the Appendix on page 12. 2 Client assets for the current quarter are considered preliminary until the Form 10-Q is filed with the Securities and Exchange Commission. *Refer to page 13 for additional detail on notable items. Assets under Custody / Administration2 (AUC/A) $19.9T (1)% 9 % Assets under Custody2 (AUC) $15.8T (1)% 9 % Assets under Management2 (AUM) $2.0T — % 11 % CET1 Ratio 12.4 % Common Stock Dividends Declared $161.9M Common Stock Repurchased $352.3M Total Payout Ratio 82 % INCOME STATEMENT PRE-TAX NOTABLE ITEMS* CLIENT ASSETS CAPITAL $48.7 million in net favorable items in 3Q 2026: $34.0 million gain on the sale of guardianship services business $14.7 million incremental gain related to Visa Exchange Offer
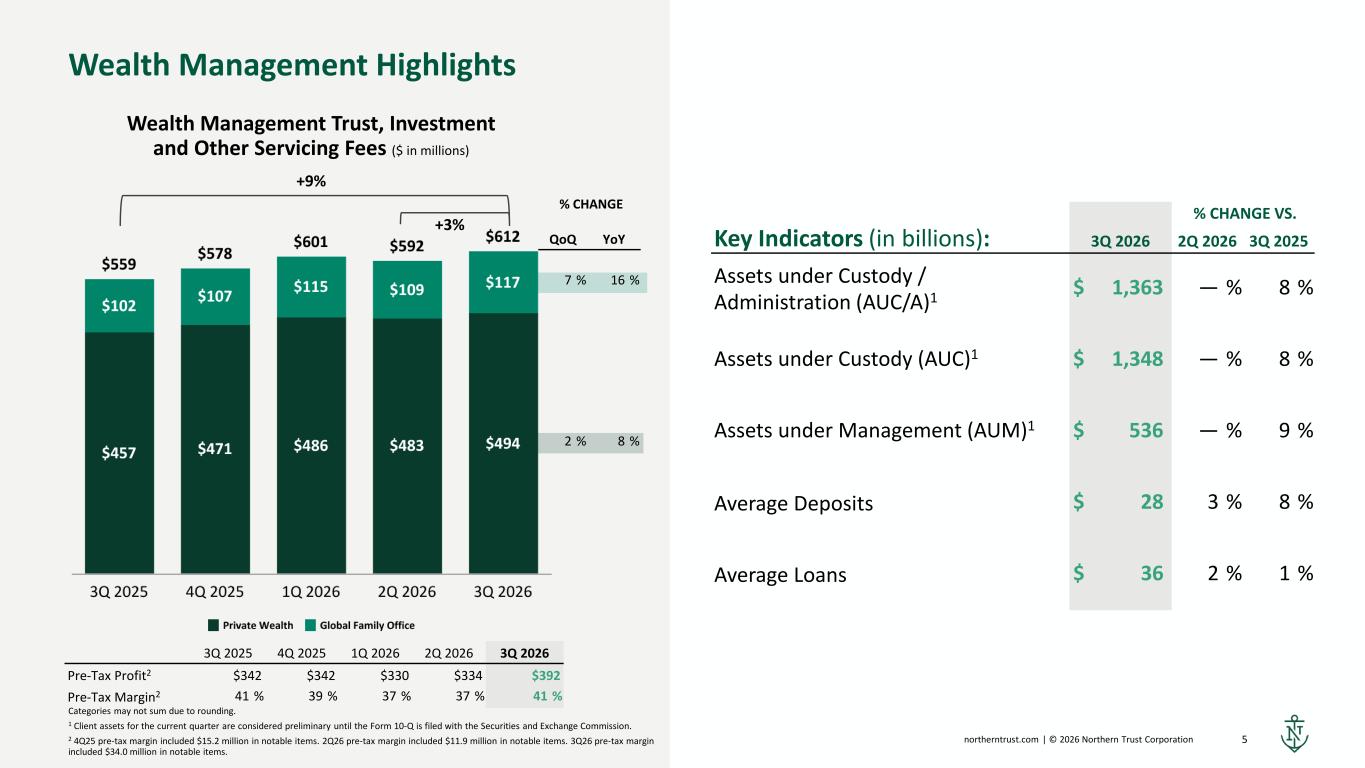
5northerntrust.com | © 2026 Northern Trust Corporation Wealth Management Trust, Investment and Other Servicing Fees ($ in millions) +9% +3% Wealth Management Highlights % CHANGE VS. Key Indicators (in billions): 3Q 2026 2Q 2026 3Q 2025 Assets under Custody / Administration (AUC/A)1 $ 1,363 — % 8 % Assets under Custody (AUC)1 $ 1,348 — % 8 % Assets under Management (AUM)1 $ 536 — % 9 % Average Deposits $ 28 3 % 8 % Average Loans $ 36 2 % 1 % 3Q 2025 4Q 2025 1Q 2026 2Q 2026 3Q 2026 Pre-Tax Profit2 $342 $342 $330 $334 $392 Pre-Tax Margin2 41 % 39 % 37 % 37 % 41 % % CHANGE QoQ YoY 7 % 16 % 2 % 8 % Categories may not sum due to rounding. 1 Client assets for the current quarter are considered preliminary until the Form 10-Q is filed with the Securities and Exchange Commission. 2 4Q25 pre-tax margin included $15.2 million in notable items. 2Q26 pre-tax margin included $11.9 million in notable items. 3Q26 pre-tax margin included $34.0 million in notable items.
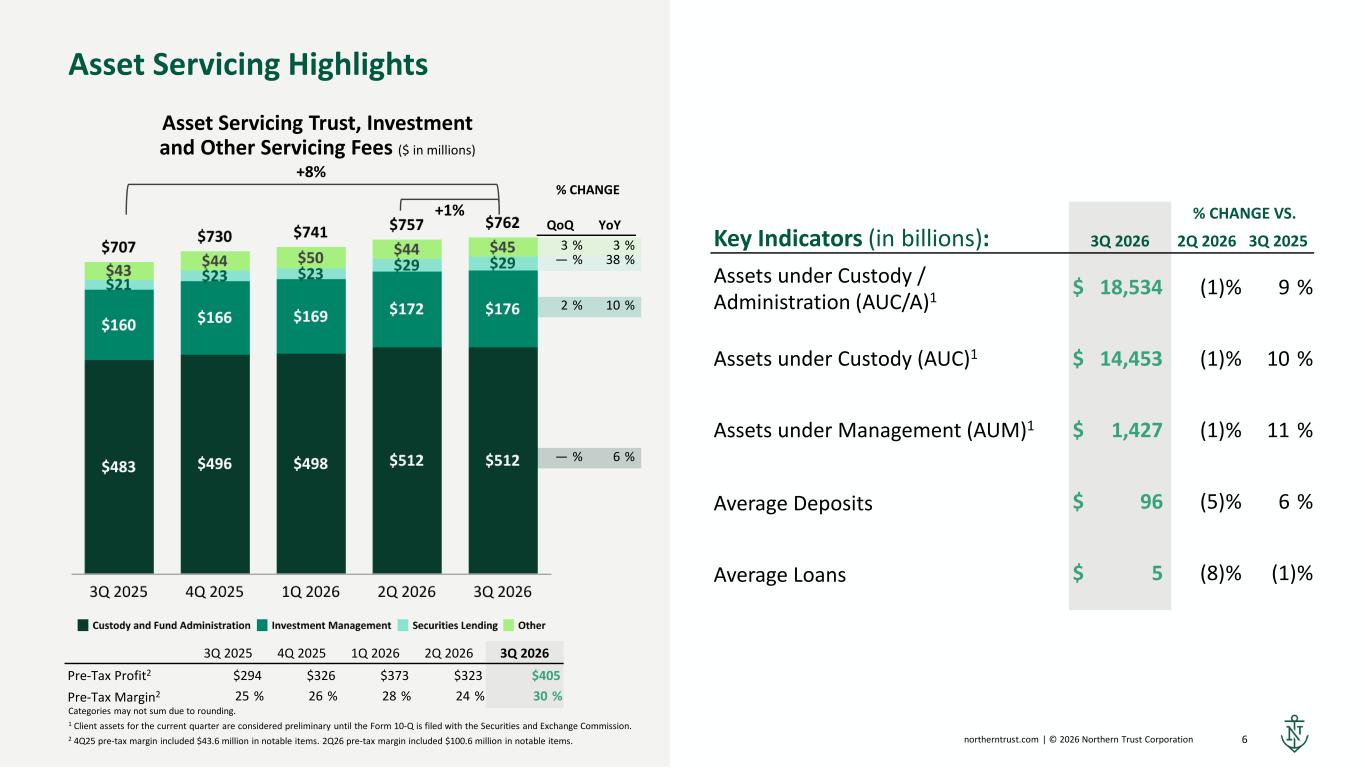
6northerntrust.com | © 2026 Northern Trust Corporation % CHANGE VS. Key Indicators (in billions): 3Q 2026 2Q 2026 3Q 2025 Assets under Custody / Administration (AUC/A)1 $ 18,534 (1)% 9 % Assets under Custody (AUC)1 $ 14,453 (1)% 10 % Assets under Management (AUM)1 $ 1,427 (1)% 11 % Average Deposits $ 96 (5)% 6 % Average Loans $ 5 (8)% (1)% Asset Servicing Trust, Investment and Other Servicing Fees ($ in millions) Asset Servicing Highlights +8% +1% 3Q 2025 4Q 2025 1Q 2026 2Q 2026 3Q 2026 Pre-Tax Profit2 $294 $326 $373 $323 $405 Pre-Tax Margin2 25 % 26 % 28 % 24 % 30 % % CHANGE QoQ YoY 3 % 3 % — % 38 % 2 % 10 % — % 6 % Categories may not sum due to rounding. 1 Client assets for the current quarter are considered preliminary until the Form 10-Q is filed with the Securities and Exchange Commission. 2 4Q25 pre-tax margin included $43.6 million in notable items. 2Q26 pre-tax margin included $100.6 million in notable items.
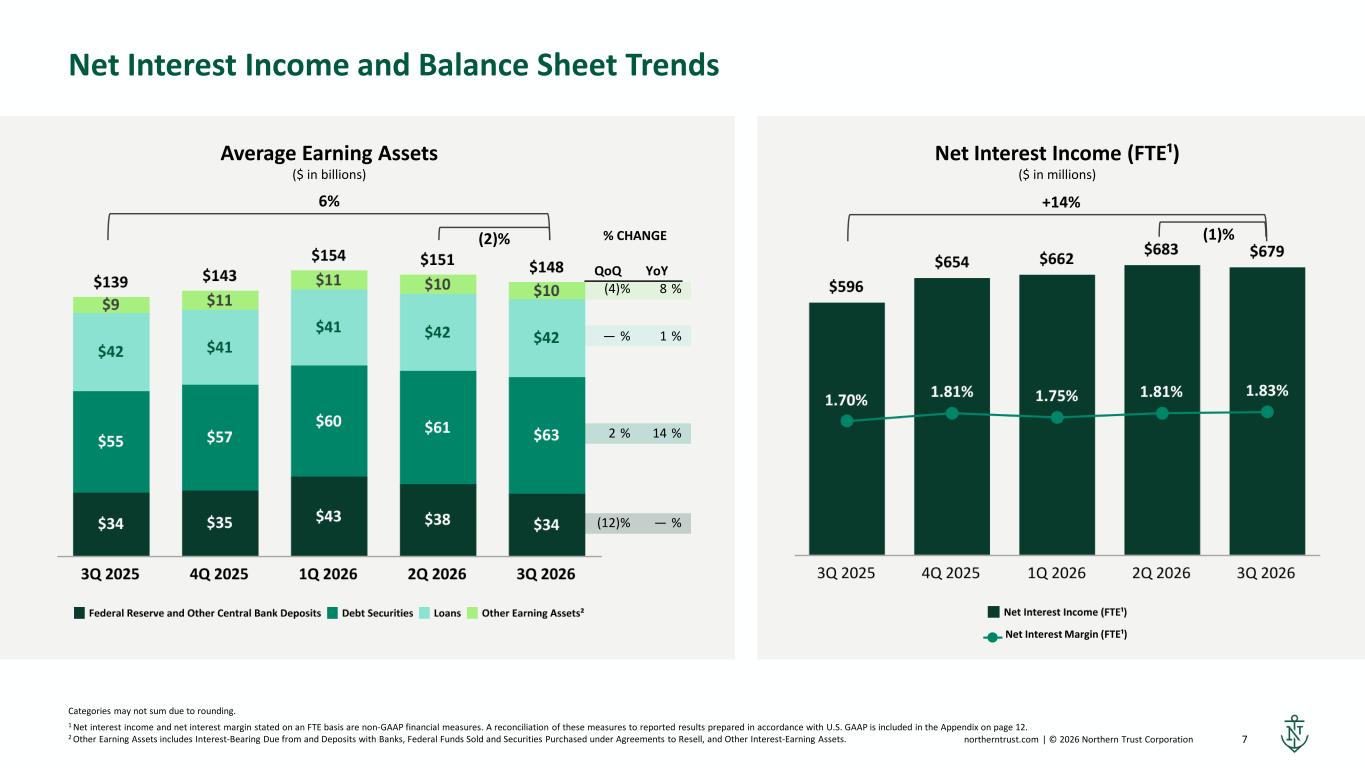
7northerntrust.com | © 2026 Northern Trust Corporation Average Earning Assets ($ in billions) Net Interest Income (FTE¹) ($ in millions) Net Interest Income and Balance Sheet Trends 6% (2)% Net Interest Margin (FTE¹) +14% (1)%% CHANGE QoQ YoY (4)% 8 % — % 1 % 2 % 14 % (12)% — % Categories may not sum due to rounding. 1 Net interest income and net interest margin stated on an FTE basis are non-GAAP financial measures. A reconciliation of these measures to reported results prepared in accordance with U.S. GAAP is included in the Appendix on page 12. 2 Other Earning Assets includes Interest-Bearing Due from and Deposits with Banks, Federal Funds Sold and Securities Purchased under Agreements to Resell, and Other Interest-Earning Assets.
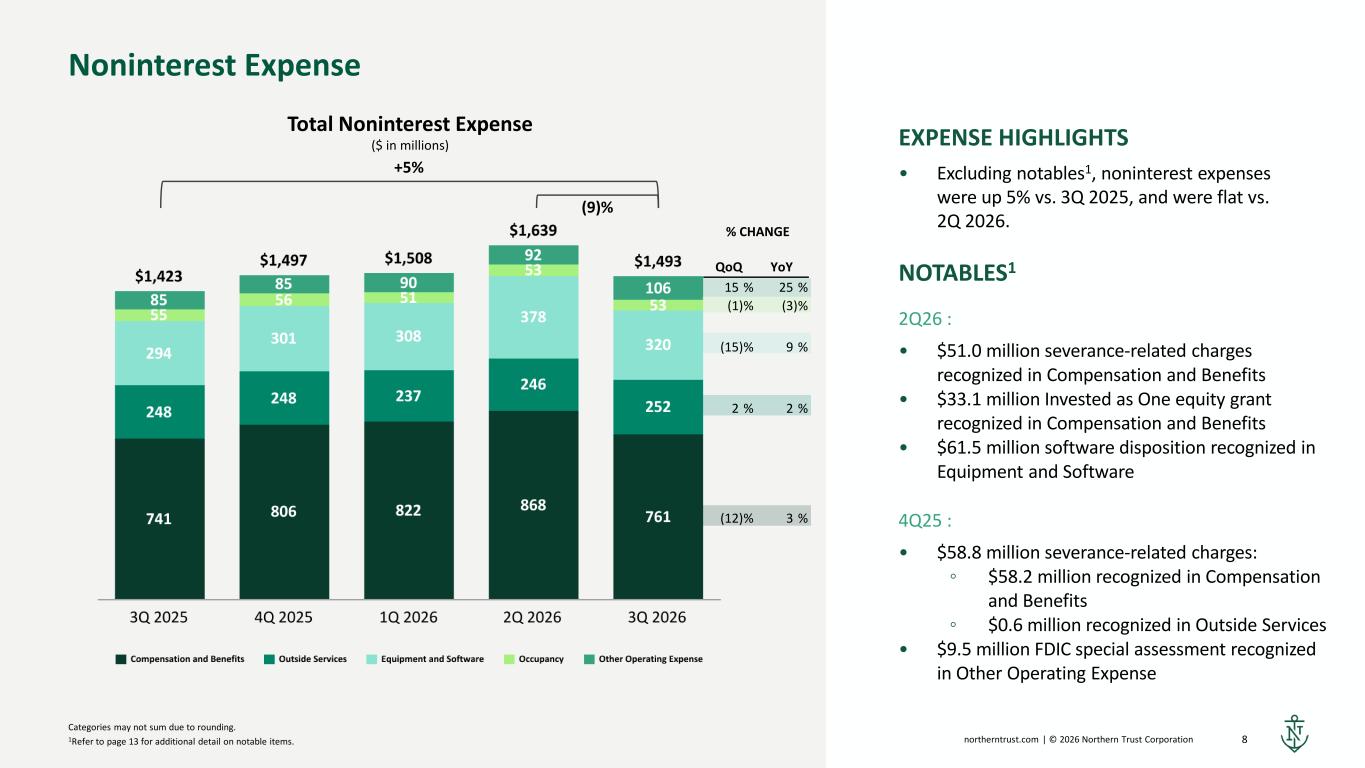
8northerntrust.com | © 2026 Northern Trust Corporation NOTABLES1 2Q26 : • $51.0 million severance-related charges recognized in Compensation and Benefits • $33.1 million Invested as One equity grant recognized in Compensation and Benefits • $61.5 million software disposition recognized in Equipment and Software 4Q25 : • $58.8 million severance-related charges: ◦ $58.2 million recognized in Compensation and Benefits ◦ $0.6 million recognized in Outside Services • $9.5 million FDIC special assessment recognized in Other Operating Expense EXPENSE HIGHLIGHTS • Excluding notables1, noninterest expenses were up 5% vs. 3Q 2025, and were flat vs. 2Q 2026. Total Noninterest Expense ($ in millions) Noninterest Expense +5% (9)% % CHANGE QoQ YoY 15 % 25 % (1)% (3)% (15)% 9 % 2 % 2 % (12)% 3 % Categories may not sum due to rounding. 1Refer to page 13 for additional detail on notable items.
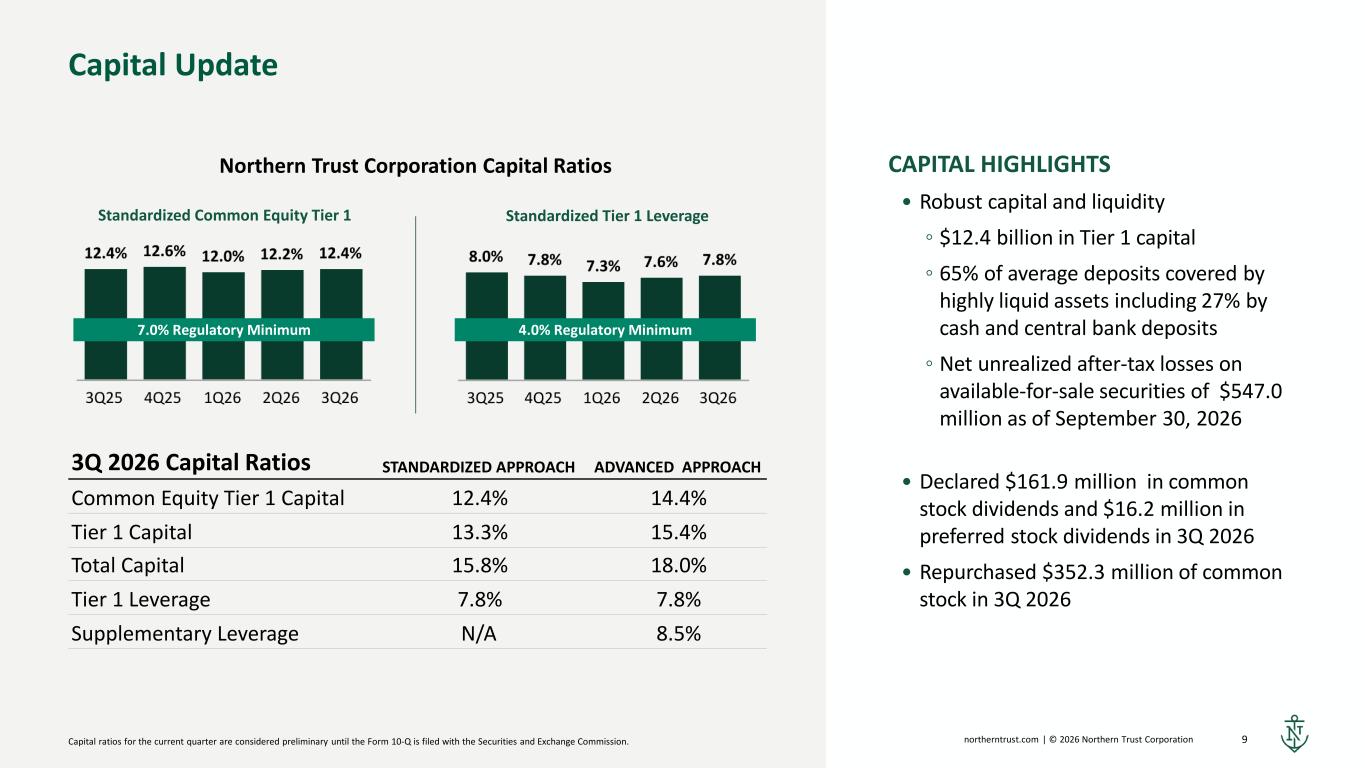
9northerntrust.com | © 2026 Northern Trust CorporationCapital ratios for the current quarter are considered preliminary until the Form 10-Q is filed with the Securities and Exchange Commission. Standardized Tier 1 Leverage CAPITAL HIGHLIGHTS • Robust capital and liquidity ◦ $12.4 billion in Tier 1 capital ◦ 65% of average deposits covered by highly liquid assets including 27% by cash and central bank deposits ◦ Net unrealized after-tax losses on available-for-sale securities of $547.0 million as of September 30, 2026 • Declared $161.9 million in common stock dividends and $16.2 million in preferred stock dividends in 3Q 2026 • Repurchased $352.3 million of common stock in 3Q 2026 Northern Trust Corporation Capital Ratios 3Q 2026 Capital Ratios STANDARDIZED APPROACH ADVANCED APPROACH Common Equity Tier 1 Capital 12.4% 14.4% Tier 1 Capital 13.3% 15.4% Total Capital 15.8% 18.0% Tier 1 Leverage 7.8% 7.8% Supplementary Leverage N/A 8.5% Standardized Common Equity Tier 1 Capital Update 7.0% Regulatory Minimum 4.0% Regulatory Minimum
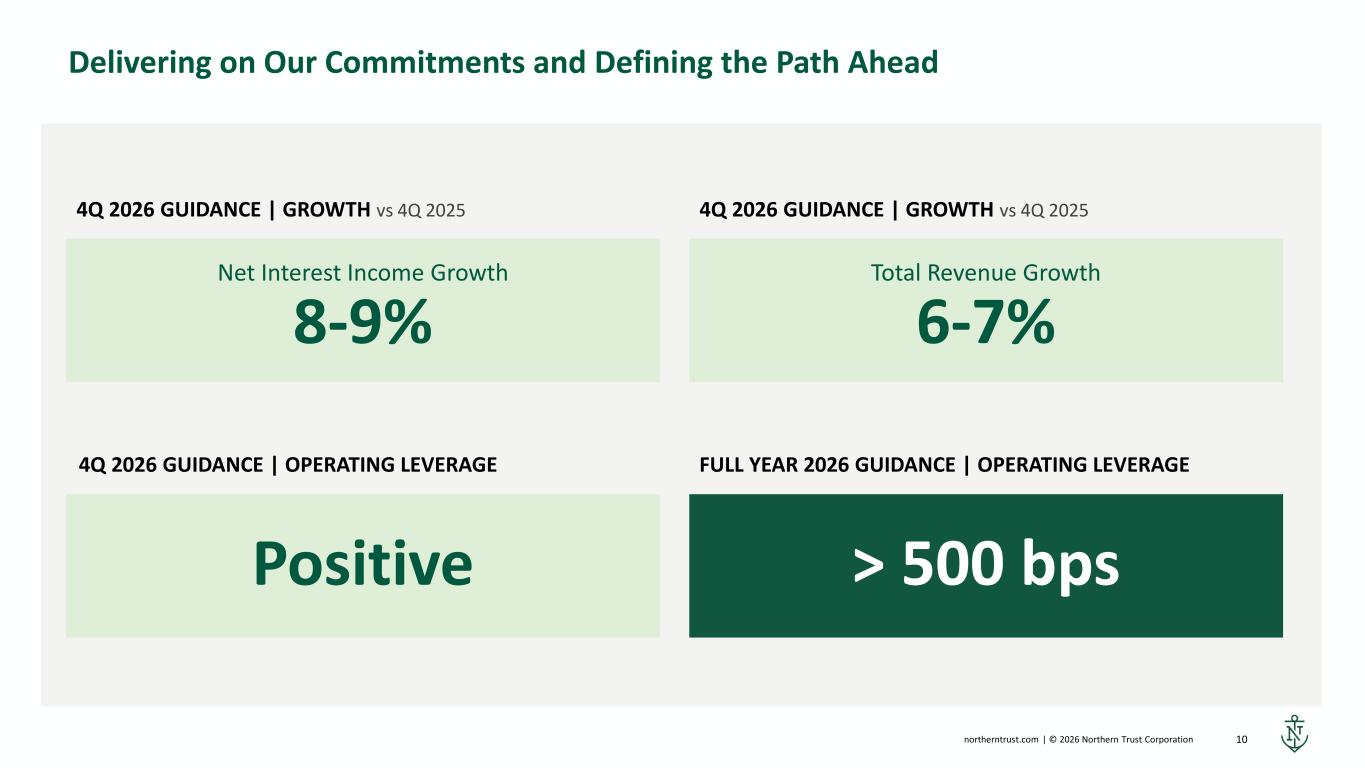
10northerntrust.com | © 2026 Northern Trust Corporation Delivering on Our Commitments and Defining the Path Ahead > 500 bps 4Q 2026 GUIDANCE | GROWTH vs 4Q 2025 Net Interest Income Growth 8-9% Positive Total Revenue Growth 6-7% 4Q 2026 GUIDANCE | OPERATING LEVERAGE FULL YEAR 2026 GUIDANCE | OPERATING LEVERAGE 4Q 2026 GUIDANCE | GROWTH vs 4Q 2025

northerntrust.com | © 2026 Northern Trust Corporation 11 APPENDIX
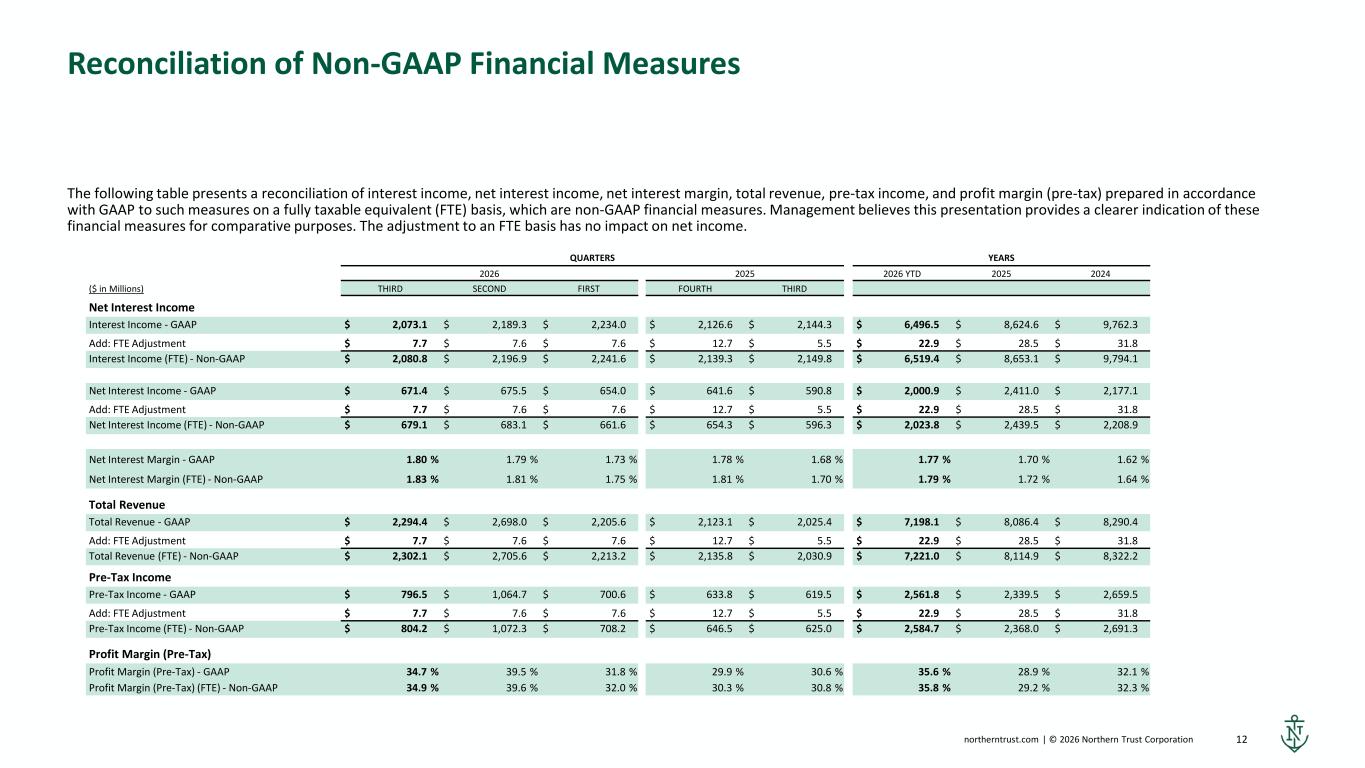
12northerntrust.com | © 2026 Northern Trust Corporation Reconciliation of Non-GAAP Financial Measures The following table presents a reconciliation of interest income, net interest income, net interest margin, total revenue, pre-tax income, and profit margin (pre-tax) prepared in accordance with GAAP to such measures on a fully taxable equivalent (FTE) basis, which are non-GAAP financial measures. Management believes this presentation provides a clearer indication of these financial measures for comparative purposes. The adjustment to an FTE basis has no impact on net income. QUARTERS YEARS 2026 2025 2026 YTD 2025 2024 ($ in Millions) THIRD SECOND FIRST FOURTH THIRD Net Interest Income Interest Income - GAAP $ 2,073.1 $ 2,189.3 $ 2,234.0 $ 2,126.6 $ 2,144.3 $ 6,496.5 $ 8,624.6 $ 9,762.3 Add: FTE Adjustment $ 7.7 $ 7.6 $ 7.6 $ 12.7 $ 5.5 $ 22.9 $ 28.5 $ 31.8 Interest Income (FTE) - Non-GAAP $ 2,080.8 $ 2,196.9 $ 2,241.6 $ 2,139.3 $ 2,149.8 $ 6,519.4 $ 8,653.1 $ 9,794.1 Net Interest Income - GAAP $ 671.4 $ 675.5 $ 654.0 $ 641.6 $ 590.8 $ 2,000.9 $ 2,411.0 $ 2,177.1 Add: FTE Adjustment $ 7.7 $ 7.6 $ 7.6 $ 12.7 $ 5.5 $ 22.9 $ 28.5 $ 31.8 Net Interest Income (FTE) - Non-GAAP $ 679.1 $ 683.1 $ 661.6 $ 654.3 $ 596.3 $ 2,023.8 $ 2,439.5 $ 2,208.9 Net Interest Margin - GAAP 1.80 % 1.79 % 1.73 % 1.78 % 1.68 % 1.77 % 1.70 % 1.62 % Net Interest Margin (FTE) - Non-GAAP 1.83 % 1.81 % 1.75 % 1.81 % 1.70 % 1.79 % 1.72 % 1.64 % Total Revenue Total Revenue - GAAP $ 2,294.4 $ 2,698.0 $ 2,205.6 $ 2,123.1 $ 2,025.4 $ 7,198.1 $ 8,086.4 $ 8,290.4 Add: FTE Adjustment $ 7.7 $ 7.6 $ 7.6 $ 12.7 $ 5.5 $ 22.9 $ 28.5 $ 31.8 Total Revenue (FTE) - Non-GAAP $ 2,302.1 $ 2,705.6 $ 2,213.2 $ 2,135.8 $ 2,030.9 $ 7,221.0 $ 8,114.9 $ 8,322.2 Pre-Tax Income Pre-Tax Income - GAAP $ 796.5 $ 1,064.7 $ 700.6 $ 633.8 $ 619.5 $ 2,561.8 $ 2,339.5 $ 2,659.5 Add: FTE Adjustment $ 7.7 $ 7.6 $ 7.6 $ 12.7 $ 5.5 $ 22.9 $ 28.5 $ 31.8 Pre-Tax Income (FTE) - Non-GAAP $ 804.2 $ 1,072.3 $ 708.2 $ 646.5 $ 625.0 $ 2,584.7 $ 2,368.0 $ 2,691.3 Profit Margin (Pre-Tax) Profit Margin (Pre-Tax) - GAAP 34.7 % 39.5 % 31.8 % 29.9 % 30.6 % 35.6 % 28.9 % 32.1 % Profit Margin (Pre-Tax) (FTE) - Non-GAAP 34.9 % 39.6 % 32.0 % 30.3 % 30.8 % 35.8 % 29.2 % 32.3 %
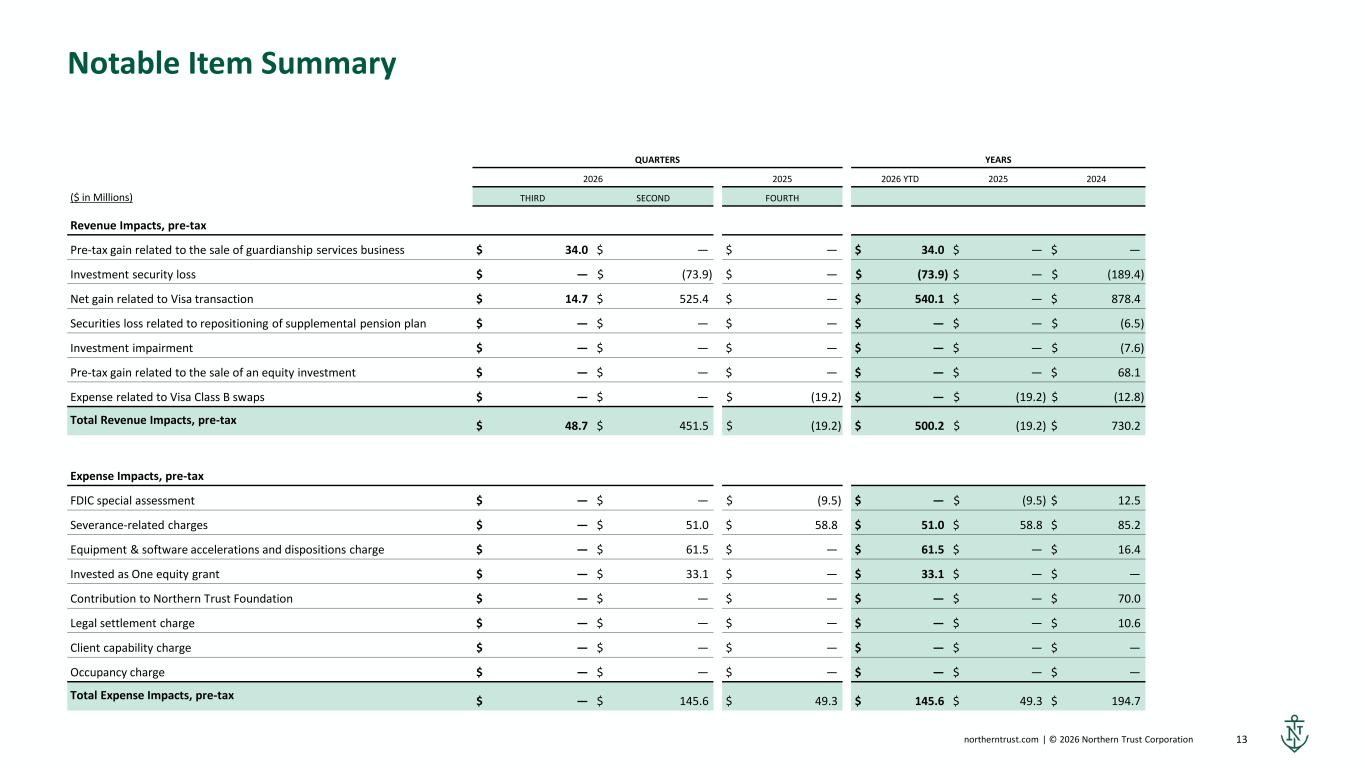
13northerntrust.com | © 2026 Northern Trust Corporation Notable Item Summary QUARTERS YEARS 2026 2025 2026 YTD 2025 2024 ($ in Millions) THIRD SECOND FOURTH Revenue Impacts, pre-tax Pre-tax gain related to the sale of guardianship services business $ 34.0 $ — $ — $ 34.0 $ — $ — Investment security loss $ — $ (73.9) $ — $ (73.9) $ — $ (189.4) Net gain related to Visa transaction $ 14.7 $ 525.4 $ — $ 540.1 $ — $ 878.4 Securities loss related to repositioning of supplemental pension plan $ — $ — $ — $ — $ — $ (6.5) Investment impairment $ — $ — $ — $ — $ — $ (7.6) Pre-tax gain related to the sale of an equity investment $ — $ — $ — $ — $ — $ 68.1 Expense related to Visa Class B swaps $ — $ — $ (19.2) $ — $ (19.2) $ (12.8) Total Revenue Impacts, pre-tax $ 48.7 $ 451.5 $ (19.2) $ 500.2 $ (19.2) $ 730.2 Expense Impacts, pre-tax FDIC special assessment $ — $ — $ (9.5) $ — $ (9.5) $ 12.5 Severance-related charges $ — $ 51.0 $ 58.8 $ 51.0 $ 58.8 $ 85.2 Equipment & software accelerations and dispositions charge $ — $ 61.5 $ — $ 61.5 $ — $ 16.4 Invested as One equity grant $ — $ 33.1 $ — $ 33.1 $ — $ — Contribution to Northern Trust Foundation $ — $ — $ — $ — $ — $ 70.0 Legal settlement charge $ — $ — $ — $ — $ — $ 10.6 Client capability charge $ — $ — $ — $ — $ — $ — Occupancy charge $ — $ — $ — $ — $ — $ — Total Expense Impacts, pre-tax $ — $ 145.6 $ 49.3 $ 145.6 $ 49.3 $ 194.7
14northerntrust.com | © 2026 Northern Trust Corporation Forward-Looking Statements This presentation may include statements which constitute “forward-looking statements” within the meaning of the safe harbor provisions of the Private Securities Litigation Reform Act of 1995. Forward-looking statements are identified typically by words or phrases such as “believe,” “expect,” “anticipate,” “intend,” “estimate,” “project,” “likely,” “plan,” “goal,” “target,” “strategy,” and similar expressions or future or conditional verbs such as “may,” “will,” “should,” “would,” and “could.” Forward-looking statements include statements, other than those related to historical facts, that relate to Northern Trust’s financial results and outlook, capital adequacy, dividend policy and share repurchase program, accounting estimates and assumptions, credit quality including allowance levels, future pension plan contributions, effective tax rate, anticipated expense levels, contingent liabilities, acquisitions, strategies, market and industry trends, and expectations regarding the impact of accounting pronouncements and legislation. These statements are based on Northern Trust’s current beliefs and expectations of future events or future results, and involve risks and uncertainties that are difficult to predict and subject to change. These statements are also based on assumptions about many important factors, including the factors discussed in Northern Trust’s most recent annual report on Form 10-K and other filings with the U.S. Securities and Exchange Commission, all of which are available on Northern Trust’s website. We caution you not to place undue reliance on any forward-looking statement as actual results may differ materially from those expressed or implied by forward-looking statements. Northern Trust assumes no obligation to update its forward-looking statements. This presentation should be reviewed together with Northern Trust Corporation’s Third Quarter 2026 earnings press release.

15northerntrust.com | © 2026 Northern Trust Corporation