
Financial Trends Third Quarter 2026 October 21, 2026 The historical financial results and trends reflected in this report are not indicative of future financial results and trends for Northern Trust Corporation. This report should be read in conjunction with the Corporation's Third Quarter 2026 earnings press release, 2025 Annual Report to Shareholders and periodic reports to the Securities and Exchange Commission, all of which contain additional information about factors that could affect the Corporation's future financial results and trends. The Corporation assumes no obligation to update this report.
1 7 Financial Summary Interest Rate Trends 2 8 Net Income Trends Asset Quality 3 9 Reporting Segment Results Client Assets 4 10 Balance Sheet (EOP) Reconciliation to FTE 5 11 Regulatory Capital Reconciliation to FTE (Ratios) 6 Balance Sheet Trends TABLE OF CONTENTS
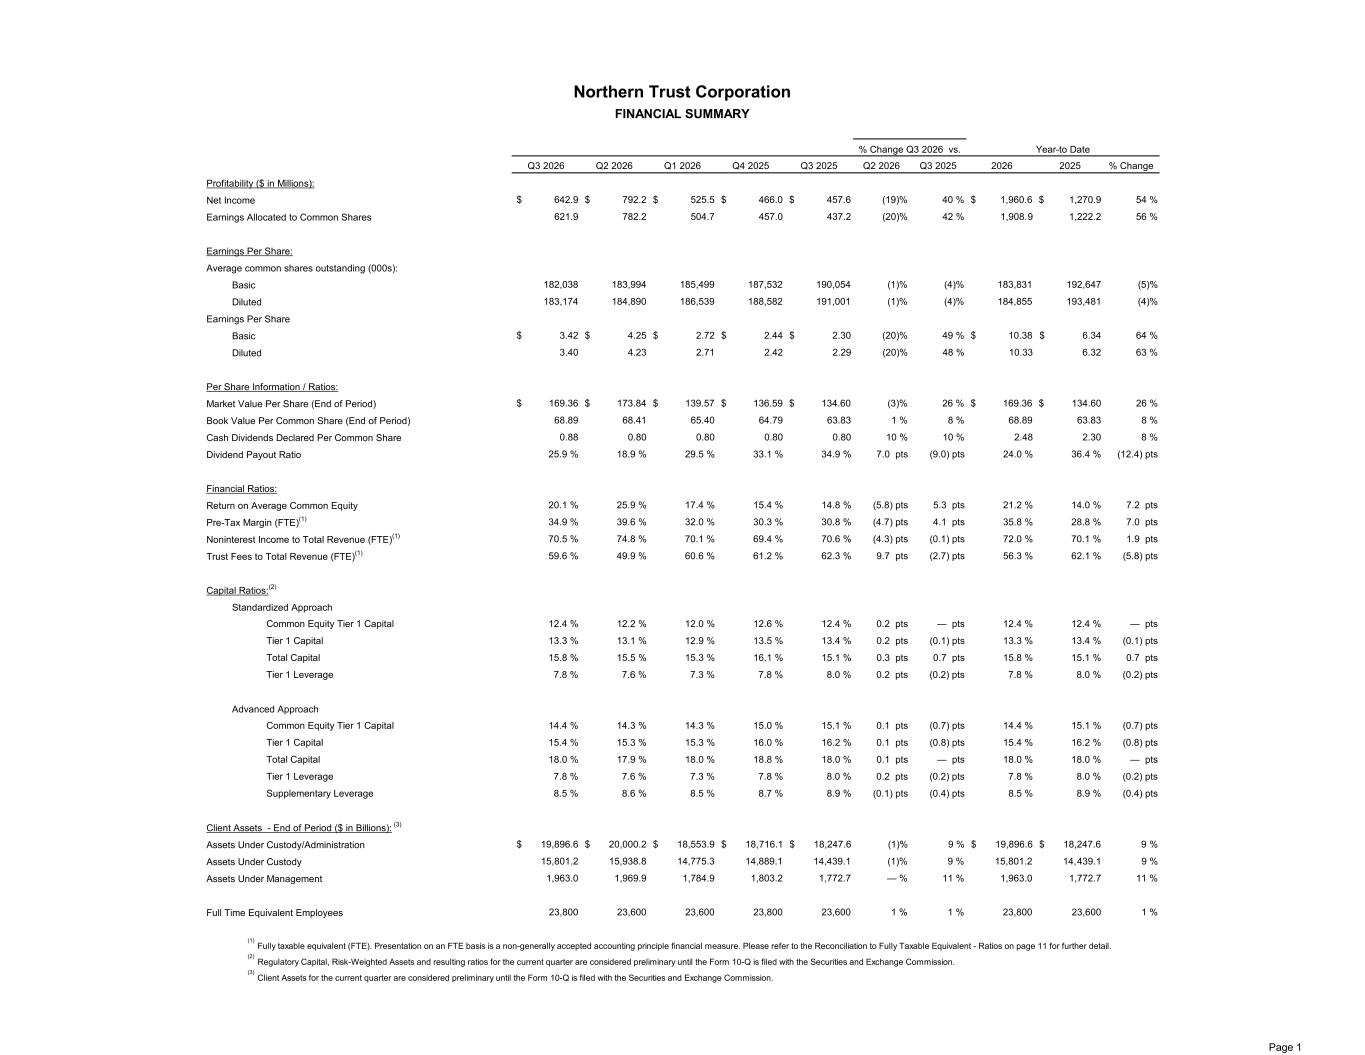
Q3 2026 Q2 2026 Q1 2026 Q4 2025 Q3 2025 Q2 2026 Q3 2025 2026 2025 % Change $ 642.9 $ 792.2 $ 525.5 $ 466.0 $ 457.6 (19)% 40 % $ 1,960.6 $ 1,270.9 54 % 621.9 782.2 504.7 457.0 437.2 (20)% 42 % 1,908.9 1,222.2 56 % 182,038 183,994 185,499 187,532 190,054 (1)% (4)% 183,831 192,647 (5)% 183,174 184,890 186,539 188,582 191,001 (1)% (4)% 184,855 193,481 (4)% $ 3.42 $ 4.25 $ 2.72 $ 2.44 $ 2.30 (20)% 49 % $ 10.38 $ 6.34 64 % 3.40 4.23 2.71 2.42 2.29 (20)% 48 % 10.33 6.32 63 % $ 169.36 $ 173.84 $ 139.57 $ 136.59 $ 134.60 (3)% 26 % $ 169.36 $ 134.60 26 % 68.89 68.41 65.40 64.79 63.83 1 % 8 % 68.89 63.83 8 % 0.88 0.80 0.80 0.80 0.80 10 % 10 % 2.48 2.30 8 % 25.9 % 18.9 % 29.5 % 33.1 % 34.9 % 7.0 pts (9.0) pts 24.0 % 36.4 % (12.4) pts 20.1 % 25.9 % 17.4 % 15.4 % 14.8 % (5.8) pts 5.3 pts 21.2 % 14.0 % 7.2 pts 34.9 % 39.6 % 32.0 % 30.3 % 30.8 % (4.7) pts 4.1 pts 35.8 % 28.8 % 7.0 pts 70.5 % 74.8 % 70.1 % 69.4 % 70.6 % (4.3) pts (0.1) pts 72.0 % 70.1 % 1.9 pts 59.6 % 49.9 % 60.6 % 61.2 % 62.3 % 9.7 pts (2.7) pts 56.3 % 62.1 % (5.8) pts Common Equity Tier 1 Capital 12.4 % 12.2 % 12.0 % 12.6 % 12.4 % 0.2 pts — pts 12.4 % 12.4 % — pts Tier 1 Capital 13.3 % 13.1 % 12.9 % 13.5 % 13.4 % 0.2 pts (0.1) pts 13.3 % 13.4 % (0.1) pts Total Capital 15.8 % 15.5 % 15.3 % 16.1 % 15.1 % 0.3 pts 0.7 pts 15.8 % 15.1 % 0.7 pts Tier 1 Leverage 7.8 % 7.6 % 7.3 % 7.8 % 8.0 % 0.2 pts (0.2) pts 7.8 % 8.0 % (0.2) pts Common Equity Tier 1 Capital 14.4 % 14.3 % 14.3 % 15.0 % 15.1 % 0.1 pts (0.7) pts 14.4 % 15.1 % (0.7) pts Tier 1 Capital 15.4 % 15.3 % 15.3 % 16.0 % 16.2 % 0.1 pts (0.8) pts 15.4 % 16.2 % (0.8) pts Total Capital 18.0 % 17.9 % 18.0 % 18.8 % 18.0 % 0.1 pts — pts 18.0 % 18.0 % — pts Tier 1 Leverage 7.8 % 7.6 % 7.3 % 7.8 % 8.0 % 0.2 pts (0.2) pts 7.8 % 8.0 % (0.2) pts Supplementary Leverage 8.5 % 8.6 % 8.5 % 8.7 % 8.9 % (0.1) pts (0.4) pts 8.5 % 8.9 % (0.4) pts $ 19,896.6 $ 20,000.2 $ 18,553.9 $ 18,716.1 $ 18,247.6 (1)% 9 % $ 19,896.6 $ 18,247.6 9 % 15,801.2 15,938.8 14,775.3 14,889.1 14,439.1 (1)% 9 % 15,801.2 14,439.1 9 % 1,963.0 1,969.9 1,784.9 1,803.2 1,772.7 — % 11 % 1,963.0 1,772.7 11 % 23,800 23,600 23,600 23,800 23,600 1 % 1 % 23,800 23,600 1 % (1) (2) (3) Full Time Equivalent Employees Fully taxable equivalent (FTE). Presentation on an FTE basis is a non-generally accepted accounting principle financial measure. Please refer to the Reconciliation to Fully Taxable Equivalent - Ratios on page 11 for further detail. Client Assets for the current quarter are considered preliminary until the Form 10-Q is filed with the Securities and Exchange Commission. Regulatory Capital, Risk-Weighted Assets and resulting ratios for the current quarter are considered preliminary until the Form 10-Q is filed with the Securities and Exchange Commission. Advanced Approach Assets Under Management Assets Under Custody Client Assets - End of Period ($ in Billions): (3) Assets Under Custody/Administration Return on Average Common Equity Pre-Tax Margin (FTE)(1) Noninterest Income to Total Revenue (FTE)(1) Capital Ratios:(2) Standardized Approach Trust Fees to Total Revenue (FTE)(1) Cash Dividends Declared Per Common Share Book Value Per Common Share (End of Period) Market Value Per Share (End of Period) Financial Ratios: Dividend Payout Ratio Basic Diluted Earnings Per Share Basic Per Share Information / Ratios: Diluted Profitability ($ in Millions): Net Income Northern Trust Corporation FINANCIAL SUMMARY Average common shares outstanding (000s): Earnings Per Share: Earnings Allocated to Common Shares Year-to Date% Change Q3 2026 vs. Page 1
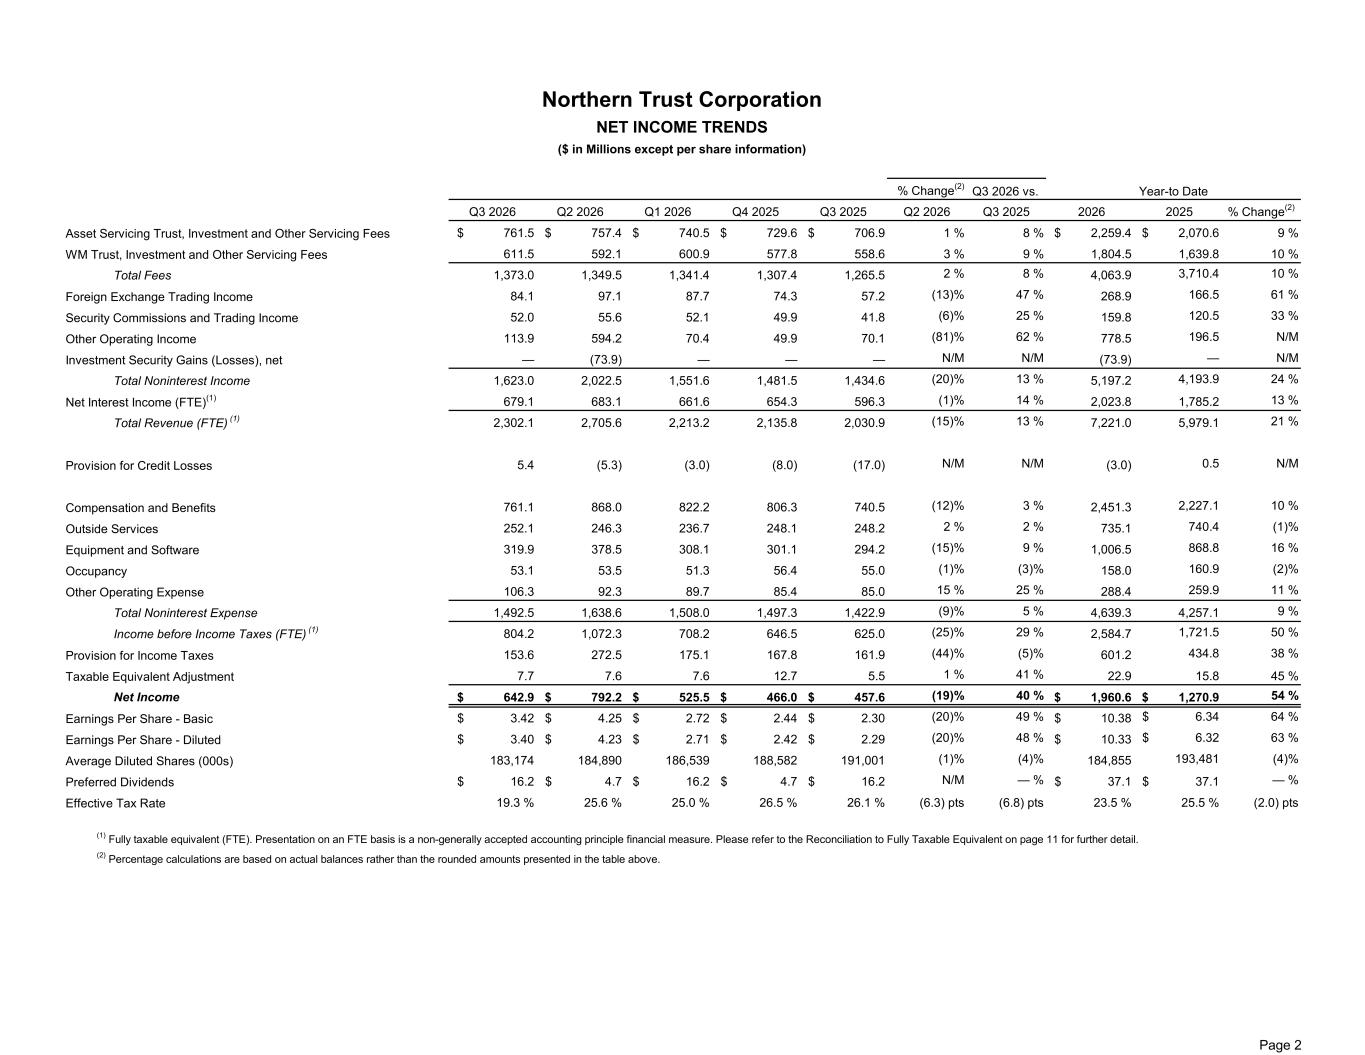
% Change(2) Q3 2026 Q2 2026 Q1 2026 Q4 2025 Q3 2025 Q2 2026 Q3 2025 2026 2025 % Change(2) $ 761.5 $ 757.4 $ 740.5 $ 729.6 $ 706.9 1 % 8 % $ 2,259.4 $ 2,070.6 9 % 611.5 592.1 600.9 577.8 558.6 3 % 9 % 1,804.5 1,639.8 10 % Total Fees 1,373.0 1,349.5 1,341.4 1,307.4 1,265.5 2 % 8 % 4,063.9 3,710.4 10 % 84.1 97.1 87.7 74.3 57.2 (13)% 47 % 268.9 166.5 61 % 52.0 55.6 52.1 49.9 41.8 (6)% 25 % 159.8 120.5 33 % 113.9 594.2 70.4 49.9 70.1 (81)% 62 % 778.5 196.5 N/M — (73.9) — — — N/M N/M (73.9) — N/M Total Noninterest Income 1,623.0 2,022.5 1,551.6 1,481.5 1,434.6 (20)% 13 % 5,197.2 4,193.9 24 % 679.1 683.1 661.6 654.3 596.3 (1)% 14 % 2,023.8 1,785.2 13 % Total Revenue (FTE) (1) 2,302.1 2,705.6 2,213.2 2,135.8 2,030.9 (15)% 13 % 7,221.0 5,979.1 21 % 5.4 (5.3) (3.0) (8.0) (17.0) N/M N/M (3.0) 0.5 N/M 761.1 868.0 822.2 806.3 740.5 (12)% 3 % 2,451.3 2,227.1 10 % 252.1 246.3 236.7 248.1 248.2 2 % 2 % 735.1 740.4 (1)% 319.9 378.5 308.1 301.1 294.2 (15)% 9 % 1,006.5 868.8 16 % 53.1 53.5 51.3 56.4 55.0 (1)% (3)% 158.0 160.9 (2)% 106.3 92.3 89.7 85.4 85.0 15 % 25 % 288.4 259.9 11 % Total Noninterest Expense 1,492.5 1,638.6 1,508.0 1,497.3 1,422.9 (9)% 5 % 4,639.3 4,257.1 9 % Income before Income Taxes (FTE) (1) 804.2 1,072.3 708.2 646.5 625.0 (25)% 29 % 2,584.7 1,721.5 50 % 153.6 272.5 175.1 167.8 161.9 (44)% (5)% 601.2 434.8 38 % 7.7 7.6 7.6 12.7 5.5 1 % 41 % 22.9 15.8 45 % Net Income $ 642.9 $ 792.2 $ 525.5 $ 466.0 $ 457.6 (19)% 40 % $ 1,960.6 $ 1,270.9 54 % $ 3.42 $ 4.25 $ 2.72 $ 2.44 $ 2.30 (20)% 49 % $ 10.38 $ 6.34 64 % $ 3.40 $ 4.23 $ 2.71 $ 2.42 $ 2.29 (20)% 48 % $ 10.33 $ 6.32 63 % 183,174 184,890 186,539 188,582 191,001 (1)% (4)% 184,855 193,481 (4)% $ 16.2 $ 4.7 $ 16.2 $ 4.7 $ 16.2 N/M — % $ 37.1 $ 37.1 — % 19.3 % 25.6 % 25.0 % 26.5 % 26.1 % (6.3) pts (6.8) pts 23.5 % 25.5 % (2.0) pts (1) Fully taxable equivalent (FTE). Presentation on an FTE basis is a non-generally accepted accounting principle financial measure. Please refer to the Reconciliation to Fully Taxable Equivalent on page 11 for further detail. (2) Percentage calculations are based on actual balances rather than the rounded amounts presented in the table above. Average Diluted Shares (000s) Earnings Per Share - Diluted Preferred Dividends Effective Tax Rate Occupancy Other Operating Expense Provision for Income Taxes Taxable Equivalent Adjustment Earnings Per Share - Basic Net Interest Income (FTE)(1) Provision for Credit Losses Outside Services Compensation and Benefits Equipment and Software WM Trust, Investment and Other Servicing Fees Foreign Exchange Trading Income Security Commissions and Trading Income Investment Security Gains (Losses), net Other Operating Income Asset Servicing Trust, Investment and Other Servicing Fees ($ in Millions except per share information) NET INCOME TRENDS Northern Trust Corporation Q3 2026 vs. Year-to Date Page 2
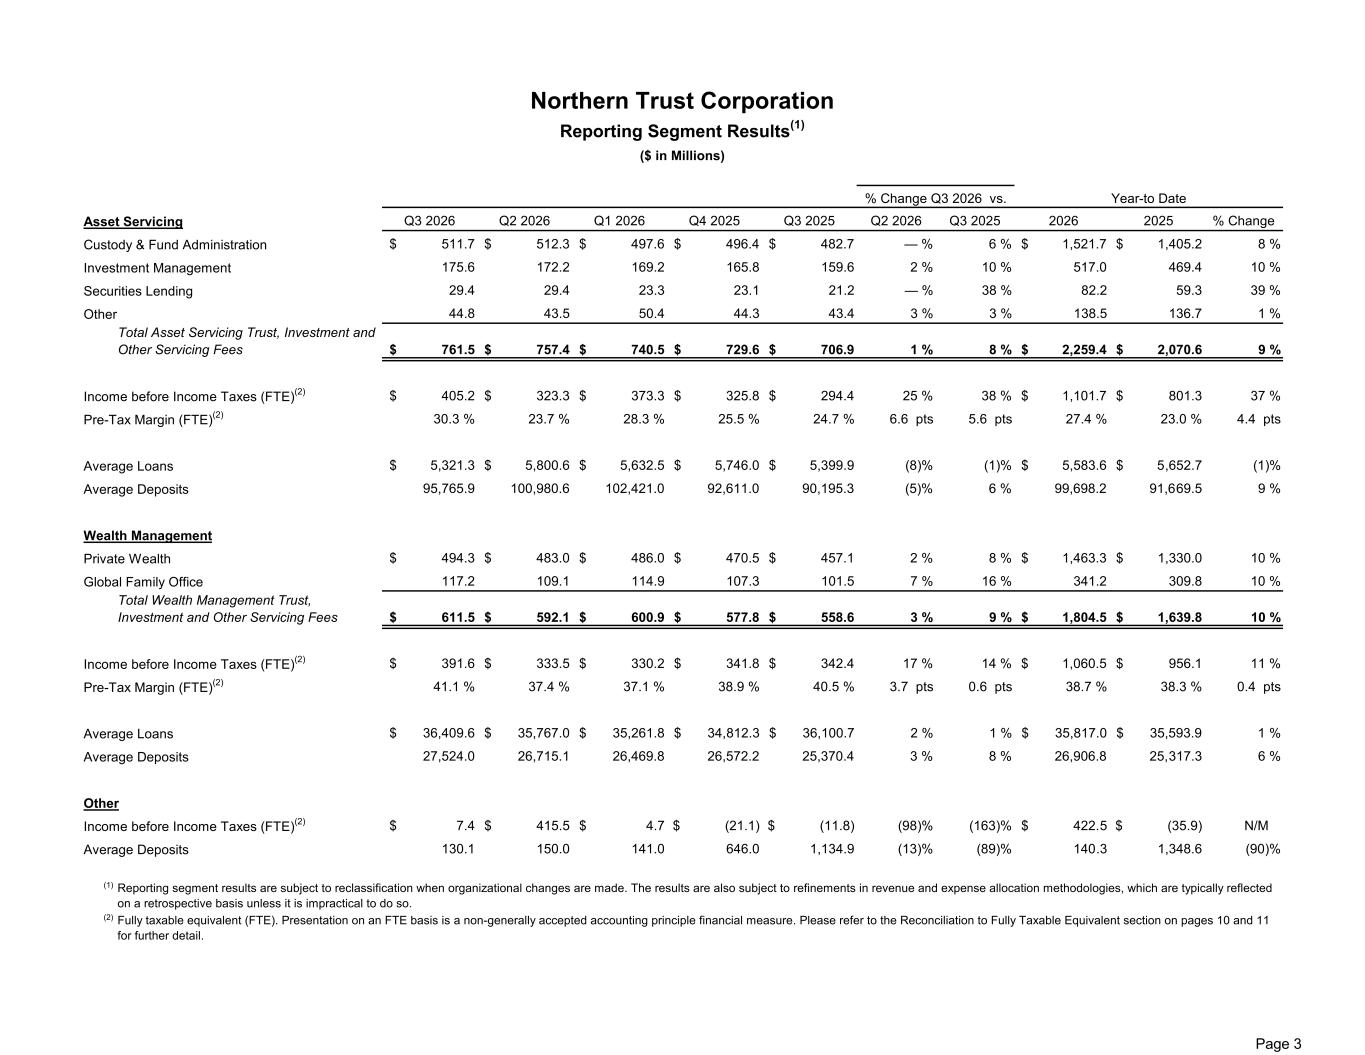
Q3 2026 Q2 2026 Q1 2026 Q4 2025 Q3 2025 Q2 2026 Q3 2025 2026 2025 % Change $ 511.7 $ 512.3 $ 497.6 $ 496.4 $ 482.7 — % 6 % $ 1,521.7 $ 1,405.2 8 % 175.6 172.2 169.2 165.8 159.6 2 % 10 % 517.0 469.4 10 % 29.4 29.4 23.3 23.1 21.2 — % 38 % 82.2 59.3 39 % 44.8 43.5 50.4 44.3 43.4 3 % 3 % 138.5 136.7 1 % Total Asset Servicing Trust, Investment and Other Servicing Fees $ 761.5 $ 757.4 $ 740.5 $ 729.6 $ 706.9 1 % 8 % $ 2,259.4 $ 2,070.6 9 % $ 405.2 $ 323.3 $ 373.3 $ 325.8 $ 294.4 25 % 38 % $ 1,101.7 $ 801.3 37 % 30.3 % 23.7 % 28.3 % 25.5 % 24.7 % 6.6 pts 5.6 pts 27.4 % 23.0 % 4.4 pts $ 5,321.3 $ 5,800.6 $ 5,632.5 $ 5,746.0 $ 5,399.9 (8)% (1)% $ 5,583.6 $ 5,652.7 (1)% 95,765.9 100,980.6 102,421.0 92,611.0 90,195.3 (5)% 6 % 99,698.2 91,669.5 9 % $ 494.3 $ 483.0 $ 486.0 $ 470.5 $ 457.1 2 % 8 % $ 1,463.3 $ 1,330.0 10 % 117.2 109.1 114.9 107.3 101.5 7 % 16 % 341.2 309.8 10 % Total Wealth Management Trust, Investment and Other Servicing Fees $ 611.5 $ 592.1 $ 600.9 $ 577.8 $ 558.6 3 % 9 % $ 1,804.5 $ 1,639.8 10 % $ 391.6 $ 333.5 $ 330.2 $ 341.8 $ 342.4 17 % 14 % $ 1,060.5 $ 956.1 11 % 41.1 % 37.4 % 37.1 % 38.9 % 40.5 % 3.7 pts 0.6 pts 38.7 % 38.3 % 0.4 pts $ 36,409.6 $ 35,767.0 $ 35,261.8 $ 34,812.3 $ 36,100.7 2 % 1 % $ 35,817.0 $ 35,593.9 1 % 27,524.0 26,715.1 26,469.8 26,572.2 25,370.4 3 % 8 % 26,906.8 25,317.3 6 % $ 7.4 $ 415.5 $ 4.7 $ (21.1) $ (11.8) (98)% (163)% $ 422.5 $ (35.9) N/M 130.1 150.0 141.0 646.0 1,134.9 (13)% (89)% 140.3 1,348.6 (90)% (1) (2) Income before Income Taxes (FTE)(2) Other Year-to Date Reporting segment results are subject to reclassification when organizational changes are made. The results are also subject to refinements in revenue and expense allocation methodologies, which are typically reflected on a retrospective basis unless it is impractical to do so. Fully taxable equivalent (FTE). Presentation on an FTE basis is a non-generally accepted accounting principle financial measure. Please refer to the Reconciliation to Fully Taxable Equivalent section on pages 10 and 11 for further detail. Average Deposits Pre-Tax Margin (FTE)(2) Income before Income Taxes (FTE)(2) Average Loans Average Deposits Average Loans Average Deposits Wealth Management Global Family Office Private Wealth Securities Lending Investment Management Other Income before Income Taxes (FTE)(2) Pre-Tax Margin (FTE)(2) Custody & Fund Administration Asset Servicing ($ in Millions) Reporting Segment Results(1) Northern Trust Corporation % Change Q3 2026 vs. Page 3
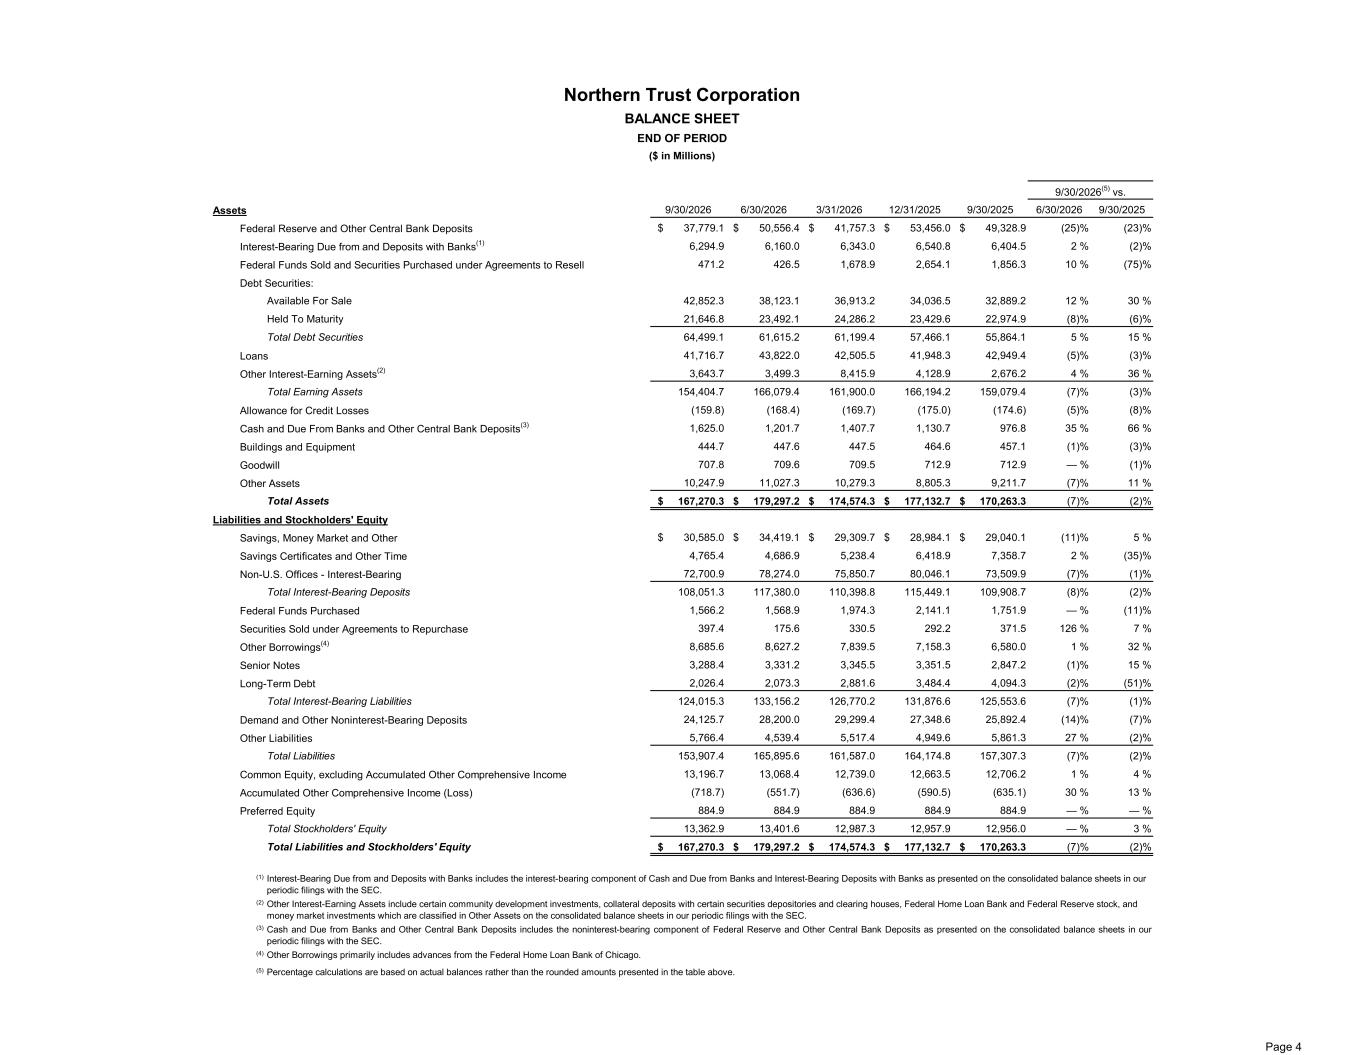
9/30/2026 6/30/2026 3/31/2026 12/31/2025 9/30/2025 6/30/2026 9/30/2025 $ 37,779.1 $ 50,556.4 $ 41,757.3 $ 53,456.0 $ 49,328.9 (25)% (23)% 6,294.9 6,160.0 6,343.0 6,540.8 6,404.5 2 % (2)% 471.2 426.5 1,678.9 2,654.1 1,856.3 10 % (75)% Available For Sale 42,852.3 38,123.1 36,913.2 34,036.5 32,889.2 12 % 30 % Held To Maturity 21,646.8 23,492.1 24,286.2 23,429.6 22,974.9 (8)% (6)% Total Debt Securities 64,499.1 61,615.2 61,199.4 57,466.1 55,864.1 5 % 15 % 41,716.7 43,822.0 42,505.5 41,948.3 42,949.4 (5)% (3)% 3,643.7 3,499.3 8,415.9 4,128.9 2,676.2 4 % 36 % Total Earning Assets 154,404.7 166,079.4 161,900.0 166,194.2 159,079.4 (7)% (3)% (159.8) (168.4) (169.7) (175.0) (174.6) (5)% (8)% 1,625.0 1,201.7 1,407.7 1,130.7 976.8 35 % 66 % 444.7 447.6 447.5 464.6 457.1 (1)% (3)% 707.8 709.6 709.5 712.9 712.9 — % (1)% 10,247.9 11,027.3 10,279.3 8,805.3 9,211.7 (7)% 11 % Total Assets $ 167,270.3 $ 179,297.2 $ 174,574.3 $ 177,132.7 $ 170,263.3 (7)% (2)% $ 30,585.0 $ 34,419.1 $ 29,309.7 $ 28,984.1 $ 29,040.1 (11)% 5 % 4,765.4 4,686.9 5,238.4 6,418.9 7,358.7 2 % (35)% 72,700.9 78,274.0 75,850.7 80,046.1 73,509.9 (7)% (1)% Total Interest-Bearing Deposits 108,051.3 117,380.0 110,398.8 115,449.1 109,908.7 (8)% (2)% 1,566.2 1,568.9 1,974.3 2,141.1 1,751.9 — % (11)% 397.4 175.6 330.5 292.2 371.5 126 % 7 % 8,685.6 8,627.2 7,839.5 7,158.3 6,580.0 1 % 32 % 3,288.4 3,331.2 3,345.5 3,351.5 2,847.2 (1)% 15 % 2,026.4 2,073.3 2,881.6 3,484.4 4,094.3 (2)% (51)% Total Interest-Bearing Liabilities 124,015.3 133,156.2 126,770.2 131,876.6 125,553.6 (7)% (1)% 24,125.7 28,200.0 29,299.4 27,348.6 25,892.4 (14)% (7)% 5,766.4 4,539.4 5,517.4 4,949.6 5,861.3 27 % (2)% Total Liabilities 153,907.4 165,895.6 161,587.0 164,174.8 157,307.3 (7)% (2)% 13,196.7 13,068.4 12,739.0 12,663.5 12,706.2 1 % 4 % (718.7) (551.7) (636.6) (590.5) (635.1) 30 % 13 % 884.9 884.9 884.9 884.9 884.9 — % — % Total Stockholders' Equity 13,362.9 13,401.6 12,987.3 12,957.9 12,956.0 — % 3 % Total Liabilities and Stockholders' Equity $ 167,270.3 $ 179,297.2 $ 174,574.3 $ 177,132.7 $ 170,263.3 (7)% (2)% (1) (2) (3) (4) (5) Percentage calculations are based on actual balances rather than the rounded amounts presented in the table above. Other Borrowings primarily includes advances from the Federal Home Loan Bank of Chicago. Other Interest-Earning Assets include certain community development investments, collateral deposits with certain securities depositories and clearing houses, Federal Home Loan Bank and Federal Reserve stock, and money market investments which are classified in Other Assets on the consolidated balance sheets in our periodic filings with the SEC. Cash and Due from Banks and Other Central Bank Deposits includes the noninterest-bearing component of Federal Reserve and Other Central Bank Deposits as presented on the consolidated balance sheets in our periodic filings with the SEC. Interest-Bearing Due from and Deposits with Banks includes the interest-bearing component of Cash and Due from Banks and Interest-Bearing Deposits with Banks as presented on the consolidated balance sheets in our periodic filings with the SEC. Long-Term Debt Other Borrowings(4) Senior Notes Demand and Other Noninterest-Bearing Deposits Other Liabilities Common Equity, excluding Accumulated Other Comprehensive Income Preferred Equity Accumulated Other Comprehensive Income (Loss) Savings, Money Market and Other Savings Certificates and Other Time Federal Funds Purchased Securities Sold under Agreements to Repurchase Non-U.S. Offices - Interest-Bearing Other Assets Goodwill Cash and Due From Banks and Other Central Bank Deposits(3) Buildings and Equipment Liabilities and Stockholders' Equity Debt Securities: Federal Funds Sold and Securities Purchased under Agreements to Resell Federal Reserve and Other Central Bank Deposits Interest-Bearing Due from and Deposits with Banks(1) Allowance for Credit Losses Other Interest-Earning Assets(2) Loans Assets Northern Trust Corporation END OF PERIOD BALANCE SHEET ($ in Millions) 9/30/2026(5) vs. Page 4
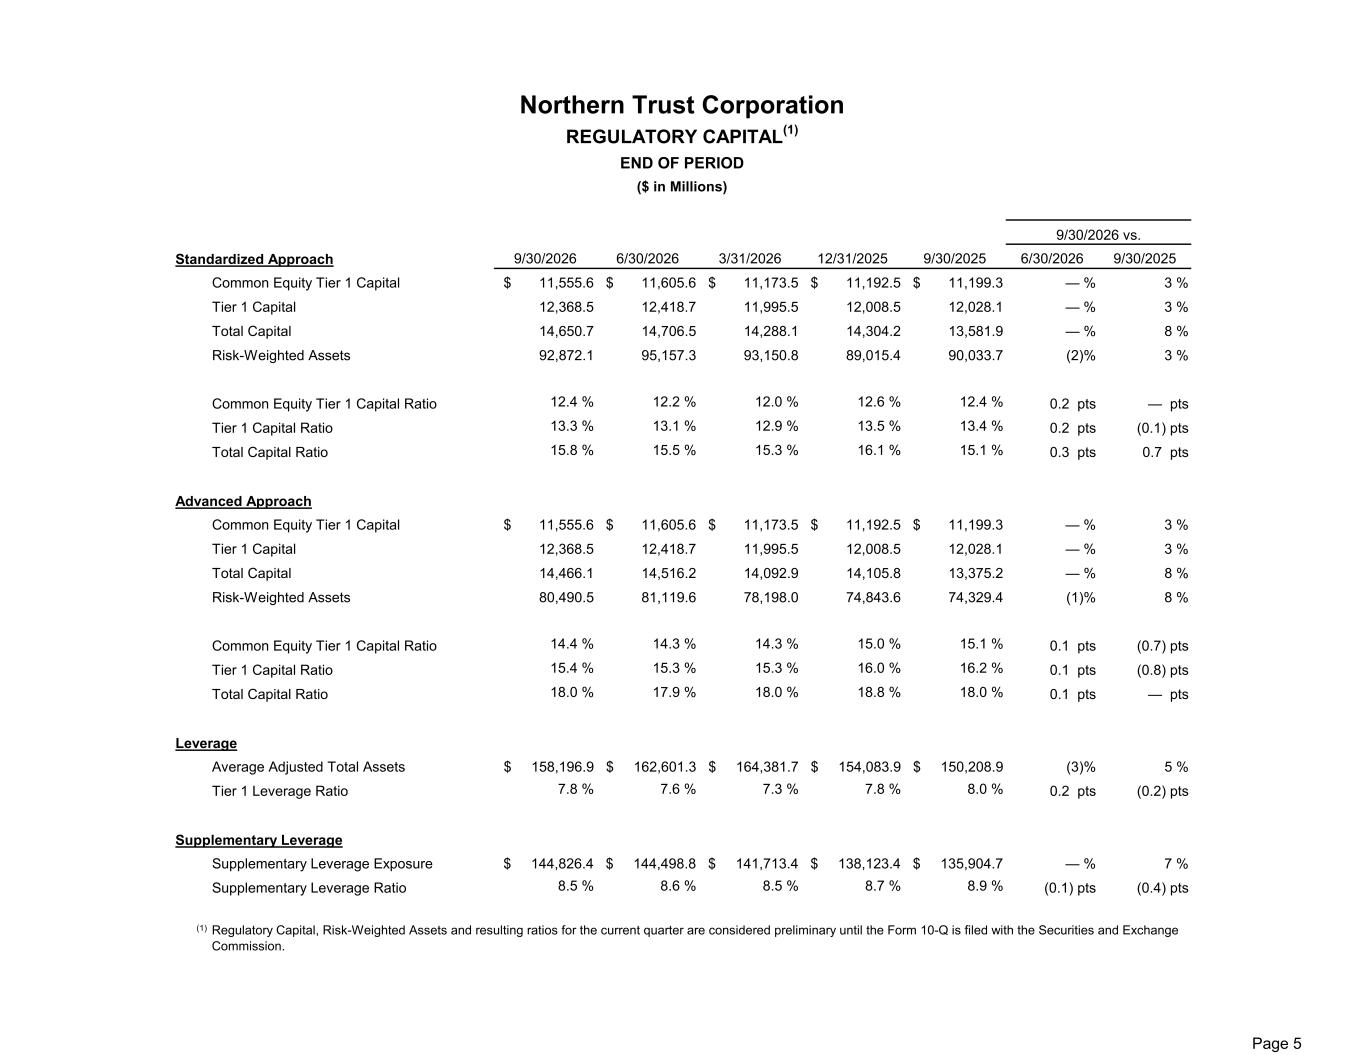
9/30/2026 6/30/2026 3/31/2026 12/31/2025 9/30/2025 6/30/2026 9/30/2025 Common Equity Tier 1 Capital $ 11,555.6 $ 11,605.6 $ 11,173.5 $ 11,192.5 $ 11,199.3 — % 3 % Tier 1 Capital 12,368.5 12,418.7 11,995.5 12,008.5 12,028.1 — % 3 % Total Capital 14,650.7 14,706.5 14,288.1 14,304.2 13,581.9 — % 8 % Risk-Weighted Assets 92,872.1 95,157.3 93,150.8 89,015.4 90,033.7 (2)% 3 % Common Equity Tier 1 Capital Ratio 12.4 % 12.2 % 12.0 % 12.6 % 12.4 % 0.2 pts — pts Tier 1 Capital Ratio 13.3 % 13.1 % 12.9 % 13.5 % 13.4 % 0.2 pts (0.1) pts Total Capital Ratio 15.8 % 15.5 % 15.3 % 16.1 % 15.1 % 0.3 pts 0.7 pts Common Equity Tier 1 Capital $ 11,555.6 $ 11,605.6 $ 11,173.5 $ 11,192.5 $ 11,199.3 — % 3 % Tier 1 Capital 12,368.5 12,418.7 11,995.5 12,008.5 12,028.1 — % 3 % Total Capital 14,466.1 14,516.2 14,092.9 14,105.8 13,375.2 — % 8 % Risk-Weighted Assets 80,490.5 81,119.6 78,198.0 74,843.6 74,329.4 (1)% 8 % Common Equity Tier 1 Capital Ratio 14.4 % 14.3 % 14.3 % 15.0 % 15.1 % 0.1 pts (0.7) pts Tier 1 Capital Ratio 15.4 % 15.3 % 15.3 % 16.0 % 16.2 % 0.1 pts (0.8) pts Total Capital Ratio 18.0 % 17.9 % 18.0 % 18.8 % 18.0 % 0.1 pts — pts Average Adjusted Total Assets $ 158,196.9 $ 162,601.3 $ 164,381.7 $ 154,083.9 $ 150,208.9 (3)% 5 % Tier 1 Leverage Ratio 7.8 % 7.6 % 7.3 % 7.8 % 8.0 % 0.2 pts (0.2) pts Supplementary Leverage Exposure $ 144,826.4 $ 144,498.8 $ 141,713.4 $ 138,123.4 $ 135,904.7 — % 7 % Supplementary Leverage Ratio 8.5 % 8.6 % 8.5 % 8.7 % 8.9 % (0.1) pts (0.4) pts (1) Advanced Approach Leverage Supplementary Leverage Regulatory Capital, Risk-Weighted Assets and resulting ratios for the current quarter are considered preliminary until the Form 10-Q is filed with the Securities and Exchange Commission. Standardized Approach Northern Trust Corporation REGULATORY CAPITAL(1) END OF PERIOD 9/30/2026 vs. ($ in Millions) Page 5
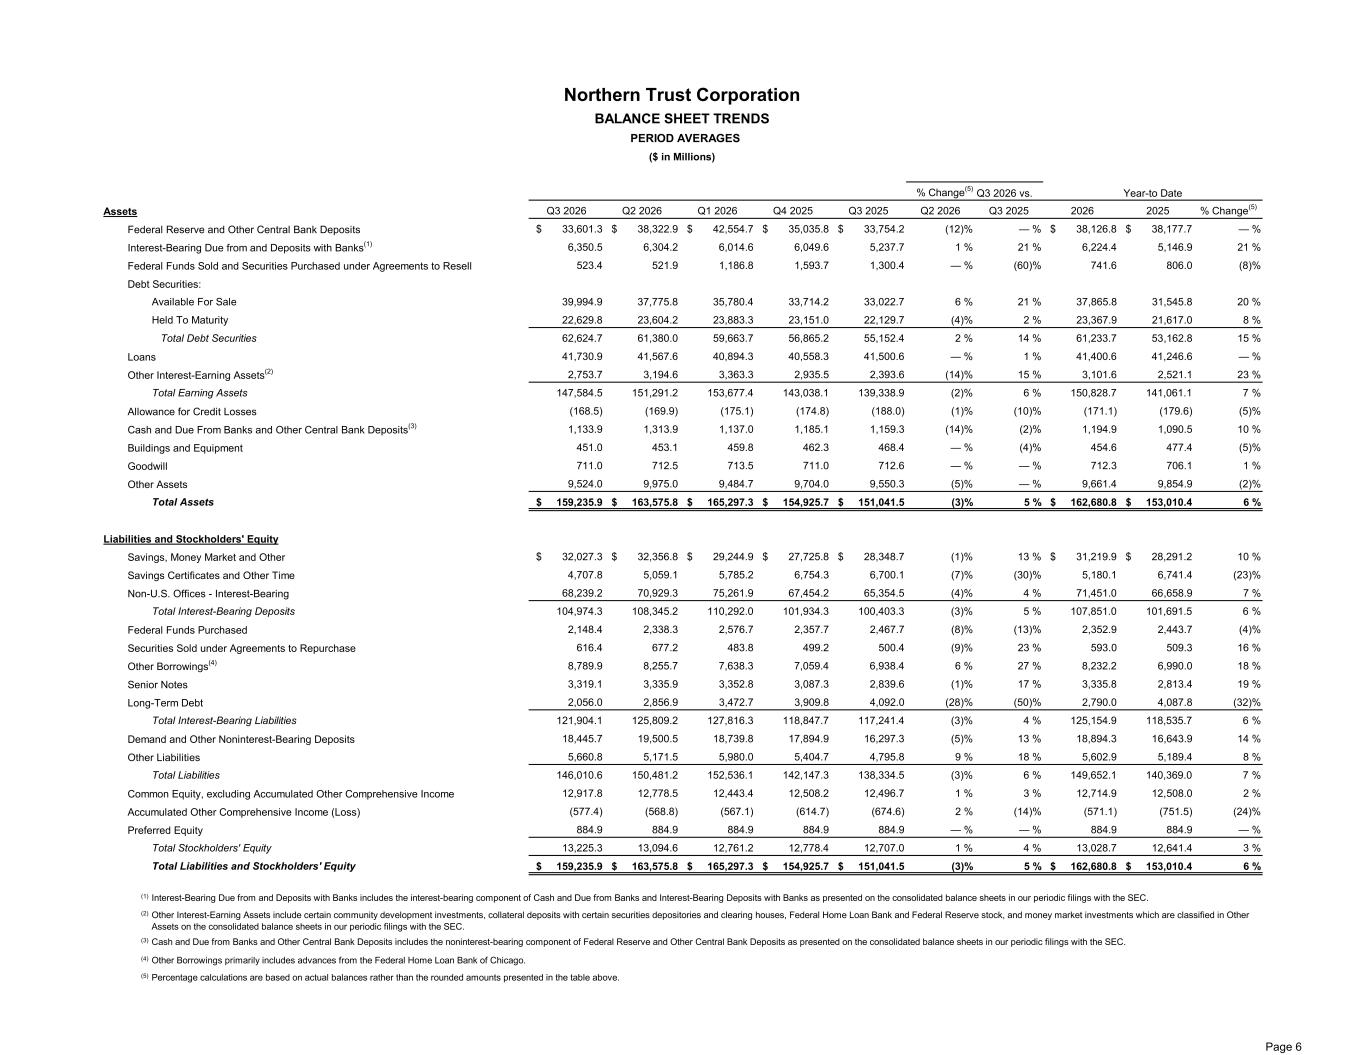
% Change(5) Q3 2026 Q2 2026 Q1 2026 Q4 2025 Q3 2025 Q2 2026 Q3 2025 2026 2025 % Change(5) $ 33,601.3 $ 38,322.9 $ 42,554.7 $ 35,035.8 $ 33,754.2 (12)% — % $ 38,126.8 $ 38,177.7 — % 6,350.5 6,304.2 6,014.6 6,049.6 5,237.7 1 % 21 % 6,224.4 5,146.9 21 % 523.4 521.9 1,186.8 1,593.7 1,300.4 — % (60)% 741.6 806.0 (8)% Available For Sale 39,994.9 37,775.8 35,780.4 33,714.2 33,022.7 6 % 21 % 37,865.8 31,545.8 20 % Held To Maturity 22,629.8 23,604.2 23,883.3 23,151.0 22,129.7 (4)% 2 % 23,367.9 21,617.0 8 % Total Debt Securities 62,624.7 61,380.0 59,663.7 56,865.2 55,152.4 2 % 14 % 61,233.7 53,162.8 15 % 41,730.9 41,567.6 40,894.3 40,558.3 41,500.6 — % 1 % 41,400.6 41,246.6 — % 2,753.7 3,194.6 3,363.3 2,935.5 2,393.6 (14)% 15 % 3,101.6 2,521.1 23 % Total Earning Assets 147,584.5 151,291.2 153,677.4 143,038.1 139,338.9 (2)% 6 % 150,828.7 141,061.1 7 % (168.5) (169.9) (175.1) (174.8) (188.0) (1)% (10)% (171.1) (179.6) (5)% 1,133.9 1,313.9 1,137.0 1,185.1 1,159.3 (14)% (2)% 1,194.9 1,090.5 10 % 451.0 453.1 459.8 462.3 468.4 — % (4)% 454.6 477.4 (5)% 711.0 712.5 713.5 711.0 712.6 — % — % 712.3 706.1 1 % 9,524.0 9,975.0 9,484.7 9,704.0 9,550.3 (5)% — % 9,661.4 9,854.9 (2)% Total Assets $ 159,235.9 $ 163,575.8 $ 165,297.3 $ 154,925.7 $ 151,041.5 (3)% 5 % $ 162,680.8 $ 153,010.4 6 % $ 32,027.3 $ 32,356.8 $ 29,244.9 $ 27,725.8 $ 28,348.7 (1)% 13 % $ 31,219.9 $ 28,291.2 10 % 4,707.8 5,059.1 5,785.2 6,754.3 6,700.1 (7)% (30)% 5,180.1 6,741.4 (23)% 68,239.2 70,929.3 75,261.9 67,454.2 65,354.5 (4)% 4 % 71,451.0 66,658.9 7 % Total Interest-Bearing Deposits 104,974.3 108,345.2 110,292.0 101,934.3 100,403.3 (3)% 5 % 107,851.0 101,691.5 6 % 2,148.4 2,338.3 2,576.7 2,357.7 2,467.7 (8)% (13)% 2,352.9 2,443.7 (4)% 616.4 677.2 483.8 499.2 500.4 (9)% 23 % 593.0 509.3 16 % 8,789.9 8,255.7 7,638.3 7,059.4 6,938.4 6 % 27 % 8,232.2 6,990.0 18 % 3,319.1 3,335.9 3,352.8 3,087.3 2,839.6 (1)% 17 % 3,335.8 2,813.4 19 % 2,056.0 2,856.9 3,472.7 3,909.8 4,092.0 (28)% (50)% 2,790.0 4,087.8 (32)% Total Interest-Bearing Liabilities 121,904.1 125,809.2 127,816.3 118,847.7 117,241.4 (3)% 4 % 125,154.9 118,535.7 6 % 18,445.7 19,500.5 18,739.8 17,894.9 16,297.3 (5)% 13 % 18,894.3 16,643.9 14 % 5,660.8 5,171.5 5,980.0 5,404.7 4,795.8 9 % 18 % 5,602.9 5,189.4 8 % Total Liabilities 146,010.6 150,481.2 152,536.1 142,147.3 138,334.5 (3)% 6 % 149,652.1 140,369.0 7 % 12,917.8 12,778.5 12,443.4 12,508.2 12,496.7 1 % 3 % 12,714.9 12,508.0 2 % (577.4) (568.8) (567.1) (614.7) (674.6) 2 % (14)% (571.1) (751.5) (24)% 884.9 884.9 884.9 884.9 884.9 — % — % 884.9 884.9 — % Total Stockholders' Equity 13,225.3 13,094.6 12,761.2 12,778.4 12,707.0 1 % 4 % 13,028.7 12,641.4 3 % Total Liabilities and Stockholders' Equity $ 159,235.9 $ 163,575.8 $ 165,297.3 $ 154,925.7 $ 151,041.5 (3)% 5 % $ 162,680.8 $ 153,010.4 6 % (1) (2) (3) (4) (5) Other Borrowings primarily includes advances from the Federal Home Loan Bank of Chicago. Cash and Due from Banks and Other Central Bank Deposits includes the noninterest-bearing component of Federal Reserve and Other Central Bank Deposits as presented on the consolidated balance sheets in our periodic filings with the SEC. Percentage calculations are based on actual balances rather than the rounded amounts presented in the table above. Interest-Bearing Due from and Deposits with Banks includes the interest-bearing component of Cash and Due from Banks and Interest-Bearing Deposits with Banks as presented on the consolidated balance sheets in our periodic filings with the SEC. Other Interest-Earning Assets include certain community development investments, collateral deposits with certain securities depositories and clearing houses, Federal Home Loan Bank and Federal Reserve stock, and money market investments which are classified in Other Assets on the consolidated balance sheets in our periodic filings with the SEC. Long-Term Debt Senior Notes Securities Sold under Agreements to Repurchase Other Borrowings(4) Demand and Other Noninterest-Bearing Deposits Other Liabilities Preferred Equity Accumulated Other Comprehensive Income (Loss) Common Equity, excluding Accumulated Other Comprehensive Income Savings, Money Market and Other Federal Funds Purchased Non-U.S. Offices - Interest-Bearing Savings Certificates and Other Time Year-to DateQ3 2026 vs. Other Assets Goodwill Cash and Due From Banks and Other Central Bank Deposits(3) Buildings and Equipment Liabilities and Stockholders' Equity Debt Securities: Federal Funds Sold and Securities Purchased under Agreements to Resell Federal Reserve and Other Central Bank Deposits Interest-Bearing Due from and Deposits with Banks(1) Allowance for Credit Losses Other Interest-Earning Assets(2) Loans Assets Northern Trust Corporation BALANCE SHEET TRENDS PERIOD AVERAGES ($ in Millions) Page 6
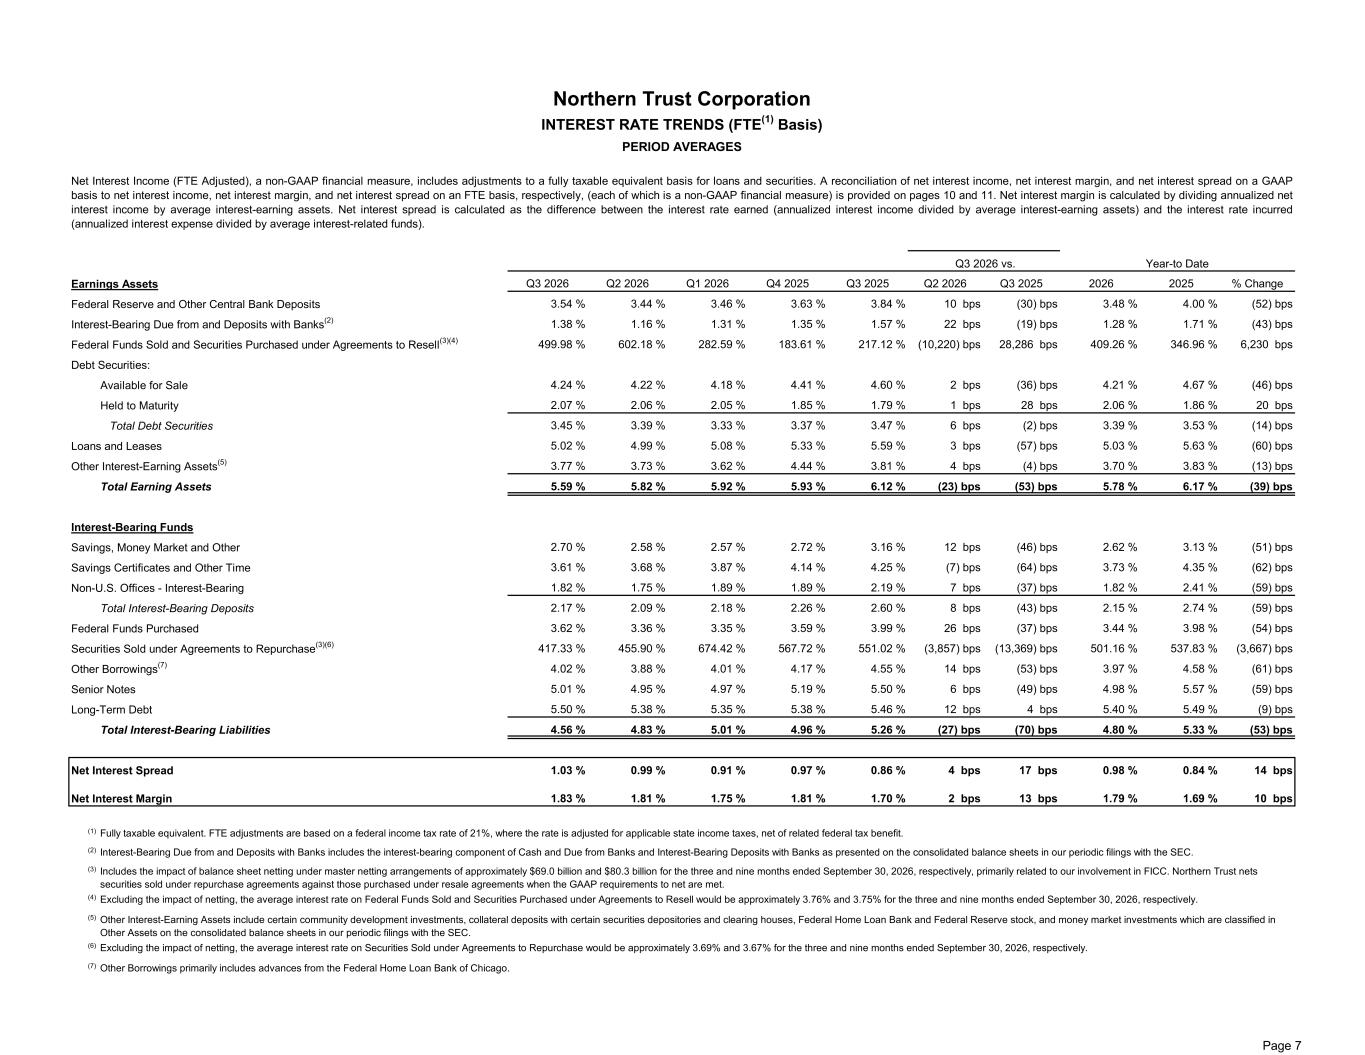
Q3 2026 Q2 2026 Q1 2026 Q4 2025 Q3 2025 Q2 2026 Q3 2025 2026 2025 % Change 3.54 % 3.44 % 3.46 % 3.63 % 3.84 % 10 bps (30) bps 3.48 % 4.00 % (52) bps 1.38 % 1.16 % 1.31 % 1.35 % 1.57 % 22 bps (19) bps 1.28 % 1.71 % (43) bps 499.98 % 602.18 % 282.59 % 183.61 % 217.12 % (10,220) bps 28,286 bps 409.26 % 346.96 % 6,230 bps 4.24 % 4.22 % 4.18 % 4.41 % 4.60 % 2 bps (36) bps 4.21 % 4.67 % (46) bps 2.07 % 2.06 % 2.05 % 1.85 % 1.79 % 1 bps 28 bps 2.06 % 1.86 % 20 bps 3.45 % 3.39 % 3.33 % 3.37 % 3.47 % 6 bps (2) bps 3.39 % 3.53 % (14) bps 5.02 % 4.99 % 5.08 % 5.33 % 5.59 % 3 bps (57) bps 5.03 % 5.63 % (60) bps 3.77 % 3.73 % 3.62 % 4.44 % 3.81 % 4 bps (4) bps 3.70 % 3.83 % (13) bps 5.59 % 5.82 % 5.92 % 5.93 % 6.12 % (23) bps (53) bps 5.78 % 6.17 % (39) bps 2.70 % 2.58 % 2.57 % 2.72 % 3.16 % 12 bps (46) bps 2.62 % 3.13 % (51) bps 3.61 % 3.68 % 3.87 % 4.14 % 4.25 % (7) bps (64) bps 3.73 % 4.35 % (62) bps 1.82 % 1.75 % 1.89 % 1.89 % 2.19 % 7 bps (37) bps 1.82 % 2.41 % (59) bps 2.17 % 2.09 % 2.18 % 2.26 % 2.60 % 8 bps (43) bps 2.15 % 2.74 % (59) bps 3.62 % 3.36 % 3.35 % 3.59 % 3.99 % 26 bps (37) bps 3.44 % 3.98 % (54) bps 417.33 % 455.90 % 674.42 % 567.72 % 551.02 % (3,857) bps (13,369) bps 501.16 % 537.83 % (3,667) bps 4.02 % 3.88 % 4.01 % 4.17 % 4.55 % 14 bps (53) bps 3.97 % 4.58 % (61) bps 5.01 % 4.95 % 4.97 % 5.19 % 5.50 % 6 bps (49) bps 4.98 % 5.57 % (59) bps 5.50 % 5.38 % 5.35 % 5.38 % 5.46 % 12 bps 4 bps 5.40 % 5.49 % (9) bps 4.56 % 4.83 % 5.01 % 4.96 % 5.26 % (27) bps (70) bps 4.80 % 5.33 % (53) bps 1.03 % 0.99 % 0.91 % 0.97 % 0.86 % 4 bps 17 bps 0.98 % 0.84 % 14 bps 1.83 % 1.81 % 1.75 % 1.81 % 1.70 % 2 bps 13 bps 1.79 % 1.69 % 10 bps (1) (2) (3) (4) (5) (6) (7) Other Interest-Earning Assets include certain community development investments, collateral deposits with certain securities depositories and clearing houses, Federal Home Loan Bank and Federal Reserve stock, and money market investments which are classified in Other Assets on the consolidated balance sheets in our periodic filings with the SEC. Other Borrowings primarily includes advances from the Federal Home Loan Bank of Chicago. Excluding the impact of netting, the average interest rate on Securities Sold under Agreements to Repurchase would be approximately 3.69% and 3.67% for the three and nine months ended September 30, 2026, respectively. Includes the impact of balance sheet netting under master netting arrangements of approximately $69.0 billion and $80.3 billion for the three and nine months ended September 30, 2026, respectively, primarily related to our involvement in FICC. Northern Trust nets securities sold under repurchase agreements against those purchased under resale agreements when the GAAP requirements to net are met. Federal Funds Purchased Securities Sold under Agreements to Repurchase(3)(6) Total Interest-Bearing Liabilities Long-Term Debt Senior Notes Other Borrowings(7) Interest-Bearing Due from and Deposits with Banks includes the interest-bearing component of Cash and Due from Banks and Interest-Bearing Deposits with Banks as presented on the consolidated balance sheets in our periodic filings with the SEC. Fully taxable equivalent. FTE adjustments are based on a federal income tax rate of 21%, where the rate is adjusted for applicable state income taxes, net of related federal tax benefit. Net Interest Margin Net Interest Spread Excluding the impact of netting, the average interest rate on Federal Funds Sold and Securities Purchased under Agreements to Resell would be approximately 3.76% and 3.75% for the three and nine months ended September 30, 2026, respectively. Savings Certificates and Other Time Savings, Money Market and Other Interest-Bearing Funds Non-U.S. Offices - Interest-Bearing Total Interest-Bearing Deposits Debt Securities: Available for Sale Held to Maturity Total Earning Assets Other Interest-Earning Assets(5) Loans and Leases Total Debt Securities Northern Trust Corporation INTEREST RATE TRENDS (FTE(1) Basis) PERIOD AVERAGES Net Interest Income (FTE Adjusted), a non-GAAP financial measure, includes adjustments to a fully taxable equivalent basis for loans and securities. A reconciliation of net interest income, net interest margin, and net interest spread on a GAAP basis to net interest income, net interest margin, and net interest spread on an FTE basis, respectively, (each of which is a non-GAAP financial measure) is provided on pages 10 and 11. Net interest margin is calculated by dividing annualized net interest income by average interest-earning assets. Net interest spread is calculated as the difference between the interest rate earned (annualized interest income divided by average interest-earning assets) and the interest rate incurred (annualized interest expense divided by average interest-related funds). Federal Funds Sold and Securities Purchased under Agreements to Resell(3)(4) Interest-Bearing Due from and Deposits with Banks(2) Federal Reserve and Other Central Bank Deposits Earnings Assets Year-to Date Q3 2026 vs. Page 7
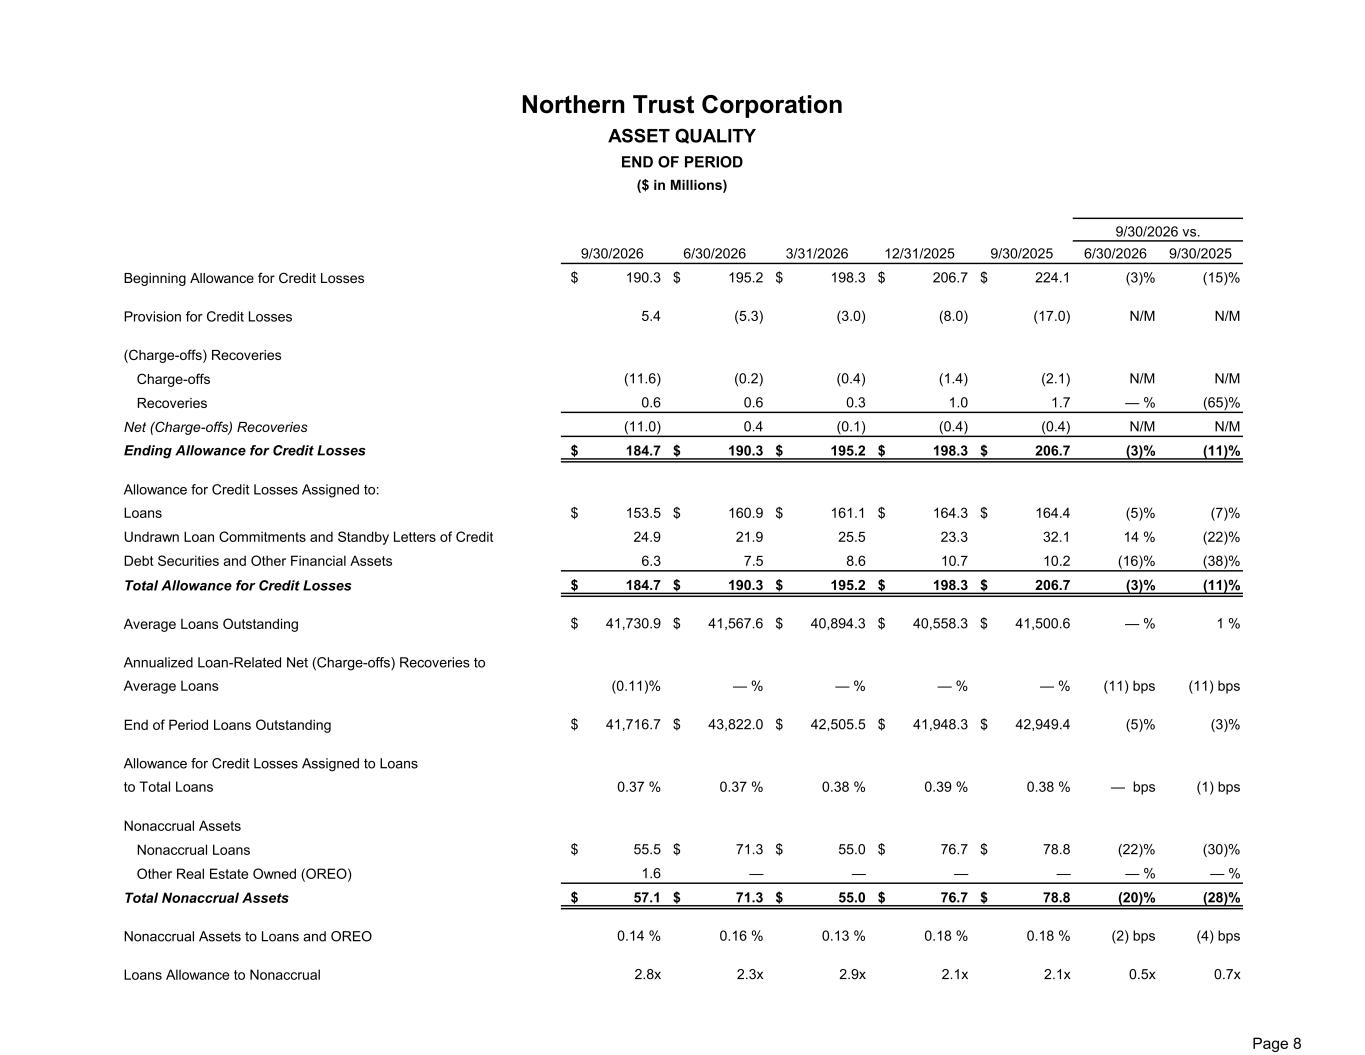
9/30/2026 6/30/2026 3/31/2026 12/31/2025 9/30/2025 6/30/2026 9/30/2025 $ 190.3 $ 195.2 $ 198.3 $ 206.7 $ 224.1 (3)% (15)% 5.4 (5.3) (3.0) (8.0) (17.0) N/M N/M (11.6) (0.2) (0.4) (1.4) (2.1) N/M N/M 0.6 0.6 0.3 1.0 1.7 — % (65)% (11.0) 0.4 (0.1) (0.4) (0.4) N/M N/M Ending Allowance for Credit Losses $ 184.7 $ 190.3 $ 195.2 $ 198.3 $ 206.7 (3)% (11)% Loans $ 153.5 $ 160.9 $ 161.1 $ 164.3 $ 164.4 (5)% (7)% Undrawn Loan Commitments and Standby Letters of Credit 24.9 21.9 25.5 23.3 32.1 14 % (22)% Debt Securities and Other Financial Assets 6.3 7.5 8.6 10.7 10.2 (16)% (38)% $ 184.7 $ 190.3 $ 195.2 $ 198.3 $ 206.7 (3)% (11)% $ 41,730.9 $ 41,567.6 $ 40,894.3 $ 40,558.3 $ 41,500.6 — % 1 % Average Loans (0.11)% — % — % — % — % (11) bps (11) bps $ 41,716.7 $ 43,822.0 $ 42,505.5 $ 41,948.3 $ 42,949.4 (5)% (3)% to Total Loans 0.37 % 0.37 % 0.38 % 0.39 % 0.38 % — bps (1) bps $ 55.5 $ 71.3 $ 55.0 $ 76.7 $ 78.8 (22)% (30)% 1.6 — — — — — % — % $ 57.1 $ 71.3 $ 55.0 $ 76.7 $ 78.8 (20)% (28)% 0.14 % 0.16 % 0.13 % 0.18 % 0.18 % (2) bps (4) bps 2.8x 2.3x 2.9x 2.1x 2.1x 0.5x 0.7xLoans Allowance to Nonaccrual Nonaccrual Loans Nonaccrual Assets Other Real Estate Owned (OREO) Total Nonaccrual Assets Nonaccrual Assets to Loans and OREO Total Allowance for Credit Losses Average Loans Outstanding Annualized Loan-Related Net (Charge-offs) Recoveries to Allowance for Credit Losses Assigned to Loans End of Period Loans Outstanding (Charge-offs) Recoveries Charge-offs Recoveries Net (Charge-offs) Recoveries Allowance for Credit Losses Assigned to: Northern Trust Corporation END OF PERIOD ASSET QUALITY ($ in Millions) Provision for Credit Losses Beginning Allowance for Credit Losses 9/30/2026 vs. Page 8
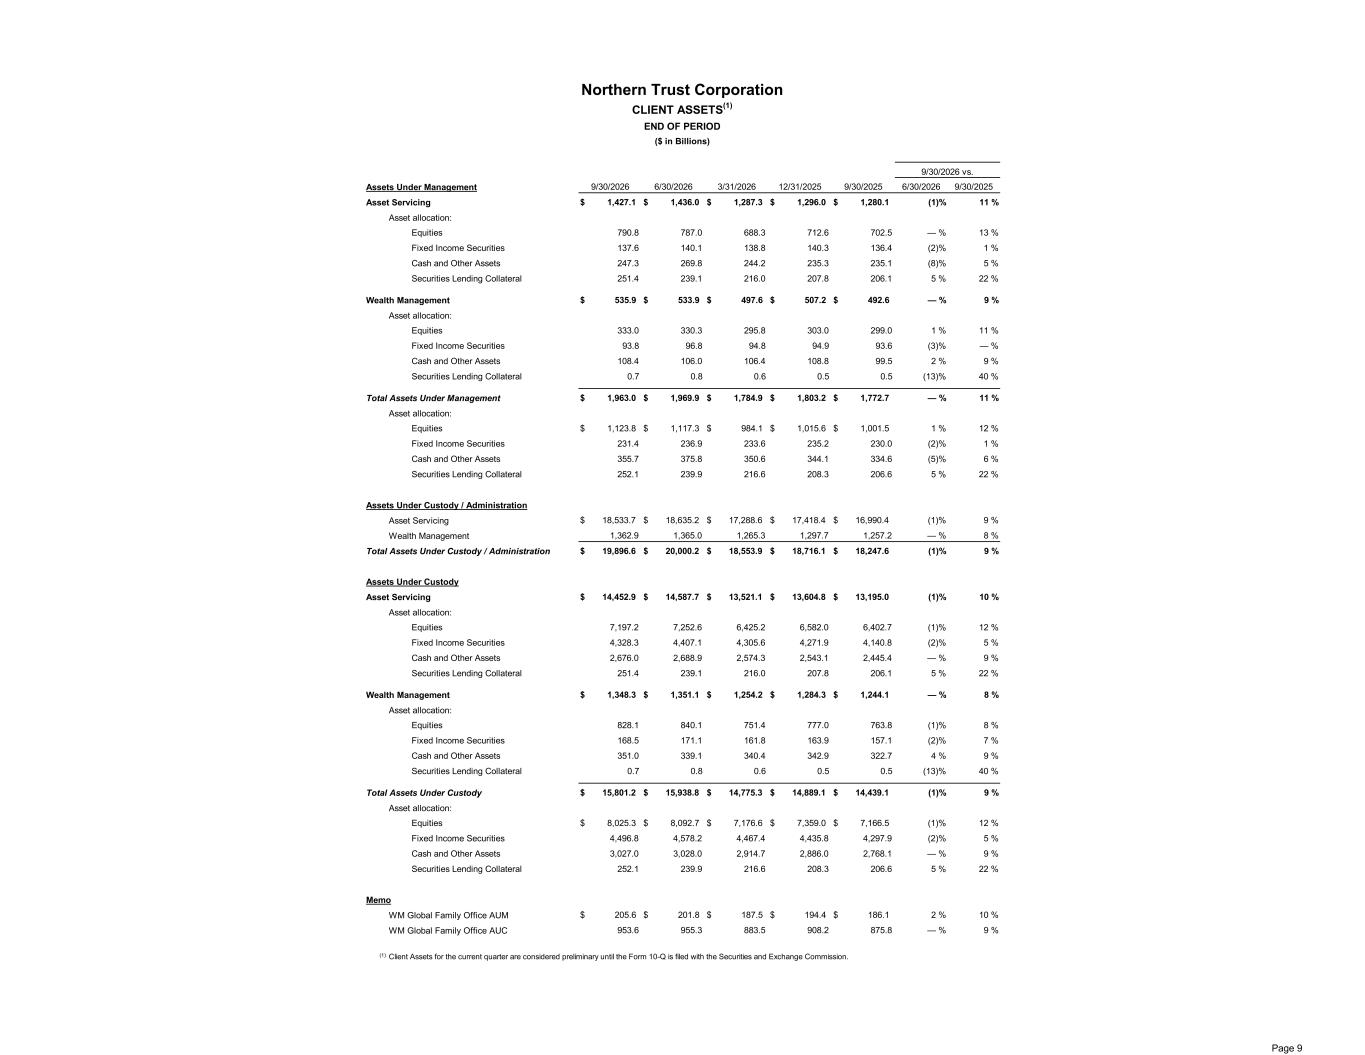
9/30/2026 6/30/2026 3/31/2026 12/31/2025 9/30/2025 6/30/2026 9/30/2025 $ 1,427.1 $ 1,436.0 $ 1,287.3 $ 1,296.0 $ 1,280.1 (1)% 11 % Equities 790.8 787.0 688.3 712.6 702.5 — % 13 % Fixed Income Securities 137.6 140.1 138.8 140.3 136.4 (2)% 1 % Cash and Other Assets 247.3 269.8 244.2 235.3 235.1 (8)% 5 % Securities Lending Collateral 251.4 239.1 216.0 207.8 206.1 5 % 22 % $ 535.9 $ 533.9 $ 497.6 $ 507.2 $ 492.6 — % 9 % Equities 333.0 330.3 295.8 303.0 299.0 1 % 11 % Fixed Income Securities 93.8 96.8 94.8 94.9 93.6 (3)% — % Cash and Other Assets 108.4 106.0 106.4 108.8 99.5 2 % 9 % Securities Lending Collateral 0.7 0.8 0.6 0.5 0.5 (13)% 40 % $ 1,963.0 $ 1,969.9 $ 1,784.9 $ 1,803.2 $ 1,772.7 — % 11 % Equities $ 1,123.8 $ 1,117.3 $ 984.1 $ 1,015.6 $ 1,001.5 1 % 12 % Fixed Income Securities 231.4 236.9 233.6 235.2 230.0 (2)% 1 % Cash and Other Assets 355.7 375.8 350.6 344.1 334.6 (5)% 6 % Securities Lending Collateral 252.1 239.9 216.6 208.3 206.6 5 % 22 % $ 18,533.7 $ 18,635.2 $ 17,288.6 $ 17,418.4 $ 16,990.4 (1)% 9 % 1,362.9 1,365.0 1,265.3 1,297.7 1,257.2 — % 8 % $ 19,896.6 $ 20,000.2 $ 18,553.9 $ 18,716.1 $ 18,247.6 (1)% 9 % $ 14,452.9 $ 14,587.7 $ 13,521.1 $ 13,604.8 $ 13,195.0 (1)% 10 % Equities 7,197.2 7,252.6 6,425.2 6,582.0 6,402.7 (1)% 12 % Fixed Income Securities 4,328.3 4,407.1 4,305.6 4,271.9 4,140.8 (2)% 5 % Cash and Other Assets 2,676.0 2,688.9 2,574.3 2,543.1 2,445.4 — % 9 % Securities Lending Collateral 251.4 239.1 216.0 207.8 206.1 5 % 22 % $ 1,348.3 $ 1,351.1 $ 1,254.2 $ 1,284.3 $ 1,244.1 — % 8 % Equities 828.1 840.1 751.4 777.0 763.8 (1)% 8 % Fixed Income Securities 168.5 171.1 161.8 163.9 157.1 (2)% 7 % Cash and Other Assets 351.0 339.1 340.4 342.9 322.7 4 % 9 % Securities Lending Collateral 0.7 0.8 0.6 0.5 0.5 (13)% 40 % $ 15,801.2 $ 15,938.8 $ 14,775.3 $ 14,889.1 $ 14,439.1 (1)% 9 % Equities $ 8,025.3 $ 8,092.7 $ 7,176.6 $ 7,359.0 $ 7,166.5 (1)% 12 % Fixed Income Securities 4,496.8 4,578.2 4,467.4 4,435.8 4,297.9 (2)% 5 % Cash and Other Assets 3,027.0 3,028.0 2,914.7 2,886.0 2,768.1 — % 9 % Securities Lending Collateral 252.1 239.9 216.6 208.3 206.6 5 % 22 % $ 205.6 $ 201.8 $ 187.5 $ 194.4 $ 186.1 2 % 10 % 953.6 955.3 883.5 908.2 875.8 — % 9 % (1) Client Assets for the current quarter are considered preliminary until the Form 10-Q is filed with the Securities and Exchange Commission. WM Global Family Office AUC Memo WM Global Family Office AUM Asset allocation: Wealth Management Asset allocation: Total Assets Under Custody Asset allocation: Asset Servicing Wealth Management Assets Under Custody / Administration 9/30/2026 vs. Asset Servicing Assets Under Custody Total Assets Under Custody / Administration Asset Servicing Asset allocation: Wealth Management Asset allocation: Asset allocation: Total Assets Under Management Assets Under Management Northern Trust Corporation END OF PERIOD CLIENT ASSETS(1) ($ in Billions) Page 9
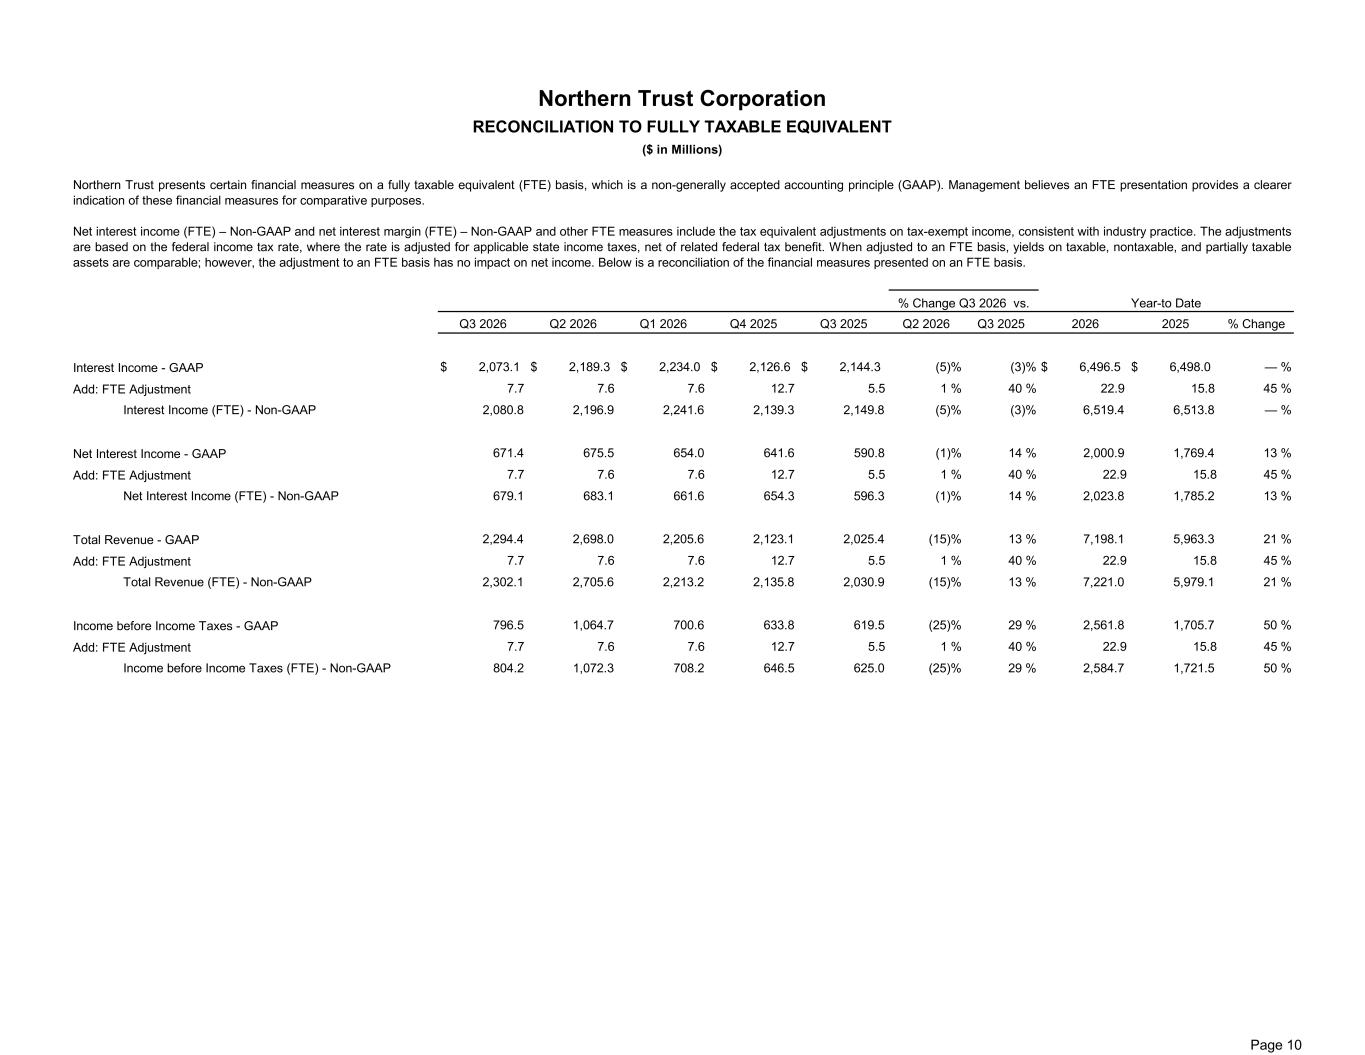
Q3 2026 Q2 2026 Q1 2026 Q4 2025 Q3 2025 Q2 2026 Q3 2025 2026 2025 % Change $ 2,073.1 $ 2,189.3 $ 2,234.0 $ 2,126.6 $ 2,144.3 (5)% (3)% $ 6,496.5 $ 6,498.0 — % 7.7 7.6 7.6 12.7 5.5 1 % 40 % 22.9 15.8 45 % Interest Income (FTE) - Non-GAAP 2,080.8 2,196.9 2,241.6 2,139.3 2,149.8 (5)% (3)% 6,519.4 6,513.8 — % 671.4 675.5 654.0 641.6 590.8 (1)% 14 % 2,000.9 1,769.4 13 % 7.7 7.6 7.6 12.7 5.5 1 % 40 % 22.9 15.8 45 % Net Interest Income (FTE) - Non-GAAP 679.1 683.1 661.6 654.3 596.3 (1)% 14 % 2,023.8 1,785.2 13 % 2,294.4 2,698.0 2,205.6 2,123.1 2,025.4 (15)% 13 % 7,198.1 5,963.3 21 % 7.7 7.6 7.6 12.7 5.5 1 % 40 % 22.9 15.8 45 % Total Revenue (FTE) - Non-GAAP 2,302.1 2,705.6 2,213.2 2,135.8 2,030.9 (15)% 13 % 7,221.0 5,979.1 21 % 796.5 1,064.7 700.6 633.8 619.5 (25)% 29 % 2,561.8 1,705.7 50 % 7.7 7.6 7.6 12.7 5.5 1 % 40 % 22.9 15.8 45 % Income before Income Taxes (FTE) - Non-GAAP 804.2 1,072.3 708.2 646.5 625.0 (25)% 29 % 2,584.7 1,721.5 50 % Income before Income Taxes - GAAP Add: FTE Adjustment Year-to Date Interest Income - GAAP Add: FTE Adjustment Add: FTE Adjustment Net Interest Income - GAAP Add: FTE Adjustment Total Revenue - GAAP ($ in Millions) RECONCILIATION TO FULLY TAXABLE EQUIVALENT Northern Trust Corporation % Change Q3 2026 vs. Northern Trust presents certain financial measures on a fully taxable equivalent (FTE) basis, which is a non-generally accepted accounting principle (GAAP). Management believes an FTE presentation provides a clearer indication of these financial measures for comparative purposes. Net interest income (FTE) – Non-GAAP and net interest margin (FTE) – Non-GAAP and other FTE measures include the tax equivalent adjustments on tax-exempt income, consistent with industry practice. The adjustments are based on the federal income tax rate, where the rate is adjusted for applicable state income taxes, net of related federal tax benefit. When adjusted to an FTE basis, yields on taxable, nontaxable, and partially taxable assets are comparable; however, the adjustment to an FTE basis has no impact on net income. Below is a reconciliation of the financial measures presented on an FTE basis. Page 10
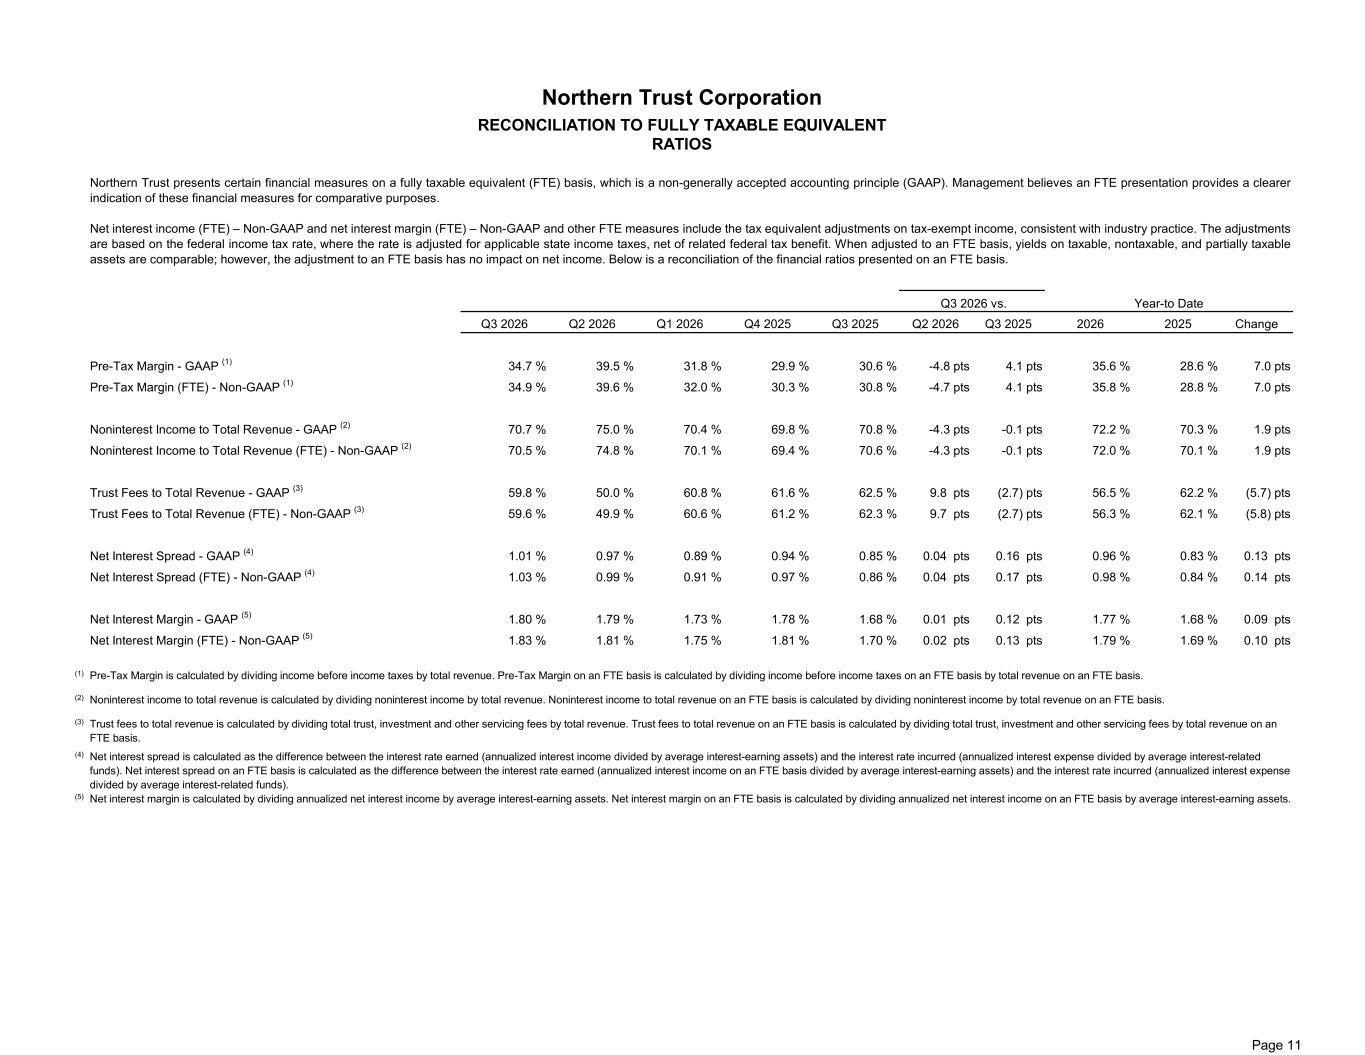
Q3 2026 Q2 2026 Q1 2026 Q4 2025 Q3 2025 Q2 2026 Q3 2025 2026 2025 Change Pre-Tax Margin - GAAP (1) 34.7 % 39.5 % 31.8 % 29.9 % 30.6 % -4.8 pts 4.1 pts 35.6 % 28.6 % 7.0 pts Pre-Tax Margin (FTE) - Non-GAAP (1) 34.9 % 39.6 % 32.0 % 30.3 % 30.8 % -4.7 pts 4.1 pts 35.8 % 28.8 % 7.0 pts Noninterest Income to Total Revenue - GAAP (2) 70.7 % 75.0 % 70.4 % 69.8 % 70.8 % -4.3 pts -0.1 pts 72.2 % 70.3 % 1.9 pts Noninterest Income to Total Revenue (FTE) - Non-GAAP (2) 70.5 % 74.8 % 70.1 % 69.4 % 70.6 % -4.3 pts -0.1 pts 72.0 % 70.1 % 1.9 pts Trust Fees to Total Revenue - GAAP (3) 59.8 % 50.0 % 60.8 % 61.6 % 62.5 % 9.8 pts (2.7) pts 56.5 % 62.2 % (5.7) pts Trust Fees to Total Revenue (FTE) - Non-GAAP (3) 59.6 % 49.9 % 60.6 % 61.2 % 62.3 % 9.7 pts (2.7) pts 56.3 % 62.1 % (5.8) pts Net Interest Spread - GAAP (4) 1.01 % 0.97 % 0.89 % 0.94 % 0.85 % 0.04 pts 0.16 pts 0.96 % 0.83 % 0.13 pts Net Interest Spread (FTE) - Non-GAAP (4) 1.03 % 0.99 % 0.91 % 0.97 % 0.86 % 0.04 pts 0.17 pts 0.98 % 0.84 % 0.14 pts Net Interest Margin - GAAP (5) 1.80 % 1.79 % 1.73 % 1.78 % 1.68 % 0.01 pts 0.12 pts 1.77 % 1.68 % 0.09 pts Net Interest Margin (FTE) - Non-GAAP (5) 1.83 % 1.81 % 1.75 % 1.81 % 1.70 % 0.02 pts 0.13 pts 1.79 % 1.69 % 0.10 pts (1) (2) (3) (4) (5) Net interest spread is calculated as the difference between the interest rate earned (annualized interest income divided by average interest-earning assets) and the interest rate incurred (annualized interest expense divided by average interest-related funds). Net interest spread on an FTE basis is calculated as the difference between the interest rate earned (annualized interest income on an FTE basis divided by average interest-earning assets) and the interest rate incurred (annualized interest expense divided by average interest-related funds). Net interest margin is calculated by dividing annualized net interest income by average interest-earning assets. Net interest margin on an FTE basis is calculated by dividing annualized net interest income on an FTE basis by average interest-earning assets. Pre-Tax Margin is calculated by dividing income before income taxes by total revenue. Pre-Tax Margin on an FTE basis is calculated by dividing income before income taxes on an FTE basis by total revenue on an FTE basis. Noninterest income to total revenue is calculated by dividing noninterest income by total revenue. Noninterest income to total revenue on an FTE basis is calculated by dividing noninterest income by total revenue on an FTE basis. Trust fees to total revenue is calculated by dividing total trust, investment and other servicing fees by total revenue. Trust fees to total revenue on an FTE basis is calculated by dividing total trust, investment and other servicing fees by total revenue on an FTE basis. Year-to Date RATIOS RECONCILIATION TO FULLY TAXABLE EQUIVALENT Northern Trust Corporation Northern Trust presents certain financial measures on a fully taxable equivalent (FTE) basis, which is a non-generally accepted accounting principle (GAAP). Management believes an FTE presentation provides a clearer indication of these financial measures for comparative purposes. Net interest income (FTE) – Non-GAAP and net interest margin (FTE) – Non-GAAP and other FTE measures include the tax equivalent adjustments on tax-exempt income, consistent with industry practice. The adjustments are based on the federal income tax rate, where the rate is adjusted for applicable state income taxes, net of related federal tax benefit. When adjusted to an FTE basis, yields on taxable, nontaxable, and partially taxable assets are comparable; however, the adjustment to an FTE basis has no impact on net income. Below is a reconciliation of the financial ratios presented on an FTE basis. Q3 2026 vs. Page 11