.2 THIRD QUARTER 2025 EARNINGS CALL LEON TOPALIAN Chair, President and CEO STEVE LAXTON Executive Vice President and CFO October 28, 2025
FORWARD-LOOKING STATEMENTS Certain statements made in this presentation may constitute forward-looking statements within the meaning of the Private Securities Litigation Reform Act of 1995. These statements involve risks and uncertainties. The words “anticipate,” “believe,” “expect,” “intend,” “may,” “project,” “will,” “should,” “could” and similar expressions are intended to identify forward-looking statements. These forward-looking statements reflect the Company’s best judgment based on current information, and although we base these statements on circumstances that we believe to be reasonable when made, there can be no assurance that future events will not affect the accuracy of such forward-looking information. The Company does not undertake any obligation to update these statements. The forward-looking statements are not guarantees of future performance, and actual results may vary materially from the projected results and expectations discussed in this presentation. Factors that might cause the Company’s actual results to differ materially from those anticipated in forward- looking statements include, but are not limited to: (1) competitive pressure on sales and pricing, including pressure from imports and substitute materials; (2) U.S. and foreign trade policies affecting steel imports or exports; (3) the sensitivity of the results of our operations to general market conditions, and in particular, prevailing market steel prices and changes in the supply and cost of raw materials, including pig iron, iron ore and scrap steel; (4) the availability and cost of electricity and natural gas, which could negatively affect our cost of steel production or result in a delay or cancellation of existing or future drilling within our natural gas drilling programs; (5) critical equipment failures and business interruptions; (6) market demand for steel products, which, in the case of many of our products, is driven by the level of nonresidential construction activity in the United States; (7) impairment in the recorded value of inventory, equity investments, fixed assets, goodwill or other long- lived assets; (8) uncertainties and volatility surrounding the global economy, including excess world capacity for steel production, inflation and interest rate changes; (9) fluctuations in currency conversion rates; (10) significant changes in laws or government regulations affecting environmental compliance, including legislation and regulations that result in greater regulation of greenhouse gas emissions that could increase our energy costs, capital expenditures and operating costs or cause one or more of our permits to be revoked or make it more difficult to obtain permit modifications; (11) the cyclical nature of the steel industry; (12) capital investments and their impact on our performance; (13) our safety performance; (14) our ability to integrate businesses we acquire; (15) the impact of the COVID-19 pandemic, any variants of the virus, and any other similar public health situation; and (16) the risks discussed in “Item 1A. Risk Factors” of the Company’s Annual Report on Form 10-K for the year ended December 31, 2024 and elsewhere therein and in the other reports we file with the U.S. Securities and Exchange Commission. 2
NON-GAAP FINANCIAL MEASURES The Company uses certain non-GAAP (Generally Accepted Accounting Principles) financial measures in this news presentation, including adjusted earnings, EBITDA and Free Cash Flow (FCF). Generally, a non- GAAP financial measure is a numerical measure of a company’s performance or financial position that either excludes or includes amounts that are not normally excluded or included in the most directly comparable financial measure calculated and presented in accordance with GAAP. We define EBITDA as net earnings before noncontrolling interests adding back the following items: interest expense, net; provision for income taxes; depreciation; amortization; and losses and impairments of assets. We define Free Cash Flow (FCF) as Cash Provided by Operating Activities less Capital Expenditures. Please note that other companies might define their non-GAAP financial measures differently than we do. Management presents the non-GAAP financial measures of EBITDA and FCF in this news release because it considers them to be an important supplemental measure of performance. Management believes that these non-GAAP financial measures provide additional insight for analysts and investors evaluating the Company’s financial and operational performance by providing a consistent basis of comparison across periods. Non-GAAP financial measures have limitations as an analytical tool. Investors are encouraged to review the reconciliation of non-GAAP financial measures to their most directly comparable GAAP financial measures provided in this presentation, including in the accompanying tables located in the Appendix. 3
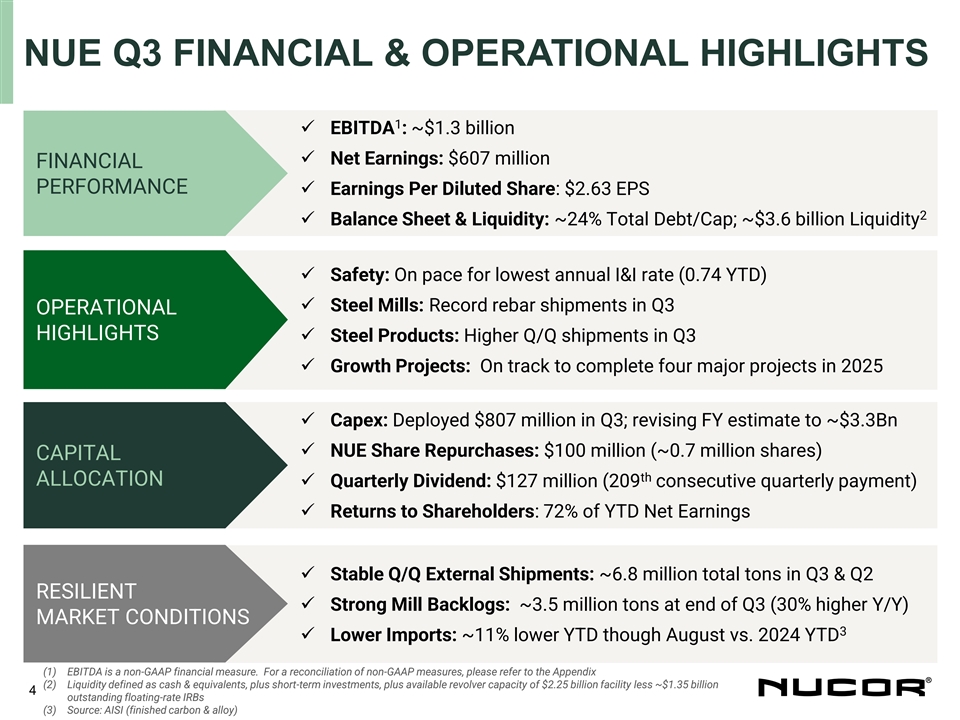
NUE Q3 FINANCIAL & OPERATIONAL HIGHLIGHTS 1 ✓ EBITDA : ~$1.3 billion ✓ $1.5 Billion EBITDA ✓ Net Earnings: $607 million FINANCIAL ✓ $845 Million Net Earnings PERFORMANCE ✓ Earnings Per Diluted Share: $2.63 EPS ✓ $3.46 Earnings Per Share (diluted) 2 ✓ Balance Sheet & Liquidity: ~24% Total Debt/Cap; ~$3.6 billion Liquidity ✓ Safety: On pace for lowest annual I&I rate (0.74 YTD) ✓ Steel Mills: Record rebar shipments in Q3 OPERATIONAL HIGHLIGHTS ✓ Steel Products: Higher Q/Q shipments in Q3 ✓ Growth Projects: On track to complete four major projects in 2025 ✓ Capex: Deployed $807 million in Q3; revising FY estimate to ~$3.3Bn ✓ NUE Share Repurchases: $100 million (~0.7 million shares) CAPITAL th ALLOCATION ✓ Quarterly Dividend: $127 million (209 consecutive quarterly payment) ✓ Returns to Shareholders: 72% of YTD Net Earnings ✓ Stable Q/Q External Shipments: ~6.8 million total tons in Q3 & Q2 RESILIENT ✓ Strong Mill Backlogs: ~3.5 million tons at end of Q3 (30% higher Y/Y) MARKET CONDITIONS 3 ✓ Lower Imports: ~11% lower YTD though August vs. 2024 YTD (1) EBITDA is a non-GAAP financial measure. For a reconciliation of non-GAAP measures, please refer to the Appendix (2) Liquidity defined as cash & equivalents, plus short-term investments, plus available revolver capacity of $2.25 billion facility less ~$1.35 billion 4 outstanding floating-rate IRBs (3) Source: AISI (finished carbon & alloy)
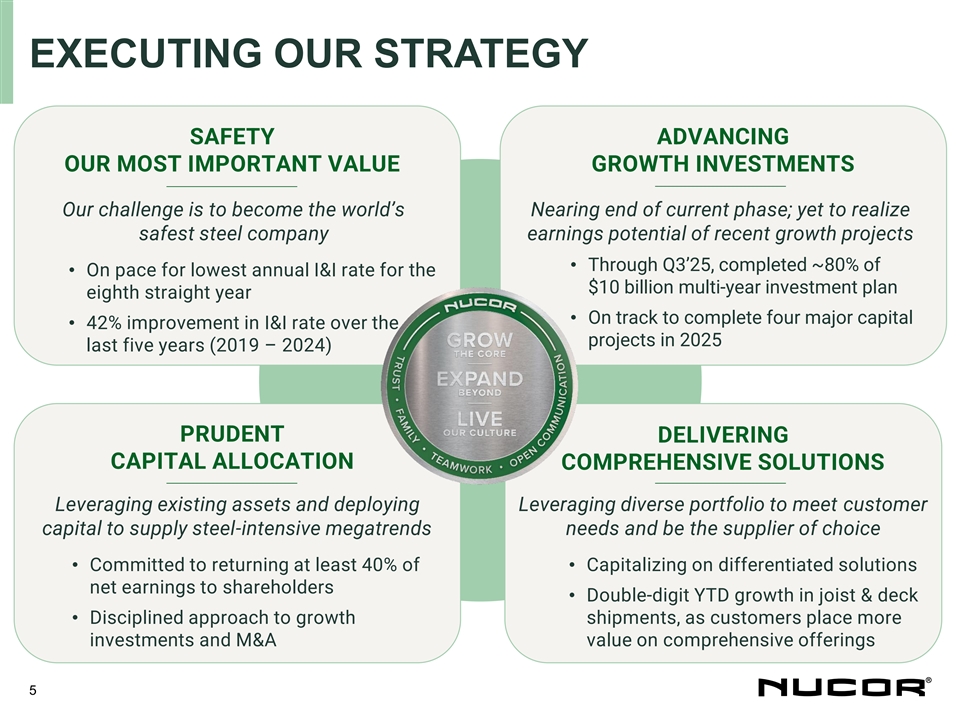
EXECUTING OUR STRATEGY SAFETY ADVANCING OUR MOST IMPORTANT VALUE GROWTH INVESTMENTS Our challenge is to become the world’s Nearing end of current phase; yet to realize safest steel company earnings potential of recent growth projects • Through Q3’25, completed ~80% of • On pace for lowest annual I&I rate for the $10 billion multi-year investment plan eighth straight year • On track to complete four major capital • 42% improvement in I&I rate over the projects in 2025 last five years (2019 – 2024) PRUDENT DELIVERING CAPITAL ALLOCATION COMPREHENSIVE SOLUTIONS Leveraging existing assets and deploying Leveraging diverse portfolio to meet customer capital to supply steel-intensive megatrends needs and be the supplier of choice • Committed to returning at least 40% of • Capitalizing on differentiated solutions net earnings to shareholders • Double-digit YTD growth in joist & deck • Disciplined approach to growth shipments, as customers place more investments and M&A value on comprehensive offerings 5
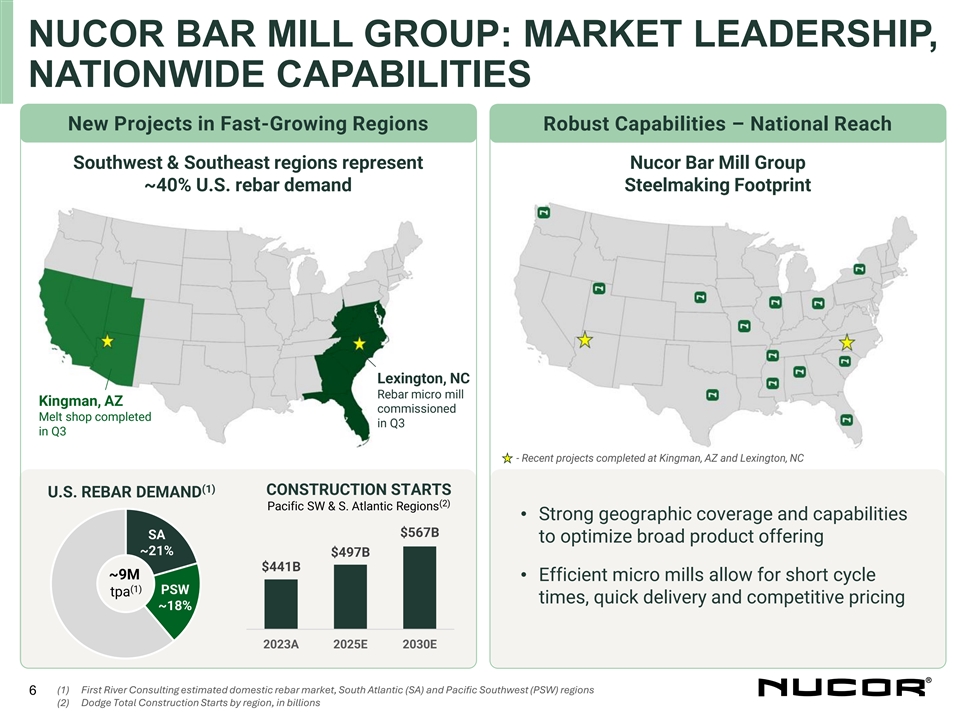
NUCOR BAR MILL GROUP: MARKET LEADERSHIP, NATIONWIDE CAPABILITIES New Projects in Fast-Growing Regions Robust Capabilities – National Reach Southwest & Southeast regions represent Nucor Bar Mill Group ~40% U.S. rebar demand Steelmaking Footprint Lexington, NC Rebar micro mill Kingman, AZ commissioned Melt shop completed in Q3 in Q3 - Recent projects completed at Kingman, AZ and Lexington, NC (1) CONSTRUCTION STARTS U.S. REBAR DEMAND (2) Pacific SW & S. Atlantic Regions • Strong geographic coverage and capabilities $567B SA to optimize broad product offering ~21% $497B $441B ~9M • Efficient micro mills allow for short cycle (1) PSW tpa times, quick delivery and competitive pricing ~18% 2023A 2025E 2030E (1) First River Consulting estimated domestic rebar market, South Atlantic (SA) and Pacific Southwest (PSW) regions 6 (2) Dodge Total Construction Starts by region, in billions
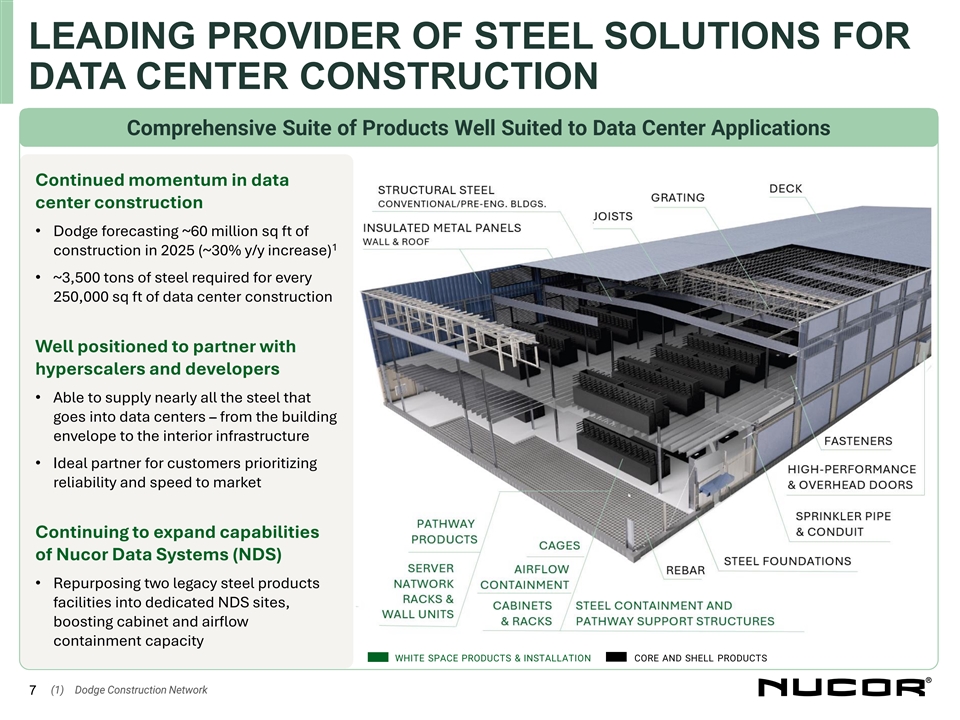
LEADING PROVIDER OF STEEL SOLUTIONS FOR DATA CENTER CONSTRUCTION Comprehensive Suite of Products Well Suited to Data Center Applications Continued momentum in data center construction • Dodge forecasting ~60 million sq ft of 1 construction in 2025 (~30% y/y increase) • ~3,500 tons of steel required for every 250,000 sq ft of data center construction Well positioned to partner with hyperscalers and developers • Able to supply nearly all the steel that goes into data centers – from the building envelope to the interior infrastructure • Ideal partner for customers prioritizing reliability and speed to market Continuing to expand capabilities of Nucor Data Systems (NDS) • Repurposing two legacy steel products facilities into dedicated NDS sites, boosting cabinet and airflow containment capacity WHITE SPACE PRODUCTS & INSTALLATION CORE AND SHELL PRODUCTS (1) Dodge Construction Network 7
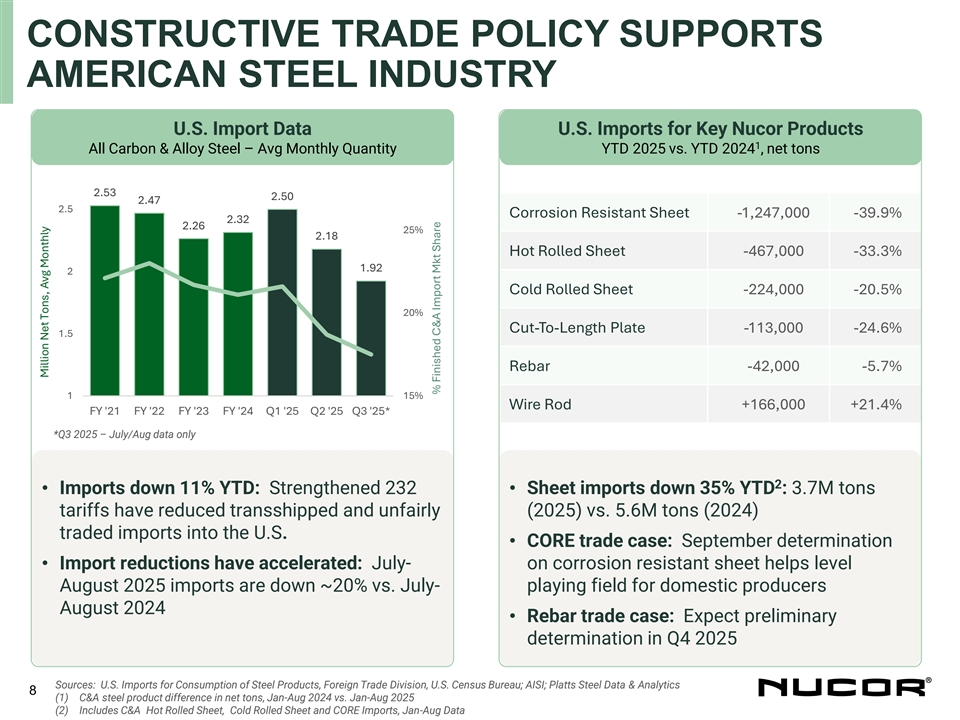
CONSTRUCTIVE TRADE POLICY SUPPORTS AMERICAN STEEL INDUSTRY U.S. Import Data U.S. Imports for Key Nucor Products 1 All Carbon & Alloy Steel – Avg Monthly Quantity YTD 2025 vs. YTD 2024 , net tons 2.53 2.50 2.47 2.5 Corrosion Resistant Sheet -1,247,000 -39.9% 2.32 2.26 25% 2.18 Hot Rolled Sheet -467,000 -33.3% 1.92 2 Cold Rolled Sheet -224,000 -20.5% 20% Cut-To-Length Plate -113,000 -24.6% 1.5 Rebar -42,000 -5.7% 1 15% Wire Rod +166,000 +21.4% FY '21 FY '22 FY '23 FY '24 Q1 '25 Q2 '25 Q3 '25* *Q3 2025 – July/Aug data only 2 • Imports down 11% YTD: Strengthened 232 • Sheet imports down 35% YTD : 3.7M tons tariffs have reduced transshipped and unfairly (2025) vs. 5.6M tons (2024) traded imports into the U.S. • CORE trade case: September determination • Import reductions have accelerated: July- on corrosion resistant sheet helps level August 2025 imports are down ~20% vs. July- playing field for domestic producers August 2024 • Rebar trade case: Expect preliminary determination in Q4 2025 Sources: U.S. Imports for Consumption of Steel Products, Foreign Trade Division, U.S. Census Bureau; AISI; Platts Steel Data & Analytics 8 (1) C&A steel product difference in net tons, Jan-Aug 2024 vs. Jan-Aug 2025 (2) Includes C&A Hot Rolled Sheet, Cold Rolled Sheet and CORE Imports, Jan-Aug Data Million Net Tons, Avg Monthly % Finished C&A Import Mkt Share
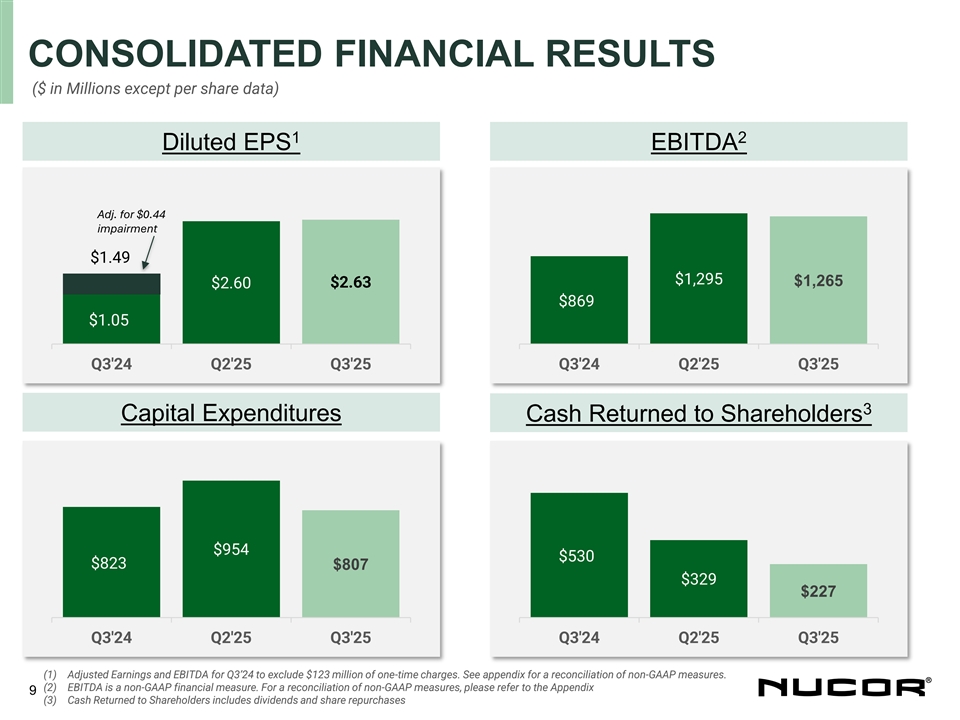
CONSOLIDATED FINANCIAL RESULTS ($ in Millions except per share data) 1 2 Diluted EPS EBITDA Adj. for $0.44 impairment $1.49 $1,295 $1,265 $2.60 $2.63 $869 $1.05 Q3'24 Q2'25 Q3'25 Q3'24 Q2'25 Q3'25 3 Capital Expenditures Cash Returned to Shareholders $954 $530 $823 $807 $329 $227 Q3'24 Q2'25 Q3'25 Q3'24 Q2'25 Q3'25 (1) Adjusted Earnings and EBITDA for Q3’24 to exclude $123 million of one-time charges. See appendix for a reconciliation of non-GAAP measures. (2) EBITDA is a non-GAAP financial measure. For a reconciliation of non-GAAP measures, please refer to the Appendix 9 (3) Cash Returned to Shareholders includes dividends and share repurchases
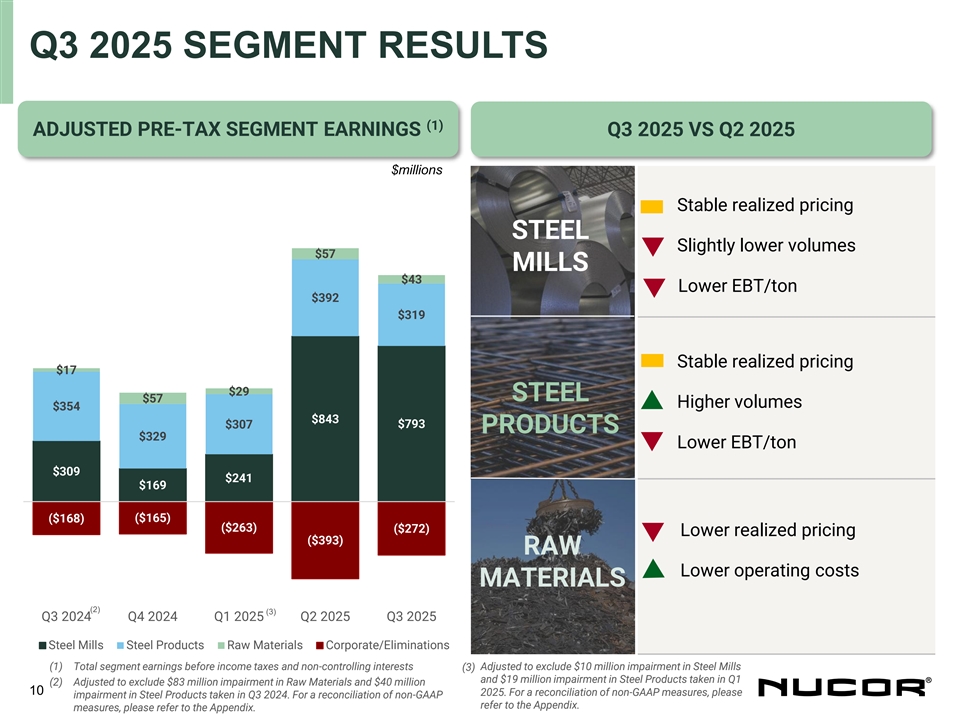
Q3 2025 SEGMENT RESULTS (1) ADJUSTED PRE-TAX SEGMENT EARNINGS Q3 2025 VS Q2 2025 $millions • Stable realized pricing STEEL • Slightly lower volumes $57 MILLS $43 • Lower EBT/ton $392 $319 • Stable realized pricing $17 $29 STEEL $57 • Higher volumes $354 $843 $793 $307 PRODUCTS $329 • Lower EBT/ton $309 $241 $169 ($168) ($165) ($263) ($272) Lower realized pricing ($393) RAW Lower operating costs MATERIALS (2) (3) Q3 2024 Q4 2024 Q1 2025 Q2 2025 Q3 2025 Steel Mills Steel Products Raw Materials Corporate/Eliminations (1) Total segment earnings before income taxes and non-controlling interests (3) Adjusted to exclude $10 million impairment in Steel Mills and $19 million impairment in Steel Products taken in Q1 (2) Adjusted to exclude $83 million impairment in Raw Materials and $40 million 10 2025. For a reconciliation of non-GAAP measures, please impairment in Steel Products taken in Q3 2024. For a reconciliation of non-GAAP refer to the Appendix. measures, please refer to the Appendix.
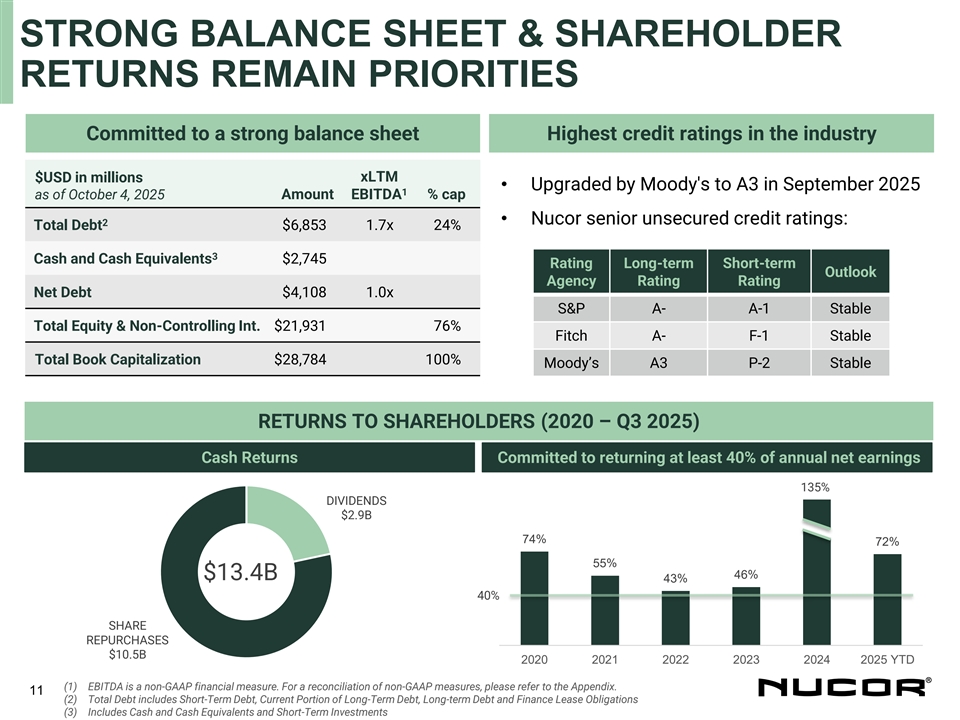
STRONG BALANCE SHEET & SHAREHOLDER RETURNS REMAIN PRIORITIES Committed to a strong balance sheet Highest credit ratings in the industry xLTM $USD in millions • Upgraded by Moody's to A3 in September 2025 1 as of October 4, 2025 Amount EBITDA % cap • Nucor senior unsecured credit ratings: 2 Total Debt $6,853 1.7x 24% 3 Cash and Cash Equivalents $2,745 Rating Long-term Short-term Outlook Agency Rating Rating Net Debt $4,108 1.0x S&P A- A-1 Stable Total Equity & Non-Controlling Int. $21,931 76% Fitch A- F-1 Stable Total Book Capitalization $28,784 100% Moody’s A3 P-2 Stable RETURNS TO SHAREHOLDERS (2020 – Q3 2025) Cash Returns Committed to returning at least 40% of annual net earnings 135% DIVIDENDS $2.9B 74% 72% 55% 46% $13.4B 43% 40% SHARE REPURCHASES $10.5B 2020 2021 2022 2023 2024 2025 YTD (1) EBITDA is a non-GAAP financial measure. For a reconciliation of non-GAAP measures, please refer to the Appendix. 11 (2) Total Debt includes Short-Term Debt, Current Portion of Long-Term Debt, Long-term Debt and Finance Lease Obligations (3) Includes Cash and Cash Equivalents and Short-Term Investments
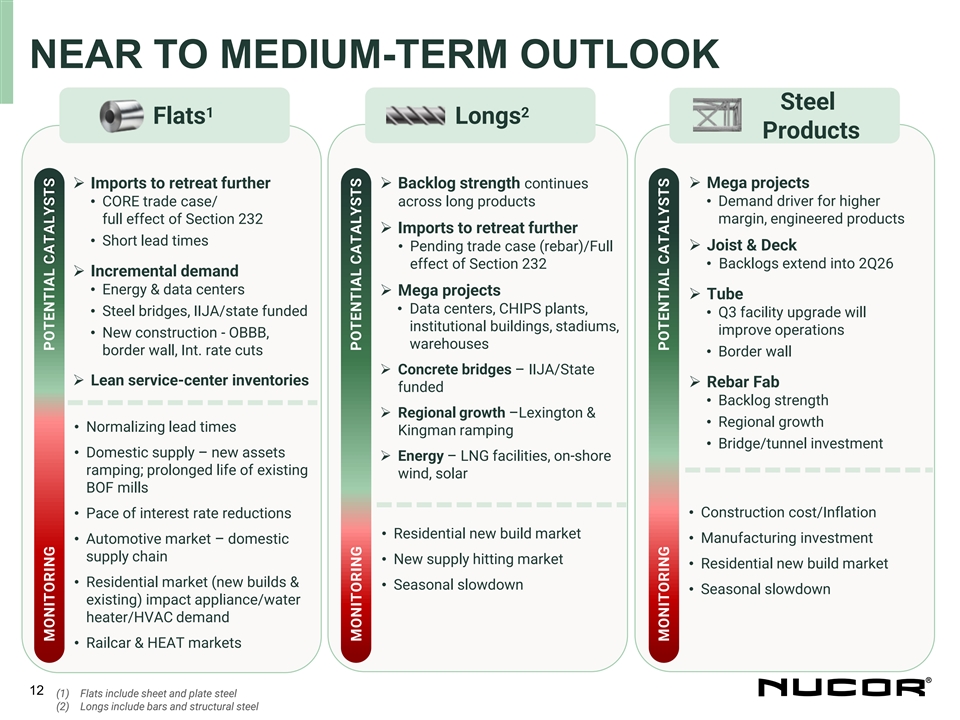
NEAR TO MEDIUM-TERM OUTLOOK Steel 1 2 Flats Longs Products ➢ Mega projects ➢ Imports to retreat further➢ Backlog strength continues • CORE trade case/ across long products• Demand driver for higher full effect of Section 232 margin, engineered products ➢ Imports to retreat further • Short lead times ➢ Joist & Deck • Pending trade case (rebar)/Full • Backlogs extend into 2Q26 effect of Section 232 ➢ Incremental demand • Energy & data centers ➢ Mega projects ➢ Tube • Data centers, CHIPS plants, • Steel bridges, IIJA/state funded • Q3 facility upgrade will institutional buildings, stadiums, improve operations • New construction - OBBB, warehouses border wall, Int. rate cuts • Border wall ➢ Concrete bridges – IIJA/State ➢ Lean service-center inventories ➢ Rebar Fab funded • Backlog strength ➢ Regional growth –Lexington & • Regional growth • Normalizing lead times Kingman ramping • Bridge/tunnel investment • Domestic supply – new assets ➢ Energy – LNG facilities, on-shore ramping; prolonged life of existing wind, solar BOF mills • Construction cost/Inflation • Pace of interest rate reductions • Residential new build market • Manufacturing investment • Automotive market – domestic supply chain • New supply hitting market • Residential new build market • Residential market (new builds & • Seasonal slowdown • Seasonal slowdown existing) impact appliance/water heater/HVAC demand • Railcar & HEAT markets 12 (1) Flats include sheet and plate steel (2) Longs include bars and structural steel MONITORING POTENTIAL CATALYSTS MONITORING POTENTIAL CATALYSTS MONITORING POTENTIAL CATALYSTS
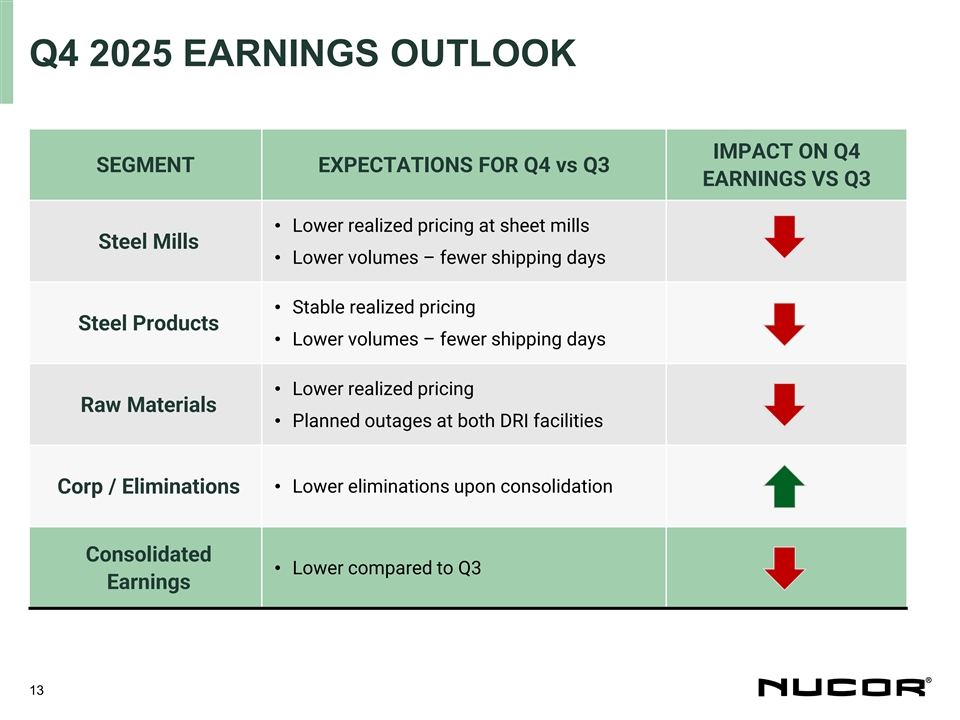
Q4 2025 EARNINGS OUTLOOK IMPACT ON Q4 SEGMENT EXPECTATIONS FOR Q4 vs Q3 EARNINGS VS Q3 • Lower realized pricing at sheet mills Steel Mills • Lower volumes – fewer shipping days • Stable realized pricing Steel Products • Lower volumes – fewer shipping days • Lower realized pricing Raw Materials • Planned outages at both DRI facilities Corp / Eliminations• Lower eliminations upon consolidation Consolidated • Lower compared to Q3 Earnings 13

APPENDIX 14
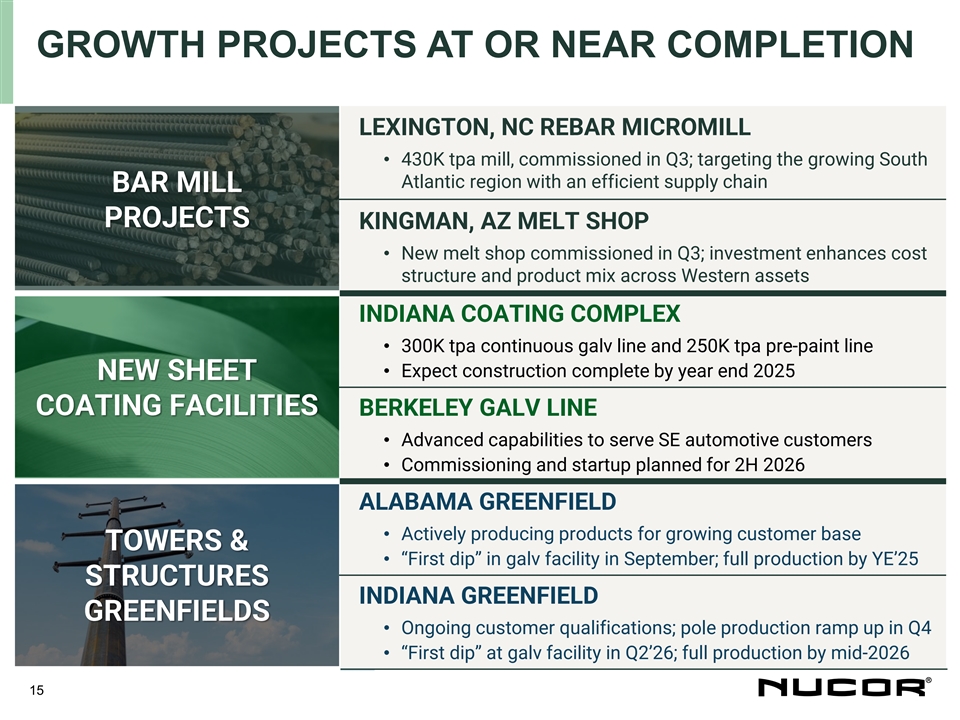
GROWTH PROJECTS AT OR NEAR COMPLETION LEXINGTON, NC REBAR MICROMILL • 430K tpa mill, commissioned in Q3; targeting the growing South Atlantic region with an efficient supply chain BAR MILL PROJECTS KINGMAN, AZ MELT SHOP • New melt shop commissioned in Q3; investment enhances cost structure and product mix across Western assets INDIANA COATING COMPLEX • 300K tpa continuous galv line and 250K tpa pre-paint line • Expect construction complete by year end 2025 NEW SHEET COATING FACILITIES BERKELEY GALV LINE • Advanced capabilities to serve SE automotive customers • Commissioning and startup planned for 2H 2026 ALABAMA GREENFIELD • Actively producing products for growing customer base TOWERS & • “First dip” in galv facility in September; full production by YE’25 STRUCTURES INDIANA GREENFIELD GREENFIELDS • Ongoing customer qualifications; pole production ramp up in Q4 • “First dip” at galv facility in Q2’26; full production by mid-2026 15
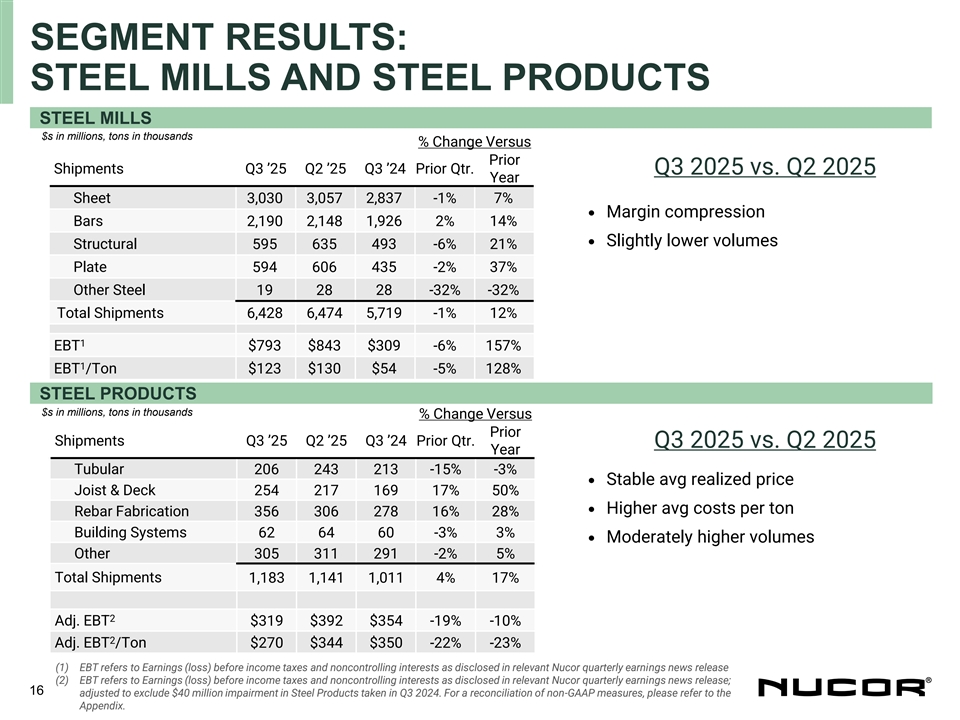
SEGMENT RESULTS: STEEL MILLS AND STEEL PRODUCTS STEEL MILLS $s in millions, tons in thousands % Change Versus Prior Shipments Q3 ’25 Q2 ’25 Q3 ’24 Prior Qtr. Q3 2025 vs. Q2 2025 Year Sheet 2,837 7% 3,030 3,057 -1% • Margin compression Bars 2,190 2,148 1,926 2% 14% • Slightly lower volumes Structural 595 635 493 -6% 21% Plate 594 606 435 -2% 37% Other Steel 19 28 28 -32% -32% Total Shipments 6,428 6,474 5,719 -1% 12% 1 EBT $793 $843 $309 -6% 157% 1 EBT /Ton $123 $130 $54 -5% 128% STEEL PRODUCTS $s in millions, tons in thousands % Change Versus Prior Shipments Q3 ’25 Q2 ’25 Q3 ’24 Prior Qtr. Q3 2025 vs. Q2 2025 Year Tubular 206 243 213 -15% -3% • Stable avg realized price Joist & Deck 254 217 169 17% 50% • Higher avg costs per ton Rebar Fabrication 356 306 278 16% 28% Building Systems 62 64 60 -3% 3% • Moderately higher volumes Other 305 311 291 -2% 5% Total Shipments 1,183 1,141 1,011 4% 17% 2 Adj. EBT $319 $392 $354 -19% -10% 2 Adj. EBT /Ton $270 $344 $350 -22% -23% (1) EBT refers to Earnings (loss) before income taxes and noncontrolling interests as disclosed in relevant Nucor quarterly earnings news release (2) EBT refers to Earnings (loss) before income taxes and noncontrolling interests as disclosed in relevant Nucor quarterly earnings news release; 16 adjusted to exclude $40 million impairment in Steel Products taken in Q3 2024. For a reconciliation of non-GAAP measures, please refer to the Appendix.
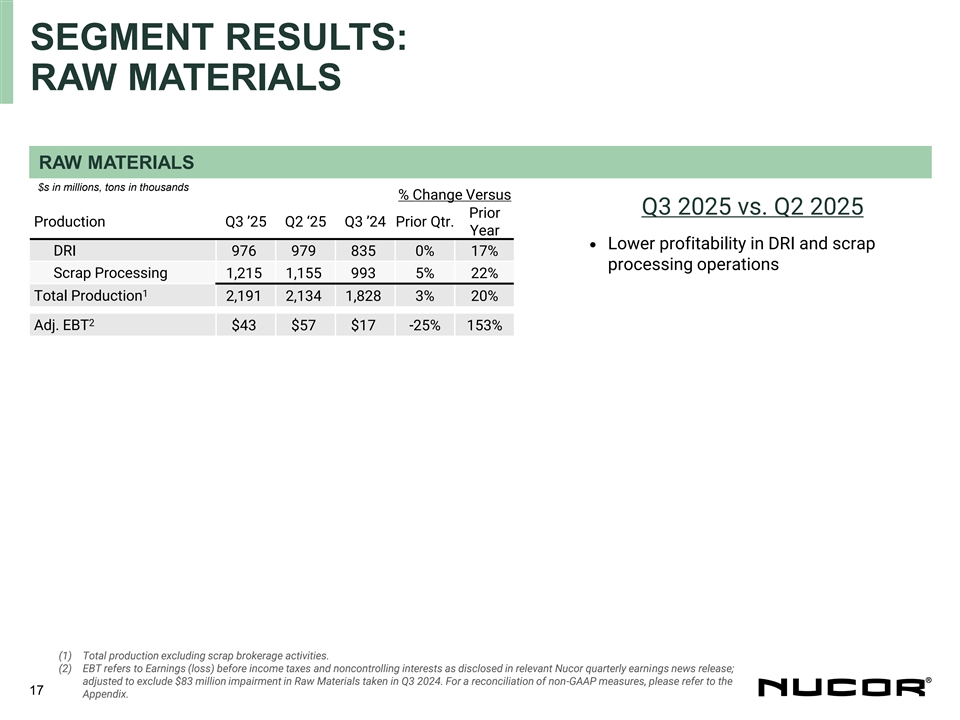
SEGMENT RESULTS: RAW MATERIALS RAW MATERIALS $s in millions, tons in thousands % Change Versus Q3 2025 vs. Q2 2025 Prior Production Q3 ’25 Q2 ‘25 Q3 ’24 Prior Qtr. Year • Lower profitability in DRI and scrap DRI 976 979 835 0% 17% processing operations Scrap Processing 1,215 1,155 993 5% 22% 1 Total Production 2,191 2,134 1,828 3% 20% 2 Adj. EBT $43 $57 $17 -25% 153% (1) Total production excluding scrap brokerage activities. (2) EBT refers to Earnings (loss) before income taxes and noncontrolling interests as disclosed in relevant Nucor quarterly earnings news release; adjusted to exclude $83 million impairment in Raw Materials taken in Q3 2024. For a reconciliation of non-GAAP measures, please refer to the 17 Appendix.
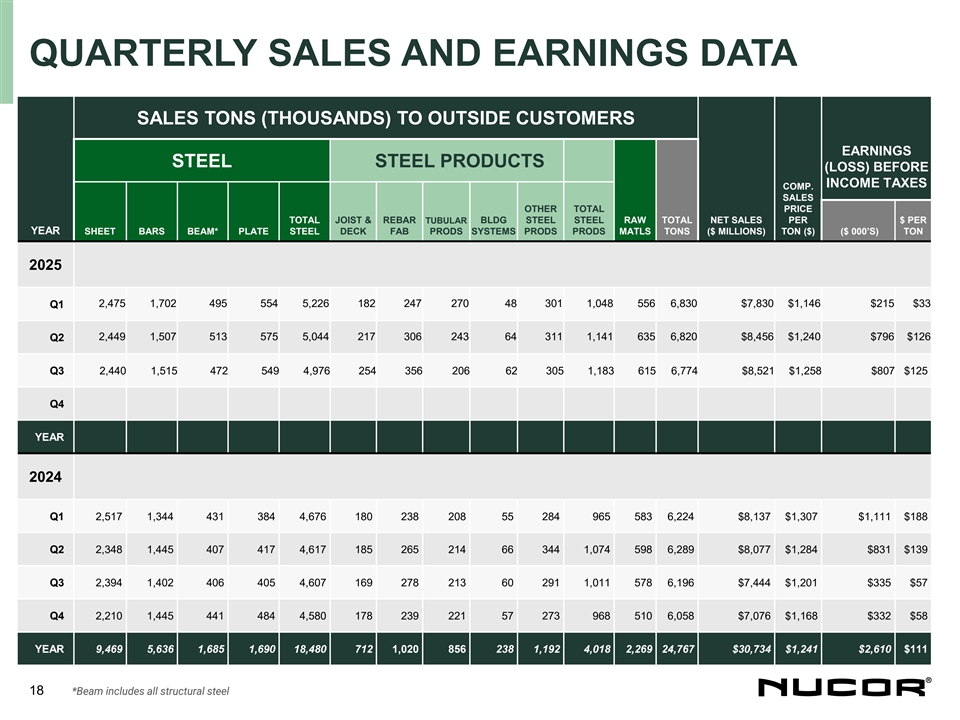
QUARTERLY SALES AND EARNINGS DATA SALES TONS (THOUSANDS) TO OUTSIDE CUSTOMERS EARNINGS STEEL STEEL PRODUCTS (LOSS) BEFORE INCOME TAXES COMP. SALES OTHER TOTAL PRICE TOTAL JOIST & REBAR TUBULAR BLDG STEEL STEEL RAW TOTAL NET SALES PER $ PER YEAR SHEET BARS BEAM* PLATE STEEL DECK FAB PRODS SYSTEMS PRODS PRODS MATLS TONS ($ MILLIONS) TON ($) ($ 000’S) TON 2025 2,475 1,702 495 554 5,226 182 247 270 48 301 1,048 556 6,830 $7,830 $1,146 $215 $33 Q1 2,449 1,507 513 575 5,044 217 306 243 64 311 1,141 635 6,820 $8,456 $1,240 $796 $126 Q2 Q3 2,440 1,515 472 549 4,976 254 356 206 62 305 1,183 615 6,774 $8,521 $1,258 $807 $125 Q4 YEAR 2024 Q1 2,517 1,344 431 384 4,676 180 238 208 55 284 965 583 6,224 $8,137 $1,307 $1,111 $188 Q2 2,348 1,445 407 417 4,617 185 265 214 66 344 1,074 598 6,289 $8,077 $1,284 $831 $139 Q3 2,394 1,402 406 405 4,607 169 278 213 60 291 1,011 578 6,196 $7,444 $1,201 $335 $57 Q4 2,210 1,445 441 484 4,580 178 239 221 57 273 968 510 6,058 $7,076 $1,168 $332 $58 YEAR 9,469 5,636 1,685 1,690 18,480 712 1,020 856 238 1,192 4,018 2,269 24,767 $30,734 $1,241 $2,610 $111 18 *Beam includes all structural steel
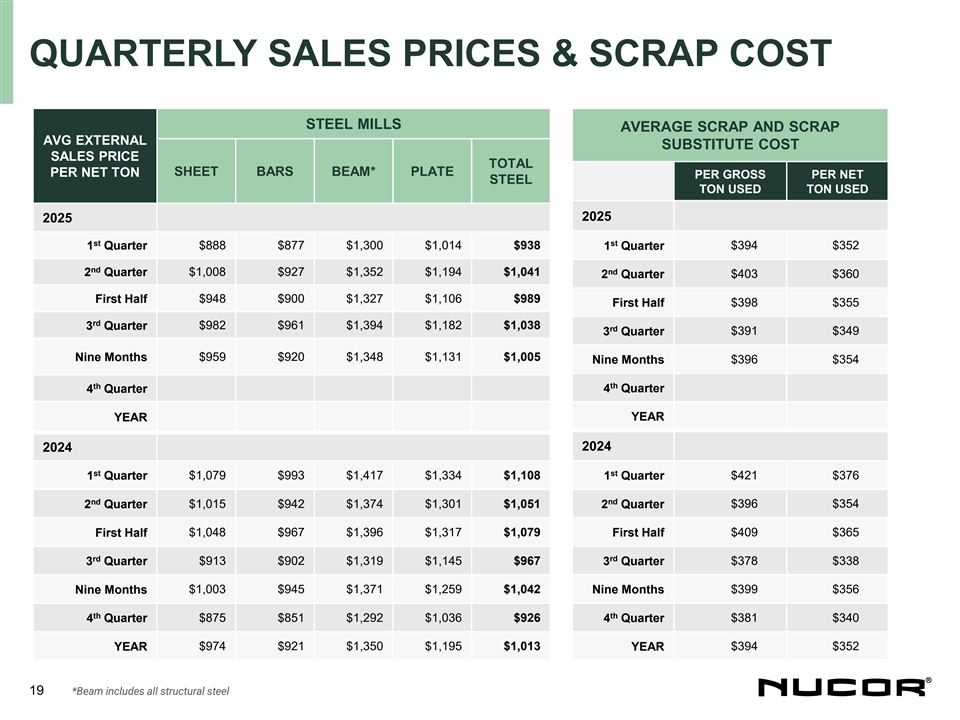
QUARTERLY SALES PRICES & SCRAP COST STEEL MILLS AVERAGE SCRAP AND SCRAP AVG EXTERNAL SUBSTITUTE COST SALES PRICE TOTAL SHEET BARS BEAM* PLATE PER NET TON PER GROSS PER NET STEEL TON USED TON USED 2025 2025 st st 1 Quarter $888 $877 $1,300 $1,014 $938 $394 $352 1 Quarter nd nd 2 Quarter $1,008 $927 $1,352 $1,194 $1,041 2 Quarter $403 $360 First Half $948 $900 $1,327 $1,106 $989 First Half $398 $355 rd 3 Quarter $982 $961 $1,394 $1,182 $1,038 rd $391 $349 3 Quarter Nine Months $959 $920 $1,348 $1,131 $1,005 Nine Months $396 $354 th th 4 Quarter 4 Quarter YEAR YEAR 2024 2024 st st 1 Quarter $1,079 $993 $1,417 $1,334 $1,108 1 Quarter $421 $376 nd nd 2 Quarter $1,015 $942 $1,374 $1,301 $1,051 2 Quarter $396 $354 $1,048 $967 $1,396 $1,317 $1,079 $409 $365 First Half First Half rd rd 3 Quarter $913 $902 $1,319 $1,145 $967 3 Quarter $378 $338 Nine Months $1,003 $945 $1,371 $1,259 $1,042 Nine Months $399 $356 th th 4 Quarter $875 $851 $1,292 $1,036 $926 4 Quarter $381 $340 YEAR $974 $921 $1,350 $1,195 $1,013 YEAR $394 $352 19 *Beam includes all structural steel
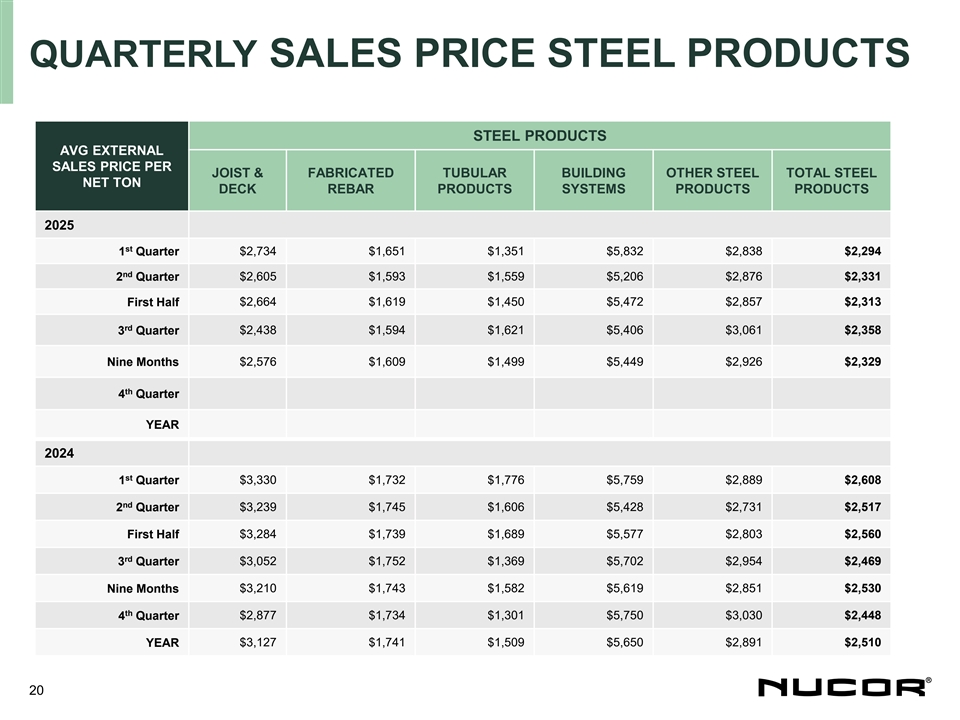
QUARTERLY SALES PRICE STEEL PRODUCTS STEEL PRODUCTS AVG EXTERNAL SALES PRICE PER JOIST & FABRICATED TUBULAR BUILDING OTHER STEEL TOTAL STEEL NET TON DECK REBAR PRODUCTS SYSTEMS PRODUCTS PRODUCTS 2025 st 1 Quarter $2,734 $1,651 $1,351 $5,832 $2,838 $2,294 nd 2 Quarter $2,605 $1,593 $1,559 $5,206 $2,876 $2,331 First Half $2,664 $1,619 $1,450 $5,472 $2,857 $2,313 rd 3 Quarter $2,438 $1,594 $1,621 $5,406 $3,061 $2,358 $2,576 $1,609 $1,499 $5,449 $2,926 $2,329 Nine Months th 4 Quarter YEAR 2024 st 1 Quarter $3,330 $1,732 $1,776 $5,759 $2,889 $2,608 nd 2 Quarter $3,239 $1,745 $1,606 $5,428 $2,731 $2,517 First Half $3,284 $1,739 $1,689 $5,577 $2,803 $2,560 rd 3 Quarter $3,052 $1,752 $1,369 $5,702 $2,954 $2,469 $3,210 $1,743 $1,582 $5,619 $2,851 $2,530 Nine Months th 4 Quarter $2,877 $1,734 $1,301 $5,750 $3,030 $2,448 YEAR $3,127 $1,741 $1,509 $5,650 $2,891 $2,510 20
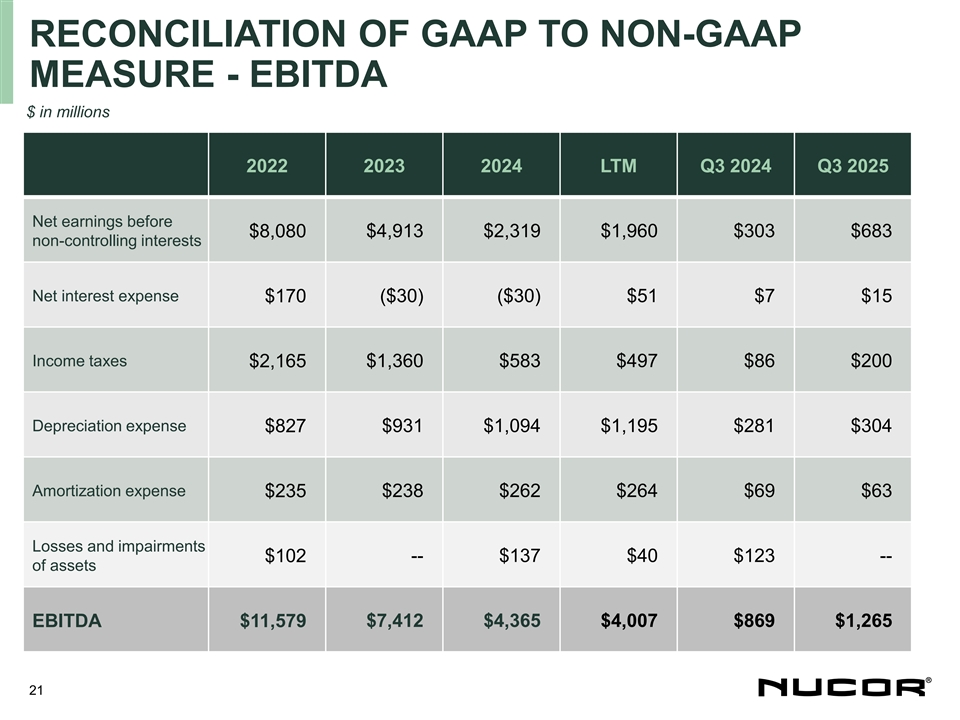
RECONCILIATION OF GAAP TO NON-GAAP MEASURE - EBITDA $ in millions 2022 2023 2024 LTM Q3 2024 Q3 2025 Net earnings before $8,080 $4,913 $2,319 $1,960 $303 $683 non-controlling interests Net interest expense $170 ($30) ($30) $51 $7 $15 Income taxes $2,165 $1,360 $583 $497 $86 $200 Depreciation expense $827 $931 $1,094 $1,195 $281 $304 Amortization expense $235 $238 $262 $264 $69 $63 Losses and impairments $102 -- $137 $40 $123 -- of assets $7,412 $4,365 $4,007 $869 $1,265 EBITDA $11,579 21
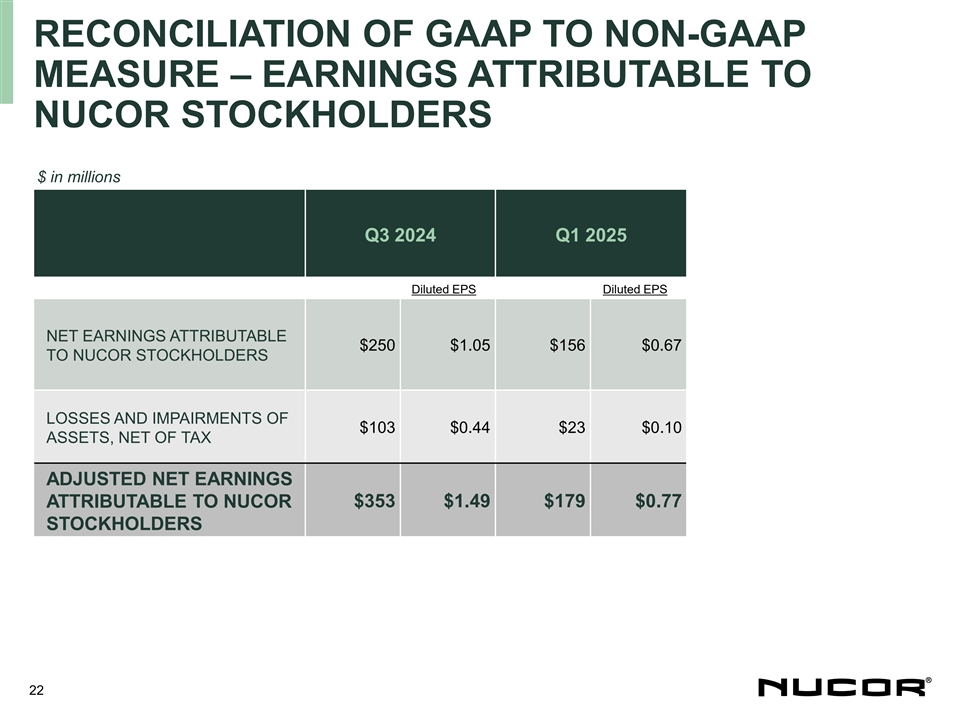
RECONCILIATION OF GAAP TO NON-GAAP MEASURE – EARNINGS ATTRIBUTABLE TO NUCOR STOCKHOLDERS $ in millions Q3 2024 Q1 2025 Diluted EPS Diluted EPS NET EARNINGS ATTRIBUTABLE $250 $1.05 $156 $0.67 TO NUCOR STOCKHOLDERS LOSSES AND IMPAIRMENTS OF $103 $0.44 $23 $0.10 ASSETS, NET OF TAX ADJUSTED NET EARNINGS ATTRIBUTABLE TO NUCOR $353 $1.49 $179 $0.77 STOCKHOLDERS 22
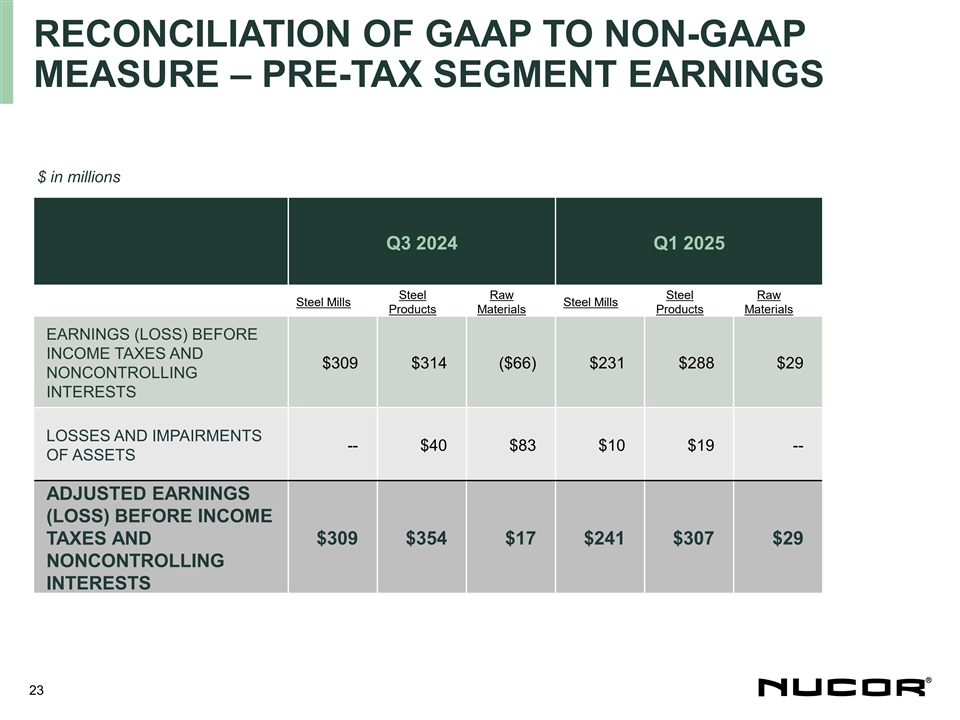
RECONCILIATION OF GAAP TO NON-GAAP MEASURE – PRE-TAX SEGMENT EARNINGS $ in millions Q3 2024 Q1 2025 Steel Raw Steel Raw Steel Mills Steel Mills Products Materials Products Materials EARNINGS (LOSS) BEFORE INCOME TAXES AND $309 $314 ($66) $231 $288 $29 NONCONTROLLING INTERESTS LOSSES AND IMPAIRMENTS -- $40 $83 $10 $19 -- OF ASSETS ADJUSTED EARNINGS (LOSS) BEFORE INCOME TAXES AND $309 $354 $17 $241 $307 $29 NONCONTROLLING INTERESTS 23