| Feldman Financial Advisors, Inc. | ||
| 8804 Mirador Place | ||
| McLean, VA 22102 | ||
| (202) 467-6862 | ||
|
Everett Cash Mutual Insurance Company Everett, Pennsylvania
Conversion Valuation Appraisal Report Valued as of September 17, 2025
Prepared By
Feldman Financial Advisors, Inc. McLean, Virginia
|
| Feldman Financial Advisors, Inc. | ||
| 8804 Mirador Place | ||
| McLean, VA 22102 | ||
| (202) 467-6862 | ||
September 17, 2025
Board of Directors
Everett Cash Mutual Insurance Company
10591 Lincoln Highway
Everett, Pennsylvania 61201
Members of the Board:
At your request, we have completed and hereby provide an independent appraisal (the “Appraisal”) of the estimated consolidated pro forma market value of Everett Cash Mutual Insurance Company (“ECM” or the “Company”) as of September 17, 2025 (the “Valuation Date”). Pursuant to a Plan of Conversion from the Mutual to Stock Form (the “Plan of Conversion”) to be adopted by ECM’s Board of Directors, ECM plans to convert from a Pennsylvania mutual insurance company to a Pennsylvania stock insurance company (the “Conversion”) under the Pennsylvania Insurance Company Mutual-to-Stock Conversion Act (the “Act”). Simultaneously, ECM will issue and sell all of its common stock to Old Republic Specialty Insurance Group, Inc. (“Old Republic Specialty”), a wholly owned subsidiary of Old Republic International Corporation (“Old Republic”). Old Republic Specialty will acquire all of the authorized common stock of the converted ECM for an amount of cash equal to at least the minimum of the valuation range (“Valuation Range”) established herein by the statutorily required and independently determined Appraisal. As a result of the foregoing, ECM will become an indirect wholly owned subsidiary of Old Republic.
ECM’s eligible policyholders and other eligible subscribers will receive the right to purchase shares of Old Republic common stock in a stock offering (the “Offering”) in an aggregate amount between the minimum and maximum of the Valuation Range at a purchase price per share discount of from 30% to 35% of the volume-weighted average trading price of Old Republic common stock. In the event that the aggregate amount of stock sold in the Offering is less than the minimum of the Valuation Range, Old Republic will contribute cash equal to not less than the difference between the minimum of the Valuation Range and the aggregate amount of stock sold in the Offering to fund the acquisition of all of the common stock of ECM as converted.
In accordance with Section 914(A)-d of the Act, the aggregate price of the capital stock issued in the Conversion shall be equal to the estimated pro forma market value of the converted stock company based upon an independent evaluation by a qualified expert. Furthermore, as permitted by Section 914(A)-d of the Act, the pro forma market value may be that value that is estimated to be necessary to attract full subscription for the shares and may be stated as a range of pro forma market value. Pursuant to the requirement in Section 913-A(b)(1), the Appraisal must be included as part of the Plan of Conversion filed with the Commissioner of the Pennsylvania Insurance Department.
FELDMAN FINANCIAL ADVISORS, INC.
Board of Directors
Everett Cash Mutual Insurance Company
September 17, 2025
Page Two
Feldman Financial Advisors, Inc. (“Feldman Financial”) is a financial consulting and advisory firm that specializes in financial valuations and analyses of business enterprises and securities in the financial services industry. The background of Feldman Financial is presented in Exhibit I. In preparing the Appraisal, we conducted an analysis of ECM that included discussions with the Company’s management. We reviewed the unaudited financial statements of ECM as prepared under generally accepted accounting principles (“GAAP”) for the years ended December 31, 2023 and 2024. We also reviewed statutory financial data of ECM for the years ended December 31, 2023 and 2024 and the six months ended June 30, 2025. In addition, where appropriate, we considered information based on other available published sources that we believe are reliable; however, we cannot guarantee the accuracy and completeness of such information.
In preparing the Appraisal, we also reviewed and analyzed: (i) financial and operating information with respect to the business, operations, and prospects of ECM as furnished to us by the Company; (ii) publicly available information concerning the Company that we believe to be relevant to our analysis; (iii) a comparison of the historical financial results and present financial condition of the Company with those of selected publicly traded insurance companies that we deemed relevant; and (iv) financial performance and market valuation data of certain publicly traded insurance industry aggregates as provided by industry sources.
The Appraisal is based on the Company’s representation that the information and financial data furnished to us by the Company and its independent auditors are truthful, accurate, and complete. We did not independently verify the financial statements and other information provided by the Company and its independent auditors, nor did we independently value the assets or liabilities of the Company. The Appraisal considers the Company only as a going concern on a standalone basis and should not be considered as an indication of the liquidation value of the Company.
It is our opinion that, as of September 17, 2025, the estimated consolidated pro forma market value of the Company was $180,000,000 with a corresponding Valuation Range of $153,000,000 to $207,000,000. The Valuation Range was based upon a 15% decrease from the midpoint of $180,000,000 to determine the minimum and a 15% increase from the midpoint to establish the maximum.
Our Appraisal is not intended, and must not be construed, to be a recommendation of any kind as to the advisability of purchasing shares of Old Republic common stock in the Offering. The Appraisal considers the Company only as a going concern and should not be considered as an indication of its liquidation value. The Appraisal is necessarily based upon estimates of a number of matters, all of which are subject to change from time to time.
FELDMAN FINANCIAL ADVISORS, INC.
Board of Directors
Everett Cash Mutual Insurance Company
September 17, 2025
Page Three
The Appraisal reflects only the Valuation Range, as of the Valuation Date, of the estimated consolidated pro forma market value of the Company as converted and does not take into account any trading activity with respect to the purchase and sale of Old Republic common stock in the secondary market on the date of issuance of such securities or at any time thereafter following the completion of the Offering. Feldman Financial is not a seller of securities within the meaning of any federal or state securities laws, and any report prepared by Feldman Financial shall not be used as an offer or solicitation with respect to the purchase or sale of any securities.
The Valuation Range reported herein may be updated as necessary and required. These updates will consider, among other factors, any developments or changes in the Company’s operating performance, financial condition, or management policies, and current conditions in the securities markets for insurance company common stocks. Should any such new developments or changes be material, in our opinion, to the estimated consolidated pro forma market value of the Company, appropriate adjustments to the Valuation Range will be made. The reasons for any such adjustments will be explained in detail at that time.
| Respectfully submitted, | |
| Feldman Financial Advisors, Inc. | |
| /s/ Trent R. Feldman | |
| Trent R. Feldman, President | |
| /s/ Peter W. L. Williams | |
| Peter W. L. Williams, Principal |
FELDMAN FINANCIAL ADVISORS, INC.
TABLE OF CONTENTS
| CHAPTER | PAGE | |||
| INTRODUCTION | 1 | |||
| I. | BUSINESS OF EVERETT CASH MUTUAL INSURANCE COMPANY | 2 | ||
| General Overview | 2 | |||
| Financial Condition | 8 | |||
| Income and Expense Trends | 10 | |||
| II. | INDUSTRY FUNDAMENTALS | 19 | ||
| Financial Strength Ratings by A.M. Best | 19 | |||
| Industry Performance and Investment Outlook | 20 | |||
| III. | COMPARISONS WITH PUBLICLY TRADED COMPANIES | 21 | ||
| General Overview | 21 | |||
| Selection Criteria | 22 | |||
| Summary Profiles of the Comparative Group Companies | 25 | |||
| Recent Financial Comparisons | 30 | |||
| IV. | MARKET VALUE ADJUSTMENTS | 34 | ||
| General Overview | 34 | |||
| Earnings Prospects | 34 | |||
| Management | 35 | |||
| Liquidity of the Issue | 35 | |||
| Dividend Policy | 36 | |||
| Subscription Interest | 36 | |||
| Stock Market Conditions | 36 | |||
| New Issue Discount | 38 | |||
| Adjustments Conclusion | 40 | |||
| Valuation Approach | 40 | |||
| Valuation Conclusion | 41 | |||
| APPENDIX – EXHIBITS | ||||
| I | Background of Feldman Financial Advisors, Inc. | I-1 | ||
| II | Statement of Contingent and Limiting Conditions | II-1 | ||
| III-1 | Consolidated Balance Sheets | III-1 | ||
| III-2 | Consolidated Income Statements | III-2 | ||
| III-3 | Consolidated Investments and Cash Portfolio | III-3 | ||
| IV-1 | Statutory Financial Data – Everett Cash Mutual Insurance Company | IV-1 | ||
| IV-1 | Statutory Financial Data – American Reliable Insurance Company | IV-6 | ||
| IV-1 | Statutory Financial Data – 1st Choice Advantage Insurance Company, Inc. | IV-11 | ||
| IV-1 | Statutory Financial Data – Ever-Greene Mutual Insurance Company | IV-16 | ||
| V-1 | Financial Performance Data for Public P&C Insurance Companies | V-1 | ||
| V-2 | Market Valuation Data for Public P&C Insurance Companies | V-3 | ||
| VI-1 | Pro Forma Assumptions for Conversion Valuation | VI-1 | ||
| VI-2 | Pro Forma Conversion Valuation Range | VI-2 | ||
i
FELDMAN FINANCIAL ADVISORS, INC.
LIST OF TABLES
| CHAPTER | PAGE | ||||
| I. | BUSINESS OF EVERETT CASH MUTUAL INSURANCE COMPANY | ||||
| Table 1 | Corporate Organizational Structure | 3 | |||
| Table 2 | Selected Financial Condition Data | 8 | |||
| Table 3 | Consolidated Income Statement Data | 11 | |||
| Table 4 | Consolidated Underwriting Performance Data | 12 | |||
| Table 5 | Consolidated Direct Premiums Written by Line of Business | 13 | |||
| Table 6 | Consolidated Direct Premiums Written by State | 14 | |||
| Table 7 | Statutory Financial Overview | 18 | |||
| III. | COMPARISONS WITH PUBLICLY TRADED COMPANIES | ||||
| Table 8 | General Operating Summary of the Comparative Group | 24 | |||
| Table 9 | Comparative Financial Condition Data | 31 | |||
| Table 10 | Comparative Operating Performance Data | 33 | |||
| IV. | MARKET VALUE ADJUSTMENTS | ||||
| Table 11 | Selected Stock Market Index Performance | 37 | |||
| Table 12 | Subscription-Based Insurance Company Demutualizations | 39 | |||
| Table 13 | Comparative Market Valuation Analysis | 42 | |||
ii
FELDMAN FINANCIAL ADVISORS, INC.
INTRODUCTION
At your request, we have completed and hereby provide an independent appraisal (the “Appraisal”) of the estimated consolidated pro forma market value of Everett Cash Mutual Insurance Company (“ECM” or the “Company”) as of September 17, 2025 (the “Valuation Date”). Pursuant to a Plan of Conversion from the Mutual to Stock Form (the “Plan of Conversion”) to be adopted by the Company’s Board of Directors (the “Board”), ECM plans to convert from a Pennsylvania mutual insurance company to a Pennsylvania stock insurance company (the “Conversion”) under the Pennsylvania Insurance Company Mutual-to-Stock Conversion Act (the “Act”). Simultaneously, ECM will issue and sell all of its common stock to Old Republic Specialty Insurance Group, Inc. (“Old Republic Specialty”), a wholly owned subsidiary of Old Republic International Corporation (“Old Republic”). Old Republic Specialty will acquire all of the authorized common stock of the converted ECM for an amount of cash equal to at least the minimum of the valuation range (“Valuation Range”) established herein by the statutorily required and independently determined Appraisal. As a result of the foregoing, ECM will become an indirect wholly owned subsidiary of Old Republic.
ECM’s eligible policyholders and other eligible subscribers will receive the right to purchase shares of Old Republic common stock in a stock offering (the “Offering”) in an aggregate amount between the minimum and maximum of the Valuation Range at a purchase price per share discount of from 30% to 35% of the volume-weighted average trading price of Old Republic common stock. In the event that the aggregate amount of stock sold in the Offering is less than the minimum of the Valuation Range, Old Republic will contribute cash equal to not less than the difference between the minimum of the Valuation Range and the aggregate amount of stock sold in the Offering to fund the acquisition of all of the common stock of the ECM as converted.
In accordance with Section 914(A)-d of the Act, the aggregate price of the capital stock issued in the Conversion shall be equal to the estimated pro forma market value of the converted stock company based upon an independent evaluation by a qualified expert. Furthermore, as permitted by Section 914(A)-d of the Act, the pro forma market value may be that value that is estimated to be necessary to attract full subscription for the shares and may be stated as a range of pro forma market value.
Feldman Financial Advisors, Inc. (“Feldman Financial”) is a financial consulting and advisory firm that specializes in financial valuations and analyses of business enterprises and securities in the financial services industries. The background of Feldman Financial is presented in Exhibit I. In preparing the Appraisal, we conducted an analysis of ECM that included discussions with the Company’s management. We reviewed the unaudited financial statements of ECM as prepared under generally accepting accounting principles (“GAAP”) for the years ended December 31, 2023 and 2024. We also reviewed statutory financial data of ECM for the years ended December 31, 2023 and 2024 and the six months ended June 30, 2025. In addition, where appropriate, we considered information based on other available published sources that we believe are reliable; however, we cannot guarantee the accuracy and completeness of such information.
In preparing the Appraisal, we also reviewed and analyzed: (i) financial and operating information with respect to the business, operations, and prospects of ECM as furnished to us by the Company; (ii) publicly available information concerning the Company that we believe to be relevant to our analysis; (iii) a comparison of the historical financial results and present financial condition of the Company with those of selected publicly traded insurance companies that we deemed relevant; and (iv) financial performance and market valuation data of certain publicly traded insurance industry aggregates as provided by industry sources.
The Appraisal is based on the Company’s representation that the information and financial data furnished to us by the Company and its independent auditors are truthful, accurate, and complete. We did not independently verify the financial statements and other information provided by the Company and its independent auditors, nor did we independently value the assets or liabilities of the Company. The Appraisal considers the Company only as a going concern on a standalone basis and should not be considered as an indication of the liquidation value of the Company.
Our Appraisal is not intended, and must not be construed, to be a recommendation of any kind as to the advisability of purchasing shares of Old Republic common stock in the Offering. The Appraisal considers the Company only as a going concern and should not be considered as an indication of its liquidation value. The Appraisal is necessarily based upon estimates of a number of matters, all of which are subject to change from time to time.
The Valuation Range reported herein may be updated as necessary and required. These updates will consider, among other factors, any developments or changes in the Company’s operating performance, financial condition, or management policies, and current conditions in the securities markets for insurance company common stocks. Should any such new developments or changes be material, in our opinion, to the estimated consolidated pro forma market value of the Company, appropriate adjustments to the Valuation Range will be made. The reasons for any such adjustments will be explained in detail at that time.
1
FELDMAN FINANCIAL ADVISORS, INC.
I. BUSINESS OF EVERETT CASH MUTUAL INSURANCE COMPANY
General Overview
ECM is a mutual insurance company domiciled in Pennsylvania. ECM operates as a property and casualty insurance carrier specializing in farmowners and agribusiness coverage. ECM also offers certain commercial insurance products that complement its farm/agricultural focus. The Company was established originally in 1913. The executive offices of ECM are located in Everett, Pennsylvania. At December 31, 2024, on a consolidated GAAP basis, the Company had total assets of $513.0 million and total equity capital of $130.7 million. For the year ended December 31, 2024, ECM had direct premiums written of $237.2 million, net premiums earned of $177.1 million, and GAAP net income of $11.1 million.
ECM is organized as a group of companies, including various subsidiary companies and an affiliate. ECM markets its products through a network of independent agents in 48 states and the District of Columbia. Approximately 14.3%, 11.2%, 7.5%, and 6.7% of consolidated direct premiums written were from Pennsylvania, North Carolina, Texas, and Arkansas, respectively, for the year ended December 31, 2024. ECM is the fourth largest writer of farmowners insurance in Pennsylvania and the second largest writer of farmowners insurance in North Carolina.
ECM has expanded its geographic footprint to cover the continental United States through a combination of organic growth and the acquisition in 2022 of American Reliable Insurance Company (“ARIC”). ARIC is domiciled in Arizona and writes farm, ranch, and equine insurance coverage in 48 states and the District of Columbia. Following the acquisition of ARIC, ECM’s direct premiums written more than doubled from $107.8 million in 2021 to $249.7 million in 2023. The acquisition of ARIC accomplished, among other things, extraordinary geographic diversification and spread of risk for ECM and positioned the Company on a national scale.
Business Strategy
ECM seeks to be a leading provider of insurance solutions to the farm, ranch, and agricultural business sector. ECM has focused on growing its statutory surplus and premium revenue with a consistent theme of “narrow but deep” market penetration in the farm/agricultural insurance sector. An integral part of ECM’s business strategy is to own multiple insurance carriers that can target different market segments and geographical areas. Numerous states prevent an insurance carrier from offering multiple rating plans for a particular product. Through its subsidiary and affiliate group of companies, ECM utilizes different carriers to carve a product niche in profitable operating segments. ECM has also emphasized expanding its commercial insurance business, particularly in areas that are logical extensions of its agricultural niches. ECM’s focus on commercial lines has included small contractors, restaurants, wineries, breweries, and other “Main Street” small businesses.
Corporate Operating Structure
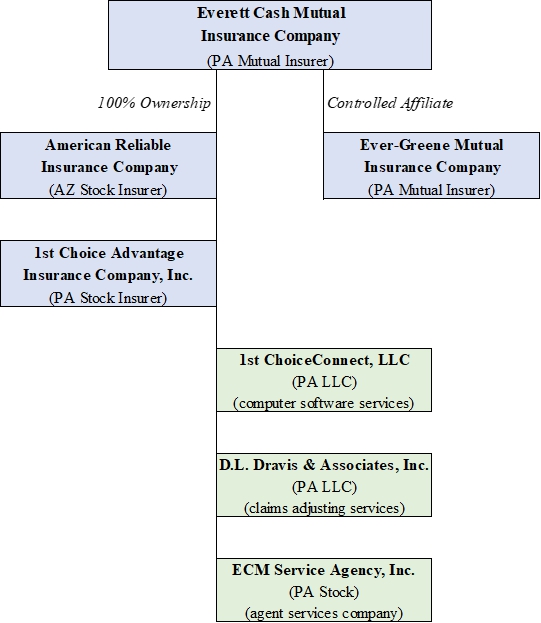
ECM is the ultimate controlling entity of its group of subsidiary companies. The corporate organizational chart on the next page depicts the direct ownership and affiliated relationships within the group of ECM businesses. ECM has 100% ownership of ARIC and 1st Choice Advantage Insurance Company, Inc. (“1CA”). ECM controls Ever-Greene Mutual Insurance Company (“EGM”) through a common board of directors at both companies. ECM is also party to reinsurance agreements and cost-sharing agreements with 1CA, EGM, and ARIC. Non-insurance carrier entities owned by ECM include 1st ChoiceConnect, LCC (“1CC”), D.L. Dravis and Associates, Inc. (“Dravis”), and ECM Service Agency, Inc. (“ECMSA”). ECM, ARIC, 1CA, and EGM share a common board of directors, employees, software, and office space. ECMSA operates as a retail insurance agency. Dravis provides claims adjusting and appraisal services to insurance companies. 1CC provides policy and claims software solutions to insurance companies. ARIC, 1CA, EGM, 1CC, and Dravis reimburse ECM under a cost-sharing agreement that stipulates the allocation of personnel costs, along with specific overhead expenses, based upon predetermined factors.
2
FELDMAN FINANCIAL ADVISORS, INC.
Table 1
ECM Insurance Group
Corporate Organizational Structure
3
FELDMAN FINANCIAL ADVISORS, INC.
Descriptions of the companies within the ECM Insurance Group are summarized below:
ECM (Everett, Pennsylvania) writes primarily property and liability insurance in 16 states, including Arkansas, Georgia, Illinois, Indiana, Iowa, Kansas, Kentucky, Maryland, Missouri, Nebraska, North Carolina, Ohio, Pennsylvania, South Dakota, Tennessee, and Virginia. ECM is also licensed but is not currently writing in five additional states. ECM provides insurance coverages primarily in the farmowners and commercial lines of business through a network of independent insurance agencies. ECM began non-renewing its personal automobile line of business in August 2024. ECM’s unconsolidated direct written premiums amounted to $107.2 million for the year ended December 31, 2024, with approximately 25.4%, 13.8%, and 12.8% generated in Pennsylvania, North Carolina, and Arkansas, respectively.
ARIC (Phoenix, Arizona) was acquired by ECM effective as of December 31, 2022. ARIC is licensed to write primarily property and liability insurance in all U.S. states and the District of Columbia, and writes insurance in all states except Alaska and Hawaii. ARIC provides insurance coverages primarily in the farmowners and commercial lines of business through a network of independent insurance agencies. ARIC concentrates on agribusiness, farms, ranches, and all aspects of the equine industry, including equine mortality. ARIC’s direct written premiums amounted to $100.7 million for the year ended December 31, 2024, with 8.3%, 5.2%, and 4.3% written in North Carolina, Texas, and Oklahoma, respectively.
1CA (Everett, Pennsylvania) is licensed to write automobile insurance in Pennsylvania, North Carolina, Kentucky, Ohio, Virginia, Tennessee, Georgia, Indiana, and Texas. 1CA also writes property insurance in Texas and Georgia. 1CA was initially established in 2000 to write automobile insurance in support of ECM’s primary property offering. Starting in 2017, 1CA began to diversify its product offerings to include other product lines consistent with ECM’s product offerings. During 2024, 1CA initiated a planned exit from private passenger automobile lines in all states. Products are offered by 1CA through a network of independent insurance agents. 1CA’s direct written premiums amounted to $29.3 million for the year ended December 31, 2024, with 39.7%, 16.2%, and 12.1% written in Texas, Pennsylvania, and North Carolina, respectively
EGM (Everett, Pennsylvania) is licensed in Pennsylvania. EGM is affiliated with ECM through common management and board control. Effective January 1, 2023, EGM assumed an increased strategic role within the ECM Insurance Group and entered into a quota share reinsurance agreement with ECM, whereby EGM began assuming 60% participation on risks written on a direct basis by ECM within Pennsylvania and classified as perils. EGM wrote no direct business in 2024 and reported $12.7 million in net premiums earned. In connection with the Conversion, EGM plans to merge into ECM and surrender its operating license.
1CC (Everett, Pennsylvania) functions as the technology arm of the ECM Insurance Group. ECM licensed its internally developed policy and claims systems to other insurance carriers, converting what is typically a cost center into a profit center. 1CC provides clients with innovative and cost-effective information management software, strategic management systems, and business intelligence models and dashboards for policy and claims administration, rate assessments and quotes, and payment access.
Dravis (Everett, Pennsylvania) operates as the independent claims adjusting division for the ECM Insurance Group. Dravis is a collection of employee adjusters and independent contractors, primarily overseeing the field investigation for ECM, ARIC, and other insurance carriers. Dravis has provided multi-line claims services since 1982. The staff of adjusters and appraisers at Dravis is equipped to handle a full spectrum of claims needs, including conducting full investigations and processing claims through completion, determination of value, settlement, and any mediation.
4
FELDMAN FINANCIAL ADVISORS, INC.
Product Offerings
ECM’s core competency lies in offering insurance products to farm/agriculture and selected commercial businesses. ECM has emphasized financial strength and growth in evolving into a multi-line, multi-state insurance carrier. ECM writes a variety of personal and commercial lines packages, specializing in farmowners coverage. ARIC concentrates on agribusiness, farms, ranches, and all aspects of the equine industry, including equine mortality. 1CA provides personal and commercial automobile coverage for farmowners and commercial policyholders in good standing with ECM. EGM’s current business consists of inland marine business assumed from ECM. ECM and 1CA are exiting the personal automobile market as personal automobile will be non-renewed starting with September 1, 2024 renewals. ECM, 1CA, and ARIC will continue to offer commercial automobile coverage as this segment is viewed as a key product to round out the farm/agriculture business model.
ECM provides niche programs for a wide variety of distinct businesses, including equine, poultry (along with avian influenza), confinement operations, commercial farms, wineries and vineyards, as well as farm bed and breakfast lodging. ECM has remained focused on expanding its niche through new product line offerings and expansion of its geographic footprint. ECM has gradually shifted its business mix by de-emphasizing homeowners accounts, which now only compose a nominal percentage of its overall premium business. In addition, personal automobile (which only makes up a modest portion of overall premium writings) non-renewals began September 1, 2024 and are expected to be completed by September 1, 2025. Management has also established new commercial coverage products, including agribusiness, liquor liability, car washes, wineries/breweries, and equipment breakdown, and has been expanding its commercial automobile program to support its niche farm/agriculture products. Overall, the Company’s prospective business plan includes maintaining focus on farm/agribusiness, continued integration of ARIC, and placing greater emphasis on pricing sophistication, rate adequacy and risk selection.
Marketing and Distribution
ECM’s marketing plan is aimed at delivering a top-quality insurance product to agents who are able to appreciate and sell the quality of the Company’s product in a price-sensitive marketplace. Having made a long-term commitment to a narrow market niche, ECM seeks to maintain pricing stability throughout the insurance market pricing cycles. The Company realizes there are always competitors who will offer an insurance product at a lower price, and there are always customers actively seeking the lowest-priced product. ECM strives to align itself with the segment of the market that does appreciate the coverages and services provided by the Company as an industry specialist. The Company recognizes that this segment requires competitive pricing but is willing to pay for needed coverages and services. ECM focuses on marketing its products through independent agents who are especially committed to the farmowners/agribusiness niche. ECM’s multiple distribution channel approach allows the Company to adjust pricing based on market conditions in various states.
The marketing efforts of ECM are further supported by the Company’s claims, underwriting, and billings operations. As an industry specialist, ECM is able to offer expertise in all interactions with agents and/or policyholders. ECM believes that these positive experiences result in higher policyholder retention and create new business opportunities for the Company’s agents. While it relies on independent agents for the front-line distribution and customer support, underwriting, billing, loss control, and claim handling responsibilities are retained by ECM. Many of the Company’s agents have had direct relationships with ECM for a number of years.
Executive Officers
ECM is managed by an experienced group of executives led by Randy F. Shaw, its President and Chief Executive Officer. Mr. Shaw joined ECM in 1987 and has served in many senior positions at ECM. Summary biographies of ECM’s executive officers are included below:
Randy F. Shaw serves as the President and Chief Executive Officer of ECM and also serves on the Board of Directors. He joined the Company in July 1987 and formerly served as Treasurer, Chief Financial Officer, and Chief Operating Officer of ECM. Mr. Shaw has more than 40 years of experience in the insurance and finance industry and holds a Certified Public Accountant designation. Prior to joining ECM, he was employed with Grumman Systems Support Corporation and Arthur Andersen & Company. Mr. Shaw received his B.S. in Accounting from Penn State University.
5
FELDMAN FINANCIAL ADVISORS, INC.
David E. Eppinger serves as Executive Vice President/Chief Operating Officer, a position he has held since January 2020. He also serves as Secretary of the Company. Previously, he served as the Vice President of Research and Development at ECM. Mr. Eppinger joined ECM originally in August 1998. He received his B.S. in Quantitative Business Analysis from Penn State University.
Steven S. Merrill serves as the Chief Financial Officer and Treasurer of the Company. He joined the Company in August 2022. Mr. Merrill is a Certified Public Accountant and was formerly employed by the independent accounting firms of Brown Schultz Sheridan & Fritz, Buffamante Whipple Buttafaro, P.C., and KPMG LLP. Mr. Merrill received his B.S. in Accounting from the University of Delaware.
Dennis R. Fraley serves as Executive Vice President of Underwriting of ECM. He joined the Company in April 2018. Mr. Fraley was employed previously by American Reliable Insurance Company since 2003 in various positions as National Sales Manager, Underwriting Manager of Commercial Operations, and Director of Commercial Operations and Underwriting. Mr. Fraley is a graduate of the University of Illinois Urbana-Champaign.
Plan of Conversion
As a mutual insurance company, ECM does not have shareholders. It has members. The members of ECM are the policyholders of ECM. The members of ECM are entitled to the right to elect directors and to approve fundamental transactions such as the Conversion. In an insurance company organized as a stock institution, policyholders have no governance rights, which reside with shareholders, and instead have only contractual rights under their insurance policies.
The Plan of Conversion is subject to the approval of the Board of ECM and subject to the approval of the Commissioner of the Pennsylvania Insurance Department. The Plan of Conversion is also subject to the approval of the members of ECM by the affirmative vote of at least two-thirds of the votes to be cast at a special meeting. The Plan of Conversion provides that Old Republic will offer shares of its common stock for sale in the Offering to Eligible Members of ECM and the directors, officers, and employees of ECM. The maximum amount of Old Republic common stock that any person, together with any associate or group of persons acting in concert, may directly or indirectly acquire in the Offering shall not exceed $350,000.
The Board of ECM regularly undertakes strategic review and assessment of its operations, business plans, enterprise risk management, and market position generally. The Board has also engaged in ongoing efforts to identify strategic alternatives to achieve ECM’s goals and address significant challenges currently facing it, including exceedingly high reinsurance costs, limited capacity to write new farmowners business, and needed technology and infrastructure investments. Ultimately, the Board determined that ECM’s future success, its ability to continue to serve its policyholders and other stakeholders, and ECM’s mission to become a preeminent writer of farmowners business, would all be enhanced by expanding its writing capacity, expanding geographically, augmenting its capital position, and achieving an “A+” rating from A.M. Best Company, Inc. (“A.M. Best”). After careful and thorough study and consideration, ECM concluded that the subscription rights method of demutualization, in a transaction sponsored by Old Republic, best suits ECM under the circumstances. In reaching its conclusion, ECM considered, among other things, that a sponsored demutualization with Old Republic will:
| ● | provide ECM with immediate and long-term access to a significant amount of additional capital and reinsurance capacity; |
| ● | permit ECM to avail itself of Old Republic’s A.M. Best “A+” financial strength rating and Old Republic’s larger A.M. Best financial size category; |
| ● | provide Eligible Members with an opportunity to acquire shares of Old Republic common stock at a significant (between 30% to 35%) discount to market; |
| ● | permit ECM to operate as an indirect wholly owned subsidiary of Old Republic going forward and serve as a platform for developing Old Republic’s specialty farmowners insurance business, thereby maintaining ECM’s existence on a continuing basis; |
6
FELDMAN FINANCIAL ADVISORS, INC.
| ● | permit ECM to continue to serve its existing specialty farmowners insurance customers and increase its product offerings to those customers and new policyholders; |
| ● | permit ECM to maintain its name, headquarters, culture, values, and management team; |
| ● | facilitate the creation of a charitable foundation with a significant $5.0 million contribution for the purpose of supporting the farming community; and |
| ● | provide ECM employees and management with opportunities for career advancement and participation in Old Republic’s existing employee benefits. |
Upon completion of the Conversion, all of the outstanding shares of common stock of the converted ECM will be purchased by Old Republic Specialty and ECM will then become an indirect wholly owned stock subsidiary of Old Republic. The Conversion will be effected only if the combined subscription orders and cash contribution amount from Old Republic equal at least the minimum of the Valuation Range and the members of ECM approve the Plan of Conversion.
The net proceeds from the Conversion will supply additional capital that ECM needs to support future premium growth. The net proceeds will also be used for general corporate purposes, including the repayment of a portion of the surplus notes outstanding. On a short-term basis, the net proceeds will be invested primarily in U.S. Government securities, other federal agency securities, and other securities consistent with the Company’s investment policy.
The remainder of Chapter I examines in more detail the trends addressed in this section, including the impact of changes in the Company’s economic and competitive environment, and ECM’s recent financial performance. The discussion is supplemented by the exhibits in the Appendix. Exhibit III-1 displays the Company’s consolidated GAAP balance sheets as of December 31, 2023 and 2024. Exhibit III-2 presents the Company’s consolidated GAAP income statements for the years ended December 31, 2023 and 2024.
7
FELDMAN FINANCIAL ADVISORS, INC.
Financial Condition
Table 2 presents selected data concerning ECM’s consolidated GAAP financial position as of December 31, 2023 and 2024. Exhibit III-1 presents ECM’s unaudited consolidated GAAP balance sheets as of December 31, 2023 and 2024. Consolidated GAAP financial statements of the Company prior to the years ended December 31, 2023 and 2024 have not been prepared. The recent GAAP financial statements were prepared internally by management of ECM with the assistance of external accountants but were not audited by an independent accounting firm.
Table 2
Selected Financial Condition Data
As of December 31, 2023 and 2024
(Dollars in Thousands)
| December 31, | ||||||||
| 2024 | 2023 | |||||||
| Consolidated Balance Sheet Data | ||||||||
| Total assets | $ | 513,046 | $ | 512,969 | ||||
| Total investments and cash | 240,851 | 229,532 | ||||||
| Uncollected premiums | 42,103 | 37,605 | ||||||
| Reinsurance reoverable (1) | 93,356 | 99,591 | ||||||
| Prepaid reinsurance premiums | 77,136 | 79,458 | ||||||
| Goodwill and other intangibles | 23,891 | 27,047 | ||||||
| Losses and loss adjustment expenses | 154,142 | 159,375 | ||||||
| Unearned premiums | 163,445 | 171,060 | ||||||
| Surplus notes payable | 25,000 | 25,000 | ||||||
| Total liabilities | 382,315 | 388,668 | ||||||
| Total equity | 130,731 | 124,301 | ||||||
| Total equity / total assets | 25.48 | % | 24.23 | % | ||||
| Tangible equity / tangible assets | 21.84 | % | 20.01 | % | ||||
| Total investments and cash / total assets | 46.95 | % | 44.75 | % | ||||
| Policy reserves (2) / total equity | 117.91 | % | 128.22 | % | ||||
| (1) | Includes reinsurance recoverable on unpaid and paid losses and loss adjustment expenses. |
| (2) | Policy reserves equal losses and loss adjustment expenses. |
Source: Everett Cash Mutual Insurance Company, internal GAAP financial statements.
ECM’s consolidated total assets were relatively unchanged from December 31, 2023 to December 31, 2024, measuring approximately $513.0 million at both year-end periods. The largest changes among asset categories in 2024 were an $11.3 million increase in total investment and cash and a $4.5 million increase in uncollected premiums, which were offset partially by a $6.2 million decrease in reinsurance balances recoverable and a $3.2 million decrease in goodwill and other intangibles. Total investments and cash increased from $229.5 million at December 31, 2023 to $240.9 million at December 31, 2024 as a result of continued positive cash flow from operations.
Total investments and cash amounted to 46.9% of total assets at December 31, 2024, compared to 44.7% of total assets as of December 31, 2023. Reinsurance balances recoverable decreased from $99.6 million (19.4% of total assets) at December 31, 2023 to $93.4 million (18.2% of total assets) at December 31, 2024. Reinsurance recoveries are estimates of paid and unpaid losses collectible from ECM’s reinsurers. Prepaid reinsurance premiums declined from $79.5 million (15.5% of total assets) at December 31, 2023 to $77.1 million (15.0% of total assets) at December 31, 2024. Prepaid reinsurance premiums represent amounts ECM has paid or advanced to reinsurers for premiums ceded but not yet earned.
8
FELDMAN FINANCIAL ADVISORS, INC.
Total liabilities decreased by 1.6% or $6.4 million from $388.7 million at December 31, 2023 to $382.3 million at December 31, 2024. The decrease in total liabilities was caused, in part, by the decrease in total policy reserves (losses and loss adjustment expenses), which was reflective of the timing of claims payments and favorable loss reserve development. Total policy reserves decreased by 3.3% or $5.2 million from $159.4 million at December 31, 2023 to $154.1 million at December 31, 2024, while unearned premiums decreased by 4.5% or $7.6 million from $171.1 million at year-end 2023 to $163.4 million at year-end 2024. Premiums are earned over the terms of the related insurance policies and reinsurance contract. Unearned premium reserves are established to cover the unexpired portion of premiums written. Such reserves are computed by monthly pro rata methods for direct business and are based on reports from ceding companies for reinsurance.
ECM maintains policy reserves for the payment of claims (losses) and loss adjustment expenses (“LAE”) related to adjusting those claims. ECM’s loss reserves consist of case reserves, which are reserves for claims that have been reported to it, defense and cost containment (“DCC”) expense reserves, which include all defense and litigation-related expenses, and reserves for claims that have been incurred but have not yet been reported or for case reserve deficiencies or redundancies (“IBNR”). ECM utilizes an independent actuary to assist with the estimation of its loss and LAE reserves. Such reserves are necessarily based on assumptions and estimates, and while management of ECM believes the reserves as established make a reasonable provision for all unpaid losses and settlement expenses, the ultimate liability may differ from that provided.
ECM’s consolidated balance of investments and cash amounted to $240.9 million at December 31, 2024 and constituted 46.9% of total assets. ECM maintains a portion of its investments in relatively short-term and highly liquid assets to ensure the availability of funds for operating purposes. ECM’s cash, cash equivalents, and short-term investments amounted to $23.6 million and investment securities amounted to $217.2 million at December 31, 2024. Exhibit III-3 presents ECM’s consolidated investments and cash portfolio as of December 31, 2023 and 2024. ECM’s investment portfolio comprised $174.6 million of bonds and $40.3 million of common stocks at year-end 2024. The bond portfolio consisted primarily of corporate bonds, U.S. Government and agency obligations, and tax-exempt state and municipal bonds. ECM employs a laddered approach to manage its fixed-income securities to efficiently and effectively manage interest rate risk and return. The common stock portfolio mainly comprised publicly traded stocks, mutual funds, and exchange traded funds. Consistent with its current enterprise risk management strategies, ECM has purposefully reduced the overall investment risk in its securities holdings.
In accordance with insurance industry practice, ECM reinsures a portion of its loss exposure and pays to the reinsurers a portion of the premiums received on all policies reinsured. Insurance policies written by the Company are reinsured with other insurance companies principally to: (i) reduce net liability on individual risks; (ii) mitigate the effect of individual loss occurrences (including catastrophic losses); (iii) stabilize underwriting results; (iv) decrease leverage; and (v) increase underwriting capacity. ECM ceded to reinsurers $76.4 million and $69.7 million of written premiums for the years ended December 31, 2023 and 2024, respectively. ECM’s reinsurance providers, the majority of whom are longstanding partners who understand the Company’s business, are all carefully selected with the help of the Company’s reinsurance broker. ECM monitors the solvency of its reinsurers through regular review of their financial statements and, if available, their A.M. Best ratings. All of the Company’s unaffiliated reinsurance partners currently have at least an “A-” rating from A.M. Best.
As of December 31, 2023 and 2024, ECM had $25.0 million in surplus notes outstanding. The statutory notes are included as regulatory capital for statutory accounting purposes. ECM issued the surplus notes to support its regulatory capital in connection with its steady growth and diversification initiatives. ECM issued a $10.0 million surplus note in February 2019 and an additional $15.0 million surplus note in May 2023. The $10.0 million surplus note bears a current interest rate of 6.50% and matures in February 2039 and the $15.0 million surplus note has a current interest rate of 8.05% and matures in May 2043. Following the completion of the Conversion, ECM plans to repay the $10.0 million surplus note.
ECM’s consolidated GAAP total equity increased from $124.3 million at December 31, 2023 to $130.7 million at December 31, 2024, chiefly as a result of profitable operating results in 2024. ECM’s ratio of total equity to total assets advanced from 24.2% at December 31, 2023 to 25.4% at December 31, 2024. ECM’s consolidated tangible equity increased from $97.3 million at year-end 2023 to $106.8 million at year-end 2024, and the corresponding ratio of tangible equity to tangible assets advanced from 20.8% to 21.8%. ECM had $23.9 million of goodwill on its balance sheet as of December 31, 2024, which original amount of $30.8 million resulted from the acquisition of ARIC in 2022 and is being amortized on a straight-line basis over ten years.
9
FELDMAN FINANCIAL ADVISORS, INC.
Income and Expense Trends
Table 3 displays ECM’s consolidated GAAP earnings results for the years ended December 31, 2023 and 2024. Table 4 presents the Company’s underwriting performance and related ratios. Table 5 presents a summary of consolidated direct premiums written by policy line of business and Table 6 details ECM’s consolidated direct premiums written by state. ECM’s operating results are influenced by factors affecting the property and casualty (“P&C”) insurance industry in general. The performance of the P&C insurance industry is subject to significant variations due to competition, weather, catastrophic events, regulation, general economic conditions, judicial trends, fluctuations in interest rates, and other factors. ECM’s operating results are influenced by factors affecting the P&C insurance industry in general. The operating results of the United States P&C insurance industry are subject to significant variations due to competition, weather, catastrophic events, regulation, general economic conditions, judicial trends, fluctuations in interest rates, and other changes in the investment environment.
ECM’s premium growth and underwriting results have been, and continue to be, influenced by market conditions. Pricing in the P&C insurance industry historically has been cyclical with the financial performance of insurers fluctuating from periods of low premium rates and excess underwriting capacity resulting from increased competition (soft market), followed by periods of high premium rates and a shortage of underwriting capacity resulting from decreased competition (hard market).
ECM recorded GAAP net income of $11.1 million for the year ended December 31, 2024 as compared to GAAP net income of $3.1 million for the year ended December 31, 2023. The Company experienced noticeable improvement in net premiums earned and underwriting profits in 2024. The $8.0 million increase in earnings for 2024 was attributable primarily to a $13.1 million increase in net premiums earned and a $2.9 million increase in net underwriting profits. ECM’s consolidated return on average assets (“ROA”) increased to 2.17% in 2024 and its return on average equity (“ROE”) advanced to 8.73% in 2024.
Total revenue increased to $184.9 million in 2024, which was $21.6 million or 13.2% greater than the $163.3 million of total revenue reported in 2023. Net premiums earned increased by $13.1 million or 8.0% from $164.0 million in 2023 to $177.1 million in 2024, primarily due to a $6.7 million reduction in reinsurance ceded and a $23.4 million positive change in unearned premiums. ECM’s consolidated direct premiums written declined by $12.6 million or 5.1% from $249.7 million in 2023 to $237.2 million in 2024. As shown in Table 5, the decrease in direct premiums written was mainly attributable to a $5.1 million decline in private automobile premiums written and a $4.3 million in homeowners premiums written.
Table 5 illustrates that commercial multi-peril and farmowners multi-peril accounted for 39.7% and 31.7%, respectively, of consolidated direct premiums written in 2024. Commercial multi-peril amounted to $94.3 million and farmowners multi-peril amounted to $75.2 million of direct premiums written in 2024. The next largest categories in 2024 were inland marine ($31.4 million or 9.0%) and commercial automobile ($18.1 million or 7.6%). As a result of the Company’s planned exit from the personal automobile business, personal automobile direct premiums declined by 40.8% or $5.1 million from $12.6 million in 2023 to $7.4 million in 2024.
As shown in Table 6, the states that accounted for the largest amount of consolidated direct premiums written in 2024 included Pennsylvania ($33.8 million or 14.3%), North Carolina ($26.7 million or 11.2%), Texas ($17.9 million or 7.5%), Arkansas ($15.8 million or 6.7%) and Kentucky ($13.3 million or 5.6%). The state that experienced the largest increase between 2023 and 2024 was Iowa, which increased by $2.9 million from $1.7 million in 2023 to $4.6 million in 2024.
10
FELDMAN FINANCIAL ADVISORS, INC.
Table 3
Consolidated Income Statement Data
For the Years Ended December 31, 2023 and 2024
(Dollars in Thousands)
| Year
Ended December 31, | ||||||||
| 2024 | 2023 | |||||||
| Direct premiums written | $ | 237,203 | $ | 249,654 | ||||
| Reinsurance assumed | (20 | ) | 4,634 | |||||
| Reinsurance ceded | (69,729 | ) | (76,434 | ) | ||||
| Change in unearned premiums | 5,293 | (18,116 | ) | |||||
| Other income | 4,388 | 4,275 | ||||||
| Net premiums earned | 177,136 | 164,012 | ||||||
| Losses incurred | 98,727 | 111,905 | ||||||
| Loss adjustment expenses incurred | 10,883 | 10,408 | ||||||
| Other underwriting expenses incurred | 56,037 | 33,529 | ||||||
| Other expenses | 5,195 | 4,801 | ||||||
| Total underwriting expenses | 170,842 | 160,643 | ||||||
| Net underwriting gain | 6,293 | 3,369 | ||||||
| Investment income | 8,912 | 7,258 | ||||||
| Net realized capital gains, net of taxes | 4,402 | 780 | ||||||
| Investment expenses | (1,193 | ) | (1,050 | ) | ||||
| Interest expense | (1,813 | ) | (1,207 | ) | ||||
| Surplus note origination costs | - | (723 | ) | |||||
| Depreciation on real estate | (46 | ) | (46 | ) | ||||
| Net investment gain | 10,263 | 5,013 | ||||||
| Other income, net | 623 | 436 | ||||||
| Goodwill amortization expense | (3,156 | ) | (3,156 | ) | ||||
| Net other income (expense) | (2,532 | ) | (2,719 | ) | ||||
| Net income before income tax expense | 14,024 | 5,662 | ||||||
| Federal income tax expense | 2,898 | 2,547 | ||||||
| Net income | $ | 11,126 | $ | 3,115 | ||||
Source: Everett Cash Mutual Insurance Company, internal GAAP financial statements.
11
FELDMAN FINANCIAL ADVISORS, INC.
Table 4
Consolidated Underwriting Performance Data
For the Years Ended December 31, 2023 and 2024
(Dollars in Thousands)
| Year
Ended December 31, | ||||||||
| 2024 | 2023 | |||||||
| Selected Income Statement Data | ||||||||
| Net premiums earned | $ | 177,136 | $ | 164,012 | ||||
| Losses and loss adjustment expenses incurred | 109,610 | 122,313 | ||||||
| Underwriting expenses | 61,232 | 38,331 | ||||||
| Total underwriting losses and expenses | 170,842 | 160,643 | ||||||
| Net underwriting profit | $ | 6,293 | $ | 3,369 | ||||
| Underwriting Ratios | ||||||||
| Loss ratio (1) | 61.9 | % | 74.6 | % | ||||
| Expense ratio (2) | 34.5 | % | 23.3 | % | ||||
| Combined ratio (3) | 96.4 | % | 97.9 | % | ||||
| (1) | Losses and loss adjustment expenses divided by net premiums earned. |
| (2) | Net underwriting and other expenses divided by net premiums earned. |
| (3) | Sum of the loss ratio and the expense ratio. |
Source: Everett Cash Mutal Insurance Company, unaudited GAAP financial statements.
A key measurement of the profitability of any insurance company for any period is its combined ratio, which is equal to the sum of its loss ratio and its expense ratio. The profitability of property and casualty insurance companies depends on income from underwriting, investment, and service operations. Underwriting results are considered profitable when the combined ratio is under 100% and unprofitable when the combined ratio is over 100%. Table 4 provides additional underwriting performance data for ECM based on GAAP financial data for the years ended December 31, 2023 and 2024.
12
FELDMAN FINANCIAL ADVISORS, INC.
Table 5
Consolidated Direct Premiums Written by Line of Business
For the Years Ended December 31, 2023 and 2024
(Dollars in Thousands; Percent of Total)
| Line of | Year
Ended December 31, 2024 | Year
Ended December 31, 2023 | ||||||||||||||||||||||||||||||
| Business | ECM | ARIC | 1CA | Combined | ECM | ARIC | 1CA | Combined | ||||||||||||||||||||||||
| Fire | $ | 537 | $ | 32 | $ | 0 | $ | 569 | $ | 609 | $ | 3,303 | $ | 0 | $ | 3,913 | ||||||||||||||||
| Allied lines | 161 | 26 | 0 | 188 | 198 | 2,366 | 0 | 2,563 | ||||||||||||||||||||||||
| Farmowners multi-peril | 69,250 | 3,553 | 2,410 | 75,212 | 68,791 | 3,753 | 2,387 | 74,931 | ||||||||||||||||||||||||
| Homeowners multi-peril | 2,556 | 3,864 | 0 | 6,420 | 2,654 | 8,053 | 0 | 10,707 | ||||||||||||||||||||||||
| Commercial multi-peril | 22,368 | 60,778 | 11,120 | 94,266 | 17,074 | 61,741 | 10,306 | 89,120 | ||||||||||||||||||||||||
| Inland marine | 1,536 | 19,816 | 8 | 21,359 | 1,517 | 19,002 | 0 | 20,519 | ||||||||||||||||||||||||
| Workers’ compensation | 1,319 | 0 | 0 | 1,319 | 1,540 | 0 | 0 | 1,540 | ||||||||||||||||||||||||
| Other liability | 5,319 | 3,448 | 542 | 9,309 | 5,830 | 5,759 | 567 | 12,157 | ||||||||||||||||||||||||
| Private automobile | 1,036 | 329 | 6,070 | 7,434 | 1,653 | 1,534 | 9,375 | 12,562 | ||||||||||||||||||||||||
| Commercial automobile | 3,109 | 8,853 | 6,100 | 18,062 | 3,077 | 9,355 | 9,209 | 21,641 | ||||||||||||||||||||||||
| Total | $ | 107,191 | $ | 100,699 | $ | 29,314 | $ | 237,203 | $ | 102,943 | $ | 114,866 | $ | 31,844 | $ | 249,654 | ||||||||||||||||
| Line of | Year
Ended December 31, 2024 | Year
Ended December 31, 2023 | ||||||||||||||||||||||||||||||
| Business | ECM | ARIC | 1CA | Combined | ECM | ARIC | 1CA | Combined | ||||||||||||||||||||||||
| Fire | 0.50 | 0.03 | 0.00 | 0.24 | 0.59 | 2.88 | 0.00 | 1.57 | ||||||||||||||||||||||||
| Allied lines | 0.15 | 0.03 | 0.00 | 0.08 | 0.19 | 2.06 | 0.00 | 1.03 | ||||||||||||||||||||||||
| Farmowners multi-peril | 64.60 | 3.53 | 8.22 | 31.71 | 66.82 | 3.27 | 7.50 | 30.01 | ||||||||||||||||||||||||
| Homeowners multi-peril | 2.38 | 3.84 | 0.00 | 2.71 | 2.58 | 7.01 | 0.00 | 4.29 | ||||||||||||||||||||||||
| Commercial multi-peril | 20.87 | 60.36 | 37.93 | 39.74 | 16.59 | 53.75 | 32.36 | 35.70 | ||||||||||||||||||||||||
| Inland marine | 1.43 | 19.68 | 0.03 | 9.00 | 1.47 | 16.54 | 0.00 | 8.22 | ||||||||||||||||||||||||
| Workers’ compensation | 1.23 | 0.00 | 0.00 | 0.56 | 1.50 | 0.00 | 0.00 | 0.62 | ||||||||||||||||||||||||
| Other liability | 4.96 | 3.42 | 1.85 | 3.92 | 5.66 | 5.01 | 1.78 | 4.87 | ||||||||||||||||||||||||
| Private automobile | 0.97 | 0.33 | 20.71 | 3.13 | 1.61 | 1.34 | 29.44 | 5.03 | ||||||||||||||||||||||||
| Commercial automobile | 2.90 | 8.79 | 20.81 | 7.61 | 2.99 | 8.14 | 28.92 | 8.67 | ||||||||||||||||||||||||
| Total | 100.00 | 100.00 | 100.00 | 100.00 | 100.00 | 100.00 | 100.00 | 100.00 | ||||||||||||||||||||||||
Source: S&P Global.
13
FELDMAN FINANCIAL ADVISORS, INC.
Table 6
Consolidated Direct Premiums Written by State
For the Years Ended December 31, 2023 and 2024
(Dollars in Thousands)
| Year Ended December 31, 2024 | Year Ended December 31, 2023 | |||||||||||||||||||||||||||||||
| ECM | ARIC | 1CA | Combined | ECM | ARIC | 1CA | Combined | |||||||||||||||||||||||||
| Alabama | $ | 0 | $ | 1,678 | $ | 0 | $ | 1,678 | $ | 0 | $ | 1,703 | $ | 0 | $ | 1,703 | ||||||||||||||||
| Alaska | 0 | 0 | 0 | 0 | 0 | 138 | 0 | 138 | ||||||||||||||||||||||||
| Arizona | 0 | 3,675 | 0 | 3,675 | 0 | 3,511 | 0 | 3,511 | ||||||||||||||||||||||||
| Arkansas | 13,758 | 2,031 | 0 | 15,789 | 14,022 | 1,678 | 0 | 15,700 | ||||||||||||||||||||||||
| California | 0 | 3,374 | 0 | 3,374 | 0 | 3,538 | 0 | 3,538 | ||||||||||||||||||||||||
| Colorado | 0 | 2,760 | 0 | 2,760 | 0 | 2,720 | 0 | 2,720 | ||||||||||||||||||||||||
| Connecticut | 0 | 1,058 | 0 | 1,058 | 0 | 2,138 | 0 | 2,138 | ||||||||||||||||||||||||
| D.C. | 0 | 2 | 0 | 2 | 0 | 8 | 0 | 8 | ||||||||||||||||||||||||
| Delaware | 0 | 22 | 0 | 22 | 0 | 37 | 0 | 37 | ||||||||||||||||||||||||
| Florida | 0 | 3,866 | 0 | 3,866 | 0 | 4,539 | 0 | 4,539 | ||||||||||||||||||||||||
| Georgia | 2,547 | 3,009 | 3,021 | 8,577 | 2,338 | 3,172 | 3,056 | 8,566 | ||||||||||||||||||||||||
| Hawaii | 0 | 0 | 0 | 0 | 0 | 0 | 0 | 0 | ||||||||||||||||||||||||
| Idaho | 0 | 1,954 | 0 | 1,954 | 0 | 3,045 | 0 | 3,045 | ||||||||||||||||||||||||
| Illinois | 94 | 3,041 | 0 | 3,135 | 85 | 2,779 | 0 | 2,864 | ||||||||||||||||||||||||
| Indiana | 6,361 | 1,608 | 2,069 | 10,038 | 6,628 | 1,773 | 2,826 | 11,227 | ||||||||||||||||||||||||
| Iowa | 3,788 | 849 | 0 | 4,637 | 553 | 1,104 | 0 | 1,658 | ||||||||||||||||||||||||
| Kansas | 7,085 | 1,166 | 0 | 8,252 | 7,071 | 1,432 | 0 | 8,503 | ||||||||||||||||||||||||
| Kentucky | 8,998 | 2,027 | 2,306 | 13,331 | 8,971 | 2,033 | 3,137 | 14,141 | ||||||||||||||||||||||||
| Louisiana | 0 | 3,357 | 0 | 3,357 | 0 | 3,368 | 0 | 3,368 | ||||||||||||||||||||||||
| Maine | 0 | 737 | 0 | 737 | 0 | 928 | 0 | 928 | ||||||||||||||||||||||||
| Maryland | 795 | 840 | 0 | 1,635 | 794 | 1,006 | 0 | 1,800 | ||||||||||||||||||||||||
| Massachusetts | 0 | 2,410 | 0 | 2,410 | 0 | 3,273 | 0 | 3,273 | ||||||||||||||||||||||||
| Michigan | 0 | 1,855 | 0 | 1,855 | 0 | 1,757 | 0 | 1,757 | ||||||||||||||||||||||||
| Minnesota | 0 | 1,880 | 0 | 1,880 | 0 | 2,241 | 0 | 2,241 | ||||||||||||||||||||||||
| Mississippi | 0 | 1,709 | 0 | 1,709 | 0 | 2,233 | 0 | 2,233 | ||||||||||||||||||||||||
| Missouri | 8,200 | 3,592 | 0 | 11,792 | 8,744 | 4,062 | 0 | 12,806 | ||||||||||||||||||||||||
| Montana | 0 | 3,446 | 0 | 3,446 | 0 | 4,086 | 0 | 4,086 | ||||||||||||||||||||||||
| Nebraska | 2,898 | 896 | 0 | 3,794 | 1,385 | 848 | 0 | 2,233 | ||||||||||||||||||||||||
| Nevada | 0 | 1,934 | 0 | 1,934 | 0 | 1,831 | 0 | 1,831 | ||||||||||||||||||||||||
| New Hampshire | 0 | 236 | 0 | 236 | 0 | 492 | 0 | 492 | ||||||||||||||||||||||||
| New Jersey | 0 | 1,827 | 0 | 1,827 | 0 | 2,107 | 0 | 2,107 | ||||||||||||||||||||||||
| New Mexico | 0 | 2,990 | 0 | 2,990 | 0 | 3,154 | 0 | 3,154 | ||||||||||||||||||||||||
| New York | 0 | 1,776 | 0 | 1,776 | 0 | 2,056 | 0 | 2,056 | ||||||||||||||||||||||||
| North Carolina | 14,751 | 8,356 | 3,561 | 26,669 | 14,308 | 12,716 | 3,366 | 30,390 | ||||||||||||||||||||||||
| North Dakota | 0 | 286 | 0 | 286 | 0 | 370 | 0 | 370 | ||||||||||||||||||||||||
| Ohio | 738 | 2,267 | 203 | 3,208 | 682 | 1,957 | 276 | 2,916 | ||||||||||||||||||||||||
| Oklahoma | 0 | 4,330 | 0 | 4,330 | 0 | 4,509 | 0 | 4,509 | ||||||||||||||||||||||||
| Oregon | 0 | 2,672 | 0 | 2,672 | 0 | 3,544 | 0 | 3,544 | ||||||||||||||||||||||||
| Pennsylvania | 27,193 | 1,858 | 4,758 | 33,809 | 27,459 | 1,988 | 6,277 | 35,724 | ||||||||||||||||||||||||
| Rhode Island | 0 | 171 | 0 | 171 | 0 | 752 | 0 | 752 | ||||||||||||||||||||||||
| South Carolina | 0 | 2,588 | 0 | 2,588 | 0 | 2,541 | 0 | 2,541 | ||||||||||||||||||||||||
| South Dakota | 485 | 1,036 | 0 | 1,520 | 520 | 1,138 | 0 | 1,659 | ||||||||||||||||||||||||
| Tennessee | 5,132 | 1,015 | 781 | 6,928 | 4,924 | 1,063 | 856 | 6,843 | ||||||||||||||||||||||||
| Texas | 0 | 6,237 | 11,628 | 17,865 | 0 | 5,592 | 10,837 | 16,429 | ||||||||||||||||||||||||
| Utah | 0 | 516 | 0 | 516 | 0 | 510 | 0 | 510 | ||||||||||||||||||||||||
| Vermont | 0 | 342 | 0 | 342 | 0 | 468 | 0 | 468 | ||||||||||||||||||||||||
| Virginia | 4,367 | 753 | 986 | 6,107 | 4,457 | 1,126 | 1,212 | 6,795 | ||||||||||||||||||||||||
| Washington | 0 | 3,467 | 0 | 3,467 | 0 | 4,347 | 0 | 4,347 | ||||||||||||||||||||||||
| West Virginia | 0 | 89 | 0 | 89 | 0 | 81 | 0 | 81 | ||||||||||||||||||||||||
| Wisconsin | 0 | 2,007 | 0 | 2,007 | 0 | 1,833 | 0 | 1,833 | ||||||||||||||||||||||||
| Wyoming | 0 | 1,103 | 0 | 1,103 | 0 | 1,539 | 0 | 1,539 | ||||||||||||||||||||||||
| Total | $ | 107,191 | $ | 100,699 | $ | 29,314 | $ | 237,203 | $ | 102,943 | $ | 114,866 | $ | 31,844 | $ | 249,654 | ||||||||||||||||
Source: S&P Global.
14
FELDMAN FINANCIAL ADVISORS, INC.
Table 6 (continued)
Consolidated Direct Premiums Written by State
For the Years Ended December 31, 2023 and 2024
(Percent of Total)
| Year Ended December 31, 2024 | Year Ended December 31, 2023 | |||||||||||||||||||||||||||||||
| ECM | ARIC | 1CA | Combined | ECM | ARIC | 1CA | Combined | |||||||||||||||||||||||||
| Alabama | 0.00 | 1.67 | 0.00 | 0.71 | 0.00 | 1.48 | 0.00 | 0.68 | ||||||||||||||||||||||||
| Alaska | 0.00 | 0.00 | 0.00 | 0.00 | 0.00 | 0.12 | 0.00 | 0.06 | ||||||||||||||||||||||||
| Arizona | 0.00 | 3.65 | 0.00 | 1.55 | 0.00 | 3.06 | 0.00 | 1.41 | ||||||||||||||||||||||||
| Arkansas | 12.83 | 2.02 | 0.00 | 6.66 | 13.62 | 1.46 | 0.00 | 6.29 | ||||||||||||||||||||||||
| California | 0.00 | 3.35 | 0.00 | 1.42 | 0.00 | 3.08 | 0.00 | 1.42 | ||||||||||||||||||||||||
| Colorado | 0.00 | 2.74 | 0.00 | 1.16 | 0.00 | 2.37 | 0.00 | 1.09 | ||||||||||||||||||||||||
| Connecticut | 0.00 | 1.05 | 0.00 | 0.45 | 0.00 | 1.86 | 0.00 | 0.86 | ||||||||||||||||||||||||
| D.C. | 0.00 | 0.00 | 0.00 | 0.00 | 0.00 | 0.01 | 0.00 | 0.00 | ||||||||||||||||||||||||
| Delaware | 0.00 | 0.02 | 0.00 | 0.01 | 0.00 | 0.03 | 0.00 | 0.01 | ||||||||||||||||||||||||
| Florida | 0.00 | 3.84 | 0.00 | 1.63 | 0.00 | 3.95 | 0.00 | 1.82 | ||||||||||||||||||||||||
| Georgia | 2.38 | 2.99 | 10.30 | 3.62 | 2.27 | 2.76 | 9.60 | 3.43 | ||||||||||||||||||||||||
| Hawaii | 0.00 | 0.00 | 0.00 | 0.00 | 0.00 | 0.00 | 0.00 | 0.00 | ||||||||||||||||||||||||
| Idaho | 0.00 | 1.94 | 0.00 | 0.82 | 0.00 | 2.65 | 0.00 | 1.22 | ||||||||||||||||||||||||
| Illinois | 0.09 | 3.02 | 0.00 | 1.32 | 0.08 | 2.42 | 0.00 | 1.15 | ||||||||||||||||||||||||
| Indiana | 5.93 | 1.60 | 7.06 | 4.23 | 6.44 | 1.54 | 8.88 | 4.50 | ||||||||||||||||||||||||
| Iowa | 3.53 | 0.84 | 0.00 | 1.95 | 0.54 | 0.96 | 0.00 | 0.66 | ||||||||||||||||||||||||
| Kansas | 6.61 | 1.16 | 0.00 | 3.48 | 6.87 | 1.25 | 0.00 | 3.41 | ||||||||||||||||||||||||
| Kentucky | 8.39 | 2.01 | 7.87 | 5.62 | 8.71 | 1.77 | 9.85 | 5.66 | ||||||||||||||||||||||||
| Louisiana | 0.00 | 3.33 | 0.00 | 1.42 | 0.00 | 2.93 | 0.00 | 1.35 | ||||||||||||||||||||||||
| Maine | 0.00 | 0.73 | 0.00 | 0.31 | 0.00 | 0.81 | 0.00 | 0.37 | ||||||||||||||||||||||||
| Maryland | 0.74 | 0.83 | 0.00 | 0.69 | 0.77 | 0.88 | 0.00 | 0.72 | ||||||||||||||||||||||||
| Massachusetts | 0.00 | 2.39 | 0.00 | 1.02 | 0.00 | 2.85 | 0.00 | 1.31 | ||||||||||||||||||||||||
| Michigan | 0.00 | 1.84 | 0.00 | 0.78 | 0.00 | 1.53 | 0.00 | 0.70 | ||||||||||||||||||||||||
| Minnesota | 0.00 | 1.87 | 0.00 | 0.79 | 0.00 | 1.95 | 0.00 | 0.90 | ||||||||||||||||||||||||
| Mississippi | 0.00 | 1.70 | 0.00 | 0.72 | 0.00 | 1.94 | 0.00 | 0.89 | ||||||||||||||||||||||||
| Missouri | 7.65 | 3.57 | 0.00 | 4.97 | 8.49 | 3.54 | 0.00 | 5.13 | ||||||||||||||||||||||||
| Montana | 0.00 | 3.42 | 0.00 | 1.45 | 0.00 | 3.56 | 0.00 | 1.64 | ||||||||||||||||||||||||
| Nebraska | 2.70 | 0.89 | 0.00 | 1.60 | 1.35 | 0.74 | 0.00 | 0.89 | ||||||||||||||||||||||||
| Nevada | 0.00 | 1.92 | 0.00 | 0.82 | 0.00 | 1.59 | 0.00 | 0.73 | ||||||||||||||||||||||||
| New Hampshire | 0.00 | 0.23 | 0.00 | 0.10 | 0.00 | 0.43 | 0.00 | 0.20 | ||||||||||||||||||||||||
| New Jersey | 0.00 | 1.81 | 0.00 | 0.77 | 0.00 | 1.83 | 0.00 | 0.84 | ||||||||||||||||||||||||
| New Mexico | 0.00 | 2.97 | 0.00 | 1.26 | 0.00 | 2.75 | 0.00 | 1.26 | ||||||||||||||||||||||||
| New York | 0.00 | 1.76 | 0.00 | 0.75 | 0.00 | 1.79 | 0.00 | 0.82 | ||||||||||||||||||||||||
| North Carolina | 13.76 | 8.30 | 12.15 | 11.24 | 13.90 | 11.07 | 10.57 | 12.17 | ||||||||||||||||||||||||
| North Dakota | 0.00 | 0.28 | 0.00 | 0.12 | 0.00 | 0.32 | 0.00 | 0.15 | ||||||||||||||||||||||||
| Ohio | 0.69 | 2.25 | 0.69 | 1.35 | 0.66 | 1.70 | 0.87 | 1.17 | ||||||||||||||||||||||||
| Oklahoma | 0.00 | 4.30 | 0.00 | 1.83 | 0.00 | 3.93 | 0.00 | 1.81 | ||||||||||||||||||||||||
| Oregon | 0.00 | 2.65 | 0.00 | 1.13 | 0.00 | 3.08 | 0.00 | 1.42 | ||||||||||||||||||||||||
| Pennsylvania | 25.37 | 1.85 | 16.23 | 14.25 | 26.67 | 1.73 | 19.71 | 14.31 | ||||||||||||||||||||||||
| Rhode Island | 0.00 | 0.17 | 0.00 | 0.07 | 0.00 | 0.65 | 0.00 | 0.30 | ||||||||||||||||||||||||
| South Carolina | 0.00 | 2.57 | 0.00 | 1.09 | 0.00 | 2.21 | 0.00 | 1.02 | ||||||||||||||||||||||||
| South Dakota | 0.45 | 1.03 | 0.00 | 0.64 | 0.51 | 0.99 | 0.00 | 0.66 | ||||||||||||||||||||||||
| Tennessee | 4.79 | 1.01 | 2.66 | 2.92 | 4.78 | 0.93 | 2.69 | 2.74 | ||||||||||||||||||||||||
| Texas | 0.00 | 6.19 | 39.67 | 7.53 | 0.00 | 4.87 | 34.03 | 6.58 | ||||||||||||||||||||||||
| Utah | 0.00 | 0.51 | 0.00 | 0.22 | 0.00 | 0.44 | 0.00 | 0.20 | ||||||||||||||||||||||||
| Vermont | 0.00 | 0.34 | 0.00 | 0.14 | 0.00 | 0.41 | 0.00 | 0.19 | ||||||||||||||||||||||||
| Virginia | 4.07 | 0.75 | 3.36 | 2.57 | 4.33 | 0.98 | 3.81 | 2.72 | ||||||||||||||||||||||||
| Washington | 0.00 | 3.44 | 0.00 | 1.46 | 0.00 | 3.78 | 0.00 | 1.74 | ||||||||||||||||||||||||
| West Virginia | 0.00 | 0.09 | 0.00 | 0.04 | 0.00 | 0.07 | 0.00 | 0.03 | ||||||||||||||||||||||||
| Wisconsin | 0.00 | 1.99 | 0.00 | 0.85 | 0.00 | 1.60 | 0.00 | 0.73 | ||||||||||||||||||||||||
| Wyoming | 0.00 | 1.09 | 0.00 | 0.46 | 0.00 | 1.34 | 0.00 | 0.62 | ||||||||||||||||||||||||
| Total | 100.00 | 100.00 | 100.00 | 100.00 | 100.00 | 100.00 | 100.00 | 100.00 | ||||||||||||||||||||||||
Source: S&P Global.
15
FELDMAN FINANCIAL ADVISORS, INC.
Losses and loss adjustment expenses incurred decreased by 10.4% or $12.7 million from $122.3 million in 2023 to $109.6 million in 2024. Losses and loss adjustment expenses incurred represent the Company’s largest expense item and include: (i) claim payments made; (ii) estimates for future claim payments and changes in those estimates for prior periods; and (iii) costs associated with investigating, defending, and adjusting claims. ECM’s consolidated loss ratio decreased from 74.6% in 2023 to 61.9% in 2024, primarily due to the increase in net premiums earned and favorable development relative to prior years’ loss reserve estimates. Underwriting expenses on a GAAP basis increased from $38.3 million in 2023 to $61.2 million in 2024 and ECM’s consolidated expense ratio increased from 23.3% in 2023 to 34.5% in 2024. ECM’s combined ratio improved from 97.9% in 2023 to 96.4% in 2015, driven largely by the growth in net premiums earned and the decline in losses and loss adjustment expenses incurred.
ECM’s consolidated investment income increased by $1.6 million or 22.8% from $7.3 million in 2023 to $8.9 million in 2024. The increase in investment income reflected the expansion of investment portfolio holdings and a general increase in market rates during 2024. Net realized capital gains increased from $780,000 in 2023 to $4.4 million in 2024 due to the overall appreciation in the equity securities markets. Interest expense, largely representing the interest costs of the surplus notes, increased from $1.2 million in 2023 to $1.8 million in 2024, as 2024 reflected a full year’s cost of the $15.0 million surplus note issued in May 2023. Overall, net investment profits increased from $5.0 million in 2023 to $10.3 million in 2024.
ECM recognized $3.2 million in goodwill amortization expense in both 2023 and 2024. The goodwill resulted from the acquisition of ARIC in 2022 and is being expensed on a straight-line method over ten years. The outstanding balance of goodwill declined from $27.0 million at December 31, 2023 to $23.9 million at December 31, 2024.
The Company’s consolidated income before income taxes increased by $8.4 million from $5.7 million for the year ended December 31, 2023 to $14.0 million for the year ended December 31, 2024. The improvement in pre-tax earnings resulted from the $2.9 million increase in underwriting profits and $5.3 million increase in net investment profits. Federal income tax expense amounted to $2.4 million in 2023 and $2.9 million in 2024. The effective income tax rate was approximately 20.7% in 2024.
Statutory Financial Data Overview
State insurance laws and regulations require ECM (and its subsidiary and affiliate insurance carriers) to file financial statements with state insurance departments in every state where it does business, and the operations of ECM are subject to examination by those departments. ECM prepares statutory financial statements in accordance with accounting practices and procedures prescribed or permitted by these departments. Certain accounting standards differ under statutory accounting practices (“SAP”) as compared to GAAP. For example, premium income is recognized on a pro rata basis over the term covered by the insurance policy, while the related acquisition costs are expensed when incurred under SAP. Under GAAP, both premium income and the related policy acquisition costs are recognized on a pro rata basis over the term of the insurance policy. Therefore, the SAP data for ECM does not correspond to the GAAP presentation.
Table 7 presents summary statutory financial data for ECM over the period from December 31, 2014 to 2024 and for the year-to-date (“YTD”) period ended June 30, 2025. The financial data presented in Table 7 includes combined statutory financial information of ECM, 1CA, EGM, and (effective December 31, 2022) ARIC. Exhibits IV-1, IV-2, IV-3, and IV-4 contain unconsolidated statutory financial summary data for ECM, ARIC, 1CA, and EGM, respectively, for the years ended December 31, 2021 to 2024 and the six months ended June 30, 2025.
16
FELDMAN FINANCIAL ADVISORS, INC.
As reflected in Table 7 on a statutory basis, the Company has experienced significant growth in total assets, capital and surplus, and direct premiums written. ECM’s statutory total assets increased at a compound annual growth rate of 9.5% over the ten-year period from $122.5 million at December 31, 2014 to $303.5 million at December 31, 2024. ECM’s statutory capital and surplus increased at compound annual growth rate of 7.8% from $59.3 million at December 31, 2014 to $126.0 million at December 31, 2024. ECM’s direct premiums written increased at a compound annual growth rate of 13.4% from $67.4 million in 2014 to $237.2 million in 2024.
Historically, ECM’s premium revenue business was generated in a few states, including Pennsylvania, North Carolina, Indiana, and Kentucky, and concentrated primarily on farmowners multi-peril coverage. As part of its strategy to mitigate risk, ECM implemented initiatives to diversify its product offerings and geographic footprint. These diversification efforts led to the acquisition in 2022 of ARIC, which significantly expanded ECM’s geographic presence and product diversification. As a result, ECM’s consolidated direct premiums written expanded from $107.8 million and $160.5 million in 2021 and 2022, respectively, to $249.7 million in 2023. Concurrently, the ratio of ECM’s net premiums written to average capital and surplus increased from 98.6% in 2021 to 129.0% in 2022 and 168.1% in 2023.
ECM experienced a consolidated statutory net loss of $9.7 million for the year ended December 31, 2023, chiefly due to the negative impact of the frequency and severity of weather-related events. ECM’s statutory combined ratio increased from 90.6% in 2022 to 106.5% in 2023. ECM’s statutory expense ratio increased moderately from 29.6% in 2022 to 30.8% in 2023, while its statutory loss ratio increased considerably from 61.0% in 2022 to 75.7% in 2023. ECM’s consolidated statutory earnings rebounded in 2024 to a positive level of $14.8 million. The statutory loss ratio returned to a more normalized level of 62.3% in 2024 and the resulting statutory combined ratio was 96.4%. Benefiting from the integration of ARIC, ECM’s net premiums earned increased steadily from $122.5 million in 2022 to $159.7 million in 2023 and $172.7 million in 2024. ECM’s statutory earnings in 2024 were also boosted by the increase in net investment profits from $3.8 million in 2023 to $9.7 million in 2024.
For the six months ended June 30, 2025, ECM reported a consolidated statutory net loss of $4.2 million. ECM’s profitability is usually cyclical due to weather-related losses with net underwriting profits generally being lower in the first half of the calendar year versus the second half of the year. ECM’s consolidated statutory combined ratio amounted to 107.0% for the first half of 2025, reflecting a 73.6% loss ratio and a 33.4% expense ratio. As a result of the statutory net loss in the first half of 2025, ECM’s consolidated statutory capital and surplus declined from $126.0 million at December 31, 2024 to $122.3 million at June 30, 2025. The ratio of statutory capital and surplus to statutory total assets declined moderately from 41.5% at December 31, 2024 to 39.5% at June 30, 2025.
17
FELDMAN FINANCIAL ADVISORS, INC.
Table 7
Statutory Financial Overview
ECM Insurance Group
As of and For the Years Ended December 31, 2014 to 2024 and
As of and For the Year-to-Date Period Ended June 30, 2025
(Data in Thousands of Dollars, Except Percentages)
| YTD | Year Ended | |||||||||||||||||||||||||||||||||||||||||||||||
| 6/30/25 | 12/31/24 | 12/31/23 | 12/31/22 | 12/31/21 | 12/31/20 | 12/31/19 | 12/31/18 | 12/31/17 | 12/31/16 | 12/31/15 | 12/31/14 | |||||||||||||||||||||||||||||||||||||
| Balance Sheet Data | ||||||||||||||||||||||||||||||||||||||||||||||||
| Total Assets | 309,728 | 303,544 | 280,716 | 262,307 | 224,866 | 198,524 | 173,927 | 155,496 | 152,251 | 142,467 | 133,106 | 122,492 | ||||||||||||||||||||||||||||||||||||
| Total Liabilities | 187,419 | 177,535 | 170,705 | 160,689 | 107,764 | 97,033 | 85,302 | 87,076 | 83,026 | 76,249 | 67,790 | 63,213 | ||||||||||||||||||||||||||||||||||||
| Capital and Surplus | 122,309 | 126,009 | 110,011 | 101,618 | 117,102 | 101,491 | 88,625 | 68,419 | 69,225 | 66,218 | 65,316 | 59,279 | ||||||||||||||||||||||||||||||||||||
| Capital and Surplus Growth (%) | -2.94 | % | 14.54 | % | 8.26 | % | -13.22 | % | 15.38 | % | 14.52 | % | 29.53 | % | -1.16 | % | 4.54 | % | 1.38 | % | 10.18 | % | 12.38 | % | ||||||||||||||||||||||||
| Capital and Surplus / Total Assets | 39.49 | % | 41.51 | % | 39.19 | % | 38.74 | % | 52.08 | % | 51.12 | % | 50.96 | % | 44.00 | % | 45.47 | % | 46.48 | % | 49.07 | % | 48.39 | % | ||||||||||||||||||||||||
| Income Statement Data | ||||||||||||||||||||||||||||||||||||||||||||||||
| Direct Premiums Written (DPW) | 116,120 | 237,203 | 249,654 | 160,451 | 107,791 | 98,211 | 83,078 | 79,926 | 79,865 | 76,942 | 72,822 | 67,376 | ||||||||||||||||||||||||||||||||||||
| Net Premiums Written (NPW) | 94,095 | 167,455 | 177,853 | 141,058 | 107,799 | 98,483 | 80,268 | 77,329 | 77,622 | 74,687 | 71,616 | 64,948 | ||||||||||||||||||||||||||||||||||||
| Net Premiums Earned | 86,964 | 172,748 | 159,737 | 122,545 | 103,153 | 90,147 | 77,814 | 77,607 | 76,276 | 73,291 | 68,432 | 61,153 | ||||||||||||||||||||||||||||||||||||
| Net Loss and LAE Incurred | 64,025 | 107,692 | 120,920 | 74,730 | 60,210 | 53,742 | 51,549 | 57,533 | 56,538 | 58,231 | 41,551 | 38,333 | ||||||||||||||||||||||||||||||||||||
| Net Underwriting Expense | 31,645 | 57,652 | 55,236 | 42,144 | 32,967 | 29,813 | 24,416 | 23,177 | 21,366 | 21,393 | 20,632 | 18,401 | ||||||||||||||||||||||||||||||||||||
| Net Underwriting Gain (Loss) | (8,706 | ) | 7,404 | (16,419 | ) | 5,671 | 9,976 | 6,592 | 1,849 | (3,103 | ) | (1,628 | ) | (6,333 | ) | 6,249 | 4,418 | |||||||||||||||||||||||||||||||
| Net Investment Income | 3,072 | 9,721 | 3,844 | 3,856 | 8,153 | 3,389 | 3,541 | 5,037 | 4,307 | 3,216 | 4,502 | 4,688 | ||||||||||||||||||||||||||||||||||||
| Income Tax Expense (Benefit) | (1,148 | ) | 2,997 | (2,414 | ) | 2,276 | 2,735 | 2,442 | 780 | 125 | 356 | (1,177 | ) | 3,039 | 2,382 | |||||||||||||||||||||||||||||||||
| Net Income (Loss) | (4,219 | ) | 14,750 | (9,725 | ) | 7,616 | 15,786 | 7,917 | 5,010 | 2,213 | 2,721 | (1,493 | ) | 8,107 | 7,096 | |||||||||||||||||||||||||||||||||
| Operating Ratios (%) | ||||||||||||||||||||||||||||||||||||||||||||||||
| Growth Rate - DPW | (10.37 | ) | (4.99 | ) | 55.60 | 48.85 | 9.75 | 18.22 | 3.94 | 0.08 | 3.80 | 5.66 | 8.08 | 13.39 | ||||||||||||||||||||||||||||||||||
| NPW / Avg. Capital and Surplus | 151.57 | 141.90 | 168.08 | 128.99 | 98.63 | 103.60 | 102.22 | 112.36 | 114.62 | 113.56 | 114.96 | 115.95 | ||||||||||||||||||||||||||||||||||||
| Loss and LAE Ratio | 73.62 | 62.34 | 75.70 | 60.98 | 58.37 | 59.62 | 66.25 | 74.13 | 74.12 | 79.45 | 60.72 | 62.68 | ||||||||||||||||||||||||||||||||||||
| Expense Ratio | 33.35 | 34.06 | 30.81 | 29.62 | 30.58 | 30.27 | 30.42 | 29.97 | 27.53 | 28.64 | 28.81 | 28.33 | ||||||||||||||||||||||||||||||||||||
| Combined Ratio | 106.97 | 96.40 | 106.51 | 90.60 | 88.95 | 89.89 | 96.66 | 104.11 | 101.65 | 108.10 | 89.53 | 91.02 | ||||||||||||||||||||||||||||||||||||
Source: ECM, internal financial data; includes combined statutory financial data for ECM, 1CA, EGM, and (effective December 31, 2022) ARIC.
18
FELDMAN FINANCIAL ADVISORS, INC.
II. INDUSTRY FUNDAMENTALS
Financial Strength Ratings by A.M. Best
A.M. Best is a widely recognized rating agency dedicated to the insurance industry. A.M. Best provides ratings that indicate the financial strength of insurance companies. The objective of A.M. Best’s rating system is to provide an independent opinion of an insurer’s financial strength and its ability to meet ongoing obligations to policyholders. The assigned financial strength rating is derived from an in-depth evaluation and analysis of a company’s balance sheet strength, operating performance, and business profile. A.M. Best’s ratings scale comprises 15 individual ratings grouped into nine categories (excluding suspended ratings).
A.M. Best has provided ratings and analysis on ECM since 1974. A.M. Best currently assigns a financial strength rating of A (Excellent) to ECM, most recently confirmed on November 13, 2024. The rating of A (Excellent) is the third highest of 15 ratings and the category of “Excellent” represents the second highest of nine categories. Insurance companies rated A are considered by A.M. Best to have “an excellent ability to meet their ongoing insurance obligations.” The recent financial strength rating of A (Excellent) was also extended to ARIC and 1CA, while EGM was assigned a rating of B++ (Good). The outlook assigned to these credit ratings is stable.
A.M. Best’s current financial strength rating of ECM reflected its balance sheet strength, which A.M. Best assessed as very strong, as well as the Company’s adequate operating performance, neutral business profile, and appropriate enterprise risk management. ECM’s rating of A (Excellent) was also affirmed in 2023, 2021, and 2019. Previously, ECM’s financial strength rating was upgraded from A- (Excellent) to A (Excellent) in 2016 and upgraded from B++ (Good) to A- (Excellent) in 2010. The prior upgrades were chiefly attributable to ECM’s consistently favorable trend of improved underwriting performance and risk-adjusted capitalization.
In its most recent analysis of ECM, A.M. Best cited as positive factors the Company’s solid risk-adjusted capitalization, which had been augmented by a capital raise in the form of an additional surplus note in 2023. A.M. Best noted that ECM’s above-average underwriting performance has resulted in increased capital levels in sustained year-over-year periods. A.M. Best also indicated that the ECM Insurance Group has successfully operated in the niche market of farmowners/small commercial and ancillary products for many years. In A.M. Best’s perspective, these positive rating factors are partially offset by ECM’s property-focused book of business that leaves it susceptible to weather-related losses. However, A.M. Best noted that ECM continues to maintain a comprehensive reinsurance program in an effort to mitigate the impact of weather-related losses on the Company’s profitability and capitalization.
A.M. Best also referenced that ECM’s five-year and ten-year average combined ratio through 2023 compared favorably to the personal property composite industry average, and attributed the Company’s profitable underwriting results in most years to new state expansions providing a broader spread of risk, improved rate adequacy in the automobile programs, and continued growth in farm/agribusiness specialty products. While still susceptible to weather-related events due to its property exposure, ECM maintains its emphasis on a generally short-tail book of business to manage its reserve adequacy, claims processing efficiency, and effective pricing analytics.
19
FELDMAN FINANCIAL ADVISORS, INC.
Industry Performance and Investment Outlook
The property and casualty segment of the insurance industry provides protection from risk in two basic areas. In general, property insurance protects an insured against financial loss arising out of loss of property or its use caused by an insured peril. Casualty insurance protects the insured against financial loss arising out of the insured’s obligation to others for loss or damage to persons, including, with respect to workers compensation insurance, persons who are employees, or property. There are approximately 2,500 companies providing property and casualty insurance coverage in the United States. About 100 of these companies provide the majority of the property and casualty coverage.
Historically, the financial performance of the P&C insurance industry has tended to fluctuate in cyclical periods of aggressive price competition and excess underwriting capacity (known as a soft market), followed often by periods of high premium rates and shortages of underwriting capacity (or a hard market). Although an individual insurance company’s financial performance is dependent on its own specific business characteristics, the profitability of most property and casualty insurance companies tends to follow this cyclical market pattern. During soft market conditions, premium rates are stable or falling and insurance coverage is readily available. During periods of hard market conditions, coverage may be more difficult to find and insurers increase premiums or exit unprofitable areas of business. Following several years of heavy catastrophe losses in 2011-2012, industry premium rates have firmed and the rebounding economy has helped spur the demand for insurance.
According to S&P Global, the P&C insurance industry experienced direct written premium growth of 9.5% in 2021, 9.6% in 2022, 10.4% in 2023, and 9.8% in 2024, evidencing an improving insurance pricing environment. After several years of strong premium growth, forecasts project a deceleration in 2025. S&P Global projects growth in direct premiums written of 6.8% in 2025 and 6.1% in 2026 as competitive pressures increase. Historically strong growth over the past four years was initially driven by commercial line premiums recording double-digit gains in 2021-22, and then followed by personal lines in 2023-24. Elevated risks to premium growth in 2025 stem from increased tariffs and reduced net migration, which could put upward pressure on goods prices and wage inflation, potentially requiring premium rate adjustments to compensate. S&P Global projects direct premiums written in 2025 to increase by 10.4% in the farmowners insurance sector.
Underwriting results were profitable for the U.S. P&C insurance industry from 2018 to 2021, but turned negative in 2022 and 2023 as the industry’s combined ratio measured 102.6% in 2022 and 101.7% in 2023. The P&C industry was confronted with a challenging operating environment in 2022 and 2023, with rising loss costs attributable to inflation, supply chain issues, higher replacement costs, and natural catastrophes. A dramatic turnaround in the private automobile business drove the P&C industry back to underwriting profitability in 2024 with an industry combined ratio of 96.5% in 2024. The industry’s solid premium growth and easing claims costs contributed to the positive underwriting results in 2024. S&P Global projects a combined ratio of 99.5% for 2025 as the losses from the California wildfires will mitigate improvements in other business lines. S&P Global projects a 2025 combined ratio of 99.0% in the farmowners insurance segment. The homeowners insurance segment continues to face profitability pressure due to rising claims costs and climate-related exposure. S&P Global projects a 2025 combined ratio of 106.1% in the homeowners insurance segment. In states at high risk for climate-related events, such as California and Florida, policyholders are facing significant premium hikes and reduced coverage options.
Net investment income is an important revenue source for P&C insurers, historically accounting for 15% to 20% of total revenues. Net investment income for the P&C industry increased from 2021 to 2024 as a higher interest rate environment improved investment yields. The Federal Reserve increased the federal funds rate eight times in 2022 and four times in 2023 in an effort to tame inflation. As inflation eased, the Federal Reserve reduced the federal funds rate by 50 basis points in September 2024, bringing the benchmark rate down to a target range of 4.75% to 5.0%. A series of 25 basis point reductions in November and December 2024 decreased the target range to 4.25% to 4.50%. Additional easing of monetary policy is expected to result in further rate reductions in late 2025.
Fitch Ratings currently holds a “neutral” fundamental sector outlook for the U.S. P&C insurance sector in 2025. Fitch projects that P&C insurers will generate a positive underwriting profit in 2025 along with modestly higher net income. Fitch considered the capital strength of the industry and rated insurers to support obligations and withstand potential severe losses from various adverse events. Catastrophes remain a major concern for insurers due to the high losses incurred, leading to rate increases to ensure claims payouts. Exposure growth, better pricing, prudent underwriting, and favorable reserve development will help the P&C industry withstand the effects of catastrophes.
The industry is witnessing increased use of technology such as blockchain, artificial intelligence, advanced analytics, telematics, cloud computing, and robotic process automation that expedite business operations and save costs. The industry has also witnessed the emergence of insurtechs or technology-led insurers. Insurers continue to invest heavily in technology, generative artificial intelligence in particular, as it is expected to improve scale and efficiencies. Consolidation in the P&C industry is likely to continue as companies look to diversify their operations into new business lines and geographical areas. Buying businesses along the same lines will also continue as insurers seek to gain market share and grow in their niche areas. With a sturdy capital level, the industry is witnessing an increasing number of business mergers, acquisitions, and consolidations.
20
FELDMAN FINANCIAL ADVISORS, INC.
III. COMPARISONS WITH PUBLICLY TRADED COMPANIES
General Overview
The comparative market approach provides a sound basis for determining estimates of going-concern valuations where a regular and active market exists for the stocks of peer institutions. The comparative market approach was utilized in determining the estimated pro forma market value of ECM because: (i) reliable market and financial data are readily available for comparable institutions, and (ii) the comparative market method has been widely accepted as a valuation approach by the applicable regulatory authorities. The generally employed valuation method in initial public offerings (“IPOs”), where possible, is the comparative market approach, which can also be relied upon to determine pro forma market value in an insurance company stock conversion.
The comparative market approach derives valuation benchmarks from the trading patterns of selected peer institutions that, due to certain factors such as financial performance and operating strategies, enable the appraiser to estimate the potential value of the subject institution in a mutual-to-stock conversion offering. In Chapter III, our valuation analysis focuses on the selection and comparison of the Company with a comparable group of publicly traded insurance companies (the “Comparative Group”). Chapter IV will detail any additional discounts or premiums that we believe are appropriate to the Company’s pro forma market value.
We considered other conventional valuation methodologies in the course of determining the Company’s estimated pro forma market value. Various income approaches include a capitalization of earnings and a discounted cash flow analysis and reflect the economic principle that the value of a subject investment, or subject business interest, is equal to the present value of the economic income expected to be generated by the investment. The income capitalization approach relies on either a single period or multiple periods considered to be representative of recurring benefits, which are capitalized by a capitalization rate chosen from comparable companies or from risk-adjusted rates of return required by investors in a particular line of business. When multiple periods are used, income is estimated for several future periods. This income is discounted to the present time period, with or without a terminal value, depending upon the circumstances of the particular company.
Due to the unpredictable nature of earnings in the P&C industry, primarily because of potential catastrophic events, and the lack of long-term GAAP earnings projections for ECM, we did not utilize an income approach. Furthermore, a large number of publicly traded insurance companies are represented in the stock market, are widely followed by analysts and investors, and are traded actively. The trading characteristics of these public companies allow analysts and investors to gain and apply knowledge about the comparative fundamentals of these companies as they relate to financial performance and market valuations.
Asset-based valuation approaches may be either on a going concern, orderly disposition, or forced liquidation basis. Going concern asset-based valuations are often used in the case of companies that hold readily marketable assets, such as an investment company. ECM holds assets for the purpose of producing income to support its insurance operations. While a portion of ECM’s assets are readily marketable, its primary business is not investment in assets for resale. Financial service companies are rarely valued on the basis of their assets at liquidation value or the disposal of individual assets or groups of assets. While the stock market may use a concept of “book value” as a pricing benchmark, few investors recognize the overall value of a financial service company as being its net book value at any point in time because of the significant differences in composition of balance sheet assets and liabilities and risks associated with business, market, credit, and interest rate factors that the concept of simple “book value” does not fully recognize. For an insurance company such as ECM, the asset-based approach could lead to valuation conclusions that do not fully take into account the enterprise as a whole and the accompanying intangible benefits or risk factors related to the business franchise. Therefore, we have elected not to utilize this approach and have concentrated instead on the comparative market approach.
21
FELDMAN FINANCIAL ADVISORS, INC.
Selection Criteria
Selected market price and financial performance data for property and casualty insurance companies traded on the New York Stock Exchange, NYSE American Stock Exchange, or NASDAQ Stock Market are shown in Exhibit V as compiled from data obtained by S&P Global, a leading provider of financial and market data focused on the financial services industry, including banks and insurance companies. S&P Global differentiates the overall insurance industry into six market segments: (i) life and health, (ii) managed care, (iii) mortgage and financial guaranty, (iv) multi-line, (v) property and casualty, and (vi) title. For purposes of this selection screening, we focused exclusively on publicly traded insurance companies based or operating chiefly in the United States and included in the property and casualty segment (“Public P&C Insurance Group”). Several criteria, discussed below, were used to select the individual members of the Comparative Group from the overall universe of publicly traded insurance companies.
| ● | Operating characteristics – A company’s operating characteristics are the most important factors because they affect investors’ expected rates of return on a company’s stock under various business and economic scenarios, and they influence the market’s general perception of the quality and attractiveness of a given company. Operating characteristics, which may vary in importance during the business cycle, include financial variables such as profitability, capitalization, growth, risk exposure, liquidity, and other factors such as lines of business and management strategies. |
| ● | Degree of marketability and liquidity – Marketability of a stock reflects the relative ease and promptness with which a security may be sold when desired, at a representative current price, without material concession in price merely because of the necessity of sale. Marketability also connotes the existence of buying interest as well as selling interest and is usually indicated by trading volumes and the spread between the bid and asked price for a security. Liquidity of the stock issue refers to the organized market exchange process whereby the security can be converted into cash. We attempted to limit our selection to companies that have access to a regular trading market or price quotations. We excluded from the Comparative Group and the Public P&C Insurance Group those companies that are sellers in pending acquisitions that have been previously announced. |
In determining the Comparative Group composition, we focused primarily on ECM’s asset size, market segment, and product lines. In particular, we also focused on companies operating in niche markets or specialty lines of business. Attempting to concentrate on the Company’s financial characteristics and enlarge the Comparative Group to obtain a meaningful statistical cluster of companies, we broadened the size range criteria to encompass a statistically significant number of companies. In addition, due to the ongoing consolidation activity within the insurance industry, we sought to include a sufficient number of companies in the event that one or several members are subsequently subject to a pending acquisition, as we may update this Appraisal, if necessary and required, prior to completion of the Conversion.
Of the 55 companies composing the Public P&C Insurance Group as of September 17, 2025, there were only five insurers with total assets under $1.0 billion. We included Kingstone Companies with total assets of $393.4 million in the Comparative Group. However, we excluded the other insurers under $1.0 billion in assets, including Conifer Holdings (due to its sustained history of operating losses), Kingsway Financial Services (reliance on extended warranty and business services), NI Holdings (organized in the mutual holding company structure), and Trupanion (provider of medical insurance for cats and dogs).
22
FELDMAN FINANCIAL ADVISORS, INC.
The median asset size of the overall Public P&C Insurance Group was $6.1 billion and the average size was even larger at $47.6 billion, skewed by very large companies such as Berkshire Hathaway with total assets approximating $1.2 trillion. The median equity level of the overall Public P&C Insurance Group was $1.5 billion and the average equity level was $18.5 billion. We applied the following selection criteria and focused principally on companies below the medians of the Public P&C Insurance Group based on asset size and equity level.
| ● | Publicly traded – stock-form insurance company whose shares are traded on New York Stock Exchange, NYSE American, or NASDAQ Stock Market. |
| ● | Industry segment – insurance underwriter whose primary market segment is listed as property and casualty by S&P Global. |
| ● | Non-acquisition target – not subject to an announced or pending acquisition. |
| ● | Non-mutual holding company – not organized in mutual holding company form. |
| ● | Seasoned trading history – publicly traded for at least one year. |
| ● | Current financial data – publicly reported financial data on a GAAP basis available for the last twelve months (“LTM”) ended June 30, 2025. |
| ● | Equity level – total equity less than $1.5 billion. |
| ● | Market capitalization – total market value less than $2.0 billion. |
As a result of applying the above criteria, the screening process produced a reliable representation of publicly traded insurance companies for valuation purposes. We selected ten companies for inclusion in the Comparative Group that each met all of the screening criteria outlined above. A general operating summary of the ten companies is presented in Table 8. In focusing on smaller publicly traded companies, the Comparative Group includes a total of five companies with total assets less than $3.0 billion (American Coastal Insurance, Global Indemnity Group, Heritage Insurance Holdings, Kingstone Companies, and Safety Insurance Group). Four of the companies had total assets between $3.0 billion and $5.0 billion (Employers Holdings, Skyward Specialty Insurance Group, United Fire Group, and Universal Insurance Holdings), and one company had total assets greater than $5.0 billion (Horace Mann Educators Corporation).
While no single company constitutes a perfect comparable, and differences inevitably exist between ECM and the individual companies, we believe that the chosen Comparative Group on the whole provides a meaningful basis of financial comparison for valuation purposes. Summary operating profiles of the publicly traded insurance companies selected for the Comparative Group are presented in the next section beginning on pages 44 to 48.
23
FELDMAN FINANCIAL ADVISORS, INC.
Table 8
General Operating Summary of the Comparative Group
As of June 30, 2025
| State | Ticker | Exchange | IPO Date | Total Assets ($Mil.) | Total Equity ($Mil.) | Total Equity/ Assets (%) | ||||||||||||||
| Everett Cash Mutual Insurance Co. (1) | PA | NA | NA | NA | 513.0 | 130.7 | 25.48 | |||||||||||||
| Comparative Group Median | NA | NA | NA | NA | 2,906.3 | 770.5 | 22.40 | |||||||||||||
| Comparative Group Mean | NA | NA | NA | NA | 3,790.7 | 698.6 | 23.59 | |||||||||||||
| Comparative Group | ||||||||||||||||||||
| American Coastal Insurance Corporation | FL | ACIC | NASDAQ | 10/04/07 | 1,346.9 | 292.3 | 21.70 | |||||||||||||
| Employers Holdings, Inc. | NV | EIG | NYSE | 01/30/07 | 3,543.3 | 1,083.1 | 30.57 | |||||||||||||
| Global Indemnity Group, LLC | PA | GBLI | NYSE | 12/15/03 | 1,720.6 | 695.3 | 40.41 | |||||||||||||
| Heritage Insurance Holdings, Inc. | FL | HRTG | NYSE | 05/22/14 | 2,536.8 | 383.3 | 15.11 | |||||||||||||
| Horace Mann Educators Corporation | IL | HMN | NYSE | 11/15/91 | 14,728.3 | 1,360.3 | 9.24 | |||||||||||||
| Kingstone Companies, Inc. | NY | KINS | NASDAQ | NA | 393.4 | 94.9 | 24.12 | |||||||||||||
| Safety Insurance Group, Inc. | MA | SAFT | NASDAQ | 11/21/02 | 2,364.2 | 873.3 | 36.94 | |||||||||||||
| Skyward Specialty Insurance Group, Inc. | TX | SKWD | NASDAQ | 01/12/23 | 4,336.4 | 899.9 | 20.75 | |||||||||||||
| United Fire Group, Inc. | IA | UFCS | NASDAQ | NA | 3,661.1 | 845.7 | 23.10 | |||||||||||||
| Universal Insurance Holdings, Inc. | FL | UVE | NYSE | 12/16/92 | 3,275.8 | 457.8 | 13.98 | |||||||||||||
| (1) | Consolidated GAAP financial data as of December 31, 2024. |
Source: Everett Cash Mutual Insurance Company; S&P Global.
24
FELDMAN FINANCIAL ADVISORS, INC.
Summary Profiles of the Comparative Group Companies
American Coastal Insurance Corporation (NASDAQ: ACIC) – St. Petersburg, Florida
American Coastal Insurance Corporation (“American Coastal”) is a holding company primarily engaged in the commercial property and casualty insurance business through its subsidiary, American Coastal Insurance Company. American Coastal’s primary source of revenue is generated from commercial residential property insurance in Florida. American Coastal also previously wrote personal homeowners insurance in New York through Interboro Insurance Company; however, on April 1, 2025, American Coastal completed the sale of Interboro Insurance Company. American Coastal provides commercial multi-peril property insurance for residential condominium associations and apartments in Florida. In 2020, American Coastal began writing commercial policies in Texas and South Carolina. Effective May 31, 2022, American Coastal no longer writes commercial policies in Texas and South Carolina. In addition, during 2022, American Coastal wrote personal residential business in six other states. However, in February 2023, American Coastal divested a former insurance subsidiary in Florida that was placed into receivership. The recent sale of Interboro Insurance Company represented the final step in American Coastal’s strategic shift to become a specialty commercial underwriter. American Coastal provides coverage to policyholders for loss or damage to buildings, inventory, or equipment caused by covered loss occurrences, including fire, wind, hail, water, theft, and vandalism. As of June 30, 2025, American Coastal had total assets of $1.3 billion, total policy reserves of $603.2 million, total equity of $292.3 million, LTM total revenue of $323.0 million, and LTM net income of $80.9 million.
Employers Holdings, Inc. (NYSE: EIG) – Reno, Nevada
Employers Holdings, Inc. (“Employers Holdings”) is a holding company with subsidiary carriers that are specialty providers of workers compensation insurance and services focused on small and mid-sized businesses engaged in low-to-medium hazard industries. Employers Holdings operates throughout the United States with the exception of North Dakota, Ohio, Washington, and Wyoming, which are served exclusively by their state funds. Employers Holdings’ business is concentrated in California, where it generated approximately 45% of its in-force premiums as of December 31, 2024. Employers Holdings offers insurance through Employers Insurance Company of Nevada, Employers Compensation Insurance Company, Employers Preferred Insurance Company, Employers Assurance Company, and Cerity Insurance Company. Employers Holdings emphasizes an underwriting approach designed to individually select specific types of businesses, predominantly those in the lowest four of the seven workers compensation insurance industry-defined hazard groups, which it believes will have fewer and less costly claims relative to other businesses in the same hazard groups. Its primary insured employer segments include restaurants, traveler accommodations, and building finishing and equipment contractors. Each of the insurance subsidiaries of Employers Holdings is currently assigned a group financial strength rating of A (Excellent) by A.M. Best with a stable outlook. As of June 30, 2025, Employers Holdings had total assets of $3.5 billion, total policy reserves of $2.2 billion, total equity of $1.1 billion, LTM total revenue of $889.5 million, and LTM net income of $101.1 million.
25
FELDMAN FINANCIAL ADVISORS, INC.
Global Indemnity Group, LLC (NYSE: GNLI) – Bala Cynwyd, Pennsylvania
Global Indemnity Group, LLC (“Global Indemnity”) is a holding company. Its principal assets are its ownership in the shares of (i) Belmont Holdings GX, Inc., an insurance holding company that owns the following insurance companies: United National Insurance Company, Diamond State Insurance Company, Penn-America Insurance Company, Penn-Star Insurance Company, and Penn-Patriot Insurance Company, and (ii) Penn-America Underwriters, LLC, an agency and specialized service holding company. Global Indemnity’s Penn-America segment distributes specialty property and casualty insurance products in the excess and surplus lines marketplace. Penn-America targets “Main Street” specialty excess and surplus lines, focusing on small businesses such as artisan contractors, habitational (landlord), general services, vacant properties, mercantile and restaurants, bars and taverns, commercial buildings, and collectibles. Penn-America is one of the larger providers of insurance to Main Street businesses and has built this position by focusing on this market for over 40 years. Penn-America underwrites commercial coverages for 900 classes of casualty business and 200 classes of property business. Penn-America distributes property and general liability products for small commercial businesses through a select network of wholesale general agents with specific binding authority to rate, quote, and issue policies. Companies within the Penn-America operations are eligible to write on a surplus lines (non-admitted) basis, and others are licensed to write on an admitted basis in all 50 states, the District of Columbia, Puerto Rico, and the U.S. Virgin Islands. For the year ended December 31, 2024, Penn-Americal’s gross written premiums were generated primarily in the states of California (14.3%), Florida (12.8%), Texas (10.4%), New York (9.2%), and Massachusetts (4.7%). Each of Global Indemnity’s insurance companies is currently assigned a financial strength rating of A (Excellent) by A.M. Best with a stable outlook. As of June 30, 2025, Global Indemnity had total assets of $1.7 billion, total policy reserves of $971.1 million, total equity of $695.3 million, LTM total revenue of $439.4 million, and LTM net income of $28.1 million.
Heritage Insurance Holdings, Inc. (NYSE: HRTG) – Tampa, Florida
Heritage Insurance Holdings, Inc. (“Heritage Insurance”) is a regional property and casualty insurance holding company that primarily provides personal and commercial residential insurance through its insurance company subsidiaries: Heritage Property & Casualty Insurance Company (“Heritage P&C”), which provides personal and commercial residential property insurance and commercial general liability insurance; Narragansett Bay Insurance Company (“NBIC”), which provides personal and commercial residential property insurance; and Zephyr Insurance Company (“Zephyr”), which provides personal residential and wind-only property insurance in Hawaii. Heritage Insurance is vertically integrated and controls or manages substantially all aspects of insurance underwriting, customer service, financial reporting and actuarial analysis, distribution, and claims processing and adjusting. On an admitted basis, Heritage Insurance provides personal residential insurance in 14 Eastern and Gulf states, as well as commercial residential insurance in three of those states. Heritage Insurance is transitioning the focus of its business to increasing its policy count and expanding its geographic footprint. A majority of its new business growth has occurred in the Northeast and Mid-Atlantic states, which NBIC covers, along with California. As of June 30, 2025, Heritage Insurance had total assets of $2.5 billion, total policy reserves of $1.5 billion, total equity of $383.3 million, LTM total revenue of $841.7 million, and LTM net income of $106.9 million.
26
FELDMAN FINANCIAL ADVISORS, INC.
Horace Mann Educators Corporation (NYSE: HMN) – Springfield, Illinois
Horace Mann Educators Corporation (“Horace Mann”) is a multi-line financial services company focused on helping America’s educators and others who serve their communities to achieve specific financial objectives. Horace Mann’s primary insurance subsidiaries include Horace Mann Insurance Company, Horace Mann Property & Casualty Insurance Company, and Horace Mann Life Insurance Company. Horace Mann’s products and services include automobile insurance, homeowners insurance, life insurance, retirement solutions, and supplemental health insurance. Horace Mann also provides group benefits for disability, life, and supplemental health. Horace Mann has three reporting segments: property and casualty (its largest segment), life and retirement, and supplemental and group benefits. Within the property and casualty segment, Horace Mann’s primary insurance products include private passenger automobile insurance, residential home insurance, and personal umbrella insurance. For the year ended December 31, 2024, based on direct premiums for all product lines, the top five states and their portion of total direct insurance premiums were California (13.1%), Texas (9.3%), North Carolina (7.8%), Minnesota (6.1%), and Georgia (4.9%). Horace Mann’s life and retirement segment markets annuities, other defined contribution plans, traditional term and whole life insurance products, and indexed universal life products. The supplemental and group benefits segment offers employer-sponsored products, including accident, critical illness, term life, short-term disability, and long-term disability. Horace Mann’s insurance companies are currently assigned a financial strength rating of A (Excellent) by A.M. Best with a stable outlook. As of June 30, 2025, Horace Mann had total assets of $14.7 billion, total policy reserves of $8.6 billion, total equity of $1.4 billion, LTM total revenue of $1.6 billion, and LTM net income of $140.1 million.
Kingstone Companies, Inc. (NASDAQ: KINS) – Kingston, New York
Kingstone Companies, Inc. (“Kingstone”) offers property and casualty insurance products through its wholly-owned subsidiary, Kingstone Insurance Company (“KICO”). KICO is a New York-domiciled carrier that writes business through retail and wholesale agents and brokers. KICO is actively writing personal lines and commercial auto insurance in New York, and in 2024 was the 12th largest writer of homeowners insurance in New York. KICO is also licensed in the states of New Jersey, Rhode Island, Massachusetts, Connecticut, Pennsylvania, New Hampshire, and Maine. For the years ended December 31, 2023 and 2024, respectively, 88.3% and 96.0% of KICO’s direct written premiums came from the New York policies. Kingstone’s subsidiary, Cosi Agency, Inc., is a multi-state licensed general agency that receives commission revenue from KICO for the policies it places with others and pays commissions to these agencies. Kingstone’s largest line of business is personal lines, consisting of homeowners, dwelling fire, cooperative/ condominium, renters, and personal umbrella policies. Kingstone also writes for-hire vehicle physical damage only policies for livery and car service vehicles and taxicabs. These policies insure only the physical damage portion of insurance for such vehicles, with no liability coverage included. In July 2025, Kingstone announced the reinstatement of its quarterly cash dividend with the declaration of a $0.05 quarterly dividend. Kingstone has also indicated that it plans to launch business expansion outside of New York State in 2026 to reduce its geographic concentration and to improve growth potential. As of June 30, 2025, Kingstone had total assets of $393.4 million, total policy reserves of $269.9 million, total equity of $94.9 million, LTM total revenue of $185.7 million, and LTM net income of $27.6 million.
27
FELDMAN FINANCIAL ADVISORS, INC.
Safety Insurance Group, Inc. (NASDAQ: SAFT) – Boston, Massachusetts
Safety Insurance Group, Inc. (“Safety Insurance Group”) is a leading provider of private passenger automobile, commercial automobile, and homeowners insurance in Massachusetts. In addition to these coverages, Safety Insurance Group offers a portfolio of other insurance products, including dwelling fire, umbrella, and business owner policies. Operating exclusively in Massachusetts, New Hampshire, and Maine, Safety Insurance Group offers insurance through Safety Insurance Company, Safety Indemnity Insurance Company, Safety Property and Casualty Insurance Company, and Safety Northeast Insurance Company. Safety Insurance Group’s carriers distribute their products exclusively through independent agents. It has utilized its relationships with independent insurance agents, who numbered 828 in 1,079 locations throughout these three states during 2024, to become the third largest private passenger automobile carrier, the second largest commercial automobile carrier, and the third largest homeowners insurance carrier in Massachusetts. Safety Insurance Group also serves eligible small and medium-sized commercial accounts with a program that covers apartments and residential condominiums, mercantile establishments (including restaurants), offices, wholesaling businesses, and specialty trade contractors. For the year ended December 31, 2024, Safety Insurance Group’s direct written premium distribution was as follows: Massachusetts (94.7%), New Hampshire (4.4%), and Maine (0.9%). The operating subsidiaries of Safety Insurance Group currently carry A.M. Best group financial strength ratings of A (Excellent), all with stable outlooks. As of June 30, 2025, Safety Insurance Group had total assets of $2.4 billion, total policy reserves of $1.3 billion, total equity of $873.3 million, LTM total revenue of $1.2 billion, and LTM net income of $84.9 million.
Skyward Specialty Insurance Group, Inc. (NASDAQ: SKWD) – Houston, Texas
Skyward Specialty Insurance Group, Inc. (“Skyward Group”) is a specialty insurance company operation delivering commercial property and casualty products and solutions on a non-admitted and admitted basis, predominantly in the United States. Skyward Group focuses its business on markets that are underserved, dislocated, or for which standard insurance coverages are insufficient or inadequate to meet the needs of businesses. Skyward Group’s customers typically require highly specialized, customized underwriting solutions and claims capabilities. Skyward Group’s portfolio of insured risks is highly diversified and it writes multiple lines of business, including general liability, excess liability, professional liability (including cyber and media liability insurance), commercial automobile, group accident and health, property, agriculture, credit, surety, and workers compensation. Skyward Group conducts its operations principally through four insurance companies: Great Midwest Insurance Company, Houston Specialty Insurance Company, Imperium Insurance Company, and Oklahoma Specialty Insurance Company. Skyward Group operates through nine underwriting divisions: accident and health, agriculture and credit (re)insurance, captives, construction and energy solutions, global property, professional lines, specialty programs, surety, and transactional excess and surplus. For the year ended December 31, 2024, Skyward Group’s direct written premium distribution was as follows: Texas (11.2%), California (8.8%), Florida (8.3%), Louisiana (6.8%), New York (6.5%), and Georgia (4.4%). The subsidiaries of Skyward Group currently carry A.M. Best financial strength ratings of A (Excellent), all with stable outlooks. As of June 30, 2025, Skyward Group had total assets of $4.3 billion, total policy reserves of $2.7 billion, total equity of $899.9 million, LTM total revenue of $1.3 billion, and LTM net income of $132.0 million.
28
FELDMAN FINANCIAL ADVISORS, INC.
United Fire Group, Inc. (NASDAQ: UFCS) – Cedar Rapids, Iowa
United Fire Group, Inc. (“United Fire Group”) and its subsidiaries are engaged in the business of writing property and casualty insurance through a network of independent agencies. United Fire Group’s insurance company subsidiaries are currently licensed as property and casualty insurers in all 50 states, plus the District of Columbia. United Fire Group owns 100% of United Fire & Casualty Company, which owns other insurance carriers, including Addison Insurance Company, Lafayette Insurance Company, United Fire & Indemnity Company, Mercer Insurance Company, Financial Pacific Insurance Company, and UFG Specialty Insurance Company. United Fire Group’s business primarily comprises commercial lines of property and casualty insurance, including surety bonds. United Fire Group’s main commercial policies are tailored business packages that include the following lines of business: fire and allied lines, other liability, automobile, workers compensation, and surety. United Fire Group’s core commercial products support a wide variety of customers, including small business owners and middle market businesses in industries such as construction, services, retail trade, financial, and manufacturing. United Fire Group partners with managing general agents to offer delegated underwriting programs providing niche products, including marine specialty, professional liability, and earthquake coverages. For the year ended December 31, 2024, United Fire Group’s direct written premium distribution included the following states: Texas (18.4%), California (12.5%), Iowa (6.5%), Missouri (4.9%), and Louisiana (4.8%). The operating subsidiaries of United Fire Group currently carry A.M. Best group financial strength ratings of A- (Excellent), all with stable outlooks. As of June 30, 2025, United Fire Group had total assets of $3.7 billion, total policy reserves of $2.6 billion, total equity of $845.7 million, LTM total revenue of $1.3 billion, and LTM net income of $91.8 million.
Universal Insurance Holdings, Inc. (NYSE: UVE) – Fort Lauderdale, Florida
Universal Insurance Holdings, Inc. (“Universal Insurance”) is a holding company offering property and casualty insurance and value-added insurance services. Universal Insurance develops, markets, and underwrites insurance products for consumers predominantly in the personal residential homeowners lines of business and performs substantially all other insurance-related services for its primary insurance entities, including risk management, claims management, and distribution. Universal Insurance’s primary entities, which include Universal Property & Casualty Insurance Company (“UPCIC”) and American Platinum Property and Casualty Insurance Company (“APPCIC”), offer insurance products through both its appointed independent agent network and its online distribution channels across its multi-state footprint (primarily in Florida). UPCIC, the primary risk-bearing insurance entity, which accounts for the substantial majority of Universal Insurance’s business, primarily distributes policies through an independent agency force and offers the following types of personal residential insurance: homeowners, renters/tenants, condominium unit owners, and dwelling/fire. UPCIC also offers allied lines, coverage for other structures, and personal property, liability, and personal articles coverages. APPCIC writes similar lines of insurance as UPCIC, but is only licensed in Florida and Georgia, and primarily distributes policies through digital platforms. For the year ended December 31, 2024, Universal Insurance’s direct written premium distribution included Florida (77.2%) and other states (22.8%). As of June 30, 2025, Universal Insurance had total assets of $3.3 billion, total policy reserves of $1.9 billion, total equity of $457.8 million, LTM total revenue of $1.6 billion, and LTM net income of $66.4 million.
29
FELDMAN FINANCIAL ADVISORS, INC.
Recent Financial Comparisons
Table 9 summarizes certain financial comparisons between ECM and the Comparative Group. Financial data for the Comparative Group and the Public P&C Insurance Group are based on the most recently available GAAP data for the LTM ended June 30, 2025. Financial data for ECM is presented for the LTM ended December 31, 2024, the most recent period available for GAAP financial data. The Public P&C Insurance Group includes all of the companies presented in Exhibit V.
The Company’s total assets of $513.0 million measured below the Comparative Group’s median and mean of $2.9 billion and $3.8 billion, respectively. Overall, the Comparative Group includes one company with assets under $1.0 billion, eight with assets between $1.0 billion and $5.0 billion, and one company with assets greater than $5.0 billion. The median asset size of the Public P&C Insurance Group was $6.1 billion.
The P&C insurance industry is highly competitive in the areas of price, coverage, and service, and includes insurers ranging from large companies offering a wide variety of products worldwide to smaller, specialized companies in a single state or region offering only a single product. Smaller companies may find themselves competing with many companies of substantially greater financial resources, more advanced technology, larger business volumes, more diversified insurance coverage, broader product ranges, and higher ratings. Competition centers not only on the marketing of products, but also on the recruitment and retention of qualified agents and producers. Large national insurers may have certain competitive advantages over smaller companies, including increased name recognition, increased loyalty of their customer base, greater efficiencies and economies of scale, and reduced policy acquisition costs. ECM has sought to gain competitive advantages by operating as a niche player in a specialty insurance market.
ECM’s ratio of total policy reserves to total equity on a GAAP basis measured 1.18x, evidencing its solid capital position and comparatively restrained utilization of underwriting leverage. The Comparative Group’s median and mean ratios of policy reserves to equity were 2.94x and 3.02x, respectively. Among the Comparative Group, only two companies had ratios of policy reserves to equity below 2.0x, Global Indemnity Group at 1.40x and Safety Insurance Group at 1.54x. Correspondingly, these two companies also exhibited higher equity capital ratios. ECM’s GAAP equity capital ratio at 25.5% of total assets surpassed the Comparative Group’s median of 22.4% and the Public P&C Insurance Group’s median of 22.4%. Among the Comparative Group, only Global Indemnity Group (40.4%), Safety Insurance Group (36.9%), and Employers Holdings (30.6%) had GAAP equity capital ratios above ECM’s ratio of 25.5%. Excluding goodwill and other intangible assets, ECM’s ratio of tangible equity to assets was 21.8% and similar to the Comparative Group’s median and mean ratios of 21.1% and 22.5%, respectively.
The Company’s ratio of investments and cash to total assets was 46.9% as of December 31, 2024, measuring below the Comparative Group’s median ratio of 62.4% and mean ratio of 61.8%. ECM’s lower concentration of invested assets reflects comparatively higher levels of receivables in the form of reinsurance receivables and premium receivables. In conjunction with the Company’s significantly increased premium revenue related to the acquisition of ARIC and steady organic growth, ECM accessed additional reinsurance capacity to support its expanded underwriting business and stabilize underwriting results. ECM’s total assets were relatively unchanged over the LTM period, whereas the Comparative Group reflected median and mean asset growth rates of 5.3% and 8.1%, respectively. Most members of the Comparative Group experienced moderate asset growth over the past year, while a few reported significant asset increases due to substantial increases in total revenue and net income.
30
FELDMAN FINANCIAL ADVISORS, INC.
Table 9
Comparative Financial Condition Data
Everett Cash Mutual Insurance Company and the Comparative Group
As of or for the Last Twelve Months Ended June 30, 2025
| Total Assets ($Mil.) | Total Policy Resrvs. ($Mil.) | Total Equity ($Mil.) | LTM Asset Growth (%) | Policy Resrvs./ Equity (x) | Invest. &Cash/ Assets (%) | Total Equity/ Assets (%) | Tang. Equity/ Assets (%) | |||||||||||||||||||||||||
| Everett Cash Mutual Insurance Co. (1) | 513.0 | 154.1 | 130.7 | 0.02 | 1.18 | 46.95 | 25.48 | 21.84 | ||||||||||||||||||||||||
| Comparative Group Median | 2,906.3 | 1,664.4 | 770.5 | 5.26 | 2.94 | 62.35 | 22.40 | 21.06 | ||||||||||||||||||||||||
| Comparative Group Mean | 3,790.7 | 2,266.2 | 698.6 | 9.05 | 3.02 | 61.78 | 23.59 | 22.51 | ||||||||||||||||||||||||
| Public P&C Insurance Group Median | 6,069.3 | 3,647.5 | 1,541.4 | 7.39 | 2.84 | 62.59 | 22.40 | 21.47 | ||||||||||||||||||||||||
| Public P&C Insurance Group Mean | 47,643.9 | 19,926.5 | 18,491.3 | 10.22 | 2.78 | 60.80 | 25.48 | 22.73 | ||||||||||||||||||||||||
| Comparative Group | ||||||||||||||||||||||||||||||||
| American Coastal Insurance Corporation | 1,346.9 | 603.2 | 292.3 | 2.71 | 2.06 | 53.92 | 21.70 | 17.79 | ||||||||||||||||||||||||
| Employers Holdings, Inc. | 3,543.3 | 2,216.4 | 1,083.1 | (0.19 | ) | 2.05 | 71.39 | 30.57 | 29.30 | |||||||||||||||||||||||
| Global Indemnity Group, LLC | 1,720.6 | 971.1 | 695.3 | (1.03 | ) | 1.40 | 83.60 | 40.41 | 39.75 | |||||||||||||||||||||||
| Heritage Insurance Holdings, Inc. | 2,536.8 | 1,475.4 | 383.3 | (2.41 | ) | 3.85 | 45.66 | 15.11 | 13.98 | |||||||||||||||||||||||
| Horace Mann Educators Corporation | 14,728.3 | 8,634.2 | 1,360.3 | 3.12 | 6.35 | 48.08 | 9.24 | 7.97 | ||||||||||||||||||||||||
| Kingstone Companies, Inc. | 393.4 | 269.9 | 94.9 | 23.03 | 2.84 | 69.53 | 24.12 | 24.02 | ||||||||||||||||||||||||
| Safety Insurance Group, Inc. | 2,364.2 | 1,345.4 | 873.3 | 9.36 | 1.54 | 68.92 | 36.94 | 36.28 | ||||||||||||||||||||||||
| Skyward Specialty Insurance Group, Inc. | 4,336.4 | 2,732.8 | 899.9 | 26.22 | 3.04 | 51.97 | 20.75 | 19.10 | ||||||||||||||||||||||||
| United Fire Group, Inc. | 3,661.1 | 2,559.8 | 845.7 | 7.41 | 3.03 | 65.61 | 23.10 | 23.02 | ||||||||||||||||||||||||
| Universal Insurance Holdings, Inc. | 3,275.8 | 1,853.4 | 457.8 | 22.30 | 4.05 | 59.09 | 13.98 | 13.91 | ||||||||||||||||||||||||
| (1) | Consolidated GAAP financial data as of or for the LTM ended December 31, 2024. |
Source: Everett Cash Mutual Insurance Company; S&P Global.
31
FELDMAN FINANCIAL ADVISORS, INC.
As shown in Table 10, the Company’s ROA for the LTM ended December 31, 2024 was 2.17% and was below the Comparative Group’s median and mean ROA results of 2.93% and 3.21%, respectively, for the LTM ended December 31, 2024. The Public P&C Insurance Group reported median and mean ROA results of 3.29% and 3.53%, respectively, for the LTM ended December 31, 2024. ECM’s ROE for the LTM ended December 31, 2024 was 8.73% and lagged the Comparative Group’s median and mean ROE results of 13.47% and 16.91%, respectively, for the LTM ended December 31, 2024. ECM’s comparative disadvantage in profitability versus the Comparative Group reflected its slightly higher expense ratio and lower level of net premiums written to average equity. The Company’s lower concentration of invested assets to total assets also had a restraining impact on the level of net investment income production.
All of the Comparative Group companies reported positive earnings, led by American Coastal Insurance and Kingstone Companies with 2024 ROA results of 6.48% and 5.52%, respectively. The lower earning performers in the Comparative Group were Horace Mann and United Fire Group with 2024 ROA results of 0.72% and 1.83%, respectively.
ECM’s expense ratio of 34.5% for the LTM ended December 31, 2024 was slightly higher than the Comparative Group’s median and mean ratios of 33.6% and 33.3%, respectively. ECM’s loss ratio of 61.9% for the LTM ended December 31, 2024 was below the median Comparative Group ratio of 62.1% and above the mean Comparative Group ratio of 59.7%. Similarly, ECM’s combined ratio of 96.4% for the LTM ended December 31, 2024 was below the median Comparative Group ratio of 96.8% and above the mean Comparative Group ratio of 93.0%. ECM’s LTM pre-tax income measured 7.6% of total revenue, while the Comparative Group exhibited a higher level of pre-tax profitability with a median ratio of 12.0% and a mean ratio of 13.9%. Goodwill amortization is an additional expense for ECM that impacts its GAAP earnings.
The Company’s ratio of net premiums written to average equity measured 1.31x for the LTM ended December 31, 2024 and was lower than the Comparative Group’s median and mean LTM ratios of 1.43x and 1.69x, respectively. In recent years, the Company’s rate of net premium growth has exceeded the rate of capital accumulation. Increasing the Company’s capital to support future premium growth on its existing platform is an important strategic goal of ECM as it seeks to capitalize on expansion opportunities within its traditional farm/agriculture niche market and selectively targeted commercial segments
32
FELDMAN FINANCIAL ADVISORS, INC.
Table 10
Comparative Operating Performance Data
Everett Cash Mutual Insurance Company and the Comparative Group
For the Last Twelve Months Ended June 30, 2025
| LTM Total Revenue ($Mil.) | LTM Net Prem. Written/ Avg.Eq. (x) | LTM Pre- tax Inc./ Total Revenue (%) | LTM ROA (%) | LTM ROE (%) | 2024(1) Loss Ratio (%) | 2024(1) Exp. Ratio (%) | 2024(1) Comb. Ratio (%) | 2024(1) ROA (%) | 2024(1) ROE (%) | |||||||||||||||||||||||||||||||
| Everett Cash Mutual Insurance Co. (2) | 184.9 | 1.31 | 7.59 | 2.17 | 8.73 | 61.9 | 34.5 | 96.4 | 2.17 | 8.73 | ||||||||||||||||||||||||||||||
| Comparative Group Median | 1,044.6 | 1.43 | 11.95 | 3.15 | 13.90 | 62.1 | 33.6 | 96.8 | 2.93 | 13.47 | ||||||||||||||||||||||||||||||
| Comparative Group Mean | 967.2 | 1.69 | 13.88 | 3.62 | 18.54 | 59.7 | 33.3 | 93.0 | 3.21 | 16.91 | ||||||||||||||||||||||||||||||
| Public P&C Insurance Group Median | 1,686.3 | 1.14 | 13.20 | 3.52 | 14.88 | 63.2 | 30.7 | 93.9 | 3.29 | 15.81 | ||||||||||||||||||||||||||||||
| Public P&C Insurance Group Mean | 15,885.3 | 1.45 | 12.84 | 3.48 | 14.94 | 60.9 | 32.5 | 92.5 | 3.53 | 16.92 | ||||||||||||||||||||||||||||||
| Comparative Group | ||||||||||||||||||||||||||||||||||||||||
| American Coastal Insurance Corporation | 323.0 | 1.22 | 33.80 | 6.67 | 31.90 | 25.3 | 42.2 | 67.5 | 6.48 | 34.07 | ||||||||||||||||||||||||||||||
| Employers Holdings, Inc. | 889.5 | 0.71 | 13.97 | 2.84 | 9.42 | 60.9 | 37.0 | 97.9 | 3.32 | 11.39 | ||||||||||||||||||||||||||||||
| Global Indemnity Group, LLC | 439.4 | 0.57 | 8.21 | 1.62 | 4.10 | 56.6 | 39.0 | 95.6 | 2.49 | 6.45 | ||||||||||||||||||||||||||||||
| Heritage Insurance Holdings, Inc. | 841.7 | 2.51 | 16.75 | 4.44 | 35.11 | 58.2 | 36.0 | 94.2 | 2.62 | 24.01 | ||||||||||||||||||||||||||||||
| Horace Mann Educators Corporation | 1,649.2 | 1.26 | 10.61 | 0.96 | 10.77 | 70.7 | 27.2 | 97.9 | 0.72 | 8.33 | ||||||||||||||||||||||||||||||
| Kingstone Companies, Inc. | 185.7 | 2.72 | 18.66 | 7.53 | 39.87 | 48.7 | 31.3 | 80.0 | 5.52 | 36.28 | ||||||||||||||||||||||||||||||
| Safety Insurance Group, Inc. | 1,199.8 | 1.36 | 9.01 | 3.73 | 10.06 | 70.9 | 30.2 | 101.1 | 3.25 | 8.61 | ||||||||||||||||||||||||||||||
| Skyward Specialty Insurance Group, Inc. | 1,253.7 | 1.50 | 13.29 | 3.46 | 16.22 | 63.4 | 28.9 | 92.3 | 3.50 | 16.16 | ||||||||||||||||||||||||||||||
| United Fire Group, Inc. | 1,322.7 | 1.63 | 8.74 | 2.61 | 11.58 | 63.3 | 35.9 | 99.2 | 1.83 | 8.24 | ||||||||||||||||||||||||||||||
| Universal Insurance Holdings, Inc. | 1,567.4 | 3.43 | 5.81 | 2.37 | 16.38 | 79.2 | 24.9 | 104.1 | 2.35 | 15.55 | ||||||||||||||||||||||||||||||
| (1) | For the LTM ended December 31, 2024 |
| (2) | Consolidated GAAP financial data for the LTM ended December 31, 2024. |
Source: Everett Cash Mutual Insurance Company; S&P Global.
33
FELDMAN FINANCIAL ADVISORS, INC.
IV. MARKET VALUE ADJUSTMENTS
General Overview
This concluding chapter of the Appraisal identifies certain adjustments to ECM’s estimated pro forma market value relative to the Comparative Group. The adjustments discussed in this chapter are made from the viewpoints of potential investors in the Conversion, which would include eligible policyholders and other eligible individuals with subscription rights. It is assumed that these potential investors are aware of all relevant and necessary facts as they would pertain to the value of the Company relative to other publicly traded insurance companies and relative to alternative investments.
Our Appraisal is predicated on a continuation of the current operating environment for ECM and insurance companies in general. Changes in the Company’s operating performance along with changes in the regional and national economies, the stock market, interest rates, the regulatory environment, and other external factors may occur from time to time, often with great unpredictability, which could materially impact the pro forma market value of the Company or the trading market values of insurance company stocks in general. Therefore, the Valuation Range provided herein may be subject to a more current re-evaluation, if necessary and required, prior to the actual completion of the Conversion.
In addition to the comparative operating fundamentals discussed in prior chapters, it is important to address additional market value adjustments based on certain financial and other criteria, which include, among other factors:
(1) Earnings Prospects
(2) Management
(3) Liquidity of the Issue
(4) Dividend Policy
(5) Subscription Interest
(6) Stock Market Conditions
(7) New Issue Discount
Earnings Prospects
Earnings prospects are dependent upon the ability to grow revenue and control expenses, and the effectiveness of managing the combined ratio (ratio of loss and underwriting expenses to net premiums earned). ECM’s revenue is generated primarily from net premiums earned, net investment income, and net realized investment gains or losses. The Company’s expenses mainly comprise losses and settlement expenses, policy acquisition costs, and other general corporate expenses. The Company’s revenue growth is affected by various factors, including competitive pricing, agency relationships, product strategy, business development, customer service and client retention, reinsurance arrangements, and investment performance. ECM’s operating efficiency affects the degree to which it can profitably leverage its distribution system and cost infrastructure.
Many of the earnings challenges faced by the Company are systemic to smaller insurers that lack economies of scale, diverse distribution channels, significant geographic diversity, or enhanced technological resources. ECM was able to address many of these challenges with the recent acquisition of ARIC, which expanded its geographic footprint and furthered its “narrow but deep” focus on the farm/agriculture niche market. The Company also plans to expand its state licenses for its various insurance subsidiary carriers to provide more operating flexibility. Currently ongoing initiatives at ECM are centered on upgrading its infrastructure and completing the integration of ARIC with the goal of developing a more unified and efficient policy and claims management system, agency compensation structure, and proprietary automobile product offerings.
34
FELDMAN FINANCIAL ADVISORS, INC.
ECM’s earnings in 2023 were impacted by weather-related losses and rebounded in 2024 due to solid underwriting profits and significant contributions from net realized securities gains. The Company’s expense ratio has continued to climb due to its business expansion. In addition, ECM’s profitability continues to be constrained by reinsurance costs, interest expense on surplus notes, and goodwill amortization expense. The Company’s consolidated GAAP ROA of 2.17% was lower than the Comparative Group’s median ROA of 2.93% in 2024, and its consolidated GAAP ROE of 8.73% further lagged the Comparative Group’s median ROE of 13.47%. The uncertainties surrounding the ultimate success of the Company’s recent and future strategic initiatives to increase revenue, expand its market penetration in targeted states, and improve profitability in its narrow market niche place the Company at a disadvantage with regard to the Comparative Group, which overall is reporting higher levels of earnings. We therefore believe that, given the Company’s recent earnings trends and the limited ability to generate substantial improvements in its profitability over the near term, a downward adjustment is warranted for the Company’s earnings prospects with respect to the Comparative Group.
Management
Management’s principal challenges are to implement strategic objectives, generate premium revenue growth, control operating costs, and monitor asset quality and underwriting risks while ECM competes in the highly competitive P&C insurance industry. The challenges facing the Company in attempting to sustain improvements in profitability and enhance its competitiveness are paramount because of the inherent competitive disadvantages faced by smaller insurers in general.
We believe that investors would take into account that ECM is professionally managed by a team of experienced insurance executives that has focused on the Company’s traditional market niche and emphasized its historical operating strengths in attempting to grow revenues and improve profitability. We also note that investors will likely rely upon top-line premium growth, bottom-line earnings results, and the ongoing progress of strategic capital deployment as the means of evaluating the future performance of management. Based on these considerations, we believe no adjustment is warranted based on management.
Liquidity of the Issue
All ten members of the Comparative Group are traded on major stock exchanges. Five companies are listed on the NASDAQ Stock Market and five are traded on the New York Stock Exchange. As of September 17, 2025, the market capitalizations of the Comparative Group reflected a median of $762.6 million and ranged from $191.5 million for Kingstone Companies to approximately $1.9 billion each for Horace Mann Educators Corporation and Skyward Specialty Insurance Group. In contrast, the median market capitalization for the Public P&C Insurance Group was higher at approximately $2.3 billion as of September 17, 2025. Additionally, we note that the common stock of Old Republic is traded on the New York Stock Exchange and had an aggregate total market capitalization of $9.5 billion as of September 17, 2025.
The
development of a public market having the desirable characteristics of depth, liquidity, and orderliness depends on the presence in the
marketplace of a sufficient number of willing buyers and sellers at any given time and the existence of market makers to facilitate stock
trade transactions. Given the estimated range of the Company’s pro forma market value and the presence of several other smaller
insurance companies in the Comparative Group that are publicly traded and also operate in the P&C insurance sector, we believe that
it is reasonable to believe that an established market for the Company’s stock could develop, assuming that it would continually
meet listing requirements. Therefore, we believe that no adjustment is necessary for stock liquidity.
35
FELDMAN FINANCIAL ADVISORS, INC.
Dividend Policy
Payment of cash dividends is commonplace among publicly traded insurance companies with solid capital levels. Of the ten members of the Comparative Group, seven currently pay regular cash dividends. Of the 55 companies in the Public P&C Insurance Group, 34 (or approximately 62%) currently pay regular cash dividends. The median and mean dividend yields of the Comparative Group were 2.33% and 2.21%, respectively, as of September 17, 2025. The median and mean dividend yields of the Public P&C Insurance Group were 0.77% and 1.23%, respectively, as of September 17, 2025. (Old Republic currently pays regular quarterly dividends and had a dividend yield of 2.96% as of September 17, 2025.) ECM would experience an increased capital base following the Conversion and exhibit improved dividend-paying capacity. Therefore, we have concluded that no adjustment would be warranted for purposes of dividend policy.
Subscription Interest
While mutual-to-stock conversions are commonplace in the savings institution industry, such conversions are less common in the insurance industry. In past years, IPOs of savings institution stocks have attracted a great deal of investor interest and this speculative fervor continued through 2024 and 2025. In contrast, over the past decade, there have been only a handful of insurance company demutualization transactions utilizing a subscription rights offering (including stand-alone offerings or sponsor-affiliation transactions), and the subscription interest has been very moderate. In connection with the Conversion, subscription rights will be offered to policyholders of ECM and the Company’s directors, officers, and employees. At the present time, we are not aware of any particular marketing factors or transaction circumstances that would suggest either an overwhelming or suppressed level of interest in purchasing shares by eligible subscribers. Therefore, we do not believe that any additional adjustment is necessary at this time.
Stock Market Conditions
Table 11 summarizes the recent performance of various insurance stock indexes along with broader market indexes. The S&P U.S. Broad Market Index (“BMI”) Insurance of all publicly traded insurance companies decreased 0.7% over the past one-year period through September 17, 2025, and the S&P 500 Property & Casualty Index declined 1.0% over the corresponding period. In contrast, the S&P 500 Index advanced by 17.1% over the past year through September 30, 2025. Over the past three years ended September 17, 2025, the S&P BMI Insurance Index was up 50.3%, while the S&P 500 Index increased 70.4%.
U.S. equity markets experienced increased volatility in the first half of 2025. The first quarter was weak for the broader market, and the second quarter saw a strong recovery. Market turbulence emerged in February 2025 that pushed stock prices lower and created tremendous volatility. The S&P 500 Index reached an all-time high in February 2025, but investor sentiment shifted sharply thereafter due to concerns about (1) the lofty prices of big technology stocks, (2) the possibility of slower economic growth, and (3) repercussions related to trade policy and tariffs. U.S. economic data pointed to a slowing economy and weakening consumer confidence. Despite rising tariffs, inflation eased from 3.0% to 2.7% year-over-year. Against this backdrop, the S&P 500 Index reached an all-time high in the first half of 2025 and persisted in attaining record highs through September 2025. Investor enthusiasm for artificial intelligence-related stocks, easing trade tensions, and the likelihood of future discount rate reductions by the Federal Reserve helped propel the market’s returns in the third quarter of 2025. Nevertheless, many stock research analysts have lowered their earnings forecasts for future quarters. The combination of a rising stock market and declining earnings estimates has left the S&P 500 Index at 22.4 times forward earnings, an expensive valuation level that has historically led to market declines in the next year.
36
FELDMAN FINANCIAL ADVISORS, INC.
Table 11
Selected Stock Market Index Performance
For the Period Ended September 17, 2025
| Index | Percent Change (%) | |||||||||||||||||||
| Value | Year- | One | Two | Three | ||||||||||||||||
| 9/17/25 | to-Date | Year | Years | Years | ||||||||||||||||
| Overall Market Indexes | ||||||||||||||||||||
| S&P 500 | 6,600.35 | 12.22 | 17.14 | 48.31 | 70.40 | |||||||||||||||
| S&P 400 Mid Cap | 3,266.27 | 4.66 | 6.38 | 27.22 | 37.22 | |||||||||||||||
| S&P 500 Financials | 897.49 | 11.57 | 19.46 | 55.50 | 63.94 | |||||||||||||||
| Insurance Market Indexes | ||||||||||||||||||||
| S&P U.S. Broad Market Index Insurance | 452.17 | 1.28 | (0.69 | ) | 32.37 | 50.33 | ||||||||||||||
| S&P 500 Insurance | 808.06 | 1.27 | (1.89 | ) | 32.16 | 48.95 | ||||||||||||||
| Insurance Sector Indexes | ||||||||||||||||||||
| S&P 500 Property & Casualty Insurance | 1,359.53 | 3.61 | (1.02 | ) | 53.63 | 67.30 | ||||||||||||||
| S&P 500 Life & Health Insurance | 556.18 | (0.69 | ) | (1.81 | ) | 21.27 | 29.47 | |||||||||||||
| Insurance Market Cap Indexes | ||||||||||||||||||||
| S&P U.S. LargeCap Insurance | 1,352.64 | (1.21 | ) | (4.28 | ) | 27.22 | 46.39 | |||||||||||||
| S&P U.S. MidCap Insurance | 1,897.61 | 3.80 | 0.48 | 38.54 | 56.38 | |||||||||||||||
| S&P U.S. SmallCap Insurance | 882.46 | 2.50 | 4.82 | 32.39 | 48.00 | |||||||||||||||
Source: S&P Global.
Although insurance stocks underperformed during the past year, the sector has participated in the longer-term rally over the past three years, benefiting from improved market conditions. Insurance premiums have been on the rise and the higher interest rate environment has helped insurance companies generate strong returns on the premiums they are collecting. Increased merger and acquisition activity among insurance companies has provided additional support for improved market valuations. Strengthening fundamentals in the insurance industry have included fortified capital positions, improved product pricing, and increased demand for products as consumers and businesses accumulated additional cash flow in the rebounding economy.
37
FELDMAN FINANCIAL ADVISORS, INC.
While earnings of P&C insurers historically have been very volatile due to cyclical market conditions and catastrophic losses, the stock performance of these insurers has evidenced lesser volatility. The industry’s improved capital position provides a solid buffer against catastrophic losses. The valuation support for many P&C companies will focus on incremental additions to book value from stable earnings and capital deployment strategies such as leverage, mergers, dividend payments, and share repurchases to provide price momentum going forward. While encountering short-term resistance to premium rate increases, the industry may be poised to experience margin expansion. Although a more competitive pricing environment is expected to impact insurers’ ability to raise premium rates, the overall operating climate is projected to remain stable, and therefore, we believe no specific adjustment is necessary for stock market conditions.
New Issue Discount
A “new issue” discount that reflects investor concerns and investment risks inherent in all IPOs is a factor to be considered for purposes of valuing companies converting from mutual to stock form. The magnitude of the new issue discount typically narrows during periods of declining stock prices and expands during stronger market conditions as existing trading companies appreciate in value. The necessity to build a new issue discount into the stock price of a converting insurance company continues to prevail in recognition of the uncertainty among investors as a result of the lack of a seasoned trading history for the converting company, its operation in an intensely competitive industry, underlying concerns regarding the interest rate outlook and sustainable economic trends, recent volatility in the stock market, and the ever-changing landscape of competitors and product marketing in the insurance marketplace.
Because a mutual-to-stock conversion transaction results in an infusion of additional capital, the new issue discount is most often reflected in the form of relative discounts to the pro forma price-to-book value ratio. The pro forma equity of the converting company includes the existing equity plus the net proceeds from the mutual-to-stock conversion. Pricing a new conversion offering at a relatively high ratio in relation to pro forma book value, because of the mathematics of the calculation, would require very large increases in valuations resulting in unsustainable price-to-earnings (“P/E”) ratios and marginal returns on equity. Given ECM’s existing capitalization, it will be confronted with the challenges of managing and deploying the excess capital to generate competitive returns on equity.
Past experiences of insurance mutual-to-stock demutualizations confirm the applicability of the new issue discount. Table 12 summarizes the pro forma offering valuations and results in subscription-based insurance company demutualizations over the past 30 years. The pro forma price-to-book value (“P/B”) ratios in these transactions ranged from 45.2% to 61.6% at the midpoint of the respective midpoint offering values with a median pro forma P/B ratio of 54.2% and an average pro forma P/B ratio of 53.4%. The pro forma price-to-tangible book value (“P/TB”) ratios in these transactions at the midpoint offering values reflected a median pro forma P/TB ratio of 54.4% and an average pro forma P/TB ratio of 53.2%.
Three of the transactions shown in Table 12 involved sponsored demutualizations wherein an acquirer was the standby investor to infuse at least the minimum offering amount as capital into the converting mutual insurance company in exchange for assuming 100% ownership of the converted company. First Nonprofit Insurance Company (Chicago, Illinois) and ARI Mutual Insurance Company (Newtown, Pennsylvania) completed sponsored demutualizations in 2013 and 2016, respectively, with AmTrust Financial Services as the sponsoring stock acquirer. Standard Mutual Insurance Company (Springfield, Illinois) completed its sponsored demutualization in 2016 with National General Holdings Corporation as the sponsoring stock acquirer.
38
FELDMAN FINANCIAL ADVISORS, INC.
Table 12
Subscription-Based Insurance Company Demutualizations
| Holding Company | Insurance Company | St. | Date Offering Completed | Total Assets ($Mil.) | Pro Forma Midpoint Offering Value ($Mil.) | Closing Offering Amount ($Mil.) | Pre-Conv.
Total Equity ($Mil.) | Pro
Forma Midpoint P/B Ratio (%) | Pro
Forma Midpoint P/TB Ratio (%) | |||||||||||||||||||||
| Median -- All Demutualization Transactions | $ | 111.5 | $ | 40.0 | $ | 36.5 | $ | 36.2 | 54.2 | 54.4 | ||||||||||||||||||||
| Average -- All Demutualization Transactions | 153.9 | 48.0 | 46.3 | 43.7 | 53.4 | 53.2 | ||||||||||||||||||||||||
| Median -- Sponsored Conversions | 127.9 | 28.0 | 23.8 | 25.0 | 54.4 | 54.8 | ||||||||||||||||||||||||
| Average -- Sponsored Conversions | 133.1 | 36.3 | 30.9 | 35.6 | 54.2 | 54.7 | ||||||||||||||||||||||||
| Forge Group, Inc. | Amalgamated Casualty Ins. Co. | DC | 03/11/22 | 88.3 | 20.0 | 20.5 | 43.3 | 45.2 | 49.7 | |||||||||||||||||||||
| Vericity, Inc. | Fidelity Life Association | IL | 08/17/19 | 666.4 | 175.0 | 148.8 | 196.2 | 50.9 | 51.2 | |||||||||||||||||||||
| Positive Physicians Holdings (1) | Positive Physicians Ins. Exch. | PA | 03/27/19 | 67.2 | 42.0 | 36.5 | 17.5 | 52.8 | 52.8 | |||||||||||||||||||||
| Professional Casualty Assn. | PA | 39.6 | 13.9 | 50.8 | 50.8 | |||||||||||||||||||||||||
| Physicians’ Ins. Program Exch. | PA | 26.6 | 12.3 | 49.8 | 49.8 | |||||||||||||||||||||||||
| Federal Life Group, Inc. | Federal Life Insurance Company | IL | 12/11/18 | 257.6 | 40.0 | 35.3 | 36.2 | 55.1 | 55.1 | |||||||||||||||||||||
| ICC Holdings, Inc. | Illinois Casualty Company | IL | 03/24/17 | 123.4 | 32.0 | 35.0 | 30.2 | 55.9 | 55.9 | |||||||||||||||||||||
| SPCI Holdings, Inc. (2) | Standard Mutual Ins. Company | IL | 10/07/16 | 67.4 | 24.0 | 20.4 | 21.3 | 54.8 | 54.8 | |||||||||||||||||||||
| ARI HoldCo (3) | ARI Mutual Insurance Company | PA | 01/22/16 | 127.9 | 28.0 | 23.8 | 25.0 | 54.4 | 54.4 | |||||||||||||||||||||
| Mutual Insurers Holding Co. (3) | First Nonprofit Insurance Co. | IL | 05/13/13 | 204.0 | 57.0 | 48.5 | 60.5 | 53.4 | 55.0 | |||||||||||||||||||||
| Penn Millers Holding Corp. | Penn Millers Insurance Company | PA | 10/19/09 | 219.6 | 51.0 | 54.4 | 54.8 | 55.0 | 55.0 | |||||||||||||||||||||
| Eastern Insurance Holdings (4) | Educators Mutual Life Ins. Co. | PA | 06/16/06 | 111.2 | 65.0 | 74.8 | 62.1 | 55.8 | 55.8 | |||||||||||||||||||||
| Fremont Michigan InsuraCorp | Fremont Mutual Insurance Co. | MI | 10/18/04 | 60.1 | 8.0 | 8.6 | 8.2 | 50.8 | 50.8 | |||||||||||||||||||||
| Mercer Insurance Group, Inc. | Mercer Mutual Insurance Co. | NJ | 12/15/03 | 111.5 | 49.0 | 56.4 | 38.2 | 61.6 | NA | |||||||||||||||||||||
| Old Guard Group, Inc. | Old Guard Mutual Ins. Company | PA | 02/01/97 | 137.1 | 33.6 | 39.6 | 36.4 | 54.2 | NA | |||||||||||||||||||||
| (1) | Transaction involved a simultaneous conversion and merger of the three mutual insurance companies. |
| (2) | Sponsored demutualization that involved merger into National General Holdings Corporation. |
| (3) | Sponsored demutualization that involved merger into AmTrust Financial Services. |
| (4) | Transaction involved the simultaneous acquisition of Eastern Holding Company and its insurance company subsidiaries. |
Source: S&P Global; Securities and Exchange Commission.
39
FELDMAN FINANCIAL ADVISORS, INC.
Adjustments Conclusion
We believe that ECM’s consolidated pro forma market value should be discounted relative to the Comparative Group because of earnings prospects and the new issue discount. Individual discounts and premiums are not necessarily additive and may, to some extent, offset or overlay each other. On the whole, we conclude that the Company’s pro forma market value should be discounted relative to the Comparative Group. It is the role of the appraiser to balance the relative dynamics of P/B and P/E discounts and premiums. We have concluded that a discount of approximately 60% based on the P/B valuation metric is reasonable and appropriate for determining the Company’s pro forma Valuation Range value relative to the Comparative Group’s current P/B trading market ratios. Conversely, the resulting Valuation Range will reflect more comparable ratios to the Comparative Group on the P/E basis and other pricing metrics.
Valuation Approach
In determining the estimated consolidated pro forma market value of the Company, we have employed the comparative market valuation approach and considered the following primary pricing ratios: price-to-book value per share and price-to-earnings per share. Table 13 displays the trading market price valuation ratios of the Comparative Group as of September 17, 2025. Exhibit VI displays the pro forma assumptions and calculations utilized in analyzing the Company’s pro forma valuation ratios on a fully converted basis. In reaching our conclusions of the Valuation Range, we evaluated the relationship of the Company’s pro forma valuation ratios relative to the Comparative Group’s market valuation data.
Investors continue to make decisions to buy or sell P&C insurance company stocks based upon consideration of P/B and P/E comparisons. The P/E ratio is an important valuation ratio in the current insurance stock environment as operating profits have returned to more normalized levels. The P/B ratio remains an important valuation metric because due to applicable regulation, insurers’ ability to write premiums is directly related to their surplus, which is a regulatory proxy for equity capital. Also, insurers are required by regulators to maintain minimum equity capital at levels commensurate with the scope and riskiness of their activities. These regulatory effects make book equity a relatively useful measure of the scale of operations and the P/B ratio is a means of reflecting qualitative evaluations regarding factors such as solvency risk, potential growth, pricing capacity, expected returns on equity, and efficient capital utilization.
As of September 17, 2025, the median P/B ratio for the Comparative Group was 143.8% and the mean P/B ratio was 144.9%. In consideration of the foregoing analysis, along with the additional adjustments discussed in this chapter, we have determined a pro forma midpoint P/B ratio of 58.8% for ECM on a consolidated basis, which reflects an aggregate midpoint value of $180.0 million based on the assumptions summarized in Exhibit VI. Applying a range of value of 15% above and below the midpoint, the resulting minimum of the Valuation Range at $153.0 million reflects a P/B ratio of 54.8% and the resulting maximum of $207.0 million reflects a P/B ratio of 62.1%.
The Company’s pro forma P/B valuation ratios reflect discounts to the Comparative Group’s median P/B ratio of 145.9%, with the magnitude of the P/B discount measuring 57.4% at ECM’s maximum valuation, 59.7% at the midpoint valuation, and 62.4% at the minimum valuation. In our opinion, this range of discounts for the P/B valuation metric is appropriate to reflect the differences in operating fundamentals discussed in Chapter III and the aforementioned adjustments specified for earnings prospects and the new issue discount.
In addition, we also took into consideration the low returns on equity that would be anticipated in the near term by the Company on a pro forma basis as its capital ratios reach higher levels after the Conversion ranging from a 42.5% pro forma equity-to-assets ratio at the minimum valuation to 44.8% at the midpoint valuation and 46.9% at the maximum valuation. The Company’s range of pro forma equity-to-assets ratios would significantly surpass the Comparative Group’s corresponding median of 22.4% and the Public P&C Insurance Group’s median of 22.4%, and measure higher than every equity-to-assets ratio represented among the Comparative Group.
40
FELDMAN FINANCIAL ADVISORS, INC.
The minimum of the Valuation Range at $153.0 million reflects a P/TB ratio of 59.9% and the resulting maximum of $207.0 million reflects a P/TB ratio of 66.9%. The Company’s pro forma P/TB ratios are higher than its P/B ratios because of the goodwill on the Company’s balance sheet, which results in a lower level of pro forma tangible equity versus pro forma total equity. The Company’s pro forma P/TB valuation ratios reflect discounts to the Comparative Group’s median P/B ratio of 158.3%, with the magnitude of the discount measuring 57.7% at ECM’s maximum valuation, 59.8% at the midpoint valuation, and 62.2% at the minimum valuation.
Other non-equity related market valuation ratios reflect lesser discounts or actual premiums accorded to the Company on a pro forma basis relative to the Comparative Group. Based on the Valuation Range as indicated above, the Company’s pro forma P/E ratios based on LTM earnings through December 31, 2024 reflected values of 10.0x at the minimum, 11.2x at the midpoint, and 12.3x at the maximum.
As shown in Exhibit VI-2, pro forma earnings include historical earnings plus the estimated return on net proceeds from the Conversion. The Company’s pro forma P/E ratios at the midpoint and maximum of the Valuation Range are positioned above the Comparative Group’s median ratio of 10.7x. The Company’s pro forma P/E ratios reflect premiums of 4.6% and 14.8% at the midpoint and maximum, respectively, to the Comparative Group’s median P/E ratio of 10.7x, while the Company’s pro forma P/E of 10.0x at the minimum reflects a discount of 6.6%.
On an operating earnings basis, which excludes net realized securities gains, the Company’s pro forma operating P/E ratios reflect higher ratios of 14.0x, 15.4x, and 16.6x at the minimum, midpoint, and maximum, respectively, versus the Comparative Group’s median operating P/E ratio of 10.9x. The Company’s pro forma price-to-total revenue ratio of 0.94x at the midpoint is similar to the Comparative Group’s median of 0.96x. The minimum and maximum of the Valuation Range reflect pro forma price-to-total revenue ratios of 0.80x and 1.08x, respectively.
Valuation Conclusion
It is our opinion that, as of September 17, 2025, the aggregate estimated consolidated pro forma market value of ECM was $180,000,000 with a resulting Valuation Range of $153,000,000 to $207,000,000. The Valuation Range was based upon a 15% decrease from the midpoint of $180,000,000 to determine the minimum and a 15% increase to establish the maximum. Exhibits VI-1 and IV-2 present the assumptions and calculations utilized in determining the Company’s estimated consolidated pro forma market value and corresponding pro forma valuation ratios.
41
FELDMAN FINANCIAL ADVISORS, INC.
Table 13
Comparative Market Valuation Analysis
Everett Cash Mutual Insurance Company and the Comparative Group
Market Price Data as of September 17, 2025
| Company | Closing
Price 9/17/25 ($) | Total
Assets ($Mil.) | Total
Market Value ($Mil.) | Price/
Book Value (%) | Price/
Tang. Book (%) | Price/
LTM EPS (x) | Price/
Oper. EPS (x) | Price/
Total Revenue (x) | Price/
Total Assets (%) | Total
Equity/ Assets (%) | Current
Div. Yield (%) | |||||||||||||||||||||||||||||||||
| Everett Cash Mutual Insurance Company | ||||||||||||||||||||||||||||||||||||||||||||
| Pro Forma Minimum | NA | 656.6 | 153.0 | 54.8 | 59.9 | 9.97 | 13.98 | 0.80 | 23.30 | 42.53 | 0.00 | |||||||||||||||||||||||||||||||||
| Pro Forma Midpoint | NA | 683.6 | 180.0 | 58.8 | 63.7 | 11.17 | 15.37 | 0.94 | 26.33 | 44.80 | 0.00 | |||||||||||||||||||||||||||||||||
| Pro Forma Maximum | NA | 710.6 | 207.0 | 62.1 | 66.9 | 12.26 | 16.58 | 1.08 | 29.13 | 46.90 | 0.00 | |||||||||||||||||||||||||||||||||
| Comparative Group Median | NA | 2,906.3 | 762.6 | 145.9 | 158.3 | 10.68 | 10.85 | 0.96 | 27.90 | 22.40 | 2.33 | |||||||||||||||||||||||||||||||||
| Comparative Group Mean | NA | 3,790.7 | 908.2 | 146.2 | 159.4 | 10.70 | 10.82 | 1.00 | 30.83 | 23.59 | 2.21 | |||||||||||||||||||||||||||||||||
| Public P&C Insurance Median | NA | 6,069.3 | 2,308.4 | 159.3 | 172.9 | 13.03 | 12.74 | 1.15 | 40.03 | 22.40 | 0.77 | |||||||||||||||||||||||||||||||||
| Public P&C Insurance Mean | NA | 47,643.9 | 18,177.8 | 197.8 | 211.1 | 13.49 | 14.75 | 1.63 | 54.62 | 25.48 | 1.23 | |||||||||||||||||||||||||||||||||
| Comparative Group | ||||||||||||||||||||||||||||||||||||||||||||
| American Coastal Insurance Corp. | 11.13 | 1,346.9 | 542.8 | 185.6 | 237.8 | 6.83 | 6.87 | 1.68 | 40.30 | 21.70 | 0.00 | |||||||||||||||||||||||||||||||||
| Employers Holdings, Inc. | 42.24 | 3,543.3 | 974.1 | 92.6 | 98.4 | 10.30 | 12.76 | 1.10 | 27.49 | 30.57 | 3.09 | |||||||||||||||||||||||||||||||||
| Global Indemnity Group, LLC | 29.73 | 1,720.6 | 312.2 | 61.5 | 63.2 | 15.03 | 14.72 | 0.71 | 18.14 | 40.41 | 4.67 | |||||||||||||||||||||||||||||||||
| Heritage Insurance Holdings, Inc. | 24.87 | 2,536.8 | 717.9 | 201.3 | 220.4 | 7.17 | 7.13 | 0.85 | 28.30 | 15.11 | 0.00 | |||||||||||||||||||||||||||||||||
| Horace Mann Educators Corporation | 45.76 | 14,728.3 | 1,859.0 | 137.4 | 161.4 | 13.54 | 10.15 | 1.13 | 12.62 | 9.24 | 3.06 | |||||||||||||||||||||||||||||||||
| Kingstone Companies, Inc. | 13.54 | 393.4 | 191.5 | 201.8 | 202.8 | 6.77 | 7.20 | 1.03 | 48.67 | 24.12 | 1.47 | |||||||||||||||||||||||||||||||||
| Safety Insurance Group, Inc. | 71.72 | 2,364.2 | 1,068.2 | 122.3 | 125.8 | 12.56 | 15.04 | 0.89 | 45.18 | 36.94 | 5.14 | |||||||||||||||||||||||||||||||||
| Skyward Specialty Insurance Group | 46.74 | 4,336.4 | 1,892.3 | 210.3 | 233.3 | 14.70 | 14.16 | 1.51 | 43.64 | 20.75 | 0.00 | |||||||||||||||||||||||||||||||||
| United Fire Group, Inc. | 31.67 | 3,661.1 | 807.3 | 95.5 | 95.9 | 9.02 | 8.65 | 0.61 | 22.05 | 23.10 | 2.06 | |||||||||||||||||||||||||||||||||
| Universal Insurance Holdings, Inc. | 25.30 | 3,275.8 | 716.5 | 154.4 | 155.2 | 11.05 | 11.55 | 0.46 | 21.87 | 13.98 | 2.60 | |||||||||||||||||||||||||||||||||
Source: Everett Cash Mutual Insurance Company; S&P Global; Feldman Financial Advisors, Inc.
42
FELDMAN FINANCIAL ADVISORS, INC.
Exhibit I
Background of Feldman Financial Advisors, Inc.
Overview of Firm
Feldman Financial Advisors provides consulting and advisory services to financial services companies in the areas of corporate valuations, mergers and acquisitions, strategic planning, regulatory business and capital plans, and expert witness testimony and analysis. Our senior staff members have been involved in the mutual-to-stock conversion valuation process since 1982 and have valued more than 350 converting financial institutions.
Feldman Financial Advisors was incorporated in February 1996 by a group of consultants who were previously associated with Credit Suisse First Boston and Kaplan Associates. Each of the officers of Feldman Financial Advisors has over 40 years of experience in consulting to financial institutions and financial services companies. Our senior staff collectively has worked with more than 1,000 commercial banks, savings institutions, mortgage companies, and insurance companies nationwide. The firm’s office is located in McLean, Virginia.
Background of Senior Professional Staff
Trent Feldman – President. Trent is a co-founder of Feldman Financial Advisors and a nationally recognized expert in providing strategic advice to and valuing financial service companies, and advising on mergers and acquisitions. Trent was previously with Kaplan Associates for 14 years and was one of three founding principals at that firm. Trent also has worked at the Federal Home Loan Bank Board and with the California state legislature. Trent holds Bachelor’s and Master’s degrees from the University of California, Los Angeles.
Peter Williams – Principal. Peter is a co-founder of Feldman Financial Advisors and specializes in merger and acquisition analysis, mutual-to-stock conversion valuations, other types of corporate valuations, strategic business plans, and fair market valuation analysis. Peter was previously with Kaplan Associates for 13 years. Peter also worked as a Corporate Planning Analyst with the Wilmington Trust Company in Delaware. Peter holds a B.A. in Economics from Yale University and an M.B.A. in Finance and Investments from The George Washington University.
I-1
FELDMAN FINANCIAL ADVISORS, INC.
Exhibit II
Statement of Contingent and Limiting Conditions
This Appraisal is made subject to the following general contingent and limiting conditions:
| 1. | The analyses, opinions, and conclusions presented in this Appraisal apply to this engagement only and may not be used out of the context presented herein. This Appraisal is valid only for the effective date specified herein and only for the purpose specified herein. |
| 2. | Neither all nor any part of the contents of this Appraisal is to be referred to or quoted in any registration statement, prospectus, public filing, loan agreement, or other agreement or document without our prior written approval. In addition, our Appraisal and analysis are not intended for general circulation or publication, nor are they to be reproduced or distributed to other third parties without our prior written consent. |
| 3. | Neither our Appraisal nor our valuation conclusion is to be construed as a fairness opinion as to the fairness of an actual or proposed transaction, a solvency assessment, or an investment recommendation. For various reasons, the price at which the subject interest might be sold in a specific transaction between specific parties on a specific date might be significantly different from the valuation conclusion expressed herein. |
| 4. | Our analysis assumes that as of the effective valuation date, the Company and its assets will continue to operate as a going concern. Furthermore, our analysis is based on the past and present financial condition of the Company and its assets as of the effective valuation date. |
| 5. | We assume no responsibility for legal matters including interpretations of the law, contracts, or title considerations. We assume that the subject assets, properties, or business interests are appraised free and clear of any or all liens or encumbrances unless otherwise stated. |
| 6. | We assume that there is full compliance with all applicable federal, state, and local regulations and laws unless the lack of compliance is stated, defined, and considered in the Appraisal. |
| 7. | We do not express an opinion or any other form of assurance on the reasonableness of management’s projections reviewed by us or on the underlying assumptions. |
| 8. | We assume responsible ownership and competent management with respect to the subject assets, properties, or business interests. |
| 9. | The information furnished by others is believed to be reliable. However, we issue no warranty or other form of assurance regarding its accuracy. |
II-1
FELDMAN FINANCIAL ADVISORS, INC.
Exhibit III-1
Everett Cash Mutual Insurance Company
Consolidated Balance Sheets
As of December 31, 2023 and 2024
(Dollars in Thousands)
| December 31, | ||||||||
| 2024 | 2023 | |||||||
| Assets | ||||||||
| Bonds | $ | 174,581 | $ | 158,506 | ||||
| Common stocks | 40,255 | 42,522 | ||||||
| Real estate, net | 640 | 665 | ||||||
| Cash, cash equivalents, and short-term investments | 23,616 | 21,690 | ||||||
| Investment in ARIC | - | 4,558 | ||||||
| Other invested assets | 1,759 | 1,591 | ||||||
| Total investments and cash | 240,851 | 229,532 | ||||||
| Accrued investment income | 1,301 | 1,065 | ||||||
| Uncollected premiums, net | 42,103 | 37,605 | ||||||
| Reinsurance recoverable on unpaid losses and LAE | 85,322 | 95,147 | ||||||
| Reinsurance recoverable on paid losses and LAE | 8,034 | 4,445 | ||||||
| Prepaid reinsurance premiums | 77,136 | 79,458 | ||||||
| Deferred policy acquisition costs | 21,242 | 23,631 | ||||||
| Net deferred tax asset | 8,066 | 8,683 | ||||||
| Goodwill and other intangibles | 23,891 | 27,047 | ||||||
| Other assets | 5,100 | 6,357 | ||||||
| Total Assets | $ | 513,046 | $ | 512,969 | ||||
| Liabilities and Capital and Surplus | ||||||||
| Losses and loss adjustment expenses | $ | 154,142 | $ | 159,375 | ||||
| Unearned premiums | 163,445 | 171,060 | ||||||
| Advance premiums | 4,033 | 3,411 | ||||||
| Ceded reinsurance premiums payable | 7,974 | 5,217 | ||||||
| Commissions payable | 5,210 | 5,534 | ||||||
| Other expenses payable | 5,763 | 2,282 | ||||||
| Net deferred tax liability | 8,759 | 9,539 | ||||||
| Deferred policy acquisition costs | 4,753 | 4,647 | ||||||
| Surplus notes payable | 25,000 | 25,000 | ||||||
| Other liabilities | 3,236 | 2,602 | ||||||
| Total Liabilities | 382,315 | 388,668 | ||||||
| Total Capital and Surplus | 130,731 | 124,301 | ||||||
| Total Liabilities and Capital and Surplus | $ | 513,046 | $ | 512,969 | ||||
Source: Everett Cash Mutual Insurance Company, internal GAAP financial statements.
III-1
FELDMAN FINANCIAL ADVISORS, INC.
Exhibit III-2
Everett Cash Mutual Insurance Company
Consolidated Income Statements
For the Years Ended December 31, 2023 and 2024
(Dollars in Thousands)
| Year
Ended December 31, | ||||||||
| 2024 | 2023 | |||||||
| Direct premiums written | $ | 237,203 | $ | 249,654 | ||||
| Reinsurance assumed | (20 | ) | 4,634 | |||||
| Reinsurance ceded | (69,729 | ) | (76,434 | ) | ||||
| Change in unearned premiums | 5,293 | (18,116 | ) | |||||
| Other income | 4,388 | 4,275 | ||||||
| Net premiums earned | 177,136 | 164,012 | ||||||
| Losses incurred | 98,727 | 111,905 | ||||||
| Loss adjustment expenses incurred | 10,883 | 10,408 | ||||||
| Other underwriting expenses incurred | 56,037 | 33,529 | ||||||
| Other expenses | 5,195 | 4,801 | ||||||
| Total underwriting expenses | 170,842 | 160,643 | ||||||
| Net underwriting gain | 6,293 | 3,369 | ||||||
| Investment income | 8,912 | 7,258 | ||||||
| Net realized capital gains, net of taxes | 4,402 | 780 | ||||||
| Investment expenses | (1,193 | ) | (1,050 | ) | ||||
| Interest expense | (1,813 | ) | (1,207 | ) | ||||
| Surplus note origination costs | - | (723 | ) | |||||
| Depreciation on real estate | (46 | ) | (46 | ) | ||||
| Net investment gain | 10,263 | 5,013 | ||||||
| Other income, net | 623 | 436 | ||||||
| Goodwill amortization expense | (3,156 | ) | (3,156 | ) | ||||
| Net other income (expense) | (2,532 | ) | (2,719 | ) | ||||
| Net income before income tax expense | 14,024 | 5,662 | ||||||
| Federal income tax expense | 2,898 | 2,547 | ||||||
| Net income | $ | 11,126 | $ | 3,115 | ||||
Source: Everett Cash Mutual Insurance Company, internal GAAP financial statements.
III-2
FELDMAN FINANCIAL ADVISORS, INC.
Exhibit III-3
Everett Cash Mutual Insurance Company
Consolidated Investments and Cash Portfolio
As of December 31, 2023 and 2024
(Dollars in Thousands)
| December 31, | ||||||||||||||||
| 2024 | 2023 | |||||||||||||||
| Investment and Cash Category | Amount (000s) | Percent (%) | Amount (000s) | Percent (%) | ||||||||||||
| Cash, cash equivalents, and short-term investments | $ | 23,616 | 9.81 | $ | 21,690 | 9.45 | ||||||||||
| Bonds, at statement value: | ||||||||||||||||
| U.S. Government obligations | 28,375 | 11.78 | 28,062 | 12.23 | ||||||||||||
| U.S. states, territories, and possessions | 26,843 | 11.15 | 28,887 | 12.59 | ||||||||||||
| U.S. political subdivision of states, territories, and possessions | 2,032 | 0.84 | 1,874 | 0.82 | ||||||||||||
| U.S. special revenue | 2,460 | 1.02 | 2,468 | 1.08 | ||||||||||||
| Industrial and miscellaneous | 114,777 | 47.65 | 97,111 | 42.31 | ||||||||||||
| Mortgage-backed securities | 93 | 0.04 | 104 | 0.05 | ||||||||||||
| Total bonds | 174,581 | 72.49 | 158,506 | 69.06 | ||||||||||||
| Common stocks, at fair value or carrying value: | ||||||||||||||||
| Unaffiliated companies | 38,372 | 15.93 | 40,861 | 17.80 | ||||||||||||
| Affiliated companies | 1,883 | 0.78 | 6,218 | 2.71 | ||||||||||||
| Total common stocks | 40,255 | 16.71 | 47,080 | 20.51 | ||||||||||||
| Real estate, net | 640 | 0.27 | 665 | 0.29 | ||||||||||||
| Other invested assets | 1,759 | 0.73 | 1,591 | 0.69 | ||||||||||||
| Total investments and cash | $ | 240,851 | 100.00 | $ | 229,532 | 100.00 | ||||||||||
Source: Everett Cash Mutual Insurance Company, internal financial data.
III-3
FELDMAN FINANCIAL ADVISORS, INC.
Exhibit IV-1
Everett Cash Mutual Insurance Company
Unconsolidated Statutory Financial Data
For the Years Ended December 31, 2021 to 2024 and YTD Ended June 30, 2025
(Dollars in Thousands)
| Period Ended | YTD
6/30/25 | Year
12/31/24 | Year
12/31/23 | Year
12/31/22 | Year
12/31/21 | |||||||||||||||
| Balance Sheet Summary | ||||||||||||||||||||
| Total Cash and Investments | $ | 206,563 | $ | 217,181 | $ | 201,875 | $ | 184,720 | $ | 176,509 | ||||||||||
| Total Assets | 273,443 | 265,835 | 244,929 | 216,359 | 196,229 | |||||||||||||||
| Loss Reserves | 58,375 | 51,198 | 47,287 | 37,029 | 32,420 | |||||||||||||||
| Loss Adjustment Expense Reserves | 10,575 | 8,773 | 8,080 | 5,569 | 4,528 | |||||||||||||||
| Total Loss and LAE Reserves | 68,950 | 59,971 | 55,368 | 42,598 | 36,948 | |||||||||||||||
| Unearned Premium Reserve | 75,944 | 68,329 | 71,582 | 60,537 | 41,632 | |||||||||||||||
| Total Liabilities | 160,442 | 148,949 | 141,516 | 122,211 | 86,193 | |||||||||||||||
| Surplus Notes | 25,000 | 25,000 | 25,000 | 10,000 | 10,000 | |||||||||||||||
| Capital and Surplus | 113,001 | 116,886 | 103,413 | 94,148 | 110,036 | |||||||||||||||
| Capital and Surplus / Assets (%) | 41.33 | 43.97 | 42.22 | 43.51 | 56.08 | |||||||||||||||
| Total Reserves / Capital and Surplus (%) | 61.02 | 51.31 | 53.54 | 45.25 | 33.58 | |||||||||||||||
| Income Statement Summary | ||||||||||||||||||||
| Direct Premiums Written | 54,183 | 107,191 | 102,943 | 95,649 | 80,456 | |||||||||||||||
| Net Reinsurance Premiums | 24,928 | 26,197 | 37,930 | 21,280 | 5,325 | |||||||||||||||
| Net Premiums Written | 79,110 | 133,388 | 140,873 | 116,929 | 85,781 | |||||||||||||||
| Net Premiums Earned | 71,496 | 136,640 | 129,829 | 98,024 | 83,086 | |||||||||||||||
| Net Loss and LAE Incurred | 56,489 | 90,148 | 103,855 | 59,290 | 45,777 | |||||||||||||||
| Net Underwriting Expense Incurred | 25,370 | 44,270 | 43,670 | 34,286 | 25,725 | |||||||||||||||
| Policyholder Dividends | 0 | 0 | 0 | 0 | 0 | |||||||||||||||
| Net Underwriting Gain (Loss) | (10,364 | ) | 2,223 | (17,696 | ) | 4,448 | 11,584 | |||||||||||||
| Net Investment Income | 1,769 | 2,747 | 2,273 | 2,723 | 2,589 | |||||||||||||||
| Net Realized Capital Gains (Losses) | 244 | 3,330 | 633 | 618 | 5,053 | |||||||||||||||
| Income Tax Expense | (1,719 | ) | 537 | (3,218 | ) | 2,028 | 2,890 | |||||||||||||
| Net Income | (6,443 | ) | 8,306 | (11,233 | ) | 6,039 | 16,635 | |||||||||||||
| Pre-tax Operating Income | (8,407 | ) | 5,513 | (15,083 | ) | 7,449 | 14,471 | |||||||||||||
| Premiums Written By Segment (%) | ||||||||||||||||||||
| Personal Lines - Direct Premiums Written | 67.69 | 67.95 | 71.01 | 71.81 | NA | |||||||||||||||
| Commercial Lines - Direct Premiums Written | 32.31 | 32.05 | 28.99 | 28.19 | NA | |||||||||||||||
| Personal Lines - Net Premiums Written | NA | 34.07 | 30.61 | 51.19 | NA | |||||||||||||||
| Commercial Lines - Net Premiums Written | NA | 65.93 | 69.39 | 48.81 | NA | |||||||||||||||
IV-1
FELDMAN FINANCIAL ADVISORS, INC.
Exhibit IV-1 (continued)
Everett Cash Mutual Insurance Company
Unconsolidated Statutory Financial Data
For the Years Ended December 31, 2021 to 2024 and YTD Ended June 30, 2025
(Dollars in Thousands)
| Period Ended | YTD
6/30/25 | Year
12/31/24 | Year
12/31/23 | Year
12/31/22 | Year
12/31/21 | |||||||||||||||
| Operating Ratios (%) | ||||||||||||||||||||
| Growth Rate - Direct Premiums Written | (5.91 | ) | 4.13 | 7.63 | 18.88 | 5.23 | ||||||||||||||
| Growth Rate - Net Premiums Written | 10.81 | (5.31 | ) | 20.48 | 36.31 | 6.84 | ||||||||||||||
| Growth Rate - Operating Income | NM | NM | NM | (48.53 | ) | 30.74 | ||||||||||||||
| Loss and LAE Ratio | 79.01 | 65.97 | 79.99 | 60.49 | 55.10 | |||||||||||||||
| Expense Ratio | 32.07 | 33.19 | 31.00 | 29.32 | 29.99 | |||||||||||||||
| Policyholder Dividend Ratio | 0.00 | 0.00 | 0.00 | 0.00 | 0.00 | |||||||||||||||
| Combined Ratio | 111.08 | 99.16 | 110.99 | 89.81 | 85.08 | |||||||||||||||
| Operating Ratio | 108.61 | 97.15 | 109.24 | 87.03 | 81.97 | |||||||||||||||
| Effective Tax Rate | NM | 6.07 | NM | 25.14 | 14.80 | |||||||||||||||
| Net Yield on Invested Assets | 1.66 | 1.32 | 1.17 | 1.56 | 1.55 | |||||||||||||||
| Pre-Tax Operating Margin | (11.44 | ) | 3.94 | (11.39 | ) | 7.37 | 16.83 | |||||||||||||
| Return on Average Equity (C&S) | (11.09 | ) | 7.55 | (11.09 | ) | 5.91 | 16.19 | |||||||||||||
| Pre-Tax Operating ROE | (14.47 | ) | 5.01 | (14.89 | ) | 7.29 | 14.08 | |||||||||||||
| Return on Average Assets | (4.71 | ) | 3.17 | (4.84 | ) | 3.02 | 8.93 | |||||||||||||
| Capital, Leverage & Liquidity (%) | ||||||||||||||||||||
| RBC - Total Adjusted Capital ($000) | NA | 116,886 | 103,413 | 94,148 | 110,036 | |||||||||||||||
| ACL Risk Based Capital ($000) | NA | 19,920 | 21,171 | 15,861 | 11,318 | |||||||||||||||
| Risk Based Capital Ratio (TAC/ACL RBC) | NA | 586.76 | 488.47 | 593.59 | 972.24 | |||||||||||||||
| Net Premiums Written / Average C&S | 136.18 | 121.25 | 139.04 | 114.42 | 83.47 | |||||||||||||||
| Affiliated Investments / Capital & Surplus | 51.40 | 49.38 | 54.79 | 54.80 | 8.23 | |||||||||||||||
| Total Reins. Recoverable Excl. Affiliates / C&S | NA | 32.98 | 31.07 | 8.68 | 0.63 | |||||||||||||||
| Cash & Short-Term Investments / Liabilities | 6.39 | 12.41 | 9.09 | 17.62 | 10.39 | |||||||||||||||
| Reserve Analysis (%) | ||||||||||||||||||||
| Change in Loss & LAE Reserves / Reserves | 29.95 | 8.31 | 29.98 | 15.29 | 13.83 | |||||||||||||||
| Loss & LAE Reserves / Net Premiums Earned | 45.34 | 45.80 | 35.91 | 38.12 | 41.69 | |||||||||||||||
| Investments (%) | ||||||||||||||||||||
| Net Yield on Invested Assets | 1.66 | 1.32 | 1.17 | 1.56 | 1.55 | |||||||||||||||
| Unaffiliated Bonds / Unaffiliated Investments | 72.32 | 70.01 | 70.01 | 62.28 | 62.84 | |||||||||||||||
| Unaff. Preferred Stocks / Unaff. Investments | 0.00 | 0.00 | 0.00 | 0.00 | 0.00 | |||||||||||||||
| Unaff. Common Stocks / Unaff. Investments | 19.76 | 18.04 | 20.55 | 22.35 | 30.48 | |||||||||||||||
| Affiliated Investments / Total Investments | 26.20 | 24.61 | 25.41 | 24.55 | 5.09 | |||||||||||||||
| Gross Yield on Bonds (excluding affiliates) | NA | 2.81 | 2.54 | 2.27 | 2.52 | |||||||||||||||
| Bond Average Asset Quality (#1-6) | NA | 1.11 | 1.10 | 1.11 | 1.14 | |||||||||||||||
| Bonds Rated 3-6 / Total Bonds | NA | 0.00 | 0.00 | 0.00 | 0.47 | |||||||||||||||
| Bonds < 1 Year / Total Bonds | NA | 13.48 | 11.43 | 16.58 | 11.12 | |||||||||||||||
IV-2
FELDMAN FINANCIAL ADVISORS, INC.
Exhibit IV-1 (continued)
Everett Cash Mutual Insurance Company
Unconsolidated Statutory Financial Data
For the Years Ended December 31, 2021 to 2024 and YTD Ended June 30, 2025
(Dollars in Thousands)
| Period Ended | YTD
6/30/25 | Year
12/31/24 | Year
12/31/23 | Year
12/31/22 | Year
12/31/21 | |||||||||||||||
| Assets ($000) | ||||||||||||||||||||
| Bonds | $ | 118,311 | $ | 123,777 | $ | 116,470 | $ | 98,745 | $ | 106,073 | ||||||||||
| Preferred Stocks | 0 | 0 | 0 | 0 | 0 | |||||||||||||||
| Common Stocks | 75,539 | 72,513 | 70,289 | 62,042 | 59,355 | |||||||||||||||
| Cash and Short-term Investments | 10,257 | 18,492 | 12,860 | 21,530 | 8,958 | |||||||||||||||
| Other Investments | 1,826 | 1,759 | 1,591 | 1,711 | 1,403 | |||||||||||||||
| Total Cash and Investments | 206,563 | 217,181 | 201,875 | 184,720 | 176,509 | |||||||||||||||
| Premiums and Considerations Due | 44,792 | 31,037 | 28,066 | 26,215 | 16,714 | |||||||||||||||
| Reinsurance Recoverable | 11,332 | 7,900 | 4,576 | 215 | (2 | ) | ||||||||||||||
| Receivable from Parent, Subsidiary, or Affiliates | 664 | 1,567 | 181 | 0 | 227 | |||||||||||||||
| Other Assets | 10,092 | 8,151 | 10,231 | 5,209 | 2,781 | |||||||||||||||
| Total Assets | $ | 273,443 | $ | 265,835 | $ | 244,929 | $ | 216,359 | $ | 196,229 | ||||||||||
| Liabilities and Equity ($000) | ||||||||||||||||||||
| Loss Reserves | $ | 58,375 | $ | 51,198 | $ | 47,287 | $ | 37,029 | $ | 32,420 | ||||||||||
| Loss Adjustment Expense Reserves | 10,575 | 8,773 | 8,080 | 5,569 | 4,528 | |||||||||||||||
| Total Loss and LAE Reserves | 68,950 | 59,971 | 55,368 | 42,598 | 36,948 | |||||||||||||||
| Unearned Premium Reserve | 75,944 | 68,329 | 71,582 | 60,537 | 41,632 | |||||||||||||||
| Total Reinsurance Liabilities | 7,676 | 8,673 | 5,538 | 11,357 | 66 | |||||||||||||||
| Commissions, Other Expenses, and Taxes Due | 5,839 | 9,716 | 6,297 | 5,122 | 5,076 | |||||||||||||||
| Payable to Parent, Subsidiary, or Affiliates | 0 | 0 | 239 | 4 | 0 | |||||||||||||||
| Other Liabilities | 2,033 | 2,260 | 2,493 | 2,592 | 2,471 | |||||||||||||||
| Total Liabilities | 160,442 | 148,949 | 141,516 | 122,211 | 86,193 | |||||||||||||||
| Surplus Notes | 25,000 | 25,000 | 25,000 | 10,000 | 10,000 | |||||||||||||||
| Unassigned Surplus | 88,001 | 91,886 | 78,413 | 84,148 | 100,036 | |||||||||||||||
| Total Capital and Surplus | 113,001 | 116,886 | 103,413 | 94,148 | 110,036 | |||||||||||||||
| Total Liabilities and Capital and Surplus | $ | 273,443 | $ | 265,835 | $ | 244,929 | $ | 216,359 | $ | 196,229 | ||||||||||
IV-3
FELDMAN FINANCIAL ADVISORS, INC.
Exhibit IV-1 (continued)
Everett Cash Mutual Insurance Company
Unconsolidated Statutory Financial Data
For the Years Ended December 31, 2021 to 2024 and YTD Ended June 30, 2025
(Dollars in Thousands)
| Period Ended | YTD
6/30/25 | Year
12/31/24 | Year
12/31/23 | Year
12/31/22 | Year
12/31/21 | |||||||||||||||
| Underwriting Revenue ($000) | ||||||||||||||||||||
| Direct Premiums Written | $ | 54,183 | $ | 107,191 | $ | 102,943 | $ | 95,649 | $ | 80,456 | ||||||||||
| Net Reinsurance Premiums | 24,928 | 26,197 | 37,930 | 21,280 | 5,325 | |||||||||||||||
| Net Premiums Written | 79,110 | 133,388 | 140,873 | 116,929 | 85,781 | |||||||||||||||
| Change in Unearned Premiums Reserve | (7,615 | ) | 3,252 | (11,044 | ) | (18,905 | ) | (2,695 | ) | |||||||||||
| Net Premiums Earned | 71,496 | 136,640 | 129,829 | 98,024 | 83,086 | |||||||||||||||
| Underwriting Deductions ($000) | ||||||||||||||||||||
| Net Losses Paid | NA | 78,200 | 84,955 | 48,822 | 36,933 | |||||||||||||||
| Net Loss Adjustment Expense Paid | NA | 7,345 | 6,131 | 4,818 | 4,355 | |||||||||||||||
| Net Change in Loss and LAE Reserves | NA | 4,603 | 12,769 | 5,650 | 4,489 | |||||||||||||||
| Losses and LAE Incurred | 56,489 | 90,148 | 103,855 | 59,290 | 45,777 | |||||||||||||||
| Other Underwriting Expense Incurred | 25,370 | 44,270 | 43,670 | 34,286 | 25,725 | |||||||||||||||
| Other Underwriting Deductions | 0 | 0 | 0 | 0 | 0 | |||||||||||||||
| Total Losses and Expenses Incurred | 81,860 | 134,417 | 147,525 | 93,576 | 71,502 | |||||||||||||||
| Net Underwriting Gain (Loss) | (10,364 | ) | 2,223 | (17,696 | ) | 4,448 | 11,584 | |||||||||||||
| Policyholder Dividends | 0 | 0 | 0 | 0 | 0 | |||||||||||||||
| Investment Income ($000) | ||||||||||||||||||||
| Net Investment Income | 1,769 | 2,747 | 2,273 | 2,723 | 2,589 | |||||||||||||||
| Net Realized Capital Gains (Losses) | 244 | 3,330 | 633 | 618 | 5,053 | |||||||||||||||
| Other Income ($000) | ||||||||||||||||||||
| Finance Service Charges | 94 | 207 | 227 | 218 | 217 | |||||||||||||||
| All Other Income | 94 | 335 | 114 | 60 | 81 | |||||||||||||||
| Net Income ($000) | ||||||||||||||||||||
| Income (Loss) Before Income Taxes | (8,162 | ) | 8,842 | (14,451 | ) | 8,067 | 19,524 | |||||||||||||
| Federal Income Tax Expense | (1,719 | ) | 537 | (3,218 | ) | 2,028 | 2,890 | |||||||||||||
| Net Income (Loss) | $ | (6,443 | ) | $ | 8,306 | $ | (11,233 | ) | $ | 6,039 | $ | 16,635 | ||||||||
IV-4
FELDMAN FINANCIAL ADVISORS, INC.
Exhibit IV-1 (continued)
Everett Cash Mutual Insurance Company
Unconsolidated Statutory Financial Data
For the Years Ended December 31, 2021 to 2024 and YTD Ended June 30, 2025
(Dollars in Thousands)
| Period Ended | YTD
6/30/25 | Year
12/31/24 | Year
12/31/23 | Year
12/31/22 | Year
12/31/21 | |||||||||||||||
| Operating Ratios (%) | ||||||||||||||||||||
| Loss Ratio | 71.58 | 60.09 | 73.34 | 54.51 | 49.85 | |||||||||||||||
| Loss Adjustment Expense Ratio | 7.43 | 5.88 | 6.66 | 5.98 | 5.24 | |||||||||||||||
| Loss and LAE Ratio | 79.01 | 65.97 | 79.99 | 60.49 | 55.10 | |||||||||||||||
| Net Commission Ratio | NA | 24.45 | 25.68 | 20.24 | 20.97 | |||||||||||||||
| Salaries and Benefits Ratio | NA | 3.86 | 1.42 | 4.45 | 3.88 | |||||||||||||||
| Tax, License, and Fees Ratio | NA | 2.15 | 2.17 | 2.30 | 2.69 | |||||||||||||||
| Administrative and Other Expense Ratio | NA | 2.73 | 1.73 | 2.34 | 2.44 | |||||||||||||||
| Expense Ratio | 32.07 | 33.19 | 31.00 | 29.32 | 29.99 | |||||||||||||||
| Policyholder Dividend Ratio | 0.00 | 0.00 | 0.00 | 0.00 | 0.00 | |||||||||||||||
| Combined Ratio | 111.08 | 99.16 | 110.99 | 89.81 | 85.08 | |||||||||||||||
| Combined Ratio Excluding Policyholder Dividend | 111.08 | 99.16 | 110.99 | 89.81 | 85.08 | |||||||||||||||
| Operating Ratio | 108.61 | 97.15 | 109.24 | 87.03 | 81.97 | |||||||||||||||
| Premium Analysis | ||||||||||||||||||||
| Direct Premiums Written ($000) | $ | 54,183 | $ | 107,191 | $ | 102,943 | $ | 95,649 | $ | 80,456 | ||||||||||
| Gross Premiums Written ($000) | 106,166 | 206,672 | 207,784 | 139,509 | 90,235 | |||||||||||||||
| Net Premiums Written ($000) | 79,110 | 133,388 | 140,873 | 116,929 | 85,781 | |||||||||||||||
| Growth DPW (%) | (5.91 | ) | 4.13 | 7.63 | 18.88 | 5.23 | ||||||||||||||
| Growth GPW (%) | (2.32 | ) | (0.53 | ) | 48.94 | 54.61 | 6.91 | |||||||||||||
| Growth NPW (%) | 10.81 | (5.31 | ) | 20.48 | 36.31 | 6.84 | ||||||||||||||
| Retention Ratio (NPW/GPW) (%) | 74.52 | 64.54 | 67.80 | 83.81 | 95.06 | |||||||||||||||
| Direct Premiums Written by Geography (%) | ||||||||||||||||||||
| Mid-Atlantic Region | 26.10 | 26.11 | 27.45 | 28.27 | 33.03 | |||||||||||||||
| Southeast Region | 38.88 | 37.84 | 38.90 | 39.54 | 33.65 | |||||||||||||||
| Midwest Region | 35.02 | 36.05 | 33.65 | 32.19 | 33.32 | |||||||||||||||
| Direct Premiums Written by Segment (%) | ||||||||||||||||||||
| Homeowners’ / Farmowners’ Multi-peril | 67.71 | 66.99 | 69.40 | 70.27 | 67.69 | |||||||||||||||
| Commercial Multi-peril Combined | 20.51 | 20.87 | 16.59 | 15.45 | 16.78 | |||||||||||||||
| Commercial Automobile | 3.59 | 2.90 | 2.99 | 2.88 | NA | |||||||||||||||
| Personal Automobile | (0.02 | ) | 0.97 | 1.61 | 1.54 | NA | ||||||||||||||
| Workers’ Compensation | 1.42 | 1.23 | 1.50 | 1.58 | 1.82 | |||||||||||||||
| Marine Lines Combined | 1.34 | 1.43 | 1.47 | 1.51 | 1.65 | |||||||||||||||
| Fire and Allied Lines Combined | 0.55 | 0.65 | 0.78 | 0.88 | 1.04 | |||||||||||||||
| Other | 4.90 | 4.96 | 5.66 | 5.88 | 11.02 | |||||||||||||||
Source: S&P Global.
IV-5
FELDMAN FINANCIAL ADVISORS, INC.
Exhibit IV-2
American Reliable Insurance Company
Unconsolidated Statutory Financial Data
For the Years Ended December 31, 2021 to 2024 and YTD Ended June 30, 2025
(Dollars in Thousands)
| Period Ended | YTD
6/30/25 | Year 12/31/24 | Year 12/31/23 | Year 12/31/22 | Year 12/31/21 | |||||||||||||||
| Balance Sheet Summary | ||||||||||||||||||||
| Total Cash and Investments | $ | 16,941 | $ | 15,500 | $ | 15,102 | $ | 10,063 | $ | 381,371 | ||||||||||
| Total Assets | 40,178 | 29,464 | 24,817 | 20,848 | 478,833 | |||||||||||||||
| Loss Reserves | 0 | 0 | 0 | 0 | 158,048 | |||||||||||||||
| Loss Adjustment Expense Reserves | 0 | 0 | 0 | 0 | 39,143 | |||||||||||||||
| Total Loss and LAE Reserves | 0 | 0 | 0 | 0 | 197,190 | |||||||||||||||
| Unearned Premium Reserve | 0 | 0 | 0 | 0 | 78,922 | |||||||||||||||
| Total Liabilities | 23,170 | 12,720 | 8,454 | 10,848 | 349,731 | |||||||||||||||
| Surplus Notes | 0 | 0 | 0 | 0 | 0 | |||||||||||||||
| Capital and Surplus | 17,008 | 16,744 | 16,362 | 10,000 | 129,103 | |||||||||||||||
| Capital and Surplus / Assets (%) | 42.33 | 56.83 | 65.93 | 47.97 | 26.96 | |||||||||||||||
| Total Reserves / Capital and Surplus (%) | 0.00 | 0.00 | 0.00 | 0.00 | 152.74 | |||||||||||||||
| Income Statement Summary | ||||||||||||||||||||
| Direct Premiums Written | 49,469 | 100,699 | 114,866 | 148,291 | 174,089 | |||||||||||||||
| Net Reinsurance Premiums | (49,469 | ) | (100,699 | ) | (114,866 | ) | (89,748 | ) | (69 | ) | ||||||||||
| Net Premiums Written | 0 | 0 | 0 | 58,543 | 174,020 | |||||||||||||||
| Net Premiums Earned | 0 | 0 | 0 | 137,465 | 178,683 | |||||||||||||||
| Net Loss and LAE Incurred | 0 | 0 | 0 | 79,731 | 115,490 | |||||||||||||||
| Net Underwriting Expense Incurred | 0 | (346 | ) | (1,769 | ) | 56,248 | 64,850 | |||||||||||||
| Policyholder Dividends | 0 | 0 | 0 | 0 | 0 | |||||||||||||||
| Net Underwriting Gain (Loss) | 0 | 346 | 1,769 | 1,485 | (1,657 | ) | ||||||||||||||
| Net Investment Income | 281 | 134 | (36 | ) | 9,352 | 6,418 | ||||||||||||||
| Net Realized Capital Gains (Losses) | 0 | 0 | 0 | (29,031 | ) | (146 | ) | |||||||||||||
| Income Tax Expense | 70 | 90 | 371 | (312 | ) | 6,178 | ||||||||||||||
| Net Income | 264 | 391 | 1,367 | 13,139 | 22,312 | |||||||||||||||
| Pre-tax Operating Income | 334 | 481 | 1,738 | 41,859 | 28,635 | |||||||||||||||
| Premiums Written By Segment (%) | ||||||||||||||||||||
| Personal Lines - Direct Premiums Written | 1.08 | 7.69 | 11.61 | 25.68 | NA | |||||||||||||||
| Commercial Lines - Direct Premiums Written | 98.92 | 92.31 | 88.39 | 74.32 | NA | |||||||||||||||
| Personal Lines - Net Premiums Written | NA | NA | NA | 1.11 | NA | |||||||||||||||
| Commercial Lines - Net Premiums Written | NA | NA | NA | 98.89 | NA | |||||||||||||||
IV-6
FELDMAN FINANCIAL ADVISORS, INC.
Exhibit IV-2 (continued)
American Reliable Insurance Company
Unconsolidated Statutory Financial Data
For the Years Ended December 31, 2021 to 2024 and YTD Ended June 30, 2025
(Dollars in Thousands)
| Period Ended | YTD 6/30/25 | Year 12/31/24 | Year 12/31/23 | Year 12/31/22 | Year 12/31/21 | |||||||||||||||
| Operating Ratios (%) | ||||||||||||||||||||
| Growth Rate - Direct Premiums Written | (8.73 | ) | (12.33 | ) | (22.54 | ) | (14.82 | ) | (9.06 | ) | ||||||||||
| Growth Rate - Net Premiums Written | NA | NA | NA | (66.36 | ) | 5.61 | ||||||||||||||
| Growth Rate - Operating Income | 8.34 | (72.34 | ) | (95.85 | ) | 46.18 | 305.46 | |||||||||||||
| Loss and LAE Ratio | NA | NA | NA | 58.00 | 64.63 | |||||||||||||||
| Expense Ratio | NM | NM | NM | 96.08 | 37.27 | |||||||||||||||
| Policyholder Dividend Ratio | NA | NA | NA | 0.00 | 0.00 | |||||||||||||||
| Combined Ratio | NA | NA | NA | 154.08 | 101.90 | |||||||||||||||
| Operating Ratio | NA | NA | NA | 147.28 | 98.31 | |||||||||||||||
| Effective Tax Rate | 21.00 | 18.73 | 21.32 | (2.43 | ) | 21.68 | ||||||||||||||
| Net Yield on Invested Assets | 3.42 | 0.90 | (0.28 | ) | 2.85 | 1.92 | ||||||||||||||
| Pre-Tax Operating Margin | 100.00 | 355.45 | NM | 23.54 | 13.70 | |||||||||||||||
| Return on Average Equity (C&S) | 3.13 | 2.36 | 10.23 | 13.38 | 20.29 | |||||||||||||||
| Pre-Tax Operating ROE | 3.97 | 2.90 | 13.01 | 42.63 | 26.04 | |||||||||||||||
| Return on Average Assets | 1.54 | 1.95 | 4.83 | 3.22 | 5.43 | |||||||||||||||
| Capital, Leverage & Liquidity (%) | ||||||||||||||||||||
| RBC - Total Adjusted Capital ($000) | NA | 16,744 | 16,362 | 10,000 | 129,103 | |||||||||||||||
| ACL Risk Based Capital ($000) | NA | 729 | 1,179 | 2,154 | 30,014 | |||||||||||||||
| Risk Based Capital Ratio (TAC/ACL RBC) | NA | 2,296.01 | 1,388.04 | 464.30 | 430.14 | |||||||||||||||
| Net Premiums Written / Average C&S | 586.72 | 0.00 | 0.00 | 59.62 | 158.28 | |||||||||||||||
| Total Reins. Recoverable Excl. Affiliates / C&S | NA | 236.65 | 402.64 | NM | 22.95 | |||||||||||||||
| Cash & Short-Term Investments / Liabilities | 21.79 | 22.73 | 58.42 | 48.74 | 9.08 | |||||||||||||||
| Reserve Analysis (%) | ||||||||||||||||||||
| Change in Loss & LAE Reserves / Reserves | NA | NA | NA | NM | 14.57 | |||||||||||||||
| Loss & LAE Reserves / Net Premiums Earned | NA | NA | NA | 132.97 | 102.84 | |||||||||||||||
| Investments (%) | ||||||||||||||||||||
| Net Yield on Invested Assets | 3.42 | 0.90 | (0.28 | ) | 2.85 | 1.92 | ||||||||||||||
| Unaffiliated Bonds / Unaffiliated Investments | 70.20 | 81.35 | 67.29 | 47.46 | 87.91 | |||||||||||||||
| Unaff. Preferred Stocks / Unaff. Investments | 0.00 | 0.00 | 0.00 | 0.00 | 1.99 | |||||||||||||||
| Unaff. Common Stocks / Unaff. Investments | 0.00 | 0.00 | 0.00 | 0.00 | 0.00 | |||||||||||||||
| Affiliated Investments / Total Investments | 0.00 | 0.00 | 0.00 | 0.00 | 0.00 | |||||||||||||||
| Gross Yield on Bonds (excluding affiliates) | NA | 4.36 | 4.26 | 3.09 | 2.15 | |||||||||||||||
| Bond Average Asset Quality (#1-6) | NA | 1.05 | 1.00 | 1.00 | 1.28 | |||||||||||||||
| Bonds Rated 3-6 / Total Bonds | NA | 0.00 | 0.00 | 0.00 | 1.56 | |||||||||||||||
| Bonds < 1 Year / Total Bonds | NA | 11.76 | 32.41 | 69.66 | 13.57 | |||||||||||||||
IV-7
FELDMAN FINANCIAL ADVISORS, INC.
Exhibit IV-2 (continued)
American Reliable Insurance Company
Unconsolidated Statutory Financial Data
For the Years Ended December 31, 2021 to 2024 and YTD Ended June 30, 2025
(Dollars in Thousands)
| Period Ended | YTD
6/30/25 | Year 12/31/24 | Year 12/31/23 | Year 12/31/22 | Year 12/31/21 | |||||||||||||||
| Assets ($000) | ||||||||||||||||||||
| Bonds | $ | 11,893 | $ | 12,608 | $ | 10,163 | $ | 4,776 | $ | 335,267 | ||||||||||
| Preferred Stocks | 0 | 0 | 0 | 0 | 7,598 | |||||||||||||||
| Common Stocks | 0 | 0 | 0 | 0 | 0 | |||||||||||||||
| Cash and Short-term Investments | 5,048 | 2,891 | 4,939 | 5,287 | 31,752 | |||||||||||||||
| Other Investments | 0 | 0 | 0 | 0 | 6,754 | |||||||||||||||
| Total Cash and Investments | 16,941 | 15,500 | 15,102 | 10,063 | 381,371 | |||||||||||||||
| Premiums and Considerations Due | 22,889 | 13,771 | 8,901 | 7,584 | 56,347 | |||||||||||||||
| Reinsurance Recoverable | 250 | 49 | 463 | 3,185 | 9,841 | |||||||||||||||
| Receivable from Parent, Subsidiary, or Affiliates | 0 | 0 | 239 | 0 | 24,173 | |||||||||||||||
| Other Assets | 97 | 144 | 112 | 16 | 7,102 | |||||||||||||||
| Total Assets | $ | 40,178 | $ | 29,464 | $ | 24,817 | $ | 20,848 | $ | 478,833 | ||||||||||
| Liabilities and Equity ($000) | ||||||||||||||||||||
| Loss Reserves | $ | 0 | $ | 0 | $ | 0 | $ | 0 | $ | 158,048 | ||||||||||
| Loss Adjustment Expense Reserves | 0 | 0 | 0 | 0 | 39,143 | |||||||||||||||
| Total Loss and LAE Reserves | 0 | 0 | 0 | 0 | 197,190 | |||||||||||||||
| Unearned Premium Reserve | 0 | 0 | 0 | 0 | 78,922 | |||||||||||||||
| Total Reinsurance Liabilities | 20,499 | 7,986 | 6,216 | 10,769 | 29,664 | |||||||||||||||
| Commissions, Other Expenses, and Taxes Due | 1,397 | 1,766 | 1,841 | 0 | 894 | |||||||||||||||
| Payable to Parent, Subsidiary, or Affiliates | 392 | 1,638 | 0 | 0 | 36,291 | |||||||||||||||
| Other Liabilities | 882 | 1,330 | 397 | 79 | 6,770 | |||||||||||||||
| Total Liabilities | 23,170 | 12,720 | 8,454 | 10,848 | 349,731 | |||||||||||||||
| Common Capital Stock | 2,600 | 2,600 | 4,200 | 4,200 | 4,200 | |||||||||||||||
| Unassigned Surplus | (71,947 | ) | (72,211 | ) | (74,193 | ) | (75,555 | ) | 43,548 | |||||||||||
| Other Including Gross Contributed | 86,355 | 86,355 | 86,355 | 81,355 | 81,355 | |||||||||||||||
| Total Capital and Surplus | 17,008 | 16,744 | 16,362 | 10,000 | 129,103 | |||||||||||||||
| Total Liabilities and Capital and Surplus | $ | 40,178 | $ | 29,464 | $ | 24,817 | $ | 20,848 | $ | 478,833 | ||||||||||
IV-8
FELDMAN FINANCIAL ADVISORS, INC.
Exhibit IV-2 (continued)
American Reliable Insurance Company
Unconsolidated Statutory Financial Data
For the Years Ended December 31, 2021 to 2024 and YTD Ended June 30, 2025
(Dollars in Thousands)
| Period Ended | YTD 6/30/25 | Year 12/31/24 | Year 12/31/23 | Year 12/31/22 | Year 12/31/21 | |||||||||||||||
| Underwriting Revenue ($000) | ||||||||||||||||||||
| Direct Premiums Written | $ | 49,469 | $ | 100,699 | $ | 114,866 | $ | 148,291 | $ | 174,089 | ||||||||||
| Net Reinsurance Premiums | (49,469 | ) | (100,699 | ) | (114,866 | ) | (89,748 | ) | (69 | ) | ||||||||||
| Net Premiums Written | 0 | 0 | 0 | 58,543 | 174,020 | |||||||||||||||
| Change in Unearned Premiums Reserve | 0 | 0 | 0 | 78,922 | 4,663 | |||||||||||||||
| Net Premiums Earned | 0 | 0 | 0 | 137,465 | 178,683 | |||||||||||||||
| Underwriting Deductions ($000) | ||||||||||||||||||||
| Net Losses Paid | NA | 0 | 0 | 225,931 | 75,748 | |||||||||||||||
| Net Loss Adjustment Expense Paid | NA | 0 | 0 | 50,990 | 14,660 | |||||||||||||||
| Net Change in Loss and LAE Reserves | NA | 0 | 0 | (197,190 | ) | 25,082 | ||||||||||||||
| Losses and LAE Incurred | 0 | 0 | 0 | 79,731 | 115,490 | |||||||||||||||
| Other Underwriting Expense Incurred | 0 | (346 | ) | (1,769 | ) | 56,248 | 64,850 | |||||||||||||
| Other Underwriting Deductions | 0 | 0 | 0 | 0 | 0 | |||||||||||||||
| Total Losses and Expenses Incurred | 0 | (346 | ) | (1,769 | ) | 135,979 | 180,340 | |||||||||||||
| Net Underwriting Gain (Loss) | 0 | 346 | 1,769 | 1,485 | (1,657 | ) | ||||||||||||||
| Policyholder Dividends | 0 | 0 | 0 | 0 | 0 | |||||||||||||||
| Investment Income ($000) | ||||||||||||||||||||
| Net Investment Income | 281 | 134 | (36 | ) | 9,352 | 6,418 | ||||||||||||||
| Net Realized Capital Gains (Losses) | 0 | 0 | 0 | (29,031 | ) | (146 | ) | |||||||||||||
| Other Income ($000) | ||||||||||||||||||||
| Finance Service Charges | 0 | 0 | 0 | 1,019 | 943 | |||||||||||||||
| All Other Income | 54 | 1 | 6 | 30,002 | 22,932 | |||||||||||||||
| Net Income ($000) | ||||||||||||||||||||
| Income Before Income Taxes | 334 | 481 | 1,738 | 12,828 | 28,489 | |||||||||||||||
| Federal Income Tax Expense | 70 | 90 | 371 | (312 | ) | 6,178 | ||||||||||||||
| Net Income | $ | 264 | $ | 391 | $ | 1,367 | $ | 13,139 | $ | 22,312 | ||||||||||
IV-9
FELDMAN FINANCIAL ADVISORS, INC.
Exhibit IV-2 (continued)
American Reliable Insurance Company
Unconsolidated Statutory Financial Data
For the Years Ended December 31, 2021 to 2024 and YTD Ended June 30, 2025
(Dollars in Thousands)
| Period Ended | YTD 6/30/25 | Year 12/31/24 | Year 12/31/23 | Year 12/31/22 | Year 12/31/21 | |||||||||||||||
| Operating Ratios (%) | ||||||||||||||||||||
| Loss Ratio | NA | NA | NA | 49.38 | 54.44 | |||||||||||||||
| Loss Adjustment Expense Ratio | NA | NA | NA | 8.62 | 10.19 | |||||||||||||||
| Loss and LAE Ratio | NA | NA | NA | 58.00 | 64.63 | |||||||||||||||
| Net Commission Ratio | NM | NM | NM | 62.20 | 23.66 | |||||||||||||||
| Salaries and Benefits Ratio | NM | NM | NM | 18.22 | 7.61 | |||||||||||||||
| Tax, License, and Fees Ratio | NM | NM | NM | 2.25 | 1.11 | |||||||||||||||
| Administrative and Other Expense Ratio | NM | NM | NM | 13.40 | 4.88 | |||||||||||||||
| Expense Ratio | NM | NM | NM | 96.08 | 37.27 | |||||||||||||||
| Policyholder Dividend Ratio | NA | NA | NA | 0.00 | 0.00 | |||||||||||||||
| Combined Ratio | NA | NA | NA | 154.08 | 101.90 | |||||||||||||||
| Combined Ratio Excluding Policyholder Dividend | NA | NA | NA | 154.08 | 101.90 | |||||||||||||||
| Operating Ratio | NA | NA | NA | 147.28 | 98.31 | |||||||||||||||
| Premium Analysis | ||||||||||||||||||||
| Direct Premiums Written ($000) | $ | 49,469 | $ | 100,699 | $ | 114,866 | $ | 148,291 | $ | 174,089 | ||||||||||
| Gross Premiums Written ($000) | 49,469 | 100,699 | 114,866 | 206,834 | 348,108 | |||||||||||||||
| Net Premiums Written ($000) | 0 | 0 | 0 | 58,543 | 174,020 | |||||||||||||||
| Growth DPW (%) | (8.73 | ) | (12.33 | ) | (22.54 | ) | (14.82 | ) | (9.06 | ) | ||||||||||
| Growth GPW (%) | (8.73 | ) | (12.33 | ) | (44.46 | ) | (40.58 | ) | (2.31 | ) | ||||||||||
| Growth NPW (%) | NM | NA | NM | (66.36 | ) | 5.61 | ||||||||||||||
| Retention Ratio (NPW/GPW) (%) | 0.00 | 0.00 | 0.00 | 28.30 | 49.99 | |||||||||||||||
| Direct Premiums Written by Geography (%) | ||||||||||||||||||||
| Mid-Atlantic Region | 6.15 | 6.28 | 6.27 | 5.02 | 4.16 | |||||||||||||||
| Southeast Region | 21.84 | 24.92 | 26.86 | 29.99 | 32.90 | |||||||||||||||
| Midwest Region | 22.42 | 22.35 | 20.31 | 16.26 | 14.58 | |||||||||||||||
| Southwest Region | 22.89 | 20.05 | 17.28 | 17.29 | 20.16 | |||||||||||||||
| West Region | 21.83 | 21.47 | 22.27 | 24.37 | 22.82 | |||||||||||||||
| Northeast Region | 4.88 | 4.92 | 7.01 | 7.07 | 5.38 | |||||||||||||||
| Direct Premiums Written by Segment (%) | ||||||||||||||||||||
| Homeowners’ / Farmowners’ Multi-peril | 0.84 | 7.37 | 10.28 | 14.41 | 14.95 | |||||||||||||||
| Commercial Multi-peril Combined | 66.40 | 60.36 | 53.75 | 38.71 | 32.26 | |||||||||||||||
| Commercial Automobile | 10.58 | 8.79 | 8.14 | 5.77 | NA | |||||||||||||||
| Personal Automobile | 0.24 | 0.33 | 1.34 | 11.27 | NA | |||||||||||||||
| Marine Lines Combined | 19.29 | 19.68 | 16.54 | 10.89 | 6.34 | |||||||||||||||
| Fire and Allied Lines Combined | (0.01 | ) | 0.06 | 4.94 | 12.87 | 13.36 | ||||||||||||||
| Other | 2.66 | 3.42 | 5.01 | 6.07 | 33.08 | |||||||||||||||
Source: S&P Global.
IV-10
FELDMAN FINANCIAL ADVISORS, INC.
Exhibit IV-3
1st Choice Advantage Insurance Company, Inc.
Unconsolidated Statutory Financial Data
For the Years Ended December 31, 2021 to 2024 and YTD Ended June 30, 2025
(Dollars in Thousands)
| Period Ended | YTD 6/30/25 | Year 12/31/24 | Year 12/31/23 | Year 12/31/22 | Year 12/31/21 | |||||||||||||||
| Balance Sheet Summary | ||||||||||||||||||||
| Total Cash and Investments | $ | 29,627 | $ | 29,807 | $ | 28,616 | $ | 26,860 | $ | 23,409 | ||||||||||
| Total Assets | 36,061 | 36,065 | 35,314 | 33,115 | 29,434 | |||||||||||||||
| Loss Reserves | 4,807 | 5,566 | 6,183 | 5,553 | 4,900 | |||||||||||||||
| Loss Adjustment Expense Reserves | 1,032 | 981 | 847 | 1,123 | 973 | |||||||||||||||
| Total Loss and LAE Reserves | 5,840 | 6,547 | 7,031 | 6,676 | 5,872 | |||||||||||||||
| Unearned Premium Reserve | 11,021 | 11,489 | 13,658 | 12,949 | 13,341 | |||||||||||||||
| Total Liabilities | 19,842 | 21,610 | 24,389 | 23,836 | 21,529 | |||||||||||||||
| Surplus Notes | 0 | 0 | 0 | 0 | 0 | |||||||||||||||
| Capital and Surplus | 16,219 | 14,455 | 10,926 | 9,279 | 7,905 | |||||||||||||||
| Capital and Surplus / Assets (%) | 44.98 | 40.08 | 30.94 | 28.02 | 26.86 | |||||||||||||||
| Total Reserves / Capital and Surplus (%) | 36.00 | 45.29 | 64.35 | 71.95 | 74.29 | |||||||||||||||
| Income Statement Summary | ||||||||||||||||||||
| Direct Premiums Written | 12,469 | 29,314 | 31,844 | 29,662 | 27,335 | |||||||||||||||
| Net Reinsurance Premiums | (3,858 | ) | (8,093 | ) | (7,952 | ) | (5,933 | ) | (5,717 | ) | ||||||||||
| Net Premiums Written | 8,611 | 21,221 | 23,892 | 23,729 | 21,618 | |||||||||||||||
| Net Premiums Earned | 9,079 | 23,390 | 23,183 | 24,121 | 19,667 | |||||||||||||||
| Net Loss and LAE Incurred | 4,422 | 14,021 | 15,034 | 15,392 | 14,298 | |||||||||||||||
| Net Underwriting Expense Incurred | 2,874 | 6,134 | 7,261 | 7,759 | 7,146 | |||||||||||||||
| Policyholder Dividends | 0 | 0 | 0 | 0 | 0 | |||||||||||||||
| Net Underwriting Gain (Loss) | 1,783 | 3,235 | 888 | 970 | (1,777 | ) | ||||||||||||||
| Net Investment Income | 466 | 846 | 685 | 448 | 379 | |||||||||||||||
| Net Realized Capital Gains (Losses) | (57 | ) | 157 | 4 | (85 | ) | (9 | ) | ||||||||||||
| Income Tax Expense | 444 | 765 | 369 | 248 | (155 | ) | ||||||||||||||
| Net Income (Loss) | 1,774 | 3,552 | 1,299 | 1,173 | (1,158 | ) | ||||||||||||||
| Pre-tax Operating Income (Loss) | 2,276 | 4,161 | 1,663 | 1,507 | (1,304 | ) | ||||||||||||||
| Premiums Written By Segment (%) | ||||||||||||||||||||
| Personal Lines - Direct Premiums Written | 10.62 | 28.93 | 36.94 | 38.13 | NA | |||||||||||||||
| Commercial Lines - Direct Premiums Written | 89.38 | 71.07 | 63.06 | 61.87 | NA | |||||||||||||||
| Personal Lines - Net Premiums Written | NA | 29.40 | 39.43 | 39.36 | NA | |||||||||||||||
| Commercial Lines - Net Premiums Written | NA | 70.60 | 60.57 | 60.64 | NA | |||||||||||||||
IV-11
FELDMAN FINANCIAL ADVISORS, INC.
Exhibit IV-3 (continued)
1st Choice Advantage Insurance Company, Inc.
Unconsolidated Statutory Financial Data
For the Years Ended December 31, 2021 to 2024 and YTD Ended June 30, 2025
(Dollars in Thousands)
| Period Ended | YTD 6/30/25 | Year 12/31/24 | Year 12/31/23 | Year 12/31/22 | Year 12/31/21 | |||||||||||||||
| Operating Ratios (%) | ||||||||||||||||||||
| Growth Rate - Direct Premiums Written | (29.85 | ) | (7.94 | ) | 7.35 | 8.51 | 25.68 | |||||||||||||
| Growth Rate - Net Premiums Written | (36.27 | ) | (11.18 | ) | 0.69 | 9.76 | 21.50 | |||||||||||||
| Growth Rate - Operating Income | 12.55 | 150.12 | 10.40 | NM | NM | |||||||||||||||
| Loss and LAE Ratio | 48.71 | 59.94 | 64.85 | 63.81 | 72.70 | |||||||||||||||
| Expense Ratio | 33.37 | 28.90 | 30.39 | 32.70 | 33.05 | |||||||||||||||
| Policyholder Dividend Ratio | 0.00 | 0.00 | 0.00 | 0.00 | 0.00 | |||||||||||||||
| Combined Ratio | 82.08 | 88.85 | 95.24 | 96.51 | 105.76 | |||||||||||||||
| Operating Ratio | 76.95 | 85.23 | 92.28 | 94.65 | 103.83 | |||||||||||||||
| Effective Tax Rate | 20.01 | 17.73 | 22.11 | 17.48 | NM | |||||||||||||||
| Net Yield on Invested Assets | 3.10 | 2.82 | 2.50 | 1.80 | 1.74 | |||||||||||||||
| Pre-Tax Operating Margin | 23.77 | 17.11 | 6.94 | 6.11 | (6.47 | ) | ||||||||||||||
| Return on Average Equity (C&S) | 23.03 | 28.09 | 12.88 | 13.49 | (14.60 | ) | ||||||||||||||
| Pre-Tax Operating ROE | 29.54 | 32.90 | 16.49 | 17.32 | (16.44 | ) | ||||||||||||||
| Return on Average Assets | 9.73 | 9.56 | 3.79 | 3.75 | (4.12 | ) | ||||||||||||||
| Capital, Leverage & Liquidity (%) | ||||||||||||||||||||
| RBC - Total Adjusted Capital ($000) | NA | 14,455 | 10,926 | 9,279 | 7,905 | |||||||||||||||
| ACL Risk Based Capital ($000) | NA | 2,106 | 2,585 | 2,600 | 2,052 | |||||||||||||||
| Risk Based Capital Ratio (TAC/ACL RBC) | NA | 686.41 | 422.67 | 356.88 | 385.30 | |||||||||||||||
| Net Premiums Written / Average C&S | 111.78 | 167.80 | 236.89 | 272.77 | 272.46 | |||||||||||||||
| Total Reins. Recoverable Excl. Affiliates / C&S | NA | 15.31 | 7.29 | (1.85 | ) | (7.16 | ) | |||||||||||||
| Cash & Short-Term Investments / Liabilities | 7.17 | 5.88 | 9.87 | 16.35 | 9.66 | |||||||||||||||
| Reserve Analysis (%) | ||||||||||||||||||||
| Change in Loss & LAE Reserves / Reserves | (21.60 | ) | (6.89 | ) | 5.31 | 13.69 | 20.47 | |||||||||||||
| Loss & LAE Reserves / Net Premiums Earned | 34.24 | 29.26 | 29.21 | 24.52 | 26.99 | |||||||||||||||
| Investments (%) | ||||||||||||||||||||
| Net Yield on Invested Assets | 3.10 | 2.82 | 2.50 | 1.80 | 1.74 | |||||||||||||||
| Unaffiliated Bonds / Unaffiliated Investments | 73.50 | 74.00 | 68.28 | 63.05 | 65.23 | |||||||||||||||
| Unaff. Preferred Stocks / Unaff. Investments | 0.00 | 0.00 | 0.00 | 0.00 | 0.00 | |||||||||||||||
| Unaff. Common Stocks / Unaff. Investments | 21.70 | 21.73 | 23.31 | 22.45 | 25.88 | |||||||||||||||
| Affiliated Investments / Total Investments | 0.00 | 0.00 | 0.00 | 0.00 | 0.00 | |||||||||||||||
| Gross Yield on Bonds (excluding affiliates) | NA | 3.18 | 2.64 | 2.00 | 2.05 | |||||||||||||||
| Bond Average Asset Quality (#1-6) | NA | 1.06 | 1.06 | 1.07 | 1.12 | |||||||||||||||
| Bonds Rated 3-6 / Total Bonds | NA | 0.00 | 0.00 | 0.00 | 1.29 | |||||||||||||||
| Bonds < 1 Year / Total Bonds | NA | 11.47 | 11.80 | 16.22 | 16.21 | |||||||||||||||
IV-12
FELDMAN FINANCIAL ADVISORS, INC.
Exhibit IV-3 (continued)
1st Choice Advantage Insurance Company, Inc.
Unconsolidated Statutory Financial Data
For the Years Ended December 31, 2021 to 2024 and YTD Ended June 30, 2025
(Dollars in Thousands)
| Period Ended | YTD 6/30/25 | Year 12/31/24 | Year 12/31/23 | Year 12/31/22 | Year 12/31/21 | |||||||||||||||
| Assets ($000) | ||||||||||||||||||||
| Bonds | $ | 21,774 | $ | 22,057 | $ | 19,538 | $ | 16,934 | $ | 15,270 | ||||||||||
| Preferred Stocks | 0 | 0 | 0 | 0 | 0 | |||||||||||||||
| Common Stocks | 6,429 | 6,478 | 6,670 | 6,029 | 6,059 | |||||||||||||||
| Cash and Short-term Investments | 1,423 | 1,271 | 2,408 | 3,897 | 2,080 | |||||||||||||||
| Other Investments | 0 | 0 | 0 | 0 | 0 | |||||||||||||||
| Total Cash and Investments | 29,627 | 29,807 | 28,616 | 26,860 | 23,409 | |||||||||||||||
| Premiums and Considerations Due | 5,134 | 5,280 | 6,446 | 6,064 | 5,614 | |||||||||||||||
| Reinsurance Recoverable | 851 | 731 | 111 | 26 | 0 | |||||||||||||||
| Receivable from Parent, Subsidiary, or Affiliates | 276 | 70 | 0 | 0 | 0 | |||||||||||||||
| Other Assets | 174 | 178 | 141 | 165 | 411 | |||||||||||||||
| Total Assets | $ | 36,061 | $ | 36,065 | $ | 35,314 | $ | 33,115 | $ | 29,434 | ||||||||||
| Liabilities and Equity ($000) | ||||||||||||||||||||
| Loss Reserves | $ | 4,807 | $ | 5,566 | $ | 6,183 | $ | 5,553 | $ | 4,900 | ||||||||||
| Loss Adjustment Expense Reserves | 1,032 | 981 | 847 | 1,123 | 973 | |||||||||||||||
| Total Loss and LAE Reserves | 5,840 | 6,547 | 7,031 | 6,676 | 5,872 | |||||||||||||||
| Unearned Premium Reserve | 11,021 | 11,489 | 13,658 | 12,949 | 13,341 | |||||||||||||||
| Total Reinsurance Liabilities | 808 | 1,481 | 1,379 | 1,663 | 593 | |||||||||||||||
| Commissions, Other Expenses, and Taxes Due | 338 | 482 | 726 | 1,285 | 767 | |||||||||||||||
| Payable to Parent, Subsidiary, or Affiliates | 0 | 0 | 181 | 0 | 227 | |||||||||||||||
| Other Liabilities | 1,836 | 1,612 | 1,414 | 1,263 | 729 | |||||||||||||||
| Total Liabilities | 19,842 | 21,610 | 24,389 | 23,836 | 21,529 | |||||||||||||||
| Common Capital Stock | 2,501 | 2,501 | 2,501 | 2,501 | 2,501 | |||||||||||||||
| Surplus Notes | 0 | 0 | 0 | 0 | 0 | |||||||||||||||
| Unassigned Surplus | 4,416 | 2,653 | (877 | ) | (2,524 | ) | (3,898 | ) | ||||||||||||
| Other Including Gross Contributed | 9,302 | 9,302 | 9,302 | 9,302 | 9,302 | |||||||||||||||
| Total Capital and Surplus | 16,219 | 14,455 | 10,926 | 9,279 | 7,905 | |||||||||||||||
| Total Liabilities and Capital and Surplus | $ | 36,061 | $ | 36,065 | $ | 35,314 | $ | 33,115 | $ | 29,434 | ||||||||||
IV-13
FELDMAN FINANCIAL ADVISORS, INC.
Exhibit IV-3 (continued)
1st Choice Advantage Insurance Company, Inc.
Unconsolidated Statutory Financial Data
For the Years Ended December 31, 2021 to 2024 and YTD Ended June 30, 2025
(Dollars in Thousands)
| Period Ended | YTD 6/30/25 | Year 12/31/24 | Year 12/31/23 | Year 12/31/22 | Year 12/31/21 | |||||||||||||||
| Underwriting Revenue ($000) | ||||||||||||||||||||
| Direct Premiums Written | $ | 12,469 | $ | 29,314 | $ | 31,844 | $ | 29,662 | $ | 27,335 | ||||||||||
| Net Reinsurance Premiums | (3,858 | ) | (8,093 | ) | (7,952 | ) | (5,933 | ) | (5,717 | ) | ||||||||||
| Net Premiums Written | 8,611 | 21,221 | 23,892 | 23,729 | 21,618 | |||||||||||||||
| Change in Unearned Premiums Reserve | 468 | 2,169 | (709 | ) | 392 | (1,951 | ) | |||||||||||||
| Net Premiums Earned | 9,079 | 23,390 | 23,183 | 24,121 | 19,667 | |||||||||||||||
| Underwriting Deductions ($000) | ||||||||||||||||||||
| Net Losses Paid | NA | 12,340 | 12,888 | 12,906 | 11,789 | |||||||||||||||
| Net Loss Adjustment Expense Paid | NA | 2,165 | 1,791 | 1,682 | 1,511 | |||||||||||||||
| Net Change in Loss and LAE Reserves | NA | (484 | ) | 355 | 804 | 998 | ||||||||||||||
| Losses and LAE Incurred | 4,422 | 14,021 | 15,034 | 15,392 | 14,298 | |||||||||||||||
| Other Underwriting Expense Incurred | 2,874 | 6,134 | 7,261 | 7,759 | 7,146 | |||||||||||||||
| Other Underwriting Deductions | 0 | 0 | 0 | 0 | 0 | |||||||||||||||
| Total Losses and Expenses Incurred | 7,296 | 20,154 | 22,295 | 23,151 | 21,444 | |||||||||||||||
| Net Underwriting Gain (Loss) | 1,783 | 3,235 | 888 | 970 | (1,777 | ) | ||||||||||||||
| Policyholder Dividends | 0 | 0 | 0 | 0 | 0 | |||||||||||||||
| Investment Income ($000) | ||||||||||||||||||||
| Net Investment Income | 466 | 846 | 685 | 448 | 379 | |||||||||||||||
| Net Realized Capital Gains (Losses) | (57 | ) | 157 | 4 | (85 | ) | (9 | ) | ||||||||||||
| Other Income ($000) | ||||||||||||||||||||
| Finance Service Charges | 19 | 62 | 73 | 71 | 73 | |||||||||||||||
| All Other Income | 7 | 17 | 16 | 17 | 21 | |||||||||||||||
| Net Income ($000) | ||||||||||||||||||||
| Income (Loss) Before Income Taxes | 2,218 | 4,318 | 1,668 | 1,422 | (1,313 | ) | ||||||||||||||
| Federal Income Tax Expense (Benefit) | 444 | 765 | 369 | 248 | (155 | ) | ||||||||||||||
| Net Income (Loss) | $ | 1,774 | $ | 3,552 | $ | 1,299 | $ | 1,173 | $ | (1,158 | ) | |||||||||
IV-14
FELDMAN FINANCIAL ADVISORS, INC.
Exhibit IV-3 (continued)
1st Choice Advantage Insurance Company, Inc.
Unconsolidated Statutory Financial Data
For the Years Ended December 31, 2021 to 2024 and YTD Ended June 30, 2025
(Dollars in Thousands)
| Period Ended | YTD 6/30/25 | Year 12/31/24 | Year 12/31/23 | Year 12/31/22 | Year 12/31/21 | |||||||||||||||
| Operating Ratios (%) | ||||||||||||||||||||
| Loss Ratio | 38.29 | 50.12 | 58.31 | 56.21 | 63.83 | |||||||||||||||
| Loss Adjustment Expense Ratio | 10.42 | 9.83 | 6.54 | 7.60 | 8.87 | |||||||||||||||
| Loss and LAE Ratio | 48.71 | 59.94 | 64.85 | 63.81 | 72.70 | |||||||||||||||
| Net Commission Ratio | NA | 17.88 | 20.14 | 22.01 | 21.92 | |||||||||||||||
| Salaries and Benefits Ratio | NA | 3.13 | 2.82 | 3.59 | 4.32 | |||||||||||||||
| Tax, License, and Fees Ratio | NA | 3.62 | 3.59 | 3.25 | 3.13 | |||||||||||||||
| Administrative and Other Expense Ratio | NA | 4.28 | 3.84 | 3.84 | 3.69 | |||||||||||||||
| Expense Ratio | 33.37 | 28.90 | 30.39 | 32.70 | 33.05 | |||||||||||||||
| Policyholder Dividend Ratio | 0.00 | 0.00 | 0.00 | 0.00 | 0.00 | |||||||||||||||
| Combined Ratio | 82.08 | 88.85 | 95.24 | 96.51 | 105.76 | |||||||||||||||
| Combined Ratio Excluding Policyholder Dividend | 82.08 | 88.85 | 95.24 | 96.51 | 105.76 | |||||||||||||||
| Operating Ratio | 76.95 | 85.23 | 92.28 | 94.65 | 103.83 | |||||||||||||||
| Premium Analysis | ||||||||||||||||||||
| Direct Premiums Written ($000) | $ | 12,469 | $ | 29,314 | $ | 31,844 | $ | 29,662 | $ | 27,335 | ||||||||||
| Gross Premiums Written ($000) | 12,469 | 29,314 | 31,844 | 29,662 | 27,335 | |||||||||||||||
| Net Premiums Written ($000) | 8,611 | 21,221 | 23,892 | 23,729 | 21,618 | |||||||||||||||
| Growth DPW (%) | (29.85 | ) | (7.94 | ) | 7.35 | 8.51 | 25.68 | |||||||||||||
| Growth GPW (%) | (29.85 | ) | (7.94 | ) | 7.35 | 8.51 | 25.68 | |||||||||||||
| Growth NPW (%) | (36.27 | ) | (11.18 | ) | 0.69 | 9.76 | 21.50 | |||||||||||||
| Retention Ratio (NPW/GPW) (%) | 69.06 | 72.39 | 75.03 | 80.00 | 79.09 | |||||||||||||||
| Direct Premiums Written by Geography (%) | ||||||||||||||||||||
| Mid-Atlantic Region | 10.21 | 16.23 | 19.71 | 21.59 | 23.13 | |||||||||||||||
| Southeast Region | 34.33 | 28.48 | 26.66 | 25.58 | 23.84 | |||||||||||||||
| Midwest Region | 7.02 | 15.62 | 19.60 | 19.92 | 21.12 | |||||||||||||||
| Southwest Region | 48.44 | 39.67 | 34.03 | 32.91 | 31.91 | |||||||||||||||
| Direct Premiums Written by Segment (%) | ||||||||||||||||||||
| Homeowners' / Farmowners' Multi-peril | 11.20 | 8.22 | 7.50 | 6.40 | 5.36 | |||||||||||||||
| Commercial Multi-peril Combined | 46.25 | 37.93 | 32.36 | 31.10 | 29.92 | |||||||||||||||
| Commercial Automobile | 40.78 | 31.26 | 28.92 | 28.85 | NA | |||||||||||||||
| Personal Automobile | (0.58 | ) | 20.71 | 29.44 | 31.73 | NA | ||||||||||||||
| Marine Lines Combined | (0.02 | ) | 0.03 | 0.00 | 0.00 | 0.00 | ||||||||||||||
| Other | 2.37 | 1.85 | 1.78 | 1.91 | 64.71 | |||||||||||||||
Source: S&P Global.
IV-15
FELDMAN FINANCIAL ADVISORS, INC.
Exhibit IV-4
Ever-Greene Mutual Insurance Company
Unconsolidated Statutory Financial Data
For the Years Ended December 31, 2021 to 2024 and YTD Ended June 30, 2025
(Dollars in Thousands)
| Period Ended | YTD
6/30/25 | Year 12/31/24 | Year 12/31/23 | Year 12/31/22 | Year 12/31/21 | |||||||||||||||
| Balance Sheet Summary | ||||||||||||||||||||
| Total Cash and Investments | $ | 18,623 | $ | 16,584 | $ | 13,122 | $ | 7,437 | $ | 7,061 | ||||||||||
| Total Assets | 21,555 | 19,204 | 15,599 | 7,499 | 7,108 | |||||||||||||||
| Loss Reserves | 2,924 | 1,924 | 1,655 | 20 | 31 | |||||||||||||||
| Loss Adjustment Expense Reserves | 378 | 378 | 175 | 5 | 6 | |||||||||||||||
| Total Loss and LAE Reserves | 3,302 | 2,302 | 1,830 | 25 | 38 | |||||||||||||||
| Unearned Premium Reserve | 6,475 | 6,491 | 6,363 | 0 | 0 | |||||||||||||||
| Total Liabilities | 12,246 | 10,081 | 9,001 | 30 | 42 | |||||||||||||||
| Surplus Notes | 0 | 0 | 0 | 0 | 0 | |||||||||||||||
| Capital and Surplus | 9,308 | 9,123 | 6,598 | 7,470 | 7,066 | |||||||||||||||
| Capital and Surplus / Assets (%) | 43.19 | 47.51 | 42.30 | 99.60 | 99.40 | |||||||||||||||
| Total Reserves / Capital and Surplus (%) | 35.48 | 25.23 | 27.74 | 0.33 | 0.53 | |||||||||||||||
| Income Statement Summary | ||||||||||||||||||||
| Direct Premiums Written | 0 | 0 | 0 | 0 | 0 | |||||||||||||||
| Net Reinsurance Premiums | 6,373 | 12,845 | 13,088 | 400 | 400 | |||||||||||||||
| Net Premiums Written | 6,373 | 12,845 | 13,088 | 400 | 400 | |||||||||||||||
| Net Premiums Earned | 6,389 | 12,718 | 6,725 | 400 | 400 | |||||||||||||||
| Net Loss and LAE Incurred | 4,192 | 5,500 | 3,468 | 49 | 135 | |||||||||||||||
| Net Underwriting Expense Incurred | 2,322 | 4,615 | 4,637 | 98 | 96 | |||||||||||||||
| Policyholder Dividends | 0 | 0 | 0 | 0 | 0 | |||||||||||||||
| Net Underwriting Gain (Loss) | (125 | ) | 2,602 | (1,379 | ) | 253 | 169 | |||||||||||||
| Net Investment Income | 369 | 580 | 285 | 151 | 142 | |||||||||||||||
| Net Realized Capital Gains (Losses) | 0 | 0 | (0 | ) | (0 | ) | (0 | ) | ||||||||||||
| Income Tax Expense | 57 | 681 | 64 | 0 | 0 | |||||||||||||||
| Net Income | 186 | 2,501 | (1,158 | ) | 404 | 310 | ||||||||||||||
| Pre-tax Operating Income | 243 | 3,182 | (1,094 | ) | 404 | 310 | ||||||||||||||
| Premiums Written By Segment (%) | ||||||||||||||||||||
| Personal Lines - Direct Premiums Written | NA | NA | NA | NA | NA | |||||||||||||||
| Commercial Lines - Direct Premiums Written | NA | NA | NA | NA | NA | |||||||||||||||
| Personal Lines - Net Premiums Written | NA | 86.71 | 86.01 | 0.00 | NA | |||||||||||||||
| Commercial Lines - Net Premiums Written | NA | 13.29 | 13.99 | 100.00 | NA | |||||||||||||||
IV-16
FELDMAN FINANCIAL ADVISORS, INC.
Exhibit IV-4 (continued)
Ever-Greene Mutual Insurance Company
Unconsolidated Statutory Financial Data
For the Years Ended December 31, 2021 to 2024 and YTD Ended June 30, 2025
(Dollars in Thousands)
| Period Ended | YTD
6/30/25 | Year 12/31/24 | Year 12/31/23 | Year 12/31/22 | Year 12/31/21 | |||||||||||||||
| Operating Ratios (%) | ||||||||||||||||||||
| Growth Rate - Direct Premiums Written | NA | NA | NA | NA | NA | |||||||||||||||
| Growth Rate - Net Premiums Written | (1.92 | ) | (1.86 | ) | NM | 0.00 | 0.00 | |||||||||||||
| Growth Rate - Operating Income | (84.42 | ) | NM | NM | 30.20 | (7.28 | ) | |||||||||||||
| Loss and LAE Ratio | 65.62 | 43.25 | 51.56 | 12.17 | 33.72 | |||||||||||||||
| Expense Ratio | 36.44 | 35.93 | 35.43 | 24.54 | 24.09 | |||||||||||||||
| Policyholder Dividend Ratio | 0.00 | 0.00 | 0.00 | 0.00 | 0.00 | |||||||||||||||
| Combined Ratio | 102.05 | 79.18 | 86.99 | 36.72 | 57.81 | |||||||||||||||
| Operating Ratio | 96.29 | 74.62 | 82.75 | (1.07 | ) | 22.40 | ||||||||||||||
| Effective Tax Rate | 23.52 | 21.39 | NM | 0.00 | 0.00 | |||||||||||||||
| Net Yield on Invested Assets | 4.10 | 3.92 | 3.09 | 2.09 | 2.06 | |||||||||||||||
| Pre-Tax Operating Margin | 3.60 | 23.93 | (15.61 | ) | 73.35 | 57.32 | ||||||||||||||
| Return on Average Equity (C&S) | 3.94 | 32.98 | (17.79 | ) | 5.55 | 4.49 | ||||||||||||||
| Pre-Tax Operating ROE | 5.15 | 41.96 | (16.80 | ) | 5.55 | 4.49 | ||||||||||||||
| Return on Average Assets | 1.81 | 14.35 | (10.06 | ) | 5.52 | 4.45 | ||||||||||||||
| Capital, Leverage & Liquidity (%) | ||||||||||||||||||||
| RBC - Total Adjusted Capital ($000) | NA | 9,123 | 6,598 | NA | NA | |||||||||||||||
| ACL Risk Based Capital ($000) | NA | 1,816 | 1,812 | NA | NA | |||||||||||||||
| Risk Based Capital Ratio (TAC/ACL RBC) | NA | 502.31 | 364.03 | NA | NA | |||||||||||||||
| Net Premiums Written / Average C&S | 135.00 | 169.40 | 201.04 | 5.49 | 5.79 | |||||||||||||||
| Total Reins. Recoverable Excl. Affiliates / C&S | NA | 0.00 | 0.00 | 0.00 | 0.00 | |||||||||||||||
| Cash & Short-Term Investments / Liabilities | 3.68 | 4.42 | 8.74 | 1,656.94 | 1,420.86 | |||||||||||||||
| Reserve Analysis (%) | ||||||||||||||||||||
| Change in Loss & LAE Reserves / Reserves | 86.88 | 25.79 | NM | (33.56 | ) | (16.77 | ) | |||||||||||||
| Loss & LAE Reserves / Net Premiums Earned | 22.92 | 17.33 | 11.03 | 9.33 | 10.60 | |||||||||||||||
| Investments (%) | ||||||||||||||||||||
| Net Yield on Invested Assets | 4.10 | 3.92 | 3.09 | 2.09 | 2.06 | |||||||||||||||
| Unaffiliated Bonds / Unaffiliated Investments | 97.58 | 97.32 | 94.01 | 93.38 | 91.48 | |||||||||||||||
| Unaff. Preferred Stocks / Unaff. Investments | 0.00 | 0.00 | 0.00 | 0.00 | 0.00 | |||||||||||||||
| Unaff. Common Stocks / Unaff. Investments | 0.00 | 0.00 | 0.00 | 0.00 | 0.00 | |||||||||||||||
| Affiliated Investments / Total Investments | 0.00 | 0.00 | 0.00 | 0.00 | 0.00 | |||||||||||||||
| Gross Yield on Bonds (excluding affiliates) | NA | 4.03 | 3.07 | 2.30 | 2.26 | |||||||||||||||
| Bond Average Asset Quality (#1-6) | NA | 1.04 | 1.03 | 1.05 | 1.07 | |||||||||||||||
| Bonds Rated 3-6 / Total Bonds | NA | 0.00 | 0.00 | 0.00 | 0.01 | |||||||||||||||
| Bonds < 1 Year / Total Bonds | NA | 11.88 | 13.05 | 14.86 | 38.28 | |||||||||||||||
IV-17
FELDMAN FINANCIAL ADVISORS, INC.
Exhibit IV-4 (continued)
Ever-Greene Mutual Insurance Company
Unconsolidated Statutory Financial Data
For the Years Ended December 31, 2021 to 2024 and YTD Ended June 30, 2025
(Dollars in Thousands)
| Period Ended | YTD 6/30/25 | Year 12/31/24 | Year 12/31/23 | Year 12/31/22 | Year 12/31/21 | |||||||||||||||
| Assets ($000) | ||||||||||||||||||||
| Bonds | $ | 18,172 | $ | 16,139 | $ | 12,335 | $ | 6,945 | $ | 6,460 | ||||||||||
| Preferred Stocks | 0 | 0 | 0 | 0 | 0 | |||||||||||||||
| Common Stocks | 0 | 0 | 0 | 0 | 0 | |||||||||||||||
| Cash and Short-term Investments | 450 | 445 | 786 | 492 | 601 | |||||||||||||||
| Other Investments | 0 | 0 | 0 | 0 | 0 | |||||||||||||||
| Total Cash and Investments | 18,623 | 16,584 | 13,122 | 7,437 | 7,061 | |||||||||||||||
| Premiums and Considerations Due | 2,213 | 2,180 | 2,105 | 17 | 5 | |||||||||||||||
| Reinsurance Recoverable | 0 | 0 | 0 | 0 | 0 | |||||||||||||||
| Receivable from Parent, Subsidiary, or Affiliates | 0 | 0 | 0 | 0 | 0 | |||||||||||||||
| Other Assets | 720 | 440 | 372 | 45 | 42 | |||||||||||||||
| Total Assets | $ | 21,555 | $ | 19,204 | $ | 15,599 | $ | 7,499 | $ | 7,108 | ||||||||||
| Liabilities and Equity ($000) | ||||||||||||||||||||
| Loss Reserves | $ | 2,924 | $ | 1,924 | $ | 1,655 | $ | 20 | $ | 31 | ||||||||||
| Loss Adjustment Expense Reserves | 378 | 378 | 175 | 5 | 6 | |||||||||||||||
| Total Loss and LAE Reserves | 3,302 | 2,302 | 1,830 | 25 | 38 | |||||||||||||||
| Unearned Premium Reserve | 6,475 | 6,491 | 6,363 | 0 | 0 | |||||||||||||||
| Total Reinsurance Liabilities | 2,404 | 620 | 702 | 0 | 0 | |||||||||||||||
| Commissions, Other Expenses, and Taxes Due | 46 | 46 | 42 | 5 | 5 | |||||||||||||||
| Payable to Parent, Subsidiary, or Affiliates | 20 | 0 | 0 | 0 | 0 | |||||||||||||||
| Other Liabilities | 0 | 622 | 64 | 0 | 0 | |||||||||||||||
| Total Liabilities | 12,246 | 10,081 | 9,001 | 30 | 42 | |||||||||||||||
| Common Capital Stock | 0 | 0 | 0 | 0 | 0 | |||||||||||||||
| Unassigned Surplus | 9,308 | 9,123 | 6,598 | 7,470 | 7,066 | |||||||||||||||
| Other Including Gross Contributed | 0 | 0 | 0 | 0 | 0 | |||||||||||||||
| Total Capital and Surplus | 9,308 | 9,123 | 6,598 | 7,470 | 7,066 | |||||||||||||||
| Total Liabilities and Capital and Surplus | $ | 21,555 | $ | 19,204 | $ | 15,599 | $ | 7,499 | $ | 7,108 | ||||||||||
IV-18
FELDMAN FINANCIAL ADVISORS, INC.
Exhibit IV-4 (continued)
Ever-Greene Mutual Insurance Company
Unconsolidated Statutory Financial Data
For the Years Ended December 31, 2021 to 2024 and YTD Ended June 30, 2025
(Dollars in Thousands)
| Period Ended | YTD
6/30/25 | Year 12/31/24 | Year 12/31/23 | Year 12/31/22 | Year 12/31/21 | |||||||||||||||
| Underwriting Revenue ($000) | ||||||||||||||||||||
| Direct Premiums Written | 0 | 0 | 0 | 0 | 0 | |||||||||||||||
| Net Reinsurance Premiums | 6,373 | 12,845 | 13,088 | 400 | 400 | |||||||||||||||
| Net Premiums Written | 6,373 | 12,845 | 13,088 | 400 | 400 | |||||||||||||||
| Change in Unearned Premiums Reserve | 16 | (128 | ) | (6,363 | ) | 0 | 0 | |||||||||||||
| Net Premiums Earned | 6,389 | 12,718 | 6,725 | 400 | 400 | |||||||||||||||
| Underwriting Deductions ($000) | ||||||||||||||||||||
| Net Losses Paid | NA | 4,626 | 1,538 | 53 | 135 | |||||||||||||||
| Net Loss Adjustment Expense Paid | NA | 403 | 124 | 8 | 8 | |||||||||||||||
| Net Change in Loss and LAE Reserves | NA | 472 | 1,805 | (13 | ) | (8 | ) | |||||||||||||
| Losses and LAE Incurred | 4,192 | 5,500 | 3,468 | 49 | 135 | |||||||||||||||
| Other Underwriting Expense Incurred | 2,322 | 4,615 | 4,637 | 98 | 96 | |||||||||||||||
| Other Underwriting Deductions | 0 | 0 | 0 | 0 | 0 | |||||||||||||||
| Total Losses and Expenses Incurred | 6,514 | 10,116 | 8,105 | 147 | 231 | |||||||||||||||
| Net Underwriting Gain (Loss) | (125 | ) | 2,602 | (1,379 | ) | 253 | 169 | |||||||||||||
| Policyholder Dividends | 0 | 0 | 0 | 0 | 0 | |||||||||||||||
| Investment Income ($000) | ||||||||||||||||||||
| Net Investment Income | 369 | 580 | 285 | 151 | 142 | |||||||||||||||
| Net Realized Capital Gains (Losses) | 0 | 0 | 0 | 0 | 0 | |||||||||||||||
| Other Income ($000) | ||||||||||||||||||||
| Finance Service Charges | 0 | 0 | 0 | 0 | 0 | |||||||||||||||
| All Other Income | 0 | 0 | 0 | 0 | 0 | |||||||||||||||
| Net Income ($000) | ||||||||||||||||||||
| Income (Loss) Before Income Taxes | 243 | 3,182 | (1,094 | ) | 404 | 310 | ||||||||||||||
| Federal Income Tax Expense | 57 | 681 | 64 | 0 | 0 | |||||||||||||||
| Net Income (Loss) | $ | 186 | $ | 2,501 | $ | (1,158 | ) | $ | 404 | $ | 310 | |||||||||
IV-19
FELDMAN FINANCIAL ADVISORS, INC.
Exhibit IV-4 (continued)
Ever-Greene Mutual Insurance Company
Unconsolidated Statutory Financial Data
For the Years Ended December 31, 2021 to 2024 and YTD Ended June 30, 2025
(Dollars in Thousands)
| Period Ended | YTD 6/30/25 | Year 12/31/24 | Year 12/31/23 | Year 12/31/22 | Year 12/31/21 | |||||||||||||||
| Operating Ratios (%) | ||||||||||||||||||||
| Loss Ratio | 62.07 | 38.49 | 47.18 | 10.53 | 31.99 | |||||||||||||||
| Loss Adjustment Expense Ratio | 3.54 | 4.76 | 4.38 | 1.64 | 1.73 | |||||||||||||||
| Loss and LAE Ratio | 65.62 | 43.25 | 51.56 | 12.17 | 33.72 | |||||||||||||||
| Net Commission Ratio | NA | 35.00 | 35.00 | 20.00 | 20.00 | |||||||||||||||
| Salaries and Benefits Ratio | NA | 0.00 | 0.00 | 0.00 | 0.00 | |||||||||||||||
| Tax, License, and Fees Ratio | NA | 0.09 | 0.11 | 0.25 | 0.25 | |||||||||||||||
| Administrative and Other Expense Ratio | NA | 0.84 | 0.32 | 4.29 | 3.84 | |||||||||||||||
| Expense Ratio | NA | 35.93 | 35.43 | 24.54 | 24.09 | |||||||||||||||
| Policyholder Dividend Ratio | 0.00 | 0.00 | 0.00 | 0.00 | 0.00 | |||||||||||||||
| Combined Ratio | 102.05 | 79.18 | 86.99 | 36.72 | 57.81 | |||||||||||||||
| Combined Ratio Excluding Policyholder Dividend | 102.05 | 79.18 | 86.99 | 36.72 | 57.81 | |||||||||||||||
| Operating Ratio | 96.29 | 74.62 | 82.75 | (1.07 | ) | 22.40 | ||||||||||||||
| Premium Analysis | ||||||||||||||||||||
| Direct Premiums Written ($000) | $ | 0 | $ | 0 | $ | 0 | $ | 0 | $ | 0 | ||||||||||
| Gross Premiums Written ($000) | 6,373 | 12,845 | 13,088 | 400 | 400 | |||||||||||||||
| Net Premiums Written ($000) | 6,373 | 12,845 | 13,088 | 400 | 400 | |||||||||||||||
| Growth DPW (%) | NA | NA | NA | NA | NA | |||||||||||||||
| Growth GPW (%) | (1.92 | ) | (1.86 | ) | NM | 0.00 | 0.00 | |||||||||||||
| Growth NPW (%) | (1.92 | ) | (1.86 | ) | NM | 0.00 | 0.00 | |||||||||||||
| Retention Ratio (NPW/GPW) (%) | 100.00 | 100.00 | 100.00 | 100.00 | 100.00 | |||||||||||||||
| Direct Premiums Written by Geography (%) | ||||||||||||||||||||
| Mid-Atlantic Region | NA | NA | NA | NA | NA | |||||||||||||||
| Southeast Region | NA | NA | NA | NA | NA | |||||||||||||||
| Midwest Region | NA | NA | NA | NA | NA | |||||||||||||||
| Southwest Region | NA | NA | NA | NA | NA | |||||||||||||||
| West Region | NA | NA | NA | NA | NA | |||||||||||||||
| Northeast Region | NA | NA | NA | NA | NA | |||||||||||||||
| Net Premiums Written by Segment (%) | ||||||||||||||||||||
| Homeowners' / Farmowners' Multi-peril | NA | 86.71 | 86.01 | 0.00 | 0.00 | |||||||||||||||
| Fire and Allied Lines Combined | NA | 2.52 | 3.19 | 40.99 | 33.60 | |||||||||||||||
| Commercial Multi-peril Combined | NA | 10.76 | 10.80 | 0.00 | 0.00 | |||||||||||||||
| Marine Lines Combined | NA | 0.00 | 0.00 | 59.01 | 66.40 | |||||||||||||||
Source: S&P Global.
IV-20
FELDMAN FINANCIAL ADVISORS, INC.
Exhibit
V-1
Financial Performance Data for Public Property and Casualty Insurance Companies
| Total | Total | Tang. | LTM | Net Prem. | 2024 | 2024 | 2024 | |||||||||||||||||||||||||||||||||||||||||||||||||
| Total | Policy | Total | Resrvs./ | Equity/ | Equity/ | Total | Written/ | Loss | Expense | Comb. | LTM | LTM | ||||||||||||||||||||||||||||||||||||||||||||
| Assets | Reserves | Equity | Equity | Assets | Assets | Revenue | Avg. Eq. | Ratio | Ratio | Ratio | ROA | ROE | ||||||||||||||||||||||||||||||||||||||||||||
| Company | State | ($Mil.) | ($Mil.) | ($Mil.) | (x) | (%) | (%) | ($Mil.) | (x) | (%) | (%) | (%) | (%) | (%) | ||||||||||||||||||||||||||||||||||||||||||
| American Coastal Insurance Corp. | FL | 1,347 | 603 | 292 | 2.06 | 21.70 | 17.79 | 323 | 1.22 | 25.3 | 42.2 | 67.5 | 6.67 | 31.90 | ||||||||||||||||||||||||||||||||||||||||||
| American Financial Group, Inc. | OH | 30,669 | 17,860 | 4,516 | 3.95 | 14.72 | 13.32 | 8,298 | 1.60 | 63.3 | 27.9 | 91.2 | 2.46 | 16.96 | ||||||||||||||||||||||||||||||||||||||||||
| American Integrity Insurance Group | FL | 1,591 | 888 | 302 | 2.94 | 18.97 | 18.97 | 260 | NA | 47.9 | 33.0 | 80.9 | NA | NA | ||||||||||||||||||||||||||||||||||||||||||
| American International Group, Inc. | NY | 165,971 | 91,644 | 41,529 | 2.21 | 25.02 | 23.26 | 27,802 | NA | 59.8 | 32.0 | 91.8 | 1.94 | 7.44 | ||||||||||||||||||||||||||||||||||||||||||
| AMERISAFE, Inc. | LA | 1,155 | 797 | 266 | 3.00 | 22.99 | 22.99 | 306 | 1.01 | 58.1 | 30.6 | 88.7 | 4.23 | 18.08 | ||||||||||||||||||||||||||||||||||||||||||
| Arch Capital Group Ltd. | -- | 78,788 | 43,714 | 23,041 | 1.90 | 29.24 | 28.04 | 19,156 | 0.77 | 55.2 | 27.3 | 82.5 | 5.12 | 17.27 | ||||||||||||||||||||||||||||||||||||||||||
| Assurant, Inc. | GA | 35,526 | 23,360 | 5,499 | 4.25 | 15.48 | 7.22 | 12,305 | NA | 28.2 | 72.5 | 100.7 | 2.05 | 13.76 | ||||||||||||||||||||||||||||||||||||||||||
| Ategrity Specialty Ins. Co. Hldgs. | NY | 1,363 | 711 | 560 | 1.27 | 41.09 | 41.09 | 378 | 0.87 | 60.3 | 33.6 | 93.9 | NA | 16.28 | ||||||||||||||||||||||||||||||||||||||||||
| AXIS Capital Holdings Limited | -- | 34,151 | 24,034 | 6,174 | 3.89 | 18.08 | 17.51 | 6,238 | 0.97 | 59.5 | 32.8 | 92.3 | 2.71 | 14.87 | ||||||||||||||||||||||||||||||||||||||||||
| Berkshire Hathaway Inc. | NE | 1,163,968 | 200,800 | 670,276 | 0.30 | 57.59 | 52.74 | 393,623 | NA | 67.5 | NA | NA | 5.51 | 9.83 | ||||||||||||||||||||||||||||||||||||||||||
| Bowhead Specialty Holdings Inc. | NY | 1,942 | 1,453 | 407 | 3.57 | 20.97 | 20.97 | 492 | 1.37 | 64.4 | 31.4 | 95.8 | 2.99 | 13.20 | ||||||||||||||||||||||||||||||||||||||||||
| Cincinnati Financial Corporation | OH | 38,842 | 19,475 | 14,301 | 1.36 | 36.82 | 36.82 | 11,672 | 0.74 | 63.5 | 29.9 | 93.4 | 4.93 | 13.24 | ||||||||||||||||||||||||||||||||||||||||||
| CNA Financial Corporation | IL | 68,936 | 47,422 | 10,661 | 4.45 | 15.47 | 15.28 | 14,651 | NA | 64.3 | 30.6 | 94.9 | 1.31 | 8.39 | ||||||||||||||||||||||||||||||||||||||||||
| Conifer Holdings, Inc. | MI | 283 | 200 | 28 | 7.09 | 9.96 | 9.64 | 63 | 1.20 | 120.2 | 35.8 | 156.0 | 10.63 | 111.16 | ||||||||||||||||||||||||||||||||||||||||||
| Donegal Group Inc. | PA | 2,408 | 1,753 | 606 | 2.89 | 25.15 | 24.95 | 994 | 1.69 | 64.5 | 34.1 | 98.6 | 3.52 | 15.14 | ||||||||||||||||||||||||||||||||||||||||||
| Employers Holdings, Inc. | NV | 3,543 | 2,216 | 1,083 | 2.05 | 30.57 | 29.30 | 890 | 0.71 | 60.9 | 37.0 | 97.9 | 2.84 | 9.42 | ||||||||||||||||||||||||||||||||||||||||||
| Enact Holdings, Inc. | NC | 6,773 | 653 | 5,223 | 0.13 | 77.11 | 77.11 | 1,223 | 0.19 | 4.0 | 23.0 | 27.0 | 10.26 | 13.42 | ||||||||||||||||||||||||||||||||||||||||||
| Everest Group, Ltd. | -- | 60,519 | 40,119 | 15,019 | 2.67 | 24.82 | 24.82 | 17,675 | 1.08 | 74.4 | 27.9 | 102.3 | 1.42 | 5.56 | ||||||||||||||||||||||||||||||||||||||||||
| Global Indemnity Group, LLC | PA | 1,721 | 971 | 695 | 1.40 | 40.41 | 39.75 | 439 | 0.57 | 56.6 | 39.0 | 95.6 | 1.62 | 4.10 | ||||||||||||||||||||||||||||||||||||||||||
| Hamilton Insurance Group, Ltd. | -- | 8,913 | 5,399 | 2,559 | 2.11 | 28.71 | 27.98 | 2,593 | 0.89 | 58.2 | 33.1 | 91.3 | 7.25 | 24.77 | ||||||||||||||||||||||||||||||||||||||||||
| HCI Group, Inc. | FL | 2,353 | 1,324 | 785 | 1.69 | 33.35 | 33.24 | 776 | 1.50 | 55.3 | 27.8 | 83.1 | 7.30 | 30.16 | ||||||||||||||||||||||||||||||||||||||||||
| Heritage Insurance Holdings, Inc. | FL | 2,537 | 1,475 | 383 | 3.85 | 15.11 | 13.98 | 842 | 2.51 | 58.2 | 36.0 | 94.2 | 4.44 | 35.11 | ||||||||||||||||||||||||||||||||||||||||||
| Hippo Holdings Inc. | CA | 1,706 | 895 | 334 | 2.68 | 19.58 | 16.57 | 425 | 1.12 | 77.0 | 44.7 | 121.7 | 0.01 | 0.06 | ||||||||||||||||||||||||||||||||||||||||||
| Horace Mann Educators Corp. | IL | 14,728 | 8,634 | 1,360 | 6.35 | 9.24 | 7.97 | 1,649 | 1.26 | 70.7 | 27.2 | 97.9 | 0.96 | 10.77 | ||||||||||||||||||||||||||||||||||||||||||
| James River Group Holdings, Ltd. | -- | 5,018 | 3,647 | 493 | 7.41 | 9.82 | 5.80 | 665 | 1.13 | 86.2 | 31.4 | 117.6 | (1.82 | ) | (18.03 | ) | ||||||||||||||||||||||||||||||||||||||||
| Kestrel Group Ltd | -- | NA | NA | NA | NA | NA | NA | NA | NA | NA | NA | NA | NA | NA | ||||||||||||||||||||||||||||||||||||||||||
| Kingstone Companies, Inc. | NY | 393 | 270 | 95 | 2.84 | 24.12 | 24.02 | 186 | 2.72 | 48.7 | 31.3 | 80.0 | 7.53 | 39.87 | ||||||||||||||||||||||||||||||||||||||||||
| Kingsway Financial Services Inc. | IL | 208 | NA | 19 | NA | 9.32 | (71.19 | ) | 120 | NA | NA | NA | NA | (5.22 | ) | (85.46 | ) | |||||||||||||||||||||||||||||||||||||||
| Kinsale Capital Group, Inc. | VA | 5,557 | 3,545 | 1,723 | 2.06 | 31.00 | 30.96 | 1,723 | 1.03 | 55.8 | 20.6 | 76.4 | 9.02 | 29.82 | ||||||||||||||||||||||||||||||||||||||||||
| Lemonade, Inc. | NY | 1,935 | 819 | 527 | 1.55 | 27.25 | 26.19 | 601 | 0.80 | 75.0 | NA | NA | (11.10 | ) | (35.28 | ) | ||||||||||||||||||||||||||||||||||||||||
V-1
FELDMAN FINANCIAL ADVISORS, INC.
Exhibit
V-1 (continued)
Financial Performance Data for Public Property and Casualty Insurance Companies
| Total | Policy | Total | Tang. | LTM Net Prem. | 2024 | 2024 | 2024 | |||||||||||||||||||||||||||||||||||||||||||||||||
| Total | Policy | Total | Resrvs./ | Equity/ | Equity/ | Total | Written/ | Loss | Expense | Comb. | LTM | LTM | ||||||||||||||||||||||||||||||||||||||||||||
| Assets | Reserves | Equity | Equity | Assets | Assets | Revenue | Avg.Eq. | Ratio | Ratio | Ratio | ROA | ROE | ||||||||||||||||||||||||||||||||||||||||||||
| Company | State | ($Mil.) | ($Mil.) | ($Mil.) | (x) | (%) | (%) | ($Mil.) | (x) | (%) | (%) | (%) | (%) | (%) | ||||||||||||||||||||||||||||||||||||||||||
| Loews Corporation | NY | 84,668 | 47,422 | 18,389 | 2.58 | 21.72 | 21.39 | 18,061 | NA | 64.3 | 30.6 | 94.9 | 1.72 | 7.90 | ||||||||||||||||||||||||||||||||||||||||||
| Markel Group Inc. | VA | 66,791 | 38,201 | 17,337 | 2.20 | 25.96 | 20.68 | 16,454 | 0.49 | 59.9 | 35.3 | 95.2 | 3.67 | 13.64 | ||||||||||||||||||||||||||||||||||||||||||
| Mercury General Corporation | CA | 9,083 | 5,797 | 1,969 | 2.94 | 21.68 | 21.25 | 5,768 | 2.98 | 72.6 | 23.4 | 96.0 | 4.60 | 20.98 | ||||||||||||||||||||||||||||||||||||||||||
| NI Holdings, Inc. | ND | 620 | 346 | 243 | 1.42 | 39.24 | 39.23 | 310 | 1.14 | 66.9 | 33.8 | 100.7 | 0.28 | 0.63 | ||||||||||||||||||||||||||||||||||||||||||
| Old Republic International Corp. | IL | 29,256 | 18,554 | 6,204 | 2.99 | 21.20 | NA | 8,666 | NA | 41.7 | 52.2 | 93.9 | 3.18 | 14.90 | ||||||||||||||||||||||||||||||||||||||||||
| Palomar Holdings, Inc. | CA | 2,832 | 1,500 | 847 | 1.77 | 29.91 | 28.32 | 682 | 1.06 | 26.4 | 51.7 | 78.1 | 6.60 | 21.27 | ||||||||||||||||||||||||||||||||||||||||||
| RenaissanceRe Holdings Ltd. | -- | 54,728 | 30,475 | 10,800 | 2.82 | 19.73 | 18.74 | 12,944 | 0.95 | 52.8 | 31.1 | 83.9 | 5.24 | 25.81 | ||||||||||||||||||||||||||||||||||||||||||
| RLI Corp. | IL | 5,991 | 3,841 | 1,735 | 2.21 | 28.96 | 28.31 | 1,811 | 0.99 | 48.4 | 37.8 | 86.2 | 5.65 | 19.80 | ||||||||||||||||||||||||||||||||||||||||||
| Root, Inc. | OH | 1,588 | 840 | 245 | 3.43 | 15.40 | NA | 1,365 | 6.61 | 68.5 | 27.9 | 96.4 | 5.52 | 42.01 | ||||||||||||||||||||||||||||||||||||||||||
| Safety Insurance Group, Inc. | MA | 2,364 | 1,345 | 873 | 1.54 | 36.94 | 36.28 | 1,200 | 1.36 | 70.9 | 30.2 | 101.1 | 3.73 | 10.06 | ||||||||||||||||||||||||||||||||||||||||||
| Selective Insurance Group, Inc. | NJ | 14,468 | 9,627 | 3,369 | 2.86 | 23.29 | 23.25 | 5,113 | 1.51 | 72.3 | 30.7 | 103.0 | 2.81 | 12.09 | ||||||||||||||||||||||||||||||||||||||||||
| SiriusPoint Ltd. | -- | 12,356 | 7,671 | 2,107 | 3.64 | 17.05 | 16.13 | 2,651 | 1.11 | 58.4 | 29.9 | 88.3 | 0.94 | 5.16 | ||||||||||||||||||||||||||||||||||||||||||
| Skyward Specialty Insurance Group | TX | 4,336 | 2,733 | 900 | 3.04 | 20.75 | 19.10 | 1,254 | 1.50 | 63.4 | 28.9 | 92.3 | 3.46 | 16.22 | ||||||||||||||||||||||||||||||||||||||||||
| Slide Insurance Holdings, Inc. | FL | 2,814 | 1,292 | 868 | 1.49 | 30.85 | 30.69 | 982 | NA | 42.8 | 29.5 | 72.3 | NA | NA | ||||||||||||||||||||||||||||||||||||||||||
| The Allstate Corporation | IL | 115,894 | 72,450 | 24,005 | 3.02 | 20.71 | 18.52 | 67,108 | NA | 72.6 | 21.7 | 94.3 | 5.08 | 26.88 | ||||||||||||||||||||||||||||||||||||||||||
| The Hanover Insurance Group, Inc. | MA | 15,732 | 10,971 | 3,216 | 3.41 | 20.44 | 19.53 | 6,407 | 2.13 | 63.5 | 31.3 | 94.8 | 3.62 | 19.07 | ||||||||||||||||||||||||||||||||||||||||||
| The Hartford Insurance Group, Inc. | CT | 83,639 | 56,874 | 17,518 | 3.25 | 20.94 | 18.50 | 27,427 | NA | 63.0 | 30.2 | 93.2 | 3.98 | 19.40 | ||||||||||||||||||||||||||||||||||||||||||
| The Progressive Corporation | OH | 115,480 | 67,489 | 32,604 | 2.07 | 28.23 | NA | 82,376 | 2.91 | 69.1 | 19.7 | 88.8 | 9.73 | 38.04 | ||||||||||||||||||||||||||||||||||||||||||
| The Travelers Companies, Inc. | NY | 138,873 | 93,341 | 29,518 | 3.16 | 21.26 | 18.54 | 47,838 | 1.59 | 64.0 | 28.5 | 92.5 | 3.90 | 18.91 | ||||||||||||||||||||||||||||||||||||||||||
| Tiptree Inc. | CT | 6,148 | 3,363 | 723 | 4.65 | 11.77 | 7.17 | 2,024 | 2.31 | NA | NA | NA | 1.65 | 14.08 | ||||||||||||||||||||||||||||||||||||||||||
| Trupanion, Inc. | WA | 848 | 53 | 355 | 0.15 | 41.93 | 36.93 | 1,360 | NA | 82.5 | NA | NA | 1.34 | 3.37 | ||||||||||||||||||||||||||||||||||||||||||
| United Fire Group, Inc. | IA | 3,661 | 2,560 | 846 | 3.03 | 23.10 | 23.02 | 1,323 | 1.63 | 63.3 | 35.9 | 99.2 | 2.61 | 11.58 | ||||||||||||||||||||||||||||||||||||||||||
| Universal Insurance Holdings, Inc. | FL | 3,276 | 1,853 | 458 | 4.05 | 13.98 | 13.91 | 1,567 | 3.43 | 79.2 | 24.9 | 104.1 | 2.37 | 16.38 | ||||||||||||||||||||||||||||||||||||||||||
| W. R. Berkley Corporation | CT | 42,658 | 28,315 | 9,305 | 3.04 | 21.81 | 21.47 | 14,286 | 1.45 | 61.8 | 28.5 | 90.3 | 4.31 | 20.50 | ||||||||||||||||||||||||||||||||||||||||||
| White Mountains Insurance Group | -- | 11,823 | 4,509 | 5,340 | 0.84 | 45.17 | 41.16 | 2,464 | 0.38 | 53.9 | 27.9 | 81.8 | 3.12 | 6.39 | ||||||||||||||||||||||||||||||||||||||||||
| Overall P&C Insurance Group Median | 6,069 | 3,647 | 1,541 | 2.84 | 22.40 | 21.47 | 1,686 | 1.17 | 63.2 | 30.7 | 93.9 | 3.52 | 14.88 | |||||||||||||||||||||||||||||||||||||||||||
| Overall P&C Insurance Group Mean | 47,644 | 19,927 | 18,491 | 2.78 | 25.48 | 22.73 | 15,885 | 1.49 | 60.9 | 32.5 | 92.5 | 3.48 | 14.94 | |||||||||||||||||||||||||||||||||||||||||||
Source: S&P Global; financial data as of the LTM ended June 30, 2025.
V-2
FELDMAN FINANCIAL ADVISORS, INC.
Exhibit V-2
Market Valuation Data for Public Property and Casualty Insurance Companies
| Company | Ticker | Exchange | State | Closing
Price 9/17/25 ($) | Total
Market Value ($Mil.) | Price/
Book Value (%) | Price/
Tang. Book (%) | Price/
LTM EPS (x) | Price/
Oper. EPS (x) | Price/
2025 Est. EPS (x) | Price/
LTM Rev. (x) | Price/
Total Assets (%) | Current Div. Yield (%) | One-Yr.
Price Change (%) | ||||||||||||||||||||||||||||||||||||||
| American Coastal Insurance Corp. | ACIC | NASDAQ | FL | 11.13 | 543 | 185.6 | 237.8 | 6.83 | 6.87 | NA | 1.68 | 40.30 | 0.00 | (0.71 | ) | |||||||||||||||||||||||||||||||||||||
| American Financial Group, Inc. | AFG | NYSE | OH | 139.04 | 11,565 | 256.7 | 288.6 | 15.28 | 14.82 | 17.99 | 1.39 | 37.71 | 2.31 | 1.85 | ||||||||||||||||||||||||||||||||||||||
| American Integrity Insurance Group | AII | NYSE | FL | 21.11 | 401 | 136.9 | 136.9 | 0.07 | 0.06 | 14.00 | 1.54 | 25.21 | 0.00 | 24.91 | ||||||||||||||||||||||||||||||||||||||
| American International Group, Inc. | AIG | NYSE | NY | 76.80 | 42,293 | 103.6 | 114.1 | 14.55 | 13.91 | 12.12 | 1.52 | 25.48 | 2.36 | 4.35 | ||||||||||||||||||||||||||||||||||||||
| AMERISAFE, Inc. | AMSF | NASDAQ | LA | 44.07 | 836 | 315.6 | 315.6 | 16.69 | 18.52 | 11.86 | 2.73 | 72.41 | 3.60 | (10.19 | ) | |||||||||||||||||||||||||||||||||||||
| Arch Capital Group Ltd. | ACGL | NASDAQ | -- | 87.35 | 32,467 | 147.6 | 157.0 | 9.01 | 10.31 | 14.82 | 1.69 | 41.21 | 0.00 | (23.35 | ) | |||||||||||||||||||||||||||||||||||||
| Assurant, Inc. | AIZ | NYSE | GA | 209.50 | 10,366 | 192.5 | 452.8 | 15.17 | 12.87 | 8.26 | 0.84 | 29.18 | 1.56 | 7.03 | ||||||||||||||||||||||||||||||||||||||
| Ategrity Specialty Ins. Co. Hldgs. | ASIC | NYSE | NY | 20.61 | 992 | 177.0 | 177.0 | 55.70 | 52.85 | 9.92 | 2.62 | 72.78 | 0.00 | (16.49 | ) | |||||||||||||||||||||||||||||||||||||
| AXIS Capital Holdings Limited | AXS | NYSE | -- | 94.92 | 7,376 | 131.9 | 137.7 | 9.13 | 7.58 | 14.46 | 1.18 | 21.60 | 1.87 | 19.52 | ||||||||||||||||||||||||||||||||||||||
| Berkshire Hathaway Inc. | BRK.A | NYSE | NE | 739,380 | 383,881 | 159.2 | 193.8 | 16.89 | 25.52 | 18.23 | 0.98 | 32.98 | 0.00 | 7.90 | ||||||||||||||||||||||||||||||||||||||
| Bowhead Specialty Holdings Inc. | BOW | NYSE | NY | 28.15 | 908 | 226.6 | 226.6 | 19.15 | 18.64 | 21.57 | 1.85 | 46.77 | 0.00 | (3.76 | ) | |||||||||||||||||||||||||||||||||||||
| Cincinnati Financial Corporation | CINF | NASDAQ | OH | 154.48 | 24,157 | 168.8 | 168.8 | 13.40 | 24.56 | 10.53 | 2.07 | 62.19 | 2.27 | 13.45 | ||||||||||||||||||||||||||||||||||||||
| CNA Financial Corporation | CNA | NYSE | IL | 46.15 | 12,456 | 117.2 | 118.8 | 14.38 | 10.05 | 11.59 | 0.85 | 18.07 | 4.00 | (7.99 | ) | |||||||||||||||||||||||||||||||||||||
| Conifer Holdings, Inc. | CNFR | NASDAQ | MI | 2.03 | 25 | 88.0 | 91.1 | 0.83 | NM | 10.20 | 0.40 | 8.76 | 0.00 | 93.33 | ||||||||||||||||||||||||||||||||||||||
| Donegal Group Inc. | DGIC.A | NASDAQ | PA | 19.15 | 592 | 115.2 | 116.5 | 8.17 | 8.33 | 14.58 | 0.60 | 24.60 | 3.83 | 24.92 | ||||||||||||||||||||||||||||||||||||||
| Employers Holdings, Inc. | EIG | NYSE | NV | 42.24 | 974 | 92.6 | 98.4 | 10.30 | 12.76 | 12.76 | 1.10 | 27.49 | 3.09 | (12.07 | ) | |||||||||||||||||||||||||||||||||||||
| Enact Holdings, Inc. | ACT | NASDAQ | NC | 37.74 | 5,567 | 107.2 | 107.2 | 8.60 | 8.39 | 7.43 | 4.55 | 82.19 | 2.23 | 3.85 | ||||||||||||||||||||||||||||||||||||||
| Everest Group, Ltd. | EG | NYSE | -- | 333.65 | 13,868 | 93.1 | 93.1 | 17.71 | 16.65 | NA | 0.78 | 22.91 | 2.42 | (13.91 | ) | |||||||||||||||||||||||||||||||||||||
| Global Indemnity Group, LLC | GBLI | NYSE | PA | 29.73 | 312 | 61.5 | 63.2 | 15.03 | 14.72 | 9.25 | 0.71 | 18.14 | 4.67 | (5.96 | ) | |||||||||||||||||||||||||||||||||||||
V-3
FELDMAN FINANCIAL ADVISORS, INC.
Exhibit V-2 (continued)
Market Valuation Data for Public Property and Casualty Insurance Companies
| Company | Ticker | Exchange | State | Closing
Price 9/17/25 ($) |
Total
Market Value ($Mil.) |
Price/
Book Value (%) |
Price/
Tang. Book (%) |
Price/
LTM EPS (x) |
Price/
Oper. EPS (x) |
Price/
2025 Est. EPS (x) |
Price/
LTM Rev. (x) |
Price/
Total Assets (%) |
Current
Div. Yield (%) |
One-Yr.
Price Change (%) |
||||||||||||||||||||||||||||||||||||||
| Hamilton Insurance Group, Ltd. | HG | NYSE | -- | 23.56 | 1,556 | 92.2 | 95.6 | 6.51 | NA | 13.59 | 0.60 | 17.46 | 0.00 | 29.52 | ||||||||||||||||||||||||||||||||||||||
| HCI Group, Inc. | HCI | NYSE | FL | 180.79 | 2,308 | 308.8 | 310.4 | 16.03 | NA | 7.66 | 2.98 | 98.10 | 0.90 | 70.75 | ||||||||||||||||||||||||||||||||||||||
| Heritage Insurance Holdings, Inc. | HRTG | NYSE | FL | 24.87 | 718 | 201.3 | 220.4 | 7.17 | 7.13 | 4.69 | 0.85 | 28.30 | 0.00 | 59.32 | ||||||||||||||||||||||||||||||||||||||
| Hippo Holdings Inc. | HIPO | NYSE | CA | 36.99 | 931 | 284.2 | 348.6 | NM | NA | 14.03 | 2.19 | 54.58 | 0.00 | 104.03 | ||||||||||||||||||||||||||||||||||||||
| Horace Mann Educators Corp. | HMN | NYSE | IL | 45.76 | 1,859 | 137.4 | 161.4 | 13.54 | 10.15 | 16.77 | 1.13 | 12.62 | 3.06 | 34.27 | ||||||||||||||||||||||||||||||||||||||
| James River Group Holdings, Ltd. | JRVR | NASDAQ | -- | 5.08 | 233 | 47.3 | 83.7 | NM | NM | 7.71 | 0.35 | 4.65 | 0.77 | (22.56 | ) | |||||||||||||||||||||||||||||||||||||
| Kestrel Group Ltd | KG | NASDAQ | -- | 28.13 | 218 | 145.1 | 157.1 | NA | NA | 15.11 | NA | NA | 0.00 | (14.76 | ) | |||||||||||||||||||||||||||||||||||||
| Kingstone Companies, Inc. | KINS | NASDAQ | NY | 13.54 | 191 | 201.8 | 202.8 | 6.77 | 7.20 | 33.78 | 1.03 | 48.67 | 1.47 | 46.85 | ||||||||||||||||||||||||||||||||||||||
| Kingsway Financial Services Inc. | KFS | NYSE | IL | 14.37 | 414 | NM | NM | NM | 42.26 | 20.11 | 3.46 | 199.35 | 0.00 | 79.18 | ||||||||||||||||||||||||||||||||||||||
| Kinsale Capital Group, Inc. | KNSL | NYSE | VA | 430.66 | 9,979 | 582.5 | 583.7 | 22.47 | 24.88 | 11.11 | 5.79 | 179.60 | 0.16 | (5.43 | ) | |||||||||||||||||||||||||||||||||||||
| Lemonade, Inc. | LMND | NYSE | NY | 55.81 | 4,234 | NM | NM | NM | NA | 19.39 | 7.05 | 218.84 | 0.00 | 206.99 | ||||||||||||||||||||||||||||||||||||||
| Loews Corporation | L | NYSE | NY | 96.79 | 19,890 | 114.7 | 117.0 | 15.39 | 14.55 | NA | 1.10 | 23.49 | 0.26 | 22.07 | ||||||||||||||||||||||||||||||||||||||
| Markel Group Inc. | MKL | NYSE | VA | 1,927.84 | 24,257 | 140.9 | 189.5 | 11.56 | NA | 15.94 | 1.47 | 36.32 | 0.00 | 22.13 | ||||||||||||||||||||||||||||||||||||||
V-4
FELDMAN FINANCIAL ADVISORS, INC.
Exhibit V-2 (continued)
Market Valuation Data for Public Property and Casualty Insurance Companies
| Company | Ticker | Exchange | State | Closing
Price 9/17/25 ($) |
Total
Market Value ($Mil.) |
Price/
Book Value (%) |
Price/
Tang. Book (%) |
Price/
LTM EPS (x) |
Price/
Oper. EPS (x) |
Price/
2025 Est. EPS (x) |
Price/
LTM Rev. (x) |
Price/
Total Assets (%) |
Current
Div. Yield (%) |
One-Yr.
Price Change (%) |
||||||||||||||||||||||||||||||||||||||
| Mercury General Corporation | MCY | NYSE | CA | 77.66 | 4,300 | 218.4 | 224.1 | 11.03 | 13.62 | 14.61 | 0.75 | 47.35 | 1.64 | 30.85 | ||||||||||||||||||||||||||||||||||||||
| NI Holdings, Inc. | NODK | NASDAQ | ND | 13.70 | 283 | 116.6 | 116.7 | NM | NA | 18.87 | 0.91 | 45.68 | 0.00 | (9.81 | ) | |||||||||||||||||||||||||||||||||||||
| Old Republic International Corp. | ORI | NYSE | IL | 39.66 | 9,542 | 159.3 | NA | 9.89 | 11.60 | 16.65 | 1.10 | 32.61 | 2.96 | 12.07 | ||||||||||||||||||||||||||||||||||||||
| Palomar Holdings, Inc. | PLMR | NASDAQ | CA | 115.05 | 3,081 | 363.6 | 392.8 | 20.22 | 18.03 | 26.79 | 4.52 | 108.79 | 0.00 | 17.67 | ||||||||||||||||||||||||||||||||||||||
| RenaissanceRe Holdings Ltd. | RNR | NYSE | -- | 240.96 | 11,155 | 113.6 | 121.7 | 6.16 | 8.28 | 14.55 | 0.86 | 20.38 | 0.67 | (8.58 | ) | |||||||||||||||||||||||||||||||||||||
| RLI Corp. | RLI | NYSE | IL | 65.41 | 5,992 | 346.3 | 357.3 | 18.74 | 23.11 | 13.16 | 3.31 | 100.02 | 0.98 | (14.65 | ) | |||||||||||||||||||||||||||||||||||||
| Root, Inc. | ROOT | NASDAQ | OH | 95.29 | 1,298 | 600.2 | NA | 19.02 | NA | 16.19 | 0.95 | 81.74 | 0.00 | 132.64 | ||||||||||||||||||||||||||||||||||||||
| Safety Insurance Group, Inc. | SAFT | NASDAQ | MA | 71.72 | 1,068 | 122.3 | 125.8 | 12.56 | 15.04 | 11.55 | 0.89 | 45.18 | 5.14 | (13.39 | ) | |||||||||||||||||||||||||||||||||||||
| Selective Insurance Group, Inc. | SIGI | NASDAQ | NJ | 77.42 | 4,711 | 148.6 | 149.0 | 12.67 | 12.71 | 11.46 | 0.92 | 32.56 | 1.98 | (16.00 | ) | |||||||||||||||||||||||||||||||||||||
| SiriusPoint Ltd. | SPNT | NYSE | -- | 17.96 | 2,097 | 110.0 | 118.4 | 20.18 | NA | NA | 0.79 | 16.97 | 0.00 | 27.38 | ||||||||||||||||||||||||||||||||||||||
| Skyward Specialty Insurance Group | SKWD | NASDAQ | TX | 46.74 | 1,892 | 210.3 | 233.3 | 14.70 | 14.16 | NA | 1.51 | 43.64 | 0.00 | 17.88 | ||||||||||||||||||||||||||||||||||||||
| Slide Insurance Holdings, Inc. | SLDE | NASDAQ | FL | 12.74 | 1,599 | 183.8 | 185.2 | 1.33 | NA | 17.50 | 1.63 | 56.82 | 0.00 | (37.09 | ) | |||||||||||||||||||||||||||||||||||||
| The Allstate Corporation | ALL | NYSE | IL | 197.25 | 51,726 | 236.8 | 276.0 | 9.27 | 9.37 | 10.48 | 0.77 | 44.63 | 2.04 | 3.67 | ||||||||||||||||||||||||||||||||||||||
| The Hanover Insurance Group, Inc. | THG | NYSE | MA | 174.92 | 6,257 | 195.2 | 206.7 | 11.52 | 10.54 | 5.98 | 0.98 | 39.77 | 2.06 | 17.36 | ||||||||||||||||||||||||||||||||||||||
| The Hartford Insurance Group, Inc. | HIG | NYSE | CT | 130.65 | 36,454 | 214.8 | 251.6 | 11.84 | 11.79 | 16.36 | 1.33 | 43.58 | 1.60 | 11.60 | ||||||||||||||||||||||||||||||||||||||
| The Progressive Corporation | PGR | NYSE | OH | 243.61 | 143,603 | 438.0 | NA | 13.72 | NA | 16.36 | 1.74 | 124.35 | 0.16 | (5.18 | ) | |||||||||||||||||||||||||||||||||||||
| The Travelers Companies, Inc. | TRV | NYSE | NY | 275.03 | 61,919 | 209.7 | 248.8 | 12.16 | 12.06 | 16.36 | 1.29 | 44.59 | 1.62 | 13.87 | ||||||||||||||||||||||||||||||||||||||
| Tiptree Inc. | TIPT | NASDAQ | CT | 22.83 | 856 | 171.3 | 438.6 | 17.78 | 8.27 | 16.36 | 0.42 | 13.93 | 0.99 | 14.44 | ||||||||||||||||||||||||||||||||||||||
| Trupanion, Inc. | TRUP | NASDAQ | WA | 45.10 | 1,939 | 545.4 | 672.4 | NM | NA | 16.36 | 1.43 | 228.72 | 0.00 | (3.11 | ) | |||||||||||||||||||||||||||||||||||||
| United Fire Group, Inc. | UFCS | NASDAQ | IA | 31.67 | 807 | 95.5 | 95.9 | 9.02 | 8.65 | 16.36 | 0.61 | 22.05 | 2.06 | 51.75 | ||||||||||||||||||||||||||||||||||||||
| Universal Insurance Holdings, Inc. | UVE | NYSE | FL | 25.30 | 716 | 154.4 | 155.2 | 11.05 | 11.55 | 16.36 | 0.46 | 21.87 | 2.60 | 14.95 | ||||||||||||||||||||||||||||||||||||||
| W. R. Berkley Corporation | WRB | NYSE | CT | 73.11 | 27,730 | 298.4 | 304.5 | 16.65 | 17.57 | 16.36 | 1.94 | 65.01 | 0.50 | 25.77 | ||||||||||||||||||||||||||||||||||||||
| White Mountains Insurance Group | WTM | NYSE | -- | 1,722.98 | 4,380 | 95.5 | 115.6 | 21.58 | NA | NM | 1.78 | 37.05 | 0.06 | 1.07 | ||||||||||||||||||||||||||||||||||||||
| Overall P&C Insurance Group Median | NA | 2,308 | 159.3 | 172.9 | 13.03 | 12.74 | 14.58 | 1.15 | 40.03 | 0.77 | 11.60 | |||||||||||||||||||||||||||||||||||||||||
| Overall P&C Insurance Group Mean | NA | 18,178 | 197.8 | 211.1 | 13.49 | 14.75 | 14.45 | 1.63 | 54.62 | 1.23 | 18.62 | |||||||||||||||||||||||||||||||||||||||||
Source: S&P Global; market price data as of September 17, 2025 and financial data as of the LTM ended June 30, 2025.
V-5
FELDMAN FINANCIAL ADVISORS, INC.
Exhibit VI-1
Pro Forma Assumptions for Conversion Valuation
| 1. | The total amount of the net offering proceeds was fully invested at the beginning of the applicable period. |
| 2. | The net offering proceeds are invested to yield a return of 3.62%, which represents the yield on the five-year U.S. Treasury bond as of September 17, 2025. The effective income tax rate was assumed to be 21.0%, resulting in a net after-tax yield of 2.86%. |
| 3. | Fixed expenses related to the Conversion reorganization are estimated to equal $500,000. |
| 4. | In connection with the Conversion, the Company plans to establish a charitable foundation that will be funded with an initial contribution of $5.0 million from the Conversion proceeds. Pro forma adjustments have been made to the net offering proceeds to reflect this charitable contribution. |
| 5. | The charitable contribution expense is viewed as a non-recurring item and, therefore, we have not included its effect in pro forma income. |
| 6. | No effect has been given in the pro forma equity calculation for the assumed earnings on the net proceeds. |
| 7. | The calculation of operating income excludes the after-tax effect of net realized securities gains. |
VI-1
FELDMAN FINANCIAL ADVISORS, INC.
Exhibit VI-2
Pro Forma Conversion Valuation Range
Everett
Cash Mutual Insurance Company
Historical GAAP Financial Data as of December 31, 2024
(Dollars in Thousands)
| Minimum | Midpoint | Maximum | ||||||||||
| Gross offering proceeds | $ | 153,000 | $ | 180,000 | $ | 207,000 | ||||||
| Less: estimated expenses | (500 | ) | (500 | ) | (500 | ) | ||||||
| Estimated net proceeds | 152,500 | 179,500 | 206,500 | |||||||||
| Less: cash contribution to charitable foundation | (5,000 | ) | (5,000 | ) | (5,000 | ) | ||||||
| Estimated net investable proceeds | $ | 147,500 | $ | 174,500 | $ | 201,500 | ||||||
| Net Income: | ||||||||||||
| LTM ended December 31, 2024 | $ | 11,126 | $ | 11,126 | $ | 11,126 | ||||||
| Pro forma income on net proceeds (1) | 4,219 | 4,991 | 5,763 | |||||||||
| Pro forma net income | $ | 15,345 | $ | 16,117 | $ | 16,889 | ||||||
| Operating Income: (2) | ||||||||||||
| LTM ended December 31, 2024 | $ | 6,724 | $ | 6,724 | $ | 6,724 | ||||||
| Pro forma income on net proceeds (1) | 4,219 | 4,991 | 5,763 | |||||||||
| Pro forma operating income | $ | 10,943 | $ | 11,715 | $ | 12,487 | ||||||
| Total Revenue: | ||||||||||||
| LTM ended December 31, 2024 | $ | 184,867 | $ | 184,867 | $ | 184,867 | ||||||
| Pro forma income before taxes on net proceeds (1) | 5,340 | 6,317 | 7,294 | |||||||||
| Pro forma total revenue | $ | 190,207 | $ | 191,184 | $ | 192,161 | ||||||
| Total Equity: | ||||||||||||
| GAAP as of December 31, 2024 | $ | 130,731 | $ | 130,731 | $ | 130,731 | ||||||
| Estimated net proceeds | 152,500 | 179,500 | 206,500 | |||||||||
| After-tax cost of charitable foundation contribution | (3,950 | ) | (3,950 | ) | (3,950 | ) | ||||||
| Pro forma total equity | $ | 279,281 | $ | 306,281 | $ | 333,281 | ||||||
| Tangible Equity: | ||||||||||||
| GAAP as of December 31, 2024 | $ | 106,840 | $ | 106,840 | $ | 106,840 | ||||||
| Estimated net proceeds | 152,500 | 179,500 | 206,500 | |||||||||
| After-tax cost of charitable foundation contribution | (3,950 | ) | (3,950 | ) | (3,950 | ) | ||||||
| Pro forma tangible equity | $ | 255,390 | $ | 282,390 | $ | 309,390 | ||||||
| Total Assets: | ||||||||||||
| GAAP as of December 31, 2024 | $ | 513,046 | $ | 513,046 | $ | 513,046 | ||||||
| Estimated net proceeds | 147,500 | 174,500 | 201,500 | |||||||||
| After-tax cost of charitable foundation contribution | (3,950 | ) | (3,950 | ) | (3,950 | ) | ||||||
| Pro forma total assets | $ | 656,596 | $ | 683,596 | $ | 710,596 | ||||||
| Pro Forma Ratios: | ||||||||||||
| Price / LTM Earnings | 9.97 | x | 11.17 | x | 12.26 | x | ||||||
| Price / Operating Earnings | 13.98 | x | 15.37 | x | 16.58 | x | ||||||
| Price / LTM Revenue | 0.80 | x | 0.94 | x | 1.08 | x | ||||||
| Price / Book Value | 54.78 | % | 58.77 | % | 62.11 | % | ||||||
| Price / Tangible Book Value | 59.91 | % | 63.74 | % | 66.91 | % | ||||||
| Price / Total Assets | 23.30 | % | 26.33 | % | 29.13 | % | ||||||
| Total Equity / Assets | 42.53 | % | 44.80 | % | 46.90 | % | ||||||
| Tangible Equity / Assets | 40.36 | % | 42.81 | % | 45.05 | % | ||||||
| (1) | Assumes 3.62% pre-tax yield and 2.86% after-tax yield on net investable proceeds. |
| (2) | Excludes net realized securities gains. |
VI-2