☐ | Preliminary Proxy Statement |
☐ | Confidential, for Use of the Commission Only (as permitted by Rule 14a-6(e)(2)) |
☒ | Definitive Proxy Statement |
☐ | Definitive Additional Materials |
☐ | Soliciting Material under §240.14a-12 |
☒ | No fee required. | |
☐ | Fee paid previously with preliminary materials. | |
☐ | Fee computed on table in exhibit required by Item 25(b) per Exchange Act Rules 14a-6(i)(1) and 0-11. | |

Sincerely, |
![]() |
William H. Weideman |
Chairman of the Board |
YOUR VOTE IS IMPORTANT We urge you to promptly vote your shares online, by telephone or by completing, signing and dating and returning a proxy card in the postage prepaid envelope. |
Time: | 8:00 a.m. (Central Time) |
Date: | Thursday, May 1, 2025 |
Place: | The Plaza in Clayton Office Tower |
190 Carondelet Plaza | |
Annex Room—16th Floor | |
Clayton, MO 63105 USA | |
Purpose: | To consider and act upon the following: |
(1)Election of nine directors, all of whom are identified in the proxy statement. | |
(2) Conduct an advisory vote to approve the compensation for named executive officers. | |
(3) Ratification of the appointment of the independent registered public accounting firm for 2025. | |
(4) Such other business that is properly presented at the meeting. | |
Who May Vote: | You may vote if you were a record owner of Olin common stock at the close of business on March 3, 2025. |
By Order of our Board of Directors: |
![]() |
Inchan Hwang |
Secretary |
Page | |
IMPORTANT NOTICE REGARDING THE AVAILABILITY OF PROXY MATERIALS .................................................... | |
GENERAL QUESTIONS ............................................................................................................................................................. | |
VOTING .......................................................................................................................................................................................... | |
MISCELLANEOUS ....................................................................................................................................................................... | |
CERTAIN BENEFICIAL OWNERS ........................................................................................................................................... | |
ITEM 1—PROPOSAL FOR THE ELECTION OF DIRECTORS ........................................................................................... | |
Director Nominee Composition, Skills and Experience Matrix .......................................................................................... | |
Business Experience of Nominees ....................................................................................................................................... | |
CORPORATE GOVERNANCE MATTERS .............................................................................................................................. | |
How Many Meetings Did Board Members Attend? ............................................................................................................. | |
Which Board Members Are Independent? ............................................................................................................................ | |
Does Olin Have Corporate Governance Guidelines and a Code of Conduct? ............................................................... | |
Does Olin Have an Insider Trading Policy? .......................................................................................................................... | |
Does Olin Prohibit Hedging and Pledging of Its Stock by Insiders? ................................................................................. | |
Do Olin’s Board and Committees Conduct Evaluations? ................................................................................................... | |
What Are our Board Committees? ......................................................................................................................................... | |
Compensation Committee Interlocks and Insider Participation ........................................................................................ | |
What Is Olin’s Director Nomination Process? ...................................................................................................................... | |
What Is our Board Leadership Structure? ............................................................................................................................ | |
How Does our Board Oversee Olin’s Risk Management Process? ................................................................................. | |
REPORT OF OUR AUDIT COMMITTEE .................................................................................................................................. | |
SECURITY OWNERSHIP OF DIRECTORS AND OFFICERS ............................................................................................. | |
CERTAIN RELATIONSHIPS AND RELATED TRANSACTIONS........................................................................................ | |
CORPORATE RESPONSIBILITY ............................................................................................................................................. | |
EXECUTIVE OFFICERS ............................................................................................................................................................. | |
COMPENSATION DISCUSSION AND ANALYSIS ................................................................................................................ | |
EXECUTIVE COMPENSATION ................................................................................................................................................. | |
DIRECTOR COMPENSATION ................................................................................................................................................... | |
PAY RATIO DISCLOSURE ........................................................................................................................................................ | |
PAY VERSUS PERFORMANCE ............................................................................................................................................... | |
STOCK OPTION GRANT PRACTICES ................................................................................................................................... | |
FOR NAMED EXECUTIVE OFFICERS .................................................................................................................................... | |
Vote Required for Approval ................................................................................................................................................... | |
ITEM 3—PROPOSAL TO RATIFY THE APPOINTMENT OF INDEPENDENT REGISTERED PUBLIC ACCOUNTING FIRM ................................................................................................................................................................... | |
Vote Required for Ratification ............................................................................................................................................... |
Name and Address of Beneficial Owner | Amount and Nature of Beneficial Ownership | Percent of Class | ||
Hotchkis & Wiley Capital Management, LLC ............................................................................... | 10,335,868 (a) | 9.0% | ||
601 S. Figueroa Street, 39th Fl | ||||
Los Angeles, CA 90017 | ||||
BlackRock, Inc. ................................................................................................................................. | 11,501,266 (b) | 10.0% | ||
55 East 52nd Street | ||||
New York, NY 10055 | ||||
The Vanguard Group, Inc. ............................................................................................................... | 12,108,920 (c) | 10.5% | ||
100 Vanguard Boulevard | ||||
Malvern, PA 19355 |
Director Nominee Composition, Skills and Experience Matrix |


Limited skill / experience | Some skill / experience | Very skilled / experienced |
Senior Leadership Experience (CEO, President or other C-Suite Role) | 11% | 89% | |||||||||||
Significant experience leading and operating in large, complex businesses, including developing, implementing and assessing business plans and strategies | |||||||||||||
Global Business Experience | 33% | 67% | |||||||||||
Significant experience developing and managing business in markets around the World and/or as part of a global business leadership team | |||||||||||||
Financial Experience | 33% | 67% | |||||||||||
Significant experience making capital decisions, reviewing and analyzing financial information and reports, understanding financial markets and investment decision- making | |||||||||||||
Risk Management Experience | 33% | 67% | |||||||||||
Significant experience identifying, prioritizing and managing risks, including strategic, operational, compliance, cyber-security, and environmental, health and safety | |||||||||||||
Corporate Governance / Public Company Experience | 11% | 22% | 67% | ||||||||||
Significant experience with corporate governance planning, management accountability, ESG implementation, reporting obligations and regulatory compliance | |||||||||||||
Operations / Technology Experience | 12% | 44% | 44% | ||||||||||
Significant experience in complex manufacturing, engineering, logistics and/or chemical operations, EHS requirements, driving productivity initiatives and information technology solutions | |||||||||||||
Commodity / Cyclical Business Experience | 11% | 22% | 67% | ||||||||||
Significant experience in managing commodity or cyclical businesses | |||||||||||||
Marketing / Sales Experience | 33% | 56% | 11% | ||||||||||
Significant experience enhancing sales into existing markets and developing new markets and products | |||||||||||||
Corporate Development / Strategic Planning Experience | 55% | 44% | |||||||||||
Significant experience with implementing and reviewing strategic plans and processes, including acquisitions, divestitures, joint ventures and other opportunities | |||||||||||||
Human Capital / Executive Compensation / Talent Management | 55% | 44% | |||||||||||
Significant experience with executive development, performance and compensation planning and analysis, human capital management and ESG social elements | |||||||||||||
Business Experience of Nominees |
![]() | Beverley A. Babcock Director Since: June 2019 Independent Age: 64 •Olin Committees: Chair of the Audit Committee; Member of the Executive Committee •‘Audit Committee Financial Expert’ under applicable SEC rules •Former Chief Financial Officer and Senior Vice President, Finance and Administration and Controller of Imperial Oil Limited •Former Assistant Controller and Vice President, Corporate Financial Services of ExxonMobil Corporation •Former Member of NYSE Listed Company Advisory Board •Member of the Chartered Professional Accountants of Canada Ms. Babcock brings a combination of extensive global financial, accounting and treasury management experience, and relevant industry experience to the Olin’s Board. Ms. Babcock retired in May 2018 as Chief Financial Officer and Senior Vice President, Finance and Administration and Controller of Imperial Oil Limited, a publicly-held Canadian petroleum company with 69.6% ownership by ExxonMobil Corporation, a position she held since September 2015. Prior to that, Ms. Babcock served as Vice President, Corporate Financial Services from 2013 to 2015, Assistant Controller, Corporate Accounting Services from 2011 to 2013, and in various other senior leadership positions from 1998 to 2013, all at ExxonMobil Corporation. Earlier in her career, she was an Auditor of Clarkson Gordon, which became part of Ernst & Young. Ms. Babcock is a former member of the NYSE Listed Company Advisory Board and is a member of the Chartered Professional Accountants of Canada. Ms. Babcock serves on the Board of Directors of Westinghouse Air Brake Technologies Corporation. Additionally, Ms. Babcock serves on the Board of Directors of Forté Foundation, a non-profit consortium of leading companies and top business schools working together to launch women into fulfilling, significant careers in business. Ms. Babcock earned a Bachelor’s degree from Queen’s University and a master’s degree in business administration from McMaster University. |
![]() | Edward M. Daly Director Since: March 2025 Independent Age: 59 •Olin Committees: Compensation Committee •Former 20th Commanding General (four-star general) of the U.S. Army Materiel Command •Director of SkyWater Technology, Inc. General (Retired) Daly’s leadership positions in the U.S. Army brings valuable insight and understanding of the defense industry and national security priorities to Olin’s Board. Gen. Daly retired from the U.S. Army in 2023 after 36 years of honorable service. In his final assignment, he served as the 20th Commanding General of the U.S. Army Materiel Command. In this role, he led one of the Army’s largest commands with 190,000 Military and Department of the Army Civilians and Contractors and was responsible for an annual budget of more than $50B. As the U.S. Army’s senior logistician, Gen. Daly led Army logistics worldwide, global foreign military sales, and initial materiel fielding efforts in support of Ukraine as well as the Army's Organic Industrial Base and Infrastructure Modernization initiatives. Gen. Daly is a member of the Board of Directors of SkyWater Technology, and the Chair of its Risk Management Committee and a member of its Compensation Committee. He is also the founder and Chairman of the board of Virtus 9 Corporation, an integrated logistics solutions provider to U.S. military partners and allies, and is the president of Daly Consulting & Logistics, LLC, a supply chain and logistics consulting firm. Gen. Daly graduated from the United States Military Academy in 1987. He earned Master’s Degrees in Business Administration from Gonzaga University and in Strategic Studies from the U.S. Army War College. He is the only career Logistics 4-Star General to graduate from the United States Military Academy at West Point since its founding in 1802. |
![]() | Matthew S. Darnall Director Since: September 2021 Independent Age: 62 •Olin Committees: Audit Committee; Nominating and Governance Committee •Former Managing Director, Industrials Group of The Goldman Sachs Group, Inc. Mr. Darnall brings significant investment banker expertise and merger and acquisitions, capital structure and allocation, and corporate structure and reorganization experience to Olin’s Board of Directors. Mr. Darnall retired in July 2021 from his position as Managing Director, Industrials Group of The Goldman Sachs Group, Inc. (a leading financial institution), a position he held since 2003. Over a 36-year career at Goldman Sachs, Mr. Darnall advised companies on corporate financial matters and mergers and acquisitions transactions within the Communications, Media and Entertainment Group from 1994 to 2003; Energy and Power Group from 1990 to 1994; Midwest Regional Coverage Group from 1988 to 1990 and as an Analyst in the Mergers and Acquisitions Group from 1985 to 1988. Mr. Darnall serves on the Board of Trustees of DePauw University, and also on the Board of Trustee of Glenwood Academy. Mr. Darnall earned a Bachelor’s degree in economics from DePauw University and a master’s degree in business administration from the University of Chicago. |
![]() | Kenneth T. Lane Director Since: March 2024 President and Chief Executive Officer and Director Age: 56 •Olin Committees: Executive Committee •President and Chief Executive Officer of Olin Corporation •Former Executive Vice President Global Olefins and Polyolefins of LyondellBasell Mr. Lane brings substantial global strategic leadership, manufacturing, commercial and operations experience in commodity and specialty chemicals businesses to Olin’s Board. Olin’s Board appointed Mr. Lane as Olin’s President and Chief Executive Officer and Director, effective March 18, 2024. Mr. Lane comes to Olin from LyondellBasell, one of the world’s largest plastic, chemicals, and refining companies, where he most recently served as Executive Vice President, Global Olefins and Polyolefins (O&P). Mr. Lane had manufacturing and commercial responsibility for the O&P Americas and O&P Europe, Asia and International (EAI) segments as well as Global Procurement. Preceding this assignment, Lane served as Executive Vice President of Global O&P for three years and as interim CEO of LyondellBasell in early 2022. Prior to joining LyondellBasell in July 2019, he was with BASF for 13 years, where he held senior executive positions in the Global Polyurethanes Division, and served as President of the Monomers Division and as President of BASF Catalysts. Before BASF, he also served in a variety of operations, strategy and commercial positions at BP Chemicals as well as various technical and operations roles at Amoco Chemical Corporation. Over his career, he has served in leadership roles in the United States, Malaysia, the United Kingdom, China and Belgium. Mr. Lane holds a Bachelor of Science in civil engineering from Clemson University and a Master of Science in management from the University of Alabama in Huntsville. |
![]() | Julie A. Piggott Director Since: June 2023 Independent Age: 64 •Olin Committees: Compensation Committee; Nominating and Governance Committee •Former Executive Vice President and Chief Financial Officer of BNSF Railway Company Ms. Piggott brings strategic leadership skills and extensive experience in finance, accounting, risk management and business management, as well as a background in the supply chain industry to the Olin board. Ms. Piggott served as Executive Vice President and Chief Financial Officer of BNSF Railway Company ("BNSF"), one of North America's leading freight transportation companies, from 2014 until her retirement in 2021. Ms. Piggott held various other finance and commercial roles with BNSF since joining the company in 1991, including Vice President Planning and Studies, and Controller from 2009 to 2014, Vice President Finance and Treasurer from 2008 to 2009, and Vice President Finance from 2006 to 2008. Prior to her tenure at BNSF, Ms. Piggott's experience included finance, accounting, and audit roles at a private investment management company and Ernst & Young LLP (formerly Ernst & Whinney), a public accounting firm. Ms. Piggott holds an inactive CPA license from the state of Minnesota. Ms. Piggott serves on the Board of Directors of Arcosa, Inc, including its Audit Committee and its Governance and Sustainability Committee and also serves on the Board of Directors of a non-profit charity and the advisory board of the College of Business, Analytics & Communications at Minnesota State of Moorhead. Ms. Piggott holds a Bachelor of Science degree in Accounting from Minnesota State University, Moorhead, Minnesota, and an Executive MBA from Southern Methodist University. |
![]() | Earl L. Shipp Director Since: October 2017 Independent Age: 67 •Olin Committees: Chair of the Compensation Committee; Audit Committee •Former Vice President, US Gulf Coast Operations of The Dow Chemical Company •Former President, Dow Middle East, India & Africa and Former President, Basic Chemicals Group of Dow •Director of National Grid plc and Great Lakes Dredge & Dock Co. •NACD Cyber Security Oversight Certified Mr. Shipp brings substantial chemical industry experience, including chlorine and epoxy business experience, and manufacturing, engineering and operations management experience to Olin’s Board. Mr. Shipp retired in September 2017 from his position as Vice President, US Gulf Coast Operations of The Dow Chemical Company, a diversified chemical manufacturing company, a position he held from November 2010. Prior to that, he served as President of Dow Middle East, India & Africa from June 2006 to October 2010 and as President of the Basic Chemicals Group at Dow from May 2007 to May 2009. During his 36-year history at Dow, he held a variety of leadership and engineering roles, including appointments as VP & Site Director of Louisiana Operations and Global Operations Director for Propylene Oxide/Propylene Glycol, Business Director for Propylene Oxide/Propylene Glycol, and Business Vice President for Oxides and Glycols. Mr. Shipp is a member of the Board of Directors of National Grid plc, and the chair of its Board’s Safety & Sustainability Committee and a member of its Board’s People & Governance Committee. He also serves on the Board of Great Lakes Dredge & Dock Co. and is a member of that Board’s Audit Committee and the Compensation Committee. He is also a member of the Board of Directors and the Executive Committee of The Economic Development Alliance of Brazoria County, Texas. Mr. Shipp earned a Bachelor’s degree in chemical engineering from Wayne State University and completed the executive education program at Indiana State University School of Business. He holds a United States Coast Guard Captains License. |
![]() | William H. Weideman Director Since: October 2015 Independent Chairman of the Board Age: 70 •Olin Committees: Chair of the Executive Committee; Audit Committee •‘Audit Committee Financial Expert’ under applicable SEC rules •Former Chief Financial Officer and Executive Vice President of The Dow Chemical Company •Former Director of Dow Chemical Employees’ Credit Union, Mid-Michigan Medical Center and Sadara Chemical Company Mr. Weideman brings valuable financial, audit, and business administration experience to Olin’s Board, as well as extensive knowledge of the businesses Olin acquired from The Dow Chemical Company. Mr. Weideman retired in January 2015 as Chief Financial Officer and Executive Vice President of The Dow Chemical Company, a position he held since March 2010. Prior to that, Mr. Weideman served as an Interim Chief Financial Officer from November 2009 to March 2010, and Executive Vice President of Finance, Dow Agrosciences & Corporate Strategic Development from April 2010 through September 2012, all at Dow. He joined Dow in 1976 as a Cost Accountant in Midland, Michigan and held a variety of accounting and controller roles for different Dow businesses. Mr. Weideman served on the Board of Directors of Mid-Michigan Medical Center and on the Board of Trustees for Central Michigan University through December 31, 2020. From October 30, 2011 through December 2015, he served on the Board of Directors of Sadara Chemical Company, a joint venture between Saudi Aramco and Dow. From August 30, 2000 through December 2015, he was on the Board of Directors of The Dow Chemical Employees’ Credit Union. Mr. Weideman earned a Bachelor’s degree in business administration and accounting from Central Michigan University. |
![]() | W. Anthony Will Director Since: September 2021 Independent Age: 59 •Olin Committees: Compensation Committee; Nominating and Governance Committee •President and Chief Executive Officer and Director of CF Industries Holdings Inc. Mr. Will brings significant public company chief executive officer, operations and corporate development experience and risk management, accounting and finance and human capital management experience to Olin’s Board. Mr. Will serves as President and Chief Executive Officer and a member of the Board of Directors of CF Industries Holdings Inc. (a leading global manufacturer of hydrogen and nitrogen products), positions he has held since January 2014. Prior to that, he served as Senior Vice President, Manufacturing and Distribution from January 2012 to January 2014; Vice President, Manufacturing and Distribution from March 2009 through December 2011 and Vice President, Corporate Development from April 2007 to March 2009. Mr. Will served in comparable officer positions with Terra Nitrogen GP Inc., an indirect, wholly-owned subsidiary and the sole general partner of Terra Nitrogen Company, L.P. until purchased by CF Industries in April 2018, and as a member of its Board of Directors from June 2010 until February 2016 and as chairman of the Board from January 2014 to February 2016. Earlier in his career, Mr. Will served as a Partner at Accenture Ltd., vice President, Business Development at Sears, Roebuck and Company, Consultant for Egon Zehnder International, Vice President, Strategy and Corporate Development at Fort James Corporation, Manager at Boston Consulting Group and Group Leader at Motorola Solutions, Inc. Mr. Will earned a bachelor’s degree in electrical engineering from Iowa State University and a master’s degree in business administration from Northwestern University. |
![]() | Carol A. Williams Director Since: October 2015 Independent Age: 67 •Olin Committees: Chair of the Nominating and Governance Committee; Executive Committee •Former Executive Vice President, Manufacturing and Engineering, Supply Chain and Environmental, Health & Safety Operations of The Dow Chemical Company •Former Vice President, Chlor-alkali Assets Business of Dow, and Senior Vice President of Basic Chemicals •Director of O-I Glass, Inc. Ms. Williams brings extensive management experience in manufacturing, purchasing and supply chain operations, substantial experience in research and development, and comprehensive knowledge of the chlor-alkali and general chemicals industry to Olin’s Board. Ms. Williams retired in 2015 as Special Advisor to the Chief Executive Officer of The Dow Chemical Company, a position she held since January 2015. Prior to this, she served as Dow’s Executive Vice President of Manufacturing and Engineering from September 2011 through December 2014, adding responsibility for Supply Chain and Environmental, Health & Safety Operations in 2012, President of Chemicals & Energy from August 2010 to August 2011, and Senior Vice President of Basic Chemicals from January 2009 through July 2010, all at Dow. During Ms. Williams’ 34-year history at Dow, she assumed increasingly more significant management positions in research and development before becoming Operations Leader and then Vice President for the global chlor-alkali assets business. Ms. Williams joined the Board of Directors of O-I Glass, Inc. in May 2014 and currently serves on its Nominating/Corporate Governance Committee and its Compensation and Talent Development Committee. She served as its Independent Board Chair from 2015 to 2021. Ms. Williams is a member of the Engineering Advisory Board and Energy Futures Institute Presidential Consultation Committee for Carnegie Mellon University. She served on the Board of Directors of Zep, Inc. from 2012 through June 2015. Ms. Williams earned a bachelor’s degree in chemical engineering from Carnegie Mellon University. |
How Many Meetings Did Board Members Attend? |
Which Board Members Are Independent? |
Does Olin Have Corporate Governance Guidelines and a Code of Conduct? |
Does Olin Have an Insider Trading Policy? |
Does Olin Prohibit Hedging and Pledging of Its Stock by Insiders? |
Do Olin’s Board and Committees Conduct Evaluations? |
What Are our Board Committees? |
Compensation Committee Interlocks and Insider Participation |
What Is Olin’s Director Nomination Process? |
What Is the Board Leadership Structure? |
How Does the Board Oversee Olin’s Risk Management Process? |
February 19, 2025 | Beverley A. Babcock, Chair Matthew S. Darnall Earl L. Shipp William H. Weideman |
Name of Beneficial Owner | Number of Shares Beneficially Owned (2) | Percent of Common Stock (3) | ||
Beverley A. Babcock ......................................................................................... | 27,953 | — | ||
C. Robert Bunch ................................................................................................ | 45,762 | — | ||
Edward M. Daly ................................................................................................ | — | — | ||
Matthew S. Darnall ............................................................................................ | 18,436 | — | ||
Julie A. Piggott ................................................................................................... | 5,315 | — | ||
Earl L. Shipp ....................................................................................................... | 52,022 | — | ||
William H. Weideman ........................................................................................ | 50,617 | — | ||
W. Anthony Will .................................................................................................. | 28,436 | — | ||
Carol A. Williams ................................................................................................ | 50,617 | — | ||
Kenneth T. Lane ................................................................................................. | 100,412 | — | ||
Scott M. Sutton .................................................................................................. | 315,752 | — | ||
Deon A. Carter ................................................................................................... | — | — | ||
Brett A. Flaugher ................................................................................................ | 254,596 | — | ||
Damian Gumpel (1) ........................................................................................... | 172,214 | — | ||
Florian J. Kohl .................................................................................................... | 4,138 | — | ||
Dana C. O’Brien ................................................................................................. | 78,001 | — | ||
Todd A. Slater ..................................................................................................... | 780,577 | — | ||
Patrick M. Schumacher .................................................................................... | 39,112 | — | ||
Directors and executive officers as a group, including those named above (17 persons) ............................................... | 1,934,242 | 1.7 |
Name | Number of Phantom Stock Units Held in Director Deferred Accounts (4) | Number of Shares Subject to Options Exercisable in 60 days | ||
Beverley A. Babcock .................................................................................................. | 27,192 | — | ||
C. Robert Bunch .......................................................................................................... | 45,762 | — | ||
Edward M. Daly ........................................................................................................... | — | — | ||
Matthew S. Darnall ..................................................................................................... | 18,436 | — | ||
Julie A. Piggott ............................................................................................................. | 5,315 | — | ||
Earl L. Shipp ................................................................................................................ | 41,862 | — | ||
William H. Weideman ................................................................................................. | 37,477 | — | ||
W. Anthony Will ........................................................................................................... | 18,436 | — | ||
Carol A. Williams ......................................................................................................... | 44,048 | — | ||
Kenneth T. Lane .......................................................................................................... | — | 43,162 | ||
Scott M. Sutton ............................................................................................................ | — | 225,425 | ||
Deon A. Carter ............................................................................................................. | — | — | ||
Brett A. Flaugher ......................................................................................................... | — | 166,206 | ||
Damian Gumpel .......................................................................................................... | — | 137,675 | ||
Florian J. Kohl .............................................................................................................. | — | 4,138 | ||
Dana C. O’Brien .......................................................................................................... | — | 75,903 | ||
Patrick M. Schumacher .............................................................................................. | — | 39,112 | ||
Todd A. Slater .............................................................................................................. | — | 621,068 | ||
Directors and executive officers as a group, including those named above (17 persons) ........................................................ | 238,528 | 1,544,906 |
Name and Age | Title | Served as an Olin Officer Since | ||
Kenneth T. Lane (57) | President and Chief Executive Officer | 2024 | ||
Brett A. Flaugher (60) | Vice President and President, Winchester | 2018 | ||
Deon A. Carter (57) | Vice President and President, Chlor Alkali Products and Vinyls | 2024 | ||
Florian J. Kohl (53) | Vice President and President, Epoxy & International | 2024 | ||
Angela M. Castle (46) | Vice President, Chief Legal Officer | 2025 | ||
Todd A. Slater (61) | Senior Vice President and Chief Financial Officer | 2005 | ||
Randee N. Sumner (51) | Vice President and Controller | 2014 | ||
Teresa M. Vermillion (49) | Vice President and Treasurer | 2018 |
Page | |
COMPENSATION DISCUSSION AND ANALYSIS ..................................................................................................................... | |
Introduction ..................................................................................................................................................................................... | |
Executive Summary ...................................................................................................................................................................... | |
Compensation Philosophy, Practices and Policies .................................................................................................................. | |
Compensation Process: Roles and Responsibilities ............................................................................................................... | |
What We Pay and Why: Elements of Compensation .............................................................................................................. | |
Looking Forward to 2025 ............................................................................................................................................................. | |
Risk Assessment ........................................................................................................................................................................... | |
Tax and Accounting Considerations ........................................................................................................................................... | |
Compensation Committee Report .............................................................................................................................................. | |
EXECUTIVE COMPENSATION ...................................................................................................................................................... | |
Summary Compensation Table ................................................................................................................................................... | |
Grants of Plan-Based Awards ..................................................................................................................................................... | |
Outstanding Equity Awards at Fiscal Year-End ........................................................................................................................ | |
Option Exercises and Stock Vested ........................................................................................................................................... | |
Pension Benefits ............................................................................................................................................................................ | |
Nonqualified Deferred Compensation ........................................................................................................................................ | |
Potential Payments Upon Termination or Change in Control ................................................................................................. | |
DIRECTOR COMPENSATION ........................................................................................................................................................ | |
PAY RATIO DISCLOSURE ............................................................................................................................................................. | |
PAY VERSUS PERFORMANCE .................................................................................................................................................... | |
STOCK OPTION GRANT PRACTICES ......................................................................................................................................... | |
Introduction | ||||
Name | Title | |
Kenneth T. Lane | President and CEO | |
Todd A. Slater | Senior Vice President and CFO | |
Brett A. Flaugher | Vice President and President, Winchester | |
Dana C. O'Brien | Senior Vice President, Chief Legal Officer | |
Florian J. Kohl | Vice President and President, Epoxy & International | |
Scott M. Sutton | Former President and CEO | |
Patrick M. Schumacher | Former Vice President and President, Chlor Alkali Products and Vinyls | |
Damian Gumpel | Former Vice President, Corporate Strategy |


Executive Summary |


Compensation Philosophy, Practices and Policies |
What We Do | What We Don’t Do | |||
☑ | Align Pay and Performance: By tying our executives’ pay to Olin’s actual results, our compensation programs (i) align our executives’ interests with those of our shareholders and (ii) induce our management team to achieve our most important goals. Each NEO has a target total direct compensation opportunity that is reviewed annually by our Compensation Committee to ensure alignment with Olin’s pay for performance objectives. | ☒ | No Option Repricing: We prohibit option repricing without shareholder approval. | |
☑ | Use Appropriate Peer Groups When Establishing Compensation Opportunities: We established a peer group to help us review market practices and design a competitive compensation program. We set compensation of our executive officers at levels that we believe are appropriate relative to the compensation paid to similarly situated officers of our peers, also giving consideration to market and other factors. | ☒ | No Excessive Perquisites: We do not provide our NEOs with excessive perquisites. | |
☑ | Maintain an Independent Compensation Committee and Consultant: Compensation decisions for our NEOs are approved by a Compensation Committee composed of non-employee independent directors. In addition, our Compensation Committee is advised by an independent consultant who reports directly to the Compensation Committee and provides no other services to Olin or its management. | ☒ | No Tax Gross-Ups: We do not provide “gross-ups” to any of our named executive officers, including gross-ups for any excise taxes imposed with respect to Section 280G or Section 409A of the Code. | |
☑ | Perform Regular Risk Assessments: We regularly assess the risk inherent in our compensation policies and programs to ensure mitigation of operational, financial, legal, regulatory, strategic and reputational risks. | ☒ | No Hedging or Pledging: We do not allow our NEOs to hedge or pledge our stock. | |
☑ | Maintain a Clawback Policy: Each of our NEOs is subject to a clawback policy applicable to all of Olin’s executive officers, as defined by Section 16 of the Exchange Act. The policy generally allows Olin to recover compensation (including cash and/or equity awards) previously paid to an executive officer in the event of a financial restatement that impacts the applicable performance metric if, in the opinion of our Board or Compensation Committee, the revision would have resulted in a lower payment or award. | ☒ | No Payment of Dividends on Unvested Equity Awards: Payment of dividends or dividend equivalents for all equity awards is subject to the same vesting conditions as the underlying award. | |
☑ | Maintain a Stock Ownership Policy: We maintain a stock ownership policy that requires our executive officers to maintain stock ownership (excluding unvested performance share unit awards) equal to a set multiple of base salary. Covered executives have five years from the date the guidelines apply to attain the required stock ownership levels. The base salary multiple is 6 for the CEO, 3 for any Senior Vice President, and 2 for any Vice President. As of December 31, 2024, all covered executives were in compliance, to the extent possible, with the stock ownership policy. | ☒ | No Automatic Compensation Increases: We do not automatically increase NEO’s base salary or total compensation opportunities each year. | |


Compensation Process: Roles and Responsibilities |
Air Products and Chemicals, Inc. | The Chemours Company | International Flavors & Fragrances, Inc. | ||
Albemarle Corporation | Corteva, Inc. | The Mosaic Company | ||
Avient Corporation | DuPont de Nemours, Inc. | PPG Industries, Inc. | ||
Axalta Coating Systems Ltd. | Eastman Chemical Company | RPM International, Inc. | ||
Cabot Corporation | Ecolab Inc. | The Scotts Miracle-Gro Company | ||
Celanese Corporation | FMC Corporation | The Sherwin-Williams Company | ||
CF Industries Holdings, Inc. | Huntsman Corporation | Westlake Chemicals Corporation |
What We Pay and Why: Elements of Compensation |
Compensation Element | Description | Objectives | ||
Base Salary | Fixed compensation that is reviewed annually based on, for example, scope of responsibilities, tenure, market value, and individual performance. | Rewards day-to-day value of executives consistent with the market. Attract, retain and motivate qualified and experienced executives. | ||
Short-Term Incentives | “At-risk” compensation earned based on performance measured against pre- established annual goals. 80% of each NEO’s award is tied to company and/or division financial performance with the remaining 20% to the achievement of non- financial goals. | Ties compensation to the achievement of short-term company goals and objectives. Motivates executives to achieve short-term financial targets and non-financial strategic objectives that ultimately contribute to long- term company growth and shareholder return. | ||
Long-Term Incentives | “At risk” compensation comprised of 50% performance shares and 50% stock options, with the value fluctuating according to shareholder value. Performance share units vest based on achievement of relative Total Shareholder Return (TSR) and Net Income. Stock options vest based on continued service. | Motivates executives to achieve long-term goals that benefit shareholders, aligning financial interests of executives and shareholders. Coordinates activities of all NEOs in support of long-term organizational value enhancement. Rewards continuous service with the company. | ||
Other Compensation and Benefits | Broad-based benefits provided to Olin employees (e.g., health insurance and retirement plan participation) and the availability of a nonqualified deferred compensation plan. Market competitive severance and change in control packages. | Provide a total compensation package that is market competitive to allow us to recruit and retain executive talent. Allow executives to focus on generating shareholder value and ensure personal indifference to the outcome of a transaction in the event of a change in control. |
Performance Measure | Performance Threshold | Performance Target | Performance Maximum | Actual Performance | Actual Payout Percentage | |||||
Adjusted EBITDA—Corporate | $1,080.0 | $1,500.0 | $1,800.0 | $1,000.2 | —% | |||||
Levered Free Cash Flow—Corporate | $493.2 | $685.0 | $822.0 | $408.4 | —% | |||||
Adjusted EBITDA—Chemicals Division | $940.3 | $1,306.0 | $1,567.2 | $816.0 | —% | |||||
Adjusted Cash Flow—Chemicals Division | $756.0 | $1,050.0 | $1,260.0 | $673.7 | —% | |||||
Adjusted EBITDA—Winchester Division | $229.7 | $319.0 | $382.8 | $271.7 | 44.1% | |||||
Adjusted Cash Flow—Winchester Division | $189.4 | $263.0 | $315.6 | $238.8 | 16.7% |
Non-Financial Category | Percentage Earned | |
Strategic Goals | 15.0% | |
Safety, Health & Environmental Goals | 1.0% |
NEO | Threshold | Target | Maximum | Earned | ||||
Kenneth T. Lane | $429,000 | $1,072,500 | $2,145,000 | $171,600 | ||||
Todd A. Slater | $240,000 | $600,000 | $1,200,000 | $96,000 | ||||
Brett A. Flaugher | $216,000 | $540,000 | $1,080,000 | $332,640 | ||||
Dana C. O'Brien | $200,000 | $500,000 | $100,000 | $80,000 | ||||
Florian J. Kohl | $180,000 | $450,000 | $900,000 | $72,000 | ||||
Patrick M. Schumacher | $144,000 | $360,000 | $720,000 | $57,600 | ||||
Damian Gumpel | $176,000 | $440,000 | $880,000 | $70,400 |
NEO | Target Award | |
Kenneth T. Lane | $7,000,000 | |
Todd A. Slater | $1,680,000 | |
Brett A. Flaugher | $1,200,000 | |
Dana C. O'Brien | $1,100,000 | |
Florian J. Kohl | $600,000 | |
Patrick M. Schumacher | $1,200,000 | |
Damian Gumpel | $1,100,000 |
Olin’s Relative TSR Percentile | Percentage of Relative TSR PSUs Earned | |
80.0 or More | 200% | |
Greater than 50.0, but Less than 80.0 | 100% plus 3.33% for each incremental percentile above the 50.0 | |
50.0 | 100% | |
Greater than 20.0, but Less than 50.0 | 25% plus 2.5% for each incremental percentile above the 20.0 | |
20.0 | 25% | |
Less than 20.0 | 0% |
Olin’s Net Income as Percentage of Goal | Percentage of Net Income PSUs Earned (1) | |
140% or More | 200% | |
100% | 100% | |
60% | 50% | |
Less than 60% | 0% | |
(1) To the extent Olin’s net income falls in between the outlined target achievements, the shares earned will be determined based on linear interpolation. | ||
NEO | Target 2022 LTIP PSUs | 2022 LTIP Aggregate Payout % | 2022 LTIP PSUs Earned | |||
Todd A. Slater | 15,100 | 46.13% | 6,965 | |||
Brett A. Flaugher | 8,000 | 46.13% | 3,691 | |||
Dana C. O’Brien | 9,100 | 46.13% | 4,197 | |||
Scott M. Sutton | 72,400 | 46.13% | 33,399 | |||
Patrick M. Schumacher | 10,100 | 46.13% | 4,142 | |||
Damian Gumpel | 10,100 | 46.13% | 4,659 |
Looking Forward to 2025 |
Risk Assessment |
Tax and Accounting Considerations |
Compensation Committee Report |
February 19, 2025 | Earl L. Shipp, Chair C. Robert Bunch Julie A. Piggott W. Anthony Will |
Summary Compensation Table |
Name and Principal Position (a) | Year (b) | Salary ($) (c) | Bonus (1) ($) (d) | Stock Awards (2) ($) (e) | Option Awards (2) ($) (f) | Non- equity Incentive Plan Compens ation (3) ($) (g) | Change in Pension Value and Nonqualified Deferred Compensation Earnings (4) ($) (h) | All Other Compens ation (5) ($) (i) | Total ($) (j) | |||||||||
Kenneth T. Lane President and CEO | 2024 | $870,833 | $— | $15,695,134 | $3,500,007 | $171,600 | $— | $120,560 | $20,358,134 | |||||||||
Todd A. Slater Senior Vice President and CFO | 2024 | $720,000 | $100,000 | $976,090 | $840,004 | $96,000 | $520 | $104,571 | $2,837,185 | |||||||||
2023 | $680,000 | $— | $871,670 | $833,431 | $386,280 | $15,924 | $127,740 | $2,915,045 | ||||||||||
2022 | $650,000 | $— | $829,141 | $762,480 | $717,200 | $— | $131,306 | $3,090,127 | ||||||||||
Brett A. Flaugher Vice President and President, Winchester | 2024 | $660,000 | $100,000 | $697,224 | $600,020 | $332,640 | $— | $90,855 | $2,480,739 | |||||||||
Dana C. O’Brien Senior Vice President, Chief Legal Officer | 2024 | $650,000 | $100,000 | $639,143 | $550,013 | $80,000 | $— | $91,727 | $2,110,883 | |||||||||
2023 | $630,000 | $— | $528,265 | $505,106 | $313,020 | $— | $110,160 | $2,086,551 | ||||||||||
2022 | $600,000 | $150,000 | $499,681 | $457,488 | $586,800 | $— | $63,000 | $2,356,969 | ||||||||||
Florian J. Kohl Vice President and President, Epoxy & International | 2024 | $579,167 | $100,000 | $746,837 | $300,022 | $72,000 | $— | $68,055 | $1,866,081 | |||||||||
Scott M. Sutton Former President and CEO | 2024 | $625,000 | $875,000 | $— | $— | $— | $— | $1,281,383 | $2,781,383 | |||||||||
2023 | $1,250,000 | $— | $4,754,436 | $4,545,892 | $1,165,500 | $— | $266,703 | $11,982,531 | ||||||||||
2022 | $1,065,000 | $— | $3,975,484 | $3,657,786 | $1,806,040 | $— | $241,256 | $10,745,566 | ||||||||||
Patrick M. Schumacher Former Vice President and President, Chlor Alkali Products and Vinyls | 2024 | $440,000 | $— | $697,224 | $600,020 | $57,600 | $— | $493,893 | $2,288,737 | |||||||||
2023 | $600,000 | $— | $581,126 | $555,630 | $273,900 | $— | $89,363 | $2,100,019 | ||||||||||
2022 | $550,000 | $— | $554,591 | $508,320 | $459,500 | $— | $50,400 | $2,122,811 | ||||||||||
Damian Gumpel Former Vice President, Corporate Strategy | 2024 | $600,000 | $60,000 | $639,143 | $550,013 | $70,400 | $— | $114,782 | $2,034,338 | |||||||||
2023 | $600,000 | $— | $581,126 | $555,630 | $280,280 | $6,875 | $99,376 | $2,123,287 | ||||||||||
2022 | $550,000 | $— | $554,591 | $508,320 | $459,500 | $— | $115,204 | $2,187,615 |
NEO | 2024 Performance Share / Total | 2023 Performance Share | 2022 Performance Share | |||||
Kenneth T. Lane | $8,354,268 | / | $19,872,268 | N/A | N/A | |||
Todd A. Slater | $1,952,180 | / | $1,952,180 | $1,743,379 | $1,658,282 | |||
Dana C. O'Brien | $1,278,286 | / | $1,278,286 | $1,056,570 | $999,362 | |||
Florian J. Kohl | $697,224 | / | $1,095,449 | N/A | N/A | |||
Brett A. Flaugher | $1,394,448 | / | $1,394,448 | N/A | N/A | |||
Scott M. Sutton | $— | / | $— | $9,508,872 | $7,950,968 | |||
Patrick M. Schumacher | $1,394,448 | / | $1,394,448 | $1,162,252 | $1,109,182 | |||
Damian Gumpel | $1,278,286 | / | $1,278,286 | $1,162,252 | $1,109,182 | |||
NEO | RSP/Supplemental RSP– Retirement Account (a) | Other Payments (b) | Total | |||
Kenneth T. Lane | $88,688 | $31,872 | $120,560 | |||
Todd A. Slater | $104,571 | $— | $104,571 | |||
Brett A. Flaugher | $90,855 | $— | $90,855 | |||
Dana C. O'Brien | $91,727 | $— | $91,727 | |||
Florian J. Kohl | $68,055 | $— | $68,055 | |||
Scott M. Sutton | $218,663 | $1,062,720 | $1,281,383 | |||
Patrick M. Schumacher | $93,893 | $400,000 | $493,893 | |||
Damian Gumpel | $84,021 | $30,761 | $114,782 |
Vesting Date | Vesting % of the Retention Bonus | |
January 1, 2025 | 20% | |
July 1, 2025 | 30% | |
January 1, 2026 | 40% |
Grants of Plan-Based Awards |
Name (a) | Grant Date (b) | Compensation Committee Meeting Date | Estimated Future Payouts Under Non-Equity Incentive Plan Awards (1) | Estimated Future Payouts Under Equity Incentive Plan Awards (2) | All Other Stock Awards: Number of Shares of Stock or Units (3) (#) (i) | All Other Option Awards: Number of Securities Underlying Options (4) (#) (i) | Exercise or Base Price of Option Awards ($/Share) (4) (j) | Grant Date Fair Value of Stock and Option Awards (5) (k) | ||||||||||||||||
Threshold ($) (c) | Target ($) (d) | Maximum ($) (e) | Threshold (#) (f) | Target (#) (g) | Maximum (#) (h) | |||||||||||||||||||
Kenneth T. Lane | 03/18/2024 | $429,000 | $1,072,500 | $2,145,000 | ||||||||||||||||||||
03/18/2024 | 22,791 | 60,776 | 121,552 | $4,177,134 | ||||||||||||||||||||
03/18/2024 | 129,486 | $57.59 | $3,500,007 | |||||||||||||||||||||
03/18/2024 | 200,000 | $11,518,000 | ||||||||||||||||||||||
Todd A. Slater | 02/22/2024 | 02/21/2024 | $240,000 | $600,000 | $1,200,000 | |||||||||||||||||||
02/22/2024 | 02/21/2024 | 6,025 | 16,066 | 32,132 | $976,090 | |||||||||||||||||||
02/22/2024 | 02/21/2024 | 34,754 | $52.29 | $840,004 | ||||||||||||||||||||
Brett A. Flaugher | 02/22/2024 | 02/21/2024 | $216,000 | $540,000 | $1,080,000 | |||||||||||||||||||
02/22/2024 | 02/21/2024 | 4,304 | 11,476 | 22,952 | $697,224 | |||||||||||||||||||
02/22/2024 | 02/21/2024 | 24,825 | $52.29 | $600,020 | ||||||||||||||||||||
Dana C. O'Brien | 02/22/2024 | 02/21/2024 | $200,000 | $500,000 | $1,000,000 | |||||||||||||||||||
02/22/2024 | 02/21/2024 | 3,945 | 10,520 | 21,040 | $639,143 | |||||||||||||||||||
02/22/2024 | 02/21/2024 | 22,756 | $52.29 | $550,013 | ||||||||||||||||||||
Florian J. Kohl | 02/22/2024 | 02/21/2024 | $180,000 | $450,000 | $900,000 | |||||||||||||||||||
02/22/2024 | 02/21/2024 | 2,152 | 5,738 | 11,476 | $348,612 | |||||||||||||||||||
02/22/2024 | 02/21/2024 | 12,413 | $52.29 | $300,022 | ||||||||||||||||||||
02/22/2024 | 02/21/2024 | 2,500 | $130,725 | |||||||||||||||||||||
06/01/2024 | 5,000 | $267,500 | ||||||||||||||||||||||
Patrick M. Schumacher | 02/22/2024 | 02/21/2024 | $144,000 | $360,000 | $720,000 | |||||||||||||||||||
02/22/2024 | 02/21/2024 | 4,304 | 11,476 | 22,952 | $697,224 | |||||||||||||||||||
02/22/2024 | 02/21/2024 | 24,825 | $52.29 | $600,020 | ||||||||||||||||||||
Damian Gumpel | 02/22/2024 | 02/21/2024 | $176,000 | $440,000 | $880,000 | |||||||||||||||||||
02/22/2024 | 02/21/2024 | 3,945 | 10,520 | 21,040 | $639,143 | |||||||||||||||||||
02/22/2024 | 02/21/2024 | 22,756 | $52.29 | $550,013 | ||||||||||||||||||||
Outstanding Equity Awards at Fiscal Year-End |
Option Awards | Stock Awards | ||||||||||||||||
Name (a) | Number of Securities Underlying Unexercised Options Exercisable (#) (b) | Number of Securities Underlying Unexercised Options Unexercisable (#) (c) | Option Exercise Price ($) (d) | Option Expiration Date (e) | Number of Shares or Units of Stock That Have Not Vested (#) (f) | Market Value of Shares or Units of Stock That Have Not Vested (5) ($) (g) | Equity Incentive Plan Awards: Number of Unearned Shares, Units or Other Rights That Have Not Vested (#) (h) | Equity Incentive Plan Awards: Market or Payout Value of Unearned Shares, Units or Other Rights That Have Not Vested (6) ($) (i) | |||||||||
Kenneth T. Lane | — | — | $— | — | — | $— | 60,776 | $2,054,229 | |||||||||
— | — | $— | — | 200,000 | $6,760,000 | — | $— | ||||||||||
— | 129,486 | (1) | $57.59 | 03/18/2034 | — | $— | — | $— | |||||||||
Todd A. Slater | — | — | $— | — | — | $— | 16,066 | $543,031 | |||||||||
— | — | $— | — | — | $— | 13,626 | $460,559 | ||||||||||
— | 34,754 | (2) | $52.29 | 02/22/2034 | — | $— | — | $— | |||||||||
9,667 | 19,332 | (3) | $60.55 | 02/22/2033 | — | $— | — | $— | |||||||||
24,000 | 12,000 | (4) | $49.71 | 02/22/2032 | — | $— | — | $— | |||||||||
64,200 | — | $28.99 | 02/15/2031 | — | $— | — | $— | ||||||||||
163,600 | — | $17.33 | 02/18/2030 | — | $— | — | $— | ||||||||||
94,100 | — | $26.26 | 02/19/2029 | — | $— | — | $— | ||||||||||
54,000 | — | $32.94 | 02/16/2028 | — | $— | — | $— | ||||||||||
86,000 | — | $29.75 | 02/10/2027 | — | $— | — | $— | ||||||||||
92,250 | — | $13.14 | 02/11/2026 | — | $— | — | $— | ||||||||||
Brett A. Flaugher | — | — | $— | — | — | $— | 11,476 | $387,889 | |||||||||
— | — | $— | — | — | $— | 7,846 | $265,195 | ||||||||||
— | 24,825 | (2) | $52.29 | 02/22/2034 | — | $— | — | $— | |||||||||
5,566 | 11,130 | (3) | $60.55 | 02/22/2033 | — | $— | — | $— | |||||||||
12,800 | 6,400 | (4) | $49.71 | 02/22/2032 | — | $— | — | $— | |||||||||
30,800 | — | $28.99 | 02/15/2031 | — | $— | — | $— | ||||||||||
41,800 | — | $17.33 | 02/18/2030 | — | $— | — | $— | ||||||||||
24,000 | — | $26.26 | 02/19/2029 | — | $— | — | $— | ||||||||||
12,000 | — | $32.94 | 02/16/2028 | — | $— | — | $— | ||||||||||
19,000 | — | $29.75 | 02/10/2027 | — | $— | — | $— | ||||||||||
Dana C. O'Brien | — | — | $— | — | — | $— | 10,520 | $355,576 | |||||||||
— | — | $— | — | — | $— | 8,258 | $279,120 | ||||||||||
— | 22,756 | (2) | $52.29 | 02/22/2034 | — | $— | — | $— | |||||||||
5,859 | 11,716 | (3) | $60.55 | 02/22/2033 | — | $— | — | $— | |||||||||
14,400 | 7,200 | (4) | $49.71 | 02/22/2032 | — | $— | — | $— | |||||||||
35,000 | — | $58.59 | 11/29/2031 | — | $— | — | $— | ||||||||||
Florian J. Kohl | — | — | $— | — | — | $— | 5,738 | $193,944 | |||||||||
— | — | $— | — | 10,000 | $338,000 | — | $— | ||||||||||
— | 12,413 | (2) | $52.29 | 02/22/2034 | — | $— | — | $— | |||||||||
Scott M. Sutton | 52,725 | — | $60.55 | 10/31/2025 | — | $— | — | $— | |||||||||
172,700 | — | $49.71 | 10/31/2025 | — | $— | — | $— | ||||||||||
Patrick M. Schumacher | 6,445 | — | $60.55 | 10/01/2025 | — | $— | — | $— | |||||||||
16,000 | — | $49.71 | 10/01/2025 | — | $— | — | $— | ||||||||||
16,667 | — | $58.59 | 10/01/2025 | — | $— | — | $— | ||||||||||
Option Awards | Stock Awards | ||||||||||||||||
Name (a) | Number of Securities Underlying Unexercised Options Exercisable (#) (b) | Number of Securities Underlying Unexercised Options Unexercisable (#) (c) | Option Exercise Price ($) (d) | Option Expiration Date (e) | Number of Shares or Units of Stock That Have Not Vested (#) (f) | Market Value of Shares or Units of Stock That Have Not Vested (5) ($) (g) | Equity Incentive Plan Awards: Number of Unearned Shares, Units or Other Rights That Have Not Vested (#) (h) | Equity Incentive Plan Awards: Market or Payout Value of Unearned Shares, Units or Other Rights That Have Not Vested (6) ($) (i) | |||||||||
Damian Gumpel | — | — | $— | — | — | $— | 10,520 | $355,576 | |||||||||
— | — | $— | — | — | $— | 9,084 | $307,039 | ||||||||||
— | 22,756 | (2) | $52.29 | 02/22/2034 | — | $— | — | $— | |||||||||
6,445 | 12,888 | (3) | $60.55 | 02/22/2033 | — | $— | — | $— | |||||||||
16,000 | 8,000 | (4) | $49.71 | 02/22/2032 | — | $— | — | $— | |||||||||
30,800 | — | $28.99 | 02/15/2031 | — | $— | — | $— | ||||||||||
55,300 | — | $17.33 | 02/18/2030 | — | $— | — | $— | ||||||||||
2,100 | — | $26.26 | 02/19/2029 | — | $— | — | $— | ||||||||||
5,000 | — | $32.94 | 02/16/2028 | — | $— | — | $— | ||||||||||
Option Exercises and Stock Vested |
Option Awards | Stock Awards | |||||||
Name (a) | Number of Shares Acquired on Exercise (#) (b) | Value Realized on Exercise (1) ($) (c) | Number of Shares Acquired on Vesting (2) (#) (d) | Value Realized on Vesting (3) ($) (e) | ||||
Kenneth T. Lane | — | $— | — | $— | ||||
Todd A. Slater | 63,250 | $1,662,030 | 18,416 | $962,973 | ||||
Brett A. Flaugher | 15,000 | $586,650 | 8,782 | $459,211 | ||||
Dana C. O'Brien | — | $— | — | $— | ||||
Florian J. Kohl | — | $— | — | $— | ||||
Scott M. Sutton | 308,300 | $7,431,249 | 394,102 | $31,704,279 | ||||
Patrick M. Schumacher | — | $— | — | $— | ||||
Damian Gumpel | — | $— | 15,484 | $939,691 | ||||
Pension Benefits |
Name (a) | Plan Name (b) | Number of Years Credited Service (1) (#) (c) | Present Value of Accumulated Benefit (2) (3) ($) (d) | Payments During Last Fiscal Year ($) (e) | ||||
Todd A. Slater (4) | Qualified Plan | 5.00 | $166,071 | $— | ||||
Supplemental Plan | 5.00 | $26,011 | $— | |||||
Brett A. Flaugher (4) | Qualified Plan | 23.37 | $767,357 | $— | ||||
Supplemental Plan | 23.37 | $29,480 | $— | |||||
Damian Gumpel | Qualified Plan | 6.30 | $56,185 | $— |
Nonqualified Deferred Compensation |
Name (a) | Executive Contributions in Last FY (1) ($) (b) | Registrant Contributions in Last FY (2) ($) (c) | Aggregate Earnings (Losses) in Last FY ($) (d) | Aggregate Withdrawals/ Distributions ($) (e) | Aggregate Balance at Last FYE ($) (f) | |||||
Kenneth T. Lane | $31,550 | $55,213 | $919 | $— | $87,682 | |||||
Todd A. Slater | $37,500 | $68,346 | $(617,212) | $— | $1,118,820 | |||||
Dana C. O'Brien | $18,300 | $55,502 | $9,159 | $— | $230,133 | |||||
Florian J. Kohl | $14,050 | $31,830 | $308 | $— | $46,188 | |||||
Brett A. Flaugher | $18,900 | $54,630 | $20,369 | $— | $441,903 | |||||
Scott M. Sutton | $19,600 | $182,438 | $42,379 | $— | $913,230 | |||||
Patrick M. Schumacher | $— | $57,668 | $5,060 | $— | $138,334 | |||||
Damian Gumpel | $15,300 | $47,796 | $(186,404) | $— | $349,156 |
Potential Payments Upon Termination or Change in Control |
Termination by Olin without Cause not in Connection with a Change in Control | ||||||||||||
NEO | Cash Payments (1) | Equity Awards (2) | Retention Bonus | Benefits Continuation (3) | Outplacement Services | Total | ||||||
Kenneth T. Lane | $3,602,500 | $513,557 | $— | $21,009 | $40,000 | $4,177,066 | ||||||
Todd A. Slater | $1,920,000 | $488,049 | $900,000 | $20,443 | $40,000 | $3,368,492 | ||||||
Brett A. Flaugher | $1,740,000 | $306,093 | $900,000 | $13,770 | $40,000 | $2,999,863 | ||||||
Dana C. O'Brien | $1,650,000 | $304,606 | $900,000 | $7,182 | $40,000 | $2,901,788 | ||||||
Florian J. Kohl | $1,500,000 | $64,648 | $900,000 | $20,460 | $40,000 | $2,525,108 | ||||||
Damian Gumpel | $1,480,000 | $323,218 | $540,000 | $20,207 | $40,000 | $2,403,425 | ||||||
Termination by Olin in Connection with a Change in Control without Cause or for Good Reason | ||||||||||||
NEO | Cash Payments (4) | Equity Awards (5) | Retention Bonus | Benefits Continuation (3) | Outplacement Services | Total | ||||||
Kenneth T. Lane | $8,662,500 | $8,814,229 | $— | $63,028 | $40,000 | $17,579,757 | ||||||
Todd A. Slater | $3,240,000 | $1,003,590 | $900,000 | $40,886 | $40,000 | $5,224,476 | ||||||
Brett A. Flaugher | $2,940,000 | $653,084 | $900,000 | $27,540 | $40,000 | $4,560,624 | ||||||
Dana C. O'Brien | $2,800,000 | $634,696 | $900,000 | $14,363 | $40,000 | $4,389,059 | ||||||
Florian J. Kohl | $2,550,000 | $531,944 | $900,000 | $40,919 | $40,000 | $4,062,863 | ||||||
Damian Gumpel | $2,520,000 | $662,615 | $540,000 | $40,414 | $40,000 | $3,803,029 | ||||||
Change in Control not in Connection with a Termination | ||||||||||||
NEO | Cash Payments | Equity Awards (6) | Retention Bonus | Benefits Continuation | Outplacement Services | Total | ||||||
Kenneth T. Lane | $— | $2,054,229 | $— | $— | $— | $2,054,229 | ||||||
Todd A. Slater | $— | $1,003,590 | $900,000 | $— | $— | $1,903,590 | ||||||
Brett A. Flaugher | $— | $653,084 | $900,000 | $— | $— | $1,553,084 | ||||||
Dana C. O'Brien | $— | $634,696 | $900,000 | $— | $— | $1,534,696 | ||||||
Florian J. Kohl | $— | $193,944 | $900,000 | $— | $— | $1,093,944 | ||||||
Damian Gumpel | $— | $662,615 | $540,000 | $— | $— | $1,202,615 | ||||||
Retirement (7) | ||||||||||||
NEO | Cash Payments | Equity Awards (8) | Retention Bonus | Benefits Continuation | Outplacement Services | Total | ||||||
Kenneth T. Lane | $— | $— | $— | $— | $— | $— | ||||||
Todd A. Slater | $— | $488,049 | $— | $— | $— | $488,049 | ||||||
Brett A. Flaugher | $— | $306,093 | $— | $— | $— | $306,093 | ||||||
Dana C. O'Brien | $— | $— | $— | $— | $— | $— | ||||||
Florian J. Kohl | $— | $— | $— | $— | $— | $— | ||||||
Damian Gumpel | $— | $— | $— | $— | $— | $— | ||||||
Death | ||||||||||||
NEO | Cash Payments | Equity Awards (9) | Retention Bonus | Benefits Continuation | Outplacement Services | Total | ||||||
Kenneth T. Lane | $— | $7,273,557 | $— | $— | $— | $7,273,557 | ||||||
Todd A. Slater | $— | $488,049 | $900,000 | $— | $— | $1,388,049 | ||||||
Brett A. Flaugher | $— | $306,093 | $900,000 | $— | $— | $1,206,093 | ||||||
Dana C. O'Brien | $— | $304,606 | $900,000 | $— | $— | $1,204,606 | ||||||
Florian J. Kohl | $— | $402,648 | $900,000 | $— | $— | $1,302,648 | ||||||
Damian Gumpel | $— | $323,218 | $540,000 | $— | $— | $863,218 | ||||||
Disability | ||||||||||||
NEO | Cash Payments | Equity Awards (10) | Retention Bonus | Benefits Continuation | Outplacement Services | Total | ||||||
Kenneth T. Lane | $— | $7,273,557 | $— | $— | $— | $7,273,557 | ||||||
Todd A. Slater | $— | $488,049 | $900,000 | $— | $— | $1,388,049 | ||||||
Brett A. Flaugher | $— | $306,093 | $900,000 | $— | $— | $1,206,093 | ||||||
Dana C. O'Brien | $— | $304,606 | $900,000 | $— | $— | $1,204,606 | ||||||
Florian J. Kohl | $— | $402,648 | $900,000 | $— | $— | $1,302,648 | ||||||
Damian Gumpel | $— | $323,218 | $540,000 | $— | $— | $863,218 | ||||||
Element of Compensation | Amount | Election | ||
Annual Stock Grant | $115,000 | (1) | ||
Annual Retainer - Stock | $40,000 | (2) | ||
Annual Retainer - Cash | $100,000 | (3) | ||
Additional Lead Director Retainer | $30,000 | (3) | ||
Additional Nominating and Governance Committee Chair Retainer | $15,000 | (3) | ||
Additional Compensation Committee Chair Retainer | $20,000 | (3) | ||
Additional Audit Committee Chair Retainer | $25,000 | (3) | ||
Elections: (1)Automatically credited as phantom stock units in the Director’s deferred stock account. (2)Must be taken in shares of common stock or credited as phantom stock units in the Director’s deferred stock account. (3)Must be taken in cash or either (i) credited as phantom stock units in the Director’s deferred stock account or (ii) credited to the Director’s deferred cash account. | ||||
Element of Compensation | Amount | Increased from 2024 | ||
Annual Stock Grant | $140,000 | Yes | ||
Annual Retainer - Stock | $60,000 | Yes | ||
Annual Retainer - Cash | $100,000 | No | ||
Additional Lead Director Retainer | $35,000 | Yes | ||
Additional Nominating and Governance Committee Chair Retainer | $20,000 | Yes | ||
Additional Compensation Committee Chair Retainer | $25,000 | Yes | ||
Additional Audit Committee Chair Retainer | $30,000 | Yes | ||
Additional Non-Executive Board Chair Retainer | $150,000 | N/A |
Name (a) | Fees Earned or Paid in Cash (1) ($) (b) | Stock Awards (2) ($) (c) | All Other Compensation (3) ($) (d) | Total ($) (e) | ||||
Beverley A. Babcock | $125,000 | $155,058 | $— | $280,058 | ||||
C. Robert Bunch | $100,007 | $155,058 | $— | $255,065 | ||||
Matthew S. Darnall | $100,007 | $155,058 | $— | $255,065 | ||||
Julie A. Piggott | $100,000 | $155,058 | $— | $255,058 | ||||
Earl L. Shipp | $120,033 | $155,058 | $5,000 | $280,091 | ||||
William H. Weideman | $130,000 | $155,058 | $— | $285,058 | ||||
W. Anthony Will | $100,007 | $155,058 | $— | $255,065 | ||||
Carol A. Williams | $115,000 | $155,058 | $5,000 | $275,058 |
CEO Pay Ratio | ||
Annual Total Compensation - Current and Former CEO | $23,139,517 | |
Annual Total Compensation - Median Employee | $90,939 | |
Current and Former CEO to Median Employee Pay Ratio | 254:1 | |
Supplemental CEO Pay Ratio | ||
Annual Total Compensation - Current CEO | $8,840,134 | |
Annual Total Compensation - Median Employee | $90,939 | |
Current CEO to Median Employee Pay Ratio | 97:1 | |
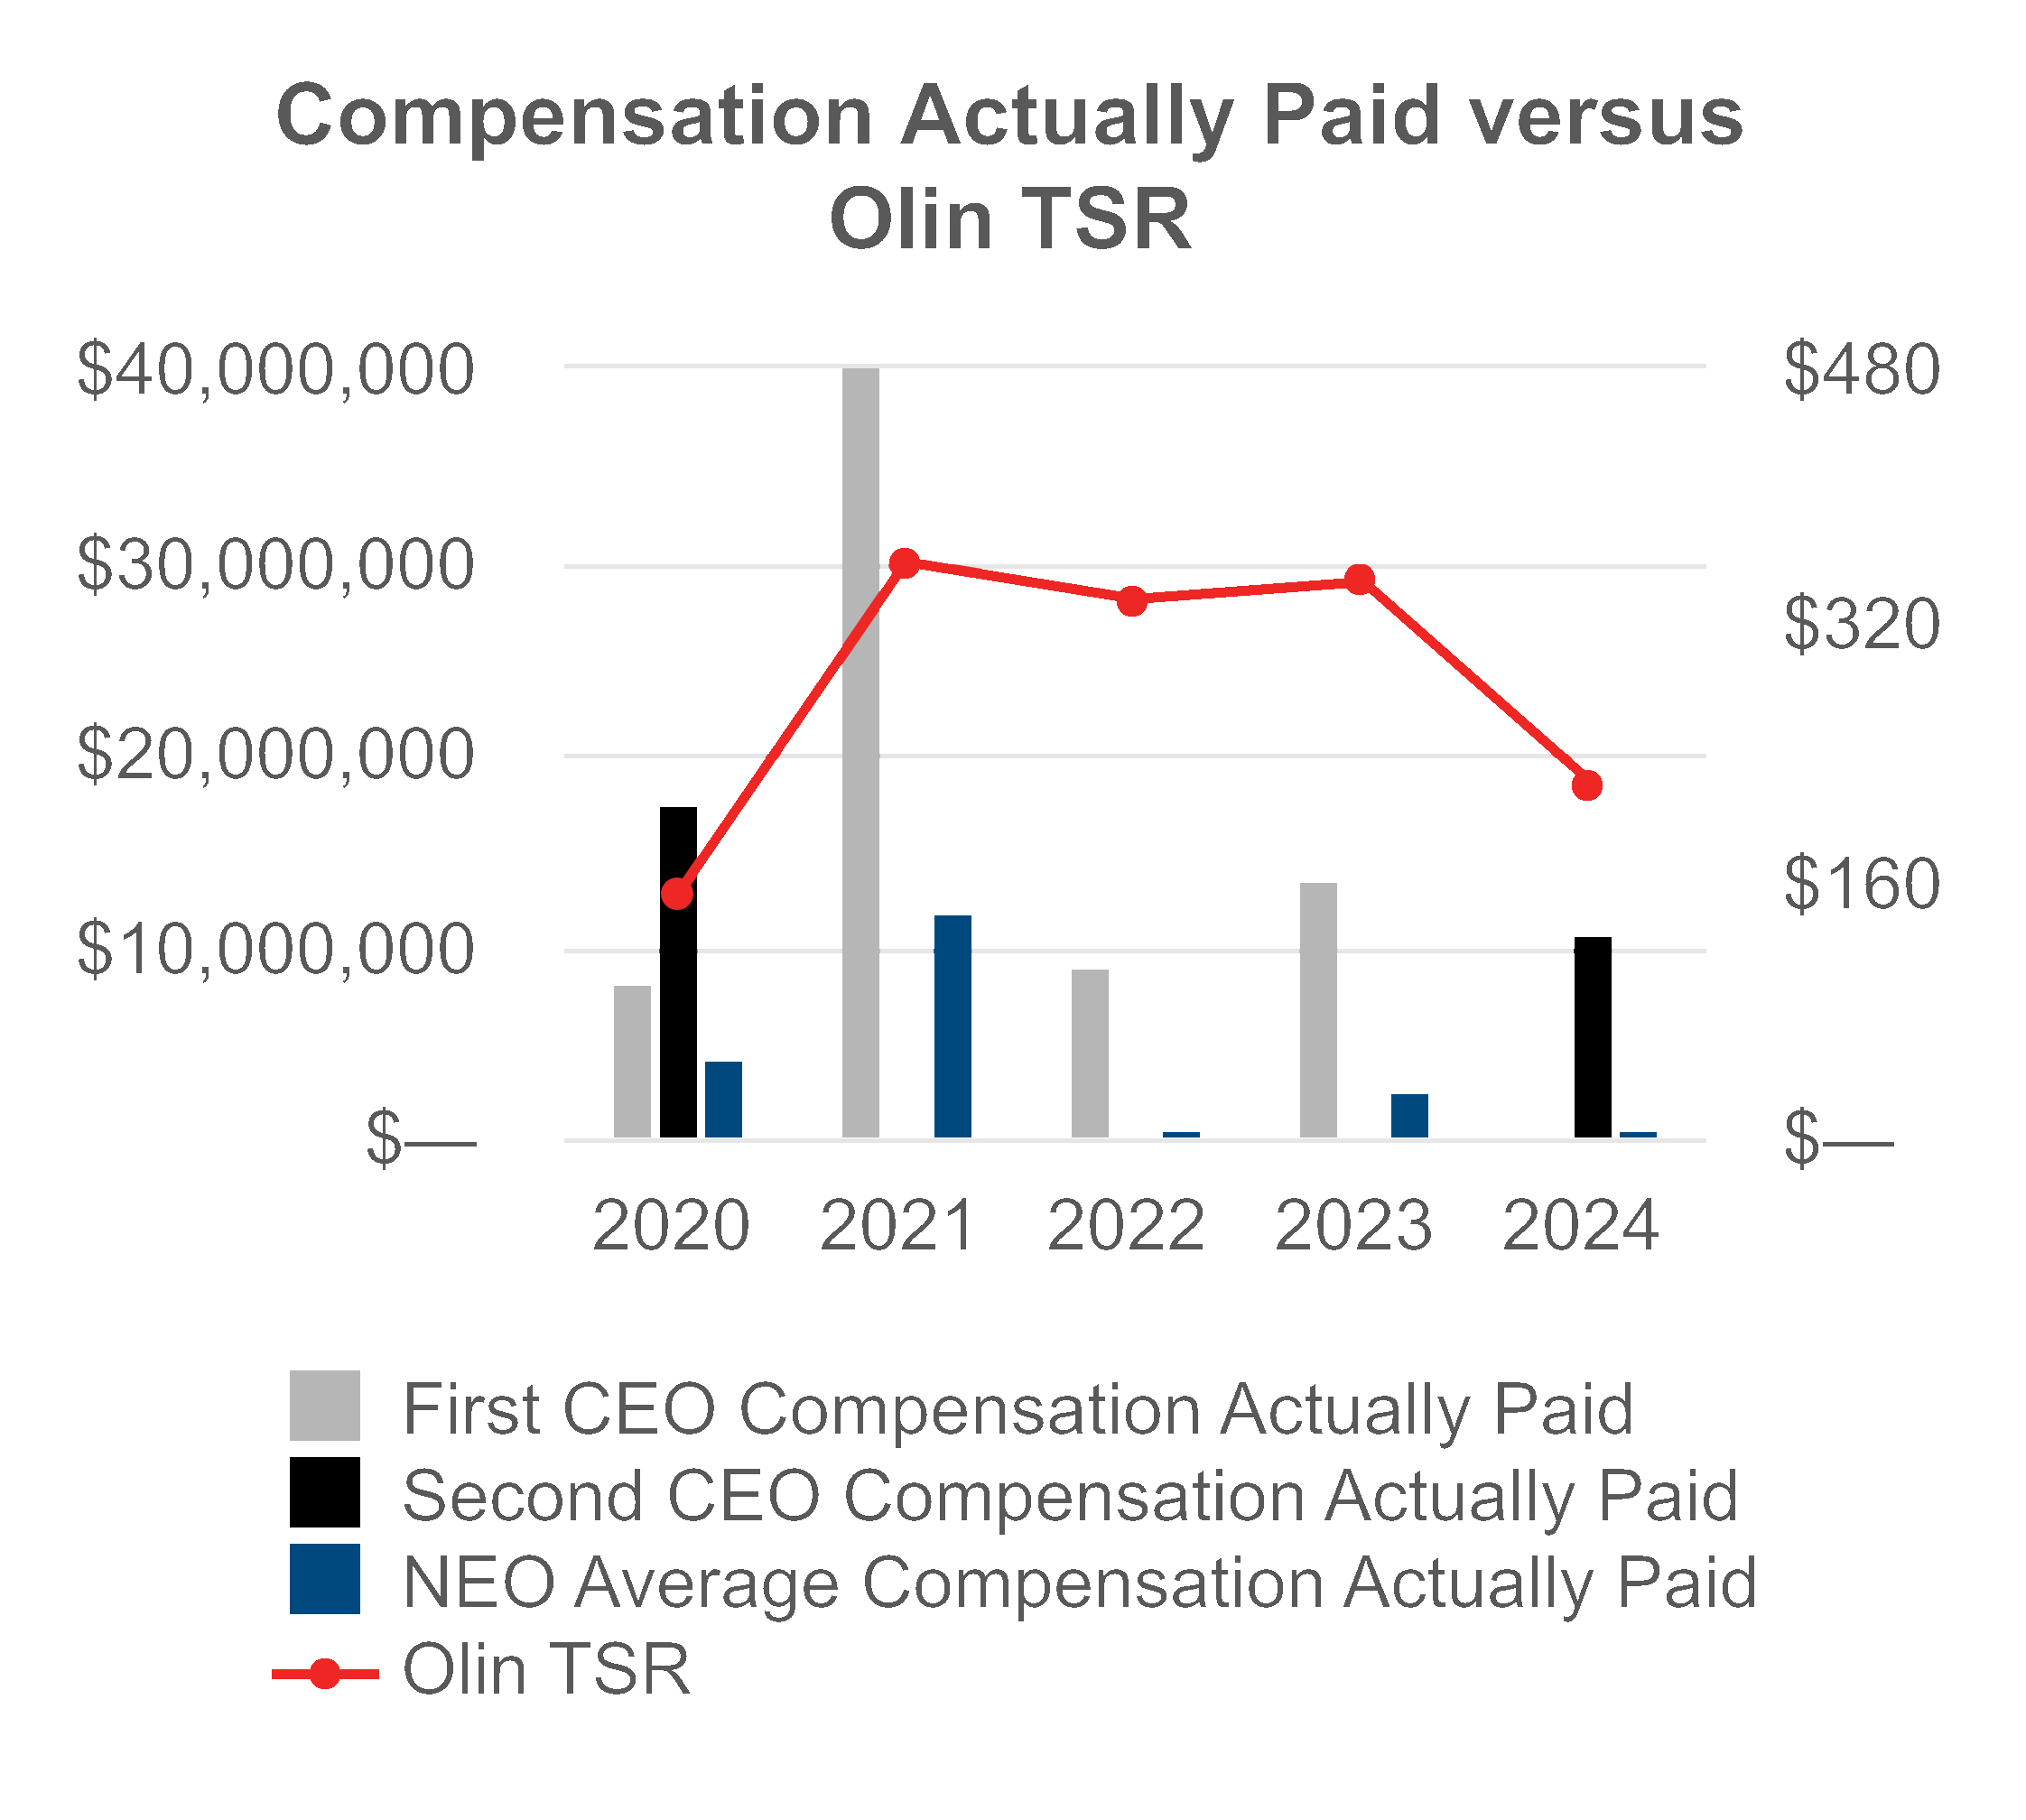
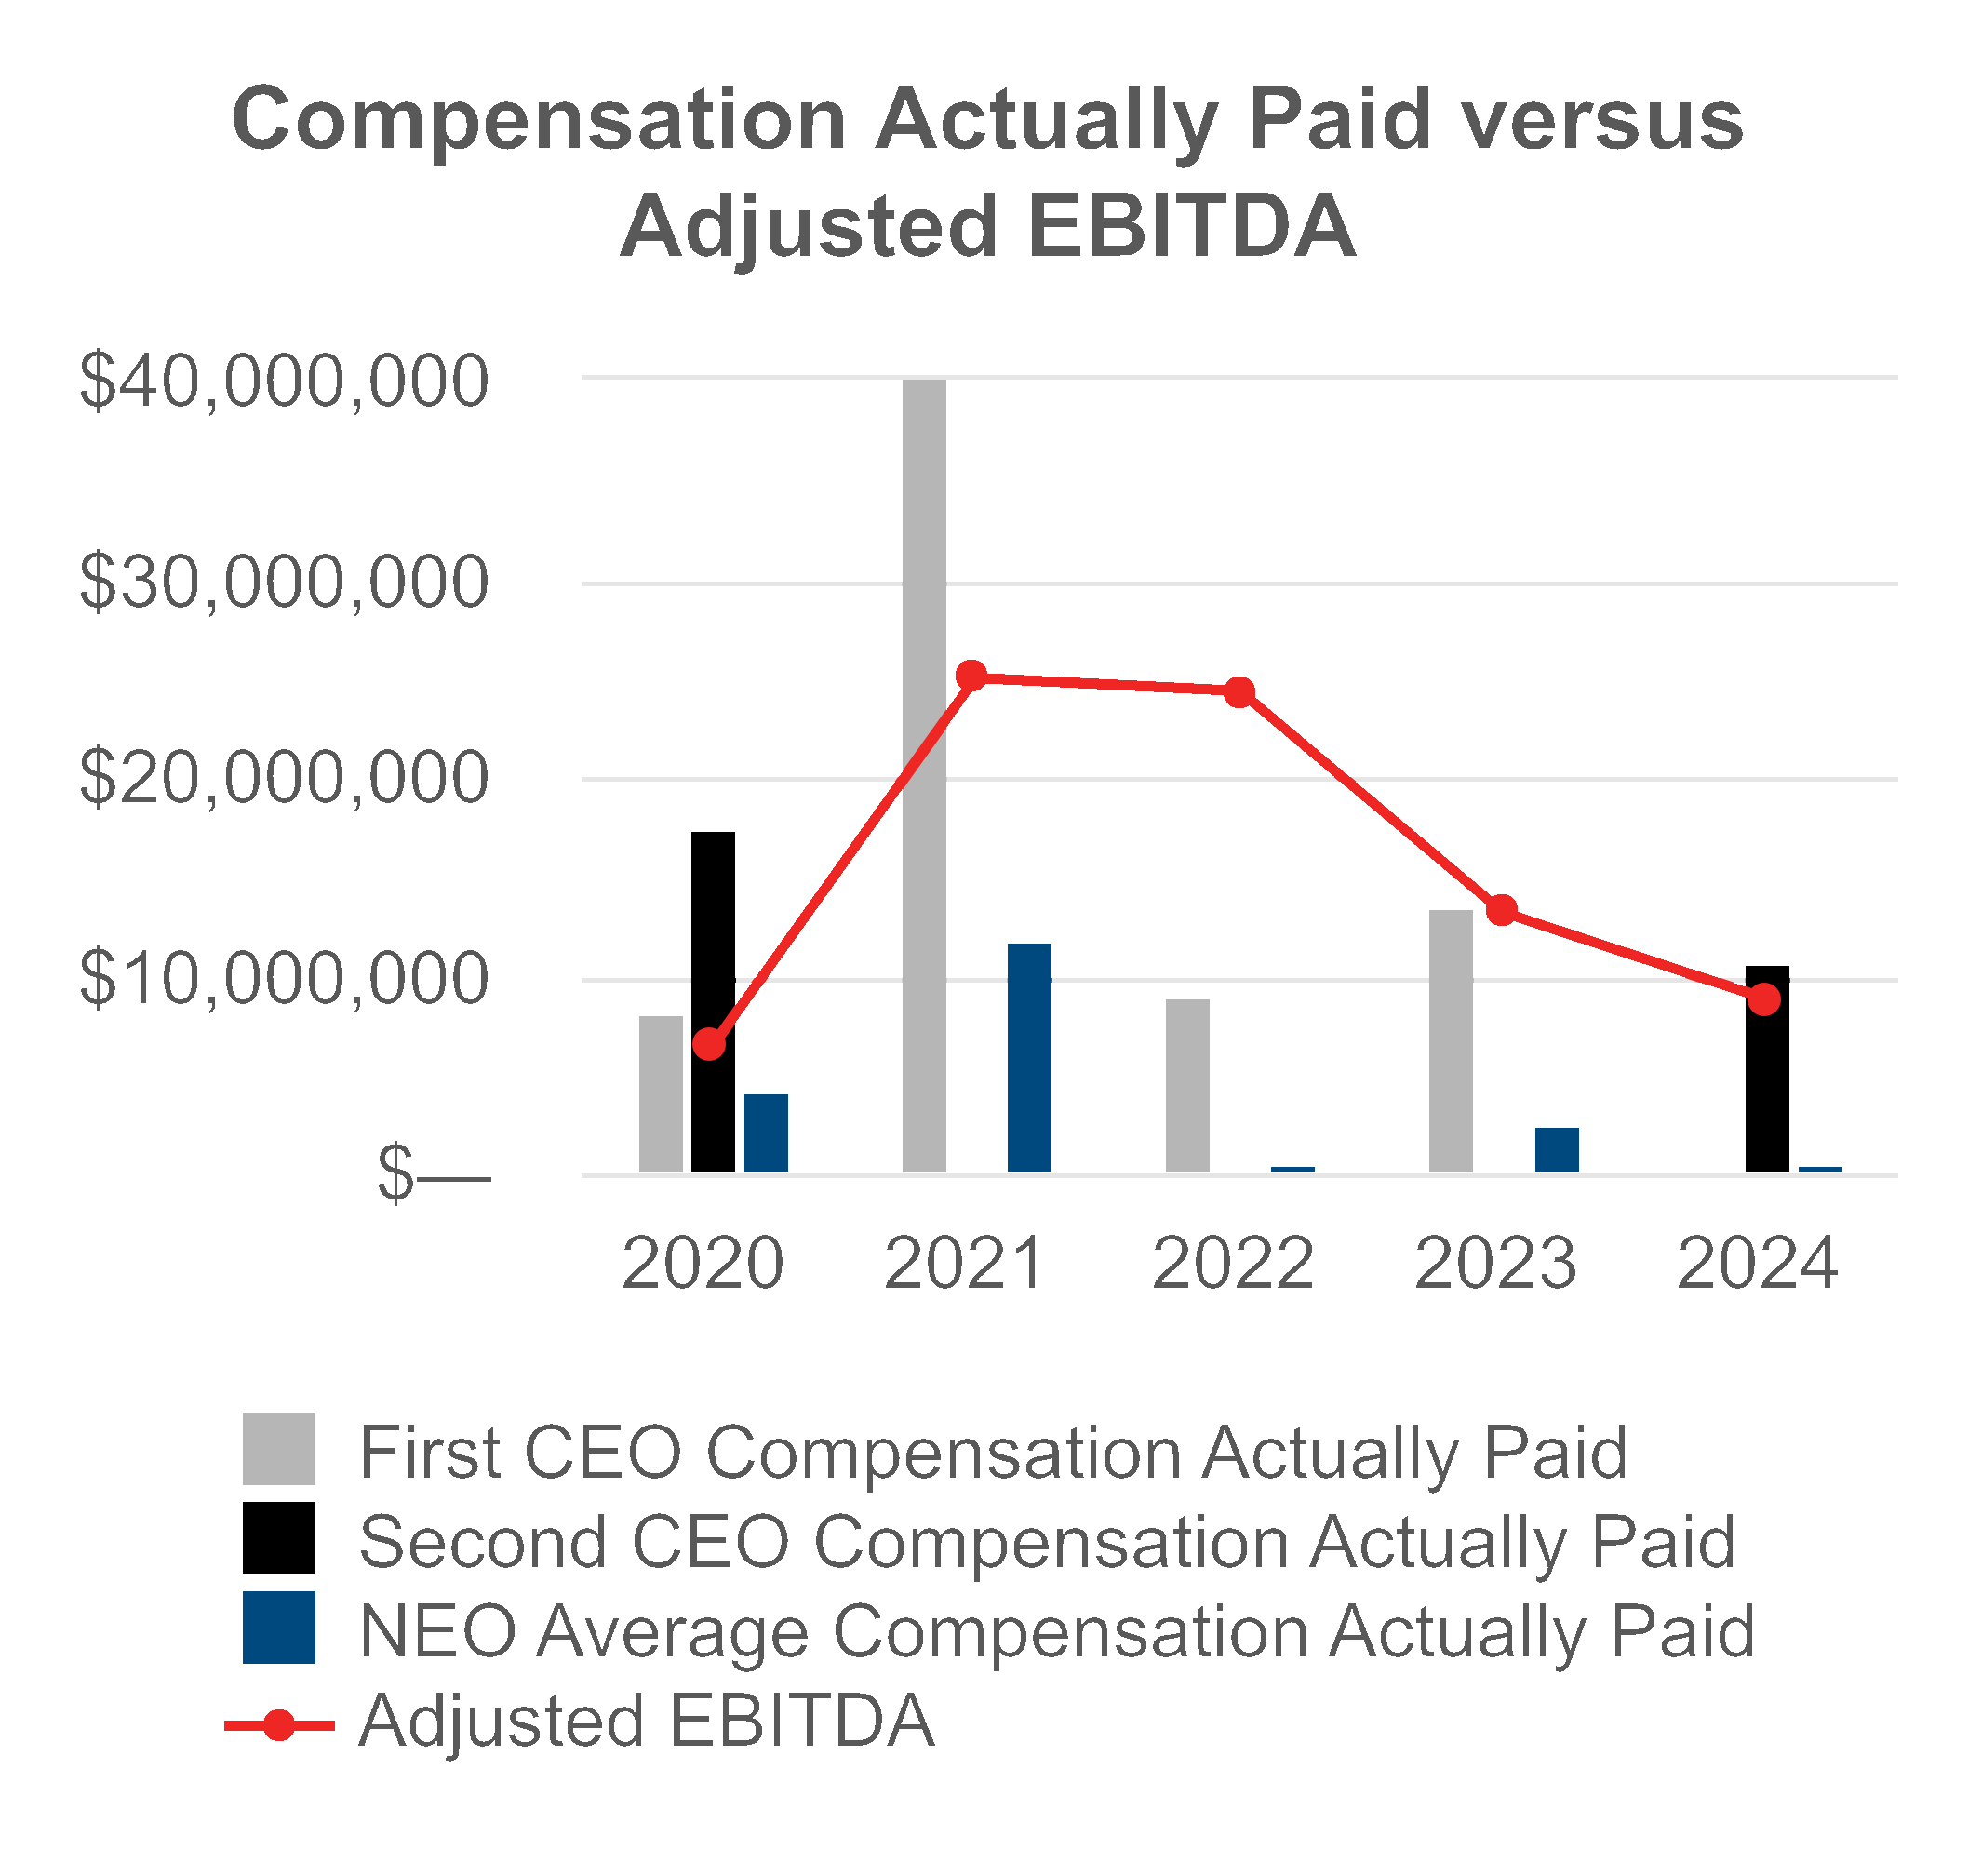
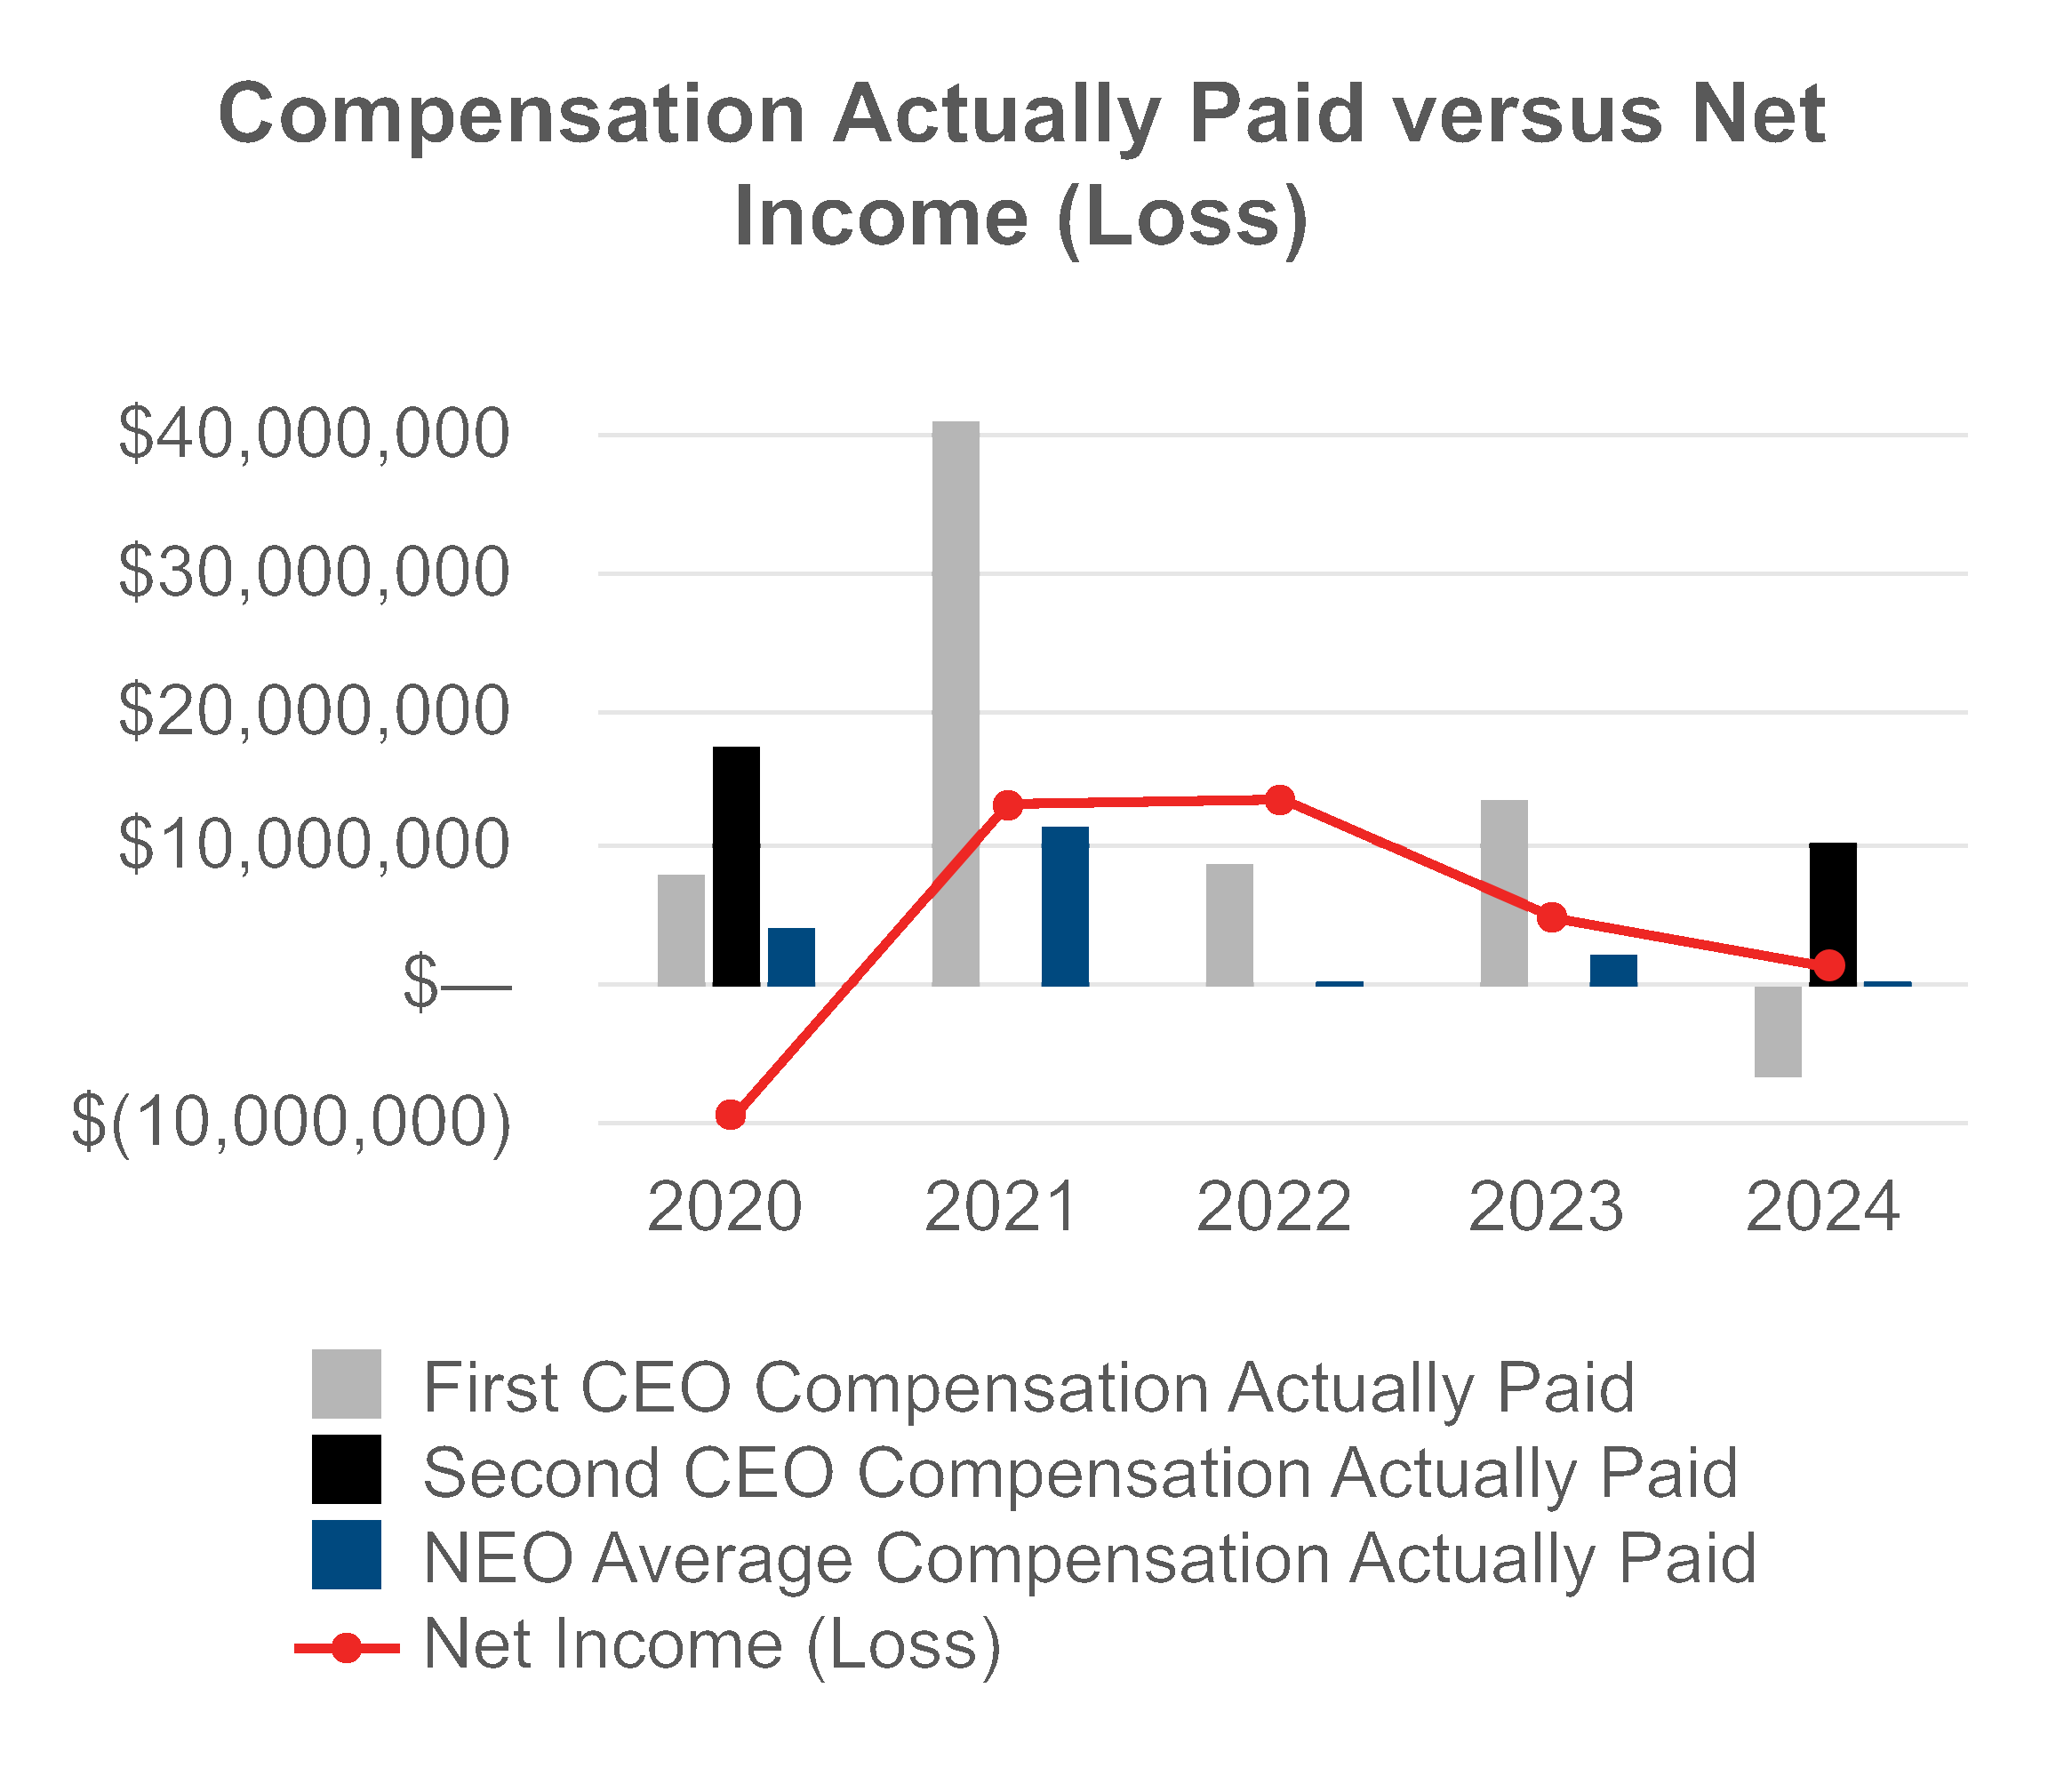
Year | SCT Total for First CEO (1) ($) | SCT Total for Second CEO (1) ($) | Average SCT Total for Other NEOs (2) ($) | CAP to First CEO (3) ($) | CAP to Second CEO (3) ($) | Average CAP to Other NEOs (3) (4) ($) | TSR (5) ($) | Peer Group TSR (5) ($) | Net Income (Loss) ($ in millions) | Adjusted EBITDA ($ in millions) | ||||||||||
2024 | $ | $ | $ | $( | $ | $ | $ | $ | $ | $ | ||||||||||
2023 | $ | N/A | $ | $ | N/A | $ | $ | $ | $ | $ | ||||||||||
2022 | $ | N/A | $ | $ | N/A | $ | $ | $ | $ | $ | ||||||||||
2021 | $ | N/A | $ | $ | N/A | $ | $ | $ | $ | $ | ||||||||||
2020 | $ | $ | $ | $ | $ | $ | $ | $ | $( | $ |
First CEO ($) | Second CEO ($) | Average Other NEOs ($) | ||||
Total Compensation from Summary Compensation Table | $ | $ | $ | |||
Adjustments for Pension | ||||||
Change in Pension Value and Nonqualified Deferred Compensation Earnings in the Summary Compensation Table | ( | |||||
Service Cost | ||||||
Total Adjustments for Pension | ( | |||||
Adjustments for Equity Awards (i) | ||||||
Grant Date Fair Value of Stock Awards in the Summary Compensation Table | ( | ( | ||||
Grant Date Fair Value of Option Awards in the Summary Compensation Table | ( | ( | ||||
Year-end Fair Value of Outstanding and Unvested Awards Granted in Current Year | ||||||
Year-over-year Change in Fair Value of Outstanding and Unvested Awards Granted in Prior Years | ( | |||||
Fair Value at Vest Date for Awards Granted and Vested in Current Year | ||||||
Year-over-year Change in Fair Value Between Prior Year-end Fair Value and Vest Date Fair Value of Awards Granted in Prior Years | ( | ( | ||||
Prior Year-end Fair Value of Awards Which Failed to Meet Vesting Conditions | ( | ( | ||||
Dividends or Other Earnings Paid on Stock or Option Awards not Otherwise Reflected in Total Compensation | ||||||
Total Adjustments for Equity Awards | ( | ( | ( | |||
Compensation Actually Paid | $( | $ | $ |


Most Important Performance Measures |
NEO | Grant Date | Number of Securities Underlying the Award | Exercise Price of the Award | Grant Date Fair Value of the Award | Percentage Change in the Closing Market Price of the Securities Underlying the Award between the Trading Day ending Immediately Prior to the Disclosure of Material Nonpublic Information and the Trading Day beginning immediately following the Disclosure of Material Nonpublic Information (1) | |||||
— | $ | $ | ||||||||
2/22/2024 | $ | $ | ||||||||
2/22/2024 | $ | $ | ||||||||
2/22/2024 | $ | $ | ||||||||
2/22/2024 | $ | $ | ||||||||
— | $ | $ | ||||||||
2/22/2024 | $ | $ | ||||||||
2/22/2024 | $ | $ |
Vote Required for Approval |
Fees ($ in thousands) | ||||||||
2024 | 2023 | |||||||
Nature of Service | $ | % | $ | % | ||||
Audit Fees (1) ............................................................ | $4,750 | 100% | $4,525 | 100% | ||||
Audit Related Fees ................................................... | — | — | — | — | ||||
Tax Fees | ||||||||
Tax Compliance ............................................... | — | — | — | — | ||||
Tax Consultation and Planning ..................... | — | — | — | — | ||||
All Other Fees ............................................................ | — | — | — | — | ||||
$4,750 | 100% | $4,525 | 100% | |||||
Vote Required for Ratification |