2026 THIRD QUARTER EARNINGS October 22, 2026 Turning Point For PG&E And California 1
2 This presentation and the oral remarks made in connection with it contain statements regarding PG&E Corporation’s and Pacific Gas and Electric Company’s (the “Utility”) future performance, including expectations, objectives, and forecasts about operating results (including 2026 and 2027 non-GAAP core EPS), debt and equity issuances, rate base growth, capital expenditures, cash flow, cost savings, credit ratings, customer bills, inflation, wildfire risk mitigation, safety outcomes, wildfire-related cost recovery, dividends, load growth, operating and maintenance costs, capital to expense ratio, technology, and regulatory developments. These statements and other statements that are not purely historical constitute forward-looking statements that are necessarily subject to various risks and uncertainties. Actual results may differ materially from those described in forward-looking statements. Factors that could cause actual results to differ materially include, but are not limited to, risks and uncertainties associated with: • the timing and outcome of the strategic review, including whether any strategic alternative will be identified and approved by PG&E Corporation’s Board of Directors, and any potential disruption to PG&E Corporation’s or the Utility’s business, or costs incurred, as a result of the strategic review and related uncertainty; • the risk that no strategic alternative is consummated, including the possibility that regulatory approvals from any applicable governmental entities (or any conditions, limitations or restrictions placed on such approvals) required for certain strategic alternatives are not able to be obtained, or that legal, regulatory, or other constraints may limit PG&E Corporation’s ability to pursue certain strategic alternatives that PG&E Corporation's Board of Directors or management determines would otherwise be in the best interests of PG&E Corporation and the Utility; • the possibility that, even if a strategic alternative is achieved, any or all of the intended or expected benefits of a strategic alternative will not be achieved; • wildfires that have occurred or may occur in the Utility’s service area, including the extent of the Utility’s liability in connection with the 2021 Dixie fire, the 2022 Mosquito fire, and future wildfires; • the timing and outcome of FERC and CPUC proceedings, including regarding ratemaking, cost recovery, and other matters; • the Utility’s ability to recover wildfire-related costs, including costs for the 2021 Dixie fire, from the Wildfire Fund and Continuation Account (including the Utility’s maintenance of a valid safety certificate and whether the Continuation Account has sufficient remaining funds), and through CPUC and FERC rate cases; • the Utility’s implementation of its wildfire mitigation programs, including PSPS, EPSS, situational awareness and response, undergrounding, and the programs’ effectiveness; • the impact of legislative and regulatory developments or inaction, including those regarding the Wildfire Fund, wildfires, the environment, California’s clean energy goals, the nuclear industry, utilities’ transactions with their affiliates, municipalization, privacy, import tariffs, and taxes; • the Utility’s ability to safely and reliably operate, maintain, construct, and decommission its facilities; • changes in the electric power and natural gas industries driven by technological advancements and a decarbonized economy; • a cyber incident, cybersecurity breach, or physical attack; • severe weather events, extended drought, and climate change, particularly their impact on the likelihood and severity of wildfires; • the outcome of self-reports, agency compliance reports, investigations, or other enforcement actions; • PG&E Corporation and the Utility’s substantial indebtedness, which may adversely affect their financial health and limit their operating flexibility; • the risks and uncertainties associated with ongoing or future litigation, including the extent to which related costs can be recovered through insurance, rates, or from other third parties; • the Utility’s ability to manage its costs effectively, timely recover costs through rates, and achieve projected savings and the extent of excess unrecoverable costs; • the impact of growing distributed and renewable generation resources, and changing customer demand for natural gas and electric services; • the Utility’s ability and cost to construct necessary infrastructure and the extent of customer demand for new load; and • the other factors disclosed in PG&E Corporation’s and the Utility’s joint Annual Report on Form 10-K for the year ended December 31, 2025, their joint Quarterly Report on Form 10-Q for the quarter ended September 30, 2026 (the “Form 10-Q”), and other reports filed with, or furnished to, the SEC, which are available on PG&E Corporation’s website at www.pgecorp.com and on the SEC’s website at www.sec.gov. Undefined, capitalized terms have the meanings set forth in the Form 10-Q. Unless otherwise indicated, the statements in this presentation are made as of October 22, 2026. PG&E Corporation and the Utility undertake no obligation to update information contained herein whether due to new information, future events, or otherwise, except to the extent required by law. This presentation was attached to PG&E Corporation’s and the Utility’s joint Current Report on Form 8-K that was furnished to the SEC on October 22, 2026, and is also available on PG&E Corporation’s website at www.pgecorp.com. Forward-Looking Statements
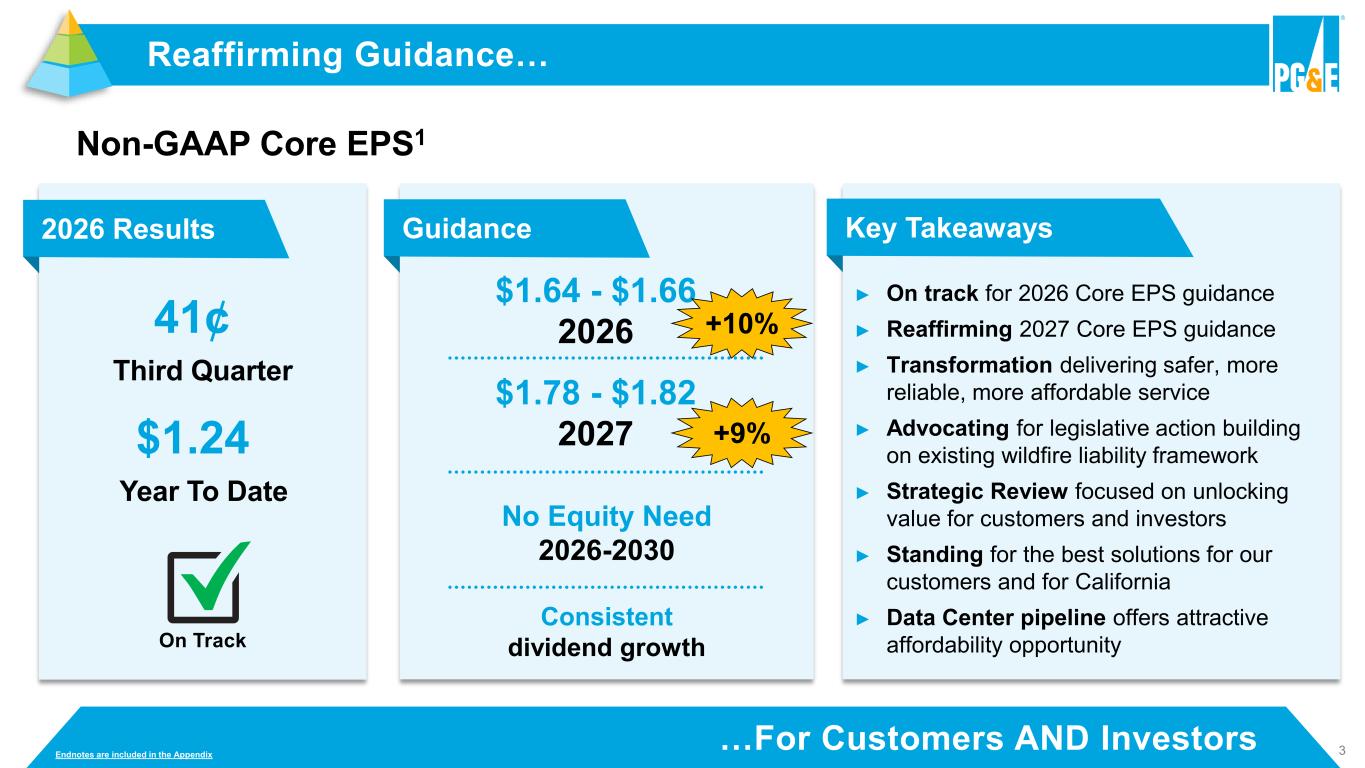
3 Non-GAAP Core EPS1 41¢ Third Quarter 2026 Results …For Customers AND Investors Reaffirming Guidance… Endnotes are included in the Appendix Guidance On Track ► On track for 2026 Core EPS guidance ► Reaffirming 2027 Core EPS guidance ► Transformation delivering safer, more reliable, more affordable service ► Advocating for legislative action building on existing wildfire liability framework ► Strategic Review focused on unlocking value for customers and investors ► Standing for the best solutions for our customers and for California ► Data Center pipeline offers attractive affordability opportunity Key Takeaways $1.78 - $1.82 2027 $1.64 - $1.66 2026 +10% $1.24 Year To Date +9% Consistent dividend growth No Equity Need 2026-2030
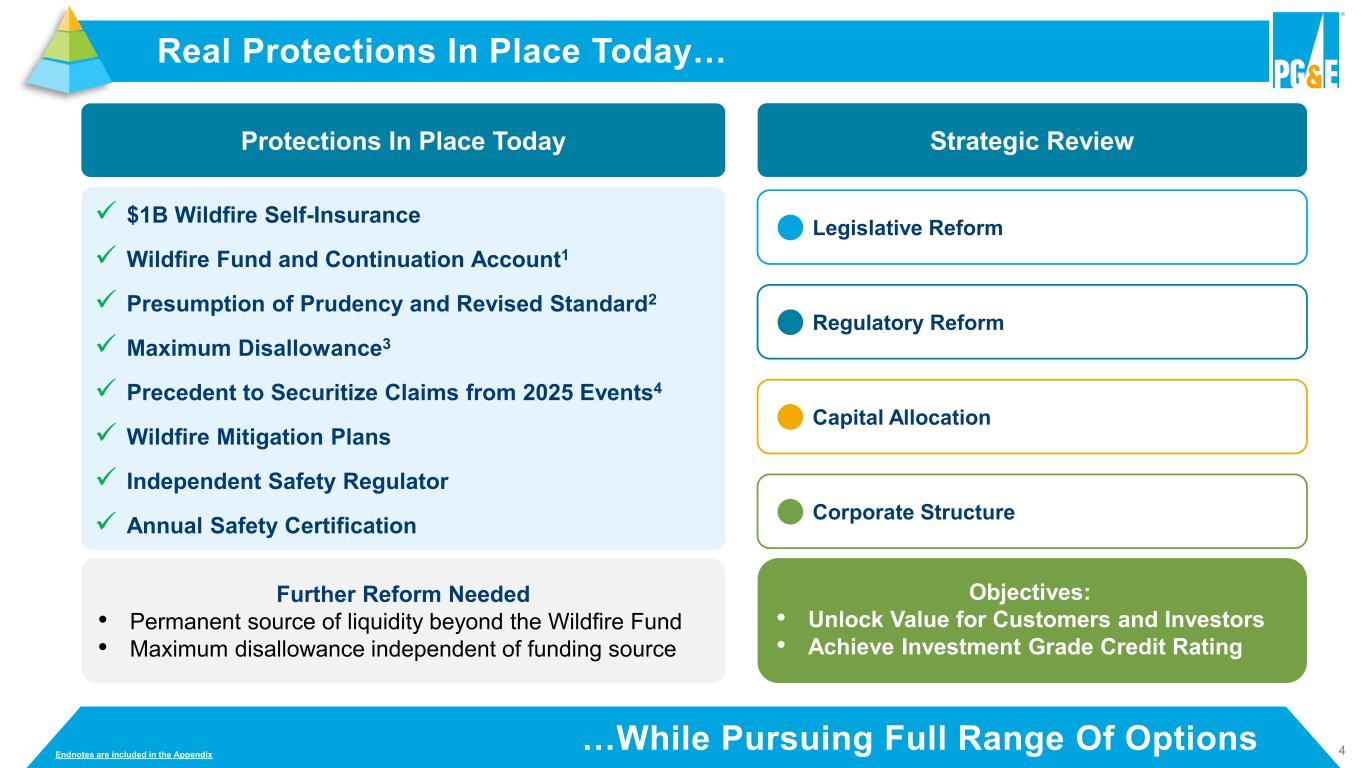
4 Real Protections In Place Today… …While Pursuing Full Range Of Options Further Reform Needed • Permanent source of liquidity beyond the Wildfire Fund • Maximum disallowance independent of funding source Legislative Reform Regulatory Reform Capital Allocation Corporate Structure ✓ $1B Wildfire Self-Insurance ✓ Wildfire Fund and Continuation Account1 ✓ Presumption of Prudency and Revised Standard2 ✓ Maximum Disallowance3 ✓ Precedent to Securitize Claims from 2025 Events4 ✓ Wildfire Mitigation Plans ✓ Independent Safety Regulator ✓ Annual Safety Certification Protections In Place Today Strategic Review Endnotes are included in the Appendix Objectives: • Unlock Value for Customers and Investors • Achieve Investment Grade Credit Rating
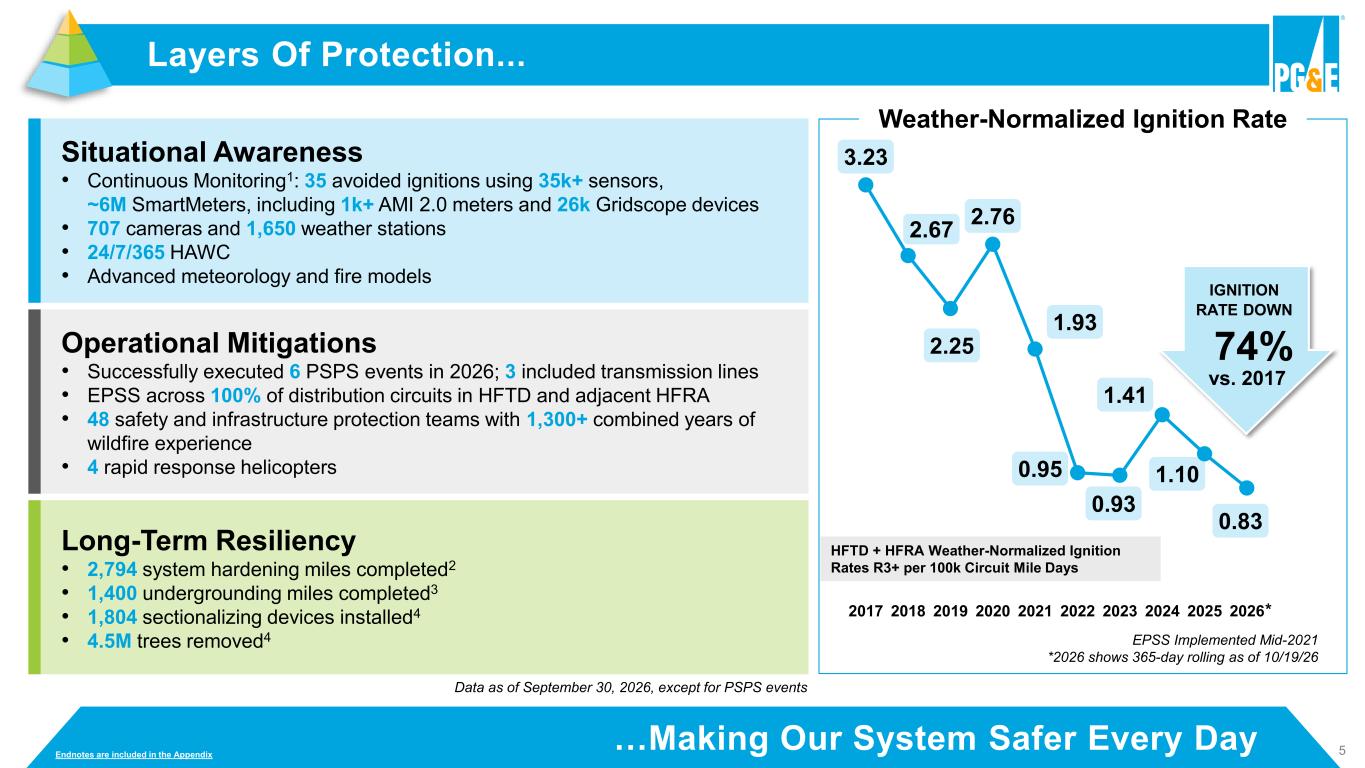
5…Making Our System Safer Every Day Layers Of Protection... Weather-Normalized Ignition Rate Situational Awareness • Continuous Monitoring1: 35 avoided ignitions using 35k+ sensors, ~6M SmartMeters, including 1k+ AMI 2.0 meters and 26k Gridscope devices • 707 cameras and 1,650 weather stations • 24/7/365 HAWC • Advanced meteorology and fire models Operational Mitigations • Successfully executed 6 PSPS events in 2026; 3 included transmission lines • EPSS across 100% of distribution circuits in HFTD and adjacent HFRA • 48 safety and infrastructure protection teams with 1,300+ combined years of wildfire experience • 4 rapid response helicopters Long-Term Resiliency • 2,794 system hardening miles completed2 • 1,400 undergrounding miles completed3 • 1,804 sectionalizing devices installed4 • 4.5M trees removed4 HFTD + HFRA Weather-Normalized Ignition Rates R3+ per 100k Circuit Mile Days 3.23 2.67 2.25 2.76 1.93 0.95 0.93 1.41 1.10 0.83 2017 2018 2019 2020 2021 2022 2023 2024 2025 2026 EPSS Implemented Mid-2021 *2026 shows 365-day rolling as of 10/19/26 * 74% vs. 2017 IGNITION RATE DOWN Endnotes are included in the Appendix Data as of September 30, 2026, except for PSPS events
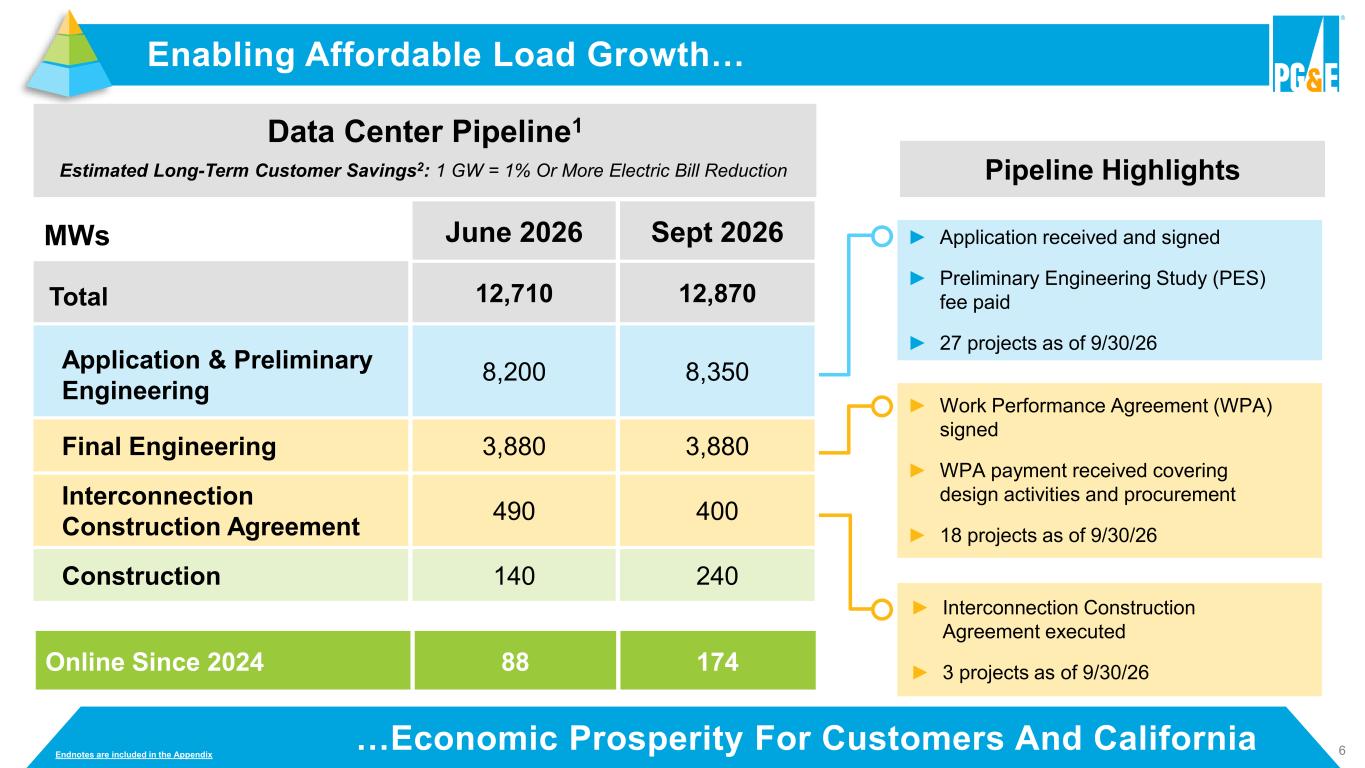
6…Economic Prosperity For Customers And California Enabling Affordable Load Growth… Endnotes are included in the Appendix Data Center Pipeline1 Estimated Long-Term Customer Savings2: 1 GW = 1% Or More Electric Bill Reduction Pipeline Highlights MWs June 2026 Sept 2026 Total 12,710 12,870 Application & Preliminary Engineering 8,200 8,350 Final Engineering 3,880 3,880 Interconnection Construction Agreement 490 400 Construction 140 240 ► Application received and signed ► Preliminary Engineering Study (PES) fee paid ► 27 projects as of 9/30/26 ► Work Performance Agreement (WPA) signed ► WPA payment received covering design activities and procurement ► 18 projects as of 9/30/26 ► Interconnection Construction Agreement executed ► 3 projects as of 9/30/26Online Since 2024 88 174
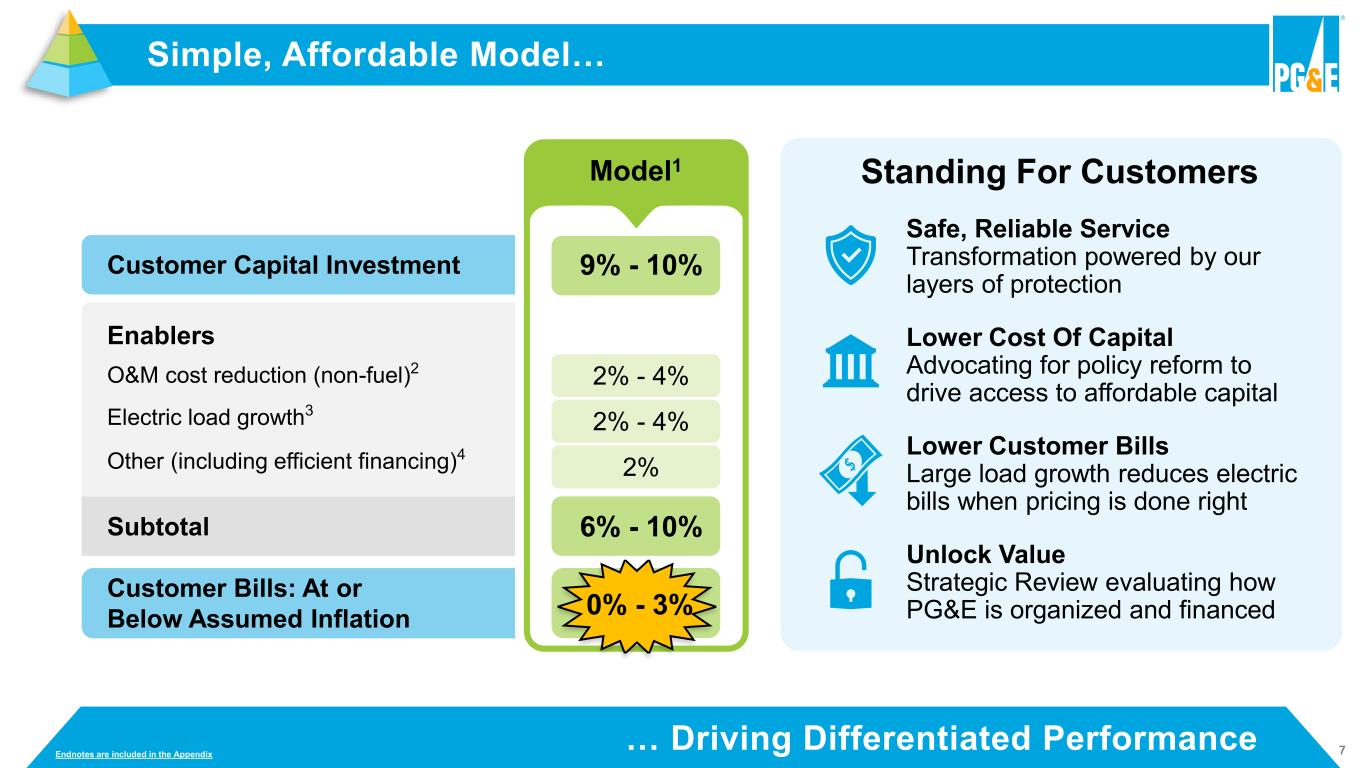
7… Driving Differentiated Performance Simple, Affordable Model… Endnotes are included in the Appendix Standing For Customers Safe, Reliable Service Transformation powered by our layers of protection Lower Cost Of Capital Advocating for policy reform to drive access to affordable capital Lower Customer Bills Large load growth reduces electric bills when pricing is done right Unlock Value Strategic Review evaluating how PG&E is organized and financed Subtotal Enablers O&M cost reduction (non-fuel)2 Electric load growth3 Other (including efficient financing)4 Customer Capital Investment Customer Bills: At or Below Assumed Inflation 2% - 3% 2% - 4% 2% 9% - 10% 6% - 9% 1% - 3% - 4 - 6 - 10 Model1 0
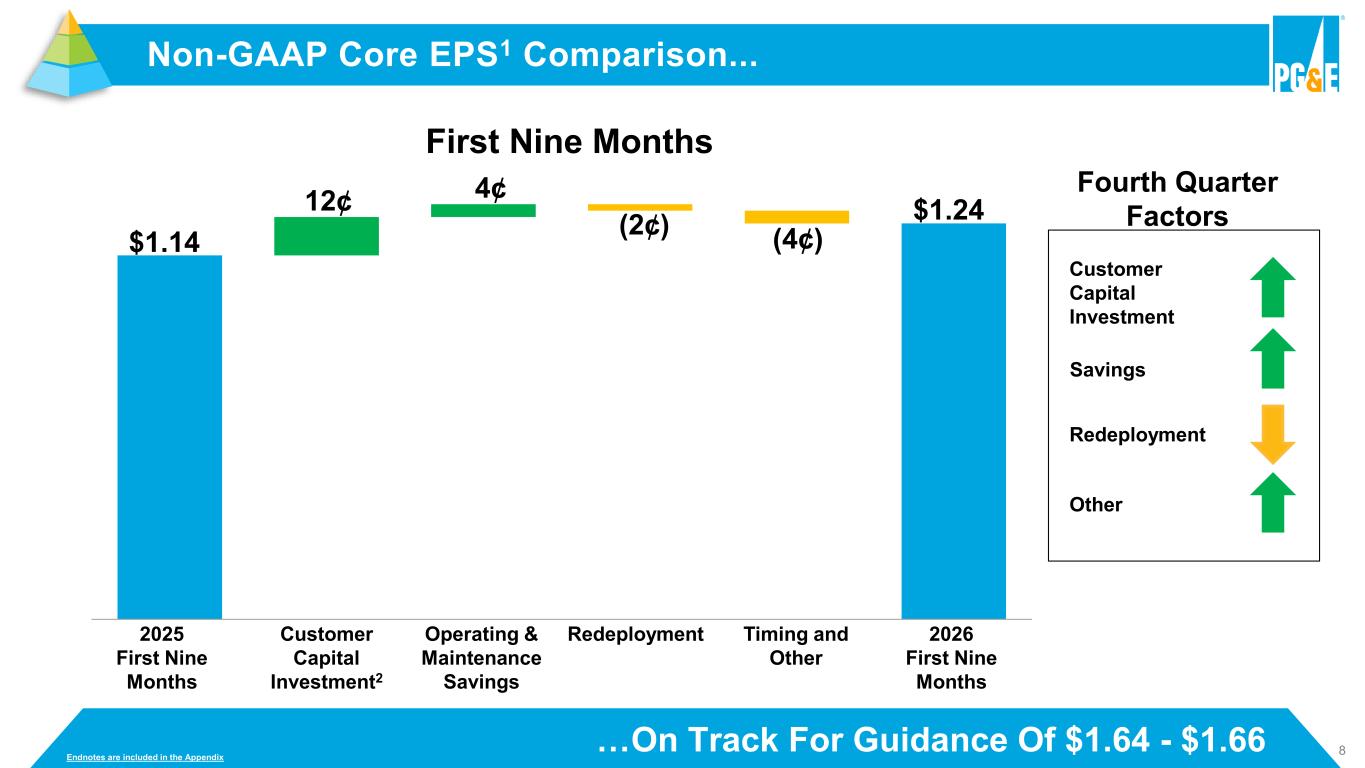
8 Non-GAAP Core EPS1 Comparison... Endnotes are included in the Appendix …On Track For Guidance Of $1.64 - $1.66 Endnotes are included in the Appendix 2025 nine months Customer Capital … Operating & … Redeployment Other -… 2026 nine months $- $0 $0 $1 $1 $1 $1 $1 Full Year 2025 vs. 2024 Customer Capital Investment2 Timing and t er 2026 First Nine Months Operating & Maintenance Savings Redeploy ent2025 First Nine Months 12¢ First Nine Months (2¢) 4¢ $1.14 (4¢) $1.24 Fourth Quarter Factors Customer Capital Investment Redeployment Other Savings
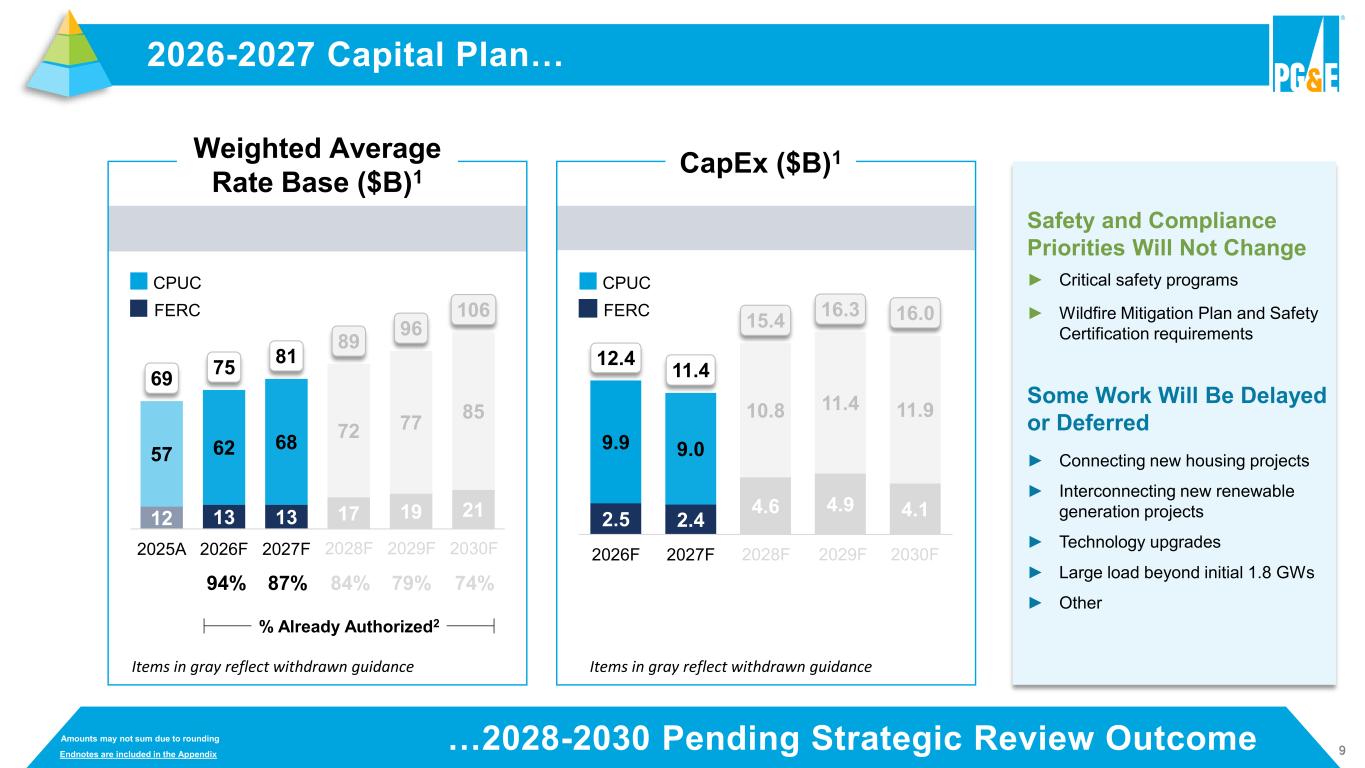
9…2028-2030 Pending Strategic Review Outcome 2026-2027 Capital Plan… CPUC FERC XX% % Already Authorized2 84% 79% 74% Weighted Average Rate Base ($B)1 CPUC FERC CapEx ($B)1 Endnotes are included in the Appendix 12 13 13 17 19 21 57 62 68 72 77 85 69 75 81 89 96 106 2025A 2026F 2027F 2028F 2029F 2030F 2.5 2.4 4.6 4.9 4.1 9.9 9.0 10.8 11.4 11.9 12.4 11.4 15.4 16.3 16.0 2026F 2027F 2028F 2029F 2030F 94% Items in gray reflect withdrawn guidanceItems in gray reflect withdrawn guidance Amounts may not sum due to rounding Safety and Compliance Priorities Will Not Change ► Critical safety programs ► Wildfire Mitigation Plan and Safety Certification requirements Some Work Will Be Delayed or Deferred ► Connecting new housing projects ► Interconnecting new renewable generation projects ► Technology upgrades ► Large load beyond initial 1.8 GWs ► Other 87%
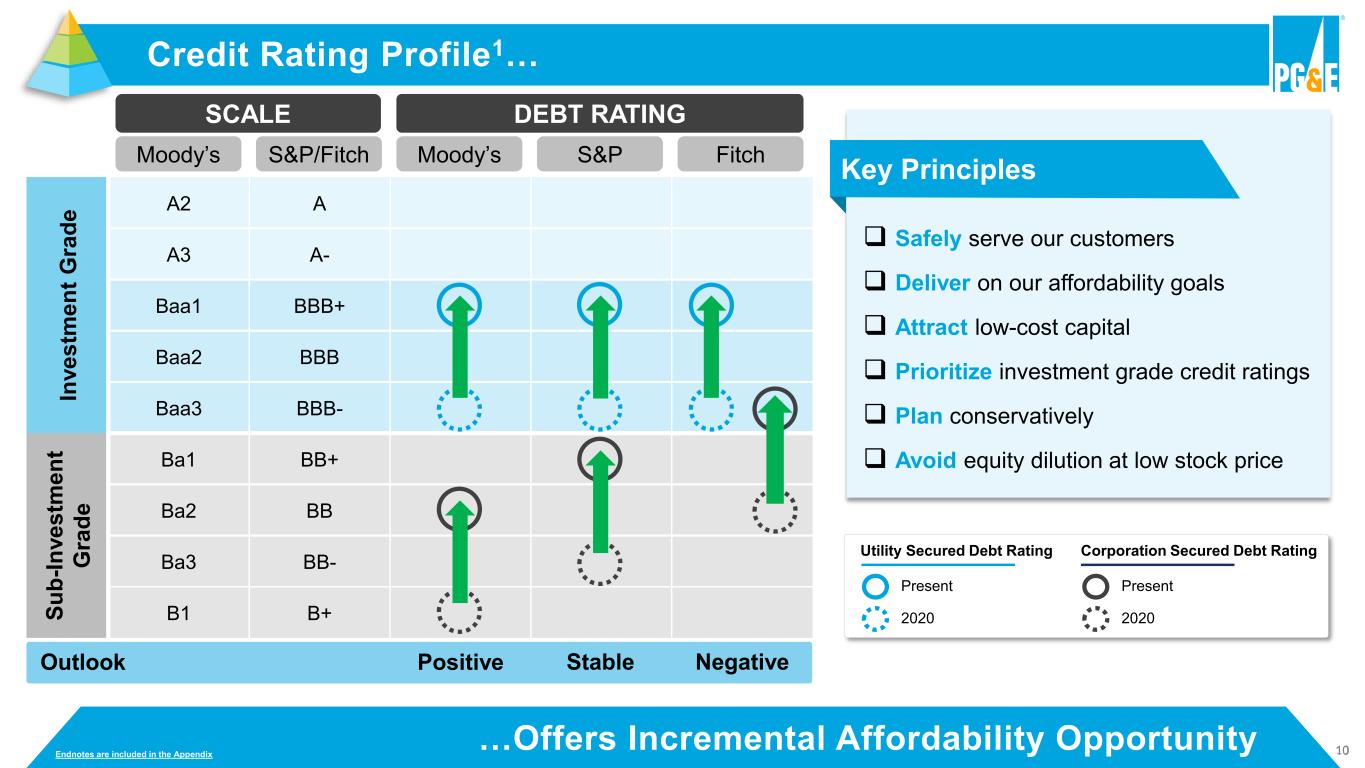
10…Offers Incremental Affordability Opportunity SCALE RATING In v e s tm e n t G ra d e A2 A A3 A- Baa1 BBB+ Baa2 BBB Baa3 BBB- S u b -I n v e s tm e n t G ra d e Ba1 BB+ Ba2 BB Ba3 BB- B1 B+ Outlook Positive Credit Rating Profile1… Stable Negative SCALE DEBT RATING Moody’s S&P/Fitch Moody’s S&P Fitch Present 2020 Corporation Secured Debt Rating Present 2020 Utility Secured Debt Rating Endnotes are included in the Appendix Key Principles ❑ Safely serve our customers ❑ Deliver on our affordability goals ❑ Attract low-cost capital ❑ Prioritize investment grade credit ratings ❑ Plan conservatively ❑ Avoid equity dilution at low stock price
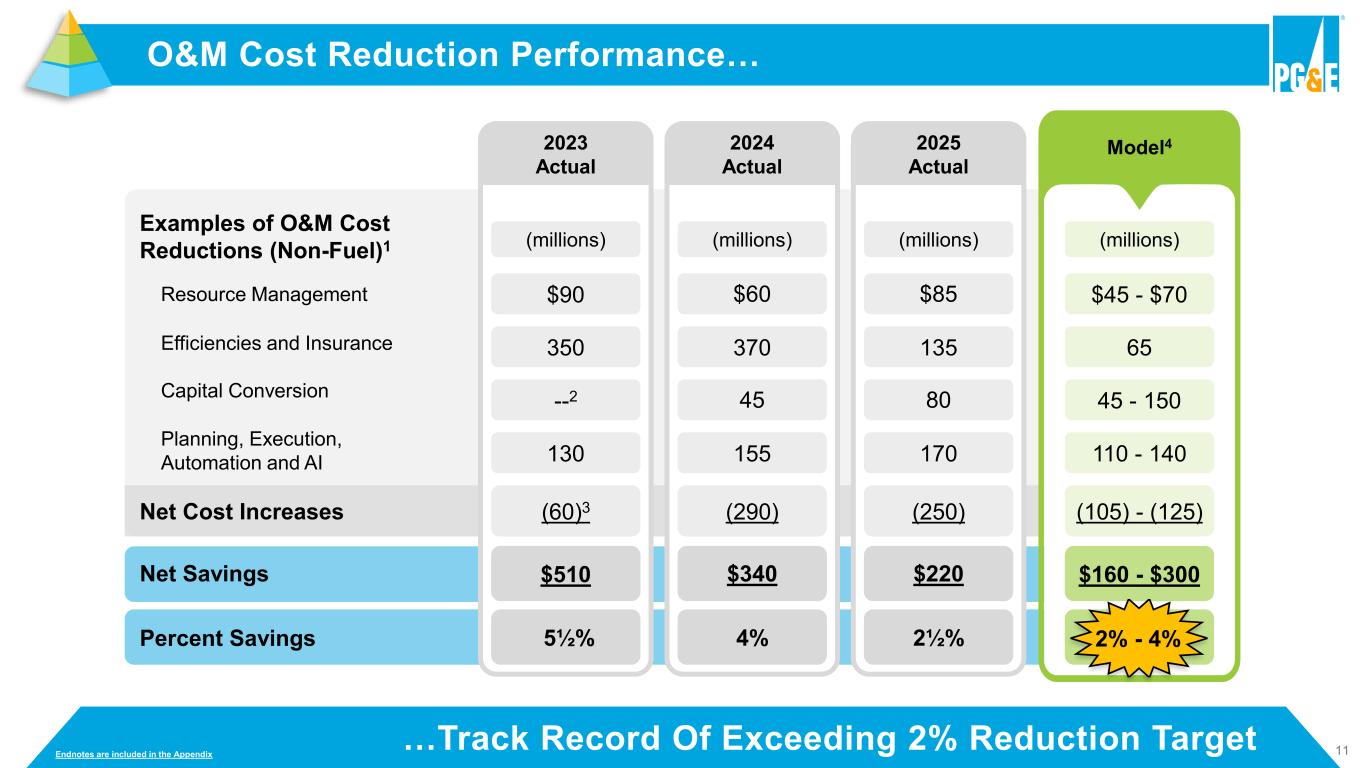
11 O&M Cost Reduction Performance… …Track Record Of Exceeding 2% Reduction Target Endnotes are included in the Appendix Examples of O&M Cost Reductions (Non-Fuel)1 Resource Management Efficiencies and Insurance Capital Conversion Planning, Execution, Automation and AI Net Cost Increases Net Savings Percent Savings $510 5½% (60)3 130 --2 350 $90 (millions) 2023 Actual $340 4% (290) 155 45 370 $60 (millions) 2024 Actual $160 - $300 2% - 4% (105) - (125) 110 - 140 45 - 150 65 $45 - $70 (millions) Model4 $220 2½% (250) 170 80 135 $85 (millions) 2025 Actual
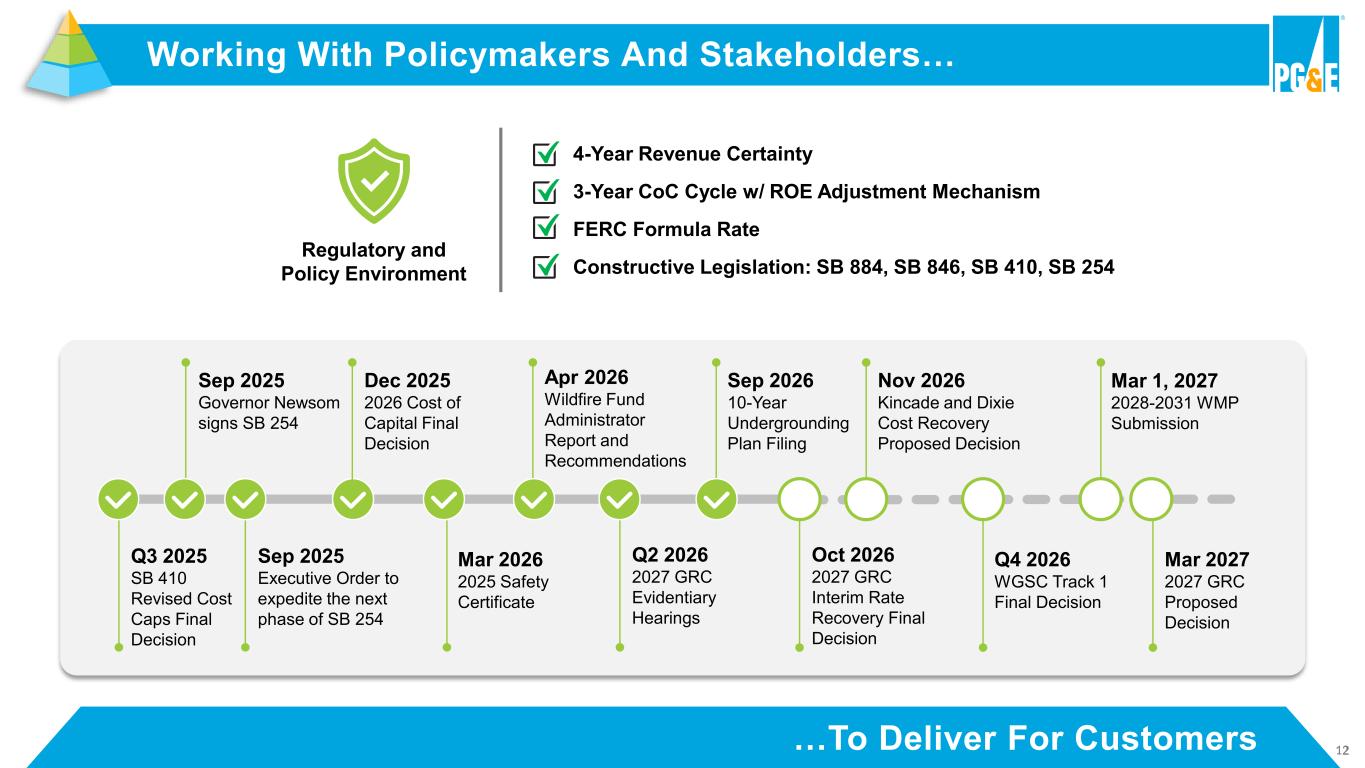
12…To Deliver For Customers Working With Policymakers And Stakeholders… Constructive Legislation: SB 884, SB 846, SB 410, SB 254 4-Year Revenue Certainty 3-Year CoC Cycle w/ ROE Adjustment Mechanism FERC Formula Rate Regulatory and Policy Environment Dec 2025 2026 Cost of Capital Final Decision Sep 2025 Governor Newsom signs SB 254 Q3 2025 SB 410 Revised Cost Caps Final Decision Sep 2025 Executive Order to expedite the next phase of SB 254 Apr 2026 Wildfire Fund Administrator Report and Recommendations Mar 2026 2025 Safety Certificate Nov 2026 Kincade and Dixie Cost Recovery Proposed Decision Q2 2026 2027 GRC Evidentiary Hearings Sep 2026 10-Year Undergrounding Plan Filing Mar 2027 2027 GRC Proposed Decision Q4 2026 WGSC Track 1 Final Decision Mar 1, 2027 2028-2031 WMP Submission Oct 2026 2027 GRC Interim Rate Recovery Final Decision
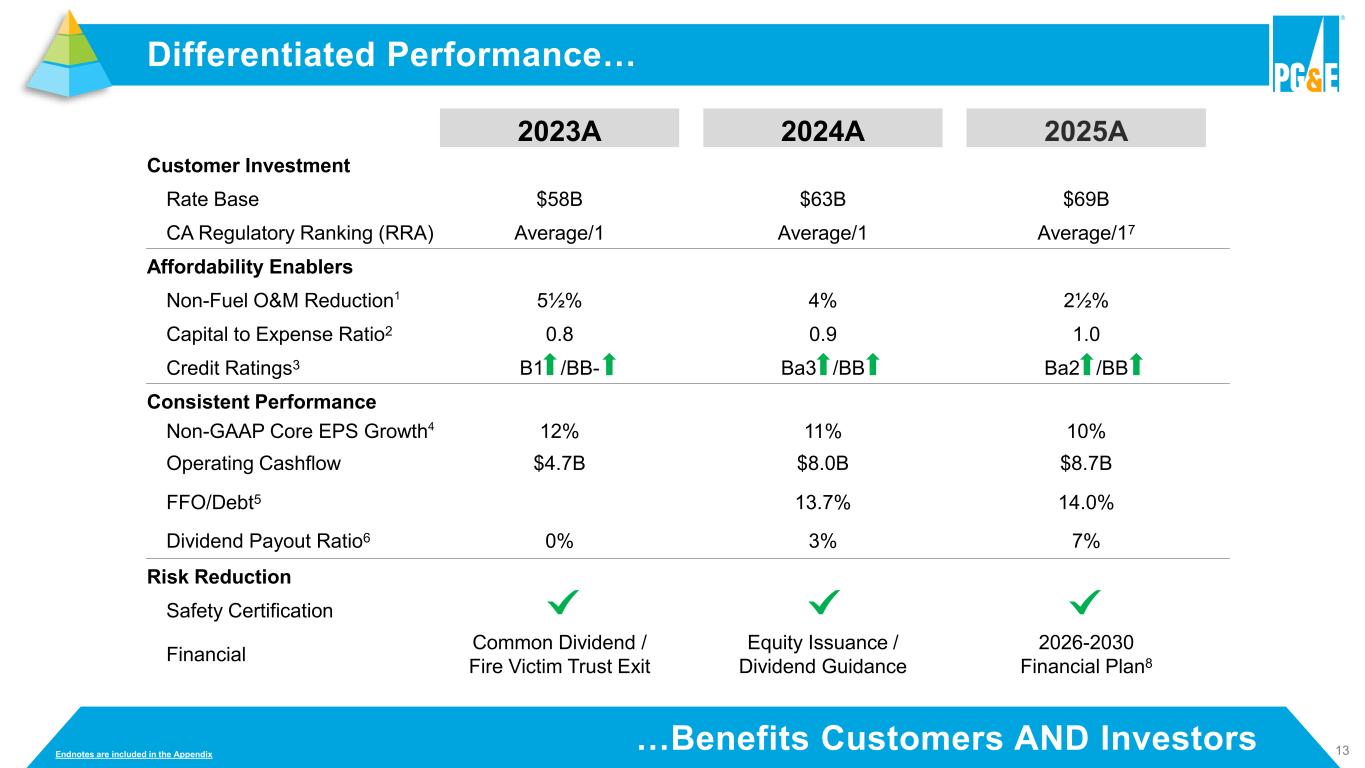
13…Benefits Customers AND Investors 2023A 2024A 2025A Customer Investment Rate Base $58B $63B $69B CA Regulatory Ranking (RRA) Average/1 Average/1 Average/17 Affordability Enablers Non-Fuel O&M Reduction1 5½% 4% 2½% Capital to Expense Ratio2 0.8 0.9 1.0 Credit Ratings3 B1 /BB- Ba3 /BB Ba2 /BB Consistent Performance Non-GAAP Core EPS Growth4 12% 11% 10% Operating Cashflow $4.7B $8.0B $8.7B FFO/Debt5 13.7% 14.0% Dividend Payout Ratio6 0% 3% 7% Risk Reduction Safety Certification Financial Common Dividend / Fire Victim Trust Exit Equity Issuance / Dividend Guidance 2026-2030 Financial Plan8 Differentiated Performance… Endnotes are included in the Appendix
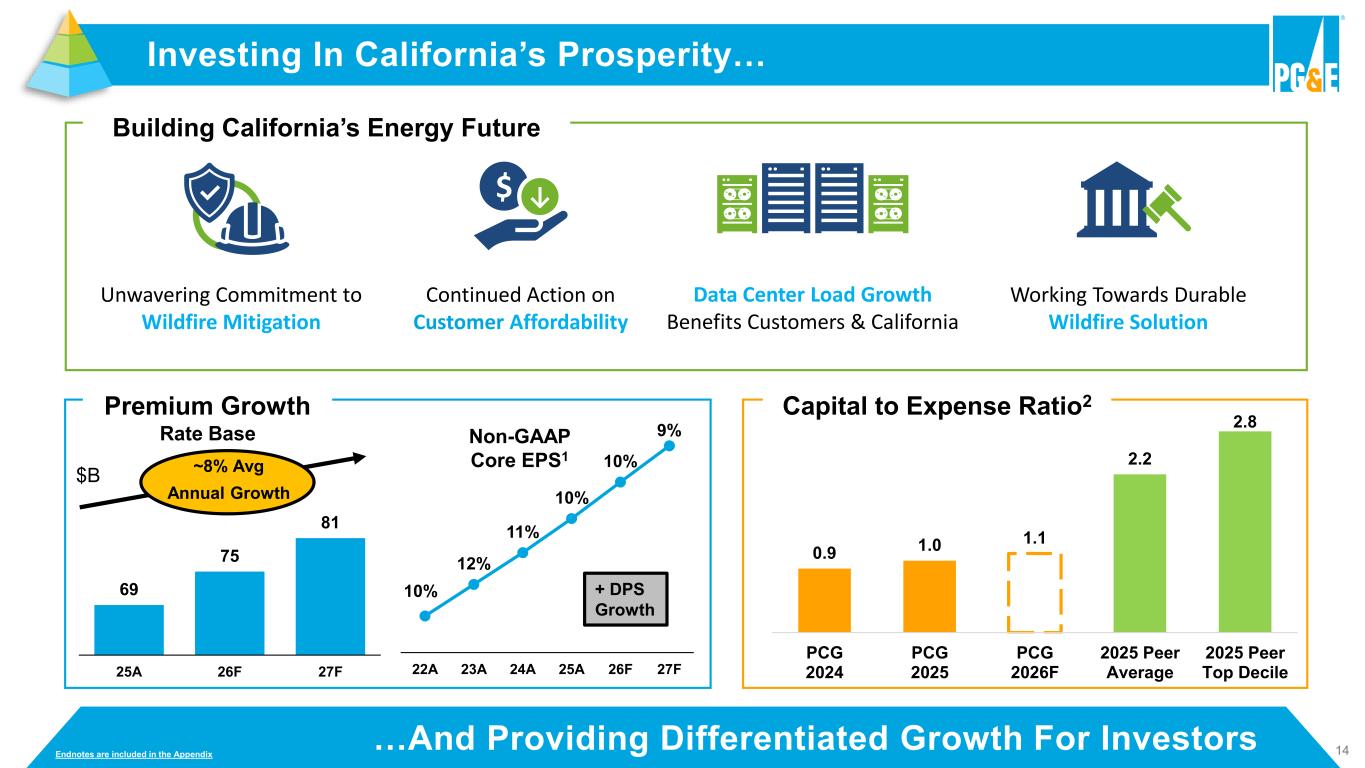
14…And Providing Differentiated Growth For Investors Investing In California’s Prosperity… Building California’s Energy Future 10% 12% 11% 10% 10% 9% 22A 23A 24A 25A 26F 27F $B 0.9 1.0 1.1 2.2 2.8 PCG 2024 PCG 2025 PCG 2026F 2025 Peer Average 2025 Peer Top Decile Premium Growth Capital to Expense Ratio2 ~8% Avg Annual Growth Rate Base Non-GAAP Core EPS1 + DPS Growth 69 75 81 25A 26F 27F Endnotes are included in the Appendix $ ↓ Continued Action on Customer Affordability Unwavering Commitment to Wildfire Mitigation Data Center Load Growth Benefits Customers & California Working Towards Durable Wildfire Solution
15 Physical and Financial Safety Decarbonized Energy System Affordable and Resilient Energy Q&A
Appendix 1 Presentation Endnotes 16
17 Appendix 1: Presentation Endnotes Slide 3: Reaffirming Guidance 1. Non-GAAP core EPS is not calculated in accordance with GAAP. See Appendix 3, Exhibit A for a reconciliation of EPS results on a GAAP basis to non-GAAP core EPS and Appendix 3, Exhibit E regarding non-GAAP financial measures. PG&E Corporation is unable to provide GAAP guidance or present a quantitative reconciliation of forward-looking non-GAAP core earnings, non-GAAP core EPS, or non-GAAP core EPS growth (including any ratios based thereon, including dividend payout ratios) without unreasonable effort because specific line items, which may be significant, are not estimable. For instance, amortization of the Wildfire Fund contribution asset, the impacts of regulatory decisions, special tax items, and wildfire-related costs, net of recoveries, are difficult to predict due to various factors outside of management’s control. Slide 4: Real Protections In Place Today 1. For claims above $1B self-insurance attachment point. 2. Prior to the enactment of AB 1054, utilities bore the burden of proving that their conduct was reasonable in order to obtain recovery of costs through rates. AB 1054 changed the standard so that the conduct of a utility is deemed reasonable unless a party to the proceeding creates a serious doubt as to the reasonableness of the utility’s conduct. Reasonable conduct is not limited to the optimum practice, method, or act to the exclusion of others, but rather encompasses a spectrum of possible practices, methods, or acts consistent with utility system needs, the interest of the ratepayers, and the requirements of governmental agencies of competent jurisdiction. 3. Maximum disallowance is 20% of electric T&D equity rate base as of year of ignition. Maximum disallowance does not apply if Utility found to have acted with conscious or willful disregard of the rights and safety of others. 4. Exceeding Wildfire Fund capacity. Slide 5: Layers Of Protection 1. Benefits began in 2025. 2. Program began in 2018. 3. Program began in 2021. 4. Program began in 2019. Slide 6: Enabling Affordable Load Growth 1. Scope includes applications received to serve new data center load requesting 20 megawatts of power or more. Application & Preliminary Engineering includes projects that have submitted an application and requires the customer to have paid the Preliminary Engineering Study fee ($500,000). Final Engineering includes projects that have executed a Work Performance Agreement and requires the customer to have begun paying for design and procurement activities (10% of the total estimated project cost). Construction ends after customer energization. 2. Load growth can reduce other customers' rates when the incremental revenue for the new load is greater than the total incremental costs as a result of serving that load. Factors that may cause the Utility’s actual results to differ materially from this forecast include the pricing and rate design for the new load, which in turn depends on power supply costs, the costs to construct infrastructure to connect new load, the Utility’s cost to serve the new load, and the amount of power used. Assumes additional power supply costs from serving new data center load do not result in higher prices for other customers. See “Forward-Looking Statements” on slide 2. Slide 7: Simple, Affordable Model 1. These numbers are illustrative approximations and should not be interpreted as a guarantee of future performance. See “Forward-Looking Statements” on slide 2. 2. The Utility’s cost reduction strategies include increased efficiency and waste elimination driven by implementing the Lean operating system, improving its work management, identifying additional opportunities to improve its capital-to-expense ratio, and an improved organizational design. Factors that may cause the Utility’s actual results to differ materially from i ts forecasts include whether the Utility can control its operating costs within the authorized levels of spending and timely recover its costs through rates; whether the Utility can achieve projected savings; the extent to which the Utility incurs unrecoverable costs that are higher than the forecasts of such costs; and changes in cost forecasts or the scope and timing of planned work resulting from changes in customer demand for electricity and natural gas or other reasons. See “Forward-Looking Statements” on slide 2. Non-fuel operating and maintenance costs is designed to represent the Utility’s operational efficiency. It excludes certain state-mandated programs where the Utility’s role is to facilitate achieving public policy goals regarding energy efficiency, the cost of which the Utility recovers; and expenses paid for using the statutory revenues associated with Diablo Canyon extended operations authorized by SB 846. This calculation also does not include balancing account deferrals; property taxes; non-core items; and other adjustments such as write-offs for canceled work including the Pacific Generation transaction. Reductions available for redeployment. 3. Expected drivers of forecasted electric load growth include data centers, electric vehicle adoption, and building electrification. 4. Factors that may cause the Utility’s actual results to differ materially from its forecasts include the ability of PG&E Corporation and the Utility to access capital markets and other sources of debt and equity financing in a timely manner on acceptable terms; their ability to raise financing through securitization transactions; actions by credit rating agencies to downgrade PG&E Corporation’s or the Utility’s credit ratings; the supply and price of electricity, natural gas, and nuclear fuel ; and the impact of any changes in federal or state tax laws, policies, regulations, or their interpretation, and PG&E Corporation’s and the Utility’s ability to obtain efficient tax treatment. See “Forward-Looking Statements” on slide 2. Slide 8: Non-GAAP Core EPS Comparison 1. Non-GAAP core EPS is not calculated in accordance with GAAP. See Appendix 3, Exhibit A for a reconciliation of EPS results on a GAAP basis to non-GAAP core EPS and Appendix 3, Exhibit E regarding non-GAAP financial measures. 2. Year-over-year changes in customer capital investment were primarily due to the earnings impact of higher rate base, the 2023 WMCE final decision, partially offset by the change in the Utility’s authorized CPUC return on equity from 10.28% to 9.98%. Slide titles are hyperlinks
18 Appendix 1: Presentation Endnotes Slide titles are hyperlinks Slide 9: 2026-2027 Capital Plan 1. Weighted-average rate base forecasts reflect authorized and incurred capital expenditures plus a forecast of capital expenditures that the Utility expects to be approved. Excludes construction work in progress (CWIP) and non-earnings rate base related to AB 1054 and SB 254. See "Forward-Looking Statements" on slide 2. 2. Percentage already authorized for CPUC-jurisdictional rate base holds constant the 2026 adopted CapEx for 2027 from the 2023 GRC and includes SB 410 and Oakland headquarters Petition for Modification, Gas AMI, 2023 WMCE, other CPUC- jurisdictional approvals and assumes FERC-jurisdictional rate base is equivalent to amounts requested in the formula rate through Transmission Owner rate proceedings for years 2025 through 2027. Slide 10: Credit Rating Profile 1. A securities rating is not a recommendation to buy, sell, or hold securities and may be subject to revision or withdrawal at any time. 2. FFO/Debt is not calculated in accordance with GAAP. A reconciliation is not provided for future period FFO/Debt because PG&E Corporation is not able to estimate the impact of specific line items, which have the potential to significantly impact the company’s FFO/Debt in future periods, and so a reconciliation is not available without unreasonable effort. See Appendix 3, Exhibit E regarding non-GAAP financial measures. Slide 11: O&M Cost Reduction Performance 1. Non-fuel operating and maintenance costs is designed to represent the Utility’s operational efficiency. It excludes certain state-mandated programs where the Utility’s role is to facilitate achieving public policy goals regarding energy efficiency, the cost of which the Utility recovers; and expenses paid for using the statutory revenues associated with Diablo Canyon extended operations authorized by SB 846. This calculation also does not include balancing account deferrals; property taxes; non-core items; and other adjustments such as write-offs for canceled work including the Pacific Generation transaction. Reductions available for redeployment. 2. Denoted amount is not material. 3. A higher discount rate used to measure the projected benefit costs at December 31, 2023 compared to December 31, 2022 resulted in lower pension and other post-retirement benefits service cost in the amount of $321 million. This decrease is embedded in 2023 net cost increases. 4. These numbers are illustrative approximations and should not be interpreted as a guarantee of future performance. See “Forward-Looking Statements” on slide 2. Slide 13: Differentiated Performance 1. The Utility’s cost reduction strategies include increased efficiency driven by implementing the Lean operating system, improving its work management, identifying additional opportunities to convert expenses to capital expenditures, and an improved organizational design. Factors that may cause the Utility’s actual results to differ materially from its forecasts include whether the Utility can control its operating costs within the authorized levels of spending and timely recover its costs through rates; whether the Utility can achieve projected savings; the extent to which the Utility incurs unrecoverable costs that are higher than the forecasts of such costs; and changes in cost forecasts or the scope and timing of planned work resulting from changes in customer demand for electricity and natural gas or other reasons. Non-fuel operating and maintenance costs is designed to represent the Utility’s operational efficiency. It excludes certain state-mandated programs where the Utility’s role is to facilitate achieving public policy goals regarding energy efficiency, the cost of which the Ut ility recovers; and expenses paid for using the statutory revenues associated with Diablo Canyon extended operations authorized by SB 846. This calculation also does not include balancing account deferrals; property taxes; non-core items; and other adjustments such as write-offs for canceled work including the Pacific Generation transaction. Reductions available for redeployment. See “Forward-Looking Statements” on slide 2. 2. Represents Capital expenditures divided by Operating and maintenance, as disclosed in the applicable Annual Report on Form 10-K. 3. Corporation secured debt credit rating. 4. Non-GAAP core EPS is not calculated in accordance with GAAP. See Appendix 3, Exhibit A for a reconciliation of EPS results on a GAAP basis to non-GAAP core EPS and Appendix 3, Exhibit E regarding non-GAAP financial measures. 5. FFO/Debt is not calculated in accordance with GAAP. See Appendix 3, Exhibit D for a reconciliation of Operating income and Total debt on a GAAP basis to FFO/Debt. FFO/Debt for 2023 has not been disclosed. A reconciliation is not provided for future period FFO/Debt because PG&E Corporation is not able to estimate the impact of specific line items, which have the potential to significantly impact the company’s FFO/Debt in future periods, and so a reconciliation is not available without unreasonable effort. See Appendix 3, Exhibit E regarding non-GAAP financial measures. 6. Dividend payout ratio is determined by dividing the total dividends per share paid over the fiscal year by non-GAAP core EPS. See Appendix 3, Exhibit E regarding non-GAAP financial measures. 7. On October 14, 2026, S&P Global's Regulatory Research Associates (RRA) lowered California's state regulatory ranking to Average/2 from Average/1 as part of its comprehensive review completed in September 2026. 8. On September 2, 2026, PG&E Corporation withdrew its capital expenditure, rate base, and earnings growth guidance beyond 2027 in connection with the announcement of the Strategic Review. See "Forward-Looking Statements" on slide 2.
19 Appendix 1: Presentation Endnotes Slide titles are hyperlinks Slide 14: Investing In California's Prosperity 1. Non-GAAP core EPS is not calculated in accordance with GAAP. See Appendix 3, Exhibit A for a reconciliation of EPS results on a GAAP basis to non-GAAP core EPS and Appendix 3, Exhibit E regarding non-GAAP financial measures. 2. Represents Capital expenditures divided by Operating and maintenance, as disclosed in the applicable Annual Report on Form 10-K. Peer utilities used for these calculations include AEP, AES Corp, Alliant Energy Corp, Ameren Corp, Avista Corp, Berkshire Hathaway Energy, Black Hills Corp, CenterPoint Energy, Cleco Power, Consolidated Edison Inc., Dominion Energy, DPL LLC, DTE Energy Company, Duke Energy Corporation, Edison International, Entergy Corporation and Subsidiaries, Evergy Inc., Eversource Energy and Subsidiaries, Exelon Corp, FirstEnergy Corp, Hawaiian Electric, Idaho Power Company, MDU Resources Group, MGE Energy Inc., NextEra Energy, NiSource Inc., OGE Energy Corp, Otter Tail Corporation, Pinnacle West Capital Corp, Portland General Electric, PPL Electric, Public Service Company of New Mexico, Public Service Enterprise Group, Puget Sound Energy, Sempra, Southern Co, Unitil Corp, WEC Energy Group, and Xcel Energy. Slide 21: Appendix 2: 2026 Factors Impacting Earnings 1. Non-GAAP core EPS is not calculated in accordance with GAAP. See Appendix 3, Exhibit E regarding non-GAAP financial measures. 2. The low end of the share count range assumes no PG&E Corporation mandatory convertible preferred shares (MCPs) have converted into common stock. The high end of the range assumes all MCPs have converted based on a PG&E Corporation common stock price of $20.55, consistent with the prospectus supplement filed December 3, 2024. 3. Weighted-average rate base forecasts reflect authorized and incurred capital expenditures plus a forecast of capital expenditures that the Utility expects to be approved. Excludes construction work in progress (CWIP) and non-earnings rate base related to AB 1054 and SB 254. See "Forward-Looking Statements" on slide 2. 4. The capital structure of an investor-owned utility is the proportional authorization of shareholders’ equity and debt that comprise a company’s long-range financing or capitalization. The CPUC currently authorized capital structure is comprised of 47.5% long-term debt, 0.5% preferred equity, and 52% common equity. The FERC currently authorized capital structure is comprised of 49.70% long-term debt, 0.3% preferred, and 50% common equity. 5. Non-GAAP core earnings assumptions include no 2026 impacts from changes in the federal tax code. 6. Unrecoverable net interest includes PG&E Corporation long-term debt, Wildfire Fund contribution debt financing, and other interest above authorized, netted against the Utility’s balancing account interest. Slide 22: Appendix 2: 2027 Factors Impacting Earnings 1. Non-GAAP core EPS is not calculated in accordance with GAAP. See Appendix 3, Exhibit E regarding non-GAAP financial measures. 2. The low end of the share count range assumes no PG&E Corporation mandatory convertible preferred shares (MCPs) have converted into common stock until maturity of the MCP instrument in December. The high end of the range assumes all MCPs have converted based on a PG&E Corporation common stock price of $20.55, consistent with the prospectus supplement filed December 3, 2024. 3. Weighted-average rate base forecasts reflect authorized and incurred capital expenditures plus a forecast of capital expenditures that the Utility expects to be approved. Excludes construction work in progress (CWIP) and non-earnings rate base related to AB 1054 and SB 254. See "Forward-Looking Statements" on slide 2. 4. The capital structure of an investor-owned utility is the proportional authorization of shareholders’ equity and debt that comprise a company’s long-range financing or capitalization. The CPUC currently authorized capital structure is comprised of 47.5% long-term debt, 0.5% preferred equity, and 52% common equity. The FERC currently authorized capital structure is comprised of 49.70% long-term debt, 0.3% preferred, and 50% common equity. 5. Non-GAAP core earnings assumptions include no 2027 impacts from changes in the federal tax code. 6. Unrecoverable net interest includes PG&E Corporation long-term debt, Wildfire Fund contribution debt financing, and other interest above authorized, netted against the Utility’s balancing account interest. Slide 23: Appendix 2: Physical Risk Mitigations Making Our System Safer Every Day 1. Incidents ≥ 10 acres in California (all sources) reflect CAL FIRE data as of 9/25/26, the most recent data available. Structures destroyed in PG&E reportable fires in HFTD/HFRA during R3+ conditions are as of 10/19/26. Slide 26: Appendix 2: Existing Protections Enhanced Pending Broader Policy Update 1. Prior to the enactment of AB 1054, utilities bore the burden of proving that their conduct was reasonable in order to obtain recovery of costs through rates. AB 1054 changed the standard so that the conduct of a utility is deemed reasonable unless a party to the proceeding creates a serious doubt as to the reasonableness of the utility’s conduct. Reasonable conduct is not limited to the optimum practice, method, or act to the exclusion of others, but rather encompasses a spectrum of possible practices, methods, or acts consistent with utility system needs, the interest of the ratepayers, and the requirements of governmental agencies of competent jurisdiction. 2. For fires in any calendar year. 3. Maximum disallowance does not apply if Utility found to have acted with conscious or willful disregard of the rights and safety of others. Slide 28: Appendix 2: SB 846 Diablo Canyon Legislation 1. The pre-extension period extended through the scheduled retirement dates of November 2024 and August 2025 for Units 1 and 2, respectively. 2. The extension period covers the additional 5-year life for each Unit.
Appendix 2 Supplemental Earnings Materials 20
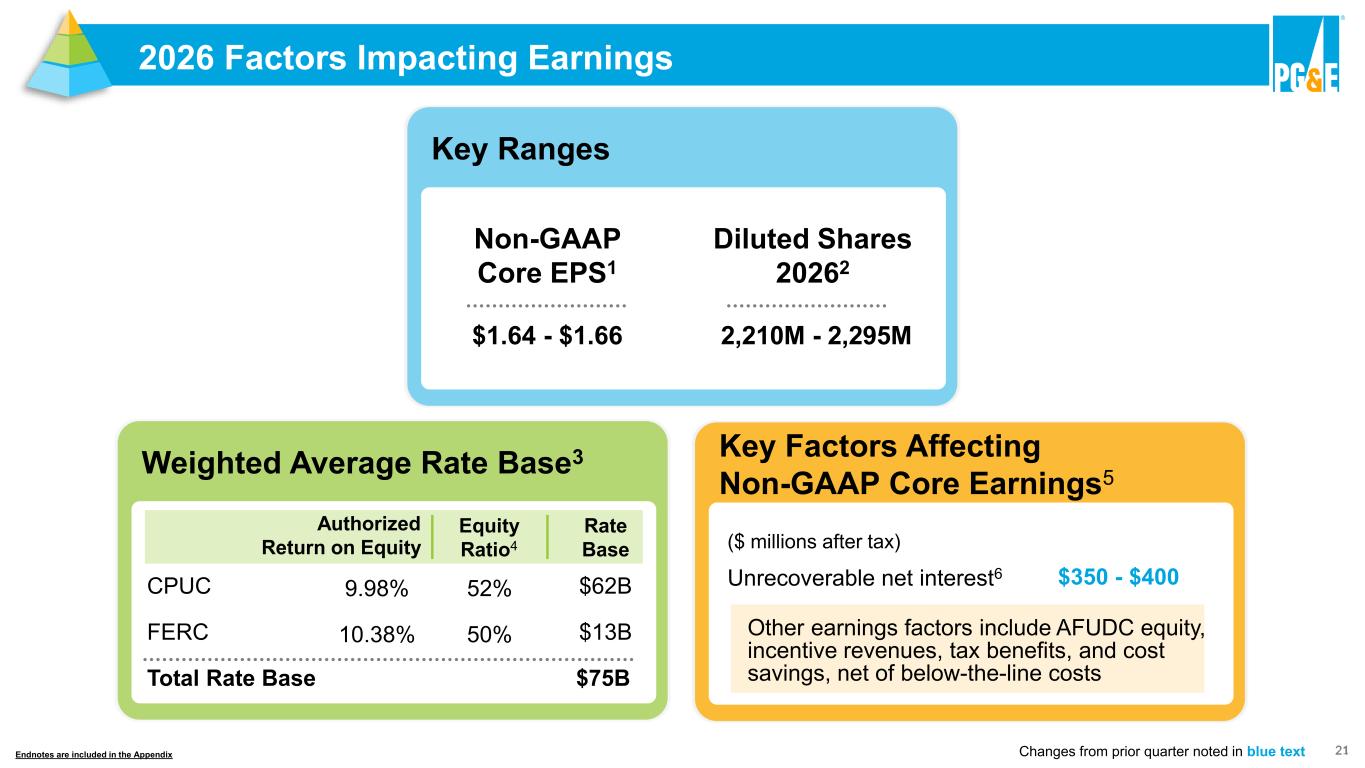
21 2026 Factors Impacting Earnings Endnotes are included in the Appendix $1.64 - $1.66 Non-GAAP Core EPS1 Diluted Shares 20262 2,210M - 2,295M Key Ranges Weighted Average Rate Base3 CPUC 9.98% 52% $62B FERC 10.38% 50% $13B Total Rate Base $75B Authorized Return on Equity Key Factors Affecting Non-GAAP Core Earnings5 ($ millions after tax) Unrecoverable net interest6 $350 - $400 Other earnings factors include AFUDC equity, incentive revenues, tax benefits, and cost savings, net of below-the-line costs Equity Ratio4 Rate Base Changes from prior quarter noted in blue text
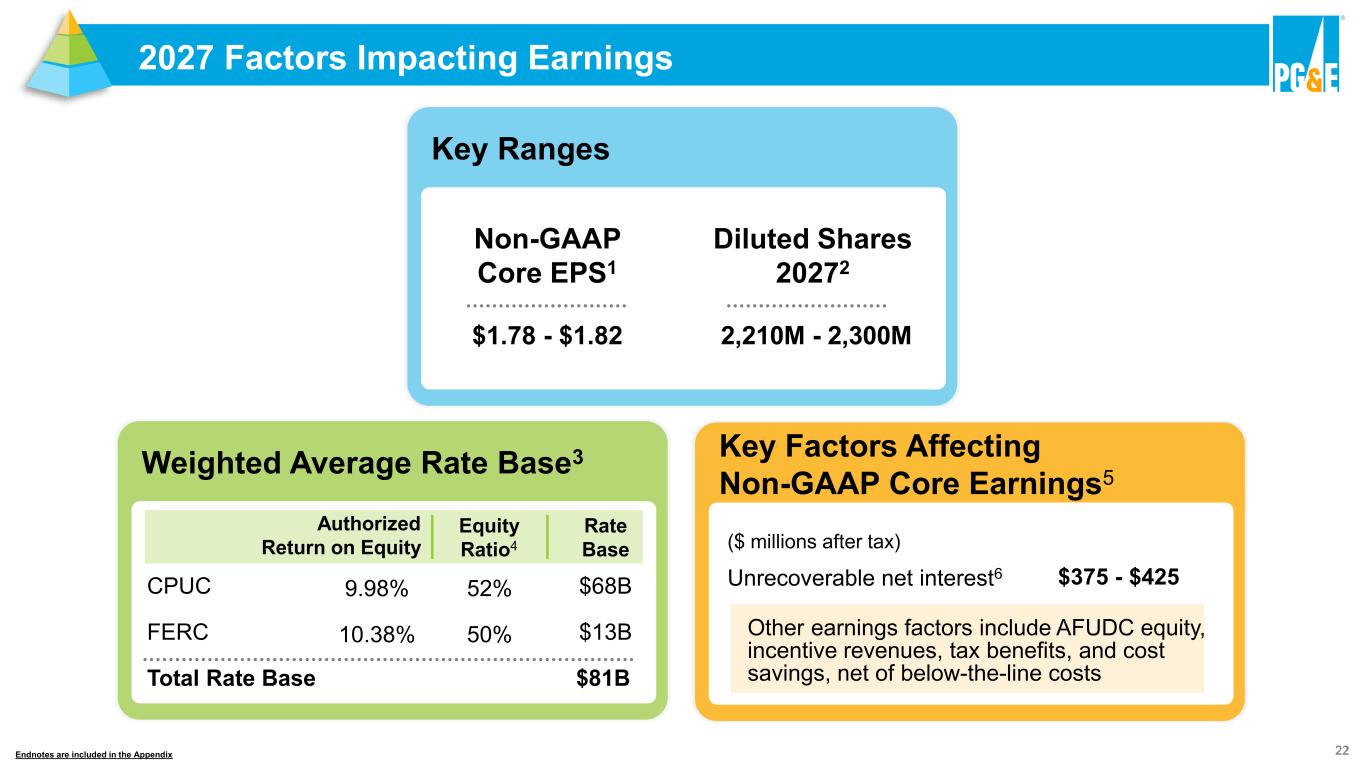
22 2027 Factors Impacting Earnings Endnotes are included in the Appendix $1.78 - $1.82 Non-GAAP Core EPS1 Diluted Shares 20272 2,210M - 2,300M Key Ranges Weighted Average Rate Base3 CPUC 9.98% 52% $68B FERC 10.38% 50% $13B Total Rate Base $81B Authorized Return on Equity Key Factors Affecting Non-GAAP Core Earnings5 ($ millions after tax) Unrecoverable net interest6 $375 - $425 Other earnings factors include AFUDC equity, incentive revenues, tax benefits, and cost savings, net of below-the-line costs Equity Ratio4 Rate Base
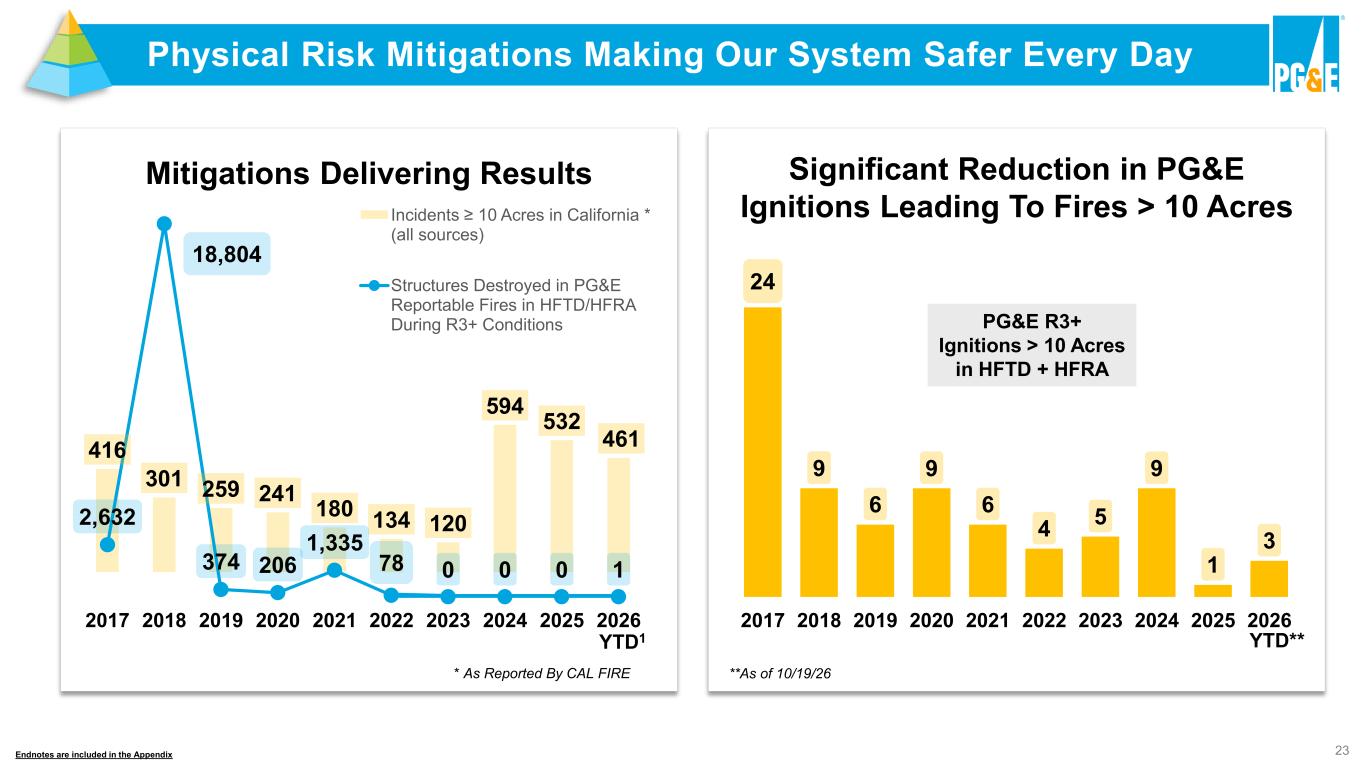
23 Physical Risk Mitigations Making Our System Safer Every Day 24 9 6 9 6 4 5 9 1 3 2017 2018 2019 2020 2021 2022 2023 2024 2025 2026 Significant Reduction in PG&E Ignitions Leading To Fires > 10 Acres PG&E R3+ Ignitions > 10 Acres in HFTD + HFRA **As of 10/19/26 YTD** Mitigations Delivering Results * As Reported By CAL FIRE 416 301 259 241 180 134 120 594 532 461 2,632 18,804 374 206 1,335 78 0 0 0 1 0 2000 4000 6000 8000 10000 12000 14000 16000 18000 20000 -100 100 300 500 700 900 1100 1300 1500 2017 2018 2019 2020 2021 2022 2023 2024 2025 2026 Incidents ≥ 10 Acres in California * (all sources) Structures Destroyed in PG&E Reportable Fires in HFTD/HFRA During R3+ Conditions YTD1 Endnotes are included in the Appendix
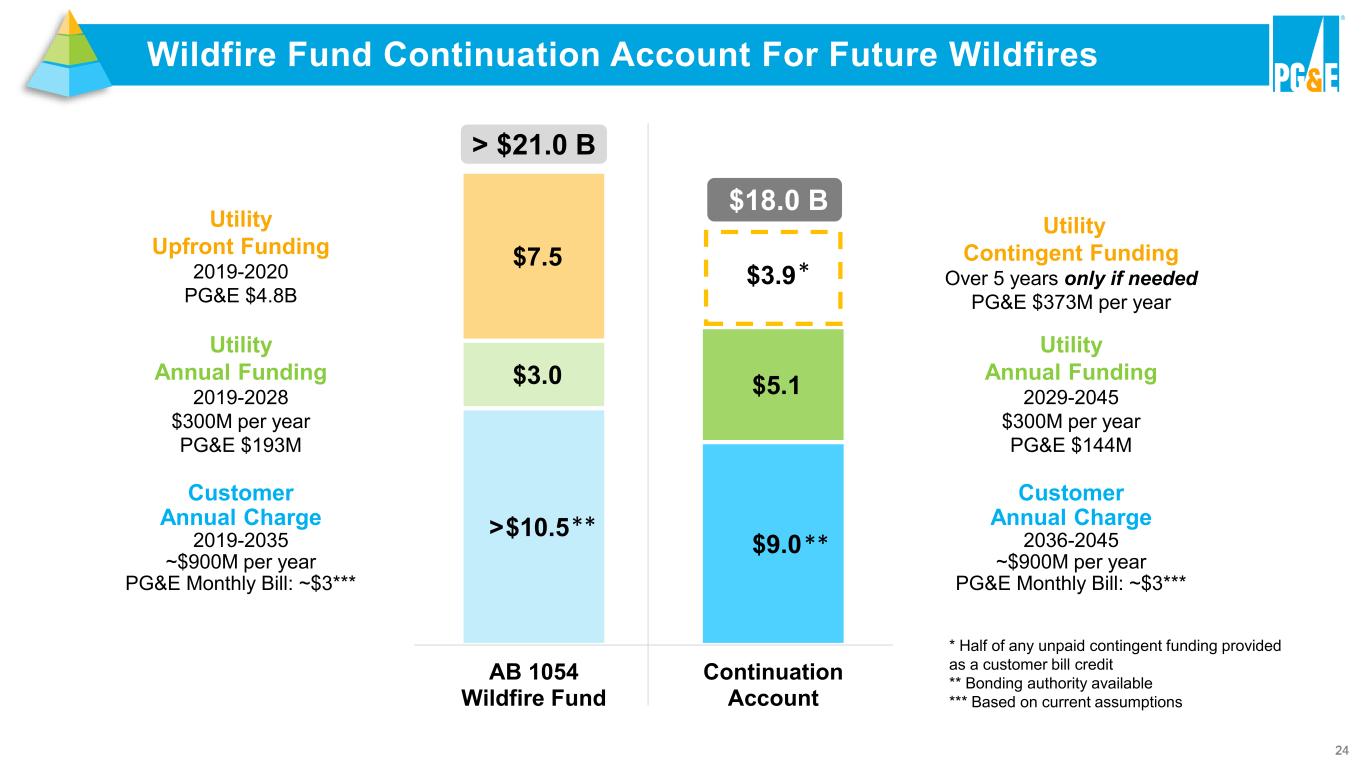
24 Wildfire Fund Continuation Account For Future Wildfires Customer Annual Charge 2036-2045 ~$900M per year PG&E Monthly Bill: ~$3*** Utility Contingent Funding Over 5 years only if needed PG&E $373M per year Utility Annual Funding 2029-2045 $300M per year PG&E $144M $10.5 $9.0 $3.0 $5.1 $3.9 $7.5 > $21.0 B $18.0 B AB 1054 Wildfire Fund Continuation Account ** * Half of any unpaid contingent funding provided as a customer bill credit ** Bonding authority available *** Based on current assumptions Utility Upfront Funding 2019-2020 PG&E $4.8B Utility Annual Funding 2019-2028 $300M per year PG&E $193M Customer Annual Charge 2019-2035 ~$900M per year PG&E Monthly Bill: ~$3*** * > **
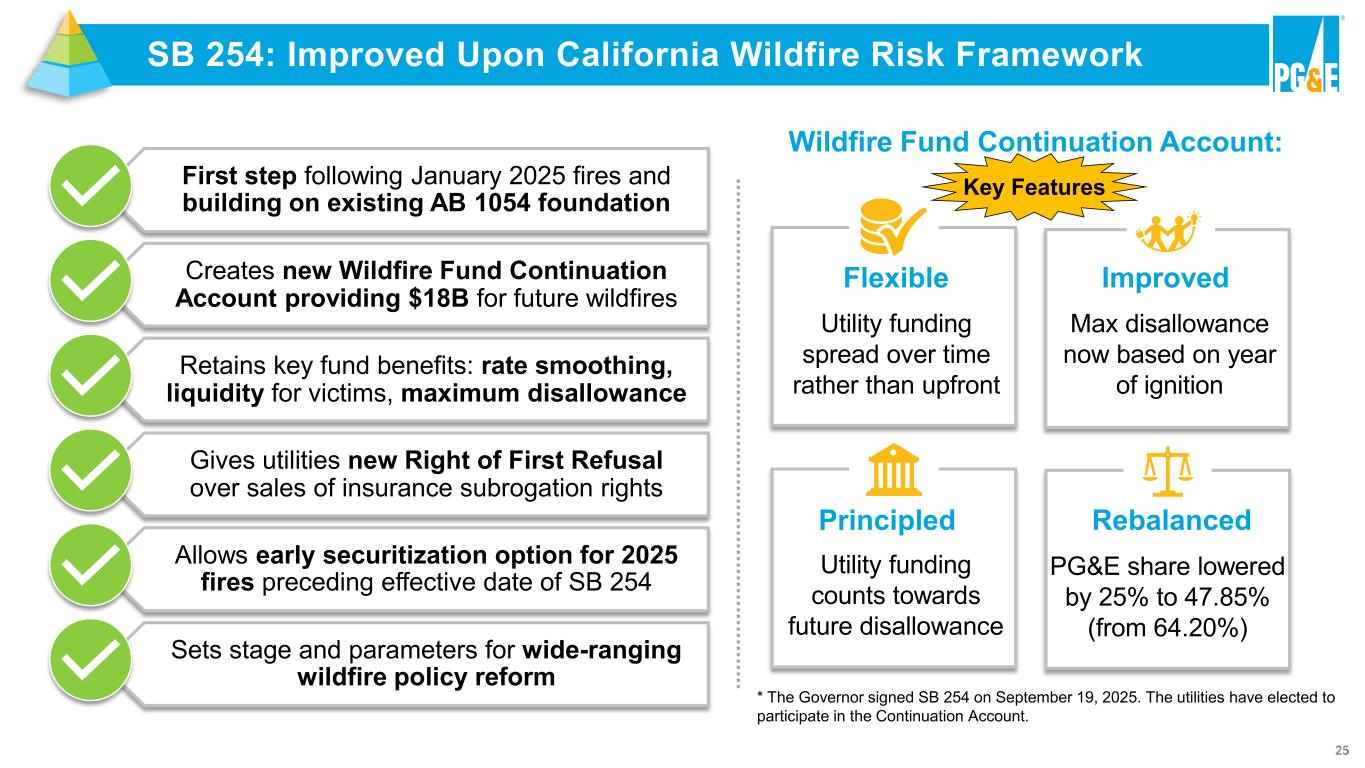
25 SB 254: Improved Upon California Wildfire Risk Framework First step following January 2025 fires and building on existing AB 1054 foundation Creates new Wildfire Fund Continuation Account providing $18B for future wildfires Retains key fund benefits: rate smoothing, liquidity for victims, maximum disallowance Gives utilities new Right of First Refusal over sales of insurance subrogation rights Allows early securitization option for 2025 fires preceding effective date of SB 254 Wildfire Fund Continuation Account: Sets stage and parameters for wide-ranging wildfire policy reform Rebalanced PG&E share lowered by 25% to 47.85% (from 64.20%) Principled Utility funding counts towards future disallowance Flexible Improved Max disallowance now based on year of ignition Utility funding spread over time rather than upfront * The Governor signed SB 254 on September 19, 2025. The utilities have elected to participate in the Continuation Account. Key Features
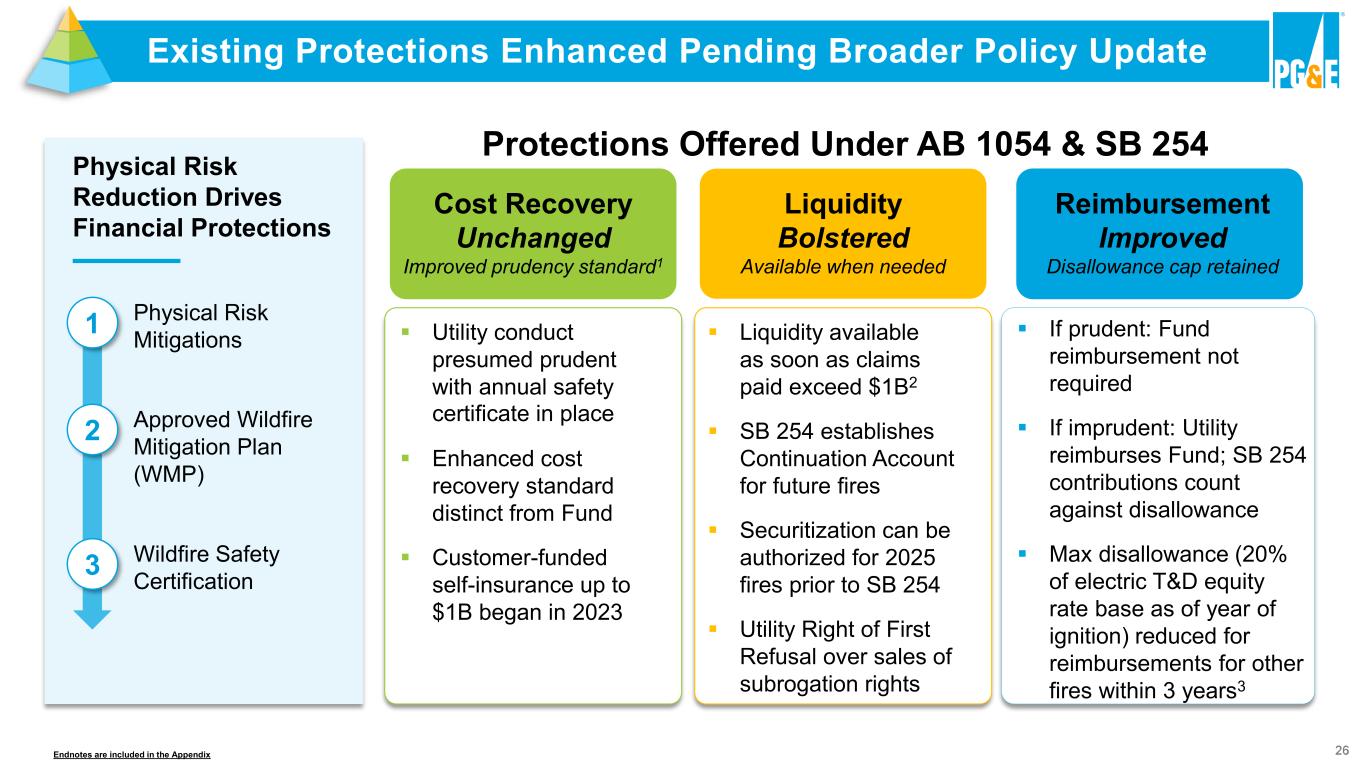
26 Existing Protections Enhanced Pending Broader Policy Update Protections Offered Under AB 1054 & SB 254 ▪ Liquidity available as soon as claims paid exceed $1B2 ▪ SB 254 establishes Continuation Account for future fires ▪ Securitization can be authorized for 2025 fires prior to SB 254 ▪ Utility Right of First Refusal over sales of subrogation rights Liquidity Bolstered Available when needed ▪ Utility conduct presumed prudent with annual safety certificate in place ▪ Enhanced cost recovery standard distinct from Fund ▪ Customer-funded self-insurance up to $1B began in 2023 Cost Recovery Unchanged Improved prudency standard1 Reimbursement Improved Disallowance cap retained ▪ If prudent: Fund reimbursement not required ▪ If imprudent: Utility reimburses Fund; SB 254 contributions count against disallowance ▪ Max disallowance (20% of electric T&D equity rate base as of year of ignition) reduced for reimbursements for other fires within 3 years3 Physical Risk Reduction Drives Financial Protections 1 Physical Risk Mitigations 2 Approved Wildfire Mitigation Plan (WMP) 3 Wildfire Safety Certification Endnotes are included in the AppendixEndnotes are included in the ppendix
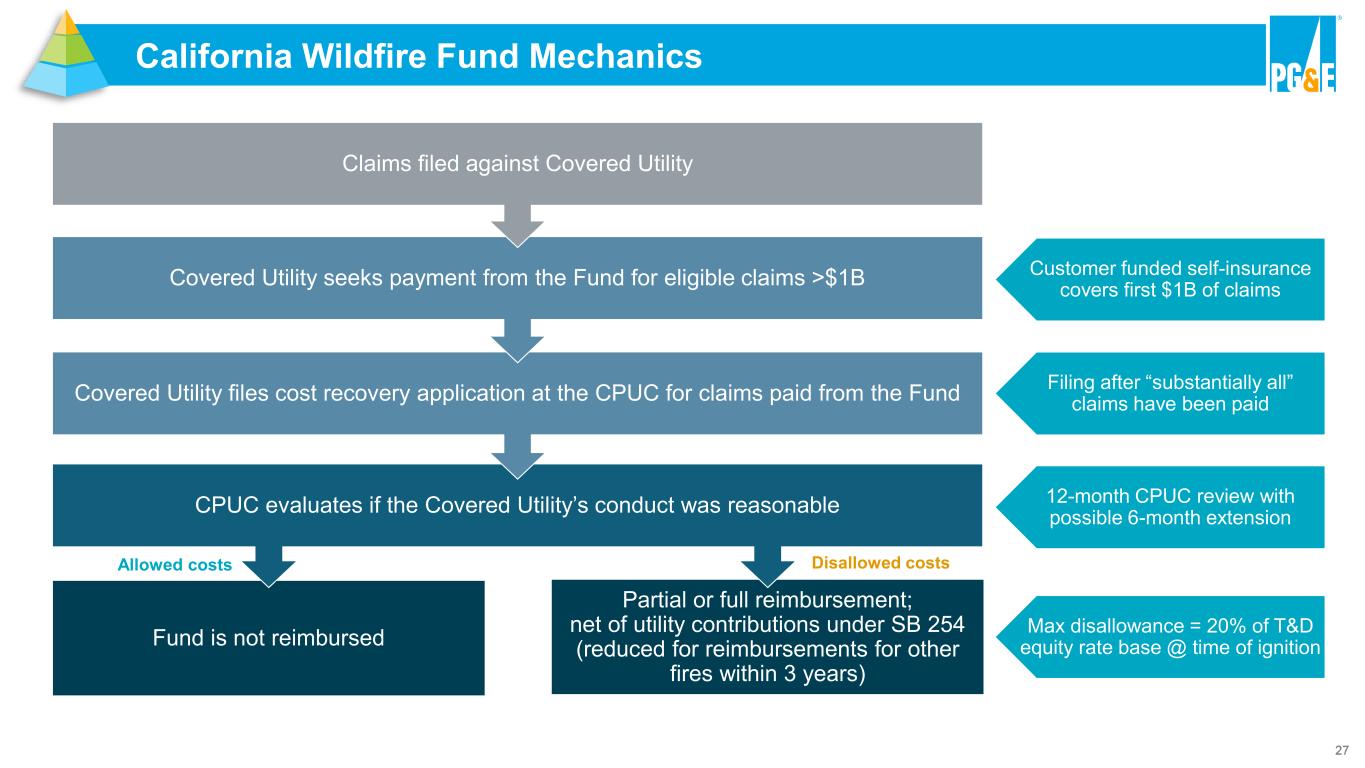
27 California Wildfire Fund Mechanics Fund is not reimbursed Partial or full reimbursement; net of utility contributions under SB 254 (reduced for reimbursements for other fires within 3 years) CPUC evaluates if the Covered Utility’s conduct was reasonable Covered Utility files cost recovery application at the CPUC for claims paid from the Fund Covered Utility seeks payment from the Fund for eligible claims >$1B Disallowed costsAllowed costs Claims filed against Covered Utility Filing after “substantially all” claims have been paid 12-month CPUC review with possible 6-month extension Customer funded self-insurance covers first $1B of claims Max disallowance = 20% of T&D equity rate base @ time of ignition
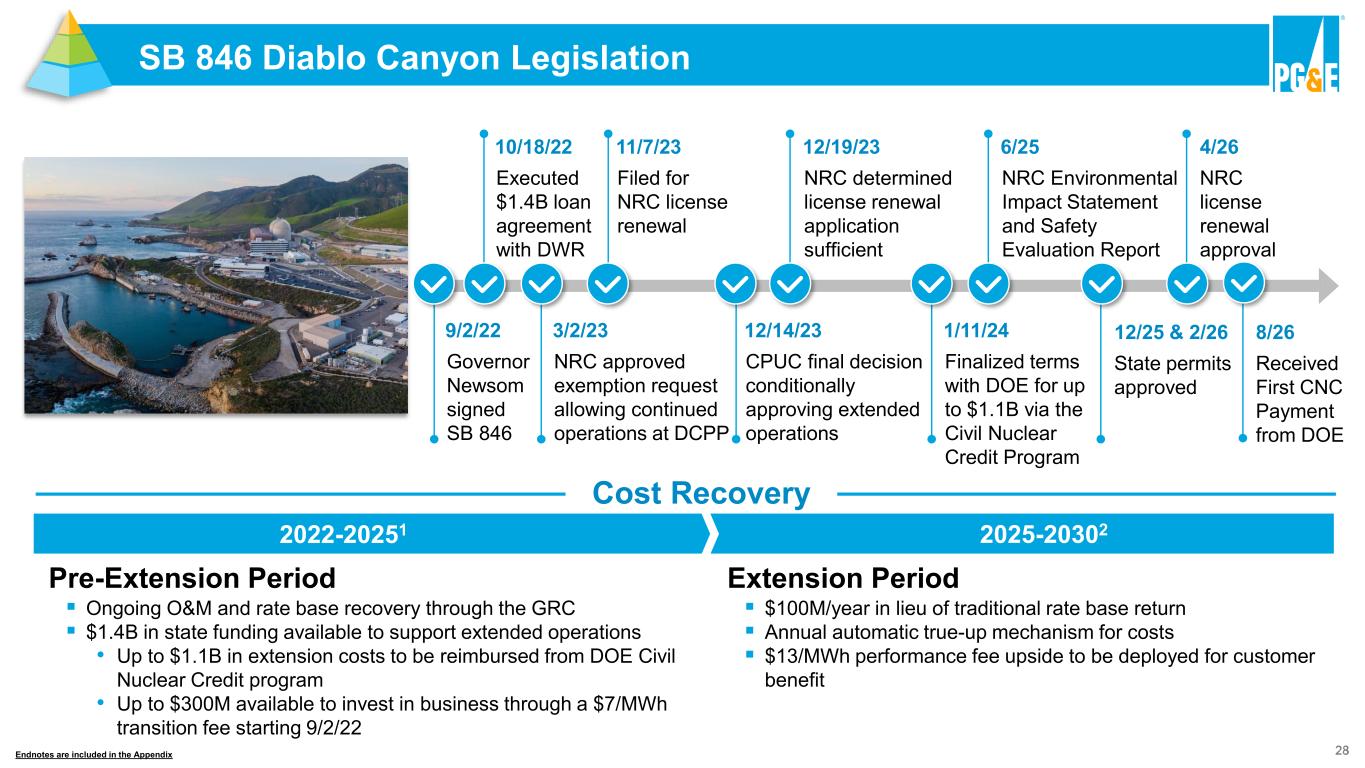
28 SB 846 Diablo Canyon Legislation Cost Recovery 2022-20251 2025-20302 ▪ Ongoing O&M and rate base recovery through the GRC ▪ $1.4B in state funding available to support extended operations • Up to $1.1B in extension costs to be reimbursed from DOE Civil Nuclear Credit program • Up to $300M available to invest in business through a $7/MWh transition fee starting 9/2/22 ▪ $100M/year in lieu of traditional rate base return ▪ Annual automatic true-up mechanism for costs ▪ $13/MWh performance fee upside to be deployed for customer benefit Pre-Extension Period Extension Period 9/2/22 Governor Newsom signed SB 846 1/11/24 Finalized terms with DOE for up to $1.1B via the Civil Nuclear Credit Program 10/18/22 Executed $1.4B loan agreement with DWR 3/2/23 NRC approved exemption request allowing continued operations at DCPP 11/7/23 Filed for NRC license renewal 12/14/23 CPUC final decision conditionally approving extended operations 12/19/23 NRC determined license renewal application sufficient 6/25 NRC Environmental Impact Statement and Safety Evaluation Report Endnotes are included in the Appendix 12/25 & 2/26 State permits approved 4/26 NRC license renewal approval 8/26 Received First CNC Payment from DOE
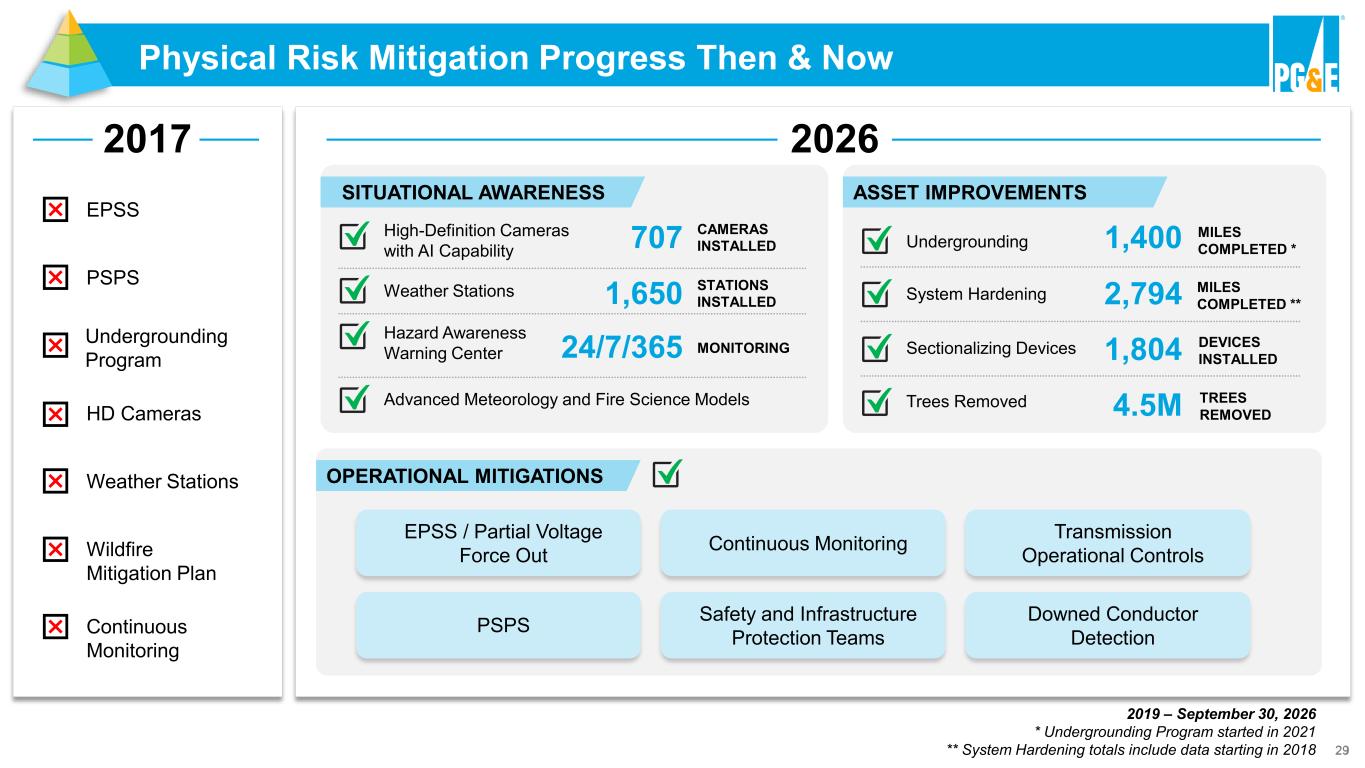
29 Physical Risk Mitigation Progress Then & Now 2017 EPSS PSPS Undergrounding Program HD Cameras Weather Stations Wildfire Mitigation Plan SITUATIONAL AWARENESS High-Definition Cameras with AI Capability Weather Stations Hazard Awareness Warning Center Advanced Meteorology and Fire Science Models 707 CAMERAS INSTALLED 1,650 STATIONS INSTALLED 24/7/365 MONITORING ASSET IMPROVEMENTS Undergrounding System Hardening Sectionalizing Devices Trees Removed 1,400 MILES COMPLETED * 2,794 MILES COMPLETED ** 1,804 DEVICES INSTALLED 4.5M TREES REMOVED OPERATIONAL MITIGATIONS EPSS / Partial Voltage Force Out PSPS Continuous Monitoring Safety and Infrastructure Protection Teams Transmission Operational Controls Downed Conductor Detection 2019 – September 30, 2026 * Undergrounding Program started in 2021 ** System Hardening totals include data starting in 2018 2026 Continuous Monitoring
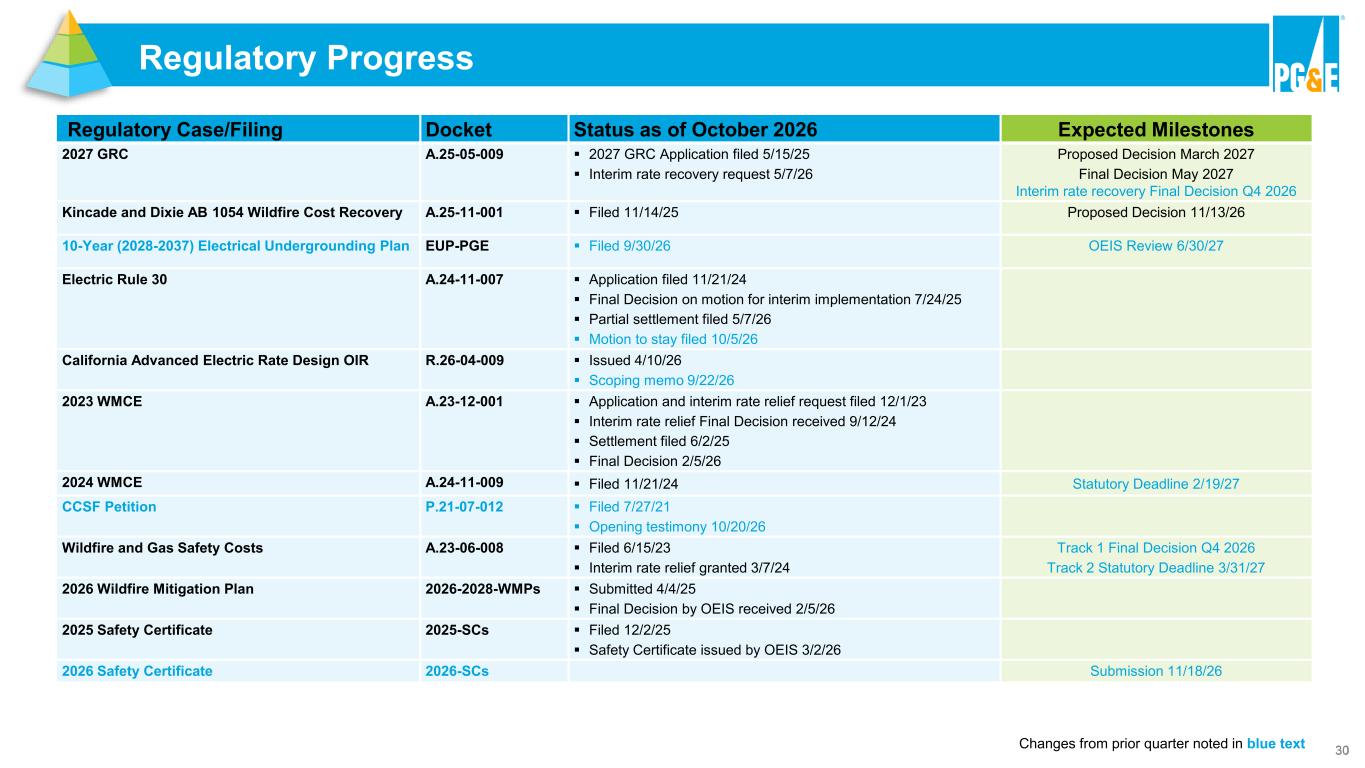
30 Regulatory Case/Filing Docket Status as of October 2026 Expected Milestones 2027 GRC A.25-05-009 ▪ 2027 GRC Application filed 5/15/25 ▪ Interim rate recovery request 5/7/26 Proposed Decision March 2027 Final Decision May 2027 Interim rate recovery Final Decision Q4 2026 Kincade and Dixie AB 1054 Wildfire Cost Recovery A.25-11-001 ▪ Filed 11/14/25 Proposed Decision 11/13/26 10-Year (2028-2037) Electrical Undergrounding Plan EUP-PGE ▪ Filed 9/30/26 OEIS Review 6/30/27 Electric Rule 30 A.24-11-007 ▪ Application filed 11/21/24 ▪ Final Decision on motion for interim implementation 7/24/25 ▪ Partial settlement filed 5/7/26 ▪ Motion to stay filed 10/5/26 California Advanced Electric Rate Design OIR R.26-04-009 ▪ Issued 4/10/26 ▪ Scoping memo 9/22/26 2023 WMCE A.23-12-001 ▪ Application and interim rate relief request filed 12/1/23 ▪ Interim rate relief Final Decision received 9/12/24 ▪ Settlement filed 6/2/25 ▪ Final Decision 2/5/26 2024 WMCE A.24-11-009 ▪ Filed 11/21/24 Statutory Deadline 2/19/27 CCSF Petition P.21-07-012 ▪ Filed 7/27/21 ▪ Opening testimony 10/20/26 Wildfire and Gas Safety Costs A.23-06-008 ▪ Filed 6/15/23 ▪ Interim rate relief granted 3/7/24 Track 1 Final Decision Q4 2026 Track 2 Statutory Deadline 3/31/27 2026 Wildfire Mitigation Plan 2026-2028-WMPs ▪ Submitted 4/4/25 ▪ Final Decision by OEIS received 2/5/26 2025 Safety Certificate 2025-SCs ▪ Filed 12/2/25 ▪ Safety Certificate issued by OEIS 3/2/26 2026 Safety Certificate 2026-SCs Submission 11/18/26 Changes from prior quarter noted in blue text Regulatory Progress
Appendix 3 Supplemental Non-GAAP Information 31
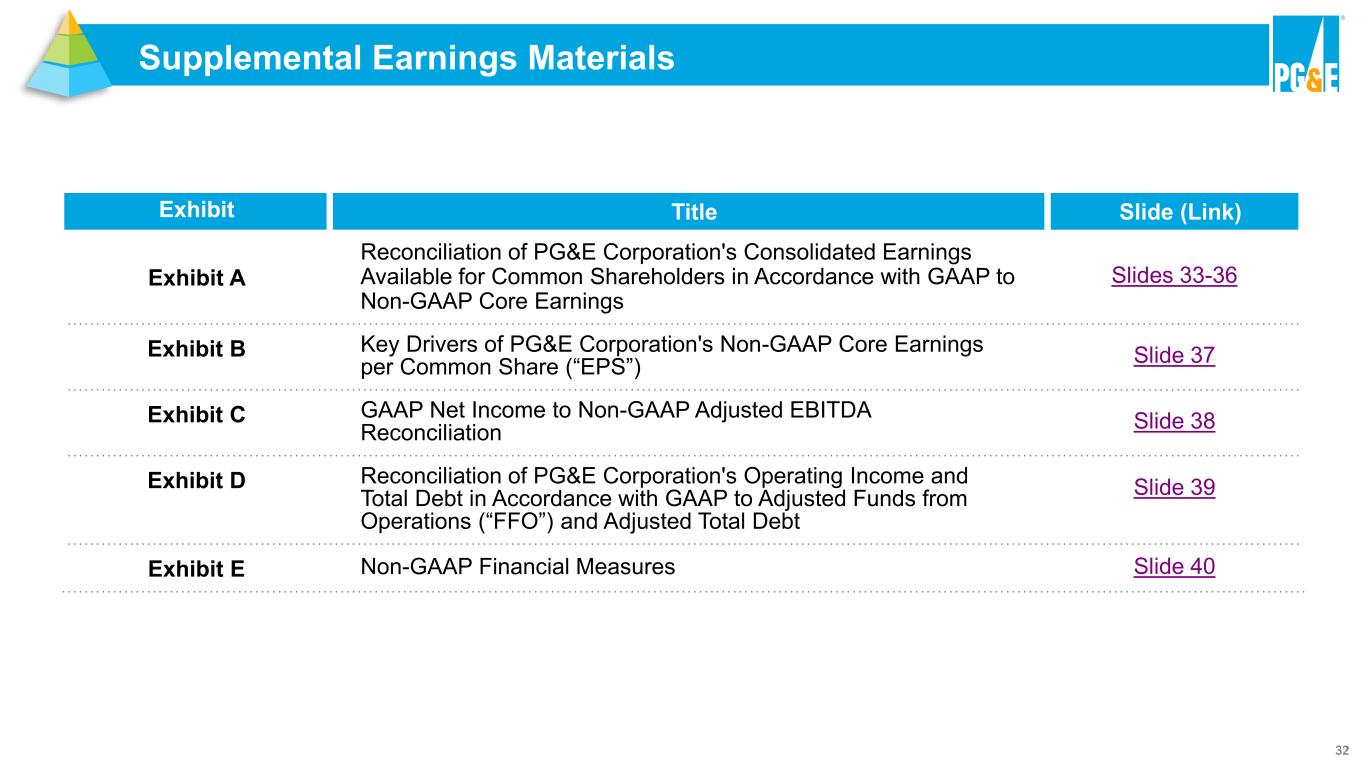
32 Supplemental Earnings Materials Exhibit Title Slide (Link) Exhibit A Reconciliation of PG&E Corporation's Consolidated Earnings Available for Common Shareholders in Accordance with GAAP to Non-GAAP Core Earnings Slides 33-36 Exhibit B Key Drivers of PG&E Corporation's Non-GAAP Core Earnings per Common Share (“EPS”) Slide 37 Exhibit C GAAP Net Income to Non-GAAP Adjusted EBITDA Reconciliation Slide 38 Exhibit D Reconciliation of PG&E Corporation's Operating Income and Total Debt in Accordance with GAAP to Adjusted Funds from Operations (“FFO”) and Adjusted Total Debt Slide 39 Exhibit E Non-GAAP Financial Measures Slide 40
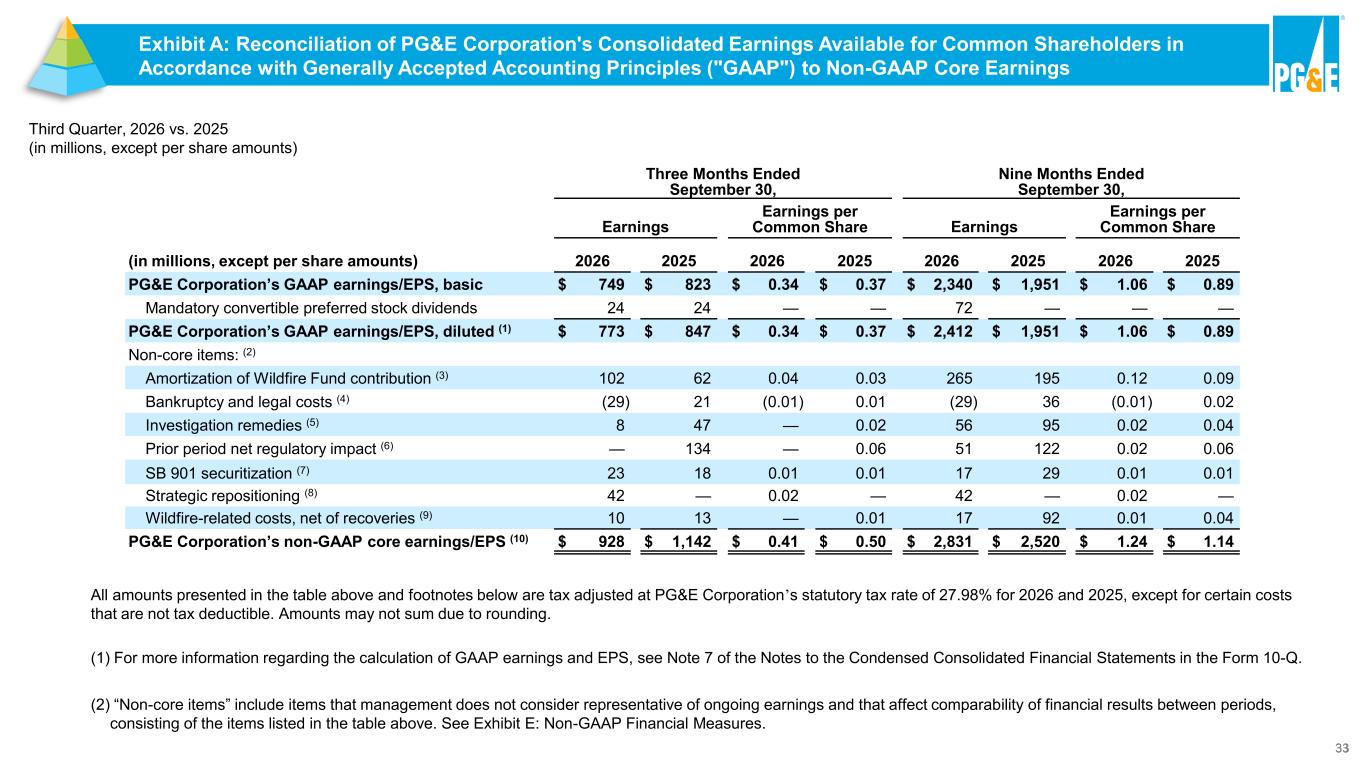
33 Three Months Ended September 30, Nine Months Ended September 30, Earnings Earnings per Common Share Earnings Earnings per Common Share (in millions, except per share amounts) 2026 2025 2026 2025 2026 2025 2026 2025 PG&E Corporation’s GAAP earnings/EPS, basic $ 749 $ 823 $ 0.34 $ 0.37 $ 2,340 $ 1,951 $ 1.06 $ 0.89 Mandatory convertible preferred stock dividends 24 24 — — 72 — — — PG&E Corporation’s GAAP earnings/EPS, diluted (1) $ 773 $ 847 $ 0.34 $ 0.37 $ 2,412 $ 1,951 $ 1.06 $ 0.89 Non-core items: (2) Amortization of Wildfire Fund contribution (3) 102 62 0.04 0.03 265 195 0.12 0.09 Bankruptcy and legal costs (4) (29) 21 (0.01) 0.01 (29) 36 (0.01) 0.02 Investigation remedies (5) 8 47 — 0.02 56 95 0.02 0.04 Prior period net regulatory impact (6) — 134 — 0.06 51 122 0.02 0.06 SB 901 securitization (7) 23 18 0.01 0.01 17 29 0.01 0.01 Strategic repositioning (8) 42 — 0.02 — 42 — 0.02 — Wildfire-related costs, net of recoveries (9) 10 13 — 0.01 17 92 0.01 0.04 PG&E Corporation’s non-GAAP core earnings/EPS (10) $ 928 $ 1,142 $ 0.41 $ 0.50 $ 2,831 $ 2,520 $ 1.24 $ 1.14 All amounts presented in the table above and footnotes below are tax adjusted at PG&E Corporation’s statutory tax rate of 27.98% for 2026 and 2025, except for certain costs that are not tax deductible. Amounts may not sum due to rounding. Third Quarter, 2026 vs. 2025 (in millions, except per share amounts) (2) “Non-core items” include items that management does not consider representative of ongoing earnings and that affect comparability of financial results between periods, consisting of the items listed in the table above. See Exhibit E: Non-GAAP Financial Measures. Exhibit A: Reconciliation of PG&E Corporation's Consolidated Earnings Available for Common Shareholders in Accordance with Generally Accepted Accounting Principles ("GAAP") to Non-GAAP Core Earnings (1) For more information regarding the calculation of GAAP earnings and EPS, see Note 7 of the Notes to the Condensed Consolidated Financial Statements in the Form 10-Q.
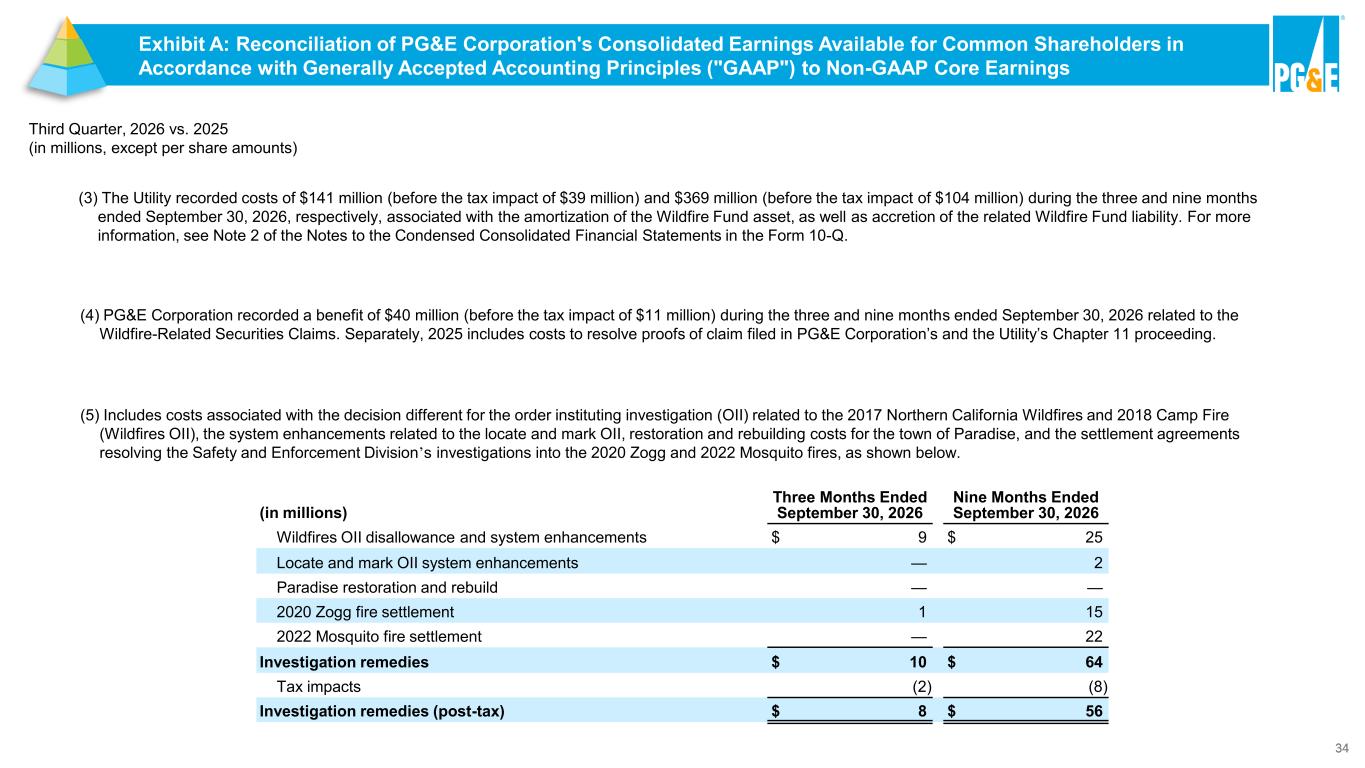
34 Third Quarter, 2026 vs. 2025 (in millions, except per share amounts) (4) PG&E Corporation recorded a benefit of $40 million (before the tax impact of $11 million) during the three and nine months ended September 30, 2026 related to the Wildfire-Related Securities Claims. Separately, 2025 includes costs to resolve proofs of claim filed in PG&E Corporation’s and the Utility’s Chapter 11 proceeding. (3) The Utility recorded costs of $141 million (before the tax impact of $39 million) and $369 million (before the tax impact of $104 million) during the three and nine months ended September 30, 2026, respectively, associated with the amortization of the Wildfire Fund asset, as well as accretion of the related Wildfire Fund liability. For more information, see Note 2 of the Notes to the Condensed Consolidated Financial Statements in the Form 10-Q. Exhibit A: Reconciliation of PG&E Corporation's Consolidated Earnings Available for Common Shareholders in Accordance with Generally Accepted Accounting Principles ("GAAP") to Non-GAAP Core Earnings Exhibit A: Reconciliation of PG&E Corporation's Consolidated Earnings Available for Common Shareholders in Accordance with Generally Accepted Accounting Principles ("GAAP") to Non-GAAP Core Earnings (5) Includes costs associated with the decision different for the order instituting investigation (OII) related to the 2017 Northern California Wildfires and 2018 Camp Fire (Wildfires OII), the system enhancements related to the locate and mark OII, restoration and rebuilding costs for the town of Paradise, and the settlement agreements resolving the Safety and Enforcement Division’s investigations into the 2020 Zogg and 2022 Mosquito fires, as shown below. (in millions) Three Months Ended September 30, 2026 Nine Months Ended September 30, 2026 Wildfires OII disallowance and system enhancements $ 9 $ 25 Locate and mark OII system enhancements — 2 Paradise restoration and rebuild — — 2020 Zogg fire settlement 1 15 2022 Mosquito fire settlement — 22 Investigation remedies $ 10 $ 64 Tax impacts (2) (8) Investigation remedies (post-tax) $ 8 $ 56
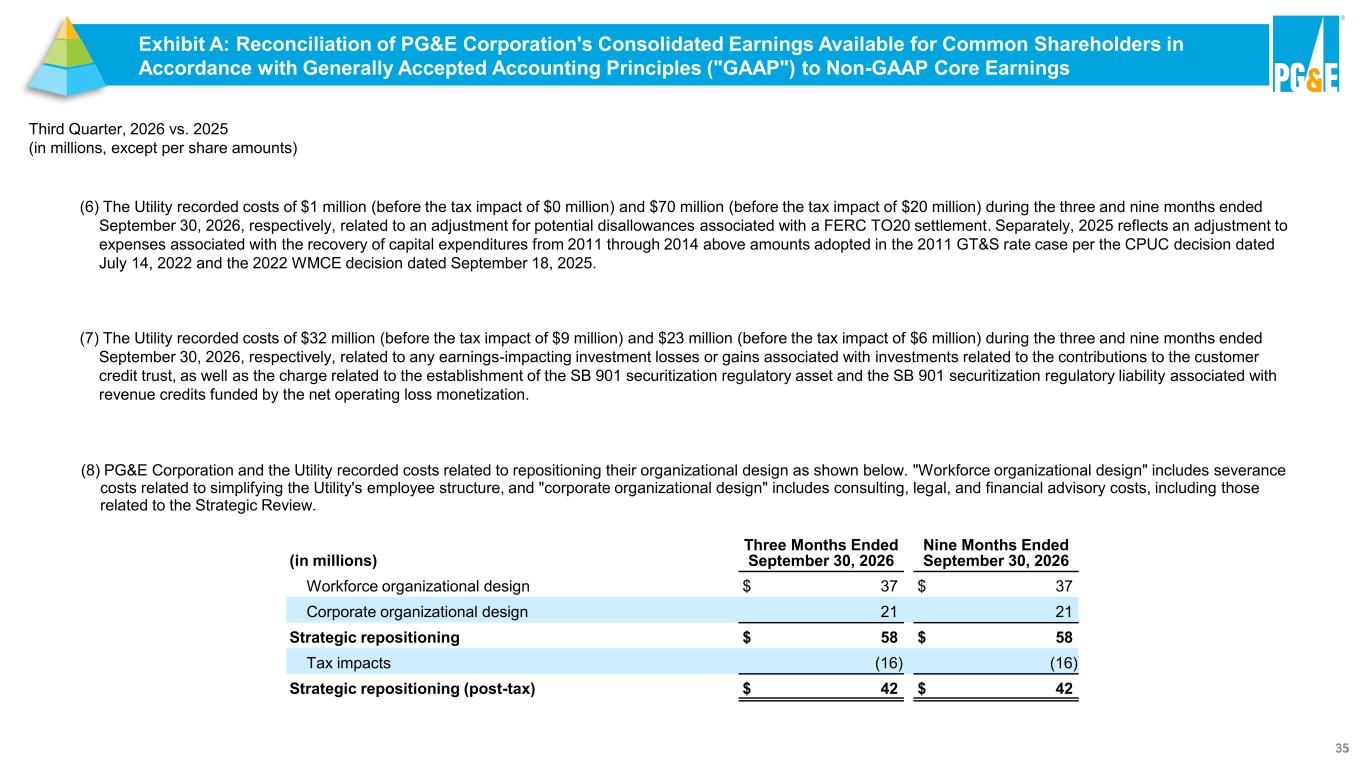
35 Third Quarter, 2026 vs. 2025 (in millions, except per share amounts) (8) PG&E Corporation and the Utility recorded costs related to repositioning their organizational design as shown below. "Workforce organizational design" includes severance costs related to simplifying the Utility's employee structure, and "corporate organizational design" includes consulting, legal, and financial advisory costs, including those related to the Strategic Review. (in millions) Three Months Ended September 30, 2026 Nine Months Ended September 30, 2026 Workforce organizational design $ 37 $ 37 Corporate organizational design 21 21 Strategic repositioning $ 58 $ 58 Tax impacts (16) (16) Strategic repositioning (post-tax) $ 42 $ 42 Exhibit A: Reconciliation of PG&E Corporation's Consolidated Earnings Available for Common Shareholders in Accordance with Generally Accepted Accounting Principles ("GAAP") to Non-GAAP Core Earnings Exhibit A: Reconciliation of PG&E Corporation's Consolidated Earnings Available for Common Shareholders in Accordance with Generally Accepted Accounting Principles ("GAAP") to Non-GAAP Core Earnings (7) The Utility recorded costs of $32 million (before the tax impact of $9 million) and $23 million (before the tax impact of $6 million) during the three and nine months ended September 30, 2026, respectively, related to any earnings-impacting investment losses or gains associated with investments related to the contributions to the customer credit trust, as well as the charge related to the establishment of the SB 901 securitization regulatory asset and the SB 901 securitization regulatory liability associated with revenue credits funded by the net operating loss monetization. (6) The Utility recorded costs of $1 million (before the tax impact of $0 million) and $70 million (before the tax impact of $20 million) during the three and nine months ended September 30, 2026, respectively, related to an adjustment for potential disallowances associated with a FERC TO20 settlement. Separately, 2025 reflects an adjustment to expenses associated with the recovery of capital expenditures from 2011 through 2014 above amounts adopted in the 2011 GT&S rate case per the CPUC decision dated July 14, 2022 and the 2022 WMCE decision dated September 18, 2025.
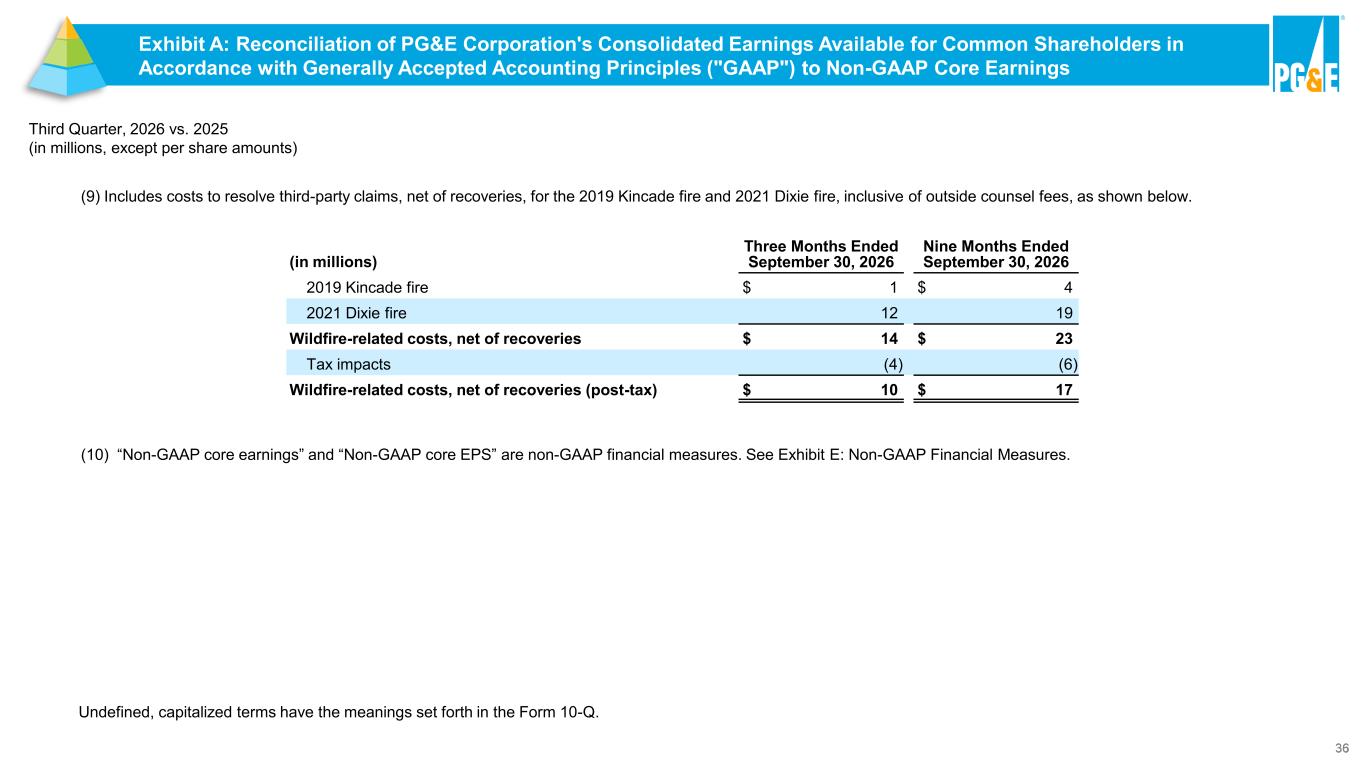
36 Third Quarter, 2026 vs. 2025 (in millions, except per share amounts) (10) “Non-GAAP core earnings” and “Non-GAAP core EPS” are non-GAAP financial measures. See Exhibit E: Non-GAAP Financial Measures. (9) Includes costs to resolve third-party claims, net of recoveries, for the 2019 Kincade fire and 2021 Dixie fire, inclusive of outside counsel fees, as shown below. Undefined, capitalized terms have the meanings set forth in the Form 10-Q. (in millions) Three Months Ended September 30, 2026 Nine Months Ended September 30, 2026 2019 Kincade fire $ 1 $ 4 2021 Dixie fire 12 19 Wildfire-related costs, net of recoveries $ 14 $ 23 Tax impacts (4) (6) Wildfire-related costs, net of recoveries (post-tax) $ 10 $ 17 Exhibit A: Reconciliation of PG&E Corporation's Consolidated Earnings Available for Common Shareholders in Accordance with Generally Accepted Accounting Principles ("GAAP") to Non-GAAP Core Earnings Exhibit A: Reconciliation of PG&E Corporation's Consolidated Earnings Available for Common Shareholders in Accordance with Generally Accepted Accounting Principles ("GAAP") to Non-GAAP Core Earnings
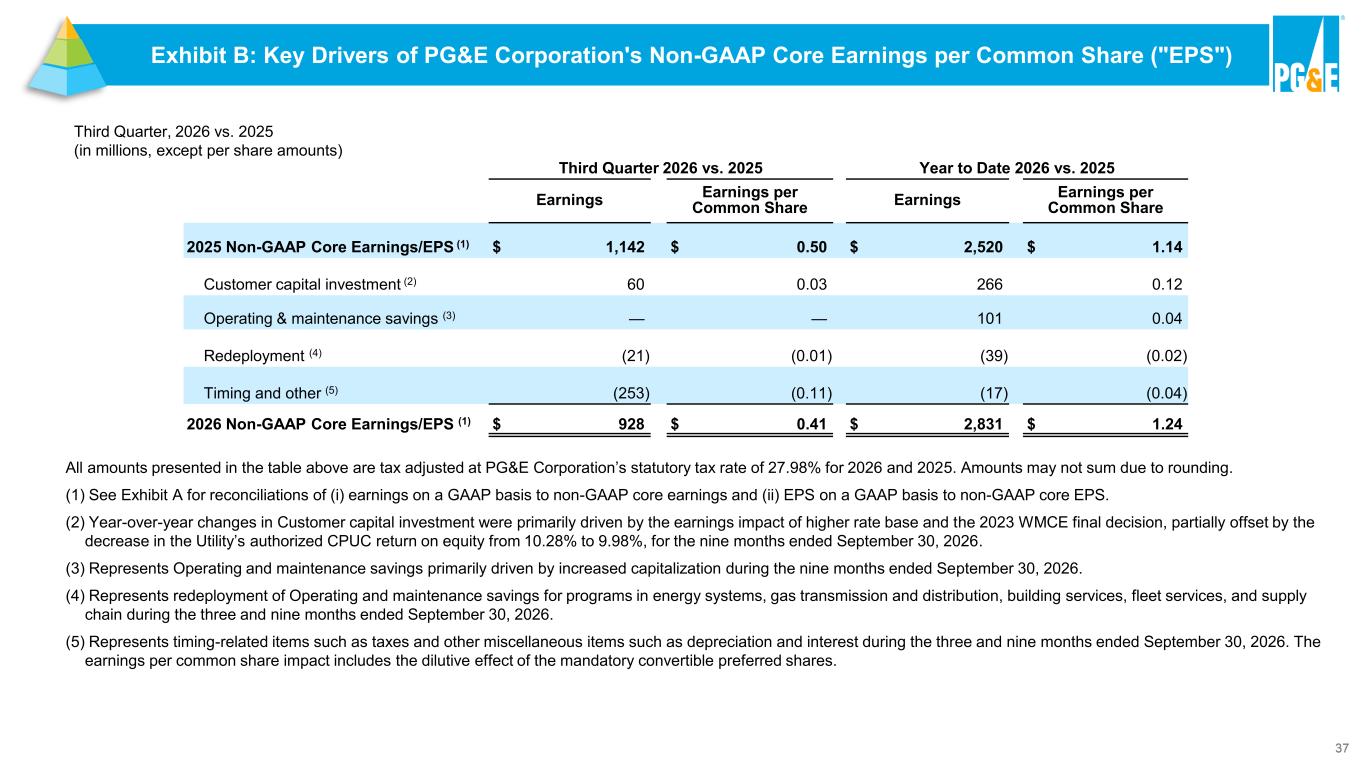
37 All amounts presented in the table above are tax adjusted at PG&E Corporation’s statutory tax rate of 27.98% for 2026 and 2025. Amounts may not sum due to rounding. (1) See Exhibit A for reconciliations of (i) earnings on a GAAP basis to non-GAAP core earnings and (ii) EPS on a GAAP basis to non-GAAP core EPS. (2) Year-over-year changes in Customer capital investment were primarily driven by the earnings impact of higher rate base and the 2023 WMCE final decision, partially offset by the decrease in the Utility’s authorized CPUC return on equity from 10.28% to 9.98%, for the nine months ended September 30, 2026. (3) Represents Operating and maintenance savings primarily driven by increased capitalization during the nine months ended September 30, 2026. (4) Represents redeployment of Operating and maintenance savings for programs in energy systems, gas transmission and distribution, building services, fleet services, and supply chain during the three and nine months ended September 30, 2026. (5) Represents timing-related items such as taxes and other miscellaneous items such as depreciation and interest during the three and nine months ended September 30, 2026. The earnings per common share impact includes the dilutive effect of the mandatory convertible preferred shares. Third Quarter 2026 vs. 2025 Year to Date 2026 vs. 2025 Earnings Earnings per Common Share Earnings Earnings per Common Share 2025 Non-GAAP Core Earnings/EPS (1) $ 1,142 $ 0.50 $ 2,520 $ 1.14 Customer capital investment (2) 60 0.03 266 0.12 Operating & maintenance savings (3) — — 101 0.04 Redeployment (4) (21) (0.01) (39) (0.02) Timing and other (5) (253) (0.11) (17) (0.04) 2026 Non-GAAP Core Earnings/EPS (1) $ 928 $ 0.41 $ 2,831 $ 1.24 Third Quarter, 2026 vs. 2025 (in millions, except per share amounts) Exhibit B: Key Drivers of PG&E Corporation's Non-GAAP Core Earnings per Common Share ("EPS") Exhibit B: Key Drivers of PG&E Corporation's Non-GAAP Core Earnings per Common Share ("EPS")
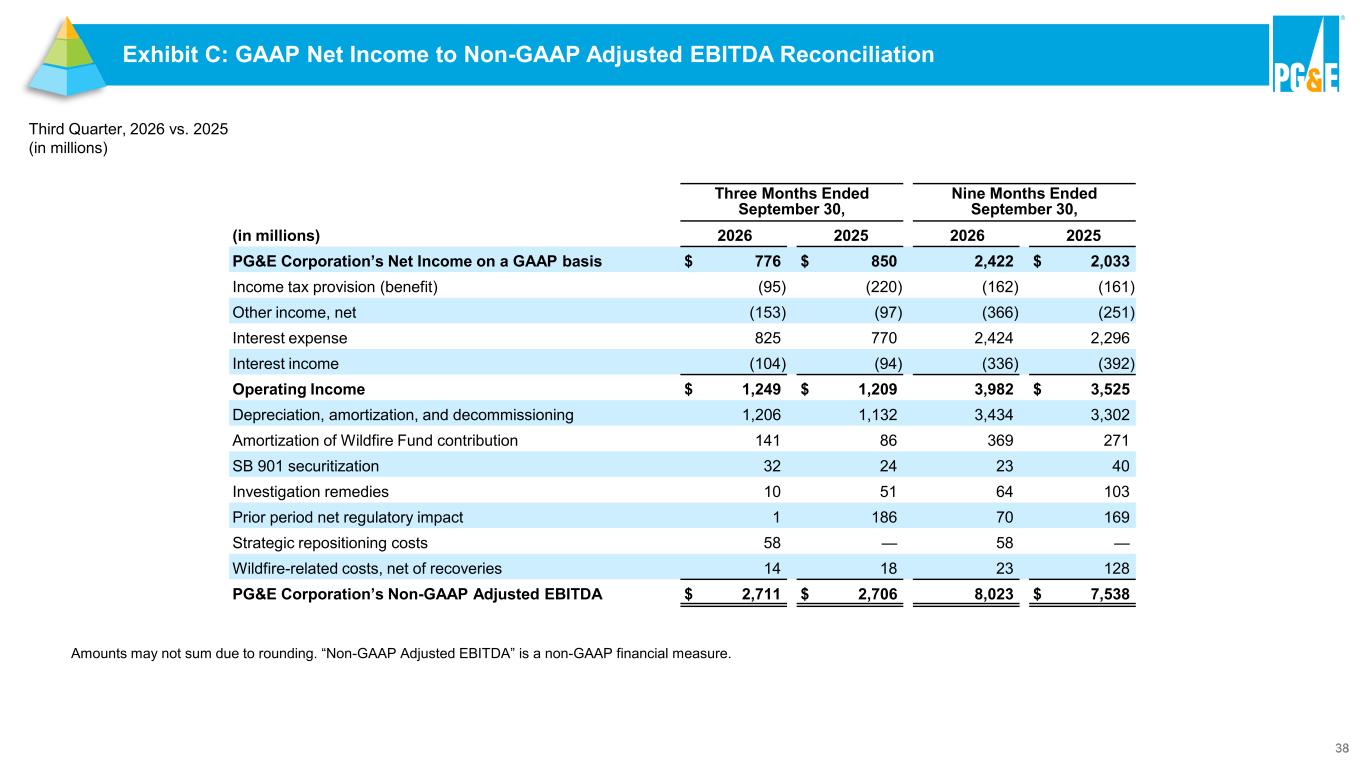
38 Three Months Ended September 30, Nine Months Ended September 30, (in millions) 2026 2025 2026 2025 PG&E Corporation’s Net Income on a GAAP basis $ 776 $ 850 2,422 $ 2,033 Income tax provision (benefit) (95) (220) (162) (161) Other income, net (153) (97) (366) (251) Interest expense 825 770 2,424 2,296 Interest income (104) (94) (336) (392) Operating Income $ 1,249 $ 1,209 3,982 $ 3,525 Depreciation, amortization, and decommissioning 1,206 1,132 3,434 3,302 Amortization of Wildfire Fund contribution 141 86 369 271 SB 901 securitization 32 24 23 40 Investigation remedies 10 51 64 103 Prior period net regulatory impact 1 186 70 169 Strategic repositioning costs 58 — 58 — Wildfire-related costs, net of recoveries 14 18 23 128 PG&E Corporation’s Non-GAAP Adjusted EBITDA $ 2,711 $ 2,706 8,023 $ 7,538 Third Quarter, 2026 vs. 2025 (in millions) Amounts may not sum due to rounding. “Non-GAAP Adjusted EBITDA” is a non-GAAP financial measure. Exhibit C: GAAP Net Income to Non-GAAP Adjusted EBITDA Reconciliation
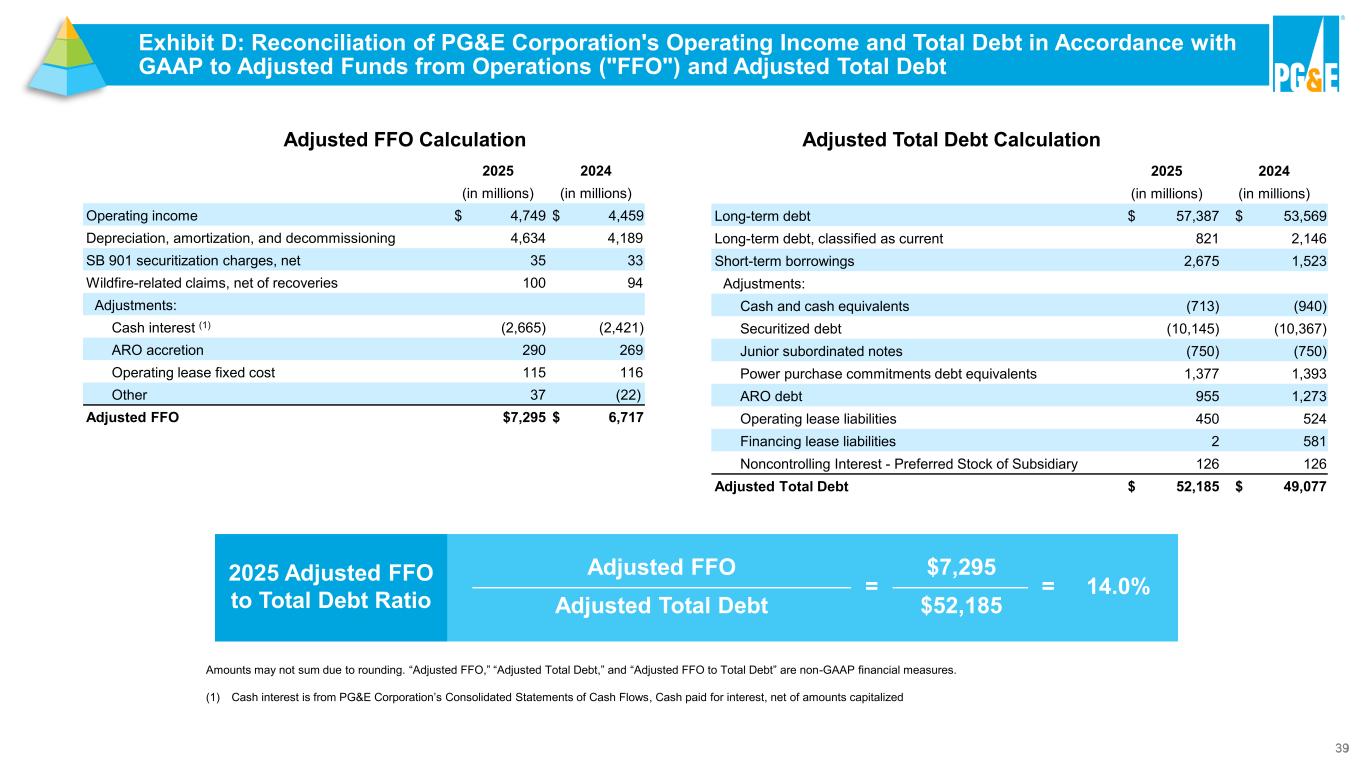
39 Exhibit D: Reconciliation of PG&E Corporation's Operating Income and Total Debt in Accordance with GAAP to Adjusted Funds from Operations ("FFO") and Adjusted Total Debt 2025 2024 (in millions) (in millions) Operating income $ 4,749 $ 4,459 Depreciation, amortization, and decommissioning 4,634 4,189 SB 901 securitization charges, net 35 33 Wildfire-related claims, net of recoveries 100 94 Adjustments: Cash interest (1) (2,665) (2,421) ARO accretion 290 269 Operating lease fixed cost 115 116 Other 37 (22) Adjusted FFO $7,295 $ 6,717 2025 2024 (in millions) (in millions) Long-term debt $ 57,387 $ 53,569 Long-term debt, classified as current 821 2,146 Short-term borrowings 2,675 1,523 Adjustments: Cash and cash equivalents (713) (940) Securitized debt (10,145) (10,367) Junior subordinated notes (750) (750) Power purchase commitments debt equivalents 1,377 1,393 ARO debt 955 1,273 Operating lease liabilities 450 524 Financing lease liabilities 2 581 Noncontrolling Interest - Preferred Stock of Subsidiary 126 126 Adjusted Total Debt $ 52,185 $ 49,077 Adjusted FFO Calculation Adjusted Total Debt Calculation Adjusted FFO = $7,295 = 14.0% Adjusted Total Debt $52,185 2025 Adjusted FFO to Total Debt Ratio Amounts may not sum due to rounding. “Adjusted FFO,” “Adjusted Total Debt,” and “Adjusted FFO to Total Debt” are non-GAAP financial measures. (1) Cash interest is from PG&E Corporation’s Consolidated Statements of Cash Flows, Cash paid for interest, net of amounts capitalized
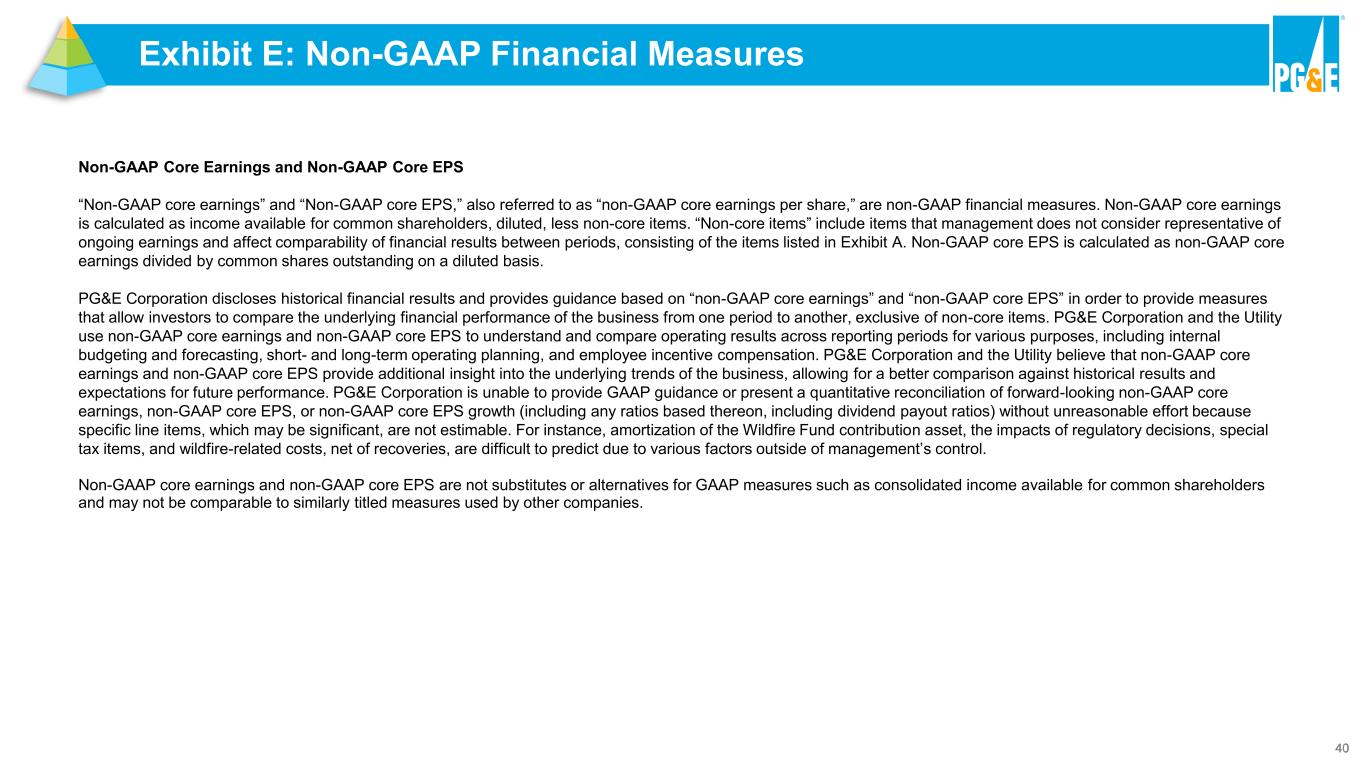
40 Non-GAAP Core Earnings and Non-GAAP Core EPS “Non-GAAP core earnings” and “Non-GAAP core EPS,” also referred to as “non-GAAP core earnings per share,” are non-GAAP financial measures. Non-GAAP core earnings is calculated as income available for common shareholders, diluted, less non-core items. “Non-core items” include items that management does not consider representative of ongoing earnings and affect comparability of financial results between periods, consisting of the items listed in Exhibit A. Non-GAAP core EPS is calculated as non-GAAP core earnings divided by common shares outstanding on a diluted basis. PG&E Corporation discloses historical financial results and provides guidance based on “non-GAAP core earnings” and “non-GAAP core EPS” in order to provide measures that allow investors to compare the underlying financial performance of the business from one period to another, exclusive of non-core items. PG&E Corporation and the Utility use non-GAAP core earnings and non-GAAP core EPS to understand and compare operating results across reporting periods for various purposes, including internal budgeting and forecasting, short- and long-term operating planning, and employee incentive compensation. PG&E Corporation and the Utility believe that non-GAAP core earnings and non-GAAP core EPS provide additional insight into the underlying trends of the business, allowing for a better comparison against historical results and expectations for future performance. PG&E Corporation is unable to provide GAAP guidance or present a quantitative reconciliation of forward-looking non-GAAP core earnings, non-GAAP core EPS, or non-GAAP core EPS growth (including any ratios based thereon, including dividend payout ratios) without unreasonable effort because specific line items, which may be significant, are not estimable. For instance, amortization of the Wildfire Fund contribution asset, the impacts of regulatory decisions, special tax items, and wildfire-related costs, net of recoveries, are difficult to predict due to various factors outside of management’s control. Non-GAAP core earnings and non-GAAP core EPS are not substitutes or alternatives for GAAP measures such as consolidated income available for common shareholders and may not be comparable to similarly titled measures used by other companies. Exhibit E: Non-GAAP Financial Measures