Pitney Bowes Discloses Financial Results for Third Quarter 2025 and Issues CEO Letter Delivered Earnings Growth and Sustained Meaningful Capital Returns to Shareholders Increases Share Repurchase Authorization to $500M Following More Than $280M in YTD Share Buybacks, While Also Increasing Dividend for Fourth Straight Quarter Makes Significant Progress on First Phase of Strategic Review, Including Identifying New Operational Efficiencies and Identifies $50 Million to $60 Million in Additional Cost Savings Releases CEO Letter Detailing New Initiatives, Quarterly Performance and Go-Forward Outlook STAMFORD, Conn.--(BUSINESS WIRE)--October 29, 2025--Pitney Bowes Inc. (NYSE: PBI) (“Pitney Bowes” or the “Company”), a technology-driven company that provides digital shipping solutions, mailing innovation, and financial services to clients around the world, today disclosed its financial results for the third quarter of 2025. In conjunction with this announcement, Pitney Bowes’ CEO, Kurt Wolf, has released a letter to shareholders to provide his commentary on the quarter and updates on strategic initiatives. Q3 2025 Financial Highlights • Revenue was $460 million, down 8% year over year • GAAP EPS was $0.30, an improvement of $1.06 year over year • Adjusted EPS was $0.31, an improvement of $0.10 year over year • GAAP net income of $52 million, an improvement of $190 million year over year • Adjusted EBIT was $107 million, an improvement of $5 million year over year • GAAP cash from operating activities was $67 million, an improvement of $1 million year over year • Free Cash Flow was $60 million, and excluded $9 million of restructuring payments Earnings per share results are summarized in the table below: Third Quarter 2025 2024 GAAP EPS $0.30 ($0.75) Loss from discontinued operations, net of tax - $1.42 Restructuring charges $0.01 $0.13 Foreign currency loss / (gain) on intercompany loans ($0.02) $0.08 Transaction and strategic review costs $0.02 $0.01 Loss on debt redemption/refinancing - $0.01 (Benefit) / costs in connection with Ecommerce exit ($0.01) $0.16 Asset impairment charge - $0.05 Tax benefit from affiliate reorganization - ($0.89) Adjusted EPS $0.31 $0.21 Note: Amounts may not foot due to rounding. Q3 2025 CEO Commentary & Letter To read and/or download a copy of this quarter’s CEO letter please click here.
Q3 2025 Business Segment Reporting SendTech Solutions SendTech Solutions offers physical and digital shipping and mailing technology solutions, financing, services, supplies and other applications for small and medium businesses, retail, enterprise, and government clients around the world to help simplify and save on the sending, tracking and receiving of letters, parcels and flats. Third Quarter ($ millions) 2025 2024 % Change Reported Revenue $311 $331 (6%) Adj. Segment EBITDA $112 $112 0% Adj. Segment EBIT $101 $102 (1%) SendTech revenue declined due to the impact of prior year product migration and a decrease in the mailing install base. Adjusted Segment EBITDA was flat year-over-year. The decline in Adjusted Segment EBIT was driven by lower revenue and was partially offset by cost reduction initiatives. Presort Services Presort Services provides sortation services that enable clients to qualify for USPS workshare discounts in First Class Mail, Marketing Mail, Marketing Mail Flats and Bound Printed Matter. Third Quarter ($ millions) 2025 2024 % Change Reported Revenue $149 $166 (11%) Adj. Segment EBITDA $42 $55 (24%) Adj. Segment EBIT $33 $46 (29%) Lower volumes due to client losses tied to a prior rigid pricing strategy under former management and broader market decline drove the decrease in revenue. Adjusted Segment EBITDA and EBIT declined due to the decrease in revenue and reduced operating leverage from lower volumes. 2025 Full-Year Outlook Pitney Bowes now expects to achieve near the low end of previously disclosed guidance range for Revenue, Adjusted EBIT and Free Cash Flow. The Company also now expects to achieve near the midpoint of its previously disclosed guidance range for Adjusted EPS. For reference, the Company’s previously disclosed guidance ranges are: $ millions, except EPS Low High Revenue $1,900 $1,950 Adjusted EBIT $450 $465 Adjusted EPS $1.20 $1.40 Free Cash Flow $330 $370
Q3 2025 Earnings Conference Call Management will discuss the Company’s results in a webcast today at 5:00 p.m. ET. Instructions for accessing the earnings results call are available on the Investor Relations page of the Company’s website at www.pitneybowes.com. About Pitney Bowes Pitney Bowes (NYSE: PBI) is a technology-driven company that provides digital shipping solutions, mailing innovation, and financial services to clients around the world – including more than 90 percent of the Fortune 500. Small businesses to large enterprises, and government entities rely on Pitney Bowes to reduce the complexity of sending mail and parcels. For the latest news, corporate announcements, and financial results, visit www.pitneybowes.com/us/newsroom. For additional information, visit Pitney Bowes at www.pitneybowes.com. Adjusted Segment EBIT Adjusted Segment EBIT is the primary measure of profitability and operational performance at the segment level. Adjusted Segment EBIT includes segment revenues and related costs and expenses attributable to the segment, but excludes interest, taxes, general corporate expenses, restructuring charges, and other items not allocated to a business segment. We also report Adjusted Segment EBITDA as an additional useful measure of segment profitability and operational performance, which is calculated as Adjusted Segment EBIT plus depreciation and amortization expense of the segment. Use of Non-GAAP Measures Pitney Bowes’ financial results are reported in accordance with generally accepted accounting principles (GAAP). Pitney Bowes also discloses certain non-GAAP measures, such as revenue growth on a constant currency basis, adjusted earnings before interest and taxes (Adjusted EBIT), adjusted earnings before interest, taxes, depreciation and amortization (Adjusted EBITDA), adjusted earnings per share (Adjusted EPS) and free cash flow. Revenue growth on a constant currency basis excludes the impact of changes in currency exchange rates from the prior period under comparison. Constant currency change is calculated by converting the current period non-U.S. dollar denominated revenue using the prior year’s exchange rate. We believe that excluding the impacts of currency exchange rates provides a better understanding of the underlying revenue performance. Adjusted EBIT, Adjusted EBITDA and Adjusted EPS exclude the impact of restructuring charges, foreign currency gains and losses on intercompany loans, certain costs associated with the Ecommerce Restructuring, gains and losses on debt redemptions and other unusual items that we believe are not indicative to our core business operations. Free cash flow adjusts cash flow from operations calculated in accordance with GAAP for capital expenditures, restructuring payments and other special items. Management believes free cash flow provides better insight into the amount of cash available for other discretionary uses. Reconciliations of non-GAAP measures to comparable GAAP measures can be found in the attached financial schedules and at the Company's web site at: https://www.investorrelations.pitneybowes.com/. We do not provide a reconciliation of forward‑looking non‑GAAP measures to the most comparable GAAP measures because items necessary for such reconciliation are not available on a reasonable basis without unreasonable efforts.
Forward-Looking Statements This document contains “forward-looking statements” about the Company’s expected or potential future business and financial performance, including, but not limited to, statements about future revenue and profitability, earnings guidance, future events or conditions, capital allocation strategy, expected cost savings and efficiency improvements, and strategic initiatives and priorities. Forward-looking statements are not guarantees of future performance and involve risks and uncertainties that could cause actual results to differ materially from those projected. Factors which could cause future performance to differ materially from expectations include, without limitation, changes in postal regulations or the operations and financial health of posts in the U.S. or other major markets or changes to the broader postal or shipping markets; declines in physical mail volumes or shipping volumes; the loss of customers, including some of our larger clients; changes in trade policies, tariffs and regulations; global supply chain issues adversely impacting our third party suppliers’ ability to provide us products and services; periods of difficult economic conditions, the impacts of inflation and rising prices, higher interest rates and a slow-down in economic activity, including a global recession, or a prolonged U.S. government shutdown, to the Company and our clients; changes in foreign currency exchange rates; changes in labor and transportation availability and costs; inability to successfully execute on our strategic initiatives; and other factors as more fully outlined in the Company's Annual Report on Form 10-K for the year ended December 31, 2024 and other reports filed with the Securities and Exchange Commission during 2025. Pitney Bowes assumes no obligation to update any forward-looking statements contained in this document as a result of new information, events, or developments, except as required by law. Contacts: For Investors: Alex Brown investorrelations@pb.com For Media: Longacre Square Partners Ashley Areopagita aareopagita@longacresquare.com
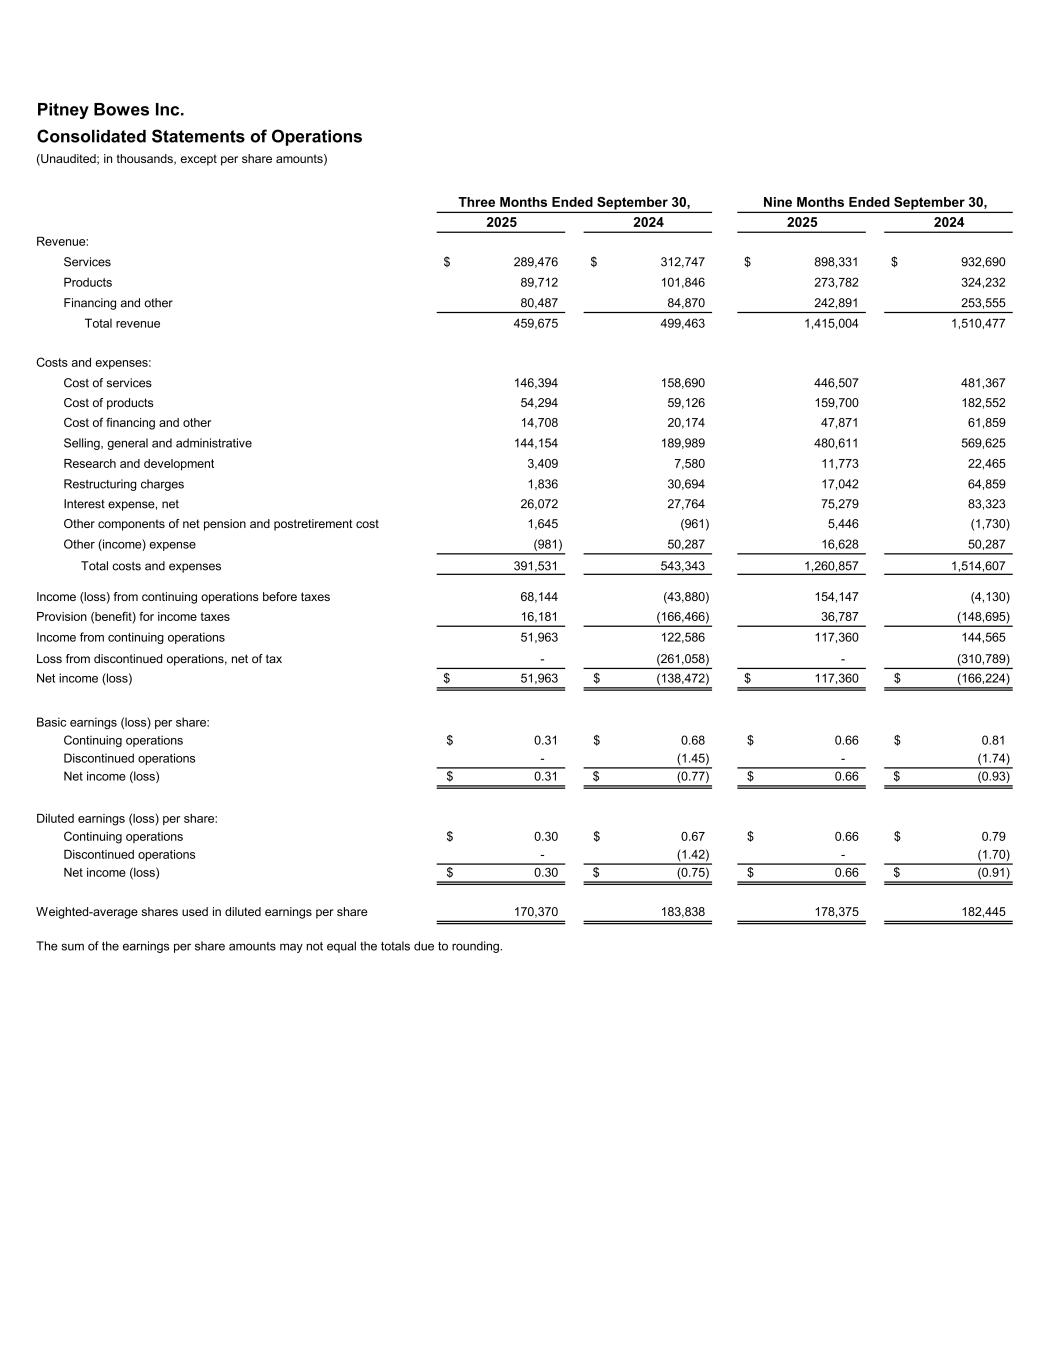
Pitney Bowes Inc. Consolidated Statements of Operations (Unaudited; in thousands, except per share amounts) 2025 2024 2025 2024 Revenue: Services 289,476$ 312,747$ 898,331$ 932,690$ Products 89,712 101,846 273,782 324,232 Financing and other 80,487 84,870 242,891 253,555 Total revenue 459,675 499,463 1,415,004 1,510,477 Costs and expenses: Cost of services 146,394 158,690 446,507 481,367 Cost of products 54,294 59,126 159,700 182,552 Cost of financing and other 14,708 20,174 47,871 61,859 Selling, general and administrative 144,154 189,989 480,611 569,625 Research and development 3,409 7,580 11,773 22,465 Restructuring charges 1,836 30,694 17,042 64,859 Interest expense, net 26,072 27,764 75,279 83,323 Other components of net pension and postretirement cost 1,645 (961) 5,446 (1,730) Other (income) expense (981) 50,287 16,628 50,287 Total costs and expenses 391,531 543,343 1,260,857 1,514,607 Income (loss) from continuing operations before taxes 68,144 (43,880) 154,147 (4,130) Provision (benefit) for income taxes 16,181 (166,466) 36,787 (148,695) Income from continuing operations 51,963 122,586 117,360 144,565 Loss from discontinued operations, net of tax - (261,058) - (310,789) Net income (loss) 51,963$ (138,472)$ 117,360$ (166,224)$ Basic earnings (loss) per share: Continuing operations 0.31$ 0.68$ 0.66$ 0.81$ Discontinued operations - (1.45) - (1.74) Net income (loss) 0.31$ (0.77)$ 0.66$ (0.93)$ Diluted earnings (loss) per share: Continuing operations 0.30$ 0.67$ 0.66$ 0.79$ Discontinued operations - (1.42) - (1.70) Net income (loss) 0.30$ (0.75)$ 0.66$ (0.91)$ Weighted-average shares used in diluted earnings per share 170,370 183,838 178,375 182,445 The sum of the earnings per share amounts may not equal the totals due to rounding. Nine Months Ended September 30,Three Months Ended September 30,
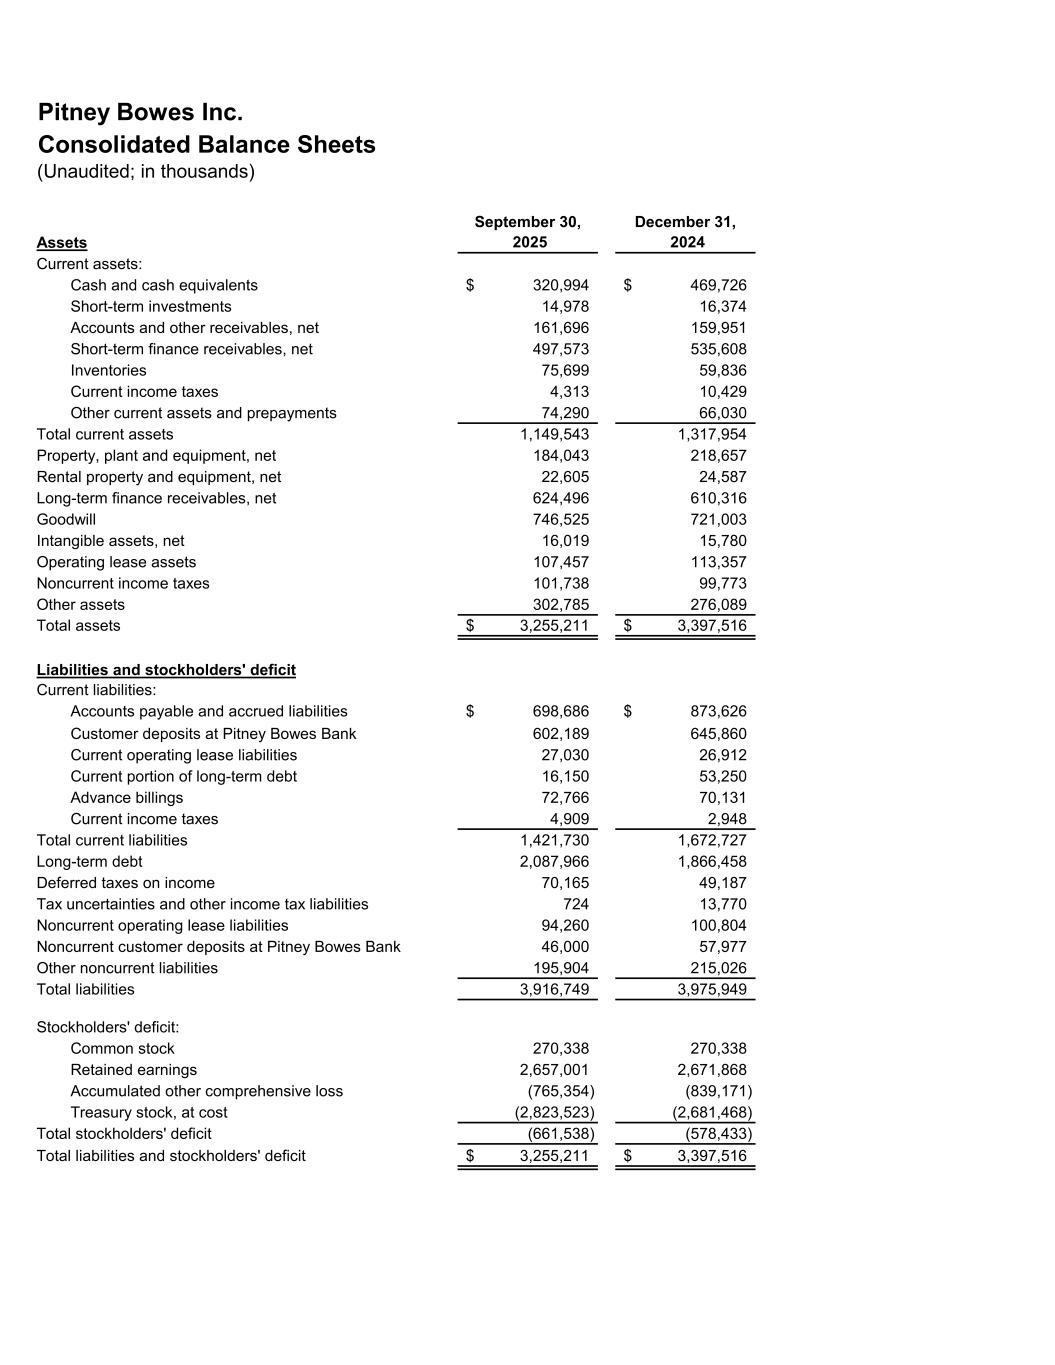
Pitney Bowes Inc. Consolidated Balance Sheets (Unaudited; in thousands) Assets September 30, 2025 December 31, 2024 Current assets: Cash and cash equivalents 320,994$ 469,726$ Short-term investments 14,978 16,374 Accounts and other receivables, net 161,696 159,951 Short-term finance receivables, net 497,573 535,608 Inventories 75,699 59,836 Current income taxes 4,313 10,429 Other current assets and prepayments 74,290 66,030 Total current assets 1,149,543 1,317,954 Property, plant and equipment, net 184,043 218,657 Rental property and equipment, net 22,605 24,587 Long-term finance receivables, net 624,496 610,316 Goodwill 746,525 721,003 Intangible assets, net 16,019 15,780 Operating lease assets 107,457 113,357 Noncurrent income taxes 101,738 99,773 Other assets 302,785 276,089 Total assets 3,255,211$ 3,397,516$ Liabilities and stockholders' deficit Current liabilities: Accounts payable and accrued liabilities 698,686$ 873,626$ Customer deposits at Pitney Bowes Bank 602,189 645,860 Current operating lease liabilities 27,030 26,912 Current portion of long-term debt 16,150 53,250 Advance billings 72,766 70,131 Current income taxes 4,909 2,948 Total current liabilities 1,421,730 1,672,727 Long-term debt 2,087,966 1,866,458 Deferred taxes on income 70,165 49,187 Tax uncertainties and other income tax liabilities 724 13,770 Noncurrent operating lease liabilities 94,260 100,804 Noncurrent customer deposits at Pitney Bowes Bank 46,000 57,977 Other noncurrent liabilities 195,904 215,026 Total liabilities 3,916,749 3,975,949 Stockholders' deficit: Common stock 270,338 270,338 Retained earnings 2,657,001 2,671,868 Accumulated other comprehensive loss (765,354) (839,171) Treasury stock, at cost (2,823,523) (2,681,468) Total stockholders' deficit (661,538) (578,433) Total liabilities and stockholders' deficit 3,255,211$ 3,397,516$
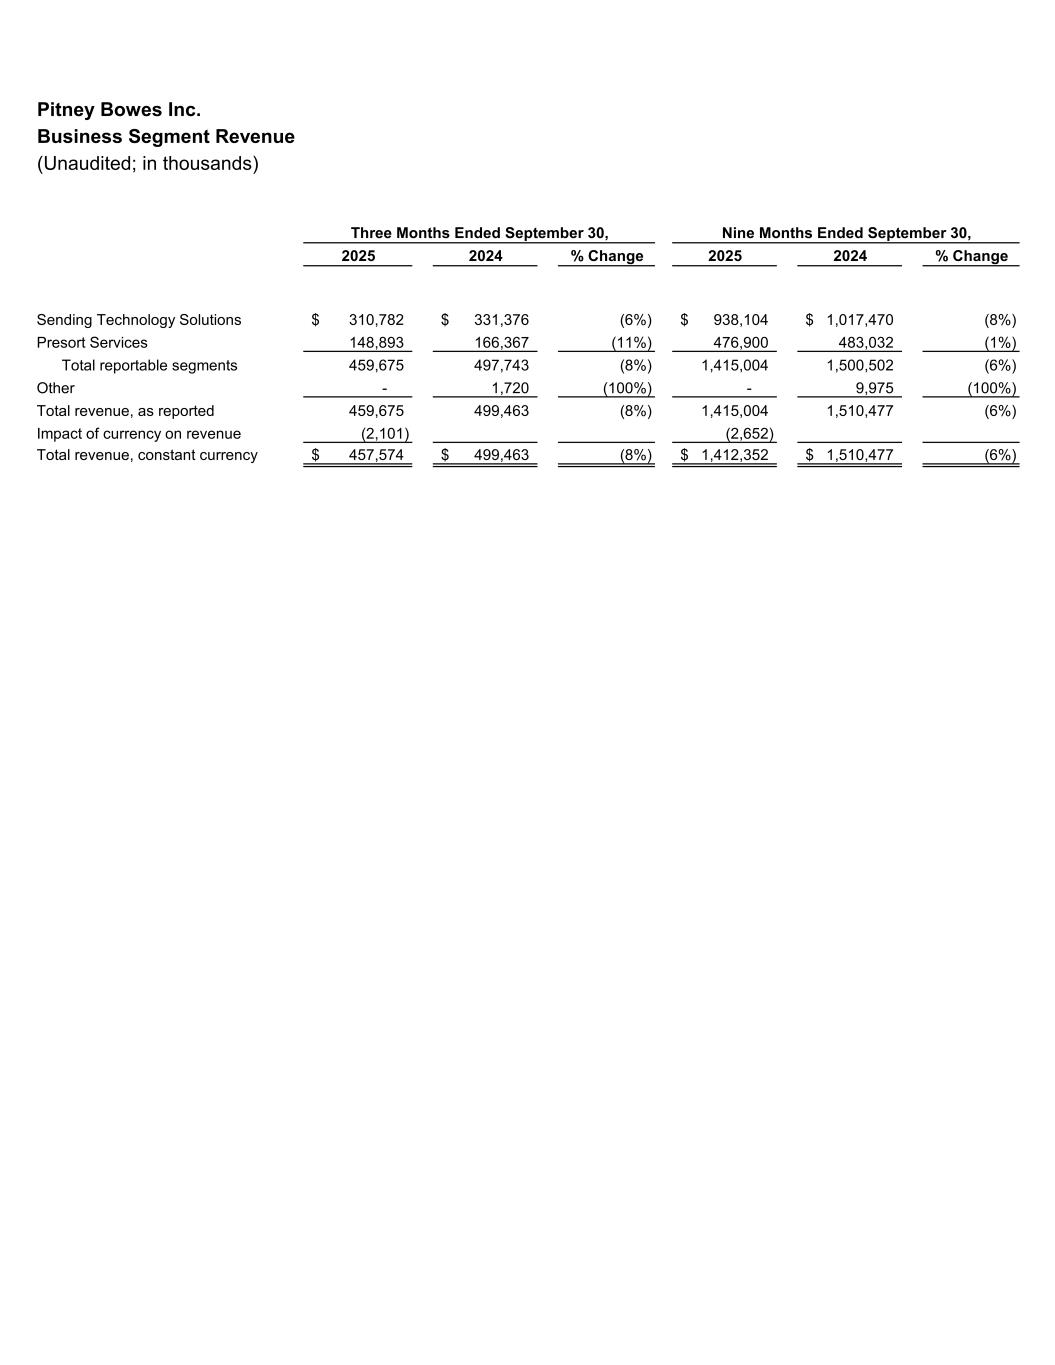
Pitney Bowes Inc. Business Segment Revenue (Unaudited; in thousands) 2025 2024 % Change 2025 2024 % Change Sending Technology Solutions 310,782$ 331,376$ (6%) 938,104$ 1,017,470$ (8%) Presort Services 148,893 166,367 (11%) 476,900 483,032 (1%) Total reportable segments 459,675 497,743 (8%) 1,415,004 1,500,502 (6%) Other - 1,720 (100%) - 9,975 (100%) Total revenue, as reported 459,675 499,463 (8%) 1,415,004 1,510,477 (6%) Impact of currency on revenue (2,101) (2,652) Total revenue, constant currency 457,574$ 499,463$ (8%) 1,412,352$ 1,510,477$ (6%) Three Months Ended September 30, Nine Months Ended September 30,
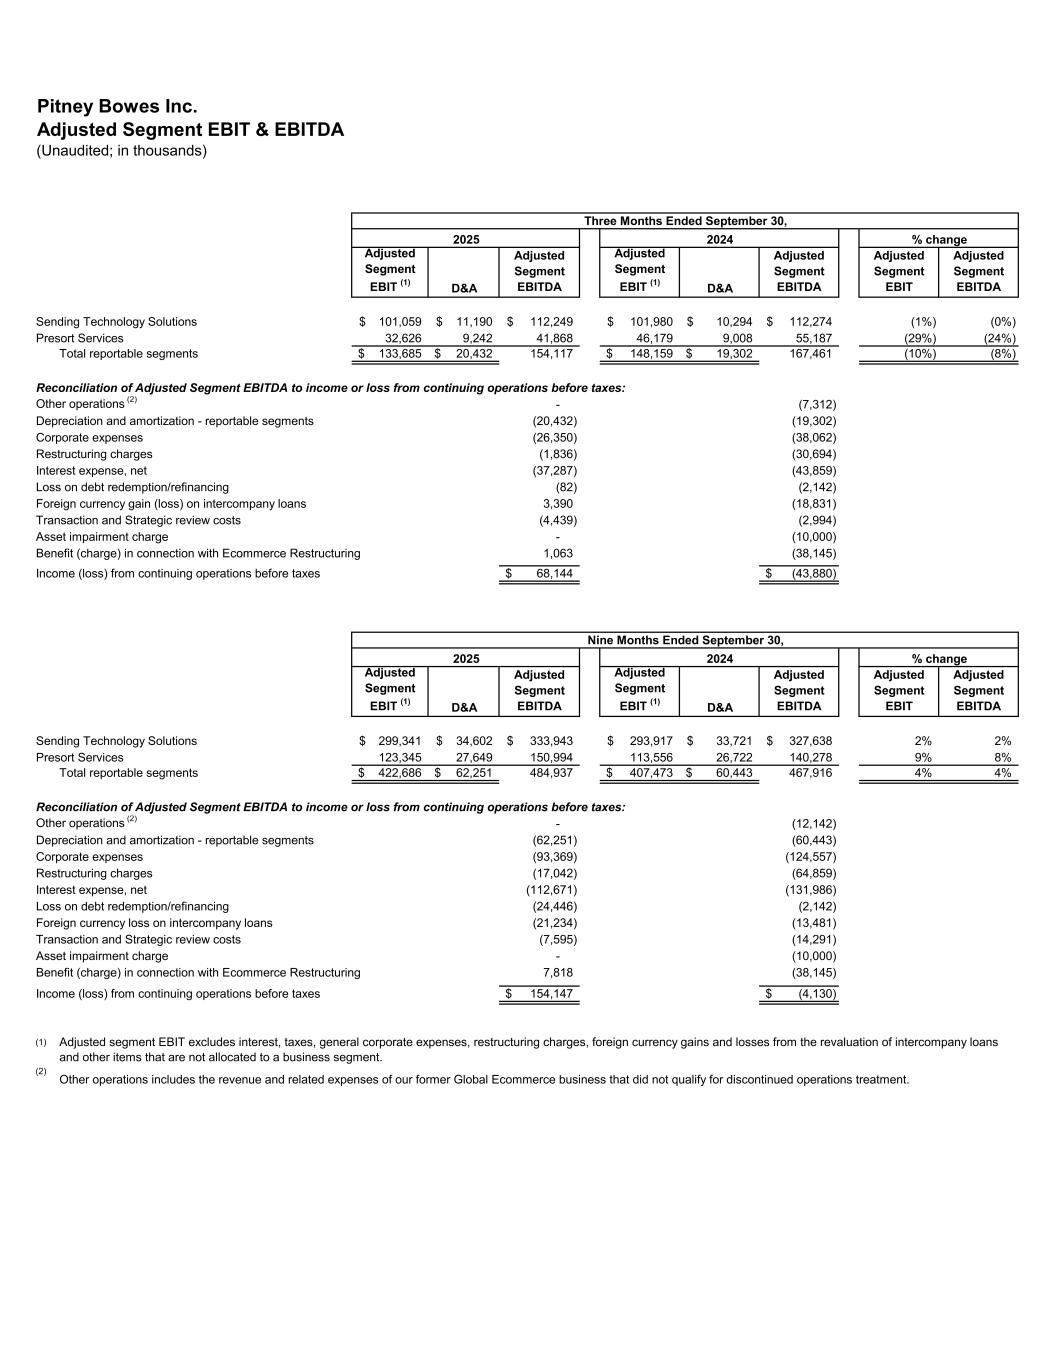
Pitney Bowes Inc. Adjusted Segment EBIT & EBITDA (Unaudited; in thousands) Adjusted Segment EBIT (1) D&A Adjusted Segment EBITDA Adjusted Segment EBIT (1) D&A Adjusted Segment EBITDA Adjusted Segment EBIT Adjusted Segment EBITDA Sending Technology Solutions 101,059$ 11,190$ 112,249$ 101,980$ 10,294$ 112,274$ (1%) (0%) Presort Services 32,626 9,242 41,868 46,179 9,008 55,187 (29%) (24%) Total reportable segments 133,685$ 20,432$ 154,117 148,159$ 19,302$ 167,461 (10%) (8%) Reconciliation of Adjusted Segment EBITDA to income or loss from continuing operations before taxes: Other operations (2) - (7,312) Depreciation and amortization - reportable segments (20,432) (19,302) Corporate expenses (26,350) (38,062) Restructuring charges (1,836) (30,694) Interest expense, net (37,287) (43,859) Loss on debt redemption/refinancing (82) (2,142) Foreign currency gain (loss) on intercompany loans 3,390 (18,831) Transaction and Strategic review costs (4,439) (2,994) Asset impairment charge - (10,000) Benefit (charge) in connection with Ecommerce Restructuring 1,063 (38,145) Income (loss) from continuing operations before taxes 68,144$ (43,880)$ Adjusted Segment EBIT (1) D&A Adjusted Segment EBITDA Adjusted Segment EBIT (1) D&A Adjusted Segment EBITDA Adjusted Segment EBIT Adjusted Segment EBITDA Sending Technology Solutions 299,341$ 34,602$ 333,943$ 293,917$ 33,721$ 327,638$ 2% 2% Presort Services 123,345 27,649 150,994 113,556 26,722 140,278 9% 8% Total reportable segments 422,686$ 62,251$ 484,937 407,473$ 60,443$ 467,916 4% 4% Reconciliation of Adjusted Segment EBITDA to income or loss from continuing operations before taxes: Other operations (2) - (12,142) Depreciation and amortization - reportable segments (62,251) (60,443) Corporate expenses (93,369) (124,557) Restructuring charges (17,042) (64,859) Interest expense, net (112,671) (131,986) Loss on debt redemption/refinancing (24,446) (2,142) Foreign currency loss on intercompany loans (21,234) (13,481) Transaction and Strategic review costs (7,595) (14,291) Asset impairment charge - (10,000) Benefit (charge) in connection with Ecommerce Restructuring 7,818 (38,145) Income (loss) from continuing operations before taxes 154,147$ (4,130)$ (1) (2) Adjusted segment EBIT excludes interest, taxes, general corporate expenses, restructuring charges, foreign currency gains and losses from the revaluation of intercompany loans and other items that are not allocated to a business segment. Other operations includes the revenue and related expenses of our former Global Ecommerce business that did not qualify for discontinued operations treatment. Three Months Ended September 30, 2025 2024 Nine Months Ended September 30, 2025 2024 % change % change
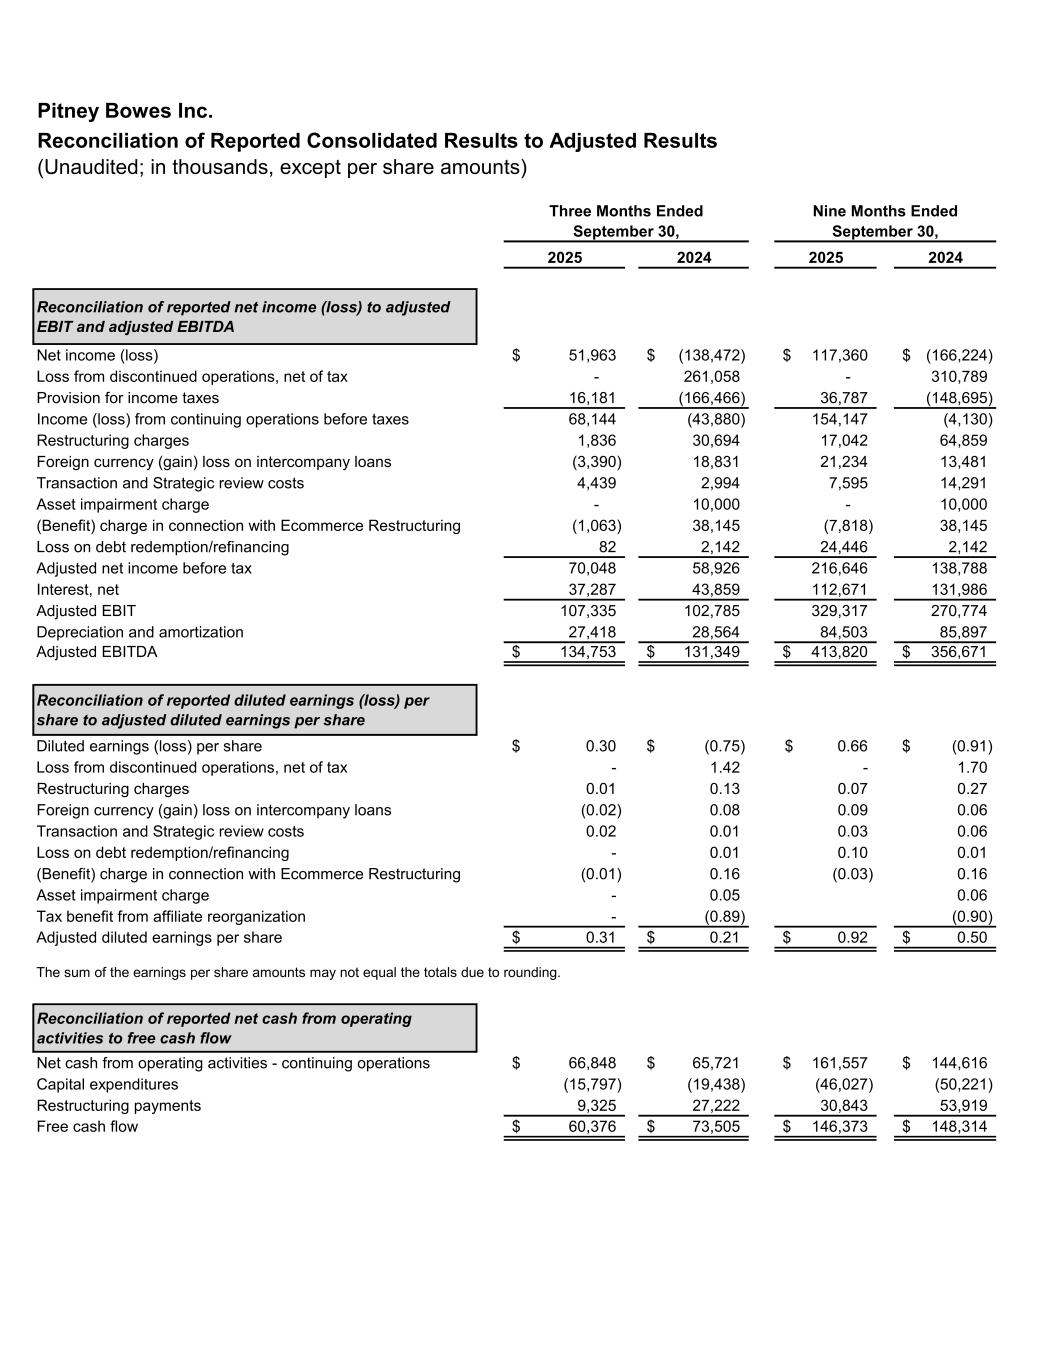
Pitney Bowes Inc. Reconciliation of Reported Consolidated Results to Adjusted Results (Unaudited; in thousands, except per share amounts) 2025 2024 2025 2024 Reconciliation of reported net income (loss) to adjusted EBIT and adjusted EBITDA Net income (loss) 51,963$ (138,472)$ 117,360$ (166,224)$ Loss from discontinued operations, net of tax - 261,058 - 310,789 Provision for income taxes 16,181 (166,466) 36,787 (148,695) Income (loss) from continuing operations before taxes 68,144 (43,880) 154,147 (4,130) Restructuring charges 1,836 30,694 17,042 64,859 Foreign currency (gain) loss on intercompany loans (3,390) 18,831 21,234 13,481 Transaction and Strategic review costs 4,439 2,994 7,595 14,291 Asset impairment charge - 10,000 - 10,000 (Benefit) charge in connection with Ecommerce Restructuring (1,063) 38,145 (7,818) 38,145 Loss on debt redemption/refinancing 82 2,142 24,446 2,142 Adjusted net income before tax 70,048 58,926 216,646 138,788 Interest, net 37,287 43,859 112,671 131,986 Adjusted EBIT 107,335 102,785 329,317 270,774 Depreciation and amortization 27,418 28,564 84,503 85,897 Adjusted EBITDA 134,753$ 131,349$ 413,820$ 356,671$ Reconciliation of reported diluted earnings (loss) per share to adjusted diluted earnings per share Diluted earnings (loss) per share 0.30$ (0.75)$ 0.66$ (0.91)$ Loss from discontinued operations, net of tax - 1.42 - 1.70 Restructuring charges 0.01 0.13 0.07 0.27 Foreign currency (gain) loss on intercompany loans (0.02) 0.08 0.09 0.06 Transaction and Strategic review costs 0.02 0.01 0.03 0.06 Loss on debt redemption/refinancing - 0.01 0.10 0.01 (Benefit) charge in connection with Ecommerce Restructuring (0.01) 0.16 (0.03) 0.16 Asset impairment charge - 0.05 0.06 Tax benefit from affiliate reorganization - (0.89) (0.90) Adjusted diluted earnings per share 0.31$ 0.21$ 0.92$ 0.50$ The sum of the earnings per share amounts may not equal the totals due to rounding. Reconciliation of reported net cash from operating activities to free cash flow Net cash from operating activities - continuing operations 66,848$ 65,721$ 161,557$ 144,616$ Capital expenditures (15,797) (19,438) (46,027) (50,221) Restructuring payments 9,325 27,222 30,843 53,919 Free cash flow 60,376$ 73,505$ 146,373$ 148,314$ Three Months Ended September 30, Nine Months Ended September 30,