ANNUAL REPORT PURSUANT TO SECTION 13 OR 15(d) OF THE SECURITIES EXCHANGE ACT OF 1934
For the fiscal year ended December 31, 2025 Commission file number: 1-3579
PITNEY BOWES INC.
State of incorporation:
Delaware
I.R.S. Employer Identification No.
06-0495050
Address:
27 Waterview Drive,
Shelton,
Connecticut
06484
Telephone Number:
(203)
922-4000
Securities registered pursuant to Section 12(b) of the Act:
Title of Each Class
Trading Symbol(s)
Name of Each Exchange on Which Registered
Common Stock, $1 par value per share
PBI
New York Stock Exchange
6.7% Notes due 2043
PBI.PRB
New York Stock Exchange
Securities registered pursuant to Section 12(g) of the Act: None.
Indicate by check mark if the registrant is a well-known seasoned issuer, as defined in Rule 405 of the Securities Act. Yesþ No ¨
Indicate by check mark if the registrant is not required to file reports pursuant to Section 13 or Section 15(d) of the Act. Yes ¨ Noþ
Indicate by check mark whether the registrant (1) has filed all reports required to be filed by Section 13 or 15(d) of the Securities Exchange Act of 1934 during the preceding 12 months (or for such shorter period that the registrant was required to file such reports), and (2) has been subject to such filing requirements for the past 90 days. Yesþ No ¨
Indicate by check mark whether the registrant has submitted electronically every Interactive Data File required to be submitted pursuant to Rule 405 of Regulation S-T (section 232.405 of this chapter) during the preceding 12 months (or for such shorter period that the registrant was required to submit such files) Yesþ No ¨
Indicate by check mark whether the registrant is a large accelerated filer, an accelerated filer, a non-accelerated filer, a smaller reporting company, or an emerging growth company. See definition of "large accelerated filer,""accelerated filer,""smaller reporting company," and "emerging growth company" in Rule 12b-2 of the Exchange Act.
Large accelerated filer
þ
Accelerated filer
o
Non-accelerated filer
o
Smaller reporting company
☐
Emerging growth company
☐
If an emerging growth company, indicate by check mark whether the registrant has elected not to use the extended transition period for complying with new or revised financial accounting standards provided pursuant to Section 13(a) of the Exchange Act. ¨
Indicate by check mark whether the registrant has filed a report on and attestation to its management's assessment of the effectiveness of its internal control over financial reporting under Section 404(b) of the Sarbanes-Oxley Act (15 U.S.C. 7262(b)) by the registered public accounting firm that prepared or issued its audit report. Yes ☑ No ¨
Indicate by check mark whether the registrant is a shell company (as defined in Rule 12b-2 of the Act). Yes ☐ No þ
If securities are registered pursuant to Section 12(b) of the Act, indicate by check mark whether the financial statements of the registrant included in the filing reflect the correction of an error to previously issued financial statements. þ
Indicate by check mark whether any of those error corrections are restatements that required a recovery analysis of incentive-based compensation received by any of the registrant's executive officers during the relevant recovery period pursuant to § 240.10D-1(b). ¨
As of June 30, 2025, the aggregate market value of the registrant's common stock held by non-affiliates of the registrant was $2 billion based on the closing sale price as reported on the New York Stock Exchange. At January 31, 2026, there were 149,942,698 outstanding shares of common stock, $1 par value.
DOCUMENTS INCORPORATED BY REFERENCE
Portions of the registrant's proxy statement to be filed within 120 days after our fiscal year end in connection with the Annual Meeting of Stockholders, are incorporated by reference in Part III of this Form 10-K.
This Annual Report on Form 10-K (Annual Report) contains statements that are forward-looking. We believe that these forward-looking statements are reasonable based on our current expectations and assumptions. However, we caution readers that any forward-looking statement within the meaning of Section 27A of the Securities Act of 1933 and Section 21E of the Securities Exchange Act of 1934 are subject to risks and uncertainties and actual results could differ materially. Words such as "estimate," "project," "plan," "believe," "expect," "anticipate," "intend" and similar expressions may identify such forward-looking statements. We undertake no obligation to publicly update or revise any forward-looking statement, whether as a result of new information, future events or otherwise, except as required by law. Forward-looking statements in this Annual Report speak only as of the date hereof, and forward-looking statements in documents attached that are incorporated by reference speak only as of the date of those documents.
Forward-looking statements are subject to inherent risks and uncertainties and subject to change. Accordingly, actual results of operations, financial condition and cash flows could differ materially from those projected or assumed in our forward-looking statements. Certain factors which could cause future financial performance to differ materially from expectations include, without limitation:
•changes in postal regulations or the operations and financial health of posts in the U.S. or other major markets, or changes to the broader postal or shipping markets
•accelerated or sudden decline in physical mail or shipping volumes
•the loss of some of our larger clients
•periods of difficult economic conditions impacting the company and our clients, including inflation and rising prices, changes in interest rates and a slow-down in economic activity, including a global recession, or a prolonged U.S. government shutdown
•our ability to compete successfully
•changes in banking regulations, major bank failures, the loss of our Industrial Bank charter or limitations on our banking activities
•changes in government contracting regulations and compliance challenges
•changes in labor and transportation availability and costs
•global supply chain issues adversely impacting our third party suppliers' ability to provide us with products and services
•changes in trade policies, tariffs and regulations
•changes in senior management and Board of Directors, loss of key employees and ability to attract and retain employees
•expenses and potential impacts resulting from cyber-attacks or other cybersecurity incidents affecting us or our suppliers
•inability to comply with data privacy and protection laws and regulations
•interruptions or difficulties in the operation of our cloud-based applications and systems or those of our suppliers
•changes in credit ratings, capital market disruptions, decline in cash flows, noncompliance with debt covenants or future interest rate increases that may adversely impact our ability to access capital markets at reasonable costs
•our indebtedness, including Convertible Notes, and the impact of any conversion, repurchase or redemption of the Convertible Notes
•our success at managing customer credit risk
•changes in foreign currency exchange rates
•the risks and uncertainties associated with the Ecommerce Restructuring
•changes in tax rates, laws or regulations
•inability to protect our intellectual property rights and intellectual property infringement claims
•our success in developing and marketing new products and services and obtaining regulatory approvals, if required
•acts of nature and the impact of a pandemic on the Company and the services and solutions we offer
•shareholder activism
Further information about factors that could materially affect us, including our results of operations and financial condition, is contained in Item 1A. "Risk Factors" in this Annual Report.
3
ITEM 1. BUSINESS
General
Pitney Bowes Inc. ("we, us, our, or the company") is a technology-driven company that provides digital shipping solutions, mailing innovation, and financial services to clients around the world - including more than 90 percent of the Fortune 500. Small businesses to large enterprises, and government entities rely on Pitney Bowes to reduce the complexity of sending mail and parcels.
Business Segments
SendTech Solutions
SendTech Solutions provides clients with physical and digital shipping and mailing technology solutions and other applications to help simplify and save on the sending, tracking and receiving of letters, parcels and flats, as well as supplies and maintenance services for these offerings. We offer financing alternatives that enable clients to finance equipment. Digital delivery services enables clients to reduce transportation and logistics costs, select the best carrier based on need and cost, improve delivery times and track packages in real-time. Powered by our shipping APIs, clients can purchase postage, print shipping labels and access shipping and tracking services from multiple carriers that can be easily integrated into any web application such as online shopping carts or ecommerce sites and provide guaranteed delivery times and flexible payment options.
Through our wholly owned subsidiary, The Pitney Bowes Bank ("the Bank"), we offer financing alternatives that enable clients to finance other manufacturers' equipment and product purchases, a revolving credit solution that allows clients to make meter rental payments and purchase postage, services and supplies, an interest-bearing deposit solution to clients that prefer to prepay postage and meet working capital needs.
Presort Services
We are the largest workshare partner of the United States Postal Service ("USPS") and national outsource provider of mail sortation services that allow clients to qualify volumes of First-Class Mail, First Class Flats, Marketing Mail and Marketing Mail Flats/Bound Printed Matter for postal workshare discounts. Using our proprietary technology, we provide clients with end-to-end solutions from pick up to delivery into the postal system network, improving mail delivery and enhancing total mail value including optimizing postage savings.
Other
Other represents amounts of the prior Global Ecommerce segment that did not qualify for discontinued operations treatment, primarily related to operations that were dissolved or sold and certain shared services functions. In August 2024, we exited from the Global Ecommerce business through an orderly wind-down of these operations. See Note 4 to the Consolidated Financial Statements for further information.
Sales and Services
We market our products, solutions and services through a direct and inside sales force, global and regional partner channels, direct mailings and digital channels. We provide call-center, online and on-site support services for our products and solutions. Support services are primarily provided under maintenance contracts.
Competition
SendTech Solutions
We face competition from other mail equipment and solutions providers and those that offer online shipping and mailing products and services solutions. We differentiate ourselves through the breadth of our physical and digital offerings, including cloud-based software platforms designed to support complex, high-volume, multi-carrier shipping and mailing operations, an open platform architecture; competitive pricing; available financing and payment solutions; product reliability; support services; and our extensive knowledge of the shipping and mailing industry.
Our financing operations face competition, in varying degrees, from large, diversified financial institutions, leasing companies, commercial finance companies, commercial banks and smaller specialized firms. We believe what differentiates us from our competitors is the breadth of our financing and payment solutions and our ability to seamlessly integrate these solutions into our clients' shipping and mailing operations.
Presort Services
We face competition from regional and local presort providers, cooperatives of multiple local presort providers, consolidators and service bureaus that offer presort solutions as part of a larger bundle of outsourcing services. We also face competition from large mailers that have sufficient volumes and the capability to sort their own mailings in-house and could use excess capacity to offer presort services to others. The principal competitive factors include price, innovative service, delivery speed, tracking and reporting, industry expertise and economies of scale. Our competitive advantages include our national network of processing centers handling
4
upwards of 15 billion mail pieces annually including a proprietary Mail Exchange program affording clients maximized postage discounts, improved deliverability, and proven business continuity protocols. Clients benefit from our industry expertise at all levels through local Mail Design Professional certified support resources, allowing greater access to programs like United States Postal Service ("USPS") Promotions and Incentives, saving additional costs on mailing and increasing impact of their mail. Additionally, a dedicated postal relations team ensures rapid resolution for quality and compliance. With a fleet of over 350 drivers and vehicles, we provide clients flexible logistics including a unique USPS long-haul partnership made possible by our significant scale and processing volumes, ensuring improved delivery performance and additional safeguards for participating mail, particularly during peak seasons. Our proprietary Presort Services Account offers mail management capabilities from pick-up to invoicing including tracking, reporting, and data ingestion assuring mailers complete visibility and chain of custody. Our competitive capabilities collectively result in unexpected value for mailers.
Also see Item 1A. Risk Factors for further details regarding the competition our businesses face.
Research and Development
We invest in research and development activities to develop new products and solutions, enhance the effectiveness and functionality of existing products and solutions and deliver high value technology and differentiated services in high value segments of the market.
Third Party Suppliers
SendTech Solutions depends on third party suppliers and outsource providers for a variety of services and product components and the hosting of our SaaS offerings. Presort Services relies on third party suppliers to help equip our facilities, provide warehouse support and assist with logistical operations. All of our businesses and corporate functions depend on third party providers for a variety of data analytics, sales, reporting and other functions. In certain instances, we rely on single-sourced or limited-sourced suppliers and outsourcing vendors around the world because doing so is advantageous due to quality, price or lack of alternative sources. We have risk mitigation programs to monitor conditions affecting our suppliers' ability to fulfill expected commitments. We believe that our available sources for services, components, supplies, logistics and manufacturing are adequate.
Regulatory Matters
We are subject to the regulations of the USPS and other postal authorities worldwide, including requirements applicable to our mailing, shipping and related services. We are also subject to regulations as a U.S. government contractor, including applicable procurement and compliance requirements, as well as transportation regulations for various parts of our business, worldwide customs, trade and export regulations related to our domestic and cross-border logistics operations. In addition, our businesses that use, process, transmit or store personal, confidential or proprietary data are subject to evolving data privacy and security regulations in the United States and internationally. The Bank is chartered as an Industrial Bank under the laws of the State of Utah. As such, the Bank is subject to the regulations of the Utah Department of Financial Institutions and the Federal Deposit Insurance Corporation, and to applicable banking laws and regulations, including those relating to capital and liquidity, consumer compliance, and anti-money laundering and sanctions compliance. Certain company affiliates that provide services to the Bank are also subject to regulatory requirements applicable to those services.
Climate Change
Although climate change has not had a material impact on our operations to date, the risk of increasingly severe climate events or the risk that those events happen more frequently could affect one or more of our facilities and our ability to conduct daily operations or impact our clients and their ability to do business with us. Changes in regulation relating to climate change and other aspects of sustainability and governance of ESG, including different regulatory requirements in different locations where we operate, may change the cost of compliance for collecting, assuring and reporting information regarding these impacts and risk management.
Human Capital
Employee Profile
We have approximately 6,600 employees, with 75% located in the United States. We also rely on a contingent hourly workforce to supplement our full-time workforce to meet fluctuating demand.
We seek to create a high-performance culture that will drive and sustain enhanced long-term value for all our shareholders. To attract, retain and engage the talent needed, we provide competitive compensation designed to reward performance and contribution. We regularly assess the business environments and labor markets in the areas we operate to ensure our compensation programs reflect best practices and are market competitive. Depending on position and level, elements of our compensation packages include base salary, variable compensation based on individual and company objectives and equity. We provide a competitive benefits package, including medical, dental, life and disability insurance, and benefits that provide additional support for our employees’ mental, physical, financial and social well-being.
5
Employee Engagement and Development
We are committed to creating a culture where our employees feel supported and valued. We offer employees many opportunities to advance their skills, learn new skills and achieve career goals through virtual and in-person development and training programs, professional development initiatives, experiential learning, mentoring and coaching programs. Through multiple platforms, we offer employees and candidates varied opportunities to find development opportunities and stay informed about key changes to our business. We conduct periodic employee engagement surveys and benchmark the results both internally and against other high performing organizations. We consider feedback from employees and we make changes where possible and financially prudent.
Health and Safety
We are committed to providing a safe workplace that protects against and limits personal injury and environmental harm. Through regular evaluations of site safety performance, sharing of successes, and creating projects to engage employees in safety improvements, we identify risks, provide guidance and training, review and learn from accidents, and reduce injuries. We also report monthly to both local site management and senior leadership on safety metrics, trends, risks and regulatory activity.
Available Information
Our Annual Reports on Form 10-K, Quarterly Reports on Form 10-Q, Current Reports on Form 8-K and any amendments thereto filed with, or furnished to, the SEC, are available, free of charge, through the Investor Relations section of our website at www.investorrelations.pitneybowes.com or from the SEC's website at www.sec.gov, as soon as reasonably practicable after these reports are electronically filed with, or furnished to, the SEC. The other information found on our website is not part of this or any other report we file with or furnish to the SEC and is not incorporated herein or therein by reference.
Information About Our Executive Officers
Name
Age
Title
Executive Officer Since
Kurt Wolf
52
Chief Executive Officer
2025
Paul Evans
57
Executive Vice President, Chief Financial Officer and Treasurer
2025
Lauren Freeman-Bosworth
51
Executive Vice President, General Counsel and Corporate Secretary
2024
Debbie Pfeiffer
65
Executive Vice President and President, Presort Services
2024
Todd Everett
52
Executive Vice President and President, Sending Technology Solutions
2025
There are no family relationships among the above officers.
Mr. Wolf was appointed Chief Executive Officer in May 2025 and has served on our Board of Directors since May 2023. Prior to joining the Company, he served as Managing Member and Chief Investment Officer of Hestia Capital Management, a deep value hedge fund, since 2009.
Mr. Evans was appointed Executive Vice President, Chief Financial Officer and Treasurer in July 2025 and served on our Board of Directors since 2024. Previously, he served as Chief Operating Officer at America's Auto Auction Group, Interim Chief Executive Officer at Hill International, Inc. and Chief Financial Officer of Sevan Multi-Site Solutions.
Ms. Freeman-Bosworth was appointed Executive Vice President, General Counsel and Corporate Secretary in April 2024. Prior to this appointment, she was the Company's Vice President and Deputy General Counsel, Litigation, Governance and Compliance since June 2014.
Ms. Pfeiffer was appointed Executive Vice President and President, Presort Services in January 2024. Prior to this appointment, she served as the Company's President, Presort Services since November 2015.
Mr. Everett was appointed Executive Vice President and President, Sending Technology Solutions in September 2025 and served on our Board of Directors since 2023. He also is currently an independent advisor to several ecommerce companies and a board member of a private technology shipping company. Mr. Everett also held various roles at Newgistics, Inc., including President and Chief Executive Officer from 2015 until February 2018, prior to Pitney Bowes' acquisition of Newgistics.
6
ITEM 1A. RISK FACTORS
Our operations face certain risks that should be considered in evaluating our business. We manage and mitigate these risks on a proactive basis, using an enterprise risk management program. Nevertheless, the following risk factors, some of which may be beyond our control, could materially affect our business, financial condition, results of operations, brand and reputation, and may cause future results to be materially different from our current expectations. These risk factors are not intended to be all inclusive.
Mailing and Shipping Industry Risks
The financial condition and governance model of the USPS, or the national posts in our other major markets, has affected, and could, in the future, adversely affect client demand for our offerings and thus our financial performance.
We are dependent on financially viable national posts in the geographic markets where we operate, particularly in the United States. A significant portion of our revenue depends upon the ability of these posts, especially the USPS, to provide reliable, competitive mail and package delivery services to our clients. Their ability to provide high quality reliable service at affordable rates relates to their ongoing financial strength. The USPS and other national posts continue to face financial challenges which could lead to changes in governance models. If these challenges or changes interfere with these posts’ ability to provide the services they currently provide, our financial performance may be adversely affected.
We are subject to postal regulations and processes, which could adversely affect our financial performance.
A significant portion of our business is subject to regulation and oversight by the USPS, posts in other major markets, and the governmental bodies that regulate the posts themselves. These postal authorities have the power to regulate some of our current products and services and to establish guidelines for postage rates. They also must approve many of our new product and service offerings before we can bring them to market. If new product and service offerings are not approved or there are significant conditions to approval, our ability to grow the business and in turn, our financial performance, could be adversely affected. Additionally, if favorable postage rates are reversed, regulations on existing products, rates or services are changed, legal or regulatory changes cause posts to change their operating models in a way that disadvantages our business, posts utilize their position in the market or their role as product regulator to limit competition in areas where the posts themselves offer solutions, or if we fall out of compliance with the posts’ regulations, our financial performance could be adversely affected.
If we are not able to respond to the continuing decline in the volume of physical mail delivered via traditional postal services, our financial performance could be adversely affected.
Continuing declines in traditional mail volumes impact our financial results. An accelerated or sudden decline in mail volumes could result from one or more of the following factors: changes in communication technologies and their use; changes in frequency and quality of mail delivery from national posts; changes in law that favor alternative means of communication, burden mail, or limit how the mail may be used; significant rate increases; or other external events affecting physical mail delivery. If we are not successful at meeting the continuing challenges faced in our mailing business, or if physical mail volumes experience an accelerated or sudden decline, our financial performance could be adversely affected.
Our ability to compete in the shipping market in the United States depends upon certain contractual relationships we have with the USPS and other carriers, as well as their service.
Our SendTech Solutions offerings depend upon certain contractual relationships with the USPS and other carriers to enable us to offer these services profitably. Should the USPS or other carriers make changes to how they contract with us for our solutions, our profitability could be adversely affected.
Business Operational Risks
The markets for our products and services are highly competitive.
SendTech Solutions faces competition from other mail equipment and solutions providers, companies that offer products and services as alternative means of message communications and those that offer online shipping and mailing products and services solutions. SendTech Solutions’ digital shipping business competes with technology providers ranging from large, established companies and national posts to smaller companies offering negotiated carrier rates. In addition, our financing operations face competition, in varying degrees, from large, diversified financial institutions, leasing companies, commercial finance companies, commercial banks and smaller specialized firms. Presort Services faces competition from regional and local presort providers, cooperatives of multiple local presort providers, consolidators and service bureaus that offer presort solutions as part of a larger bundle of outsourcing services and large volume mailers that have sufficient volumes and the capability to presort their own mailings in-house and could use excess capacity to offer presort services to others. We compete on the basis of a variety of factors, including price and the breadth and quality of our products and services. If we are not able to differentiate ourselves from our competitors or effectively compete with them, we may lose clients and the financial results of these segments may be adversely affected.
7
If we fail to effectively manage our third party suppliers, or if their ability to perform were negatively impacted, our business, financial performance and reputation could be adversely affected.
SendTech Solutions operations rely on third party suppliers for services and components for our mailing equipment, spare parts, supplies and services and for the hosting of our SaaS offerings. Presort Services relies on third party suppliers to help equip our facilities, provide warehouse support and assist with logistical operations. In certain instances, we rely on single-sourced or limited-sourced suppliers around the world because of advantages in quality, price or lack of alternative sources. Like many other companies, we and our suppliers have experienced interruptions, delays and increased supply costs in the past, due to, among other things, volatility in the semiconductor industry, threats of strikes, rising inflation, tariffs and geopolitical instability. If we experience supply chain constraints in the future or these constraints were to worsen, or if other unknown events cause our suppliers to not be able to provide their services, components or equipment to us in a timely and cost-effective manner, and we were not able to find alternate suppliers, we could lose clients, incur significant disruptions in manufacturing and operations and increased costs.
Fluctuations in transportation costs or disruptions to transportation services in Presort Services could adversely affect client satisfaction or our financial performance.
In addition to our reliance on the USPS, Presort Services relies upon third party transportation service providers to transport a significant portion of our mail volumes. The use of these providers is subject to risks, including our ability to negotiate acceptable terms due to, increased competition during peak periods, capacity issues, increased fuel costs, labor shortages, performance problems, extreme weather, natural or man-made disasters, pandemics, or other unforeseen difficulties. Given our reliance upon these providers, any unforeseen disruptions affecting the availability of these services or any dramatic increase in the cost of these services (each of which we have experienced, at times), could adversely affect client satisfaction and our financial performance.
Our business depends on our ability to attract, retain, and engage with, employees at a reasonable cost to meet the needs of our business and to consistently deliver highly differentiated, competitive offerings.
During the second half of 2025, we approved a voluntary, early retirement initiative in the U.S. and a globally targeted, involuntary restructuring initiative (together, the “2025 Plan”). Such actions may cause us to experience a loss of continuity, experience and institutional knowledge, a reduction in productivity and efficiency, the unexpected loss of key employees and/or other retention issues during transitional periods. Such actions may also make it more difficult to attract and retain qualified employees.
There is also significant competition for the talent needed for research and development of new products and services and talent needed to sell and service our other products and services within all our business units.
At times, Presort Services has experienced increased demand and competition for labor, driving up costs. We supplement our workforce with contingent hourly workers from staffing agencies on an as-needed basis; however, if we experience labor shortages, and are unable to attract and utilize contingent workers, or if our staffing agencies terminate their relationship with us and we cannot find alternative providers, we could incur higher costs and our operations could be adversely affected. Moreover, given the nature of our Presort Services employee base, if we cannot continue to maintain good relationships, we could experience increased employee dissatisfaction and turnover, which could result in increased operating costs and reduced operational flexibility.
If we fail to comply with government contracting regulations, our financial performance, brand name and reputation could suffer.
We have a significant number of contracts with governmental entities. Government contracts are subject to extensive and complex procurement laws and regulations, along with regular audits and investigations by government agencies. If we were subjected to a claim of contractual noncompliance by a government agency and were found noncompliant, then we could be subject to various civil or criminal penalties and administrative sanctions, which could include the termination of the contract, reimbursement of payments received, fines and debarment from doing business with other government agencies. Any of these events could not only affect our financial performance, but also adversely affect our brand and reputation.
Difficulty in obtaining and protecting our intellectual property, and the risk of infringement claims by others may negatively impact our financial performance.
Our business success depends in part upon protecting our intellectual property rights, including proprietary technology developed (internally or by third party partners and subcontractors) or obtained through acquisitions. We rely on copyrights, patents, trademarks, trade secrets and other intellectual property laws to establish and protect our proprietary rights. If we are unable to protect our intellectual property rights, our competitive position may suffer, which could adversely affect our revenue and profitability. The continued evolution of patent law and the nature of our innovation work may affect the number of patents we are able to receive for our development efforts. As we continue to transition our business to more software and service-based offerings, patent protection of these innovations will be more difficult to obtain. As a result, we will rely more on copyrights and, when appropriate, trade secret protection for those software and service-based offerings. In addition, from time to time, third parties may claim that we, our clients, or our suppliers, have infringed their intellectual property rights. Although third parties also face the same difficulties in patenting software and service-based offerings, these claims, if successful, may require us to redesign affected products, enter into costly settlement or license agreements, pay damage awards, or face a temporary or permanent injunction prohibiting us from marketing or selling certain products.
8
Our capital investments to develop new products and offerings may not yield the anticipated benefits.
We make significant capital investments in new products and services to meet the evolving needs of our customers, improve and grow our business and remain competitive. If we are not successful in these new product or service introductions, or if our past capital investments do not yield the results anticipated when making the investments, there may be an adverse effect on our financial performance.
We are subject to risks relating to claims arising from the Ecommerce Restructuring and related transactions.
On August 8, 2024, we entered into a series of transactions designed to facilitate an orderly wind-down of a majority of our Global Ecommerce reporting segment, including the sale of 81% of the voting interests of DRF Logistics, LLC (“DRF Logistics”), which owned a majority of the Global Ecommerce segment’s net assets and operations (the “GEC Sale”). Following the GEC Sale, DRF Logistics and DRF LLC, a subsidiary of DRF Logistics (together, the “Ecommerce Debtors”), at the direction of their own governing bodies, filed voluntary petitions to commence Chapter 11 bankruptcy cases. We refer to the GEC Sale, the Chapter 11 cases and any associated transactions collectively as the “Ecommerce Restructuring.” On November 25, 2024, the Bankruptcy Court entered an order confirming the liquidation plan, and the timely and orderly wind-down of the Ecommerce Debtors is ongoing. Risks and uncertainties may continue to be associated with the Ecommerce Restructuring, including, among others, continuing claims asserted against the Company or its affiliates related to the Ecommerce Restructuring as described in Part I, Item 3, “Legal Proceedings.”
Changes within our senior management and our Board of Directors could create uncertainties and impact our business.
We have undergone recent changes in our senior management and in the composition of our Board of Directors. Leadership transitions may create continuity risks and operational challenges and could adversely affect our ability to execute our strategy. These changes also may create uncertainty among investors, customers, employees, and other stakeholders regarding our future direction and performance, and could make it more difficult to attract and retain qualified personnel. Our senior management team is focused on initiatives to strengthen our business and improve long-term value for our shareholders. If we fail to effectively implement any of these initiatives or to do so on a timely basis, our business, results of operations, financial condition and cash flows could be adversely affected.
Cybersecurity and Technology Risks
Our financial performance and our reputation could be adversely affected, and we could be subject to legal liability or regulatory enforcement actions, if we or our suppliers are unable to protect against, or effectively respond to, cyberattacks or other cybersecurity incidents.
We depend on the security and integrity of our information technology systems and those of certain third-party service providers and suppliers to support numerous business processes and activities, to service our clients, and to enable consumer transactions and postal services. There are numerous cybersecurity risks to these systems, including, but not limited to, individual and group criminal hackers, industrial espionage, denial of service attacks, ransomware and malware attacks, attacks on the software supply chain, and employee errors and/or malfeasance, phishing and other social engineering attacks, credential theft, insider threats and exploitation of vulnerabilities in third-party software and systems. These cyber threats are diverse and constantly evolving, especially given the advances in, and the rise of the use of, artificial intelligence, thereby increasing the difficulty of preventing, detecting, and successfully defending against themand may be more difficult to detect and mitigate, including as threat actors use artificial intelligence and other advanced tools to enhance attacks and impersonation tactics. Successful cybersecurity breaches could, among other things, disrupt our operations or degrade service delivery or result in the unauthorized disclosure, theft and misuse of company, client, consumer and employee sensitive and confidential information, all of which could adversely affect our financial performance. Cybersecurity breaches could result in legal claims or proceedings, financial liability to other parties, governmental investigations, regulatory enforcement actions and penalties, and damage to our brand and reputation. Although we maintain insurance coverage relating to cybersecurity incidents, we may incur costs or financial losses that are either not insured against or not fully covered through our insurance and such insurance may be subject to exclusions, sub-limits and retentions and may become more expensive or less available on acceptable terms. We and certain of our suppliers have experienced cybersecurity incidents in the past, and may experience additional incidents in the future. Despite the implementation of our cybersecurity processes, our security measures cannot guarantee that a significant cyberattack will not occur or that we will be able to prevent, detect or respond to all incidents in a timely and effective manner. Our goal is to prevent meaningful incursions and minimize the overall impact of those that occur. For more information on how the Company handles cybersecurity, see Item 1C. Cybersecurity.
Failure to comply with data privacy and protection laws and regulations could subject us to legal liability and adversely affect our reputation and our financial performance.
Our businesses use, process, and store proprietary information and personal, sensitive, or confidential data relating to our business, clients, and employees. Privacy laws and similar regulations in many jurisdictions where we do business require that we take significant steps to safeguard that information, and these laws and regulations continue to evolve. The scope of the laws that may be applicable to us is often uncertain and may be conflicting, and the growth of our cloud-based services increases the scope and
9
complexity of laws that might apply. In addition, new laws may add an array of requirements on how we handle or use information and increase our compliance obligations. For example,India's Digital Personal Data Protection Act of 2023, and implemented rules notified in 2025, established a framework regulating the processing of digital personal data. The European Union’s Artificial Intelligence Act, which entered into force in August 2024, introduces additional requirements for certain AI systems and practices and will apply on a phased timeline, and may increase compliance obligations for organizations that develop, deploy or use AI-enabled tools. In the United States, a growing number of states have enacted different laws regarding personal information, privacy and artificial intelligence that impose significant new requirements on consumer personal information. In some instances (e.g., California), these laws also expand the definition of consumer personal information to include information related to employees and business contacts. Some of these state laws have established independent agencies with rule making and enforcement authority, whose initial guidance, actions, and regulations continue to evolve and may be adopted or become effective on a phased basis. Other countries or states have enacted and will continue to enact and amend laws or regulations in the future that have similar or additional requirements. Although we endeavor to continually monitor and assess the impact of these laws and regulations, and continually update our systems to protect our data and comply with these laws, their interpretation and enforcement are uncertain, subject to change, and may require substantial costs to monitor and implement. Failure to comply with data privacy and protection laws and regulations could also result in government enforcement actions (which could result in substantial civil and/or criminal penalties) and private litigation, which could adversely affect our reputation and financial performance.
If we or our third party service providers and suppliers encounter interruptions or difficulties in the operation of our cloud-based applications, our business could be disrupted, our reputation and relationships may be harmed, and our financial performance could be adversely affected.
Our business relies upon the continuous and uninterrupted performance of our cloud-based applications and systems and those of certain third-party service providers and suppliers to support numerous business processes, to service our clients and to support their transactions with their customers and postal services. Our applications and systems, and those of our third-party service providers and suppliers, may be subject to interruptions due to technological errors, system capacity constraints, software errors or defects, human errors, computer or communications failures, power loss, adverse acts of nature and other unexpected events. We have business continuity and disaster recovery plans in place designed to reduce the impact on our business operations in case of such events and we also require our suppliers to have the same .and, where appropriate, contractually obligate certain third-party service providers and suppliers to maintain similar plans. Nonetheless, there can be no guarantee that these plans will function as designed or will be sufficient to address all contingencies. If we are unable to limit interruptions or successfully correct them in a timely manner or at all, such interruptions could result in lost revenue, loss of critical data, significant expenditures of capital, a delay or loss in market acceptance of our services and damage to our reputation, brand and relationships, any of which could have an adverse effect on our business and our financial performance.
Macroeconomic and General Regulatory Risks
Periods of difficult economic conditions, other macroeconomic events, or a public health crisis could adversely affect our business.
Our operations and financial performance are impacted by economic conditions in the United States and the other countries where we and our clients do business. Any significant or perceived weakening of these economies, reduction in business confidence, change in business or consumer spending habits, concerns of a domestic or global recession, rising inflation or interest rates, limited availability of credit, or other macroeconomic events (including public health crises, severe weather events, government shutdowns or other disruptions in government operations), not within our control, may impact our clients’ businesses or reduce our clients’ demand for shipping and mailing products and services and thus, negatively affect our financial performance. These economic conditions, at times, have arisen and can arise suddenly, and the duration and full impact of such conditions can be difficult to predict, which could adversely impact our business, financial condition, and results of operations.
A significant decline in cash flows, changes in our credit ratings, capital market disruptions, noncompliance with any of our debt covenants, or significant withdrawals by depositors at the Bank, could adversely affect our ability to maintain adequate liquidity, provide competitive financing services and to fund various discretionary priorities.
We provide competitive finance offerings and fund discretionary priorities, such as capital investments, strategic acquisitions, dividend payments and share repurchases through a combination of cash generated from operations, and access to capital markets. Our ability to access U.S. capital markets and the associated cost of borrowing is dependent upon our credit ratings and is subject to capital market volatility. We maintain a revolving credit facility to provide funding as needed, however, our ability to borrow under this facility is subject to compliance with the covenants set forth in the credit agreement governing the revolving credit facility.
A significant decline in cash flows, or changes in our credit ratings, material capital market disruptions or noncompliance with any of our debt covenants that adversely affects our ability to access capital markets, could impact our ability to maintain adequate liquidity, continue to provide competitive finance offerings, repay or refinance maturing debt, and fund other strategic or discretionary activities, and adversely affect our operational and financial performance.
10
Changes in tax rates, laws or regulations could adversely impact our financial results.
We are subject to taxes in the U.S. and in the foreign jurisdictions where we do business. Due to continuing global fiscal challenges and political conditions, tax laws and enforcement approaches have been and may continue to be subject to significant change. Changes in tax laws may be on a prospective or retroactive basis and could have a material impact on our tax expense and cash flows. The Organization for Economic Co-operation and Development (OECD) has set forth a Two-Pillar Solution fundamentally overhauling the international tax rules. Pillar One focuses on reallocation of profits while Pillar Two applies a global minimum corporate tax. The OECD has issued Model Rules and ongoing administrative guidance to support implementation and coordination of these initiatives, and a number of jurisdictions have enacted or are implementing rules based on the OECD framework, including the Pillar Two global minimum tax. Although some jurisdictions have issued guidance or passed tax laws based on the OECD Model Rules, the final nature, timing and extent of any such tax reforms or other legislative or regulatory actions (including their scope, interpretation, implementation, enforcement and interaction with other jurisdictions’ rules) are evolving and it is difficult to assess their overall effect. These developments could increase our compliance and reporting obligations and, depending on the jurisdictions in which we operate and the interaction among applicable rules, could result in incremental tax expense (including “top-up” taxes), potential double taxation and adversely impact our financial results and cash flows. We continuously monitor developments and evaluate the impact these new rules are anticipated to have on our tax rate.
We are subject to tax audits in the various jurisdictions in which we operate. Given the complexity of the current and changing tax laws and regulations, tax authorities may disagree with certain positions we have taken and assess additional taxes. We regularly review the strength of our positions based on current law, court cases, rulings and proposed legislative changes to determine the appropriateness of our tax provision, however, there can be no assurance that we will accurately predict the outcomes of these audits, which could have a material impact on our effective tax rate and adversely impact our financial results and cash flows.
Our operations and financial performance may be negatively affected by changes in trade policies, tariffs and regulations.
In recent years, the United States increased tariffs for certain goods, which triggered other nations to also increase tariffs on certain of their goods. These increased tariffs resulted in additional costs on certain components used in SendTech products. In addition, there continues to be significant uncertainty about the future relationship between the United States and various other countries with respect to trade policies, treaties, tariffs, taxes, and other limitations on cross-border operations. Changes in tariffs, trade barriers, price and exchange controls and other regulatory requirements could have an adverse effect on our business, prospects, financial condition and operating results, the extent of which cannot be predicted with certainty at this time.
Our business could be negatively affected as a result of shareholder activism.
We value constructive input from investors and regularly engage with our stockholders regarding strategy and performance. Our Board of Directors and management team are committed to acting in the best interests of all our stockholders; however, there is no assurance that the results of actions taken by our Board of Directors and management team will be successful.
We have been and may continue to be subject to shareholder activism in the future.Such activism or perceived uncertainties as to our future direction could adversely affect our results of operations and financial condition, as well as the market performance of our securities, including fluctuations in our stock price based on temporary or speculative market perceptions or other factors that do not necessarily reflect the underlying fundamentals and prospects of our business.
We also face evolving and diverging requirements and expectations from investors, regulators, customers and other stakeholders across the jurisdictions in which we operate, including on environmental, social, governance and sustainability matters. Any actual or perceived failure to meet any expectations of our key stakeholders, including any regulatory requirements or expectations, could expose us to legal, operational and reputational risks, which could negatively impact our business.
Our indebtedness and the terms of our debt agreements could limit our financial and operating flexibility and adversely affect our
Business.
As of December 31, 2025, we had total debt of approximately $2 billion. Our debt service obligations could require us to dedicate a portion of our cash flows from operations to interest and principal payments. This could reduce the funds available to support operations, capital expenditures, and strategic initiatives and could increase our vulnerability to adverse business, industry, or economic conditions.
In addition, the agreements governing our indebtedness contain financial covenants and other restrictions that may limit our ability to take actions that could be in our best interests, including limitations on incurring additional indebtedness, granting liens, making certain investments, selling assets, entering into certain strategic transactions, or making certain restricted payments. For example, under our senior secured credit agreement, we are required to satisfy quarterly tested maintenance covenants, including a minimum interest coverage ratio and maximum secured net leverage and total net leverage ratios. Our ability to comply with these covenants and restrictions may be affected by events beyond our control. If we fail to comply, we may be required to seek waivers or amendments, which may not be available on acceptable terms, and a default could result in acceleration of amounts due and other remedies (including pursuant to any cross-default or cross-acceleration provisions).
We may need to refinance, redeem, or repay indebtedness as it matures (or in certain circumstances earlier than scheduled), and we
11
cannot guarantee that we will be able to do so on acceptable terms, or at all. In particular, our senior secured credit agreement contains provisions pursuant to which, if the notes due March 2027 have not been redeemed in full by specified dates and liquidity falls below
specified levels, certain of our term loans and any borrowings under our revolving credit facility could become due earlier than their
stated maturities. Further, a portion of our indebtedness bears interest at variable rates and increases in interest rates could increase our borrowing costs and adversely affect our cash flows.
The conditional conversion feature of the Convertible Notes, if triggered, may adversely affect our financial condition and operating results.
In the event the conditional conversion feature of the Convertible Notes is triggered, holders of Convertible Notes will be entitled to convert the Convertible Notes at any time during specified periods at their option. If one or more holders elect to convert their Convertible Notes, the conversion would be settled through the payment of cash, which could adversely affect our liquidity. In addition, even if holders do not elect to convert their Convertible Notes, we could be required to reclassify all or a portion of the outstanding principal of the Convertible Notes as a current rather than long-term liability, which could result in a reduction of our net working capital.
Certain provisions in the Indenture governing the Convertible Notes could delay or prevent an otherwise beneficial takeover or takeover attempt of us.
Certain provisions in the Convertible Notes and the Indenture could make it more difficult or expensive for a third party to acquire us. For example, if an attempted acquisition constitutes a fundamental change, holders of the Convertible Notes will have the right to require us to repurchase their Convertible Notes in cash. In addition, if an attempted acquisition constitutes a make-whole fundamental change, we may be required to increase the conversion rate for holders who convert their Convertible Notes. In either case, our obligations under the Convertible Notes and the Indenture could increase the cost of acquiring us or otherwise discourage a third party from acquiring us, including in a transaction that holders of the Convertible Notes or holders of our common stock may view as favorable.
The Capped Call Transactions may affect the value of the Convertible Notes and the market price of our common stock.
In connection with the pricing of the Convertible Notes, we entered into privately negotiated Capped Call Transactions with the option counterparties. The Capped Call Transactions are expected to reduce potential dilution to our common stock upon conversion of any Convertible Notes, with such reduction subject to a cap. If the market price per share of our common stock, as measured under the terms of the Capped Call Transactions, exceeds the cap price of the Capped Call Transactions, there would nevertheless be dilution to the extent that such market price exceeds the cap price of the Capped Call Transactions. In addition, to the extent any observation period for any Convertible Notes does not correspond to the period during which the market price of our common stock is measured under the terms of the Capped Call Transactions, there could also be dilution and/or a reduced offset of any such cash payments as a result of the different measurement periods.
The option counterparties or their respective affiliates may modify their hedge positions by entering into or unwinding various derivatives with respect to our common stock and/or purchasing or selling our common stock or other securities of ours in secondary market transactions following the pricing of the Convertible Notes and prior to the maturity of the Convertible Notes (and may do so on each exercise date for the Capped Call Transactions or following any termination of any portion of the Capped Call Transactions in connection with any repurchase, redemption or early conversion of the Convertible Notes). This activity could also cause an increase or a decrease in the market price of our common stock or the Convertible Notes, which could affect holders’ ability to convert the Convertible Notes and, to the extent the activity occurs following conversion or during any observation period related to a conversion of Convertible Notes, it could affect the amount and value of the consideration that holders will receive upon conversion of such Convertible Notes.
We are subject to counterparty risk with respect to the Capped Call Transactions.
The option counterparties are financial institutions, and we are subject to the risk that any or all of them might default under the Capped Call Transactions. Our exposure to the credit risk of the option counterparties will not be secured by any collateral. Global economic conditions from time to time have resulted in the actual or perceived failure or financial difficulties of many financial institutions. If an option counterparty were to default under the Capped Call Transactions, we would become an unsecured creditor with a claim equal to our exposure at that time under the Capped Call Transactions with such option counterparty. Our exposure will depend on many factors but, generally, an increase in our exposure will be correlated to an increase in the market price and in the volatility of our common stock. In addition, upon a default by an option counterparty, we may suffer adverse tax consequences and more dilution than we currently anticipate with respect to our common stock. We can provide no assurance as to the financial stability or viability of the option counterparties.
ITEM 1B. UNRESOLVED STAFF COMMENTS
None.
12
ITEM 1C. CYBERSECURITY
A comprehensive cybersecurity program is critical to achieving our business goals. Like all companies in today’s world, we face a multitude of cybersecurity threats that range from ransomware, and denial-of-service, to attacks from more advanced nation state actors, and even insider threats. Likewise, our customers, suppliers, subcontractors and partners face similar cybersecurity threats, and a cybersecurity incident impacting us or any of these entities could materially adversely affect our business operations and financial performance. These cybersecurity threats and related risks make it imperative that we expend considerable resources to safeguard our organization’s assets and to prevent service disruptions or minimize the impact should an incident occur. Our processes for assessing, identifying, and managing material risks from cybersecurity threats are described below.
The Audit Committee of the Board of Directors oversees the Company's cybersecurity risk management program, including management’s processes for identifying and mitigating risks, including cybersecurity risks, to help align our risk exposure with our strategic objectives.Senior technology leadership, including our Senior Vice President of IT and Security, briefs the Audit Committee and the full Board of Directors on our cybersecurity and information security posture on a regular cadence. In addition to this regular reporting, cybersecurity risks or threats may also be escalated to the Audit Committee on an as-needed basis. In the event of an incident, we strive to follow our detailed incident response playbook, which outlines the steps to be taken from incident detection to mitigation, recovery, escalation to senior management, the Board of Directors, and functional areas, and notification to customers and employees as appropriate.
Our information security organization is led by the Senior Vice President of IT and Security, who is responsible for our overall information security strategy, policy, security engineering, product security, operations and cybersecurity threat detection and response.The Senior Vice President of IT and Security has more than 33 years of experience serving in various information technology roles. The information security organization manages and continually enhances an enterprise security structure with the goal of preventing cybersecurity incidents to the extent feasible, while simultaneously increasing our system and product resilience in an effort to minimize the business impact should an incident occur. Our cybersecurity program attempts to follow the National Institute of Standards and Technology (NIST) Cybersecurity Framework principles. We also seek to maintain certain ISO certification and obtain AICPA SOC2 reports for certain of our systems and products. We have adopted a risk-based management process to define, manage, and prioritize controls required to maintain the confidentiality, integrity and availability of our digital assets. Employees outside of our information security organization also have a role in our cybersecurity defenses and are required to receive periodic cybersecurity training, which we believe improves our overall cybersecurity posture.
We have also extended our cybersecurity governance to our operational business executives. Technical leadership periodically presents an assessment of mission critical information assets, those that would cause significant business, customer, or employee impact to the appropriate senior management executives. This is a formal assessment which describes the underlying cyber posture, mitigation plan, and commitments. It ensures that the cybersecurity program in the business unit is progressing against its goals and new risks are operationally prioritized. In addition, the Senior Vice President of IT and Security meets with leaders from the Company's legal, IT, and internal audit organizations to ensure alignment with privacy, regulations, legal compliance and audit plans.
We rely heavily on third party partners (i.e. suppliers, subcontractors, consultants, etc.) to support our products, business operations and technology services, and a cybersecurity incident at a partner could materially adversely impact us. Where possible, we include information security provisions, audit rights and insurance requirements, in contracts with these partners based on their level of access to our systems and data. For our most critical partners, where possible, we attempt to pursue an annual attestation of ongoing compliance to our standard policies and practices. For select partners, we engage third party cybersecurity monitoring and alerting services, and seek to work directly with those partners to address potential deficiencies identified.
Given the constantly evolving cyber-threat landscape, we continuously test and evolve our cybersecurity program. We engage internal security team experts who perform ‘ethical hacking’ against our information assets to uncover risks. As part of its risk based annual audit plan, our internal audit team reviews a number of components of our information technology operations, which taken together, comprise our cybersecurity defenses. A report of its findings is distributed to certain members of management and completion of the auditor's comments is tracked and reported up to the Audit Committee. We also engage third party service providers to conduct evaluations of our security controls, whether through penetration testing, independent audits or consulting on best practices to address new challenges. These evaluations include testing both the design and operational effectiveness of security controls.
Assessing, identifying, and managing cybersecurity related risks are integrated into our overall enterprise risk management (ERM) process. Cybersecurity related risks are included in the risk universe that our ERM process evaluates to assess top risks to the enterprise on an annual basis. To the extent the ERM process identifies a heightened cybersecurity related risk, risk owners are assigned to develop risk mitigation plans, which are then tracked to completion. The ERM process annual risk assessment is presented to the Audit Committee.
As of the date of this report, we have not identified any cybersecurity threats or incidents that have materially affected or are reasonably likely to materially affect the Company. We and certain of our service providers have experienced cyberattacks and attempted cyberattacks in the past, which we believe have thus far been mitigated by preventative, detective, and responsive measures put in place. Notwithstanding the cybersecurity protections we have in place, we may not be successful in preventing or mitigating a cybersecurity incident that could have a material adverse effect on us. See Item 1A. “Risk Factors” for a discussion of cybersecurity risks.
13
ITEM 2. PROPERTIES
We lease numerous facilities worldwide, including administrative offices, mail sortation facilities, service locations, data centers and call centers. We conduct our research and development activities in facilities located in Noida and Pune, India and Shelton, Connecticut. Effective January 1, 2026, we relocated our corporate headquarters to Shelton, Connecticut.
Presort Services conducts mail sortation operations through a network of 34 operating centers throughout the United States. SendTech Solutions leases a manufacturing and distribution facility in Indiana. This facility is significant as it stores a majority of the SendTech Solutions products, supplies and inventories.
Should any facility be unable to function as intended for an extended period of time, our ability to service our clients and operating results could be impacted. Management believes that our facilities are in good operating condition, materially utilized and adequate for our current business needs.
ITEM 3. LEGAL PROCEEDINGS
See Note 16 Commitments and Contingencies to the Consolidated Financial Statements for additional information.
ITEM 4. MINE SAFETY DISCLOSURES
Not applicable.
14
PART II
ITEM 5. MARKET FOR THE COMPANY'S COMMON EQUITY, RELATED STOCKHOLDER MATTERS AND ISSUER PURCHASES OF EQUITY SECURITIES
Our common stock is principally traded on the New York Stock Exchange (NYSE) under the symbol "PBI". At January 31, 2026, we had 10,580 common stockholders of record.
Dividends and Share Repurchases
During 2025, we paid quarterly dividends totaling $51 million, or $0.30 per share. We expect to continue to pay a quarterly dividend; however, the Board of Directors may decide to increase, decrease or not approve the payment of a dividend at any time.
Throughout 2025, the Board of Directors authorized a new $500 million share repurchase program. On February 16, 2026, the Board of Directors authorized an increase to the share repurchase program of $250 million. Subject to limitations in our New Credit Agreement (as defined below), common stock repurchases may be made from time to time in open market or private transactions in such manner as may be deemed advisable from time to time (including, without limitation, pursuant to one or more 10b5-1 trading plans, accelerated share repurchase programs, and any other method that the Company may deem advisable) and may be discontinued at any time. The following table provides information about common stock purchases during the three months ended December 31, 2025:
Total number of shares purchased
Average price paid per share
Total number of shares purchased as part of publicly announced plans or programs
Approximate dollar value of shares that may yet be purchased under the plans or programs (in thousands)
Beginning balance
$148,226
October 2025
3,203,100
$
11.30
3,203,100
$212,031
November 2025
7,926,090
$
9.52
7,926,090
$136,553
December 2025
1,484,407
$
10.05
1,484,407
$121,639
12,613,597
$
10.04
12,613,597
During 2025, we purchased 35,853,442 shares at an aggregate cost of $378 million. From January 1, 2026 through February 13, 2026 we purchased an aggregate additional 1,204,679 shares at a cost of $12 million.
15
Stock Performance Graph
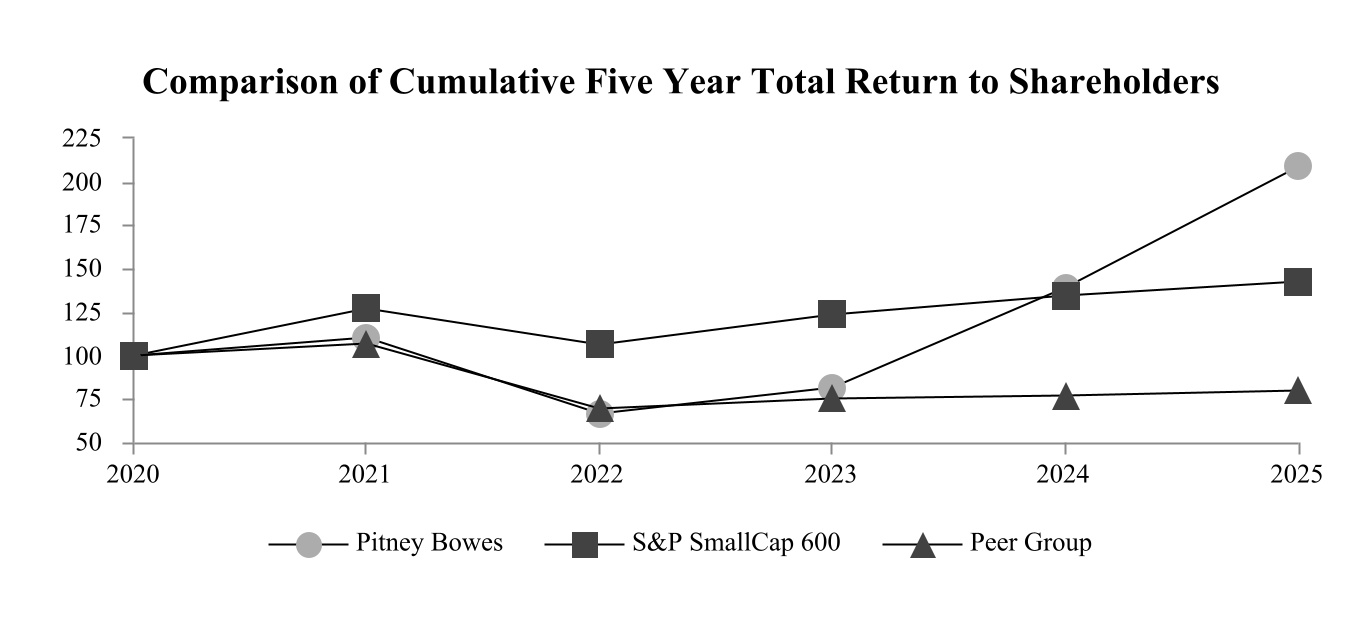
Our peer group is comprised of: ACCO Brands Corporation, Bread Financial Holdings, Inc., Cimpress plc, CSG Systems International, Inc., Deluxe Corporation, Diebold Nixdorf, Incorporated, E2open Parent Holdings, Inc., HNI Corporation, Matthews International Corporation, McGrath RentCorp, Quad/Graphics, Inc., Sabre Corporation, TTEC Holdings, Inc. and Unisys Corporation.
The accompanying graph shows the annual change in the value of a $100 investment in Pitney Bowes Inc., the Standard and Poor's (S&P) SmallCap 600 Composite Index and a peer group over a five-year period assuming the reinvestment of dividends. The composition of our peer group is developed by our Compensation Committee based on recommendations from their independent compensation consultant.
The above graph was determined by an independent third party. On a total return basis, a $100 investment on December 31, 2020, in Pitney Bowes Inc., the S&P SmallCap 600 Composite Index and our peer group would have been worth $209, $142 and $80, respectively, on December 31, 2025.
Total return for the S&P SmallCap 600 Composite Index and our peer group is based on market capitalization, weighted for each year. The stock price performance is not necessarily indicative of future stock price performance.
ITEM 6. [RESERVED]
16
ITEM 7. MANAGEMENT'S DISCUSSION AND ANALYSIS OF FINANCIAL CONDITION AND RESULTS OF
OPERATIONS
The following discussion of our financial condition and operating results should be read in conjunction with our risk factors, consolidated financial statements and related notes. This discussion includes forward-looking statements based on management's current expectations, estimates and projections and involves risks and uncertainties. Actual results may differ significantly from those currently expressed. A detailed discussion of risks and uncertainties that could cause actual results to differ materially from such forward-looking statements is outlined under "Forward-Looking Statements" and "Item 1A. Risk Factors" in this Form 10-K. All table amounts are presented in thousands of dollars.
RESULTS OF OPERATIONS
Years Ended December 31,
Favorable/(Unfavorable)
2025
2024
Actual % Change
Total revenue
$
1,892,629
$
2,026,598
(7)
%
Total cost of revenue
868,767
964,298
10
%
Selling, general and administrative
621,567
717,894
13
%
Research and development
15,278
31,957
52
%
Restructuring charges
58,660
76,915
24
%
Interest expense, net
101,460
110,094
8
%
Other components of net pension and postretirement cost
7,543
89,044
92
%
Other expense
26,830
88,723
70
%
Income (loss) from continuing operations before income taxes
192,524
(52,327)
>100%
Provision (benefit) for income taxes
47,827
(154,829)
>(100%)
Income from continuing operations
144,697
102,502
41
%
Loss from discontinued operations, net of tax
—
(306,099)
100
%
Net income (loss)
$
144,697
$
(203,597)
>100%
Years Ended December 31,
Favorable/(Unfavorable)
2024
2023
Actual % Change
Total revenue
$
2,026,598
$
2,078,925
(3)
%
Total cost of revenue
964,298
1,048,315
8
%
Selling, general and administrative
717,894
781,609
8
%
Research and development
31,957
29,486
(8)
%
Restructuring charges
76,915
52,412
(47)
%
Goodwill impairment
—
123,574
100
%
Interest expense, net
110,094
98,769
(11)
%
Other components of net pension and postretirement cost
89,044
(8,256)
>(100%)
Other expense (income)
88,723
(3,064)
>(100%)
Loss from continuing operations before income taxes
(52,327)
(43,920)
(19)
%
(Benefit) provision for income taxes
(154,829)
17,347
>100%
Income (loss) from continuing operations
102,502
(61,267)
>100%
Loss from discontinued operations, net of tax
(306,099)
(324,360)
6
%
Net loss
$
(203,597)
$
(385,627)
47
%
Refer to Segment Results and Consolidated Expenses sections for detailed information.
17
CHANGES IN REPORTING
We recast our reporting presentation of revenue and cost of revenue to better align with our offerings. We now report Services revenue and Cost of services, which includes the previously reported Business services and Support services, Products revenue and Cost of products, which includes the previously reported Equipment sales and Supplies, and Financing and other revenue and Cost of financing and other, which includes the previously reported Financing and Rentals.
We recast our corporate expense allocation methodology to allocate all marketing and innovation expenses to our SendTech Solutions segment due to a change in how these functions are now managed.
We recast our segment reporting to report the revenue and related expenses of a cross-border services contract in our SendTech Solutions reporting segment, which was previously reported in Other operations.
Prior periods presented in this Form 10-K have been recast to conform to the current period presentation.
SEGMENT RESULTS
We operate in two segments: SendTech Solutions and Presort Services. Management measures segment profitability and performance as segment revenues less the related costs and expenses attributable to the segment. Segment results exclude interest, taxes, corporate expenses, restructuring charges and other items not allocated to the segments.
In the Consolidated Statements of Operations, we allocate a portion of total interest expense to finance interest expense, included in Cost of financing and other. For segment reporting, we exclude the allocated finance interest expense from the determination of adjusted segment EBIT.
SendTech Solutions
SendTech Solutions provides clients with physical and digital shipping and mailing technology solutions and other applications to help simplify and save on the sending, tracking and receiving of letters, parcels and flats, as well as supplies and maintenance services for these offerings. We offer financing alternatives that enable clients to finance Company and other manufacturers' equipment and product purchases, a revolving credit solution that allows clients to make meter rental payments and purchase postage, services and supplies, an interest-bearing deposit solution to clients that prefer to prepay postage and meet working capital needs.
Financial performance for the SendTech Solutions segment was as follows:
Years Ended December 31,
Favorable/(Unfavorable)
2025
2024
% change
Services
$
569,403
$
588,046
(3)
%
Products
364,709
430,845
(15)
%
Financing and other
321,889
335,141
(4)
%
Total revenue
1,256,001
1,354,032
(7)
%
Cost of services
196,143
218,108
10
%
Cost of products
212,366
244,203
13
%
Cost of financing and other
13,807
17,461
21
%
Total costs of revenue
422,316
479,772
12
%
Gross margin
833,685
874,260
(5)
%
Gross margin %
66.4
%
64.6
%
Selling, general and administrative
398,230
461,737
14
%
Research and development
15,968
29,883
47
%
Other components of pension and post retirement costs
7,298
(2,111)
>(100%)
Adjusted Segment EBIT
$
412,189
$
384,751
7
%
SendTech Solutions revenue decreased $98 million in 2025 compared to 2024. Products revenue declined $66 million primarily due to customers opting to extend leases of their existing advanced-technology equipment rather than purchase new equipment, the impact of
18
the prior year product migration and a significant deal in the prior year. Services revenue declined $19 million primarily due to the declining meter population. Financing and other revenue declined $13 million driven by the impact of the prior year product migration and mix of business. Revenue in 2025 includes an unfavorable adjustment of $4 million related to prior periods (see Note 1 to the Consolidated Financial Statements for further information).
Gross margin declined $41 million compared to the prior year. The impact of lower revenue was partially offset by headcount reductions and other cost savings initiatives resulting in an increase in gross margin percentage to 66.4% from 64.6%.
Selling, general and administrative ("SG&A") expense declined $64 million and research and development ("R&D") expense declined $14 million, primarily driven by lower employee-related expenses and overall cost savings initiatives.
Adjusted segment EBIT was $412 million in 2025, which includes the $4 million charge from the unfavorable revenue adjustment related to prior periods compared to $385 million for the prior year.
Years Ended December 31,
Favorable/(Unfavorable)
2024
2023
% change
Services
$
588,046
$
595,319
(1)
%
Products
430,845
471,448
(9)
%
Financing and other
335,141
339,097
(1)
%
Total revenue
1,354,032
1,405,864
(4)
%
Cost of services
218,108
232,975
6
%
Cost of products
244,203
265,360
8
%
Cost of financing and other
17,461
19,407
10
%
Total costs of revenue
479,772
517,742
7
%
Gross margin
874,260
888,122
(2)
%
Gross margin %
64.6
%
63.2
%
Selling, general and administrative
461,737
485,080
5
%
Research and development
29,883
29,905
—
%
Other components of pension and post retirement costs
(2,111)
(2,245)
(6)
%
Adjusted Segment EBIT
$
384,751
$
375,382
2
%
SendTech Solutions revenue decreased $52 million in 2024 compared to 2023. Products revenue declined $41 million primarily due to customers opting to extend leases of their existing advanced-technology equipment rather than purchase new equipment. Services revenue declined $7 million primarily due to the declining meter population and continuing shift to cloud-enabled products, which was partially offset by an increase in our shipping subscriptions, including enterprise subscriptions and growth in digital delivery services due to client mix.
Gross margin declined $14 million primarily due to the decline in revenue; however, gross margin percentage increased to 64.6% from 63.2% compared to the prior year. The increase in gross margin percentage was primarily driven by improvements in gross margin due to growth in enterprise shipping subscriptions and digital delivery services.
SG&A expense declined $23 million, primarily driven by lower employee-related expenses of $17 million due to savings from the 2023 and 2024 Plans, lower credit loss provision of $4 million and lower expenses driven by overall cost savings initiatives, partially offset by higher professional and outsourcing fees of $13 million.
Adjusted segment EBIT was $385 million in 2024 compared to $375 million in 2023.
19
Presort Services
Presort Services is the largest workshare partner of the USPS and national outsource provider of mail sortation services that allow clients to qualify large volumes of First Class Mail, First Class Flats, Marketing Mail, and Marketing Mail Flats/Bound Printed Matter for postal worksharing discounts.
Financial performance for the Presort Services segment was as follows:
Years Ended December 31,
Favorable/(Unfavorable)
2025
2024
% Change
Services
$
636,628
$
662,587
(4)
%
Cost of services
398,771
417,741
5
%
Gross Margin
237,857
244,846
(3)
%
Gross Margin %
37.4
%
37.0
%
Selling, general and administrative
72,391
78,860
8
%
Other components of net pension and postretirement cost
189
202
6
%
Adjusted segment EBIT
$
165,277
$
165,784
—
%
Revenue decreased $26 million in 2025 compared to 2024 primarily due to a 7% decline in total mail volumes driven by client losses and a broader market decline, partially mitigated by pricing actions. The processing of First Class Mail and First Class Flats, Marketing Mail Flats/Bound Printed Matter and Marketing Mail contributed revenue decreases of $15 million, $6 million and $5 million, respectively. Prior year revenue includes a $5 million favorable adjustment related to prior periods. See Note 1 to the Consolidated Financial Statements for more information.
Gross margin decreased $7 million compared to the prior year primarily due to the decline in revenue, partially offset by a $5 million favorable cost adjustment related to prior periods (see Note 1 to the Consolidated Financial Statements for further information). Gross margin percentage increased slightly to 37.4% from 37.0%.
SG&A expense declined $6 million compared to the prior year driven primarily by lower credit loss provision of $2 million, lower employee related expenses of $2 million and overall cost savings initiatives.
Adjusted segment EBIT was $165 million in 2025 compared to $166 million in 2024.
Years Ended December 31,
Favorable/(Unfavorable)
2024
2023
% Change
Services
$
662,587
$
617,599
7
%
Cost of services
417,741
432,229
3
%
Gross Margin
244,846
185,370
32
%
Gross Margin %
37.0
%
30.0
%
Selling, general and administrative
78,860
74,230
(6)
%
Other components of net pension and postretirement costs
202
228
11
%
Adjusted segment EBIT
$
165,784
$
110,912
49
%
Revenue increased $45 million in 2024 compared to 2023 primarily due to pricing actions and product mix. The processing of First Class Mail and First Class Flats and Marketing Mail Flats/Bound Printed Matter contributed revenue increases of $40 million and $7 million, respectively, which was partially offset by a revenue decrease from Marketing Mail of $2 million. The revenue increase includes a $5 million favorable adjustment related to prior periods. Refer to Note 1 Basis of Presentation for further information.
20
Gross margin increased $59 million and gross margin percentage increased to 37.0% from 30.0% in the prior year primarily due to the increase in revenue, lower transportation costs of $5 million driven by lane optimization, cost savings as a result of the 2023 Plan, and the benefits from investments made in automation and higher-throughput sortation equipment.
SG&A expense increased $5 million compared to 2023 primarily due to higher credit loss provision of $3 million.
Adjusted segment EBIT was $166 million in 2024, including the $5 million benefit from the favorable revenue adjustment, compared to $111 million in 2023.
CORPORATE EXPENSES
The majority of operating expenses are recorded directly or allocated to our reportable segments. Operating expenses not recorded directly or allocated to our reportable segments are reported as corporate expenses. Corporate expenses primarily represents corporate administrative functions such as finance, human resources, legal and information technology.
Years Ended December 31,
Favorable/(Unfavorable)
2025
2024
Actual % change
Corporate expenses
$
116,173
$
152,503
24
%
Corporate expenses for 2025 decreased $36 million compared to the prior year primarily due to lower salary expense of $38 million driven by actions taken under the 2024 Plan and overall cost savings initiatives.
Years Ended December 31,
Favorable/(Unfavorable)
2024
2023
Actual % change
Corporate expenses
$
152,503
$
175,951
13
%
Corporate expenses for 2024 decreased $23 million compared to the prior year primarily due to lower salary expense of $22 million due to savings from the 2023 and 2024 Plans, lower professional and outsourcing fees of $12 million, non-cash foreign currency revaluation gains on intercompany loans of $8 million, lower insurance costs of $3 million and various other expense savings totaling approximately $15 million from cost savings initiatives. These cost savings were partially offset by higher variable compensation expense of $37 million.
CONSOLIDATED EXPENSES
SG&A Expense
SG&A expense decreased $96 million in 2025 compared to 2024 primarily due to lower employee-related expenses of $88 million driven by actions taken under our restructuring plans, lower professional and outsourcing fees of $28 million, lower insurance expense of $18 million and general cost savings initiatives, partially offset by higher non-cash foreign currency revaluation losses on intercompany loans of $32 million.
SG&A expense decreased $64 million in 2024 compared to 2023 primarily driven by lower employee-related costs of $10 million, due to lower salary expense of $40 million from headcount reductions partially offset by higher variable compensation of $33 million and a favorable impact of $16 million from the revaluation of intercompany loans. SG&A expense also benefited from overall cost savings initiatives that resulted in expense savings of approximately $38 million from savings in areas such as marketing, travel, real estate and insurance.
R&D Expense
R&D expense decreased $17 million in 2025 compared to 2024 primarily due to headcount reductions and general cost savings initiatives.
R&D expense increased $2 million in 2024 compared to 2023.
21
Restructuring charges
Restructuring charges decreased $18 million in 2025 compared to 2024. Employee severance charges decreased $25 million driven by the significant number of actions taken under the 2024 Plan in the prior year, partially offset by a $7 million abandonment charge in the current year related to the closure of our corporate office in Stamford, Connecticut. See Note 12 to the Consolidated Financial Statements for further information.
Restructuring charges increased $25 million in 2024 compared to 2023 primarily driven by actions taken under the 2023 and 2024 Plans.
Other components of net pension and postretirement cost
Other components of net pension and postretirement cost were $8 million, $89 million and a benefit of $8 million in 2025, 2024 and 2023, respectively. Other components of net pension and postretirement cost in 2024 includes a settlement charge of $91 million from a targeted campaign to offer lump sum settlements to vested participants. The amount of other components of net pension and postretirement cost recognized each year will vary based on actuarial assumptions and actual results of our pension plans. See Note 14 to the Consolidated Financial Statements for further information.
Other expense (income)
Other expense (income) declined $62 million in 2025 compared to 2024 primarily due to lower charges in connection with the Ecommerce Restructuring of $55 million and a $10 million prior year asset impairment, partially offset by a higher loss on the redemption/refinancing of debt of $3 million.
Other expense (income) increased $92 million in 2024 compared to 2023 due to $67 million of charges related to the Ecommerce Restructuring, a $14 million increase in debt redemption/refinancing costs and a $10 million asset impairment charge.
Income taxes
See Note 15 to the Consolidated Financial Statements for further information.
OUTLOOK
For 2026, we expect low to mid-single digit decline in revenue driven by the continued secular decline in mailing. We expect low single digit decline in EBIT and EBIT margin, primarily driven by expected competitive pricing pressures in Presort Services, partially offset by lower worldwide operating costs from previous and continued cost-cutting actions, including savings under the 2025 Plan. Lower interest costs and share repurchases are expected to benefit earnings per share and partially offset the impacts of lower EBIT.
Within SendTech Solutions, we intend to pursue strategies that will leverage the segment's strong position, customer base and current product and technology offerings to mitigate the secular downward pressures in the mailing industry.
Within Presort Services, we are focused on increasing volume growth by maintaining competitive pricing and pursuing strategic growth opportunities.
We will also continue to implement capital allocation strategies to opportunistically reduce debt and lower interest costs, return capital to our shareholders through share repurchases and dividends and pursue other long-term investment opportunities.
22
LIQUIDITY AND CAPITAL RESOURCES
Our ability to maintain adequate liquidity for our operations is dependent upon a number of factors, including our revenue and earnings, our ability to manage costs and improve productivity, our clients' ability to pay their balances on a timely basis and the impacts of changing macroeconomic and geopolitical conditions. At December 31, 2025 we had cash, cash equivalents and short-term investments of $297 million, which includes $44 million held at our foreign subsidiaries used to support the liquidity needs of those subsidiaries. At this time, we believe that existing cash and investments, cash generated from operations and borrowing capacity under our revolving credit facility will be sufficient to fund our cash needs for the next 12 months. Our future capital requirements will depend on many factors, including our strategic plans, investments and stock repurchase activity levels.
Cash Flow Summary
The change in cash and cash equivalents is as follows:
2025
2024
2023
Net cash from operating activities
$
383,257
$
229,170
$
80,091
Net cash from investing activities
(125,097)
(49,056)
(124,096)
Net cash from financing activities
(445,358)
(305,455)
(30,002)
Effect of exchange rate changes on cash and cash equivalents
2,359
(4,987)
5,731
Change in cash and cash equivalents
$
(184,839)
$
(130,328)
$
(68,276)
Operating activities
Cash flows from operating activities in 2025 improved $154 million compared to the prior year, which includes an improvement of $47 million related to discontinued operations. Excluding discontinued operations, cash flows from continuing operations improved $107 million driven primarily by changes in working capital.
Cash flows from operating activities in 2024 improved $149 million compared to the prior year driven primarily by a decline in finance receivables and lower payments of accounts payable and accrued liabilities. Cash flow from operations also benefited from lower cash outflows from discontinued operations of $107 million.
Investing activities
Cash flows from investing activities for 2025 declined $76 million compared to the prior year primarily due to higher investments in loan receivables of $52 million and lower cash from investment activities of $53 million. These declines were partially offset by higher cash under the DIP Facility of $26 million as we received reimbursements of $9 million in the current year compared to net disbursements of $17 million in the prior year.
Cash flows from investing activities for 2024 improved $75 million compared to the prior year primarily due to higher cash from investment activities of $40 million, lower investments in loan receivables of $20 million, lower cash outflows from discontinued operations of $17 million, and lower capital expenditures of $6 million, partially offset by net DIP Facility funding of $17 million.
Financing activities
Cash flows from financing activities for 2025 declined $140 million compared to the prior year primarily due to common stock repurchases of $378 million, lower cash from changes in customer account deposits at the Bank of $40 million and higher dividend payments of $15 million. These declines were partially offset by higher cash from debt activity of $280 million and prior year cash outflows related to discontinued operations of $7 million.
Cash flows from financing activities for 2024 declined $275 million compared to the prior year primarily due to higher net debt repayments of $178 million and lower cash from changes in customer account deposits at the Bank of $97 million.
Debt and Financing Activities
In the first quarter of 2025, we redeemed the remaining outstanding balance of the Notes due March 2028 and recorded a loss of $17 million. Additionally, we entered into a new senior secured credit agreement (the "New Credit Agreement"), which provided a $265 million revolving credit facility (subsequently increased to $400 million during 2025) maturing March 2028, a $160 million term loan maturing March 2028 and a $615 million term loan maturing March 2032. The proceeds from the new term loans were used to repay the outstanding balances of the Term loan due March 2026 and Term loan due March 2028, under our prior credit agreement and for general corporate purposes. We recorded a loss of $8 million in connection with this refinance.
Under the New Credit Agreement, we are required to maintain (i) a Consolidated Interest Coverage Ratio (as defined in the New Credit Agreement) of not less than 2.00 to 1.00, (ii) a Consolidated Secured Net Leverage Ratio (as defined in the New Credit
23
Agreement) of no greater than 3.00 to 1.00 and (iii) a Consolidated Total Net Leverage Ratio (as defined in the New Credit Agreement) of no greater than 5.25 to 1.00 for the fiscal quarters ending March 31, 2025 and June 30, 2025, 5.00 to 1.00 for the fiscal quarters ending September 30, 2025 and December 31, 2025 and 4.75 to 1.00 for each fiscal quarter ending on or after March 31, 2026. At December 31, 2025, we were in compliance with these financial covenants and there were no outstanding borrowings under the revolving credit facility. Borrowings under our New Credit Agreement are secured by assets of the Company.
The New Credit Agreement also contains provisions whereby if, on any day between the period commencing on September 14, 2026 and ending on March 15, 2027, the Notes due March 2027 have not been redeemed in full and liquidity is less than an amount equal to the amount to redeem the Notes due March 2027 plus $100 million, the Term loan due March 2028 and any borrowings under the revolving credit facility would become due on such date (the "Pro Rata Springing Maturity Date"), and if on any date during the period beginning on December 14, 2026 and ending on March 15, 2027, the Notes due March 2027 remain outstanding and the Pro Rata Springing Maturity Date has occurred, the Term loan due March 2032 would be become due on the date that is 91 days after the Pro Rata Springing Maturity Date. We are considering various strategies and intend to redeem the Notes due March 2027 before September 2026 either with available liquidity or refinance through the capital markets.
In August 2025, we issued an aggregate $230 million convertible senior notes due 2030 (the "Convertible Notes"). The Convertible Notes accrue interest at a rate of 1.50% per annum, payable semi-annually in arrears on February 15 and August 15 of each year and mature on August 15, 2030, unless earlier repurchased, redeemed or converted. The initial conversion rate is 70.1533 shares of common stock per $1,000 principal amount, which represents an initial conversion price of approximately $14.25 per share of common stock, subject to adjustment. Net proceeds were $221 million. We used $24.7 million of the proceeds to enter into privately negotiated capped call transactions (the "Capped Call Transactions") with certain of the initial purchasers or their respective affiliates and certain other financial institutions. The Capped Call Transactions are expected to reduce the potential dilution of our common stock upon conversion of any Convertible Notes, with such reduction subject to a cap. We also used $61.9 million of the proceeds to repurchase 5.5 million of our common stock. The remaining proceeds will be used for general corporate purposes and other strategic investments.
The Convertible Notes are senior unsecured obligations of the Company and are guaranteed jointly and severally, on a senior unsecured basis, by each of the Company’s existing and future wholly owned U.S. subsidiaries that guarantee the Company’s existing credit agreement, existing senior notes or any other series of capital market debt with an aggregate principal amount outstanding in excess of $150 million.
Conversions of the Convertible Notes will be settled by paying cash up to the aggregate principal amount of the Convertible Notes being converted and by delivering shares of our common stock in respect of the remainder, if any, of our conversion obligation in excess of the aggregate principal amount of the Convertible Notes being converted.
See Note 13 to the Consolidated Financial Statements for further information regarding the Convertible Notes and Capped Call Transactions.
In November 2025, we commenced a tender offer to purchase, subject to certain terms and conditions, up to $80 million aggregate principal amount of our Notes due January 2037 and Notes due March 2043. The tender offer was completed in December 2025 by purchasing validly tendered and accepted notes in the aggregate principal amount of $80 million. We recorded a gain of $10 million for the tender offer.
During 2025, we purchased an aggregate $57 million of the Notes due March 2027 and Notes due March 2029 in the open market and we repaid $32 million of principal related to our term loans.
In connection with the GEC Chapter 11 Cases, the Company, through one of its wholly owned subsidiaries, agreed to provide funding to the Ecommerce Debtors through a DIP Facility. We provided initial funding of $28 million and have received repayments of $20 million. The remaining balance on the DIP Facility is fully reserved and any future repayments will be recorded as income in the period received.
While we are focused on reducing our leverage and interest costs, we may incur additional debt or issue additional equity securities in the future.
24
Future Cash Requirements
The following table summarizes our known and contractually committed cash requirements at December 31, 2025.
Payments due in (in millions)
Total
2026
2027
2028
2029
2030
Thereafter
Debt maturities
$
2,026
$
17
$
368
$
134
$
332
$
236
$
939
Lease obligations
153
38
35
30
23
15
12
Purchase obligations
95
95
—
—
—
—
—
Retiree medical payments
71
9
9
8
8
7
30
Total
$
2,345
$
159
$
412
$
172
$
363
$
258
$
981
Debt
Required debt repayments over the next 12 months are $17 million, which we anticipate satisfying through available cash on hand and cash generated from operations. We estimate that cash interest payments for the next 12 months will be $130 - $140 million. See Note 13 to the Consolidated Financial Statements for information regarding our debt.
Lease obligations
We lease real estate and equipment under operating and capital lease arrangements. These leases have terms of up to 10 years and include renewal options. See Note 7 and Note 17 to the Consolidated Financial Statements for further information.
Purchase obligations
Purchase obligations include unrecorded open purchase orders for goods and services.
Off Balance Sheet Arrangements
At December 31, 2025, we had approximately $27 million outstanding letters of credit guarantees with financial institutions that are primarily issued as security for insurance, leases, customs and other performance obligations. In general, we would only be liable for the amount of these guarantees in the event of default in the performance of our obligations, the probability of which we believe is remote. Outstanding letters of credit reduce the amount we can borrow under our revolving credit facility.
25
Critical Accounting Estimates
The preparation of our financial statements in conformity with GAAP requires management to make estimates and assumptions about certain items that affect the reported amounts of assets, liabilities, revenues, expenses and accompanying disclosures, including the disclosure of contingent assets and liabilities. The accounting policies below have been identified by management as those policies that are most critical to our financial statements due to the estimates and assumptions required. Management believes that the estimates and assumptions used are reasonable and appropriate based on the information available at the time the financial statements were prepared; however, actual results could differ from those estimates and assumptions. See Note 1 to the Consolidated Financial Statements for a summary of our accounting policies.
Revenue recognition
We derive revenue from multiple sources including the sale and lease of equipment, equipment rentals, financing, support services and business services. Certain transactions are consummated at the same time and can therefore generate revenue from multiple sources. The most common form of these arrangements involves a sale or noncancelable lease of equipment, meter services and an equipment maintenance agreement. We are required to determine whether each product and service within the contract should be treated as a separate performance obligation (unit of accounting) for revenue recognition purposes. We recognize revenue for performance obligations when control is transferred to the customer. Transfer of control may occur at a point in time or over time, depending on the nature of the contract and the performance obligation.
For contracts that include multiple performance obligations, the total transaction price is typically determined based on the sum of standalone selling prices (SSP) for each performance obligation, which are a range of selling prices that we would sell a product or service to a customer on a separate basis. SSP are established for each performance obligation at the inception of the contract and can be observable prices or estimated. Revenue is allocated to the meter service and equipment maintenance agreement elements using their respective observable selling prices charged in standalone and renewal transactions. For sale and lease transactions, the SSP of the equipment is based on a range of observable selling prices in standalone transactions. We recognize revenue on non-lease transactions when control of the equipment transfers to the customer, which is upon delivery for customer installable models and upon installation or customer acceptance for other models. We recognize revenue on equipment for lease transactions upon shipment for customer installable models and upon installation or customer acceptance for other models.
Allowances for credit losses
Finance receivables are comprised of sales-type leases, secured loans and unsecured revolving loans. We provide an allowance for expected credit losses based on historical loss experience, the nature of our portfolios, adverse situations that may affect a client's ability to pay and current economic conditions and outlook based on reasonable and supportable forecasts. Total allowance for credit losses as a percentage of finance receivables was 2% at both December 31, 2025 and 2024. Holding all other assumptions constant, a 0.25% increase in the allowance rate at December 31, 2025 would have reduced pre-tax income by $3 million.
Trade accounts receivable are generally due within 30 days after the invoice date. We provide an allowance for expected credit losses based on historical loss experience, the age of the receivables, specific troubled accounts and other currently available information. Accounts deemed uncollectible are written off against the allowance after all collection efforts have been exhausted and management deems the account to be uncollectible, or when they are 365 days past due, if sooner. The allowance for credit losses as a percentage of trade accounts receivables was 4% and 5% at December 31, 2025 and 2024, respectively. Holding all other assumptions constant, a 0.25% increase in the allowance rate at December 31, 2025 would have reduced pre-tax income by less than $1 million.
Income taxes and valuation allowance
We are subject to income taxes in the U.S. and numerous foreign jurisdictions. Our annual tax rate is based on income, statutory tax rates, tax reserve changes and tax planning opportunities available to us in the various jurisdictions in which we operate. Significant judgment is required in determining the annual tax rate and in evaluating our tax positions. We regularly assess the likelihood of tax adjustments in each of the tax jurisdictions in which we have operations and account for the related financial statement implications. We have established tax reserves that we believe are appropriate given the possibility of tax adjustments. Determining the appropriate level of tax reserves requires judgment regarding the uncertain application of tax laws. Reserves are adjusted when information becomes available or when an event occurs indicating a change in the reserve is appropriate. Changes in tax reserves could have a material impact on our financial condition or results of operations.
Significant judgment is also required in determining the amount of deferred tax assets that will ultimately be realized and corresponding deferred tax asset valuation allowance. When estimating the necessary valuation allowance, we consider all available evidence for each jurisdiction including historical operating results, estimates of future taxable income and the feasibility of tax planning strategies. If new information becomes available that would alter our estimate of the amount of deferred tax assets that will ultimately be realized, we adjust the valuation allowance through income tax expense. Changes in the deferred tax asset valuation allowance could have a material impact on our financial condition or results of operations.
26
Pension benefits
The calculation of net periodic pension expense and determination of net pension obligations are dependent on assumptions and estimates relating to, among other things, the discount rate (interest rate used to discount the future estimated liability) and the expected rate of return on plan assets. These assumptions are evaluated and updated annually.
We manage significant defined benefit pension obligations. As part of our strategy to mitigate risks associated with these plans, in 2025, we entered into buy-in contracts (the "Buy-In") with insurance carriers to secure a portion of the defined benefit pension obligations (see Note 14 to the Consolidated Financial Statements).
These transactions involved transferring the risk for a select group of plan participants of the U.S. Qualified Pension Plan and the Canada Pension Plan to high-quality insurance carriers. The purchase of these buy-in contracts were made by transferring plan assets. While the related obligations and assets remain on our balance sheet, this action reduces our exposure to future fluctuations in the value of assets and liabilities for the covered population. We anticipate this will lead to a more stable funded status in future periods. We continue to evaluate opportunities for future de-risking activities, which could include additional buy-in or potentially buy-out transactions depending on market conditions and regulatory considerations.
As a result of the de-risking of the pension plan assets, the expected rate of return on Plan assets assumption used in the determination of net periodic pension costs is lower than the prior year, and as a result, we estimate that 2026 net periodic pension costs will increase approximately $35 million over 2025 levels.
The discount rate for our largest plan, the U.S. Qualified Pension Plan (the U.S. Plan) and our largest foreign plan, the U.K. Qualified Pension Plan (the U.K. Plan) used to determine net periodic pension expense for 2025 was 5.65% and 5.45%, respectively. The discount rate used to determine 2026 net periodic pension expense for the U.S. Plan and the U.K. Plan was 5.34% and 5.50%, respectively. A 0.25% change in the discount rate would not materially impact annual pension expense for the U.S. Plan or the U.K. Plan. A 0.25% change in the discount rate would impact the projected benefit obligation of the U.S. Plan and U.K. Plan by $16 million and $11 million, respectively.
Actual pension plan results that differ from our assumptions and estimates are accumulated and amortized primarily over the life expectancy of plan participants and affect future pension expense. Net pension expense is also based on a market-related valuation of plan assets where differences between the actual and expected return on plan assets are recognized over a five-year period in the U.S. and a two-year period in the U.K. Plan benefits for participants in a majority of our U.S. and foreign pension plans are frozen.
Residual value of leased assets
Equipment residual values are determined at the inception of the lease using estimates of the equipment's fair value at the end of the lease term. Fair value estimates of equipment at the end of the lease term are based on historical renewal experience, used equipment markets, competition and technological changes.
We evaluate residual values on an annual basis or sooner if circumstances warrant. Declines in estimated residual values considered "other-than-temporary" are recognized immediately. Increases in estimated future residual values are not recognized until the equipment is remarketed. If the actual residual value of leased assets were 10% lower than management's current estimates and considered "other-than-temporary", pre-tax income would be $4 million lower.
Legal and Regulatory Matters
See Regulatory Matters in Item 1 and Other Tax Matters in Note 15 to the Consolidated Financial Statements for regulatory matters regarding our tax returns and Note 16 to the Consolidated Financial Statements for information regarding our legal proceedings.
Foreign Currency Exchange
The functional currency for most of our foreign operations is the local currency. Changes in the value of the U.S. dollar relative to the currencies of countries in which we operate impact our reported assets, liabilities, revenue and expenses. Exchange rate fluctuations can also impact the settlement of intercompany receivables and payables between our subsidiaries in different countries. During 2025, 16% of our consolidated revenue was from operations outside the United States.
27
ITEM 7A. QUANTITATIVE AND QUALITATIVE DISCLOSURES ABOUT MARKET RISK
We are exposed to market risks primarily from changes in foreign currency exchange rates and interest rates. To manage these market risks, we have, from time-to-time, employed derivatives according to established policies and procedures. We did not employ any derivative instruments to manage these risks in 2025. We do not use derivatives for speculative purposes.
Foreign Exchange Risk
We have a number of short-term intercompany loans denominated in a foreign currency, predominantly the British Pound and Euro. Our foreign currency risk primarily includes the periodic revaluation of these intercompany loans and related interest, which is recorded in earnings. Assuming foreign currency exchange rates at December 31, 2025, a 1% change in the British Pound and Euro would impact earnings by $5 million and $2 million, respectively.
We are also exposed to foreign currency risks associated with transactions denominated in currencies other than a location’s functional currency and forecasted inventory purchases between affiliates and third parties. However, these risks are not deemed to be significant.
Interest Rate Risk
We are exposed to interest rate risk on our variable-rate debt borrowings. At December 31, 2025, 63% of our debt was at fixed rates and the remaining 37% is at variable rates. The weighted average interest rate of our variable rate debt at December 31, 2025 and 2024 was 7.1% and 8.3%, respectively. Based on our variable-rate debt outstanding at December 31, 2025, a 100 basis point change in the weighted average interest rate of our variable rate debt in 2025 would have increased interest expense approximately $7 million.
We also maintain a significant investment portfolio comprised of fixed-rate investment in government and municipal securities, corporate securities, mortgage-backed securities and asset-backed securities. Changes in interest rates impact the fair value of these investments. We have designated these securities as available-for-sale, and changes in fair value due to changes in interest rates are recognized in accumulated other comprehensive loss, a component of equity, and not earnings. We do not expect to recognize impairment losses on investment securities in an unrealized loss position as we have the intent and ability to hold these securities until recovery of unrealized losses or maturity.
Credit Risk
We are exposed to credit risk on our accounts receivable and finance receivable balances. No single client comprised more than 10% of our consolidated net sales in 2025 or 2024. We maintain provisions for potential credit losses based on historical experience, age of receivable, current economic conditions and future outlook and other relevant factors that may impact our customers’ ability to pay. We continually evaluate the adequacy of our allowance for credit losses and adjust as necessary.
ITEM 8. FINANCIAL STATEMENTS AND SUPPLEMENTARY DATA
See "Index to Consolidated Financial Statements and Schedules" in this Form 10-K.
ITEM 9. CHANGES IN AND DISAGREEMENTS WITH ACCOUNTANTS ON ACCOUNTING AND FINANCIAL DISCLOSURE
None.
ITEM 9A. CONTROLS AND PROCEDURES
Evaluation of Disclosure Controls and Procedures
We maintain disclosure controls and procedures (as defined in Rule 13a-15(e) and Rule 15d-15(e) under the Securities Exchange Act of 1934, as amended (the Exchange Act)), that are designed to ensure that information required to be disclosed in reports filed or submitted under the Exchange Act is recorded, processed, summarized and reported within the time periods specified in the Securities and Exchange Commission’s rules and forms, and to ensure that such information is accumulated and communicated to management, including our Chief Executive Officer (CEO) and Chief Financial Officer (CFO), to allow timely decisions regarding required disclosure.
Any system of controls and procedures, no matter how well designed and operated, can provide only reasonable (and not absolute) assurance of achieving the desired control objectives. Under the direction of our CEO and CFO, management evaluated the effectiveness of the design and operation of our disclosure controls and procedures as required by Rule 13a-15 or Rule 15d-15 under
28
the Exchange Act. Notwithstanding this caution, the CEO and CFO have reasonable assurance that the disclosure controls and procedures were effective as of December 31, 2025.
Management's Report on Internal Control over Financial Reporting
Management is responsible for establishing and maintaining adequate internal control over financial reporting as defined in Rules 13a-15(f) and 15d-15(f) under the Exchange Act. Management assessed the effectiveness of the internal control over financial reporting as of December 31, 2025 under the criteria set forth by the Committee of Sponsoring Organizations of the Treadway Commission (COSO) in Internal Control - Integrated Framework (2013) and concluded that the internal control over financial reporting was effective.
The effectiveness of our internal control over financial reporting as of December 31, 2025 has been audited by PricewaterhouseCoopers LLP, an independent registered public accounting firm, as stated in their report in this Form 10-K.
Changes in Internal Control over Financial Reporting
There have been no changes in our internal control over financial reporting during the three months ended December 31, 2025, that have materially affected, or are reasonably likely to materially affect, such internal control over financial reporting.
ITEM 9B. OTHER INFORMATION
During the three months ended December 31, 2025, certain directors and officers of the Company adopted a "Rule 10b5-1 trading arrangement," as defined in Item 408(a) of Regulation S-K, as set forth in the table below:
Action
Date
Trading Arrangement
Total Shares to be Sold(3)
Expiration Date
Rule 10b5-1(1)
Non-Rule 10b5-1(2)
Lauren Freeman-Bosworth (Executive Vice President, General Counsel, and Corporate Secretary)
Adopt
October 31, 2025
x
42,199(4)
December 31, 2026
Kurtis James Wolf (Chief Executive Officer) (5)
Adopt
November 10, 2025
x
6,000,000
December 31, 2026
(1) Intended to satisfy the affirmative defense of Rule 10b5-1(c).
(2) Not intended to satisfy the affirmative defense of Rule 10b5-1(c).
(3) Represents the maximum number of shares that may be sold pursuant to the 10b5-1 trading arrangement. The actual number of shares sold will be dependent on the terms of, and the satisfaction of the conditions as set forth in, the written plan.
(4) The Rule 10b5-1 trading arrangement includes the sale of shares to be received upon future vesting of certain outstanding equity awards, net of any shares withheld by us to satisfy applicable taxes. The number of shares to be withheld, and thus the exact number of shares to be sold pursuant to Ms. Freeman-Bosworth’s Rule 10b5-1 trading arrangement, can only be determined upon the occurrence of the future vesting events. For purposes of this disclosure, we have calculated the number of shares reported above based on the gross number of shares expected to be received upon the future vesting of such equity awards, before subtracting any shares to be withheld by us to satisfy applicable taxes in connection with such future vesting events. Accordingly, the actual number of shares eligible to be sold upon such vesting will be lower.
(5) Shares are held directly by Hestia Capital Partners, LP (“Hestia Capital”) and ECA Fund, LP – Hestia. Mr. Wolf is the managing member of (a) Hestia Partners GP, the general partner of Hestia Capital and (b) Hestia Capital Management, LLC, the investment manager of Hestia Capital. The Rule 10b5-1 trading arrangement provides for sales split into two categories: sales based on time and escalating prices, and sales based solely on price. The number of shares to be sold is dependent on the satisfaction of certain conditions set forth in the written plan, including escalating price targets and Rule 144 volume limitations, among other parameters.
Disclosure in lieu of reporting on a Current Report on Form 8-K
Item 5.02. Departure of Directors or Certain Officers; Election of Directors; Appointment of Certain Officers; Compensatory Arrangements of Certain Officers.
On February 17, 2026, Pitney Bowes Inc. (the “Company”) entered into an employment letter (the “Agreement”) with Kurt Wolf regarding the terms and conditions of his continued employment as the Company’s President and Chief Executive Officer. The term of the Agreement commences on February 17, 2026 (the “Effective Date”) and continues for three years thereafter; it will then automatically renew for one-year periods unless either party provides at least ninety days’ prior notice of non-renewal. As of the
29
Effective Date, the Agreement replaces and supersedes the Employment Letter, dated as of May 21, 2025, between Mr. Wolf and the Company.
Pursuant to the terms of the Agreement, Mr. Wolf will be entitled to the following: (a) an annual base salary of $40,000, less applicable withholdings and other payroll deductions, (b) commencing with the 2026 fiscal year, a target annual bonus of $960,000 (the “Target Bonus”), which may be earned based on achievement of performance goals in accordance with the Company’s Key Employees Incentive Plan (the “Incentive Plan”), subject to his continued employment with the Company through the date of payment and the terms and conditions of the Incentive Plan, and (c) eligibility for annual grants of long-term incentive (“LTI”) awards. For 2026, Mr. Wolf’s LTI award will take the form of performance stock units (“PSUs”) with a target grant date value equal to $6,500,000; the PSUs will be subject to the terms and conditions of the Company’s 2024 Stock Plan and the terms and conditions of the applicable award agreement, including a three-year time-based vesting requirement.
Mr. Wolf remains eligible to participate in the Pitney Bowes Severance Pay Plan (the “Severance Pay Plan”) and the Pitney Bowes Senior Executive Severance Policy ((the “Executive Severance Policy,” and together with the Severance Pay Plan, the “Severance Plans”). For the purpose of calculating any severance amount that may become due under the Severance Plans, Mr. Wolf’s annual base salary will be deemed to equal the sum of his annual base salary and Target Bonus. Mr. Wolf’s resignation for good reason (as defined in the Agreement) prior to a change in control will be treated as if his employment were involuntarily terminated without cause for purposes of the Severance Pay Plan and LTI awards, as applicable, and the Company giving Mr. Wolf a notice of non-renewal of the Agreement will be treated as if his employment were involuntarily terminated without cause for purposes of the Severance Plans, Incentive Plan and LTI awards, as applicable.
The foregoing description of the Agreement does not purport to be complete and is qualified in its entirety by reference to the full text of the Agreement, which is attached hereto as Exhibit 10(w) and incorporated herein by reference.
ITEM 9C. DISCLOSURE REGARDING FOREIGN JURISDICTIONS THAT PREVENT INSPECTIONS
None.
30
PART III
ITEM 10. DIRECTORS, EXECUTIVE OFFICERS AND CORPORATE GOVERNANCE
Other than information regarding our executive officers disclosed in Part I of this Annual Report, the information required by this Item is incorporated by reference to our Proxy Statement to be filed in connection with the 2026 Annual Meeting of Stockholders.
Code of Ethics
We have Business Practices Guidelines (BPG) that apply to all our officers and other employees and a Code of Business Conduct and Ethics (the Code) that applies to our Board of Directors. The BPG and the Code are posted on our corporate governance website located at www.pb.com/us/our-company/leadership-and-governance/corporate-governance.html. Amendments to either the BPG or the Code and any waiver from a provision of the BPG or the Code requiring disclosure will be disclosed on our corporate governance website.
The information regarding the Audit Committee, its members and the Audit Committee financial experts is incorporated by reference to our Proxy Statement to be filed in connection with the 2026 Annual Meeting of Stockholders.
ITEM 11. EXECUTIVE COMPENSATION
The information required by this Item is incorporated by reference to our Proxy Statement to be filed in connection with the 2026 Annual Meeting of Stockholders.
ITEM 12. SECURITY OWNERSHIP OF CERTAIN BENEFICIAL OWNERS AND MANAGEMENT AND RELATED STOCKHOLDER MATTERS
EQUITY COMPENSATION PLAN INFORMATION TABLE
The following table provides information as of December 31, 2025 regarding the number of shares of common stock that may be issued under our equity compensation plans.
Plan Category
(a) Number of securities to be issued upon exercise of outstanding options, warrants and rights (1)
(b) Weighted-average exercise price of outstanding options, warrants and rights (2)
(c) Number of securities remaining available for future issuance under equity compensation plans excluding securities reflected in column (a)
Equity compensation plans approved by security holders
7,856,316
$12.53
24,045,391
Equity compensation plans not approved by security holders
—
—
—
Total
7,856,316
$12.53
24,045,391
(1) Includes outstanding restricted stock units, stock options and performance stock units.
(2) Weighted average exercise price of stock options only.
Other than information regarding securities authorized for issuance under equity compensation plans, the information required by this Item is incorporated by reference to our Proxy Statement to be filed in connection with the 2026 Annual Meeting of Stockholders.
ITEM 13. CERTAIN RELATIONSHIPS, RELATED TRANSACTIONS AND DIRECTOR INDEPENDENCE
The information required by this Item is incorporated by reference to our Proxy Statement to be filed in connection with the 2026 Annual Meeting of Stockholders.
ITEM 14. PRINCIPAL ACCOUNTANT FEES AND SERVICES
The information required by this Item is incorporated by reference to our Proxy Statement to be filed in connection with the 2026 Annual Meeting of Stockholders.
31
PART IV
ITEM 15. EXHIBITS AND FINANCIAL STATEMENT SCHEDULES
(a)(1) Index to Consolidated Financial Statements and Schedules
Page Number in Form 10-K
Consolidated Statements of Operations for the years ended December 31, 2025, 2024 and 2023
First Supplemental Indenture, dated as of October 23, 2007, by and among Pitney Bowes Inc., The Bank of New York, as successor trustee, and Citibank, N.A., as resigning trustee
Indenture, dated March 19, 2021, among Pitney Bowes Inc., the guarantors party thereto and Truist Bank, as trustee, with respect to Pitney Bowes Inc.'s 6.875% Senior Notes due 2027.
Indenture, dated March 19, 2021, among Pitney Bowes Inc., the guarantors party thereto and Truist Bank, as trustee, with respect to Pitney Bowes Inc.'s 7.250% Senior Notes due 2029.
Indenture, dated August 8, 2025, among Pitney Bowes Inc., the guarantors party thereto and Truist Bank, as trustee, with respect to Pitney Bowes Inc.'s 1.50% Convertible Senior Notes due 2030
Form of Settlement and Release Agreement, dated as of August 8, 2024, by and among (i) DRF Logistics, LLC and DRF, LLC, as proposed debtors and debtors-in-possession and (ii) the Company and Pitney Bowes International Holdings, Inc.
Credit Agreement, dated as of February 7, 2025, among Pitney Bowes Inc., a Delaware corporation, the lenders and issuing banks thereto from time to time and Bank of America, N.A., as administrative agent
First Incremental Facility Amendment, dated as of August 29, 2025, among Pitney Bowes Inc., the Loan Parties party thereto, the Lenders and Issuing Banks party thereto and Bank of America, N.A., as administrative agent
The cover page from the Company's Annual Report on Form 10-K for the year ended December 31, 2025, formatted in Inline XBRL (included as Exhibit 101).
* The Exhibits identified above with an asterisk (*) are management contracts or compensatory plans or arrangements.
The Company has certain outstanding long-term indebtedness that does not exceed 10% of the total assets of the Company; therefore, copies of instruments defining the rights of holders of such indebtedness are not included as exhibits. The Company agrees to furnish copies of such instruments to the SEC upon request.
ITEM 16. FORM 10-K SUMMARY
None
35
PART IV
SIGNATURES
Pursuant to the requirements of Section 13 or 15(d) of the Securities Exchange Act of 1934, the Registrant has duly caused this report to be signed on its behalf by the undersigned, thereunto duly authorized.
Date: February 19, 2026PITNEY BOWES INC.
Registrant
By: /s/ Kurt Wolf
Kurt Wolf
Chief Executive Officer
Pursuant to the requirements of the Securities Exchange Act of 1934, this report has been signed below by the following persons on behalf of the Registrant and in the capacities and on the dates indicated.
Signature
Title
Date
/s/ Kurt Wolf
Kurt Wolf
Chief Executive Officer - Director (Principal Executive Officer)
Report of Independent Registered Public Accounting Firm
To the Board of Directors and Stockholders of Pitney Bowes Inc.
Opinions on the Financial Statements and Internal Control over Financial Reporting
We have audited the accompanying consolidated balance sheets of Pitney Bowes Inc. and its subsidiaries (the "Company") as of December 31, 2025 and 2024, and the related consolidated statements of operations, of comprehensive income (loss), of stockholders' deficit and of cash flows for each of the three years in the period ended December 31, 2025, including the related notes and financial statement schedule listed in the index appearing under Item 15(a)(1) (collectively referred to as the "consolidated financial statements"). We also have audited the Company's internal control over financial reporting as of December 31, 2025, based on criteria established in Internal Control - Integrated Framework (2013) issued by the Committee of Sponsoring Organizations of the Treadway Commission (COSO).
In our opinion, the consolidated financial statements referred to above present fairly, in all material respects, the financial position of the Company as of December 31, 2025 and 2024, and the results of its operations and its cash flows for each of the three years in the period ended December 31, 2025 in conformity with accounting principles generally accepted in the United States of America. Also in our opinion, the Company maintained, in all material respects, effective internal control over financial reporting as of December 31, 2025, based on criteria established in Internal Control - Integrated Framework (2013) issued by the COSO.
Basis for Opinions
The Company's management is responsible for these consolidated financial statements, for maintaining effective internal control over financial reporting, and for its assessment of the effectiveness of internal control over financial reporting, included in Management’s Report on Internal Control over Financial Reporting appearing under Item 9A. Our responsibility is to express opinions on the Company’s consolidated financial statements and on the Company's internal control over financial reporting based on our audits. We are a public accounting firm registered with the Public Company Accounting Oversight Board (United States) (PCAOB) and are required to be independent with respect to the Company in accordance with the U.S. federal securities laws and the applicable rules and regulations of the Securities and Exchange Commission and the PCAOB.
We conducted our audits in accordance with the standards of the PCAOB. Those standards require that we plan and perform the audits to obtain reasonable assurance about whether the consolidated financial statements are free of material misstatement, whether due to error or fraud, and whether effective internal control over financial reporting was maintained in all material respects.
Our audits of the consolidated financial statements included performing procedures to assess the risks of material misstatement of the consolidated financial statements, whether due to error or fraud, and performing procedures that respond to those risks. Such procedures included examining, on a test basis, evidence regarding the amounts and disclosures in the consolidated financial statements. Our audits also included evaluating the accounting principles used and significant estimates made by management, as well as evaluating the overall presentation of the consolidated financial statements. Our audit of internal control over financial reporting included obtaining an understanding of internal control over financial reporting, assessing the risk that a material weakness exists, and testing and evaluating the design and operating effectiveness of internal control based on the assessed risk. Our audits also included performing such other procedures as we considered necessary in the circumstances. We believe that our audits provide a reasonable basis for our opinions.
Definition and Limitations of Internal Control over Financial Reporting
A company’s internal control over financial reporting is a process designed to provide reasonable assurance regarding the reliability of financial reporting and the preparation of financial statements for external purposes in accordance with generally accepted accounting principles. A company’s internal control over financial reporting includes those policies and procedures that (i) pertain to the maintenance of records that, in reasonable detail, accurately and fairly reflect the transactions and dispositions of the assets of the company; (ii) provide reasonable assurance that transactions are recorded as necessary to permit preparation of financial statements in accordance with generally accepted accounting principles, and that receipts and expenditures of the company are being made only in accordance with authorizations of management and directors of the company; and (iii) provide reasonable assurance regarding prevention or timely detection of unauthorized acquisition, use, or disposition of the company’s assets that could have a material effect on the financial statements.
38
Because of its inherent limitations, internal control over financial reporting may not prevent or detect misstatements. Also, projections of any evaluation of effectiveness to future periods are subject to the risk that controls may become inadequate because of changes in conditions, or that the degree of compliance with the policies or procedures may deteriorate.
Critical Audit Matters
The critical audit matter communicated below is a matter arising from the current period audit of the consolidated financial statements that was communicated or required to be communicated to the audit committee and that (i) relates to accounts or disclosures that are material to the consolidated financial statements and (ii) involved our especially challenging, subjective, or complex judgments. The communication of critical audit matters does not alter in any way our opinion on the consolidated financial statements, taken as a whole, and we are not, by communicating the critical audit matter below, providing a separate opinion on the critical audit matter or on the accounts or disclosures to which it relates.
Revenue Recognition – Mail Processing Services Related to the Presort Services Segment
As described in Notes 1 and 2 to the consolidated financial statements, the Company’s Presort Services segment revenue, which is comprised entirely of mail processing services, was $636.6 million for the year ended December 31, 2025. Revenues for mail processing services are recognized over time using an output method based on the number of mail pieces either processed or delivered, depending on the service type, since that measure best depicts the value of goods and services transferred to the client over the contract period. Contract terms for these services initially range from one to five years and contain annual renewal options. Management reviews third party relationships and records revenue on a gross basis when the Company acts as a principal in a transaction and on a net basis when the Company acts as an agent between a client and vendor. The Company acts as an agent for certain mail processing services transactions.
The principal considerations for our determination that performing procedures relating to mail processing services revenue related to the Presort Services segment is a critical audit matter are a high degree of auditor effort in performing procedures and evaluating audit evidence related to the Company’s revenue recognition.
Addressing the matter involved performing procedures and evaluating audit evidence in connection with forming our overall opinion on the consolidated financial statements. These procedures included testing the effectiveness of controls relating to revenue recognition for mail processing services related to the Presort Services segment. These procedures also included, among others, testing the existence and accuracy of gross mail processing services revenue by (i) obtaining and inspecting source documents such as invoices, rate change notifications to customers, and customer pick up slips or prejob reports to evidence the customer arrangement and validate pricing terms and quantities, (ii) recalculating the mail processing services revenue, and (iii) vouching cash receipts or application of the deposit account funds, as applicable. Additionally, we confirmed cost of postage directly with the principal in validating the accuracy of net revenue for those transactions in which the Company is an agent.
/s/ PricewaterhouseCoopers LLP
Stamford, Connecticut
February 19, 2026
We have served as the Company’s auditor since 1934.
39
PITNEY BOWES INC.
CONSOLIDATED STATEMENTS OF OPERATIONS
(In thousands, except per share amounts)
Years Ended December 31,
2025
2024
2023
Revenue:
Services
$
1,206,031
$
1,260,612
$
1,268,380
Products
364,709
430,845
471,448
Financing and other
321,889
335,141
339,097
Total revenue
1,892,629
2,026,598
2,078,925
Costs and expenses:
Cost of services
594,898
639,039
698,316
Cost of products
212,366
244,198
267,104
Cost of financing and other
61,503
81,061
82,895
Selling, general and administrative
621,567
717,894
781,609
Research and development
15,278
31,957
29,486
Restructuring charges
58,660
76,915
52,412
Goodwill impairment
—
—
123,574
Interest expense, net
101,460
110,094
98,769
Other components of net pension and postretirement cost
7,543
89,044
(8,256)
Other expense (income)
26,830
88,723
(3,064)
Total costs and expenses
1,700,105
2,078,925
2,122,845
Income (loss) from continuing operations before income taxes
192,524
(52,327)
(43,920)
Provision (benefit) for income taxes
47,827
(154,829)
17,347
Income (loss) from continuing operations
144,697
102,502
(61,267)
Loss from discontinued operations, net of tax
—
(306,099)
(324,360)
Net income (loss)
$
144,697
$
(203,597)
$
(385,627)
Basic earnings (loss) per share attributable to common stockholders (1):
Continuing operations
$
0.84
$
0.57
$
(0.35)
Discontinued operations
—
(1.71)
(1.85)
Net income (loss)
$
0.84
$
(1.13)
$
(2.20)
Diluted earnings (loss) per share attributable to common stockholders (1):
Continuing operations
$
0.84
$
0.56
$
(0.35)
Discontinued operations
—
(1.68)
(1.85)
Net income (loss)
$
0.84
$
(1.12)
$
(2.20)
(1)The sum of the earnings per share amounts may not equal the totals due to rounding.
See Notes to Consolidated Financial Statements
40
PITNEY BOWES INC.
CONSOLIDATED STATEMENTS OF COMPREHENSIVE INCOME (LOSS)
(In thousands)
Years Ended December 31,
2025
2024
2023
Net income (loss)
$
144,697
$
(203,597)
$
(385,627)
Other comprehensive income (loss), net of tax:
Foreign currency translations, net of tax of $376, $(560) and $(741), respectively
51,291
(37,464)
25,279
Net loss on cash flow hedges, net of tax of $(2,321) and $(1,847), respectively in 2024 and 2023
—
(6,962)
(5,541)
Net unrealized gain on available for sale securities, net of tax of $2,195, $1,207 and $1,878, respectively
7,028
3,866
5,977
Adjustments to pension and postretirement plans, net of tax of $(9,198), $(11,683) and $(18,875), respectively
(29,037)
(35,525)
(55,128)
Amortization of pension and postretirement costs, net of tax of $6,547, $29,019 and $4,461, respectively
20,757
88,159
13,732
Other comprehensive income (loss), net of tax
50,039
12,074
(15,681)
Comprehensive income (loss)
$
194,736
$
(191,523)
$
(401,308)
See Notes to Consolidated Financial Statements
41
PITNEY BOWES INC.
CONSOLIDATED BALANCE SHEETS
(In thousands, except per share amount)
December 31, 2025
December 31, 2024
ASSETS
Current assets:
Cash and cash equivalents (includes $38,851 and $58,817, respectively, reported at fair value)
$
284,887
$
469,726
Short-term investments (includes $1,715 and $3,926, respectively, reported at fair value)
12,232
16,374
Accounts and other receivables (net of allowance of $7,507 and $7,723 respectively)
168,099
159,951
Short-term finance receivables (net of allowance of $14,206 and $13,302, respectively)
496,446
535,608
Inventories
66,241
59,836
Current income taxes
3,143
10,429
Other current assets and prepayments (net of allowance of $10,466 and $19,373, respectively)
69,451
66,030
Total current assets
1,100,499
1,317,954
Property, plant and equipment, net
185,913
218,657
Rental property and equipment, net
24,054
24,587
Long-term finance receivables (net of allowance of $4,370 and $8,374, respectively)
605,129
610,316
Goodwill
746,687
721,003
Intangible assets, net
14,741
15,780
Operating lease assets
106,996
113,357
Noncurrent income taxes
95,412
99,773
Other assets (includes $185,111 and $173,539, respectively, reported at fair value)
289,520
276,089
Total assets
$
3,168,951
$
3,397,516
LIABILITIES AND STOCKHOLDERS’ DEFICIT
Current liabilities:
Accounts payable and accrued liabilities
$
845,378
$
873,626
Customer deposits at Pitney Bowes Bank
582,630
645,860
Current operating lease liabilities
28,396
26,912
Current portion of long-term debt
17,150
53,250
Advance billings
69,075
70,131
Current income taxes
5,210
2,948
Total current liabilities
1,547,839
1,672,727
Long-term debt
1,975,888
1,866,458
Deferred taxes on income
72,665
49,187
Tax uncertainties and other income tax liabilities
278
13,770
Noncurrent operating lease liabilities
99,757
100,804
Noncurrent customer deposits at Pitney Bowes Bank
71,000
57,977
Other noncurrent liabilities
203,884
215,026
Total liabilities
3,971,311
3,975,949
Commitments and contingencies (See Note 16)
Stockholders' deficit:
Common stock, $1 par value (480,000 shares authorized; 270,338 shares issued)
270,338
270,338
Retained earnings
2,655,703
2,671,868
Accumulated other comprehensive loss
(789,132)
(839,171)
Treasury stock, at cost (119,634 and 87,932 shares, respectively)
(2,939,269)
(2,681,468)
Total stockholders’ deficit
(802,360)
(578,433)
Total liabilities and stockholders’ deficit
$
3,168,951
$
3,397,516
See Notes to Consolidated Financial Statements
42
PITNEY BOWES INC.
CONSOLIDATED STATEMENTS OF CASH FLOWS
(In thousands)
Years Ended December 31,
2025
2024
2023
Cash flows from operating activities:
Net income (loss)
$
144,697
$
(203,597)
$
(385,627)
Loss from discontinued operations, net of tax
—
306,099
324,360
Adjustments to reconcile net income or loss to net cash from operating activities:
Depreciation and amortization
111,575
114,485
112,724
Allowance for credit losses
13,234
13,182
14,219
(Reduction) allowance for DIP Facility
(8,907)
19,373
—
Stock-based compensation
14,151
16,524
8,857
Amortization of debt fees
7,226
12,907
10,698
Loss (gain) on debt redemption/refinancing
14,072
10,892
(3,064)
Restructuring charges
58,392
76,915
52,412
Restructuring payments
(41,338)
(86,024)
(34,443)
Pension contributions and retiree medical payments
(25,931)
(24,907)
(33,815)
Pension settlement charges
—
91,339
—
Loss on disposal of fixed assets
11,066
13,192
13,572
Loss (gain) on revaluation of intercompany loans
21,944
(10,241)
5,760
Impairment charges
268
10,000
123,574
Deferred taxes
38,405
(173,710)
(35,786)
Other, net
8,241
(12,954)
(6,841)
Changes in operating assets and liabilities, net of acquisitions/divestitures:
Accounts and other receivables
(13,999)
31,983
25,431
Finance receivables
107,223
60,342
(2,646)
Inventories
(5,566)
2,260
18,209
Other current assets and prepayments
817
996
20,815
Accounts payable and accrued liabilities
(62,028)
47,348
(16,386)
Current and noncurrent income taxes
(6,806)
(35,070)
30,101
Advance billings
(3,479)
(4,882)
(7,528)
Net cash from operating activities: continuing operations
383,257
276,452
234,596
Net cash from operating activities: discontinued operations
—
(47,282)
(154,505)
Net cash from operating activities
383,257
229,170
80,091
Cash flows from investing activities:
Capital expenditures
(66,278)
(72,403)
(78,109)
Purchases of investment securities
(34,772)
(30,099)
(18,887)
Proceeds from sales/maturities of investment securities
28,345
76,563
25,390
Net investment in loan receivables
(61,200)
(9,467)
(29,754)
DIP Facility net reimbursement (disbursement)
8,907
(17,234)
—
Acquisition
(2,200)
—
—
Settlement of derivative contracts
—
—
427
Other investing activities, net
2,101
10,969
1,606
Net cash from investing activities: continuing operations
(125,097)
(41,671)
(99,327)
Net cash from investing activities: discontinued operations
—
(7,385)
(24,769)
Net cash from investing activities
(125,097)
(49,056)
(124,096)
Cash flows from financing activities:
Proceeds from the issuance of debt, net of discount
1,005,000
—
266,750
Principal payments of debt
(934,316)
(233,930)
(322,886)
Premiums and fees to redeem/refinance debt
(17,271)
(13,688)
(10,531)
Dividends paid to stockholders
(51,059)
(35,956)
(35,215)
Customer deposits at Pitney Bowes Bank
(50,208)
(10,458)
86,223
Capped call payment
(24,702)
—
—
Common stock repurchases
(378,361)
—
—
Other financing activities, net
5,559
(4,568)
(6,340)
Net cash from financing activities: continuing operations
(445,358)
(298,600)
(21,999)
Net cash from financing activities: discontinued operations
—
(6,855)
(8,003)
Net cash from financing activities
(445,358)
(305,455)
(30,002)
Effect of exchange rate changes on cash and cash equivalents
2,359
(4,987)
5,731
Change in cash and cash equivalents
(184,839)
(130,328)
(68,276)
Cash and cash equivalents at beginning of period
469,726
600,054
668,330
Cash and cash equivalents at end of period
$
284,887
$
469,726
$
600,054
See Notes to Consolidated Financial Statements
43
PITNEY BOWES INC.
CONSOLIDATED STATEMENTS OF STOCKHOLDERS' DEFICIT
(In thousands)
Common Stock
Retained earnings
Accumulated other comprehensive loss
Treasury stock
Total deficit
Balance at December 31, 2022
$
323,338
$
5,125,677
$
(835,564)
$
(4,552,798)
$
60,653
Net loss
—
(385,627)
—
—
(385,627)
Other comprehensive loss
—
—
(15,681)
—
(15,681)
Dividends ($0.20 per share)
—
(35,215)
—
—
(35,215)
Issuance of common stock
—
(73,474)
—
71,171
(2,303)
Stock-based compensation
—
9,597
—
—
9,597
Retirement of treasury stock
(53,000)
(1,562,970)
—
1,615,970
—
Balance at December 31, 2023
270,338
3,077,988
(851,245)
(2,865,657)
(368,576)
Net loss
—
(203,597)
—
—
(203,597)
Other comprehensive income
—
—
12,074
—
12,074
Dividends ($0.20 per share)
—
(35,956)
—
—
(35,956)
Issuance of common stock
—
(183,644)
—
184,189
545
Stock-based compensation
—
17,077
—
—
17,077
Balance at December 31, 2024
270,338
2,671,868
(839,171)
(2,681,468)
(578,433)
Net income
—
144,697
—
—
144,697
Other comprehensive income
—
—
50,039
—
50,039
Dividends ($0.30 per share)
—
(51,059)
—
—
(51,059)
Issuance of common stock
—
(123,954)
—
120,560
(3,394)
Stock-based compensation
—
14,151
—
—
14,151
Repurchase of common stock
—
—
—
(378,361)
(378,361)
Balance at December 31, 2025
$
270,338
$
2,655,703
$
(789,132)
$
(2,939,269)
$
(802,360)
See Notes to Consolidated Financial Statements
44
PITNEY BOWES INC.
NOTES TO CONSOLIDATED FINANCIAL STATEMENTS
(Tabular amounts in thousands, except per share amounts)
1. Summary of Significant Accounting Policies
Basis of Presentation
The accompanying Consolidated Financial Statements of Pitney Bowes Inc. and its wholly owned subsidiaries (we, us, our, or the company) have been prepared in conformity with accounting principles generally accepted in the United States of America (GAAP). Intercompany transactions and balances have been eliminated.
In 2025, we recast our reporting presentation of revenue and cost of revenue to better align with our offerings. We now report Services revenue and Cost of services, which includes the previously reported Business services and Support services, Products revenue and Cost of products, which includes the previously reported Equipment sales and Supplies and Financing and other revenue and Cost of financing and other, which includes the previously reported Financing and Rentals. We also recast our corporate expense allocation methodology to allocate all marketing and innovation expenses to our SendTech Solutions segment due to a change in how these functions are now managed. Additionally, we recast our segment reporting to report the revenue and related expenses of a cross-border services contract in our SendTech Solutions reporting segment, which was previously reported in Other operations. Prior periods have been recast to conform to the current period presentation.
Other operations in 2024 and 2023 includes the revenue and related expenses of the operations and shared services of the former Global Ecommerce reporting segment that did not qualify for discontinued operations treatment.
During the first quarter of 2025, we identified an error and recorded an out of period adjustment of $4 million to correct an overstatement of revenue in prior periods. During the fourth quarter of 2025, we identified an error and recorded an out of period adjustment of $5 million to correct an overstatement of cost of revenue in prior periods. Inclusive of other insignificant errors identified in 2025, there was an aggregate $3 million credit to pre-tax net income recorded out of period in 2025. The impact of these adjustments was not material to the consolidated financial statements for any interim or annual periods.
During the first quarter of 2024, we identified an error and recorded an out of period adjustment of $5 million to correct an understatement of revenue in prior periods, of which $4 million originated in 2020 and prior. The impact of the adjustment was not material to the consolidated financial statements for any interim or annual periods.
Use of Estimates
The preparation of financial statements in conformity with GAAP requires the use of estimates and assumptions that affect the reported amounts of assets, liabilities, revenues, expenses and accompanying disclosures, including the disclosure of contingent assets and liabilities. These estimates and assumptions are based on management's best knowledge of current events, historical experience and other information available when the financial statements are prepared. These estimates include, but are not limited to, goodwill and intangible asset impairment review, deferred tax asset valuation allowance, income tax reserves, revenue recognition for multiple element arrangements, pension and other postretirement costs, allowance for credit losses, residual values of leased assets, useful lives of long-lived and intangible assets, restructuring costs and loss contingencies. Actual results could differ from those estimates and assumptions.
Cash and Cash Equivalents
Cash equivalents include interest-earning investments with maturities of three months or less at the date of purchase.
Investment Securities
Investment securities classified as available-for-sale are recorded at fair value with changes in fair value due to market conditions (i.e., interest rates) recorded in accumulated other comprehensive loss ("AOCL"), and changes in fair value due to credit conditions recorded in earnings. Purchase premiums and discounts are amortized using the effective interest method over the term of the security. Gains and losses on sales of available-for-sale securities are recorded on the trade date using the specific identification method. There were no unrealized losses due to credit losses charged to earnings in 2025, 2024, or 2023. Investment securities classified as held-to-maturity are carried at amortized cost.
Accounts Receivables and Allowance for Credit Losses
Accounts receivables are generally due within 30 days after the invoice date. We provide an allowance for credit losses based on historical loss experience, the age of the receivables, specific troubled accounts and other currently available information.
Accounts receivables are written off against the allowance after all collection efforts have been exhausted and management deems the account to be uncollectible, or when they are 365 days past due, if sooner. We believe that our accounts receivable credit risk is low because of the geographic and industry diversification of our clients and small account balances for most of our clients. We continually evaluate the adequacy of the allowance for credit losses and adjust as necessary.
45
PITNEY BOWES INC.
NOTES TO CONSOLIDATED FINANCIAL STATEMENTS
(Tabular amounts in thousands, except per share amounts)
Finance Receivables and Allowance for Credit Losses
Finance receivables are comprised of sales-type leases, secured loans and unsecured loans. Sales-type leases and secured loans are financing options for the purchase or lease of Pitney Bowes equipment or other manufacturers' equipment and are generally due in installments over periods ranging from three to five years. Unsecured loans comprise revolving credit lines offered to our clients for postage, supplies and working capital purposes. These revolving credit lines are generally due monthly; however, clients may rollover outstanding balances. Interest is recognized using the effective interest method. Fees are recognized ratably over the period covered and client acquisition costs are expensed as incurred.
We provide an allowance for credit losses based on historical loss experience, the nature of our portfolios, adverse situations that may affect a client's ability to pay and current economic conditions and outlook based on reasonable and supportable forecasts. We continually evaluate the adequacy of the allowance for credit losses and adjust as necessary.
Credit approval limits are established based on the credit quality of the client and the type of equipment financed. We cease revenue recognition for lease receivables and unsecured loan receivables that are more than 90 days past due. Revenue recognition is resumed when the client's payments reduce the account aging to less than 60 days past due. Finance receivables are written off against the allowance after all collection efforts have been exhausted and management deems the account to be uncollectible. We believe that our finance receivable credit risk is low because of the geographic and industry diversification of our clients and small account balances for most of our clients.
Inventories
Inventories are stated at the lower of cost, determined on the first-in, first-out (FIFO) basis or net realizable value.
Fixed Assets
Property, plant and equipment and rental property and equipment are stated at cost less accumulated depreciation. Major improvements that add to the productive capacity or extend the life of an asset are capitalized while repairs and maintenance are charged to expense. Fully depreciated assets are retained in fixed assets and accumulated depreciation until they are removed from service.
Depreciation is computed principally using the straight-line method based on the following estimated useful lives:
Estimated Useful Life
Machinery and equipment
3-12 years
Furniture and fixtures
3-10 years
Rental equipment
3-6 years
Leasehold improvements
Shorter of lease term or useful life
Internal-Use Software and Research and Development Costs
Research and development includes research, development and engineering activities relating to the development of new products and solutions and enhancements of existing products and solutions. Costs primarily include salaries, benefits and other employee-related expenses, materials, contract services, information systems and facilities and equipment costs. Costs incurred to acquire or develop software for internal use during the application development stage are capitalized. Internal-use software costs are depreciated using the straight-line method over the estimated useful life of up to 3 years. Research and development costs not eligible for capitalization are charged to expense as incurred.
Intangible Assets
Finite-lived intangible assets are amortized using the straight-line method over estimated useful lives of up to 10 years.
Deferred Costs
Certain incremental costs to obtain a contract are capitalized if we expect the benefit of those costs to be realized over a period greater than one year. These costs primarily relate to contract costs and sales commissions on multi-year equipment sales. Costs are amortized in a manner consistent with the timing of the related revenue over the contract performance period or longer, if renewals are expected and the renewal commission is not commensurate with the initial commission. Unamortized deferred costs at both December 31, 2025 and December 31, 2024, included in other assets, were $28 million. Amortization expense for these costs for the years ended December 31, 2025, 2024 and 2023 was $15 million, $16 million and $16 million, respectively.
46
PITNEY BOWES INC.
NOTES TO CONSOLIDATED FINANCIAL STATEMENTS
(Tabular amounts in thousands, except per share amounts)
Revenue Recognition
We derive revenue from multiple sources including sales, rentals, financing and services. Certain transactions are consummated at the same time and can therefore generate revenue from multiple sources. The most common form of these transactions involves a sale or noncancelable lease of equipment, meter services and an equipment maintenance agreement. We determine whether each product and service within the contract should be treated as a separate performance obligation (unit of accounting) for revenue recognition purposes. For contracts that include multiple performance obligations, the total transaction price is typically determined based on the sum of standalone selling prices (SSP) for each performance obligation, which are a range of selling prices that we would sell a product or service on a standalone basis. SSP are established for each performance obligation at the inception of the contract and can be observable prices or estimated. The transaction price assigned to the various performance obligations impacts the timing of revenue recognition, but does not change the total revenue recognized. More specifically, revenue related to our offerings is recognized as follows:
Services
Services revenue includes mail processing services, shipping subscription solutions and cross-border solutions. Revenue for mail processing services and cross-border solutions are recognized over time using an output method based on the number of parcels or mail pieces either processed or delivered, depending on the service type, since that measure best depicts the value of goods and services transferred to the client over the contract period. Revenue for shipping subscription solutions is recognized ratably over the contract period as the client obtains equal benefit from these services throughout the period. We review third party relationships and record revenue on a gross basis when we act as a principal in a transaction and on a net basis when we act as an agent between a client and vendor. In determining whether we are acting as principal or agent, we consider several factors such as whether we are the primary obligor to the client or have control over pricing. We act as an agent for certain mail processing services transactions.
Services revenue also includes providing maintenance, professional and subscription services for our equipment and digital mailing and shipping technology solutions. Revenue is allocated to these services using selling prices charged in standalone transactions. Revenue for maintenance and subscription services is recognized ratably over the contract period and revenue for professional services is recognized when services are provided.
Products
We sell and lease equipment directly to customers and to distributors (re-sellers) throughout the world. The amount of revenue allocated to the equipment is based on a range of observable selling prices in standalone transactions. Revenue is recognized as control of the equipment transfers to the customer. Revenue from the sale of equipment under sales-type leases is recognized upon shipment for self-installed products and upon installation or customer acceptance for other products. Revenue from the direct sale of equipment is recognized upon delivery for self-installed products and upon installation or customer acceptance for other products. We do not typically offer any rights of return. The sale of supplies for our mailing equipment is recognized upon delivery.
Financing and other
We provide financing for our products primarily through sales-type leases and revolving lines of credit. Financing revenue includes finance income, late fees and investment income, gains and losses at the Pitney Bowes Bank (the "Bank"), a wholly owned subsidiary. We record financing income over the lease term using the effective interest method. Financing revenue also includes amounts related to sales-type leases that customers extend or renew for an additional term. Revenue for these contracts is recognized over the term of the modified lease using the effective interest method. .
Equipment residual values are determined at the inception of the lease using management's best estimate of fair value at the end of the lease term. Fair value estimates are determined based on historical renewal experience, used equipment markets, competition and technological changes. We evaluate residual values on an annual basis or sooner if circumstances warrant. Declines in estimated residual values considered "other-than-temporary" are recognized immediately. Increases in estimated future residual values are not recognized until the equipment is remarketed.
Financing and other revenue also includes revenue from mailing equipment that does not meet the criteria for as a sales-type lease. We may invoice in advance for rentals according to the terms of the agreement. Advanced billings are initially deferred and recognized on a straight-line basis over the billing period. Revenue generated from financing clients for the continued use of equipment subsequent to the expiration of the original lease is recognized as other revenue.
Shipping and Handling
Shipping and handling revenue and costs are recognized as revenue and cost of revenue as incurred.
Restructuring Charges
Restructuring charges may include employee severance and related separation costs and facility abandonment and other related charges. Employee severance and separation costs are recognized when a liability is incurred and the amount to be paid is both
47
PITNEY BOWES INC.
NOTES TO CONSOLIDATED FINANCIAL STATEMENTS
(Tabular amounts in thousands, except per share amounts)
probable and can be reasonably estimated. Severance accruals are based on company policy, historical experience and negotiated settlements.
Stock-based Compensation
Compensation expense for stock-based awards is recognized ratably over the service period based on the estimated fair value of the awards expected to vest. Depending on the type of award, the fair value is estimated based on the market price of our common stock on the grant date, less the present value of expected dividends, the Black-Scholes valuation model or Monte Carlo simulation model. We believe that these valuation techniques and the underlying assumptions are appropriate in estimating the fair value of stock awards. Stock-based compensation expense is recognized primarily in selling, general and administrative expense.
Retirement Plans
Net periodic benefit cost includes service cost, interest cost, expected return on plan assets and the amortization of actuarial gains and losses. Actuarial gains and losses arise from actual results that differ from previous assumptions and changes in assumptions. The expected return on plan assets is based on a market-related valuation of plan assets where differences between the actual and expected return on plan assets are recognized over a five-year period in the U.S. and a two-year period in the U.K. Actuarial gains and losses are recognized in other comprehensive loss, net of tax, and amortized to benefit cost primarily over the life expectancy of plan participants. The funded status of pension and other postretirement benefit plans is recognized in the consolidated balance sheets.
Impairment Review
Long-lived assets and finite-lived intangible assets are reviewed for impairment whenever events or changes in circumstances indicate that the carrying amount may not be fully recoverable. The estimated undiscounted future cash flows expected to result from the use and eventual disposition of the asset is compared to the asset's carrying value. The fair value of the asset is determined using probability weighted expected cash flow estimates, derived from our long-term business plan and historical experience, quoted market prices when available and appraisals, as appropriate.
Goodwill is tested annually for impairment at the reporting unit level as of the beginning of the fourth quarter or sooner if circumstances indicate an impairment may exist. A qualitative assessment (commonly referred to as Step 0) can be performed to evaluate whether it is more-likely-than-not that goodwill has been impaired, as a basis to determine whether it is necessary to perform the two-step quantitative impairment test. This qualitative assessment includes a review of factors such as our reporting unit’s market value compared to its carrying value, our planned overall business strategy compared to recent financial results, as well as macroeconomic conditions, industry and market considerations, cost factors, and other relevant company-specific events.
The quantitative impairment test for goodwill determines the fair value of each reporting unit and compares it to the reporting unit's carrying value, including goodwill. If the fair value of a reporting unit exceeds the carrying value of the net assets assigned to that reporting unit, goodwill is not impaired. If the fair value of the reporting unit is less than the carrying value of the net assets assigned to the reporting unit, a goodwill impairment loss is calculated as the difference between these amounts, limited to the amount of goodwill allocated to the reporting unit.
In 2025, we performed a qualitative assessment of goodwill for impairment. Based on this assessment, we concluded that it was more likely than not that the estimated fair values of our reporting units were higher than their carrying values and that the performance of a quantitative impairment test was not required. In 2024 and 2023, we performed a quantitative impairment test for goodwill.
Derivative Instruments
We are exposed to the impact of changes in foreign currency exchange rates and interest rates. We limit these risks by following established risk management policies and procedures. We may also use derivatives to limit the effects of currency exchange rate fluctuations on financial results and manage the related cost of debt. We will not use derivatives for trading or speculative purposes.
Derivatives are measured at fair value and reported as assets and liabilities, as applicable. The accounting for changes in fair value depends on the intended use of the derivative, the resulting designation and the effectiveness of the instrument in offsetting the risk exposure it is designed to hedge. To qualify as a hedge, a derivative must be highly effective in offsetting the risk designated for hedging purposes. The hedge relationship must be formally documented at inception, detailing the particular risk management objective and strategy for the hedge. The effectiveness of the hedge relationship is evaluated on a retrospective and prospective basis.
The use of derivatives exposes us to counterparty credit risk. To mitigate such risks, we may only enter into agreements with financial institutions that meet stringent credit requirements. We regularly review our credit exposure and the creditworthiness of our counterparties. We have not seen a material change in the creditworthiness of our derivative counterparties.
Income Taxes
We recognize deferred tax assets and liabilities for the future tax consequences attributable to differences between the carrying amounts of assets and liabilities and their respective tax bases. Deferred tax assets and liabilities are measured using the enacted tax
48
PITNEY BOWES INC.
NOTES TO CONSOLIDATED FINANCIAL STATEMENTS
(Tabular amounts in thousands, except per share amounts)
rates expected to apply to taxable income in the years in which those temporary differences are expected to be recovered or settled. The effect of a change in tax rates on deferred tax assets and liabilities is recognized in income in the period that includes the enactment date of such change. A valuation allowance is provided when it is more likely than not that a deferred tax asset will not be realized. In estimating the necessity and amount of a valuation allowance, we consider all available evidence for each jurisdiction, including historical operating results, estimates of future taxable income and the feasibility of ongoing tax planning strategies. We adjust the valuation allowance through income tax expense when new information becomes available that would alter our determination of the amount of deferred tax assets that will ultimately be realized.
Earnings per Share
Basic earnings per share is computed by dividing net income by the weighted-average number of common shares outstanding during the year. Diluted earnings per share is computed by dividing net income, adjusted on an if-converted basis if appropriate, by the weighted-average number of common shares outstanding plus the dilutive impact of common stock equivalents and convertible securities outstanding during the period. potentially dilutive impact of common stock equivalents is determined using the treasury stock method and the potentially dilutive impact of convertible senior notes is determined using the if-converted method.
We utilize the control number concept in the computation of diluted earnings per share to determine whether potential common stock equivalents are dilutive. The control number used is income from continuing operations. The control number concept requires that the same number of potentially dilutive securities applied in computing diluted earnings per share from continuing operations be applied to all other categories of income or loss, regardless of their anti-dilutive effect on such categories.
Translation of Non-U.S. Currency Amounts
The functional currency of our foreign operations is the local currency. Assets and liabilities of subsidiaries operating outside the U.S. are translated at rates in effect at the end of the period and revenue and expenses are translated at average rates during the period. Net deferred translation gains and losses are included as a component of accumulated other comprehensive loss.
We maintain a number of short-term intercompany loans with and among our foreign entities that are denominated and settled in different currencies. We have elected to not hedge this foreign currency exposure and recognize non-cash gains and losses on the revaluation of these intercompany loans in selling, general and administrative expense.
Loss Contingencies
In the ordinary course of business, we are routinely defendants in, or party to, a number of pending and threatened legal actions. On a quarterly basis, we review the status of each significant matter and assess the potential financial exposure. If the potential loss from any claim or legal action is considered probable and can be reasonably estimated, we establish a liability for the estimated loss. If the reasonable estimate of a probable loss is in a range, and no amount within the range is a better estimate than any other amount, the minimum amount of the range is recorded. The assessment of the ultimate outcome of each claim or legal action and the determination of the potential financial exposure requires significant judgment. Estimates of potential liabilities for claims or legal actions are based only on information that is available at that time. As additional information becomes available, we may revise our estimates, and these revisions could have a material impact on our results of operations and financial position. Legal fees are expensed as incurred.
Accounting Pronouncements Adopted in 2025
In December 2023, the Financial Accounting Standards Board ("FASB") issued ASU 2023-09, Income Taxes (Topic 740): Improvements to Income Tax Disclosures, which requires additional income tax disclosures, including the rate reconciliation and taxes paid. We prospectively adopted this standard in the fourth quarter of 2025. See Note 15 to the Consolidated Financial Statements for further information.
Accounting Pronouncements Not Yet Adopted
In November 2025, the FASB issued ASU 2025-08, Financial Instruments - Credit Losses (Topic 326): Purchased Loans, which updates the accounting for certain acquired seasoned loans subject to the current expected credit loss model. This standard is effective for fiscal years beginning after December 15, 2026, and interim periods within fiscal years beginning after December 15, 2026, with early adoption permitted. We are currently assessing the impact this standard will have on our financial statements.
In September 2025, the FASB issued ASU 2025-06, Intangibles - Goodwill and Other - Internal-Use Software (Subtopic 350-40): Targeted Improvements to the Accounting for Internal-Use Software, which updates the timing of recognition for internal-use software costs. This standard is effective for fiscal years beginning after December 15, 2027, and interim periods within fiscal years beginning after December 15, 2027, with early adoption permitted. We are currently assessing the impact this standard will have on our financial statements.
In July 2025, the FASB issued ASU 2025-05, Financial Instruments - Credit Losses (Topic 326): Measurement of Credit Losses for Accounts Receivable and Contract Assets, which provides the option to elect a practical expedient to assume that the current
49
PITNEY BOWES INC.
NOTES TO CONSOLIDATED FINANCIAL STATEMENTS
(Tabular amounts in thousands, except per share amounts)
conditions as of the balance sheet date will remain unchanged for the remaining life of the asset when developing a reasonable and supportable forecast as part of estimating expected credit losses on those assets. This standard is effective for fiscal years beginning after December 15, 2025 and interim periods within fiscal years beginning after December 15, 2025. We are currently assessing the impact this standard will have on our financial statements.
In November 2024, the FASB issued ASU 2024-03, Income Statement - Reporting Comprehensive Income - Expense Disaggregation Disclosures (Subtopic 220-40): Disaggregation of Income Statement Expenses, which requires more detailed information about specified categories of expenses included in certain expense captions presented on the face of the income statement. This standard is effective for fiscal years beginning after December 15, 2026 and interim periods within fiscal years beginning after December 15, 2027, with early adoption permitted. We are currently assessing the impact this standard will have on our disclosures.
2. Revenue
Disaggregated Revenue
The following tables disaggregate our revenue by source and timing of recognition:
Year Ended December 31, 2025
SendTech Solutions
Presort Services
Revenue from services and products
Revenue from leasing transactions and financing
Total consolidated revenue
Revenue from services and products
Services
$
569,403
$
636,628
$
1,206,031
$
—
$
1,206,031
Products
212,768
—
212,768
151,941
364,709
Financing and other
—
—
—
321,889
321,889
Subtotal
782,171
636,628
1,418,799
$
473,830
$
1,892,629
Revenue from leasing transactions and financing
473,830
—
473,830
Total revenue
$
1,256,001
$
636,628
$
1,892,629
Timing of revenue recognition from services and products
Services/products transferred at a point in time
$
274,178
$
—
$
274,178
Services/products transferred over time
507,993
636,628
1,144,621
Total
$
782,171
$
636,628
$
1,418,799
Year Ended December 31, 2024
SendTech Solutions
Presort Services
Other operations
Revenue from services and products
Revenue from leasing transactions and financing
Total consolidated revenue
Revenue from services and products
Services
$
588,046
$
662,587
$
9,979
$
1,260,612
$
—
$
1,260,612
Products
233,960
—
—
233,960
196,885
430,845
Financing and other
—
—
—
—
335,141
335,141
Subtotal
822,006
662,587
9,979
1,494,572
$
532,026
$
2,026,598
Revenue from leasing transactions and financing
532,026
—
—
532,026
Total revenue
$
1,354,032
$
662,587
$
9,979
$
2,026,598
Timing of revenue recognition from services and products
Services/products transferred at a point in time
$
296,691
$
—
$
—
$
296,691
Services/products transferred over time
525,315
662,587
9,979
1,197,881
Total
$
822,006
$
662,587
$
9,979
$
1,494,572
50
PITNEY BOWES INC.
NOTES TO CONSOLIDATED FINANCIAL STATEMENTS
(Tabular amounts in thousands, except per share amounts)
Year Ended December 31, 2023
SendTech Solutions
Presort Services
Other operations
Revenue from services and products
Revenue from leasing transactions and financing
Total consolidated revenue
Revenue from services and products
Services
$
595,319
$
617,599
$
55,462
$
1,268,380
$
—
$
1,268,380
Products
235,853
—
—
235,853
235,595
471,448
Financing and other
—
—
—
—
339,097
339,097
Subtotal
831,172
617,599
55,462
1,504,233
$
574,692
$
2,078,925
Revenue from leasing transactions and financing
574,692
—
—
574,692
Total revenue
$
1,405,864
$
617,599
$
55,462
$
2,078,925
Timing of revenue recognition from services and products
Services/products transferred at a point in time
$
306,415
$
—
$
—
$
306,415
Services/products transferred over time
524,757
617,599
55,462
1,197,818
Total
$
831,172
$
617,599
$
55,462
$
1,504,233
Our performance obligations for revenue from products and services are as follows:
Services revenue includes revenues from digital shipping and mailing technology solutions and the maintenance, professional and subscription services related to those solutions, mail processing services and cross-border solutions. Revenues for mail processing services and cross-border solutions are recognized over time using an output method based on the number of parcels or mail pieces either processed or delivered, depending on the service type, since that measure best depicts the value of goods and services transferred to the client over the contract period. Contract terms for these services initially range from one to five years and contain annual renewal options. Revenue for shipping subscription services is recognized ratably over the contract period as the client obtains equal benefit from these services throughout the period. Revenue for maintenance and subscription services is recognized ratably over the contract period, which ranges from one to five years, and revenue for professional services is recognized when services are provided.
Products revenue generally includes the sale of mailing and shipping equipment and related supplies. We recognize revenue upon delivery for self-install equipment and supplies and upon acceptance or installation for other equipment.
Financing and other revenue includes revenue from sales-type and operating leases, finance income, fees and investment income, gains and losses at the Pitney Bowes Bank.
Advance Billings from Contracts with Customers
Balance Sheet Location
December 31, 2025
December 31, 2024
Increase/ (decrease)
Advance billings, current
Advance billings
$
63,528
$
63,732
$
(204)
Advance billings, noncurrent
Other noncurrent liabilities
$
102
$
159
$
(57)
Advance billings are recorded when cash payments are due in advance of our performance. Revenue is recognized ratably over the contract term. Items in advance billings primarily relate to maintenance services on mailing equipment. Revenue recognized during the twelve months ended December 31, 2025 includes $52 million of advance billings at the beginning of the period. Current advance billings at both December 31, 2025 and 2024 also includes $6 million from leasing transactions.
Future Performance Obligations
Future performance obligations primarily include maintenance and subscription services bundled with our leasing contracts. The transaction prices allocated to future performance obligations will be recognized as follows:
2026
2027
2028-2030
Total
SendTech Solutions
$
249,451
$
185,279
$
207,734
$
642,464
These amounts do not include revenue for performance obligations under contracts with terms less than 12 months or revenue for performance obligations where revenue is recognized based on the amount billable to the customer.
51
PITNEY BOWES INC.
NOTES TO CONSOLIDATED FINANCIAL STATEMENTS
(Tabular amounts in thousands, except per share amounts)
3. Segment Information
Our reportable segments are SendTech Solutions and Presort Services. SendTech Solutions includes the revenue and related expenses from physical and digital mailing and shipping technology solutions, financing, services, supplies and other applications to help simplify and save on the sending, tracking and receiving of letters, parcels and flats. Presort Services includes the revenue and related expenses from sortation services to qualify large volumes of First Class Mail, First Class Flats, Marketing Mail and Marketing Mail Flats/Bound Printed Matter for postal worksharing discounts.
Other operations in 2024 and 2023 includes the revenue and related expenses of the operations and shared services of the former Global Ecommerce reporting segment that did not qualify for discontinued operations treatment. .
Management, including our Chief Executive Officer, who is the Chief Operating Decision Maker (CODM), measures segment profitability and performance using adjusted segment earnings before interest and taxes (EBIT). Adjusted segment EBIT is calculated by deducting from segment revenue the related costs and expenses attributable to the segment. Adjusted segment EBIT excludes interest, taxes, general corporate expenses, restructuring charges, goodwill impairment charges and other items not allocated to a particular business segment. Management believes that adjusted segment EBIT provides investors a useful measure of operating performance and underlying trends of the business. Adjusted segment EBIT may not be indicative of our overall consolidated performance and therefore, should be read in conjunction with our consolidated results of operations. The following tables provide information about our reportable segments and a reconciliation of adjusted segment EBIT to income or loss from continuing operations before income taxes.
Revenue
Years Ended December 31,
2025
2024
2023
SendTech Solutions
$
1,256,001
$
1,354,032
$
1,405,864
Presort Services
636,628
662,587
617,599
Total segment revenue
1,892,629
2,016,619
2,023,463
Other operations
—
9,979
55,462
Total revenue
$
1,892,629
$
2,026,598
$
2,078,925
Geographic data:
United States
$
1,594,983
$
1,700,864
$
1,712,079
Outside United States
297,646
325,734
366,846
Total revenue
$
1,892,629
$
2,026,598
$
2,078,925
52
PITNEY BOWES INC.
NOTES TO CONSOLIDATED FINANCIAL STATEMENTS
(Tabular amounts in thousands, except per share amounts)
Years Ended December 31,
2025
2024
2023
SendTech Solutions
Revenue
$
1,256,001
$
1,354,032
$
1,405,864
Less:
Cost of revenue
422,316
479,772
517,742
Operating expenses
421,496
489,509
512,740
Adjusted segment EBIT
$
412,189
$
384,751
$
375,382
Presort Services
Revenue
$
636,628
$
662,587
$
617,599
Less:
Cost of revenue
398,771
417,741
432,229
Operating expenses
72,580
79,062
74,458
Adjusted segment EBIT
$
165,277
$
165,784
$
110,912
Adjusted Segment EBIT
Years Ended December 31,
2025
2024
2023
SendTech Solutions
$
412,189
$
384,751
$
375,382
Presort Services
165,277
165,784
110,912
Total adjusted segment EBIT
577,466
550,535
486,294
Reconciling items:
Other operations
—
(12,821)
(2,625)
Interest expense, net
(149,156)
(173,694)
(162,050)
Corporate expenses
(116,173)
(152,503)
(175,951)
Restructuring charges
(58,392)
(76,915)
(52,412)
Pension settlement
—
(91,339)
—
Impairment charges
(268)
(10,000)
(123,574)
(Loss) gain on debt redemption/refinancing
(14,072)
(10,892)
3,064
Proxy solicitation fees
—
—
(10,905)
Foreign currency (loss) gain on intercompany loans
(21,944)
10,243
(5,761)
Charges in connection with Ecommerce Restructuring
(12,758)
(67,831)
—
Transaction and Strategic review costs
(12,179)
(17,110)
—
Income (loss) from continuing operations before income taxes
$
192,524
$
(52,327)
$
(43,920)
Depreciation and amortization
Years Ended December 31,
2025
2024
2023
SendTech Solutions
45,524
45,868
46,979
Presort Services
37,029
35,825
33,642
Total reportable segments
82,553
81,693
80,621
Corporate
29,022
32,276
30,119
Other operations
—
516
1,984
Total depreciation and amortization
$
111,575
$
114,485
$
112,724
53
PITNEY BOWES INC.
NOTES TO CONSOLIDATED FINANCIAL STATEMENTS
(Tabular amounts in thousands, except per share amounts)
Capital expenditures
Years Ended December 31,
2025
2024
2023
SendTech Solutions
$
42,573
$
44,351
$
44,975
Presort Services
14,026
11,011
11,182
Total reportable segments
56,599
55,362
56,157
Corporate
9,679
13,829
18,099
Other operations
—
3,212
3,853
Total capital expenditures
$
66,278
$
72,403
$
78,109
Assets
December 31,
2025
2024
2023
SendTech Solutions
$
1,963,310
$
1,981,753
$
2,081,199
Presort Services
485,877
478,420
500,757
Total reportable segments
2,449,187
2,460,173
2,581,956
Cash and cash equivalents
284,887
469,726
600,054
Short-term investments
12,232
16,374
22,166
Long-term investments
204,876
190,436
250,240
Other corporate assets
217,769
260,807
285,328
Assets of discontinued operations
—
—
532,441
Consolidated assets
$
3,168,951
$
3,397,516
$
4,272,185
Identifiable long-lived assets:
United States
$
303,039
$
345,457
$
390,471
Outside United States
13,924
11,143
13,682
Total
$
316,963
$
356,600
$
404,153
54
PITNEY BOWES INC.
NOTES TO CONSOLIDATED FINANCIAL STATEMENTS
(Tabular amounts in thousands, except per share amounts)
4. Discontinued Operations
On August 8, 2024, we entered into a series of transactions designed to facilitate an orderly wind-down of a majority of the Company’s Global Ecommerce reporting segment. In connection with the wind-down, an affiliate of Hilco Commercial Industrial, LLC (“Hilco”) subscribed for 81% of the voting interests in the subsidiary, DRF Logistics, LLC owning a majority of the Global Ecommerce segment’s net assets and operations (DRF Logistics, LLC and its subsidiary, DRF LLC, the “Ecommerce Debtors”) for de minimis consideration(the “GEC Sale”), with a subsidiary of Pitney Bowes retaining 19% of the voting interests and 100% of the economic interests.
Subsequent to the GEC Sale, the Ecommerce Debtors, at the direction of their own governing bodies, filed petitions to commence Chapter 11 bankruptcy cases and conduct an orderly wind-down of the Ecommerce Debtors (the “GEC Chapter 11 Cases”). As a result of the GEC Chapter 11 Cases, the Company determined that it no longer had control of the Ecommerce Debtors and therefore, the Ecommerce Debtors were deconsolidated. We refer to the GEC Sale, the GEC Chapter 11 Cases and any associated transactions as the “Ecommerce Restructuring”.
On November 25, 2024, the Bankruptcy Court confirmed the Ecommerce Debtors’ Third Amended Joint Plan of Liquidation (the “Plan”) and on December 9, 2024, the Plan became effective in accordance with its terms, substantially consummating the separation of the Company from the Ecommerce Debtors.
In connection with the GEC Chapter 11 Cases, we provided a senior secured, super-priority debtor-in-possession term loan (the “DIP Facility”) to the Ecommerce Debtors and provided initial funding of $28 million. Through December 31, 2025, we've received repayments of $20 million. The remaining unpaid balance on the DIP Facility is fully reserved and any future repayments will be recorded as income.
We account for the investment in the Ecommerce Debtors using the equity method, but have ascribed a fair value of our economic interest in the Ecommerce Debtors of zero. We do not anticipate receiving any recovery or distribution from our economic equity interest and remain exposed to the economic risks and continued costs applicable to the Ecommerce Debtors through our investment in the DIP Facility.
Financial information of discontinued operations is as follows:
Years Ended December 31,
2024
2023
Revenue
$
728,462
$
1,187,423
Cost of revenue
737,856
1,195,975
Selling, general and administrative
105,909
115,652
Goodwill impairment
—
215,610
Other
12,589
22,769
Total costs and expenses
856,354
1,550,006
Loss from discontinued operations
(127,892)
(362,583)
Loss on sale
(213,842)
—
Loss from discontinued operations before taxes
(341,734)
(362,583)
Tax benefit
(35,635)
(38,223)
Loss from discontinued operations, net of tax
$
(306,099)
$
(324,360)
55
PITNEY BOWES INC.
NOTES TO CONSOLIDATED FINANCIAL STATEMENTS
(Tabular amounts in thousands, except per share amounts)
5. Earnings per Share (EPS)
The calculations of basic and diluted EPS are presented below. The sum of EPS amounts may not equal the totals due to rounding.
Years Ended December 31,
2025
2024
2023
Numerator:
Income (loss) from continuing operations
$
144,697
$
102,502
$
(61,267)
Loss from discontinued operations, net of tax
—
(306,099)
(324,360)
Net income (loss)
$
144,697
$
(203,597)
$
(385,627)
Denominator:
Weighted-average shares used in basic EPS
171,605
179,510
175,640
Dilutive effect of common stock equivalents
1,435
3,016
—
Weighted-average shares used in diluted EPS
173,040
182,526
175,640
Basic earnings (loss) per share:
Continuing operations
$
0.84
$
0.57
$
(0.35)
Discontinued operations
—
(1.71)
(1.85)
Net income (loss)
$
0.84
$
(1.13)
$
(2.20)
Diluted earnings (loss) per share:
Continuing operations
$
0.84
$
0.56
$
(0.35)
Discontinued operations
—
(1.68)
(1.85)
Net income (loss)
$
0.84
$
(1.12)
$
(2.20)
Common stock equivalents excluded from calculation of diluted earnings per share because their impact would be anti-dilutive:
Stock-based compensation awards
4,646
8,129
13,467
Convertible senior notes
16,135
—
—
Total
20,781
8,129
13,467
6. Inventories
Inventories consisted of the following:
December 31,
2025
2024
Raw materials
$
28,967
$
20,405
Supplies and service parts
16,359
15,095
Finished products
20,915
24,336
Total inventories
$
66,241
$
59,836
56
PITNEY BOWES INC.
NOTES TO CONSOLIDATED FINANCIAL STATEMENTS
(Tabular amounts in thousands, except per share amounts)
7. Finance Assets and Lessor Operating Leases
Finance Assets
All finance receivables are in our SendTech Solutions segment. We segregate our finance receivables into a North America portfolio and International portfolio. Finance receivables consisted of the following:
December 31, 2025
December 31, 2024
North America
International
Total
North America
International
Total
Sales-type lease receivables
Gross finance receivables
$
870,453
$
114,080
$
984,533
$
946,294
$
120,109
$
1,066,403
Unguaranteed residual values
33,047
6,063
39,110
36,361
5,890
42,251
Unearned income
(255,754)
(34,736)
(290,490)
(257,971)
(34,674)
(292,645)
Allowance for credit losses
(10,281)
(1,947)
(12,228)
(12,659)
(2,324)
(14,983)
Net investment in sales-type lease receivables
637,465
83,460
720,925
712,025
89,001
801,026
Loan receivables
Loan receivables
384,846
2,152
386,998
334,717
16,874
351,591
Allowance for credit losses
(6,334)
(14)
(6,348)
(6,549)
(144)
(6,693)
Net investment in loan receivables
378,512
2,138
380,650
328,168
16,730
344,898
Net investment in finance receivables
$
1,015,977
$
85,598
$
1,101,575
$
1,040,193
$
105,731
$
1,145,924
Maturities of finance receivables at December 31, 2025 were as follows:
Sales-type Lease Receivables
Loan Receivables
North America
International
Total
North America
International
Total
2026
$
342,867
$
46,463
$
389,330
$
247,693
$
2,152
$
249,845
2027
255,789
32,589
288,378
61,348
—
61,348
2028
160,119
20,113
180,232
42,587
—
42,587
2029
81,720
10,848
92,568
25,247
—
25,247
2030
27,706
3,493
31,199
7,307
—
7,307
Thereafter
2,252
574
2,826
664
—
664
Total
$
870,453
$
114,080
$
984,533
$
384,846
$
2,152
$
386,998
57
PITNEY BOWES INC.
NOTES TO CONSOLIDATED FINANCIAL STATEMENTS
(Tabular amounts in thousands, except per share amounts)
Allowance for Credit Losses
Activity in the allowance for credit losses on finance receivables was as follows:
Allowance for Credit Losses
Sales-type Lease Receivables
Loan Receivables
North America
International
North America
International
Total
Balance at December 31, 2022
$
14,131
$
2,893
$
4,787
$
139
$
21,950
Amounts charged to expense
2,096
1,178
4,847
389
8,510
Write-offs
(4,757)
(1,448)
(5,182)
(391)
(11,778)
Recoveries
2,454
181
1,893
—
4,528
FX impact
18
(18)
1
16
17
Balance at December 31, 2023
13,942
2,786
6,346
153
23,227
Amounts charged to expense
1,176
450
5,363
382
7,371
Write-offs
(4,233)
(870)
(6,587)
(379)
(12,069)
Recoveries
1,635
178
1,801
—
3,614
FX impact
139
(220)
(374)
(12)
(467)
Balance at December 31, 2024
12,659
2,324
6,549
144
21,676
Amounts charged to expense
830
(25)
4,018
277
5,100
Write-offs
(5,529)
(646)
(5,058)
(419)
(11,652)
Recoveries
2,244
169
819
—
3,232
FX impact
77
125
6
12
220
Balance at December 31, 2025
$
10,281
$
1,947
$
6,334
$
14
$
18,576
The table below shows write-offs of gross finance receivables by year of origination.
December 31, 2025
Sales Type Lease Receivables
Loan Receivables
Total
2025
2024
2023
2022
2021
Prior
Write-offs
$
296
$
1,041
$
1,439
$
1,672
$
1,129
$
598
$
5,477
$
11,652
December 31, 2024
Sales Type Lease Receivables
Loan Receivables
Total
2024
2023
2022
2021
2020
Prior
Write-offs
$
144
$
1,104
$
1,702
$
1,063
$
749
$
341
$
6,966
$
12,069
December 31, 2023
Sales Type Lease Receivables
Loan Receivables
Total
2023
2022
2021
2020
2019
Prior
Write-offs
$
883
$
1,680
$
1,551
$
1,079
$
619
$
393
$
5,573
$
11,778
58
PITNEY BOWES INC.
NOTES TO CONSOLIDATED FINANCIAL STATEMENTS
(Tabular amounts in thousands, except per share amounts)
Aging of Receivables
The aging of gross finance receivables was as follows:
December 31, 2025
Sales-type Lease Receivables
Loan Receivables
North America
International
North America
International
Total
Past due amounts 0 - 90 days
$
861,059
$
111,809
$
382,697
$
1,746
$
1,357,311
Past due amounts > 90 days
9,394
2,271
2,149
406
14,220
Total
$
870,453
$
114,080
$
384,846
$
2,152
$
1,371,531
December 31, 2024
Sales-type Lease Receivables
Loan Receivables
North America
International
North America
International
Total
Past due amounts 0 - 90 days
$
932,948
$
117,908
$
331,411
$
16,809
$
1,399,076
Past due amounts > 90 days
13,346
2,201
3,306
65
18,918
Total
$
946,294
$
120,109
$
334,717
$
16,874
$
1,417,994
Credit Quality
The extension of credit and management of credit lines to new and existing clients uses a combination of a client's credit score, where available, a detailed manual review of their financial condition and payment history or an automated process. Once credit is granted, the payment performance of the client is managed through automated collections processes and is supplemented with direct follow up should an account become delinquent. We have robust automated collections and extensive portfolio management processes to ensure that our global strategy is executed, collection resources are allocated and enhanced tools and processes are implemented as needed.
Over 90% of our finance receivables are within our North American portfolio. We use a third party to score the majority of this portfolio on a quarterly basis using a proprietary credit score. The relative scores are determined based on a number of factors, including financial information, payment history, company type and ownership structure. We stratify the credit scores of our clients into low, medium and high-risk accounts. Due to timing and other issues, our entire portfolio may not be scored at period end. We report these amounts as "Not Scored"; however, absence of a score is not indicative of the credit quality of the account. The credit score is used to predict client payment behaviors and the probability that an account will become greater than 90 days past due during the subsequent 12-month period.
•Low risk accounts are companies with very good credit scores and a predicted delinquency rate of less than 5%.
•Medium risk accounts are companies with average to good credit scores and a predicted delinquency rate between 5% and 10%.
•High risk accounts are companies with poor credit scores, are delinquent or are at risk of becoming delinquent. The predicted delinquency rate would be greater than 10%.
We do not use a third party to score our International portfolio because the cost to do so is prohibitive as there is no single credit score model that covers all countries. Accordingly, the entire International portfolio is reported in the Not Scored category. Most of the International credit applications are subjected to an automated review process, while larger dollar value credit applications are manually reviewed, which includes obtaining client financial information, credit reports and other available information.
The table below shows gross finance receivables by relative risk class and year of origination based on the relative scores of the accounts within each class as of December 31, 2025 and 2024.
Sales Type Lease Receivables
Loan Receivables
Total
2025
2024
2023
2022
2021
Prior
Low
$
150,688
$
153,596
$
153,844
$
106,037
$
76,774
$
76,956
$
336,943
$
1,054,838
Medium
27,793
28,927
27,310
18,950
12,719
12,754
29,701
158,154
High
2,798
2,974
2,555
2,076
1,214
1,451
4,998
18,066
Not Scored
49,845
32,817
23,710
12,157
4,531
2,057
15,356
140,473
Total
$
231,124
$
218,314
$
207,419
$
139,220
$
95,238
$
93,218
$
386,998
$
1,371,531
59
PITNEY BOWES INC.
NOTES TO CONSOLIDATED FINANCIAL STATEMENTS
(Tabular amounts in thousands, except per share amounts)
Sales Type Lease Receivables
Loan Receivables
Total
2024
2023
2022
2021
2020
Prior
Low
$
188,847
$
210,547
$
163,892
$
104,269
$
66,673
$
42,586
$
273,736
$
1,050,550
Medium
31,970
31,839
26,652
19,180
10,556
10,512
34,376
165,085
High
4,633
4,488
3,753
2,415
2,038
684
11,826
29,837
Not Scored
49,835
38,659
28,250
17,131
5,400
1,594
31,653
172,522
Total
$
275,285
$
285,533
$
222,547
$
142,995
$
84,667
$
55,376
$
351,591
$
1,417,994
Lease Income
Lease income from sales-type leases, excluding variable lease payments, was as follows:
Years Ended December 31,
2025
2024
2023
Profit recognized at commencement
$
75,390
$
101,600
$
120,011
Interest income
149,999
152,348
154,998
Total lease income from sales-type leases
$
225,389
$
253,948
$
275,009
Lessor Operating Leases
We lease mailing equipment under operating leases with terms of one to five years. Revenue from operating leases for the years ended December 31, 2025, 2024 and 2023 were $58 million, $65 million and $68 million, respectively. Maturities of these operating leases are as follows:
2026
$
25,966
2027
16,716
2028
7,281
2029
4,271
2030
1,753
Thereafter
59
Total
$
56,046
8. Fixed Assets
Fixed assets consisted of the following:
December 31,
2025
2024
Machinery and equipment
$
493,157
$
538,255
Internal-use software
445,693
435,614
Leasehold improvements
77,080
84,987
1,015,930
1,058,856
Accumulated depreciation
(830,017)
(840,199)
Property, plant and equipment, net
$
185,913
$
218,657
Rental property and equipment
$
57,571
$
64,293
Accumulated depreciation
(33,517)
(39,706)
Rental property and equipment, net
$
24,054
$
24,587
Depreciation expense was $107 million, $110 million and $108 million for the years ended December 31, 2025, 2024 and 2023, respectively.
60
PITNEY BOWES INC.
NOTES TO CONSOLIDATED FINANCIAL STATEMENTS
(Tabular amounts in thousands, except per share amounts)
9. Intangible Assets and Goodwill
Intangible Assets
Intangible assets consisted of the following:
December 31, 2025
December 31, 2024
Gross Carrying Amount
Accumulated Amortization
Net Carrying Amount
Gross Carrying Amount
Accumulated Amortization
Net Carrying Amount
Customer relationships
$
32,032
$
(18,490)
$
13,542
$
43,569
$
(29,179)
$
14,390
Software & technology
1,230
(31)
1,199
2,944
(1,554)
1,390
Total intangible assets, net
$
33,262
$
(18,521)
$
14,741
$
46,513
$
(30,733)
$
15,780
Amortization expense was $5 million for each of the years ended December 31, 2025, 2024 and 2023.
Future amortization expense for intangible assets at December 31, 2025 is shown in the table below. Actual amortization expense may differ from the amounts above due to fluctuations in foreign currency exchange rates, acquisitions, divestitures and impairment charges.
2026
$
3,584
2027
3,438
2028
2,871
2029
1,789
2030
939
Thereafter
2,120
Total
$
14,741
Goodwill
Changes in the carrying amount of goodwill by reporting segment are shown in the tables below.
December 31, 2023
FX Impact
December 31, 2024
FX Impact
December 31, 2025
SendTech Solutions
510,646
(13,406)
$
497,240
$
25,684
$
522,924
Presort Services
223,763
—
223,763
—
223,763
Total goodwill
$
734,409
$
(13,406)
$
721,003
$
25,684
$
746,687
During 2023, the performance of our then Global Ecommerce reporting unit, continuing changes in macroeconomic conditions and our long-term outlook for this business were triggering events that caused us to evaluate the Global Ecommerce goodwill for impairment. To assess goodwill for impairment, we determined the fair value of the reporting unit and compared it to the unit's carrying value, including goodwill. We engaged a third party to assist in the determination of the fair value of the reporting unit. The fair value was estimated using a discounted cash flow model based on management developed cash flow projections, which included judgements and assumptions related to revenue growth rates, operating margins, operating income, and a discount rate. The estimates and assumptions were considered Level 3 inputs under the fair value hierarchy. Our assessments indicated that the estimated fair value of the reporting unit was less than its carrying value. Accordingly, a goodwill impairment charge of $124 million was recorded in 2023.
61
PITNEY BOWES INC.
NOTES TO CONSOLIDATED FINANCIAL STATEMENTS
(Tabular amounts in thousands, except per share amounts)
10. Fair Value Measurements and Derivative Instruments
We measure certain financial assets and liabilities at fair value on a recurring basis. Fair value is a market-based measure considered from the perspective of a market participant rather than an entity-specific measure. An entity is required to classify certain assets and liabilities measured at fair value based on the following fair value hierarchy that prioritizes the inputs used to measure fair value:
Level 1 – Unadjusted quoted prices in active markets for identical assets and liabilities.
Level 2 – Quoted prices for identical assets and liabilities in markets that are not active, quoted prices for similar assets and liabilities in active markets or other inputs that are observable or can be corroborated by observable market data for substantially the full term of the assets or liabilities.
Level 3– Unobservable inputs that are supported by little or no market activity, may be derived from internally developed methodologies based on management's best estimate of fair value and that are significant to the fair value of the asset or liability.
Financial assets and liabilities are classified in their entirety based on the lowest level of input that is significant to the fair value measurement. Our assessment of the significance of a particular input to the fair value measurement requires judgment and may affect its placement within the fair value hierarchy.
The fair value table as of December 31, 2024 has been revised to exclude certain interest-bearing savings accounts that were previously reported within the money market funds line item that should not have been included in the fair value table based on the nature of these deposits, and to correct for certain other leveling disclosure errors. Additionally, the Held-to-Maturities Securities disclosure as of December 31, 2024 has been revised to exclude certain short-term savings products that do not meet the definition of securities and the investments in a loss position has been revised to correct for classification errors between the greater than 12 months and less than 12 months disclosure. These revisions impact our footnote disclosure only and had no impact on our consolidated financial statements for any interim or annual periods.
The following tables show, by level within the fair value hierarchy, our financial assets and liabilities that are accounted for at fair value on a recurring basis.
December 31, 2025
Level 1
Level 2
Level 3
Total
Assets:
Money market funds
$
47,239
$
—
$
—
$
47,239
Mutual funds
11,852
—
—
11,852
Government securities
120
13,366
—
13,486
Corporate debt securities
—
43,895
—
43,895
Mortgage-backed securities
—
89,002
—
89,002
Asset-backed securities
—
20,203
—
20,203
Total assets
$
59,211
$
166,466
$
—
$
225,677
Liabilities:
Deferred compensation obligations
$
—
$
13,741
$
—
$
13,741
Total liabilities
$
—
$
13,741
$
—
$
13,741
62
PITNEY BOWES INC.
NOTES TO CONSOLIDATED FINANCIAL STATEMENTS
(Tabular amounts in thousands, except per share amounts)
December 31, 2024
Level 1
Level 2
Level 3
Total
Assets:
Money market funds
$
65,251
$
—
$
—
$
65,251
Mutual funds
14,664
—
—
14,664
Government securities
2,334
13,410
—
15,744
Corporate debt securities
—
42,159
—
42,159
Mortgage-backed securities
—
90,628
—
90,628
Asset-backed securities
—
7,836
—
7,836
Total assets
$
82,249
$
154,033
$
—
$
236,282
Liabilities:
Deferred compensation obligations
$
—
$
16,309
$
—
$
16,309
Total liabilities
$
—
$
16,309
$
—
$
16,309
The valuation of investment securities is based on a market approach using inputs that are observable, or can be corroborated by observable data, in an active marketplace. The following information relates to our classification within the fair value hierarchy:
Assets
•Money Market Funds: Money market funds typically invest in securities issued by the U.S. government and its agencies and other highly liquid, low risk securities. The fair value of money market funds is based on the net asset value as reported daily by the underlying money market fund and serves as the basis for subscriptions and redemptions. Accordingly, money market funds are classified as Level 1.
•Mutual Funds: Comprised of mutual funds investing in equity securities of U.S. and foreign companies and a variety of fixed income securities. Mutual fund investments are primarily held in our deferred compensation plan (see Deferred Compensation Obligation below). The fair value of mutual funds is based on the net asset value as reported daily by the underlying mutual fund and serves as the basis for subscriptions and redemptions. Accordingly, mutual funds are classified as Level 1.
•Government Securities: Government securities consist primarily of municipal bonds and U.S. agency securities. Government securities are classified as Level 1 when unadjusted quoted prices in active markets are available and as Level 2 when fair value is determined using quoted market prices for similar securities or benchmarking models which derive prices based on observable transactions for comparable securities.
•Corporate Debt Securities: Corporate debt securities are valued using recently executed comparable transactions, market price quotations or bond spreads for the same maturity as the security. Accordingly, these securities are classified as Level 2.
•Mortgage-Backed Securities: Comprised of residential and commercial mortgage-backed securities issued by FHLMC (Federal Home Loan Mortgage Corporation; Freddie Mac), FNMA (Federal National Mortgage Association; Fannie Mae), GNMA (Governmental National Mortgage Association, also known as Ginnie Mae), and FHA (Federal Housing Administration). Fair value for these securities is determined based on prices of comparable securities, external pricing indices or external price/spread data. Accordingly, these securities are classified as Level 2.
•Asset-Backed Securities: Asset-backed securities are classified as Level 2 as fair value for these securities is determined based on prices of comparable securities, external pricing indices or external price/spread data.
Liabilities
•Deferred Compensation Obligation: we offer certain eligible employees the option to defer a portion of their variable compensation and invest this deferred compensation among a variety of investment options. The deferred compensation obligation represents the aggregate value of the participants' accounts at the end of the reporting period. The fair value of the deferred compensation obligation is determined based on the underlying asset values and is classified as Level 2. The deferred compensation obligation is reported in Accounts payable and accrued liabilities on our Consolidated Balance Sheet.
63
PITNEY BOWES INC.
NOTES TO CONSOLIDATED FINANCIAL STATEMENTS
(Tabular amounts in thousands, except per share amounts)
Available-For-Sale Securities
Available-for-sale securities consisted of the following:
December 31, 2025
Amortized cost
Gross unrealized gains
Gross unrealized losses
Estimated fair value
Mutual funds
$
1,886
$
—
$
(171)
$
1,715
Government securities
19,043
—
(5,557)
13,486
Corporate debt securities
49,481
—
(5,586)
43,895
Mortgage-backed securities
107,652
—
(18,650)
89,002
Asset-backed securities
19,947
256
—
20,203
Total
$
198,009
$
256
$
(29,964)
$
168,301
December 31, 2024
Amortized cost
Gross unrealized losses
Estimated fair value
Mutual funds
$
1,835
$
(223)
$
1,612
Government securities
21,432
(5,688)
15,744
Corporate debt securities
50,367
(8,208)
42,159
Mortgage-backed securities
114,941
(24,313)
90,628
Asset-backed securities
8,348
(512)
7,836
Total
$
196,923
$
(38,944)
$
157,979
The fair value of available-for-sale securities is reported on our Consolidated Balance Sheet as follows:
December 31, 2025
December 31, 2024
Short-term investments
$
1,715
$
3,926
Other assets
166,586
154,053
Total
$
168,301
$
157,979
Investment securities in a loss position were as follows:
December 31, 2025
December 31, 2024
Fair Value
Gross unrealized losses
Fair Value
Gross unrealized losses
Greater than 12 continuous months
Mutual funds
$
1,715
$
171
$
1,612
$
223
Government securities
13,486
5,557
15,744
5,688
Corporate debt securities
43,895
5,586
42,159
8,208
Mortgage-backed securities
89,002
18,650
90,628
24,313
Asset-backed securities
—
—
7,836
512
Total
$
148,098
$
29,964
$
157,979
$
38,944
At December 31, 2025, substantially all securities in the investment portfolio were in an unrealized loss position. However, we have not recorded an allowance for credit loss or an impairment charge as we have the ability and intent to hold these securities until recovery of the unrealized losses and expect to receive the stated principal and interest at maturity.
64
PITNEY BOWES INC.
NOTES TO CONSOLIDATED FINANCIAL STATEMENTS
(Tabular amounts in thousands, except per share amounts)
At December 31, 2025, scheduled maturities of available-for-sale securities were as follows:
Amortized cost
Estimated fair value
Within 1 year
$
1,886
$
1,715
After 1 year through 5 years
25,093
23,036
After 5 years through 10 years
41,482
39,405
After 10 years
129,548
104,145
Total
$
198,009
$
168,301
The actual maturities may not coincide with scheduled maturities as certain securities contain early redemption features and/or allow for the prepayment of obligations with or without penalty.
Held-to-Maturity Securities
The carrying value and fair value of investments classified as held-to-maturity is as follows:
December 31, 2025
December 31, 2024
Carrying value
Fair value
Carrying value
Fair value
Government securities
$
19,865
$
19,787
$
20,308
$
20,219
Other
4,408
4,134
2,480
2,242
Total
$
24,273
$
23,921
$
22,788
$
22,461
The carrying value of held-to-maturity securities is reported on our Consolidated Balance Sheet as follows:
December 31, 2025
December 31, 2024
Short-term investments
$
10,522
$
12,448
Other assets
13,751
10,340
Total
$
24,273
$
22,788
Scheduled maturities of held-to-maturity securities at December 31, 2025 were as follows:
Carrying value
Fair value
Within 1 year
$
10,522
$
10,490
After 1 year through 5 years
7,633
7,589
After 10 years
6,118
5,842
Total
$
24,273
$
23,921
Simple Agreement for Future Equity (SAFE) Investment
We had invested $10 million in a robotics solutions company, via a SAFE arrangement, which provided us the right to participate in future equity offerings. Due to the loss of a significant customer of the robotics solutions company, in the third quarter of 2024 we determined the investment was impaired and recorded a $10 million impairment charge.
Derivative Instruments
We did not enter into any derivative instruments during 2025.
During 2024, we had interest rate swap agreements that effectively converted $200 million of variable rate debt to fixed rates. These swaps were designated as cash flow hedges. The swaps were recorded at fair value at the end of each reporting period with the change in fair value reflected in AOCL. For the twelve months ended December 31, 2024, the amount recognized in AOCL was a loss of $8 million and the amount reclassified from AOCL to earnings was a gain of $10 million. These swap agreements matured on December 31, 2024.
65
PITNEY BOWES INC.
NOTES TO CONSOLIDATED FINANCIAL STATEMENTS
(Tabular amounts in thousands, except per share amounts)
Fair Value of Financial Instruments
Our financial instruments include cash equivalents, accounts receivables, finance receivables, accounts payable and debt. The carrying values of cash equivalents, accounts receivables, finance receivables and accounts payable approximate fair value. The inputs used to estimate fair value of cash equivalents, accounts receivables, finance receivables and accounts payable were Level 2.
The inputs used to estimate the fair value of debt were Level 2 and included recently executed transactions and market price quotations.
December 31,
2025
2024
Carrying value
$
1,993,038
$
1,919,708
Fair value
$
1,954,304
$
1,823,430
11. Supplemental Financial Statement Information
Selected balance sheet information is as follows:
December 31,
2025
2024
Other assets:
Long-term investments
$
204,876
$
190,436
Other
84,644
85,653
Total
$
289,520
$
276,089
Accounts payable and accrued liabilities:
Accounts payable
$
230,045
$
239,740
Customer deposits
272,251
255,892
Employee related liabilities
187,146
234,895
Other
155,936
143,099
Total
$
845,378
$
873,626
Other noncurrent liabilities:
Pension liabilities
$
94,414
$
105,766
Postretirement medical benefits
67,334
70,390
Other
42,136
38,870
Total
$
203,884
$
215,026
Activity in the allowance for credit losses, other than finance receivables (see Note 7 to the Consolidated Financial Statements for further information) is presented below.
Years Ended December 31,
2025
2024
2023
Balance at beginning of year
$
27,096
$
5,292
$
5,372
Amounts charged to expense
(773)
25,184
5,709
Write-offs, recoveries and other
(8,350)
(3,380)
(5,789)
Balance at end of period
$
17,973
$
27,096
$
5,292
Accounts and other receivables
$
7,507
$
7,723
$
5,292
Other current assets and prepayments
10,466
19,373
—
Total
$
17,973
$
27,096
$
5,292
Amounts charged to expense for the year ended December 31, 2025 includes a credit of $9 million related to a DIP Facility reimbursement. See Note 4 to the Consolidated Financial Statements for further information.
66
PITNEY BOWES INC.
NOTES TO CONSOLIDATED FINANCIAL STATEMENTS
(Tabular amounts in thousands, except per share amounts)
Interest expense, net
Interest expense, net for the years ended December 31, 2025, 2024 and 2023 includes $8 million, $14 million and $14 million of interest income, respectively.
Other expense (income) consisted of the following:
Years Ended December 31,
2025
2024
2023
Loss (gain) on redemption/refinancing of debt
$
14,072
$
10,892
$
(3,064)
Charges in connection with the Ecommerce Restructuring
12,758
67,831
—
Asset impairment
—
10,000
—
Other expense (income)
$
26,830
$
88,723
$
(3,064)
Supplemental cash flow information is as follows:
Years Ended December 31,
2025
2024
2023
Purchases of property and equipment in accounts payable
$
1,248
$
1,719
$
2,068
Cash interest paid
$
142,107
$
167,890
$
164,046
67
PITNEY BOWES INC.
NOTES TO CONSOLIDATED FINANCIAL STATEMENTS
(Tabular amounts in thousands, except per share amounts)
12. Restructuring Charges
2025 Plan
During the third quarter of 2025, we approved a targeted restructuring plan which was not anticipated to be material. In October 2025, we finalized an additional organizational review, that together with the targeted restructuring plan, will comprise a worldwide restructuring plan (the "2025 Plan"). Under the 2025 Plan, we expect to eliminate 300-400 positions and incur total charges of $35 million-$45 million. We expect these actions will be completed by the first half of 2026 and will generate annualized savings of $35 million-$50 million. During 2025, we eliminated approximately 360 positions and incurred charges of $36 million.
Additionally, in the fourth quarter of 2025, we made the decision to close our corporate office in Stamford, Connecticut effective December 31, 2025. As a result, we recorded an abandonment charge of $7 million.
2024 Plan
We completed our 2024 Plan in the second quarter of 2025. Under this plan, we eliminated approximately 3,200 positions and incurred cumulative charges of $89 million.
2023 Plan
We completed our 2023 Plan in the second quarter of 2024. Under this plan, we eliminated 1,049 positions and incurred cumulative charges of $69 million.
Activity in our restructuring reserves was as follows:
2025 Plan
2024 Plan
2023 Plan
Total
Balance at December 31, 2023
$
—
$
—
$
26,128
$
26,128
Amounts charged to expense - continuing operations
—
66,294
10,621
76,915
Amounts charged to expense - discontinued operations
—
7,265
—
7,265
Cash payments
—
(50,150)
(35,874)
(86,024)
Noncash activity
—
(245)
(875)
(1,120)
Balance at December 31, 2024
—
23,164
—
23,164
Amounts charged to expense - continuing operations
43,186
15,206
—
58,392
Cash payments
(6,157)
(35,181)
—
(41,338)
Noncash activity
(6,989)
(1,396)
—
(8,385)
Balance at December 31, 2025
$
30,040
$
1,793
$
—
$
31,833
Components of restructuring expense in discontinued operations primarily include severance charges. Components of restructuring expense in continuing operations were as follows:
Year Ended December 31, 2025
2025 Plan
2024 Plan
Total
Severance
$
36,158
$
13,810
$
49,968
Facilities and other
7,028
1,396
8,424
Total
$
43,186
$
15,206
$
58,392
Year Ended December 31, 2024
2024 Plan
2023 Plan
Total
Severance
$
65,958
$
9,398
$
75,356
Facilities and other
336
1,223
1,559
Total
$
66,294
$
10,621
$
76,915
Year Ended December 31, 2023
2023 Plan
Prior Plan
Total
Severance
$
40,152
$
3,057
$
43,209
Facilities and other
8,661
542
9,203
Total
$
48,813
$
3,599
$
52,412
68
PITNEY BOWES INC.
NOTES TO CONSOLIDATED FINANCIAL STATEMENTS
(Tabular amounts in thousands, except per share amounts)
13. Debt
December 31,
Interest rate
2025
2024
Term loan due March 2026
SOFR + 2.25%
$
—
$
235,000
Notes due March 2027
6.875%
346,700
380,000
Notes due March 2028
SOFR + 6.9%
—
96,563
Term loan due March 2028
SOFR + 4.0%
—
433,125
Term loan due March 2028
SOFR + 2.10%
154,000
—
Notes due March 2029
7.25%
326,000
350,000
Convertible Notes due August 2030
1.50%
230,000
—
Term loan due March 2032
SOFR + 3.75%
588,567
—
Notes due January 2037
5.25%
31,666
35,841
Notes due March 2043
6.70%
349,279
425,000
Principal amount
2,026,212
1,955,529
Less: unamortized costs, net
33,174
35,821
Total debt
1,993,038
1,919,708
Less: current portion long-term debt
17,150
53,250
Long-term debt
$
1,975,888
$
1,866,458
In the first quarter of 2025, we redeemed the remaining outstanding balance of the Notes due March 2028 and recorded a loss of $17 million. Additionally, we entered into a new senior secured credit agreement (the "New Credit Agreement"), which provided a $265 million revolving credit facility (subsequently increased to $400 million during 2025) maturing March 2028, a $160 million term loan maturing March 2028 and a $615 million term loan maturing March 2032. The proceeds from the new term loans were used to repay the outstanding balances of the Term loan due March 2026 and Term loan due March 2028, under our prior agreement and for general corporate purposes. We recorded a loss of $8 million in connection with this refinance.
Under the New Credit Agreement, we are required to maintain (i) a Consolidated Interest Coverage Ratio (as defined in the New Credit Agreement) of not less than 2.00 to 1.00, (ii) a Consolidated Secured Net Leverage Ratio (as defined in the New Credit Agreement) of no greater than 3.00 to 1.00 and (iii) a Consolidated Total Net Leverage Ratio (as defined in the New Credit Agreement) of no greater than 5.25 to 1.00 for the fiscal quarters ending March 31, 2025 and June 30, 2025, 5.00 to 1.00 for the fiscal quarter ending December 31, 2025 and 4.75 to 1.00 for each fiscal quarter ending on or after March 31, 2026. At December 31, 2025, we were in compliance with these financial covenants and there were no outstanding borrowings under the revolving credit facility. Borrowings under our New Credit Agreement are secured by assets of the Company.
The New Credit Agreement also contains provisions whereby if, on any day between the period commencing on September 14, 2026 and ending on March 15, 2027, the Notes due March 2027 have not been redeemed in full and liquidity is less than an amount equal to the amount to redeem the Notes due March 2027 plus $100 million, the Term loan due March 2028 and any borrowings under the revolving credit facility would become due on such date (the "Pro Rata Springing Maturity Date"), and if on any date during the period beginning on December 14, 2026 and ending on March 15, 2027, the Notes due March 2027 remain outstanding and the Pro Rata Springing Maturity Date has occurred, the Term loan due March 2032 would be become due on the date that is 91 days after the Pro Rata Springing Maturity Date. We are considering various strategies and intend to redeem the Notes due March 2027 before September 2026 either with available liquidity or refinance through the capital markets.
The New Credit Agreement contains affirmative and negative covenants that are usual and customary, including negative covenants that, subject to the exceptions set forth in the New Credit Agreement, limit the ability for the Company and its restricted subsidiaries to incur additional debt, incur or permit liens on assets, make investments and acquisitions, consolidate or merge with any other company, engage in asset sales and make dividends and distributions.
In August 2025, we issued an aggregate $230 million convertible senior notes (the "Convertible Notes") pursuant to an indenture, dated August 8, 2025 (the "Indenture"), among the Company, the guarantors party thereto and Truist Bank, as trustee. The Convertible Notes accrue interest at a rate of 1.50% per annum, payable semi-annually in arrears on February 15 and August 15 of each year. The Convertible Notes will mature on August 15, 2030, unless earlier repurchased, redeemed or converted. Prior to May 15, 2030, the Convertible Notes will be convertible only upon satisfaction of certain conditions and during certain periods, and, thereafter, the Convertible Notes will be convertible at any time until the close of business on the second scheduled trading day immediately preceding the maturity date. The initial conversion rate is 70.1533 shares of common stock per $1,000 principal amount, which
69
PITNEY BOWES INC.
NOTES TO CONSOLIDATED FINANCIAL STATEMENTS
(Tabular amounts in thousands, except per share amounts)
represents an initial conversion price of approximately $14.25 per share of common stock, subject to adjustment. The net proceeds of $221 million were used to enter into capped call transactions (see below), repurchase shares of our common stock and for general corporate purposes.
We may not redeem the Convertible Notes prior to August 21, 2028. On or after August 21, 2028, we may redeem for cash all or any portion of the Convertible Notes, at our option, if the last reported sale price of the Company’s Common Stock has been at least 130% of the conversion price then in effect for at least 20 trading days (whether or not consecutive) during any 30 consecutive trading day period (including the last trading day of such period) ending on, and including, the trading day immediately preceding the date on which we provide notice of redemption at a redemption price equal to 100% of the principal amount to be redeemed, plus accrued and unpaid interest.
If the Company undergoes a fundamental change (as defined in the Indenture), subject to certain conditions, holders may require that we repurchase for cash all or part of their Convertible Notes at a repurchase price equal to 100% of the principal amount to be repurchased, plus accrued and unpaid interest. In addition, if a make-whole fundamental change (as defined in the Indenture) occurs, or if we send a notice of redemption, we may be required to increase the conversion rate for any Convertible Notes converted in connection with such make-whole fundamental change or notice of redemption by a specified number of shares of its Common Stock.
The Convertible Notes are senior unsecured obligations of the Company and are guaranteed jointly and severally, on a senior unsecured basis, by each of the Company’s existing and future wholly owned U.S. subsidiaries that guarantee the Company’s existing credit agreement, existing senior notes or any other series of capital market debt with an aggregate principal amount outstanding in excess of $150 million.
Conversions of the Convertible Notes will be settled by paying cash up to the aggregate principal amount of the Convertible Notes being converted and by delivering shares of our common stock in respect of the remainder, if any, of our conversion obligation in excess of the aggregate principal amount of the Convertible Notes being converted.
In connection with the Convertible Notes offering, we entered into privately negotiated capped call transactions (the "Capped Call Transactions") with certain of the initial purchasers or their respective affiliates and certain other financial institutions. The Capped Call Transactions are expected to reduce the potential dilution of our common stock upon conversion of any Convertible Notes, with such reduction subject to a cap. The table below sets forth the key terms and premium paid for the Capped Calls related to the Convertible Notes:
Initial number of shares covered, subject to certain adjustments
16,135
Initial strike price, subject to certain adjustments
$14.25
Initial cap price, subject to certain adjustments
$22.36
Total premium paid
$24,702
The premium paid was recorded as a reduction to stockholders' deficit in the condensed consolidated balance sheet. The Capped Call Transactions are not part of the terms of the Convertible Notes and do not change the holders’ rights under the Convertible Notes. Holders of the Convertible Notes do not have any rights with respect to the Capped Call Transactions.
In November 2025, we commenced a tender offer to purchase, subject to certain terms and conditions, up to $80 million aggregate principal amount of our Notes due January 2037 and Notes due March 2043. The tender offer was completed in December 2025 by purchasing validly tendered and accepted notes in the aggregate principal amount of $80 million. We recorded a gain of $10 million for the tender offer.
During 2025, we purchased an aggregate $57 million of the Notes due March 2027 and Notes due March 2029 in the open market and we repaid $32 million of principal related to our term loans. At December 31, 2025, the interest rate on the Term loan due March 2028 was 5.8% and the interest rate on the Term loan due March 2032 was 7.4%.
The Bank is a member of the Federal Home Loan Bank (FHLB) of Des Moines and has access to certain credit products as a funding source known as "advances." As of December 31, 2025, there were no outstanding advances.
70
PITNEY BOWES INC.
NOTES TO CONSOLIDATED FINANCIAL STATEMENTS
(Tabular amounts in thousands, except per share amounts)
Annual maturities of outstanding principal at December 31, 2025 are as follows:
2026
$
17,150
2027
367,850
2028
134,150
2029
332,150
2030
236,150
Thereafter
938,762
Total
$
2,026,212
14. Retirement Plans and Postretirement Medical Benefits
Retirement Plans
We provide retirement benefits to eligible employees in the U.S. and outside the U.S. under various defined benefit retirement plans. Benefit accruals under most of our defined benefit plans have been frozen. The benefit obligations and funded status of defined benefit pension plans are as follows:
United States
Foreign
2025
2024
2025
2024
Accumulated benefit obligation
$
991,154
$
1,001,801
$
462,726
$
447,127
Projected benefit obligation
Benefit obligation - beginning of year
$
1,001,811
$
1,205,140
$
450,740
$
492,767
Service cost
25
49
1,143
745
Interest cost
53,485
58,131
23,477
20,815
Net actuarial (gain) loss
32,303
(39,337)
(12,056)
(15,310)
Foreign currency changes
—
—
33,545
(15,591)
Settlements
—
(140,356)
(1,122)
(7,861)
Benefits paid
(96,470)
(81,816)
(29,541)
(24,825)
Benefit obligation - end of year
$
991,154
$
1,001,811
$
466,186
$
450,740
Fair value of plan assets
Fair value of plan assets - beginning of year
$
958,812
$
1,153,490
$
408,205
$
466,687
Actual return on plan assets
72,960
22,920
11,951
(19,217)
Company contributions
5,626
4,574
8,645
7,881
Settlements
—
(140,356)
(1,122)
(7,861)
Foreign currency changes
—
—
27,707
(14,460)
Benefits paid
(96,470)
(81,816)
(29,541)
(24,825)
Fair value of plan assets - end of year
$
940,928
$
958,812
$
425,845
$
408,205
Amounts recognized in the Consolidated Balance Sheets
Noncurrent asset
$
—
$
—
$
25,479
$
26,502
Current liability
(19,776)
(4,606)
(1,855)
(1,664)
Noncurrent liability
(30,449)
(38,393)
(63,965)
(67,373)
Funded status
$
(50,225)
$
(42,999)
$
(40,341)
$
(42,535)
71
PITNEY BOWES INC.
NOTES TO CONSOLIDATED FINANCIAL STATEMENTS
(Tabular amounts in thousands, except per share amounts)
Information provided in the table below is only for pension plans with an accumulated benefit obligation in excess of plan assets:
United States
Foreign
2025
2024
2025
2024
Projected benefit obligation
$
991,154
$
1,001,811
$
383,913
$
368,417
Accumulated benefit obligation
$
991,154
$
1,001,801
$
381,867
$
366,197
Fair value of plan assets
$
940,928
$
958,812
$
318,757
$
299,912
Pretax amounts recognized in AOCL consist of:
United States
Foreign
2025
2024
2025
2024
Net actuarial loss
$
647,221
$
633,733
$
343,268
$
350,007
Prior service (credit) cost
(45)
(65)
6,662
6,969
Transition asset
—
—
(7)
(7)
Total
$
647,176
$
633,668
$
349,923
$
356,969
The components of net periodic benefit cost (income) for defined benefit pension plans were as follows:
United States
Foreign
2025
2024
2023
2025
2024
2023
Service cost
$
25
$
49
$
44
$
1,143
$
745
$
766
Interest cost
53,485
58,131
63,533
23,477
20,815
21,238
Expected return on plan assets
(74,302)
(85,701)
(86,008)
(26,585)
(25,858)
(29,899)
Amortization of prior service (credit) cost
(20)
(20)
(20)
307
298
286
Amortization of net actuarial loss
20,156
19,190
17,362
9,120
7,737
2,068
Settlements
—
88,051
771
197
3,373
(25)
Net periodic benefit cost (income)
$
(656)
$
79,700
$
(4,318)
$
7,659
$
7,110
$
(5,566)
Other changes in plan assets and benefit obligations for defined benefit pension plans recognized in other comprehensive loss were as follows:
United States
Foreign
2025
2024
2025
2024
Net actuarial loss
$
33,644
$
23,443
$
2,577
$
29,581
Amortization of net actuarial loss
(20,156)
(19,190)
(9,120)
(7,737)
Amortization of prior service credit (cost)
20
20
(307)
(298)
Settlements
—
(88,051)
(197)
(3,373)
Total recognized in other comprehensive loss
$
13,508
$
(83,778)
$
(7,047)
$
18,173
In 2024, we recorded an aggregate settlement charge of $91 million in connection with a targeted lump-sum campaign for terminated vested participants in the United States and Canada Defined Benefit Plan.
72
PITNEY BOWES INC.
NOTES TO CONSOLIDATED FINANCIAL STATEMENTS
(Tabular amounts in thousands, except per share amounts)
Weighted-average actuarial assumptions used to determine year end benefit obligations and net periodic benefit cost for defined benefit pension plans include:
2025
2024
2023
United States
Used to determine benefit obligations
Discount rate
5.34%
5.65%
5.15%
Rate of compensation increase
N/A
N/A
N/A
Used to determine net periodic benefit cost
Discount rate
5.65%
5.15%
5.55%
Expected return on plan assets
6.90%
6.70%
6.50%
Rate of compensation increase
N/A
N/A
N/A
Foreign
Used to determine benefit obligations
Discount rate
3.20
%
-
6.40%
2.20
%
-
6.70%
1.95
%
-
4.60%
Rate of compensation increase
2.00
%
-
9.94%
2.00
%
-
9.88%
2.00
%
-
3.50%
Used to determine net periodic benefit cost
Discount rate
2.20
%
-
6.70%
1.95
%
-
4.60%
1.95
%
-
5.10%
Expected return on plan assets
3.00
%
-
7.00%
2.75
%
-
5.50%
2.75
%
-
5.26%
Rate of compensation increase
2.00
%
-
9.88%
2.00
%
-
3.50%
2.00
%
-
3.60%
A discount rate is used to determine the present value of our future benefit obligations. As a result of the decision to terminate the US pension plan as of March 31, 2026 (see below), the discount rate used to determine the benefit obligation for U.S. plan was based on the estimated amount required to settle the obligations through lump sum payments and the purchase of annuities, and was determined by matching the timing of the expected cash flows of the pension obligations to the total cost to settle the obligation, as generated by a portfolio of long-term, high-quality fixed income debt instruments.
The discount rate for our largest foreign plan, the U.K. Qualified Pension Plan (the “U.K. Plan”), was determined using a model that discounts each year's estimated benefit payments by an applicable spot rate derived from a yield curve created from a large number of high quality corporate bonds. For our other smaller foreign pension plans, the discount rate is selected based on high-quality fixed income indices available in the country in which the plan is domiciled.
The expected return on plan assets is based on the target asset allocation for the applicable pension plan and expected rates of return for various asset classes in the investment portfolio after analyzing historical experience, future expectations of returns and volatility of asset classes.
Pension Buy-In Transaction
U.S. Qualified Pension Plan
In December 2025, we entered into a buy-in contract (the “U.S. Buy-In”) with an insurance carrier to secure a portion of the pension benefits for certain plan participants of the U.S. Qualified Pension Plan (the “Plan”). The U.S. Buy-In was purchased for approximately $800 million using existing plan assets. This annuity contract provides for the payment of fully guaranteed, irreversible benefits to the Plan for eligible retirees and their beneficiaries, corresponding to a portion of the Plan's total projected benefit obligation.
The U.S. Buy-In insurance annuity contract is accounted for as an asset within the Plan's trust and remains on our Consolidated Balance Sheet. The underlying pension benefit obligation to the participants covered by the annuity contract also remains on the balance sheet. The annuity contract is measured at fair value, which is determined by the insurance carrier.
Canada Pension Plan
In 2025, we also entered into a buy-in contract (the “Canada Buy-In”) with an insurance carrier to secure the pension benefits for all defined benefit plan participants of the Canada Pension Plan (the “Canada Plan”). The Canada Buy-In was purchased for
73
PITNEY BOWES INC.
NOTES TO CONSOLIDATED FINANCIAL STATEMENTS
(Tabular amounts in thousands, except per share amounts)
approximately $70 million using existing plan assets. This annuity contract provides for the payment of fully guaranteed, irreversible benefits to the Canada Plan for eligible retirees and their beneficiaries, corresponding to the Canada Plan's total projected benefit obligation.
The Canada Buy-In is accounted for as an asset within the Canada Plan's trust and remains on our Consolidated Balance Sheet. The underlying pension benefit obligation to the participants covered by the Canada Buy-In also remains on the balance sheet. The annuity contract is measured at fair value, which is determined by the plan actuaries.
Because we retain the primary obligation for the benefits, the U.S. Buy-In and Canada Buy-In do not qualify as an immediate settlement under ASC 715, Compensation—Retirement Benefits, and therefore, no gain or loss was recognized in the Consolidated Statements of Operations at the time of the transaction.
We continue to recognize the net actuarial gains and losses, prior service costs/credits, and other components of net periodic pension cost over the remaining service period or life expectancy of the participants, as applicable.
The U.S. Buy-In and Canada Buy-In effectively de-risk a portion of our pension obligations by transferring the investment and longevity risks for the covered participants to the insurance carrier. As a result of this de-risking, the expected rate of return on plan assets assumption used in the determination of net periodic pension costs is lower than the prior year, and accordingly, we estimate that 2026 net periodic pension costs for the U.S. and Canada plans will increase approximately $35 million over 2025 levels.
In January 2026, our CEO, under authority granted by the Board of Directors in 2025, approved the termination of the U.S. Qualified Pension Plan, effective March 31, 2026. We intend to distribute plan benefits through a voluntary lump sum window and by entering into a buy-out contract to transfer all remaining assets and liabilities of the Plan to the insurance carrier before the end of the year.
Investment Strategy and Asset Allocation
U.S. Pension Plans
In connection with U.S. Buy-In and planned termination of the U.S. Qualified Pension Plan, the investment strategy of the U.S. Pension Plans is to minimize funded status volatility and fully hedge plan obligations on a termination‑basis. The below asset allocations reflect the U.S. Buy-In purchased in 2025 and our intention to enter into a buy-out contract before the end of 2026.
Target and actual asset allocations for the U.S. pension plans were as follows:
Target allocation
Percent of Plan Assets at December 31,
2026
2025
2024
Asset category
Equities
—
%
—
%
15
%
Multi-asset credit
—
%
—
%
2
%
Fixed income
—
%
14
%
77
%
Annuity
—
%
85
%
—
%
Real estate
—
%
1
%
5
%
Private equity
—
%
—
%
1
%
Total
—
%
100
%
100
%
74
PITNEY BOWES INC.
NOTES TO CONSOLIDATED FINANCIAL STATEMENTS
(Tabular amounts in thousands, except per share amounts)
Foreign Pension Plans
The investment strategies for our foreign pension plans is to maximize returns within reasonable and prudent risk levels to achieve and maintain full funding of the accumulated benefit obligations and the actuarial liabilities while adhering to regulations and restrictions.
Our foreign pension plan assets are managed by outside investment managers and monitored regularly by local trustees and our corporate personnel. Target and actual asset allocations for the U.K. Plan, which comprises 75% of the total foreign pension plan assets, were as follows:
Target Allocation
Percent of Plan Assets at December 31,
2026
2025
2024
Asset category
Global equities
5
%
5
%
6
%
Fixed income
55
%
55
%
53
%
Multi-asset credit
4
%
4
%
6
%
Real estate
10
%
10
%
15
%
Diversified Growth Funds
25
%
25
%
16
%
Cash
1
%
1
%
4
%
Total
100
%
100
%
100
%
Pension plan assets are exposed to various risks, including interest rate risks, market risks and credit risks. To mitigate these risks, investments are diversified across asset classes and within each class and are periodically rebalanced. Derivative instruments may also be used for market exposure, to alter risk/return characteristics and to manage foreign currency exposure. We do not have any significant concentrations of credit risk within the U.K Plan or other foreign plan assets.
Fair Value Measurements of Plan Assets
The following tables show the U.S. and foreign pension plans' assets, by level within the fair value hierarchy. The plan asset categories presented in the following tables are subsets of the broader asset allocation categories.
United States Pension Plans
December 31, 2025
Level 1
Level 2
Level 3
Total
Commingled fixed income securities
$
—
$
34,618
$
—
$
34,618
Government and related securities
97,055
—
—
97,055
Corporate debt securities
—
31
—
31
Mortgage-backed /asset-backed securities
—
17
—
17
Real estate
—
—
7,452
7,452
Buy-in annuity contract
—
—
798,275
798,275
Total plan assets at fair value
$
97,055
$
34,666
$
805,727
937,448
Investments valued at NAV
4,664
Cash
15
Other
(1,199)
Fair value of plan assets
$
940,928
75
PITNEY BOWES INC.
NOTES TO CONSOLIDATED FINANCIAL STATEMENTS
(Tabular amounts in thousands, except per share amounts)
December 31, 2024
Level 1
Level 2
Level 3
Total
Money market funds
$
—
$
10,461
$
—
$
10,461
Equity securities
—
67,945
—
67,945
Commingled fixed income securities
—
185,212
—
185,212
Government and related securities
158,047
37,880
—
195,927
Corporate debt securities
—
498,867
—
498,867
Mortgage-backed /asset-backed securities
—
39,046
—
39,046
Real estate
—
—
45,221
45,221
Securities lending collateral
—
109,132
—
109,132
Total plan assets at fair value
$
158,047
$
948,543
$
45,221
1,151,811
Securities lending payable
(109,132)
Investments valued at NAV
4,940
Cash
466
Other
(89,273)
Fair value of plan assets
$
958,812
Foreign Plans
December 31, 2025
Level 1
Level 2
Level 3
Total
Money market funds
$
—
$
23,878
$
—
$
23,878
Equity securities
—
18,853
—
18,853
Commingled fixed income securities
—
193,786
—
193,786
Real estate
—
—
30,247
30,247
Diversified growth funds
—
—
80,144
80,144
Buy-in annuity contract
—
—
72,752
72,752
Total plan assets at fair value
$
—
$
236,517
$
183,143
419,660
Cash
3,589
Other
2,596
Fair value of plan assets
$
425,845
December 31, 2024
Level 1
Level 2
Level 3
Total
Money market funds
$
—
$
2,400
$
—
$
2,400
Equity securities
—
28,958
—
28,958
Commingled fixed income securities
—
212,425
—
212,425
Government and related securities
—
31,962
—
31,962
Corporate debt securities
—
20,875
—
20,875
Real estate
—
3,675
43,930
47,605
Diversified growth funds
—
—
48,400
48,400
Total plan assets at fair value
$
—
$
300,295
$
92,330
392,625
Cash
12,644
Other
2,936
Fair value of plan assets
$
408,205
76
PITNEY BOWES INC.
NOTES TO CONSOLIDATED FINANCIAL STATEMENTS
(Tabular amounts in thousands, except per share amounts)
The following information relates to our classification of investments into the fair value hierarchy:
•Money Market Funds: Money market funds typically invest in government securities, certificates of deposit, commercial paper and other highly liquid, low risk securities. Money market funds are principally used for overnight deposits and are classified as Level 1 when unadjusted quoted prices in active markets are available and as Level 2 when they are not actively traded on an exchange.
•Equity Securities: Equity securities are comprised of private commingled funds investing in U.S. and foreign stocks. The commingled funds are not traded on an active market and fair value is based on the value of the underlying securities owned by each fund. These commingled funds are classified as Level 2.
•Commingled Fixed Income Securities: Commingled fixed income securities are comprised of mutual funds that invest in a variety of fixed income securities, including securities of the U.S. government and its agencies, corporate debt, mortgage-backed securities and asset-backed securities. Fair value is based on the value of the underlying investments owned by each fund, minus its liabilities, divided by the number of shares outstanding, as reported by the fund manager. These mutual funds are classified as Level 1 when unadjusted quoted prices in active markets are available and as Level 2 when they are not actively traded on an exchange.
•Government and Related Securities: Debt securities are classified as Level 1 where active, high-volume trades for identical securities exist. Valuation adjustments are not applied to these securities. Debt securities are classified as Level 2 where fair value is determined using quoted market prices for similar securities or benchmarking model derived prices to quoted market prices and trade data for identical or comparable securities.
•Corporate Debt Securities: Corporate debt securities are valued using recently executed comparable transactions, market price quotations or bond spreads for the same maturity as the security. These securities are classified as Level 2.
•Mortgage-Backed Securities / Asset-Backed Securities: These securities are valued based on external pricing indices or on external price/spread data. These securities are classified as Level 2.
•Buy-in Annuity Contracts - consists of contracts with insurance carriers to provide pension benefits to certain eligible pension plan participants. The value of the contracts are determined by the insurance carriers or actuaries and is equal to the present value of future projected benefits. These assets are classified as Level 3.
•Real Estate: consists of units in open-ended commingled real estate funds. The underlying properties held in these funds are valued periodically (but at least annually) by the investment manager, certified appraisers or others. The valuation techniques used to value these investments include the cost approach, sales-comparison method and the income approach. These assets are classified as Level 3.
•Diversified Growth Funds: comprised of units in commingled diversified funds that comprise a mix of different asset classes. The underlying investments may not be listed on an exchange or traded in an active market. Inputs used to value these funds may fall into all three fair value categories. Accordingly, these securities are classified as Level 3.
•Securities Lending Fund: represents a commingled fund through our custodian's securities lending program. The U.S. pension plan lends securities to other banks and/or brokers, and receives collateral, typically cash. This collateral is invested in a commingled fund that invests in short-term fixed income securities. This investment is classified as Level 2. This amount invested in the fund is offset by a corresponding liability reflected in the U.S. pension plan's net assets available for benefits.
Investments Valued at Net Asset Value
Represents investments in private equity limited partnerships that are measured at fair value using the Net Asset Value (NAV) per share as a practical expedient and are not categorized in the fair value hierarchy. There is no active market for these investments and the pension plan receives a proportionate share of the gains, losses and expenses in accordance with the partnership agreements. There was a remaining unfunded commitment of $6 million at both December 31, 2025 and 2024. These investments comprise less than 1% of total U.S. Pension Fund assets at both December 31, 2025 and 2024.
77
PITNEY BOWES INC.
NOTES TO CONSOLIDATED FINANCIAL STATEMENTS
(Tabular amounts in thousands, except per share amounts)
Level 3 Gains and Losses
The following table summarizes the changes in the fair value of Level 3 assets:
U.S. Plans
Foreign Plans
Buy-in annuity contract
Real estate
Buy-in annuity contract
Real estate
Diversified Growth Funds
Balance at December 31, 2023
$
—
$
67,256
$
—
$
43,205
$
—
Realized gains
—
6,762
—
—
—
Unrealized (losses) gains
—
(14,316)
—
406
3,446
Net purchases, sales and settlements
—
(14,481)
—
1,214
45,406
Foreign currency and other
—
—
—
(895)
(452)
Balance at December 31, 2024
—
45,221
—
43,930
48,400
Realized gains
—
8,486
—
—
—
Unrealized (losses) gains
—
(7,147)
1,165
799
6,503
Net purchases, sales and settlements
—
(39,108)
—
(16,993)
21,359
Buy-in contract purchase
798,275
—
69,934
—
—
Foreign currency and other
—
—
1,653
2,511
3,882
Balance at December 31, 2025
$
798,275
$
7,452
$
72,752
$
30,247
$
80,144
78
PITNEY BOWES INC.
NOTES TO CONSOLIDATED FINANCIAL STATEMENTS
(Tabular amounts in thousands, except per share amounts)
Postretirement Medical Benefits
We provide certain employer subsidized health care and employer provided life insurance benefits in the U.S. and Canada to eligible retirees and their dependents. The cost of these benefits is recognized over the period the employee provides credited service to the company. The benefit obligation and funded status for postretirement medical benefit plans are as follows:
2025
2024
Benefit obligation
Benefit obligation - beginning of year
$
79,647
$
93,487
Service cost
273
369
Interest cost
4,159
4,479
Net actuarial gain
2,630
(5,603)
Foreign currency changes
295
(633)
Benefits paid, net
(10,806)
(12,452)
Benefit obligation - end of year (1)
$
76,198
$
79,647
Fair value of plan assets
Fair value of plan assets - beginning of year
$
—
$
—
Company contribution
10,806
12,452
Benefits paid, net
(10,806)
(12,452)
Fair value of plan assets - end of year
$
—
$
—
Amounts recognized in the Consolidated Balance Sheets
Current liability
$
(8,865)
$
(9,257)
Noncurrent liability
(67,334)
(70,390)
Funded status
$
(76,199)
$
(79,647)
(1) Includes a benefit obligation for the U.S. postretirement plan of $70 million and $73 million at December 31, 2025 and 2024, respectively.
Pretax amounts recognized in AOCL consist of:
2025
2024
Net actuarial gain
$
(13,425)
$
(18,511)
The components of net periodic benefit cost for postretirement medical benefit plans were as follows:
2025
2024
2023
Service cost
$
273
$
369
$
367
Interest cost
4,159
4,479
5,031
Amortization of net actuarial loss
(2,456)
(1,451)
(2,249)
Net periodic benefit cost
$
1,976
$
3,397
$
3,149
Other changes in benefit obligation for postretirement medical benefit plans recognized in other comprehensive loss were as follows:
2025
2024
Net actuarial gain
$
2,630
$
(5,603)
Amortization of net actuarial loss
2,456
1,451
Total recognized in other comprehensive loss
$
5,086
$
(4,152)
79
PITNEY BOWES INC.
NOTES TO CONSOLIDATED FINANCIAL STATEMENTS
(Tabular amounts in thousands, except per share amounts)
The weighted-average discount rates used to determine end of year benefit obligation and net periodic pension cost include:
2025
2024
2023
Discount rate used to determine benefit obligation
U.S.
5.30
%
5.60
%
5.20
%
Canada
4.65
%
4.55
%
4.60
%
Discount rate used to determine net period benefit cost
U.S.
5.60
%
5.20
%
5.60
%
Canada
4.55
%
4.60
%
5.15
%
The discount rate for the U.S. postretirement medical benefit plan is determined by matching the expected cash flows associated with the benefit obligations to a pool of corporate long-term, high-quality fixed income debt instruments available as of the measurement date. The discount rate for the Canada postretirement medical benefit plan is determined by matching the expected cash flows associated with the benefit obligations to spot rates along a yield curve developed based on yields of corporate long-term, high-quality fixed income debt instruments available as of the measurement date.
The assumed health care cost trend rate used in measuring the accumulated postretirement benefit obligation for the U.S. plan was 7.50% and 6.50% for 2025 and 2024, respectively. The assumed health care trend rate is 7.25% for 2026 and will gradually decline to 5.0% by the year 2035 and remain at that level thereafter. Assumed health care cost trend rates have a significant effect on the amounts reported for the health care plans.
Estimated Future Benefit Payments
The following benefit payments are expected to be paid.
Pension Benefits
Postretirement Medical Benefits
2026
$
1,037,924
$
9,087
2027
32,847
8,611
2028
33,029
8,192
2029
33,393
7,724
2030
33,092
7,293
Thereafter
166,565
29,855
$
1,336,850
$
70,762
During 2026, we anticipate making contributions of approximately $7 million to our foreign pension plans and approximately $24 million to our U.S. pension plans as a result of the anticipated plan termination.
Savings Plans
We offer a voluntary defined contribution 401(k) plan to our U.S. employees designed to help them accumulate additional savings for retirement and make matching contributions based on their eligible pay. Total employer contributions to the 401(k) plan were $27 million and $26 million in 2025 and 2024, respectively.
80
PITNEY BOWES INC.
NOTES TO CONSOLIDATED FINANCIAL STATEMENTS
(Tabular amounts in thousands, except per share amounts)
15. Income Taxes
Income (loss) from continuing operations before income taxes consisted of the following:
Years Ended December 31,
2025
2024
2023
U.S.
$
146,384
$
(112,261)
$
(112,437)
International
46,140
59,934
68,517
Total
$
192,524
$
(52,327)
$
(43,920)
The provision (benefit) for income taxes consisted of the following:
Years Ended December 31,
2025
2024
2023
U.S. Federal:
Current
$
(9,440)
$
2,535
$
32,784
Deferred
28,050
(138,444)
(31,591)
18,610
(135,909)
1,193
U.S. State and Local:
Current
2,912
1,375
9,083
Deferred
7,368
(41,416)
(9,973)
10,280
(40,041)
(890)
International:
Current
15,950
14,971
11,266
Deferred
2,987
6,150
5,778
18,937
21,121
17,044
Total current
9,422
18,881
53,133
Total deferred
38,405
(173,710)
(35,786)
Total provision (benefit) for income taxes
$
47,827
$
(154,829)
$
17,347
Effective tax rate
24.8
%
295.9
%
(39.5)
%
The benefit for income taxes for 2024 includes a tax benefit of $164 million primarily due to an affiliate reorganization as well as a $6 million benefit related to a state interest valuation allowance release.
The effective tax rate for 2023 includes a benefit of $2 million on the aggregate $124 million goodwill impairment charge as the majority of this charge is nondeductible.
81
PITNEY BOWES INC.
NOTES TO CONSOLIDATED FINANCIAL STATEMENTS
(Tabular amounts in thousands, except per share amounts)
In the fourth quarter of 2025, we prospectively adopted ASU 2023-09, Income Taxes (Topic 740): Improvements to Income Tax Disclosures.A reconciliation of income taxes computed at the federal statutory rate and our provision or benefit for income taxes consisted of the following:
Years Ended December 31,
2025
2024
2023
U.S. Federal statutory tax rate
$
40,430
21.0%
$
(10,989)
$
(9,223)
State and local income taxes, net of federal benefit (1)
8,126
4.2%
(31,632)
(703)
Foreign tax effects
Canada
Capital gain
4,381
2.3%
Other
(550)
(0.3)%
Other foreign jurisdictions
5,131
2.7%
Impact of foreign operations taxed at rates other than the U.S. statutory rate (2)
4,595
2,779
Effect of cross-border tax laws
Global intangible low-taxed income
566
0.3%
Subpart F income
2,009
1.0%
Other
(489)
(0.3)%
U.S. tax impacts of foreign income in the U.S. (3)
7,983
1,099
Changes in valuation allowances
—
2,100
—
Nontaxable or nondeductible items
Unrealized stock compensation benefits
(2,057)
(1.1)%
1,686
574
Surrender of company-owned life insurance policies
—
8,139
—
Nondeductible officer's compensation
5,123
2.7%
5,992
—
Affiliate reorganization
—
(141,723)
—
Goodwill impairment
—
—
24,437
Changes in unrecognized tax benefits
Accrual/release of uncertain tax amounts related to foreign operations (4)
(14,328)
(7.4)%
(829)
(2,829)
Other adjustments
(515)
(0.3)%
(151)
1,213
Provision (benefit) for income taxes
$
47,827
24.8%
$
(154,829)
$
17,347
(1) State taxes in California, Illinois, New York and New Jersey make up the majority (greater than 50%) of the tax effect in this category for the year ended December 31, 2025. Also includes a benefit of $22 million related to the affiliate reorganization and a benefit of $6 million related to a state interest valuation allowance release for the year ended December 31, 2024.
(2) Includes a charge of $1 million for a change in tax rates for the year ended December 31, 2024.
(3) Includes a charge of $2 million for the loss of the GILTI deduction as well as a charge of $2 million for withholding tax for the year ended December 31, 2024.
(4) Includes a benefit of $4 million related to interest on unrecognized tax benefits for the year ended December 31, 2025.
82
PITNEY BOWES INC.
NOTES TO CONSOLIDATED FINANCIAL STATEMENTS
(Tabular amounts in thousands, except per share amounts)
Deferred tax liabilities and assets consisted of the following:
December 31,
2025
2024
Deferred tax liabilities:
Deferred profit (for tax purposes) on sale to finance subsidiary
$
(44,759)
$
(53,370)
Lease revenue and related depreciation
(167,126)
(183,237)
Intangible assets
(53,334)
(52,773)
Operating lease liability
(26,135)
(27,857)
Other
(12,208)
(10,847)
Gross deferred tax liabilities
(303,562)
(328,084)
Deferred tax assets:
Depreciation
9,314
32,539
Postretirement medical benefits
18,949
20,108
Pension
16,610
16,948
Operating lease asset
31,411
31,429
Long-term incentives
3,773
5,914
Net operating and capital losses
248,099
257,186
Tax credit carry forwards
67,376
65,697
Section 163j carryforward
76,309
86,075
Tax uncertainties gross-up
3,379
4,568
Other
63,387
57,915
Gross deferred tax assets
538,607
578,379
Less: Valuation allowance
(224,922)
(206,441)
Net deferred tax assets
313,685
371,938
Total deferred taxes, net
$
10,123
$
43,854
The valuation allowance relates primarily to certain foreign, state and local net operating loss and tax credit carryforwards that will more-likely-than-not expire without being utilized.
We have a federal net operating loss carryforward of $224 million as of December 31, 2025, that has an unlimited carryforward period. We have net operating loss carryforwards in international jurisdictions of $422 million as of December 31, 2025, of which $118 million can be carried forward indefinitely and the remainder expire over the next 20 years. We also have net operating loss carryforwards in most states totaling $1 billion that will expire over the next 20 years. In addition, we have tax credit carryforwards of $67 million, of which $52 million can be carried forward indefinitely and the remainder expire over the next 10 years.
As of December 31, 2025, we assert that we are permanently reinvested in our pre-1987 and post-2017 undistributed earnings of $587 million as well as all other outside basis differences. While a determination of the full liability that would be incurred if these earnings were repatriated is not practicable, we have estimated the withholding taxes would be approximately $3 million.
83
PITNEY BOWES INC.
NOTES TO CONSOLIDATED FINANCIAL STATEMENTS
(Tabular amounts in thousands, except per share amounts)
A reconciliation of the amount of unrecognized tax benefits is as follows:
Years Ended December 31,
2025
2024
2023
Balance at beginning of year
$
27,037
$
30,232
$
33,300
Increases from prior period positions
—
—
343
Decreases from prior period positions
(39)
(955)
(524)
Increases from current period positions
—
73
400
Decreases relating to settlements with tax authorities
(52)
(1,467)
(350)
Reductions from lapse of applicable statute of limitations
(10,845)
(846)
(2,937)
Balance at end of year
$
16,101
$
27,037
$
30,232
The amount of the unrecognized tax benefits at December 31, 2025, 2024 and 2023 that would affect the effective tax rate if recognized was $13 million, $24 million and $26 million, respectively.
We recognize interest and penalties related to uncertain tax positions in our provision for income taxes. The amount included in our provision for income taxes related to interest and penalties on uncertain tax positions for the year ended December 31, 2025 was a benefit of $4 million and for each of the years ended December 31, 2024 and 2023 were not significant. We had approximately $4 million accrued for the payment of interest and penalties at December 31, 2024.
Cash income tax payments, net of refunds consisted of the following:
Year Ended December 31, 2025
Federal
$
(6,836)
State
California
1,480
Other
1,717
Foreign
Barbados
1,678
Canada
9,828
France
3,595
Japan
2,097
Other
2,500
Cash income tax payments, net of refunds
$
16,059
Cash income tax payments, net of refunds for the years ended December 31, 2024 and 2023 were $45,478 and $22,626, respectively.
Other Tax Matters
The One Big Beautiful Bill Act that was enacted on July 4, 2025, did not have a material impact on our tax provision.
With regard to U.S. Federal income tax, all positions are effectively settled with the Internal Revenue Service for years prior to 2022. On a state and local level, returns for most jurisdictions are closed through 2019. For our significant non-U.S. jurisdictions, Canada is closed to examination through 2020 except for a specific issue under current exam, and France, Germany and the U.K. are closed through 2019, 2020, and 2023 respectively. We also have other less significant tax filings currently subject to examination, including an appeal of a specific issue in India.
We regularly assess the likelihood of tax adjustments in each of the tax jurisdictions in which we have operations and account for the related financial statement implications. We believe we have established tax reserves that are appropriate given the possibility of tax adjustments. However, determining the appropriate level of tax reserves requires judgment regarding the uncertain application of tax law and the possibility of tax adjustments. Future changes in tax reserve requirements could have a material positive or negative impact on our results of operations, financial position and cash flows.
84
PITNEY BOWES INC.
NOTES TO CONSOLIDATED FINANCIAL STATEMENTS
(Tabular amounts in thousands, except per share amounts)
16. Commitments and Contingencies
From time to time, in the ordinary course of business as well as in connection with our recent GEC Chapter 11 cases, we are involved in litigation pertaining to, among other things, contractual rights under vendor, insurance or other contracts; intellectual property or patent rights; equipment, service, payment or other disputes with clients; or disputes with employees. Some of these actions may be brought as a purported class action on behalf of a purported class of customers, employees, or others.
On October 1, 2024, one of the Ecommerce Debtors filed a complaint against Trilogy Leasing Co., LLC (“Trilogy”) in the United States Bankruptcy Court for the Southern District of Texas seeking to recharacterize certain Equipment Supplements to which they are parties as disguised financings ("Recharacterization Proceeding"). On October 8, 2024, we filed a motion to intervene in support of the Ecommerce Debtors' position, which the court granted on April 1, 2025. The case is now proceeding.
On November 7, 2024, Trilogy and its parent company Kingsbridge Holdings, LLC brought suit against us in the Circuit Court of Cook County, Illinois, alleging that we are liable for certain Equipment Supplements that were executed by the Ecommerce Debtors and by Pitney Bowes Presort Services, LLC and seeking $95 million in lease payments and additional interest and fees. On December 16, 2024, we removed the litigation to the Northern District of Illinois based on diversity jurisdiction and subsequently filed a motion to dismiss, and to the extent not dismissed, stay the action pending the conclusion of the Recharacterization Proceeding. On July 15, 2025, the Northern District of Illinois court granted, in part, and denied, in part, the relief sought.
In addition, on May 9, 2025, Mitsubishi (the assignee of certain Equipment Supplements by Trilogy and/or Kingsbridge Holdings, LLC) brought an action in Superior Court of the State of Delaware, raising claims that are a subset of the claims in the Illinois Action. This matter has been settled for an immaterial amount. We are continuing the litigation against the remaining Trilogy plaintiffs.
Due to uncertainties inherent in litigation, any actions could have a material adverse effect on our financial position, results of operations or cash flows; however, in management's opinion, the final outcome of outstanding matters will not have a material adverse effect on our financial position, results of operations or cash flows, taking into account established accruals for estimated liabilities.
17. Leased Assets and Liabilities
We lease real estate, equipment and vehicles under operating and finance lease agreements. Our leases have terms of up to 10 years, and may include renewal options. At lease commencement, a lease liability and corresponding right-of-use asset is recognized. Lease liabilities represent the present value of future lease payments over the expected lease term, including options to extend or terminate the lease when it is reasonably certain those options will be exercised. Lease payments include all fixed payments and variable payments tied to an index, but exclude costs such as common area maintenance charges, property taxes, insurance and mileage. The present value of the lease liability is determined using our incremental borrowing rate at lease commencement. Information regarding operating and financing leases is as follows:
Leases
Balance Sheet Location
December 31, 2025
December 31, 2024
Assets
Operating
Operating lease assets
$
106,996
$
113,357
Finance
Property, plant and equipment, net
35,490
31,271
Total leased assets
$
142,486
$
144,628
Liabilities
Operating
Current operating lease liabilities
$
28,396
$
26,912
Noncurrent operating lease liabilities
99,757
100,804
Finance
Accounts payable and accrued liabilities
10,585
8,938
Other noncurrent liabilities
26,356
23,655
Total lease liabilities
$
165,094
$
160,309
85
PITNEY BOWES INC.
NOTES TO CONSOLIDATED FINANCIAL STATEMENTS
(Tabular amounts in thousands, except per share amounts)
Years Ended December 31,
Lease Cost
2025
2024
2023
Operating lease expense
$
42,457
$
37,640
$
46,316
Finance lease expense
Amortization of leased assets
9,702
8,709
6,554
Interest on lease liabilities
2,525
1,970
1,750
Variable lease expense
5,589
8,888
8,337
Sublease income
(433)
(335)
(466)
Total expense
$
59,840
$
56,872
$
62,491
Operating lease expense includes immaterial amounts related to leases with terms of 12 months or less.
Future Lease Payments
Operating Leases
Finance Leases
Total
2026
$
37,976
$
12,707
$
50,683
2027
34,807
10,399
45,206
2028
29,980
8,778
38,758
2029
22,964
4,618
27,582
2030
15,307
2,875
18,182
Thereafter
11,678
2,949
14,627
Total
152,712
42,326
195,038
Less: present value discount
24,559
5,385
29,944
Lease liability
$
128,153
$
36,941
$
165,094
Future lease payments exclude $5 million of payments for leases signed but not yet commenced at December 31, 2025.
Lease Term and Discount Rate
December 31, 2025
December 31, 2024
Weighted-average remaining lease term
Operating leases
4.3 years
5.1 years
Finance leases
4.1 years
3.9 years
Weighted-average discount rate
Operating leases
8.2%
9.3%
Finance leases
7.2%
8.6%
Years Ended December 31,
Cash Flow Information
2025
2024
2023
Operating cash outflows - operating leases
$
37,583
$
40,775
$
40,597
Operating cash outflows - finance leases
$
2,525
$
1,970
$
1,750
Financing cash outflows - finance leases
$
9,172
$
5,310
$
5,442
Leased assets obtained in exchange for new lease obligations
Operating leases
$
25,590
$
11,765
$
37,204
Finance leases
$
12,493
$
12,433
$
5,509
86
PITNEY BOWES INC.
NOTES TO CONSOLIDATED FINANCIAL STATEMENTS
(Tabular amounts in thousands, except per share amounts)
18. Stockholders' Equity
The following table summarizes the changes in shares of Common Stock outstanding and Treasury Stock:
Common Stock Outstanding
Treasury Stock
Balance at December 31, 2022
174,030,587
149,307,325
Retirement of treasury stock
—
(53,000,000)
Issuance of treasury stock
2,335,246
(2,335,246)
Balance at December 31, 2023
176,365,833
93,972,079
Issuance of treasury stock
6,040,034
(6,040,034)
Balance at December 31, 2024
182,405,867
87,932,045
Repurchases of common stock
(35,853,442)
35,853,442
Issuance of treasury stock
4,151,131
(4,151,131)
Balance at December 31, 2025
150,703,556
119,634,356
At December 31, 2025, 31,901,707 shares were reserved for issuance under our stock plans and dividend reinvestment program.
19. Accumulated Other Comprehensive Loss
Reclassifications out of accumulated other comprehensive loss were as follows:
Gain (Loss) Reclassified from AOCL (a)
Years Ended December 31,
2025
2024
2023
Cash flow hedges
Cost of sales
$
—
$
—
$
(33)
Interest expense
—
10,124
9,708
Total before tax
—
10,124
9,675
Tax provision
—
2,531
2,419
Net of tax
$
—
$
7,593
$
7,256
Available for sale securities
Financing revenue
$
(505)
$
(4,851)
$
(11)
Tax benefit
(126)
(1,213)
(3)
Net of tax
$
(379)
$
(3,638)
$
(8)
Pension and Postretirement Benefit Plans (b)
Prior service costs
$
(287)
$
(278)
$
(266)
Actuarial losses
(26,820)
(25,476)
(17,181)
Settlement
(197)
(91,424)
(746)
Total before tax
(27,304)
(117,178)
(18,193)
Tax benefit
(6,547)
(29,019)
(4,461)
Net of tax
$
(20,757)
$
(88,159)
$
(13,732)
(a) Amounts in parentheses indicate reductions to income and increases to other comprehensive loss.
(b) Reclassified from accumulated other comprehensive loss to other components of net pension and postretirement cost. These amounts are included in net periodic costs for defined benefit pension plans and postretirement medical benefit plans (see Note 14 to the Consolidated Financial Statements for additional details).
87
PITNEY BOWES INC.
NOTES TO CONSOLIDATED FINANCIAL STATEMENTS
(Tabular amounts in thousands, except per share amounts)
Changes in accumulated other comprehensive loss, net of tax, were as follows:
Cash flow hedges
Available-for-sale securities
Pension and postretirement benefit plans
Foreign currency adjustments
Total
Balance at December 31, 2022
$
12,503
$
(39,440)
$
(716,056)
$
(92,571)
$
(835,564)
Other comprehensive income (loss) before reclassifications
1,715
5,969
(55,128)
25,279
(22,165)
Amounts reclassified from accumulated other comprehensive loss
(7,256)
8
13,732
—
6,484
Net other comprehensive (loss) income
(5,541)
5,977
(41,396)
25,279
(15,681)
Balance at December 31, 2023
6,962
(33,463)
(757,452)
(67,292)
(851,245)
Other comprehensive income (loss) before reclassifications
631
228
(35,525)
(37,464)
(72,130)
Amounts reclassified from accumulated other comprehensive loss
(7,593)
3,638
88,159
—
84,204
Net other comprehensive (loss) income
(6,962)
3,866
52,634
(37,464)
12,074
Balance at December 31, 2024
—
(29,597)
(704,818)
(104,756)
(839,171)
Other comprehensive income (loss) before reclassifications
—
6,649
(29,037)
51,291
28,903
Amounts reclassified from accumulated other comprehensive loss
—
379
20,757
—
21,136
Net other comprehensive income (loss)
—
7,028
(8,280)
51,291
50,039
Balance at December 31, 2025
$
—
$
(22,569)
$
(713,098)
$
(53,465)
$
(789,132)
20. Stock-Based Compensation Plans
We may grant restricted stock units, stock options and other stock awards to eligible employees. All stock-based awards are approved by the Executive Compensation Committee of the Board of Directors. We settle stock awards with treasury shares. At December 31, 2025, there were 24,045,391 shares available for future grants.
Restricted Stock Units
Restricted stock units (RSUs) typically vest ratably over a three-year service period and entitle the holder to shares of common stock as the units vest. The following table summarizes information about RSUs:
2025
2024
Shares
Weighted average fair value
Shares
Weighted average fair value
Outstanding - beginning of the year
2,008,620
$
5.29
5,525,193
$
5.74
Granted
1,109,948
10.46
2,042,275
4.88
Vested
(1,443,101)
5.40
(4,579,834)
5.86
Forfeited
(424,646)
10.28
(979,014)
4.22
Outstanding - end of the year
1,250,821
$
8.24
2,008,620
$
5.29
The fair value of RSUs is determined based on the stock price on the grant date less the present value of expected dividends. At December 31, 2025, there was $5 million of unrecognized compensation cost related to RSUs that is expected to be recognized over a weighted-average period of 2.1 years. The intrinsic value of RSUs outstanding at December 31, 2025 was $13 million. The fair value of RSUs vested during 2025, 2024 and 2023 was $15 million, $22 million and $12 million, respectively. During 2023, we granted 2,068,825 RSUs at a weighted average fair value of $4.19.
In 2025 and 2024, RSUs granted include 84,044 and 226,581, respectively, to non-employee directors. These RSUs vest one year from the grant date.
88
PITNEY BOWES INC.
NOTES TO CONSOLIDATED FINANCIAL STATEMENTS
(Tabular amounts in thousands, except per share amounts)
Performance Stock Units
Performance stock units (PSUs) are stock awards where the number of shares ultimately awarded is based upon the attainment of certain performance targets and total shareholder return relative to peer companies. PSUs vest at the end of a three-year service period.
2025
2024
Shares
Weighted average fair value
Shares
Weighted average fair value
Outstanding - beginning of the year
1,081,357
$
5.62
811,620
$
9.57
Granted
552,220
10.47
2,472,987
4.90
Vested
(301,913)
7.77
(266,618)
5.29
Release of deferred shares
—
—
(804,281)
9.50
Forfeited
(703,977)
7.69
(1,132,351)
4.20
Outstanding - end of the year
627,687
$
6.54
1,081,357
$
5.62
Stock Options
Stock options are granted at an exercise price equal to or greater than the market price of our common stock on the grant date. Options typically vest ratably over three years and expire ten years from the grant date. We did not grant any options in 2023. At December 31, 2025, there was $2 million of unrecognized compensation cost related to stock options that is expected to be recognized over a weighted-average period of 2.4 years. The intrinsic value of options outstanding at December 31, 2025 was $5 million.
The following table summarizes information about stock option activity:
2025
2024
Shares
Per share weighted average exercise prices
Shares
Per share weighted average exercise prices
Options outstanding - beginning of the year
8,261,245
$
10.87
9,151,645
$
9.50
Granted
689,127
14.00
1,500,000
9.00
Exercised
(2,787,856)
7.91
(2,315,720)
4.32
Canceled
(184,708)
13.59
(74,680)
9.43
Options outstanding - end of the year
5,977,808
$
12.53
8,261,245
$
10.87
Options exercisable - end of the year
5,288,681
$
12.34
8,261,245
$
10.87
The following table provides additional information about stock options outstanding and exercisable at December 31, 2025:
Options Outstanding
Options Exercisable
Range of per share exercise prices
Shares
Per share weighted-average exercise price
Weighted-average remaining contractual life
Shares
Per share weighted-average exercise price
Weighted-average remaining contractual life
$4.32 - $8.64
1,190,829
$
6.39
3.0 years
1,190,829
$
6.39
3.0 years
$9.00 - $13.16
3,021,210
$
12.72
1.6 years
2,791,501
$
12.78
1.4 years
$14.00 - $16.82
1,765,769
$
16.35
1.2 years
1,306,351
$
16.82
0.1 years
5,977,808
$
12.53
1.8 years
5,288,681
$
12.34
1.4 years
89
PITNEY BOWES INC.
NOTES TO CONSOLIDATED FINANCIAL STATEMENTS
(Tabular amounts in thousands, except per share amounts)
The following table lists the weighted average assumptions used to calculate the fair value of stock options granted:
Year Ended December 31,
2025
2024
Expected dividend yield
2.8
%
2.2
%
Expected stock price volatility
69.6
%
55.3
%
Risk-free interest rate
4.0
%
4.3
%
Expected life
5 years
2 years
Weighted-average fair value per option granted
$4.35
$1.64
Fair value of options granted
$3,000
$2,460
Employee Stock Purchase Plan (ESPP)
We maintain a non-compensatory ESPP that enables substantially all U.S. and Canadian employees to purchase shares of our common stock at an offering price of 90% of the average market price on the offering date. At no time will the exercise price be less than the lowest price permitted under Section 423 of the Internal Revenue Code. Employees purchased 114,597 shares and 263,635 shares in 2025 and 2024, respectively. We have reserved 3,687,284 common shares for future purchase under the ESPP.
90
PITNEY BOWES INC.
SCHEDULE II - VALUATION AND QUALIFYING ACCOUNTS AND RESERVES