0000085961false2025FYShares Issued, Not DisclosedP3YP3YP3Yhttp://fasb.org/us-gaap/2025#AccountsPayableAndOtherAccruedLiabilitiesCurrenthttp://fasb.org/us-gaap/2025#AccountsPayableAndOtherAccruedLiabilitiesCurrenthttp://fasb.org/us-gaap/2025#DebtCurrenthttp://fasb.org/us-gaap/2025#DebtCurrenthttp://fasb.org/us-gaap/2025#OtherLiabilitiesNoncurrenthttp://fasb.org/us-gaap/2025#OtherLiabilitiesNoncurrenthttp://fasb.org/us-gaap/2025#LongTermDebtAndCapitalLeaseObligationshttp://fasb.org/us-gaap/2025#LongTermDebtAndCapitalLeaseObligations333333iso4217:USDxbrli:sharesiso4217:USDxbrli:sharesr:segmentr:optionxbrli:purer:institutionr:programr:site00000859612025-01-012025-12-3100000859612025-06-3000000859612026-01-310000085961us-gaap:ServiceMember2025-01-012025-12-310000085961us-gaap:ServiceMember2024-01-012024-12-310000085961us-gaap:ServiceMember2023-01-012023-12-3100000859612024-01-012024-12-3100000859612023-01-012023-12-310000085961r:FuelServicesMember2025-01-012025-12-310000085961r:FuelServicesMember2024-01-012024-12-310000085961r:FuelServicesMember2023-01-012023-12-310000085961r:LeaseandRentalMember2025-01-012025-12-310000085961r:LeaseandRentalMember2024-01-012024-12-310000085961r:LeaseandRentalMember2023-01-012023-12-3100000859612025-12-3100000859612024-12-3100000859612023-12-3100000859612022-12-310000085961us-gaap:PreferredStockMember2022-12-310000085961us-gaap:CommonStockMember2022-12-310000085961us-gaap:AdditionalPaidInCapitalMember2022-12-310000085961us-gaap:RetainedEarningsMember2022-12-310000085961us-gaap:AccumulatedOtherComprehensiveIncomeMember2022-12-310000085961us-gaap:RetainedEarningsMember2023-01-012023-12-310000085961us-gaap:AccumulatedOtherComprehensiveIncomeMember2023-01-012023-12-310000085961us-gaap:CommonStockMember2023-01-012023-12-310000085961us-gaap:AdditionalPaidInCapitalMember2023-01-012023-12-310000085961us-gaap:PreferredStockMember2023-12-310000085961us-gaap:CommonStockMember2023-12-310000085961us-gaap:AdditionalPaidInCapitalMember2023-12-310000085961us-gaap:RetainedEarningsMember2023-12-310000085961us-gaap:AccumulatedOtherComprehensiveIncomeMember2023-12-310000085961us-gaap:RetainedEarningsMember2024-01-012024-12-310000085961us-gaap:AccumulatedOtherComprehensiveIncomeMember2024-01-012024-12-310000085961us-gaap:CommonStockMember2024-01-012024-12-310000085961us-gaap:AdditionalPaidInCapitalMember2024-01-012024-12-310000085961us-gaap:PreferredStockMember2024-12-310000085961us-gaap:CommonStockMember2024-12-310000085961us-gaap:AdditionalPaidInCapitalMember2024-12-310000085961us-gaap:RetainedEarningsMember2024-12-310000085961us-gaap:AccumulatedOtherComprehensiveIncomeMember2024-12-310000085961us-gaap:RetainedEarningsMember2025-01-012025-12-310000085961us-gaap:AccumulatedOtherComprehensiveIncomeMember2025-01-012025-12-310000085961us-gaap:CommonStockMember2025-01-012025-12-310000085961us-gaap:AdditionalPaidInCapitalMember2025-01-012025-12-310000085961us-gaap:PreferredStockMember2025-12-310000085961us-gaap:CommonStockMember2025-12-310000085961us-gaap:AdditionalPaidInCapitalMember2025-12-310000085961us-gaap:RetainedEarningsMember2025-12-310000085961us-gaap:AccumulatedOtherComprehensiveIncomeMember2025-12-310000085961srt:MinimumMember2025-01-012025-12-310000085961srt:MaximumMember2025-01-012025-12-310000085961srt:MinimumMemberr:TrucksAndTractorsMember2025-12-310000085961srt:MaximumMemberr:TrucksAndTractorsMember2025-12-310000085961r:TrailersMember2025-12-310000085961srt:MinimumMemberr:RevenueEarningEquipmentMember2025-12-310000085961srt:MaximumMemberr:RevenueEarningEquipmentMember2025-12-310000085961srt:MinimumMemberr:FacilitiesMember2025-12-310000085961srt:MaximumMemberr:FacilitiesMember2025-12-310000085961srt:MinimumMemberr:FacilitiesMember2025-01-012025-12-310000085961r:FacilitiesMember2025-12-310000085961srt:MinimumMemberr:RevenueEarningEquipmentMaterialHandlingEquipmentAutomatedWashingMachinesandVehiclesMember2025-12-310000085961srt:MaximumMemberr:RevenueEarningEquipmentMaterialHandlingEquipmentAutomatedWashingMachinesandVehiclesMember2025-12-310000085961r:RevenueEarningEquipmentMaterialHandlingEquipmentAutomatedWashingMachinesandVehiclesMember2025-01-012025-12-3100000859612025-09-302025-09-3000000859612025-10-012025-12-310000085961us-gaap:OperatingSegmentsMemberr:FleetManagementSolutionsMember2025-01-012025-12-310000085961us-gaap:OperatingSegmentsMemberr:SupplyChainSolutionsMember2025-01-012025-12-310000085961us-gaap:OperatingSegmentsMemberr:DedicatedTransportationSolutionsMember2025-01-012025-12-310000085961us-gaap:IntersegmentEliminationMember2025-01-012025-12-310000085961us-gaap:MaterialReconcilingItemsMember2025-01-012025-12-310000085961us-gaap:OperatingSegmentsMemberr:FleetManagementSolutionsMember2024-01-012024-12-310000085961us-gaap:OperatingSegmentsMemberr:SupplyChainSolutionsMember2024-01-012024-12-310000085961us-gaap:OperatingSegmentsMemberr:DedicatedTransportationSolutionsMember2024-01-012024-12-310000085961us-gaap:IntersegmentEliminationMember2024-01-012024-12-310000085961us-gaap:MaterialReconcilingItemsMember2024-01-012024-12-310000085961us-gaap:OperatingSegmentsMemberr:FleetManagementSolutionsMember2023-01-012023-12-310000085961us-gaap:OperatingSegmentsMemberr:SupplyChainSolutionsMember2023-01-012023-12-310000085961us-gaap:OperatingSegmentsMemberr:DedicatedTransportationSolutionsMember2023-01-012023-12-310000085961us-gaap:IntersegmentEliminationMember2023-01-012023-12-310000085961us-gaap:MaterialReconcilingItemsMember2023-01-012023-12-310000085961country:US2025-12-310000085961country:US2024-12-310000085961country:CA2025-12-310000085961country:CA2024-12-310000085961country:MX2025-12-310000085961country:MX2024-12-310000085961us-gaap:OperatingSegmentsMembercountry:USr:FleetManagementSolutionsMember2025-01-012025-12-310000085961us-gaap:OperatingSegmentsMembercountry:USr:SupplyChainSolutionsMember2025-01-012025-12-310000085961us-gaap:OperatingSegmentsMembercountry:USr:DedicatedTransportationSolutionsMember2025-01-012025-12-310000085961us-gaap:IntersegmentEliminationMembercountry:US2025-01-012025-12-310000085961country:US2025-01-012025-12-310000085961us-gaap:OperatingSegmentsMembercountry:CAr:FleetManagementSolutionsMember2025-01-012025-12-310000085961us-gaap:OperatingSegmentsMembercountry:CAr:SupplyChainSolutionsMember2025-01-012025-12-310000085961us-gaap:OperatingSegmentsMembercountry:CAr:DedicatedTransportationSolutionsMember2025-01-012025-12-310000085961us-gaap:IntersegmentEliminationMembercountry:CA2025-01-012025-12-310000085961country:CA2025-01-012025-12-310000085961us-gaap:OperatingSegmentsMembercountry:MXr:FleetManagementSolutionsMember2025-01-012025-12-310000085961us-gaap:OperatingSegmentsMembercountry:MXr:SupplyChainSolutionsMember2025-01-012025-12-310000085961us-gaap:OperatingSegmentsMembercountry:MXr:DedicatedTransportationSolutionsMember2025-01-012025-12-310000085961us-gaap:IntersegmentEliminationMembercountry:MX2025-01-012025-12-310000085961country:MX2025-01-012025-12-310000085961us-gaap:OperatingSegmentsMembercountry:USr:FleetManagementSolutionsMember2024-01-012024-12-310000085961us-gaap:OperatingSegmentsMembercountry:USr:SupplyChainSolutionsMember2024-01-012024-12-310000085961us-gaap:OperatingSegmentsMembercountry:USr:DedicatedTransportationSolutionsMember2024-01-012024-12-310000085961us-gaap:IntersegmentEliminationMembercountry:US2024-01-012024-12-310000085961country:US2024-01-012024-12-310000085961us-gaap:OperatingSegmentsMembercountry:CAr:FleetManagementSolutionsMember2024-01-012024-12-310000085961us-gaap:OperatingSegmentsMembercountry:CAr:SupplyChainSolutionsMember2024-01-012024-12-310000085961us-gaap:OperatingSegmentsMembercountry:CAr:DedicatedTransportationSolutionsMember2024-01-012024-12-310000085961us-gaap:IntersegmentEliminationMembercountry:CA2024-01-012024-12-310000085961country:CA2024-01-012024-12-310000085961us-gaap:OperatingSegmentsMembercountry:MXr:FleetManagementSolutionsMember2024-01-012024-12-310000085961us-gaap:OperatingSegmentsMembercountry:MXr:SupplyChainSolutionsMember2024-01-012024-12-310000085961us-gaap:OperatingSegmentsMembercountry:MXr:DedicatedTransportationSolutionsMember2024-01-012024-12-310000085961us-gaap:IntersegmentEliminationMembercountry:MX2024-01-012024-12-310000085961country:MX2024-01-012024-12-310000085961us-gaap:OperatingSegmentsMembercountry:USr:FleetManagementSolutionsMember2023-01-012023-12-310000085961us-gaap:OperatingSegmentsMembercountry:USr:SupplyChainSolutionsMember2023-01-012023-12-310000085961us-gaap:OperatingSegmentsMembercountry:USr:DedicatedTransportationSolutionsMember2023-01-012023-12-310000085961us-gaap:IntersegmentEliminationMembercountry:US2023-01-012023-12-310000085961country:US2023-01-012023-12-310000085961us-gaap:OperatingSegmentsMembercountry:CAr:FleetManagementSolutionsMember2023-01-012023-12-310000085961us-gaap:OperatingSegmentsMembercountry:CAr:SupplyChainSolutionsMember2023-01-012023-12-310000085961us-gaap:OperatingSegmentsMembercountry:CAr:DedicatedTransportationSolutionsMember2023-01-012023-12-310000085961us-gaap:IntersegmentEliminationMembercountry:CA2023-01-012023-12-310000085961country:CA2023-01-012023-12-310000085961us-gaap:OperatingSegmentsMembercountry:MXr:FleetManagementSolutionsMember2023-01-012023-12-310000085961us-gaap:OperatingSegmentsMembercountry:MXr:SupplyChainSolutionsMember2023-01-012023-12-310000085961us-gaap:OperatingSegmentsMembercountry:MXr:DedicatedTransportationSolutionsMember2023-01-012023-12-310000085961us-gaap:IntersegmentEliminationMembercountry:MX2023-01-012023-12-310000085961country:MX2023-01-012023-12-310000085961us-gaap:OperatingSegmentsMemberr:ChoiceLeaseMemberr:FleetManagementSolutionsMember2025-01-012025-12-310000085961us-gaap:OperatingSegmentsMemberr:ChoiceLeaseMemberr:FleetManagementSolutionsMember2024-01-012024-12-310000085961us-gaap:OperatingSegmentsMemberr:ChoiceLeaseMemberr:FleetManagementSolutionsMember2023-01-012023-12-310000085961us-gaap:OperatingSegmentsMemberr:CommercialRentalMemberr:FleetManagementSolutionsMember2025-01-012025-12-310000085961us-gaap:OperatingSegmentsMemberr:CommercialRentalMemberr:FleetManagementSolutionsMember2024-01-012024-12-310000085961us-gaap:OperatingSegmentsMemberr:CommercialRentalMemberr:FleetManagementSolutionsMember2023-01-012023-12-310000085961us-gaap:OperatingSegmentsMemberr:SelectCareAndOtherMemberr:FleetManagementSolutionsMember2025-01-012025-12-310000085961us-gaap:OperatingSegmentsMemberr:SelectCareAndOtherMemberr:FleetManagementSolutionsMember2024-01-012024-12-310000085961us-gaap:OperatingSegmentsMemberr:SelectCareAndOtherMemberr:FleetManagementSolutionsMember2023-01-012023-12-310000085961us-gaap:OperatingSegmentsMemberr:FuelServicesAndChoiceLeaseLiabilityInsuranceRevenueMemberr:FleetManagementSolutionsMember2025-01-012025-12-310000085961us-gaap:OperatingSegmentsMemberr:FuelServicesAndChoiceLeaseLiabilityInsuranceRevenueMemberr:FleetManagementSolutionsMember2024-01-012024-12-310000085961us-gaap:OperatingSegmentsMemberr:FuelServicesAndChoiceLeaseLiabilityInsuranceRevenueMemberr:FleetManagementSolutionsMember2023-01-012023-12-310000085961r:SupplyChainSolutionsMemberr:OmnichannelRetailMember2025-01-012025-12-310000085961r:SupplyChainSolutionsMemberr:OmnichannelRetailMember2024-01-012024-12-310000085961r:SupplyChainSolutionsMemberr:OmnichannelRetailMember2023-01-012023-12-310000085961r:SupplyChainSolutionsMemberr:AutomotiveIndustryMember2025-01-012025-12-310000085961r:SupplyChainSolutionsMemberr:AutomotiveIndustryMember2024-01-012024-12-310000085961r:SupplyChainSolutionsMemberr:AutomotiveIndustryMember2023-01-012023-12-310000085961r:SupplyChainSolutionsMemberr:ConsumerPackedGoodsMember2025-01-012025-12-310000085961r:SupplyChainSolutionsMemberr:ConsumerPackedGoodsMember2024-01-012024-12-310000085961r:SupplyChainSolutionsMemberr:ConsumerPackedGoodsMember2023-01-012023-12-310000085961r:SupplyChainSolutionsMemberr:IndustrialandOtherMember2025-01-012025-12-310000085961r:SupplyChainSolutionsMemberr:IndustrialandOtherMember2024-01-012024-12-310000085961r:SupplyChainSolutionsMemberr:IndustrialandOtherMember2023-01-012023-12-310000085961r:SupplyChainSolutionsMember2025-01-012025-12-310000085961r:SupplyChainSolutionsMember2024-01-012024-12-310000085961r:SupplyChainSolutionsMember2023-01-012023-12-310000085961r:MaintenanceServicesMember2025-01-012025-12-310000085961r:MaintenanceServicesMember2024-01-012024-12-310000085961r:MaintenanceServicesMember2023-01-012023-12-310000085961r:HeldForUseFullServiceLeaseMember2025-01-012025-12-310000085961r:HeldForUseFullServiceLeaseMember2025-12-310000085961r:HeldForUseFullServiceLeaseMember2024-12-310000085961r:HeldForUseCommercialRentalMember2025-01-012025-12-310000085961r:HeldForUseCommercialRentalMember2025-12-310000085961r:HeldForUseCommercialRentalMember2024-12-310000085961r:TrailersMember2025-01-012025-12-310000085961r:TrailersMember2025-12-310000085961r:TrailersMember2024-12-310000085961r:HeldForSaleMember2025-12-310000085961r:HeldForSaleMember2024-12-310000085961us-gaap:TrucksMemberus-gaap:FairValueMeasurementsNonrecurringMemberus-gaap:FairValueInputsLevel3Member2025-12-310000085961us-gaap:TrucksMemberus-gaap:FairValueMeasurementsNonrecurringMemberus-gaap:FairValueInputsLevel3Member2024-12-310000085961us-gaap:TrucksMemberus-gaap:FairValueMeasurementsNonrecurringMemberus-gaap:FairValueInputsLevel3Member2025-01-012025-12-310000085961us-gaap:TrucksMemberus-gaap:FairValueMeasurementsNonrecurringMemberus-gaap:FairValueInputsLevel3Member2024-01-012024-12-310000085961us-gaap:TrucksMemberus-gaap:FairValueMeasurementsNonrecurringMemberus-gaap:FairValueInputsLevel3Member2023-01-012023-12-310000085961r:TractorsMemberus-gaap:FairValueMeasurementsNonrecurringMemberus-gaap:FairValueInputsLevel3Member2025-12-310000085961r:TractorsMemberus-gaap:FairValueMeasurementsNonrecurringMemberus-gaap:FairValueInputsLevel3Member2024-12-310000085961r:TractorsMemberus-gaap:FairValueMeasurementsNonrecurringMemberus-gaap:FairValueInputsLevel3Member2025-01-012025-12-310000085961r:TractorsMemberus-gaap:FairValueMeasurementsNonrecurringMemberus-gaap:FairValueInputsLevel3Member2024-01-012024-12-310000085961r:TractorsMemberus-gaap:FairValueMeasurementsNonrecurringMemberus-gaap:FairValueInputsLevel3Member2023-01-012023-12-310000085961r:TrailersAndOthersMemberus-gaap:FairValueMeasurementsNonrecurringMemberus-gaap:FairValueInputsLevel3Member2025-12-310000085961r:TrailersAndOthersMemberus-gaap:FairValueMeasurementsNonrecurringMemberus-gaap:FairValueInputsLevel3Member2024-12-310000085961r:TrailersAndOthersMemberus-gaap:FairValueMeasurementsNonrecurringMemberus-gaap:FairValueInputsLevel3Member2025-01-012025-12-310000085961r:TrailersAndOthersMemberus-gaap:FairValueMeasurementsNonrecurringMemberus-gaap:FairValueInputsLevel3Member2024-01-012024-12-310000085961r:TrailersAndOthersMemberus-gaap:FairValueMeasurementsNonrecurringMemberus-gaap:FairValueInputsLevel3Member2023-01-012023-12-310000085961us-gaap:FairValueMeasurementsNonrecurringMemberus-gaap:FairValueInputsLevel3Member2025-12-310000085961us-gaap:FairValueMeasurementsNonrecurringMemberus-gaap:FairValueInputsLevel3Member2024-12-310000085961us-gaap:FairValueMeasurementsNonrecurringMemberus-gaap:FairValueInputsLevel3Member2025-01-012025-12-310000085961us-gaap:FairValueMeasurementsNonrecurringMemberus-gaap:FairValueInputsLevel3Member2024-01-012024-12-310000085961us-gaap:FairValueMeasurementsNonrecurringMemberus-gaap:FairValueInputsLevel3Member2023-01-012023-12-310000085961us-gaap:LandMember2025-12-310000085961us-gaap:LandMember2024-12-310000085961srt:MinimumMemberus-gaap:BuildingAndBuildingImprovementsMember2025-12-310000085961srt:MaximumMemberus-gaap:BuildingAndBuildingImprovementsMember2025-12-310000085961us-gaap:BuildingAndBuildingImprovementsMember2025-12-310000085961us-gaap:BuildingAndBuildingImprovementsMember2024-12-310000085961srt:MinimumMemberus-gaap:MachineryAndEquipmentMember2025-12-310000085961srt:MaximumMemberus-gaap:MachineryAndEquipmentMember2025-12-310000085961us-gaap:MachineryAndEquipmentMember2025-12-310000085961us-gaap:MachineryAndEquipmentMember2024-12-310000085961srt:MinimumMemberus-gaap:PropertyPlantAndEquipmentOtherTypesMember2025-12-310000085961srt:MaximumMemberus-gaap:PropertyPlantAndEquipmentOtherTypesMember2025-12-310000085961us-gaap:PropertyPlantAndEquipmentOtherTypesMember2025-12-310000085961us-gaap:PropertyPlantAndEquipmentOtherTypesMember2024-12-310000085961r:FleetManagementSolutionsMember2023-12-310000085961r:SupplyChainSolutionsMember2023-12-310000085961r:DedicatedTransportationSolutionsMember2023-12-310000085961r:FleetManagementSolutionsMember2024-01-012024-12-310000085961r:DedicatedTransportationSolutionsMember2024-01-012024-12-310000085961r:FleetManagementSolutionsMember2024-12-310000085961r:SupplyChainSolutionsMember2024-12-310000085961r:DedicatedTransportationSolutionsMember2024-12-310000085961r:FleetManagementSolutionsMember2025-01-012025-12-310000085961r:DedicatedTransportationSolutionsMember2025-01-012025-12-310000085961r:FleetManagementSolutionsMember2025-12-310000085961r:SupplyChainSolutionsMember2025-12-310000085961r:DedicatedTransportationSolutionsMember2025-12-310000085961us-gaap:TradeNamesMemberr:FleetManagementSolutionsMember2025-12-310000085961us-gaap:TradeNamesMemberr:SupplyChainSolutionsMember2025-12-310000085961us-gaap:TradeNamesMemberr:DedicatedTransportationSolutionsMember2025-12-310000085961us-gaap:TradeNamesMemberr:CentralSupportServicesMember2025-12-310000085961us-gaap:TradeNamesMember2025-12-310000085961us-gaap:CustomerRelationshipsMemberr:FleetManagementSolutionsMember2025-12-310000085961us-gaap:CustomerRelationshipsMemberr:SupplyChainSolutionsMember2025-12-310000085961us-gaap:CustomerRelationshipsMemberr:DedicatedTransportationSolutionsMember2025-12-310000085961us-gaap:CustomerRelationshipsMemberr:CentralSupportServicesMember2025-12-310000085961us-gaap:CustomerRelationshipsMember2025-12-310000085961r:CentralSupportServicesMember2025-12-310000085961us-gaap:TradeNamesMemberr:FleetManagementSolutionsMember2024-12-310000085961us-gaap:TradeNamesMemberr:SupplyChainSolutionsMember2024-12-310000085961us-gaap:TradeNamesMemberr:DedicatedTransportationSolutionsMember2024-12-310000085961us-gaap:TradeNamesMemberr:CentralSupportServicesMember2024-12-310000085961us-gaap:TradeNamesMember2024-12-310000085961us-gaap:CustomerRelationshipsMemberr:FleetManagementSolutionsMember2024-12-310000085961us-gaap:CustomerRelationshipsMemberr:SupplyChainSolutionsMember2024-12-310000085961us-gaap:CustomerRelationshipsMemberr:DedicatedTransportationSolutionsMember2024-12-310000085961us-gaap:CustomerRelationshipsMemberr:CentralSupportServicesMember2024-12-310000085961us-gaap:CustomerRelationshipsMember2024-12-310000085961r:CentralSupportServicesMember2024-12-310000085961r:CardinalLogisticsMember2024-02-012024-02-010000085961us-gaap:FiniteLivedIntangibleAssetsMember2025-01-012025-12-310000085961r:UnfavorableLeaseAssetsMember2025-01-012025-12-310000085961us-gaap:FiniteLivedIntangibleAssetsMember2024-01-012024-12-310000085961r:FavorableLeaseAssetsMember2024-01-012024-12-310000085961srt:MinimumMember2025-12-310000085961srt:MaximumMember2025-12-310000085961r:ReserveForSelfInsuranceAccrualsMember2024-12-310000085961r:ReserveForSelfInsuranceAccrualsMember2023-12-310000085961r:ReserveForSelfInsuranceAccrualsMember2022-12-310000085961r:ReserveForSelfInsuranceAccrualsMember2025-01-012025-12-310000085961r:ReserveForSelfInsuranceAccrualsMember2024-01-012024-12-310000085961r:ReserveForSelfInsuranceAccrualsMember2023-01-012023-12-310000085961r:ReserveForSelfInsuranceAccrualsMember2025-12-310000085961country:GB2025-01-012025-12-310000085961country:GB2024-01-012024-12-310000085961country:GB2023-01-012023-12-310000085961country:CA2025-01-012025-12-310000085961country:CA2024-01-012024-12-310000085961country:CA2023-01-012023-12-310000085961us-gaap:ForeignTaxJurisdictionOtherMember2025-01-012025-12-310000085961us-gaap:ForeignTaxJurisdictionOtherMember2024-01-012024-12-310000085961us-gaap:ForeignTaxJurisdictionOtherMember2023-01-012023-12-310000085961stpr:TX2025-01-012025-12-310000085961stpr:TX2024-01-012024-12-310000085961stpr:TX2023-01-012023-12-310000085961stpr:CA2025-01-012025-12-310000085961stpr:CA2024-01-012024-12-310000085961stpr:CA2023-01-012023-12-310000085961stpr:IL2025-01-012025-12-310000085961stpr:IL2024-01-012024-12-310000085961stpr:IL2023-01-012023-12-310000085961stpr:NJ2025-01-012025-12-310000085961stpr:NJ2024-01-012024-12-310000085961stpr:NJ2023-01-012023-12-310000085961us-gaap:StateAndLocalTaxJurisdictionOtherMember2025-01-012025-12-310000085961us-gaap:StateAndLocalTaxJurisdictionOtherMember2024-01-012024-12-310000085961us-gaap:StateAndLocalTaxJurisdictionOtherMember2023-01-012023-12-310000085961country:MX2025-01-012025-12-310000085961country:MX2024-01-012024-12-310000085961country:MX2023-01-012023-12-310000085961us-gaap:ValuationAllowanceOfDeferredTaxAssetsMember2024-12-310000085961us-gaap:ValuationAllowanceOfDeferredTaxAssetsMember2023-12-310000085961us-gaap:ValuationAllowanceOfDeferredTaxAssetsMember2022-12-310000085961us-gaap:ValuationAllowanceOfDeferredTaxAssetsMember2025-01-012025-12-310000085961us-gaap:ValuationAllowanceOfDeferredTaxAssetsMember2024-01-012024-12-310000085961us-gaap:ValuationAllowanceOfDeferredTaxAssetsMember2023-01-012023-12-310000085961us-gaap:ValuationAllowanceOfDeferredTaxAssetsMember2025-12-310000085961us-gaap:DomesticCountryMember2025-12-310000085961us-gaap:DomesticCountryMember2024-12-310000085961r:NoExpirationMemberus-gaap:DomesticCountryMember2025-12-310000085961r:NoExpirationMemberus-gaap:DomesticCountryMember2024-12-310000085961us-gaap:StateAndLocalJurisdictionMember2025-12-310000085961us-gaap:StateAndLocalJurisdictionMember2024-12-310000085961r:NoExpirationMemberus-gaap:StateAndLocalJurisdictionMember2025-12-310000085961r:NoExpirationMemberus-gaap:StateAndLocalJurisdictionMember2024-12-310000085961us-gaap:ForeignCountryMember2025-12-310000085961us-gaap:ForeignCountryMember2024-12-310000085961r:NoExpirationMemberus-gaap:ForeignCountryMember2025-12-310000085961r:NoExpirationMemberus-gaap:ForeignCountryMember2024-12-310000085961r:DomesticAndForeignTaxJurisdictionMember2025-12-310000085961r:DomesticAndForeignTaxJurisdictionMember2024-12-3100000859612024-10-012024-12-310000085961us-gaap:OperatingLeaseLeaseNotYetCommencedMember2025-12-310000085961r:TradeReceivablesFinancingProgramMember2025-12-310000085961r:TradeReceivablesFinancingProgramMember2024-12-310000085961r:USCommercialPaperLongTermMember2025-12-310000085961r:USCommercialPaperLongTermMember2024-12-310000085961r:UnsecuredUSNotesMediumTermNotesLongTerm463Member2025-12-310000085961r:UnsecuredUSNotesMediumTermNotesLongTerm463Member2024-12-310000085961r:UnsecuredUSNotesMediumTermNotesLongTerm335Member2025-12-310000085961r:UnsecuredUSNotesMediumTermNotesLongTerm335Member2024-12-310000085961r:UnsecuredUSNotesMediumTermNotesLongTerm695Member2025-12-310000085961r:UnsecuredUSNotesMediumTermNotesLongTerm695Member2024-12-310000085961r:UnsecuredUSNotesMediumTermNotesLongTerm4.81And5.53Member2025-12-310000085961r:UnsecuredUSNotesMediumTermNotesLongTerm4.81And5.53Member2024-12-310000085961r:UnsecuredUSNotesMediumTermNotesLongTerm290Member2025-12-310000085961r:UnsecuredUSNotesMediumTermNotesLongTerm290Member2024-12-310000085961r:UnsecuredUSNotesMediumTermNotesLongTerm3.94And4.27Member2025-12-310000085961r:UnsecuredUSNotesMediumTermNotesLongTerm3.94And4.27Member2024-12-310000085961r:UnsecuredUSNotesMediumTermNotesLongTerm430Member2025-12-310000085961r:UnsecuredUSNotesMediumTermNotesLongTerm430Member2024-12-310000085961r:UnsecuredUSNotesMediumTermNotesLongTerm5.30Member2025-12-310000085961r:UnsecuredUSNotesMediumTermNotesLongTerm5.30Member2024-12-310000085961r:UnsecuredUSNotesMediumTermNotesLongTerm565Member2025-12-310000085961r:UnsecuredUSNotesMediumTermNotesLongTerm565Member2024-12-310000085961r:UnsecuredUSNotesMediumTermNotesLongTerm525Member2025-12-310000085961r:UnsecuredUSNotesMediumTermNotesLongTerm525Member2024-12-310000085961r:UnsecuredUSNotesMediumTermNotesLongTerm6.30Member2025-12-310000085961r:UnsecuredUSNotesMediumTermNotesLongTerm6.30Member2024-12-310000085961r:UnsecuredUSNotesMediumTermNotesLongTerm5.38Member2025-12-310000085961r:UnsecuredUSNotesMediumTermNotesLongTerm5.38Member2024-12-310000085961r:UnsecuredUSNotesMediumTermNotesLongTerm5.50Member2025-12-310000085961r:UnsecuredUSNotesMediumTermNotesLongTerm5.50Member2024-12-310000085961r:UnsecuredUSNotesMediumTermNotesLongTerm4.95Member2025-12-310000085961r:UnsecuredUSNotesMediumTermNotesLongTerm4.95Member2024-12-310000085961r:UnsecuredUSNotesMediumTermNotesLongTerm4.90Member2025-12-310000085961r:UnsecuredUSNotesMediumTermNotesLongTerm4.90Member2024-12-310000085961r:UnsecuredMediumTermNoteIssuedFebruary2025Member2025-12-310000085961r:UnsecuredMediumTermNoteIssuedFebruary2025Member2024-12-310000085961r:UnsecuredMediumTermNoteIssuedMay2025Member2025-12-310000085961r:UnsecuredMediumTermNoteIssuedMay2025Member2024-12-310000085961r:UnsecuredMediumTermNoteIssuedNovember2025Member2025-12-310000085961r:UnsecuredMediumTermNoteIssuedNovember2025Member2024-12-310000085961r:UnsecuredUSNotesMediumTermNotesLongTerm6.60Member2025-12-310000085961r:UnsecuredUSNotesMediumTermNotesLongTerm6.60Member2024-12-310000085961r:UnsecuredUSObligationsPrincipallyBankTermLoansLongTermMember2025-12-310000085961r:UnsecuredUSObligationsPrincipallyBankTermLoansLongTermMember2024-12-310000085961r:AssetBackedUSObligationsMember2025-12-310000085961r:AssetBackedUSObligationsMember2024-12-310000085961r:FinanceLeaseObligationAndOtherMember2025-12-310000085961r:FinanceLeaseObligationAndOtherMember2024-12-310000085961us-gaap:InterestRateSwapMemberus-gaap:DesignatedAsHedgingInstrumentMemberus-gaap:FairValueHedgingMember2024-12-310000085961us-gaap:InterestRateSwapMemberus-gaap:DesignatedAsHedgingInstrumentMemberus-gaap:FairValueHedgingMember2025-12-310000085961us-gaap:MediumTermNotesMember2025-01-012025-12-310000085961r:USAndForeignTermLoanMember2025-01-012025-12-310000085961us-gaap:RevolvingCreditFacilityMember2025-12-310000085961r:TradeReceivablesFinancingProgramMember2025-12-310000085961us-gaap:LetterOfCreditMemberr:TradeReceivablesProgramMember2025-12-310000085961us-gaap:RevolvingCreditFacilityMembersrt:MinimumMember2025-01-012025-12-310000085961us-gaap:RevolvingCreditFacilityMembersrt:MaximumMember2025-01-012025-12-310000085961us-gaap:RevolvingCreditFacilityMember2025-01-012025-12-310000085961us-gaap:LetterOfCreditMember2025-12-310000085961r:TradeReceivablesFinancingProgramMembersrt:MinimumMember2025-01-012025-12-310000085961r:TradeReceivablesFinancingProgramMembersrt:MaximumMember2025-01-012025-12-310000085961r:TradeReceivablesFinancingProgramMemberus-gaap:SecuredOvernightFinancingRateSofrMember2025-01-012025-12-310000085961r:TradeReceivablesFinancingProgramMemberr:CommercialPaperYieldRateMember2025-01-012025-12-310000085961r:TradeReceivablesFinancingProgramMember2025-09-300000085961r:A2025AntiDilutiveProgramMemberus-gaap:CommonStockMember2025-12-310000085961r:October2025DiscretionaryProgramMemberus-gaap:CommonStockMember2025-12-310000085961r:October2025DiscretionaryProgramMemberus-gaap:CommonStockMember2025-01-012025-12-310000085961r:A2025AntiDilutiveProgramMember2025-01-012025-12-310000085961r:A2025AntiDilutiveProgramMember2024-01-012024-12-310000085961r:A2025AntiDilutiveProgramMember2023-01-012023-12-310000085961r:A2023AntiDilutiveProgramMember2025-01-012025-12-310000085961r:A2023AntiDilutiveProgramMember2024-01-012024-12-310000085961r:A2023AntiDilutiveProgramMember2023-01-012023-12-310000085961r:A2021AntiDilutiveProgramMember2025-01-012025-12-310000085961r:A2021AntiDilutiveProgramMember2024-01-012024-12-310000085961r:A2021AntiDilutiveProgramMember2023-01-012023-12-310000085961r:AntiDilutiveProgramsMember2025-01-012025-12-310000085961r:AntiDilutiveProgramsMember2024-01-012024-12-310000085961r:AntiDilutiveProgramsMember2023-01-012023-12-310000085961r:October2025DiscretionaryProgramMember2025-01-012025-12-310000085961r:October2025DiscretionaryProgramMember2024-01-012024-12-310000085961r:October2025DiscretionaryProgramMember2023-01-012023-12-310000085961r:October2024DiscretionaryProgramMember2025-01-012025-12-310000085961r:October2024DiscretionaryProgramMember2024-01-012024-12-310000085961r:October2024DiscretionaryProgramMember2023-01-012023-12-310000085961r:October2023DiscretionaryProgramMemberMember2025-01-012025-12-310000085961r:October2023DiscretionaryProgramMemberMember2024-01-012024-12-310000085961r:October2023DiscretionaryProgramMemberMember2023-01-012023-12-310000085961r:February2023DiscretionaryProgramMember2025-01-012025-12-310000085961r:February2023DiscretionaryProgramMember2024-01-012024-12-310000085961r:February2023DiscretionaryProgramMember2023-01-012023-12-310000085961r:DiscretionaryProgramsMember2025-01-012025-12-310000085961r:DiscretionaryProgramsMember2024-01-012024-12-310000085961r:DiscretionaryProgramsMember2023-01-012023-12-310000085961us-gaap:AccumulatedTranslationAdjustmentMember2022-12-310000085961us-gaap:AccumulatedDefinedBenefitPlansAdjustmentMember2022-12-310000085961us-gaap:AccumulatedGainLossNetCashFlowHedgeParentMember2022-12-310000085961us-gaap:AccumulatedTranslationAdjustmentMember2023-01-012023-12-310000085961us-gaap:AccumulatedDefinedBenefitPlansAdjustmentMember2023-01-012023-12-310000085961us-gaap:AccumulatedGainLossNetCashFlowHedgeParentMember2023-01-012023-12-310000085961us-gaap:AccumulatedTranslationAdjustmentMember2023-12-310000085961us-gaap:AccumulatedDefinedBenefitPlansAdjustmentMember2023-12-310000085961us-gaap:AccumulatedGainLossNetCashFlowHedgeParentMember2023-12-310000085961us-gaap:AccumulatedTranslationAdjustmentMember2024-01-012024-12-310000085961us-gaap:AccumulatedDefinedBenefitPlansAdjustmentMember2024-01-012024-12-310000085961us-gaap:AccumulatedGainLossNetCashFlowHedgeParentMember2024-01-012024-12-310000085961us-gaap:AccumulatedTranslationAdjustmentMember2024-12-310000085961us-gaap:AccumulatedDefinedBenefitPlansAdjustmentMember2024-12-310000085961us-gaap:AccumulatedGainLossNetCashFlowHedgeParentMember2024-12-310000085961us-gaap:AccumulatedTranslationAdjustmentMember2025-01-012025-12-310000085961us-gaap:AccumulatedDefinedBenefitPlansAdjustmentMember2025-01-012025-12-310000085961us-gaap:AccumulatedGainLossNetCashFlowHedgeParentMember2025-01-012025-12-310000085961us-gaap:AccumulatedTranslationAdjustmentMember2025-12-310000085961us-gaap:AccumulatedDefinedBenefitPlansAdjustmentMember2025-12-310000085961us-gaap:AccumulatedGainLossNetCashFlowHedgeParentMember2025-12-310000085961r:NonvestedStockMember2025-01-012025-12-310000085961r:NonvestedStockMember2024-01-012024-12-310000085961r:NonvestedStockMember2023-01-012023-12-310000085961r:StockOptionAndStockPurchasePlanMember2025-01-012025-12-310000085961r:StockOptionAndStockPurchasePlanMember2024-01-012024-12-310000085961r:StockOptionAndStockPurchasePlanMember2023-01-012023-12-310000085961us-gaap:RestrictedStockUnitsRSUMember2025-01-012025-12-310000085961us-gaap:RestrictedStockUnitsRSUMember2025-12-310000085961srt:DirectorMember2025-01-012025-12-310000085961r:TimeVestedMemberus-gaap:RestrictedStockMember2024-12-310000085961r:PerformanceBasedVestedMemberDomainus-gaap:RestrictedStockMember2024-12-310000085961r:TimeVestedMemberus-gaap:RestrictedStockMember2025-01-012025-12-310000085961r:PerformanceBasedVestedMemberDomainus-gaap:RestrictedStockMember2025-01-012025-12-310000085961r:TimeVestedMemberus-gaap:RestrictedStockMember2025-12-310000085961r:PerformanceBasedVestedMemberDomainus-gaap:RestrictedStockMember2025-12-310000085961us-gaap:StockOptionMember2025-01-012025-12-310000085961r:EmployeeStockPurchasePlanMember2025-12-310000085961srt:MinimumMemberr:EmployeeStockPurchasePlanMember2025-01-012025-12-310000085961srt:MaximumMemberr:EmployeeStockPurchasePlanMember2025-01-012025-12-310000085961r:EmployeeStockPurchasePlanMember2024-12-310000085961r:EmployeeStockPurchasePlanMember2023-12-310000085961r:CompanyAdministeredPlanMemberus-gaap:PensionPlansDefinedBenefitMember2025-12-310000085961us-gaap:ForeignPlanMemberus-gaap:PensionPlansDefinedBenefitMember2023-09-300000085961us-gaap:ForeignPlanMemberus-gaap:PensionPlansDefinedBenefitMember2025-12-310000085961us-gaap:ForeignPlanMemberus-gaap:PensionPlansDefinedBenefitMember2025-04-012025-04-300000085961us-gaap:ForeignPlanMemberus-gaap:PensionPlansDefinedBenefitMember2025-04-300000085961us-gaap:ForeignPlanMember2025-12-310000085961us-gaap:OtherPensionPlansPostretirementOrSupplementalPlansDefinedBenefitMember2024-12-310000085961us-gaap:OtherPensionPlansPostretirementOrSupplementalPlansDefinedBenefitMember2025-12-310000085961r:CompanyAdministeredPlanMemberus-gaap:PensionPlansDefinedBenefitMember2025-01-012025-12-310000085961r:CompanyAdministeredPlanMemberus-gaap:PensionPlansDefinedBenefitMember2024-01-012024-12-310000085961r:CompanyAdministeredPlanMemberus-gaap:PensionPlansDefinedBenefitMember2023-01-012023-12-310000085961country:USus-gaap:PensionPlansDefinedBenefitMemberr:CompanyAdministeredPlanMember2025-01-012025-12-310000085961country:USus-gaap:PensionPlansDefinedBenefitMemberr:CompanyAdministeredPlanMember2024-01-012024-12-310000085961country:USus-gaap:PensionPlansDefinedBenefitMemberr:CompanyAdministeredPlanMember2023-01-012023-12-310000085961us-gaap:ForeignPlanMemberus-gaap:PensionPlansDefinedBenefitMemberr:CompanyAdministeredPlanMember2025-01-012025-12-310000085961us-gaap:ForeignPlanMemberus-gaap:PensionPlansDefinedBenefitMemberr:CompanyAdministeredPlanMember2024-01-012024-12-310000085961us-gaap:ForeignPlanMemberus-gaap:PensionPlansDefinedBenefitMemberr:CompanyAdministeredPlanMember2023-01-012023-12-310000085961country:USus-gaap:PensionPlansDefinedBenefitMember2025-01-012025-12-310000085961country:USus-gaap:PensionPlansDefinedBenefitMember2024-01-012024-12-310000085961country:USus-gaap:PensionPlansDefinedBenefitMember2023-01-012023-12-310000085961us-gaap:ForeignPlanMemberus-gaap:PensionPlansDefinedBenefitMember2025-01-012025-12-310000085961us-gaap:ForeignPlanMemberus-gaap:PensionPlansDefinedBenefitMember2024-01-012024-12-310000085961us-gaap:ForeignPlanMemberus-gaap:PensionPlansDefinedBenefitMember2023-01-012023-12-310000085961us-gaap:PensionPlansDefinedBenefitMember2024-12-310000085961us-gaap:PensionPlansDefinedBenefitMember2023-12-310000085961us-gaap:PensionPlansDefinedBenefitMember2025-01-012025-12-310000085961us-gaap:PensionPlansDefinedBenefitMember2024-01-012024-12-310000085961us-gaap:PensionPlansDefinedBenefitMember2025-12-310000085961country:US2025-12-310000085961country:US2024-12-310000085961us-gaap:ForeignPlanMember2024-12-310000085961r:DefinedBenefitPlanEquityFundsMemberus-gaap:PensionPlansDefinedBenefitMember2025-12-310000085961us-gaap:FairValueInputsLevel1Memberus-gaap:PensionPlansDefinedBenefitMemberr:DefinedBenefitPlanEquityFundsMember2025-12-310000085961us-gaap:FairValueInputsLevel2Memberus-gaap:PensionPlansDefinedBenefitMemberr:DefinedBenefitPlanEquityFundsMember2025-12-310000085961us-gaap:FairValueInputsLevel3Memberus-gaap:PensionPlansDefinedBenefitMemberr:DefinedBenefitPlanEquityFundsMember2025-12-310000085961r:DefinedBenefitPlanFixedIncomeFundsMemberus-gaap:PensionPlansDefinedBenefitMember2025-12-310000085961us-gaap:FairValueInputsLevel1Memberus-gaap:PensionPlansDefinedBenefitMemberr:DefinedBenefitPlanFixedIncomeFundsMember2025-12-310000085961us-gaap:FairValueInputsLevel2Memberus-gaap:PensionPlansDefinedBenefitMemberr:DefinedBenefitPlanFixedIncomeFundsMember2025-12-310000085961us-gaap:FairValueInputsLevel3Memberus-gaap:PensionPlansDefinedBenefitMemberr:DefinedBenefitPlanFixedIncomeFundsMember2025-12-310000085961r:DefinedBenefitPlanFixedIncomeSecuritiesMemberus-gaap:PensionPlansDefinedBenefitMember2025-12-310000085961us-gaap:FairValueInputsLevel1Memberus-gaap:PensionPlansDefinedBenefitMemberr:DefinedBenefitPlanFixedIncomeSecuritiesMember2025-12-310000085961us-gaap:FairValueInputsLevel2Memberus-gaap:PensionPlansDefinedBenefitMemberr:DefinedBenefitPlanFixedIncomeSecuritiesMember2025-12-310000085961us-gaap:FairValueInputsLevel3Memberus-gaap:PensionPlansDefinedBenefitMemberr:DefinedBenefitPlanFixedIncomeSecuritiesMember2025-12-310000085961us-gaap:PrivateEquityFundsMemberus-gaap:PensionPlansDefinedBenefitMember2025-12-310000085961us-gaap:FairValueInputsLevel1Memberus-gaap:PensionPlansDefinedBenefitMemberus-gaap:PrivateEquityFundsMember2025-12-310000085961us-gaap:FairValueInputsLevel2Memberus-gaap:PensionPlansDefinedBenefitMemberus-gaap:PrivateEquityFundsMember2025-12-310000085961us-gaap:FairValueInputsLevel3Memberus-gaap:PensionPlansDefinedBenefitMemberus-gaap:PrivateEquityFundsMember2025-12-310000085961r:DefinedBenefitPlanHedgeFundsMemberus-gaap:PensionPlansDefinedBenefitMember2025-12-310000085961us-gaap:FairValueInputsLevel1Memberus-gaap:PensionPlansDefinedBenefitMemberr:DefinedBenefitPlanHedgeFundsMember2025-12-310000085961us-gaap:FairValueInputsLevel2Memberus-gaap:PensionPlansDefinedBenefitMemberr:DefinedBenefitPlanHedgeFundsMember2025-12-310000085961us-gaap:FairValueInputsLevel3Memberus-gaap:PensionPlansDefinedBenefitMemberr:DefinedBenefitPlanHedgeFundsMember2025-12-310000085961r:BulkAnnuityContractMemberus-gaap:PensionPlansDefinedBenefitMember2025-12-310000085961us-gaap:FairValueInputsLevel1Memberus-gaap:PensionPlansDefinedBenefitMemberr:BulkAnnuityContractMember2025-12-310000085961us-gaap:FairValueInputsLevel2Memberus-gaap:PensionPlansDefinedBenefitMemberr:BulkAnnuityContractMember2025-12-310000085961us-gaap:FairValueInputsLevel3Memberus-gaap:PensionPlansDefinedBenefitMemberr:BulkAnnuityContractMember2025-12-310000085961us-gaap:DefinedBenefitPlanCashAndCashEquivalentsMemberus-gaap:PensionPlansDefinedBenefitMember2025-12-310000085961us-gaap:FairValueInputsLevel1Memberus-gaap:PensionPlansDefinedBenefitMemberus-gaap:DefinedBenefitPlanCashAndCashEquivalentsMember2025-12-310000085961us-gaap:FairValueInputsLevel2Memberus-gaap:PensionPlansDefinedBenefitMemberus-gaap:DefinedBenefitPlanCashAndCashEquivalentsMember2025-12-310000085961us-gaap:FairValueInputsLevel3Memberus-gaap:PensionPlansDefinedBenefitMemberus-gaap:DefinedBenefitPlanCashAndCashEquivalentsMember2025-12-310000085961us-gaap:FairValueInputsLevel1Memberus-gaap:PensionPlansDefinedBenefitMember2025-12-310000085961us-gaap:FairValueInputsLevel2Memberus-gaap:PensionPlansDefinedBenefitMember2025-12-310000085961us-gaap:FairValueInputsLevel3Memberus-gaap:PensionPlansDefinedBenefitMember2025-12-310000085961r:DefinedBenefitPlanEquityFundsMemberus-gaap:PensionPlansDefinedBenefitMember2024-12-310000085961us-gaap:FairValueInputsLevel1Memberus-gaap:PensionPlansDefinedBenefitMemberr:DefinedBenefitPlanEquityFundsMember2024-12-310000085961us-gaap:FairValueInputsLevel2Memberus-gaap:PensionPlansDefinedBenefitMemberr:DefinedBenefitPlanEquityFundsMember2024-12-310000085961us-gaap:FairValueInputsLevel3Memberus-gaap:PensionPlansDefinedBenefitMemberr:DefinedBenefitPlanEquityFundsMember2024-12-310000085961r:DefinedBenefitPlanFixedIncomeFundsMemberus-gaap:PensionPlansDefinedBenefitMember2024-12-310000085961us-gaap:FairValueInputsLevel1Memberus-gaap:PensionPlansDefinedBenefitMemberr:DefinedBenefitPlanFixedIncomeFundsMember2024-12-310000085961us-gaap:FairValueInputsLevel2Memberus-gaap:PensionPlansDefinedBenefitMemberr:DefinedBenefitPlanFixedIncomeFundsMember2024-12-310000085961us-gaap:FairValueInputsLevel3Memberus-gaap:PensionPlansDefinedBenefitMemberr:DefinedBenefitPlanFixedIncomeFundsMember2024-12-310000085961r:DefinedBenefitPlanFixedIncomeSecuritiesMemberus-gaap:PensionPlansDefinedBenefitMember2024-12-310000085961us-gaap:FairValueInputsLevel1Memberus-gaap:PensionPlansDefinedBenefitMemberr:DefinedBenefitPlanFixedIncomeSecuritiesMember2024-12-310000085961us-gaap:FairValueInputsLevel2Memberus-gaap:PensionPlansDefinedBenefitMemberr:DefinedBenefitPlanFixedIncomeSecuritiesMember2024-12-310000085961us-gaap:FairValueInputsLevel3Memberus-gaap:PensionPlansDefinedBenefitMemberr:DefinedBenefitPlanFixedIncomeSecuritiesMember2024-12-310000085961us-gaap:PrivateEquityFundsMemberus-gaap:PensionPlansDefinedBenefitMember2024-12-310000085961us-gaap:FairValueInputsLevel1Memberus-gaap:PensionPlansDefinedBenefitMemberus-gaap:PrivateEquityFundsMember2024-12-310000085961us-gaap:FairValueInputsLevel2Memberus-gaap:PensionPlansDefinedBenefitMemberus-gaap:PrivateEquityFundsMember2024-12-310000085961us-gaap:FairValueInputsLevel3Memberus-gaap:PensionPlansDefinedBenefitMemberus-gaap:PrivateEquityFundsMember2024-12-310000085961r:DefinedBenefitPlanHedgeFundsMemberus-gaap:PensionPlansDefinedBenefitMember2024-12-310000085961us-gaap:FairValueInputsLevel1Memberus-gaap:PensionPlansDefinedBenefitMemberr:DefinedBenefitPlanHedgeFundsMember2024-12-310000085961us-gaap:FairValueInputsLevel2Memberus-gaap:PensionPlansDefinedBenefitMemberr:DefinedBenefitPlanHedgeFundsMember2024-12-310000085961us-gaap:FairValueInputsLevel3Memberus-gaap:PensionPlansDefinedBenefitMemberr:DefinedBenefitPlanHedgeFundsMember2024-12-310000085961r:BulkAnnuityContractMemberus-gaap:PensionPlansDefinedBenefitMember2024-12-310000085961us-gaap:FairValueInputsLevel1Memberus-gaap:PensionPlansDefinedBenefitMemberr:BulkAnnuityContractMember2024-12-310000085961us-gaap:FairValueInputsLevel2Memberus-gaap:PensionPlansDefinedBenefitMemberr:BulkAnnuityContractMember2024-12-310000085961us-gaap:FairValueInputsLevel3Memberus-gaap:PensionPlansDefinedBenefitMemberr:BulkAnnuityContractMember2024-12-310000085961us-gaap:DefinedBenefitPlanCashAndCashEquivalentsMemberus-gaap:PensionPlansDefinedBenefitMember2024-12-310000085961us-gaap:FairValueInputsLevel1Memberus-gaap:PensionPlansDefinedBenefitMemberus-gaap:DefinedBenefitPlanCashAndCashEquivalentsMember2024-12-310000085961us-gaap:FairValueInputsLevel2Memberus-gaap:PensionPlansDefinedBenefitMemberus-gaap:DefinedBenefitPlanCashAndCashEquivalentsMember2024-12-310000085961us-gaap:FairValueInputsLevel3Memberus-gaap:PensionPlansDefinedBenefitMemberus-gaap:DefinedBenefitPlanCashAndCashEquivalentsMember2024-12-310000085961us-gaap:FairValueInputsLevel1Memberus-gaap:PensionPlansDefinedBenefitMember2024-12-310000085961us-gaap:FairValueInputsLevel2Memberus-gaap:PensionPlansDefinedBenefitMember2024-12-310000085961us-gaap:FairValueInputsLevel3Memberus-gaap:PensionPlansDefinedBenefitMember2024-12-310000085961us-gaap:FairValueInputsLevel3Memberus-gaap:PensionPlansDefinedBenefitMember2023-12-310000085961us-gaap:FairValueInputsLevel3Memberus-gaap:PensionPlansDefinedBenefitMember2025-01-012025-12-310000085961us-gaap:FairValueInputsLevel3Memberus-gaap:PensionPlansDefinedBenefitMember2024-01-012024-12-310000085961us-gaap:DeferredCompensationArrangementWithIndividualByTypeOfCompensationPensionAndOtherPostretirementBenefitsMember2025-12-310000085961us-gaap:DeferredCompensationArrangementWithIndividualByTypeOfCompensationPensionAndOtherPostretirementBenefitsMember2024-12-310000085961r:CardinalLogisticsMember2024-02-010000085961r:CardinalLogisticsMemberus-gaap:CustomerRelationshipsMembersrt:MinimumMember2024-02-010000085961r:CardinalLogisticsMemberus-gaap:CustomerRelationshipsMembersrt:MaximumMember2024-02-010000085961r:RetailMobileCommercialFleetMaintenanceBusinessMemberr:FleetManagementSolutionsMember2024-01-012024-12-310000085961r:IFSInvestmentsILLCMember2023-11-012023-11-010000085961r:IFSInvestmentsILLCMember2023-11-010000085961r:IFSInvestmentsILLCMemberus-gaap:CustomerRelationshipsMembersrt:MinimumMember2023-11-010000085961r:IFSInvestmentsILLCMemberus-gaap:CustomerRelationshipsMembersrt:MaximumMember2023-11-01
UNITED STATES
SECURITIES AND EXCHANGE COMMISSION
Washington, D.C. 20549
FORM 10-K
☑
ANNUAL REPORT PURSUANT TO SECTION 13 OR 15(d) OF THE SECURITIES EXCHANGE ACT OF 1934
For the fiscal year ended December 31, 2025
OR
☐
TRANSITION REPORT PURSUANT TO SECTION 13 OR 15(d) OF THE SECURITIES EXCHANGE ACT OF 1934
For the transition period from to
Commission File Number: 1-4364
RYDER SYSTEM, INC.
(Exact name of registrant as specified in its charter)
Florida
59-0739250
(State or other jurisdiction of incorporation or organization)
(I.R.S. Employer Identification No.)
2333 Ponce de Leon Blvd., Suite 700
(305)
500-3726
Coral Gables, Florida33134
(Address of principal executive offices, including zip code)
(Telephone number, including area code)
Securities registered pursuant to Section 12(b) of the Act:
Title of each class
Trading symbol(s)
Name of exchange on which registered
Ryder System, Inc. Common Stock ($0.50 par value)
R
New York Stock Exchange
Securities registered pursuant to Section 12(g) of the Act: None
Indicate by check mark if the registrant is a well-known seasoned issuer, as defined in Rule 405 of the Securities Act. Yes☑No ☐
Indicate by check mark if the registrant is not required to file reports pursuant to Section 13 or Section 15(d) of the Act. Yes ☐No☑
Indicate by check mark whether the registrant (1) has filed all reports required to be filed by Section 13 or 15(d) of the Securities Exchange Act of 1934 during the preceding 12 months (or for such shorter period that the registrant was required to file such reports), and (2) has been subject to such filing requirements for the past 90 days. Yes☑ No ☐
Indicate by check mark whether the registrant has submitted electronically every Interactive Data File required to be submitted pursuant to Rule 405 of Regulation S-T (§ 232.405 of this chapter) during the preceding 12 months (or for such shorter period that the registrant was required to submit such files). Yes☑ No ☐
Indicate by check mark whether the registrant is a large accelerated filer, an accelerated filer, a non-accelerated filer, a smaller reporting company, or an emerging growth company. See the definitions of “large accelerated filer,” “accelerated filer,” “smaller reporting company” and “emerging growth company” in Rule 12b-2 of the Exchange Act.
Large accelerated filer
☑
Accelerated filer
☐
Non-accelerated filer
☐
Smaller reporting company
☐
Emerging growth company
☐
If an emerging growth company, indicate by check mark if the registrant has elected not to use the extended transition period for complying with any new or revised financial accounting standards provided pursuant to Section 13(a) of the Exchange Act. ☐
Indicate by check mark whether the registrant has filed a report on and attestation to its management’s assessment of the effectiveness of its internal control over financial reporting under Section 404(b) of the Sarbanes-Oxley Act (15 U.S.C. 7262(b)) by the registered public accounting firm that prepared or issued its audit report. ☑
If securities are registered pursuant to Section 12(b) of the Act, indicate by check mark whether the financial statements of the registrant included in the filing reflect the correction of an error to previously issued financial statements. ☐
Indicate by check mark whether any of those error corrections are restatements that required a recovery analysis of incentive-based compensation received by any of the registrant's executive officers during the relevant recovery period pursuant to § 240.10D-1(b). ☐
Indicate by check mark whether the registrant is a shell company (as defined in Rule 12b-2 of the Act). Yes ☐ No ☑
The aggregate market value of the voting and non-voting common equity held by non-affiliates of the registrant computed by reference to the price at which the common equity was sold at June 30, 2025 was $6.3 billion. The number of shares of Ryder System, Inc. Common Stock outstanding at January 31, 2026 was 39,427,204.
Documents Incorporated by Reference into this Report
Part of Form 10-K into which Document is Incorporated
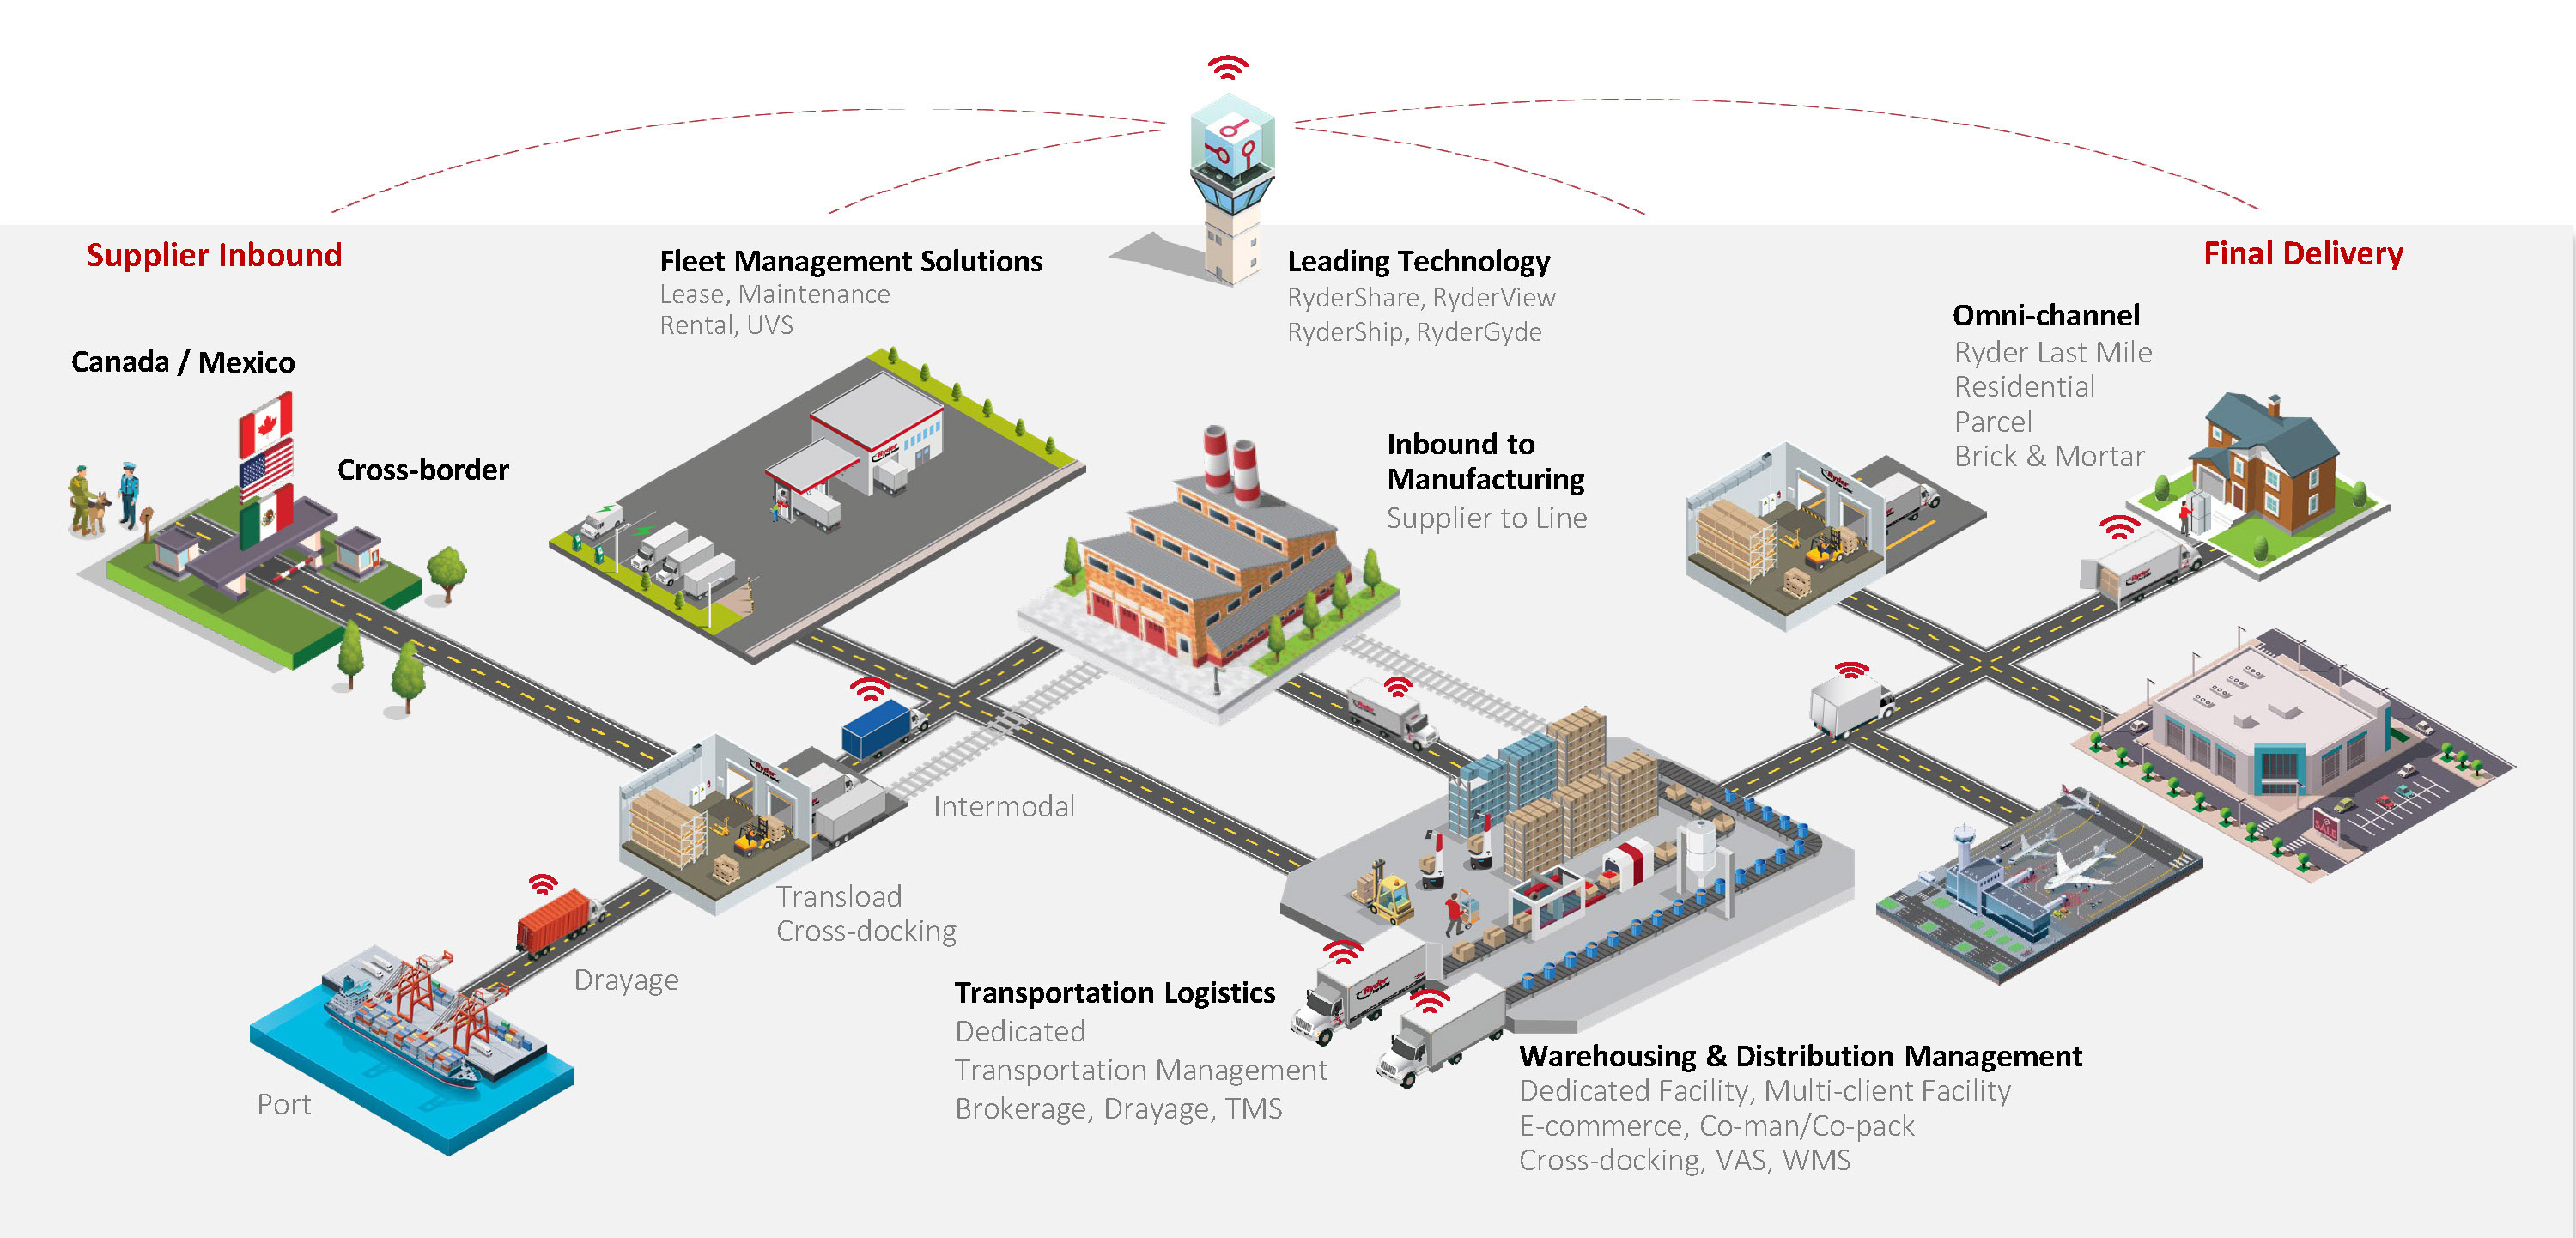
Ryder System, Inc. (Ryder) is a leading provider of outsourced logistics and transportation services throughout North America. We offer port‑to‑door solutions that integrate every step of the supply chain, including international inbound flows and cross‑border logistics, fleet and transportation management, warehousing, manufacturing support and multi-channel final delivery. Our complementary business segments provide a broad range of value-added solutions, which provides our customers with a seamless, end‑to‑end logistics network designed to reduce complexity and improve speed, reliability and efficiency across the entire flow of goods. Ryder connects every link in the supply chain, moving products smoothly from ports and suppliers all the way to customers’ doorsteps as illustrated below.
We report our financial performance based on three business segments: (1) Fleet Management Solutions (FMS), which provides full service leasing, commercial rental and vehicle maintenance services; (2) Supply Chain Solutions (SCS), which provides fully integrated logistics solutions; and (3) Dedicated Transportation Solutions (DTS), which provides turnkey transportation solutions, including dedicated vehicles, professional drivers, management and administrative support. Dedicated transportation services provided as part of an operationally integrated, multi-service supply chain solution to SCS customers are primarily reported in the SCS business segment.
1
___________________
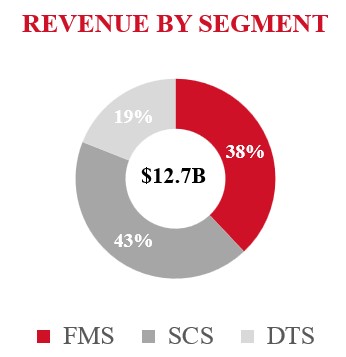
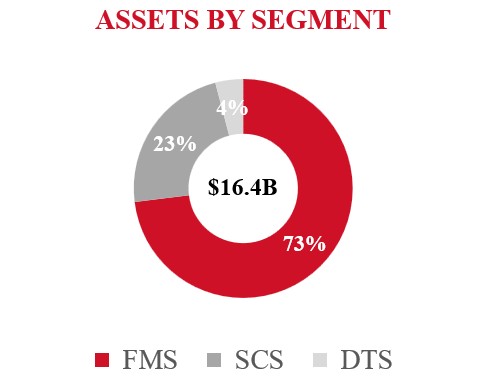
As of and for the year ended December 31, 2025. FMS total revenue includes eliminations
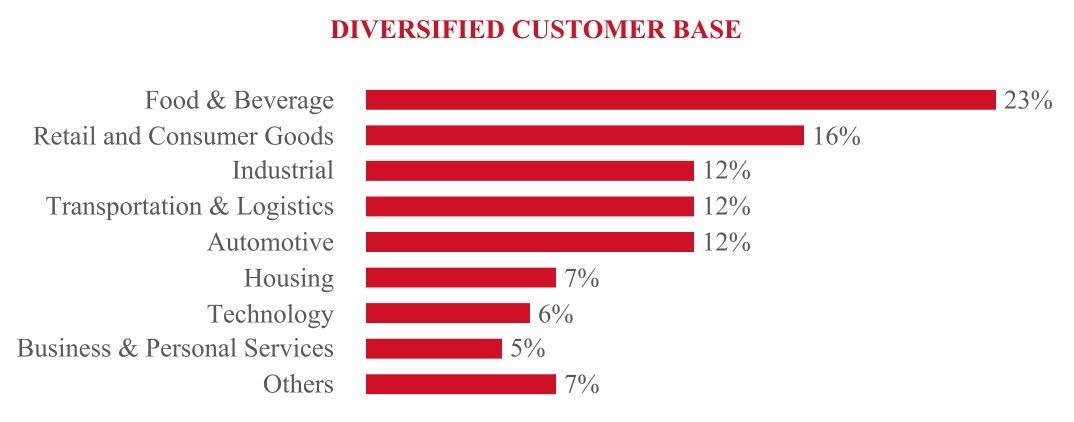
We operate in highly competitive markets. Our customers select us based on numerous factors including service quality, price, technology and service offerings. As an alternative to using our services, customers may choose to provide these services themselves or obtain similar services from other third parties. Our customer base reflects a variety of industries as shown below (as a percentage of operating revenue - a non-GAAP measure):
Further information on our business and business segments is presented in Part II, Item 7, "Management's Discussion and Analysis of Financial Condition and Results of Operations", and in Note 3, "Segment Reporting" of the Notes to Consolidated Financial Statements included in Part II, Item 8, "Financial Statements and Supplementary Data" in this Annual Report.
MISSION AND STRATEGY
Ryder's mission is to responsibly deliver innovative supply chain and transportation solutions that are reliable, safe and efficient, enabling our customers to deliver on their promises. Companies performing their own logistics and transportation services face increasing challenges related to dynamic supply chains, disruptive technologies, labor shortages, government regulation and increased vehicle cost and complexity. We offer the most comprehensive port-to-door solutions and transportation services in North America to help solve many of the challenges facing companies today. We have a balanced growth strategy focused on de-risking and optimizing the business model, enhancing returns and free cash flow, and driving long-term profitable growth. We aim to achieve this by growing with existing customers and new prospects who internally manage their supply chain services. The current phase of our balanced growth strategy is driven by three priorities: (i) create value through operational excellence, (ii) invest in customer-centric innovation, and (iii) further improve full-cycle returns and generate profitable growth. We seek to execute our strategy by:
•leveraging secular trends that favor outsourcing logistics and transportation services;
•offering market leading end-to-end supply chain solutions in North America;
•growing earnings from our contractual lease, dedicated and supply chain businesses;
•continuously improving productivity and processes;
2
•investing in customer-centric innovations that differentiate and enhance our solutions;
•attracting, developing and retaining the best talent; and
•executing our disciplined capital allocation priorities, including organic growth, targeted acquisitions and strategic investments, and returning capital to shareholders.
INDUSTRY AND OPERATIONS
Fleet Management Solutions
Value Proposition
Our FMS business provides a variety of fleet solutions that are designed to improve our customers' competitive positions. By outsourcing their needs to us, our customers can focus on their core business, improve their efficiency and productivity and lower their costs. Our FMS product offerings include contract terms with full service leasing, as well as leasing with flexible maintenance options; commercial vehicle rental; maintenance services; digital and technology support services that optimize asset performance, compliance, and safety; and comprehensive fuel services. In addition, our customers are able to purchase used trucks, tractors and trailers through our used vehicle sales facilities or our digital channel. FMS also provides vehicles, as well as maintenance, fuel and other services, to our SCS and DTS businesses. FMS operates one of the leading full service leasing, commercial rental and contract maintenance businesses in North America.
Market Trends
The U.S. commercial fleet market is estimated to include approximately 11 million vehicles,of which 5 million are privately owned by companies, 2 million are for-hire carriers, 1 million are leased from banks or other financial institutions, 1 million are part of utilities and government fleets, and 1 million are being leased or rented from third parties like Ryder.1
Companies that privately own their fleets are generally providing fleet management services themselves rather than outsourcing those services to third parties like Ryder. Over the last few years, several trends have emerged that we believe increase the value of our product offerings and will increasingly lead companies with privately held fleets to outsource. These trends include:
•Demand for efficient and reliable vehicles have caused companies to place greater emphasis on the quality of their preventive maintenance and safety programs;
•Maintaining and operating commercial vehicles has become more complex and expensive, as truck technology must comply with increasing state and federal emissions regulations;
•Companies must also manage global supply chain and labor challenges, as well as volatile used vehicle markets; and
•The cost and total capital required for owning vehicles continues to rise with every technological change requiring increasing cash outlays.
Operations
In 2025, our global FMS business accounted for 38% of our consolidated revenue.
Our FMS customers range from small businesses to large enterprises operating in a variety of industries. As of December 31, 2025, we had 789 operating locations, excluding ancillary storage locations, in 49 states, the District of Columbia, Puerto Rico and seven Canadian provinces. Our operating locations serve multiple customers, and typically include maintenance facilities; service islands for fueling; sales and administrative offices; and commercial rental vehicle counters. As of December 31, 2025, 20% of our operating locations are at customer sites where we provide vehicle maintenance solely for that customer's fleet.
FMS Product Offerings
ChoiceLease. Our lease offering provides customers with bundled vehicle and maintenance services while our customers furnish and supervise their own drivers and exercise control over the vehicles. Customers are able to select the terms of their lease and their preferred level of maintenance services, from full service to on-demand maintenance.
Our ChoiceLease customers receive the following benefits:
•Competitive Prices as we leverage our vehicle buying power to benefit our customers. Once we have an executed customer agreement, we acquire vehicles and components that are custom engineered to our customer's requirements
(1)U.S. Fleet as of December 2024, Class 3-8, Polk/S&P Registration Data.
3
and lease such vehicles to them for periods generally ranging three to seven years for trucks and tractors and ten years for trailers;
•Extensive Network of Maintenance Facilities and Trained Technicians for vehicle maintenance and repairs, temporary substitute vehicles and 24-hour emergency roadside service;
•Preventive and Flexible Maintenance Programs that are cost-effective and designed to reduce vehicle downtime;
•Access to Lease Vehicles as we leverage our original equipment manufacturer (OEM) relationships to secure access to vehicles. Once we have a signed agreement with the customer, we acquire vehicles that are engineered to the customer's requirements;
•No Vehicle Residual Risk Exposure as we typically retain vehicle residual risk exposure;
•Fleet Support Services, including services related to fuel, safety, fuel tax reporting, permitting and licensing, certain regulatory compliance and physical damage coverage; and
•Digital Fleet Management Platform,RyderGyde™ available in a mobile application or at ryder.com®, that enables our customers to manage their fleets.
During 2025, ChoiceLease revenue accounted for 60% of our FMS total revenue.
Commercial Rental. We offer rental vehicles to customers that need to supplement their fleets on a short-term basis to handle seasonal increases or discrete projects. ChoiceLease customers also utilize our commercial rental fleet as substitute vehicles while their lease vehicles undergo maintenance and while they await delivery of new lease vehicles. Although our commercial rental business is transactional in nature, we focus on building long-term relationships with customers to become their preferred source for commercial vehicle rentals. In addition, we also provide other benefits, including extending auto-liability insurance coverage and competitive fuel pricing. During 2025, commercial rental revenue accounted for 16% of our FMS total revenue.
SelectCare. Through SelectCare, customers have access to our extensive network of maintenance facilities and trained technicians to maintain the vehicles they own or lease from third parties. We offer several bundles of services, including full service contract maintenance, as well as preventive and on-demand maintenance. We also offer on-demand retail mobile maintenance in select U.S. markets that enables our customers to order on-site maintenance services with no long-term contractual commitment through our Torque by Ryder™ service offering. While we typically service these vehicles at our own facilities, we also operate on-site maintenance facilities or provide mobile maintenance services at customer locations.
We also provide additional maintenance and repair services that are not included in our contractual maintenance programs and generally charge for those services on an hourly basis. By servicing all of our customers' maintenance needs, we create stronger, long-term relationships and can provide a wide range of outsourcing solutions.
During 2025, SelectCare revenue accounted for 12% of our FMS total revenue.
The following table provides information regarding the number of vehicles and customers by FMS product offering:
December 31, 2025
Vehicles
Customers
ChoiceLease
141,700
11,700
Commercial rental (1)
31,600
27,200
SelectCare (2)
44,100
1,700
___________________
(1)Commercial rental customers represent those who rented a vehicle for more than three days during the year and include 5,000 ChoiceLease customers.
(2)Our SelectCare customers include approximately 1,000 ChoiceLease customers.
Fuel Services. Our FMS customers have access to competitively priced diesel fuel at 401 of our maintenance facilities across the U.S. and Canada. We also provide services such as fuel planning, fuel tax reporting, centralized billing, fuel cards and fuel monitoring. Although fuel sales do not significantly impact our FMS earnings, as the costs are largely a pass-through to our customers, we believe that leveraging our fuel buying power provides a valuable benefit to our customers. During 2025, fuel services revenue accounted for 12% of our FMS total revenue.
Used Vehicles. We offer used vehicles from our 61 retail sales centers throughout the U.S. and Canada (23 of which are co-located at an FMS shop), at our branch locations and through our website at www.ryder.com/used-trucks. We primarily sell our used vehicles through our retail channel, which allows us to leverage our maintenance expertise and strong brand reputation, and to realize higher sales proceeds than in the wholesale market. The realized sales proceeds of used vehicles are dependent upon various factors, including the used vehicle market, supply and demand in wholesale and retail markets, and
4
changes in vehicle technology. In recent years, the used vehicle sales market has been particularly weak. At December 31, 2025, we have used vehicle inventory of 9,500 vehicles, slightly above our long-term target range of 7,000 to 9,000.
FMS Business Strategy
Our strategy is to be the leading provider of fleet management services for light-, medium- and heavy-duty commercial vehicles. Our strategy is driven by the following priorities:
•drive fleet growth that maximizes our return on investment by (1) implementing sales and marketing initiatives to encourage private fleets to outsource their fleet management needs to us, (2) reducing costs through operational efficiencies, and (3) offering innovative products, solutions and support services that strengthen customer relationships;
•deliver a consistent, industry-leading and cost-effective lease and maintenance program through continued process improvement, productivity initiatives and technology improvements, which also help us attract new customers; and
•optimize asset utilization and management, particularly with respect to our rental fleet, used vehicle operations and maintenance facility infrastructure.
Competition
As an alternative to using our fleet management services, companies may choose to provide these services themselves or to obtain them from other third parties. We compete with finance lessors, truck and trailer manufacturers and independent dealers. We also compete with other companies on factors such as price, geographic coverage, equipment, maintenance options, and service reliability and quality. We also face competition from managed maintenance providers who are hired to coordinate and manage the maintenance of large fleets through a network of independent maintenance providers.
Supply Chain Solutions
Value Proposition
Our SCS business provides a broad range of innovative logistics management services that optimize our customers' supply chains and key business requirements. Our business is organized by the following industry verticals: omnichannel retail (which includes retail, technology, last mile and e-commerce); automotive; consumer packaged goods (CPG); and industrial and other (which includes healthcare). Our SCS product offerings provide port-to-door solutions, giving our customers end-to-end control from pickup at any North American port to final delivery, including both dedicated distribution and multi-client distribution, transportation management, dedicated transportation, brokerage, e-commerce, last mile, contract manufacturing and contract packing, and other value-added services. These services are available individually, in various combinations, or as part of a comprehensive integrated solution. Key aspects of our value proposition are our operational execution, leveraged assets and infrastructure, technical and industry expertise and customer-facing visibility platforms.
Market Trends
Logistics spending in the U.S. in the key target markets in which we operate was approximately $1.5 trillion, of which $234 billion was outsourced.2 As supply chains continue to expand and become more complex, the demand for outsourced logistics is expected to continue increasing as companies will require more sophisticated, cost-effective and reliable supply chain practices. For example, we believe secular trends continue to accelerate demand for supply chain resiliency, e-commerce fulfillment, final mile delivery of big and bulky goods, and onshoring and nearshoring of manufacturing and supply chain operations.
(2)Armstrong & Associates – Working Through the Uncertainty, Latest Third-Party Logistics Market Results and Outlook, June 2025.
5
Operations
During 2025, our SCS business accounted for 43% of our consolidated revenue, and our customer accounts and warehousing square footage were as follows:
(2)Includes Ryder leased and owned and Ryder managed.
(3)Includes 17 managed warehouses in Mexico.
In the U.S., SCS customer accounts are mostly large enterprises with complex supply chains. Most of our core SCS business operations are strategically located to maximize efficiencies and reduce costs. For example, we centralize certain administrative support services, including our carrier procurement and contract management, in our logistics centers in Novi, Michigan and Fort Worth, Texas. In Mexico, we offer a full range of logistics services and manage approximately 23,600 border crossings each month between the U.S. and Mexico. Our Canadian operations are also highly coordinated with their U.S. and Mexico counterparts and manage approximately 5,000 border crossings each month.
SCS Product Offerings
Distribution Management. We offer a variety of logistics services for warehousing and transportation, including network design; warehouse design and automation; coordinating inbound and outbound material flow; managing import and export of international shipments; coordinating just-in-time replenishment of component parts and final assembly; shipment delivery to distribution centers or end delivery points; and e-commerce fulfillment. During 2025, distribution management and value-added services accounted for approximately 36% of our SCS total revenue.
Dedicated Transportation. We offer specialized dedicated transportation services as part of an integrated supply chain solution with our equipment and professional drivers or with outside carriers. We also offer additional services related to routing and scheduling, fleet design, safety, regulatory compliance, risk management, technology and communication systems support. We operate at our customers' facilities, and our customers benefit from our extensive network of FMS facilities that provide maintenance for all Ryder vehicles used in SCS solutions. During 2025, approximately 28% of our SCS total revenue was related to dedicated transportation services.
Transportation Management and Brokerage. We offer transportation management and brokerage services, including shipment optimization, load scheduling and delivery confirmation through a series of technology and web-based solutions. Our transportation consultants focus on carrier procurement for all modes of transportation, with an emphasis on truck-based transportation, and also provide additional services like rate negotiation, freight bill audits and payment services. During 2025, we purchased or executed $9.8 billion in freight moves on our customers' behalf, including $334 million in brokerage services. During 2025, transportation management solutions accounted for 12% of our SCS total revenue.
E-commerce and Last Mile. We offer omnichannel delivery services through a network of over165 sites strategically located throughout the U.S. that we own or that are leased by us, our customers or our agents. For our e-commerce customers, we receive, pick, pack and ship smaller items via parcel carriers to the end consumer's home or to our customer's warehouse or retail stores. For our last mile customers, we receive, assemble and coordinate final delivery of big and bulky items to the end consumer. We also offer minor installation and disposal services. Customers also benefit from our proprietary software, RyderView 2.0™, that optimizes routes and allows customers to schedule their appointments. During 2025, our e-commerce and last mile services accounted for 18% of our SCS total revenue.
Contract Manufacturing and Contract Packaging. We offer contract manufacturing and contract packaging and warehousing, for some of the largest and best-known consumer brands in the U.S., primarily in the consumer packaged goods, retail, and healthcare industries. During 2025, our contract manufacturing and contract packaging services and other services accounted for 6% of our SCS total revenue.
6
SCS Business Strategy
Our strategy is to offer differentiated and proactive solutions utilizing expertise in our key industry verticals. Our strategy is driven by the following key priorities:
•provide best in class execution and quality through reliable and flexible supply chain solutions;
•develop innovative solutions, automation capabilities, and customer-centric technology such as RyderShare™, RyderView 2.0™ and RyderShip™;
•focus consistently on network optimization and continuous improvement;
•execute on targeted sales and marketing growth strategies; and
•expand product offerings to complement port-to-door solutions.
Competition
As an alternative to using our services, companies may choose to internally manage their own supply chains and logistics operations, or obtain alternative services from other third parties. We compete with a few large, multi-service companies across all of our product offerings and industries, as well as with other companies on specific service offerings like transportation or distribution management. We compete based on factors such as price, service offerings, market knowledge, expertise in logistics-related technology and overall performance (e.g., timeliness, accuracy and flexibility).
Dedicated Transportation Solutions
Value Proposition
Our DTS business provides specialized dedicated transportation services. We provide our customers with vehicles and professional drivers, and offer a variety of engineering and other services related to routing and scheduling, fleet design, safety, regulatory compliance, risk management and technology and communication systems support. Our customers benefit from a dedicated transportation solution that mitigates the labor and regulatory challenges associated with maintaining a private fleet, such as driver recruitment and retention, hours of service requirements, Department of Transportation (DOT) audits and workers' compensation.
Market Trends
The outsourced U.S. dedicated market was estimated to be $31 billion3 from an addressable market of approximately $500 billion.4 Many of the same trends that impact our FMS business affect our DTS business. As operating and maintaining a private fleet becomes more complex, especially as companies must comply with increasing DOT regulations, we expect the demand for outsourced dedicated services to increase. In addition, there is still significant demand for qualified truck drivers, dedicated capacity from quality transportation and logistics providers, and industry expertise related to asset utilization analysis and fleet rationalization studies offered as part of our DTS services.
Operations/Product Offerings
During 2025, our DTS business accounted for 18% of our consolidated revenue. As of December 31, 2025, we had 210DTS customer accounts in the U.S. Although a significant portion of our DTS operations are located at customer facilities, our DTS business also utilizes and benefits from our FMS services, including our extensive network of FMS maintenance facilities. Our DTS accounts typically operate in a limited geographic area for short-haul drives.
We provide custom transportation analysis using advanced logistics planning and operating tools. Based on this analysis, our logistics specialists create a distribution system that optimizes freight flow while meeting customer service goals. If a distribution system includes multiple modes of transportation (air, rail, sea and highway), we select appropriate transportation modes and carriers, and monitor and audit carrier performance. In addition, customers from our SCS business that utilize our dedicated transportation services benefit from our cost-effective solutions that help aggregate loads, consolidate shipments or optimize backhaul opportunities.
(3)Armstrong & Associates – Working Through the Uncertainty, Latest Third-Party Logistics Market Results and Outlook, June 2025.
(4)Addressable market as of December 2024, Class 3-8, IHS Markit Ltd. (formerly RL Polk) & Ryder Internal Estimates.
7
DTS Business Strategy
Our strategy is to offer custom solutions to customers who need specific vehicles, specialized handling, dedicated capacity or integrated transportation services. Our strategy is driven by the following key priorities:
•increase market share to provide more specialized services across industries, including retail, metals, agriculture and grocery, energy and utility, consumer product goods, construction and food and beverage;
•develop innovative solutions, capabilities, and customer-centric technology such as RyderShare™;
•leverage our FMS sales team to convince private fleet operators to outsource their transportation needs to us;
•focus consistently on network optimization and continuous improvement; and
•recruit and retain professional drivers.
Competition
We compete with other dedicated providers to provide highly engineered solutions, involving specialized handling or service requirements. To a lesser extent, we also compete with truckload carriers providing dedicated solutions for standard freight. We compete based on a number of factors, including price, equipment options and features, maintenance, service and geographic coverage, driver availability and operational expertise. As an alternative to using our services, companies may choose to manage their own private fleets or obtain alternative services from other third-party vendors. We differentiate our product offering by leveraging our FMS vehicles and maintenance services and integrating our services with those of our SCS business to create a more comprehensive transportation solution. Our strong safety record and focus on customer service also enables us to uniquely satisfy our customers' needs with high-value products that require specialized handling in a manner that differentiates us from truckload carriers.
CYCLICALITY
Our business is impacted by economic and market conditions. In a strong economic environment, there is generally more demand for our services. In a weak or volatile economy, demand for our services decreases and becomes more unpredictable. To mitigate this volatility, we have taken significant steps over recent years and continue to focus on diversifying our contractual business mix and strengthening our long-term customer relationships. Although we believe these efforts help lessen the immediate impact of an economic downturn, companies are often unwilling to commit to a full service lease or long-term supply chain and dedicated contracts. Our commercial rental and used vehicle sales businesses are transactional and more susceptible to economic and market conditions, which can significantly impact their results in both the short- and long-term. We mitigate some of the potential impact of an economic downturn through a disciplined and centralized approach to asset management. We strive to manage the size, mix and location of our operating fleet and used vehicle inventories to maximize asset utilization and used vehicle proceeds in both strong and weak market conditions.
SEASONALITY
Historically, our lease and related maintenance revenues, DTS service revenues and most of our SCS service revenues have not been impacted by seasonality because of the long-term nature of the underlying customer contracts and the associated fixed charges. However, our rental revenue and certain SCS service revenues are seasonal in nature.
Commercial rental operations are seasonal and generate the lowest revenue of the year typically in the first quarter due to lower market demand and the highest revenue typically in the third and fourth quarters. We generally decrease or increase the size of our rental fleet throughout the year to mitigate the seasonal effect of demand as well as changing economic conditions. As demand changes because of seasonal factors, we also move our rental vehicles among our locations.
Some of our SCS customers tend to operate in seasonal industries. Because of the concentration of customers in our SCS business, we experience reduction in freight volume shipped by those customers or a reduction in their need for our services from time to time. We actively monitor and shift resources to mitigate these seasonal effects.
REGULATION
Our business is subject to laws and regulations in the jurisdictions in which we operate and is regulated by various agencies, including the U.S. Department of Transportation (DOT), Department of Agriculture (USDA), Department of Health and Human Services (HHS), Department of Homeland Security (DHS), Department of Labor (DOL), Occupational Safety and Health Administration (OSHA), and Environmental Protection Agency (EPA), amongst others. The Federal Motor Carrier
8
Safety Administration (FMCSA), an agency within the DOT, manages the Compliance, Safety, Accountability program (CSA), designed to monitor and improve commercial vehicle motor safety. The FMCSA also has regulations mandating electronic logging devices in commercial motor vehicles that impact various aspects of our dedicated, supply chain and rental businesses.
We must comply with licensing and other requirements imposed by the DHS, and our supply chain security program is certified by the U.S. Customs and Border Protection Customs-Trade Partnership Against Terrorism certification, Canada’s Partners in Protection program, and Mexico’s Authorized Economic Operator program. We may also become subject to new or more restrictive laws and regulations related to emissions or vehicle specifications, drivers' hours of service, wage and hour requirements, employee and independent contractor classification, security, including data privacy and cybersecurity, and ergonomics.
Additional information about the laws and regulations that we are subject to can be found in Item 1A, "Risk Factors" in this Annual Report on Form 10-K.
HUMAN CAPITAL
We strive to create a high-performance culture that embraces diverse perspectives and experiences and ensures that all of our employees have opportunities to develop the skills they need to grow and excel in their fields. Human capital management is a priority for our executives and board of directors. We are committed to identifying and developing the talent necessary for our long-term success throughout all levels of our organization, including our front-line employees interacting with our customers or supporting our field teams from behind the scenes. We have a robust talent and succession planning process and have established programs to support the development of our talent pipeline for critical roles in our organization. Annually, we conduct a robust review with our leadership team focusing on high performing and high potential talent, diverse talent and the succession plan for our critical roles.
We recognize that it is important to develop our future leaders. We provide a variety of resources to help our employees build and develop their skills, including online development resources as well as individual development opportunities and projects for key talent. Additionally, we have leadership development resources for our future leaders as they continue to develop their skills. We invest in our employees by offering comprehensive health, welfare and retirement programs, along with wellness programs and well-being initiatives.
In addition, we provide our professional drivers, technicians and warehouse associates with on-going training opportunities. For example, we pair our professional drivers with certified driver trainers during onboarding and provide position and customer-specific training. Our technicians also receive both online and in-person training, and we collaborate with our OEMs to ensure our technicians possess the knowledge and skills necessary to service our customers. Our warehouse associates also receive regular safety and compliance training that is specific to their location.
As of December 31, 2025, we had 51,600 total employees in North America. We currently employ 12,700 professional drivers and 4,600 technicians. We have 34,300 hourly employees in the U.S., 3,600 of which are organized by labor unions. Those employees organized by labor unions are principally represented by the International Brotherhood of Teamsters, the International Association of Machinists and Aerospace Workers and the United Auto Workers. Their wages and benefits are governed by 94 separate labor agreements, which are renegotiated periodically. Although we have not experienced a material work stoppage or strike, these events can potentially occur given the types of businesses in which we engage. Refer to Item 1A, "Risk Factors" for further information regarding risk associated with our human capital and the attraction, development and retention of personnel.
9
Safety
Our safety culture is founded upon a core commitment to the safety, health and security of our employees, customers and the community. Safety is embedded in our day-to-day operations, reinforced by many safety programs and continuous operational improvement, and supported by our safety organization. We have created and implemented policies, processes and training programs to minimize safety events, and we review and monitor our performance closely. Our safety organization oversees our overall safety strategy and consists of three divisions: Safety Standards & Technology, Field Safety Solutions, and DOT Compliance. Our safety organization manages our safety policies, technologies and training, all field safety processes, risks assessments, safety site investigations and regulatory compliance activities, among other things.
We deploy relevant vehicle safety systems in the vehicles we operate and install aftermarket safety monitoring systems that allow our operations teams to measure and improve driver performance, including in-vehicle video event recorders. Training is also a key component of our safety program and is available to our professional drivers, technicians, warehouse associates and management, amongst others. Trainings cover a variety of topics, including safe driving, health and wellness, equipment safety, and proper lifting and material handling techniques. We use certified driver trainers to on-board and train our professional drivers, as well as provide proactive injury and crash prevention, and remedial training. Our technicians also receive training to improve their maintenance skills to ensure compliance with best-in-line safety measures. For our warehouse associates, we provide training on various safety techniques along with regular OSHA training. Our proprietary, web-based safety management system delivers monthly proactive safety programs and compliance tasks that are tailored to each location.
The safety policies and procedures in place require that all managers, supervisors and employees incorporate safe processes in all aspects of our business. Monthly safety scorecards are tracked and reviewed by management for progress toward key safety objectives.
Additionally, we offer safety support to customers through Ryder Fleet Risk Services (FRS), which helps customers navigate the increasingly complex industry landscape through customized consultations, trainings and compliance support.
10
INFORMATION ABOUT OUR EXECUTIVE OFFICERS
Name
Position
Current Position Since
Prior Business Experience
Age
Robert E. Sanchez (1)
Chair and Chief Executive Officer
2013
President and Chief Operating Officer from February 2012 to December 2012. President, Global FMS from September 2010 to February 2012. Executive Vice President and Chief Financial Officer from October 2007 to September 2010. Executive Vice President of Operations, U.S. FMS from October 2005 to October 2007. Senior Vice President and Chief Information Officer from January 2003 to October 2005.
60
John J. Diez (1)
President and Chief Operating Officer
2025
Executive Vice President and Chief Financial Officer from June 2021 to December 2024. President, Global FMS from August 2019 to May 2021. President of DTS from March 2015 to August 2019. Senior Vice President of Ryder Dedicated from March 2014 to February 2015. Senior Vice President of Asset Management from January 2011 to February 2014.
55
Cristina Gallo-Aquino
Executive Vice President, Chief Financial Officer and Principal Accounting Officer
2025
Senior Vice President, Controller and Principal Accounting Officer from September 2020 to December 2024. Vice President and Chief Financial Officer, Global FMS from August 2015 to August 2020. Vice President and Controller from September 2010 to August 2015.
52
Thomas M. Havens
President, Fleet Management Solutions
2021
Senior Vice President and Global Chief of Operations for FMS from November 2012 to May 2021. Vice President and General Manager for FMS in Canada from September 2011 to November 2012.
57
J. Steven Sensing
President, Supply Chain Solutions and Dedicated Transportation Solutions
2015
Vice President and General Manager of the Hi-Tech and Healthcare industry groups for SCS from February 2007 to February 2015.
Senior Vice President, Automotive, Aerospace, & Industrial for SCS from August 2022 to August 2025. Vice President, Ryder Last Mile from August 2021 to August 2022. Vice President, Dedicated Transportation Solutions from September 2019 to August 2021. Group Director, SCS in Retail, Tech & Health from June 2013 to September 2019.
51
Robert D. Fatovic
Executive Vice President, Chief Legal Officer and Corporate Secretary
2012
Executive Vice President, General Counsel and Secretary from June 2004 to July 2012. Senior Vice President, U.S. Supply Chain Operations, Hi-Tech and Consumer Industries from December 2002 to May 2004. Vice President and Deputy General Counsel from May 2000 to December 2002.
60
Karen M. Jones
Executive Vice President and Chief Marketing Officer
2014
Senior Vice President and Chief Marketing Officer from September 2013 to October 2014.
63
Francisco Lopez
Executive Vice President and Chief Human Resources Officer
2018
Chief Human Resources Officer February 2016 to February 2018. Senior Vice President, Global Human Resources Operations from July 2013 to February 2016.
51
Sanford J. Hodes
Senior Vice President and Chief Procurement and Corporate Development Officer
2022
Senior Vice President and Deputy General Counsel and Safety, Health, and Security from February 2011 to October 2022.
58
Rajeev Ravindran
Executive Vice President and Chief Information Officer
2018
Chief Information Officer and Group Vice President at JM Enterprises from 2012 to January 2018.
60
___________________
(1)As announced in December 2025, effective as of March 31, 2026, Mr. Sanchez will retire as CEO and assume the role of Executive Chair. At such time, Mr. Diez will succeed him as CEO and be appointed to the Board.
FURTHER INFORMATION
For further discussion concerning our business, see the information included in Items 7 and 8 of this Annual Report. Industry and market data used throughout Item 1 was obtained through a compilation of surveys and studies conducted by industry sources, consultants and analysts.
We make available our Annual Report on Form 10-K, quarterly reports on Form 10-Q, current reports on Form 8-K and all amendments to those reports through the Investor Relations area of our website at investors.ryder.com as soon as reasonably practicable after such material is electronically filed with or furnished to the Securities and Exchange Commission (SEC). The
11
SEC maintains an Internet site that contains our reports, proxy and information statements and other SEC filings. The address of the SEC's website is www.sec.gov.
In addition, our Corporate Governance Guidelines, Principles of Business Conduct and board committee charters are posted on the Governance page in the Investor Relations area of our website at investors.ryder.com. A copy of these documents is available to anyone through the Investor Relations area of our website at investors.ryder.com.
ITEM 1A. RISK FACTORS
The following is a cautionary discussion of the material risks and uncertainties that management believes affect us. Any of the following risks, as well as risks that are not currently known to us or that we currently deem immaterial, could materially affect our business, financial condition or results of operations. Accordingly, you should carefully consider the following risk factors in conjunction with all of the other information set forth in or incorporated by reference in this Form 10-K.
Business and Operating Risks
Decreased customer demand for transportation and logistics services due to adverse economic conditions, competition or other factors has impacted and could in the future adversely impact our business and operating results.
The transportation industry is highly cyclical and susceptible to trends in economic activity. Our business relies on the strength of our customers' businesses and their level of confidence in current and future economic conditions. In our FMS business, vehicles are leased or rented to customers that transport goods commercially, hence, the demand for our products and services is directly tied to the production and sale of goods by our customers, and more generally, the health of the North American economy. In our SCS and DTS businesses, our logistics and transportation services are tied to the demand for our customers' goods. If demand for our customers' products declines such as due to increased prices as a result of tariffs, our customers may experience a decline in volumes, which may impact our financial results. As a result, our business may begin to slow before overall market slowdowns, at the point of customer uncertainty, and may recover later than overall market recoveries, as our customers may continue to feel uncertain about future market conditions. If uncertainty around macroeconomic conditions and the transportation and logistics industries increases, such as due to recessionary conditions, changes in international trade policy, labor shortages, tariffs, interest rate fluctuations, inflationary pressures or changes in technology, our future growth prospects, business and results of operations could be materially adversely affected.
Among our services and product offerings, demand for used vehicles, rental and contractual sales are particularly susceptible to changes in economic and market conditions. In a weak or volatile economy (such as during an economic recession or downturn), our customers may not need additional vehicles, may experience reduced shipping or warehousing needs, or are often unwilling to commit or unable to fulfill long-term contracts. For example, we make real estate commitments to support our SCS multi client warehouse network based on anticipated customer demand to drive the highest level of utilization and revenue per warehouse. If customer demand is lower than expected we may have excess capacity in our warehouses. This could result in a decrease in revenue that could adversely affect our financial condition and operating results. Accordingly, any sustained weakness in demand or a protracted economic downturn can negatively impact performance and operating results in used vehicle sales, rental and contractual services across our business segments.
We bear the risk that we will not be able to resell our used vehicles at a price at or above their residual value estimates.
To determine the residual value estimates and useful life of our vehicle fleet, management is required to make judgments about future events that are subject to risks and uncertainties outside of their control. While we regularly review and update our outlook for the used vehicle market, as management believes appropriate, the used vehicle pricing market has historically been subject to significant pricing volatility. Despite management's best estimates, we may be unable to accurately forecast the residual value of our vehicle fleet or accurately and timely adjust our residual estimates to better align with future market conditions at the end of a vehicle's useful life. A variety of factors, many of which are outside of our control, could cause residual value estimates to differ from actual used vehicle sales pricing, such as changes in supply and demand of used vehicles; volatility in market conditions; changes in vehicle technology; regulatory requirements; competitor pricing; wholesale market prices; customer requirements and preferences; and changes in underlying assumption factors.
Any material decrease in residual value accounting estimates could have a material adverse impact on our financial results. In the past, we have realized losses on sales of used vehicles at the end of a vehicle's useful life when our residual value estimates were above used vehicle market prices due to rapidly changing market conditions. In addition, when we have materially decreased residual value estimates, our earnings over the vehicle's remaining useful life have decreased due to an
12
increase in depreciation expense. Alternatively, we may realize gains on sales of used vehicles at the end of a vehicle's useful life when our residual value estimates are below used vehicle market prices. While management determines residual value estimates with the goal of minimizing losses on sales of used vehicles and to record the best estimate of fair value at the end of a vehicle's useful life, there is no assurance our residual value estimates will be at or below used vehicle market prices.
For a detailed discussion on our accounting policies and assumptions relating to depreciation and residual values, please see "Critical Accounting Estimates - Vehicle Residual Values" in Management's Discussion and Analysis of Financial Condition and Results of Operations.
Our profitability has been and could in the future be negatively impacted if our key operational assumptions and pricing structure prove to be invalid.
Substantially all of our SCS and DTS services, as well as our ChoiceLease and SelectCare products offered through FMS, are provided under long-term contractual arrangements with our customers. These contractual arrangements include pricing terms that are subject to a number of key operational assumptions, including:
•with respect to our SCS contracts, the scope of services, production volumes, operational efficiencies, the mix of fixed versus variable costs, market wages, availability of labor, productivity, inflation, interest rates and other factors;
•with respect to our DTS contracts, market wages, availability of labor, equipment costs, insurance rates, inflation, interest rates, and other operating factors; and
•with respect to our ChoiceLease and SelectCare contracts, residual value estimates (ChoiceLease only) and maintenance costs (including inflation and interest rates), as well as other factors.
If we are incorrect in our operational assumptions, or, as a result of subsequent changes in customer demand or other market forces that are outside of our control, these assumptions prove to be invalid, we could have lower margins than anticipated in a contract or segment, lose business, or be unable to offer competitive products and services. Although these contracts include indexed price escalation clauses or permit renegotiation upon a material change, there is no assurance that we will be successful in obtaining the necessary price adjustments or that pricing will be sufficient to cover the risk.
For example, our SCS and DTS services are highly customized and offer a high degree of specialization to meet the needs of our customers. We may not be able to adjust the pricing terms in some of our SCS and DTS contracts in the event any of our assumptions prove to be invalid. As a result, if we do not accurately predict our costs to execute SCS or DTS contracts, it could result in a significant decrease in revenue or loss that could adversely affect our operating results and financial condition.
Disruptions in global supply chains have impacted, and may continue to impact, our business, results of operations and financial condition.
Our business is highly susceptible to disruptions in global supply chains as our services are directly tied to the production and sale of goods. Disruptions in global supply chains have impacted each of our business segments as the supply and demand of commercial vehicles and vehicle parts directly impacts our FMS business, and the production and supply of certain goods impacts the businesses of our customers in SCS and DTS, and therefore our own business. Measures implemented in response to public health crises, geopolitical developments, labor strikes, and changes in international trade policy, among others, may disrupt global supply chains which may then adversely affect our business and results of operations.
For example, when COVID-19 measures prohibited many of our customers from continuing their operations, our business was initially adversely impacted because we experienced lower demand for commercial rental and used vehicles in our FMS business and reduced volumes in our SCS business. When global supply chain disruptions later caused a semiconductor shortage, we then experienced a significant increase in demand for rental and used vehicles, as well as lease, due to the limited supply of commercial vehicles. However, if there is a limited supply of commercial vehicles for an extended period of time, we may experience limited rental and lease fleet growth and a limited inventory of used vehicles. If OEMs then produce an oversupply of new commercial vehicles, our FMS business may experience reduced rental demand and used vehicle sales. Moreover, when global supply chains have been disrupted, we have experienced increased inflationary pressures that increased costs in certain other areas like payroll, real estate or lease costs and other third-party services.
Overall, the extent to which future supply chain disruptions impact our business, operations and financial results will depend on numerous factors that are difficult to accurately predict. Depending on the circumstances of a particular supply chain
13
disruption, economic and commercial activity may be impacted, and, as a result, we may again experience slowdowns, reduced demand and a negative impact to a portion of our earnings.
Our capital-intensive business requires us to make capital decisions based upon projected customer activity levels and market demand for our commercial rental product line.
We make significant investments in vehicles to support our rental business based on anticipated customer demand. We make commitments to purchase the vehicles months in advance of the expected use of the vehicle and seek to optimize the size and mix of the commercial rental fleet based on demand projections and various other factors. As a result, our business is dependent on our ability to accurately estimate future levels of rental activity and consumer preferences to effectively capitalize on market demand in order to drive the highest levels of utilization and revenue per unit. Missing our projections could result in too much or too little capacity in our rental fleet. Overcapacity could require us to deploy or sell vehicles at lower than anticipated pricing levels, which may result in higher depreciation or losses on vehicle sales. In addition, overcapacity could have an adverse impact on profitability. Undercapacity could impact our ability to reliably provide rental vehicles to our customers and may negatively affect our reputation. We employ a sales force and operations team on a full-time basis to manage and optimize this product line; however, their efforts may not be sufficient to overcome unforeseen changes in market demand in the rental business. In contrast, in our ChoiceLease product line, we typically do not purchase vehicles until we have an executed contract with a customer.
Failure to maintain, upgrade and consolidate our information technology networks, or maintain adequate controls over such technology systems, could adversely affect us.
Our success depends on the functionality of information technology systems to support our business and service offerings. When outages, system failures or delays in timely access to data occur in our information technology systems that support key business processes, for example our financial reporting and service offerings, our business may be adversely impacted. In addition, extended delays or cost overruns in securing, developing, managing and otherwise implementing technology solutions to support our business may delay and possibly prevent us from realizing the projected benefits of these solutions. Any failure to develop or maintain effective controls, including the risk of human error or misconduct, or to adequately monitor and control access to data in our systems, may result in our financial reporting being unreliable or cause us to fail to meet our reporting obligations. Further, any vulnerabilities found in the technology systems we use to support our controls or any challenges encountered in their implementation or improvement may also adversely affect our financial reporting.
We are continuously upgrading and consolidating our information technology systems by enhancing or replacing legacy systems. When we acquire new businesses, we also have to integrate those acquired systems to our network. These activities subject us to additional costs and risks, including disruption of our internal control structure, substantial capital expenditures, additional administration and operating expenses, impairment of our ability to provide our services, retention of sufficiently skilled personnel to implement and operate the new systems, and other costs and risks. Our system implementations may not result in productivity improvements at a level that outweighs the costs of implementation, or any increased productivity.
We face risks related to cybersecurity incidents and other breaches of our systems and information technology.
We depend on the integrity of our information and the proper functioning and availability of our information systems in operating our business. It is important that the data processed by these systems remains confidential and accurate as it may include sensitive customer information, confidential customer transaction data, employee records, and key financial and operational results and statistics. While we maintain an information security program that consists of industry standard safeguards and controls to help safeguard our confidential information, including security training and compliance protocols, we cannot prevent or mitigate all data breaches or cyber incidents. Threats to network and data security are becoming increasingly diverse and sophisticated, with attacks increasing in frequency (especially with the shift to remote work environments), scope and potential harm. Additionally, emerging technologies such as artificial intelligence may make it more difficult to implement protective measures that detect and prevent the occurrence of breaches or cyber incidents described above. We use artificial intelligence in our business, and challenges with its use could result in reputational or competitive harm and legal liability, which could have an adverse impact on our results of operations.
We have experienced cybersecurity threats and breaches targeting our information technology systems, networks and information, and those of our third-party providers and customers. Although, to date, these incidents have not had a material impact on our financial condition or results of operations, future events could expose us to these risks. Moreover, these types of events could also expose us, our vendors, or our customers to loss or misuse of information and restrict or prevent operations or
14
financial reporting for a period of time. Depending on the type and scope of the intrusion or cybersecurity incident, we could face litigation or other potential liability and harm to our business. Likewise, data privacy breaches from our systems could expose the personally identifiable information of our employees or contractors, sensitive customer data, or vendor data to unauthorized persons, adversely impacting our customer service, employee and customer relationships, and our reputation.
In addition, some of our software applications are utilized by third parties who provide outsourced administrative functions. Such third parties may have access to confidential information important to our business operations and services. While our information security program includes enhanced controls to monitor third-party providers' security programs, these third parties are subject to their own data breaches, cyberattacks and other events or actions that could damage, disrupt or close down their networks or systems, which in turn may adversely impact our performance capabilities. Moreover, weaknesses in vendor management or third-party controls could expose us, our vendors or our customers to additional cybersecurity risks. Also, efforts to prevent, detect and mitigate data breaches and cyber incidents subject us to additional costs.
Regulatory authorities continue to focus on how companies collect, process, use, store, share and transmit personal data. Privacy security laws and regulations pose increasingly complex and rigorous compliance challenges, which impacts our compliance costs. Any failure to comply with data privacy laws and regulations could result in significant penalties, fines, legal challenges and reputational harm.
We may fail to respond adequately or in a timely manner to innovative changes in new technology in our industry.
In recent years, our industry has been characterized by rapid changes in technology, leading to innovative transportation and logistics concepts that have impacted, or have the potential to significantly impact, our business model, competitive landscape and the industries of our customers and suppliers. While we are actively engaged in deploying emerging technologies and developing strategic alliances and new products, we cannot be certain that our initiatives will be successful or timely, and our failure to effectively implement any initiative could have an adverse impact on our financial condition or results of operations.
For example, the transportation and logistics industries may be impacted by innovations in advanced vehicle, machine learning and artificial intelligence technologies (e.g., zero-emission vehicles, autonomous or driver-assist technologies, and warehouse automation), as well as technologies we cannot yet foresee. If we are unable to quickly adapt to and adopt innovations desired by our customers, it may result in a significant loss of demand for our service offerings. Certain innovations, such as an increase in customer use of zero-emission vehicles, for example, could reduce the demand for our diesel vehicle and related maintenance and other offerings. Advancements in warehouse automation technology, such as autonomous mobile robots (AMRs), have impacted, and may continue to impact, our supply chain business. If warehouse automation technologies reduce the number of warehouse associates needed at a facility, it could adversely affect our financial condition and operational results as it could decrease SCS revenue or lead to a decrease in demand for our services. Moreover, advances in technology may require us to increase investments in order to remain competitive, and our customers may not be willing to accept higher prices to cover the cost of these investments. In addition, public policy changes may affect the requirements or timing of adopting new technologies, as well as product availability from manufacturers. These changes could further increase our investment costs, operating complexity and our ability to offer such technologies to our customers in the jurisdictions in which we operate.
We may fail to establish sufficient insurance reserves to adequately cover workers' compensation and vehicle liabilities.
We are substantially self-insured for vehicle liability and workers' compensation claims. Our self-insurance accruals are based on actuarially estimated, undiscounted cost of claims, which includes claims incurred but not reported. While we believe that our estimation processes are well designed and comply with generally accepted accounting principles in the United States, actuarial techniques and best practices, any projection of losses concerning workers' compensation and vehicle coverage is subject to a considerable degree of variability. The causes of this variability include litigation trends, claim settlement patterns, rising medical and other costs, as well as fluctuations in the frequency or severity of accidents. If actual losses incurred are greater than those anticipated, our self-insurance reserves may be insufficient, and additional costs could be recorded in our consolidated financial statements. If we suffer a substantial loss in excess of our self-insured limits, the loss and related expenses may be covered by traditional insurance and excess insurance we have in place, but if not covered or above such coverage amounts, losses could harm our business, financial condition or results of operations. For a detailed discussion on our accounting policies and assumptions relating to our self-insurance reserves, please see the "Critical Accounting Estimates - Self-Insurance Obligations" section in Management's Discussion and Analysis of Financial Condition and Results of Operations.
15
Strategic Risks
We operate in a highly competitive industry, and our business may suffer if we are unable to adequately address potential downward pricing pressures and other competitive factors.
The transportation and logistics industry is highly competitive. We face competition in all geographic markets and each industry sector in which we operate. Increased competition or our inability to compete successfully may lead to a reduction in revenues, reduced profit margins, increased pricing pressure or a loss of market share, any one of which could affect our financial results. Numerous competitive factors could impair our ability to maintain our current profitability, including:
•our inability to obtain expected customer retention levels or profitability;
•customers may choose to provide the services we provide for themselves;
•we compete with many other transportation and logistics service providers, some of which have greater capital resources or lower cost structures than we do;
•our inability to compete with new entrants in the transportation and logistics market that may offer similar services at lower cost or have greater technological capabilities;
•our competitors may periodically reduce their prices to gain business, especially during times of declining economic growth, which may limit our ability to maintain or increase prices or impede our ability to maintain our profitability or grow our market share or profitability;
•many customers periodically accept bids from multiple carriers for their shipping needs, and this process may depress rates or result in the loss of some of our business to competitors;
•the continuing trend toward consolidation in the trucking industry may result in larger carriers with greater financial resources than we have;
•advances in technology require increased investments to remain competitive, and our customers may not be willing to accept higher prices to cover the cost of these investments; and
•because cost of capital is a significant competitive factor, any increase in either the cost of our debt or equity as a result of, for example, reductions in our debt rating or stock price volatility could have a significant impact on our competitive position.
Failure to execute our business strategy, explore strategic transactions, and develop, market and deliver high-quality services that meet customer expectations may cause our revenue and earnings to suffer.
Our balanced growth strategy focuses on de-risking and optimizing the business model, enhancing returns and free cash flow, and driving long-term profitable growth, including by moving clients to outsource their logistics and transportation needs and thereby expanding the market for our services, among other factors. We seek to execute our strategy by providing customer centric innovative solutions, operational excellence, top customer service, superior talent and best-in-class information technology, while also attempting to mitigate risks to the business. Failure to execute our business strategy may negatively impact our ability to continue to create long-term shareholder value and may result in stock price volatility.
To successfully execute on this strategy, we must continue to focus on developing innovative solutions that meet both our existing and target customers' evolving needs and keep pace with our competitors. Expanding our service offerings to entice and support new clients may strain our management, capital resources, information systems and customer service. We may also need to hire new employees, which may increase costs and may result in temporary inefficiencies until those employees become proficient in their jobs.
In furtherance of our strategy, we routinely evaluate opportunities and may enter into agreements for possible strategic transactions, including acquisitions, partnerships or divestitures. We may be unable to identify strategic transactions or we may be unable to negotiate commercially acceptable terms. Other risks involved in engaging in these strategic transactions include the possible failure to realize the expected benefits of such transactions within the anticipated time frame, or at all, such as cost savings, synergies, sales and growth opportunities. In addition, the integration of an acquired business may result in material unanticipated challenges, expenses and liabilities. Any one of these factors could result in lower than expected revenues or earnings from the acquisition or strategic transaction and could adversely impact our financial condition or results of operations.
Notwithstanding our efforts, new or enhanced service offerings may not meet customer demands, prove to be profitable, or succeed in the long term. If we do not respond to current customer needs and establish new, and further develop existing, customer relationships, our ability to maintain a competitive advantage and continue to grow our business profitability could be negatively affected.
16
We and the vehicle equipment manufacturers in our FMS business rely on a small number of suppliers.
We buy vehicles and related equipment from a relatively small number of OEMs in our FMS business. Some of our OEMs rely on a small concentration of suppliers for certain vehicle parts, components and equipment. A discrete event in a particular OEM's or supplier's industry or location, or adverse regional economic conditions impacting an OEM or supplier's ability to provide vehicles or a particular component, has and could in the future adversely impact our FMS business and profitability. In addition, our business and reputation could also be negatively impacted if any parts, components or equipment from one of our suppliers suffer from broad-based quality control issues or become the subject of a product recall and we are unable to obtain replacement parts from another supplier in a timely manner. Although we believe we have alternative sources of supply for the equipment and other supplies used in our business, termination or significant alteration of our relationship with any of our key suppliers could have a material adverse effect on our business, financial condition or results of operations in the unlikely event that we were unable to obtain adequate equipment or supplies from other sources in a timely manner or at all.
We derive a significant portion of our SCS and DTS revenue from a limited number of customers.
In our SCS and DTS businesses a limited number of customers account for a significant portion of revenue. Although we maintain multiple service contracts with each of these large customers, the loss of or reduction in business from one or more of these large customers could have a material adverse effect on our business, results of operations and financial condition. While we continue to focus our efforts on diversifying our customer and carrier base, we may not be successful in doing so. During 2025, sales to our top ten customers in each of SCS and DTS accounted for approximately one-third of total revenue and operating revenue for each segment.
We are also subject to credit risk associated with the concentration of our accounts receivable from our SCS and DTS customers. If one or more of our customers were to become bankrupt, insolvent or otherwise were unable to pay for the services we provide, we may incur significant write-offs of accounts receivable or incur lease or asset impairment charges that could adversely affect our operating results and financial condition.
In addition, many of our SCS customers operate in cyclical or seasonal industries, or operate in industries, such as the food and beverage industry, that may be impacted by unanticipated weather, growing conditions (such as drought, insects or disease), natural disasters, pandemics and other conditions over which we have no control. Because of the concentration of customers in our SCS business, a downturn in our customers' businesses could cause a reduction in freight volume shipped by those customers or a reduction in their need for our services, which could materially and adversely affect our operating results and financial condition.
Legal, Regulatory and Financial Risks
We face litigation risks that could have a material adverse effect on the operation of our business.
We face litigation risks regarding a variety of issues, including accidents involving our trucks and injuries to employees, alleged violations of federal and state labor and employment law such as class-action lawsuits alleging wage and hour violations, independent contractor misclassification and improper pay, intellectual property infringement, securities laws, environmental liability, commercial claims, cyber and other matters. These matters may be time-consuming, expensive and disruptive to normal business operations. The defense of such matters could result in significant expense and the diversion of our management's time and attention from the operation of our business. In addition, our involvement could negatively impact our business reputation and our relationships with our customers, suppliers or employees. In recent years, several insurance companies have stopped offering coverage to trucking companies and reduced capacity limits as a result of increases in the severity of automobile liability claims and higher costs of settlements and verdicts, causing the cost of such insurance to increase. This trend could adversely affect our ability to obtain suitable insurance coverage or significantly increase the cost of such coverage, each of which may adversely affect our financial condition, results of operations, liquidity or cash flows. Costs we incur to defend or to satisfy a judgment or settlement of these claims may not be covered by insurance or could exceed the amount of that coverage or increase our insurance costs and could have a material adverse effect on our financial condition, results of operations, liquidity and cash flows.
17
We operate in a highly regulated industry, and changes in laws and regulations or costs of compliance with, or liability for violation of, existing or future laws or regulations could have a material adverse effect on our business.
Our business is subject to laws and regulations in the jurisdictions in which we operate and is regulated by various agencies, including the DOL, DOT, HHS, USDA and SEC. For example, the DOT exercises broad powers over our motor carrier operations and safety. We are also subject to safety, health and environmental laws and regulations imposed by various jurisdictions and agencies, such as the FDA, USDA, EPA and OSHA, including requirements related to emissions and vehicle specifications. We must also comply with domestic and international laws and regulations related to tax, anti-bribery, anti-corruption and anti-money laundering laws, such as the U.S. Foreign Corrupt Practices Act and Office of Foreign Assets Control (OFAC) restrictions. Our failure to comply with applicable laws and regulations, which may vary significantly by jurisdiction, may expose us to legal liability, fines or other penalties.
Compliance with laws and regulations has involved, and we expect will continue to involve, significant time commitments and costs. For example, the DOT, through the FMCSA, periodically conducts compliance reviews and evaluates the safety rating assessed to motor carriers ("satisfactory," "conditional" or "unsatisfactory"). The receipt of a final "conditional" or "unsatisfactory" safety rating could have a material adverse effect on certain customer relationships. Moreover, if we fail to comply with DOT regulations, including failing to maintain a "satisfactory" safety rating, the DOT could levy fines and require us to cease all transportation services, which could have a material adverse effect on our business. In addition, compliance and enforcement initiatives implemented by the FMCSA related to drivers' hours of service, fitness and safety may shrink the industry's pool of professional drivers.
In addition, new laws or regulations may be adopted or interpretative changes to existing laws and regulations could be issued at any time, which could further increase our costs or operating complexity and our ability to offer certain services in the jurisdictions in which we operate. Our failure to comply with any existing or future laws or regulations, whether actual or alleged, could have a material adverse effect on our business and on our ability to access the capital required to operate our business. Among other things, any such failure could expose us to reputational harm, loss of business, fines, penalties or potential litigation liabilities, and the loss of operating authority and restrictions on our operations. For example, compliance with new laws or regulations related to employee and independent contractor classification may cause us to incur additional exposure under federal and state tax and employment laws.
Similarly, compliance with environmental laws or regulations may also impose new restrictions on our business or require us to take certain actions that may increase our costs and adversely affect our business, such as emission reduction and zero-emission vehicle requirements. These and other similar efforts may impose restrictions on our activities or require us to take certain actions, all of which may, over time, increase our costs and adversely affect our business and results of operations. Additionally, the demand for maintenance services in FMS and offerings in our SCS and DTS businesses may also be adversely affected. Further, compliance with environmental laws and regulations is complicated by various jurisdictions following different approaches to the regulation of climate change. As a result, we cannot predict the ultimate effect on our operating results or cost structure until the timing, scope and extent of any such regulations become known. In addition, any adverse publicity about emissions by the transportation industry, for example, could accelerate the adoption of new technology and potentially decrease customer demand for some of our services and used vehicles.
Moreover, we may also fail to ensure that companies we acquire, that may not have historically maintained internal compliance controls, risk mitigation processes, or policies or procedures, comply with laws and regulations consistent with our standards. We are also subject to reputational risk and other detrimental business consequences associated with noncompliance by other parties with whom we engage with, such as employees, customers, agents, suppliers or other persons using our supply chain or assets, who may commit illegal acts, including the use of company assets for terrorist activities, fraud or a breach of data privacy laws.
Our business may be affected by uncertainty or changes in U.S. or global social, political or regulatory conditions.
Adverse developments in laws, policies or practices in the U.S. and internationally can negatively impact our business and the businesses of our customers. Negative domestic and international global trade conditions as a result of social, political or regulatory changes or perceptions could materially affect our business, financial conditions and results of operations.
18
We provide services domestically and to a lesser extent outside of the U.S., which subjects our business to various additional risks, including:
•changes in tariff policies, including recently imposed tariffs on imported vehicles, vehicle parts and industrial goods, trade restrictions and trade agreements, such as the U.S.-Mexico-Canada Agreement;
•varying tax regimes, including consequences from changes in applicable tax laws;
•difficulties in managing or overseeing foreign operations and agents;
•foreign currency fluctuations and limitations on the repatriation of funds due to foreign currency controls;
•different liability standards;
•fluctuations in inflation and interest rates;
•the price and availability of fuel;
•geopolitical developments, such as national and international conflict; and
•intellectual property laws of countries that do not protect our rights in intellectual property to the same extent as the laws of the U.S.
If we do not correctly anticipate changes in social, political or regulatory conditions or their impact on the transportation and logistics industries, we may not alter our business practices in time to avoid adverse effects. For example, in our FMS business, the recent introduction of tariffs has modestly increased our maintenance costs as the prices of certain vehicle parts has increased. To the extent we are unable to mitigate these or other cost increases, our operating results in our FMS business could be adversely affected. Additionally, the occurrence or consequences of any of these factors may restrict our ability to operate in the affected region or decrease the profitability of our operations in that region.
Our suppliers and customers may also be affected by changes in the political and regulatory environment, both in the U.S. and internationally. Negative impacts on our suppliers or customers could in turn affect our ability to operate and serve our customers, which may adversely impact our business and operating results.
We may be negatively impacted by adverse events in the U.S. credit and financial markets, by an investment rating downgrade, or by the loss of an investment grade rating.
Our FMS business is highly capital intensive, and its profitability could be adversely affected if we are unable to obtain sufficient capital to fund its operations. In general, we rely in large part upon U.S. credit and financial markets to fund our operations and contractual commitments as well as to refinance existing debt. These markets can experience high levels of volatility, and our access to capital could be constrained for extended periods. Our ability to raise capital may be materially reduced or our borrowing costs may significantly increase if, among other things, access to public investment-grade debt becomes limited or closed, we lose access to our revolving credit facility, or funding costs increase due to the loss of an investment grade rating, a severe economic downturn, or rising interest rates.
As of December 31, 2025, we had $7.6 billion of outstanding indebtedness. If we are unable to raise additional capital by accessing the debt and equity markets, or our costs of raising additional capital were to materially increase, our business could experience a material adverse effect on our operating results or we could face difficulty in implementing our long-term strategy.
Volatility in assumptions, discount rates and investment returns related to our pension plans may adversely affect the funding status of the pension plans, future funding requirements and our pension expense under our defined benefit pension plans.
We sponsor a number of defined benefit plans for employees not covered by union-administered plans, including certain employees in foreign countries. As of December 31, 2025, the aggregate present value of obligations of our global defined pension plans was $1.6 billion, and the fair value of the plan assets of our global defined benefit pension plans was $1.5 billion. The calculation of pension expense and pension plan funding requirements are influenced by multiple factors, including the funded status of our plans, which equals the difference between the plans' projected benefit obligations and the fair value of the plans' assets. Macroeconomic factors, as well as changes in investment returns and discount rates, can be volatile and may have an unfavorable impact on the funded status of our pension plans, our pension expense and future funding requirements. Although we are actively seeking to control increases in our pension expense and future funding requirements through annuitization transactions, liability-driven investment strategies and plan contributions, there can be no assurance that we will succeed, and continued cost and funding requirement pressure could reduce the profitability of our business and negatively impact our cash flows.
19
Our failure to comply with U.S. or foreign tax laws or a government challenging our tax position could adversely affect our business and future operating results.
We are affected by various federal, state and foreign tax laws, including income taxes, taxes imposed on the purchase, sale and lease of goods and services, such as sales, excise, property, value-added tax, fuel, environmental and other taxes, and taxes imposed on multinational corporations. If we are unable to successfully take actions to manage the adverse impacts of new tax legislation, or if additional interpretations, regulations, amendments or technical corrections exacerbate the adverse impacts of such legislation, our financial condition, results of operations and cash flows could be adversely affected. In addition, in the ordinary course of our business, there are many transactions and calculations where the ultimate tax determination is uncertain. For example, significant judgment is required in determining our provision for income taxes, and our tax expense includes estimates of additional tax that may be incurred for tax exposures and reflects various estimates and assumptions. Our operating results could be adversely affected by changes in the effective tax rate as a result of a change in a variety of factors, including the mix of earnings in jurisdictions with differing statutory tax rates and changes in our overall profitability.
From time to time we are also under audit by tax authorities in different jurisdictions with regards to income tax and indirect tax matters. Although we believe our tax estimates are reasonable, the final determination of tax audits and any other related tax proceedings in the jurisdictions where we are subject to taxation could be materially different from our historical income and indirect tax provisions and accruals.
Human Capital
If we are unable to mitigate labor shortage challenges, our financial results may continue to be negatively impacted.
In the past, we have experienced high labor costs due to labor shortage challenges across all of our business segments, particularly our DTS and SCS segments. These higher labor costs as well as higher subcontracted transportation costs have negatively impacted our earnings in both DTS and SCS. If labor shortages exist for an extended period of time, our earnings may be adversely impacted.
Professional Drivers. We hire professional drivers primarily for our SCS and DTS business segments. There is significant competition for qualified professional drivers in the transportation industry. Additionally, interventions and enforcement under the CSA initiative may shrink the industry's pool of professional drivers as existing drivers with unfavorable scores may no longer be eligible to drive for us. As a result of driver shortages, we have, and in the future could continue to be required to, increase driver compensation, let trucks sit idle, use outside driver agencies and subcontracted transportation carriers, or face difficulty meeting customer demands, all of which could adversely affect our growth and profitability.
Technicians. Similarly, we hire technicians in our FMS business segment to perform vehicle maintenance services on our ChoiceLease, SelectCare and rental fleets. In recent years, there has been a decrease in the overall supply of skilled maintenance technicians, particularly new technicians with qualifications from technical programs and schools, which could make it more difficult to attract and retain skilled technicians. If we are unable to maintain an adequate number of qualified technicians, whether through the retention of current technicians or the hiring of new qualified technicians, our business could be adversely affected.
Warehouse Associates. We also hire warehouse associates in our SCS business segment to support the movement of goods in warehouses, particularly in our omnichannel and consumer packaged goods verticals. In recent years, there has been ongoing competition for warehouse associates in the logistics industry. At times, our business has experienced increased demand and competition for labor, which drives up costs. If we are unable to maintain an adequate number of qualified warehouse associates, whether through our own recruitment and retention or the use of alternative third-party staffing agencies, our operations may be adversely impacted.
Management and Other Key Personnel. The foundation to our success is developing a skilled and diverse workforce that is motivated and committed to providing our customers with extraordinary service. If we fail to recruit, retain and motivate our employees, including those in senior management and other key roles, such as technology and supply chain management, or fail to preserve company culture, then we may not be able to execute on our strategy and grow our business as planned.
In addition, we are committed to creating a positive and collaborative work environment throughout our organization. If we do not, or are perceived not to, have such a work environment, our reputation or ability to recruit and retain talent may be
20
adversely impacted. Moreover, our current employees may terminate their employment with us at any time with minimal advance notice, and we are experiencing increased competition for talent that is making it more difficult for us to retain the employees we have and to recruit new employees. In addition, we are facing increased regulatory and compliance requirements that further decrease the pool of available candidates.
A significant labor dispute involving us, our vendors or one or more of our customers, or that could otherwise affect our operations, may result in strikes, work stoppages or substantially higher labor costs.
We have approximately 3,600 employees in the U.S. that are organized by labor unions whose wages and benefits are governed by 94 labor agreements that are renegotiated periodically. Disputes with regard to the terms of these agreements or our potential inability to negotiate acceptable contracts with these unions in the future could result in, among other things, a material work stoppage, slowdown or strike by the affected employees. If our workers were to engage in a work stoppage, strike or other slowdown, other employees were to become unionized, or the terms and conditions in future labor agreements were renegotiated, we could experience business disruptions or higher operating costs, which could have an adverse effect on our financial position, results of operations or cash flows. Moreover, a current or future labor dispute involving our vendors or customers, or that could otherwise affect our operations, could affect our business, financial condition or results of operations.
General Risk Factors
Damage to our reputation through unfavorable publicity or the actions of our employees could adversely affect our financial condition.
Our success is built on our ability to consistently deliver operational excellence and strong customer service. Our inability to deliver our services and solutions as promised on a consistent basis, or our customers having a negative experience or otherwise becoming dissatisfied, can negatively impact our relationships with new or existing customers and adversely affect our brand and reputation, which could adversely affect revenue and earnings growth. Adverse publicity (whether or not justified) relating to activities by our employees, contractors, agents or others with whom we do business, such as customer service mishaps or noncompliance with laws, including misconduct, fraud or other improper activities, could tarnish our reputation and reduce the value of our brand. With the increase in social media and citizen journalism, adverse publicity can be disseminated quickly and broadly, making it increasingly difficult to respond effectively. This unfavorable publicity could also require us to allocate significant resources to reinforce and protect our reputation.
Future acts of terrorism or war, or regulatory changes to combat the risk of terrorism or war may cause significant disruptions in our operations.
Transportation assets such as our fleet of vehicles and other infrastructure and information technology systems remain a target for terrorist activities. Terrorist attacks, along with any government response to those attacks, may adversely affect our financial condition, results of operations or liquidity. Regulations adopted by federal, state or local governmental bodies, including the OFAC, that impact the transportation industry, including checkpoints and travel restrictions on large trucks, could disrupt or impede the timing of our operations or cause us to incur increased expenses in order to continue meeting customer requirements. In addition, complying with these or future regulations could continue to increase our operating costs and reduce operating efficiencies. We maintain insurance coverages addressing these risks, and we have received U.S. Patriot Act protections for our security practices related to the rental of our assets. However, such insurance may be inadequate or become unavailable, premiums charged for some or all of the insurance could increase dramatically, regulations may change, or U.S. Patriot Act protections could be reduced. These changes could exacerbate the effects of an act of terrorism on our business, resulting in a significant business interruption, increased costs and liabilities and decreased revenues, or an adverse impact on results of operations.
Extreme weather or other natural occurrences could result in significant business interruptions and expenditures in excess of available insurance coverage.
Our business is susceptible to extreme weather and other natural occurrences as we operate a capital-intensive business with a large number of vehicles and need to access roads, warehouses and other facilities in order to service our customers. Extreme weather and other natural occurrences may negatively affect our operations as it may damage our vehicles and facilities and prohibit our workforce from servicing our customers. In addition, fuel costs may rise and other significant business interruptions could occur. Insurance to protect against loss of business and other related consequences resulting from
21
these natural occurrences is subject to coverage limitations, and may not be sufficient to cover all of our damages or may not be available at commercially reasonable rates.
ITEM 1B. UNRESOLVED STAFF COMMENTS
None.
ITEM 1C. CYBERSECURITY
Our cybersecurity program is designed to protect the integrity of our information and the proper functioning and availability of the information systems that help operate our business. We utilize the National Institute of Standards and Technology's Cybersecurity Framework (NIST CSF) to inform our cybersecurity program and maintain International Organization for Standardization 27001 (ISO 27001) certification. We have created and implemented processes that assess, identify, respond to and manage cybersecurity threats and incidents, and we oversee these processes to minimize the occurrence and impact of any unauthorized access, disruption or use of our information or that of our customers. We have a robust set of information security policies related to encryption of data, anti-virus, firewalls, multi-factor authentication, training of employees, as well as incident response capabilities designed to proactively identify risks and mitigate attacks and unauthorized access attempts to our systems, amongst other measures.
Our cybersecurity program is evaluated by both our management and board of directors. Our Chief Information Officer supervises our cybersecurity program, and our Chief Information Security Officer (CISO) manages its daily operation.Our CISO has over two decades of experience in the cybersecurity and risk management fields, including over 15 years of experience leading cybersecurity oversight, as well as various industry-recognized certifications, such as the Certified Information Systems Security Professional and Auditors certifications.The CISO provides quarterly reports to the audit committee of our board of directors, which is responsible for overseeing cybersecurity and information technology and notifying the board of directors of any significant risks or updates. These reports may include updates on our enterprise-wide cybersecurity strategy, policies, processes and standards, as well as potential cybersecurity or information technology risks and threats. Our cybersecurity program is also evaluated at least annually by external experts, and the results of those reviews are reported to our leadership team and the board of directors. Cybersecurity risk is also evaluated as an enterprise-wide risk via our enterprise risk management program, which is reviewed by our leadership team and the board of directors. All employees are required to complete semiannual cybersecurity trainings and have access to more frequent cybersecurity trainings through online simulations. We also require employees in certain roles to complete additional role-based, specialized cybersecurity trainings.
While we have experienced cybersecurity threats and breaches targeting our information technology systems, networks and information, and those of our third-party providers and customers, to date, these incidents have not had a material impact on our financial condition or results of operations. In the event of a cybersecurity incident, we assess whether such incident had a material impact, and in certain cases, such assessment is reviewed by our leadership team, including the Chief Executive Officer, outside legal advisors and other third-party advisors. Refer to Item 1A. Risk Factors for further information regarding risk related to cybersecurity incidents and other breaches of our systems and information technology.
ITEM 2. PROPERTIES
Our properties consist primarily of vehicle maintenance and repair facilities, warehouses and other real estate and improvements.
We manage 827 FMS properties in the U.S., Puerto Rico and Canada; we own 470 of these properties. Our FMS properties are primarily comprised of maintenance facilities generally including a shop for preventive maintenance and repairs, a service island for fueling, safety inspections and preliminary maintenance checks, used vehicle retail sales centers, and in many cases, a commercial rental vehicle counter. Included in these FMS properties are 155 on-site maintenance facilities, located at customer locations.
We also manage 524 locations in the U.S., Canada and Mexico in connection with our SCS business, which includes 246 customer locations. Almost all of our SCS locations are leased and generally include a warehouse, administrative offices and an equipment domicile. Our Mexico locations may also include repair shops.
Additionally, we maintain 14 U.S. locations primarily used for Central Support Services. These facilities are generally administrative offices, of which we own four and lease the remaining locations.
We are involved in various claims, lawsuits and administrative actions arising in the normal course of our businesses. Some involve claims for substantial amounts of money and/or claims for punitive damages. While any proceeding or litigation has an element of uncertainty, management believes that the disposition of such matters, in the aggregate, will not have a material impact on our consolidated financial condition or liquidity. Refer to Note 21, "Contingencies and Other Matters", for additional information regarding our legal proceedings.
ITEM 4. MINE SAFETY DISCLOSURES
Not applicable.
PART II
ITEM 5. MARKET FOR REGISTRANT’S COMMON EQUITY, RELATED
STOCKHOLDER MATTERS AND ISSUER PURCHASES OF EQUITY SECURITIES
Ryder Common Stock
Our common shares are listed on the New York Stock Exchange under the trading symbol “R.” As of January 31, 2026, there were 4,362 common stockholders of record.
Performance Graph
The following graph compares the performance of our common stock with the performance of the Standard & Poor's MidCap 400 Index and the Dow Jones Transportation 20 Index for a five-year period by measuring the changes in common stock prices from December 31, 2020 to December 31, 2025.
The stock performance graph assumes for comparison that the value of our common stock and of each index was $100 on December 31, 2020, and that all dividends were reinvested. Past performance is not necessarily an indicator of future results.
23
Purchases of Equity Securities
The following table provides information with respect to purchases we made of our common stock during the quarter ended December 31, 2025:
Total
Number
of Shares
Purchased
Average
Price
Paid per
Share (1)
Total Number
of Shares
Purchased as
Part of Publicly Announced Programs (2)
Aggregate Maximum
Number of Shares That
May Yet Be Purchased
Under the Discretionary
and Anti-Dilutive
Programs (2)
October 1 through October 31, 2025
305,920
$
169.29
305,920
3,194,080
November 1 through November 30, 2025
680,971
168.71
680,000
2,514,080
December 1 through December 31, 2025
100
191.99
—
2,514,080
Total
986,991
$
168.90
985,920
______________________
(1)Amounts exclude the commissions and excise tax.
(2)We currently maintain two share repurchase programs approved by our board of directors in October 2025. Refer to Note 15, “Share Repurchase Programs,” in the Notes to Consolidated Financial Statements for a discussion on our share repurchase programs. Share repurchases can be made from time to time using our working capital and a variety of methods, including open-market transactions and trading plans established pursuant to Rule 10b5-1 of the Securities Exchange Act of 1934. The timing and actual number of shares repurchased are subject to market conditions, legal requirements and other factors, including balance sheet leverage, availability of quality acquisitions and stock price.
ITEM 6. [RESERVED]
24
ITEM 7. MANAGEMENT'S DISCUSSION AND ANALYSIS OF
FINANCIAL CONDITION AND RESULTS OF OPERATIONS
ITEM 7. MANAGEMENT'S DISCUSSION AND ANALYSIS OF FINANCIAL CONDITION AND RESULTS OF OPERATIONS
The following Management’s Discussion and Analysis of Financial Condition and Results of Operations (MD&A) should be read in conjunction with our consolidated financial statements and related notes contained in Part II, Item 8 of this Annual Report on Form 10-K. The following MD&A describes the principal factors affecting our results of operations, financial resources, liquidity, contractual cash obligations and critical accounting estimates during 2025, compared with 2024. A detailed discussion of the year 2024 compared with 2023 is not included herein and can be found in the MD&A section in our 2024 Annual Report on Form 10-K, filed with the SEC on February 12, 2025, which is incorporated herein by reference.
Our results of operations and financial condition are influenced by a number of factors including: macroeconomic and other market conditions, including pricing and demand; used vehicle sales; customer contracting activity and retention; maintenance costs; residual value estimate changes; currency exchange rate fluctuations; customer preferences; inflation; fuel and energy prices; insurance costs; interest rates; labor costs; unemployment levels; tax rates; changes in accounting or regulatory requirements; and cybersecurity attacks. This MD&A includes certain forward-looking statements that are based on our current plans and expectations and are subject to risks, uncertainties and assumptions. We caution readers that certain important factors could cause actual results and events to differ significantly from those expressed. This MD&A should be read in conjunction with our discussion of cautionary statements and significant risks to the business under Part I, Item 1A. "Risk Factors” and "Special Note Regarding Forward-Looking Statements" sections included in this Annual Report.
Certain prior period amounts have been reclassified to conform with the current period presentation.
This MD&A includes certain non-GAAP financial measures. Please refer to the “Non-GAAP Financial Measures” section of this MD&A for information on these non-GAAP measures, including reconciliations to the most comparable GAAP financial measure and the reasons why we believe each measure is useful to investors.
OVERVIEW
General
Ryder is a leading logistics and transportation company. We report our financial performance based on three business segments: (1) Fleet Management Solutions (FMS), which provides full service leasing, commercial rental and vehicle maintenance services; (2) Supply Chain Solutions (SCS), which provides fully integrated logistics solutions; and (3) Dedicated Transportation Solutions (DTS), which provides turnkey transportation solutions, including dedicated vehicles, professional drivers, management and administrative support. Dedicated transportation services provided as part of an operationally integrated, multi-service supply chain solution to SCS customers are primarily reported in the SCS business segment.
Further information on our business and business segments are presented in Part I, Item 1, "Business", and in Note 3, "Segment Reporting" of the Notes to Consolidated Financial Statements included in Part II, Item 8, "Financial Statements and Supplementary Data" in this Annual Report.
2025 HIGHLIGHTS
•Diluted EPS from continuing operations of $11.99, up 8% from prior year
•Comparable EPS (a non-GAAP measure) from continuing operations of $12.92, up 8% from prior year, reflecting higher contractual earnings across all business segments, as well as share repurchases, partially offset by lower used vehicle sales and rental results
•Adjusted Return on Equity (ROE) (a non-GAAP measure) of 17%, compared to 16% in prior year
•Total revenue of $12.7 billion, consistent with prior year
•Operating revenue (a non-GAAP measure) of $10.4 billion, up 1%, primarily reflecting contractual revenue growth in SCS and FMS
•Net cash provided by operating activities from continuing operations of $2.6 billion and free cash flow (a non-GAAP measure) of $946 million
25
ITEM 7. MANAGEMENT'S DISCUSSION AND ANALYSIS OF
FINANCIAL CONDITION AND RESULTS OF OPERATIONS
Business Trends
During 2025, the strength and resiliency of our transformed business model as well as consistent execution of strategic initiatives delivered earnings growth and helped mitigate the impact of weak market conditions on used vehicle sales and commercial rental demand. The continued execution of our strategic initiatives focused on lease pricing, maintenance cost savings, acquisitions synergies and optimization of our Omnichannel network drove contractual earnings growth in all business segments.
We continue to benefit from favorable long-term secular trends in logistics and transportation solutions; however, we are experiencing near-term revenue growth headwinds that reflect the extended freight downturn and overall economic uncertainty. These favorable secular trends and the value our solutions bring to our customers remain strong and provide long-term revenue and earnings growth opportunities for all of our business segments. Our balanced growth strategy provides a solid foundation for ongoing contractual earnings growth while also positioning us to benefit from a cycle upturn. In 2026, we are well positioned for growth in SCS as we achieved record sales in 2025. In FMS and DTS, we expect contractual sales trends to improve as freight markets normalize.
While we are experiencing positive momentum in our businesses, other unknown effects from inflationary cost pressures, regulatory uncertainty, labor interruptions, introduction of tariffs and taxes, and the continued higher interest rate environment may negatively impact demand for our business, financial results, and significant judgments and estimates.
26
ITEM 7. MANAGEMENT'S DISCUSSION AND ANALYSIS OF
FINANCIAL CONDITION AND RESULTS OF OPERATIONS
RESULTS SUMMARY
Change
(Dollars in millions, except per share amounts)
2025
2024
2023
2025/2024
2024/2023
Total revenue
$
12,665
$
12,636
$
11,783
—%
7%
Operating revenue (1)
10,406
10,266
9,497
1%
8%
Earnings from continuing operations before income taxes (EBT)
$
685
$
661
$
618
4%
7%
Comparable EBT (1)
730
715
815
2%
(12)%
Earnings from continuing operations
501
489
406
2%
21%
Comparable earnings from continuing operations (1)
540
531
602
2%
(12)%
Comparable EBITDA (1)
2,867
2,776
2,665
3%
4%
Earnings per common share (EPS) — Diluted
Continuing operations
$
11.99
$
11.06
$
8.73
8%
27%
Comparable (1)
12.92
12.00
12.95
8%
(7)%
Cash dividend per share
3.44
3.04
2.66
13%
14%
Book value per share (2)
77.43
74.07
69.91
5%
6%
Total debt
$
7,645
$
7,779
$
7,114
(2)%
9%
Total shareholders’ equity
3,052
3,117
3,069
(2)%
2%
Debt to equity
250
%
250
%
232
%
Adjusted return on equity (1)
17
%
16
%
19
%
Net cash provided by operating activities from continuing operations
2,594
2,265
2,353
Free cash flow (1)
946
133
(54)
Total capital expenditures (3)
2,055
2,694
3,279
____________________
(1)Non-GAAP financial measure. Refer to the “Non-GAAP Financial Measures” section of this MD&A for reconciliations of the most comparable GAAP measure to the non-GAAP financial measure and the reasons why management believes this measure is important to investors.
(2)Book value per share is calculated using Total shareholders’ equity divided by common shares outstanding.
(3)Includes capital expenditures that have been accrued, but not yet paid.
In 2025, total revenue was $12.7 billion, consistent with prior year. Operating revenue (a non-GAAP measure excluding fuel and subcontracted transportation) increased 1% to $10.4 billion, primarily reflecting contractual revenue growth in SCS and FMS.
EBT increased to $685 million and comparable EBT (a non-GAAP measure) increased to $730 million, primarily due to higher contractual earnings, partially offset by lower used vehicle sales and rental results reflecting weaker market conditions.
FULL YEAR CONSOLIDATED RESULTS
Services
Change
(Dollars in millions)
2025
2024
2023
2025/2024
2024/2023
Services revenue
$
8,378
$
8,345
$
7,297
—%
14%
Cost of services
7,129
7,099
6,266
—%
13%
Gross margin
$
1,249
$
1,246
$
1,031
—%
21%
Gross margin %
15%
15%
14%
Services revenue represents all the revenues associated with our SCS and DTS business segments, including subcontracted transportation and fuel, as well as SelectCare and fleet support services associated with our FMS business segment. Services revenue in 2025, remained consistent with prior year as new business and higher customer volumes in SCS was largely offset by lost business in DTS.
Cost of services represents the direct costs related to services revenue and is primarily comprised of salaries and employee-related costs, subcontracted transportation (purchased transportation from third parties), fuel, lease expense, insurance and maintenance costs. Cost of services in 2025 remained consistent with the prior year.
27
ITEM 7. MANAGEMENT'S DISCUSSION AND ANALYSIS OF
FINANCIAL CONDITION AND RESULTS OF OPERATIONS
Services gross margin and gross margin as a percentage remained consistent in 2025.
Lease & Related Maintenance and Rental
Change
(Dollars in millions)
2025
2024
2023
2025/2024
2024/2023
Lease & related maintenance and rental revenue
$
3,881
$
3,835
$
3,937
1%
(3)%
Cost of lease & related maintenance and rental
2,589
2,623
2,684
(1)%
(2)%
Gross margin
$
1,292
$
1,212
$
1,253
7%
(3)%
Gross margin %
33%
32%
32%
Lease & related maintenance and rental revenue represent revenue from our ChoiceLease and commercial rental product offerings within our FMS business segment. Revenue increased 1% in 2025, reflecting ChoiceLease revenue growth, partially offset by lower rental demand.
Cost of lease & related maintenance and rental represents the direct costs related to Lease & related maintenance and rental revenue and are comprised of depreciation of revenue earning equipment, maintenance costs (primarily repair parts and labor), and other costs such as licenses, insurance and operating taxes. Cost of lease & related maintenance and rental excludes interest costs from vehicle financing, which are reported within "Interest expense" in our Consolidated Statements of Earnings. Cost of lease & related maintenance and rental decreased 1% in 2025, primarily reflecting lower maintenance costs and a smaller lease and rental fleet.
Lease & related maintenance and rental gross margin and gross margin as a percentage of revenue increased primarily due to higher ChoiceLease pricing and maintenance cost-savings initiatives.
Fuel Services
Change
(Dollars in millions)
2025
2024
2023
2025/2024
2024/2023
Fuel services revenue
$
406
$
456
$
549
(11)%
(17)%
Cost of fuel services
391
441
534
(11)%
(17)%
Gross margin
$
15
$
15
$
15
—%
—%
Gross margin %
4
%
3
%
3
%
Fuel services revenue represents fuel services provided to our FMS customers. Fuel services revenue decreased 11% in 2025, primarily reflecting lower fuel costs passed through to customers and fewer gallons sold.
Cost of fuel services includes the direct costs associated with providing our customers with fuel. These costs include fuel, salaries and employee-related costs of fuel island attendants and depreciation of our fueling facilities and equipment. Cost of fuel services decreased 11% in 2025, reflecting lower fuel costs and fewer gallons sold.
Fuel services gross margin remained consistent and gross margin as a percentage of revenue increased in 2025. Fuel is largely a pass-through to customers for which we realize minimal changes in margin during periods of steady market fuel prices. However, fuel services margin is impacted by sudden increases or decreases in market fuel prices during a short period of time, as customer pricing for fuel is established based on current market fuel costs. Fuel services gross margin as a percentage of revenue was positively impacted by these price change dynamics in 2025.
Selling, General and Administrative Expenses
Change
(Dollars in millions)
2025
2024
2023
2025/2024
2024/2023
Selling, general and administrative expenses (SG&A)
$
1,470
$
1,478
$
1,421
(1)%
4%
Percentage of total revenue
12
%
12
%
12
%
SG&A expenses decreased 1% primarily reflecting lower travel expenses and acquisition synergies, partially offset by higher medical costs. SG&A expenses as a percentage of total revenue remained at 12% in 2025.
28
ITEM 7. MANAGEMENT'S DISCUSSION AND ANALYSIS OF
FINANCIAL CONDITION AND RESULTS OF OPERATIONS
Non-Operating Pension Costs, net
Change
(Dollars in millions)
2025
2024
2023
2025/2024
2024/2023
Non-operating pension costs, net
$
36
$
41
$
40
NM
NM
Non-operating pension costs, net include the amortization of net actuarial loss and prior service cost, interest cost and expected return on plan assets components of pension and postretirement benefit costs, as well as any significant charges for settlements or curtailments if recognized. Refer to Note 19, "Employee Benefit Plans" for further discussion.
Used Vehicle Sales, net
Change
(Dollars in millions)
2025
2024
2023
2025/2024
2024/2023
Used vehicle sales, net
$
(22)
$
(72)
$
(196)
(69)%
(63)%
Used vehicle sales, net includes gains or losses from sales of used vehicles, selling costs associated with used vehicles and write-downs of vehicles held for sale to fair market value (referred to as "valuation adjustments"). Used vehicle sales, net decreased in 2025, due to lower pricing and volume, reflecting weaker market conditions, and lower retail sales mix.
Average proceeds per unit decreased in 2025 from the prior year. The following table presents the average used vehicle proceeds per unit changes, using constant currency, compared with the prior year:
Proceeds per unit change (1)
2025/2024
2024/2023
Tractors
(11)%
(21)%
Trucks
(15)%
(23)%
————————————
(1) Represents percentage change compared to prior year period in average sales proceeds on used vehicle sales using constant currency.
Interest Expense
Change
(Dollars in millions)
2025
2024
2023
2025/2024
2024/2023
Interest expense
$
404
$
386
$
296
5%
30%
Effective interest rate
5.2%
5.1%
4.4%
Interest expense increased 5% in 2025, reflecting higher average debt and higher interest rates on newer issuances compared to maturing debt.
Miscellaneous Income, net
Change
(Dollars in millions)
2025
2024
2023
2025/2024
2024/2023
Miscellaneous income, net
$
(26)
$
(34)
$
(47)
(24)%
(28)%
Miscellaneous income, net consists of investment income on securities used to fund certain benefit plans, interest income, gains on sales of operating property, foreign currency transaction remeasurement and other non-operating items. Miscellaneous income, net decreased in 2025, primarily due to prior year gain on the sale of assets and insurance recoveries.
Currency Translation Adjustment Loss
Change
(Dollars in millions)
2025
2024
2023
2025/2024
2024/2023
Currency translation adjustment loss
$
—
$
—
$
188
NM
NM
————————————
NM - Denotes Not Meaningful throughout the MD&A
29
ITEM 7. MANAGEMENT'S DISCUSSION AND ANALYSIS OF
FINANCIAL CONDITION AND RESULTS OF OPERATIONS
Restructuring and Other Items, net
Change
(Dollars in millions)
2025
2024
2023
2025/2024
2024/2023
Restructuring and other items, net
$
9
$
13
$
(21)
NM
NM
Refer to Note 20, “Other Items Impacting Comparability” in the Notes to Consolidated Financial Statements for a discussion of restructuring charges and other items.
Provision for Income Taxes
Change
(Dollars in millions)
2025
2024
2023
2025/2024
2024/2023
Provision for income taxes
$
184
$
172
$
212
7%
(19)%
Effective tax rate on continuing operations
26.8
%
26.0
%
34.3
%
Comparable tax rate on continuing operations (1)
26.0
%
25.7
%
26.1
%
_______________
(1) Non-GAAP financial measure. Refer to the “Non-GAAP Financial Measures” section of this MD&A for reconciliations of the most comparable GAAP measure to the non-GAAP financial measure and the reasons why management believes this measure is important to investors.
Our effective tax rate from continuing operations was 26.8% in 2025 as compared to 26.0% in the prior year, and our comparable tax rate on continuing operations was 26.0% in 2025 compared to 25.7% in the prior year. The increases in tax rates were primarily due to discrete tax benefits in 2024. Refer to Note 11, “Income Taxes” in the Notes to Consolidated Financial Statements for a discussion of changes in our provision for income taxes and effective tax rate from continuing operations.
30
ITEM 7. MANAGEMENT'S DISCUSSION AND ANALYSIS OF
FINANCIAL CONDITION AND RESULTS OF OPERATIONS
FULL YEAR OPERATING RESULTS BY BUSINESS SEGMENT
Change
(Dollars in millions)
2025
2024
2023
2025/2024
2024/2023
Revenue:
Fleet Management Solutions
$
5,845
$
5,888
$
5,930
(1)%
(1)%
Supply Chain Solutions
5,459
5,300
4,875
3%
9%
Dedicated Transportation Solutions
2,343
2,446
1,785
(4)%
37%
Eliminations
(982)
(998)
(807)
(2)%
24%
Total
$
12,665
$
12,636
$
11,783
—%
7%
Operating Revenue: (1)
Fleet Management Solutions
$
5,127
$
5,116
$
5,053
—%
1%
Supply Chain Solutions
4,091
3,965
3,625
3%
9%
Dedicated Transportation Solutions
1,841
1,870
1,298
(2)%
44%
Eliminations
(653)
(685)
(479)
(5)%
43%
Total
$
10,406
$
10,266
$
9,497
1%
8%
Earnings from continuing operations before income taxes:
Fleet Management Solutions
$
501
$
516
$
665
(3)%
(22)%
Supply Chain Solutions
355
332
231
7%
44%
Dedicated Transportation Solutions
140
125
121
12%
3%
Eliminations
(131)
(134)
(95)
(3)%
(41)%
865
839
922
3%
(9)%
Unallocated Central Support Services
(83)
(71)
(72)
(16)%
—%
Intangible amortization expense (2)
(52)
(53)
(35)
(2)%
52%
Non-operating pension costs, net (3)
(36)
(41)
(40)
NM
NM
Other items impacting comparability, net (4)
(9)
(13)
(157)
NM
NM
Earnings from continuing operations before income taxes
$
685
$
661
$
618
4%
7%
______________________
(1)Non-GAAP financial measure. Refer to the “Non-GAAP Financial Measures” section of this MD&A for reconciliations of the most comparable GAAP measure to the non-GAAP financial measure and the reasons why management believes this measure is important to investors.
(2)Refer to Note 9, "Intangible Assets, Net," for a discussion on this item.
(3)Refer to Note 19, "Employee Benefit Plans," for a discussion on this item.
(4)Refer to Note 20, "Other Items Impacting Comparability," and below for a discussion of items excluded from our primary measure of segment performance.
As part of management’s evaluation of segment operating performance, we define the primary measurement of our segment financial performance as segment "Earnings from continuing operations before income taxes" (Segment EBT), which includes an allocation of costs from Central Support Services (CSS) and excludes Non-operating pension costs, net, Intangible amortization expense, and certain other significant items that are not representative of our business operations and vary from period to period as discussed in Note 20, “Other Items Impacting Comparability,” in the Notes to Consolidated Financial Statements. CSS represents those costs incurred to support all business segments, including information technology, finance, marketing, human resources, legal, and safety.
The objective of the Segment EBT measurement is to provide clarity on the profitability of each business segment and, ultimately, to hold leadership of each business segment accountable for their allocated share of CSS costs. Segment results are not necessarily indicative of the results of operations that would have occurred had each segment been an independent, stand-alone entity during the periods presented. Certain costs are not attributable to any segment and remain unallocated in CSS, including costs for investor relations, public affairs and certain executive compensation. Refer to Note 3, “Segment Reporting,” in the Notes to Consolidated Financial Statements for a description of the methodology for allocating the remainder of CSS costs to the business segments.
Our FMS segment leases revenue earning equipment and provides rental vehicles, fuel, maintenance and other ancillary services to the SCS and DTS segments. Inter-segment EBT allocated to SCS and DTS includes earnings related to equipment
31
ITEM 7. MANAGEMENT'S DISCUSSION AND ANALYSIS OF
FINANCIAL CONDITION AND RESULTS OF OPERATIONS
used in providing services to SCS and DTS customers. EBT related to inter-segment equipment and services billed to SCS and DTS customers (Equipment Contribution) are included in both FMS and the segment that served the customer and then eliminated upon consolidation (presented as “Eliminations”).
The following table sets forth the benefit from Equipment Contribution included in Segment EBT for our SCS and DTS business segments:
Change
(Dollars in millions)
2025
2024
2023
2025/2024
2024/2023
Equipment Contribution:
Supply Chain Solutions
$
44
$
45
$
43
(3)%
5%
Dedicated Transportation Solutions
87
89
52
(2)%
70%
Total
$
131
$
134
$
95
(3)%
41%
Fleet Management Solutions
Change
(Dollars in millions)
2025
2024
2023
2025/2024
2024/2023
ChoiceLease
$
3,510
$
3,446
$
3,181
2%
8%
Commercial rental (1)
937
976
1,178
(4)%
(17)%
SelectCare and other
680
694
694
(2)%
—%
Fuel services revenue
718
772
877
(7)%
(12)%
FMS total revenue
$
5,845
$
5,888
$
5,930
(1)%
(1)%
FMS operating revenue (2)
$
5,127
$
5,116
$
5,053
—%
1%
FMS EBT
$
501
$
516
$
665
(3)%
(22)%
FMS EBT as a % of FMS total revenue
8.6%
8.8%
11.2%
(20) bps
(240) bps
FMS EBT as a % of FMS operating revenue (2)
9.8%
10.1%
13.2%
(30) bps
(310) bps
___________________
(1)During 2025, 2024 and 2023, rental revenue from lease customers in place of a lease vehicle represented 29%, 31%, and 34% of commercial rental revenue, respectively.
(2)Non-GAAP financial measure. Refer to the “Non-GAAP Financial Measures” section of this MD&A for reconciliations of the most comparable GAAP measure to the non-GAAP financial measure and the reasons why management believes this measure is important to investors.
FMS total revenue decreased 1% in 2025, due to lower fuel services revenue, reflecting lower fuel costs passed through to customers and fewer gallons sold. FMS operating revenue was relatively consistent in 2025, primarily reflecting higher ChoiceLease revenue largely offset by weaker rental demand.
FMS EBT decreased 3% in 2025, reflecting lower gains on used vehicle sales due to lower pricing and number of vehicles sold and weaker commercial rental demand, partially offset by higher ChoiceLease performance and benefits from maintenance cost savings initiatives. Lower gains on used vehicles sales reflect a 15% and 11% decrease in used truck and tractor pricing, respectively. Rental power fleet utilization remained consistent at 70% compared to prior year. The average commercial rental power active fleet was 7% smaller in 2025 compared to prior year.
32
ITEM 7. MANAGEMENT'S DISCUSSION AND ANALYSIS OF
FINANCIAL CONDITION AND RESULTS OF OPERATIONS
Our fleet of owned and leased revenue earning equipment and SelectCare vehicles, including vehicles under on-demand maintenance, is summarized as follows (rounded to the nearest hundred):
Change
2025
2024
2023
2025/2024
2024/2023
End of period vehicle count
By type:
Trucks (1)
78,200
80,500
75,600
(3)%
6%
Tractors (2)
62,900
66,700
69,000
(6)%
(3)%
Trailers and other (3)
43,800
44,700
40,800
(2)%
10%
Total
184,900
191,900
185,400
(4)%
4%
By ownership:
Owned
181,000
186,200
184,400
(3)
%
1
%
Leased
3,900
5,700
1,000
(32)
%
470
%
Total
184,900
191,900
185,400
(4)
%
4
%
By product line:
ChoiceLease
141,700
145,300
138,900
(2)%
5%
Commercial rental
31,600
35,500
36,400
(11)%
(2)%
Service vehicles and other
2,100
2,100
2,100
—%
—%
175,400
182,900
177,400
(4)%
3%
Held for sale
9,500
9,000
8,000
6%
13%
Total
184,900
191,900
185,400
(4)%
4%
Customer vehicles under SelectCare contracts (4)
44,100
41,800
51,600
6%
(19)%
Average vehicle count
By product line:
ChoiceLease
143,000
145,000
137,800
(1)%
5%
Commercial rental
33,700
35,300
39,300
(5)%
(10)%
Service vehicles and other
2,100
2,100
2,000
—%
5%
178,800
182,400
179,100
(2)%
2%
Held for sale
9,400
9,200
6,500
2%
42%
Total
188,200
191,600
185,600
(2)%
3%
Customer vehicles under SelectCare contracts (4)
43,200
48,900
52,700
(12)%
(7)%
Customer vehicles under SelectCare on-demand (5)
5,700
6,900
10,600
(17)%
(35)%
Total vehicles serviced
237,100
247,400
248,900
(4)%
(1)%
_______________
(1)Generally comprised of Class 1 through Class 7 type vehicles with a Gross Vehicle Weight (GVW) up to 33,000 pounds.
(2)Generally comprised of over the road on highway tractors and are primarily comprised of Class 8 type vehicles with a GVW over 33,000 pounds.
(3)Generally comprised of dry, flatbed and refrigerated type trailers.
(4)Excludes customer vehicles under SelectCare on-demand contracts.
(5)Comprised of the number of unique vehicles serviced under on-demand maintenance agreements. This does not represent averages for the periods. Vehicles included in the count may have been serviced more than one time during the respective period.
Note: Average vehicle counts were computed using a 24-point average based on monthly information.
33
ITEM 7. MANAGEMENT'S DISCUSSION AND ANALYSIS OF
FINANCIAL CONDITION AND RESULTS OF OPERATIONS
The following table provides information on our active ChoiceLease fleet (number of units rounded to nearest hundred) and our commercial rental power fleet (excludes trailers):
Change
2025
2024
2023
2025/2024
2024/2023
Active ChoiceLease fleet
End of period vehicle count (1)
132,000
135,000
129,800
(2)%
4%
Full year average vehicle count (1)
133,900
135,900
129,800
(1)%
5%
Commercial rental statistics
Commercial rental utilization - power fleet (2)
70
%
70
%
75
%
— bps
(500) bps
__________________
(1)Active ChoiceLease vehicles are calculated as those units currently earning revenue and not classified as not yet earning or no longer earning units.
(2)Rental utilization is calculated using the number of days units are rented divided by the number of days units are available to rent based on the days in the calendar year.
Supply Chain Solutions
Change
(Dollars in millions)
2025
2024
2023
2025/2024
2024/2023
Omnichannel retail
$
1,299
$
1,197
$
1,207
9%
(1)%
Automotive
1,061
1,080
1,061
(2)%
2%
Consumer packaged goods
1,187
1,149
926
3%
24%
Industrial and other
544
539
431
1%
25%
Subcontracted transportation and fuel
1,368
1,335
1,250
3%
7%
SCS total revenue
$
5,459
$
5,300
$
4,875
3%
9%
SCS operating revenue (1)
$
4,091
$
3,965
$
3,625
3%
9%
SCS EBT
$
355
$
332
$
231
7%
44%
SCS EBT as a % of SCS total revenue
6.5%
6.3%
4.7%
20 bps
160 bps
SCS EBT as a % of SCS operating revenue (1)
8.7%
8.4%
6.4%
30 bps
200 bps
End of period vehicle count:
Power vehicles
3,800
3,900
4,200
(3)%
(7)%
Trailers
9,300
9,100
9,600
2%
(5)%
Total
13,100
13,000
13,800
1%
(6)%
_____________________
(1)Non-GAAP financial measure. Refer to the “Non-GAAP Financial Measures” section of this MD&A for reconciliations of the most comparable GAAP measure to the non-GAAP financial measure and the reasons why management believes this measure is important to investors.
SCS total revenue increased 3% primarily as a result of higher operating revenue (a non-GAAP measure excluding fuel and subcontracted transportation), which increased 3% driven by new business and higher customer volumes.
SCS EBT increased 7% in 2025, primarily reflecting operating revenue growth and improved performance from optimization of our omnichannel retail network partially offset by lost business and extended customer plant shutdowns in automotive during the fourth quarter.
34
ITEM 7. MANAGEMENT'S DISCUSSION AND ANALYSIS OF
FINANCIAL CONDITION AND RESULTS OF OPERATIONS
Dedicated Transportation Solutions
Change
(Dollars in millions)
2025
2024
2023
2025/2024
2024/2023
DTS total revenue
$
2,343
$
2,446
$
1,785
(4)%
37%
DTS operating revenue (1)
$
1,841
$
1,870
$
1,298
(2)%
44%
DTS EBT
$
140
$
125
$
121
12%
4%
DTS EBT as a % of DTS total revenue
6.0%
5.1%
6.8%
90 bps
(170) bps
DTS EBT as a % of DTS operating revenue (1)
7.6%
6.7%
9.3%
90 bps
(260) bps
End of period vehicle count:
Power vehicles
6,900
7,500
5,200
(8)%
44%
Trailers
11,100
11,600
5,700
(4)%
104%
Total
18,000
19,100
10,900
(6)%
75%
_______________
(1)Non-GAAP financial measure. Refer to the “Non-GAAP Financial Measures” section of this MD&A for reconciliations of the most comparable GAAP measure to the non-GAAP financial measure and the reasons why management believes this measure is important to investors.
DTS total revenue decreased in 2025, due to lower subcontracted transportation and fuel costs passed through to customers and lower operating revenue (a non-GAAP measure excluding fuel and subcontracted transportation revenues). DTS operating revenue decreased 2% in 2025, primarily due to lower fleet count reflecting the prolonged freight market downturn.
DTS EBT increased 12% in 2025, reflecting acquisition synergies and prior year integration costs, partially offset by lower operating revenue.
Central Support Services
Change
(Dollars in millions)
2025
2024
2023
2025/2024
2024/2023
Total CSS
$
438
$
417
$
419
5%
—%
Allocation of CSS to business segments
(355)
(346)
(347)
3%
—%
Unallocated CSS
$
83
$
71
$
72
16%
—%
Total CSS costs increased 5% in 2025, primarily due to higher incentive compensation and marketing costs. Unallocated CSS increased 16% in 2025, primarily due to incentive compensation, higher information technology costs and the prior year gain on the sale of assets.
35
ITEM 7. MANAGEMENT'S DISCUSSION AND ANALYSIS OF
FINANCIAL CONDITION AND RESULTS OF OPERATIONS
FINANCIAL RESOURCES AND LIQUIDITY
Cash Flows
The following is a summary of our cash flows from continuing operations:
(In millions)
2025
2024
2023
Net cash provided by (used in) :
Operating activities
$
2,594
$
2,265
$
2,353
Investing activities
(1,650)
(2,446)
(2,663)
Financing activities
(912)
153
256
Effect of exchange rate changes on cash
13
(21)
(9)
Net change in cash, cash equivalents, and restricted cash
$
45
$
(49)
$
(63)
(In millions)
2025
2024
2023
Net cash provided by operating activities from continuing operations
Earnings from continuing operations
$
501
$
489
$
406
Non-cash and other, net
2,423
2,260
2,088
Currency translation adjustment loss
—
—
188
Collections on sales-type leases
166
148
126
Changes in operating assets and liabilities
(496)
(632)
(455)
Net cash provided by operating activities from continuing operations
$
2,594
$
2,265
$
2,353
Net cash provided by operating activities from continuing operations was $2.6 billion in 2025, compared with $2.3 billion in 2024, primarily reflecting lower income tax payments and working capital needs. Net cash used in investing activities from continuing operations decreased to $1.7 billion in 2025 compared with $2.4 billion in 2024, primarily reflecting lower capital expenditures and the prior year acquisition of Cardinal Logistics. Net cash used in financing activities from continuing operations was $912 million in 2025, compared to net cash provided by financing activities from continuing operations of $153 million in 2024, primarily reflecting lower borrowing needs.
The following table shows the components of our free cash flow (a non-GAAP measure):
(In millions)
2025
2024
2023
Net cash provided by operating activities from continuing operations
$
2,594
$
2,265
$
2,353
Sales of revenue earning equipment (1)
468
532
764
Sales of operating property and equipment (1)
18
19
63
Other (1)
1
—
—
Total cash generated (2)
3,081
2,816
3,180
Purchases of property and revenue earning equipment (1)
(2,135)
(2,683)
(3,234)
Free cash flow (2)
$
946
$
133
$
(54)
_______________
(1)Included in cash flows from investing activities.
(2)Non-GAAP financial measures. Reconciliations of net cash provided by operating activities to total cash generated and to free cash flow are set forth in this table. Refer to the “Non-GAAP Financial Measures” section of this MD&A for the reasons why management believes these measures are important to investors.
Free cash flow (a non-GAAP measure) increased to $946 million in 2025 from $133 million in 2024, primarily reflecting reduced capital expenditures and higher cash from operating activities.
Net cash provided by operating activities from continuing operations is expected to increase to approximately $2.7 billion in 2026. We expect free cash flow (a non-GAAP measure) to decrease to approximately $800 million reflecting higher investments in the ChoiceLease fleet, partially offset by higher cash generated.
36
ITEM 7. MANAGEMENT'S DISCUSSION AND ANALYSIS OF
FINANCIAL CONDITION AND RESULTS OF OPERATIONS
Purchase Obligations
The majority of our purchase obligations are pay-as-you-go transactions made in the ordinary course of business. Purchase obligations include agreements to purchase goods or services that are legally binding and that specify all significant terms, including: fixed or minimum quantities to be purchased; fixed minimum or variable price provisions; and the approximate timing of the transaction. Any amounts for which we are liable under purchase orders for goods and services received are reflected in the Consolidated Balance Sheets as “Accounts payable” and “Accrued expenses and other current liabilities.” In addition, we reflect obligations with settlements that are greater than twelve months from the balance sheet date, as "Other non-current liabilities," including operating lease liabilities. The most significant purchase obligations relate to the purchase of revenue earning equipment.
Capital expenditures generally represent the purchase of revenue earning equipment (trucks, tractors and trailers) within our FMS segment. These expenditures primarily support the ChoiceLease and commercial rental product lines. The level of capital required to support the ChoiceLease product line varies based on customer contract signings for replacement vehicles and growth. These contracts are long-term agreements that result in predictable cash flows typically over three to seven years for trucks and tractors and ten years for trailers. We utilize capital for the purchase of vehicles in our commercial rental product line to replenish and expand the fleet available for shorter-term use by contractual or occasional customers. Operating property and equipment expenditures primarily relate to spending on items such as vehicle maintenance facilities and equipment, computer and telecommunications equipment, investments in technologies, and warehouse facilities and equipment.
The following is a summary of capital expenditures:
(In millions)
2025
2024
2023
Revenue earning equipment:
ChoiceLease
$
1,508
$
2,042
$
2,562
Commercial rental
311
525
438
1,819
2,567
3,000
Operating property and equipment
236
127
279
Gross capital expenditures (1)
2,055
2,694
3,279
Changes in accounts payable related to purchases of property and revenue earning equipment
80
(11)
(45)
Cash paid for purchases of property and revenue earning equipment
$
2,135
$
2,683
$
3,234
_______________
(1)Excludes $78 million, $46 million and $26 million in 2025, 2024 and 2023, respectively, in assets held under finance leases resulting from new or the extension of existing finance leases and other additions.
Gross capital expenditures decreased to $2.1 billion in 2025, reflecting reduced investments in the ChoiceLease and rental vehicles. We expect gross capital expenditures to increase to approximately $2.4 billion in 2026, reflecting higher investments in the lease fleet.
Other Obligations and Commitments
The following table provides other material cash requirements from contractual obligations and commitments and the related reference in the Notes to Consolidated Financial Statements for further information:
Description
Reference
Reference Title
Insurance obligations (primarily self-insurance)
Note 10
Accrued Expenses and Other Liabilities
Operating leases
Note 12
Leases
Debt
Note 13
Debt
Employee benefit plans
Note 19
Employee Benefit Plans
We believe that our operating cash flows and access to the debt markets, as further discussed in "Financing and Other Funding Transactions" below, are sufficient to meet our contractual obligations.
37
ITEM 7. MANAGEMENT'S DISCUSSION AND ANALYSIS OF
FINANCIAL CONDITION AND RESULTS OF OPERATIONS
Off-Balance Sheet Arrangements
Guarantees. Refer to Note 14, “Guarantees,” in the Notes to Consolidated Financial Statements for a discussion of our agreements involving guarantees.
Financing and Other Funding Transactions
We utilize external capital primarily to support working capital needs and growth in our asset-based product lines. The variety of financing alternatives typically available to fund our capital needs include commercial paper, long-term and medium-term public and private debt, asset-backed securities, bank term loans, leasing arrangements, and bank credit facilities. Our principal sources of financing are issuances of unsecured commercial paper and medium-term notes.
As of December 31, 2025, cash and equivalents totaled $198 million and approximately $139 million was held outside the U.S. and is available to fund operations and other growth of non-U.S. subsidiaries.
In 2025, we repatriated $40 million of current year earnings from our Canada subsidiaries with minimal tax cost. In 2024, we repatriated $14 million of current year earnings from our Mexico subsidiary with minimal tax cost. As of December 31, 2025, we continue to consider our U.K. earnings to no longer be indefinitely reinvested and determined that there was no impact to deferred taxes. We consider the undistributed earnings of our Mexico subsidiary generated through 2023 to be indefinitely reinvested. As of 2024, we no longer assert that the current year earnings of our Mexico subsidiary are indefinitely reinvested. We consider the undistributed earnings of our Canada subsidiary generated through 2024 to be indefinitely reinvested. During 2025, we no longer assert that current year earnings of our Canada subsidiary are indefinitely reinvested. The estimated taxes associated with the repatriation of these earnings are not material. Our remaining foreign jurisdictions are indefinitely reinvested.
We believe that our operating cash flows, together with our access to the public unsecured bond market, commercial paper market and other available debt financing, will be adequate to meet our operating, investing and financing needs in the foreseeable future. However, volatility or disruption in the public unsecured debt market or the commercial paper market may impair our ability to access these markets on terms commercially acceptable to us. If we cease to have access to public bonds, commercial paper and other sources of unsecured borrowings, we would meet our liquidity needs by drawing upon contractually committed lending agreements or by seeking other funding sources.
In February 2025, we issued an unsecured medium-term note with aggregate principal amount of $300 million, bearing annual interest of 5.00%, and maturing on March 15, 2030. In May 2025, we issued an unsecured medium-term note with aggregate principal amount of $300 million, bearing annual interest of 4.85%, and maturing on June 15, 2030. In November 2025, we issued an unsecured medium-term note with aggregate principal amount of $300 million, bearing annual interest of 4.30%, and maturing on December 1, 2030.
In April 2025, we amended and restated our corporate revolving credit facility, which supports U.S. and Canadian commercial paper programs, with a syndicate of eleven incumbent lending institutions. The facility's committed borrowing capacity was increased to $1.6 billion and it now expires in April 2030. The credit facility is primarily used for general corporate purposes and can also be used to issue up to $150 million in letters of credit. As of December 31, 2025, there were no letters of credit outstanding against the facility.
In April 2025, we extended the trade receivables financing facility until April 2026. In September 2025, we amended this credit facility to permit an increase in borrowing capacity of up to $200 million for a maximum borrowing of $500 million, subject to lender approval. As of December 31, 2025, this credit facility's borrowing capacity was $300 million.
Refer to Note 13, “Debt,” in the Notes to Consolidated Financial Statements for information around the revolving credit facility, the trade receivables financing program, issuance of medium-term notes under our shelf registration statement, asset-backed financing obligations and debt maturities.
Our ability to access unsecured debt in the capital markets is impacted by both our short-term and long-term debt ratings. These ratings are intended to provide guidance to investors in determining the credit risk associated with our particular securities based on current information obtained by the rating agencies from us or from other sources. Ratings are not recommendations to buy, sell or hold our debt securities and may be subject to revision or withdrawal at any time by the assigning rating agency. Lower ratings generally result in higher borrowing costs, as well as reduced access to unsecured capital markets. A significant downgrade below investment grade of our short-term debt ratings would impair our ability to issue commercial paper and likely require us to rely on alternative funding sources. A significant downgrade below investment grade would not affect our ability to borrow amounts under our revolving credit facility described below, assuming ongoing compliance with the terms and conditions of the credit facility.
38
ITEM 7. MANAGEMENT'S DISCUSSION AND ANALYSIS OF
FINANCIAL CONDITION AND RESULTS OF OPERATIONS
Our debt ratings and rating outlooks as of December 31, 2025 were as follows:
Rating Summary
Short-term
Long-term
Long-term Outlook
Standard & Poor’s Ratings Services
A2
BBB+
Stable
Moody’s Investors Service
P2
Baa2
Positive
Fitch Ratings
F2
BBB+
Stable
As of December 31, 2025, we had the following amounts available to fund operations under the following facilities:
(In millions)
Revolving credit facility
$
735
Trade receivables financing program
201
Total
$
936
In accordance with our funding philosophy, we generally attempt to align the aggregate average remaining re-pricing life of our debt with the aggregate average remaining re-pricing life of our vehicle assets. We utilize both fixed-rate and variable-rate debt to achieve this alignment and generally target a mix of 20% - 40% variable-rate debt as a percentage of total debt outstanding. The variable-rate portion of our total debt (including notional value of swap agreements) was 18% as of December 31, 2025 and 2024.
Our debt to equity ratios were 250% as of December 31, 2025 and 2024. The debt to equity ratio represents total debt divided by total equity.
Pension Information
Refer to Note 19, “Employee Benefit Plans,” in the Notes to Consolidated Financial Statements for background and further information regarding our company-sponsored defined benefit retirement plans.
During 2025, total pension contributions were $66 million, which primarily related to a prefunding of future required pension contributions, compared with $56 million in 2024. We estimate total 2026 required contributions to our pension plans to be approximately $10 million. The present value of estimated global pension contributions that will be required over the next 5 years totals approximately $24 million (pre-tax). Changes in interest rates and the market value of the assets held by the plans could materially change, positively or negatively, the funded status of the plans and affect the level of pension expense and required contributions in future years. The ultimate amount of contributions is also dependent upon the requirements of applicable laws and regulations.
Due to the underfunded status of our defined benefit plans, we had an accumulated net pension equity charge (after-tax) of $575 million and $597 million as of December 31, 2025 and 2024, respectively. The funded status of our defined benefit pension plans increased to 94% in 2025 from 91% in 2024, primarily due to contributions made during 2025.
We expect 2026 defined benefit pension expense to decrease to $35 million. See the “Critical Accounting Estimates — Pension Assumptions” section for further discussion on pension accounting estimates.
Income Tax Cash Obligations
During 2025, total income taxes paid were $52 million. In the future, our income tax cash obligations may increase. Taxable income and cash taxes payable may be impacted by a variety of factors, including (i) the amount of book income generated in each jurisdiction, (ii) total capital expenditures, (iii) the reversal of our deferred tax liability, (iv) remaining net operating losses, (v) the availability of U.S. federal bonus depreciation, and (vi) the impact of any changes in U.S., state and foreign income tax laws. While it is likely that our income tax cash obligations may increase at some point in the future, we cannot reasonably estimate the timing or impact of these factors.
Share Repurchase Programs and Cash Dividends
Refer to Note 15, “Share Repurchase Programs,” in the Notes to Consolidated Financial Statements for a discussion on our share repurchase programs. In 2025, we returned a total of $664 million of capital to our shareholders through share repurchases of $519 million and cash dividends of $145 million.
39
ITEM 7. MANAGEMENT'S DISCUSSION AND ANALYSIS OF
FINANCIAL CONDITION AND RESULTS OF OPERATIONS
Cash dividend payments to shareholders of common stock were $145 million, $135 million, and $128 million in 2025, 2024, and 2023, respectively. In 2025, 2024, and 2023, our annualized dividend was $3.44, $3.04, and $2.66 per share of common stock, respectively. During 2025, we increased our annualized dividend rate 12% to $3.64 per share of common stock.
CRITICAL ACCOUNTING ESTIMATES
The preparation of financial statements in conformity with generally accepted accounting principles in the U.S. (U.S. GAAP) requires us to make estimates and assumptions. Our significant accounting policies are described in the Notes to Consolidated Financial Statements. Certain of these policies require the application of subjective or complex judgments, often as a result of the need to make estimates about the effect of matters that are inherently uncertain. These estimates and assumptions are based on historical experience, changes in the business environment, and other factors that we believe to be reasonable under the circumstances. Different estimates that could have been applied in the current period or changes in the accounting estimates that are reasonably likely can result in a material impact on our financial condition and operating results in the current and future periods. We review the development, selection and disclosure of these critical accounting estimates with Ryder’s Audit Committee on an annual basis.
The following discussion, which should be read in conjunction with the descriptions in the Notes to Consolidated Financial Statements, is furnished for additional insight into certain accounting estimates that we consider to be critical.
Vehicle Residual Values. At the time we acquire a vehicle, we estimate the residual value at the end of its useful life. These estimates determine the depreciation that will be recognized evenly (straight-line) over the vehicle’s useful life and are intended to minimize losses or to record the best estimate of fair value at the end of a vehicle's useful life. At the end of its useful life or termination of the lease, the equipment is either sold to a third party or purchased by the lessee, in which case we may record a gain or loss for the difference between the estimated residual value and the sale price.
We periodically review and adjust, as appropriate, the estimated residual values of existing revenue earning equipment for the purposes of recording depreciation expense as described in Note 6, “Revenue Earning Equipment, Net" in the Notes to Consolidated Financial Statements. Based on the results of our analysis, we may adjust the estimated residual values of certain classes of our revenue earning equipment each year. Reductions in estimated residual values will increase depreciation expense over the remaining useful life of the vehicle. Conversely, an increase in estimated residual values will decrease depreciation expense over the remaining useful life of the vehicle. Our review of the estimated residual values of revenue earning equipment is based on vehicle class (generally subcategories of trucks, tractors and trailers by weight and usage), historical and current market prices, third-party expected future market prices, expected lives of vehicles, and expected sales in the wholesale or retail markets, among other factors. Effective January 1, 2025, we made an immaterial adjustment to certain vehicles' estimated residual values based on this review. In 2024 and 2023, we did not adjust the estimated residual values of existing revenue earning equipment. Effective January 1, 2026, we expect to reduce the estimated residual values for certain tractors based on our review. These updates will not have a material impact to annual depreciation expense.
Depreciation Sensitivity
Based on our fleet of revenue earning equipment as of December 31, 2025, a hypothetical 10% reduction in estimated residual values would increase depreciation expense over the remaining life of our fleet by approximately $340 million. The current residual value estimates of our total fleet are at historically low levels. Our estimates reflect anticipated market conditions and are intended to reduce the probability of losses or need for additional depreciation during a potential cyclical downturn.
While we believe that the carrying values and estimated sales proceeds for revenue earning equipment are reasonable, we cannot guarantee that if economic conditions deteriorate or future sales proceeds are adversely impacted, we will not realize losses on sales or be required to further reduce our residual value estimates. A variety of factors, many of which are outside of our control, could cause residual value estimates to differ from actual used vehicle sales pricing, such as changes in supply and demand of used vehicles; volatility in market conditions; changes in vehicle technology; competitor pricing; regulatory requirements; wholesale market prices; customer requirements and preferences; and changes in underlying assumption factors. As a result, future residual value estimates and resulting depreciation expense are subject to change based upon changes in these factors.
Revenue Recognition. We generate revenue primarily through contracts with customers to lease, rent and maintain revenue earning equipment and to provide logistics management and dedicated transportation services. We enter into contracts that can include various combinations of services, which are generally capable of being distinct and accounted for as separate performance obligations. We account for a contract when it has approval and commitment from both parties, the rights of the parties are identified, payment terms are determined, the contract has commercial substance, and collectibility of consideration
40
ITEM 7. MANAGEMENT'S DISCUSSION AND ANALYSIS OF
FINANCIAL CONDITION AND RESULTS OF OPERATIONS
is probable. We generally recognize revenue over time as we provide the promised services to our customers in an amount we expect to receive in exchange for those products or services.
We offer a full service lease as well as a lease with more flexible maintenance options under our ChoiceLease product line in our FMS business segment, which are marketed, priced and managed as bundled products that include the equipment lease, maintenance and other related services. Our ChoiceLease product line includes the lease of a vehicle (lease component) and maintenance and other services (non-lease component). Contract consideration is allocated between the lease and non-lease components based on management's best estimate of the relative stand-alone selling price of each component. We do not sell the components of our ChoiceLease product offering on a stand-alone basis, therefore significant judgment is required to determine the stand-alone selling prices of the lease and maintenance components in order to allocate the consideration on a relative stand-alone selling price basis.
For the lease component, we estimate the stand-alone selling price using the projected cash outflows related to the underlying leased vehicle, net of the estimated disposal proceeds, and a certain targeted return considering the weighted average cost of capital. For the non-lease component of the contract, we estimate the stand-alone selling price of the maintenance component using an expected cost-plus margin approach. The expected costs are based on our historical costs of providing maintenance services in our ChoiceLease arrangements. The margin is based on the historical margin percentages for our full service maintenance contracts in the SelectCare product line, as the maintenance performance obligation in those contracts is similar to maintenance in our ChoiceLease arrangements. Full service maintenance arrangements in SelectCare are priced based on targeted margin percentages for new and used vehicles by type of vehicle (trucks, tractors, and trailers), considering the fixed and variable costs of providing maintenance services.
We recognize maintenance revenue using an input method, consistent with the estimated pattern of the costs to maintain the underlying vehicles. This generally results in the recognition of a contract liability for the portion of the customer's billings allocated to the maintenance service component of the agreement. The non-lease revenue from maintenance services related to our ChoiceLease product is recognized in "Lease & related maintenance and rental revenue" in the Consolidated Statements of Earnings. We recognized $1.0 billion in 2025, $972 million in 2024 and $963 million in 2023.
The stand-alone price for both the lease and non-lease components could vary in the future based on both external market conditions and our pricing strategies as a result of the market conditions.
Pension Assumptions. We apply actuarial methods to determine the annual net periodic pension expense and pension plan liabilities on an annual basis, or on an interim basis if there is an event, such as a curtailment, requiring remeasurement. Each December, we review actual experience compared with the assumptions used and make adjustments to our assumptions, if warranted. In determining our annual estimate of periodic pension cost, we are required to make an evaluation of critical factors such as discount rate, expected long-term rate of return on assets, retirement rate and mortality. Discount rates are based upon a duration analysis of expected benefit payments and the equivalent average yield for high quality corporate fixed income investments as of our annual measurement date at December 31. In order to estimate the discount rate relevant to our plan, we use models that match projected benefits payments of our primary plans to interest payments and maturities from a hypothetical portfolio of high quality corporate bonds. Long-term rate of return assumptions are based on a review of our asset allocation strategy and long-term expected asset returns. Investment management and other fees paid using plan assets are factored into the determination of asset return assumptions.
Assumptions as to mortality of the participants in our pension plan is a key estimate in measuring the expected payments participants may receive over their lifetime, and therefore the amount of expense we will recognize. We update our mortality assumptions as deemed necessary by taking into consideration relevant actuarial studies as they become available as well as reassessing our own historical experience. Disclosure of the significant assumptions used in arriving at the 2025 net pension expense is presented in Note 19, “Employee Benefit Plans,” in the Notes to Consolidated Financial Statements.
As part of our strategy to manage future pension costs and net funded status volatility, we regularly assess our pension investment strategy. Our U.S. pension investment policy and strategy seek to reduce the effects of future volatility on the fair value of our pension assets relative to our pension liabilities by achieving attractive risk-adjusted returns that will balance the liquidity requirements of the plans’ liabilities while striving to minimize the risk of significant funded status deterioration. As the funded status of the plan improves, we (1) gradually increase the liability hedging portfolio, which consists of high quality, fixed income securities and (2) reduce our allocation of equity investments. The composition of our U.S. pension assets was 13% equity securities and alternative assets, 86% fixed income securities and 1% cash as of December 31, 2025. In 2026, our long-term expected rate of return assumption (net of fees) for our primary U.S. plan will be 5.90%.
41
ITEM 7. MANAGEMENT'S DISCUSSION AND ANALYSIS OF
FINANCIAL CONDITION AND RESULTS OF OPERATIONS
Accounting guidance applicable to pension plans does not require immediate recognition of the effects of a deviation between these assumptions and actual experience or the revision of an estimate. This approach allows the favorable and unfavorable effects that fall within an acceptable range to be netted and included in “Accumulated other comprehensive loss.” We had a pre-tax accumulated actuarial loss of $753 million and $777 million as of December 31, 2025 and 2024, respectively. To the extent the amount of cumulative actuarial gains and losses exceed 10% of the greater of the benefit obligation or plan assets, the excess amount is primarily amortized over the average remaining life expectancy of participants. As of December 31, 2025, the amount of the actuarial loss subject to amortization in 2026 and future years is $591 million. In 2026, we expect to amortize $31 million of net actuarial loss as a component of pension expense. The effect on years beyond 2026 will depend substantially upon the actual experience of our plans in future years.
A sensitivity analysis of 2026 net pension expense to changes in key underlying assumptions for our primary plan, the U.S. pension plan, is presented below:
Assumed Rate
Change
Impact on 2026 Net Pension Expense
Effect on
December 31, 2025
Projected Benefit Obligation
Expected long-term rate of return on assets
5.90%
+/- 0.25 %
+/- $3 million
N/A
Discount rate
5.45%
+/- 0.25 %
NM
+/- $26 million
Self-Insurance Obligations. The majority of our self-insurance relates to vehicle liability and workers’ compensation. We use a variety of statistical and actuarial methods that are widely used and accepted in the insurance industry to estimate amounts for claims that have been reported but not paid and claims incurred but not reported. In applying these methods and assessing their results, we consider such factors as frequency and severity of claims, claim development and payment patterns, and changes in the nature of our business, among others. Such factors are analyzed for each of our business segments. Our estimates may be impacted by such factors as increases in the market price for medical services, unpredictability of the size of jury awards and limitations inherent in the estimation process. We recognized a charge of $3 million in 2025, a benefit of $15 million in 2024 and a benefit of $17 million in 2023 from the development of estimated prior years' self-insured loss reserves. Based on self-insurance accruals at December 31, 2025, a 5% adverse change in actuarial claim loss estimates would increase operating expense in 2026 by $25 million. Refer to Note 10, “Accrued Expenses and Other Liabilities,” in the Notes to Consolidated Financial Statements for changes to the self-insurance accruals during the year.
Goodwill. We assess goodwill for impairment, as described in Note 1, “Summary of Significant Accounting Policies — Goodwill and Other Intangible Assets,” in the Notes to Consolidated Financial Statements, on an annual basis or more often if deemed necessary. As of December 31, 2025, total goodwill was $1.2 billion. To determine whether goodwill is impaired, we are required to assess the fair value of each reporting unit and compare it to its carrying value. A reporting unit is a component of an operating segment for which discrete financial information is available and management regularly reviews its operating performance.
We assess goodwill for impairment on October 1st of each year or more often if deemed necessary. In evaluating goodwill for impairment, we have the option to first assess qualitative factors to determine whether further impairment testing is necessary, such as macroeconomic conditions, changes in our industry and the markets in which we operate, and our market capitalization as well as our reporting units' historical and expected future financial performance. If we conclude that it is more likely than not that a reporting unit's fair value is less than its carrying value or we bypass the optional qualitative assessment, recoverability is assessed by comparing the fair value of the reporting unit with its carrying amount. If a reporting unit's carrying value exceeds its fair value, we will measure any goodwill impairment losses as the amount by which the carrying amount of a reporting unit exceeds its fair value, not to exceed the total amount of goodwill allocated to that reporting unit.
For quantitative tests, we estimate the fair value of the reporting units using a combination of both a market and income approach. Under the market approach, we use a selection of comparable publicly-traded companies that correspond to the reporting unit to derive a market-based multiple. Under the income approach, the fair value of the reporting unit is estimated based on the discounted present value of the projected future cash flows. Rates used to discount cash flows are dependent upon interest rates and the cost of capital based on our industry and capital structure, adjusted for equity and size risk premiums based on market capitalization. Estimates of future cash flows are dependent on our knowledge and experience about past and current events and significant judgments and assumptions about conditions we expect to exist, including revenue growth rates, margins, long-term growth rates, capital requirements, proceeds from the sale of used vehicles, the ability to utilize our tax net
42
ITEM 7. MANAGEMENT'S DISCUSSION AND ANALYSIS OF
FINANCIAL CONDITION AND RESULTS OF OPERATIONS
operating losses, and the discount rate. Our estimates of cash flows are also based on historical and future operating performance, economic conditions and actions we expect to take. In addition to these factors, our SCS and DTS reporting units are dependent on several key customers or industry sectors.
In making our assessments of fair value, we rely on our knowledge and experience about past and current events and assumptions about conditions we expect to exist in the future. These assumptions are based on a number of factors, including future operating performance, economic conditions, actions we expect to take and present value techniques. There are inherent uncertainties related to these factors and management’s judgment in applying them to the analysis of goodwill impairment. It is possible that assumptions underlying the impairment analysis will change in such a manner that impairment in value may occur in the future. We conduct additional sensitivity analyses to assess the risk for potential impairment based upon changes in the key assumptions in our goodwill valuation test, including long-term growth rates and discount rates.
On October 1, 2025, we completed our annual goodwill impairment test for all reporting units and determined that the fair values more likely than not exceeded their respective carrying values for each reporting unit. We conducted qualitative analyses for all reporting units.
Income Taxes. Our overall tax position is complex and requires careful analysis by management to estimate the expected realization of income tax assets and liabilities.
Tax regulations can require items to be included in the tax return at different times than the items are reflected in the financial statements. As a result, the effective tax rate reflected in the financial statements can be different than that reported in the tax return. Timing differences create deferred tax assets and liabilities. Deferred tax assets generally represent items that can be used as a tax deduction or credit in the tax return in future years for which we have already recognized the tax benefit in the financial statements. Deferred tax assets were $677 million and $728 million as of December 31, 2025 and 2024, respectively. We recognize a valuation allowance against deferred tax assets to reduce such assets to amounts expected to be realized. As of December 31, 2025 and 2024, the deferred tax valuation allowance was $14 million and $12 million, respectively. In determining the required level of valuation allowance, we consider whether it is more likely than not that all or some portion of deferred tax assets will not be realized. This assessment is based on management’s expectations as to whether sufficient taxable income of an appropriate character will be realized within tax carryback and carryforward periods. Our assessment involves estimates and assumptions about matters that are inherently uncertain, and unanticipated events or circumstances could cause actual results to differ from these estimates. Should we change our estimate of the amount of deferred tax assets that we would be able to realize, an adjustment to the valuation allowance would result in an increase or decrease to the provision for income taxes in the period such a change in estimate was made.
As part of our calculation of the provision for income taxes, we determine whether the benefits of our tax positions are at least more likely than not of being sustained upon audit based on the technical merits of the tax position. We accrue the largest amount of the benefit that has a cumulative probability of greater than 50% of being sustained. These accruals require management to make estimates and judgments with respect to the ultimate outcome of a tax audit. Actual results could vary materially from these estimates.
A number of years may elapse before a particular matter for which we have established a reserve is audited and finally resolved. The number of years exposed to audit due to open statutes varies depending on the tax jurisdiction. The tax benefit that has been previously reserved because of a failure to meet the “more likely than not” recognition threshold would be recognized in our income tax expense in the first interim period when the uncertainty is resolved under any one of the following conditions: (1) the tax position has been determined to be “more likely than not” of being sustained, (2) the tax position, amount and/or timing is ultimately settled through negotiation or litigation, or (3) the statutes of limitations for the tax position has expired. Refer to Note 11, “Income Taxes,” in the Notes to Consolidated Financial Statements for further discussion.
RECENT ACCOUNTING PRONOUNCEMENTS
Refer to Note 2, “Recent Accounting Pronouncements,” in the Notes to Consolidated Financial Statements for a discussion of recent accounting pronouncements.
NON-GAAP FINANCIAL MEASURES
Non-GAAP Financial Measures. This Annual Report on Form 10-K includes information extracted from consolidated financial information that is not required by U.S. GAAP to be presented in the financial statements. Certain elements of this information are considered “non-GAAP financial measures” as defined by SEC rules. Non-GAAP financial measures should be
43
ITEM 7. MANAGEMENT'S DISCUSSION AND ANALYSIS OF
FINANCIAL CONDITION AND RESULTS OF OPERATIONS
considered in addition to, but not as a substitute for or superior to, other measures of financial performance or liquidity prepared in accordance with U.S. GAAP. Also, our non-GAAP financial measures may not be comparable to financial measures used by other companies. We provide a reconciliation of each of these non-GAAP financial measures to the most comparable GAAP measure in this non-GAAP financial measures section or in the MD&A above. We also provide the reasons why management believes each non-GAAP financial measure is useful to investors in this section.
Specifically, we refer to the following non-GAAP financial measures in this Form 10-K:
Non-GAAP Financial Measure
Comparable GAAP Measure
Operating Revenue Measures:
Operating Revenue
Total Revenue
FMS Operating Revenue
FMS Total Revenue
SCS Operating Revenue
SCS Total Revenue
DTS Operating Revenue
DTS Total Revenue
FMS EBT as a % of FMS Operating Revenue
FMS EBT as a % of FMS Total Revenue
SCS EBT as a % of SCS Operating Revenue
SCS EBT as a % of SCS Total Revenue
DTS EBT as a % of DTS Operating Revenue
DTS EBT as a % of DTS Total Revenue
Comparable Earnings Measures:
Comparable Earnings Before Income Tax
Earnings Before Income Tax
Comparable Earnings
Earnings from Continuing Operations
Comparable Earnings Before Interest, Taxes, Depreciation
and Amortization (EBITDA)
Net Earnings
Comparable EPS
EPS from Continuing Operations
Comparable Tax Rate
Effective Tax Rate from Continuing Operations
Adjusted Return on Equity (ROE)
Not Applicable. However, non-GAAP elements of the calculation have been reconciled to the corresponding GAAP measures. A numerical reconciliation of net earnings to adjusted net earnings and average shareholders' equity to adjusted average equity is provided in the following reconciliations.
Cash Flow Measures:
Total Cash Generated and Free Cash Flow
Cash Provided by Operating Activities from Continuing Operations
44
ITEM 7. MANAGEMENT'S DISCUSSION AND ANALYSIS OF
FINANCIAL CONDITION AND RESULTS OF OPERATIONS
Set forth in the table below is an overview of each non-GAAP financial measure and why management believes that presentation of each non-GAAP financial measure provides useful information to investors.
FMS EBT as a % of FMS Operating Revenue SCS EBT as a % of SCS Operating Revenue DTS EBT as a % of DTS Operating Revenue
Operating revenue is defined as total revenue for Ryder or each business segment (FMS, SCS and DTS) excluding any (1) fuel and (2) subcontracted transportation. We use operating revenue to evaluate the operating performance of our core businesses and as a measure of sales activity at the consolidated level for Ryder System, Inc., as well as for each of our business segments. We also use segment EBT as a percentage of segment operating revenue for each business segment for the same reason. Note: FMS EBT, SCS EBT and DTS EBT, our primary measures of segment performance, are not non-GAAP measures.
Fuel: We exclude FMS, SCS and DTS fuel from the calculation of our operating revenue measures, as fuel is an ancillary service that we provide our customers. Fuel revenue is impacted by fluctuations in market fuel prices and the costs are largely a pass-through to our customers, resulting in minimal changes in our profitability during periods of steady market fuel prices. However, profitability may be positively or negatively impacted by rapid changes in market fuel prices during a short period of time, as customer pricing for fuel services is established based on current market fuel costs.
Subcontracted transportation: We exclude subcontracted transportation from the calculation of our operating revenue measures, as these costs are also typically a pass-through to our customers and, therefore, carrier rate fluctuations result in minimal changes to our profitability. While our SCS and DTS business segments subcontract certain transportation services to third party providers, our FMS business segment does not engage in subcontracted transportation and, therefore, this item is not applicable to FMS.
Comparable Earnings Measures:
Comparable Earnings before Income Taxes (EBT) Comparable Earnings Comparable Earnings per Diluted Common Share (EPS) Comparable Tax Rate Adjusted Return on Equity (ROE)
Comparable EBT, Comparable Earnings and Comparable EPS are defined, respectively, as GAAP EBT, earnings and EPS, all from continuing operations, excluding (1) non-operating pension costs, net and (2) other items impacting comparability (as further described below). We believe these non-GAAP measures provide useful information to investors and allow for better year-over-year comparison of operating performance.
Non-operating pension costs, net: Our comparable earnings measures exclude non-operating pension costs, net, which include the amortization of net actuarial loss and prior service cost, interest cost and expected return on plan assets components of pension and postretirement benefit costs, as well as any significant charges for settlements or curtailments if recognized. We exclude non-operating pension costs, net because we consider these to be impacted by financial market performance and outside the operational performance of our business.
Other Items Impacting Comparability: Our comparable and adjusted earnings measures also exclude other significant items that are not representative of our business operations and vary from period to period.
Comparable Tax Rate is computed using the same methodology as the GAAP provision for income taxes. Income tax effects of non-GAAP adjustments are calculated based on the marginal tax rates to which the non-GAAP adjustments are related.
Adjusted ROE is defined as adjusted net earnings divided by adjusted average shareholders' equity and represents the rate of return on shareholders' investment. Other items impacting comparability described above are excluded, as applicable, from the calculation of adjusted net earnings and adjusted average shareholders' equity. We also exclude any significant charges for pension settlements or curtailments from the calculation of adjusted net earnings. We use adjusted ROE as an internal measure of how effectively we use the owned capital invested in our operations.
45
ITEM 7. MANAGEMENT'S DISCUSSION AND ANALYSIS OF
FINANCIAL CONDITION AND RESULTS OF OPERATIONS
Comparable Earnings Before Interest, Taxes, Depreciation and Amortization (EBITDA)
Comparable EBITDA is defined as net earnings, first adjusted to exclude discontinued operations and the following items, all from continuing operations: (1) non-operating pension costs, net and (2) other items impacting comparability (in each of (1) and (2), as defined in comparable earnings measures immediately above) and then adjusted further for (1) interest expense, (2) income taxes, (3) depreciation, (4) used vehicle sales results and (5) intangible amortization. We believe comparable EBITDA provides investors with useful information, as it is a standard measure commonly reported and widely used by investors and other interested parties to measure financial performance and our ability to service debt and meet our payment obligations. We believe that the inclusion of comparable EBITDA also provides consistency in financial reporting and aids investors in performing meaningful comparisons of past, present and future operating results. Our presentation of comparable EBITDA may not be comparable to similarly-titled measures used by other companies. Comparable EBITDA should not be considered a substitute for, or superior to, the measures of financial performance determined in accordance with GAAP.
Cash Flow Measures:
Total Cash Generated
Free Cash Flow
We consider total cash generated and free cash flow to be important measures of comparative operating performance, as our principal sources of operating liquidity are cash from operations and proceeds from the sale of revenue earning equipment.
Total Cash Generated is defined as the sum of (1) net cash provided by operating activities, (2) net cash provided by the sale of revenue earning equipment, (3) net cash provided by the sale of operating property and equipment and (4) other cash inflows from investing activities. We believe total cash generated is an important measure of total cash flows generated from our ongoing business activities.
Free Cash Flow is defined as the net amount of cash generated from operating activities and investing activities (excluding acquisitions) from continuing operations. We calculate free cash flow as the sum of (1) net cash provided by operating activities, (2) net cash provided by the sale of revenue earning equipment and operating property and equipment, and (3) other cash inflows from investing activities, less (4) purchases of property and revenue earning equipment. We believe free cash flow provides investors with an important perspective on the cash available for debt service and for shareholders, after making capital investments required to support ongoing business operations. Our calculation of free cash flow may be different from the calculation used by other companies and, therefore, comparability may be limited.
* See Total Cash Generated and Free Cash Flow reconciliations in the Financial Resources and Liquidity section of Management's Discussion and Analysis.
46
ITEM 7. MANAGEMENT'S DISCUSSION AND ANALYSIS OF
FINANCIAL CONDITION AND RESULTS OF OPERATIONS
The following table provides a reconciliation of GAAP Earnings from continuing operations before income taxes (EBT), Earnings from continuing operations, and Earnings from continuing operations per common share — Diluted (Diluted EPS) to comparable EBT, comparable earnings and comparable EPS, respectively. Certain items included in EBT, Earnings from continuing operations and Diluted EPS have been excluded from our comparable EBT, comparable earnings and comparable diluted EPS measures. The following table lists a summary of these items, which are discussed in more detail throughout our MD&A and within the Notes to Consolidated Financial Statements:
Continuing Operations
(In millions, except per share amounts)
2025
2024
2023
EBT
$
685
$
661
$
618
Non-operating pension costs, net (1)
36
41
40
Acquisition costs
—
7
2
FMS U.K. business exit
—
—
(32)
Currency translation adjustment loss
—
—
188
Other, net
9
6
(1)
Comparable EBT
$
730
$
715
$
815
Earnings
$
501
$
489
$
406
Non-operating pension costs, net (1)
29
31
31
Acquisition costs
—
6
2
FMS U.K. business exit
—
—
(19)
Currency translation adjustment loss
—
—
183
Other, net (2)
10
5
(1)
Comparable Earnings
$
540
$
531
$
602
Diluted EPS
$
11.99
$
11.06
$
8.73
Non-operating pension costs, net (1)
0.71
0.69
0.68
Acquisition costs
—
0.13
0.04
FMS U.K. business exit
—
—
(0.40)
Currency translation adjustment loss
—
—
3.93
Other, net (2)
0.22
0.12
(0.03)
Comparable EPS
$
12.92
$
12.00
$
12.95
_______________
(1)Refer to Note 19, “Employee Benefit Plans,” in the Notes to Consolidated Financial Statements for additional information.
(2)In 2025, includes the income tax effects of other items impacting comparability and non-recurring income tax adjustments. Refer to Note 20, “Other Items Impacting Comparability,” in the Notes to Consolidated Financial Statements for additional information.
The following table provides a reconciliation of the effective tax rate to the comparable tax rate:
2025
2024
2023
Effective tax rate on continuing operations (1)
26.8
%
26.0
%
34.3
%
Tax adjustments and income tax effects of non-GAAP adjustments (2)
(0.8)
%
(0.3)
%
(8.2)
%
Comparable tax rate on continuing operations (1)
26.0
%
25.7
%
26.1
%
_______________
(1)The effective tax rate on continuing operations and comparable tax rate are based on EBT and comparable EBT, found on the previous table.
(2)Income tax effects of non-GAAP adjustments are calculated based on the marginal tax rates to which the non-GAAP adjustments are related.
47
ITEM 7. MANAGEMENT'S DISCUSSION AND ANALYSIS OF
FINANCIAL CONDITION AND RESULTS OF OPERATIONS
The following table provides a reconciliation of Net earnings to comparable EBITDA:
(In millions)
2025
2024
2023
Net earnings
$
499
$
489
$
406
Loss from discontinued operations, net of tax
2
—
—
Provision for income taxes
184
172
212
EBT
685
661
618
Non-operating pension costs, net (1)
36
41
40
Acquisition costs (2)
—
7
2
FMS U.K. business exit (2)
—
—
(32)
Currency translation adjustment loss (2)
—
—
188
Other, net (2)
9
6
(1)
Comparable EBT
730
715
815
Interest expense
404
386
296
Depreciation
1,703
1,694
1,712
Used vehicle sales, net (3)
(22)
(72)
(193)
Intangible amortization
52
53
35
Comparable EBITDA
$
2,867
$
2,776
$
2,665
_______________
(1)Refer to Note 19, “Employee Benefit Plans,” in the Notes to Consolidated Financial Statements for additional information.
(2)Refer to the table above in the Full Year Operating Results by Segment for a discussion on items excluded from our comparable measures and their classification within our Consolidated Statements of Earnings and Note 20, “Other Items Impacting Comparability” in the Notes to Consolidated Financial Statements for additional information.
(3)Refer to Note 6,"Revenue Earning Equipment, net," in the Notes to Consolidated Financial Statements for additional information.
The following table provides a reconciliation of total revenue to operating revenue:
(In millions)
2025
2024
2023
Total revenue
$
12,665
$
12,636
$
11,783
Subcontracted transportation revenue
(1,473)
(1,499)
(1,380)
Fuel
(786)
(871)
(906)
Operating revenue
$
10,406
$
10,266
$
9,497
The following table provides a reconciliation of FMS total revenue to FMS operating revenue:
(In millions)
2025
2024
2023
FMS total revenue
$
5,845
$
5,888
$
5,930
Fuel revenue
(718)
(772)
(877)
FMS operating revenue
$
5,127
$
5,116
$
5,053
FMS EBT
$
501
$
516
$
665
FMS EBT as a % of FMS total revenue
8.6%
8.8%
11.2%
FMS EBT as a % of FMS operating revenue
9.8%
10.1%
13.2%
48
ITEM 7. MANAGEMENT'S DISCUSSION AND ANALYSIS OF
FINANCIAL CONDITION AND RESULTS OF OPERATIONS
The following table provides a reconciliation of SCS total revenue to SCS operating revenue:
Years ended December 31,
(In millions)
2025
2024
2023
SCS total revenue
$
5,459
$
5,300
$
4,875
Subcontracted transportation
(1,218)
(1,181)
(1,080)
Fuel
(150)
(154)
(170)
SCS operating revenue
$
4,091
$
3,965
$
3,625
SCS EBT
$
355
$
332
$
231
SCS EBT as a % of SCS total revenue
6.5%
6.3%
4.7%
SCS EBT as a % of SCS operating revenue
8.7%
8.4%
6.4%
The following table provides a reconciliation of DTS total revenue to DTS operating revenue:
Years ended December 31,
(In millions)
2025
2024
2023
DTS total revenue
$
2,343
$
2,446
$
1,785
Subcontracted transportation
(270)
(327)
(300)
Fuel
(232)
(249)
(187)
DTS operating revenue
$
1,841
$
1,870
$
1,298
DTS EBT
$
140
$
125
$
121
DTS EBT as a % of DTS total revenue
6.0%
5.1%
6.8%
DTS EBT as a % of DTS operating revenue
7.6%
6.7%
9.3%
The following tables provide numerical reconciliations of Net earnings to adjusted net earnings and average shareholders' equity to adjusted average shareholders' equity, and of the non-GAAP elements used to calculate the adjusted return on equity (Adjusted ROE) to the corresponding GAAP measures:
(In millions)
2025
2024
2023
Net earnings
$
499
$
489
$
406
Other items impacting comparability, net (1)
9
13
157
Tax impact (2)
1
(2)
8
Adjusted net earnings
$
509
$
500
$
571
Average shareholders’ equity
$
3,070
$
3,078
$
3,041
Average adjustments to shareholders’ equity (3)
5
2
(19)
Adjusted average shareholders’ equity
$
3,075
$
3,080
$
3,022
Adjusted ROE (4)
17%
16%
19%
_______________
(1)Refer to Note 20, “Other Items Impacting Comparability” in the Notes to Consolidated Financial Statements for additional information.
(2)Includes income taxes on discontinued operations.
(3)Represents the impact of Other items impacting comparability, net of tax, to equity for the respective period.
(4)Adjusted ROE is calculated by dividing Adjusted net earnings by Adjusted average shareholders' equity.
49
ITEM 7. MANAGEMENT'S DISCUSSION AND ANALYSIS OF
FINANCIAL CONDITION AND RESULTS OF OPERATIONS
The following table provides a reconciliation of forecasted net cash provided by operating activities to forecasted total cash generated and forecasted free cash flow (a non-GAAP measure) for 2026:
(In millions)
Forecast 2026
Net cash provided by operating activities from continuing operations
$
2,700
Proceeds from sales of property and revenue earning equipment (1)
500
Total cash generated
3,200
Purchases of property and revenue earning equipment (1)
(2,400)
Forecasted free cash flow
$
800
_____________________
(1)Included in cash flows from investing activities.
SPECIAL NOTE REGARDING FORWARD-LOOKING STATEMENTS
Forward-looking statements (within the meaning of the Federal Private Securities Litigation Reform Act of 1995) are statements that relate to expectations, beliefs, projections, future plans and strategies, anticipated events or trends concerning matters that are not historical facts. These statements are often preceded by or include the words “believe,” “expect,” “intend,” “estimate,” “anticipate,” “will,” “may,” “could,” “should” or similar expressions. This Annual Report contains forward-looking statements including statements regarding:
•our expectations regarding used vehicle sales and commercial rental;
•our expectations with respect to the freight cycle and market conditions, including general economic uncertainty;
•our expectations with respect to demand for outsourced logistics and the impacts of outsourcing and other secular trends in our SCS and DTS business segments and on our business and financial results;
•our expectations regarding the supply of vehicles and vehicle parts and its effect on pricing and demand;
•our expectations regarding the impact of labor shortages and interruptions and subcontracted transportation costs;
•our expectations regarding ChoiceLease revenue and earnings;
•our expectations in our SCS and DTS business segments related to revenue, earnings growth and contract sales activity;
•our expectations of cash flow from operating activities, free cash flow and full-year guidance;
•the adequacy of our accounting estimates and reserves for goodwill and other asset impairments, residual values and other depreciation assumptions, deferred income taxes and annual effective tax rates, variable revenue considerations, the valuation of our pension plans, allowance for credit losses, and self-insurance loss reserves;
•the adequacy of our fair value estimates of publicly traded debt and other debt;
•our ability to fund all of our operating, investing and financial needs for the foreseeable future through internally generated funds and outside funding sources;
•our expected level of use and availability of outside funding sources, anticipated future payments under debt and lease agreements, and risk of losses resulting from counterparty default under hedging and derivative agreements;
•our ability to meet our objectives with the share repurchase programs;
•the anticipated impact of fuel and energy prices, interest rate movements, and exchange rate fluctuations;
•our expectations as to return on pension plan assets and future pension expense;
•our expectations regarding the scope and anticipated outcomes with respect to certain claims, proceedings and lawsuits;
•our ability to access commercial paper and other available debt financing in the capital markets;
•our expectations regarding the benefits from our strategic investments and initiatives, including our maintenance and lease pricing initiatives;
•our expectations regarding acquisitions;
•the anticipated impact of tariffs and inflationary pressures;
•our expectations of the long-term residual values of revenue earnings equipment, including the probability of incurring losses or having to decrease residual value estimates in the event of a potential cyclical downturn or changes to the estimated useful lives; and
50
ITEM 7. MANAGEMENT'S DISCUSSION AND ANALYSIS OF
FINANCIAL CONDITION AND RESULTS OF OPERATIONS
•our expectations regarding U.S. federal, state and foreign tax positions and the realizability of deferred tax assets and changes in foreign tax rates.
These statements, as well as other forward-looking statements contained in this Annual Report, are based on our current plans and expectations and are subject to risks, uncertainties and assumptions. We caution readers that certain important factors could cause actual results and events to differ significantly from those expressed in any forward-looking statements. These risk factors, among others, include the following:
•Market Conditions:
◦Changes in general economic and financial conditions in the U.S. and worldwide leading to decreased demand for our services and products, lower profit margins, increased levels of bad debt and reduced access to credit and financial markets.
◦Decreases in freight demand which would impact both our transactional and variable-based contractual business.
◦Changes in our customers' operations, financial condition or business environment that may limit their demand for, or ability to purchase, our services and products.
◦Decreases in market demand affecting the commercial rental market and used vehicle sales as well as global economic conditions.
◦Volatility in customer volumes and shifting customer demand in the industries we service.
◦Changes in current financial, tax or other regulatory requirements, such as tariffs, trade restrictions or trade agreements, that could negatively impact our financial and operating results.
◦Financial institution disruptions and geopolitical events or conflicts.
•Competition:
◦Advances in technology may impact demand for our services or may require increased investments to remain competitive, and our customers may not be willing to accept higher prices to cover the cost of these investments.
◦Competition from other service providers, some of which have greater capital resources or lower capital costs, or from our customers, who may choose to provide services themselves.
◦Continued consolidation in the markets where we operate which may create large competitors with greater financial resources.
◦Our inability to maintain current pricing levels due to economic conditions, demand for services, customer acceptance or competition.
•Profitability:
◦Lower than expected sales volumes or customer retention levels.
◦Decreases in commercial rental fleet utilization and pricing.
◦Lower than expected used vehicle sales pricing levels and fluctuations in the anticipated proportion of retail versus wholesale sales.
◦Loss of key customers in our SCS and DTS business segments.
◦Decreases in volume in our omnichannel retail vertical.
◦Our inability to adapt our product offerings to meet changing consumer preferences on a cost-effective basis.
◦The inability of our information technology systems to provide timely and accurate access to data.
◦The inability of our information security program to safeguard our and our stakeholders' data.
◦Sudden changes in market fuel prices and fuel shortages.
◦Higher prices for vehicles, diesel engines and fuel as a result of new regulations or inflationary pressures.
◦Higher than expected maintenance costs and lower than expected benefits associated with our maintenance initiatives.
◦Lower than expected revenue growth due to production delays at our automotive SCS customers and supply chain disruptions.
◦The inability of an original equipment manufacturer or supplier to provide vehicles or vehicle components as originally scheduled.
◦Our inability to successfully execute our strategic returns and asset management initiatives, maintain our fleet at normalized levels and right-size our fleet in line with demand.
51
ITEM 7. MANAGEMENT'S DISCUSSION AND ANALYSIS OF
FINANCIAL CONDITION AND RESULTS OF OPERATIONS
◦Our key assumptions and pricing structure, including any assumptions made with respect to inflation, of our SCS and DTS contracts prove to be inaccurate.
◦Increased unionizing, labor strikes and work stoppages.
◦Difficulties in attracting and retaining qualified professional drivers due to labor shortages influenced by FMCSA regulatory requirements, including English proficiency standards for non-domiciled commercial drivers, that may result in higher labor costs and turnover rates.
◦Difficulties in attracting and retaining warehouse associates and technicians due to labor shortages, which may result in higher costs to procure technicians and higher turnover rates affecting our customers.
◦Our inability to manage our cost structure.
◦Our inability to limit our exposure for customer claims.
◦Unfavorable or unanticipated outcomes in legal or regulatory proceedings or uncertain positions.
◦Business interruptions or expenditures due to severe weather or other natural occurrences.
•Financing Concerns:
◦Higher borrowing costs.
◦Increased inflationary pressures.
◦Unanticipated interest rate and currency exchange rate fluctuations.
◦Negative funding status of our pension plans caused by lower than expected returns on invested assets and unanticipated changes in interest rates.
◦Instability in U.S. and worldwide credit markets, resulting in higher borrowing costs and/or reduced access to credit.
•Accounting Matters:
◦Reductions in residual values or useful lives of revenue earning equipment.
◦Increases in compensation levels, retirement rate and mortality resulting in higher pension expense.
◦Changes in accounting rules, assumptions and accruals.
•Other risks detailed from time to time in our SEC filings, including in "Item 1A. Risk Factors" of this Annual Report.
New risk factors emerge from time to time, and it is not possible for management to predict all such risk factors or to assess the impact of such risk factors on our business. As a result, no assurance can be given as to our future results or achievements. You should not place undue reliance on the forward-looking statements contained herein, which speak only as of the date of this Annual Report. We do not intend, or assume any obligation, to update or revise any forward-looking statements contained in this Annual Report, whether as a result of new information, future events or otherwise.
ITEM 7A. QUANTITATIVE AND QUALITATIVE DISCLOSURES ABOUT MARKET RISK
In the normal course of business, we are exposed to fluctuations in interest rates, foreign currency exchange rates and market fuel prices. We manage these exposures in several ways, including, in certain circumstances, the use of a variety of derivative financial instruments when deemed prudent. We do not enter into leveraged derivative financial transactions or use derivative financial instruments for trading purposes.
Interest Rate Risk
Exposure to market risk for changes in interest rates exists for our debt obligations. Our interest rate risk management program objectives are to limit the impact of interest rate changes on earnings and cash flows and to lower overall borrowing costs. We manage our exposure to interest rate risk primarily through the proportion of fixed-rate and variable-rate debt we hold in the total debt portfolio. From time to time, we also use interest rate swap agreements to manage our fixed-rate and variable-rate exposure and to better match the repricing of debt instruments to that of our portfolio of assets. The fair value of our derivatives liability was $11 million as of December 31, 2025.
As of December 31, 2025, we had $6.1 billion of fixed-rate debt outstanding (excluding finance leases and U.S. asset- backed securities) with a weighted-average interest rate of 5.10% and a fair value of $6.3 billion. A hypothetical 10% change in market interest rates would impact the fair value of our fixed-rate debt by $83 million and impact pre-tax earnings by $31 million as of December 31, 2025, respectively. Changes in the relative sensitivity of the fair value of our financial instrument
52
portfolio for these theoretical changes in the level of interest rates are primarily driven by changes in our debt maturities, interest rate profile and amount.
As of December 31, 2025, we had $1.4 billion of variable-rate debt, including $500 million of fixed-rate debt instruments swapped to SOFR-based floating-rate debt. Changes in the fair value of the interest rate swaps were offset by changes in the fair value of the debt instruments and no net gain or loss was recognized in earnings. The fair value of our variable-rate debt as of December 31, 2025 was $1.4 billion. A hypothetical 10% increase in market interest rates would not impact the fair value of our variable-rate debt or change pre-tax earnings by a material amount as of December 31, 2025.
We are also subject to interest rate risk with respect to our pension and postretirement benefit obligations, as changes in interest rates will effectively increase or decrease our liabilities associated with these benefit plans, which also results in changes to the amount of pension and postretirement benefit expense recognized on an annual basis.
Foreign Currency Exchange Risk
Exposure to market risk for changes in foreign currency exchange rates relates primarily to our foreign operations’ buying, selling and financing in currencies other than local currencies and to the carrying value of net investments in foreign subsidiaries. The majority of our transactions are denominated in U.S. dollars. The principal foreign currency exchange rate risks to which we are exposed include the Canadian dollar and Mexican peso. We manage our exposure to foreign currency exchange rate risk related to our foreign operations’ buying, selling and financing in currencies other than local currencies by naturally offsetting assets and liabilities not denominated in local currencies to the extent possible. A hypothetical uniform 10% strengthening in the value of the U.S dollar relative to all the currencies in which our transactions are denominated would not materially impact the results of operations. We also use foreign currency option contracts and forward agreements from time to time to hedge foreign currency transactional exposure. We generally do not hedge the foreign currency exposure related to our net investment in foreign subsidiaries.
Market Fuel Price Risk
Exposure to market risk for fluctuations in market fuel prices relates to various fuel purchase arrangements in place to ensure delivery of fuel at market rates in the event of fuel shortages. We are exposed to fluctuations in market fuel prices in these arrangements since none of the arrangements fix the price of fuel to be purchased. Changes in the price of fuel are generally passed on to our customers for which we realize minimal changes in profitability during periods of steady market fuel prices. However, profitability may be positively or negatively impacted by sudden increases or decreases in market fuel prices during a short period of time as customer pricing for fuel services is established based on current market fuel costs. We believe the exposure to fuel price fluctuations would not materially impact our results of operations, cash flows or financial position.
53
ITEM 8. FINANCIAL STATEMENTS AND SUPPLEMENTARY DATA
All other schedules are omitted because they are not applicable or the required information is shown in the consolidated financial statements or notes thereto.
54
MANAGEMENT’S REPORT ON INTERNAL CONTROL OVER FINANCIAL REPORTING
TO THE SHAREHOLDERS OF RYDER SYSTEM, INC.:
Management of Ryder System, Inc., together with its consolidated subsidiaries (Ryder), is responsible for establishing and maintaining adequate internal control over financial reporting as defined in Rules 13a-15(f) and 15d-15(f) under the Securities Exchange Act of 1934. Ryder’s internal control over financial reporting is designed to provide reasonable assurance regarding the reliability of financial reporting and the preparation of the consolidated financial statements for external purposes in accordance with accounting principles generally accepted in the United States of America.
Ryder’s internal control over financial reporting includes those policies and procedures that (1) pertain to the maintenance of records that, in reasonable detail, accurately and fairly reflect the transactions and dispositions of the assets of Ryder; (2) provide reasonable assurance that transactions are recorded as necessary to permit preparation of financial statements in accordance with generally accepted accounting principles, and that our receipts and expenditures are being made only in accordance with authorizations of Ryder’s management and directors; and (3) provide reasonable assurance regarding prevention or timely detection of unauthorized acquisition, use or disposition of Ryder’s assets that could have a material effect on the consolidated financial statements.
Because of its inherent limitations, internal control over financial reporting may not prevent or detect misstatements. Also, projections of any evaluation of effectiveness to future periods are subject to the risk that controls may become inadequate because of changes in conditions, or that the degree of compliance with the policies or procedures may deteriorate.
Management assessed the effectiveness of Ryder’s internal control over financial reporting as of December 31, 2025. In making this assessment, management used the criteria set forth by the Committee of Sponsoring Organizations of the Treadway Commission in “Internal Control — Integrated Framework (2013).” Based on our assessment and those criteria, management determined that Ryder maintained effective internal control over financial reporting as of December 31, 2025.
Ryder’s independent registered public accounting firm, PricewaterhouseCoopers LLP, has audited the effectiveness of Ryder’s internal control over financial reporting as of December 31, 2025. Their report appears on the subsequent page.
55
Report of Independent Registered Public Accounting Firm
To the Board of Directors and Shareholders of Ryder System, Inc.
Opinions on the Financial Statements and Internal Control over Financial Reporting
We have audited the accompanying consolidated balance sheets of Ryder System, Inc. and its subsidiaries (the "Company") as of December 31, 2025 and 2024, and the related consolidated statements of earnings, of comprehensive income, of shareholders' equity and of cash flows for each of the three years in the period ended December 31, 2025, including the related notes (collectively referred to as the "consolidated financial statements"). We also have audited the Company's internal control over financial reporting as of December 31, 2025, based on criteria established in Internal Control - Integrated Framework (2013) issued by the Committee of Sponsoring Organizations of the Treadway Commission (COSO).
In our opinion, the consolidated financial statements referred to above present fairly, in all material respects, the financial position of the Company as of December 31, 2025 and 2024, and the results of its operations and its cash flows for each of the three years in the period ended December 31, 2025 in conformity with accounting principles generally accepted in the United States of America. Also in our opinion, the Company maintained, in all material respects, effective internal control over financial reporting as of December 31, 2025, based on criteria established in Internal Control - Integrated Framework (2013) issued by the COSO.
Basis for Opinions
The Company's management is responsible for these consolidated financial statements, for maintaining effective internal control over financial reporting, and for its assessment of the effectiveness of internal control over financial reporting, included in the accompanying Management’s Report on Internal Control over Financial Reporting. Our responsibility is to express opinions on the Company’s consolidated financial statements and on the Company's internal control over financial reporting based on our audits. We are a public accounting firm registered with the Public Company Accounting Oversight Board (United States) (PCAOB) and are required to be independent with respect to the Company in accordance with the U.S. federal securities laws and the applicable rules and regulations of the Securities and Exchange Commission and the PCAOB.
We conducted our audits in accordance with the standards of the PCAOB. Those standards require that we plan and perform the audits to obtain reasonable assurance about whether the consolidated financial statements are free of material misstatement, whether due to error or fraud, and whether effective internal control over financial reporting was maintained in all material respects.
Our audits of the consolidated financial statements included performing procedures to assess the risks of material misstatement of the consolidated financial statements, whether due to error or fraud, and performing procedures that respond to those risks. Such procedures included examining, on a test basis, evidence regarding the amounts and disclosures in the consolidated financial statements. Our audits also included evaluating the accounting principles used and significant estimates made by management, as well as evaluating the overall presentation of the consolidated financial statements. Our audit of internal control over financial reporting included obtaining an understanding of internal control over financial reporting, assessing the risk that a material weakness exists, and testing and evaluating the design and operating effectiveness of internal control based on the assessed risk. Our audits also included performing such other procedures as we considered necessary in the circumstances. We believe that our audits provide a reasonable basis for our opinions.
Definition and Limitations of Internal Control over Financial Reporting
A company’s internal control over financial reporting is a process designed to provide reasonable assurance regarding the reliability of financial reporting and the preparation of financial statements for external purposes in accordance with generally accepted accounting principles. A company’s internal control over financial reporting includes those policies and procedures that (i) pertain to the maintenance of records that, in reasonable detail, accurately and fairly reflect the transactions and dispositions of the assets of the company; (ii) provide reasonable assurance that transactions are recorded as necessary to permit preparation of financial statements in accordance with generally accepted accounting principles, and that receipts and expenditures of the company are being made only in accordance with authorizations of management and directors of the company; and (iii) provide reasonable assurance regarding prevention or timely detection of unauthorized acquisition, use, or disposition of the company’s assets that could have a material effect on the financial statements.
56
Because of its inherent limitations, internal control over financial reporting may not prevent or detect misstatements. Also, projections of any evaluation of effectiveness to future periods are subject to the risk that controls may become inadequate because of changes in conditions, or that the degree of compliance with the policies or procedures may deteriorate.
Critical Audit Matters
The critical audit matter communicated below is a matter arising from the current period audit of the consolidated financial statements that was communicated or required to be communicated to the audit committee and that (i) relates to accounts or disclosures that are material to the consolidated financial statements and (ii) involved our especially challenging, subjective, or complex judgments. The communication of critical audit matters does not alter in any way our opinion on the consolidated financial statements, taken as a whole, and we are not, by communicating the critical audit matter below, providing a separate opinion on the critical audit matter or on the accounts or disclosures to which it relates.
Revenue Earning Equipment - Residual Values
As described in Notes 1 and 6 to the consolidated financial statements, the net carrying amount of revenue earning equipment was $8.9 billion as of December 31, 2025. Depreciation expense was $1.5 billion primarily related to Fleet Management Solutions (FMS) revenue earning equipment. Revenue earning equipment, comprised of vehicles, is initially recorded at cost inclusive of vendor rebates. The provision for depreciation is computed using the straight-line method. As disclosed by management, they periodically review and adjust, as appropriate, the estimated residual values of existing revenue earning equipment. Management's review of the estimated residual values of revenue earning equipment is based on vehicle class (i.e., generally subcategories of trucks, tractors and trailers by weight and usage), historical and current market prices, third-party expected future market prices, expected lives of vehicles, and expected sales in the wholesale or retail markets, among other factors.
The principal considerations for our determination that performing procedures related to revenue earning equipment - residual values is a critical audit matter are the significant judgment by management when estimating residual values, which in turn led to a high degree of auditor judgment, subjectivity and effort in performing procedures and in evaluating the significant judgment by management in estimating residual values related to the Company's historical and current market prices, and third-party expected future market prices.
Addressing the matter involved performing procedures and evaluating audit evidence in connection with forming our overall opinion on the consolidated financial statements. These procedures included testing the effectiveness of controls relating to management's assessment of, and related adjustments to, the estimated residual values of revenue earning equipment. These procedures also included, among others, (i) testing management's process for developing the estimated residual values of revenue earning equipment, (ii) testing the accuracy of the Company's historical used vehicle sales data and historical and current market prices, and (iii) evaluating the reasonableness of management's significant assumption related to third-party expected future market prices. Evaluating management's significant assumption related to third-party expected future market prices of used vehicles involved evaluating whether the assumption used was reasonable considering (i) past trends in the used vehicle sales market, (ii) consistency with external market and industry data, and (iii) consistency with evidence obtained in other areas of the audit.
/s/ PricewaterhouseCoopers LLP
Miami, Florida
February 11, 2026
We have served as the Company’s auditor since 2006.
57
RYDER SYSTEM, INC. AND SUBSIDIARIES
CONSOLIDATED STATEMENTS OF EARNINGS
(In millions, except per share amounts)
2025
2024
2023
Services revenue
$
8,378
$
8,345
$
7,297
Lease & related maintenance and rental revenue
3,881
3,835
3,937
Fuel services revenue
406
456
549
Total revenue
12,665
12,636
11,783
Cost of services
7,129
7,099
6,266
Cost of lease & related maintenance and rental
2,589
2,623
2,684
Cost of fuel services
391
441
534
Selling, general and administrative expenses
1,470
1,478
1,421
Non-operating pension costs, net
36
41
40
Used vehicle sales, net
(22)
(72)
(196)
Interest expense
404
386
296
Miscellaneous income, net
(26)
(34)
(47)
Currency translation adjustment loss
—
—
188
Restructuring and other items, net
9
13
(21)
11,980
11,975
11,165
Earnings from continuing operations before income taxes
685
661
618
Provision for income taxes
184
172
212
Earnings from continuing operations
501
489
406
Loss from discontinued operations, net of tax
(2)
—
—
Net earnings
$
499
$
489
$
406
Earnings per common share — Basic
Continuing operations
$
12.20
$
11.29
$
8.89
Discontinued operations
(0.05)
—
(0.01)
Net earnings
$
12.15
$
11.29
$
8.89
Earnings per common share — Diluted
Continuing operations
$
11.99
$
11.06
$
8.73
Discontinued operations
(0.04)
—
(0.01)
Net earnings
$
11.94
$
11.06
$
8.73
See accompanying Notes to Consolidated Financial Statements.
Note: EPS amounts may not be additive due to rounding.
58
RYDER SYSTEM, INC. AND SUBSIDIARIES
CONSOLIDATED STATEMENTS OF COMPREHENSIVE INCOME
(In millions)
2025
2024
2023
Net earnings
$
499
$
489
$
406
Other comprehensive income (loss):
Net change in cumulative translation adjustment and unrealized (loss) gain from cash flow hedges, net of taxes
50
(77)
212
Amortization of pension and postretirement items
30
31
26
Income tax expense related to amortization of pension and postretirement items
(5)
(8)
(6)
Amortization of pension and postretirement items, net of taxes
25
23
20
Change in net actuarial (loss) gain and prior service cost
(4)
23
(121)
Income tax benefit (expense) related to change in net actuarial loss and prior service cost
1
(6)
30
Change in net actuarial (loss) gain and prior service cost, net of taxes
(3)
17
(91)
Other comprehensive income (loss), net of taxes
72
(37)
141
Comprehensive income
$
571
$
452
$
547
See accompanying Notes to Consolidated Financial Statements.
59
RYDER SYSTEM, INC. AND SUBSIDIARIES
CONSOLIDATED BALANCE SHEETS
December 31,
(In millions, except share amounts)
2025
2024
Assets:
Current assets:
Cash and cash equivalents
$
198
$
154
Receivables, net
1,897
1,861
Prepaid expenses and other current assets
378
448
Total current assets
2,473
2,463
Revenue earning equipment, net
8,898
9,206
Operating property and equipment, net
1,268
1,184
Goodwill
1,152
1,158
Intangible assets, net
412
457
Operating lease right-of-use assets
1,000
1,055
Sales-type leases and other assets
1,184
1,149
Total assets
$
16,387
$
16,672
Liabilities and shareholders’ equity:
Current liabilities:
Short-term debt and current portion of long-term debt
$
819
$
1,120
Accounts payable
689
828
Accrued expenses and other current liabilities
1,270
1,323
Total current liabilities
2,778
3,271
Long-term debt
6,826
6,659
Other non-current liabilities
1,923
1,954
Deferred income taxes
1,808
1,671
Total liabilities
13,335
13,555
Commitments and contingencies (Note 21)
Shareholders’ equity:
Preferred stock, no par value per share — authorized, 3,800,917; none outstanding, December 31, 2025 and 2024
—
—
Common stock, $0.50 par value per share — authorized, 400,000,000; outstanding, December 31, 2025 — 39,417,224 and December 31, 2024 — 42,080,039
20
21
Additional paid-in capital
1,083
1,144
Retained earnings
2,569
2,644
Accumulated other comprehensive loss
(620)
(692)
Total shareholders’ equity
3,052
3,117
Total liabilities and shareholders’ equity
$
16,387
$
16,672
See accompanying Notes to Consolidated Financial Statements.
60
RYDER SYSTEM, INC. AND SUBSIDIARIES
CONSOLIDATED STATEMENTS OF CASH FLOWS
(In millions)
2025
2024
2023
Cash flows from operating activities from continuing operations:
Net earnings
$
499
$
489
$
406
Less: Loss from discontinued operations, net of tax
(2)
—
—
Earnings from continuing operations
501
489
406
Depreciation expense
1,703
1,694
1,712
Used vehicle sales, net
(22)
(72)
(196)
Currency translation adjustment loss
—
—
188
Amortization expense and other non-cash charges, net
Non-operating pension costs, net and share-based compensation expense
75
83
84
Deferred income taxes
130
21
115
Collections on sales-type leases
166
148
126
Changes in operating assets and liabilities:
Receivables
(33)
(61)
(26)
Prepaid expenses and other assets
53
(108)
(85)
Accounts payable
(63)
(32)
(7)
Accrued expenses and other liabilities
(453)
(431)
(337)
Net cash provided by operating activities from continuing operations
2,594
2,265
2,353
Cash flows from investing activities from continuing operations:
Purchases of property and revenue earning equipment
(2,135)
(2,683)
(3,234)
Sales of revenue earning equipment
468
532
764
Sales of operating property and equipment
18
19
63
Acquisitions, net of cash acquired
(1)
(314)
(250)
Other investing activities, net
—
—
(6)
Net cash used in investing activities from continuing operations
(1,650)
(2,446)
(2,663)
Cash flows from financing activities from continuing operations:
Net (repayments) borrowings of commercial paper and other
(3)
296
(100)
Debt proceeds
892
1,789
2,307
Debt repayments
(1,119)
(1,479)
(1,481)
Dividends on common stock
(145)
(135)
(128)
Common stock issued, net of tax withholdings on vested stock awards
(12)
10
2
Common stock repurchased
(519)
(321)
(337)
Other financing activities
(6)
(7)
(7)
Net cash (used in) provided by financing activities from continuing operations
(912)
153
256
Effect of exchange rate changes on Cash and cash equivalents
13
(21)
(9)
Increase (Decrease) in Cash and cash equivalents from continuing operations
45
(49)
(63)
Net cash used by operating activities from discontinued operations
(1)
(1)
—
Increase (Decrease) in Cash and cash equivalents
44
(50)
(63)
Cash and cash equivalents at beginning of period
154
204
267
Cash and cash equivalents at end of period
$
198
$
154
$
204
See accompanying Notes to Consolidated Financial Statements.
61
RYDER SYSTEM, INC. AND SUBSIDIARIES
CONSOLIDATED STATEMENTS OF SHAREHOLDERS' EQUITY
Preferred Stock
Common Stock
Additional Paid-In Capital
Retained Earnings
Accumulated
Other
Comprehensive (Loss) Gain
(In millions, except share amounts in thousands)
Amount
Shares
Par
Total
Balance at January 1, 2023
$
—
46,287
$
23
$
1,192
$
2,518
$
(796)
$
2,937
Comprehensive income
—
—
—
—
406
141
547
Common stock dividends declared — $2.66 per share
—
—
—
—
(125)
—
(125)
Common stock issued under employee stock award and stock purchase plans and other (1)
—
1,176
1
1
1
—
3
Common stock repurchased
—
(3,561)
(2)
(89)
(246)
—
(337)
Share-based compensation expense
—
—
—
44
—
—
44
Balance at December 31, 2023
—
43,902
22
1,148
2,554
(655)
3,069
Comprehensive income
—
—
—
—
489
(37)
452
Common stock dividends declared — $3.04 per share
—
—
—
—
(135)
—
(135)
Common stock issued under employee stock award and stock purchase plans and other (1)
—
663
—
9
1
—
10
Common stock repurchased
—
(2,485)
(1)
(55)
(265)
—
(321)
Share-based compensation expense
—
—
—
42
—
—
42
Balance at December 31, 2024
—
42,080
21
1,144
2,644
(692)
3,117
Comprehensive income
—
—
—
—
499
72
571
Common stock dividends declared —$3.44 per share
—
—
—
—
(144)
—
(144)
Common stock issued under employee stock award and stock purchase plans and other (1)
—
512
1
(13)
—
—
(12)
Common stock repurchased
—
(3,175)
(2)
(87)
(430)
—
(519)
Share-based compensation expense
—
—
—
39
—
—
39
Balance at December 31, 2025
$
—
39,417
$
20
$
1,083
$
2,569
$
(620)
$
3,052
_______________
(1)Net of common shares delivered as payment for the exercise price or to satisfy the holders' withholding tax liability upon exercise of options.
See accompanying Notes to Consolidated Financial Statements.
62
RYDER SYSTEM, INC. AND SUBSIDIARIES
NOTES TO CONSOLIDATED FINANCIAL STATEMENTS
1.SUMMARY OF SIGNIFICANT ACCOUNTING POLICIES
Basis of Consolidation and Presentation
The consolidated financial statements include the accounts of Ryder System, Inc. (Ryder), all entities in which Ryder has a controlling voting interest (subsidiaries) and variable interest entities (VIEs) where Ryder is determined to be the primary beneficiary in accordance with generally accepted accounting principles in the United States (U.S. GAAP). All significant intercompany accounts and transactions have been eliminated in consolidation.
We report our financial performance based on three business segments: (1) Fleet Management Solutions (FMS), which provides full service leasing, commercial rental and vehicle maintenance services; (2) Supply Chain Solutions (SCS), which provides fully integrated logistics solutions; and (3) Dedicated Transportation Solutions (DTS), which provides turnkey transportation solutions, including dedicated vehicles, professional drivers, management and administrative support. Dedicated transportation services provided as part of an operationally integrated, multi-service supply chain solution to SCS customers are primarily reported in the SCS business segment.
Use of Estimates
The preparation of our consolidated financial statements requires management to make estimates and assumptions that affect the amounts reported in the consolidated financial statements and accompanying notes. These estimates are based on management’s best knowledge of historical trends, actions that we may take in the future, and other information available when the consolidated financial statements are prepared. Changes in estimates are typically recognized in the period when new information becomes available. Areas where the nature of the estimate make it reasonably possible that actual results could materially differ from the amounts estimated include: vehicle residual values, pension assumptions, self-insurance obligations, revenue recognition, goodwill, and income taxes.
Cash, Cash Equivalents
Cash and cash equivalents represent cash on hand, and highly liquid investments in short-term, interest-bearing instruments with maturities of three months or less at the date of purchase and are stated at cost.
Revenue Recognition
We generate revenue primarily through contracts with customers to lease, rent and maintain revenue earning equipment and to provide logistics management and dedicated transportation services. We enter into contracts that can include various combinations of services, which are generally capable of being distinct and accounted for as separate performance obligations. We account for a contract when it has approval and commitment from both parties, the rights of the parties are identified, payment terms are determined, the contract has commercial substance, and collectibility of consideration is probable.
We generally recognize revenue over time as we provide the promised services to our customers in an amount we expect to receive in exchange for those products or services. Revenue is recognized net of amounts collected from customers for taxes, such as sales tax, that are remitted to the applicable taxing authorities.
Lease & related maintenance and rental
Lease & related maintenance and rental revenue include ChoiceLease and commercial rental revenues from our FMS business segment. We offer a full service lease as well as a lease with more flexible maintenance options under our ChoiceLease product line. Our ChoiceLease product is marketed, priced and managed as a bundled service. We do not offer a stand-alone lease of a vehicle. We also offer rental of vehicles under our commercial rental product line, which allows customers to supplement their fleet of vehicles on a short-term basis.
Our ChoiceLease product line includes the lease of a vehicle (lease component) and maintenance and other services (non-lease component). We generally lease new vehicles to our customers. Consideration is allocated between the lease and non-lease components based on management's best estimate of the relative stand-alone selling price of each component. For further information regarding our stand-alone selling price estimation process, refer to the "Significant Judgments and Estimates" section below.
63
RYDER SYSTEM, INC. AND SUBSIDIARIES
NOTES TO CONSOLIDATED FINANCIAL STATEMENTS — (Continued)
Our ChoiceLease product provides for a fixed charge and a variable charge based on mileage or time usage. Fixed charges are typically billed at the beginning of the month and variable charges are typically billed a month in arrears. Revenue from the lease component of ChoiceLease agreements is recognized based on the classification of the arrangement, typically as either an operating or a sales-type lease. The majority of our leases are classified as operating leases and we recognize revenue for the lease component of these agreements on a straight-line basis. The non-lease component for maintenance services are not typically performed evenly over the life of a ChoiceLease contract as the level of maintenance provided generally increases as vehicles age. Therefore, we recognize maintenance revenue consistent with the estimated pattern of the costs to maintain the underlying vehicles. This generally results in the recognition of deferred revenue for the portion of the customer's billings allocated to the maintenance service component of the agreement.
Our commercial rental product includes the short-term rental of a vehicle (one day up to one year in length). All of our rental arrangements are classified as operating leases and revenue is recognized on a straight-line basis.
Lease and rental agreements do not usually provide for scheduled rent increases or escalations. However, most lease agreements allow for rate changes based upon changes in the Consumer Price Index (CPI). Lease and rental agreements also provide for variable usage charges based on a time charge and/or a fixed per-mile charge. The time charge, the per-mile charge and the changes in rates attributed to changes in the CPI are considered contingent revenue. These charges are not considered fixed or determinable until the equipment usage or CPI change occurs and are excluded from the allocation of consideration at the inception of the contract. Revenues associated with licensing and operating taxes that are billed as incurred are also excluded from the allocation of consideration at contract inception and allocated as earned. Variable consideration is allocated to the lease and maintenance components when earned based on the same allocation percentages at contract inception (or the most recent contract modification). Amounts allocated to the lease component are recognized in revenue as earned and amounts allocated to the non-lease component are recognized in revenue using an input method, consistent with the estimated pattern of maintenance costs for the remainder of the contract term.
Leases not classified as operating leases are considered sales-type leases. We recognize revenue for sales-type leases using the effective interest method, which provides a constant periodic rate of return on the outstanding investment in the lease. We recognize the difference between the net investment in the lease and the carrying value in selling profit or loss on used vehicles in our results of operations at lease commencement.
Cost of lease & related maintenance and rental represents the direct costs related to Lease & related maintenance and rental revenue and are comprised of depreciation of revenue earning equipment, maintenance costs (primarily repair parts and labor), and other costs such as licenses, insurance and operating taxes.
Services
Services revenue includes all SCS and DTS revenues, as well as SelectCare and other revenues from our FMS business segment. In our SCS business segment, we offer a broad range of logistics management services designed to optimize the supply chain and address the key business requirements of our customers supported by a variety of technology and engineering solutions. In our DTS business segment, we combine equipment, maintenance, professional drivers, administrative services and additional services to provide customers with a single integrated dedicated transportation solution. DTS services are customized for our customers based on a transportation analysis to optimize vehicle capacity and overall asset utilization.
Revenues from SCS and DTS service contracts are recognized as services are rendered in accordance with contract terms. SCS and DTS contracts typically include (1) fixed and variable billing rates, (2) cost-plus billing rates (input method based on actual costs incurred to perform services and a contracted mark-up), or (3) variable only or fixed only billing rates for the services. Our billing structure aligns with the value transferred to our customers. We generally have a right to consideration in an amount that corresponds directly with the value we have delivered to the customer.
Our customers contract us to provide an integrated service of transportation and / or supply chain logistics services into a single transportation and / or supply chain solution. Therefore, we typically recognize SCS and DTS service contracts as one performance obligation satisfied over time.
Under our SelectCare arrangements, we provide maintenance and repairs required to keep a vehicle in good operating condition, perform preventive maintenance inspections, provide access to emergency road service, and substitute vehicles. We provide these maintenance services to customers who choose not to lease our vehicles. The vast majority of our services are routine and performed on a recurring basis throughout the term of the arrangement. From time to time, we provide non-routine major repair services in order to place a vehicle back in service.
64
RYDER SYSTEM, INC. AND SUBSIDIARIES
NOTES TO CONSOLIDATED FINANCIAL STATEMENTS — (Continued)
Our maintenance service arrangement generally provides for a monthly fixed charge and a monthly variable charge based on mileage or time usage. Fixed charges are typically billed at the beginning of the month for the services to be provided that month, while variable charges are typically billed a month in arrears. Most maintenance agreements allow for rate changes based upon changes in the CPI. The fixed per-mile charge and the changes in rates attributed to changes in the CPI are recognized as earned.
The maintenance service is the only performance obligation in SelectCare contracts. For contract maintenance agreements, revenue is recognized as maintenance services are rendered over the terms of the related arrangements. We generally account for long-term maintenance contracts as one-year contracts since our maintenance arrangements are typically cancellable, without penalty, after the first year. For on-demand maintenance services, revenue is recognized at the point in time when the service is provided.
Cost of services represents the direct costs related to services revenue and is primarily comprised of salaries and employee-related costs, subcontracted transportation (purchased transportation from third parties), fuel, lease expense, insurance and maintenance costs. Costs associated with the activities performed under our maintenance arrangements are primarily comprised of labor, parts and outside repair work and are expensed as incurred.
Fuel Services
Fuel services revenue is reported in our FMS business segment. We provide our FMS customers with access to fuel at our maintenance facilities. Fuel services revenue is invoiced to customers at contracted rates separate from other contracted services, or at retail prices. Revenue from fuel services is recognized when fuel is delivered to customers.
Cost of fuel services includes the direct costs associated with providing our customers with fuel. These costs include fuel, salaries and employee-related costs of fuel island attendants and depreciation of our fueling facilities and equipment.
Significant Judgments and Estimates
We allocate the contract consideration from our ChoiceLease arrangements between the lease and maintenance components based on the relative stand-alone selling prices of each of those services. We do not sell the lease component of our ChoiceLease product offering on a stand-alone basis, therefore significant judgment is required to determine the stand-alone selling price of the lease component. We sell maintenance services separately through our SelectCare arrangements.
For the lease component, we estimate the stand-alone selling price using the projected cash outflows related to the underlying leased vehicle, net of the estimated disposal proceeds, and a certain targeted return considering our weighted average cost of capital. For the non-lease component of the contract, we estimate the stand-alone selling price of the maintenance component using an expected cost-plus margin approach. The expected costs are based on our history of providing maintenance services in our ChoiceLease arrangements. The margin is based on the historical margin percentages for our full service maintenance contracts in the SelectCare product line, as the maintenance performance obligation in those contracts is similar to our ChoiceLease arrangements.
Our SCS and DTS contracts often include promises to transfer multiple services to a customer. Judgment is required to determine whether each service is considered distinct and accounted for as a separate performance obligation, or accounted for together as a significant integrated service and recognized over time. Our SCS and DTS services provided within a contract depend on a significant level of integration and interdependency between the services and are generally considered integrated arrangements with revenue recognized as the interdependent services are delivered.
Contract Balances
We record a receivable related to revenue recognized when we have an unconditional right to invoice. We do not have material contract assets as we generally invoice customers as we perform services. We have determined our contracts do not include a significant financing component as the period between the receipt of customer payment and the transfer of service to the customer is less than a year.
Our contract liabilities consist of deferred revenue, which primarily relates to payments received or due in advance of performance for the maintenance services component of our ChoiceLease product. Changes in contract liabilities are due to the
65
RYDER SYSTEM, INC. AND SUBSIDIARIES
NOTES TO CONSOLIDATED FINANCIAL STATEMENTS — (Continued)
collection of cash or the satisfaction of our performance obligation under the contract. Refer to Note 4, "Revenue," for further information.
Costs to Obtain and Fulfill a Contract
Our incremental direct costs of obtaining and fulfilling a contract primarily consist of sales commissions and contract origination costs. For SCS and DTS contracts, these costs are capitalized and amortized on a straight-line basis over the period of contract performance or the expected duration of the customer relationship, if renewals are expected. For ChoiceLease contracts, capitalized sales commission are allocated and amortized based on the same pattern as the revenue is recognized for the underlying lease or non-lease components of the contract; generally on a straight-line basis for the lease component and consistent with the estimated pattern of maintenance costs for the non-lease component.
The incremental costs to obtain and fulfill a contract are included in “Sales-type leases and other assets” in the Consolidated Balance Sheets. Costs are primarily amortized in “Selling, general and administrative expenses” in the Consolidated Statements of Earnings over the expected period of benefit. Refer to Note 4, "Revenue," for further discussion.
Allowance for Credit Losses and Other
We maintain an allowance for credit losses and billing adjustments related to certain discounts and other customer concessions. Amounts are charged against the allowance when the receivable is determined to be uncollectible. Increases and decreases to the allowance are recorded to earnings in the period determined.
When a business relationship with a customer is initiated, we evaluate collectability from the customer and it is continuously monitored as services are provided. We have a credit rating system based on a combination of internally developed standards and ratings provided by third parties. Our credit rating system, along with monitoring for delinquent payments, allows us to make decisions as to whether collectability is probable at the onset of the relationship and subsequently as we offer services. Factors considered during this process include historical payment trends, industry risks, liquidity of the customer, years in business, judgments, liens, and bankruptcies. Payment terms vary by contract type, although typical terms include a requirement of payment within 10 to 45 days.
Leases
Leases as Lessor
We lease revenue earning equipment to customers for periods generally ranging from three to seven years for trucks and tractors and up to ten years for trailers. We determine if an arrangement is or contains a lease at inception. The standard lease agreement for revenue earning equipment provides both parties the right to terminate; therefore, we evaluate whether the lessee is reasonably certain to exercise the termination option in order to determine the appropriate lease term. If we terminate, the customer has the right (but not obligation) to purchase the vehicle. If the customer terminates, we have the option to require the customer to purchase the vehicle or pay a termination penalty. We also rent revenue earning equipment to customers on a short-term basis, from one day up to one year in length. From time to time, we may also lease facilities to third parties. The majority of our leases are classified as operating leases. However, some of our revenue earning equipment leases are classified as sales-type leases. Refer to Note 6, "Revenue Earning Equipment, Net" for further information on our estimate of residual values of revenue earning equipment which impact our sales-type leases.
Leases as Lessee
We primarily lease facilities, revenue earning equipment and material handling equipment from third parties. We determine if an arrangement is or contains a lease at inception. Operating lease right-of-use (ROU) assets, which represent our right to use an underlying asset for the lease term, and operating lease liabilities are recognized based on the present value of lease payments over the lease term at commencement date. As most of our leases do not provide an implicit rate of return, we use our incremental borrowing rate based on the information available at commencement date in determining the present value of lease payments. We use the implicit rate when readily determinable. Operating lease ROU assets exclude lease incentives received. We pay variable lease charges related to property taxes, insurance and maintenance as well as changes in CPI for leased facilities; usage of revenue earning equipment, automated washing machines, vehicles and office equipment; and hours of operation for material handling equipment. For leases with a term of 12 months or less, with the exception of our real estate leases, we do not recognize a ROU asset or liability and recognize lease payments in our income statement on a straight-line basis over the lease term and variable lease payments in the period in which the obligation for those payments is incurred.
66
RYDER SYSTEM, INC. AND SUBSIDIARIES
NOTES TO CONSOLIDATED FINANCIAL STATEMENTS — (Continued)
Lease terms for facilities are generally three to five years with one or more five-year renewal options and the lease terms for revenue earning equipment, material handling equipment, automated washing machines, vehicles and office equipment typically range from three to seven years with no extension options. Certain of our material handling equipment and revenue earning equipment leases have residual value guarantees. For purposes of calculating operating lease ROU assets and operating lease liabilities, lease terms may be deemed to include options to extend or terminate the lease when it is reasonably certain that we will exercise that option. None of our leasing arrangements contain restrictive financial covenants. Lease expense is primarily included in "Cost of services" in the Consolidated Statements of Earnings. For amounts capitalized in the Consolidated Balance Sheets, finance lease ROU assets are included in "Operating property and equipment, net" and "Revenue earning equipment, net." Current operating and finance lease liabilities are included in "Accrued expenses and other current liabilities" and "Short-term debt and current portion of long-term debt," respectively. Noncurrent operating and finance lease liabilities are included in "Other non-current liabilities" and "Long-term debt," respectively. Refer to Note 12, "Leases," for additional information.
Revenue Earning Equipment, Operating Property and Equipment, and Depreciation
Revenue earning equipment, comprised of vehicles, and operating property and equipment are initially recorded at cost inclusive of vendor rebates. Revenue earning equipment and operating property and equipment recognized as finance leases are initially recorded at the lower of the present value of the lease payments to be made over the lease term or fair value. Vehicle repairs and maintenance that extend the life or increase the value of a vehicle are capitalized, whereas ordinary repairs and maintenance (including tire replacement or repair) are expensed as incurred. Direct costs incurred in connection with developing or obtaining internal-use software are capitalized. Costs incurred during the preliminary stage of a software development project, as well as maintenance and training costs, are expensed as incurred.
Leasehold improvements are depreciated over the shorter of their estimated useful lives or the term of the related lease. If a substantial additional investment is made in a leased property during the term of the lease, we re-evaluate the lease term to determine whether the investment, together with any penalties related to non-renewal, would constitute an economic penalty such that the renewal appears to be reasonably assured.
Depreciation is computed using the straight-line method on all depreciable assets. Depreciation expense has been recognized depending on the nature of the related asset. We periodically review and adjust depreciation expense prospectively reflecting changes in the estimated residual values and useful lives of revenue earning equipment. We routinely dispose of used revenue earning equipment as part of our FMS business. Refer to Note 6, “Revenue Earning Equipment, Net” for more information. Gains and losses on sales of operating property and equipment are reflected in “Miscellaneous income, net” in the Consolidated Statements of Earnings.
Goodwill and Other Intangible Assets
Goodwill and other intangible assets with indefinite useful lives are not amortized, but rather, are tested for impairment at least annually as of October 1 of each year, or more frequently if events or circumstances indicate the carrying value of goodwill may be impaired. In evaluating goodwill for impairment, we have the option to first assess qualitative factors to determine whether further impairment testing is necessary, such as macroeconomic conditions, changes in our industry and the markets in which we operate, and our market capitalization as well as our reporting units' historical and expected future financial performance.
If we conclude that it is more likely than not that a reporting unit's fair value is less than its carrying value or we bypass the optional qualitative assessment, recoverability is assessed by comparing the fair value of the reporting unit with its carrying amount. If a reporting unit's carrying value exceeds its fair value, we would recognize a goodwill impairment loss for the amount by which the carrying amount of a reporting unit exceeds its fair value, not to exceed the total amount of goodwill allocated to that reporting unit.
Our estimate of fair value for reporting units is determined based on a combination of a market and an income approach. Under the market approach, we use a selection of comparable publicly-traded companies that correspond to the reporting unit to derive a market-based multiple. Under the income approach, the fair value of the reporting unit is estimated based on the discounted present value of the projected future cash flows. Rates used to discount cash flows are dependent upon interest rates and the cost of capital based on our industry and capital structure, adjusted for equity and size risk premiums based on market capitalization. Estimates of future cash flows are dependent on our knowledge and experience about past and current events and
67
RYDER SYSTEM, INC. AND SUBSIDIARIES
NOTES TO CONSOLIDATED FINANCIAL STATEMENTS — (Continued)
significant judgments and assumptions about conditions we expect to exist, including revenue growth rates, margins, long-term growth rates, capital requirements, proceeds from the sale of used vehicles, the ability to utilize our tax net operating losses, and the discount rate. Our estimates of cash flows are also based on historical and future operating performance, economic conditions and actions we expect to take.
There are inherent uncertainties related to these factors and management’s judgment in applying them to the analysis of goodwill impairment. It is possible that assumptions underlying the impairment analysis will change in such a manner that impairment in value may occur in the future.
Indefinite-lived intangible assets, consisting of our trade name, are assessed for impairment when circumstances indicate that the carrying amount may not be recoverable. The assessment is consistent with the process used to evaluate goodwill impairment. Intangible assets with finite lives are amortized over their respective estimated useful lives. Identifiable intangible assets that are subject to amortization are evaluated for impairment as described below.
Impairment of Long-Lived Assets Other than Goodwill and Indefinite-Lived Intangible Assets
Long-lived assets held and used, including revenue earning equipment, operating property and equipment, and intangible assets with finite lives, are tested for recoverability when circumstances indicate that the carrying amount of assets may not be recoverable. Recoverability of long-lived assets is evaluated by comparing the carrying value of an asset or asset group to the undiscounted future operating cash flows (excluding interest charges) expected to be generated by the asset or asset group. If these comparisons indicate that the carrying value of the asset or asset group is not recoverable, an impairment loss is recognized for the amount by which the carrying value of the asset or asset group exceeds its estimated fair value.
Self-Insurance Accruals
We retain a portion of the accident risk under vehicle liability, workers’ compensation and other insurance programs. Under our insurance programs, we retain the risk of loss under such insurance programs in various amounts, generally up to $3 million on a per occurrence basis through September 30, 2025. Effective October 1, 2025, our risk of loss for vehicle liability increased to $10 million per occurrence. We continue to maintain various insurance structures, which provide aggregate limits on exposure, and excess insurance policies that fully insure us up to maximum limits, with a diverse group of commercial insurers to limit our exposure on losses above self-insured retentions. Self-insurance accruals are based primarily on an actuarial estimated, undiscounted cost of claims, which includes claims incurred but not reported. Historical loss development factors are utilized to project the future development of incurred losses, and these amounts are adjusted based upon actual claim experience and settlements. Changes in the actuarial estimates of these liabilities are charged or credited to earnings in the period determined. Amounts estimated to be paid within the next year have been classified as “Accrued expenses and other current liabilities” with the remainder included in “Other non-current liabilities” in the Consolidated Balance Sheets.
We also maintain additional insurance at certain amounts in excess of our respective underlying retention. Amounts recoverable from insurance companies are not offset against the related liability as our insurance policies do not extinguish or provide legal release from the obligation to make payments related to such risk-related losses. Amounts expected to be received within the next year from insurance companies have been included within “Receivables, net” with the remainder included in “Sales-type leases and other assets” and are recognized only when realization of the claim for recovery is considered probable.
Income Taxes
Provision for income taxes is based on reported earnings before income taxes. Deferred income taxes are recognized for the future tax effects of temporary differences between the financial statement carrying amounts of existing assets and liabilities and their respective tax bases, using tax rates in effect for the years in which the differences are expected to reverse. We have elected to account for the tax effects of the global intangible low-taxed income provision as a current period cost.
Valuation allowances are recognized to reduce deferred income tax assets to the amount that is more likely than not to be realized. In assessing the likelihood of realization, we consider estimates of future sources of taxable income. We calculate our current and deferred income tax position based on estimates and assumptions that could differ from the actual results reflected in income tax returns filed in subsequent years. Adjustments based on filed returns are recorded when identified.
We believe our measurement of liabilities for uncertain tax positions is reasonable, however, assurances cannot be given that the final outcome of these matters will be consistent with the historical income tax provisions and accruals. If a liability is ultimately deemed unnecessary, the liability will be reversed, and a tax benefit will be recognized in that period. Conversely, if additional liability is necessary, a tax provision will be recorded when that determination is made. If additional taxes are
68
RYDER SYSTEM, INC. AND SUBSIDIARIES
NOTES TO CONSOLIDATED FINANCIAL STATEMENTS — (Continued)
assessed as a result of an audit or litigation, there could be a material effect on our income tax provision and net income in the period or periods for which that determination is made.
Interest and penalties related to income tax exposures are recognized as incurred and included in "Provision for income taxes” in the Consolidated Statements of Earnings. Accruals for income tax exposures, including penalties and interest, expected to be settled within the next year are included in “Accrued expenses and other current liabilities”.
Foreign Currency Translation
Our foreign operations generally use local currency as their functional currency. Assets and liabilities of these operations are translated at the exchange rates in effect on the balance sheet date. Items in the Consolidated Statements of Earnings are translated at the average exchange rates. The related translation adjustments are recorded in “Accumulated other comprehensive loss” in the Consolidated Balance Sheets. Gains and losses resulting from foreign currency transactions are recognized in “Miscellaneous income, net” in the Consolidated Statements of Earnings.
Share-Based Compensation
The fair value of stock option awards and unvested restricted stock unit (RSU or RSUs) awards to employees are expensed on a straight-line basis over the vesting period of the awards. RSUs granted to the board of directors are expensed over a one year period when they are granted. Windfall tax benefits and tax shortfalls are charged directly to income tax expense.
Defined Benefit Pension and Postretirement Benefit Plans
The funded status of our defined benefit pension plans and postretirement benefit plans are recognized in the Consolidated Balance Sheets. The funded status is measured as the difference between the fair value of plan assets and the benefit obligation. Overfunded plans, with the fair value of plan assets exceeding the benefit obligation, are aggregated and reported as a pension asset in Sales-type leases and other assets. Underfunded plans, with the benefit obligation exceeding the fair value of plan assets, are aggregated and reported as a pension and postretirement benefit liability in Other non-current liabilities.
The current portion of pension and postretirement benefit liabilities represents the actuarial present value of benefits payable within the next year exceeding the fair value of plan assets (if funded), measured on a plan-by-plan basis. These liabilities are recognized in “Accrued expenses and other current liabilities” in the Consolidated Balance Sheets.
Prior service costs and actuarial gains and losses are recognized in “Accumulated other comprehensive loss” in the Consolidated Balance Sheets and are subsequently amortized as a component of pension and postretirement benefit expense generally over the remaining life expectancy.
The measurement of benefit obligations and pension and postretirement benefit expense is based on estimates and assumptions. These valuations reflect the terms of the plans and use participant-specific information such as compensation, age and years of service, as well as certain assumptions, including estimates of discount rates, expected return on plan assets, rate of compensation increases, interest rates and mortality rates.
Fair Value Measurements
We carry various assets and liabilities at fair value in the Consolidated Balance Sheets, including vehicles held for sale, pension assets and investments held in Rabbi Trust.
Fair value measurements are classified based on the following fair value hierarchy:
Level 1
Quoted prices (unadjusted) in active markets for identical assets or liabilities that we have the ability to access at the measurement date. An active market for the asset or liability is a market in which transactions for the asset or liability occur with sufficient frequency and volume to provide pricing information on an ongoing basis.
Level 2
Observable inputs other than Level 1 prices such as quoted prices for similar assets or liabilities; quoted prices in markets that are not active; or model-derived valuations or other inputs that are observable or can be corroborated by observable market data for substantially the full term of the assets or liabilities.
Level 3
Unobservable inputs for the asset or liability. These inputs reflect our own assumptions about the assumptions a market participant would use in pricing the asset or liability.
69
RYDER SYSTEM, INC. AND SUBSIDIARIES
NOTES TO CONSOLIDATED FINANCIAL STATEMENTS — (Continued)
When available, we use unadjusted quoted market prices to measure fair value and classify such measurements within Level 1. If quoted prices are not available, fair value is based upon model-driven valuations that use current market-based or independently sourced market parameters such as interest rates and currency rates. Items valued using these models are classified according to the lowest level input or value driver that is significant to the valuation.
The carrying amounts reported in the Consolidated Balance Sheets for Cash and cash equivalents, Receivables, net and Accounts payable approximate fair value due to the immediate or short-term maturities of these financial instruments. Revenue earning equipment held for sale is measured at fair value on a nonrecurring basis and is stated at the lower of carrying amount or fair value less costs to sell. Investments held in Rabbi Trust, pension assets, and derivatives are carried at fair value on a recurring basis. Refer to Note 19, "Employee Benefit Plans," for further information regarding pension assets.
2. RECENT ACCOUNTING PRONOUNCEMENTS
In December 2023, the FASB issued ASU No. 2023-09, Improvements to Income Tax Disclosures (Topic 740). The amendments expand annual tax disclosure requirements, including additional disaggregation in the effective tax rate reconciliation and cash taxes paid. We adopted the new standard effective January 1, 2025, and applied the amendments retrospectively. This ASU did not impact our consolidated financial position, results of operations, or cash flows.
In November 2024, the FASB issued ASU No. 2024-03, Income Statement - Reporting Comprehensive Income - Expense Disaggregation Disclosures (Subtopic 220-40). The amendments provide for more detailed disaggregation of expenses. The standard is effective for fiscal years beginning in 2027, with early adoption permitted. We are currently evaluating the disclosure impact of the adoption of this update. This ASU does not impact our consolidated financial position, results of operations, or cash flows.
In July 2025, the FASB issued ASU No. 2025-05, Financial Instruments - Credit Losses (Topic 326). The amendments provides a practical expedient for entities to assume current conditions as of a balance sheet date do not change for the remaining life of the financial assets. We adopted the practical expedient prospectively on December 31, 2025, and this ASU did not impact our consolidated financial position, results of operations or cash flows.
3.SEGMENT REPORTING
Our operating segments are aggregated into reportable business segments based upon similar economic characteristics, products, services, customers and delivery methods.
Our primary measurement of segment financial performance, defined as “Earnings from continuing operations before income taxes” (Segment EBT), includes an allocation of costs from Central Support Services (CSS) and excludes Non-operating pension costs, net, Intangible amortization expense, and certain other items as discussed in Note 20, "Other Items Impacting Comparability." The objective of the Segment EBT measurement is to provide clarity on the profitability of each business segment and, ultimately, to hold leadership of each business segment accountable for their allocated share of CSS costs. CSS represents those costs incurred to support all business segments, including information technology, finance, marketing, human resources, legal, and safety. These costs are allocated based on various methods, including resource utilization, personnel supported and utilization-related metrics. Certain costs are not attributable to any segment and remain unallocated in CSS, including costs for investor relations, public affairs and certain executive compensation.
Our FMS segment leases revenue earning equipment and provides fuel, maintenance and other ancillary services to the SCS and DTS segments. Inter-Segment EBT allocated to SCS and DTS includes earnings related to equipment used to provide services to SCS and DTS customers. Segment EBT related to inter-segment equipment and services billed to SCS and DTS customers (Equipment Contribution) are included in both FMS and the segment that served the customer and then eliminated upon consolidation (presented as “Eliminations”).
70
RYDER SYSTEM, INC. AND SUBSIDIARIES
NOTES TO CONSOLIDATED FINANCIAL STATEMENTS - (Continued)
The following table set forth financial information regularly provided and reviewed by our Chair and Chief Executive Officer (our Chief Operating Decision Maker "CODM"), to analyze financial performance, make strategic decisions and allocate resources. The table also provides a reconciliation between Segment EBT and Earnings from continuing operations before income taxes (in millions):
2025
FMS
SCS
DTS
Elimination(1)
Total
Revenue
$
5,845
$
5,459
$
2,343
$
(982)
$
12,665
Direct operating costs
4,548
4,853
2,178
Used vehicle sales, net
(22)
—
—
Other segment items (2)
818
251
25
Segment EBT
$
501
$
355
$
140
$
(131)
865
Unallocated Central Support Services
(83)
Intangible amortization expense (3)
(52)
Non-operating pension costs, net (4)
(36)
Other items impacting comparability, net (5)
(9)
Earnings from continuing operations before income taxes
$
685
2024
Revenue
$
5,888
$
5,300
$
2,446
$
(998)
$
12,636
Direct operating costs
4,638
4,735
2,270
Used vehicle sales, net
(72)
—
—
Other segment items (2)
806
233
51
Segment EBT
$
516
$
332
$
125
$
(134)
839
Unallocated Central Support Services
(71)
Intangible amortization expense (3)
(53)
Non-operating pension costs, net (4)
(41)
Other items impacting comparability, net (5)
(13)
Earnings from continuing operations before income taxes
$
661
2023
Revenue
$
5,930
$
4,875
$
1,785
$
(807)
$
11,783
Direct operating costs
4,651
4,420
1,634
Used vehicle sales, net
(194)
—
—
Other segment items (2)
808
224
30
Segment EBT
$
665
$
231
$
121
$
(95)
922
Unallocated Central Support Services
(72)
Intangible amortization expense (3)
(35)
Non-operating pension costs, net (4)
(40)
Other items impacting comparability, net (5)
(157)
Earnings from continuing operations before income taxes
$
618
_______________
(1)Represents the intercompany revenues in our FMS business segment and Inter-Segment EBT.
(2)Other segment items for each reportable segment include indirect costs and also include Equipment Contribution for SCS and DTS.
(3)Refer to Note 9, "Intangible Assets, Net," for a discussion on this item.
(4)Refer to Note 19, "Employee Benefit Plans," for a discussion on this items.
(5)Refer to Note 20, “Other Items Impacting Comparability,” for a discussion of items excluded from our primary measure of segment performance.
71
RYDER SYSTEM, INC. AND SUBSIDIARIES
NOTES TO CONSOLIDATED FINANCIAL STATEMENTS - (Continued)
The following table sets forth depreciation expense and other non-cash charges, net, interest expense and cash paid for the purchase of property and revenue earning equipment for the years presented as provided to the CODM for each of our business segments. Total assets of our business segments are not provided to the CODM.
Depreciation expense and other non-cash charges, net (1)
Interest expense
Purchases of property and revenue earning equipment
(in millions)
2025
2024
2023
2025
2024
2023
2025
2024
2023
FMS
$
1,762
$
1,775
$
1,677
$
377
$
362
$
292
$
1,963
$
2,616
$
3,085
SCS
401
371
366
19
17
8
154
50
117
DTS
18
19
11
8
8
(3)
3
1
1
CSS
59
63
31
—
(1)
(1)
15
16
31
Total
$
2,240
$
2,228
$
2,085
$
404
$
386
$
296
$
2,135
$
2,683
$
3,234
_______________
(1)Other non-charges, net primarily includes operating lease right-of-use (ROU) assets amortization.
Geographic Information
December 31,
(In millions)
2025
2024
Long-lived assets:
United States
$
9,478
$
9,758
Canada
605
563
Mexico
83
69
Total
$
10,166
$
10,390
4.REVENUE
Disaggregation of Revenue
Primary Geographical Markets
The following tables disaggregate our revenue recognized by primary geographical market by our business segments.
2025
(In millions)
FMS
SCS
DTS
Eliminations
Total
United States
$
5,548
$
4,830
$
2,343
$
(939)
$
11,782
Canada
297
294
—
(43)
548
Mexico
—
335
—
—
335
Total revenue
$
5,845
$
5,459
$
2,343
$
(982)
$
12,665
2024
(In millions)
FMS
SCS
DTS
Eliminations
Total
United States
$
5,585
$
4,697
$
2,446
$
(955)
$
11,773
Canada
303
278
—
(43)
538
Mexico
—
325
—
—
325
Total revenue
$
5,888
$
5,300
$
2,446
$
(998)
$
12,636
72
RYDER SYSTEM, INC. AND SUBSIDIARIES
NOTES TO CONSOLIDATED FINANCIAL STATEMENTS - (Continued)
2023
(In millions)
FMS
SCS
DTS
Eliminations
Total
United States
$
5,616
$
4,295
$
1,785
$
(764)
$
10,932
Canada
314
267
—
(43)
538
Mexico
—
313
—
—
313
Total revenue
$
5,930
$
4,875
$
1,785
$
(807)
$
11,783
Product Line
Our FMS revenue disaggregated by line of service is as follows:
(In millions)
2025
2024
2023
ChoiceLease
$
3,510
$
3,446
$
3,181
Commercial rental
937
976
1,178
SelectCare and other
680
694
694
Fuel services revenue
718
772
877
Fleet Management Solutions
$
5,845
$
5,888
$
5,930
Industry
We have a diversified portfolio of customers across a full array of transportation and logistics solutions and across many industries. We believe this will help to mitigate the impact of adverse downturns in specific sectors of the economy. Our portfolio of ChoiceLease and commercial rental customers, as well as our DTS business, is not concentrated in any one particular industry or geographic region.
Our SCS business segment included revenue from the following industries:
(In millions)
2025
2024
2023
Omnichannel retail
$
1,878
$
1,726
$
1,757
Automotive
1,542
1,580
1,600
Consumer packaged goods
1,213
1,182
965
Industrial and other
826
812
553
Total SCS revenue
$
5,459
$
5,300
$
4,875
Lease & Related Maintenance and Rental Revenue
The non-lease revenue from maintenance services related to our ChoiceLease product is recognized in "Lease & related maintenance and rental revenue" in the Consolidated Statements of Earnings. We recognized $1.0 billion in 2025, $972 million in 2024 and $963 million in 2023.
Deferred Revenue
The following table includes the changes in deferred revenue due to the collection and deferral of cash or the satisfaction of our performance obligation under the contract:
(In millions)
2025
2024
2023
Balance as of beginning of period
$
600
$
545
$
544
Recognized as revenue during period from beginning balance
(159)
(174)
(166)
Consideration deferred during period, net
240
231
168
Foreign currency translation adjustment and other
3
(2)
(1)
Balance as of end of period
$
684
$
600
$
545
73
RYDER SYSTEM, INC. AND SUBSIDIARIES
NOTES TO CONSOLIDATED FINANCIAL STATEMENTS - (Continued)
Contracted Not Recognized Revenue
Revenue allocated to remaining performance obligations represents contracted revenue that has not yet been recognized (contracted not recognized revenue). Contracted not recognized revenue was $3.4 billion and $3.1 billion as of December 31, 2025 and 2024, respectively, and primarily includes deferred revenue and amounts for full service ChoiceLease maintenance revenue that will be recognized as revenue in future periods as we provide maintenance services to our customers. Contracted not recognized revenue excludes (1) variable consideration as it is not included in the transaction price consideration allocated at contract inception, (2) revenues from the lease component of our ChoiceLease product and all the revenue from the commercial rental product, (3) revenues from contracts with an original duration of one year or less, including SelectCare contracts, and (4) revenue from SCS, DTS and other contracts where there are remaining performance obligations when we have the right to invoice but the revenue to be recognized in the future corresponds directly with the value to be delivered to the customer.
Sales Commissions and Contract Origination Costs
The sales commission and setup costs capitalized as of the period ended and the amortization expense for the years ended were as follows:
December 31,
Amortization expense
(In millions)
2025
2024
2025
2024
2023
Sales commissions
$
102
$
109
$
41
$
46
$
47
Contract origination costs
$
83
$
75
$
31
$
34
$
30
5.RECEIVABLES, NET
December 31,
(In millions)
2025
2024
Trade
$
1,667
$
1,634
Sales-type leases
184
161
Other, primarily warranty and insurance
81
104
1,932
1,899
Allowance for credit losses and other
(35)
(38)
Receivables, net
$
1,897
$
1,861
The following table provides a reconciliation of our allowance for credit losses and other:
(In millions)
2025
2024
Balance as of beginning of period
$
38
$
42
Changes to provisions for credit losses
27
26
Write-offs and other
(30)
(30)
Balance as of end of period
$
35
$
38
6.REVENUE EARNING EQUIPMENT, NET
(In millions)
Estimated Useful Lives
December 31, 2025
December 31, 2024
Cost
Accumulated Depreciation
Net
Cost
Accumulated Depreciation
Net
Held for use:
(In years)
Trucks
3 — 7
$
6,183
$
(2,216)
$
3,967
$
6,252
$
(2,210)
$
4,042
Tractors
4 — 7.5
6,567
(2,843)
3,724
6,721
(2,739)
3,982
Trailers and other
9.5 — 12
1,754
(723)
1,031
1,695
(671)
1,024
Held for sale
856
(680)
176
781
(623)
158
Total
$
15,360
$
(6,462)
$
8,898
$
15,449
$
(6,243)
$
9,206
74
RYDER SYSTEM, INC. AND SUBSIDIARIES
NOTES TO CONSOLIDATED FINANCIAL STATEMENTS - (Continued)
Total depreciation expense related to revenue earning equipment primarily used in our FMS segment was $1.5 billion in 2025, 2024 and 2023.
Residual Value Estimate Changes
We periodically review and adjust, as appropriate, the estimated residual values of existing revenue earning equipment for the purposes of recording depreciation expense. Reductions in estimated residual values will increase depreciation expense over the remaining useful life of the vehicle. Conversely, an increase in estimated residual values will decrease depreciation expense over the remaining useful life of the vehicle. Our review of the estimated residual values of revenue earning equipment is based on vehicle class (generally subcategories of trucks, tractors and trailers by weight and usage), historical and current market prices, third-party expected future market prices, expected lives of vehicles, and expected sales in the wholesale or retail markets, among other factors. A variety of factors, many of which are outside of our control, could cause residual value estimates to differ from actual used vehicle sales pricing, such as changes in supply and demand of used vehicles; volatility in market conditions; changes in vehicle technology; competitor pricing; regulatory requirements; wholesale market prices; customer requirements and preferences; and changes in underlying assumption factors. We have disciplines related to the management and maintenance of our vehicles designed to manage the risk associated with the residual values of our revenue earning equipment.
Effective January 1, 2025, we made an immaterial adjustment to certain vehicles' estimated residual values based on this review. In 2024 and 2023, we did not adjust the estimated residual values of existing revenue earning equipment.
Used Vehicle Sales and Valuation Adjustments
Revenue earning equipment held for sale is stated at the lower of carrying amount or fair value less costs to sell. Losses on vehicles held for sale for which carrying values exceed fair value, which we refer to as "valuation adjustments," are recognized at the time they are deemed to meet the held for sale criteria and are presented within "Used vehicle sales, net" in the Consolidated Statements of Earnings. For revenue earning equipment held for sale, we stratify our fleet by vehicle type (trucks, tractors and trailers), weight class, age and other relevant characteristics and create classes of similar assets for analysis purposes. For revenue earning equipment held for sale, fair value was determined based upon recent market prices obtained from our own sales experience for each class of similar assets and vehicle condition, if available, or third-party market pricing. In addition, we also consider expected declines in market prices, as well as, forecasted sales channel mix (retail/wholesale) when valuing the vehicles held for sale.
The following table presents our assets held for sale that are measured at fair value on a nonrecurring basis and considered a Level 3 fair value measurement:
December 31,
Losses from Valuation Adjustments
(In millions)
2025
2024
2025
2024
2023
Revenue earning equipment held for sale:
Trucks
$
26
$
10
$
21
$
14
$
6
Tractors
29
27
19
12
9
Trailers and other
5
3
7
5
5
Total assets at fair value
$
60
$
40
$
47
$
31
$
20
The table above reflects only the revenue earning equipment held for sale where net book values exceeded fair values and valuation adjustments were recorded. The net book value of assets held for sale that were less than fair value was $116 million and $118 million as of December 31, 2025 and 2024, respectively.
The components of Used vehicle sales, net were as follows:
(In millions)
2025
2024
2023
Gains on vehicle sales, net
$
(69)
$
(103)
$
(216)
Losses from valuation adjustments
47
31
20
Used vehicle sales, net
$
(22)
$
(72)
$
(196)
75
RYDER SYSTEM, INC. AND SUBSIDIARIES
NOTES TO CONSOLIDATED FINANCIAL STATEMENTS - (Continued)
7.OPERATING PROPERTY AND EQUIPMENT, NET
Estimated Useful Lives (In years)
December 31,
(Dollars in millions)
2025
2024
Land
—
$
233
$
230
Buildings and improvements
1 — 40
1,156
1,124
Machinery and equipment
2 — 10
1,373
1,322
Other
1 — 30
211
164
2,973
2,840
Accumulated depreciation
(1,705)
(1,656)
Operating property and equipment, net
$
1,268
$
1,184
(In millions)
2025
2024
2023
Operating property and equipment depreciation expense (1)
$
217
$
203
$
228
————————————
(1)During 2023, we recorded asset impairments of $35 million related to a SCS customer bankruptcy.
8.GOODWILL
The carrying amount of goodwill attributable to each business segment with changes therein was as follows:
(In millions)
FMS
SCS
DTS
Total
Balance as of January 1, 2024
$
245
$
654
$
41
$
940
Acquisitions (1)
15
18
186
219
Foreign currency translation adjustment
—
(1)
—
(1)
Balance as of December 31, 2024
260
671
227
1,158
Acquisitions (1)
(9)
1
2
(6)
Balance as of December 31, 2025
$
251
$
672
$
229
$
1,152
_______________
(1)Refer to Note 23, "Acquisitions," for additional information.
(1)Includes $116 million of customer relationships related to the acquisition of CLH Parent Corporation (Cardinal Logistics) in 2024. Refer to Note 23, "Acquisitions," for additional information.
The Ryder trade name has been identified as having an indefinite useful life. We recognized intangible asset amortization expense of $52 million in 2025, of which $53 million is associated with finite lived intangible assets, partially offset by $1 million relating to the amortization of unfavorable lease assets recorded in Operating lease right-of-use assets in the
76
RYDER SYSTEM, INC. AND SUBSIDIARIES
NOTES TO CONSOLIDATED FINANCIAL STATEMENTS - (Continued)
Consolidated Balance Sheets. In 2024, we recognized intangible assets amortization expense of $53 million, of which $51 million is associated with finite lived intangible assets and $2 million relates to favorable lease asset amortization. The future amortization expense for each of the five succeeding years related to all intangible assets that are currently reported in the Consolidated Balance Sheets is estimated to range from $45 - $52 million per year for 2026 - 2030.
10.ACCRUED EXPENSES AND OTHER LIABILITIES
December 31, 2025
December 31, 2024
(In millions)
Accrued expenses and other current liabilities
Other non-current liabilities
Total
Accrued expenses and other current liabilities
Other non-current liabilities
Total
Operating lease liabilities (1)
$
303
$
732
$
1,035
$
302
$
804
$
1,106
Deferred revenue
161
523
684
160
440
600
Self-insurance
198
356
554
193
349
542
Salaries and wages
226
—
226
197
—
197
Deferred compensation
11
145
156
7
127
134
Pension and other employee benefits
25
101
126
26
156
182
Operating taxes
124
—
124
134
—
134
Deposits, mainly from customers
67
—
67
67
—
67
Interest
60
—
60
65
—
65
Other
95
66
161
172
78
250
Total
$
1,270
$
1,923
$
3,193
$
1,323
$
1,954
$
3,277
_____________________
(1) Refer to Note 12, "Leases," for further information.
Self-insurance accruals include vehicle liability, workers’ compensation, property damage, cargo, medical and dental, which comprise our self-insurance programs.
Changes to self-insurance accruals consisted of the following:
(In millions)
2025
2024
2023
Balance as of beginning of period
$
542
$
459
$
463
Additions charged to earnings
709
628
520
Employee contributions to medical and dental self-insurance plans
121
117
103
Claim payments and write-offs
(818)
(662)
(627)
Balance as of end of period
$
554
$
542
$
459
11.INCOME TAXES
One Big Beautiful Bill Act
On July 4, 2025, the One Big Beautiful Bill Act (OBBBA) was signed into law. OBBBA permanently reinstated 100% tax bonus depreciation, restored earnings before interest, taxes, depreciation and amortization as the basis for calculating the business interest expense limitation, restored immediate expensing for domestic research and experimental expenditures, and modified the Global Intangible Low-Taxed Income regime, among other items. OBBBA has multiple effective dates, with certain provisions effective in 2025, and others implemented through 2027. These changes reduced our annual U.S. federal cash tax liability by approximately $200 million in 2025 and had no material impact on our effective income tax rate.
77
RYDER SYSTEM, INC. AND SUBSIDIARIES
NOTES TO CONSOLIDATED FINANCIAL STATEMENTS - (Continued)
The components of "Earnings from continuing operations before income taxes" and the "Provision for income taxes" from continuing operations in the Consolidated Statements of Earnings were as follows:
(In millions)
2025
2024
2023
Earnings from continuing operations before income taxes
United States
$
576
$
555
$
479
Foreign
109
106
139
Total
$
685
$
661
$
618
Provision for income taxes
Current tax expense from continuing operations:
Federal
$
6
$
112
$
35
State
22
15
45
Foreign
26
24
17
54
151
97
Deferred tax expense (income) from continuing operations:
Federal
114
(13)
88
State
14
28
(8)
Foreign
2
6
35
130
21
115
Total
$
184
$
172
$
212
Federal, state, and foreign net operating losses were utilized to offset current income taxes payable resulting in tax benefits of $3 million, $10 million, and $56 million in 2025, 2024 and 2023, respectively.
A reconciliation of the federal statutory tax rate with the effective tax rate from continuing operations follows:
December 31, 2025
December 31, 2024
December 31, 2023
(Percentage of pre-tax earnings)
Amount
Percent
Amount
Percent
Amount
Percent
U.S. federal statutory tax rate
$
144
21.0
%
$
139
21.0
%
$
130
21.0
%
State income taxes, net of federal income tax effect (1)
32
4.7
%
37
5.6
%
31
5.0
%
Foreign tax effects
U.K. loss carryforward write-off
—
—
%
—
—
%
10
1.6
%
U.K. other
4
0.5
%
—
—
%
1
0.2
%
Canadian provincial taxes
9
1.4
%
9
1.4
%
10
1.7
%
Other foreign jurisdictions
(6)
(0.9)
%
(1)
(0.2)
%
2
0.3
%
Effect of cross-border tax laws
Global intangible low-taxed income
—
—
%
—
—
%
8
1.2
%
Tax credits
Foreign tax credit
—
—
%
(6)
(0.8)
%
(10)
(1.5)
%
Other
(3)
(0.4)
%
(3)
(0.5)
%
—
—
%
Nontaxable or nondeductible items
Currency translation adjustment
—
—
%
—
—
%
34
5.5
%
Other
4
0.5
%
1
0.2
%
(1)
(0.2)
%
Changes in unrecognized tax benefits
1
0.1
%
(6)
(0.8)
%
(2)
(0.3)
%
Other
(1)
(0.1)
%
2
0.1
%
(1)
(0.2)
%
Effective tax rate
$
184
26.8
%
$
172
26.0
%
$
212
34.3
%
_______________
(1)States that make up the majority (greater than 50 percent) of the tax effect in this category are: in 2025, TX, CA, IL, FL, PA, MI, NJ, and GA; in 2024, TX, CA, IL, FL, PA, GA, NJ, MI and IN; in 2023, TX, CA, IL, FL, PA and GA.
78
RYDER SYSTEM, INC. AND SUBSIDIARIES
NOTES TO CONSOLIDATED FINANCIAL STATEMENTS - (Continued)
A reconciliation of the income taxes paid, net of refunds by jurisdiction was as follows:
(In millions)
2025
2024
2023
U.S. federal
$
10
$
157
$
24
U.S. state & local
Texas
5
4
5
California
—
3
7
Illinois
—
2
7
New Jersey
3
1
2
Other
5
22
26
Total U.S. state & local
13
32
47
Foreign
Mexico
17
10
13
Canada
12
8
9
Other
—
—
3
Total foreign
29
18
25
Total income taxes paid, net of refunds
$
52
$
207
$
96
Deferred Income Taxes
The components of the net deferred income tax liability were as follows:
December 31,
(In millions)
2025
2024
Deferred income tax assets:
Self-insurance accruals
$
135
$
131
Operating lease liabilities (1)
262
282
Net operating loss carryforwards
53
33
Accrued compensation and benefits
117
102
Pension benefits
23
35
Deferred revenue
23
23
Interest expense limitation
8
75
Other
56
47
677
728
Valuation allowance
(14)
(12)
663
716
Deferred income tax liabilities:
Property and equipment basis differences
(2,058)
(1,993)
Operating right-of-use lease assets (1)
(253)
(268)
Intangible assets bases difference
(89)
(92)
Other
(55)
(20)
(2,455)
(2,373)
Net deferred income tax liability (2)
$
(1,792)
$
(1,657)
_______________
(1)Prior period amounts have been revised.
(2)Deferred tax assets of $16 million and $14 million have been included in "Sales-type leases and other assets" as of December 31, 2025 and 2024.
79
RYDER SYSTEM, INC. AND SUBSIDIARIES
NOTES TO CONSOLIDATED FINANCIAL STATEMENTS - (Continued)
Changes to the valuation allowance on deferred tax assets consisted of the following:
(In millions)
2025
2024
2023
Balance at January 1
$
12
$
87
$
88
Additions
2
—
—
Deductions
—
(75)
(1)
Balance as of December 31
$
14
$
12
$
87
As of December 31, 2025, we have a cumulative valuation allowance of $14 million against our deferred tax assets, a net increase of $2 million from the prior year. The $75 million decrease in 2024 is primarily due to the cessation of all business activities by a foreign subsidiary on December 27, 2024, which resulted in the write-off of the subsidiary's net operating loss deferred tax asset and the associated valuation allowance. The valuation allowance is subject to change in future years based on the availability of future sources of taxable income.
In 2025, we repatriated $40 million of current year earnings from our Canada subsidiaries with minimal tax cost. In 2024, we repatriated $14 million of current year earnings from our Mexico subsidiary with minimal tax cost. As of December 31, 2025, we continue to consider our U.K. earnings to no longer be indefinitely reinvested and determined that there was no impact to deferred taxes. We consider the undistributed earnings of our Mexico subsidiary generated through 2023 to be indefinitely reinvested. As of 2024, we no longer assert that the current year earnings of our Mexico subsidiary are indefinitely reinvested. We consider the undistributed earnings of our Canada subsidiary generated through 2024 to be indefinitely reinvested. During 2025, we no longer assert that current year earnings of our Canada subsidiary are indefinitely reinvested. The estimated taxes associated with the repatriation of these earnings are not material. Our remaining foreign jurisdictions are indefinitely reinvested.
Any future repatriations of unremitted earnings could be subject to additional federal, state and foreign income taxes, withholding taxes, and/or the tax impact of foreign currency exchange gains or losses. The amount of the unrecognized deferred tax liability associated with these undistributed foreign earnings is not practicable to determine due to the complexities associated with the hypothetical calculations used in evaluating whether we will maintain the indefinite reinvestment assertion on the remaining foreign subsidiaries.
Our carryforwards for net operating losses and tax benefits with the related valuation allowances were as follows:
December 31, 2025
December 31, 2024
(Dollars in millions)
Carryforwards (1)
Valuation Allowance
Net Carryforwards
Carryforwards (1)
Valuation Allowance
Net Carryforwards
Net operating losses and
tax benefits
U.S. Federal jurisdictions
(expires 2034 - 2037)
$
8
$
(2)
$
6
$
6
$
(3)
$
3
U.S. Federal jurisdictions (with no expiration)
25
—
25
11
—
11
U.S. State jurisdictions
(expires 2026 - 2045)
26
(1)
25
27
—
27
U.S. State jurisdictions
(with no expiration)
5
—
5
3
—
3
Foreign jurisdictions
(expires 2031 - 2043)
5
(5)
—
7
(7)
—
Foreign jurisdictions
(with no expiration)
5
(6)
(1)
4
(2)
2
Total carryforwards
$
74
$
(14)
$
60
$
58
$
(12)
$
46
_______________
(1)Net operating losses are shown before unrecognized tax benefits. State amounts presented net of federal benefits.
Amounts in the table may not be additive due to rounding.
80
RYDER SYSTEM, INC. AND SUBSIDIARIES
NOTES TO CONSOLIDATED FINANCIAL STATEMENTS - (Continued)
U.S. federal net operating loss deductions are limited to 80% of taxable income for losses generated in taxable years beginning after December 31, 2017. As of December 31, 2025, $14 million of our U.S. federal net operating loss carryforwards are subject to limitations under IRC Section 382.
Uncertain Tax Positions
In many cases, our uncertain tax positions are related to tax years that remain subject to examination by the relevant taxing authorities. The following table summarizes these open tax years by jurisdiction:
Jurisdiction
Open Tax Year
United States (Federal)
2019, 2022 - 2025
Canada
2013 - 2015, 2018 - 2025
Mexico
2020 - 2025
United Kingdom (discontinued operations)
2024 - 2025
Brazil (discontinued operations)
2021- 2025
The following table summarizes the activity related to unrecognized tax benefits (excluding the federal benefit received from state positions):
(In millions)
2025
2024
2023
Balance at January 1
$
26
$
32
$
34
Increases related to tax positions taken during the current year
1
2
2
Increases related to tax positions taken during prior years
7
—
—
Reductions due to lapse of applicable statutes of limitation
(7)
(8)
(4)
Total before interest and penalties at December 31
27
26
32
Interest and penalties
2
3
3
Balance at December 31
$
29
$
29
$
35
Of the total unrecognized tax benefits as of December 31, 2025, $25 million (net of the federal benefit on state issues) represents the amount of unrecognized tax benefits that, if recognized, would favorably affect the effective tax rate in future periods.
12.LEASES
Leases as Lessor
The components of revenue from leases were as follows:
(In millions)
2025
2024
2023
Operating leases
Lease income related to ChoiceLease (1)
$
1,606
$
1,551
$
1,483
Lease income related to commercial rental (2)
$
883
$
928
$
1,123
Sales-type leases
Interest income related to net investment in leases
$
90
$
75
$
56
Variable lease income excluding commercial rental (1) (2)
$
292
$
304
$
308
________________________
(1)In 2024, amounts have been revised.
(2)Lease income related to commercial rental includes both fixed and variable lease income. Variable lease income is approximately 15% of total commercial rental income based on management's internal estimates.
81
RYDER SYSTEM, INC. AND SUBSIDIARIES
NOTES TO CONSOLIDATED FINANCIAL STATEMENTS - (Continued)
The components of the net investment in sales-type leases, which are included in "Receivables, net" and "Sales-type leases and other assets" in the Consolidated Balance Sheets, were as follows:
December 31,
(In millions)
2025
2024
Net investment in the lease - lease payment receivable
$
860
$
818
Net investment in the lease - unguaranteed residual value in assets
54
49
914
867
Estimated loss allowance
(5)
(5)
Total
$
909
$
862
Maturities of sales-type lease receivables as of December 31, 2025, were as follows:
Years ending December 31,
(In millions)
2026
$
261
2027
225
2028
207
2029
159
2030
115
Thereafter
136
Total undiscounted cash flows
1,103
Present value of lease payments (recognized as lease receivables)
(860)
Difference between undiscounted cash flows and discounted cash flows
$
243
Operating lease payments expected to be received as of December 31, 2025, were as follows:
Years ending December 31,
(In millions)
2026
$
1,321
2027
1,059
2028
838
2029
641
2030
433
Thereafter
310
Total undiscounted cash flows
$
4,602
Leases as Lessee
The components of lease expense were as follows:
(In millions)
2025
2024
2023
Finance lease cost
Amortization of right-of-use-assets
$
37
$
20
$
15
Interest on lease liabilities
6
3
2
Operating lease cost
381
374
271
Short-term lease and other
13
8
10
Variable lease cost
64
54
50
Sublease income
(14)
(29)
(41)
Total lease cost
$
487
$
430
$
307
82
RYDER SYSTEM, INC. AND SUBSIDIARIES
NOTES TO CONSOLIDATED FINANCIAL STATEMENTS - (Continued)
Operating and finance lease ROU assets and lease liabilities included in the Consolidated Balance Sheets were as follows:
December 31,
2025
2024
(In millions)
Operating
Finance
Operating
Finance
Noncurrent assets
$
1,000
$
112
$
1,055
$
75
Current liabilities
$
303
$
35
$
302
$
22
Noncurrent liabilities
$
732
$
78
$
804
$
54
December 31,
2025
2024
Weighted-average remaining lease term
Operating
4 years
5 years
Finance
4 years
4 years
Weighted-average discount rate
Operating
5.5
%
5.4
%
Finance
4.9
%
5.1
%
Maturities of operating and finance lease liabilities were as follows (in millions):
Operating Leases
Finance Leases
Years ending December 31,
Total
2026
$
349
$
40
$
389
2027
289
34
323
2028
208
26
234
2029
124
15
139
2030
81
7
88
Thereafter
111
2
113
Total lease payments
1,162
124
1,286
Less: Imputed Interest
(127)
(11)
(138)
Present value of lease liabilities
$
1,035
$
113
$
1,148
________________________
Note: Amounts may not be additive due to rounding.
As of December 31, 2025, we have entered into $34 million of additional facility operating leases that have not yet commenced. The operating leases will commence in 2026 with lease terms of generally 10 years.
83
RYDER SYSTEM, INC. AND SUBSIDIARIES
NOTES TO CONSOLIDATED FINANCIAL STATEMENTS - (Continued)
13.DEBT
Weighted Average Interest Rate
(Dollars in millions)
December 31, 2025
December 31, 2024
Maturities
December 31, 2025
December 31, 2024
Debt:
Trade receivables financing program
4.31%
5.06%
2026
$
20
$
20
U.S. commercial paper
4.07%
4.78%
2030
865
868
Unsecured medium term note issued April 2020
4.63%
4.63%
2025
—
400
Unsecured medium term note issued May 2020
3.35%
3.35%
2025
—
400
Unsecured medium term note issued December 1995
6.95%
6.95%
2025
—
150
Unsecured medium term note issued November 2021
4.81%
5.53%
2026
300
300
Unsecured medium term note issued November 2019
2.90%
2.90%
2026
400
400
Unsecured medium term note issued February 2022
3.94%
4.27%
2027
450
450
Unsecured medium term note issued May 2022
4.30%
4.30%
2027
300
300
Unsecured medium term note issued February 2024
5.30%
5.30%
2027
350
350
Unsecured medium term note issued February 2023
5.65%
5.65%
2028
500
500
Unsecured medium term note issued May 2023
5.25%
5.25%
2028
650
650
Unsecured medium term note issued November 2023
6.30%
6.30%
2028
400
400
Unsecured medium term note issued February 2024
5.38%
5.38%
2029
550
550
Unsecured medium term note issued May 2024
5.50%
5.50%
2029
300
300
Unsecured medium term note issued August 2024
4.95%
4.95%
2029
300
300
Unsecured medium term note issued November 2024
4.90%
4.90%
2029
300
300
Unsecured medium term note issued February 2025
5.00%
—%
2030
300
—
Unsecured medium term note issued May 2025
4.85%
—%
2030
300
—
Unsecured medium term note issued November 2025
4.30%
—%
2030
300
—
Unsecured medium term note issued November 2023
6.60%
6.60%
2033
600
600
Unsecured U.S. obligations
5.14%
5.14%
2027
275
275
Asset-backed U.S. obligations (1)
3.69%
3.59%
2026-2030
120
252
Finance lease obligations and other
2026-2032
113
76
7,693
7,841
Fair market value adjustment on medium-term notes (2)
(11)
(25)
Debt issuance costs and original issue discounts
(37)
(37)
Total debt (3)
7,645
7,779
Short-term debt and current portion of long-term debt
(819)
(1,120)
Long-term debt
$
6,826
$
6,659
_______________
(1)Asset-backed U.S. obligations are financing transactions backed by a portion of our revenue earning equipment.
(2)Included in "Other non-current liabilities" within the Consolidated Balance Sheets. The notional amount of the executed interest rate swaps designated as fair value hedges was $500 million as of both December 31, 2025 and 2024.
The fair value of total debt (excluding finance lease and asset-backed U.S. obligations) was approximately $7.6 billion as of December 31, 2025 and 2024, respectively. For publicly-traded debt, estimates of fair value were based on market prices. For other debt, fair value was estimated based on a model-driven approach using rates currently available to us for debt with similar terms and remaining maturities. The fair value measurements of our publicly-traded debt and our other debt were classified within Level 2 of the fair value hierarchy.
84
RYDER SYSTEM, INC. AND SUBSIDIARIES
NOTES TO CONSOLIDATED FINANCIAL STATEMENTS - (Continued)
Debt Proceeds and Repayments
The following table includes our debt proceeds and repayments in 2025:
(In millions)
Debt Proceeds
Debt Repayments
Medium-term notes (1)
$
892
Medium-term notes
$
950
U.S. and foreign term loans, finance lease obligations and other
—
U.S. and foreign term loans, finance lease obligations and other
169
Total debt proceeds
$
892
Total debt repaid
$
1,119
_______________
(1)Proceeds from medium-term notes presented net of discount and issuance costs.
Debt proceeds were used to repay maturing debt and for general corporate purposes. If the unsecured medium-term notes are downgraded below investment grade following, or as a result of, a change in control, the note holders can require us to repurchase all or a portion of the notes at a purchase price equal to 101% of principal value plus accrued and unpaid interest.
Contractual maturities of total debt are as follows:
Years ending December 31,
(In millions)
2026
790
2027
1,388
2028
1,564
2029
1,472
2030
1,766
Thereafter
600
Finance lease obligations (Refer to Note 12, "Leases")
113
7,693
Fair market value adjustment on medium-term notes
(11)
Debt issuance costs and original issue discounts
(37)
Total debt
$
7,645
Credit Arrangements
Our borrowing capacity under the revolving credit facility and trade receivables financing program was as follows:
December 31, 2025
(In millions)
Borrowing Capacity
Outstanding
Available
Revolving credit facility
$
1,600
$
865
$
735
Trade receivables financing facility (1)
300
99
201
Total
$
1,900
$
964
$
936
_______________
(1)Includes borrowings of $20 million and letters of credit outstanding of $79 million.
Revolving Credit Facility
We maintain a $1.6 billion committed revolving credit facility, which supports U.S. and Canadian commercial paper programs, with a syndicate of eleven lending institutions that expires in April 2030. The agreement provides for annual facility fees which range from 7 to 17.5 basis points based on our long-term credit ratings. The annual facility fee is 10.0 basis points as of December 31, 2025. The credit facility is primarily used to finance working capital and vehicle purchases, but can also be used to issue up to $150 million in letters of credit (there were no letters of credit outstanding against the facility as of December 31, 2025.) At our option, the interest rate on borrowings under the credit facility is based on specific risk-free rates.
85
RYDER SYSTEM, INC. AND SUBSIDIARIES
NOTES TO CONSOLIDATED FINANCIAL STATEMENTS - (Continued)
The credit facility contains no provisions limiting its availability in the event of a material adverse change to our business operations; however, the credit facility does contain standard representations and warranties, events of default, cross-default provisions, and certain affirmative and negative covenants.
Our revolving credit facility enables us to refinance short-term obligations on a long-term basis. Short-term commercial paper obligations are classified as long-term as we have both the intent and ability to refinance on a long-term basis.
Trade Receivables Financing Program
We maintain a trade receivables purchase and sale program, pursuant to which we sell certain of our domestic trade accounts receivable to a bankruptcy remote, consolidated subsidiary of Ryder, that in turn sells, on a revolving basis, an ownership interest in certain of these accounts receivable to a committed purchaser. The subsidiary is considered a VIE and is consolidated based on our control of the entity’s activities. The credit facility associated with this program is used to provide additional liquidity to fund our operations and to issue letters of credit, particularly when it is cost effective to do so. The credit facility has a commitment fee of 35 to 55 basis points depending on the utilization of the credit facility and the borrowing capacity. Borrowings bear interest at a variable interest rate based on the 30-day term SOFR rate plus 90 basis points or the A1/P1 commercial paper yield rate plus 80 basis points. In April 2025, we extended the credit facility maturity until April 2026. In September 2025, we amended this credit facility to permit an increase in borrowing capacity of up to $200 million for a maximum borrowing of $500 million, subject to lender approval. As of December 31, 2025, this credit facility's borrowing capacity was $300 million.
14.GUARANTEES
We have executed various agreements with third parties that contain standard indemnifications that may require us to indemnify a third party against losses arising from a variety of matters, such as lease obligations, financing agreements, environmental matters, and agreements to sell business assets, if they bring a claim against us. Additionally, we have entered into individual indemnification agreements with each of our independent directors, through which we will indemnify such director acting in good faith against any and all losses, expenses and liabilities arising out of such director’s service as a director. The maximum amount of potential future payments under these agreements is generally unlimited.
We cannot predict the maximum potential amount of future payments under certain of these agreements, including the indemnification agreements, due to the contingent nature of the potential obligations and the distinctive provisions that are involved in each individual agreement. We believe that if a loss were incurred in any of these matters, the loss would not have a material adverse impact on our consolidated results of operations or financial position.
As of December 31, 2025 and 2024, we had letters of credit and surety bonds outstanding, which primarily guarantee various insurance activities as noted in the following table:
December 31,
(In millions)
2025
2024
Letters of credit
$
262
$
292
Surety bonds
$
257
$
191
15.SHARE REPURCHASE PROGRAMS
We currently maintain two share repurchase programs approved by our board of directors. The first program authorizes management to repurchase up to 1.5 million shares issued to employees under our employee stock plans since August 31, 2025, under an anti-dilutive program (the "2025 Anti-Dilutive Program"). The second program grants management discretion to repurchase up to 2 million shares of common stock over a period of two years under a discretionary share repurchase program (the "October 2025 Discretionary Program"). Share repurchases under both programs can be made from time to time using our working capital and other borrowing sources. Shares are repurchased under open-market transactions and trading plans established pursuant to Rule 10b5-1 of the Securities Exchange Act of 1934. The timing and actual number of shares repurchased are subject to market conditions, legal requirements and other factors, including balance sheet leverage, availability of acquisitions and stock price.
86
RYDER SYSTEM, INC. AND SUBSIDIARIES
NOTES TO CONSOLIDATED FINANCIAL STATEMENTS - (Continued)
The anti-dilutive share repurchase programs are designed to mitigate the dilutive impact of shares issued under our employee stock plans. Shares are retired upon repurchase. The discretionary share repurchase programs are designed to provide management with capital structure flexibility while concurrently managing objectives related to balance sheet leverage, acquisition opportunities, and shareholder returns. Shares of common stock are retired upon repurchase.
The following table provides the activity for shares repurchased and retired:
2025
2024
2023
(In millions)
Shares
Amount
Shares
Amount
Shares
Amount
2025 Anti-Dilutive Program(1)
—
$
4
—
$
—
—
$
—
2023 Anti-Dilutive Program (expired in October 2025)
0.5
82
0.7
83
0.1
11
2021 Anti-Dilutive Program (expired in October 2023)
—
—
—
—
1.0
96
Anti-Dilutive Programs
0.5
86
0.7
83
1.1
107
October 2025 Discretionary Program (1)
1.0
164
—
—
—
—
October 2024 Discretionary Program (superseded in October 2025)
1.7
268
0.2
33
—
—
October 2023 Discretionary Program (expired in September 2024)
—
—
1.6
205
0.4
44
February 2023 Discretionary Program (expired in September 2023)
—
—
—
—
2.0
186
Discretionary Programs
2.7
432
1.8
238
2.4
230
Total
3.2
$
519
2.5
$
321
3.6
$
337
_____________________
(1)Program commenced October 2025 and expires October 2027.
Amounts in the table may not be additive due to rounding.
16.ACCUMULATED OTHER COMPREHENSIVE LOSS
Comprehensive income presents a measure of all changes in shareholders’ equity except for changes resulting from transactions with shareholders in their capacity as shareholders. The following summary sets forth the components of Accumulated other comprehensive loss, net of taxes:
(In millions)
Currency Translation Adjustments
Net Actuarial
(Loss) Gain
and Prior Service Costs
Unrealized (Loss) Gain from Cash Flow Hedges
Accumulated Other Comprehensive (Loss) Gain
December 31, 2022
$
(238)
$
(566)
$
8
$
(796)
Other comprehensive income (loss), net of taxes, before reclassifications
37
(91)
(1)
(55)
Amounts reclassified from AOCI, net of taxes
183
20
(7)
196
Net current-period Other comprehensive income (loss), net of taxes
220
(71)
(8)
141
December 31, 2023
(18)
(637)
—
(655)
Other comprehensive income (loss), net of taxes, before reclassifications
(76)
17
5
(54)
Amounts reclassified from AOCI, net of taxes
(2)
23
(4)
17
Net current-period Other comprehensive income (loss), net of taxes
(78)
40
1
(37)
December 31, 2024
(96)
(597)
1
(692)
Other comprehensive income (loss), net of taxes, before reclassifications
53
(3)
(2)
48
Amounts reclassified from AOCI, net of taxes
—
25
(1)
24
Net current-period Other comprehensive income (loss), net of taxes
53
22
(3)
72
December 31, 2025
$
(43)
$
(575)
$
(2)
$
(620)
In 2023, we recognized a non-cash, cumulative currency translation adjustment loss of $183 million, net of tax, as a result of the FMS U.K. business exit, which is included in "Currency translation adjustment loss" in our Consolidated Statements of
87
RYDER SYSTEM, INC. AND SUBSIDIARIES
NOTES TO CONSOLIDATED FINANCIAL STATEMENTS - (Continued)
Earnings. The cumulative currency translation adjustment loss had no impact on our consolidated financial position or cash flows.
17.EARNINGS PER SHARE
The following table presents the calculation of basic and diluted earnings per common share from continuing operations:
(Dollars in millions, except per share amounts; share amounts in thousands)
2025
2024
2023
Earnings per common share — Basic
Earnings from continuing operations
$
501
$
489
$
406
Less: Distributed and undistributed earnings allocated to unvested stock
(3)
(3)
(2)
Earnings from continuing operations available to common shareholders
$
498
$
486
$
404
Weighted average common shares outstanding
40,799
43,079
45,383
Earnings from continuing operations per common share — Basic
$
12.20
$
11.29
$
8.89
Earnings per common share — Diluted
Earnings from continuing operations available to common shareholders — Diluted
$
501
$
489
$
406
Weighted average common shares outstanding — Basic
40,799
43,079
45,383
Effect of dilutive equity awards
1,004
1,155
1,104
Weighted average common shares outstanding — Diluted
41,803
44,234
46,488
Earnings from continuing operations per common share — Diluted
$
11.99
$
11.06
$
8.73
Anti-dilutive equity awards not included in diluted EPS
50
66
825
____________________
Amounts in the table may not recalculate due to rounding of earnings and shares.
18.SHARE-BASED COMPENSATION PLANS
The following table provides information on Share-based compensation expense and related income tax benefits recognized:
(In millions)
2025
2024
2023
Unvested stock awards
$
36
$
40
$
42
Stock option and employee stock purchase plans
3
2
2
Share-based compensation expense
39
42
44
Income tax benefit
(4)
(5)
(6)
Share-based compensation expense, net of tax
$
35
$
37
$
38
Total unrecognized pre-tax compensation expense related to share-based compensation arrangements as of December 31, 2025 was $40 million and is expected to be recognized over a weighted-average period of approximately 1.8 years. The total fair value of equity awards vested was $32 million, $33 million, and $41 million, during 2025, 2024, and 2023, respectively. The total cash received from employees under all share-based employee compensation arrangements was $20 million, $33 million, and $38 million during 2025, 2024, and 2023, respectively.
88
RYDER SYSTEM, INC. AND SUBSIDIARIES
NOTES TO CONSOLIDATED FINANCIAL STATEMENTS - (Continued)
Share-Based Incentive Awards
Share-based incentive awards are provided to employees under the terms of various share-based compensation plans (collectively, the Plans). The Plans are administered by the compensation committee of the board of directors and principally include grants of RSUs.
Restricted Stock Units
RSUs entitle the holder to receive one share of Ryder common stock for each RSU granted. Under the terms of our Plans, dividends on RSUs are paid only upon vesting of the award, and the amount of dividends paid is equal to the aggregate dividends declared on common shares during the period from the date of grant of the award until the date the shares underlying the award are delivered. The common stock underlying RSUs is not deemed issued or outstanding upon grant, and does not carry any voting rights. As of December 31, 2025, there are 7.8 million shares authorized for issuance under the Plans and 2.6 million shares remaining available for future grants.
RSUs granted to employees typically contain time-based vesting conditions, and in the case of certain senior executives also performance-based vesting conditions. Time-vested restricted stockrights (TVRSRs) typically vest ratably over three years for employees. The fair value of TVRSRs is determined and fixed based on Ryder’s stock price on the date of grant. Performance-based restricted stock rights (PBRSRs) are generally granted to executive management and include company specific performance-based vesting conditions. PBRSRs are awarded based on various revenue, return-based and cash flow performance targets and may include a total shareholder return (TSR) modifier. The fair values of the PBRSRs that include a TSR modifier are estimated using a lattice-based option-pricing valuation model that incorporates a Monte-Carlo simulation. Share-based compensation expense for PBRSRs is recognized on a straight-line basis over the vesting period, based upon the probability that the performance target will be met.
In 2025, 2024, and 2023, PBRSRs were awarded based on adjusted return on equity (ROE), strategic revenue growth (SRG), and free cash flow (FCF). Our TSR will be compared against the TSR of each of the companies in a custom peer group to determine our TSR percentile rank versus this custom peer group. The number of PBRSRs will then be adjusted based on this rank.
We also grant stock awards and RSUs to non-executive members of the board of directors. RSUs to new board members do not vest until the director has served a minimum of one year. After one year of service on the board of directors, each director may elect to receive his or her stock award in the form of either (1) shares that are distributed at the time of grant or (2) RSUs that are delivered upon or after separation from the board. The fair value of the awards is determined and fixed based on Ryder’s stock price on the date of grant. Share-based compensation expense is recognized for RSUs in the year the RSUs are granted to board members. Shares of Ryder common stock delivered upon grant have standard voting rights and rights to dividend payments.
The following is a summary of activity for RSUs as of and for the year ended December 31, 2025:
Time-Vested (1)
Performance-Based(2)
(Shares in millions)
Shares
Weighted- Average Grant Date Fair Value
Shares
Weighted- Average Grant Date Fair Value
Unvested stock awards at January 1, 2025
0.6
$
86.37
0.4
$
97.81
Granted
0.2
156.86
0.1
163.93
Vested
(0.2)
89.59
(0.2)
76.68
Unvested stock awards at December 31, 2025
0.6
$
103.07
0.3
$
126.49
_____________
(1) Includes RSUs granted to non-executive members of the board of directors.
(2) Initially granted at target, assuming 100% payout.
89
RYDER SYSTEM, INC. AND SUBSIDIARIES
NOTES TO CONSOLIDATED FINANCIAL STATEMENTS - (Continued)
Option Awards
Stock options are awards that allow employees to purchase shares of our stock at a fixed price in the future. Stock option awards are granted at an exercise price equal to the market price of our stock at the time of grant. These awards, which generally vest one-third each year, are fully vested three years from the grant date. Stock options have contractual terms of ten years. We have not granted stock option awards since 2019.
The fair value of each option award is estimated on the date of grant using a Black-Scholes-Merton option-pricing valuation model. We use historical data to estimate stock option forfeitures. The following table summarizes the activity related to our stock option awards:
(Option awards and aggregate intrinsic value in millions)
Number of Option Awards
Weighted-
Average
Exercise Price
Weighted-
Average
Remaining Contractual Term (Years)
Aggregate Intrinsic Value (1)
Outstanding and exercisable as of December 31, 2024
0.7
$
67.33
2.5
$
58
Exercised
(0.2)
$
58.06
—
$
20
Outstanding and exercisable as of December 31, 2025
0.5
$
70.72
2.0
$
57
_____________
(1) The intrinsic value represents the amount by which the fair value of our stock price exceeds the option exercise price, multiplied by the number of in-the-money options.
Employee Stock Purchase Plan
We maintain an Employee Stock Purchase Plan (ESPP) that enables eligible employees in the U.S. and Canada to purchase full or fractional shares of Ryder common stock through payroll deductions of a specific dollar amount or up to 15% of eligible compensation during quarterly offering periods. The price is based on the fair market value of the stock on the last trading day of the quarter. Stock purchased under the ESPP must be held for 90 days or one year for officers.
The following table presents the shares purchased and the related weighted-average purchase price under the ESPP:
2025 (1)
2024
2023
Shares purchased
107,000
120,000
152,000
Weighted average purchase price
$
143.41
$
114.84
$
82.81
_____________
(1) As of December 31, 2025, there were 7.5 million shares authorized for issuance and 1.3 million shares remaining available to be purchased in the future.
19.EMPLOYEE BENEFIT PLANS
Pension Plans
We sponsor several defined benefit pension plans covering most employees not covered by union-administered plans, including certain employees in foreign countries. These plans generally provided participants with benefits based on years of service and career-average compensation levels.
In past years, we made amendments to defined benefit retirement plans that froze the retirement benefits for non-grandfathered and certain non-union employees in the U.S., Canada and the U.K. As of December 31, 2025, our U.S., Canadian and U.K. pension plans are frozen for all remaining active employees. These employees have ceased accruing further benefits under the defined benefit pension plans and began receiving benefits under enhanced defined contribution plans. All pension benefits earned were fully preserved and will be paid in accordance with plan and legal requirements. We maintain an active $16 million statutory unfunded pension plan in Mexico.
In September 2023, we executed a bulk annuity contract with a U.K. insurance company to fully settle our $287 million U.K. pension benefit obligation. The bulk annuity transaction will not impact our financial position or statement of earnings until administrative rights for the annuity payments are transferred to the U.K. insurance company. The transfer is expected to occur within the next two years and will result in the elimination of any remaining funded obligations related to the U.K.
90
RYDER SYSTEM, INC. AND SUBSIDIARIES
NOTES TO CONSOLIDATED FINANCIAL STATEMENTS - (Continued)
pension plan. At the time of the transfer, we expect to recognize a non-cash pre-tax charge for the U.K pension plan actuarial loss in Accumulated other comprehensive loss, which as of December 31, 2025 was $221 million.
In April 2025, we executed a bulk annuity contract with a Canadian insurance company to settle $41 million of $60 million in Canadian pension benefit obligations. The remaining $19 million of Canadian pension benefit obligations, for members not covered by the bulk annuity contract, will be settled by utilizing lump sum payments. This bulk annuity transaction will have no impact on our financial position or statement of earnings until administrative rights for the annuity payments are transferred to the Canadian insurance company and lump sum payments are made to pension plan members. The transfer and lump sum payments are expected to occur within the next two years and will result in the elimination of any remaining funded obligations related to this Canadian pension plan. At the time of transfer and lump sum payments, we expect to recognize a non-cash pre-tax charge for the Canadian pension plan actuarial loss in Accumulated other comprehensive loss, which as of December 31, 2025 was $26 million.
We also have a non-qualified supplemental pension plan covering certain U.S. employees, which provides for incremental pension payments so that the participants' payments equal the amounts that could have been received under our qualified pension plan if it were not for limitations imposed by income tax regulations. The accrued pension liability related to this plan was $43 million as of December 31, 2025 and 2024.
Net Pension Expense
Components of net pension expense for defined benefit pension plans were as follows:
(In millions)
2025
2024
2023
Company-administered plans:
Service cost
$
1
$
1
$
1
Interest cost
87
86
90
Expected return on plan assets
(82)
(76)
(77)
Amortization of net actuarial loss and prior service cost
31
31
27
Net pension expense
$
37
$
42
$
41
Company-administered plans:
U.S.
$
23
$
29
$
31
Non-U.S.
14
13
10
Net pension expense
$
37
$
42
$
41
Non-operating pension costs, net include the amortization of net actuarial loss and prior service cost, interest cost and expected return on plan assets components of pension and postretirement benefit costs, as well as any significant charges for settlements or curtailments if recognized.
The following table sets forth the weighted-average actuarial assumptions used in determining our annual net pension expense:
U.S. Plans
Non-U.S. Plans
2025
2024
2023
2025
2024
2023
Discount rate
5.65%
5.15%
5.50%
5.23%
4.25%
5.05%
Expected long-term rate of return on plan assets
6.15%
5.40%
5.40%
4.82%
3.97%
3.80%
Gain and loss amortization period (years)
19
20
20
23
24
24
The return on plan assets assumption reflects the weighted-average of the expected long-term rates of return for the broad categories of investments held in the plans, net of fees.
91
RYDER SYSTEM, INC. AND SUBSIDIARIES
NOTES TO CONSOLIDATED FINANCIAL STATEMENTS - (Continued)
Obligations and Funded Status
The following table sets forth the benefit obligations, assets and funded status associated with our pension plans:
(In millions)
2025
2024
Change in benefit obligations:
Benefit obligations at January 1
$
1,628
$
1,858
Service cost
1
1
Interest cost
88
86
Actuarial loss (gain)
23
(127)
Benefits paid
(140)
(180)
Foreign currency exchange rate changes
25
(10)
Benefit obligations at December 31
1,625
1,628
Change in plan assets:
Fair value of plan assets at January 1
1,481
1,642
Actual return on plan assets
101
(28)
Employer contribution
66
56
Benefits paid
(140)
(180)
Foreign currency exchange rate changes
22
(9)
Fair value of plan assets at December 31
1,530
1,481
Funded status
$
(95)
$
(147)
Funded percent
94%
91%
The funded status of our pension plans was presented in the Consolidated Balance Sheets as follows:
December 31,
(In millions)
2025
2024
Noncurrent asset
$
—
$
2
Current liability
(4)
(4)
Noncurrent liability
(91)
(145)
Net amount recognized
$
(95)
$
(147)
Amounts recognized in Accumulated other comprehensive loss (pre-tax) consisted of:
December 31,
(In millions)
2025
2024
Prior service cost
$
25
$
26
Net actuarial loss
753
777
Net amount recognized
$
778
$
803
In 2026, we expect to amortize $31 million of net actuarial loss and prior service cost as a component of pension expense.
The following table sets forth the weighted-average actuarial assumptions used in determining funded status:
U.S. Plans December 31,
Non-U.S. Plans December 31,
2025
2024
2025
2024
Discount rate
5.45%
5.65%
5.34%
5.23%
92
RYDER SYSTEM, INC. AND SUBSIDIARIES
NOTES TO CONSOLIDATED FINANCIAL STATEMENTS - (Continued)
As of December 31, 2025 and 2024, our total accumulated benefit obligations, as well as our pension plan obligations (projected benefit obligations (PBO) and accumulated benefit obligations (ABO)) in excess of the fair value of the related plan assets, for our U.S. and foreign plans were as follows:
U.S. Plans December 31,
Non-U.S. Plans December 31,
Total December 31,
(In millions)
2025
2024
2025
2024
2025
2024
Total accumulated benefit obligations
$
1,260
$
1,284
$
361
$
341
$
1,621
$
1,625
Plans with pension obligations in excess of plan assets:
PBO
1,260
1,284
305
285
1,565
1,569
ABO
1,260
1,284
301
283
1,561
1,567
Fair value of plan assets
1,188
1,154
282
267
1,470
1,421
Investment Policy and Fair Value of Plan Assets
We have a liability hedging investment strategy for our qualified U.S pension plan that reduces the volatility of our pension assets relative to our pension liability. The overall objective is to achieve attractive risk-adjusted returns that will balance the liquidity requirement related to the plan's liability while striving to minimize the risk of significant funded status deterioration. As the funded status of the plan improves, we gradually (1) increase the liability hedging portfolio, which consists of high quality, longer-term fixed income securities and (2) reduce our allocation of equity investments. The plan utilizes several investment strategies, including actively and passively managed fixed income and equity strategies. The investment policy establishes targeted allocations for each asset class that incorporate measures of asset and liability risks. Deviations between actual pension plan asset allocations and targeted asset allocations may occur as a result of investment performance and changes in the funded status from time to time. Rebalancing of the pension plan asset portfolio is evaluated periodically and rebalanced if actual allocations exceed an acceptable range. The qualified U.S.pension plan accounts for 78% of our total pension plan assets.
The following table presents the fair value of each major category of pension plan assets and the level of inputs used to measure fair value:
(In millions)
December 31, 2025
Asset Category
Total
Level 1
Level 2
Level 3
Commingled funds:
Equity funds
$
68
$
—
$
68
$
—
Fixed income funds
374
—
374
—
Fixed income securities
646
—
646
—
Alternative investments:
Private equity fund
30
—
—
30
Hedge fund
65
—
—
65
Bulk annuity contracts
320
—
—
320
Cash and cash equivalents
27
18
9
—
Total
$
1,530
$
18
$
1,097
$
415
93
RYDER SYSTEM, INC. AND SUBSIDIARIES
NOTES TO CONSOLIDATED FINANCIAL STATEMENTS - (Continued)
(In millions)
December 31, 2024
Asset Category
Total
Level 1
Level 2
Level 3
Commingled funds:
Equity funds
$
166
$
—
$
166
$
—
Fixed income funds
57
—
57
—
Fixed income securities
879
—
879
—
Alternative investments:
Private equity fund
34
—
—
34
Hedge fund
58
—
—
58
Bulk annuity contracts
263
—
—
263
Cash and cash equivalents
24
—
24
—
Total
$
1,481
$
—
$
1,126
$
355
The following is a description of the valuation methodologies used for our pension assets as well as the level of input used to measure fair value:
Commingled funds — These investments include passively and actively managed fixed income and equity collective investment trusts. The collective investment trusts were valued utilizing the Net Asset Value (NAV) established by the funds’ sponsors and used by investors to redeem and purchase fund shares daily. Since the units of the funds are not actively traded, the fair value measurements have been classified within Level 2 of the fair value hierarchy.
Fixed income securities — These investments include bonds of corporate issuers from diverse industries, government issuers, fixed income pooled funds and other fixed income investments. Fair values for the corporate bonds were valued using third-party pricing services. These sources determine prices utilizing market income models which factor in, where applicable, transactions of similar assets in active markets, transactions of identical assets in infrequent markets, interest rates, bond or credit default swap spreads and volatility. Since the corporate bonds are not actively traded, the fair value measurements have been classified within Level 2 of the fair value hierarchy. The fixed income pooled funds were valued utilizing the NAV established by the funds’ sponsors and used by investors to redeem and purchase fund shares daily. Since the units of the funds are not actively traded, the fair value measurements have been classified within Level 2 of the fair value hierarchy. The other investments are not actively traded and fair values are estimated using bids provided by brokers, dealers or quoted prices of similar securities with similar characteristics or pricing models. Therefore, the other investments have been classified within Level 2 of the fair value hierarchy.
Private equity and hedge funds — These investments represent limited partnership interests in private equity and hedge funds. The partnership interests are valued by the general partners based on the underlying assets in each fund. The limited partnership interests are valued using unobservable inputs and have been classified within Level 3 of the fair value hierarchy.
Bulk annuity contracts — The bulk annuity contracts relates to U.K. and Canadian insurance policies issued by U.K. and Canadian insurance companies, respectively. The U.K. and Canadian contracts are valued by the insurer using unobservable inputs not traded on an open market. Accordingly, the contracts were categorized as Level 3.
Cash and Cash Equivalent - These investments include short-term investments, such as obligations of the U.S. Government and its agencies, and related money market instruments held in a collective investment trust structure. The collective investment trusts were valued utilizing the NAV established by the funds’ sponsors and used by investors to redeem and purchase fund shares daily. Since the units of the funds are not actively traded, the fair value measurements have been classified within Level 2 of the fair value hierarchy.
94
RYDER SYSTEM, INC. AND SUBSIDIARIES
NOTES TO CONSOLIDATED FINANCIAL STATEMENTS - (Continued)
The following table presents a summary of changes in the fair value of the pension plans’ Level 3 assets:
(In millions)
2025
2024
Beginning balance at January 1
$
355
$
437
Return on plan assets:
Relating to assets still held at the reporting date
26
(47)
Purchases, sales, settlements and expenses
34
(35)
Ending balance at December 31
$
415
$
355
Funding Policy and Contributions
The funding policy for these plans is to make contributions when required by statute. We may, from time to time, make voluntary contributions to our pension plans, which exceed the amount required by statute. The majority of the plans’ assets are invested in a master trust that, in turn, is invested primarily in commingled funds and fixed income securities. During 2025, total global pension contributions were $66 million, which includes the prefunding of $60 million in future required contributions to our U.S. pension plan, compared with $56 million in 2024. We estimate total 2026 required contributions to our pension plans to be approximately $10 million, and we do not expect to make voluntary contributions.
Estimated Future Benefits Payments
The following table details pension benefits expected to be paid in each of the next five fiscal years and in the aggregate for the five fiscal years thereafter:
(In millions)
2026
$
139
2027
134
2028
130
2029
127
2030
125
2031-2035
591
Savings Plans
Employees who are not covered by union-administered plans are generally eligible to participate in enhanced savings plans. These plans provide for (1) a company contribution even if employees do not make contributions for employees hired before January 1, 2016, (2) a company match of employee contributions of eligible pay, subject to tax limits and (3) a discretionary company match. Savings plan costs totaled $51 million, $49 million and $48 million in 2025, 2024 and 2023, respectively.
Deferred Compensation and Long-Term Compensation Plans
We have deferred compensation plans that permit eligible U.S. employees, officers and directors to defer a portion of their compensation. The deferred compensation liability, including Ryder matching amounts and accumulated earnings, was $155 million and $133 million as of December 31, 2025 and 2024, respectively.
We have established a grantor trust (Rabbi Trust) to provide funding for benefits payable under the supplemental pension plan, deferred compensation plans and long-term incentive compensation plans. The assets held in the trust were $156 million and $134 million as of December 31, 2025 and 2024, respectively. The Rabbi Trust's assets consist of short-term cash investments and mutual funds that invest in debt and equity securities, including our common stock. These assets, except for the investment in our common stock, are included in “Sales-type leases and other assets” because they are available to our general creditors in the event of insolvency. The equity securities are classified as trading securities and stated at fair value. The realized and unrealized investment income recognized in "Miscellaneous income, net" was $21 million income for 2025, $20 million income for 2024 and $17 million income for 2023. The Rabbi Trust's investments in our common stock as of both December 31, 2025 and 2024 were not material. Investments held in the Rabbi Trust are assets measured at fair value on a recurring basis. All investments are considered Level 1 of the fair value hierarchy.
95
RYDER SYSTEM, INC. AND SUBSIDIARIES
NOTES TO CONSOLIDATED FINANCIAL STATEMENTS - (Continued)
20.OTHER ITEMS IMPACTING COMPARABILITY
Our primary measure of segment performance as shown in Note 3, "Segment Reporting," excludes certain items we do not believe are representative of the ongoing operations of the segment. Excluding these items from our segment measure of performance allows for better year over year comparison:
Years ended December 31,
(In millions)
2025
2024
2023
Acquisition costs (1)
—
7
2
FMS U.K. business exit (2)
—
—
(32)
Currency translation adjustment loss
—
—
188
Other, net (1) (3)
9
6
(1)
Other items impacting comparability, net
$
9
$
13
$
157
________________________
(1)Included within "Restructuring and other items, net" in our Consolidated Statements of Earnings.
(2)Primarily included within "Restructuring and other items, net" in our Consolidated Statements of Earnings. In 2023, primarily reflects commercial claims proceeds, net of fees.
(3)In 2025, these costs primarily reflect restructuring actions to consolidate and close certain facilities, cease the use of certain assets and severance costs related to cost savings initiatives. In 2024, these costs primarily reflect severance costs associated with cost savings initiatives in all three segments.
21.CONTINGENCIES AND OTHER MATTERS
We are a party to various claims, complaints and proceedings arising in the ordinary course of our continuing business operations including those relating to commercial and employment claims, environmental matters, risk management matters (e.g., vehicle liability, workers’ compensation, etc.), and administrative assessments primarily associated with operating taxes. We have established loss provisions for matters in which losses are probable and can be reasonably estimated. We believe that the resolution of these claims, complaints and legal proceedings will not have a material effect on our consolidated financial statements.
Our estimates regarding potential losses and materiality are based on our judgment and assessment of the claims utilizing currently available information. Although we will continue to reassess our estimated liability based on future developments, our objective assessment of the legal merits of such claims may not always be predictive of the outcome and actual results may vary from our current estimates.
Environmental Matters
Our operations involve storing and dispensing petroleum products, primarily diesel fuel, regulated under environmental protection laws. These laws require us to eliminate or mitigate the effect of such substances on the environment. In response to these requirements, we continually upgrade our operating facilities and implement various programs to detect and minimize contamination. In addition, we have received notices from the EPA and others that we have been identified as a potentially responsible party under the Comprehensive Environmental Response, Compensation, and Liability Act; the Superfund Amendments and Reauthorization Act; and similar state statutes. We may be required to share in the cost of cleanup of 22 identified disposal sites and have established loss provisions for matters in which losses are probable and can be reasonably estimated. We believe that the resolution of these matters will not have a material effect on our consolidated financial statements.
The ultimate cost of our environmental liabilities cannot presently be projected with certainty due to the presence of several unknown factors, primarily the level of contamination, the effectiveness of selected remediation methods, the stage of investigation at individual sites, the determination of our liability in proportion to other responsible parties and the recoverability of such costs from third parties. Based on information presently available, we believe that the ultimate disposition of these matters, although potentially material to the results of operations in any one year, will not have a material adverse effect on our financial condition or liquidity.
96
RYDER SYSTEM, INC. AND SUBSIDIARIES
NOTES TO CONSOLIDATED FINANCIAL STATEMENTS - (Continued)
22.SUPPLEMENTAL CASH FLOW INFORMATION
Supplemental cash flow information was as follows:
As of and for the Years Ended December 31,
(In millions)
2025
2024
2023
Interest paid
$
399
$
372
$
269
Income taxes paid, net of refunds
$
52
$
207
$
96
Cash paid for operating lease liabilities
$
373
$
359
$
249
Right-of-use assets obtained in exchange for lease obligations:
Finance leases
$
78
$
46
$
26
Operating leases
$
257
$
148
$
477
Capital expenditures acquired but not yet paid
$
174
$
263
$
244
23.ACQUISITIONS
On February 1, 2024, we acquired all the outstanding equity of Cardinal Logistics for a purchase price of $302 million. Cardinal Logistics is a leading customized dedicated contract carrier in North America, providing dedicated fleets and professional drivers, as well as complementary freight brokerage services, last-mile delivery and contract logistics services. We expect that the acquisition will increase our scale and network density and further advance our strategy to accelerate growth in DTS. The purchase price allocation of estimated fair values resulted in additions of goodwill and intangible assets of $200 million and $116 million, respectively, for the Cardinal Logistics acquisition. All of the intangible assets acquired relates to customer relationship and is expected to be amortized over 6 to 11 years. None of the goodwill is expected to be deductible for income tax purposes.
During 2024, we also acquired a business in our FMS segment for a purchase price of $15 million. In 2025, we reclassified $9 million of goodwill to customer intangibles in completing the purchase price allocation.
On November 1, 2023, we acquired all the outstanding equity of IFS, which specializes in contract packaging, contract manufacturing and warehousing, primarily in the consumer packaged goods, retail, and healthcare industries, for an approximate purchase price of $254 million. The purchase price allocation of estimated fair values resulted in additions to goodwill and intangible assets of $83 million and $127 million, respectively. The acquisition was included within the consumer packaged goods industry vertical in our SCS business segment and expands the product offerings that we can offer to our customers. All of the goodwill is expected to be deductible for income tax purposes. All of the intangible assets acquired relates to customer relationship and is expected to be amortized over 11 to 15 years.
ITEM 9. CHANGES IN AND DISAGREEMENTS WITH ACCOUNTANTS ON
ACCOUNTING AND FINANCIAL DISCLOSURE
None.
ITEM 9A. CONTROLS AND PROCEDURES
Evaluation of Disclosure Controls and Procedures
As of the end of the period covered by this report, we carried out an evaluation, under the supervision and with the participation of management, including Ryder’s Chief Executive Officer and Chief Financial Officer, of the effectiveness of the design and operation of Ryder’s disclosure controls and procedures (as defined in Rule 13a-15(e) under the Securities Exchange Act of 1934). Based upon that evaluation, the Chief Executive Officer and Chief Financial Officer concluded that as of December 31, 2025, Ryder’s disclosure controls and procedures (as defined in Rule 13a-15(e) under the Securities Exchange Act of 1934) were effective.
Management’s Report on Internal Control over Financial Reporting
Management’s Report on Internal Control over Financial Reporting and the Report of Independent Registered Public Accounting Firm thereon are set out in Item 8 of Part II of this Form 10-K Annual Report.
97
Changes in Internal Controls over Financial Reporting
During the three months ended December 31, 2025, there were no changes in Ryder’s internal control over financial reporting that have materially affected or are reasonably likely to materially affect such internal control over financial reporting.
ITEM 9B. OTHER INFORMATION
Rule 10b5-1 Trading Plans and Non-Rule 10b5-1 Trading Arrangements
Certain of our officers or directors, as applicable, have made elections to participate in, and are participating in, our dividend reinvestment plan and 401(k) savings plan, and have made, and may from time to time make, elections to purchase shares, have shares withheld to cover withholding taxes, or pay the exercise price of options, which may be designed to satisfy the affirmative defense conditions of Rule 10b5-1 under the Exchange Act or may constitute non-Rule 10b5-1 trading arrangements (as defined in Item 408(c) of Regulation S-K).
ITEM 9C. DISCLOSURE REGARDING FOREIGN JURISDICTIONS THAT PREVENT INSPECTIONS
Not applicable.
PART III
ITEM 10. DIRECTORS, EXECUTIVE OFFICERS AND CORPORATE GOVERNANCE
The information required by Item 10 with respect to executive officers is included within Item 1 in Part I under the caption “Information about our Executive Officers” of this Form 10-K Annual Report.
The information required by Item 10 with respect to directors, audit committee, audit committee financial experts and Section 16(a) beneficial ownership reporting compliance (to the extent applicable) is included under the captions “Election of Directors,” “Audit Committee,” and “Delinquent Section 16(a) Reports,” respectively, in our definitive proxy statement, which will be filed with the Commission within 120 days after the close of the fiscal year, and is incorporated herein by reference.
Code of Ethics
Ryder has adopted a code of ethics, the Principles of Business Conduct applicable to all employees, including its Chief Executive Officer. Our code of ethics is available through the Investor Relations area of our website at investors.ryder.com.
Insider Trading Policy
Ryder has adopted insider trading policies and procedures governing the purchase, sale and other dispositions of its securities by directors, officers and employees that we believe are reasonably designed to promote compliance with insider trading laws, rules and regulations, and applicable listing standards. This summary is qualified by reference to the full text of our insider trading policy, which is filed as Exhibit 19.1 to this Annual Report on Form 10-K.
ITEM 11. EXECUTIVE COMPENSATION
The information required by Item 11 is included under the captions “Compensation Discussion and Analysis,” “Executive Compensation,” “Compensation Committee,” “Compensation Committee Report on Executive Compensation” and “Director Compensation” in our definitive proxy statement, which will be filed with the Commission within 120 days after the close of the fiscal year, and is incorporated herein by reference.
ITEM 12. SECURITY OWNERSHIP OF CERTAIN BENEFICIAL OWNERS
AND MANAGEMENT AND RELATED STOCKHOLDER MATTERS
The information required by Item 12 with respect to security ownership of certain beneficial owners and management is included under the captions “Security Ownership of Officers and Directors” and “Security Ownership of Certain Beneficial Owners” in our definitive proxy statement, which will be filed with the Commission within 120 days after the close of the fiscal year, and is incorporated herein by reference.
98
Securities Authorized for Issuance under Equity Compensation Plans
The following table includes information as of December 31, 2025, about certain plans that provide for the issuance of common stock in connection with the exercise of stock options and other share-based awards.
Plans
Number of Securities to be Issued Upon Exercise of Outstanding Options, Warrants and Rights
Weighted-Average Exercise Price of Outstanding Options, Warrants and Rights
Number of Securities Remaining Available for Future Issuance Under Equity Compensation Plans Excluding Securities Reflected in Column (a)
(a)
(b)
(c)
Equity compensation plans approved by security holders:
Broad based employee and non-employee directors' stock plan
1,359,595
(1)
$
70.72
(2)
2,635,720
(3)
Employee stock purchase plan
—
—
1,325,873
Total
1,359,595
$
70.72
3,961,593
_______________
(1)Includes broad based employee stock options and other share-based awards of 476,034 stock options, 320,888 time-vested restricted stock units and 281,359 performance-based restricted stock units calculated at target. Includes non-employee directors' units of 276,595 time-vested restricted stock units, as well as 4,719 time-vested restricted stock units awarded to non-executive directors and vested but not exercisable until six months after the director's retirement. Refer to Note 18, "Share-Based Compensation Plans", for additional information.
(2)Weighted-average exercise price of outstanding options excludes restricted stock units.
(3)Calculated by reducing shares authorized for issuance by a ratio of two shares for each share issued (on a 1:2 ratio) except for shares delivered pursuant to a stock option, which shall reduce the shares available by one share (on a 1:1 ratio) as set forth under the terms of the 2019 Equity and Incentive Compensation Plan and assuming maximum performance for the performance-based restricted stock units. All future awards issued will reduce the shares available for issuance by the terms set forth in the 2019 Equity and Incentive Compensation Plan, as described in the previous sentence.
ITEM 13. CERTAIN RELATIONSHIPS AND RELATED TRANSACTIONS,
AND DIRECTOR INDEPENDENCE
The information required by Item 13 is included under the captions “Board of Directors” and “Related Person Transactions” in our definitive proxy statement, which will be filed with the Commission within 120 days after the close of the fiscal year, and is incorporated herein by reference.
ITEM 14. PRINCIPAL ACCOUNTANT FEES AND SERVICES
The information required by Item 14 is included under the caption “Ratification of Independent Auditor” in our definitive proxy statement, which will be filed with the Commission within 120 days after the close of the fiscal year, and is incorporated herein by reference.
PART IV
ITEM 15. EXHIBITS AND FINANCIAL STATEMENT SCHEDULES
99
(a)Items A through H and are presented on the following pages of this Form 10-K Annual Report:
Page No.
1. Financial Statements for Ryder System, Inc. and Consolidated Subsidiaries:
All other schedules are omitted because they are not applicable or the required information is shown in the consolidated financial statements or notes thereto.
3. Exhibits:
The following exhibits are filed with this report or, where indicated, incorporated by reference (Forms 10-K, 10-Q and 8-K referenced herein have been filed under the Commission’s file No. 1-4364). Ryder will provide a copy of the exhibits filed with this report at a nominal charge to those parties requesting them.
Ryder hereby agrees, pursuant to paragraph (b)(4)(iii) of Item 601 of Regulation S-K, to furnish the Commission with a copy of any instrument defining the rights of holders of long-term debt of Ryder, where such instrument has not been filed as an exhibit hereto and the total amount of securities authorized there under does not exceed 10% of the total assets of Ryder and its subsidiaries on a consolidated basis.
4.2
The First Supplemental Indenture between Ryder System, Inc. and The Chase Manhattan Bank (National Association) dated October 1, 1987, previously filed with the Commission as an exhibit to Ryder's Annual Report on Form 10-K for the year ended December 31, 1994, is incorporated by reference into this report.
4.3
The Form of Indenture between Ryder System, Inc. and The Chase Manhattan Bank (National Association) dated as of May 1, 1987, and supplemented as of November 15, 1990 and June 24, 1992, filed with the Commission on July 30, 1992 as an exhibit to Ryder's Registration Statement on Form S-3 (No. 33-50232), is incorporated by reference into this report.
Robert J. Eck, Robert A. Hagemann, Michael F. Hilton, Tamara L. Lundgren, Luis P. Nieto, Jr., David G. Nord, Abbie J. Smith, E. Follin Smith, Dmitri L. Stockton and Charles M. Swoboda
Cover Page Interactive Data File (formatted in Inline XBRL and contained in Exhibit 101).
___________________
* Management contract or compensation plan arrangement pursuant to Item 601(b)(10) of Regulation S-K.
104
SIGNATURES
Pursuant to the requirements of Section 13 or 15(d) of the Securities Exchange Act of 1934, the registrant has duly caused this report to be signed on its behalf by the undersigned, thereunto duly authorized.
Date:
February 11, 2026
RYDER SYSTEM, INC.
By: /s/ ROBERT E. SANCHEZ
Robert E. Sanchez
Chair and Chief Executive Officer
Pursuant to the requirements of the Securities Exchange Act of 1934, this report has been signed below by the following persons on behalf of the registrant and in the capacities and on the dates indicated.
Date:
February 11, 2026
By: /s/ ROBERT E. SANCHEZ
Robert E. Sanchez
Chair and Chief Executive Officer
(Principal Executive Officer)
Date:
February 11, 2026
By: /s/ CRISTINA GALLO-AQUINO
Cristina Gallo-Aquino
Executive Vice President and Chief Financial Officer
(Principal Financial Officer and Principal Accounting Officer)