
Nasdaq SFNC .2 th 4 Quarter 2025 Earnings Presentation January 20, 2026
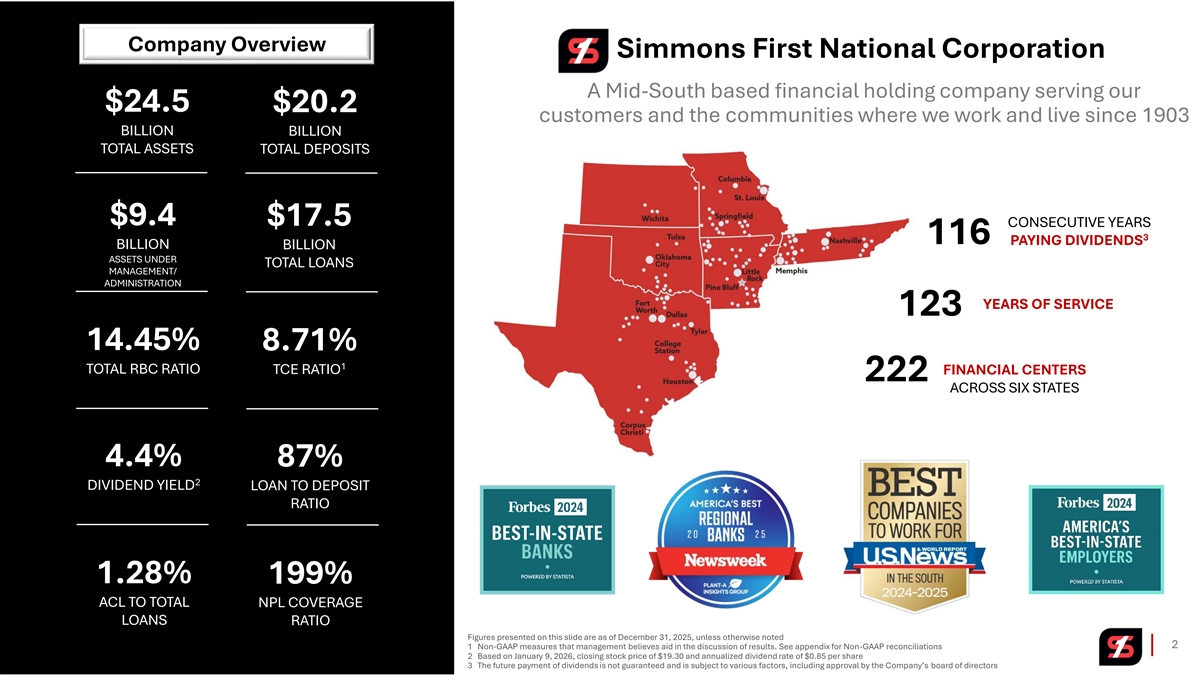
Company Overview Simmons First National Corporation A Mid-South based financial holding company serving our $24.5 $20.2 customers and the communities where we work and live since 1903 BILLION BILLION TOTAL ASSETS TOTAL DEPOSITS $9.4 $17.5 CONSECUTIVE YEARS 3 116 PAYING DIVIDENDS BILLION BILLION ASSETS UNDER TOTAL LOANS MANAGEMENT/ ADMINISTRATION YEARS OF SERVICE 123 14.45% 8.71% 1 TOTAL RBC RATIO TCE RATIO FINANCIAL CENTERS 222 ACROSS SIX STATES 4.4% 87% 2 DIVIDEND YIELD LOAN TO DEPOSIT RATIO 1.28% 199% ACL TO TOTAL NPL COVERAGE LOANS RATIO Figures presented on this slide are as of December 31, 2025, unless otherwise noted 2 1 Non-GAAP measures that management believes aid in the discussion of results. See appendix for Non-GAAP reconciliations 2 Based on January 9, 2026, closing stock price of $19.30 and annualized dividend rate of $0.85 per share 3 The future payment of dividends is not guaranteed and is subject to various factors, including approval by the Company’s board of directors

4Q25 Financial Highlights 3
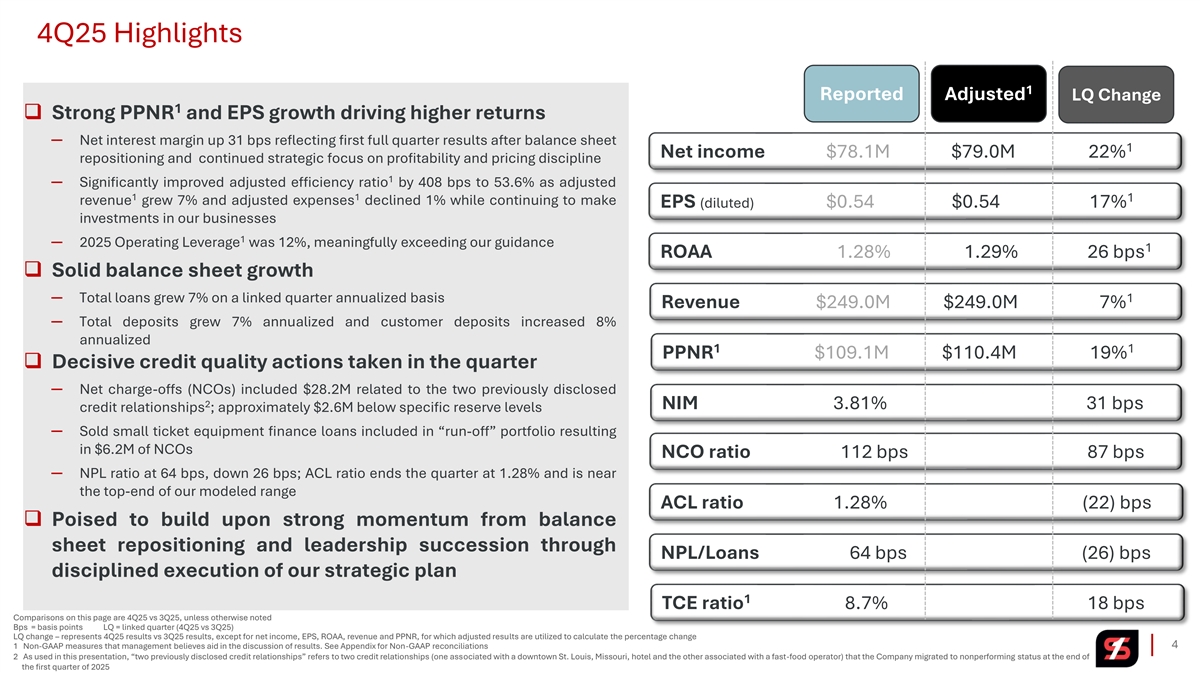
4Q25 Highlights 1 Reported Adjusted LQ Change 1 ❑ Strong PPNR and EPS growth driving higher returns ─ Net interest margin up 31 bps reflecting first full quarter results after balance sheet 1 Net income $78.1M $79.0M 22% repositioning and continued strategic focus on profitability and pricing discipline 1 ─ Significantly improved adjusted efficiency ratio by 408 bps to 53.6% as adjusted 1 1 1 revenue grew 7% and adjusted expenses declined 1% while continuing to make EPS (diluted) $0.54 $0.54 17% investments in our businesses 1 ─ 2025 Operating Leverage was 12%, meaningfully exceeding our guidance 1 ROAA 1.28% 1.29% 26 bps ❑ Solid balance sheet growth ─ Total loans grew 7% on a linked quarter annualized basis 1 Revenue $249.0M $249.0M 7% ─ Total deposits grew 7% annualized and customer deposits increased 8% annualized 1 1 PPNR $109.1M $110.4M 19% ❑ Decisive credit quality actions taken in the quarter ─ Net charge-offs (NCOs) included $28.2M related to the two previously disclosed 2 NIM 3.81% 31 bps credit relationships ; approximately $2.6M below specific reserve levels ─ Sold small ticket equipment finance loans included in “run-off” portfolio resulting in $6.2M of NCOs NCO ratio 112 bps 87 bps ─ NPL ratio at 64 bps, down 26 bps; ACL ratio ends the quarter at 1.28% and is near the top-end of our modeled range ACL ratio 1.28% (22) bps ❑ Poised to build upon strong momentum from balance sheet repositioning and leadership succession through NPL/Loans 64 bps (26) bps disciplined execution of our strategic plan 1 TCE ratio 8.7% 18 bps Comparisons on this page are 4Q25 vs 3Q25, unless otherwise noted Bps = basis points LQ = linked quarter (4Q25 vs 3Q25) LQ change – represents 4Q25 results vs 3Q25 results, except for net income, EPS, ROAA, revenue and PPNR, for which adjusted results are utilized to calculate the percentage change 1 Non-GAAP measures that management believes aid in the discussion of results. See Appendix for Non-GAAP reconciliations 4 2 As used in this presentation, “two previously disclosed credit relationships” refers to two credit relationships (one associated with a downtown St. Louis, Missouri, hotel and the other associated with a fast-food operator) that the Company migrated to nonperforming status at the end of the first quarter of 2025
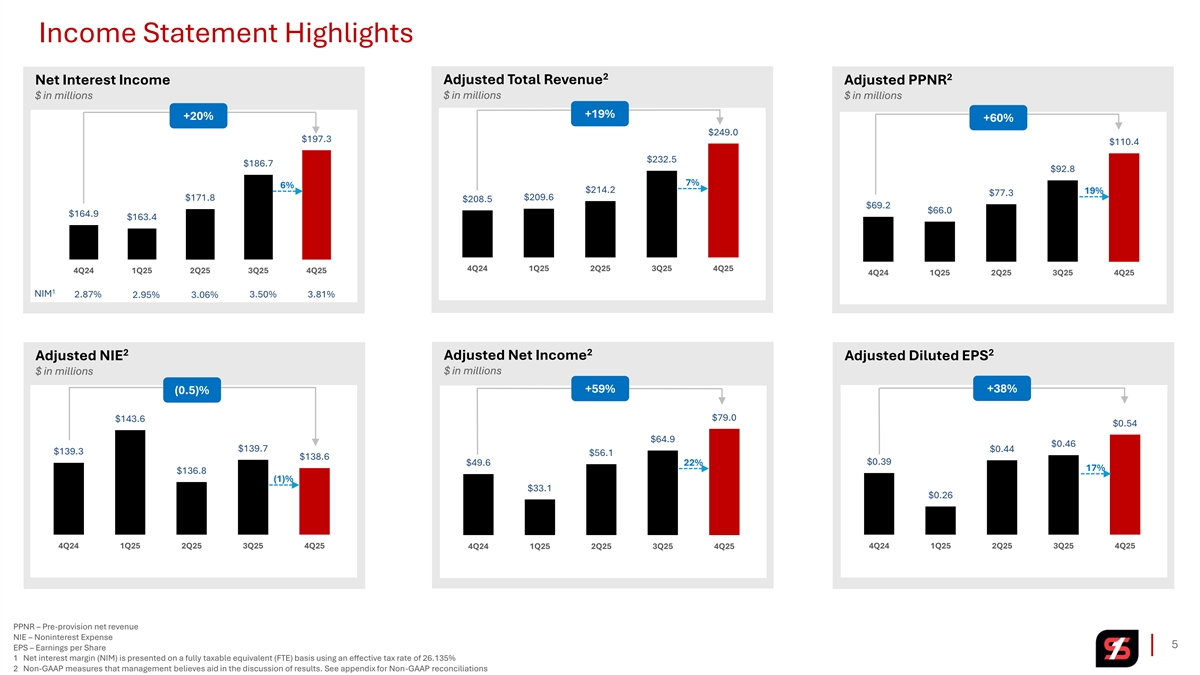
Income Statement Highlights 2 2 Net Interest Income Adjusted Total Revenue Adjusted PPNR $ in millions $ in millions $ in millions +19% +20% +60% $249.0 $197.3 $110.4 $232.5 $186.7 $92.8 7% 6% $214.2 19% $77.3 $209.6 $171.8 $208.5 $69.2 $66.0 $164.9 $163.4 4Q24 1Q25 2Q25 3Q25 4Q25 4Q24 1Q25 2Q25 3Q25 4Q25 4Q24 1Q25 2Q25 3Q25 4Q25 1 NIM 2.87% 3.50% 3.81% 2.95% 3.06% 2 2 2 Adjusted NIE Adjusted Net Income Adjusted Diluted EPS $ in millions $ in millions +59% +38% (0.5)% $79.0 $143.6 $0.54 $64.9 $0.46 $139.7 $0.44 $139.3 $56.1 $138.6 $0.39 $49.6 22% 17% $136.8 (1)% $33.1 $0.26 4Q24 1Q25 2Q25 3Q25 4Q25 4Q24 1Q25 2Q25 3Q25 4Q25 4Q24 1Q25 2Q25 3Q25 4Q25 PPNR – Pre-provision net revenue NIE – Noninterest Expense 5 EPS – Earnings per Share 1 Net interest margin (NIM) is presented on a fully taxable equivalent (FTE) basis using an effective tax rate of 26.135% 2 Non-GAAP measures that management believes aid in the discussion of results. See appendix for Non-GAAP reconciliations
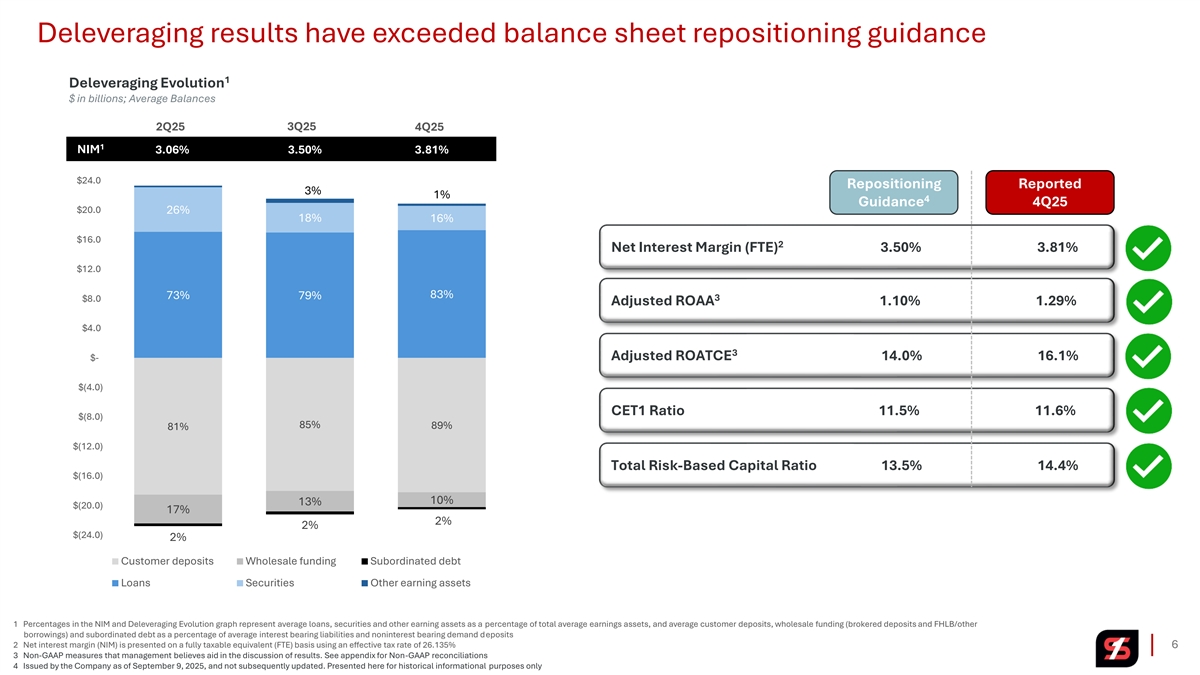
Deleveraging results have exceeded balance sheet repositioning guidance 1 Deleveraging Evolution $ in billions; Average Balances 3Q25 2Q25 4Q25 1 NIM 3.06% 3.50% 3.81% $24.0 Repositioning Reported 3% 1% 4 Guidance 4Q25 $20.0 26% 18% 16% $16.0 2 Net Interest Margin (FTE) 3.50% 3.81% $12.0 73% 83% 79% 3 $8.0 Adjusted ROAA 1.10% 1.29% $4.0 3 Adjusted ROATCE 14.0% 16.1% $- $(4.0) CET1 Ratio 11.5% 11.6% $(8.0) 85% 89% 81% $(12.0) Total Risk-Based Capital Ratio 13.5% 14.4% $(16.0) 10% 13% $(20.0) 17% 2% 2% $(24.0) 2% Customer deposits Wholesale funding Subordinated debt Loans Securities Other earning assets 1 Percentages in the NIM and Deleveraging Evolution graph represent average loans, securities and other earning assets as a percentage of total average earnings assets, and average customer deposits, wholesale funding (brokered deposits and FHLB/other borrowings) and subordinated debt as a percentage of average interest bearing liabilities and noninterest bearing demand deposits 2 Net interest margin (NIM) is presented on a fully taxable equivalent (FTE) basis using an effective tax rate of 26.135% 6 3 Non-GAAP measures that management believes aid in the discussion of results. See appendix for Non-GAAP reconciliations 4 Issued by the Company as of September 9, 2025, and not subsequently updated. Presented here for historical informational purposes only
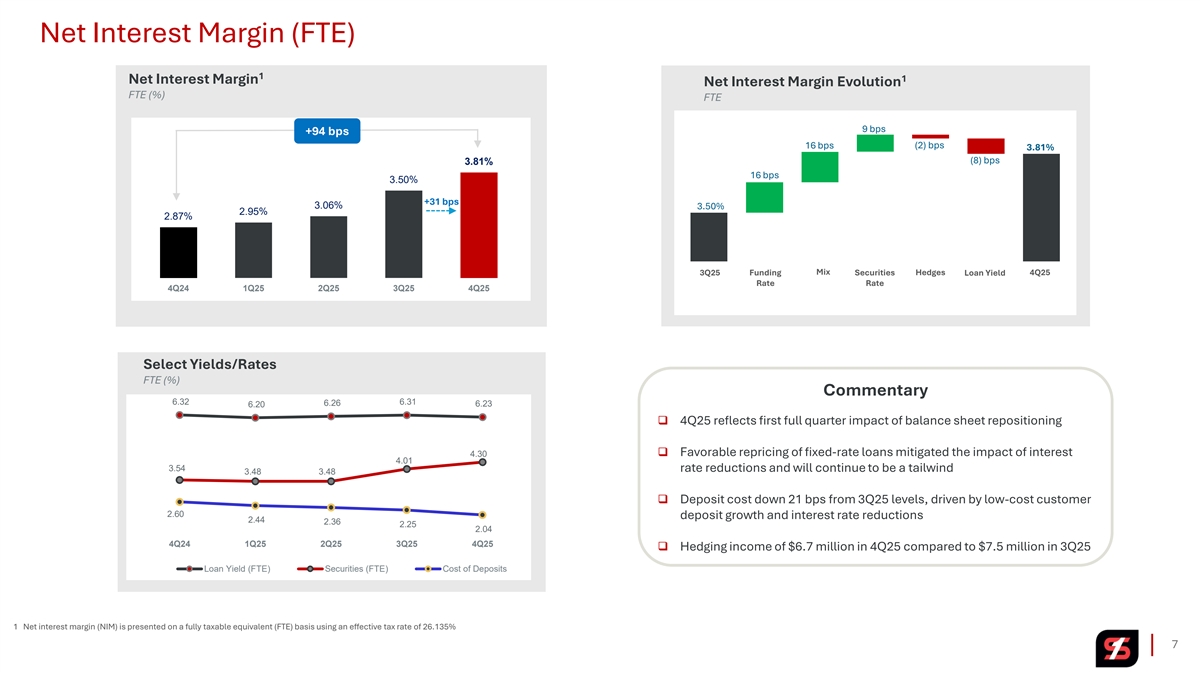
Net Interest Margin (FTE) 1 1 Net Interest Margin Net Interest Margin Evolution FTE (%) FTE 9 bps +94 bps 16 bps (2) bps 3.81% (8) bps 3.81% 16 bps 3.50% +31 bps 3.06% 3.50% 2.95% 2.87% Mix Hedges 4Q25 3Q25 Funding Securities Loan Yield Rate Rate 4Q24 1Q25 2Q25 3Q25 4Q25 Select Yields/Rates FTE (%) Commentary 6.32 6.31 6.26 6.23 6.20 ❑ 4Q25 reflects first full quarter impact of balance sheet repositioning ❑ Favorable repricing of fixed-rate loans mitigated the impact of interest 4.30 4.01 3.54 rate reductions and will continue to be a tailwind 3.48 3.48 ❑ Deposit cost down 21 bps from 3Q25 levels, driven by low-cost customer 2.60 deposit growth and interest rate reductions 2.44 2.36 2.25 2.04 4Q24 1Q25 2Q25 3Q25 4Q25 ❑ Hedging income of $6.7 million in 4Q25 compared to $7.5 million in 3Q25 Loan Yield (FTE) Securities (FTE) Cost of Deposits 1 Net interest margin (NIM) is presented on a fully taxable equivalent (FTE) basis using an effective tax rate of 26.135% 7
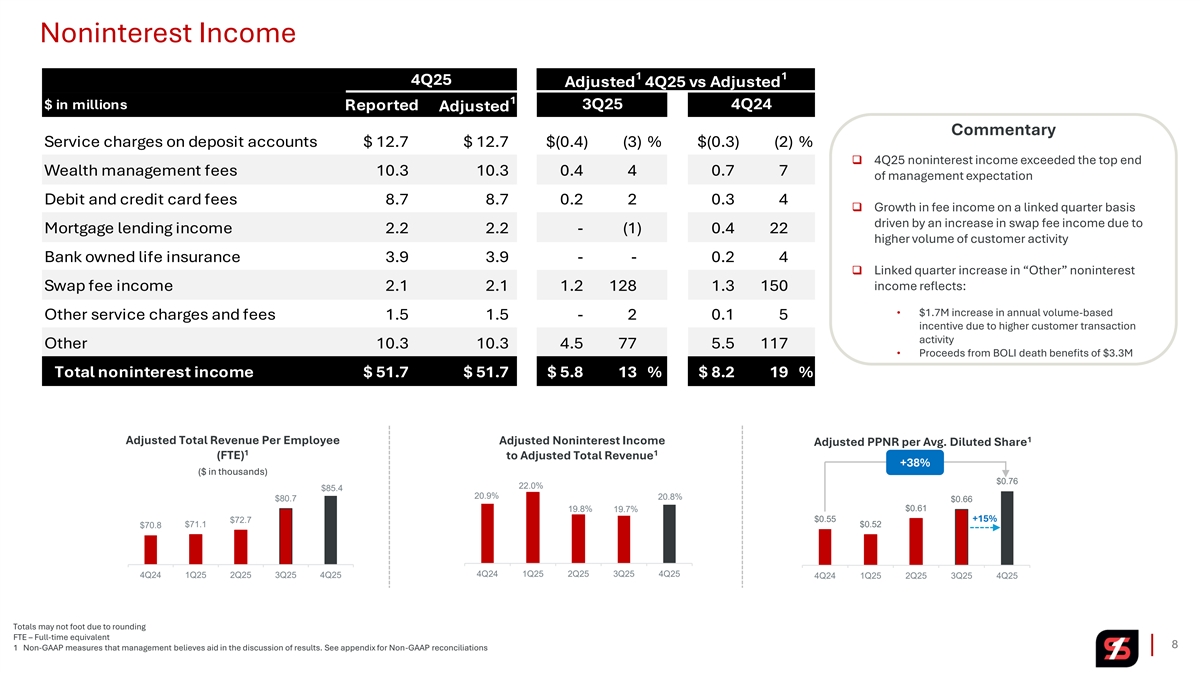
Noninterest Income 1 1 4Q25 Adjusted 4Q25 vs Adjusted 1 $ in millions Reported 3Q25 4Q24 Adjusted Commentary Service charges on deposit accounts $ 12.7 $ 12.7 $(0.4) ( 3) % $(0.3) ( 2) % ❑ 4Q25 noninterest income exceeded the top end Wealth management fees 10.3 1 0.3 0 .4 4 0.7 7 of management expectation Debit and credit card fees 8 .7 8.7 0.2 2 0.3 4 ❑ Growth in fee income on a linked quarter basis driven by an increase in swap fee income due to Mortgage lending income 2 .2 2.2 - ( 1) 0.4 22 higher volume of customer activity Bank owned life insurance 3 .9 3.9 - - 0.2 4 ❑ Linked quarter increase in “Other” noninterest income reflects: Swap fee income 2 .1 2.1 1.2 128 1.3 150 • $1.7M increase in annual volume-based Other service charges and fees 1.5 1.5 - 2 0.1 5 incentive due to higher customer transaction activity Other 10.3 1 0.3 4.5 77 5.5 117 • Proceeds from BOLI death benefits of $3.3M Total noninterest income $ 51.7 $ 51.7 $ 5.8 13 % $ 8.2 19 % 1 Adjusted Total Revenue Per Employee Adjusted Noninterest Income Adjusted PPNR per Avg. Diluted Share 1 1 (FTE) to Adjusted Total Revenue +38% ($ in thousands) $0.76 22.0% $85.4 20.9% 20.8% $80.7 $0.66 $0.61 19.8% 19.7% $72.7 $0.55 +15% $71.1 $0.52 $70.8 4Q24 1Q25 2Q25 3Q25 4Q25 4Q24 1Q25 2Q25 3Q25 4Q25 4Q24 1Q25 2Q25 3Q25 4Q25 Totals may not foot due to rounding FTE – Full-time equivalent 8 1 Non-GAAP measures that management believes aid in the discussion of results. See appendix for Non-GAAP reconciliations
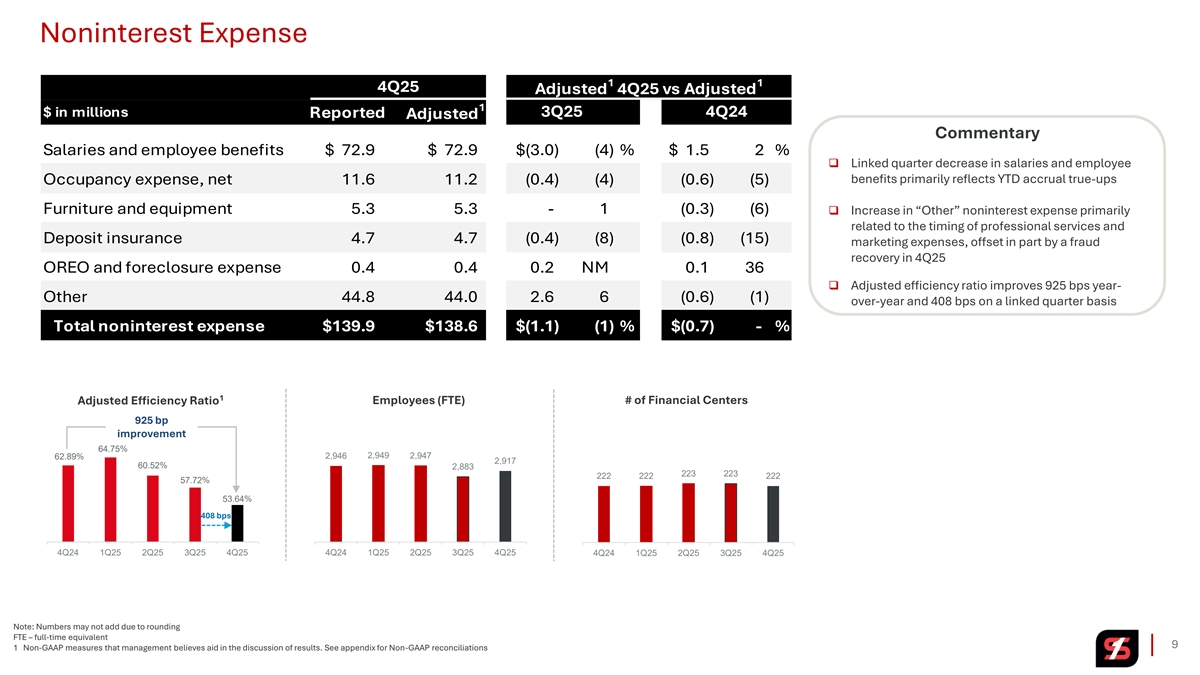
Noninterest Expense 1 1 4Q25 Adjusted 4Q25 vs Adjusted 1 $ in millions Reported 3Q25 4Q24 Adjusted Commentary Salaries and employee benefits $ 72.9 $ 72.9 $(3.0) ( 4) % $ 1.5 2 % ❑ Linked quarter decrease in salaries and employee benefits primarily reflects YTD accrual true-ups Occupancy expense, net 11.6 11.2 (0.4) ( 4) (0.6) (5) Furniture and equipment 5 .3 5.3 - 1 (0.3) (6) ❑ Increase in “Other” noninterest expense primarily related to the timing of professional services and Deposit insurance 4 .7 4.7 ( 0.4) ( 8) (0.8) (15) marketing expenses, offset in part by a fraud recovery in 4Q25 OREO and foreclosure expense 0.4 0.4 0 .2 NM 0.1 36 ❑ Adjusted efficiency ratio improves 925 bps year- Other 44.8 44.0 2.6 6 ( 0.6) (1) over-year and 408 bps on a linked quarter basis Total noninterest expense $139.9 $138.6 $(1.1) (1) % $(0.7) - % 1 Employees (FTE) # of Financial Centers Adjusted Efficiency Ratio 925 bp improvement 64.75% 2,946 2,949 2,947 62.89% 2,917 60.52% 2,883 223 223 222 222 222 57.72% 53.64% 408 bps 4Q24 1Q25 2Q25 3Q25 4Q25 4Q24 1Q25 2Q25 3Q25 4Q25 4Q24 1Q25 2Q25 3Q25 4Q25 Note: Numbers may not add due to rounding FTE – full-time equivalent 9 1 Non-GAAP measures that management believes aid in the discussion of results. See appendix for Non-GAAP reconciliations
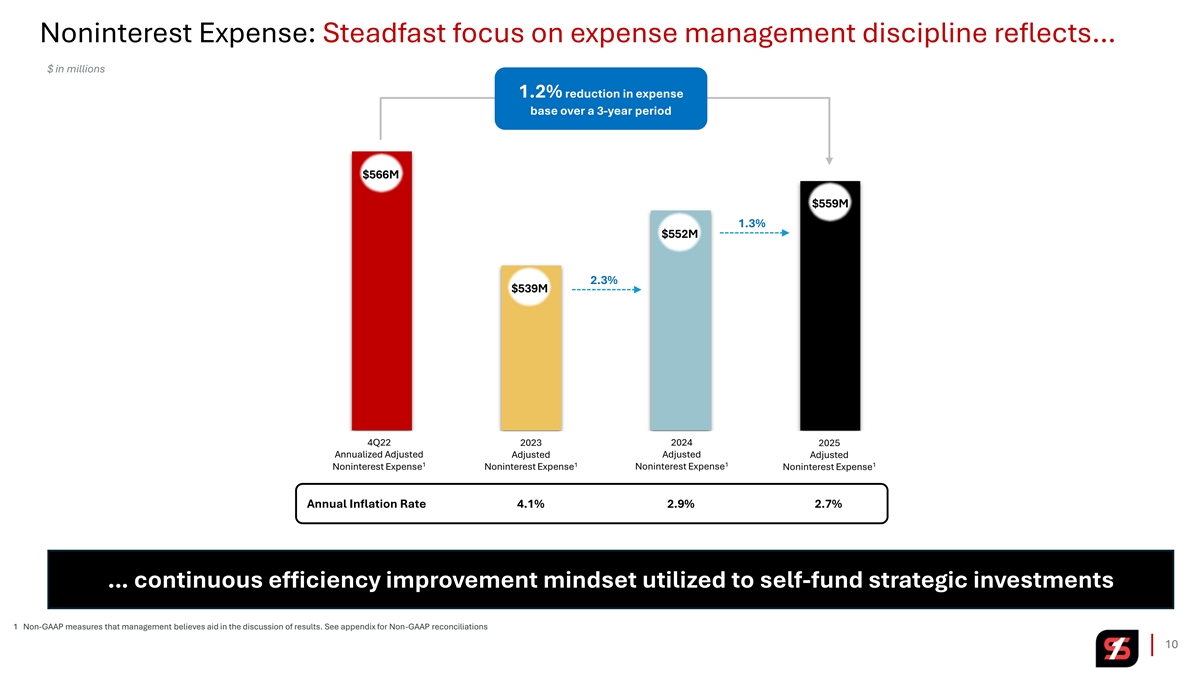
Noninterest Expense: Steadfast focus on expense management discipline reflects… $ in millions 1.2% reduction in expense base over a 3-year period $566M $559M 1.3% $552M 2.3% $539M 4Q22 2023 2024 2025 Annualized Adjusted Adjusted Adjusted Adjusted 1 1 1 1 Noninterest Expense Noninterest Expense Noninterest Expense Noninterest Expense Annual Inflation Rate 4.1% 2.9% 2.7% … continuous efficiency improvement mindset utilized to self-fund strategic investments 1 Non-GAAP measures that management believes aid in the discussion of results. See appendix for Non-GAAP reconciliations 10

Deposits, Interest Rate Sensitivity, Hedging Program and Capital 11
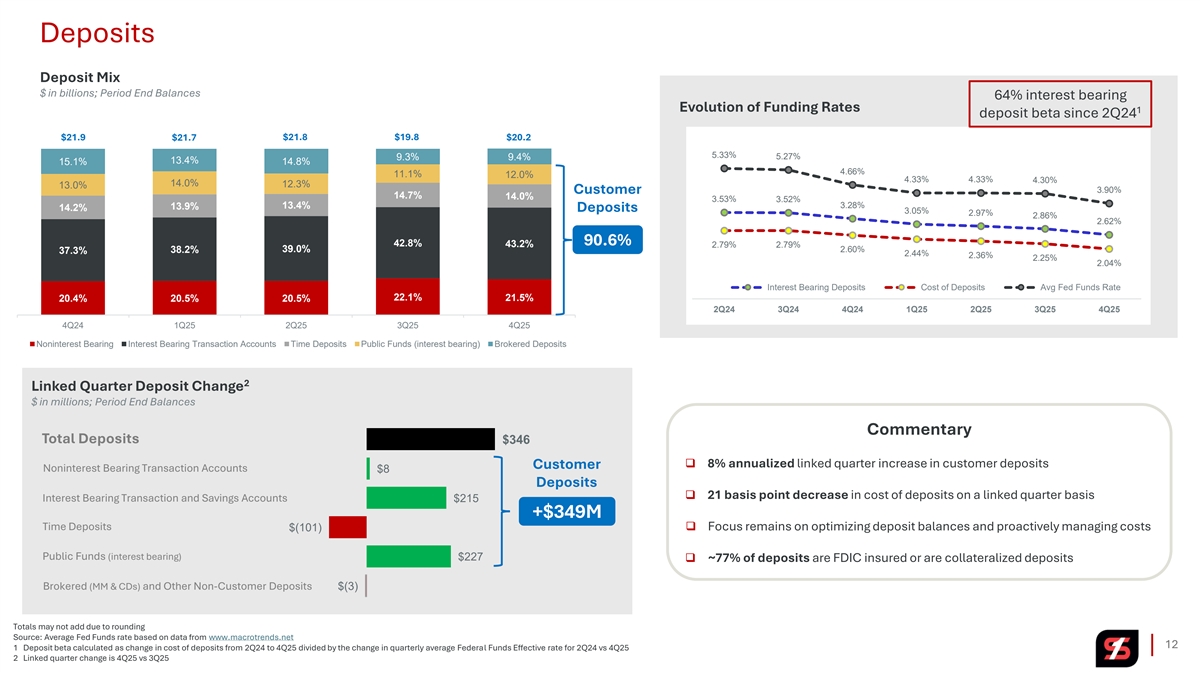
Deposits Deposit Mix $ in billions; Period End Balances 64% interest bearing Evolution of Funding Rates 1 deposit beta since 2Q24 $21.8 $19.8 $21.9 $21.7 $20.2 5.33% 9.3% 9.4% 5.27% 13.4% 15.1% 14.8% 4.66% 11.1% 12.0% 4.33% 4.33% 4.30% 14.0% 12.3% 13.0% Customer 3.90% 14.7% 14.0% 3.53% 3.52% 13.4% 3.28% 13.9% 14.2% Deposits 3.05% 2.97% 2.86% 2.62% 42.8% 90.6% 43.2% 2.79% 2.79% 39.0% 2.60% 37.3% 38.2% 2.44% 2.36% 2.25% 2.04% Interest Bearing Deposits Cost of Deposits Avg Fed Funds Rate 22.1% 21.5% 20.4% 20.5% 20.5% 2Q24 3Q24 4Q24 1Q25 2Q25 3Q25 4Q25 4Q24 1Q25 2Q25 3Q25 4Q25 Noninterest Bearing Interest Bearing Transaction Accounts Time Deposits Public Funds (interest bearing) Brokered Deposits 2 Linked Quarter Deposit Change $ in millions; Period End Balances Commentary Total Deposits $346 ❑ 8% annualized linked quarter increase in customer deposits Customer Noninterest Bearing Transaction Accounts $8 Deposits ❑ 21 basis point decrease in cost of deposits on a linked quarter basis Interest Bearing Transaction and Savings Accounts $215 +$349M Time Deposits $(101)❑ Focus remains on optimizing deposit balances and proactively managing costs Public Funds (interest bearing) $227 ❑ ~77% of deposits are FDIC insured or are collateralized deposits Brokered (MM & CDs) and Other Non-Customer Deposits $(3) Totals may not add due to rounding Source: Average Fed Funds rate based on data from www.macrotrends.net 12 1 Deposit beta calculated as change in cost of deposits from 2Q24 to 4Q25 divided by the change in quarterly average Federal Funds Effective rate for 2Q24 vs 4Q25 2 Linked quarter change is 4Q25 vs 3Q25
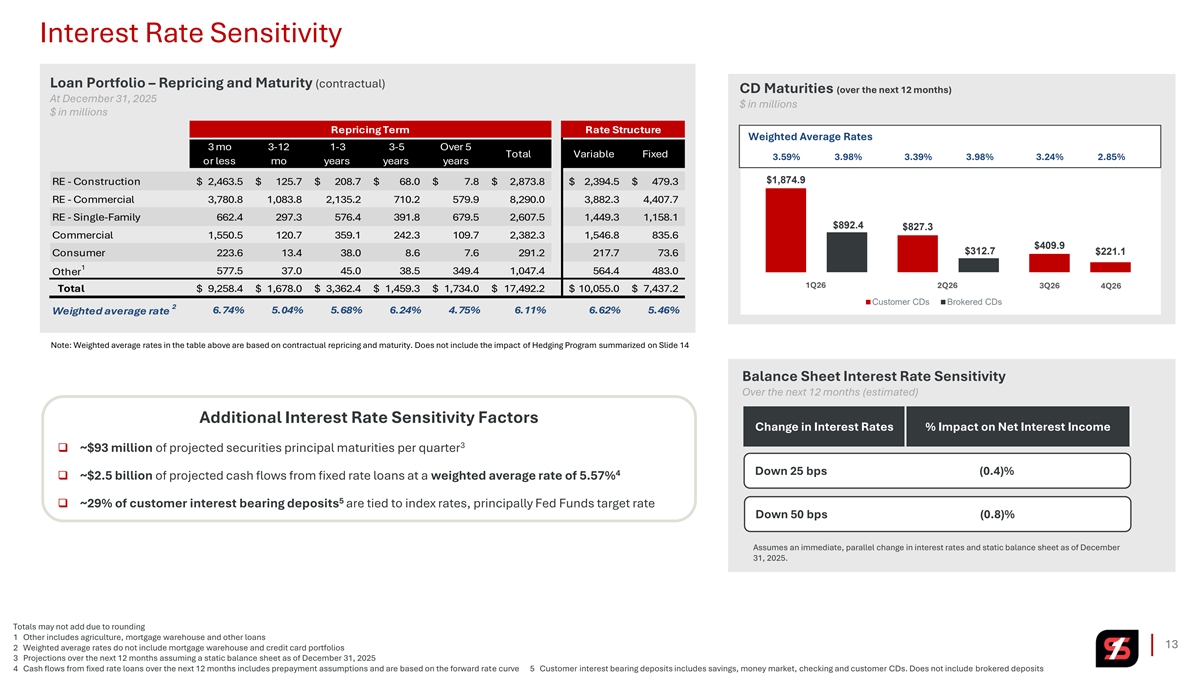
Interest Rate Sensitivity Loan Portfolio – Repricing and Maturity (contractual) CD Maturities (over the next 12 months) At December 31, 2025 $ in millions $ in millions Repricing Term Rate Structure Weighted Average Rates 3 mo 3-12 1-3 3-5 Over 5 Total Variable Fixed 3.59% 3.98% 3.39% 3.98% 3.24% 2.85% or less mo years years years $1,874.9 RE - Construction $ 2,463.5 $ 125.7 $ 208.7 $ 68.0 $ 7.8 $ 2,873.8 $ 2,394.5 $ 479.3 RE - Commercial 3,780.8 1,083.8 2,135.2 710.2 579.9 8,290.0 3,882.3 4,407.7 RE - Single-Family 662.4 297.3 576.4 391.8 679.5 2,607.5 1,449.3 1,158.1 $892.4 $827.3 Commercial 1,550.5 120.7 359.1 242.3 109.7 2,382.3 1,546.8 835.6 $409.9 $312.7 $221.1 Consumer 223.6 13.4 38.0 8.6 7.6 291.2 217.7 73.6 1 Other 577.5 37.0 45.0 38.5 349.4 1,047.4 564.4 483.0 1Q26 2Q26 3Q26 4Q26 Total $ 9,258.4 $ 1,678.0 $ 3,362.4 $ 1,459.3 $ 1,734.0 $ 17,492.2 $ 10,055.0 $ 7,437.2 Customer CDs Brokered CDs 2 6.74% 5.04% 5.68% 6.24% 4.75% 6.11% 6.62% 5.46% Weighted average rate Note: Weighted average rates in the table above are based on contractual repricing and maturity. Does not include the impact of Hedging Program summarized on Slide 14 Balance Sheet Interest Rate Sensitivity Over the next 12 months (estimated) Additional Interest Rate Sensitivity Factors Change in Interest Rates % Impact on Net Interest Income 3 ❑ ~$93 million of projected securities principal maturities per quarter Down 25 bps (0.4)% 4 ❑ ~$2.5 billion of projected cash flows from fixed rate loans at a weighted average rate of 5.57% 5 ❑ ~29% of customer interest bearing deposits are tied to index rates, principally Fed Funds target rate Down 50 bps (0.8)% Assumes an immediate, parallel change in interest rates and static balance sheet as of December 31, 2025. Totals may not add due to rounding 1 Other includes agriculture, mortgage warehouse and other loans 13 2 Weighted average rates do not include mortgage warehouse and credit card portfolios 3 Projections over the next 12 months assuming a static balance sheet as of December 31, 2025 4 Cash flows from fixed rate loans over the next 12 months includes prepayment assumptions and are based on the forward rate curve 5 Customer interest bearing deposits includes savings, money market, checking and customer CDs. Does not include brokered deposits
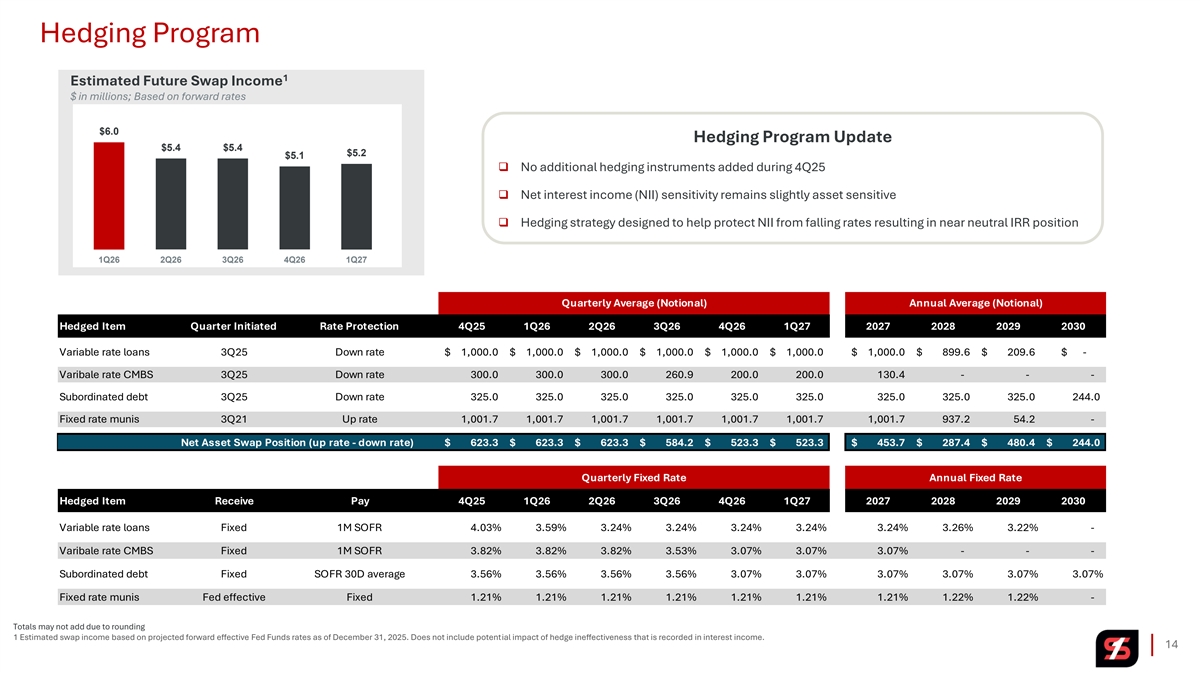
Hedging Program 1 Estimated Future Swap Income $ in millions; Based on forward rates $6.0 Hedging Program Update $5.4 $5.4 $5.2 $5.1 ❑ No additional hedging instruments added during 4Q25 ❑ Net interest income (NII) sensitivity remains slightly asset sensitive ❑ Hedging strategy designed to help protect NII from falling rates resulting in near neutral IRR position 1Q26 2Q26 3Q26 4Q26 1Q27 Quarterly Average (Notional) Annual Average (Notional) Hedged Item Quarter Initiated Rate Protection 4Q25 1Q26 2Q26 3Q26 4Q26 1Q27 2027 2028 2029 2030 Variable rate loans 3Q25 Down rate $ 1,000.0 $ 1 ,000.0 $ 1,000.0 $ 1 ,000.0 $ 1 ,000.0 $ 1,000.0 $ 1 ,000.0 $ 899.6 $ 209.6 $ - Varibale rate CMBS 3Q25 Down rate 300.0 300.0 300.0 260.9 200.0 200.0 130.4 - - - Subordinated debt 3Q25 Down rate 325.0 325.0 325.0 325.0 325.0 325.0 325.0 325.0 325.0 244.0 Fixed rate munis 3Q21 Up rate 1,001.7 1,001.7 1,001.7 1,001.7 1,001.7 1,001.7 1,001.7 937.2 54.2 - Net Asset Swap Position (up rate - down rate) $ 623.3 $ 623.3 $ 623.3 $ 584.2 $ 523.3 $ 523.3 $ 453.7 $ 287.4 $ 480.4 $ 244.0 Quarterly Fixed Rate Annual Fixed Rate Hedged Item Receive Pay 4Q25 1Q26 2Q26 3Q26 4Q26 1Q27 2027 2028 2029 2030 Variable rate loans Fixed 1M SOFR 4.03% 3.59% 3.24% 3.24% 3.24% 3.24% 3.24% 3.26% 3.22% - Varibale rate CMBS Fixed 1M SOFR 3.82% 3.82% 3.82% 3.53% 3.07% 3.07% 3.07% - - - Subordinated debt Fixed SOFR 30D average 3.56% 3.56% 3.56% 3.56% 3.07% 3.07% 3.07% 3.07% 3.07% 3.07% Fixed rate munis Fed effective Fixed 1.21% 1.21% 1.21% 1.21% 1.21% 1.21% 1.21% 1.22% 1.22% - Totals may not add due to rounding 1 Estimated swap income based on projected forward effective Fed Funds rates as of December 31, 2025. Does not include potential impact of hedge ineffectiveness that is recorded in interest income. 14
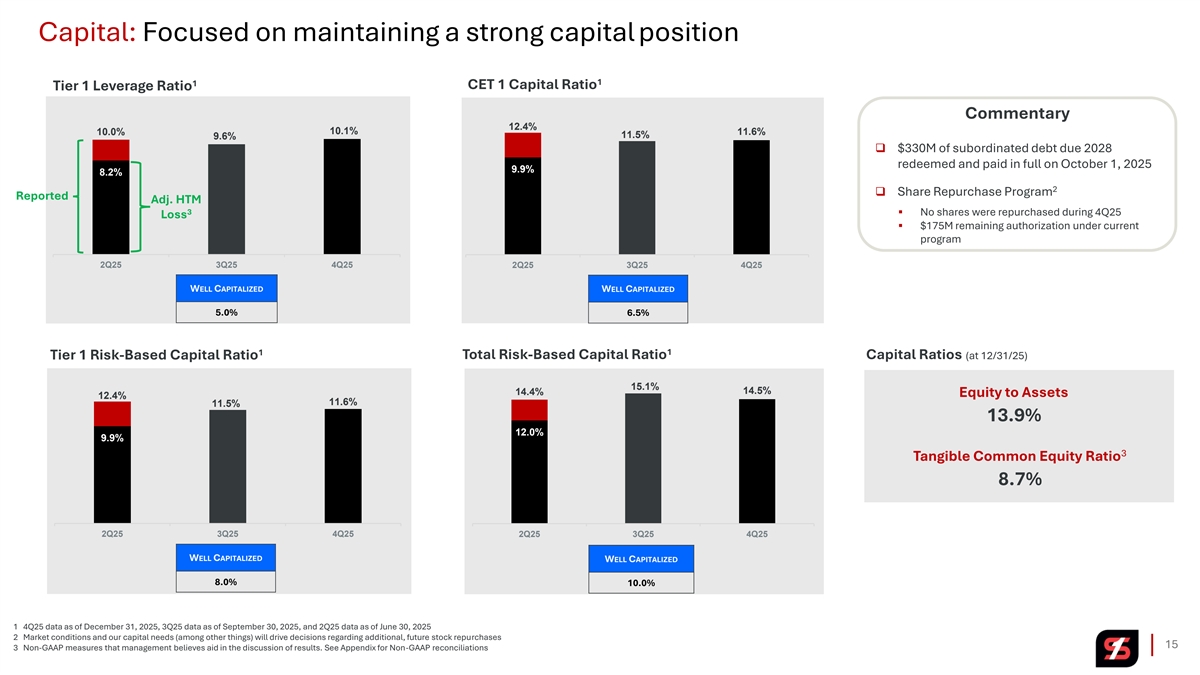
Capital: Focused on maintaining a strong capital position 1 1 CET 1 Capital Ratio Tier 1 Leverage Ratio Commentary 12.4% 10.0% 10.1% 11.6% 11.5% 9.6% ❑ $330M of subordinated debt due 2028 redeemed and paid in full on October 1, 2025 9.9% 8.2% 2 ❑ Share Repurchase Program Reported Adj. HTM 3 ▪ No shares were repurchased during 4Q25 Loss ▪ $175M remaining authorization under current program 2Q25 3Q25 4Q25 2Q25 3Q25 4Q25 WELL CAPITALIZED WELL CAPITALIZED 5.0% 6.5% 1 1 Total Risk-Based Capital Ratio Capital Ratios (at 12/31/25) Tier 1 Risk-Based Capital Ratio 15.1% 14.5% 14.4% Equity to Assets 12.4% 11.6% 11.5% 13.9% 12.0% 9.9% 3 Tangible Common Equity Ratio 8.7% 2Q25 3Q25 4Q25 2Q25 3Q25 4Q25 WELL CAPITALIZED WELL CAPITALIZED 8.0% 10.0% 1 4Q25 data as of December 31, 2025, 3Q25 data as of September 30, 2025, and 2Q25 data as of June 30, 2025 2 Market conditions and our capital needs (among other things) will drive decisions regarding additional, future stock repurchases 15 3 Non-GAAP measures that management believes aid in the discussion of results. See Appendix for Non-GAAP reconciliations

Loan Portfolio 16
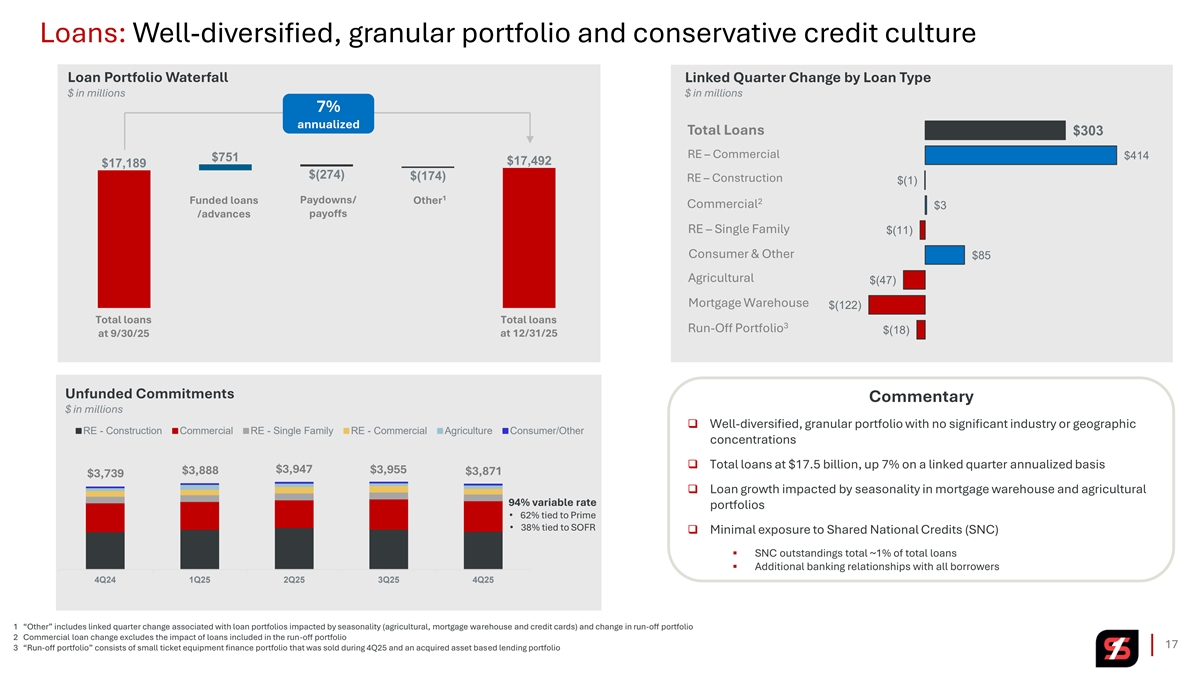
Loans: Well-diversified, granular portfolio and conservative credit culture Loan Portfolio Waterfall Linked Quarter Change by Loan Type $ in millions $ in millions 7% annualized Total Loans $303 RE – Commercial $414 $751 $17,492 $17,189 $(274) $(174) RE – Construction $(1) 1 Funded loans Paydowns/ Other 2 Commercial $3 /advances payoffs RE – Single Family $(11) Consumer & Other $85 Agricultural $(47) Mortgage Warehouse $(122) Total loans Total loans 3 Run-Off Portfolio $(18) at 9/30/25 at 12/31/25 Unfunded Commitments Commentary $ in millions ❑ Well-diversified, granular portfolio with no significant industry or geographic RE - Construction Commercial RE - Single Family RE - Commercial Agriculture Consumer/Other concentrations ❑ Total loans at $17.5 billion, up 7% on a linked quarter annualized basis $3,947 $3,955 $3,888 $3,871 $3,739 ❑ Loan growth impacted by seasonality in mortgage warehouse and agricultural 94% variable rate portfolios • 62% tied to Prime • 38% tied to SOFR ❑ Minimal exposure to Shared National Credits (SNC) ▪ SNC outstandings total ~1% of total loans ▪ Additional banking relationships with all borrowers 4Q24 1Q25 2Q25 3Q25 4Q25 1 “Other” includes linked quarter change associated with loan portfolios impacted by seasonality (agricultural, mortgage warehouse and credit cards) and change in run-off portfolio 2 Commercial loan change excludes the impact of loans included in the run-off portfolio 17 3 “Run-off portfolio” consists of small ticket equipment finance portfolio that was sold during 4Q25 and an acquired asset based lending portfolio
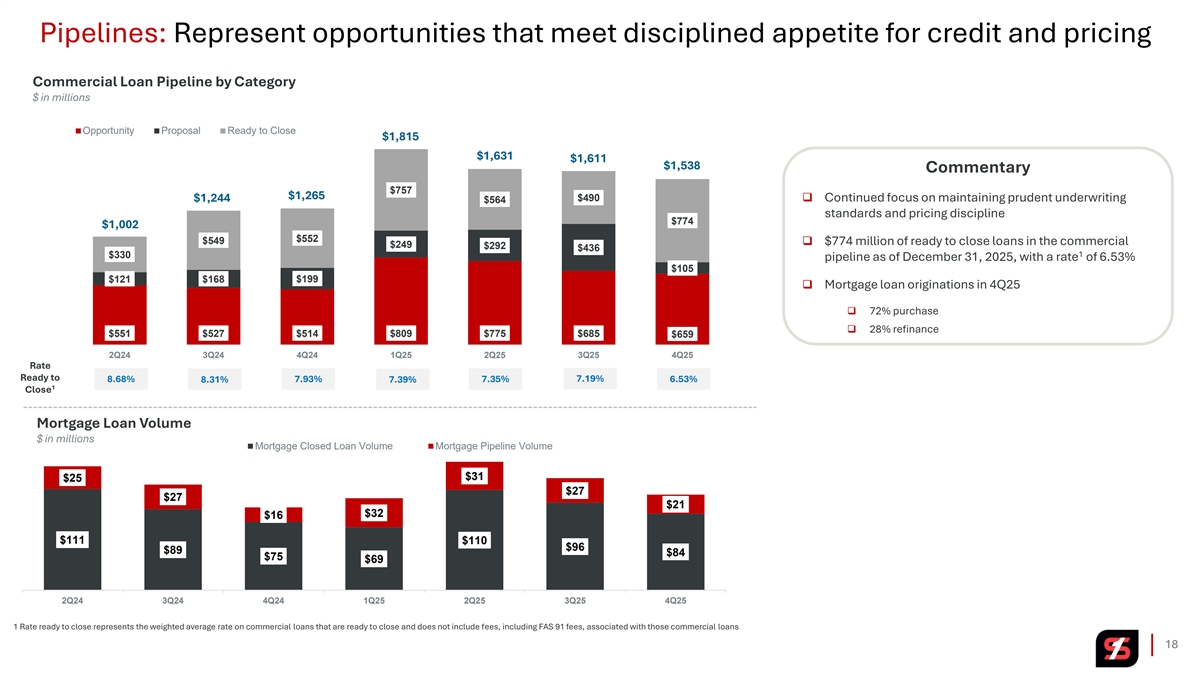
Pipelines: Represent opportunities that meet disciplined appetite for credit and pricing Commercial Loan Pipeline by Category $ in millions Opportunity Proposal Ready to Close $1,815 $1,631 $1,611 $1,538 Commentary $757 $1,265 $490 ❑ Continued focus on maintaining prudent underwriting $1,244 $564 standards and pricing discipline $774 $1,002 $552 $549 ❑ $774 million of ready to close loans in the commercial $249 $292 $436 1 $330 pipeline as of December 31, 2025, with a rate of 6.53% $105 $121 $168 $199 ❑ Mortgage loan originations in 4Q25 ❑ 72% purchase ❑ 28% refinance $551 $527 $514 $809 $775 $685 $659 2Q24 3Q24 4Q24 1Q25 2Q25 3Q25 4Q25 Rate Ready to 8.68% 8.31% 7.93% 7.39% 7.35% 7.19% 6.53% 1 Close Mortgage Loan Volume $ in millions Mortgage Closed Loan Volume Mortgage Pipeline Volume $31 $25 $27 $27 $21 $32 $16 $111 $110 $96 $89 $84 $75 $69 2Q24 3Q24 4Q24 1Q25 2Q25 3Q25 4Q25 1 Rate ready to close represents the weighted average rate on commercial loans that are ready to close and does not include fees, including FAS 91 fees, associated with those commercial loans 18
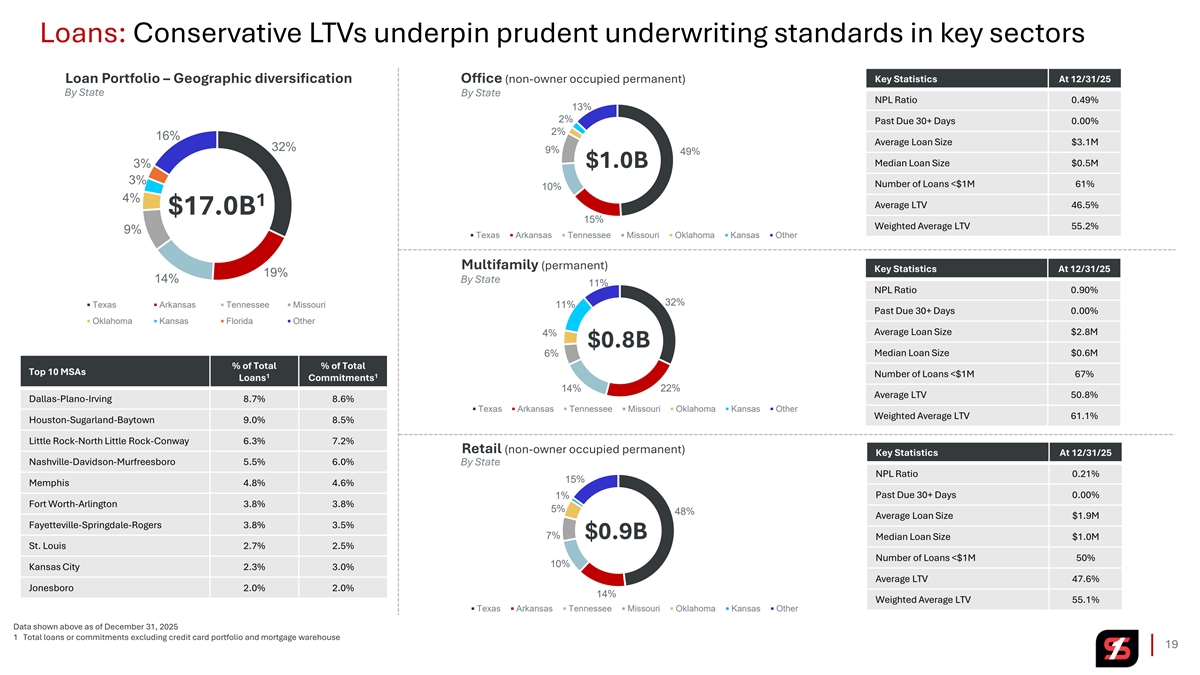
Loans: Conservative LTVs underpin prudent underwriting standards in key sectors Office (non-owner occupied permanent) Key Statistics At 12/31/25 Loan Portfolio – Geographic diversification By State By State NPL Ratio 0.49% 13% 2% Past Due 30+ Days 0.00% 2% 16% Average Loan Size $3.1M 32% 9% 49% Median Loan Size $0.5M 3% $1.0B 3% Number of Loans <$1M 61% 10% 4% 1 Average LTV 46.5% $17.0B 15% Weighted Average LTV 55.2% 9% Texas Arkansas Tennessee Missouri Oklahoma Kansas Other Multifamily (permanent) Key Statistics At 12/31/25 19% 14% By State 11% NPL Ratio 0.90% 32% Texas Arkansas Tennessee Missouri 11% Past Due 30+ Days 0.00% Oklahoma Kansas Florida Other Average Loan Size $2.8M 4% $0.8B Median Loan Size $0.6M 6% % of Total % of Total Top 10 MSAs Number of Loans <$1M 67% 1 1 Loans Commitments 22% 14% Average LTV 50.8% Dallas-Plano-Irving 8.7% 8.6% Texas Arkansas Tennessee Missouri Oklahoma Kansas Other Weighted Average LTV 61.1% Houston-Sugarland-Baytown 9.0% 8.5% Little Rock-North Little Rock-Conway 6.3% 7.2% Retail (non-owner occupied permanent) Key Statistics At 12/31/25 Nashville-Davidson-Murfreesboro 5.5% 6.0% By State NPL Ratio 0.21% 15% Memphis 4.8% 4.6% 1% Past Due 30+ Days 0.00% Fort Worth-Arlington 3.8% 3.8% 5% 48% Average Loan Size $1.9M Fayetteville-Springdale-Rogers 3.8% 3.5% 7% $0.9B Median Loan Size $1.0M St. Louis 2.7% 2.5% Number of Loans <$1M 50% 10% Kansas City 2.3% 3.0% Average LTV 47.6% Jonesboro 2.0% 2.0% 14% Weighted Average LTV 55.1% Texas Arkansas Tennessee Missouri Oklahoma Kansas Other Data shown above as of December 31, 2025 1 Total loans or commitments excluding credit card portfolio and mortgage warehouse 19
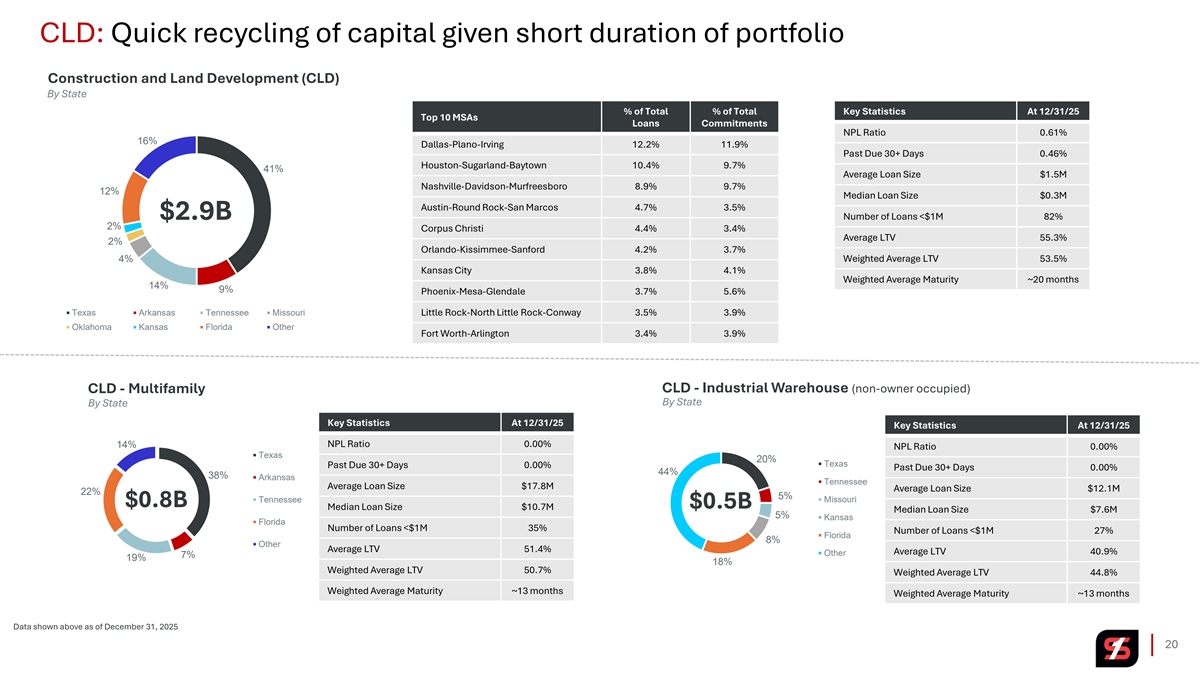
CLD: Quick recycling of capital given short duration of portfolio Construction and Land Development (CLD) By State % of Total % of Total Key Statistics At 12/31/25 Top 10 MSAs Loans Commitments NPL Ratio 0.61% 16% Dallas-Plano-Irving 12.2% 11.9% Past Due 30+ Days 0.46% Houston-Sugarland-Baytown 10.4% 9.7% 41% Average Loan Size $1.5M Nashville-Davidson-Murfreesboro 8.9% 9.7% 12% Median Loan Size $0.3M Austin-Round Rock-San Marcos 4.7% 3.5% $2.9B Number of Loans <$1M 82% 2% Corpus Christi 4.4% 3.4% Average LTV 55.3% 2% Orlando-Kissimmee-Sanford 4.2% 3.7% 4% Weighted Average LTV 53.5% Kansas City 3.8% 4.1% Weighted Average Maturity ~20 months 14% 9% Phoenix-Mesa-Glendale 3.7% 5.6% Texas Arkansas Tennessee Missouri Little Rock-North Little Rock-Conway 3.5% 3.9% Oklahoma Kansas Florida Other Fort Worth-Arlington 3.4% 3.9% CLD - Industrial Warehouse (non-owner occupied) CLD - Multifamily By State By State Key Statistics At 12/31/25 Key Statistics At 12/31/25 NPL Ratio 0.00% 14% NPL Ratio 0.00% Texas 20% Texas Past Due 30+ Days 0.00% Past Due 30+ Days 0.00% 44% 38% Arkansas Tennessee Average Loan Size $17.8M Average Loan Size $12.1M 22% 5% Tennessee Missouri $0.8B $0.5B Median Loan Size $10.7M Median Loan Size $7.6M 5% Kansas Florida Number of Loans <$1M 35% Number of Loans <$1M 27% Florida 8% Other Average LTV 51.4% Average LTV 40.9% Other 7% 19% 18% Weighted Average LTV 50.7% Weighted Average LTV 44.8% Weighted Average Maturity ~13 months Weighted Average Maturity ~13 months Data shown above as of December 31, 2025 20
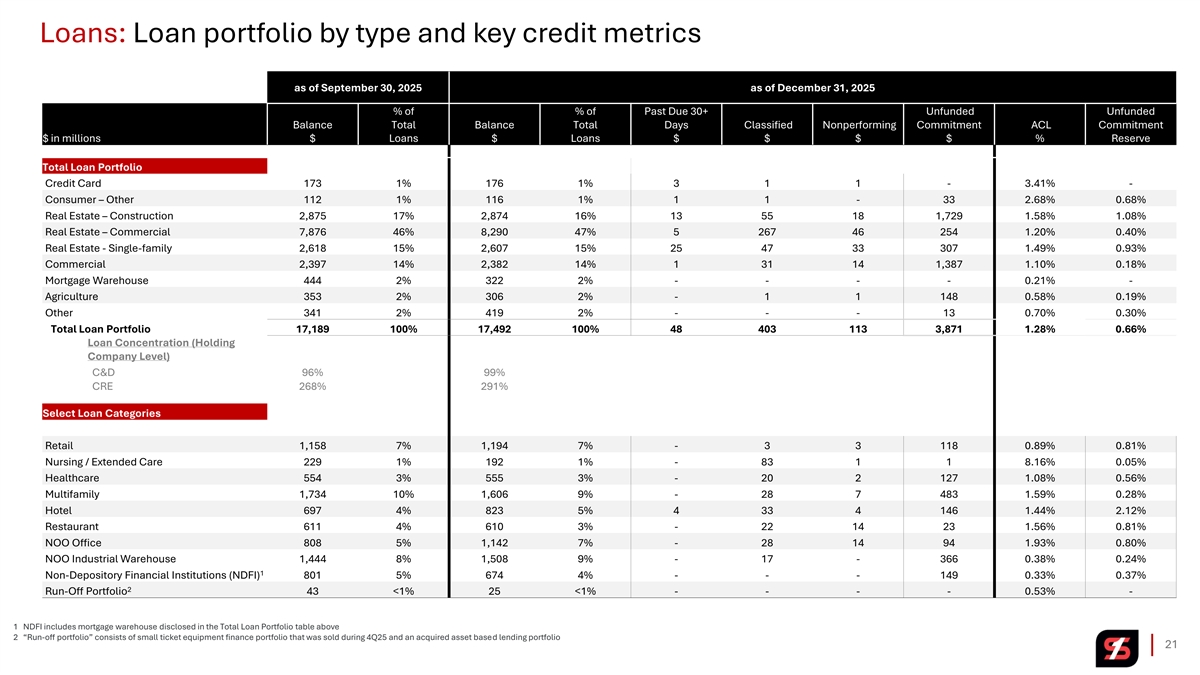
Loans: Loan portfolio by type and key credit metrics as of September 30, 2025 as of December 31, 2025 % of % of Past Due 30+ Unfunded Unfunded Balance Total Balance Total Days Classified Nonperforming Commitment ACL Commitment $ in millions $ Loans $ Loans $ $ $ $ % Reserve Total Loan Portfolio Credit Card 173 1% 176 1% 3 1 1 - 3.41% - Consumer – Other 112 1% 116 1% 1 1 - 33 2.68% 0.68% Real Estate – Construction 2,875 17% 2,874 16% 13 55 18 1,729 1.58% 1.08% Real Estate – Commercial 7,876 46% 8,290 47% 5 267 46 254 1.20% 0.40% Real Estate - Single-family 2,618 15% 2,607 15% 25 47 33 307 1.49% 0.93% Commercial 2,397 14% 2,382 14% 1 31 14 1,387 1.10% 0.18% Mortgage Warehouse 444 2% 322 2% - - - - 0.21% - Agriculture 353 2% 306 2% - 1 1 148 0.58% 0.19% Other 341 2% 419 2% - - - 13 0.70% 0.30% Total Loan Portfolio 17,189 100% 17,492 100% 48 403 113 3,871 1.28% 0.66% Loan Concentration (Holding Company Level) C&D 96% 99% CRE 268% 291% Select Loan Categories Retail 1,158 7% 1,194 7% - 3 3 118 0.89% 0.81% Nursing / Extended Care 229 1% 192 1% - 83 1 1 8.16% 0.05% Healthcare 554 3% 555 3% - 20 2 127 1.08% 0.56% Multifamily 1,734 10% 1,606 9% - 28 7 483 1.59% 0.28% Hotel 697 4% 823 5% 4 33 4 146 1.44% 2.12% Restaurant 611 4% 610 3% - 22 14 23 1.56% 0.81% NOO Office 808 5% 1,142 7% - 28 14 94 1.93% 0.80% NOO Industrial Warehouse 1,444 8% 1,508 9% - 17 - 366 0.38% 0.24% 1 Non-Depository Financial Institutions (NDFI) 801 5% 674 4% - - - 149 0.33% 0.37% 2 Run-Off Portfolio 43 <1% 25 <1% - - - - 0.53% - 1 NDFI includes mortgage warehouse disclosed in the Total Loan Portfolio table above 2 “Run-off portfolio” consists of small ticket equipment finance portfolio that was sold during 4Q25 and an acquired asset based lending portfolio 21

Credit Quality 22
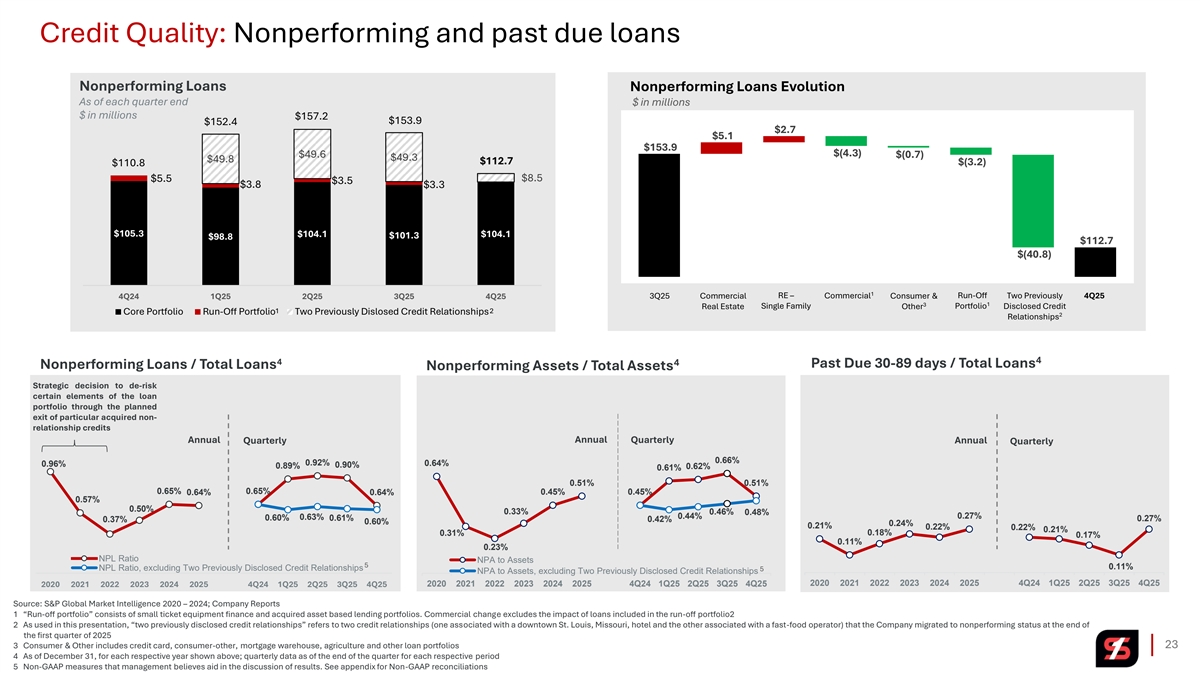
Credit Quality: Nonperforming and past due loans Nonperforming Loans Nonperforming Loans Evolution As of each quarter end $ in millions $ in millions $157.2 $153.9 $152.4 $2.7 $5.1 $153.9 $(4.3) $49.6 $(0.7) $49.3 $49.8 $112.7 $(3.2) $110.8 $8.5 $5.5 $3.5 $3.8 $3.3 $105.3 $104.1 $104.1 $101.3 $98.8 $112.7 $(40.8) 1 3Q25 Commercial RE – Commercial Consumer & Run-Off Two Previously 4Q25 4Q24 1Q25 2Q25 3Q25 4Q25 3 1 Single Family Portfolio Disclosed Credit Real Estate Other 1 2 Core Portfolio Run-Off Portfolio Two Previously Dislosed Credit Relationships 2 Relationships 4 4 4 Past Due 30-89 days / Total Loans Nonperforming Loans / Total Loans Nonperforming Assets / Total Assets Strategic decision to de-risk certain elements of the loan portfolio through the planned exit of particular acquired non- relationship credits Annual Annual Quarterly Quarterly Annual Quarterly 0.66% 0.92% 0.64% 0.96% 0.90% 0.89% 0.62% 0.61% 0.51% 0.51% 0.65% 0.65% 0.64% 0.64% 0.45% 0.45% 0.57% 0.50% 0.33% 0.46% 0.48% 0.44% 0.27% 0.63% 0.60% 0.61% 0.27% 0.37% 0.42% 0.60% 0.24% 0.21% 0.22% 0.22% 0.21% 0.31% 0.18% 0.17% 0.11% 0.23% NPL Ratio NPA to Assets 5 0.11% NPL Ratio, excluding Two Previously Disclosed Credit Relationships 5 NPA to Assets, excluding Two Previously Disclosed Credit Relationships 2020 2021 2022 2023 2024 2025 4Q24 1Q25 2Q25 3Q25 4Q25 2020 2021 2022 2023 2024 2025 4Q24 1Q25 2Q25 3Q25 4Q25 2020 2021 2022 2023 2024 2025 4Q24 1Q25 2Q25 3Q25 4Q25 Source: S&P Global Market Intelligence 2020 – 2024; Company Reports 1 “Run-off portfolio” consists of small ticket equipment finance and acquired asset based lending portfolios. Commercial change excludes the impact of loans included in the run-off portfolio2 2 As used in this presentation, “two previously disclosed credit relationships” refers to two credit relationships (one associated with a downtown St. Louis, Missouri, hotel and the other associated with a fast-food operator) that the Company migrated to nonperforming status at the end of the first quarter of 2025 3 Consumer & Other includes credit card, consumer-other, mortgage warehouse, agriculture and other loan portfolios 23 4 As of December 31, for each respective year shown above; quarterly data as of the end of the quarter for each respective period 5 Non-GAAP measures that management believes aid in the discussion of results. See appendix for Non-GAAP reconciliations
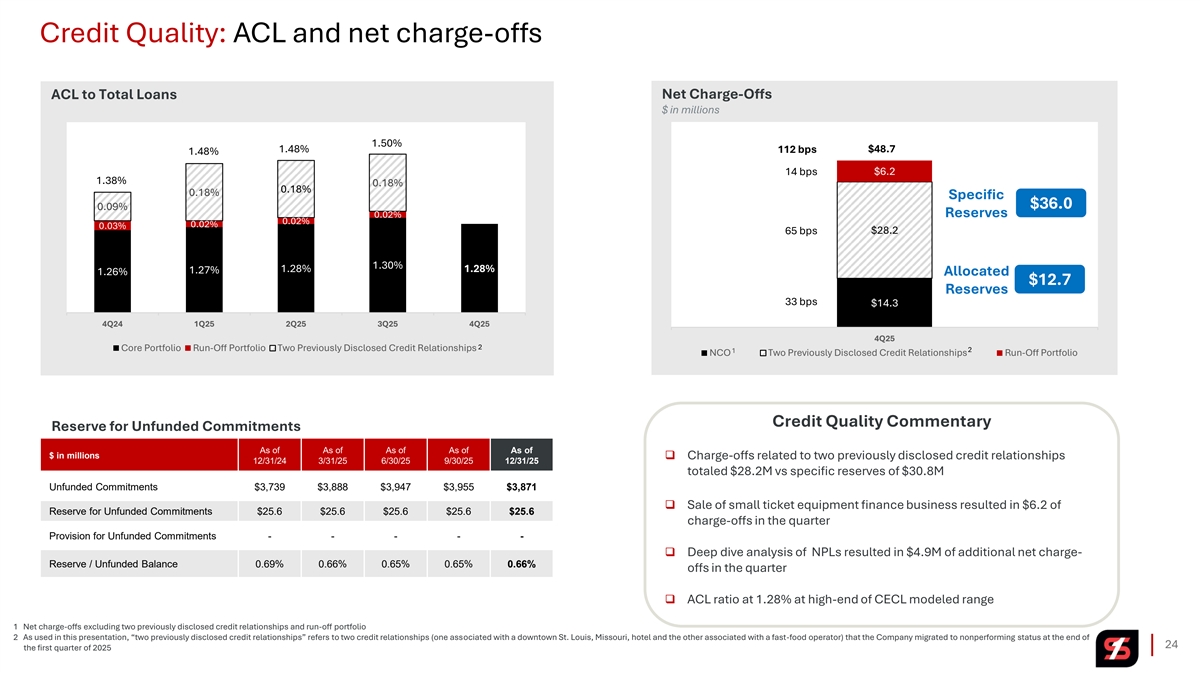
Credit Quality: ACL and net charge-offs ACL to Total Loans Net Charge-Offs $ in millions 1.50% 1.48% $48.7 112 bps 1.48% 14 bps $6.2 1.38% 0.18% 0.18% 0.18% Specific $36.0 0.09% 0.02% Reserves 0.02% 0.02% 0.03% $28.2 65 bps 1.30% 1.28% 1.28% 1.27% 1.26% Allocated $12.7 Reserves 33 bps $14.3 1.00% 4Q24 1Q25 2Q25 3Q25 4Q25 4Q25 2 Core Portfolio Run-Off Portfolio Two Previously Disclosed Credit Relationships 2 1 NCO Two Previously Disclosed Credit Relationships Run-Off Portfolio Credit Quality Commentary Reserve for Unfunded Commitments As of As of As of As of As of $ in millions ❑ Charge-offs related to two previously disclosed credit relationships 12/31/24 3/31/25 6/30/25 9/30/25 12/31/25 totaled $28.2M vs specific reserves of $30.8M Unfunded Commitments $3,739 $3,888 $3,947 $3,955 $3,871 ❑ Sale of small ticket equipment finance business resulted in $6.2 of Reserve for Unfunded Commitments $25.6 $25.6 $25.6 $25.6 $25.6 charge-offs in the quarter Provision for Unfunded Commitments - - - - - ❑ Deep dive analysis of NPLs resulted in $4.9M of additional net charge- Reserve / Unfunded Balance 0.69% 0.66% 0.65% 0.65% 0.66% offs in the quarter ❑ ACL ratio at 1.28% at high-end of CECL modeled range 1 Net charge-offs excluding two previously disclosed credit relationships and run-off portfolio 2 As used in this presentation, “two previously disclosed credit relationships” refers to two credit relationships (one associated with a downtown St. Louis, Missouri, hotel and the other associated with a fast-food operator) that the Company migrated to nonperforming status at the end of 24 the first quarter of 2025

Outlook 25
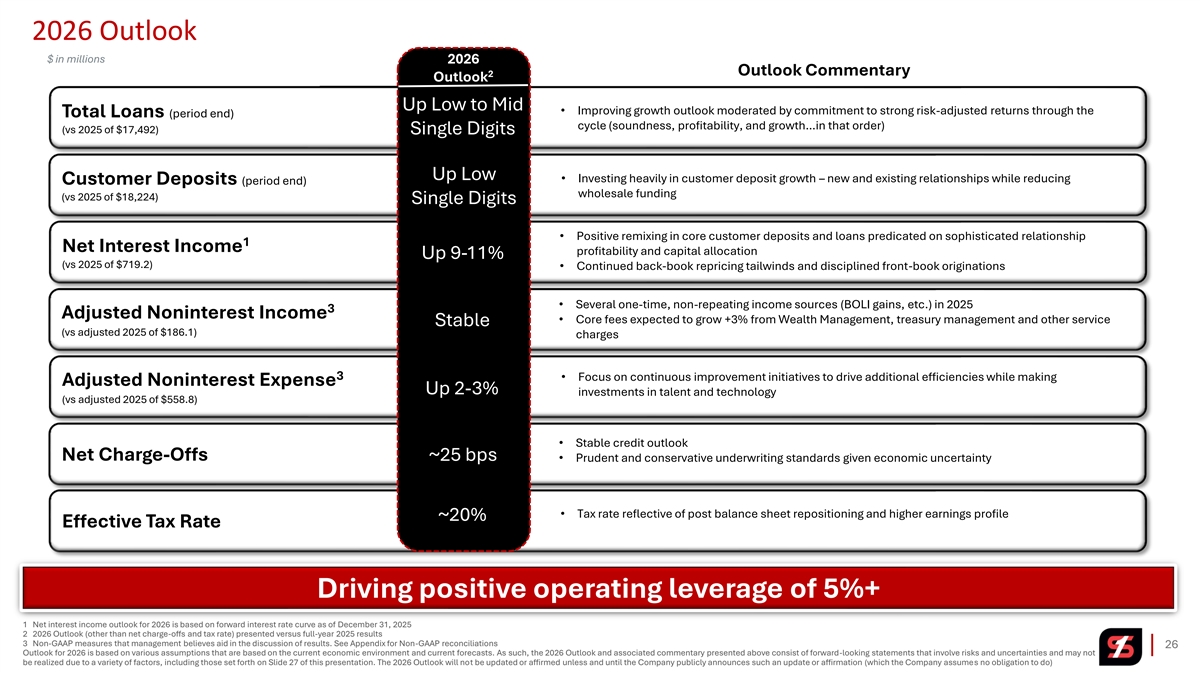
2026 Outlook $ in millions 2026 Outlook Commentary 2 Outlook Up Low to Mid • Improving growth outlook moderated by commitment to strong risk-adjusted returns through the Total Loans (period end) cycle (soundness, profitability, and growth…in that order) (vs 2025 of $17,492) Single Digits Up Low • Investing heavily in customer deposit growth – new and existing relationships while reducing Customer Deposits (period end) wholesale funding (vs 2025 of $18,224) Single Digits • Positive remixing in core customer deposits and loans predicated on sophisticated relationship 1 Net Interest Income profitability and capital allocation Up 9-11% (vs 2025 of $719.2) • Continued back-book repricing tailwinds and disciplined front-book originations • Several one-time, non-repeating income sources (BOLI gains, etc.) in 2025 3 Adjusted Noninterest Income • Core fees expected to grow +3% from Wealth Management, treasury management and other service Stable (vs adjusted 2025 of $186.1) charges 3 • Focus on continuous improvement initiatives to drive additional efficiencies while making Adjusted Noninterest Expense Up 2-3% investments in talent and technology (vs adjusted 2025 of $558.8) • Stable credit outlook Net Charge-Offs ~25 bps • Prudent and conservative underwriting standards given economic uncertainty • Tax rate reflective of post balance sheet repositioning and higher earnings profile ~20% Effective Tax Rate Driving positive operating leverage of 5%+ 1 Net interest income outlook for 2026 is based on forward interest rate curve as of December 31, 2025 2 2026 Outlook (other than net charge-offs and tax rate) presented versus full-year 2025 results 3 Non-GAAP measures that management believes aid in the discussion of results. See Appendix for Non-GAAP reconciliations 26 Outlook for 2026 is based on various assumptions that are based on the current economic environment and current forecasts. As such, the 2026 Outlook and associated commentary presented above consist of forward-looking statements that involve risks and uncertainties and may not be realized due to a variety of factors, including those set forth on Slide 27 of this presentation. The 2026 Outlook will not be updated or affirmed unless and until the Company publicly announces such an update or affirmation (which the Company assumes no obligation to do)
Forward-Looking Statements and Non-GAAP Financial Measures Forward-Looking Statements. Certain statements by Simmons First National Corporation (the “Company”, which where appropriate includes the Company’s wholly-owned banking subsidiary, Simmons Bank) contained in this presentation may not be based on historical facts and should be considered forward-looking statements within the meaning of the Private Securities Litigation Reform Act of 1995. These forward-looking statements may be identified by reference to a future period(s) or by the use of forward-looking terminology, such as anticipate, “believe,” “continue,” estimate, expect, foresee,“ “indicate,” “plan,” “potential,” “project,” “target,” may, might, will, would, could,“ “should,” “likely” or intend, future or conditional verb tenses, and variations or negatives of such terms or by similar expressions. These forward-looking statements include, without limitation, statements relating to the Company’s future growth; business strategies; product development; revenue; expenses (including interest expense and non-interest expenses); assets; loan demand (including loan growth, loan capacity, and other lending activity); deposit levels; dividends; asset quality; profitability; earnings; critical accounting policies; net interest margin; noninterest income; the Company's common stock repurchase program; adequacy of the allowance for credit losses; income tax deductions; credit quality; level of credit losses from lending commitments; interest rate sensitivity (including, among other things, the potential impact of rising rates); loan loss experience; liquidity; capital resources; future economic conditions and market risk; interest rates; the Company’s securities portfolio; legal and regulatory limitations and compliance and competition; anticipated loan principal reductions; projections regarding loan repricing; the repositioning guidance on slide 6; the interest rate sensitivity estimates and projections set forth on slide 13; the estimates related to the hedging program (including estimated future swap income) set forth on slide 14; and the 2026 Outlook on slide 26. Readers are cautioned not to place undue reliance on the forward-looking statements contained in this presentation in that actual results could differ materially from those indicated in or implied by such forward-looking statements due to a variety of factors. These factors include, but are not limited to, changes in the Company's operating or expansion strategy; the availability of and costs associated with obtaining adequate and timely sources of liquidity; changes in credit quality; changes in general market and economic conditions; increased unemployment; labor shortages; possible adverse rulings, judgments, fines, settlements and other outcomes of pending or future litigation; the ability of the Company to collect amounts due under loan agreements; significant increases in nonaccrual loan balances; changes in consumer preferences and loan demand; the effectiveness of the Company's interest rate risk management strategies; laws and regulations affecting financial institutions in general or relating to taxes; the effect of pending or future legislation; changes in governmental administrations; the ability of the Company to repurchase its common stock on favorable terms; the ability of the Company to successfully manage and implement its acquisition strategy and integrate acquired institutions; changes in tariff policies; difficulties and delays in integrating an acquired business or fully realizing cost savings and other benefits of mergers and acquisitions; changes in interest rates, deposit flows, real estate values, and capital markets; increased inflation; customer acceptance of the Company's products and services and changes in customer behaviors; changes or disruptions in technology and IT systems (including cyber or other information technology threats, attacks and events); changes in accounting principles relating to loan loss recognition (current expected credit losses, or CECL); fraud that results in material losses or that we have not discovered yet that may result in material losses; the benefits associated with the Company’s early retirement program; pandemics or significant health hazards, severe weather conditions, natural disasters, terrorist activities, political crises, war, and other military conflicts (including the ongoing military conflicts in the Middle East and between Russia and Ukraine) or other major events, or the prospect of these events; increased competition in the markets in which the Company operates and from non-bank financial institutions; changes in governmental policies; the effects of a government shutdown; loss of key employees; reliance on third parties for key services; the soundness of other financial institutions and any indirect exposure related to the closings of other financial institutions and their impact on the broader market through other customers, suppliers and partners, or that the conditions which resulted in the liquidity concerns experienced by closed financial institutions may also adversely impact, directly or indirectly, other financial institutions and market participants with which the Company has commercial or deposit relationships; increased delinquency and foreclosure rates on commercial real estate and other loans; and other risk factors. Other relevant risk factors are detailed in the Company’s Form 10-K for the year ended December 31, 2024, the Company’s Form 10-Q for the quarter ended September 30, 2025, and other reports that the Company has filed with or furnished to the U.S. Securities and Exchange Commission (the SEC), all of which are available from the SEC on its website, www.sec.gov. In addition, there can be no guarantee that the board of directors (“Board”) of the Company will approve a quarterly dividend in future quarters, and the timing, payment, and amount of future dividends (if any) is subject to, among other things, the discretion of the Board and may differ significantly from past dividends. Any forward-looking statement speaks only as of the date of this presentation, and the Company undertakes no obligation to update these forward-looking statements to reflect events or circumstances that occur after the date of this presentation. Annualized, quarterized, pro forma, projected and estimated numbers are used for illustrative purpose only, are based on hypothetical assumptions that may not accurately reflect future incomes, are not forecasts and are not guaranteed and may differ significantly from actual results. Non-GAAP Financial Measures. This presentation contains financial information determined by methods other than in accordance with U.S. generally accepted accounting principles (“GAAP”). The Company’s management uses these non-GAAP financial measures in their analysis of the Company’s performance and capital adequacy. These measures adjust GAAP performance measures to, among other things, include the tax benefit associated with revenue items that are tax-exempt, as well as exclude from net income (including on a per share diluted basis), pre-tax, pre-provision earnings, net charge-offs, income available to common shareholders, non-interest income, and non-interest expense certain income and expense items attributable to, for example, loss on sale of equipment finance business, loss on sale of securities, net branch right-sizing initiatives, early retirement program, termination of vendor and software services, and losses on early extinguishment of debt. In addition, the Company also presents certain figures based on tangible common stockholders’ equity, tangible assets and tangible book value, which exclude goodwill and other intangible assets, and presents certain other figures to include the effect that accumulated other comprehensive income could have on the Company’s capital levels. The Company further presents certain figures that are exclusive of the impact of deposits and/or loans acquired through acquisitions, mortgage warehouse loans, and/or energy loans, gains and/or losses on the sale of securities, or the Two Specific Credit Relationships. The Company’s management believes that these non-GAAP financial measures are useful to investors because they, among other things, present the results of the Company’s ongoing operations without the effect of mergers or other items not central to the Company’s ongoing business, present the Company’s capital inclusive of the potential impact of AOCI (primarily comprised of unrealized losses on securities), as well as normalize for tax effects and certain other effects. Management, therefore, believes presentations of these non-GAAP financial measures provide useful supplemental information that is essential to a proper understanding of the operating results of the Company’s ongoing businesses, and management uses these non-GAAP financial measures to assess the performance of the Company’s ongoing businesses as related to prior financial periods. These non-GAAP disclosures should not be viewed as a substitute for operating results determined in accordance with GAAP, nor are they necessarily comparable to non-GAAP performance measures that may be presented by other companies. Where non-GAAP financial measures are used, the comparable GAAP financial measure, as well as the reconciliation to the comparable GAAP financial measure, can be found in the appendix to this presentation. 27

Appendix 28
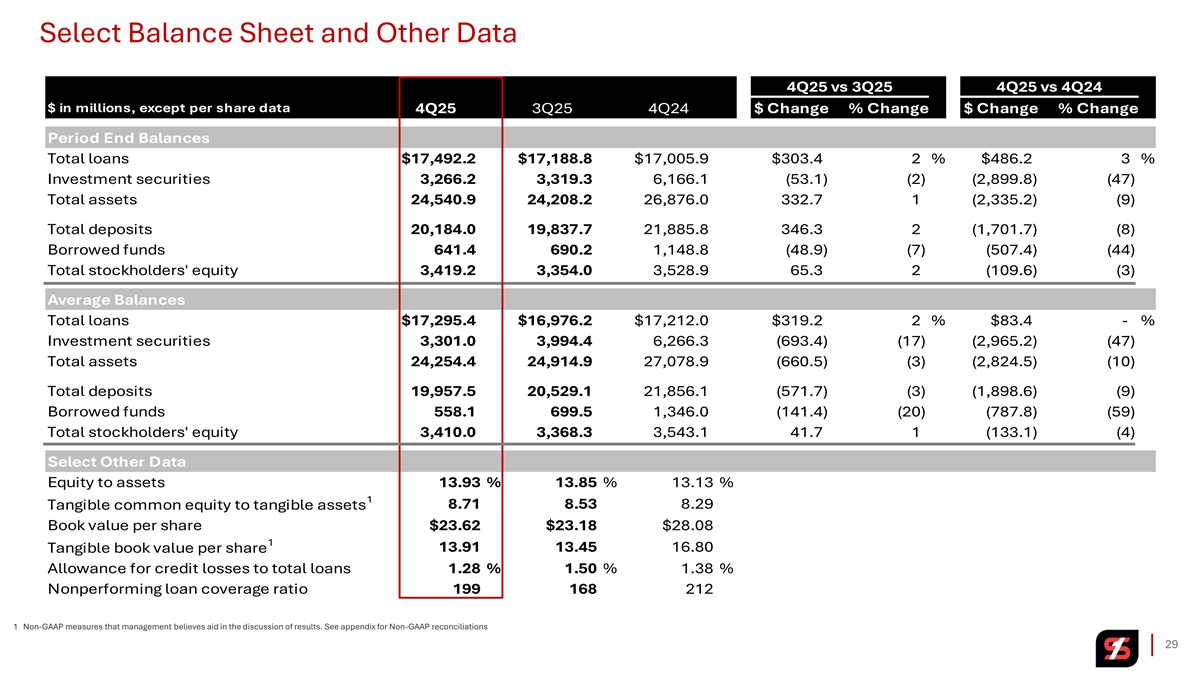
Select Balance Sheet and Other Data 4Q25 vs 3Q25 4Q25 vs 4Q24 $ in millions, except per share data 4Q25 3Q25 4Q24 $ Change % Change $ Change % Change Period End Balances Total loans $17,492.2 $17,188.8 $17,005.9 $303.4 2 % $486.2 3 % Investment securities 3,266.2 3, 319.3 6,166.1 (53.1) (2) ( 2,899.8) (47) Total assets 24,540.9 24,208.2 26,876.0 33 2.7 1 ( 2,335.2) (9) Total deposits 20,184.0 19 ,837.7 21 ,885.8 34 6.3 2 (1,701.7) (8) Borrowed funds 64 1.4 69 0.2 1,148.8 ( 48.9) (7) (507.4) (44) Total stockholders' equity 3, 419.2 3, 354.0 3, 528.9 65 .3 2 (109.6) (3) Average Balances Total loans $17,295.4 $16,976.2 $17,212.0 $319.2 2 % $83.4 - % Investment securities 3, 301.0 3,994.4 6,266.3 (693.4) (17) ( 2,965.2) (47) Total assets 24,254.4 24,914.9 27,078.9 ( 660.5) (3) (2,824.5) (10) Total deposits 19 ,957.5 20 ,529.1 21,856.1 (571.7) (3) ( 1,898.6) (9) Borrowed funds 55 8.1 69 9.5 1, 346.0 (141.4) (20) ( 787.8) (59) Total stockholders' equity 3,410.0 3, 368.3 3, 543.1 41.7 1 (133.1) (4) Select Other Data Equity to assets 13.93 % 13.85 % 13.13 % 1 8.71 8.53 8.29 Tangible common equity to tangible assets Book value per share $23.62 $23.18 $28.08 1 Tangible book value per share 13.91 13.45 16.80 Allowance for credit losses to total loans 1.28 % 1.50 % 1.38 % Nonperforming loan coverage ratio 199 168 212 1 Non-GAAP measures that management believes aid in the discussion of results. See appendix for Non-GAAP reconciliations 29
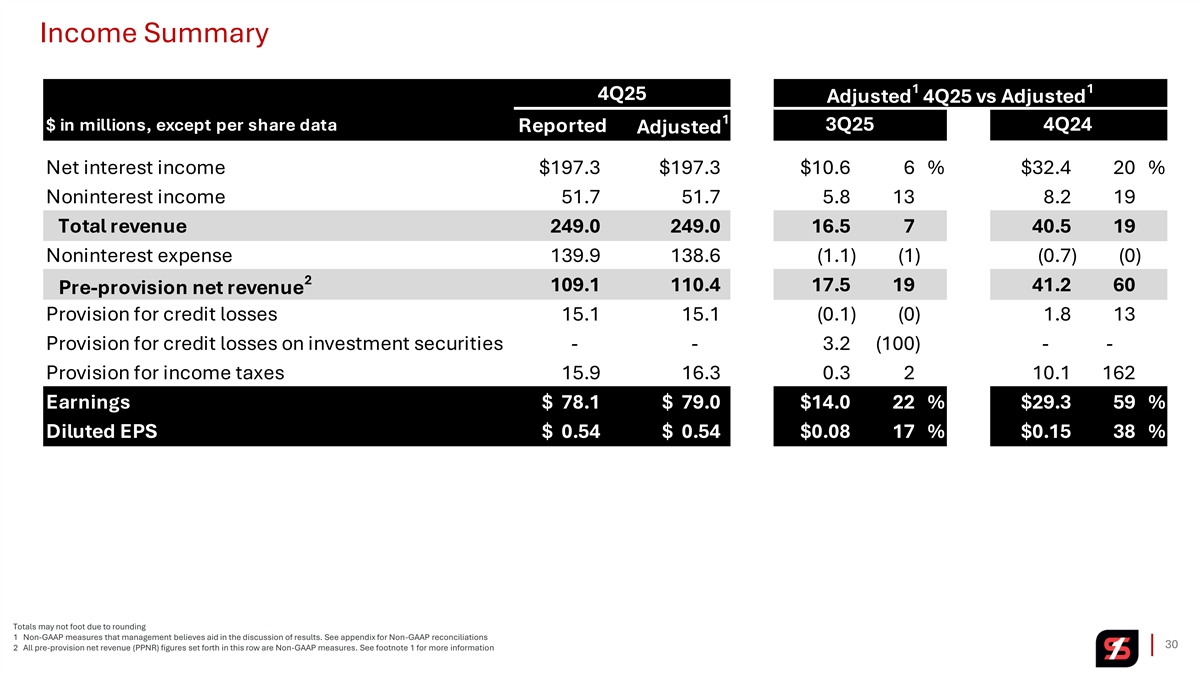
Income Summary 1 1 4Q25 Adjusted 4Q25 vs Adjusted 1 $ in millions, except per share data 3Q25 4Q24 Reported Adjusted Net interest income $197.3 $197.3 $10.6 6 % $32.4 20 % Noninterest income 51.7 5 1.7 5.8 13 8.2 19 Total revenue 249.0 249.0 16.5 7 40.5 19 Noninterest expense 139.9 138.6 ( 1.1) ( 1) ( 0.7) (0) 2 109.1 110.4 17.5 19 41.2 60 Pre-provision net revenue Provision for credit losses 1 5.1 15.1 (0.1) (0) 1.8 13 Provision for credit losses on investment securities - - 3.2 (100) - - Provision for income taxes 1 5.9 1 6.3 0.3 2 10.1 162 Earnings $ 78.1 $ 79.0 $14.0 22 % $29.3 59 % Diluted EPS $ 0.54 $ 0.54 $0.08 17 % $0.15 38 % Totals may not foot due to rounding 1 Non-GAAP measures that management believes aid in the discussion of results. See appendix for Non-GAAP reconciliations 30 2 All pre-provision net revenue (PPNR) figures set forth in this row are Non-GAAP measures. See footnote 1 for more information
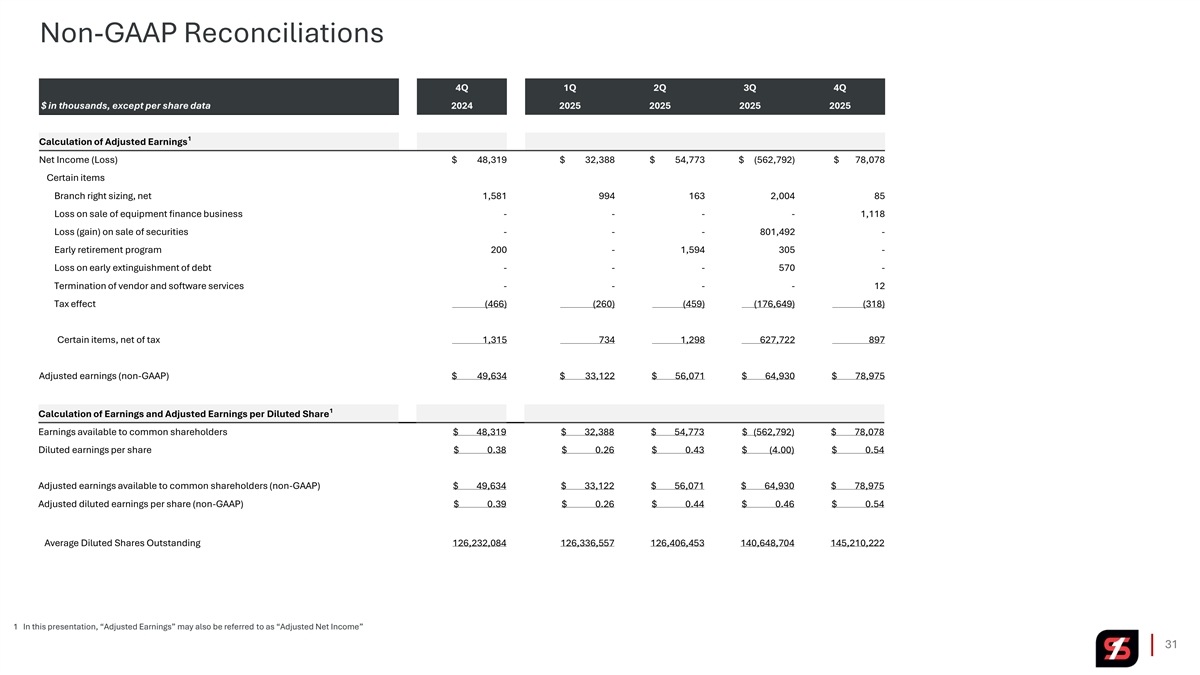
Non-GAAP Reconciliations 4Q 1Q 2Q 3Q 4Q $ in thousands, except per share data 2024 2025 2025 2025 2025 1 Calculation of Adjusted Earnings Net Income (Loss) $ 48,319 $ 32,388 $ 54,773 $ (562,792) $ 78,078 Certain items Branch right sizing, net 1,581 994 163 2,004 85 Loss on sale of equipment finance business - - - - 1,118 Loss (gain) on sale of securities - - - 801,492 - Early retirement program 200 - 1,594 305 - Loss on early extinguishment of debt - - - 570 - Termination of vendor and software services - - - - 12 Tax effect (466) (260) (459) (176,649) (318) Certain items, net of tax 1,315 734 1,298 627,722 897 Adjusted earnings (non-GAAP) $ 49,634 $ 33,122 $ 56,071 $ 64,930 $ 78,975 1 Calculation of Earnings and Adjusted Earnings per Diluted Share Earnings available to common shareholders $ 48,319 $ 32,388 $ 54,773 $ (562,792) $ 78,078 Diluted earnings per share $ 0.38 $ 0.26 $ 0.43 $ (4.00) $ 0.54 Adjusted earnings available to common shareholders (non-GAAP) $ 49,634 $ 33,122 $ 56,071 $ 64,930 $ 78,975 Adjusted diluted earnings per share (non-GAAP) $ 0.39 $ 0.26 $ 0.44 $ 0.46 $ 0.54 Average Diluted Shares Outstanding 126,232,084 126,336,557 126,406,453 140,648,704 145,210,222 1 In this presentation, “Adjusted Earnings” may also be referred to as “Adjusted Net Income” 31
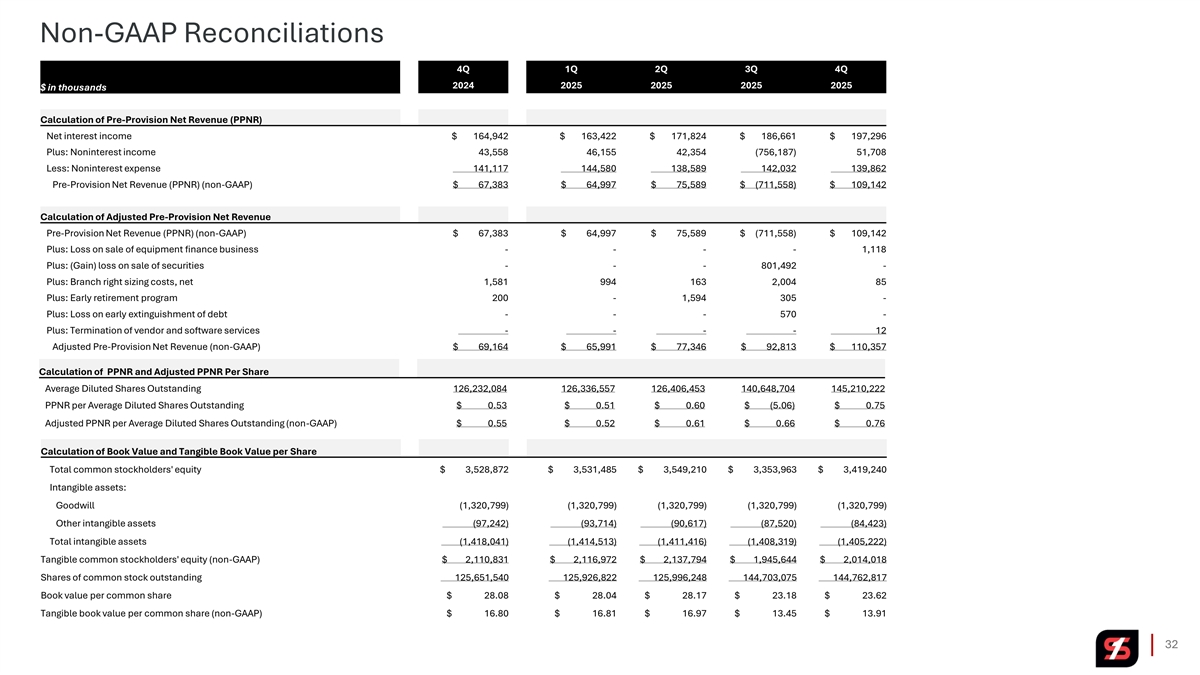
Non-GAAP Reconciliations 4Q 1Q 2Q 3Q 4Q 2024 2025 2025 2025 2025 $ in thousands Calculation of Pre-Provision Net Revenue (PPNR) Net interest income $ 164,942 $ 163,422 $ 171,824 $ 186,661 $ 197,296 Plus: Noninterest income 43,558 46,155 42,354 (756,187) 51,708 Less: Noninterest expense 141,117 144,580 138,589 142,032 139,862 Pre-Provision Net Revenue (PPNR) (non-GAAP) $ 67,383 $ 64,997 $ 75,589 $ (711,558) $ 109,142 Calculation of Adjusted Pre-Provision Net Revenue Pre-Provision Net Revenue (PPNR) (non-GAAP) $ 67,383 $ 64,997 $ 75,589 $ (711,558) $ 109,142 Plus: Loss on sale of equipment finance business - - - - 1,118 Plus: (Gain) loss on sale of securities - - - 801,492 - Plus: Branch right sizing costs, net 1,581 994 163 2,004 85 Plus: Early retirement program 200 - 1,594 305 - Plus: Loss on early extinguishment of debt - - - 570 - Plus: Termination of vendor and software services - - - - 12 Adjusted Pre-Provision Net Revenue (non-GAAP) $ 69,164 $ 65,991 $ 77,346 $ 92,813 $ 110,357 Calculation of PPNR and Adjusted PPNR Per Share Average Diluted Shares Outstanding 126,232,084 126,336,557 126,406,453 140,648,704 145,210,222 PPNR per Average Diluted Shares Outstanding $ 0.53 $ 0.51 $ 0.60 $ (5.06) $ 0.75 Adjusted PPNR per Average Diluted Shares Outstanding (non-GAAP) $ 0.55 $ 0.52 $ 0.61 $ 0.66 $ 0.76 Calculation of Book Value and Tangible Book Value per Share Total common stockholders' equity $ 3,528,872 $ 3,531,485 $ 3,549,210 $ 3,353,963 $ 3,419,240 Intangible assets: Goodwill (1,320,799) (1,320,799) (1,320,799) (1,320,799) (1,320,799) Other intangible assets (97,242) (93,714) (90,617) (87,520) (84,423) Total intangible assets (1,418,041) (1,414,513) (1,411,416) (1,408,319) (1,405,222) Tangible common stockholders' equity (non-GAAP) $ 2,110,831 $ 2,116,972 $ 2,137,794 $ 1,945,644 $ 2,014,018 Shares of common stock outstanding 125,651,540 125,926,822 125,996,248 144,703,075 144,762,817 Book value per common share $ 28.08 $ 28.04 $ 28.17 $ 23.18 $ 23.62 Tangible book value per common share (non-GAAP) $ 16.80 $ 16.81 $ 16.97 $ 13.45 $ 13.91 32
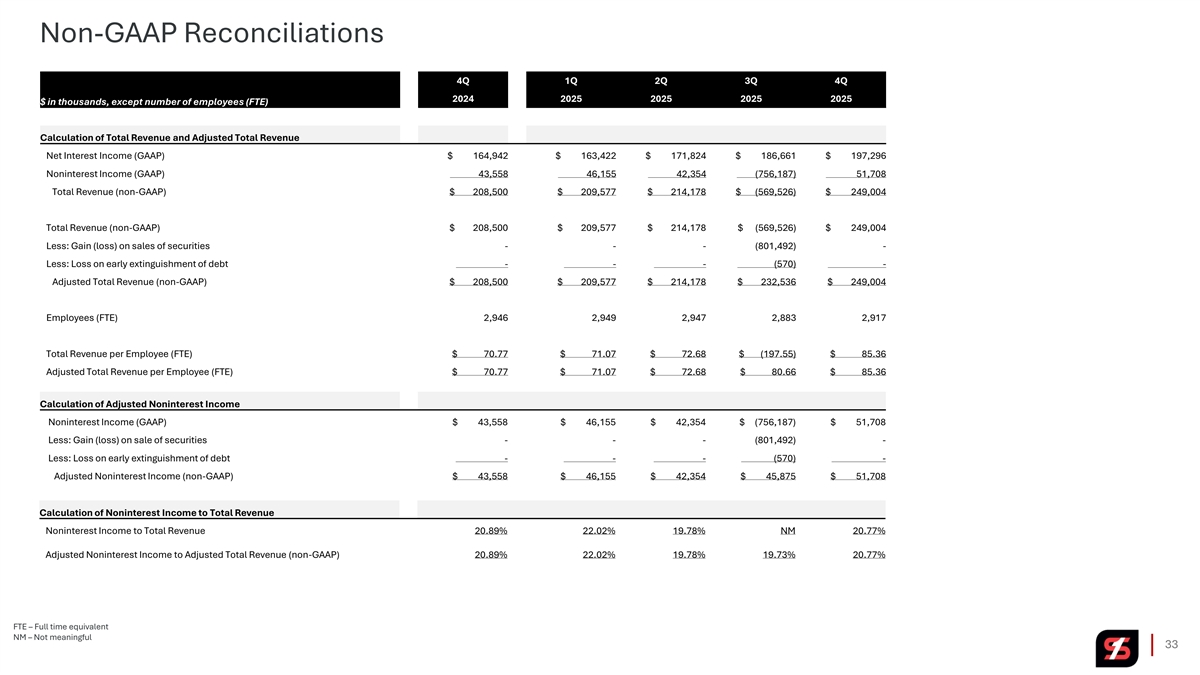
Non-GAAP Reconciliations 4Q 1Q 2Q 3Q 4Q 2024 2025 2025 2025 2025 $ in thousands, except number of employees (FTE) Calculation of Total Revenue and Adjusted Total Revenue Net Interest Income (GAAP) $ 164,942 $ 163,422 $ 171,824 $ 186,661 $ 197,296 Noninterest Income (GAAP) 43,558 46,155 42,354 (756,187) 51,708 Total Revenue (non-GAAP) $ 208,500 $ 209,577 $ 214,178 $ (569,526) $ 249,004 Total Revenue (non-GAAP) $ 208,500 $ 209,577 $ 214,178 $ (569,526) $ 249,004 Less: Gain (loss) on sales of securities - - - (801,492) - Less: Loss on early extinguishment of debt - - - (570) - Adjusted Total Revenue (non-GAAP) $ 208,500 $ 209,577 $ 214,178 $ 232,536 $ 249,004 Employees (FTE) 2,946 2,949 2,947 2,883 2,917 Total Revenue per Employee (FTE) $ 70.77 $ 71.07 $ 72.68 $ (197.55) $ 85.36 Adjusted Total Revenue per Employee (FTE) $ 70.77 $ 71.07 $ 72.68 $ 80.66 $ 85.36 Calculation of Adjusted Noninterest Income Noninterest Income (GAAP) $ 43,558 $ 46,155 $ 42,354 $ (756,187) $ 51,708 Less: Gain (loss) on sale of securities - - - (801,492) - Less: Loss on early extinguishment of debt - - - (570) - Adjusted Noninterest Income (non-GAAP) $ 43,558 $ 46,155 $ 42,354 $ 45,875 $ 51,708 Calculation of Noninterest Income to Total Revenue Noninterest Income to Total Revenue 20.89% 22.02% 19.78% NM 20.77% Adjusted Noninterest Income to Adjusted Total Revenue (non-GAAP) 20.89% 22.02% 19.78% 19.73% 20.77% FTE – Full time equivalent NM – Not meaningful 33
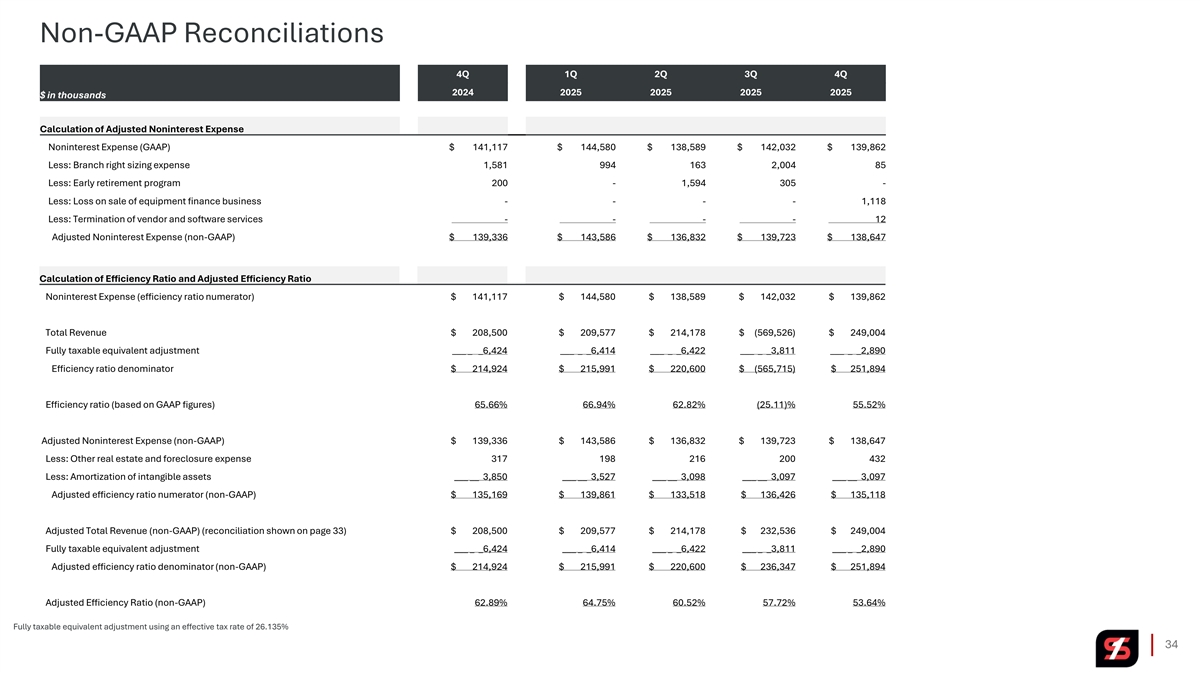
Non-GAAP Reconciliations 4Q 1Q 2Q 3Q 4Q 2024 2025 2025 2025 2025 $ in thousands Calculation of Adjusted Noninterest Expense Noninterest Expense (GAAP) $ 141,117 $ 144,580 $ 138,589 $ 142,032 $ 139,862 Less: Branch right sizing expense 1,581 994 163 2,004 85 Less: Early retirement program 200 - 1,594 305 - Less: Loss on sale of equipment finance business - - - - 1,118 Less: Termination of vendor and software services - - - - 12 Adjusted Noninterest Expense (non-GAAP) $ 139,336 $ 143,586 $ 136,832 $ 139,723 $ 138,647 Calculation of Efficiency Ratio and Adjusted Efficiency Ratio Noninterest Expense (efficiency ratio numerator) $ 141,117 $ 144,580 $ 138,589 $ 142,032 $ 139,862 Total Revenue $ 208,500 $ 209,577 $ 214,178 $ (569,526) $ 249,004 Fully taxable equivalent adjustment ___ _ _6,424 ___ _ _6,414 ___ _ _6,422 ___ _ _3,811 ___ _ _2,890 Efficiency ratio denominator $ 214,924 $ 215,991 $ 220,600 $ (565,715) $ 251,894 Efficiency ratio (based on GAAP figures) 65.66% 66.94% 62.82% (25.11)% 55.52% Adjusted Noninterest Expense (non-GAAP) $ 139,336 $ 143,586 $ 136,832 $ 139,723 $ 138,647 Less: Other real estate and foreclosure expense 317 198 216 200 432 Less: Amortization of intangible assets ___ __ 3,850 ___ __ 3,527 ___ __ 3,098 ___ __ 3,097 ___ __ 3,097 Adjusted efficiency ratio numerator (non-GAAP) $ 135,169 $ 139,861 $ 133,518 $ 136,426 $ 135,118 Adjusted Total Revenue (non-GAAP) (reconciliation shown on page 33) $ 208,500 $ 209,577 $ 214,178 $ 232,536 $ 249,004 Fully taxable equivalent adjustment ___ _ _6,424 ___ _ _6,414 ___ _ _6,422 ___ _ _3,811 ___ _ _2,890 Adjusted efficiency ratio denominator (non-GAAP) $ 214,924 $ 215,991 $ 220,600 $ 236,347 $ 251,894 Adjusted Efficiency Ratio (non-GAAP) 62.89% 64.75% 60.52% 57.72% 53.64% Fully taxable equivalent adjustment using an effective tax rate of 26.135% 34
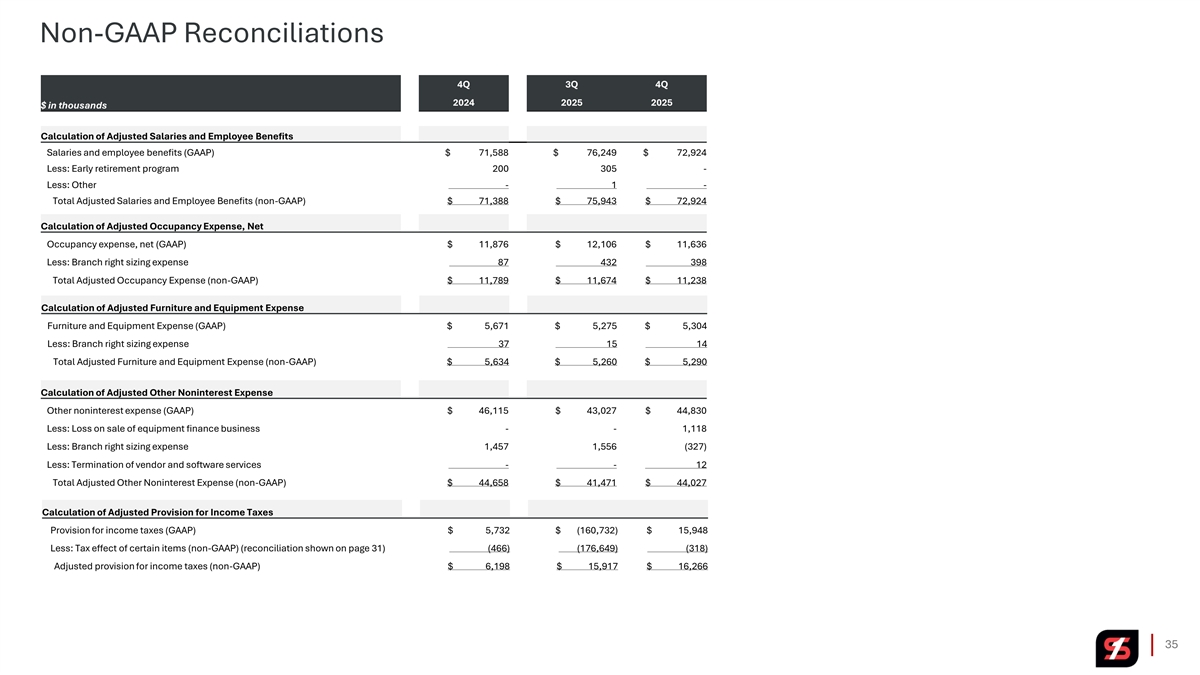
Non-GAAP Reconciliations 4Q 3Q 4Q 2024 2025 2025 $ in thousands Calculation of Adjusted Salaries and Employee Benefits Salaries and employee benefits (GAAP) $ 71,588 $ 76,249 $ 72,924 Less: Early retirement program 200 305 - Less: Other - 1 - Total Adjusted Salaries and Employee Benefits (non-GAAP) $ 71,388 $ 75,943 $ 72,924 Calculation of Adjusted Occupancy Expense, Net Occupancy expense, net (GAAP) $ 11,876 $ 12,106 $ 11,636 Less: Branch right sizing expense 87 432 398 Total Adjusted Occupancy Expense (non-GAAP) $ 11,789 $ 11,674 $ 11,238 Calculation of Adjusted Furniture and Equipment Expense Furniture and Equipment Expense (GAAP) $ 5,671 $ 5,275 $ 5,304 Less: Branch right sizing expense 37 15 14 Total Adjusted Furniture and Equipment Expense (non-GAAP) $ 5,634 $ 5,260 $ 5,290 Calculation of Adjusted Other Noninterest Expense Other noninterest expense (GAAP) $ 46,115 $ 43,027 $ 44,830 Less: Loss on sale of equipment finance business - - 1,118 Less: Branch right sizing expense 1,457 1,556 (327) Less: Termination of vendor and software services - - 12 Total Adjusted Other Noninterest Expense (non-GAAP) $ 44,658 $ 41,471 $ 44,027 Calculation of Adjusted Provision for Income Taxes Provision for income taxes (GAAP) $ 5,732 $ (160,732) $ 15,948 Less: Tax effect of certain items (non-GAAP) (reconciliation shown on page 31) (466) (176,649) (318) Adjusted provision for income taxes (non-GAAP) $ 6,198 $ 15,917 $ 16,266 35
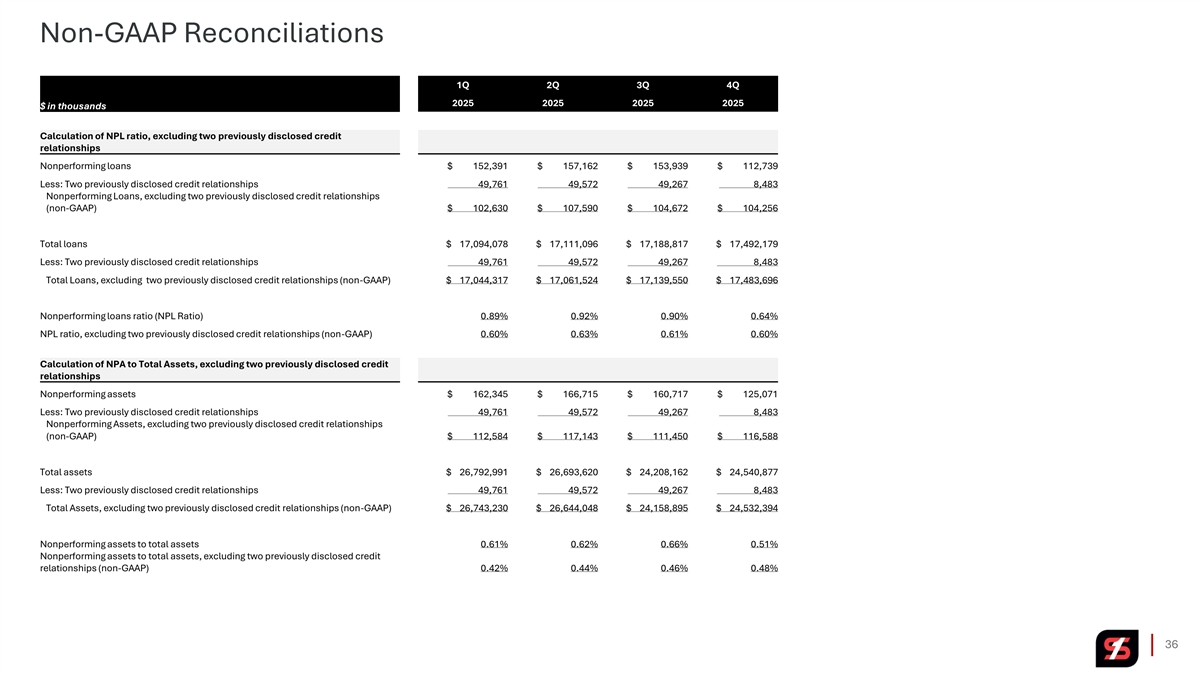
Non-GAAP Reconciliations 1Q 2Q 3Q 4Q 2025 2025 2025 2025 $ in thousands Calculation of NPL ratio, excluding two previously disclosed credit relationships Nonperforming loans $ 152,391 $ 157,162 $ 153,939 $ 112,739 Less: Two previously disclosed credit relationships 49,761 49,572 49,267 8,483 Nonperforming Loans, excluding two previously disclosed credit relationships (non-GAAP) $ 102,630 $ 107,590 $ 104,672 $ 104,256 Total loans $ 17,094,078 $ 17,111,096 $ 17,188,817 $ 17,492,179 Less: Two previously disclosed credit relationships 49,761 49,572 49,267 8,483 Total Loans, excluding two previously disclosed credit relationships (non-GAAP) $ 17,044,317 $ 17,061,524 $ 17,139,550 $ 17,483,696 Nonperforming loans ratio (NPL Ratio) 0.89% 0.92% 0.90% 0.64% NPL ratio, excluding two previously disclosed credit relationships (non-GAAP) 0.60% 0.63% 0.61% 0.60% Calculation of NPA to Total Assets, excluding two previously disclosed credit relationships Nonperforming assets $ 162,345 $ 166,715 $ 160,717 $ 125,071 Less: Two previously disclosed credit relationships 49,761 49,572 49,267 8,483 Nonperforming Assets, excluding two previously disclosed credit relationships (non-GAAP) $ 112,584 $ 117,143 $ 111,450 $ 116,588 Total assets $ 26,792,991 $ 26,693,620 $ 24,208,162 $ 24,540,877 Less: Two previously disclosed credit relationships 49,761 49,572 49,267 8,483 Total Assets, excluding two previously disclosed credit relationships (non-GAAP) $ 26,743,230 $ 26,644,048 $ 24,158,895 $ 24,532,394 Nonperforming assets to total assets 0.61% 0.62% 0.66% 0.51% Nonperforming assets to total assets, excluding two previously disclosed credit relationships (non-GAAP) 0.42% 0.44% 0.46% 0.48% 36
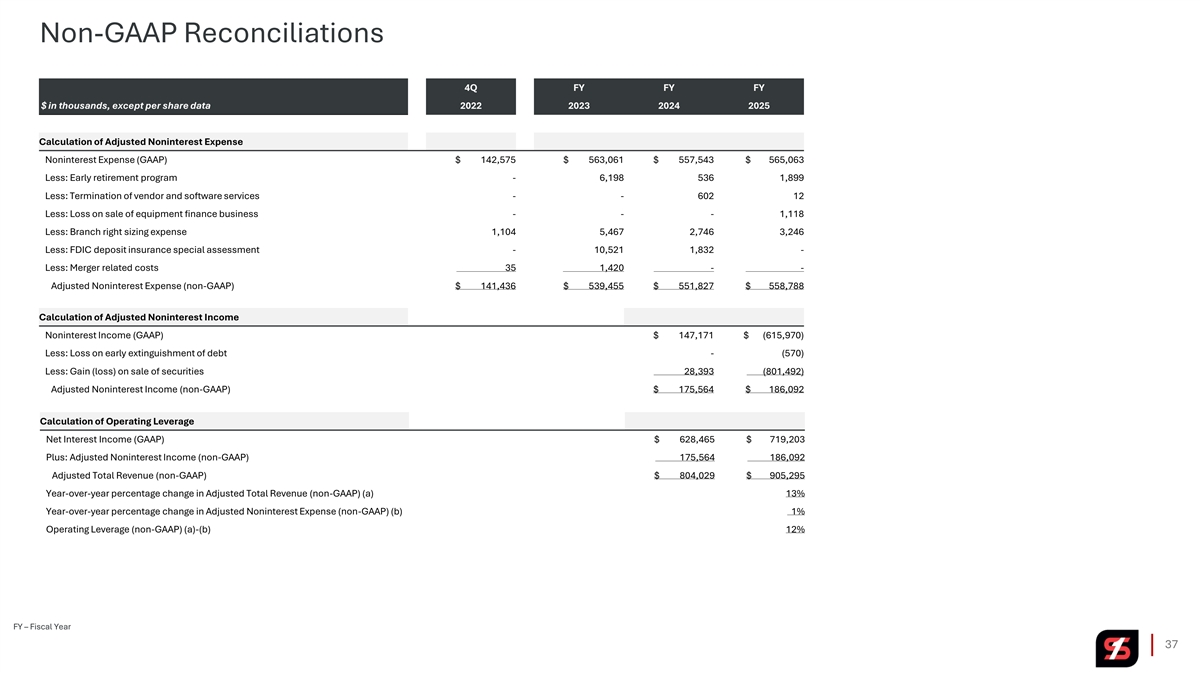
Non-GAAP Reconciliations 4Q FY FY FY $ in thousands, except per share data 2022 2023 2024 2025 Calculation of Adjusted Noninterest Expense Noninterest Expense (GAAP) $ 142,575 $ 563,061 $ 557,543 $ 565,063 Less: Early retirement program - 6,198 536 1,899 Less: Termination of vendor and software services - - 602 12 Less: Loss on sale of equipment finance business - - - 1,118 Less: Branch right sizing expense 1,104 5,467 2,746 3,246 Less: FDIC deposit insurance special assessment - 10,521 1,832 - Less: Merger related costs 35 1,420 - - Adjusted Noninterest Expense (non-GAAP) $ 141,436 $ 539,455 $ 551,827 $ 558,788 Calculation of Adjusted Noninterest Income Noninterest Income (GAAP) $ 147,171 $ (615,970) Less: Loss on early extinguishment of debt - (570) Less: Gain (loss) on sale of securities 28,393 (801,492) Adjusted Noninterest Income (non-GAAP) $ 175,564 $ 186,092 Calculation of Operating Leverage Net Interest Income (GAAP) $ 628,465 $ 719,203 Plus: Adjusted Noninterest Income (non-GAAP) 175,564 186,092 Adjusted Total Revenue (non-GAAP) $ 804,029 $ 905,295 Year-over-year percentage change in Adjusted Total Revenue (non-GAAP) (a) 13% Year-over-year percentage change in Adjusted Noninterest Expense (non-GAAP) (b) 1% Operating Leverage (non-GAAP) (a)-(b) 12% FY – Fiscal Year 37
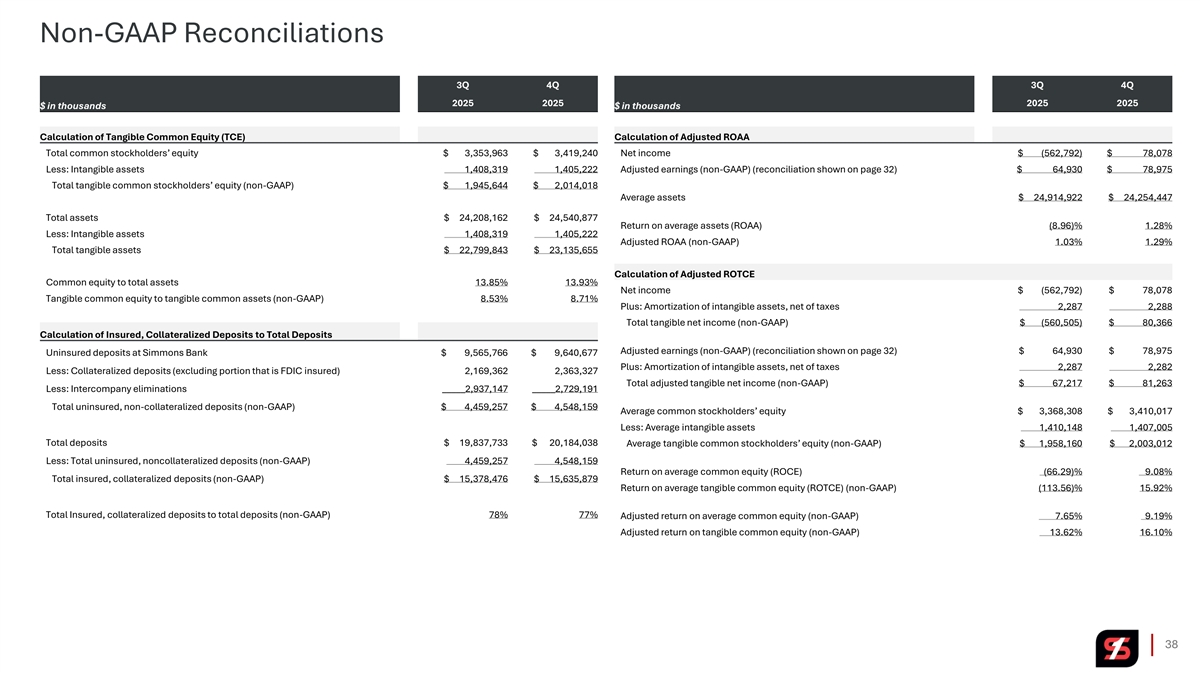
Non-GAAP Reconciliations 3Q 4Q 3Q 4Q 2025 2025 2025 2025 $ in thousands $ in thousands Calculation of Tangible Common Equity (TCE) Calculation of Adjusted ROAA Total common stockholders’ equity $ 3,353,963 $ 3,419,240 Net income $ (562,792) $ 78,078 Less: Intangible assets 1,408,319 1,405,222 Adjusted earnings (non-GAAP) (reconciliation shown on page 32) $ 64,930 $ 78,975 Total tangible common stockholders’ equity (non-GAAP) $ 1,945,644 $ 2,014,018 Average assets $ 24,914,922 $ 24,254,447 Total assets $ 24,208,162 $ 24,540,877 Return on average assets (ROAA) (8.96)% 1.28% Less: Intangible assets 1,408,319 1,405,222 Adjusted ROAA (non-GAAP) 1.03% 1.29% Total tangible assets $ 22,799,843 $ 23,135,655 Calculation of Adjusted ROTCE Common equity to total assets 13.85% 13.93% Net income $ (562,792) $ 78,078 Tangible common equity to tangible common assets (non-GAAP) 8.53% 8.71% Plus: Amortization of intangible assets, net of taxes 2,287 2,288 Total tangible net income (non-GAAP) $ (560,505) $ 80,366 Calculation of Insured, Collateralized Deposits to Total Deposits Adjusted earnings (non-GAAP) (reconciliation shown on page 32) $ 64,930 $ 78,975 Uninsured deposits at Simmons Bank $ 9,565,766 $ 9,640,677 Plus: Amortization of intangible assets, net of taxes 2,287 2,282 Less: Collateralized deposits (excluding portion that is FDIC insured) 2,169,362 2,363,327 Total adjusted tangible net income (non-GAAP) $ 67,217 $ 81,263 Less: Intercompany eliminations _____2,937,147 _____2,729,191 Total uninsured, non-collateralized deposits (non-GAAP) $ 4,459,257 $ 4,548,159 Average common stockholders’ equity $ 3,368,308 $ 3,410,017 Less: Average intangible assets 1,410,148 1,407,005 Total deposits $ 19,837,733 $ 20,184,038 Average tangible common stockholders’ equity (non-GAAP) $ 1,958,160 $ 2,003,012 Less: Total uninsured, noncollateralized deposits (non-GAAP) 4,459,257 4,548,159 Return on average common equity (ROCE) (66.29)% 9.08% Total insured, collateralized deposits (non-GAAP) $ 15,378,476 $ 15,635,879 Return on average tangible common equity (ROTCE) (non-GAAP) (113.56)% 15.92% Total Insured, collateralized deposits to total deposits (non-GAAP) 78% 77% Adjusted return on average common equity (non-GAAP) 7.65% 9.19% Adjusted return on tangible common equity (non-GAAP) 13.62% 16.10% 38
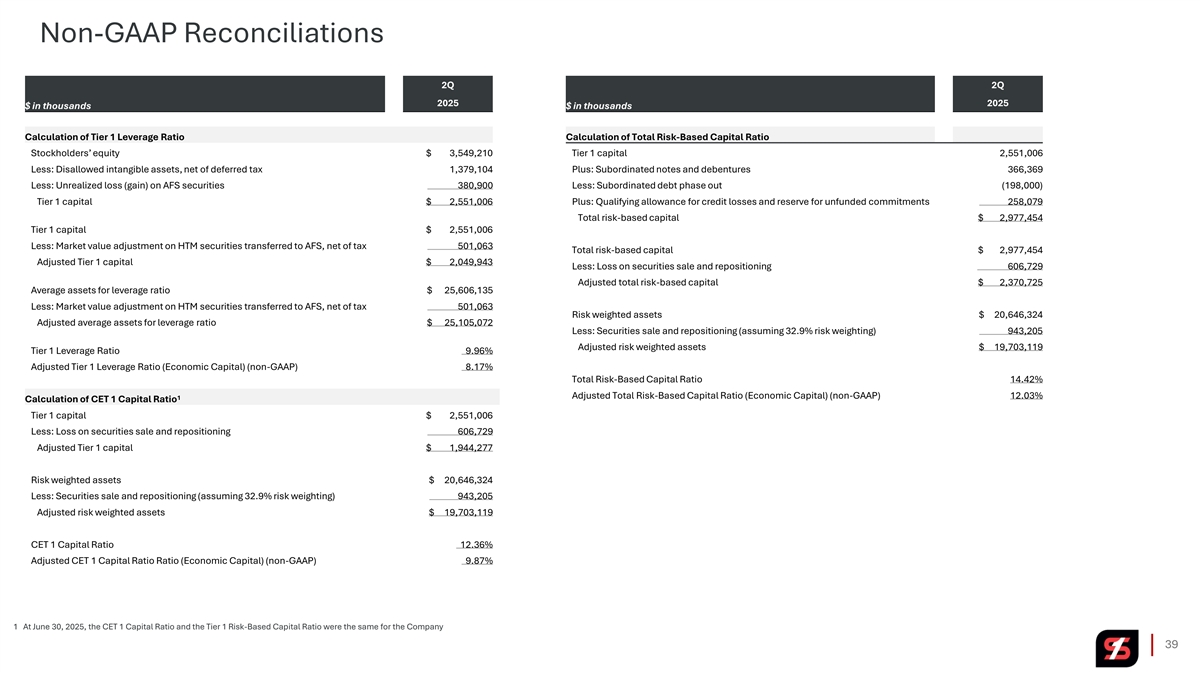
Non-GAAP Reconciliations 2Q 2Q 2025 2025 $ in thousands $ in thousands Calculation of Tier 1 Leverage Ratio Calculation of Total Risk-Based Capital Ratio Stockholders’ equity $ 3,549,210 Tier 1 capital 2,551,006 Less: Disallowed intangible assets, net of deferred tax 1,379,104 Plus: Subordinated notes and debentures 366,369 Less: Unrealized loss (gain) on AFS securities 380,900 Less: Subordinated debt phase out (198,000) Tier 1 capital $ 2,551,006 Plus: Qualifying allowance for credit losses and reserve for unfunded commitments 258,079 Total risk-based capital $ 2,977,454 Tier 1 capital $ 2,551,006 Less: Market value adjustment on HTM securities transferred to AFS, net of tax 501,063 Total risk-based capital $ 2,977,454 Adjusted Tier 1 capital $ 2,049,943 Less: Loss on securities sale and repositioning 606,729 Adjusted total risk-based capital $ 2,370,725 Average assets for leverage ratio $ 25,606,135 Less: Market value adjustment on HTM securities transferred to AFS, net of tax 501,063 Risk weighted assets $ 20,646,324 Adjusted average assets for leverage ratio $ 25,105,072 Less: Securities sale and repositioning (assuming 32.9% risk weighting) 943,205 Adjusted risk weighted assets $ 19,703,119 Tier 1 Leverage Ratio 9.96% Adjusted Tier 1 Leverage Ratio (Economic Capital) (non-GAAP) 8.17% Total Risk-Based Capital Ratio 14.42% Adjusted Total Risk-Based Capital Ratio (Economic Capital) (non-GAAP) 12.03% 1 Calculation of CET 1 Capital Ratio Tier 1 capital $ 2,551,006 Less: Loss on securities sale and repositioning 606,729 Adjusted Tier 1 capital $ 1,944,277 Risk weighted assets $ 20,646,324 Less: Securities sale and repositioning (assuming 32.9% risk weighting) 943,205 Adjusted risk weighted assets $ 19,703,119 CET 1 Capital Ratio 12.36% Adjusted CET 1 Capital Ratio Ratio (Economic Capital) (non-GAAP) 9.87% 1 At June 30, 2025, the CET 1 Capital Ratio and the Tier 1 Risk-Based Capital Ratio were the same for the Company 39

Nasdaq SFNC th 4 Quarter 2025 Earnings Presentation January 20, 2026