
KeyCorp BancAnalysts Association of Boston Conference November 6, 2025 Victor Alexander Head of the Consumer Bank
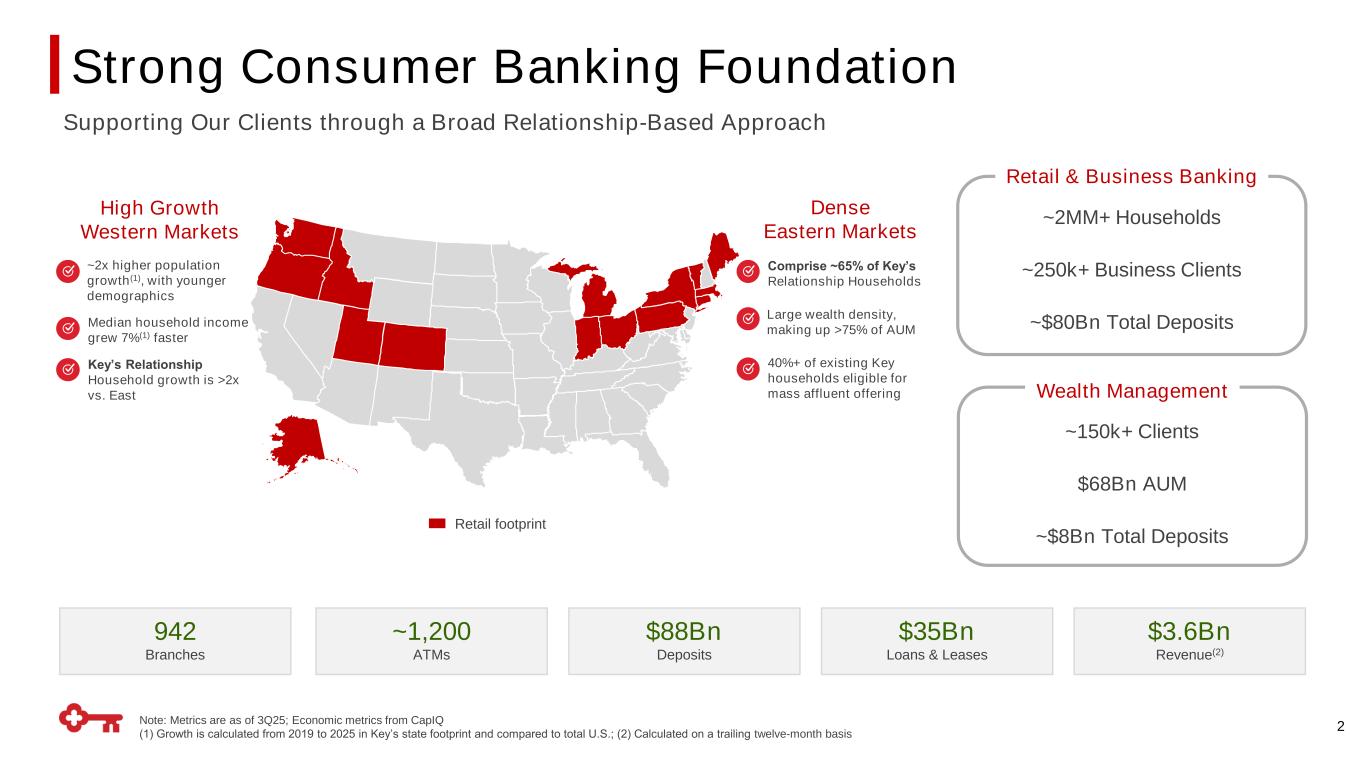
Strong Consumer Banking Foundation 2 Retail footprint ~2MM+ Households ~250k+ Business Clients ~$80Bn Total Deposits Retail & Business Banking ~150k+ Clients $68Bn AUM ~$8Bn Total Deposits Wealth Management Dense Eastern Markets High Growth Western Markets ~2x higher population growth(1), with younger demographics Median household income grew 7%(1) faster Large wealth density, making up >75% of AUM Note: Metrics are as of 3Q25; Economic metrics from CapIQ (1) Growth is calculated from 2019 to 2025 in Key’s state footprint and compared to total U.S.; (2) Calculated on a trailing twelve-month basis $3.6Bn Revenue(2) $35Bn Loans & Leases $88Bn Deposits 942 Branches ~1,200 ATMs Supporting Our Clients through a Broad Relationship-Based Approach 40%+ of existing Key households eligible for mass affluent offering Key’s Relationship Household growth is >2x vs. East Comprise ~65% of Key’s Relationship Households
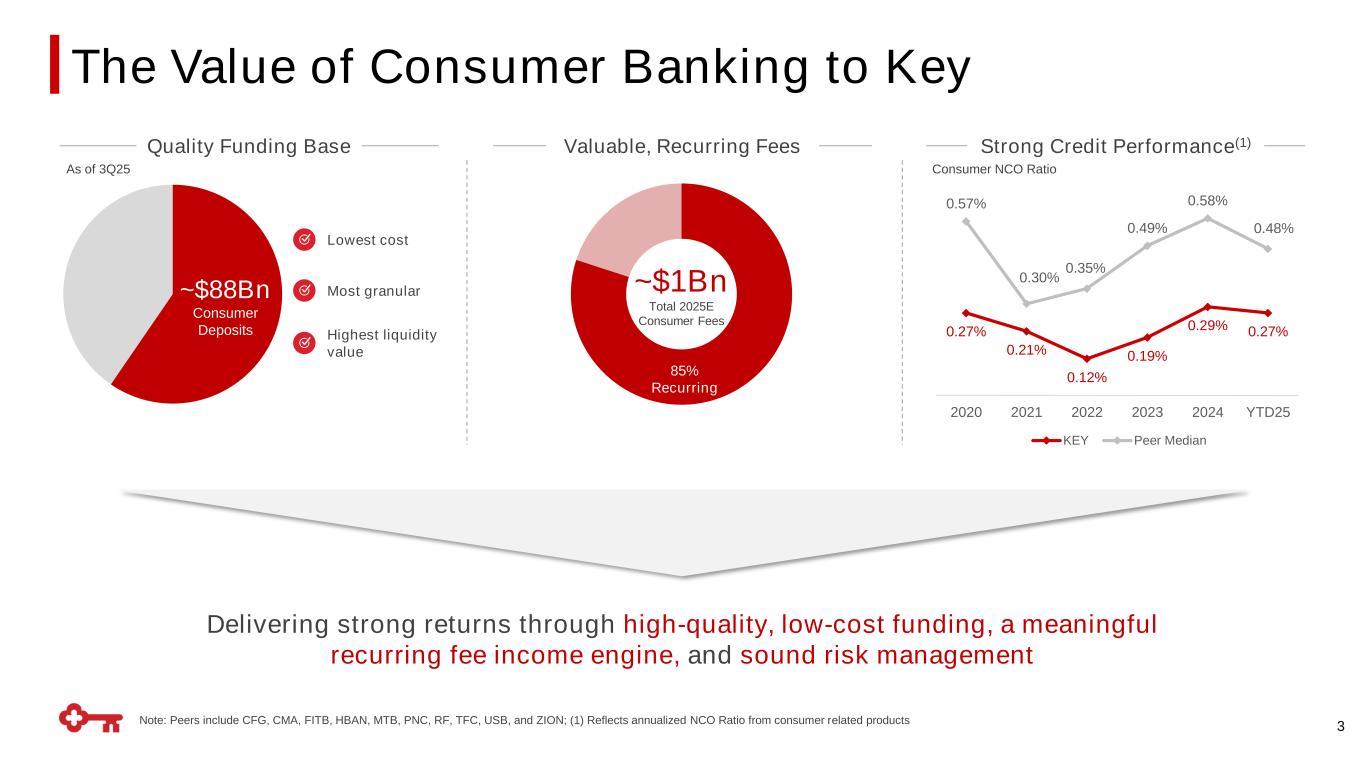
~$88Bn Consumer Deposits The Value of Consumer Banking to Key 3 0.27% 0.21% 0.12% 0.19% 0.29% 0.27% 0.57% 0.30% 0.35% 0.49% 0.58% 0.48% 2020 2021 2022 2023 2024 YTD25 KEY Peer Median ~$1Bn Total 2025E Consumer Fees 85% Recurring Lowest cost Strong Credit Performance(1) Consumer NCO Ratio Valuable, Recurring Fees As of 3Q25 Delivering strong returns through high-quality, low-cost funding, a meaningful recurring fee income engine, and sound risk management Quality Funding Base Most granular Highest liquidity value Note: Peers include CFG, CMA, FITB, HBAN, MTB, PNC, RF, TFC, USB, and ZION; (1) Reflects annualized NCO Ratio from consumer related products

Consumer Bank: Then and Now 4 2019 Now Relationship Household Growth(1) <1.0% ~3.0% Total AUM Sales(2) $5.3Bn $11.4Bn (+115%) Client Satisfaction and Experience(3) Net Promoter Scores(3) Branch: 57 Contact Center: 27 Branch: 85 (+28) Contact Center: 54 (+27) Consumer Deposits / Branch $66MM $93MM(4) (+40%) Consumer Net Funding $43Bn ~$55Bn (+28%) Consumer FTE ~8,500 ~7,500 More Focused Approach Delivers a Stronger Consumer Bank 4.3 App Store Rating #22 JD Power Ranking 4.7 App Store Rating #11 JD Power Ranking (1) Relationship Household growth from 2016 to 2019 annual average and 2020 to 3Q25 annual average, respectively; (2) As of 2019 and annualized 3Q25 YTD metric, respectively; (3) As of year-end 2019 and 2024, respectively; (4) As of 3Q25
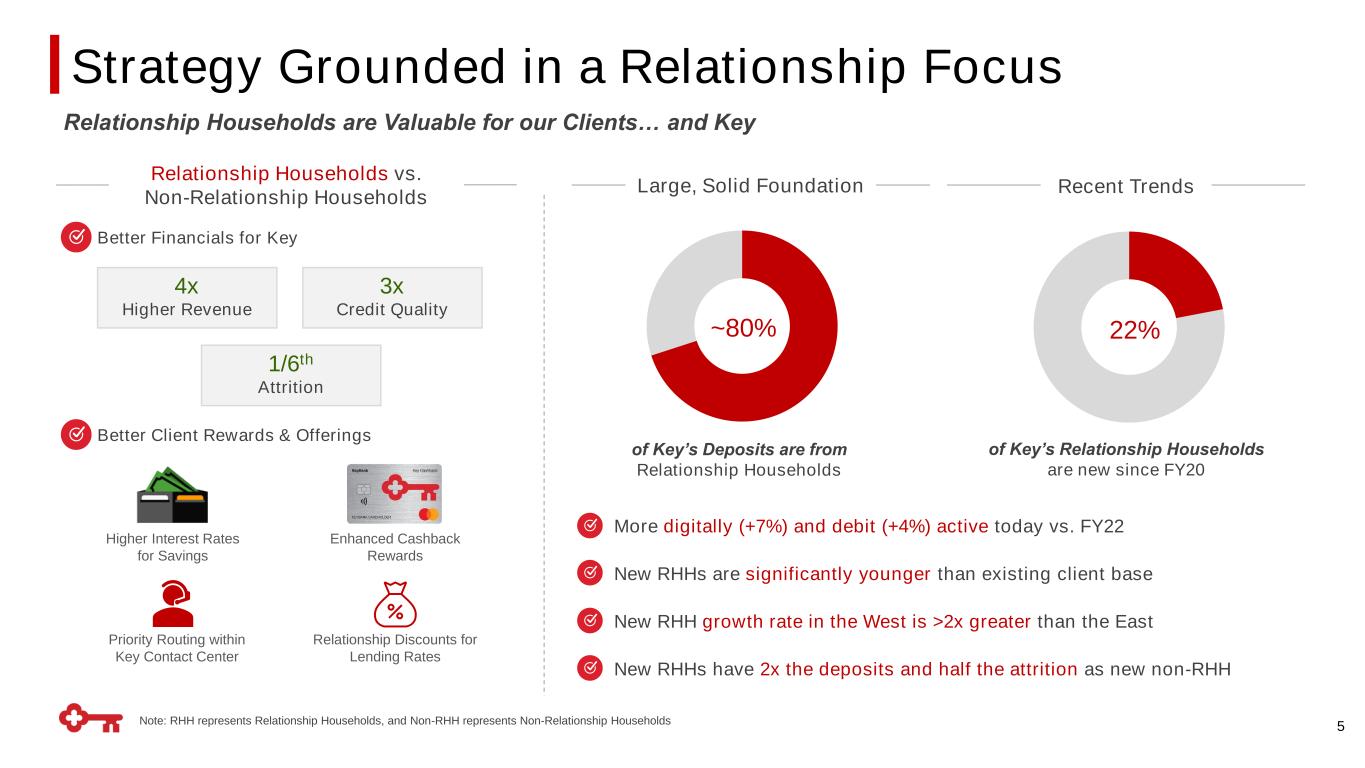
Strategy Grounded in a Relationship Focus 5 4x Higher Revenue 3x Credit Quality 1/6th Attrition Higher Interest Rates for Savings Enhanced Cashback Rewards Priority Routing within Key Contact Center Relationship Discounts for Lending Rates Relationship Households are Valuable for our Clients… and Key of Key’s Deposits are from Relationship Households ~80% 22% of Key’s Relationship Households are new since FY20 Note: RHH represents Relationship Households, and Non-RHH represents Non-Relationship Households Better Financials for Key Better Client Rewards & Offerings Large, Solid Foundation Recent Trends Relationship Households vs. Non-Relationship Households New RHHs are significantly younger than existing client base More digitally (+7%) and debit (+4%) active today vs. FY22 New RHHs have 2x the deposits and half the attrition as new non-RHH New RHH growth rate in the West is >2x greater than the East
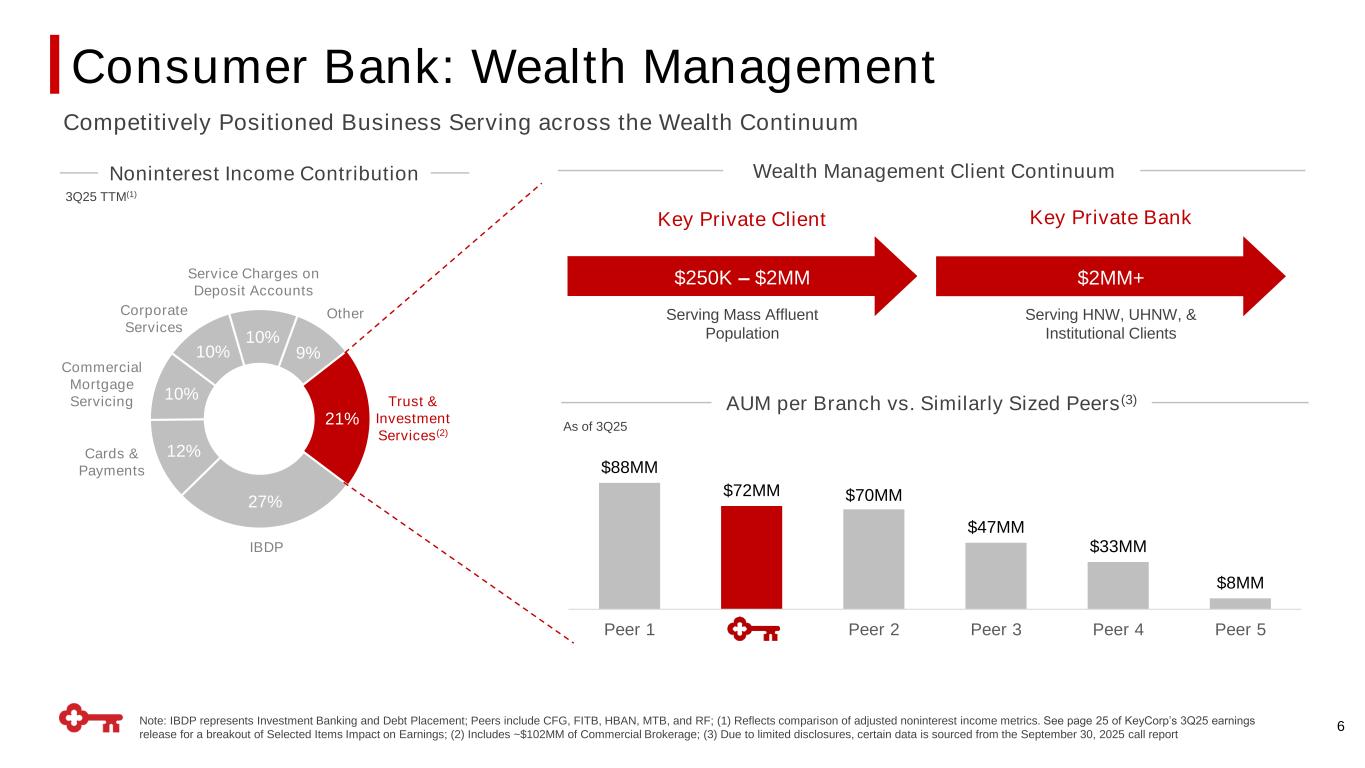
Consumer Bank: Wealth Management 6 3Q25 TTM(1) Noninterest Income Contribution Wealth Management Client Continuum Competitively Positioned Business Serving across the Wealth Continuum 21% 27% 12% 10% 10% 10% 9% IBDP Cards & Payments Service Charges on Deposit Accounts Corporate Services Commercial Mortgage Servicing Other Trust & Investment Services(2) $88MM $72MM $70MM $47MM $33MM $8MM Peer 1 Peer 2 Peer 3 Peer 4 Peer 5 As of 3Q25 AUM per Branch vs. Similarly Sized Peers(3) Note: IBDP represents Investment Banking and Debt Placement; Peers include CFG, FITB, HBAN, MTB, and RF; (1) Reflects comparison of adjusted noninterest income metrics. See page 25 of KeyCorp’s 3Q25 earnings release for a breakout of Selected Items Impact on Earnings; (2) Includes ~$102MM of Commercial Brokerage; (3) Due to limited disclosures, certain data is sourced from the September 30, 2025 call report Serving Mass Affluent Population Serving HNW, UHNW, & Institutional Clients $2MM+$250K – $2MM Key Private Client Key Private Bank
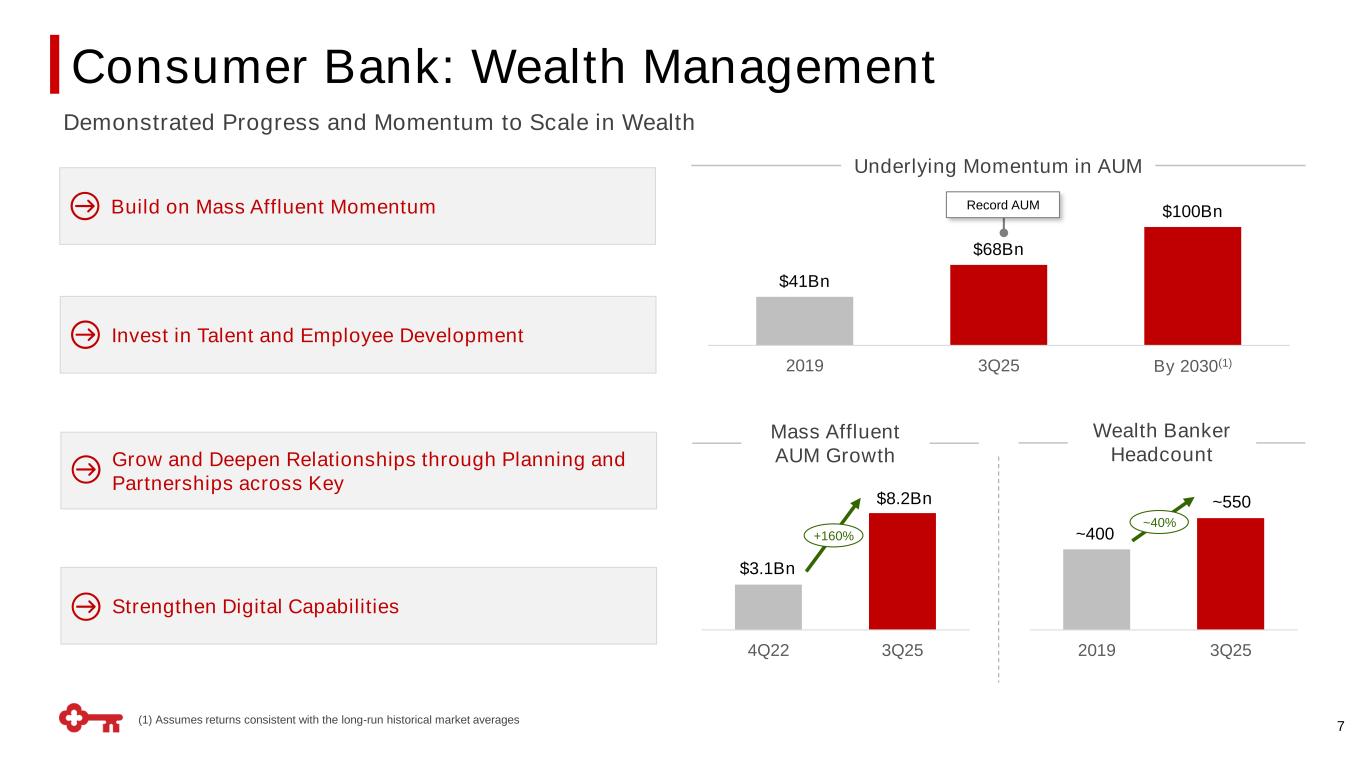
2019 3Q25 Consumer Bank: Wealth Management 7 (1) Assumes returns consistent with the long-run historical market averages Invest in Talent and Employee Development Grow and Deepen Relationships through Planning and Partnerships across Key Strengthen Digital Capabilities Build on Mass Affluent Momentum Demonstrated Progress and Momentum to Scale in Wealth Record AUM Underlying Momentum in AUM $41Bn $68Bn $100Bn 2019 3Q25 xBy 2030(1) 4Q22 3Q25 $8.2Bn $3.1Bn +160% Mass Affluent AUM Growth Wealth Banker Headcount ~40% ~550 ~400
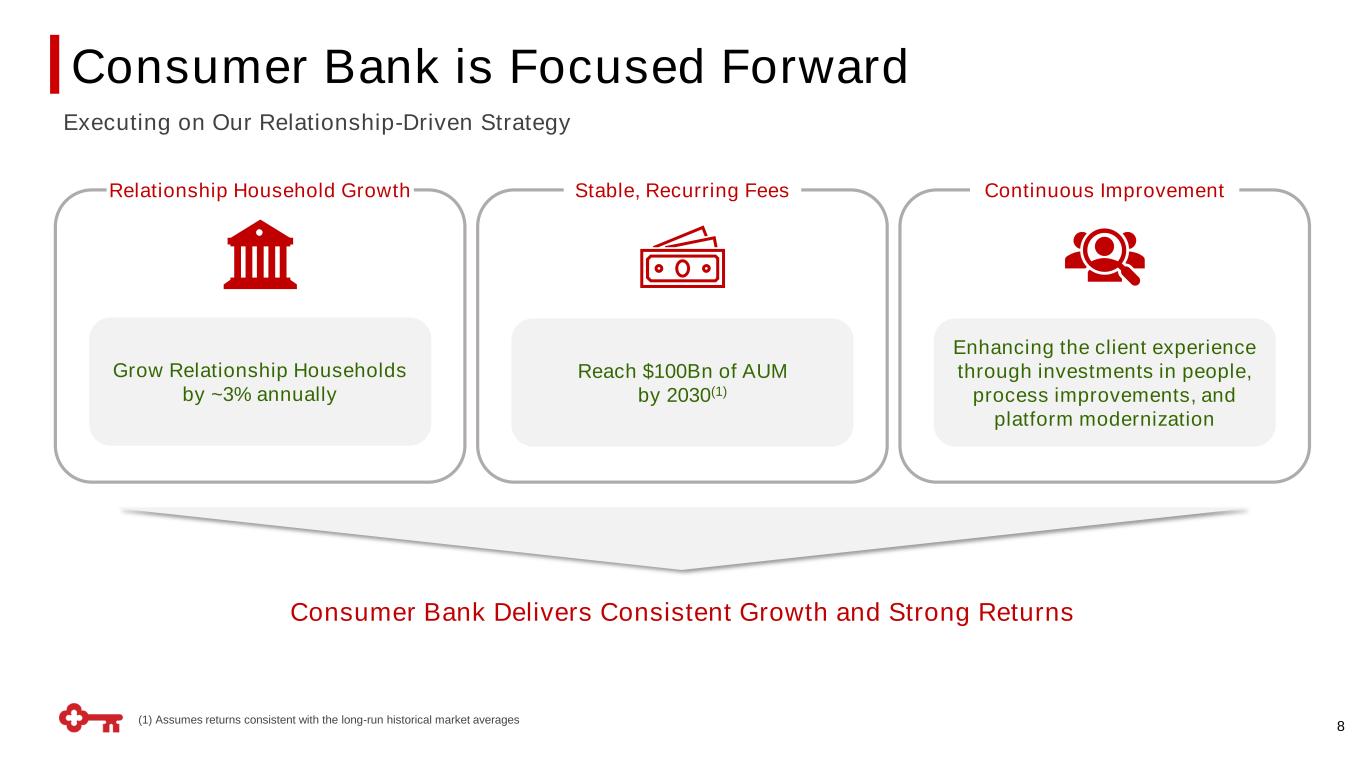
Consumer Bank is Focused Forward 8 Relationship Household Growth Stable, Recurring Fees Continuous Improvement Consumer Bank Delivers Consistent Growth and Strong Returns Grow Relationship Households by ~3% annually Reach $100Bn of AUM by 2030(1) Enhancing the client experience through investments in people, process improvements, and platform modernization Executing on Our Relationship-Driven Strategy (1) Assumes returns consistent with the long-run historical market averages

Forward-looking Statements and Additional Information 9 This communication contains forward-looking statements within the meaning of the Private Securities Litigation Reform Act of 1995 including, but not limited to, KeyCorp’s expectations or predictions of future financial or business performance or conditions. Forward-looking statements are typically identified by words such as “believe,” “seek,” “expect,” “anticipate,” “intend,” “target,” “estimate,” “continue,” “positions,” “plan,” “predict,” “project,” “forecast,” “guidance,” “goal,” “objective,” “prospects,” “possible,” “potential,” “strategy,” “opportunities,” or “trends,” by future conditional verbs such as “assume,” “will,” “would,” “should,” “could” or “may”, or by variations of such words or by similar expressions. These forward-looking statements are based on assumptions that involve risks and uncertainties, which are subject to change based on various important factors (some of which are beyond KeyCorp’s control). Actual results may differ materially from current projections. Actual outcomes may differ materially from those expressed or implied as a result of the factors described under “Forward-looking Statements” and “Risk Factors” in KeyCorp’s Annual Report on Form 10-K for the year ended December 31, 2024, and in subsequent filings of KeyCorp with the Securities and Exchange Commission (the “SEC”). Such forward-looking statements speak only as of the date they are made, and we undertake no obligation to update any forward-looking statement to reflect events or circumstances after that date or to reflect the occurrence of unanticipated events. For additional information regarding KeyCorp, please refer to our SEC filings available at www.key.com/ir. Non-GAAP Measures. This presentation may include non-GAAP measures where management believes it to be helpful in understanding Key’s results of operations or financial position. Such non- GAAP measures are not alternatives to GAAP measures, and you should not consider these non-GAAP measures in isolation or as a substitute for analysis of our results as reported under GAAP. For additional disclosure regarding such non-GAAP measures, including reconciliations to their most directly comparable GAAP measure, please refer to KeyCorp's most recent earnings release which is available at www.key.com/ir. Forward-Looking Non-GAAP Measures. From time to time we may discuss forward-looking non-GAAP financial measures. We are unable to provide a reconciliation of forward-looking non-GAAP financial measures to their most directly comparable GAAP financial measures because we are unable to provide, without unreasonable effort, a meaningful or accurate calculation or estimation of amounts that would be necessary for the reconciliation due to the complexity and inherent difficulty in forecasting and quantifying future amounts or when they may occur. Such unavailable information could be significant for future results. Annualized Data. Certain returns, yields, performance ratios, or quarterly growth rates are presented on an “annualized” basis. This is done for analytical and decision-making purposes to better discern underlying performance trends when compared to full-year or year-over-year amounts.