☒ QUARTERLY REPORT PURSUANT TO SECTION 13 OR 15(d) OF THE SECURITIES EXCHANGE ACT OF 1934
For the quarterly period ended March 31, 2026
or
☐ TRANSITION REPORT PURSUANT TO SECTION 13 OR 15(d) OF THE SECURITIES EXCHANGE ACT OF 1934
For the transition period from to
Commission File Number 001-11302
KeyCorp
Exact name of registrant as specified in its charter:
Ohio
34-6542451
State or other jurisdiction of incorporation or organization:
I.R.S. Employer Identification Number:
127 Public Square,
Cleveland,
Ohio
44114-1306
Address of principal executive offices:
Zip Code:
(216) 689-3000
Registrant’s telephone number, including area code:
SECURITIES REGISTERED PURSUANT TO SECTION 12(b) OF THE ACT:
Title of each class
Trading Symbol(s)
Name of each exchange on which registered
Common Shares, $1 par value
KEY
New York Stock Exchange
Depositary Shares (each representing a 1/40th interest in a share of Fixed-to-Floating Rate
KEY PrI
New York Stock Exchange
Perpetual Non-Cumulative Preferred Stock, Series E)
Depositary Shares (each representing a 1/40th interest in a share of Fixed Rate Perpetual Non-
KEY PrJ
New York Stock Exchange
Cumulative Preferred Stock, Series F)
Depositary Shares (each representing a 1/40th interest in a share of Fixed Rate Perpetual Non-
KEY PrK
New York Stock Exchange
Cumulative Preferred Stock, Series G)
Depositary Shares (each representing a 1/40th interest in a share of Fixed Rate Reset Perpetual Non-
KEY PrL
New York Stock Exchange
Cumulative Preferred Stock, Series H)
Indicate by check mark whether the registrant (1) has filed all reports required to be filed by Section 13 or 15(d) of the Securities Exchange Act of 1934 during the preceding 12 months (or for such shorter period that the registrant was required to file such reports), and (2) has been subject to such filing requirements for the past 90 days. Yes ☒ No ☐
Indicate by check mark whether the registrant has submitted electronically every Interactive Data File required to be submitted pursuant to Rule 405 of Regulation S-T (§232.405 of this chapter) during the preceding 12 months (or for such shorter period that the registrant was required to submit such files). Yes ☒ No ☐
Indicate by check mark whether the registrant is a large accelerated filer, an accelerated filer, a non-accelerated filer, a smaller reporting company, or an emerging growth company. See the definitions of “large accelerated filer,” “accelerated filer,” “smaller reporting company,” and “emerging growth company” in Rule 12b-2 of the Exchange Act.
Large accelerated filer
☒
Accelerated filer
☐
Non-accelerated filer
☐
Smaller reporting company
☐
Emerging growth company
☐
If an emerging growth company, indicate by check mark if the registrant has elected not to use the extended transition period for complying with any new or revised financial accounting standards provided pursuant to Section 13(a) of the Exchange Act. ☐
Indicate by check mark whether the registrant is a shell company (as defined in Rule 12b-2 of the Exchange Act). Yes ☐ No ☒
Indicate the number of shares outstanding of each of the issuer’s classes of common stock, as of the latest practicable date.
Item 2. Management’s Discussion & Analysis of Financial Condition & Results of Operations
Introduction
This section reviews the financial condition and results of operations of KeyCorp and its subsidiaries for the quarterly periods ended March 31, 2026, and March 31, 2025. Some tables may include additional periods to comply with disclosure requirements or to illustrate trends in greater depth. When you read this discussion, you should also refer to the consolidated financial statements and related notes in this report. The page locations of specific sections and notes that we refer to are presented in the Table of Contents.
References to our “2025 Form 10-K” refer to our Form 10-K for the year ended December 31, 2025, which has been filed with the SEC and is available on its website (www.sec.gov) and on our website (www.key.com/ir).
Terminology
Throughout this discussion, references to “Key,” “we,” “our,” “us,” and similar terms refer to the consolidated entity consisting of KeyCorp and its subsidiaries. “KeyCorp” refers solely to the parent holding company, and “KeyBank” refers solely to KeyCorp’s subsidiary bank, KeyBank National Association. “KeyBank (consolidated)” refers to the consolidated entity consisting of KeyBank and its subsidiaries.
We want to explain some industry-specific terms at the outset so you can better understand the discussion that follows.
•We use the phrase continuing operations in this document to mean all of our businesses other than our government-guaranteed and private education lending business, which are accounted for as discontinued operations.
•We engage in capital markets activities primarily through business conducted by our Commercial Bank segment. These activities encompass a variety of products and services. Among other things, we trade securities as a dealer, enter into derivative contracts (both to accommodate clients’ financing needs and to mitigate certain risks), and conduct transactions in foreign currencies (to accommodate clients’ needs).
•For regulatory purposes, capital is divided into two classes. Federal regulations currently prescribe that at least one-half of a bank or BHC’s total risk-based capital must qualify as Tier 1 capital. Both total and Tier 1 capital serve as bases for several measures of capital adequacy, which is an important indicator of financial stability and condition. Banking regulators evaluate a component of Tier 1 capital, known as Common Equity Tier 1, under the Regulatory Capital Rules. The “Capital” section of this report under the heading “Capital adequacy” provides more information on total capital, Tier 1 capital, and the Regulatory Capital Rules, including Common Equity Tier 1, and describes how these measures are calculated.
The acronyms and abbreviations identified below are used in the Management’s Discussion & Analysis of Financial Condition & Results of Operations as well as in the Notes to Consolidated Financial Statements (Unaudited). You may find it helpful to refer back to this page as you read this report.
ABO: Accumulated benefit obligation.
ALCO: Asset/Liability Management Committee.
ALLL: Allowance for loan and lease losses.
A/LM: Asset/liability management.
AML: Anti-money laundering.
AOCI: Accumulated other comprehensive income (loss).
ASC: Accounting Standards Codification.
ASU: Accounting Standards Update.
ATMs: Automated teller machines.
BSA: Bank Secrecy Act.
BHCA: Bank Holding Company Act of 1956, as amended.
BHCs: Bank holding companies.
Board: KeyCorp Board of Directors.
CAPM: Capital Asset Pricing Model.
CCAR: Comprehensive Capital Analysis and Review.
CECL: Current Expected Credit Losses.
CFPB: Consumer Financial Protection Bureau, also known as the Bureau of Consumer Financial Protection.
CFTC: Commodities Futures Trading Commission.
CMBS: Commercial mortgage-backed securities.
CMO: Collateralized mortgage obligation.
Common Shares: KeyCorp common shares, $1 par value.
DCF: Discounted cash flow.
DIF: Deposit Insurance Fund of the FDIC.
Dodd-Frank Act: Dodd-Frank Wall Street Reform and
Consumer Protection Act of 2010.
EAD: Exposure at default.
EBITDA: Earnings before interest, taxes, depreciation, and
amortization.
EPS: Earnings per share.
ERBA: Expanded risk-based approach.
ERISA: Employee Retirement Income Security Act of 1974.
ERM: Enterprise risk management.
EVE: Economic value of equity.
FASB: Financial Accounting Standards Board.
FDIA: Federal Deposit Insurance Act, as amended.
FDIC: Federal Deposit Insurance Corporation.
Federal Reserve: Board of Governors of the Federal Reserve
System.
FHLB: Federal Home Loan Bank of Cincinnati.
FHLMC: Federal Home Loan Mortgage Corporation.
FICO: Fair Isaac Corporation.
FINRA: Financial Industry Regulatory Authority.
FNMA: Federal National Mortgage Association.
FSOC: Financial Stability Oversight Council.
FTP: Funds transfer pricing.
FVA: Fair value of employee benefit plan assets.
GAAP: U.S. generally accepted accounting principles.
GNMA: Government National Mortgage Association.
IDI: Insured depository institution.
IRS: Internal Revenue Service.
ISDA: International Swaps and Derivatives Association.
KBCM: KeyBanc Capital Markets, Inc.
KCC: Key Capital Corporation.
KCDC: Key Community Development Corporation.
KCIC: Key Community Investment Capital LLC.
LCR: Liquidity coverage ratio.
LGD: Loss given default.
LIHTC: Low-income housing tax credit.
LTV: Loan-to-value.
Moody’s: Moody’s Investor Services, Inc.
MTRM: Market & Treasury Risk Management.
N/A: Not applicable.
NAV: Net asset value.
NFA: National Futures Association.
N/M: Not meaningful.
NMTC: New market tax credit.
NYSE: New York Stock Exchange.
OBBBA: One Big Beautiful Bill Act.
OCC: Office of the Comptroller of the Currency.
OCI: Other comprehensive income (loss).
OREO: Other real estate owned.
PBO: Projected benefit obligation.
PCCR: Purchased credit card relationship.
PCD: Purchased credit deteriorated.
PD: Probability of default.
RMBS: Residential mortgage-backed securities.
S&P: Standard and Poor’s Ratings Services, a Division of The McGraw-Hill Companies, Inc.
SEC: U.S. Securities & Exchange Commission.
Scotiabank: The Bank of Nova Scotia
SIFIs: Systemically important financial institutions, including large, interconnected BHCs and nonbank financial companies designated by FSOC for supervision by the Federal Reserve.
SOFR: Secured Overnight Financing Rate.
TE: Taxable-equivalent.
TROC: Treasury Risk Oversight Committee.
U.S. Treasury: United States Department of the Treasury.
VaR: Value at risk.
VEBA: Voluntary Employee Beneficiary Association.
VIE: Variable interest entity.
Forward-looking Statements
From time to time, we have made or will make forward-looking statements within the meaning of the Private Securities Litigation Reform Act of 1995. These statements do not relate strictly to historical or current facts. Forward-looking statements usually can be identified by the use of words such as “goal,” “objective,” “plan,” “expect,” “assume,” “anticipate,” “intend,” “project,” “believe,” “estimate,” “will,” “would,” “should,” “could,” or other words of similar meaning. Forward-looking statements provide our current expectations or forecasts of future events, circumstances, results or aspirations. Our disclosures in this report contain forward-looking statements. We may also make forward-looking statements in other documents filed with or furnished to the SEC. In addition, we may make forward-looking statements orally to analysts, investors, representatives of the media and others.
Forward-looking statements, by their nature, are subject to assumptions, risks, and uncertainties, many of which are outside of our control. Our actual results may differ materially from those set forth in our forward-looking statements. There is no assurance that any list of risks and uncertainties or risk factors is complete. In addition, no assurance can be given that any plan, initiative, projection, goal, commitment, expectation, or prospect set forth in this report can or will be achieved. Factors that could cause our actual results to differ from those described in forward-looking statements include, but are not limited to:
•the extensive regulation of the U.S. financial services industry;
•complex and evolving laws and regulations regarding privacy and cybersecurity;
•operational or risk management failures by us or critical third parties;
•breaches of security or failures of our technology systems due to technological or other factors and cybersecurity threats;
•an ineffective risk management framework;
•negative outcomes from claims, litigation, arbitration, investigations, or governmental proceedings;
•failure or circumvention of our controls and procedures;
•our exposure to a wide range of climate-related physical risks across different geographical areas;
•evolving capital and liquidity standards under applicable regulatory rules;
•disruption of the U.S. and global financial system and markets, including the impact of inflation, tariffs or other trade policies, political instability, a prolonged shutdown of the U.S. government, a potential global economic downturn or recession, and extended military conflicts;
•unanticipated changes in our liquidity position, including but not limited to, changes in our access to or the cost of funding and our ability to secure alternative funding sources;
•our ability to receive dividends from our subsidiaries, including KeyBank;
•downgrades in our credit ratings or those of KeyBank;
•a worsening of the U.S. economy due to financial, political or other shocks;
•our ability to anticipate interest rate changes and manage interest rate risk;
•deterioration of economic conditions in the geographic regions where we operate;
•the soundness of other financial institutions, including instability in the financial industry;
•our concentrated credit exposure in commercial and industrial loans;
•deterioration of commercial real estate market fundamentals;
•defaults by our loan clients or counterparties;
•adverse changes in credit quality trends;
•declining asset prices;
•deterioration of asset quality and an increase in credit losses;
•geopolitical destabilization, including ongoing military conflicts;
•labor shortages, increases in unemployment rates, and supply chain constraints;
•our ability to develop and effectively use the quantitative models we rely upon in our business planning;
•our ability to timely and effectively implement our strategic initiatives;
•damage to our reputation;
•increased competitive pressure;
•our ability to adapt our products and services to industry standards and consumer preferences;
•our ability to attract and retain talented executives and employees;
•unanticipated adverse effects of strategic partnerships or acquisitions and dispositions of assets or businesses;
•the potential impact of Scotiabank’s significant equity interest in our business;
•inaccurate assumptions or estimates underlying our consolidated financial statements;
•changes in accounting policies, standards, and interpretations; and
•impairment of goodwill.
Any forward-looking statements made by us or on our behalf speak only as of the date they are made, and we do not undertake any obligation to update any forward-looking statement to reflect the impact of subsequent events or circumstances, except as required by applicable securities laws. Before making an investment decision, you should carefully consider all risks and uncertainties disclosed in our 2025 Form 10-K, in Part II, Item 1A. "Risk Factors" of this report, and in any subsequent reports filed with the SEC by Key, as well as our registration statements under the Securities Act of 1933, as amended, all of which are or will upon filing be accessible on the SEC’s website at www.sec.gov and on our website at www.key.com/ir.
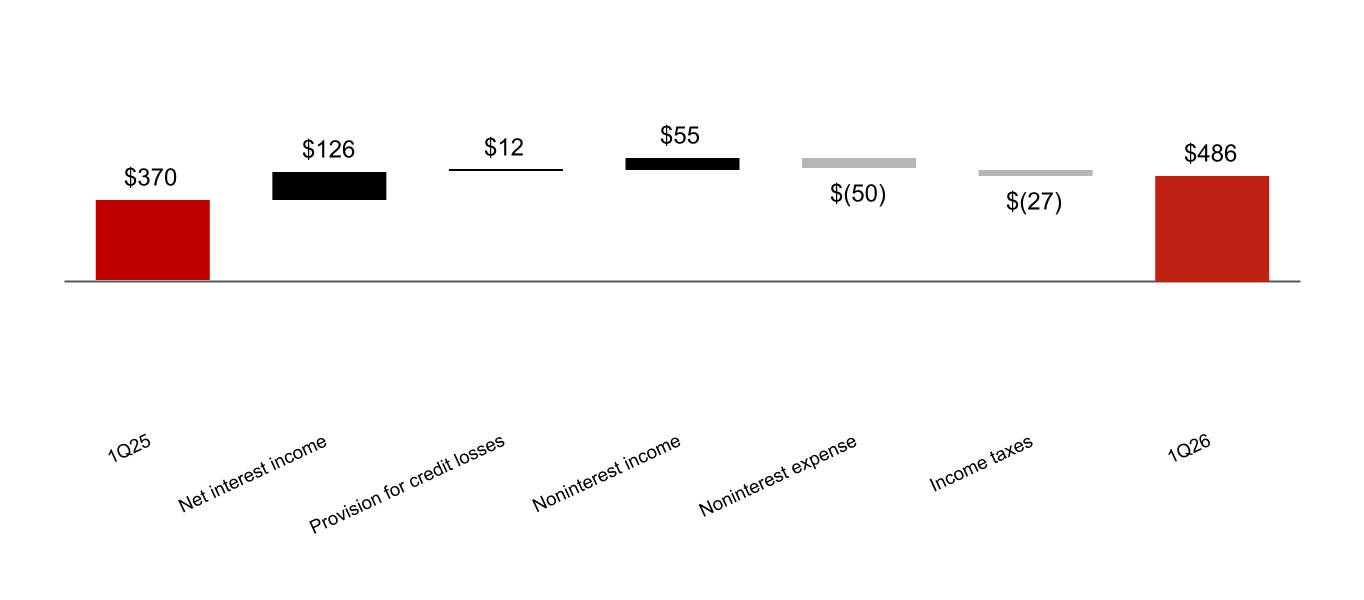
Key reported $486 million in net income from continuing operations attributable to Key common shareholders, or diluted earnings per share of $0.44, in the first quarter of 2026.
Our actions and results during the first quarter of 2026 support our corporate strategy described in the “Introduction” section under the “Corporate strategy” heading on page 51 of our 2025 Form 10-K.
•Commercial client growth and net new relationship households increased approximately 3% and 2%, respectively, year-over-year, reflecting strong client growth and relationship depth.
•Our noninterest income strength continues to be driven by differentiated fee businesses strategically focused on targeted scale. Our priority fee-based businesses — investment banking, commercial payments, and wealth management – collectively grew 12% year-over-year.
•Our Assets Under Management were $69.8 billion for the first quarter of 2026, up 14.3% year-over-year, driven by net positive cash inflows and market impacts on portfolios.
•Our continuous focus on maintaining our risk discipline has and should continue to position us to perform well through all business cycles. Net charge-offs are tracking in line with our current outlook for the year.
•We ended the quarter with a Common Equity Tier 1 ratio of 11.4%(a), which positions us to continue to support existing and prospective clients.
(a) March 31, 2026 capital ratios are estimates
Business outlook
Consistent with the forward guidance we provided on April 16, 2026, we expect these current year results, that is, full year 2026 vs. full year 2025:
Category
2025 Baseline
FY2026 (vs FY 2025)(a)
Revenue (TE)(b)
$7,513 Million
up ~7%
Net interest income (TE) (b)
$4,671 Million
up 9 to 10%
Net interest margin
4Q exit rate: ~3.05%(c)
Noninterest income
$2,842 Million
up 3 - 4%
Noninterest income on an adjusted basis(b)(d)
$2,495 Million
up 5 - 6%
Adjusted noninterest expense(b)
$4,729 Million
up 3 to 4%
Average loans
$105.7 Billion
up 2 - 4%
Average Commercial Loans
$74.5 Billion
up 6 - 8%
Net charge-offs to average loans
40 to 45 basis points
Effective tax rate
~22%
Tax-equivalent Effective Rate(e)
~23%
(a) Ranges are shown on an operating basis.
(b) Key is unable to provide a reconciliation of forward-looking non-GAAP financial measures to their most directly related GAAP financial measures due to the difficulty in forecasting when future amounts may occur. Such unavailable information could be significant for future results.
(c) Average earning assets stable to 1Q26.
(d) Excluding commercial mortgage servicing fees, operating lease income and other leasing gains, other income, and net securities gains (losses).
(e) Reflects the estimated full year taxable-equivalent adjustment.
We have established the following medium-term targets reflecting expected run rates by the end of 2027:
Return on tangible common equity(a)
15.0%+
Net Interest Margin
3.25%+
(a) Key is unable to provide a reconciliation of forward-looking non-GAAP financial measures to their most directly related GAAP financial measures due to the difficulty in forecasting when future amounts may occur. Such unavailable information could be significant for future results.
Our management structure and basis of presentation is divided into two business segments, Consumer Bank and Commercial Bank. Note 17 (“Business Segment Reporting”) describes the products and services offered by each of these business segments and provides more detailed financial information pertaining to the segments.
The Consumer Bank serves individuals and small businesses throughout our 15-state branch footprint and through our digital brand by offering a variety of deposit and investment products, personal finance and financial wellness services, lending, student loan refinancing, mortgage and home equity, credit card, treasury services, and business advisory services. In addition, wealth management and investment services are offered to assist non-profit and high-net-worth clients with their banking, trust, portfolio management, charitable giving, and related needs.
The Commercial Bank consists of the Commercial and Institutional operating segments. The Commercial operating segment is a full-service, commercial banking platform that focuses primarily on serving the borrowing, cash management, and capital markets needs of middle market clients within Key’s 15-state branch footprint. The Institutional operating segment operates nationally in providing lending, equipment financing, and banking products and services to large corporate and institutional clients. The industry coverage and product teams have established expertise in the following sectors: Consumer, Energy, Healthcare, Industrial, Public Sector, Real Estate, and Technology. It is also a significant, national, commercial real estate lender and third-party master and special servicer of commercial mortgage loans. The operating segment includes the KBCM platform which provides a broad suite of capital markets products and services including syndicated finance, debt and equity underwriting, fixed income and equity sales and trading, derivatives, foreign exchange, mergers & acquisition and other advisory, and public finance.
Supervision and regulation
The following discussion provides a summary of recent regulatory developments and should be read in conjunction with the disclosure included in our 2025 Form 10-K under the heading “Supervision and Regulation” in Item 1. Business and under the heading “V. Compliance Risk” in Item 1A. Risk Factors as well as the disclosure included in Part II, Item 1A. "Risk Factors" of this report.
Regulatory capital requirements
KeyCorp and KeyBank are subject to regulatory capital requirements that are based largely on the Basel III international capital framework (“Basel III”). The Basel III capital framework and the U.S. implementation of the Basel III capital framework (“Regulatory Capital Rules”) are discussed in more detail in Item 1. Business of our 2025 Form 10-K under the heading “Supervision and Regulation — Regulatory Capital and Liquidity Requirements.”
Under the Regulatory Capital Rules, standardized approach banking organizations, such as KeyCorp and KeyBank, are required to meet the minimum capital and leverage ratios set forth in Figure 1 below. At March 31, 2026, KeyCorp’s ratios under the fully phased-in Regulatory Capital Rules were as set forth in Figure 1.
Figure 1. Minimum Capital Ratios and KeyCorp Ratios Under the Regulatory Capital Rules
Ratios (including stress capital buffer)
Regulatory Minimum Requirement
Stress Capital Buffer (b)
Regulatory Minimum Stress Capital Buffer
KeyCorp
March 31, 2026 (c)
Common Equity Tier 1
4.50
%
3.20
%
7.70
%
11.40
%
Tier 1 Capital
6.00
3.20
9.20
13.03
Total Capital
8.00
3.20
11.20
15.18
Leverage (a)
4.00
N/A
4.00
10.47
(a)As a standardized approach banking organization, KeyCorp is not subject to the 3% supplementary leverage ratio requirement.
(b)Stress capital buffer must consist of Common Equity Tier 1 capital. As a standardized approach banking organization, KeyCorp is not subject to the countercyclical capital buffer of up to 2.5% imposed upon an advanced approaches banking organization under the Regulatory Capital Rules. KeyCorp’s stress capital buffer is 3.20% as of October 1, 2025.
(c)March 31, 2026 capital ratios are estimates.
Revised prompt corrective action framework
The federal Prompt Corrective Action (“PCA”) framework under the FDIA groups FDIC-insured depository institutions into one of five prompt corrective action capital categories: “well capitalized,” “adequately capitalized,” “undercapitalized,” “significantly undercapitalized,” and “critically undercapitalized.” In addition to implementing the Basel III capital framework in the United States, the Regulatory Capital Rules also revised the PCA capital category threshold ratios applicable to FDIC-insured depository institutions such as KeyBank. The revised PCA framework
table in Figure 2 identifies the capital category threshold ratios for a “well capitalized” and an “adequately capitalized” institution under the PCA framework.
Figure 2. "Well Capitalized" and "Adequately Capitalized" Capital Category Ratios under Revised Prompt Corrective Action Framework
Prompt Corrective Action
Capital Category
Ratio
Well Capitalized (a)
Adequately Capitalized
Common Equity Tier 1 Risk-Based
6.50
%
4.50
%
Tier 1 Risk-Based
8.00
6.00
Total Risk-Based
10.00
8.00
Tier 1 Leverage (b)
5.00
4.00
(a)A “well capitalized” institution also must not be subject to any written agreement, order, or directive to meet and maintain a specific capital level for any capital measure.
(b)As a “standardized approach” banking organization, KeyBank is not subject to the 3% supplementary leverage ratio requirement, which became effective January 1, 2018.
As of March 31, 2026, KeyBank (consolidated) satisfied the risk-based and leverage capital requirements necessary to be considered “well capitalized” for purposes of the revised PCA framework. However, investors should not regard this determination as a representation of the overall financial condition or prospects of KeyBank because the PCA framework is intended to serve a limited supervisory function. Moreover, it is important to note that the PCA framework does not apply to BHCs, like KeyCorp.
Recent regulatory capital-related developments
On March 19, 2026, the federal banking agencies issued three proposals that would make significant changes to the Regulatory Capital Rules. The agencies said that these proposals would streamline capital requirements and would better align regulatory capital with risk. One proposal would implement the final elements of the Basel III capital framework (the “Basel III Proposal”). The Basel III Proposal would establish a new approach for calculating risk-based capital ratios, “expanded risk-based approach (“ERBA”)”, that would include requirements for credit risk, equity risk, and operational risk and would increase risk sensitivity by varying capital requirements according to various risk factors. The Basel III Proposal would also establish a new framework for determining market risk capital requirements. The Basel III Proposal would apply to Category I and II banking organizations, and the market risk component of this proposal would also apply to other banking organizations with significant trading activity. All other banking organizations (including Category IV banking organizations such as KeyCorp and KeyBank) would have the option to have their capital requirements determined under the ERBA contained in this proposal.
A second proposal issued by the federal banking agencies on March 19, 2026 would revise the standardized approach for calculating risk-based capital ratios used by most banking organizations, including Category IV banking organizations such as KeyCorp and KeyBank (the “Standardized Approach Proposal”). The Standardized Approach Proposal would increase the calibration and risk sensitivity of risk weights for certain traditional lending activities. Among other things, the proposal would reduce the risk weight applicable to corporate exposures and would introduce a broader range of risk weights for residential mortgages based on more granular risk factors. Also, the Standardized Approach Proposal and the Basel III Proposal would modify the definition of capital by removing the threshold-based deduction for mortgage servicing assets, and the Standardized Approach Proposal would require Category III and IV banking organizations to include most components of AOCI, including net unrealized gains and losses on available-for-sale securities, in regulatory capital subject to a five-year transition.
A third capital-related proposal issued on March 19, 2026 was a proposal from the Federal Reserve to (1) modify the Global Systemically Important Bank (“GSIB”) capital surcharge, which applies to U.S. global systemically important BHCs (not including KeyCorp) and (2) amend the Systemic Risk Report (FR Y-15), which is used to collect systemic risk data from BHCs with total consolidated assets of $100 billion or more (including KeyCorp). The agencies indicated that the capital-related proposals they issued on March 19, 2026 replace the capital-related proposal they issued in July of 2023. Comments on the new proposals are due by June 18, 2026.
Capital planning, stress testing, and stress capital buffer
On June 27, 2025, the Federal Reserve announced the results of the supervisory stress test that it conducted of 22 large BHCs (not including KeyCorp). As a Category IV banking organization subject to a supervisory stress test every other year, KeyCorp was not required to participate in the Federal Reserve’s supervisory stress test in 2025. On August 29, 2025, the Federal Reserve published the updated stress capital buffer requirements for large BHCs, including BHCs like KeyCorp that did not participate in the supervisory stress test in 2025. KeyCorp’s updated stress capital buffer is 3.2% (based on the results of KeyCorp’s 2024 supervisory stress test and adjusted for
KeyCorp’s planned common stock dividends as set forth in KeyCorp’s 2025 capital plan). This stress capital buffer became effective on October 1, 2025. On February 4, 2026, the Federal Reserve announced that it would maintain the current stress capital buffer requirements until 2027 for the BHCs that are subject to its supervisory stress tests (rather than updating the requirements in 2026) so that the Federal Reserve will be able to consider public feedback on its stress test models before setting the new requirements.
See Item 1. Business of our 2025 Form 10-K under the heading “Supervision and Regulation - Regulatory Capital and Liquidity Requirements - Capital planning, stress testing, and stress capital buffer” for a discussion of other developments concerning capital planning, stress testing, and stress capital buffer requirements.
Recovery plans
On March 31, 2026, the OCC issued a final rule to rescind its recovery planning guidelines that applied to banks with average total consolidated assets of at least $100 billion (including KeyBank). In rescinding these guidelines, the OCC stated that the guidelines were overly prescriptive and imposed an unnecessary regulatory burden on the covered institutions. The OCC said that it would still expect all institutions that it regulates to have appropriate risk management processes in place to address all material risks in their operating environment and to maintain a formal contingency funding plan that considers a range of possible stress scenarios, assesses the stability of funding during periods of stress, and provides for a broad range of funding sources under adverse conditions.
The following chart provides a reconciliation of net income (loss) from continuing operations attributable to Key common shareholders for the three months ended March 31, 2025, to the three months ended March 31, 2026 (dollars in millions):
Net interest income
One of our principal sources of revenue is net interest income. Net interest income is the difference between interest income received on earning assets (such as loans and securities) and loan-related fee income, and interest expense paid on deposits and borrowings. There are several factors that affect net interest income, including:
•the volume, pricing, mix, and maturity of earning assets and interest-bearing liabilities;
•the volume and value of net free funds, such as noninterest-bearing deposits and equity capital;
•the use of derivative instruments to manage interest rate risk;
•interest rate fluctuations and competitive conditions within the marketplace;
•asset quality; and
•fair value accounting of acquired earning assets and interest-bearing liabilities.
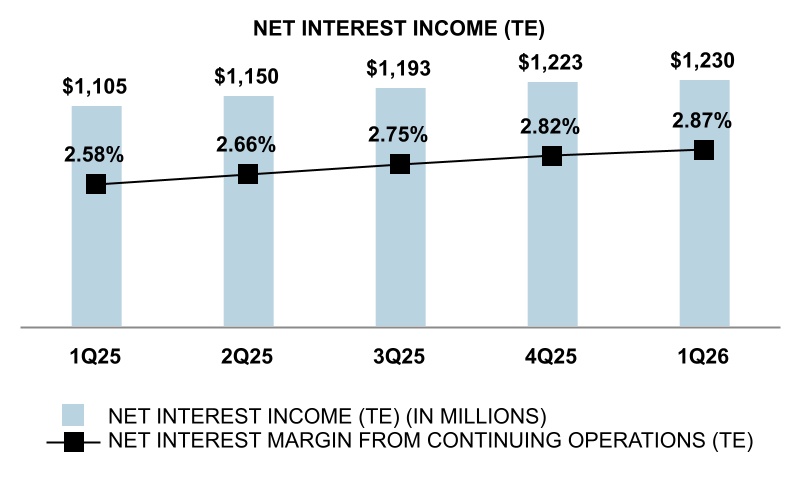
To make it easier to compare both the results across several periods and the yields on various types of earning assets (some taxable, some not), we present net interest income in this discussion on a “TE basis” (i.e., as if all income were taxable and at the same rate). For example, $100 of tax-exempt income would be presented as $126, an amount that, if taxed at the statutory federal income tax rate of 21%, would yield $100.
Net interest income (TE) was $1.23 billion for the first quarter of 2026 and the net interest margin was 2.87%. Compared to the first quarter of 2025, net interest income (TE) increased $125 million and net interest margin increased by 29 basis points. These increases were driven by a reduction in deposit costs as a result of declining interest rates and proactive deposit beta management, the reinvestment of proceeds from maturing low-yielding investment securities and fixed-rate swaps into higher-yielding investments, and a shift in the balance sheet composition to a more favorable mix of higher-yielding commercial and industrial loans. These benefits were partially offset by the impact of lower interest rates on variable-rate earning assets.
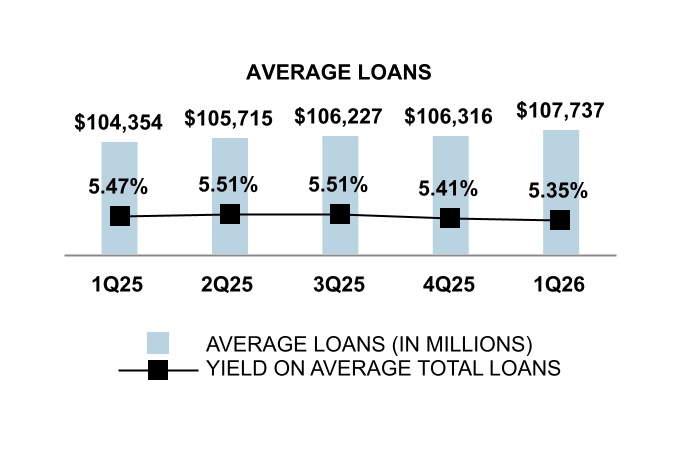
Average loans were $107.7 billion for the first quarter of 2026, an increase of $3.4 billion compared to the first quarter of 2025. Average commercial loans increased by $5.7 billion, primarily due to an increase in commercial and industrial loans. Average consumer loans declined by $2.3 billion, reflective of broad-based declines across all consumer loan categories.
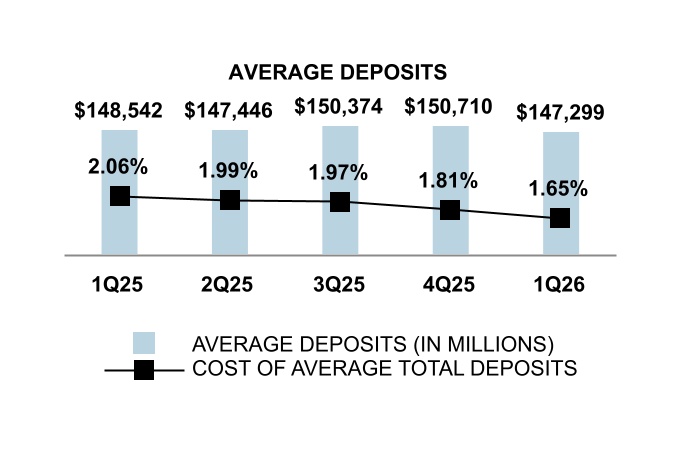
Average deposits totaled $147.3 billion for the first quarter of 2026, a decrease of $1.2 billion compared to the year-ago quarter, driven by the intentional runoff of brokered CDs.
Figure 3 shows the various components of our balance sheet that affect interest income and expense and their respective yields or rates for the current period and comparative year-ago period. This figure also presents a reconciliation of TE net interest income to net interest income reported in accordance with GAAP for each of those quarters. The net interest margin, which is an indicator of the profitability of the earning assets portfolio less the cost of funding, is calculated by dividing annualized TE net interest income by average earning assets.
Figure 3. Consolidated Average Balance Sheets, Net Interest Income, and Yields/Rates and Components of Net Interest Income Changes from Continuing Operations(g)
Three months ended March 31, 2026
Three months ended March 31, 2025
Change in Net interest income due to
Dollars in millions
Average
Balance
Interest (a)
Yield/
Rate (a)
Average Balance
Interest (a)
Yield/ Rate (a)
Volume
Yield/Rate
Total
ASSETS
Loans (b), (c)
Commercial and industrial (d)
$
59,149
$
843
5.76
%
$
53,746
$
800
6.04
%
$
78
$
(35)
$
43
Real estate — commercial mortgage
13,902
198
5.76
13,061
192
5.96
12
(6)
6
Real estate — construction
2,803
45
6.50
2,905
49
6.87
(2)
(2)
(4)
Commercial lease financing
2,213
21
3.81
2,653
23
3.52
(4)
2
(2)
Total commercial loans
78,067
1,107
5.73
72,365
1,064
5.96
84
(41)
43
Real estate — residential mortgage
18,593
155
3.34
19,737
165
3.33
(10)
—
(10)
Home equity loans
5,609
74
5.35
6,248
86
5.60
(9)
(3)
(12)
Other consumer loans
4,558
58
5.16
5,087
63
5.01
(7)
2
(5)
Credit cards
910
30
13.24
917
32
14.04
—
(2)
(2)
Total consumer loans
29,670
317
4.30
31,989
346
4.35
(26)
(3)
(29)
Total loans
107,737
1,424
5.35
104,354
1,410
5.47
58
(44)
14
Loans held for sale
1,092
14
4.99
815
14
6.70
4
(4)
—
Securities available for sale (b), (e)
39,403
370
3.59
39,321
392
3.70
1
(23)
(22)
Held-to-maturity securities (b)
8,795
86
3.91
7,274
63
3.46
14
9
23
Trading account assets
865
11
4.96
1,296
17
5.20
(5)
(1)
(6)
Short-term investments
11,134
103
3.74
15,211
174
4.63
(41)
(30)
(71)
Other investments
1,075
5
1.97
935
9
3.73
1
(5)
(4)
Total earning assets
170,101
2,013
4.71
169,206
2,079
4.86
32
(98)
(66)
Allowance for loan and lease losses
(1,419)
(1,401)
Accrued income and other assets
17,567
18,285
Discontinued assets
204
254
Total assets
$
186,453
$
186,344
LIABILITIES
Money market deposits
$
42,732
$
223
2.12
%
$
42,007
$
275
2.65
%
$
5
$
(57)
$
(52)
Demand deposits
61,478
279
1.84
57,460
310
2.19
21
(52)
(31)
Savings deposits
4,378
1
0.04
4,610
1
0.06
—
—
—
Time deposits
11,777
95
3.26
16,625
167
4.09
(43)
(29)
(72)
Total interest-bearing deposits
120,365
598
2.01
120,702
753
2.53
(17)
(138)
(155)
Federal funds purchased and securities sold under repurchase agreements
1,539
14
3.69
100
1
3.94
13
—
13
Bank notes and other short-term borrowings
2,585
20
3.20
2,273
27
4.74
3
(10)
(7)
Long-term debt (f)
10,186
151
5.96
11,779
193
6.61
(25)
(17)
(42)
Total interest-bearing liabilities
134,675
783
2.35
134,854
974
2.92
(26)
(165)
(191)
Noninterest-bearing deposits
26,934
27,840
Accrued expense and other liabilities
4,248
4,764
Discontinued liabilities (f)
204
254
Total liabilities
166,061
167,712
EQUITY
Key shareholders’ equity
20,392
18,632
Total liabilities and equity
$
186,453
$
186,344
Interest rate spread (TE)
2.36
%
1.94
%
Net interest income (TE) and net interest margin (TE)
$
1,230
2.87
%
$
1,105
2.58
%
$
58
$
67
125
TE adjustment (b)
8
9
Net interest income, GAAP basis
$
1,222
$
1,096
(a)Results are from continuing operations. Interest excludes the interest associated with the liabilities referred to in (f) below, calculated using a matched funds transfer pricing methodology.
(b)Interest income on tax-exempt securities and loans has been adjusted to a taxable-equivalent basis using the statutory federal income tax rate of 21% for the three months ended March 31, 2026, and March 31, 2025.
(c)For purposes of these computations, nonaccrual loans are included in average loan balances.
(d)Commercial and industrial average balances include $205 million and $213 million of assets from commercial credit cards for the three months ended March 31, 2026, and March 31, 2025, respectively.
(e)Yield presented is calculated on the basis of amortized cost excluding fair value hedge basis adjustments. The average amortized cost for securities available for sale was $41.5 billion and $42.7 billion for the three months ended March 31, 2026 and March 31, 2025, respectively. Yield based on the fair value of securities available for sale was 3.75% and 3.99% for the three months ended March 31, 2026 and March 31, 2025, respectively.
(f)A portion of long-term debt and the related interest expense is allocated to discontinued liabilities as a result of applying our matched funds transfer pricing methodology to discontinued operations.
(g)Average balances presented are based on daily average balances over the respective stated period.
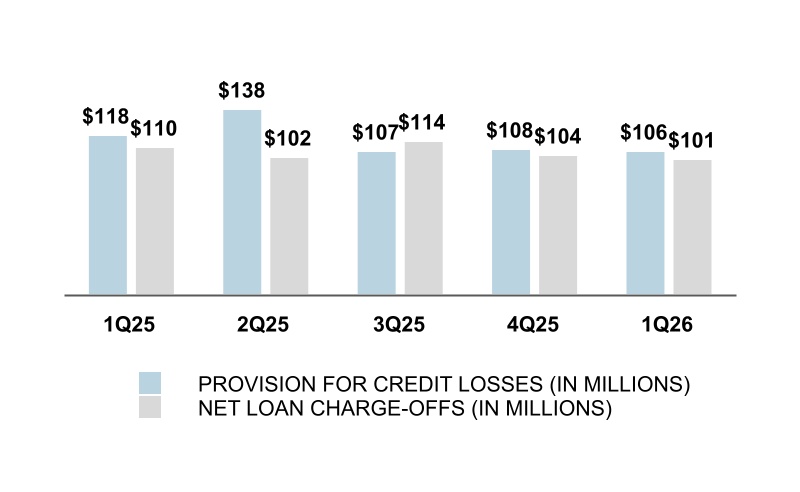
Key’s provision for credit losses was $106 million for the three months ended March 31, 2026, compared to $118 million for the three months ended March 31, 2025. The decrease from the year-ago period reflects both lower net-charge-offs and more stable reserve levels.
Noninterest income
As shown in Figure 4, noninterest income was $723 million for the first quarter of 2026, compared to $668 million for the year-ago quarter.
The following discussion explains the composition of certain elements of our noninterest income and the factors that caused those elements to change.
Figure 4. Noninterest Income
Three Months Ended March 31,
Percent Change
Dollars in millions
2026
2025
Trust and investment services income
$
157
$
139
12.9
%
Investment banking and debt placement fees
197
175
12.6
Cards and payments income
86
82
4.9
Service charges on deposit accounts
77
69
11.6
Corporate services income
71
65
9.2
Commercial mortgage servicing fees
62
76
(18.4)
Corporate-owned life insurance income
34
33
3.0
Consumer mortgage income
13
13
—
Operating lease income and other leasing gains
8
9
(11.1)
Other income
18
7
157.1
Total noninterest income
$
723
$
668
8.2
%
Trust and investment services income
Trust and investment services income consists of brokerage commissions, trust and asset management fees, and insurance income. The assets under management or administration that primarily generate certain trust and asset management fees are shown in Figure 5. For the three months ended March 31, 2026, trust and investment services income was up $18 million, or 12.9%, compared to the same period one year ago. This was primarily due to an increase in investment management income and other fees associated with higher assets under management.
A significant portion of our trust and investment services income depends on the value and mix of assets under management. As shown in Figure 5, at March 31, 2026, our bank, trust, and registered investment advisory subsidiaries had assets under management of $69.8 billion, up 14.3% compared to March 31, 2025. The increase was driven by continued net positive cash in-flows and market impacts on portfolios.
Figure 5. Assets Under Management or Administration
Dollars in millions
March 31, 2026
December 31, 2025
September 30, 2025
June 30, 2025
March 31, 2025
Discretionary assets under management by investment type:
Equity
$
37,071
$
37,433
$
37,919
$
35,987
$
33,478
Fixed income
16,100
15,500
15,183
14,591
14,290
Money market
7,180
8,144
6,595
6,420
6,851
Total discretionary assets under management
60,351
61,077
59,697
56,998
54,619
Non-discretionary assets under administration
9,405
8,887
8,158
7,246
6,434
Total
$
69,756
$
69,964
$
67,855
$
64,244
$
61,053
Investment banking and debt placement fees
Investment banking and debt placement fees consist of syndication fees, debt and equity securities underwriting fees, merger and acquisition and financial advisory fees, gains on sales of commercial mortgages, and agency origination fees. For the three months ended March 31, 2026, investment banking and debt placement fees were up $22 million, or 12.6%, compared to the same period a year ago. The increase reflects higher investment banking fees and related activity in our mergers and acquisitions and equity new issue underwriting businesses.
Cards and payments income
Cards and payments income, which consists of debit card, prepaid card, consumer and commercial credit card, and merchant services income, increased $4 million or 4.9% for the three months ended March 31, 2026, compared to the same period one year ago. The increase was primarily a result of higher merchant services income and higher credit card spend volume slightly offset by higher credit card reward costs.
Service charges on deposit accounts
Service charges on deposit accounts increased $8 million, or 11.6%, for the three months ended March 31, 2026, compared to the same period one year ago. The increase was driven by account analysis fees.
Other noninterest income
Other noninterest income includes operating lease income and other leasing gains, corporate services income,
corporate-owned life insurance income, consumer mortgage income, commercial mortgage servicing fees, net securities gains(losses), and other income. Net other noninterest income for the three months ended March 31, 2026, increased $3 million, or 1.5%, from the year-ago quarter. This net change resulted from higher corporate services income reflective of growth in loan commitment fees, foreign exchange trading gains, and non-yield loan fees, coupled with higher other noninterest income from increases in deposit network fees and lower realized losses on non-customer derivatives activity. Offsetting this net increase were lower commercial mortgage servicing fees reflective of lower special servicing and other miscellaneous ancillary fees.
Noninterest expense
As shown in Figure 6, noninterest expense was $1.2 billion for the first quarter of 2026, compared to $1.1 billion for the first quarter of 2025.
The following discussion explains the composition of certain elements of our noninterest expense and the factors that caused those elements to change.
Personnel expense, the largest category of our noninterest expense, increased by $63 million, or 9.3%, for the three months ended March 31, 2026, compared to the same period one year ago. The increase was primarily related to continued investments in people, employee benefits, and incentive compensation associated with noninterest income growth.
Figure 7. Personnel Expense
Dollars in millions
Three Months Ended March 31,
Percent Change
2026
2025
Salaries and contract labor
$
439
$
405
8.4
%
Incentive and stock-based compensation (a)
172
158
8.9
Employee benefits
127
109
16.5
Severance
5
8
(37.5)
Total personnel expense
$
743
$
680
9.3
%
(a)Excludes directors’ stock-based compensation of $1 million and $1 million for the three months ended March 31, 2026, and March 31, 2025, respectively, reported as “other expense” in Figure 6.
Nonpersonnel expense
Other nonpersonnel expense includes net occupancy, computer processing, business services and professional fees, equipment, operating lease expense, marketing, and other miscellaneous expense categories. Other nonpersonnel expense for the three months ended March 31, 2026, decreased $13 million, or 2.9%, from the year-ago quarter, primarily due to declines in technology consulting and legal expenditures, operating lease costs, and marketing spend.
Income taxes
We recorded tax expense of $136 million for the first quarter of 2026 and tax expense of $109 million for the first quarter of 2025.
Our federal tax expense and effective tax rate differs from the amount that would be calculated using the federal statutory tax rate, primarily due to investments in tax-advantaged assets, such as corporate-owned life insurance, tax credits associated with low-income housing investments, and periodic adjustments to our tax reserves.
Additional information pertaining to how our tax expense (benefit) and the resulting effective tax rates were derived is included in Note 13 (“Income Taxes”) beginning on page 153 of our 2025 Form 10-K.
This section summarizes the financial performance of our two major business segments (operating segments): Consumer Bank and Commercial Bank. Note 17 (“Business Segment Reporting”) describes the products and services offered by each of these business segments and provides more detailed financial information pertaining to the segments. For more information on the segment imperatives and market and business overview, see “Business Segment Results” beginning on page 59 of our 2025 Form 10-K. Dollars in the charts are presented in millions.
Consumer Bank
Summary of operations
Three Months Ended March 31,
Percent
Dollars in millions
2026
2025
Change
Summary of operations
Net interest income (TE)
$
738
$
706
4.5
%
Noninterest income
240
226
6.2
Total revenue (TE)
978
932
4.9
Provision for credit losses
40
43
(7.0)
Noninterest expense
709
675
5.0
Income (loss) before income taxes (TE)
229
214
7.0
Allocated income taxes (benefit) and TE adjustments
56
51
9.8
Net income (loss) attributable to Key
$
173
$
163
6.1
%
Average loans and leases
Real estate — residential mortgage
$
18,589
$
19,728
(5.8)
%
Home equity loans
5,564
6,214
(10.5)
Other consumer loans
4,569
5,078
(10.0)
Credit cards
910
917
(.8)
Commercial loans
4,373
4,882
(10.4)
Total loans and leases
$
34,005
$
36,819
(7.6)
%
Average deposits
Money market deposits
$
35,920
$
33,533
7.1
%
Demand deposits
23,214
22,772
1.9
Savings deposits
4,199
4,392
(4.4)
Time deposits
10,610
13,318
(20.3)
Noninterest-bearing deposits
13,853
14,291
(3.1)
Total deposits
$
87,796
$
88,306
(.6)
%
Credit-related statistics
Nonperforming assets at period end
$
270
$
278
Net loan charge-offs
40
52
Net loan charge-offs to average total loans
0.48
%
0.57
%
•Net income attributable to Key of $173 million for the first quarter of 2026, compared to $163 million for the year-ago quarter
•Taxable-equivalent net interest income attributable to the Consumer Bank increased $32 million, or 4.5%, compared to the first quarter of 2025
•Average loans and leases decreased $2.8 billion, or 7.6%, from the first quarter of 2025, reflective of broad-based declines across all loan categories
•Average deposits decreased $510 million, or 0.6%, from the first quarter of 2025, driven by lower time deposits, partially offset by an increase in money market deposits
•Provision for credit losses decreased $3 million compared to the first quarter of 2025, driven by lower charge-offs
•Noninterest income increased $14 million, or 6.2%, from the first quarter of 2025, primarily driven by higher trust and investment services income
•Noninterest expense increased $34 million, or 5.0%, from the first quarter of 2025, primarily driven by higher support and overhead expense
Allocated income taxes (benefit) and TE adjustments
122
109
11.9
Net income (loss) attributable to Key
$
451
$
399
13.0
%
Average loans and leases
Commercial and industrial
$
55,540
$
49,944
11.2
%
Real estate — commercial mortgage
12,692
11,679
8.7
Real estate — construction
2,704
2,789
(3.0)
Commercial lease financing
2,204
2,634
(16.3)
Other loans
6
12
(50.0)
Total loans and leases
$
73,146
$
67,058
9.1
%
Average deposits
Money market deposits
$
6,811
$
8,368
(18.6)
%
Demand deposits
39,072
35,379
10.4
Other deposits
429
568
(24.5)
Noninterest-bearing deposits
12,615
13,166
(4.2)
Total deposits
$
58,929
$
57,481
2.5
%
Credit-related statistics
Nonperforming assets at period end
$
422
$
422
Net loan charge-offs
64
57
Net loan charge-offs to average total loans
0.35
%
0.34
%
•Net income attributable to Key of $451 million for the first quarter of 2026, compared to $399 million for the year-ago quarter
•Taxable-equivalent net interest income attributable to the Commercial Bank increased $36 million or 5.7%, compared to the first quarter of 2025
•Average loan and lease balances increased $6.1 billion, or 9.1%, compared to the first quarter of 2025, driven by an increase in commercial and industrial loans
•Average deposit balances increased $1.4 billion, or 2.5%, compared to the first quarter of 2025, driven by higher client deposits
•Provision for credit losses decreased $5 million compared to the first quarter of 2025, driven by more stable reserves, partially offset by higher net charge-offs
•Noninterest income increased $34 million, or 8.3%, from the first quarter of 2025, primarily driven by an increase in investment banking and debt placement fees and service charges on deposit accounts
•Noninterest expense increased $10 million, or 2.2%, compared to the first quarter of 2025, primarily driven by an increase in support and overhead expense
(a)Loan balances include $207 million and $218 million of commercial credit card balances at December 31, 2026, and March 31, 2025, respectively.
(b)Total loans exclude loans of $194 million at December 31, 2026, and $205 million at March 31, 2025, related to the discontinued operations of the education lending business.
At March 31, 2026, total loans outstanding from continuing operations were $109.2 billion, compared to $106.5 billion at December 31, 2025. For more information on balance sheet carrying value, see Note 1 (“Summary of Significant Accounting Policies”) under the headings “Loans” and “Loans Held for Sale” starting on page 108 of our 2025 Form 10-K.
Commercial loan portfolio
Commercial loans outstanding were $79.8 billion at March 31, 2026, an increase of $3.3 billion, or 4.3%, compared to December 31, 2025, primarily driven by growth in the commercial and industrial loan portfolios.
Figure 9 provides our commercial loan portfolios by industry classification at March 31, 2026, and December 31, 2025.
Figure 9. Commercial Loans by Industry
March 31, 2026
Commercial and industrial
Commercial
real estate
Commercial
lease financing
Total commercial
loans
Percent of
total
Dollars in millions
Industry classification:
Agriculture
$
947
$
121
$
75
$
1,143
1.4
%
Automotive
2,384
644
—
3,028
3.8
Business services
3,236
247
110
3,593
4.5
Commercial real estate
8,551
12,147
1
20,699
25.9
Construction materials and contractors
2,244
274
136
2,654
3.3
Consumer goods
3,872
584
211
4,667
5.8
Consumer services
4,309
795
242
5,346
6.7
Equipment
1,674
148
40
1,862
2.3
Finance
13,460
99
166
13,725
17.3
Healthcare
2,474
1,431
112
4,017
5.0
Materials and extraction
2,190
217
99
2,506
3.1
Oil and gas
2,015
55
12
2,082
2.6
Public exposure
1,740
7
286
2,033
2.5
Technology
1,173
16
75
1,264
1.7
Transportation
990
132
288
1,410
1.8
Utilities
9,056
—
340
9,396
11.8
Other
336
28
7
371
0.5
Total
$
60,651
$
16,945
$
2,200
$
79,796
100.0
%
December 31, 2025
Commercial and industrial
Commercial
real estate
Commercial
lease financing
Total commercial
loans
Percent of
total
Dollars in millions
Industry classification:
Agriculture
$
908
$
110
$
76
$
1,094
1.4
%
Automotive
2,475
610
—
3,085
4.0
Business services
3,228
227
85
3,540
4.6
Commercial real estate
8,124
12,045
1
20,170
26.4
Construction materials and contractors
1,978
238
153
2,369
3.1
Consumer goods
3,541
547
213
4,301
5.6
Consumer services
4,081
799
251
5,131
6.7
Equipment
1,586
153
45
1,784
2.3
Finance
12,165
96
167
12,428
16.3
Healthcare
2,714
1,334
133
4,181
5.5
Materials and extraction
2,105
177
104
2,386
3.1
Oil and gas
2,051
28
13
2,092
2.7
Public exposure
1,654
7
306
1,967
2.6
Technology
1,009
17
82
1,108
1.5
Transportation
1,022
121
276
1,419
1.9
Utilities
8,686
—
358
9,044
11.8
Other
361
42
7
410
0.5
Total
$
57,688
$
16,551
$
2,270
$
76,509
100.0
%
Commercial and industrial. Commercial and industrial loans are the largest component of our loan portfolio, representing 56%of our total loan portfolio at March 31, 2026, and 54% at December 31, 2025. This portfolio is approximately 92% variable rate and consists of loans originated primarily to large corporate, middle market, and small business clients.
Commercial and industrial loans totaled $60.7 billion at March 31, 2026, an increase of $3.0 billion, or 5.1%, compared to December 31, 2025. The increase was driven by loans to the Finance industry, which primarily includes finance, insurance, and leasing companies.
Commercial real estate loans. Our commercial real estate portfolio includes project loans primarily focused in market-rate and affordable multi-family housing loans, owner-occupied commercial and industrial operating company buildings, and community center grocer-anchored retail centers. These three commercial real estate segments make up 70% of our commercial real estate portfolio. Our non-owner-occupied portfolio is focused on operators of commercial real estate who not only utilize our loan products, but also utilize our broader industry-focused products and services and provide consistent pipelines into our agency, CMBS, and other long-term market take out products. This focus ensures our relationship clients foster and build portfolios with stable, recurring cash flows, with adequate, balanced cash reserves to support our balance sheet exposures through the economic cycle.
At March 31, 2026, commercial real estate loans totaled $16.9 billion, which includes $14.1 billion of mortgage loans and $2.8 billion of construction loans. Compared to December 31, 2025, this portfolio increased $394 million, or 2.4%. Nonowner-occupied properties, generally properties for which at least 50% of the debt service is provided by
rental income from nonaffiliated third parties, represented 81% of total commercial real estate loans outstanding at March 31, 2026.
Our overall construction loans constitute 17% of commercial real estate loans as of March 31, 2026 and December 31, 2025, respectively. Construction loans provide a stream of funding for properties not fully leased at origination to support debt service payments over the term of the contract or project. As of March 31, 2026, 75% of our construction portfolio are multi-family project loans. Our office exposure only represents 4% of commercial real estate loans at period end.
As shown in Figure 10, our commercial real estate loan portfolio includes various property types and geographic locations of the underlying collateral. These loans include commercial mortgage and construction loans in both Consumer Bank and Commercial Bank.
Alaska, California, Hawaii, Idaho, Montana, Oregon, Washington, and Wyoming
Southwest –
Arizona, Nevada, and New Mexico
Central –
Arkansas, Colorado, Oklahoma, Texas, and Utah
Midwest –
Illinois, Indiana, Iowa, Kansas, Michigan, Minnesota, Missouri, Nebraska, North Dakota, Ohio, South Dakota, and Wisconsin
Southeast –
Alabama, Delaware, Florida, Georgia, Kentucky, Louisiana, Maryland, Mississippi, North Carolina, South Carolina, Tennessee, Virginia, Washington D.C., and West Virginia
Northeast –
Connecticut, Maine, Massachusetts, New Hampshire, New Jersey, New York, Pennsylvania, Rhode Island, and Vermont
National –
Accounts in three or more regions
N/M = not meaningful
Consumer loan portfolio
Consumer loans outstanding as of March 31, 2026, totaled $29.4 billion, a decrease of $638 million, or 2.1%, from December 31, 2025. The decrease was driven by declines across all consumer loan categories reflective of the intentional run-off of low-yielding loans.
The residential mortgage portfolio is comprised of loans originated by our Consumer Bank and is the largest segment of our consumer loan portfolio as of March 31, 2026, representing 63% of consumer loans outstanding. This is followed by our home equity portfolio representing 19% of consumer loans outstanding at March 31, 2026.
We held the first lien position for approximately 63% of the home equity portfolio at March 31, 2026 and December 31, 2025, respectively. For loans with real estate collateral, we track borrower performance monthly. Regardless of the lien position, credit metrics are refreshed quarterly, including recent FICO scores as well as updated loan-to-value ratios. This information is used in establishing the ALLL. Our methodology is described in Note 1 (“Summary of Significant Accounting Policies”) under the heading “Allowance for Loan and Lease Losses” of our 2025 Form 10-K.
Figure 11 presents our consumer loans by geography.
Figure 11. Consumer Loans by State
Dollars in millions
Real estate — residential mortgage
Home equity loans
Other consumer loans
Credit cards
Total
March 31, 2026
Washington
$
3,952
$
822
$
195
$
82
$
5,051
Ohio
2,617
723
63
181
3,584
New York
598
1,549
686
309
3,142
Colorado
2,750
231
112
29
3,122
California
2,047
13
383
3
2,446
Oregon
1,120
474
82
40
1,716
Pennsylvania
370
382
287
60
1,099
Florida
664
36
327
12
1,039
Utah
745
205
50
16
1,016
Connecticut
607
193
97
28
925
Other
3,013
900
2,195
146
6,254
Total
$
18,483
$
5,528
$
4,477
$
906
$
29,394
December 31, 2025
Washington
$
4,030
$
844
$
202
$
85
$
5,161
Ohio
2,613
758
66
195
3,632
New York
626
1,587
702
326
3,241
Colorado
2,769
236
118
29
3,152
California
2,056
13
399
3
2,471
Oregon
1,145
487
85
41
1,758
Pennsylvania
378
395
296
62
1,131
Florida
675
36
343
13
1,067
Utah
759
215
53
17
1,044
Connecticut
618
200
100
29
947
Other
3,063
932
2,280
153
6,428
Total
$
18,732
$
5,703
$
4,644
$
953
$
30,032
Figure 12 summarizes our loan sales for the three months ended March 31, 2026, and all of 2025.
Figure 12. Loans Sold (Including Loans Held for Sale)
Dollars in millions
Commercial
Commercial
Real Estate
Commercial Lease Financing
Residential
Real Estate
Total
2026
First quarter
$
36
$
1,667
$
122
$
411
$
2,236
Total
$
36
$
1,667
$
122
$
411
$
2,236
2025
Fourth quarter
$
81
$
2,804
$
50
$
331
$
3,266
Third quarter
79
2,513
61
359
3,012
Second quarter
239
1,465
—
338
2,042
First quarter
89
1,355
27
260
1,731
Total
$
488
$
8,137
$
138
$
1,288
$
10,051
Figure 13 shows loans that are either administered or serviced by us, but not recorded on the balance sheet; this includes loans that were sold.
Figure 13. Loans Administered or Serviced
Dollars in millions
March 31, 2026
December 31, 2025
September 30, 2025
June 30, 2025
March 31, 2025
Commercial real estate loans
$
580,860
$
566,567
$
569,430
$
576,703
$
572,449
Residential mortgage
11,488
11,419
11,440
11,383
11,352
Education loans
143
152
161
170
179
Commercial lease financing
1,639
1,719
1,815
1,815
1,868
Commercial loans
572
576
585
589
596
Consumer direct
242
258
273
290
307
Consumer indirect
53
83
122
174
239
Total
$
594,997
$
580,774
$
583,826
$
591,124
$
586,990
In the event of default by a borrower, we are subject to recourse with respect to approximately $8.2 billion of the $595.0 billion of loans administered or serviced at March 31, 2026. These are primarily associated with commercial real estate loans administered or serviced. Additional information about this recourse arrangement is included in Note 14 (“Contingent Liabilities and Guarantees”) under the heading “Recourse agreement with FNMA.”
We derive income from several sources when retaining the right to administer or service loans that are sold. We earn noninterest income (recorded as “Consumer mortgage income” and “Commercial mortgage servicing fees”) from fees for servicing or administering loans. This fee income is reduced by the amortization of related servicing assets. In addition, we earn interest income from investing funds generated by escrow deposits collected in connection with the servicing loans. Additional information about our mortgage servicing assets is included in Note 8 (“Mortgage Servicing Assets”).
Securities
We manage our securities portfolio according to the following priorities: 1) store of liquidity, 2) interest rate risk management tool, and 3) source of earnings. In keeping with the first priority, the portfolio provides securities to meet our pledging requirements. Our securities portfolio totaled $48.0 billion at March 31, 2026, compared to $48.2 billion at December 31, 2025. Available-for-sale securities were $38.9 billion at March 31, 2026, compared to $39.6 billion at December 31, 2025. Held-to-maturity securities were $9.1 billion at March 31, 2026, and $8.6 billion at December 31, 2025.
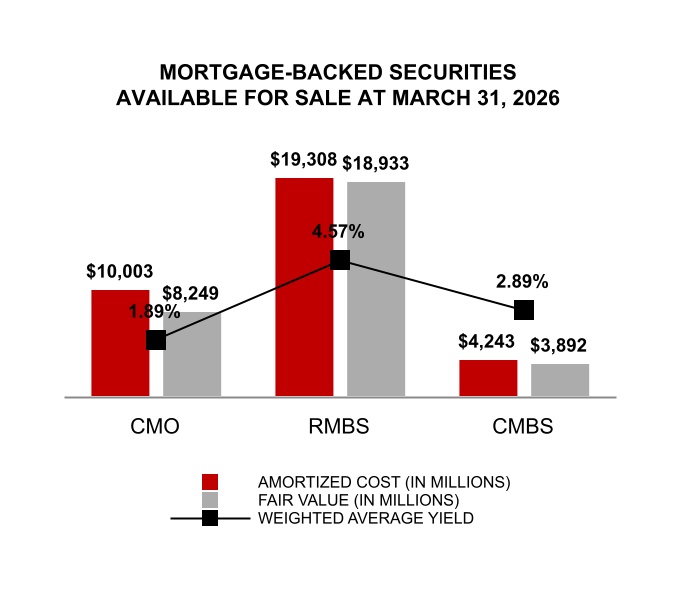
Securities available for sale
The majority of our securities available-for-sale portfolio consists of federal agency mortgage-backed securities and CMOs. CMOs are debt securities secured by a pool of mortgages or mortgage-backed securities.
Figure 14 shows the composition, yields, and remaining maturities of our securities available for sale. For more information about these securities, including gross unrealized gains and losses by type of security and securities pledged, see Note 6 (“Securities”).
(a)Maturity is based upon expected average lives rather than contractual terms.
(b)Excluded from the amortized cost of securities available for sale are basis adjustments for securities designated in active fair value hedges. Basis adjustments totaled $38 million and $99 million as of March 31, 2026 and December 31, 2025, respectively. The securities being hedged are primarily U.S. Treasuries, Agency RMBS, and Agency CMBS.
(c)Weighted-average yields are calculated based on amortized cost. Such yields have been adjusted to a TE basis using the statutory federal income tax rate in effect that calendar year.
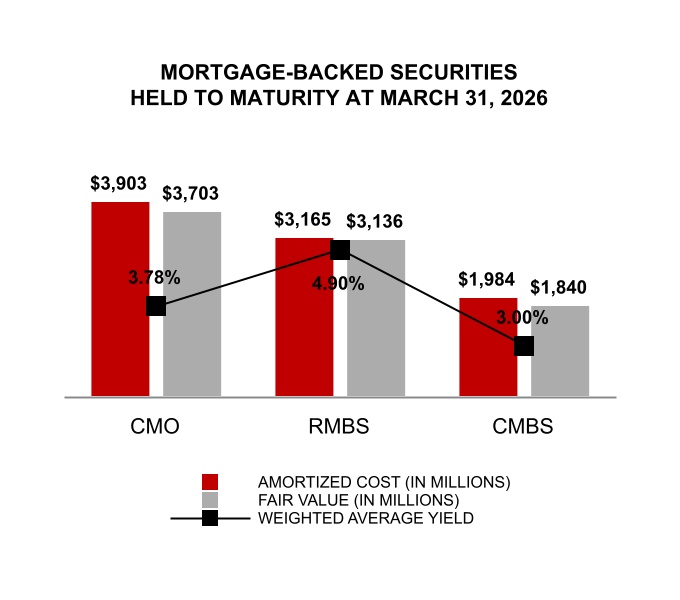
Held-to-maturity securities
The majority of our held-to-maturity portfolio consists of Federal agency CMOs and mortgage-backed securities. This portfolio is also comprised of asset-backed securities and foreign bonds. Figure 15 shows the composition, yields, and remaining maturities of these securities.
(a)Maturity is based upon expected average lives rather than contractual terms.
(b)Weighted-average yields are calculated based on amortized cost. Such yields have been adjusted to a TE basis using the statutory federal income tax rate in effect that calendar year.
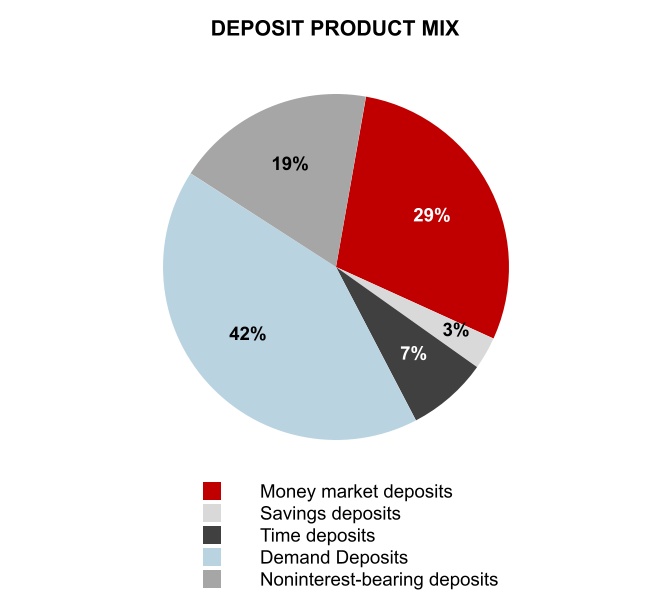
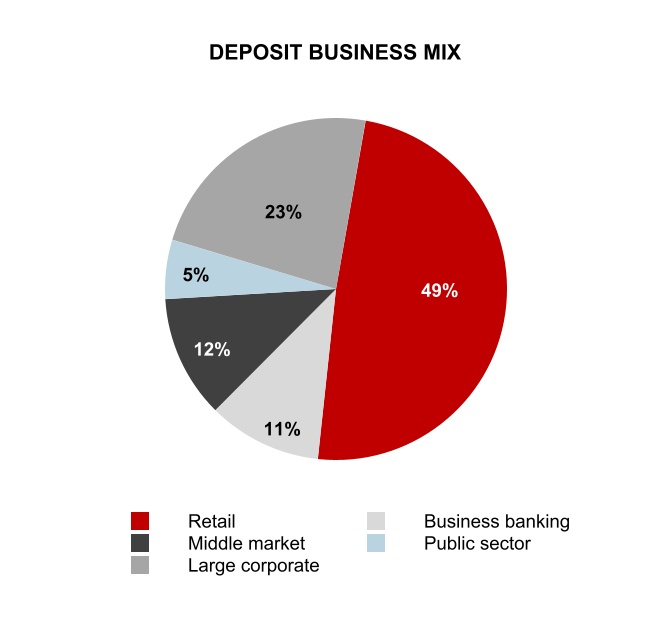
Figure 16. Breakdown of Deposits at March 31, 2026
The following table presents the breakdown of our deposits by product for the noted periods.
Dollars in billions
March 31, 2026
December 31, 2025
Money market deposits
$
42.9
$
42.7
Demand deposits
61.7
61.3
Savings deposits
4.5
4.4
Time deposits
11.2
12.7
Noninterest bearing deposits
27.6
27.6
Total
$
147.8
$
148.7
Our highly diversified deposit base is our primary source of funding. At March 31, 2026, our deposits totaled $147.8 billion, a decrease of $898 million, compared to December 31, 2025.
Uninsured deposits totaled $66.5 billion and $66.2 billion at March 31, 2026 and December 31, 2025, respectively. Uninsured deposits are defined as the portion of deposit accounts in U.S. offices that exceed the FDIC insurance limit or similar state deposit insurance regimes and amounts in any other uninsured investment or deposit accounts that are classified as deposits and not subject to any federal or state deposit insurance regimes.
Figure 17 presents estimated uninsured deposits for the noted periods which reflect amounts disclosed in KeyBank’s Call Report adjusted for intercompany deposits, which are not customer facing and are eliminated in consolidation, and accrued interest.
Figure 17. Estimated Uninsured Deposits
Dollars in billions
March 31, 2026
December 31, 2025
September 30, 2025
June 30, 2025
March 31, 2025
Uninsured deposits(a)
$
66.5
$
66.2
$
66.5
$
61.8
$
65.2
Total deposits
147.8
148.7
150.8
146.9
150.7
Uninsured % of Deposits
45
%
45
%
44
%
42
%
43
%
(a) Intercompany deposits and accrued interest excluded from uninsured deposits
$
12.9
$
12.8
$
13.2
$
12.5
$
12.4
As of March 31, 2026, approximately $12.3 billion of uninsured deposits were collateralized by government-backed securities compared to $12.0 billion as of December 31, 2025.
Wholesale funds, consisting of short-term borrowings and long-term debt, totaled $17.1 billion at March 31, 2026, compared to $11.0 billion at December 31, 2025. The change primarily reflects increases in bank notes and short-
term borrowings, as well as issuances of long-term debt during 2026. Wholesale funding supplements client deposit funding and may rise or fall with seasonal or other funding needs. For more information regarding our wholesale funds, see Part I, Item 2. Management’s Discussion & Analysis of Financial Condition & Results of Operations under the heading “Risk Management - Liquidity risk management” of this report.
Capital
Our capital management objective is to maintain capital levels consistent with our risk appetite and of a sufficient amount to operate and support our clients under a wide range of economic conditions. Our current capital levels position us well to execute against our capital priorities including supporting organic growth, investing in our business, and providing an attractive return to our investors through dividends and share repurchases.
The following sections discuss certain ways we have deployed our capital. For further information, see the Consolidated Statements of Changes in Equity and Note 16 (“Shareholders' Equity”).
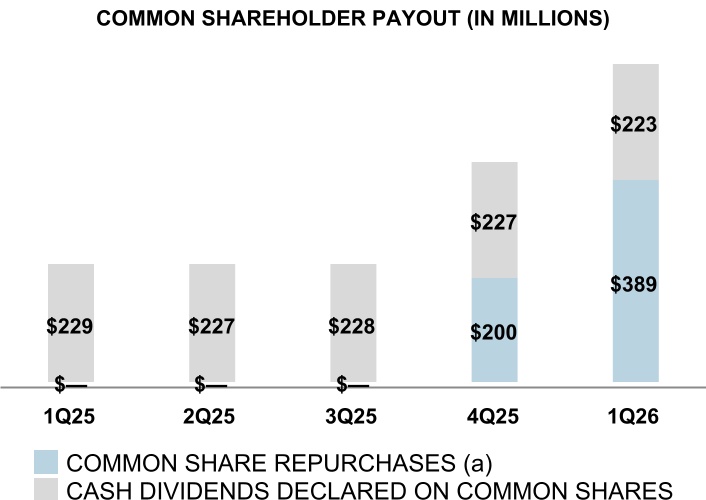
(a) Excludes shares repurchased related to equity compensation programs
Dividends
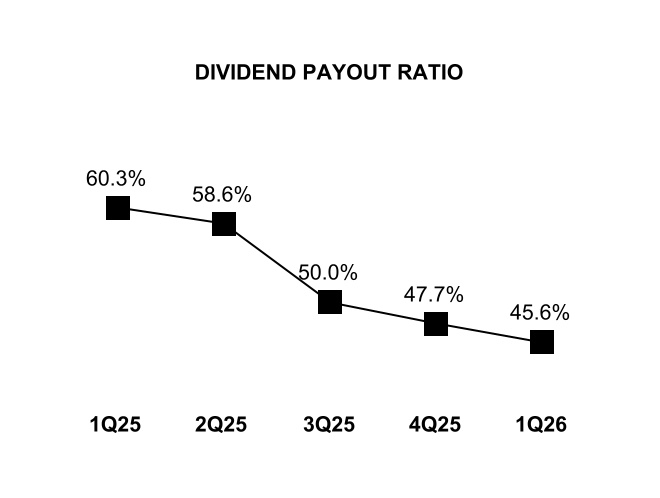
Consistent with our capital plan, we paid a quarterly dividend of $.205 per Common Share for the first quarter of 2026. Further information regarding the capital planning process and CCAR is included under the heading “Capital planning, stress testing, and stress capital buffer” beginning on page 14 in the “Supervision and Regulation” section of our 2025 Form 10-K.
Common shares outstanding
Our Common Shares are traded on the NYSE under the symbol KEY with 25,409 holders of record at March 31, 2026. Our book value per Common Share was $16.13 based on 1.1 billion shares outstanding at March 31, 2026, compared to $16.27 per Common Share based on 1.1 billion shares outstanding at December 31, 2025. At March 31, 2026, our tangible book value per Common Share was $13.60, compared to $13.77 per Common Share at December 31, 2025.
Figure 18 shows activities that caused the change in outstanding Common Shares over the past five quarters.
Figure 18. Changes in Common Shares Outstanding
2026
2025
In thousands
First
Fourth
Third
Second
First
Shares outstanding at beginning of period
1,102,401
1,112,952
1,112,453
1,111,986
1,106,786
Share repurchases
(17,969)
(11,109)
—
—
—
Shares issued under employee compensation plans (net of cancellations and returns)
In March 2025, the Board of Directors authorized a share repurchase program pursuant to which we may purchase up to $1.0 billion of Common Shares. Information on repurchases of Common Shares by KeyCorp is included in Part II, Item 2. “Unregistered Sales of Equity Securities and Use of Proceeds” of this report. During the fourth quarter of 2025, we began repurchasing shares under the share repurchase program authorized by the Board of Directors in March 2025.
As shown in Figure 18 above, Common Shares outstanding decreased by 15 million shares during the first quarter of 2026, primarily attributed to shares repurchased in the open market partially offset by shares issued under employee compensation plans. Open market share repurchases, inclusive of shares repurchased from Scotiabank, totaled approximately $389 million in the first quarter of 2026.
At March 31, 2026, we had 169.4 million treasury shares, compared to 154.3 million treasury shares at December 31, 2025. The increase in treasury shares was primarily attributable to open market share repurchases. Going forward, we expect to reissue treasury shares as needed in connection with stock-based compensation awards and for other corporate purposes.
Capital adequacy
Capital adequacy is an important indicator of financial stability and performance. All of our capital ratios remained in excess of regulatory requirements at March 31, 2026. Our capital and liquidity levels are intended to position us to weather an adverse operating environment while continuing to serve our clients’ needs, as well as to meet the Regulatory Capital Rules described in Item 1. Business of our 2025 Form 10-K under the heading “Supervision and Regulation.” Our shareholders’ equity to assets ratio was 10.6% and 11.1% at March 31, 2026, and December 31, 2025, respectively. Our tangible common equity to tangible assets ratio was 8.0% and 8.4% at March 31, 2026, and December 31, 2025, respectively. See the section entitled “GAAP to Non-GAAP Reconciliations,” which presents the computations of certain financial measures related to “tangible common equity.” The minimum capital and leverage ratios under the Regulatory Capital Rules together with the ratios of KeyCorp at March 31, 2026, are set forth in the “Supervision and regulation — Regulatory capital requirements” section in Part I, Item 2 of this report.
Figure 19 represents the details of our regulatory capital positions at March 31, 2026, and December 31, 2025, under the Regulatory Capital Rules. Information regarding the regulatory capital ratios of KeyCorp’s banking subsidiaries is presented annually, with the most recent information included in Note 21 (“Shareholders' Equity”) beginning on page 169 of our 2025 Form 10-K.
Figure 19. Capital Components and Risk-Weighted Assets
Dollars in millions
March 31, 2026
December 31, 2025
COMMON EQUITY TIER 1
Key shareholders’ equity (GAAP)
$
19,987
$
20,381
Less:
Preferred Stock (a)
2,446
2,446
Common Equity Tier 1 capital before adjustments and deductions
17,541
17,935
Less:
Goodwill, net of deferred taxes
2,552
2,556
Intangible assets, net of deferred taxes
5
7
Deferred tax assets
167
136
Net unrealized gains (losses) on available-for-sale securities, net of deferred taxes
(1,915)
(1,789)
Accumulated gains (losses) on cash flow hedges, net of deferred taxes
(69)
68
Amounts in AOCI attributed to pension and postretirement benefit costs, net of deferred taxes
(237)
(238)
Total Common Equity Tier 1 capital
$
17,038
$
17,195
TIER 1 CAPITAL
Common Equity Tier 1
$
17,038
$
17,195
Additional Tier 1 capital instruments and related surplus
2,446
2,446
Less:
Deductions
—
—
Total Tier 1 capital
$
19,484
$
19,641
TIER 2 CAPITAL
Tier 2 capital instruments and related surplus
$
1,461
$
1,522
Allowance for losses on loans and liability for losses on lending-related commitments (b)
1,752
1,747
Less:
Deductions
—
—
Total Tier 2 capital
3,213
3,269
Total risk-based capital
$
22,697
$
22,910
RISK-WEIGHTED ASSETS (d)
$
149,484
$
145,933
AVERAGE QUARTERLY TOTAL ASSETS
$
186,031
$
187,035
CAPITAL RATIOS (d)
Tier 1 risk-based capital
13.03
%
13.46
%
Total risk-based capital
15.18
%
15.70
%
Leverage (c)
10.47
%
10.50
%
Common Equity Tier 1
11.40
%
11.78
%
(a)Net of capital surplus.
(b)The ALLL included in Tier 2 capital is limited by regulation to 1.25% of the institution’s standardized total risk-weighted assets (excluding its standardized market risk-weighted assets). The ALLL includes $11 million and $11 million of allowance classified as “discontinued assets” on the balance sheet at March 31, 2026, and December 31, 2025, respectively.
(c)This ratio is Tier 1 capital divided by average quarterly total assets as defined by the Federal Reserve less: (i) goodwill, (ii) the disallowed intangible and deferred tax assets, and (iii) other deductions from assets for leverage capital purposes.
(d)March 31, 2026 capital ratios and risk weighted assets are estimates.
Like all financial services companies, we engage in business activities that come with related risks. The most significant risks we face are credit, compliance, operational, liquidity, market, strategic, model, and technology risks. We manage such risks across the entire enterprise to maintain safety and soundness and maximize profitable growth. Certain of these risks are defined and discussed in greater detail in the remainder of this section. Our definition, philosophy, and approach to risk management have not materially changed from the discussion presented under the heading “Risk Management” beginning on page 74 of our 2025 Form 10-K.
Market risk management
Market risk is the risk that movements in market risk factors, including interest rates, foreign exchange rates, equity prices, commodity prices, credit spreads, and volatilities, will reduce Key’s income and the value of its portfolios. These factors influence prospective yields, values, or prices associated with the instrument. We are exposed to market risk both in our trading and nontrading activities, which include asset and liability management activities. Information regarding our fair value policies, procedures, and methodologies is provided in Note 1 (“Summary of Significant Accounting Policies”) under the heading “Fair Value Measurements” on page 111 of our 2025 Form 10-K and Note 5 (“Fair Value Measurements”) in this report.
Trading market risk
Key incurs market risk as a result of trading activities that are used in support of client facilitation and hedging activities, principally within our investment banking and capital markets businesses. Key has exposures to a wide range of risk factors including interest rates, equity prices, foreign exchange rates, credit spreads, and commodity prices, as well as the associated implied volatilities and spreads. Our primary market risk exposures are a result of trading and hedging activities in the derivative and fixed income markets, including securitization exposures. At March 31, 2026, we did not have any re-securitization positions. We maintain modest trading inventories to facilitate customer flow, make markets in securities, and hedge certain risks including but not limited to credit spread risk and interest rate risk. The risks associated with these activities are mitigated in accordance with the Market Risk policies. The majority of our positions are traded in active markets.
Market risk management is an integral part of Key’s risk culture. The Joint KeyCorp and KeyBank National Association Risk Committee (“Board Risk Committee”) provides oversight of trading market risks. The ALCO and the Market Risk Committee regularly review and discuss market risk exposures and results of monitoring activities. Market risk policies and procedures have been defined and take into account our tolerance for risk and consideration for the business environment. The Market Risk Committee approves market risk policies and recommends our significant market risk policy to the ALCO and the Board Risk Committee for approval. For more information regarding monitoring of trading positions and the activities related to Market Risk Rule compliance, see “Market Risk Management” beginning on page 77 of our 2025 Form 10-K.
VaR and stressed VaR. VaR is the estimate of the maximum amount of loss on an instrument or portfolio due to adverse market conditions during a given time interval within a stated confidence level. Stressed VaR is used to assess extreme conditions on market risk within our trading portfolios. MTRM calculates VaR and stressed VaR at various confidence levels daily, and the results are closely monitored. VaR and stressed VaR results are also provided to our regulators and utilized in regulatory capital calculations. For more information regarding our VaR model, its governance, and assumptions, see “Market Risk Management” on page 77 of our 2025 Form 10-K.
MTRM backtests the VaR model on a daily basis to evaluate its predictive power. The test compares VaR model results at the 99% confidence level to daily held profit and loss. Backtesting exceptions occur when daily held profit and loss exceeds VaR. There were two backtesting exceptions for KeyCorp during the past 250 trading days ended March 31, 2026, generally caused by large moves in rates. All KeyCorp backtesting exceptions are thoroughly reviewed in the context of VaR model use and performance.
The aggregate VaR at the 99% confidence level with a one day holding period for all covered positions was less than $1 million at March 31, 2026, and $1.5 million at March 31, 2025. Figure 20 summarizes our VaR at the 99% confidence level with a one day holding period for significant portfolios of covered positions for the three months ended March 31, 2026, and March 31, 2025.
Figure 20. VaR for Significant Portfolios of Covered Positions
2026
2025
Three months ended March 31,
Three months ended March 31,
Dollars in millions
High
Low
Mean
March 31,
High
Low
Mean
March 31,
Trading account assets:
Fixed income
$
1.3
$
0.3
$
.6
$
.3
$
1.6
$
0.5
$
1.2
$
1.3
Derivatives:
Interest rate
$
0.2
$
0.1
$
0.1
$
0.1
$
0.5
$
0.1
$
0.2
$
0.1
Stressed VaR is calculated by running the portfolios through a predetermined stress period which is approved by the Market Risk Committee and is calculated at the 99% confidence level using the same model and assumptions used for general VaR. The aggregate stressed VaR for all covered positions was $1.1 million at March 31, 2026, and $4.5 million at March 31, 2025. Figure 21 summarizes our stressed VaR at the 99% confidence level with a one day holding period for significant portfolios of covered positions for the three months ended March 31, 2026, and March 31, 2025. Changes in VaR are dependent on portfolio composition, inventory levels, and other market factors.
Figure 21. Stressed VaR for Significant Portfolios of Covered Positions
2026
2025
Three months ended March 31,
Three months ended March 31,
Dollars in millions
High
Low
Mean
March 31,
High
Low
Mean
March 31,
Trading account assets:
Fixed income
$
2.2
$
.6
$
1.6
$
.8
$
5.2
$
2.6
$
3.9
$
4.2
Derivatives:
Interest rate
$
0.2
$
0.1
$
0.2
$
0.2
$
0.3
$
0.1
$
0.1
$
0.1
Market risk is a component of our internal capital adequacy assessment. Our risk-weighted assets include a market risk-equivalent asset amount, which consists of a VaR component, stressed VaR component, a de minimis exposure amount, and a specific risk add-on including the securitization positions. The aggregate market value of the securitization positions as defined by the Market Risk Rule was $5 million at March 31, 2026, all of which were mortgage-backed security positions. Specific risk is the price risk of individual financial instruments, which is not accounted for by changes in broad market risk factors and is measured through a standardized approach. Market risk weighted assets, including the specific risk calculations, are run quarterly by MTRM in accordance with the Market Risk Rule, and approved by the Chief Market & Treasury Risk Officer.
Nontrading market risk
Most of our nontrading market risk is derived from interest rate fluctuations and its impacts on our traditional loan and deposit products, as well as investments, hedging relationships, long-term debt, and certain short-term borrowings. Interest rate risk, which is inherent in the banking industry, is measured by the potential for fluctuations in net interest income and the EVE. Such fluctuations may result from changes in interest rates and differences in the repricing and maturity characteristics of interest-earning assets and interest-bearing liabilities. We manage the exposure to changes in net interest income and the EVE in accordance with our risk appetite and in accordance with the Board-approved ERM policy.
Interest rate risk positions are influenced by a number of factors, including the balance sheet positioning that arises out of customer preferences for loan and deposit products, economic conditions, the competitive environment within our markets, changes in market interest rates that affect client activity, and our hedging, investing, funding, and capital positions. The primary components of interest rate risk exposure consist of reprice risk, basis risk, yield curve risk, and option risk.
•“Reprice risk” is the exposure to changes in the level of interest rates and occurs when the volume of interest-bearing liabilities and the volume of interest-earning assets they fund (e.g., deposits used to fund loans) do not mature or reprice at the same time.
•“Yield curve risk” is the exposure to nonparallel changes in the slope of the yield curve (where the yield curve depicts the relationship between the yield on a particular type of security and its term to maturity) and occurs when interest-bearing liabilities and the interest-earning assets that they fund do not price or reprice to the same term point on the yield curve.
•“Option risk” is the exposure to a customer or counterparty’s ability to take advantage of the interest rate environment and terminate or reprice one of our assets, liabilities, or off-balance sheet instruments prior to contractual maturity. Option risk occurs when exposures to customer and counterparty early withdrawals or prepayments are not mitigated with an offsetting position or appropriate compensation.
•“Basis risk” is the exposure to asymmetrical changes in interest rate indexes and occurs when floating-rate assets and floating-rate liabilities reprice at the same time, but in response to different market factors or indexes.
The management of nontrading market risk is centralized within Corporate Treasury. The Risk Committee of our Board provides oversight of nontrading market risk. The ERM Committee, the ALCO, and the Treasury Risk Oversight Committee (“TROC”) review reports on the interest rate risk exposures described above. In addition, the ALCO and the TROC review reports on stress tests and sensitivity analyses related to interest rate risk. These committees have various responsibilities related to managing nontrading market risk, including recommending, approving, and monitoring strategies that maintain risk positions within approved tolerance ranges. The A/LM policy provides the framework for the oversight and management of interest rate risk and is administered by the ALCO. The MTRM, as the second line of defense, provides additional oversight.
Net interest income simulation analysis. The primary tool we use to measure our interest rate risk is simulation analysis. For purposes of this analysis, we estimate our net interest income based on the current and projected composition of our on- and off-balance sheet positions, accounting for recent and anticipated trends in customer activity. The analysis also incorporates assumptions for the current and projected interest rate environments and balance sheet growth projections based on a most likely macroeconomic outlook. The modeling incorporates investment portfolio and swap portfolio balances consistent with management's desired interest rate risk positioning. The simulation model estimates the amount of net interest income at risk by simulating the change in net interest income that would occur if rates were to gradually diverge from market expectations over the next 12 months (subject to a floor on market interest rates at zero).
Figure 22 presents the results of the simulation analysis at March 31, 2026, and March 31, 2025. At March 31, 2026, our simulated exposure to changes in interest rates remained relatively neutral. The exposure to declining rates has changed from (0.39)% as of March 31, 2025 to 0.12% as of March 31, 2026, while the exposure to rising rates has changed from 1.41% as of March 31, 2025 to 0.38% as of March 31, 2026.
We are actively managing the balance sheet to maintain desired IRR positioning in the current environment. Tolerance levels for risk management require the development of remediation plans to maintain residual risk within tolerance if simulation modeling demonstrates that a gradual, parallel 200 basis point Increase or 200 basis point decrease in interest rates over the next 12 months would reduce net interest income over the same period by more than 5.0%, revised mid-2025 from 5.5% to reflect tighter risk management. Current modeled exposure is within Board-approved tolerances.
Figure 22. Simulated Change in Net Interest Income
March 31, 2026
March 31, 2025
Basis point change assumption
-200
+200
-200
+200
Tolerance level
(5.00)
%
(5.00)
%
(5.50)
%
(5.50)
%
Interest rate risk assessment
0.12
%
0.38
%
(0.39)
%
1.41
%
Simulation analyses produce an estimate of interest rate exposure based on assumption inputs within the model. Assumptions are tailored to the specific interest rate environment and validated on a regular basis. However, actual results may differ from those derived in simulation analyses due to unanticipated changes to the balance sheet composition, consumer behavior, product pricing, market interest rates, changes in management’s desired interest rate risk positioning, investment, funding and hedging activities, or repercussions from exogenous events.
Regular sensitivity analyses are performed on the model inputs that could materially change the resulting risk assessments. Assessments are performed using different yield curve shapes, including steepenings or flattenings of the curve, immediate changes in market interest rates, and changes in the relationship of money market interest rates. Assessments are also performed on changes to the following assumptions: loan and deposit balances, the pricing of deposits without contractual maturities, changes in lending spreads, prepayments on loans and securities, investment, funding and hedging activities, and liquidity and capital management strategies.
The results of additional assessments indicate that net interest income could increase or decrease from the base simulation results presented in Figure 22. Net interest income is highly dependent on the timing, magnitude, frequency, and path of interest rate changes and the associated assumptions for deposit repricing relationships, lending spreads, and the balance behavior of transaction accounts. If fixed-rate assets increase by $1 billion, or fixed-rate liabilities decrease by $1 billion, then the potential benefit to declining rates would increase by approximately 21 basis points. A five percentage point increase or decrease in the interest-bearing deposit beta assumption changes the current simulation results by approximately 98 basis points.
The current interest rate risk position could fluctuate to higher or lower levels of risk depending on the competitive environment and client behavior that may affect the actual volume, mix, maturity, and repricing characteristics of loan and deposit flows. Corporate Treasury’s discretionary activities related to funding, investing, and hedging may also change as a result of changes in customer business flows or changes in management’s desired interest rate risk positioning. As changes occur to both the configuration of the balance sheet and the outlook for the economy, management proactively evaluates hedging opportunities that may change the interest rate risk profile.
Simulations are also conducted that measure the effect of changes in market interest rates in the second and third years of a three-year horizon. These simulations are conducted in a similar manner to those based on a 12-month horizon. To capture longer-term exposures, changes in the EVE are calculated as discussed in the following section.
Economic value of equity modeling. EVE complements net interest income simulation analysis as it estimates risk exposure beyond 12-, 24-, and 36-month horizons. EVE modeling measures the extent to which the economic values of assets, liabilities, and off-balance sheet instruments may change in response to fluctuations in interest rates. EVE is calculated by subjecting the balance sheet to an immediate increase or decrease in interest rates, measuring the resulting change in the values of assets, liabilities, and off-balance sheet instruments, and comparing those amounts with the base case of the current interest rate environment. EVE policy limits are measured against a +/-200 basis point scenario subject to a floor on market interest rates at zero. This analysis is highly dependent upon assumptions applied to assets and liabilities with non-contractual maturities. Those assumptions are based on historical behaviors, as well as forward expectations. Remediation plans are similarly developed if the analysis indicates that the EVE will decrease by 15% or more in response to an instantaneous increase or decrease in interest rates. The position is within these guidelines as of March 31, 2026.
Management of interest rate exposure. The results of the various interest rate risk analyses are used to formulate A/LM strategies to achieve the desired risk profile while managing to objectives for capital adequacy and liquidity risk exposures. Specifically, risk positions are managed by purchasing or selling securities, issuing term debt with floating or fixed interest rates, and using derivatives. Interest rate swaps and options are predominantly used, which modify the interest rate characteristics of certain assets and liabilities.
Figure 23 shows all swap positions held for A/LM purposes. These positions are used to convert the contractual interest rate index of agreed-upon amounts of assets and liabilities (i.e., notional amounts) to another interest rate index. For example, fixed-rate debt is converted to a floating rate through a “receive fixed/pay variable” interest rate swap. The volume, maturity, and mix of portfolio swaps change frequently to reflect broader A/LM objectives and the balance sheet positions to be hedged. For more information about how interest rate swaps are used to manage the risk profile, see Note 7 (“Derivatives and Hedging Activities”).
Figure 23. Portfolio Swaps by Interest Rate Risk Management Strategy
March 31, 2026
Weighted-Average
December 31, 2025
Dollars in millions
Notional Amount
Fair Value
Maturity (Years)
Receive Rate
Pay Rate
Notional Amount
Fair Value
Receive fixed/pay variable — conventional loans
$
39,450
$
(78)
1.7
3.4
%
3.6
%
$
37,050
$
66
Receive fixed/pay variable — conventional debt
9,435
(227)
4.4
2.8
3.7
8,722
(198)
Receive fixed/pay variable — forward loans
—
—
—
—
—
2,200
40
Pay fixed/receive variable — conventional debt
50
—
2.3
3.9
3.6
50
—
Pay fixed/receive variable — securities
10,551
(39)
2.1
3.6
4.1
10,194
(100)
Total portfolio swaps
$
59,486
$
(344)
(a)
2.2
3.3
%
3.7
%
$
58,216
$
(192)
(a)
Floors — forward purchased
$
500
$
—
0.1
—
%
—
%
$
3,250
$
—
Floors — forward sold
500
—
0.1
—
—
3,250
—
Total floors
$
1,000
$
—
—
—
%
—
%
$
6,500
$
—
(a)Excludes accrued interest of $197 million at March 31, 2026, and accrued interest of $173 million at December 31, 2025.
Liquidity risk, which is inherent in the banking industry, is measured by our ability to accommodate liability maturities and deposit withdrawals, meet contractual obligations, and fund new business opportunities at a reasonable cost, in a timely manner, and without adverse consequences. Liquidity management involves maintaining sufficient and diverse sources of funding to accommodate planned, as well as unanticipated, changes in cash flows of assets and liabilities under both normal and adverse conditions.
Governance structure
We manage liquidity for all of our affiliates on a consolidated basis. This approach considers the funding sources available to each entity, as well as each entity’s capacity to manage through adverse conditions.
The management of consolidated liquidity risk is centralized within Corporate Treasury. Oversight and governance is provided by the Board, the ALCO, the TROC, and the Chief Risk Officer. The Asset Liability Management Policy provides the framework for the oversight and management of liquidity risk and is administered by the ALCO. The Corporate Treasury Oversight group within the MTRM, as the second line of defense, provides additional oversight. Our current liquidity risk management practices are in compliance with the Federal Reserve Board’s Enhanced Prudential Standards.
These committees mentioned above regularly review liquidity and funding summaries, liquidity trends, peer comparisons, variance analyses, liquidity projections, internal liquidity stress tests, and goal tracking reports. The reviews generate a discussion of positions, trends, and directives on liquidity risk and shape a number of our decisions. When liquidity pressure is elevated, positions are monitored more closely and reporting is more frequent. To ensure that emerging issues are identified, we monitor an extensive set of systemic and idiosyncratic early warning indicators daily.
Factors affecting liquidity
Our liquidity could be adversely affected by both direct and indirect events. An example of a direct event would be a downgrade in our credit ratings by a rating agency. Examples of indirect events (events unrelated to us) that could impair our access to liquidity would be an act of terrorism or war, natural disasters, global pandemics, disruptive political events, or the default or bankruptcy of a major corporation, mutual fund, or hedge fund. Similarly, market speculation, or rumors about us or the banking industry in general, may adversely affect the cost and availability of normal funding sources. For a discussion of certain risks which may impact our liquidity, see Part I, Item 1A. "Risk Factors" on pages 25-43 of our 2025 Form 10-K. For more information on recent liquidity activity, see the header "Our liquidity position and recent activity" in this report below.
Our credit ratings and rating agency outlooks at March 31, 2026, are shown in Figure 24. While we believe these credit ratings, under normal conditions in the capital markets, will enable KeyCorp or KeyBank to issue fixed income securities to investors, downgrades in our credit ratings could increase our cost of funds, trigger additional collateral or funding requirements, and decrease the number of investors and counterparties willing to lend to us.
Figure 24. Credit Ratings
March 31, 2026
Outlook
Short-Term Borrowings
Long-Term Deposits (a)
Senior Long-Term Debt
Subordinated Long-Term Debt
Capital Securities
Preferred Stock
KEYCORP
Standard & Poor’s
Stable
A-2
N/A
BBB
BBB-
BB
BB
Moody’s
Positive
P-2
N/A
Baa2
Baa2
Baa3
Ba1
Fitch Ratings, Inc.
Stable
F1
N/A
A-
N/A
BB+
BB+
DBRS, Inc.
Stable
R-1 (low)
N/A
A (low)
BBB (high)
BBB (high)
BBB (low)
KEYBANK
Standard & Poor’s
Stable
A-2
N/A
BBB+
BBB
N/A
N/A
Moody’s
Positive
P-2
P-1/A2
Baa1
Baa2
N/A
N/A
Fitch Ratings, Inc.
Stable
F1
F1/A
A-
BBB+
N/A
N/A
DBRS, Inc.
Stable
R-1 (low)
A
A
A (low)
N/A
N/A
(a)P-1 rating assigned by Moody’s is specific to KeyBank’s short-term bank deposit ratings. F1 assigned by Fitch Ratings, Inc. is specific to KeyBank’s short-term deposit ratings.
Most of our liquidity risk is derived from our business model, which involves taking in deposits, many of which can be withdrawn at any time, and lending them out in the form of illiquid loan assets. The assessments of liquidity risk are measured under the assumption of normal operating conditions as well as under stressed environments. We manage these exposures in accordance with our risk appetite, and within Board-approved policy limits.
We regularly monitor our liquidity position and funding sources and measure our capacity to obtain funds in a variety of hypothetical scenarios in an effort to maintain an appropriate mix of available and affordable funding. In the normal course of business, we perform a monthly internal liquidity stress test at the consolidated KeyCorp level. From time to time, we may conduct internal liquidity stress tests more frequently, and use assumptions to reflect the changed market environment. Our testing incorporates estimates for loan and deposit lives based on our historical studies. Internal liquidity stress tests analyze potential liquidity scenarios under various funding constraints and time periods. Ultimately, they determine the periodic effects that major direct and indirect events would have on our access to funding markets and our ability to fund our normal operations. To compensate for the effect of these assumed liquidity pressures, we consider alternative sources of liquidity and maturities over different time periods to project how funding needs would be managed.
Our primary source of funding for KeyBank are customer deposits resulting in a consolidated loan-to-deposit ratio of75% as of March 31, 2026. If the cash flows needed to support operating and investing activities are not satisfied by deposit balances, we rely on wholesale funding or on-balance sheet liquid reserves. Additionally, excess cash generated by operating, investing, and deposit-gathering activities may be used to repay outstanding debt or invest in liquid assets.
We maintain a Contingency Funding Plan that outlines the process for addressing a liquidity crisis. As part of the plan, we maintain on-balance sheet liquid reserves referred to as our liquid asset portfolio, which consists of high quality liquid assets. During a stress period, that reserve could be used as a source of funding to provide time to develop and execute a longer-term strategy. Figure 25 shows our available contingent liquidity at March 31, 2026, and December 31, 2025. As of March 31, 2026, our secured term borrowings were $6.1 billion, an increase compared to the fourth quarter of 2025 to fund seasonal deposit outflows and strong loan growth during the quarter.
Figure 25. Available Contingent Liquidity
Dollars in billions
March 31, 2026
December 31, 2025
Available contingent liquidity:
Unpledged securities
$
29.5
$
29.4
Net balances of federal funds sold and balances in our Federal Reserve account
11.6
9.3
Unused secured borrowing capacity at the Federal Reserve Bank of Cleveland
41.9
39.5
Unused secured borrowing capacity at the FHLB
13.1
18.9
Total
$
96.1
$
97.0
Liquidity programs
We have several liquidity programs, which are described in “Liquidity Risk Management” beginning on page 82 of our 2025 Form 10-K, that are designed to enable KeyCorp and KeyBank to raise funds in the public and private debt markets. The proceeds from most of these programs can be used for general corporate purposes, including acquisitions. These liquidity programs are reviewed from time to time by the Board and are renewed and replaced, as necessary. There are no restrictive financial covenants in any of these programs.
Liquidity for KeyCorp
The primary sources of liquidity for KeyCorp are dividends from KeyBank and the proceeds from the issuance of debt and capital securities. KeyCorp has sufficient liquidity when it can service its debt; support customary corporate operations and activities (including acquisitions); support occasional guarantees of subsidiaries’ obligations in transactions with third parties at a reasonable cost, in a timely manner, and without adverse consequences; and fund capital distributions in the form of dividends and share buybacks.
We use a parent cash coverage months metric as the primary measure to assess parent company liquidity. The parent cash coverage months metric measures the number of months into the future where projected obligations can be met with the current quantity of liquidity. We generally issue term debt to supplement dividends from
KeyBank to manage our liquidity position at or above our targeted levels. The parent company generally maintains cash and short-term investments in an amount sufficient to meet projected debt maturities and dividends for the next 24 months. At March 31, 2026, KeyCorp held $5.4 billion in cash and short-term investments, which we projected to be sufficient to meet our projected obligations, including the repayment of our maturing debt obligations for the periods prescribed by our risk tolerance.
Typically, KeyCorp meets its liquidity requirements through regular dividends from KeyBank, supplemented with the proceeds from term debt issuances. Federal banking law limits the amount of capital distributions that a bank can make to its holding company without prior regulatory approval. A national bank’s dividend-paying capacity is affected by several factors, including net profits (as defined by statute) for the two previous calendar years and for the current year, up to the date of dividend declaration. During the first quarter of 2026, KeyBank paid $570 million in cash dividends to KeyCorp. As of March 31, 2026, KeyBank had regulatory capacity to pay $795 million in dividends to KeyCorp without prior regulatory approval.
On January 28, 2026, KeyCorp issued notes under the MTN program. KeyCorp issued $750 million of 5.305% Fixed-to-Floating Rate Senior Notes due January 28, 2037. Accordingly, at March 31, 2026, there was $12.5 billion available for issuance under the Medium-Term Note Program.
There were no bank note issuances during the first quarter. At March 31, 2026, there is $20.0 billion available for issuance under the KeyBank Bank Note Program.
Our liquidity position and recent activity
Our liquid asset portfolio, which includes overnight and short-term investments, as well as unencumbered, high quality liquid securities held as protection against a range of potential liquidity stress scenarios, continues to exceed the amount that we estimate would be necessary to manage through an adverse liquidity event by providing sufficient time to develop and execute a longer-term solution.
From time to time, KeyCorp or KeyBank may seek to retire, repurchase, or exchange outstanding debt, capital securities, preferred shares, or common shares through cash purchase, privately negotiated transactions or other means. Additional information on repurchases of Common Shares by KeyCorp is included in Part II, Item 5. Market for the Registrant’s Common Equity, Related Stockholder Matters and Issuer Purchases of Equity Securities beginning on page 48 of our 2025 Form 10-K and Part II, Item 2 of this report. Such transactions depend on prevailing market conditions, our liquidity and capital requirements, contractual restrictions, regulatory requirements, and other factors. The amounts involved may be material, individually or collectively.
The Consolidated Statements of Cash Flows summarize our sources and uses of cash by type of activity for the three-month periods ended March 31, 2026, and March 31, 2025.
For more information regarding liquidity governance structure, management of liquidity risk at KeyBank and KeyCorp, long-term liquidity strategies, and other liquidity programs, see “Liquidity Risk Management” beginning on page 82 of our 2025 Form 10-K as well as the disclosure included in Part II, Item 1A. “Risk Factors” of this report.
Credit risk management
Credit risk is the risk of loss arising from an obligor’s inability or failure to meet contractual payment or performance terms. Like other financial services institutions, we make loans, extend credit, distribute credit risk, purchase securities, provide financial and payments products, and enter into financial derivative contracts, all of which have related credit risk.
Credit policy, approval, and evaluation
We manage credit risk exposure through a multifaceted program. The Credit Risk Committee recommends Significant Level 1 credit policies to the Board Risk Committee for approval. These policies are communicated throughout the organization to foster a consistent approach to granting credit.
Our credit risk management team and certain individuals within our lines of business, to whom credit risk management has delegated limited credit authority, are responsible for credit approval. Individuals with assigned credit authority are authorized to grant exceptions to credit policies. It is not unusual to make exceptions to
established policies when mitigating circumstances dictate, however, a corporate level tolerance has been established to keep exceptions at an acceptable level based upon portfolio and economic considerations.
Our credit risk management team uses risk models to evaluate consumer loans. These models, known as scorecards, forecast the probability of serious delinquency and default for an applicant. The scorecards are embedded in the application processing system, which allows for real-time scoring and automated decisions for many of our products. We periodically validate the loan scoring processes.
We maintain an active concentration management program to mitigate concentration risk in our credit portfolios. For individual obligors, we employ a sliding scale of exposure, known as hold limits, which is dictated by the type of loan and strength of the borrower.
Allowance for loan and lease losses
We estimate the appropriate level of the ALLL on at least a quarterly basis. The methodology used is described in Note 1 (“Summary of Significant Accounting Policies”) under the heading “Allowance for Loan and Lease Losses” beginning on page 109 of our 2025 Form 10-K. Briefly, the ALLL estimate uses various models and estimation techniques based on our historical loss experience, current borrower characteristics, current economic conditions, reasonable and supportable forecasts, and other relevant factors. The ALLL at March 31, 2026, represents our best estimate of the lifetime expected credit losses inherent in the loan portfolio at that date.
As shown in Figure 26, our ALLL from continuing operations increased by $22 million, or 1.5%, from December 31, 2025. The increase in the ALLL from continuing operations primarily reflects the addition of qualitative reserves to account for elevated economic uncertainty driven by geopolitical tensions and potential downside risks from energy price volatility. These increases were partially offset by continued improvement in the commercial portfolio mix. The commercial ALLL increased by $19 million, or 1.8%, from December 31, 2025, through March 31, 2026. Our consumer ALLL increased $3 million, or 0.9%, from December 31, 2025, through March 31, 2026. Refer to Note 4 (“Asset Quality”) within this report for further discussion of changes in the ALLL.
Figure 26. Allocation of the Allowance for Loan and Lease Losses
March 31, 2026
December 31, 2025
Dollars in millions
Amount
Percent of
Allowance to
Total Allowance
Percent of
Loan Type to
Total Loans
Amount
Percent of
Allowance to
Total Allowance
Percent of
Loan Type to
Total Loans
Commercial and industrial
$
767
52.9
%
55.5
%
$
745
50.6
%
54.1
%
Commercial real estate:
Commercial mortgage
253
17.5
12.9
252
19.2
12.9
Construction
51
3.5
2.6
55
3.5
2.7
Total commercial real estate loans
304
21.0
15.5
307
22.7
15.6
Commercial lease financing
26
1.8
2.0
26
1.7
2.1
Total commercial loans
1,097
75.7
73.0
1,078
75.0
71.8
Real estate — residential mortgage
69
4.8
16.9
66
4.7
17.6
Home equity loans
51
3.5
5.1
52
4.7
5.3
Other consumer loans
148
10.2
4.1
149
9.9
4.4
Credit cards
84
5.8
0.9
82
5.7
0.9
Total consumer loans
352
24.3
27.0
349
25.0
28.2
Total ALLL — continuing operations (a)
$
1,449
100.0
%
100.0
%
$
1,427
100.0
%
100.0
%
(a)Excludes allocations of the ALLL related to the discontinued operations of the education lending business in the amount of $11 million at March 31, 2026, and $11 million at December 31, 2025.
Net loan charge-offs
Figure 27 shows the trend in our net loan charge-offs by loan type, while the composition of loan charge-offs and recoveries by type of loan is presented in Figure 29. Figure 28 shows the ratios of net charge-offs by loan category as a percentage of the respective average loan balance.
Net loan charge-offs for the three months ended March 31, 2026, decreased $9 million compared to the year-ago quarter.
(a)See Figure 10 and the accompanying discussion in the “Loans and loans held for sale” section for more information related to our commercial real estate loan portfolio.
(b)Included in "Accrued expense and other liabilities" on the balance sheet.
Figure 30 shows the composition of our nonperforming assets. As shown in Figure 30, nonperforming assets at March 31, 2026, increased $65 million from December 31, 2025. The increase was driven by two idiosyncratic exposures within the utilities and multifamily real estate sectors. Management does not view this activity as indicative of broader credit deterioration, and these exposures are actively managed and well reserved.
See Note 1 (“Summary of Significant Accounting Policies”) of our 2025 Form 10-K under the headings “Nonperforming Loans,” “Impaired Loans,” and “Allowance for Loan and Lease Losses” for a summary of our nonaccrual and charge-off policies.
Figure 30. Summary of Nonperforming Assets and Past Due Loans from Continuing Operations
Dollars in millions
March 31, 2026
December 31, 2025
September 30, 2025
June 30, 2025
March 31, 2025
Commercial and industrial
$
284
$
256
$
253
$
280
$
288
Commercial real estate:
Commercial mortgage
190
157
214
226
206
Construction
—
—
—
—
—
Total commercial real estate loans(a)
190
157
214
226
206
Commercial lease financing
6
7
—
—
—
Total commercial loans(b)
480
420
467
506
494
Real estate — residential mortgage
115
104
98
95
94
Home equity loans
76
80
82
84
87
Other consumer loans
4
4
4
4
4
Credit cards
7
7
7
7
7
Total consumer loans
202
195
191
190
192
Total nonperforming loans
682
615
658
696
686
OREO
10
9
10
11
14
Nonperforming loans held for sale
—
3
—
—
—
Other nonperforming assets
—
—
—
—
—
Total nonperforming assets
$
692
$
627
$
668
$
707
$
700
Accruing loans past due 90 days or more
$
153
$
99
$
110
$
74
$
86
Accruing loans past due 30 through 89 days
137
220
254
266
281
Nonperforming assets from discontinued operations — education lending business
2
2
2
2
1
Nonperforming loans to period-end portfolio loans
0.62
%
0.58
%
0.62
%
0.65
%
0.65
%
Nonperforming assets to period-end portfolio loans plus OREO and other nonperforming assets
0.63
0.59
0.63
0.66
0.67
(a)See Figure 10 and the accompanying discussion in the “Loans and loans held for sale” section for more information related to our commercial real estate loan portfolio.
(b)See Figure 9 and the accompanying discussion in the “Loans and loans held for sale” section for more information related to our commercial loan portfolio.
Figure 31 shows the activity that caused the change in our nonperforming loan balance during each of the last five quarters.
Figure 31. Summary of Changes in Nonperforming Loans from Continuing Operations
2026
2025
Dollars in millions
First
Fourth
Third
Second
First
Balance at beginning of period
$
615
$
658
$
696
$
686
$
758
Loans placed on nonaccrual status
253
248
210
233
170
Charge-offs
(117)
(124)
(140)
(127)
(126)
Loans sold
(2)
(7)
(13)
—
—
Payments
(37)
(124)
(68)
(74)
(57)
Transfers to OREO
(1)
(1)
(1)
(1)
(2)
Loans returned to accrual status
(29)
(35)
(26)
(21)
(57)
Balance at end of period
$
682
$
615
$
658
$
696
$
686
Operational and compliance risk management
Like all businesses, we are subject to operational risk, which is the risk of loss resulting from human error or malfeasance, inadequate or failed internal processes and systems, and external events. These events include, among other things, threats to our cybersecurity, as we are reliant upon information systems and the internet to conduct our business activities. Operational risk intersects with compliance risk, which is the risk of loss from violations of, or noncompliance with, laws, rules and regulations, prescribed practices, and ethical standards. Under the Dodd-Frank Act, large financial companies like Key are subject to heightened prudential standards and regulation. This heightened level of regulation has increased our operational risk. While operational and compliance risk are separate risk disciplines in KeyCorp’s ERM framework, losses and/or additional regulatory compliance costs
are included in operational loss reporting and could take the form of explicit charges, increased operational costs, or harm to our reputation.
We seek to mitigate operational risk through identification and measurement of risk, alignment of business strategies with risk appetite and tolerance, and a system of internal controls and reporting. We continuously strive to strengthen our system of internal controls to improve the oversight of our operational risk and to ensure compliance with laws, rules, and regulations. For example, an operational event database tracks the amounts and sources of operational risk and losses. This tracking mechanism helps to identify weaknesses and to highlight the need to take corrective action. We also rely upon software programs designed to assist in assessing operational risk and monitoring our control processes. This technology has enhanced the reporting of the effectiveness of our controls to senior management and the Board.
The Operational Risk Management Program provides the framework for the structure, governance, roles, and responsibilities, as well as the content, to manage operational risk for Key. The Compliance Risk Management Program serves the same function in managing compliance risk for Key. The Operational Risk Committee and the Compliance Risk Committee support the ERM Committee by identifying early warning events and trends, escalating emerging risks, and discussing forward-looking assessments. Both the Operational Risk Committee and the Compliance Risk Committee include attendees from each of the Three Lines of Defense. Primary responsibility for managing and monitoring internal control mechanisms lies with the managers of our various lines of business. The Operational Risk Committee and Compliance Risk Committee are senior management committees that oversee our level of operational and compliance risk and direct and support our operational and compliance infrastructure and related activities. These committees and the Operational Risk Management and Compliance Risk Management functions are an integral part of our ERM Program. Our Internal Audit function regularly assesses the overall effectiveness of our Operational Risk Management and Compliance Risk Management Programs and our system of internal controls. Internal Audit reports the results of reviews on internal controls and systems to senior management and the Audit Committee and updates the Risk Committee, as appropriate, on matters related to the oversight of these controls.
Cybersecurity
For information on our cybersecurity risk management and governance practices, please see Item 1C. Cybersecurity beginning on page 44 of our 2025 Form 10-K.
GAAP to Non-GAAP Reconciliations
Non-GAAP financial measures have inherent limitations, are not required to be uniformly applied, and are not
audited. Although these non-GAAP financial measures are frequently used by investors to evaluate a company,
they have limitations as analytical tools, and should not be considered in isolation, nor as a substitute for analyses
of results as reported under GAAP.
The tangible common equity ratio and the return on tangible common equity ratio have been a focus for some investors, and management believes that these ratios may assist investors in analyzing Key’s capital position without regard to the effects of intangible assets and preferred stock. Since analysts and banking regulators may assess our capital adequacy using tangible common equity, we believe it is useful to enable investors to assess our capital adequacy on these same bases.
Pre-provision net revenue from continuing operations (non-GAAP)
$
772
$
764
$
718
$
686
$
642
Net income (loss) attributable to Key common shareholders (GAAP)
$
486
$
475
$
453
$
389
$
369
Average Key shareholders’ equity (GAAP)
$
20,392
$
20,388
$
19,664
$
19,268
$
18,632
Less:
Intangible assets (average)
2,758
2,762
2,767
2,772
2,777
Preferred stock (average)
2,500
2,500
2,500
2,500
2,500
Average tangible common equity (non-GAAP) (A)
$
15,134
$
15,126
$
14,397
$
13,996
$
13,355
Key shareholders’ equity (GAAP)
$
19,987
$
20,381
$
20,102
$
19,484
$
19,003
Less:
Intangible assets
2,757
2,760
2,765
2,770
2,774
Preferred stock (a)
2,446
2,446
2,446
2,446
2,446
Tangible common equity (non-GAAP) (B)
$
14,784
$
15,175
$
14,891
$
14,268
$
13,783
Total assets (GAAP)
$
188,663
$
184,381
$
187,409
$
185,499
$
188,691
Less:
Intangible assets
2,757
2,760
2,765
2,770
2,774
Tangible assets (non-GAAP) (C)
$
185,906
$
181,621
$
184,644
$
182,729
$
185,917
Tangible common equity to tangible assets ratio (non-GAAP) (B/C)
8.0
%
8.4
%
8.1
%
7.8
%
7.4
%
Income (loss) from continuing operations attributable to Key common shareholders (GAAP) (D)
$
486
$
474
$
454
$
387
$
370
Return on average tangible common equity from continuing operations (non-GAAP) (D/A)
13.0
%
12.4
%
12.5
%
11.1
%
11.2
%
(a)Net of capital surplus.
Adjusted noninterest expense and adjusted noninterest income are non-GAAP measures in that they are adjusted to exclude the impact of significant or unusual items. Management believes adjusting for significant or unusual items provide investors with useful information to gain a better understanding of ongoing operations and enhance comparability of results with prior periods, as well as demonstrate the effects of the financial impacts related to those selected items.
Three months ended
Dollars in millions
3/31/2026
12/31/2025
9/30/2025
6/30/2025
3/31/2025
Adjusted noninterest expense
Noninterest expense (GAAP)
$
1,181
$
1,241
$
1,177
$
1,154
$
1,131
Adjustments:
FDIC special assessment (other expense)
—
21
5
—
—
Adjusted noninterest expense (non-GAAP)
$
1,181
$
1,262
$
1,182
$
1,154
$
1,131
Critical Accounting Policies and Estimates
Our business is dynamic and complex. Consequently, we must exercise judgment in choosing and applying accounting policies and methodologies. These choices are critical – not only are they necessary to comply with GAAP, they also reflect our view of the appropriate way to record and report our overall financial performance. All accounting policies are important, and all policies described in Note 1 (“Summary of Significant Accounting Policies”) beginning on page 91 of our 2025 Form 10-K should be reviewed for a greater understanding of how we record and report our financial performance. Note 1 (“Basis of Presentation and Accounting Policies”) of this report should also be reviewed for more information on accounting standards that have been adopted during the period.
In our opinion, some accounting policies are more likely than others to have a critical effect on our financial results and to expose those results to potentially greater volatility. These policies apply to areas of relatively greater business importance, or require us to exercise judgment and to make assumptions and estimates that affect amounts reported in the financial statements. Because these assumptions and estimates are based on current circumstances, they may prove to be inaccurate, or we may find it necessary to change them. We rely heavily on the use of judgment, assumptions, and estimates to make a number of core decisions, including accounting for the ALLL and assets and liabilities that involve valuation methodologies. In addition, we may employ outside valuation experts to assist us in determining fair values of certain assets and liabilities. A brief discussion of each of these areas appears on pages 91 through 95 of our 2025 Form 10-K. During the three months ended March 31, 2026, we did not significantly alter the manner in which we applied our critical accounting policies or developed related assumptions and estimates.
Accounting Guidance Pending Adoption at March 31, 2026
Standard
Required Adoption
Description
Effect on Financial Statements or Other Significant Matters
ASU 2024-03 and ASU 2025-01 Income Statement— Reporting Comprehensive Income—Expense Disaggregation Disclosures (Topic 220-40)
January 1, 2027 Early adoption is permitted.
The guidance requires public companies disclose additional information about certain types of costs and expenses. The guidance could be applied on a prospective or retrospective basis.
The guidance is not expected to have a material impact on Key’s disclosures.
This guidance expands the types of acquired financial assets that must use the gross‑up approach under ASC 326. Certain non‑PCD loans considered “seasoned” are now accounted for using the gross‑up approach at acquisition. All non‑PCD loans acquired in a business combination are considered “seasoned” and other acquired loans are considered “seasoned” if they were purchased at least 90 days after origination and the acquirer did not originate the loans. This guidance must be applied prospectively to loans that are acquired on or after the initial application date.
While we are currently evaluating the impact of this guidance on its financial condition and results of operations, we would also assess for early adoption upon any applicable future activity.
ASU 2025-09 Derivatives and Hedging (Topic 815) Hedge Accounting Improvements
January 1, 2027 Early adoption is permitted.
The accounting update expands cash flow hedge accounting by allowing the grouping of forecasted transactions with similar risk exposures. It introduces a model that allows entities to hedge forecasted interest payments on certain variable rate debt using simplified assumptions. The guidance also broadens hedge accounting for nonfinancial forecasted transactions, permitting eligible components of spot and forward purchases or sales to be designated as hedged risks. The amendments update hedge accounting for net written options to better reflect changes in interest rate markets proceeding the discontinuation of LIBOR. Further, this new guidance improves accounting for dual hedge strategies involving foreign currency debt by eliminating recognition mismatches and better reflecting the economics of combined interest rate and foreign exchange risk management. The guidance should be applied on a prospective basis.
We will early adopt this guidance within the first half of 2026 and do not expect it to have a material impact on our financial condition or results of operations.
ASU 2025-06 - Intangibles—Goodwill and Other— Internal-Use Software (Subtopic 350-40)
January 1, 2028 Early adoption permitted.
The guidance revises the accounting for internal-use software by replacing prescriptive development stage guidance with a principle-based capitalization threshold. Entities are required to begin capitalizing costs when management commits funding and it is probable the software will be completed and used as intended. This guidance may be applied on a prospective, retrospective or modified retrospective basis.
Key is currently evaluating the impact of this guidance on its financial condition and results of operations.
Held-to-maturity securities (fair value: $8,742 and $8,313)
9,116
8,622
Other investments
1,204
949
Loans, net of unearned income of $295 and $303
109,190
106,541
Less: Allowance for loan and lease losses
(1,449)
(1,427)
Net loans
107,741
105,114
Loans held for sale (a)
876
1,077
Premises and equipment
618
628
Goodwill
2,752
2,752
Other intangible assets
5
8
Corporate-owned life insurance
4,439
4,432
Accrued income and other assets
9,100
8,481
Discontinued assets
199
211
Total assets
$
188,663
$
184,381
LIABILITIES
Deposits in domestic offices:
Interest-bearing deposits
$
120,220
$
121,100
Noninterest-bearing deposits
27,595
27,613
Total deposits
147,815
148,713
Federal funds purchased and securities sold under repurchase agreements
34
13
Bank notes and other short-term borrowings
6,149
1,071
Accrued expense and other liabilities
3,801
4,286
Long-term debt
10,877
9,917
Total liabilities
168,676
164,000
EQUITY
Preferred stock
2,500
2,500
Common Shares, $1 par value; authorized 2,100,000,000 shares; issued 1,256,702,081 shares
1,257
1,257
Capital surplus
5,981
6,035
Retained earnings
15,622
15,359
Treasury stock, at cost (169,409,323 and 154,301,387 shares)
(3,152)
(2,810)
Accumulated other comprehensive income (loss)
(2,221)
(1,960)
Total equity
19,987
20,381
Total liabilities and equity
$
188,663
$
184,381
(a)Total loans held for sale include real estate — residential mortgage loans held for sale at fair value of $100 million at March 31, 2026, and $149 million at December 31, 2025.
See Notes to Consolidated Financial Statements (Unaudited).
Notes to Consolidated Financial Statements (Unaudited)
1. Basis of Presentation and Accounting Policies
The consolidated financial statements include the accounts of KeyCorp and its subsidiaries. All significant intercompany accounts and transactions have been eliminated in consolidation.
The consolidated financial statements include any voting rights entities in which we have a controlling financial interest. In accordance with the applicable accounting guidance for consolidations, we consolidate a VIE if we have: (i) a variable interest in the entity; (ii) the power to direct activities of the VIE that most significantly affect the entity’s economic performance; and (iii) the obligation to absorb losses of the entity or the right to receive benefits from the entity that could potentially be significant to the VIE (i.e., we are considered to be the primary beneficiary). Variable interests can include equity interests, subordinated debt, derivative contracts, leases, service agreements, guarantees, standby letters of credit, loan commitments, and other contracts, agreements, and financial instruments. See Note 10 (“Variable Interest Entities”) for information on our involvement with VIEs.
We use the equity method to account for unconsolidated investments in voting rights entities or VIEs if we have significant influence over the entity’s operating and financing decisions (usually defined as a voting or economic interest of 20% to 50%, but not controlling). Unconsolidated investments in voting rights entities or VIEs in which we have a voting or economic interest of less than 20% or for which we do not have significant influence are carried at the cost measurement alternative or at fair value. Investments held by our registered broker-dealer and investment company subsidiaries (principal investing entities and Real Estate Capital line of business) are carried at fair value.
The unaudited consolidated interim financial statements reflect all adjustments of a normal recurring nature and disclosures that are necessary for a fair presentation of the results for the interim periods presented. The results of operations for the interim period are not necessarily indicative of the results of operations to be expected for the full year. The interim financial statements should be read in conjunction with the audited consolidated financial statements and related notes included in our 2025 Form 10-K.
In preparing these financial statements, subsequent events were evaluated through the time the financial statements were issued. Financial statements are considered issued when they are widely distributed to all shareholders and other financial statement users or filed with the SEC.
2. Earnings Per Common Share
Basic earnings per share is the amount of earnings (losses), adjusted for dividends declared on our preferred stock, available to each Common Share outstanding during the reporting periods. Diluted earnings per share is the amount of earnings (losses) available to each Common Share outstanding during the reporting periods adjusted to include the effects of potentially dilutive Common Shares. Potentially dilutive Common Shares include stock options and other stock-based awards. Potentially dilutive Common Shares are excluded from the computation of diluted earnings per share in the periods where the effect would be antidilutive.
Our basic and diluted earnings per Common Share are calculated as follows:
Three months ended March 31,
Dollars in millions, except per share amounts
2026
2025
EARNINGS
Income (loss) from continuing operations
$
522
$
406
Less: Dividends on Preferred Stock
36
36
Income (loss) from continuing operations attributable to Key common shareholders
486
370
Income (loss) from discontinued operations, net of taxes
—
(1)
Net income (loss) attributable to Key common shareholders
$
486
$
369
WEIGHTED-AVERAGE COMMON SHARES
Weighted-average Common Shares outstanding (000)
1,084,277
1,096,654
Effect of Common Share options and other stock awards(a)
10,091
9,486
Weighted-average Common Shares and potential Common Shares outstanding (000)(b)
1,094,368
1,106,140
EARNINGS PER COMMON SHARE
Income (loss) from continuing operations attributable to Key common shareholders
$
.45
$
.34
Income (loss) from discontinued operations, net of taxes
—
—
Net income (loss) attributable to Key common shareholders (c)
.45
.34
Income (loss) from continuing operations attributable to Key common shareholders — assuming dilution
$
.44
$
.33
Income (loss) from discontinued operations, net of taxes — assuming dilution
—
—
Net income (loss) attributable to Key common shareholders—assuming dilution(c)
.44
.33
(a)For periods ended in a loss from continuing operations attributable to Key common shareholders, anti-dilutive instruments have been excluded from the calculation of diluted earnings per share.
(b)Assumes conversion of Common Share options and other stock awards and/or convertible preferred stock, as applicable.
(c)EPS may not foot due to rounding.
3. Loan Portfolio
Loan Portfolio by Portfolio Segment and Class of Financing Receivable(a)
Dollars in millions
March 31, 2026
December 31, 2025
Commercial and industrial (b)
$
60,651
$
57,688
Commercial real estate:
Commercial mortgage
14,144
13,707
Construction
2,801
2,844
Total commercial real estate loans
16,945
16,551
Commercial lease financing
2,200
2,270
Total commercial loans
79,796
76,509
Real estate — residential mortgage
18,483
18,732
Home equity loans
5,528
5,703
Total residential loans
24,011
24,435
Other consumer loans
4,477
4,644
Credit cards
906
953
Total consumer loans
29,394
30,032
Total loans (c)
$
109,190
$
106,541
(a)Accrued interest of $443 million and $459 million at March 31, 2026, and December 31, 2025, respectively, presented in "Accrued income and other assets" on the Consolidated Balance Sheets is excluded from the amortized cost basis disclosed in this table.
(b)Loan balances include $207 million and $205 million of commercial credit card balances at March 31, 2026, and December 31, 2025, respectively.
(c)Total loans exclude loans of $194 million at March 31, 2026, and $205 million at December 31, 2025, related to the discontinued operations of the education lending business. These amounts are included within “Discontinued assets” on the Consolidated Balance Sheet.
We have access to secured borrowings from the Federal Reserve and advances from the FHLB. As of March 31, 2026 and December 31, 2025, loans and leases totaling $73.9 billion and $71.0 billion, respectively, were pledged to the FRB and FHLB for access to these contingent funding sources.
4. Asset Quality
ALLL
We estimate the appropriate level of the ALLL on at least a quarterly basis. The methodology is described in Note 1 ("Summary of Significant Accounting Policies") under the heading "Allowance for Loan and Lease Losses" beginning on page 109 of our 2025 Form 10-K.
The ALLL at March 31, 2026, represents our current estimate of lifetime credit losses inherent in the loan portfolio at that date. The changes in the ALLL by loan category for the periods indicated are as follows:
(a)Excludes a credit related to reserves on lending-related commitments of $17 million.
Three months ended March 31, 2025:
Dollars in millions
December 31, 2024
Provision
Charge-offs
Recoveries
March 31, 2025
Commercial and Industrial
$
639
$
82
$
(62)
$
10
$
669
Commercial real estate:
Real estate — commercial mortgage
320
13
(36)
—
297
Real estate — construction
51
6
—
—
57
Total commercial real estate loans
371
19
(36)
—
354
Commercial lease financing
27
7
—
—
34
Total commercial loans
1,037
108
(98)
10
1,057
Real estate — residential mortgage
90
(19)
(1)
1
71
Home equity loans
70
5
(1)
1
75
Other consumer loans
136
19
(14)
2
143
Credit cards
76
17
(12)
2
83
Total consumer loans
372
22
(28)
6
372
Total ALLL — continuing operations
1,409
130
(a)
(126)
16
1,429
Discontinued operations
13
1
(1)
—
13
Total ALLL — including discontinued operations
$
1,422
$
131
$
(127)
$
16
$
1,442
(a)Excludes a credit related to reserves on lending-related commitments of $12 million.
As described in Note 1 ("Summary of Significant Accounting Policies"), under the heading “Allowance for Loan and Lease Losses” beginning on page 109 of our 2025 Form 10-K, we estimate the ALLL using relevant available information, from internal and external sources, relating to past events, current economic and portfolio conditions, and reasonable and supportable forecasts. In our estimation of expected credit losses, we use a two year reasonable and supportable period across all products. Following this two year period in which supportable forecasts can be generated, for all modeled loan portfolios, we revert expected credit losses to a level that is consistent with our historical information by reverting the macroeconomic variables (model inputs) to their long run average. We revert to historical loss rates for less complex estimation methods for smaller portfolios. A 20-year fixed length look back period is used to calculate the long run average of the macroeconomic variables. A four quarter reversion period is used where the macroeconomic variables linearly revert to their long run average following the two year reasonable and supportable period.
We develop our reasonable and supportable forecasts using relevant data including, but not limited to, changes in economic output, unemployment rates, property values, and other factors associated with the credit losses on financial assets. Some macroeconomic variables apply to all portfolio segments, while others are more portfolio specific. The following table discloses key macroeconomic variables for each loan portfolio.
BBB corporate bond rate (spread), fixed investment, business bankruptcies, GDP, industrial production, unemployment rate, and Producer Price Index
Commercial real estate
Property & real estate price indices, unemployment rate, business bankruptcies, GDP, and SOFR
Commercial lease financing
BBB corporate bond rate (spread), GDP, and unemployment rate
Consumer
Real estate — residential mortgage
GDP, home price index, unemployment rate, 30 year mortgage rate and U.S. household income
Home equity
Home price index, unemployment rate, and 30 year mortgage rate
Other consumer
Unemployment rate, prime rate and U.S. household income
Credit cards
Unemployment rate and U.S. household income
Discontinued operations
Unemployment rate
(a)Variables include all transformations and interactions with other risk drivers. Additionally, variables may have varying impacts at different points in the economic cycle.
In addition to macroeconomic drivers, portfolio attributes such as remaining term, outstanding balance, risk ratings, utilization, FICO, LTV, and delinquency also drive ALLL changes. Our ALLL models were designed to capture the correlation between economic and portfolio changes. As such, evaluating shifts in individual portfolio attributes and macroeconomic variables in isolation may not be indicative of past or future performance.
Economic Outlook
As of March 31, 2026, the economy continues to be resilient, but growth is weakening, inflationary pressures continue, and geopolitical uncertainty is elevated due to the ongoing military conflicts, including with Iran.
We utilized the Moody’s February 2026 Consensus forecast as the baseline forecast to estimate our expected credit losses as of March 31, 2026. This baseline scenario reflects slowing growth over the next two years, but no recession. U.S. GDP is expected to slow to an annual growth rate of 2.0% by mid-2026 and remain at that level for 2027. The expected National Unemployment Rate is forecasted at 4.5% over 2026. The U.S. Consumer Price Index is forecasted to remain close to 3% through 2026.
Evolving market conditions may not be fully captured in the baseline forecast as of quarter-end. The geopolitical environment remains both uncertain and complex, which poses potential downside-risks to the economic outlook over the next two years, although to what extent remains highly uncertain. These economic uncertainties were addressed through a qualitative reserve increase, which leveraged downside economic assumptions.
As a result of the current economic uncertainty, our future loss estimates may vary considerably from our March 31, 2026 assumptions.
Commercial Loan Portfolio
The ALLL from continuing operations for the commercial segment increased $19 million, or 1.8%, from December 31, 2025. The increasing reserve levels are reflective of the elevated economic uncertainty due to geopolitical tensions and the potential downsides from energy price volatility. These reserve increases are partially offset by continued improvement in the commercial portfolio mix.
Consumer Loan Portfolio
The ALLL from continuing operations for the consumer segment increased by $3 million, or 0.9%,from December 31, 2025. The stable reserve levels are reflective of economic uncertainty impacts, offset by loan runoff and continued strong credit performance, particularly for the residential mortgage loan book which represents the largest segment of the consumer portfolio.
The prevalent risk characteristic for both commercial and consumer loans is the risk of loss arising from an obligor’s inability or failure to meet contractual payment or performance terms. Evaluation of this risk is stratified and monitored by the loan risk rating grades assigned for the commercial loan portfolios and the refreshed FICO score assigned for the consumer loan portfolios. The internal risk grades assigned to loans follow our definitions of Pass and Criticized, which are consistent with published definitions of regulatory risk classifications. Loans with a pass rating represent those loans not classified on our rating scale for credits, as minimal credit risk has been identified. Criticized loans are those loans that either have a potential weakness deserving management's close attention or have a well-defined weakness that may put full collection of contractual cash flows at risk. Borrower FICO scores provide information about the credit quality of our consumer loan portfolio as they provide an indication as to the likelihood that a debtor will repay its debts. The scores are obtained from a nationally recognized consumer rating agency and are presented in the tables below at the dates indicated.
Most extensions of credit are subject to loan grading or scoring. Loan grades are assigned at the time of origination, verified by credit risk management, and periodically re-evaluated thereafter. This risk rating methodology blends our judgment with quantitative modeling. Commercial loans generally are assigned two internal risk ratings. The first rating reflects the probability that the borrower will default on an obligation; the second rating reflects expected recovery rates on the credit facility. Default probability is determined based on, among other factors, the financial strength of the borrower, an assessment of the borrower’s management, the borrower’s competitive position within its industry sector, and our view of industry risk in the context of the general economic outlook. Types of exposure, transaction structure, and collateral, including credit risk mitigants, affect the expected recovery assessment.
Credit Risk Profile by Creditworthiness Category and Vintage (a)(b)
As of March 31, 2026
Term Loans
Revolving Loans Amortized Cost Basis
Revolving Loans Converted to Term Loans Amortized Cost Basis
Amortized Cost Basis by Origination Year and Internal Risk Rating
Dollars in millions
2026
2025
2024
2023
2022
Prior
Total
Commercial and Industrial
Risk Rating:
Pass
$
3,017
$
9,648
$
5,707
$
2,203
$
4,832
$
5,959
$
25,593
$
193
$
57,152
Criticized (Accruing)
2
181
188
193
455
719
1,467
10
3,215
Criticized (Nonaccruing)
—
1
7
12
36
51
175
2
284
Total commercial and industrial
3,019
9,830
5,902
2,408
5,323
6,729
27,235
205
60,651
Current year gross write-offs
—
—
—
4
12
6
68
—
90
Real estate — commercial mortgage
Risk Rating:
Pass
640
3,282
813
578
1,762
4,262
1,501
29
12,867
Criticized (Accruing)
—
47
105
73
373
467
14
8
1,087
Criticized (Nonaccruing)
—
—
16
7
93
70
4
—
190
Total real estate — commercial mortgage
640
3,329
934
658
2,228
4,799
1,519
37
14,144
Current year gross write-offs
—
—
—
—
1
—
—
—
1
Real estate — construction
Risk Rating:
Pass
5
612
641
633
239
152
268
—
2,550
Criticized (Accruing)
—
7
—
75
41
125
—
3
251
Criticized (Nonaccruing)
—
—
—
—
—
—
—
—
—
Total real estate — construction
5
619
641
708
280
277
268
3
2,801
Current year gross write-offs
—
—
—
—
—
—
—
—
—
Commercial lease financing
Risk Rating:
Pass
87
309
221
269
393
807
—
—
2,086
Criticized (Accruing)
—
3
4
23
52
26
—
—
108
Criticized (Nonaccruing)
—
—
—
5
1
—
—
—
6
Total commercial lease financing
87
312
225
297
446
833
—
2,200
Current year gross write-offs
—
—
—
—
—
—
—
—
—
Total commercial loans
$
3,751
$
14,090
$
7,702
$
4,071
$
8,277
$
12,638
$
29,022
$
245
$
79,796
Total commercial loan current period gross write-offs
$
—
$
—
$
—
$
4
$
13
$
6
$
68
$
—
$
91
As of December 31, 2025
Term Loans
Revolving Loans Amortized Cost Basis
Revolving Loans Converted to Term Loans Amortized Cost Basis
Amortized Cost Basis by Origination Year and Internal Risk Rating
Dollars in millions
2025
2024
2023
2022
2021
Prior
Total
Commercial and Industrial
Risk Rating:
Pass
$
9,473
$
5,864
$
2,263
$
5,313
$
2,648
$
4,115
$
24,267
$
174
$
54,117
Criticized (Accruing)
139
218
171
463
259
493
1,535
37
3,315
Criticized (Nonaccruing)
1
14
18
54
21
33
115
—
256
Total commercial and industrial
9,613
6,096
2,452
5,830
2,928
4,641
25,917
211
57,688
Current year gross write-offs
13
27
22
27
8
28
187
—
312
Real estate — commercial mortgage
Risk Rating:
Pass
3,246
826
651
1,911
1,519
2,997
1,366
29
12,545
Criticized (Accruing)
8
99
60
326
237
246
20
9
1,005
Criticized (Nonaccruing)
—
16
3
95
31
9
3
—
157
Total real estate — commercial mortgage
3,254
941
714
2,332
1,787
3,252
1,389
38
13,707
Current year gross write-offs
19
14
1
18
29
10
3
—
94
Real estate — construction
Risk Rating:
Pass
468
565
771
262
130
72
296
2
2,566
Criticized (Accruing)
—
—
20
95
36
127
—
—
278
Criticized (Nonaccruing)
—
—
—
—
—
—
—
—
—
Total real estate — construction
468
565
791
357
166
199
296
2
2,844
Current year gross write-offs
—
—
—
—
—
—
—
—
—
Commercial lease financing
Risk Rating:
Pass
322
228
293
433
249
609
—
—
2,134
Criticized (Accruing)
5
4
26
55
18
21
—
—
129
Criticized (Nonaccruing)
—
—
5
2
—
—
—
—
7
Total commercial lease financing
327
232
324
490
267
630
—
—
2,270
Current year gross write-offs
—
—
3
1
—
2
—
—
6
Total commercial loans
$
13,662
$
7,834
$
4,281
$
9,009
$
5,148
$
8,722
$
27,602
$
251
$
76,509
Total commercial loan current period gross write-offs
$
32
$
41
$
26
$
46
$
37
$
40
$
190
$
—
$
412
(a)Accrued interest of $322 million and $338 million as of March 31, 2026, and December 31, 2025, respectively, presented in “Accrued income and other assets” on the Consolidated Balance Sheets, was excluded from the amortized cost basis disclosed in these tables.
(b)Gross write-off information is presented on a year-to-date basis for the three months ended March 31, 2026 and the twelve months ended December 31, 2025.
Revolving Loans Converted to Term Loans Amortized Cost Basis
Amortized Cost Basis by Origination Year and FICO Score
Dollars in millions
2025
2024
2023
2022
2021
Prior
Total
Real estate — residential mortgage
FICO Score:
750 and above
$
358
$
224
$
607
$
5,342
$
6,738
$
3,403
$
—
$
—
$
16,672
660 to 749
69
36
86
504
582
420
—
—
1,697
Less than 660
2
11
23
87
73
149
—
—
345
No Score
2
2
2
1
—
9
2
—
18
Total real estate — residential mortgage
431
273
718
5,934
7,393
3,981
2
—
18,732
Current period gross write-offs
—
—
—
—
—
2
—
—
2
Home equity loans
FICO Score:
750 and above
43
26
23
117
676
1,164
1,749
179
3,977
660 to 749
18
13
13
41
149
258
718
58
1,268
Less than 660
2
3
5
15
44
109
253
21
452
No Score
—
—
—
—
—
1
5
—
6
Total home equity loans
63
42
41
173
869
1,532
2,725
258
5,703
Current period gross write-offs
—
—
—
—
—
—
2
—
2
Other consumer loans
FICO Score:
750 and above
175
73
104
986
1,032
595
81
—
3,046
660 to 749
112
48
74
220
218
179
172
—
1,023
Less than 660
17
12
21
54
52
46
54
—
256
No Score
12
8
5
10
13
6
265
—
319
Total consumer direct loans
316
141
204
1,270
1,315
826
572
—
4,644
Current period gross write-offs
4
5
7
9
9
7
15
—
56
Credit cards
FICO Score:
750 and above
—
—
—
—
—
—
479
—
479
660 to 749
—
—
—
—
—
—
364
—
364
Less than 660
—
—
—
—
—
—
108
—
108
No Score
—
—
—
—
—
—
2
—
2
Total credit cards
—
—
—
—
—
—
953
—
953
Current period gross write-offs
—
—
—
—
—
—
45
—
45
Total consumer loans
$
810
$
456
$
963
$
7,377
$
9,577
$
6,339
$
4,252
$
258
$
30,032
Total consumer current period gross write-offs
$
4
$
5
$
7
$
9
$
9
$
9
$
62
$
—
$
105
(a)Accrued interest of $122 million and $121 million as of March 31, 2026, and December 31, 2025, respectively, presented in “Accrued income and other assets” on the Consolidated Balance Sheets, was excluded from the amortized cost basis disclosed in this table.
(b)Gross write-off information is presented on a year-to-date basis for the three months ended March 31, 2026 and the twelve months ended December 31, 2025.
Nonperforming and Past Due Loans
Our policies for determining past due loans, placing loans on nonaccrual, applying payments on nonaccrual loans, and resuming accrual of interest for our commercial and consumer loan portfolios are disclosed in Note 1 (“Summary of Significant Accounting Policies”) under the heading “Nonperforming Loans” beginning on page 108 of our 2025 Form 10-K.
The following aging analysis of past due and current loans as of March 31, 2026, and December 31, 2025, provides further information regarding Key’s credit exposure.
Aging Analysis of Loan Portfolio(a)
As of March 31, 2026
Current (b)(c)
30-59
Days Past
Due (b)
60-89
Days Past
Due (b)
90 and
Greater
Days Past
Due (b)
Non-performing Loans
Total Past
Due and
Non-performing
Loans (b)
Total
Loans (d)
Dollars in millions
LOAN TYPE
Commercial and industrial
$
60,272
$
27
$
28
$
40
$
284
$
379
$
60,651
Commercial real estate:
Commercial mortgage
13,861
2
3
88
190
283
14,144
Construction
2,800
—
—
1
—
1
2,801
Total commercial real estate loans
16,661
2
3
89
190
284
16,945
Commercial lease financing
2,192
1
—
1
6
8
2,200
Total commercial loans
$
79,125
$
30
$
31
$
130
$
480
$
671
$
79,796
Real estate — residential mortgage
$
18,350
$
11
$
7
$
—
$
115
$
133
$
18,483
Home equity loans
5,423
18
6
5
76
105
5,528
Other consumer loans
4,440
16
9
8
4
37
4,477
Credit cards
880
5
4
10
7
26
906
Total consumer loans
$
29,093
$
50
$
26
$
23
$
202
$
301
$
29,394
Total loans
$
108,218
$
80
$
57
$
153
$
682
$
972
$
109,190
(a)Amounts in table represent amortized cost and exclude loans held for sale.
(b)Accrued interest of $443 million presented in “Accrued income and other assets” on the Consolidated Balance Sheets is excluded from the amortized cost basis disclosed in this table.
(c)Includes balances of $54 million in Commercial mortgage and $6 million in Real estate - residential mortgage associated with loans sold to GNMA that are 90 days or more past due where Key has the right but not the obligation to repurchase and whose payments are insured by the Federal Housing Administration or guaranteed by the United States Department of Veteran Affairs.
(d)Net of unearned income, net of deferred fees and costs, and unamortized discounts and premiums.
As of December 31, 2025
Current (b)(c)
30-59
Days Past
Due (b)
60-89
Days Past
Due (b)
90 and
Greater
Days Past
Due (b)
Non-performing
Loans
Total Past
Due and
Non-performing
Loans (b)
Total
Loans (d)
Dollars in millions
LOAN TYPE
Commercial and industrial
$
57,336
$
38
$
17
$
41
$
256
$
352
$
57,688
Commercial real estate:
Commercial mortgage
13,450
47
20
33
157
257
13,707
Construction
2,843
—
—
1
—
1
2,844
Total commercial real estate loans
16,293
47
20
34
157
258
16,551
Commercial lease financing
2,260
3
—
—
7
10
2,270
Total commercial loans
$
75,889
$
88
$
37
$
75
$
420
$
620
$
76,509
Real estate — residential mortgage
$
18,593
$
21
$
14
$
—
$
104
$
139
$
18,732
Home equity loans
5,593
18
7
5
80
110
5,703
Other consumer loans
4,606
15
10
9
4
38
4,644
Credit cards
926
6
4
10
7
27
953
Total consumer loans
$
29,718
$
60
$
35
$
24
$
195
$
314
$
30,032
Total loans
$
105,607
$
148
$
72
$
99
$
615
$
934
$
106,541
(a)Amounts in table represent amortized cost and exclude loans held for sale.
(b)Accrued interest of $459 million presented in “Accrued income and other assets” on the Consolidated Balance Sheets is excluded from the amortized cost basis disclosed in this table.
(c)Includes balances of $66 million in Commercial mortgage and $6 million in Real estate - residential mortgage associated with loans sold to GNMA that are 90 days or more past due where Key has the right but not the obligation to repurchase and whose payments are insured by the Federal Housing Administration or guaranteed by the United States Department of Veteran Affairs.
(d)Net of unearned income, net of deferred fees and costs, and unamortized discounts and premiums.
At March 31, 2026, the carrying amount of our commercial nonperforming loans outstanding represented 72% of their original contractual amount owed, total nonperforming loans outstanding represented 78% of their original contractual amount owed, and nonperforming assets in total were carried at 79% of their original contractual amount owed.
Nonperforming loans reduced expected interest income by $12 million for the three months ended March 31, 2026, respectively, and $13 millionfor the three months ended March 31, 2025, respectively.
The amortized cost basis of nonperforming loans on nonaccrual status for which there is no related allowance for credit losses was $251 million at March 31, 2026 and $386 million at December 31, 2025.
Collateral-dependent Financial Assets
We classify financial assets as collateral-dependent when our borrower is experiencing financial difficulty, and we expect repayment to be provided substantially through the operation or sale of the collateral. Our commercial loans
have collateral that includes cash, accounts receivable, inventory, commercial machinery, commercial properties, commercial real estate construction projects, enterprise value, and stock or ownership interests in the borrowing entity. When appropriate we also consider the enterprise value of the borrower as a repayment source for collateral-dependent loans. Our consumer loans have collateral that includes residential real estate, automobiles, boats, and RVs.
At March 31, 2026 and March 31, 2025, the recorded investment of consumer residential mortgage and home equity loans in the process of foreclosure was $65 million and $68 million, respectively.
There were no significant changes in the extent to which collateral secures our collateral-dependent financial assets during the three months ended March 31, 2026.
Loan Modifications Made to Borrowers Experiencing Financial Difficulty
The ALLL for loans modified for borrowers experiencing financial difficulty is determined based on Key’s ALLL policy as described within Note 1 (“Summary of Significant Accounting Policies”) beginning on page 109 of our 2025 Form 10-K.
Modifications for Borrowers Experiencing Financial Difficulty
Our strategy in working with commercial borrowers is to allow them time to improve their financial position through loan modification. Commercial borrowers that are rated substandard or worse in accordance with the regulatory definition, or that cannot otherwise restructure at market terms and conditions, are considered to be experiencing financial difficulty. A modification of a loan is subject to the normal underwriting standards and processes for other similar credit extensions, both new and existing. The modified loan is evaluated to determine if it is a new loan or a continuation of the prior loan.
Consumer loans in which a borrower requires a modification as a result of negative changes to their financial condition or to avoid default, generally indicate the borrower is experiencing financial difficulty. The primary modifications made to consumer loans are amortization, maturity date and interest rate changes. Consumer borrowers identified as experiencing financial difficulty are generally unable to refinance their loans through our normal origination channel or through other independent sources.
The following tables show the amortized cost basis at the end of the noted reporting periods of the loans modified to borrowers experiencing financial difficulty within the past 12 months of the noted periods. The tables do not include those modifications that only resulted in an insignificant payment delay. The tables do not include consumer loans that are still within a trial modification period. Trial modifications may be done for consumer borrowers where a trial payment plan period is offered in advance of a permanent loan modification. As of March 31, 2026, there were 124 loans totaling $20 million in a trial modification period. As of March 31, 2025, there were 98 loans totaling $15 million in a trial modification period.
Commitments outstanding to lend additional funds to borrowers experiencing financial difficulty whose loans were modified were $98 million and $77 million at March 31, 2026 and March 31, 2025, respectively.
(a)Combination modifications consist primarily of loans modified with both an interest rate reduction and a term extension.
Financial Effects of Modifications to Borrowers Experiencing Financial Difficulty
The following table summarizes the financial impacts of loan modifications made to specific loans for the noted periods. For the three months ended March 31, 2026, the weighted-average interest rate change for commercial and industrial loans was comprised solely of modifications of commercial credit card balances.
Amortized Cost Basis of Modified Loans That Subsequently Defaulted
Key considers modifications to borrowers experiencing financial difficulty that subsequently become 90 days or more past due under modified terms as subsequently defaulted. The following table presents the amortized cost of modified loans to borrowers experiencing financial difficulty that were within 12 months of their modification and subsequently defaulted within the noted periods.
Three months ended March 31, 2026
Dollars in millions
Interest Rate Reduction
Term Extension
Other
Combination
Total
LOAN TYPE
Commercial real estate
Commercial mortgage
$
—
$
39
$
2
$
—
$
41
Total commercial real estate loans
—
39
2
—
41
Total commercial loans
—
39
2
—
41
Home equity loans
—
—
—
1
1
Total consumer loans
$
—
$
—
$
—
$
1
$
1
Total loans
$
—
$
39
$
2
$
1
$
42
Three months ended March 31, 2025
Dollars in millions
Interest Rate Reduction
Term Extension
Other
Combination
Total
LOAN TYPE
Commercial real estate
Commercial mortgage
$
—
$
19
$
—
$
—
$
19
Total commercial real estate loans
—
19
—
—
19
Total commercial loans
—
19
—
—
19
Credit cards
—
—
—
1
1
Total consumer loans
$
—
$
—
$
—
$
1
$
1
Total loans
$
—
$
19
$
—
$
1
$
20
Key closely monitors the performance of loans that are modified for borrowers experiencing financial difficulty to understand the effectiveness of its modification efforts. The following table presents the amortized cost as of March 31, 2026, of loans modified during the 12 months then ended, by aging.
The following table presents the amortized cost as of March 31, 2025, of loans modified during the twelve months then ended, by aging.
As of March 31, 2025
Current
30-89 Days Past Due
90 and Greater Days Past Due
Total
Dollars in millions
LOAN TYPE
Commercial and Industrial
$
207
$
8
$
12
$
227
Commercial real estate
Commercial mortgage
256
50
21
327
Construction
49
—
—
49
Total commercial real estate loans
305
50
21
376
Total commercial loans
$
512
$
58
$
33
$
603
Real estate — residential mortgage
$
14
$
—
$
—
$
14
Home equity loans
10
1
1
12
Other consumer loans
5
—
—
5
Credit cards
4
—
—
4
Total consumer loans
$
33
$
1
$
1
$
35
Total loans
$
545
$
59
$
34
$
638
Liability for Credit Losses on Lending-related Commitments
The liability for credit losses on lending-related commitments is included in “accrued expense and other liabilities” on the balance sheet. This includes credit risk for recourse associated with loans sold under the Fannie Mae Delegated Underwriting and Servicing program and credit losses inherent in unfunded lending-related commitments, such as letters of credit and unfunded loan commitments, and certain financial guarantees.
Changes in the liability for credit losses on lending-related commitments are summarized as follows:
Three months ended March 31,
Dollars in millions
2026
2025
Balance at beginning of period
$
313
$
290
Provision (credit) for losses on lending-related commitments
(17)
(12)
Balance at end of period
$
296
$
278
5. Fair Value Measurements
In accordance with GAAP, Key measures certain assets and liabilities at fair value. Fair value is defined as the price to sell an asset or transfer a liability in an orderly transaction between market participants in the principal market of the asset or liability. Additional information regarding our accounting policies for determining fair value is provided in Note 1 (“Summary of Significant Accounting Policies”) under the heading “Fair Value Measurements” beginning on page 111 of our 2025 Form 10-K and Note 5 (“Fair Value Measurements”) beginning on page 131 of our 2025 Form 10-K.
Assets and Liabilities Measured at Fair Value on a Recurring Basis
Certain assets and liabilities are measured at fair value on a recurring basis in accordance with GAAP. For more information on the valuation techniques used to measure classes of assets and liabilities reported at fair value on a recurring basis as well as the classification of each in the valuation hierarchy, refer to Note 5 (“Fair Value Measurements”) in our 2025 Form 10-K. The following tables present these assets and liabilities at March 31, 2026, and December 31, 2025.
Total liabilities on a recurring basis at fair value
$
673
$
1,302
$
1
$
1,491
$
448
$
1,300
$
—
$
1,474
(a)Certain investments that are measured at fair value using the net asset value per share (or its equivalent) practical expedient have not been classified in the fair value hierarchy. The fair value amounts presented in this table are intended to permit reconciliation of the fair value hierarchy to the amounts presented in the consolidated balance sheet.
(b)Netting adjustments represent the amounts recorded to convert our derivative assets and liabilities from a gross basis to a net basis in accordance with the applicable accounting guidance. The net basis takes into account the impact of bilateral collateral and master netting agreements that allow us to settle all derivative contracts with a single counterparty on a net basis and to offset the net derivative position with the related cash collateral. Total derivative assets and liabilities include these netting adjustments.
The fair value and related unfunded commitments of our indirect principal investments and direct equity investments measured at net asset value as a practical expedient at March 31, 2026, was $8 million and $52 million, respectively.
The change in the fair values of our Level 3 financial instruments measured at fair value on a recurring basis for the three months ended March 31, 2026, and March 31, 2025 was not material.
Assets and Liabilities Measured at Fair Value on a Nonrecurring Basis
Certain assets and liabilities are measured at fair value on a nonrecurring basis in accordance with GAAP. The adjustments to fair value generally result from the application of accounting guidance that requires assets and liabilities to be recorded at the lower of cost or fair value, or assessed for impairment. For more information on the valuation techniques used to measure classes of assets and liabilities measured at fair value on a nonrecurring basis, refer to Note 5 (“Fair Value Measurements”) in our 2025 Form 10-K. There were no liabilities measured at fair value on a nonrecurring basis at March 31, 2026, and December 31, 2025.
The following table presents our assets measured at fair value on a nonrecurring basis at March 31, 2026, and December 31, 2025:
March 31, 2026
December 31, 2025
Dollars in millions
Level 1
Level 2
Level 3
Total
Level 1
Level 2
Level 3
Total
ASSETS MEASURED ON A NONRECURRING BASIS
Collateral-dependent loans
$
—
$
—
$
116
$
116
$
—
$
—
$
56
$
56
Accrued income and other assets
—
—
12
12
—
—
32
32
Total assets on a nonrecurring basis at fair value
$
—
$
—
$
128
$
128
$
—
$
—
$
88
$
88
We have other investments in equity securities that do not have readily determinable fair values and do not qualify for the practical expedient to measure the investment using a net asset value per share. We have elected to measure these securities at cost less impairment plus or minus adjustments due to observable orderly transactions. Impairment is recorded when there is evidence that the expected fair value of the investment has declined to below the recorded cost. At each reporting period, we assess if these investments continue to qualify for this measurement alternative. At March 31, 2026, and December 31, 2025, the carrying amount of equity investments under this method was $475 million and $467 million, respectively. We had no adjustments or impairments for the three months ended March 31, 2026.
Quantitative Information about Level 3 Fair Value Measurements
The range and weighted-average of the significant unobservable inputs used to measure the fair value of our material Level 3 recurring and nonrecurring assets at March 31, 2026, and December 31, 2025, along with the valuation techniques used, are shown in the following table:
Level 3 Asset (Liability)
Valuation
Technique
Significant
Unobservable Input
Range (Weighted-Average) (a), (b)
Dollarsin millions
March 31, 2026
December 31, 2025
March 31, 2026
December 31, 2025
Recurring
Loans, net of unearned income (residential)
$
11
$
11
Market comparable pricing
Comparability factor
71.30 - 95.00% (84.58%)
74.30-99.00% (84.99%)
Derivative instruments:
Interest rate
(2)
(3)
Discounted cash flows
Probability of default
.02 - 100% (4.80%)
.02 - 100% (4.40%)
Loss given default
0 - 1 (.449)
0 - 1 (.485)
Insignificant level 3 assets, net of liabilities(c)
2
4
Nonrecurring
Collateral-dependent loans
116
56
Fair value of collateral
Credit and liquidity discount
0 - 72.00% (22.00%)
0 - 100.00% (40.00%)
Accrued income and other assets: (d)
OREO and other Level 3 assets
10
8
Appraised value
Appraised value
N/M
N/M
(a)The weighted average of significant unobservable inputs is calculated using a weighting relative to fair value.
(b)For significant unobservable inputs with no range, a single figure is reported to denote the single quantitative factor used.
(c)Represents the aggregate amount of Level 3 assets and liabilities measured at fair value on a recurring basis that are individually and in the aggregate insignificant. The amount includes certain equity investments and certain financial derivative assets and liabilities.
(d)Excludes $2 million pertaining to mortgage servicing assets measured on a nonrecurring basis as of March 31, 2026. Refer to Note 8 (“Mortgage Servicing Assets”) for significant unobservable inputs pertaining to these assets.
The levels in the fair value hierarchy ascribed to our financial instruments and the related carrying amounts at March 31, 2026, and December 31, 2025, are shown in the following tables. Assets and liabilities are further arranged by measurement category.
March 31, 2026
Carrying Amount
Fair Value
Dollars in millions
Level 1
Level 2
Level 3
Total
FINANCIAL ASSETS
Cash and short-term investments (a)
$
12,912
$
12,912
$
—
$
—
$
12,912
Held-to-maturity securities (b)
9,116
—
8,742
—
8,742
Other investments (c)
1,113
—
—
1,113
1,113
Loans, net of unearned income (d)
107,730
—
—
104,569
104,569
Loans held for sale (c)
776
—
—
776
776
FINANCIAL LIABILITIES
Time deposits (e)
$
11,155
$
—
$
11,198
$
—
$
11,198
Short-term borrowings (a)
5,284
—
5,284
—
5,284
Long-term debt (e)
10,877
10,025
963
—
10,988
Deposits with no stated maturity (a)
136,660
—
136,660
—
136,660
December 31, 2025
Carrying Amount
Fair Value
Dollars in millions
Level 1
Level 2
Level 3
Total
FINANCIAL ASSETS
Cash and short-term investments (a)
$
11,450
$
11,450
$
—
$
—
$
11,450
Held-to-maturity securities (b)
8,622
—
8,313
—
8,313
Other investments (c)
863
—
—
863
863
Loans, net of unearned income (d)
105,103
—
—
101,946
101,946
Loans held for sale (c)
928
—
—
928
928
FINANCIAL LIABILITIES
Time deposits (e)
$
12,680
$
—
$
12,731
$
—
$
12,731
Short-term borrowings (a)
263
—
263
—
263
Long-term debt (e)
9,917
9,318
$
729
—
10,047
Deposits with no stated maturity (a)
136,033
—
136,033
—
136,033
Valuation Methods and Assumptions
(a)Fair value equals or approximates carrying amount. The fair value of deposits with no stated maturity does not take into consideration the value ascribed to core deposit intangibles.
(b)Fair values of held-to-maturity securities are determined by using models that are based on security-specific details, as well as relevant industry and economic factors. The most significant of these inputs are quoted market prices, interest rate spreads on relevant benchmark securities, and certain prepayment assumptions. We review the valuations derived from the models to ensure that they are reasonable and consistent with the values placed on similar securities traded in the secondary markets.
(c)Information pertaining to our methodology for measuring the fair values of these assets and liabilities is included in the sections entitled “Qualitative Disclosures of Valuation Techniques” and “Assets and Liabilities Measured at Fair Value on a Nonrecurring Basis” within our 2025 Form 10-K Note 5 (“Fair Value Measurements”).
(d)The fair value of loans is based on the present value of the expected cash flows. The projected cash flows are based on the contractual terms of the loans, adjusted for prepayments and use of a discount rate based on the relative risk of the cash flows, taking into account the loan type, maturity of the loan, liquidity risk, servicing costs, and a required return on debt and capital. In addition, an incremental liquidity discount is applied to certain loans, using historical sales of loans during periods of similar economic conditions as a benchmark. The fair value of loans includes lease financing receivables at their aggregate carrying amount, which is equivalent to their fair value.
(e)Fair values of time deposits and long-term debt are based on discounted cash flows utilizing relevant market inputs.
Discontinued assets — education lending business. Our discontinued assets include government-guaranteed and private education loans originated through our education lending business that was discontinued in September 2009. This portfolio consists of loans recorded at carrying value with appropriate valuation reserves. All of these loans were excluded from the table above as follows:
•Loans at carrying value, net of allowance, of $194 million ($146 million at fair value) at March 31, 2026, and $205 million ($155 million at fair value) at December 31, 2025.
These assets are classified as Level 3 because we rely on unobservable inputs when determining fair value since observable market data is not available.
6. Securities
The amortized cost, unrealized gains and losses, and approximate fair value of our securities available for sale and held-to-maturity securities are presented in the following tables. Gross unrealized gains and losses represent the difference between the amortized cost and the fair value of securities on the balance sheet as of the dates indicated. Accordingly, the amount of these gains and losses may change in the future as market conditions change.
(a)Amortized cost amounts exclude accrued interest receivable which is recorded within “other assets” on the balance sheet. At March 31, 2026, accrued interest receivable on available for sale securities and held-to-maturity securities totaled $118 million and $29 million, respectively. At December 31, 2025, accrued interest receivable on available for sale securities and held-to-maturity securities totaled $121 million and $26 million, respectively.
(b)Excluded from the amortized cost of securities available for sale are basis adjustments for securities designated in active fair value hedges. Basis adjustments totaled $38 million and $99 million as of March 31, 2026 and December 31, 2025, respectively. The securities being hedged are primarily U.S. Treasuries, Agency RMBS, and Agency CMBS.
(c)Amortized cost includes $41 million of securities as of March 31, 2026, and $74 million of securities as of December 31, 2025, related to the purchase of senior notes from a securitization collateralized by sold indirect auto loans.
The following table summarizes securities in an unrealized loss position for which an allowance for credit losses has not been recorded as of March 31, 2026, and December 31, 2025.
Based on our evaluation at March 31, 2026, an allowance for credit losses has not been recorded nor have unrealized losses been recognized into income. The issuers of the securities are of high credit quality and have a history of no credit losses, management does not intend to sell, and it is likely that management will not be required to sell the securities prior to their anticipated recovery, and the decline in fair value is largely attributed to changes in interest rates and other market conditions. The security issuers continue to make timely principal and interest payments.
For the three months ended March 31, 2026, we had no material gross realized gains or losses from the sale of securities available for sale. For the three months ended March 31, 2025,we recognized no gross realized gains or losses from the sale of securities available for sale.
At March 31, 2026 and December 31, 2025, securities available for sale and held-to-maturity securities totaling $18.5 billion and $18.7 billion, respectively, were pledged to secure securities sold under repurchase agreements, to secure public and trust deposits, to facilitate access to secured funding, and for other purposes required or permitted by law.
The following table shows our securities by remaining maturity at March 31, 2026. CMOs, other mortgage-backed securities, and asset-backed securities in the available for sale portfolio and held-to-maturity portfolio are presented based on their expected average lives. The remaining securities, in both the available-for-sale and held-to-maturity portfolios, are presented based on their remaining contractual maturity. Actual maturities may differ from expected or contractual maturities since borrowers have the right to prepay obligations with or without prepayment penalties.
March 31, 2026
Securities Available for Sale
Held to Maturity Securities
Dollars in millions
Amortized Cost
Fair Value
Amortized Cost
Fair Value
Due in one year or less
$
3,412
$
3,420
$
316
$
313
Due after one through five years
10,227
9,883
2,294
2,228
Due after five through ten years
21,939
20,166
5,586
5,401
Due after ten years
5,818
5,449
920
800
Total
$
41,396
$
38,918
$
9,116
$
8,742
7. Derivatives and Hedging Activities
We are a party to various derivative instruments, mainly through our subsidiary, KeyBank. The primary derivatives that we use are interest rate swaps, caps, floors, forwards, and futures; foreign exchange contracts; commodity derivatives; and credit derivatives. Generally, these instruments help us manage exposure to interest rate risk, mitigate the credit risk inherent in our loan portfolio, hedge against changes in foreign currency exchange rates, and facilitate client financing and hedging needs.
Additional information regarding our accounting policies for derivatives is provided in Note 1 (“Summary of Significant Accounting Policies”) under the heading “Derivatives and Hedging” beginning on page 113 of our 2025 Form 10-K. Our derivative strategies and related risk management objectives are described in Note 7 (“Derivatives and Hedging Activities”) beginning on page 139 of our 2025 Form 10-K.
Fair Values, Volume of Activity, and Gain/Loss Information Related to Derivative Instruments
The following table summarizes the fair values of our derivative instruments on a gross and net basis as of March 31, 2026, and December 31, 2025. Total derivative assets and liabilities are adjusted to take into account the impact of legally enforceable master netting agreements that allow us to settle all derivative contracts with a single counterparty on a net basis and to offset the net derivative position with the related cash collateral. Securities collateral related to legally enforceable master netting agreements is not offset on the balance sheet. Our derivative instruments are included in “accrued income and other assets” or “accrued expenses and other liabilities” on the Consolidated Balance Sheets, as follows:
Derivatives not designated as hedging instruments:
Interest rate
74,208
95
580
74,994
145
573
Foreign exchange
6,180
90
84
5,767
83
80
Commodity
6,903
406
394
5,553
249
237
Credit
118
—
1
107
—
8
Other (b)
5,814
52
16
4,217
8
25
Total derivatives not designated as hedging instruments:
93,223
643
1,075
90,638
485
923
Total derivatives
153,783
663
1,077
154,866
472
927
Netting adjustments (c)
—
(295)
(485)
—
(297)
(274)
Net derivatives in the balance sheet
153,783
368
592
154,866
175
653
Other collateral (d)
—
—
(4)
—
(22)
(1)
Net derivative amounts
$
153,783
$
368
$
588
$
154,866
$
153
$
652
(a)We take into account bilateral collateral and master netting agreements that allow us to settle all derivative contracts held with a single counterparty on a net basis, and to offset the net derivative position with the related cash collateral when recognizing derivative assets and liabilities. As a result, we could have derivative contracts with negative fair values included in derivative assets and contracts with positive fair values included in derivative liabilities.
(b)Other derivatives include interest rate lock commitments related to our residential and commercial banking activities, forward sale commitments related to our residential mortgage banking activities, forward purchase and sales contracts consisting of contractual commitments associated with “to be announced” securities and when-issued securities, and other customized derivative contracts.
(c)Netting adjustments represent the amounts recorded to convert our derivative assets and liabilities from a gross basis to a net basis in accordance with the applicable accounting guidance. As of March 31, 2026, excess collateral that has not been offset against net derivative instrument positions totaled $246 million of cash collateral and $261 million of securities collateral posted as well as $9 million of cash collateral held. As of December 31, 2025, excess collateral that has not been offset against net derivative instrument positions totaled $165 million of cash collateral and $218 million of securities collateral posted as well as $3 million of cash collateral and $78 million of securities collateral held.
(d)Other collateral represents the amount that cannot be used to offset our derivative assets and liabilities from a gross basis to a net basis in accordance with the applicable accounting guidance. The other collateral consists of securities and is exchanged under bilateral collateral and master netting agreements that allow us to offset the net derivative position with the related collateral. The application of the other collateral cannot reduce the net derivative position below zero. Therefore, excess other collateral, if any, is not reflected above.
Fair value hedges. During the three months ended March 31, 2026, we did not exclude any portion of fair value hedging instruments from the assessment of hedge effectiveness.
The following tables summarize the amounts that were recorded on the balance sheet as of March 31, 2026, and December 31, 2025, related to cumulative basis adjustments for fair value hedges.
March 31, 2026
Dollars in millions
Balance sheet line item in which the hedge item is included
(a)The carrying amount represents the portion of the asset or liability designated as the hedged item.
(b)Certain amounts are designed as fair value hedges under the portfolio layer method. The carrying amount represents the amortized costs basis of the prepayable financial assets used to designate hedging relationships in which the hedged item is the last layer expected to be remaining at the end of the relationship. At March 31, 2026, and December 31, 2025, the amortized costs of the closed portfolios in these hedging relationships was $7 billion and $7 billion, respectively, of which $5.3 billion and $4.9 billion, respectively, were designated in a portfolio layer hedging relationship. At March 31, 2026, the cumulative basis adjustments associated with these amounts totaled $(1) million, which is comprised of $(15) million in active hedging relationships and $14 million for discontinued hedging relationships. At December 31, 2025, the cumulative basis adjustments associated with these amounts totaled $(35) million, which is comprised of $(50) million in active hedging relationships and $14 million for discontinued hedging relationships.
Cash flow hedges. During the three-month period ended March 31, 2026, we did not exclude any portion of cash flow hedging instruments from the assessment of hedge effectiveness.
Considering the interest rates, yield curves, and notional amounts as of March 31, 2026, we expect to reclassify an estimated $77 million of after-tax net losses on derivative instruments designated as cash flow hedges from AOCI to income during the next 12 months. In addition, we expect to reclassify approximately $3 million of net losses related to terminated cash flow hedges from AOCI to income during the next 12 months. These reclassified amounts could differ from actual amounts recognized due to changes in interest rates, hedge de-designations and the addition of other hedges subsequent to March 31, 2026. As of March 31, 2026, the maximum length of time over which we hedge forecasted transactions is 3.51 years.
The following tables summarize the effect of fair value and cash flow hedge accounting on the income statement for the three-month periods ended March 31, 2026, and March 31, 2025.
Location and amount of net gains (losses) recognized in income on fair value and cash flow hedging relationships
Dollars in millions
Interest expense – long-term debt
Interest income – loans
Interest Income - securities
Investment banking and debt placement fees
Three Months Ended March 31, 2026
Total amounts presented in the consolidated statement of income
$
(151)
$
1,416
$
370
$
197
Net gains (losses) on fair value hedging relationships
Interest contracts
Recognized on hedged items
29
—
(61)
—
Recognized on derivatives designated as hedging instruments
(51)
—
51
—
Net income (expense) recognized on fair value hedges
$
(22)
$
—
$
(10)
$
—
Net gain (loss) on cash flow hedging relationships
Realized gains (losses) (pre-tax) reclassified from AOCI into net income
Interest contracts
$
(1)
$
(36)
$
—
$
—
Net income (expense) recognized on cash flow hedges
$
(1)
$
(36)
$
—
$
—
Location and amount of net gains (losses) recognized in income on fair value and cash flow hedging relationships
Dollars in millions
Interest expense – long-term debt
Interest income – loans
Interest Income - securities
Investment banking and debt placement fees
Three Months Ended March 31, 2025
Total amounts presented in the consolidated statement of income
$
(193)
$
1,401
$
392
$
175
Net gains (losses) on fair value hedging relationships
Interest contracts
Recognized on hedged items
(153)
—
78
—
Recognized on derivatives designated as hedging instruments
108
—
(71)
—
Net income (expense) recognized on fair value hedges
$
(45)
$
—
$
7
$
—
Net gain (loss) on cash flow hedging relationships
Realized gains (losses) (pre-tax) reclassified from AOCI into net income
Interest contracts
$
(1)
$
(93)
$
—
$
—
Net income (expense) recognized on cash flow hedges
$
(1)
$
(93)
$
—
$
—
The following table summarizes the pre-tax effect of our cash flow hedges for the three-month periods ended March 31, 2026, and March 31, 2025.
Three months ended,
Dollars in millions
March 31, 2026
March 31, 2025
Net Gains (Losses) Recognized in OCI
Interest income — Loans
$
449
$
241
Interest expense — Long-term debt
2
(1)
Total
$
451
$
240
Net Gains (Losses) Reclassified From AOCI Into Income
Interest income — Loans
$
(36)
$
(93)
Interest expense — Long-term debt
(1)
(1)
Total
$
(37)
$
(94)
Nonhedging instruments. The following table summarizes the pre-tax net gains (losses) on our derivatives that are not designated as hedging instruments for the three-month periods ended March 31, 2026, and March 31, 2025, and where they are recorded on the income statement.
We hold collateral in the form of cash and highly rated securities issued by the U.S. Treasury, government-sponsored enterprises, or GNMA. Cash collateral of $45 million was netted against derivative assets on the balance sheet at March 31, 2026, compared to $103 million of cash collateral netted against derivative assets at December 31, 2025. The cash collateral netted against derivative liabilities totaled $235 million at March 31, 2026, and $80 million at December 31, 2025. Our means of mitigating and managing exposure to credit risk on derivative contracts is described in Note 7 (“Derivatives and Hedging Activities”) beginning on page 139 of our 2025 Form 10-K under the heading “Counterparty Credit Risk.”
The following table summarizes the fair value of our derivative assets by type at the dates indicated. These assets represent our net exposure to potential loss after taking into account the effects of bilateral collateral and master netting agreements and other means used to mitigate risk.
Dollars in millions
March 31, 2026
December 31, 2025
Interest rate
$
47
$
82
Foreign exchange
58
39
Commodity
256
149
Other
52
8
Derivative assets before collateral
413
278
Plus(Less): Related collateral
(45)
(103)
Total derivative assets
$
368
$
175
Credit Derivatives
We are a buyer and, under limited circumstances, may be a seller of credit protection through the credit derivative market. We purchase credit derivatives to manage the credit risk associated with specific commercial lending and swap obligations as well as exposures to debt securities. Our credit derivative portfolio was in a net liability position as of March 31, 2026 and December 31, 2025. Our credit derivative portfolio consists of traded credit default swap indices and risk participation agreements. Additional descriptions of our credit derivatives are provided in Note 7 (“Derivatives and Hedging Activities”) beginning on page 139 of our 2025 Form 10-K under the heading “Credit Derivatives.”
The following table provides information on the types of credit derivatives sold by us and held on the balance sheet at March 31, 2026, and December 31, 2025. The notional amount represents the amount that the seller could
be required to pay. The payment/performance risk shown in the table represents a weighted average of the default
probabilities for all reference entities in the respective portfolios. These default probabilities are implied from
observed credit indices in the credit default swap market, which are mapped to reference entities based on Key’s internal risk rating.
March 31, 2026
December 31, 2025
Dollars in millions
Notional Amount
Average
Term
(Years)
Payment /
Performance
Risk
Notional
Amount
Average
Term
(Years)
Payment /
Performance
Risk
Other
$
4
4.66
2.49
%
$
9
3.62
1.76
%
Total credit derivatives sold
$
4
—
—
$
9
—
—
Credit Risk Contingent Features
We have entered into certain derivative contracts that require us to post collateral to the counterparties when these contracts are in a net liability position. The amount of collateral to be posted is based on the amount of the net liability and thresholds generally related to our long-term senior unsecured credit ratings with Moody’s and S&P. Collateral requirements also are based on minimum transfer amounts, which are specific to each Credit Support Annex (a component of the ISDA Master Agreement) that we have signed with the counterparties. In a limited number of instances, counterparties have the right to terminate their ISDA Master Agreements with us if our ratings fall below a certain level, usually investment-grade level (i.e., “Baa3” for Moody’s and “BBB-” for S&P). At March 31, 2026, KeyBank’s rating was “Baa1” with Moody’s and “BBB+” with S&P, and KeyCorp’s rating was “Baa2” with Moody’s and “BBB” with S&P. Refer to the table below for the aggregate fair value of all derivative contracts with credit risk contingent features held by KeyBank that were in a net liability position.
Net derivative liabilities with credit-risk contingent features
$
(130)
$
(49)
Collateral posted
126
49
As of March 31, 2026, and December 31, 2025, the fair value of additional collateral that could be required to be posted as a result of the credit risk related contingent features being triggered was immaterial to Key’s consolidated financial statements. At March 31, 2026, and December 31, 2025, only KeyBank held derivative contracts with credit risk contingent features.
8. Mortgage Servicing Assets
We originate and periodically sell commercial and residential mortgage loans but continue to service those loans for the buyers. We also may purchase the right to service commercial mortgage loans from other lenders. We record a servicing asset if we purchase or retain the right to service loans in exchange for servicing fees that exceed the going market servicing rate and are considered more than adequate compensation for servicing. Additional information pertaining to the accounting for mortgage and other servicing assets is included in Note 1 (“Summary of Significant Accounting Policies”) under the heading “Servicing Assets” beginning on page 114 of our 2025 Form 10-K.
Commercial
Changes in the carrying amount of commercial mortgage servicing assets are summarized as follows:
Three months ended March 31,
Dollars in millions
2026
2025
Balance at beginning of period
$
577
$
609
Servicing retained from loan sales
22
15
Purchases
4
4
Amortization
(31)
(31)
Balance at end of period
$
572
$
597
Fair value at end of period
$
733
$
805
The fair value of commercial mortgage servicing assets is determined by calculating the present value of future cash flows associated with servicing the loans. This calculation uses a number of assumptions that are based on current market conditions. The sensitivity, range, and weighted average of the significant unobservable inputs used to determine the fair value of our commercial mortgage servicing assets at March 31, 2026, and December 31, 2025, along with the valuation techniques, are shown in the following table:
March 31, 2026
December 31, 2025
Significant
Unobservable Input
Range
Weighted Average
Range
Weighted Average
Escrow earn rate
3.92
%
4.11
%
4.10
%
3.94
%
4.09
%
4.08
%
Effect on fair value from 10% adverse change
$
(29)
$
(29)
Effect on fair value from 20% adverse change
(57)
(57)
Residual cash flows discount rate
6.97
%
10.83
%
10.58
%
6.96
%
10.84
%
10.58
%
Effect on fair value from 10% adverse change
$
(19)
$
(19)
Effect on fair value from 20% adverse change
(36)
(36)
Expected defaults
1.00
%
1.50
%
1.03
%
1.00
%
2.00
%
1.01
%
Effect on fair value from 10% adverse change
$
(2)
$
(2)
Effect on fair value from 20% adverse change
(3)
(3)
Loan assumption rate
8.00
%
45.00
%
9.83
%
8.00
%
45.00
%
10.05
%
Effect on fair value from 10% adverse change
$
(6)
$
(6)
Effect on fair value from 20% adverse change
(12)
(13)
If these economic assumptions change or prove incorrect, the fair value of commercial mortgage servicing assets may also change. Expected credit losses, escrow earn rates, and discount rates are critical to the valuation of commercial mortgage servicing assets. Estimates of these assumptions are based on how a market participant would view the respective rates and reflect historical data associated with the commercial mortgage loans, industry trends, and other considerations. Actual rates may differ from those estimated due to changes in a variety of economic factors. A decrease in the value assigned to the escrow earn rates would cause a decrease in the fair value of our commercial mortgage servicing assets. An increase in the assumed default rates of commercial mortgage loans or an increase in the assigned discount rates would cause a decrease in the fair value of our
commercial mortgage servicing assets. Prepayment activity on commercial serviced loans does not significantly impact the valuation of our commercial mortgage servicing assets. Unlike residential mortgages, commercial mortgages experience significantly lower prepayments due to certain contractual restrictions affecting the borrower’s ability to prepay the mortgage.
The sensitivity calculations above are hypothetical and should not be considered to be predictive of future performance. Changes in fair value based on adverse changes in assumptions generally cannot be extrapolated because the relationship of the change in assumption to the change in fair value may not be linear. Also, the
effect of an adverse variation in a particular assumption on the fair value is calculated without changing any other assumption, while in reality changes in one factor may result in changes in another, which may either magnify or counteract the effect of the change.
Assumptions and information for originated commercial mortgage servicing right additions for the year ended March 31, 2026 are shown in the following table:
Dollars in millions
March 31, 2026
Unpaid principal balance of loans sold during the period
$
1,685
Pretax gains related to the sale of mortgage loans
30
Weighted average servicing fee rate
0.17
%
Weighted average assumptions:
Escrow earn rate assumption
4.26
%
Discount rate assumption
10.34
%
Default rate assumption
1.02
%
Prepayment rate assumption
12.26
%
The amortization of commercial servicing assets is determined in proportion to, and over the period of, the estimated net servicing income. The amortization of commercial servicing assets for each period, as shown in the table at the beginning of this note, is recorded as a reduction to contractual fee income. The contractual fee income from servicing commercial mortgage loans totaled$93 million for the three-month period ended March 31, 2026, and $107 million for the three-month period ended March 31, 2025. Both the contractual fee income and the amortization are recorded, net, in “commercial mortgage servicing fees” on the income statement.
Residential
Changes in the carrying amount of residential mortgage servicing assets are summarized as follows:
Three months ended March 31,
Dollars in millions
2026
2025
Balance at beginning of period
$
112
$
111
Servicing retained from loan sales
5
3
Amortization
(3)
(3)
Balance at end of period
$
114
$
111
Fair value at end of period
$
140
$
138
The fair value of mortgage servicing assets is determined by calculating the present value of future cash flows associated with servicing the loans. This calculation uses a number of assumptions that are based on current market conditions. The sensitivity, range, and weighted-average of the significant unobservable inputs used to fair value our mortgage servicing assets at March 31, 2026, and December 31, 2025, along with the valuation techniques, are shown in the following table:
If these economic assumptions change or prove incorrect, the fair value of residential mortgage servicing assets may also change. Prepayment speed, discount rates, and servicing cost are critical to the valuation of residential mortgage servicing assets. Estimates of these assumptions are based on how a market participant would view the respective rates and reflect historical data associated with the residential mortgage loans, industry trends, and other considerations. Actual rates may differ from those estimated due to changes in a variety of economic factors. An
increase in the prepayment speed would cause a decrease in the fair value of our residential mortgage servicing
assets. An increase in the assigned discount rates and servicing cost assumptions would cause a decrease in the
fair value of our residential mortgage servicing assets.
The sensitivity calculations above are hypothetical and should not be considered to be predictive of future performance. Changes in fair value based on adverse changes in assumptions generally cannot be extrapolated because the relationship of the change in assumption to the change in fair value may not be linear. Also, the
effect of an adverse variation in a particular assumption on the fair value is calculated without changing any other assumption, while in reality changes in one factor may result in changes in another, which may either magnify or counteract the effect of the change.
The amortization of residential servicing assets for March 31, 2026, as shown in the table above, is recorded as a reduction to contractual fee income. The contractual fee income from servicing residential mortgage loans totaled $13 million for the three-month period ended March 31, 2026, and $9 million for the three-month period ended March 31, 2025. Both the contractual fee income and the amortization are recorded, net, in “consumer mortgage income” on the income statement.
9. Leases
As a lessee, we enter into leases of land, buildings, and equipment. Our real estate leases primarily relate to bank branches and office space. The leases of equipment principally relate to technology assets for data processing and data storage. As a lessor, we primarily provide financing through our equipment leasing business. For more information on our leasing activity, see Note 9 (“Leases”) beginning on page 147 of our 2025 Form 10-K.
Lessor Equipment Leasing
Leases may have fixed or floating rate terms. Variable payments are based on an index or other specified rate and are included in rental payments. Certain leases contain an option to extend the lease term or the option to terminate at the discretion of the lessee. Under certain conditions, lease agreements may also contain the option for a lessee to purchase the underlying asset.
Interest income from sales-type and direct financing leases is recognized in "interest income — loans" on the Consolidated Statements of Income. Income related to operating leases is recognized in “operating lease income and other leasing gains” on the Consolidated Statements of Income. The components of equipment leasing income are summarized in the table below:
Three months ended March 31,
Dollars in millions
2026
2025
Sales-type and direct financing leases
Interest income on lease receivable
$
12
$
15
Interest income related to accretion of unguaranteed residual asset
2
2
Interest income on deferred fees and costs
6
5
Total sales-type and direct financing lease income
$
20
$
22
Operating leases
Operating lease income related to lease payments
$
9
$
12
Other operating leasing gains (losses)
(1)
(3)
Total operating lease income and other leasing gains
8
9
Total lease income
$
28
$
31
10. Variable Interest Entities
Our significant VIEs are summarized below. Additional information pertaining to the criteria used in determining if an entity is a VIE is included in Note 12 (“Variable Interest Entities”) beginning on page 151 of our 2025 Form 10-K.
LIHTC and NMTC investments.We had $2.4 billion and $2.4 billion of investments in LIHTC operating partnerships at March 31, 2026, and December 31, 2025, respectively. These investments are recorded in “accrued income and other assets” on our Consolidated Balance Sheets. We do not have any loss reserves recorded related to these investments because we believe the likelihood of any loss to be remote. For all legally binding, unfunded equity commitments, we increase our recognized investment and recognize a liability. As of March 31, 2026, and December 31, 2025, we had liabilities of $1.1 billion and $1.1 billion, respectively, related to investments in qualified affordable housing projects, which are recorded in “accrued expenses and other liabilities” on our Consolidated Balance Sheets. We continue to invest in these LIHTC operating partnerships.
The assets and liabilities presented in the table below convey the size of KCDC’s direct and indirect investments at March 31, 2026, and December 31, 2025. As these investments represent unconsolidated VIEs, the assets and liabilities of the investments themselves are not recorded on our Consolidated Balance Sheets. Additional information pertaining to our LIHTC investments is included in Note 12 (“Variable Interest Entities”) beginning on page 151 of our 2025 Form 10-K.
Unconsolidated VIEs
Dollars in millions
Total
Assets
Total
Liabilities
Maximum
Exposure to Loss
March 31, 2026
LIHTC investments
$
9,635
$
4,252
$
2,853
December 31, 2025
LIHTC investments
$
11,212
$
5,026
$
2,913
We had $17 million and $18 million in NMTC investments at March 31, 2026 and December 31, 2025, respectively. These investments are recorded in “accrued income and other assets” on our Consolidated Balance Sheets.
We amortize our LIHTC and NMTC investments over the period that we expect to receive the tax benefits. During the three months ended March 31, 2026, we recognized $68 million of amortization, $68 million of tax credits and $17 million of other tax benefits associated with these investments within “income taxes” on our income statement. During the three months ended March 31, 2025, we recognized $68 million of amortization, $66 million of tax credits and $17 million of other tax benefits associated with these investments within “income taxes” on our income statement.
Principal investments.Our maximum exposure to loss associated with indirect principal investments consists of the investments’ fair value plus any unfunded equity commitments. The fair value of our indirect principal investments totaled $8 million and $9 million at March 31, 2026 and December 31, 2025, respectively. These investments are recorded in “other investments” on our Consolidated Balance Sheets. The table below reflects the size of the private equity funds in which we were invested as well as our maximum exposure to loss in connection with these investments at March 31, 2026, and December 31, 2025.
Unconsolidated VIEs
Dollars in millions
Total
Assets
Total
Liabilities
Maximum
Exposure to Loss
March 31, 2026
Indirect investments
$
1,721
$
1
$
9
December 31, 2025
Indirect investments
$
1,858
$
3
$
10
Through our principal investing entities, we have formed and funded operating entities that provide management and other related services to our investment company funds, which directly invest in portfolio companies. These entities had no assets at March 31, 2026, and December 31, 2025, that can be used to settle the entities’ obligations. The entities had no liabilities at March 31, 2026, and December 31, 2025, and other equity investors have no recourse to our general credit.
Additional information on our indirect and direct principal investments is provided in Note 5 (“Fair Value Measurements”) beginning on page 131 and in Note 12 (“Variable Interest Entities”) beginning on page 151 of our 2025 Form 10-K.
Other unconsolidated VIEs. We are involved with other various entities in the normal course of business which we have determined to be VIEs. We have determined that we are not the primary beneficiary of these VIEs because we do not have the power to direct the activities that most significantly impact their economic performance or hold a
variable interest that could potentially be significant. The table below shows our assets and liabilities associated with these unconsolidated VIEs at March 31, 2026, and December 31, 2025. These assets are recorded in “accrued income and other assets,” “other investments,” “securities available for sale,” “held-to-maturity securities,” and “loans, net of unearned income” on our Consolidated Balance Sheets. Our maximum exposure to loss is equal to the value of the assets recorded. Of the total balance as of March 31, 2026, $41 million related to the purchase of senior notes from a securitization collateralized by sold indirect auto loans. Additional information pertaining to our other unconsolidated VIEs is included in Note 12 (“Variable Interest Entities“) under the heading “Other unconsolidated VIEs” on page 152 of our 2025 Form 10-K.
Other unconsolidated VIEs
Dollars in millions
Total Assets
Total Liabilities
March 31, 2026
Other unconsolidated VIEs
$
477
$
—
December 31, 2025
Other unconsolidated VIEs
$
508
$
—
11. Income Taxes
One Big Beautiful Bill Act
On July 4, 2025, new U.S. tax legislation was signed into law, OBBBA, which makes permanent many of the tax provisions enacted in 2017 as part of the Tax Cuts and Jobs Act that were set to expire at the end of 2025. In addition, the OBBBA makes changes to certain U.S. corporate tax provisions, many of which are generally effective in the current year. Key does not expect any material change to our ongoing tax rate or any material impact on our results of operations.
Income Tax Provision
In accordance with the applicable accounting guidance, the principal method established for computing the provision for income taxes in interim periods requires us to make our best estimate of the effective tax rate expected to be applicable for the full year. This estimated effective tax rate is then applied to interim consolidated pre-tax operating income to determine the interim provision for income taxes.
The effective tax rate, which is the provision for income taxes as a percentage of income before income taxes, was 20.7% for the first quarter of 2026 and 21.2% for the first quarter of 2025. The effective tax rates were less than our combined federal and state statutory tax rate of 24.2%, primarily due to income from investments in tax-advantaged assets such as corporate-owned life insurance, tax credits associated with low-income housing investments, and periodic adjustments to our tax reserves.
Deferred Taxes
At March 31, 2026, we had a net deferred tax asset of $1.2 billion, compared to a net deferred tax asset of $1.2 billion at December 31, 2025, which are included in “accrued income and other assets” on the balance sheet. The deferred tax asset is primarily related to market fluctuations in the investment security portfolio accounted for in other comprehensive income.
To determine the amount of deferred tax assets that are more likely than not to be realized, and therefore recorded, we conduct a quarterly assessment of all available evidence. This evidence includes, but is not limited to, taxable income in prior periods, projected future taxable income, and projected future reversals of deferred tax items. These assessments involve a degree of subjectivity and may undergo change. Based on these criteria, we had a valuation allowance of $5 million at March 31, 2026, and $5 million at December 31, 2025. The valuation allowance is associated with federal and state capital loss carryforwards, and state net operating loss carryforwards.
Unrecognized Tax Benefits
At March 31, 2026, Key’s unrecognized tax benefits were $3 million. As permitted under the applicable accounting guidance for income taxes, it is our policy to recognize interest and penalties related to unrecognized tax benefits in “income tax expense.”
Pre-1988 Bank Reserves Acquired in a Business Combination
Retained earnings of KeyBank included approximately $92 million of allocated bad debt deductions for which no income taxes have been recorded. Under current federal law, these reserves are subject to recapture into taxable income if KeyBank, or any successor, fails to maintain its bank status under the Internal Revenue Code or makes non-dividend distributions or distributions greater than its accumulated earnings and profits. No deferred tax liability has been established as these events are not expected to occur in the foreseeable future.
12. Discontinued Operations
Discontinued operations primarily includes our government-guaranteed and private education lending business. At March 31, 2026, and December 31, 2025, approximately $194 million and $205 million, respectively, of education loans are included in discontinued assets on the Consolidated Balance Sheets. Net interest income after provision for credit losses for this business is not material and is included in income (loss) from discontinued operations, net of taxes on the Consolidated Statements of Income.
13. Borrowings
The following table presents a summary of our short-term borrowings:
Dollars in millions
March 31, 2026
December 31, 2025
Securities sold under repurchase agreements
$
34
$
13
Other short-term borrowings
6,149
1,071
Long-term borrowings
The following table presents the contractual rates and maturity dates of our long-term debt as of March 31, 2026 and the carrying values as of March 31, 2026 and December 31, 2025. We use interest rate swaps and caps, which modify the repricing characteristics of certain long-term debt, to manage interest rate risk. For more information about such financial instruments, see Note 7 (“Derivatives and Hedging Activities”).
March 31, 2026
March 31, 2026
December 31, 2025
Dollars in millions
Stated Rate
Maturity
Carrying Value
Parent Company
Senior notes
2.25% - 6.40%
2027 - 2037
$
5,394
$
4,659
Junior subordinated debentures
4.66% - 7.75%
2028 - 2037
445
447
Total parent company
$
5,839
$
5,106
Subsidiaries
Senior notes
3.75% - 5.85%
2027 - 2039
$
2,222
$
2,229
Subordinated notes
3.40% - 6.95%
2026 - 2032
1,930
1,932
Federal Home Loan Bank advances
1.39% - 7.36%
2026 - 2042
808
560
Other long-term debt(a)
78
90
Total subsidiaries
$
5,038
$
4,811
Total long-term debt
$
10,877
$
9,917
(a)Includes debt associated with secured borrowings, investment fund financing, and capital lease obligations.
14. Contingent Liabilities and Guarantees
Legal Proceedings
Litigation. From time to time, in the ordinary course of business, we and our subsidiaries are subject to various litigation, investigations, and administrative proceedings. Private, civil litigation may range from individual actions involving a single plaintiff to putative or actual class action lawsuits with potentially thousands of class members, as well as arbitrations and mass arbitrations. Investigations may involve both formal and informal proceedings, by both government agencies and self-regulatory bodies. These matters may involve claims for substantial monetary or non-monetary relief. At times, these matters may present novel claims or legal theories. Due to the complex nature
of these various other matters, it may be years before some matters are resolved. While it is impossible to ascertain the ultimate resolution or range of financial liability, based on information presently known to us, we do not believe there is any matter to which we are a party, or involving any of our properties, that, individually or in the aggregate, would reasonably be expected to have a material adverse effect on our financial condition. We continually monitor and reassess the potential materiality of these litigation matters. We note, however, that in light of the inherent uncertainty in legal proceedings there can be no assurance that the ultimate resolution will not exceed established accruals. As a result, the outcome of a particular matter, or a combination of matters, may be material to our results of operations for a particular period, depending upon the size of the loss or our income for that particular period.
On at least a quarterly basis, we assess our liabilities and contingencies in connection with outstanding legal proceedings utilizing the latest information available. Where it is probable that we will incur a loss and the amount of the loss can be reasonably estimated, we record a liability in our consolidated financial statements. These legal accruals may be increased or decreased to reflect any relevant developments on a quarterly basis. Where a loss is not probable or the amount of the loss is not estimable, we have not accrued a liability for said loss, consistent with applicable accounting guidance. Based on information currently available to us and advice of counsel, we believe that our established accruals are adequate and the liabilities arising from the legal proceedings will not have a material adverse effect on our consolidated financial condition.
Guarantees
We are a guarantor in various agreements with third parties. The following table shows the types of guarantees that we had outstanding at March 31, 2026. Information pertaining to the basis for determining the liabilities recorded in connection with these guarantees is included in Note 1 (“Summary of Significant Accounting Policies”) under the heading “Contingencies and Guarantees” beginning on page 115 of our 2025 Form 10-K.
March 31, 2026
Maximum Potential Undiscounted Future Payments
Liability Recorded
Dollars in millions
Financial guarantees:
Standby letters of credit
$
7,112
$
78
Recourse agreement with FNMA
8,240
59
Residential mortgage reserve
3,438
8
Written options (a)
3,882
27
Total
$
22,672
$
172
(a)The maximum potential undiscounted future payments represent notional amounts of derivatives qualifying as guarantees.
We determine the payment/performance risk associated with each type of guarantee described below based on the probability that we could be required to make the maximum potential undiscounted future payments shown in the preceding table. We use a scale of low (0% to 30% probability of payment), moderate (greater than 30% to 70% probability of payment), or high (greater than 70% probability of payment) to assess the payment/performance risk, and have determined that the payment/performance risk associated with each type of guarantee outstanding at March 31, 2026, is low. Information pertaining to the nature of each of the guarantees listed below is included in Note 19 (“Commitments, Contingent Liabilities, and Guarantees”) under the heading “Guarantees” beginning on page 166 of our 2025 Form 10-K.
Standby letters of credit. At March 31, 2026, our standby letters of credit had a remaining weighted-average life of 2.1 years, with remaining actual lives ranging from less than 1 year to 8.7 years.
Recourse agreement with FNMA. At March 31, 2026, the outstanding commercial mortgage loans in this program had a weighted-average remaining term of 5.7 years, and the unpaid principal balance outstanding of loans sold by us as a participant was $25.2 billion. The maximum potential amount of undiscounted future payments that we could be required to make under this program, as shown in the preceding table, is equal to approximately 32.7% of the principal balance of loans outstanding at March 31, 2026. FNMA delegates responsibility for originating, underwriting, and servicing mortgages, and we assume a limited portion of the risk of loss during the remaining term on each commercial mortgage loan that we sell to FNMA. We maintain a reserve for such potential losses of $59 million that we believe approximates the fair value of our liability for the guarantee as described in Note 4 (“Asset Quality”).
Residential Mortgage Banking. At March 31, 2026, the unpaid principal balance outstanding of loans sold by us in this program was $11.5 billion. The maximum potential amount of undiscounted future payments that we could be
required to make under this program, as shown in the preceding table, is equal to approximately 30% of the principal balance of loans outstanding at March 31, 2026.
Our liability for estimated repurchase obligations on loans sold, which is included in “accrued expenses and other liabilities” on the Consolidated Balance Sheets, was $8 million at March 31, 2026. For more information on our residential mortgages, see Note 8 (“Mortgage Servicing Assets”).
Written options. In the ordinary course of business, we “write” put options for clients that wish to mitigate their exposure to changes in interest rates and commodity prices. At March 31, 2026, our written put options had an average life of 1.4 years. These written put options are accounted for as derivatives at fair value, as further discussed in Note 7 (“Derivatives and Hedging Activities”).
Written put options where the counterparty is a broker-dealer or bank are accounted for as derivatives at fair value but are not considered guarantees since these counterparties typically do not hold the underlying instruments. In addition, we are a purchaser and seller of credit derivatives, which are further discussed in Note 7 (“Derivatives and Hedging Activities”).
Other Off-Balance Sheet Risk
Other off-balance sheet risk stems from financial instruments that do not meet the definition of a guarantee as specified in the applicable accounting guidance, and from other relationships. Additional information pertaining to types of other off-balance sheet risk is included in Note 19 (“Commitments, Contingent Liabilities, and Guarantees”) under the heading “Other Off-Balance Sheet Risk” on page 167 of our 2025 Form 10-K.
15. Accumulated Other Comprehensive Income
Our changes in AOCI for the three months ended March 31, 2026, and March 31, 2025, are as follows:
Dollars in millions
Unrealized gains (losses) on securities available for sale
Unrealized gains (losses) on derivative financial instruments
Net pension and postretirement benefit costs
Total
Balance at December 31, 2025
$
(1,716)
$
(7)
$
(237)
$
(1,960)
Other comprehensive income before reclassification, net of income taxes
(172)
(119)
—
(291)
Amounts reclassified from AOCI, net of income taxes (a)
—
28
2
30
Net current-period other comprehensive income, net of income taxes
(172)
(91)
2
(261)
Balance at March 31, 2026
$
(1,888)
$
(98)
$
(235)
$
(2,221)
Balance at December 31, 2025
$
(2,734)
$
(434)
$
(302)
$
(3,470)
Other comprehensive income before reclassification, net of income taxes
424
122
64
610
Amounts reclassified from AOCI, net of income taxes (a)
—
71
2
73
Net current-period other comprehensive income, net of income taxes
424
193
66
683
Balance at March 31, 2025
$
(2,310)
$
(241)
$
(236)
$
(2,787)
(a)See table below for details about these reclassifications.
Our reclassifications out of AOCI for the three months ended March 31, 2026, and March 31, 2025, are as follows:
Three months ended March 31,
Affected Line Item in the Consolidated Statement of Income
Dollars in millions
2026
2025
Unrealized gains (losses) on derivative financial instruments
Interest rate
$
(36)
$
(93)
Interest income — Loans
Interest rate
(1)
(1)
Interest expense — Long-term debt
(37)
(94)
Income (loss) from continuing operations before income taxes
(9)
(23)
Income taxes
$
(28)
$
(71)
Income (loss) from continuing operations
Net pension and postretirement benefit costs
Amortization of losses
$
(2)
$
(2)
Other expense
(2)
(2)
Income (loss) from continuing operations before income taxes
On March 13, 2025, Key announced that its Board of Directors has authorized a share repurchase program pursuant to which we may purchase up to $1.0 billion of KeyCorp Common Shares, in the open market or in privately negotiated transactions.
As contemplated by the Investment Agreement, dated as of August 12, 2024, between KeyCorp and Scotiabank, in February 2025, we entered into an agreement with Scotiabank to permit Scotiabank to participate, through a periodic “true-up” right, in any repurchase by KeyCorp of its common stock on a pro rata basis. During the first quarter of 2026, Key completed $389 million, or approximately 18 million shares, in share repurchases including $45 million, or approximately 2 million shares, from Scotiabank pursuant to our repurchase agreement described above. We also repurchased $46 million of shares related to equity compensation programs in the first quarter of 2026.
Consistent with our capital plan, the Board declared a quarterly dividend of $.205 per Common Share for the first quarter of 2026.
Preferred Stock
The following table summarizes our preferred stock at March 31, 2026.
Preferred stock series
Amount outstanding (in millions)
Book value (net of capital surplus)
Shares authorized and outstanding
Par value
Liquidation preference
Ownership interest per depositary share
Liquidation preference per depositary share
First quarter 2026 dividends paid per depositary share
5.000% Fixed-to-Floating Rate Perpetual Noncumulative Series D
$
525
$
519
21,000
$
1
$
25,000
1/25th
$
1,000
$
12.50
6.125% Fixed-to-Floating Rate Perpetual Noncumulative Series E
500
490
500,000
1
1,000
1/40th
25
.382813
5.650% Fixed Rate Perpetual Noncumulative Series F
425
412
425,000
1
1,000
1/40th
25
.353125
5.625% Fixed Rate Perpetual Non-Cumulative Series G
450
435
450,000
1
1,000
1/40th
25
.351563
6.200% Fixed Rate Reset Perpetual Non-Cumulative Series H
600
590
600,000
1
1,000
1/40th
25
.387500
17. Business Segment Reporting
The following is a description of the segments and their primary businesses at March 31, 2026.
Consumer Bank
The Consumer Bank serves individuals and small businesses throughout our 15 state branch footprint as well as healthcare professionals nationally through our digital channel by offering a variety of deposit and investment products, personal finance and financial wellness services, lending, mortgage and home equity, student loan refinancing, credit card, treasury services, and business advisory services. In addition, wealth management and investment services are offered to assist institutional, non-profit, and high-net-worth clients with their banking, trust, portfolio management, charitable giving, and related needs.
The Commercial Bank is an aggregation of our Institutional and Commercial operating segments. The Commercial operating segment is a full-service corporate bank focused principally on serving the borrowing, cash management, and capital markets needs of middle market clients within Key’s 15 state branch footprint. The Institutional operating segment operates nationally, providing lending, equipment financing, and banking products and services to large corporate and institutional clients. The industry coverage and product teams have established expertise in the following sectors: Consumer, Energy, Healthcare, Industrial, Public Sector, Real Estate, and Technology. It is also a significant, national, commercial real estate lender and third-party master and special servicer of commercial mortgage loans. The operating segment also includes the KBCM platform which provides a broad suite of capital markets products and services including syndicated finance, debt and equity underwriting, fixed income and equity sales and trading, derivatives, foreign exchange, mergers & acquisition and other advisory, and public finance.
Other
Other includes various corporate treasury activities such as management of our investment securities portfolio, long-term debt, short-term liquidity and funding activities, and balance sheet risk management, our principal investing unit, and various exit portfolios as well as reconciling items, which primarily represent the unallocated portion of nonearning assets of corporate support functions.
We use an internal FTP framework to measure the performance of its operating segments. Under this framework, business segments receive funding credits for liabilities generated and incur funding charges for assets held, based on market‑based funding assumptions, in order to isolate business operating performance from interest rate risk.
Interest rate risk is managed centrally. Because differences exist in the timing and repricing characteristics of assets and liabilities across the balance sheet, a residual impact from centrally managed interest rate risk is not allocated to the operating segments and is reflected within the Other segment.
Effective January 1, 2026, we revised our segment reporting presentation to reflect this residual impact within the Other segment. Previously, these residual amounts were included in net interest income for the Consumer and Commercial Bank segments. This change aligns segment reporting with how management evaluates performance and manages interest rate risk on a centralized basis and affects only the presentation of segment results. Prior period segment results have been recast to reflect this change in segment reporting presentation. There was no impact on the Company’s consolidated financial statements for any period presented.
Developing and applying the methodologies that we use to allocate items among our lines of business is a dynamic process. Accordingly, financial results may be revised periodically to reflect enhanced alignment of expense base allocation drivers, changes in the risk profile of a particular business, or changes in our organizational structure.
The table below shows selected financial data for our business segments for the three-month periods ended March 31, 2026, and March 31, 2025. Capital is assigned to each business segment based on a combination of regulatory and economic equity.
Income (loss) from continuing operations before income taxes (TE)
229
214
573
508
(136)
(198)
666
524
Allocated income taxes and TE adjustments
56
51
122
109
(34)
(42)
144
118
Income (loss) from continuing operations
173
163
451
399
(102)
(156)
522
406
Income (loss) from discontinued operations, net of taxes
—
—
—
—
—
(1)
—
(1)
Net income (loss)
$
173
$
163
$
451
$
399
$
(102)
$
(157)
$
522
$
405
AVERAGE BALANCES(b)
Loans and leases
$
34,005
$
36,819
$
73,146
$
67,058
$
586
$
477
$
107,737
$
104,354
Total assets (a)
37,341
39,806
82,585
76,946
66,323
69,338
186,249
186,090
Deposits
87,796
88,306
58,929
57,481
574
2,755
147,299
148,542
(a)Substantially all revenue generated by our major business segments is derived from clients that reside in the United States. Substantially all long-lived assets, including premises and equipment, capitalized software, and goodwill held by our major business segments, are located in the United States.
(b)From continuing operations.
18. Revenue from Contracts with Customers
The following table represents a disaggregation of revenue from contracts with customers, by business segment, for the three-month periods ended March 31, 2026, and March 31, 2025. The development and application of the methodologies that we use to allocate items among our business segments is a dynamic process. Accordingly, financial results may be revised periodically to reflect enhanced alignment of expense base allocations drivers, changes in the risk profile of a particular business, or changes in our organizational structure.
Three months ended March 31, 2026
Three months ended March 31, 2025
Dollars in millions
Consumer Bank
Commercial Bank
Total Contract Revenue
Consumer Bank
Commercial Bank
Total Contract Revenue
NONINTEREST INCOME
Trust and investment services income
$
129
$
19
$
148
$
113
$
19
$
132
Investment banking and debt placement fees
—
152
152
—
127
127
Services charges on deposit accounts
34
43
77
33
35
68
Cards and payments income
40
42
82
42
40
82
Other noninterest income
3
—
3
2
—
2
Total revenue from contracts with customers
$
206
$
256
$
462
$
190
$
221
$
411
Other noninterest income (a)
$
223
$
226
Noninterest income from other segments(b)
38
31
Total noninterest income
$
723
$
668
(a)Noninterest income considered earned outside the scope of contracts with customers.
(b)Other includes other segments that consists of corporate treasury, our principal investing unit, and various exit portfolios as well as reconciling items which primarily represents the unallocated portion of nonearning assets of corporate support functions. Charges related to the funding of these assets are part of net interest income and are allocated to the business segments through noninterest expense. Corporate treasury includes realized gains and losses from transactions associated with Key's investment securities portfolio. Reconciling items also includes intercompany eliminations and certain items that are not allocated to the business segments because they do not reflect their normal operations. Refer to Note 17 (“Business Segment Reporting”) for more information.
We had no material contract assets or contract liabilities as of March 31, 2026 and March 31, 2025.
Report of Independent Registered Public Accounting Firm
To the Shareholders and Board of Directors of KeyCorp
Results of Review of Interim Financial Statements
We have reviewed the accompanying consolidated balance sheet of KeyCorp as of March 31, 2026, the related consolidated statements of income, comprehensive income, changes in equity, and cash flows for the three-month periods ended March 31, 2026 and 2025, and the related notes (collectively referred to as the “consolidated interim financial statements”). Based on our reviews, we are not aware of any material modifications that should be made to the consolidated interim financial statements for them to be in conformity with U.S. generally accepted accounting principles.
We have previously audited, in accordance with the standards of the Public Company Accounting Oversight Board (United States) (PCAOB), the consolidated balance sheet of KeyCorp as of December 31, 2025, the related consolidated statements of income, comprehensive income, changes in equity and cash flows for the year then ended, and the related notes (not presented herein); and in our report dated February 23, 2026, we expressed an unqualified audit opinion on those consolidated financial statements. In our opinion, the information set forth in the accompanying consolidated balance sheet as of December 31, 2025, is fairly stated, in all material respects, in relation to the consolidated balance sheet from which it has been derived.
Basis for Review Results
These financial statements are the responsibility of KeyCorp's management. We are a public accounting firm registered with the PCAOB and are required to be independent with respect to KeyCorp in accordance with the U.S. federal securities laws and the applicable rules and regulations of the SEC and the PCAOB. We conducted our review in accordance with the standards of the PCAOB. A review of interim financial statements consists principally of applying analytical procedures and making inquiries of persons responsible for financial and accounting matters. It is substantially less in scope than an audit conducted in accordance with the standards of the PCAOB, the objective of which is the expression of an opinion regarding the financial statements taken as a whole. Accordingly, we do not express such an opinion.
Item 3. Quantitative and Qualitative Disclosure about Market Risk
The information presented in the “Market risk management” section of the Management’s Discussion & Analysis of Financial Condition & Results of Operations is incorporated herein by reference.
Item 4. Controls and Procedures
As of the end of the period covered by this report, KeyCorp carried out an evaluation, under the supervision and with the participation of KeyCorp’s management, including our Chief Executive Officer and Chief Financial Officer, of the effectiveness of the design and operation of KeyCorp’s disclosure controls and procedures (as defined in Rule 13a-15(e) under the Securities Exchange Act of 1934 (the “Exchange Act”)), to ensure that information required to be disclosed by KeyCorp in reports that it files or submits under the Exchange Act, is recorded, processed, summarized and reported within the time periods specified in the SEC’s rules and forms, and that such information is accumulated and communicated to KeyCorp’s management, including its Chief Executive Officer and Chief Financial Officer, as appropriate, to allow for timely decisions regarding required disclosure. Based upon that evaluation, KeyCorp’s Chief Executive Officer and Chief Financial Officer concluded that the design and operation of these disclosure controls and procedures were effective, in all material respects, as of the end of the period covered by this report. No changes were made to KeyCorp’s internal control over financial reporting (as defined in Rule 13a-15(f) under the Exchange Act) during the last quarter that materially affected, or are reasonably likely to materially affect, KeyCorp’s internal control over financial reporting.
PART II. OTHER INFORMATION
Item 1. Legal Proceedings
The information presented in the Legal Proceedings section of Note 14 (“Contingent Liabilities and Guarantees”) of the Notes to Consolidated Financial Statements (Unaudited) is incorporated herein by reference.
Item 1A. Risk Factors
For a discussion of certain risk factors affecting us, see the section titled “Supervision and Regulation” in Part I, Item 1. Business, on pages 11-24 of our 2025 Form 10-K; Part I, Item 1A. Risk Factors, on pages 25-43 of our 2025 Form 10-K; the section titled “Supervision and regulation” in this report; and our disclosure regarding forward-looking statements in this report.
Item 2. Unregistered Sales of Equity Securities and Use of Proceeds
From time to time, KeyCorp or its principal subsidiary, KeyBank, may seek to retire, repurchase, or exchange outstanding debt of KeyCorp or KeyBank, and capital securities or preferred stock of KeyCorp, through cash purchase, privately negotiated transactions, or otherwise. Such transactions, if any, depend on prevailing market conditions, our liquidity and capital requirements, contractual restrictions, and other factors. The amounts involved may be material.
On March 13, 2025, our Board of Directors authorized a share repurchase program pursuant to which we may purchase up to $1.0 billion of KeyCorp common shares, in the open market or in privately negotiated transactions. During the fourth quarter of 2025, we began repurchasing shares under the share repurchase program. The timing and price of repurchases as well as the actual number of shares repurchased under the program will be at the discretion of KeyCorp and will depend on a variety of factors, including general market conditions, the stock price, regulatory requirements and limitations, corporate liquidity requirements, and other factors.
As contemplated by the Investment Agreement, dated as of August 12, 2024, between KeyCorp and Scotiabank, in February 2025, we entered into an agreement with Scotiabank to permit Scotiabank to participate, through a periodic “true-up” right, in any repurchase by KeyCorp of its common stock on a pro rata basis.
During the first quarter of 2026, Key completed $389 million, or approximately 18 million shares, in share repurchases including $45 million, or approximately 2 million shares, from Scotiabank pursuant to our repurchase agreement described above. We also repurchased $46 million of shares related to equity compensation programs in the first quarter of 2026.
The following table summarizes our repurchases of our Common Shares for the three months ended March 31, 2026. Refer to Note 16 (“Shareholders' Equity”) for more information regarding share repurchases made during the three months ended March 31, 2026.
Calendar month
Total number of shares purchased (a)
Average price paid per share
Total number of shares purchased as part of publicly announced plans or programs
Dollar value of shares that may yet be purchased as part of publicly announced plans or programs
January 1 - 31
3,211,357
$
21.30
3,204,855
$
730,933,896
February 1 -28
12,602,456
21.99
10,444,920
500,561,934
March 1 - 31
4,319,273
20.90
4,319,070
410,283,042
Total
20,133,086
$
21.65
17,968,845
(a)Includes Common Shares deemed surrendered by employees in connection with our stock compensation and benefit plans to satisfy tax obligations.
Item 5. Other Information
No director or officer (as defined in Rule 16a-1(f) of the Exchange Act) of KeyCorp adopted, modified,
or terminated any Rule 10b5-1 trading arrangement or any non-Rule 10b5-1 trading arrangement (as such terms
are defined in Item 408 of Regulation S-K of the Exchange Act) during the quarter ended March 31, 2026,
except as may be noted below. We do not permit the use of Rule 10b5-1 trading arrangements by our directors or
executive officers.
Certain of our directors or officers have made elections to participate in, and are participating in, our KeyCorp
Second Amended and Restated Discounted Stock Purchase Plan, our Long-Term Incentive Deferral Plan, our
Directors’ Deferred Share Sub-Plan, and the Dividend Reinvestment Plan and dividend reinvestment features under
various compensation plans and arrangements, and previously made elections to participate in KeyCorp common
stock funds that are now frozen but were previously available as an investment option under our Deferred Savings
Plan and KeyCorp 401(k) plan. By participating in these plans or stock funds, the directors or officers have made,
and/or may from time to time make, elections involving transactions in KeyCorp Common Shares which may be
designed to satisfy the affirmative defense conditions of Rule 10b5-1 under the Exchange Act or may constitute
non-Rule 10b5-1 trading arrangements (as such term is defined in Item 408(c) of Regulation S-K of the Exchange
The following materials from KeyCorp’s Form 10-Q Report for the quarterly period ended March 31, 2026, formatted in inline XBRL: (i) the Consolidated Balance Sheets; (ii) the Consolidated Statements of Income and Consolidated Statements of Comprehensive Income; (iii) the Consolidated Statements of Changes in Equity; (iv) the Consolidated Statements of Cash Flows; and (v) the Notes to Consolidated Financial Statements.
104
The cover page from KeyCorp’s Form 10-Q for the quarterly period ended March 31, 2026, formatted in inline XBRL (contained in Exhibit 101).
*
Furnished herewith.
#
Management contract or compensatory plan or arrangement.
^
Incorporated by reference. A copy of this Exhibit has been filed with the SEC. Exhibits that are not incorporated by reference are furnished or filed with this report. Shareholders may obtain a copy of any exhibit, upon payment of reproduction costs, by writing KeyCorp Investor Relations, 127 Public Square, Cleveland, OH 44114-1306.
Information Available on Website
KeyCorp makes available free of charge on its website, www.key.com, its annual reports on Form 10-K, quarterly reports on Form 10-Q, current reports on Form 8-K, and amendments to these reports as soon as reasonably practicable after KeyCorp electronically files such material with, or furnishes it to, the SEC. We also make available a summary of filings made with the SEC of statements of beneficial ownership of our equity securities filed by our directors and officers and persons who own 10% or more of a registered class of our equity securities under Section 16 of the Exchange Act. Information contained on or accessible through our website or any other website referenced in this report is not part of this report.
Pursuant to the requirements of the Securities Exchange Act of 1934, the Registrant has duly caused this report to be signed on its behalf by the undersigned, thereunto duly authorized, on the date indicated.