UNITED STATES
SECURITIES AND EXCHANGE COMMISSION
Washington, D.C. 20549
FORM N-CSR
CERTIFIED SHAREHOLDER REPORT OF REGISTERED
MANAGEMENT INVESTMENT COMPANIES
Investment Company Act file number 811-01731
(Exact name of registrant as specified in charter)
235 W. Galena Street
Milwaukee, WI 53212
(Address of principal executive offices) (Zip code)
Diane J. Drake
Mutual Fund Administration, LLC
2220 E. Route 66, Suite 226
Glendora, CA 91740
(Name and address of agent for service)
(626) 385-5777
Registrant’s telephone number, including area code
Date of fiscal year end: December 31
Date of reporting period:
Item 1. Report to Stockholders.
(a) The registrant’s semi-annual report transmitted to shareholders pursuant to Rule 30e-1 under the Investment Company Act of 1940, as amended (the “Investment Company Act”), is as follows:

SOURCE CAPITAL
2026
SEMI-ANNUAL REPORT
for the six months ended June 30, 2026
(This page has been left blank intentionally.)
SOURCE CAPITAL
TABLE OF CONTENTS
Page | |
1
SOURCE CAPITAL
2Q 2026 COMMENTARY
You should consider the Fund’s investment objectives, risks, and charges and expenses carefully before you invest. You can obtain additional information by visiting the website at https://fpa.com/fund/source-capital/, by email at crm@fpa.com, or toll-free by calling 1‑800‑279‑1241.
Average Annual Total Returns (%)
As of June 30, 2026 | Since 12/1/15* | 10 Yr | 5 Yr | 3 Yr | 1 Yr | YTD | QTD | ||||||||||||||||
Source Capital—NAV | 8.48 | 9.26 | 8 | .75 | 13 | .93 | 14.70 | 5 | .19 | 5 | .49 | ||||||||||||
Source Capital—Market Price | 9.55 | 9.59 | 9 | .06 | 15 | .68 | 13.07 | 4 | .25 | 0 | .59 | ||||||||||||
60% MSCI ACWI/40% BBG U.S. Agg | 8.08 | 8.38 | 6 | .67 | 13 | .38 | 15.53 | 7 | .07 | 9 | .15 | ||||||||||||
60% S&P 500/40% BBG U.S. Agg | 9.75 | 9.98 | 8 | .10 | 13 | .92 | 14.76 | 6 | .45 | 9 | .31 | ||||||||||||
Index data source: Morningstar.
Past performance is no guarantee of future results and current performance may be higher or lower than the performance shown. This data represents past performance and investors should understand that investment returns and principal values fluctuate, so that when you redeem your investment it may be worth more or less than its original cost. Current month-end performance data, which may be lower or higher than the performance data quoted, may be obtained at fpa.com or by calling toll-free, 1‑800‑982‑4372.
Periods over one year are annualized. Fund performance is shown net of all fees and expenses and includes the reinvestment of distributions. Returns do not reflect the deduction of taxes that a shareholder would pay on Fund distributions, which would lower these figures. Since Source Capital is a closed-end investment company and its shares are bought and sold on the New York Stock Exchange, your performance may also vary based upon the market price of the common stock. Comparison to any index is for illustrative purposes only. An investor cannot invest directly in an index. The Fund does not include outperformance of any index or benchmark in its investment objectives.
2
SOURCE CAPITAL
LETTER TO SHAREHOLDERS
DEAR SHAREHOLDER:
Performance Overview
Source Capital’s (“Source” or “Fund”) net asset value (NAV) gained 5.49% for the quarter and 14.70% for the trailing twelve months. It captured 94.7% of the return of the balanced MSCI ACWI/Bloomberg US Agg index, the Fund’s primary illustrative benchmark, over the trailing twelve months. The Fund’s risk exposure is nearly balanced between Equities and Credit.
Performance versus Illustrative Indices (%)1
Return | ||||||||||||
Q2 2026 | Trailing 12-month | Yield* | ||||||||||
Source Capital—NAV | 5.49 | 14.70 | 5.05 | |||||||||
Source Capital—Market Price | 0.59 | 13.07 | 5.44 | |||||||||
60% MSCI ACWI / 40% BBG US Agg | 9.15 | 15.53 | 2.76 | |||||||||
60% S&P 500 / 40% BBG US Agg | 9.31 | 14.76 | 2.51 | |||||||||
Portfolio Exposure (%)2
Q2 2026 | |||||
Equity | |||||
Common Stocks | 46.3 | ||||
Total Equity | 46.3 | ||||
Credit | |||||
Public | 7.7 | ||||
Private (invested assets only) | 21.0 | ||||
Total Credit | 28.7 | ||||
Other Limited Partnerships | 3.9 | ||||
Other | 0.1 | ||||
Cash and equivalents | 21.1 | ||||
Total | 100 | ||||
3
SOURCE CAPITAL
Portfolio Discussion3
Equity
With respect to the recent performance of the Fund, in the previous twelve months, Source’s top five equity performers contributed 6.67% to its return while its bottom five contributed ‑1.98%.
Trailing Twelve-Month Top and Bottom Contributors (%) as of June 30, 20264
Top | Performance | Percent of | Bottom | Performance | Percent of | |||||||||||||
Alphabet | 2.36 | 3.4 | Comcast | ‑0.49 | 1.7 | |||||||||||||
Analog Devices | 1.52 | 2.6 | Aon | ‑0.46 | 1.6 | |||||||||||||
Citigroup | 0.98 | 0.9 | Charter Communications | ‑0.40 | 0.2 | |||||||||||||
TE Connectivity | 0.98 | 1.7 | Fortune Brands | ‑0.31 | 0.4 | |||||||||||||
Glencore | 0.83 | 2.2 | CarMax | ‑0.31 | 1.3 | |||||||||||||
6.67 | 10.8 | ‑1.98 | 5.3 | |||||||||||||||
The following companies impacted portfolio performance but have not been recently discussed.5
Analog Devices (“ADI”), a leading supplier of analog and mixed-signal semiconductors, benefited mostly from strong demand tied to AI infrastructure, industrial automation, and communications equipment. During the quarter, shares rose after ADI reported record quarterly results, including 37% year-over-year revenue growth, expanding margins, and management pointing to record bookings across several end markets. Investors were further encouraged by the company’s announced acquisition of Empower Semiconductor (closed in early July) and guidance for continued growth into the second half of the year.
We have discussed our exposure to cable broadband providers, through holdings in Comcast and Charter/Liberty Broadband in the past. Still, the stocks continue to see pressure as fiber and fixed wireless operators take share. Heading into 2020, both stocks had a strong run as residential broadband demand increased when people were forced to work from home. Since that time, shares have sold off and now trade at historically depressed valuations against a backdrop of strong FCF generation and share repurchases. While we aspire to own growing businesses at reasonable valuations, there will periodically also be room in a diversified portfolio for small positions that trade at cheap multiples and reasonable business prospects, which both Comcast and Charter fit at present.
Looking at the broader market, in the six months ending June 30th, equity markets delivered strong returns (11.25% for the ACWI and 10.21% for the S&P 500) and became increasingly narrow. Exciting AI capabilities and data center supply shortages drove the market and economic activity. We continued to find opportunities in attractive mid-sized companies that are largely AI and data center-agnostic.
4
SOURCE CAPITAL
The following pictures illustrate the market’s narrowness as seen in the indices.
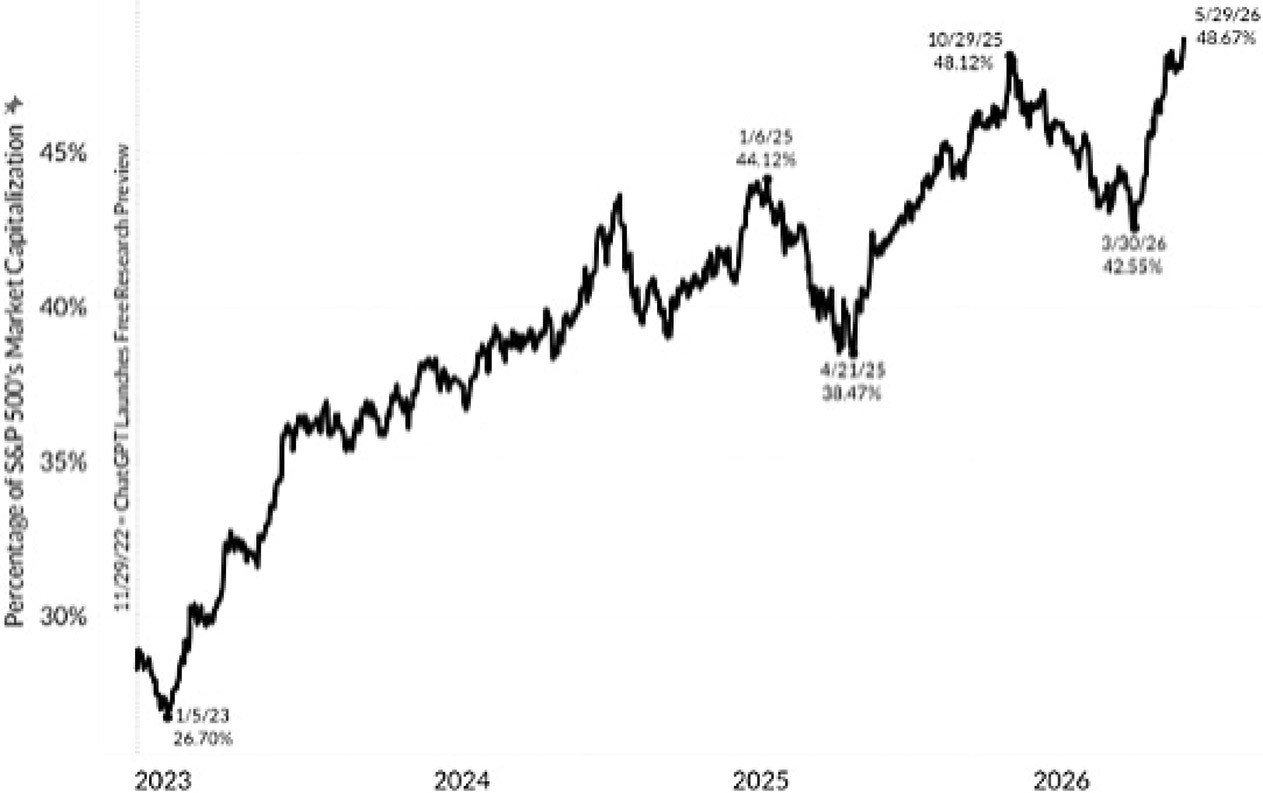
AI-related stocks have captured investors’ minds and wallets, driving the majority of recent stock market returns and, by some counts, accounting for 50% to more than 75% of the S&P 500’s total gains since late 2022.6 According to J.P. Morgan, “AI” companies now constitute approximately 50% of the S&P 500, exceeding even the Information Technology sector’s 35% weight at the then S&P 500 peak in March of 2000.
Weighting of AI-Related Companies in the S&P 500 Index7
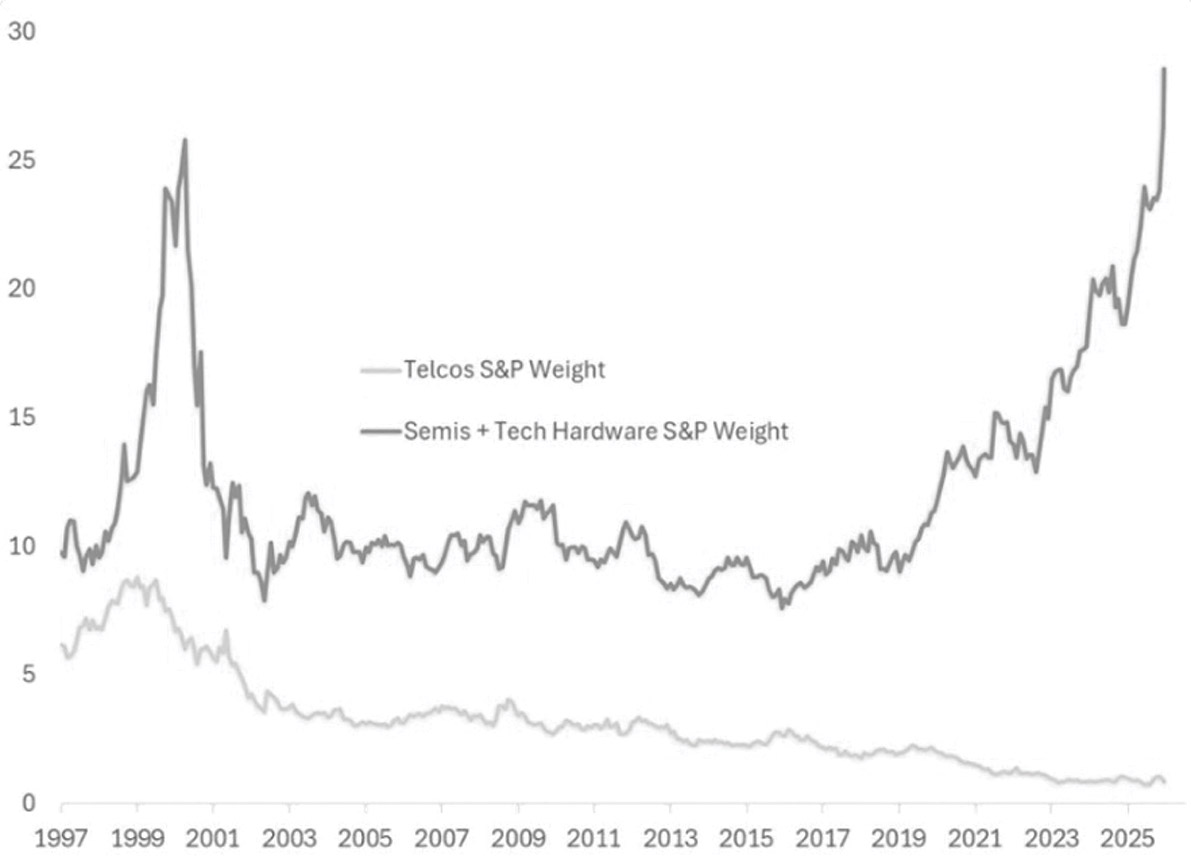
Semiconductors and tech hardware now represent nearly 30% of the market, the highest level recorded.
Weighting of Tech Hardware Companies in the S&P 500 Index8
5
SOURCE CAPITAL
Over the last six months, semiconductors and tech hardware accounted for nearly 90% of the S&P 500 Index’s return.9
Until very late in the second quarter, momentum had been the strongest indicator/driver of returns and relatively more pronounced than in the past.
Ratio of US Momentum stocks to US Minimum Volatility stocks10
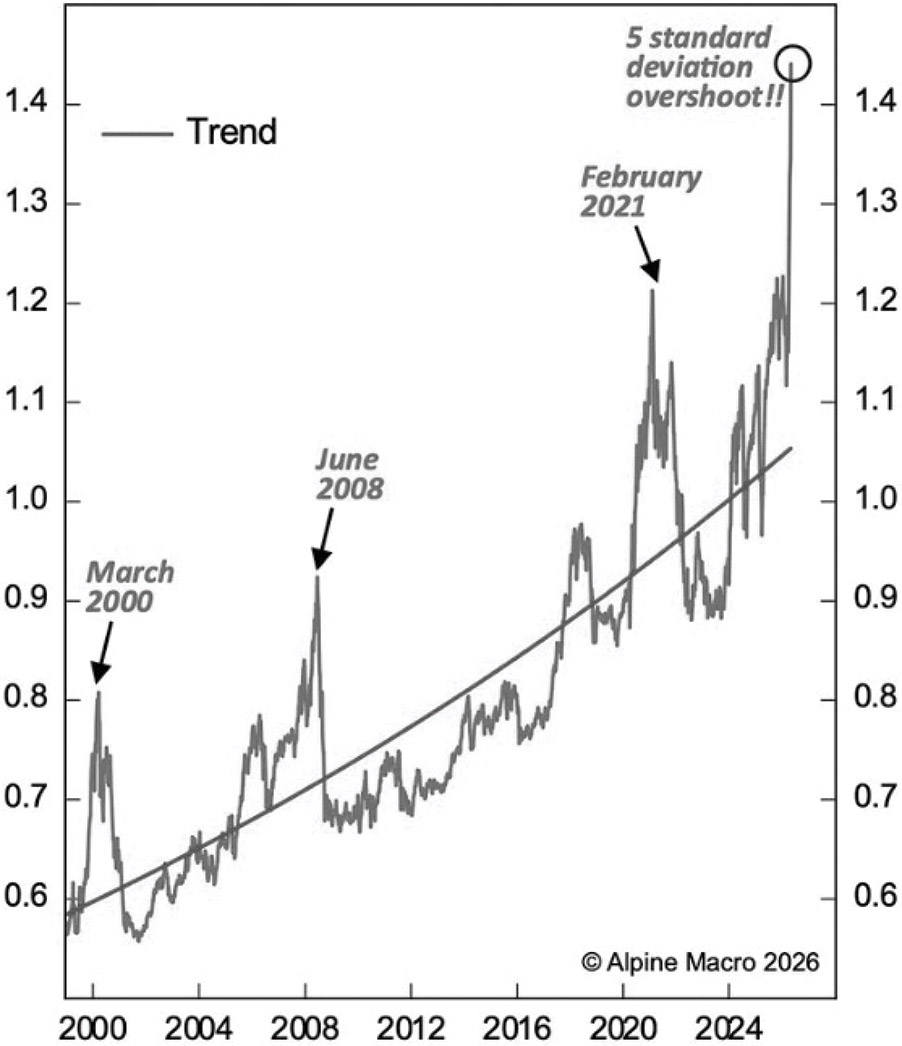
From many vantage points, the market, as expressed by the indices, is quite narrow.
Good reasons underpin the market’s narrowness. Progress in AI, first with OpenAI/ChatGPT and more recently with Anthropic/Claude/Mythos, has provided a credible peek into a future in which humans will massively increase productivity. If one squints, we can imagine machines embedded with intelligence that allow humans to enjoy a substantial surplus of necessary goods/service/comforts without requiring traditional physical/mental labor. While some technologies are speculative and others will take decades to diffuse, the potential is real and probable. If you need convincing, try a Waymo during your next visit to Los Angeles.
Rapid adoption of large language models (LLMs), facilitated by ubiquitous access to smart devices and fear of being left behind, has led to an epic boom for the suppliers of picks and shovels to the AI (datacenter) buildout.
To date, the boom has exceeded expectations. At year-end 2024 investors were generally bullish on Nvidia, ChatGPT had been introduced two years earlier. Nvidia had seen its revenue increase by 4x, and stock increase 6x since the introduction of ChatGPT. Despite being a well-recognized beneficiary of AI-led chip demand, analysts materially underestimated Nvidia’s near-term performance. At year-end 2024, analysts expected 2026 revenue of $130‑150bn. Run-rate will be closer to $400bn.11 To date, the correct call on fundamentals has been to be more bullish than the bulls.
Nvidia is not alone; semiconductor revenue is through the roof, and the memory market has developed an acute shortage.
6
SOURCE CAPITAL
Monthly Global Semiconductor Billings ($ billions)12
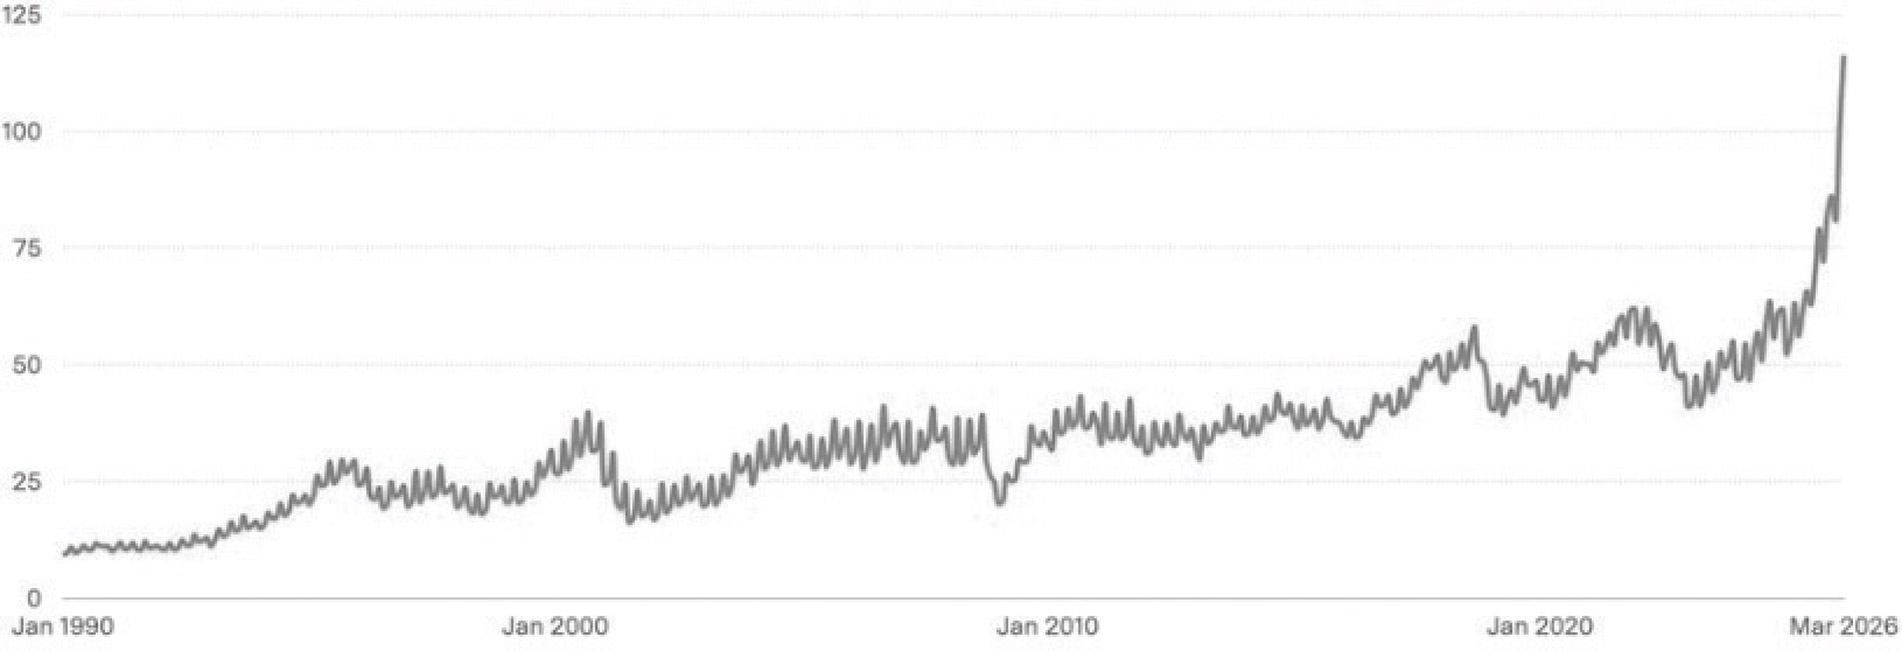
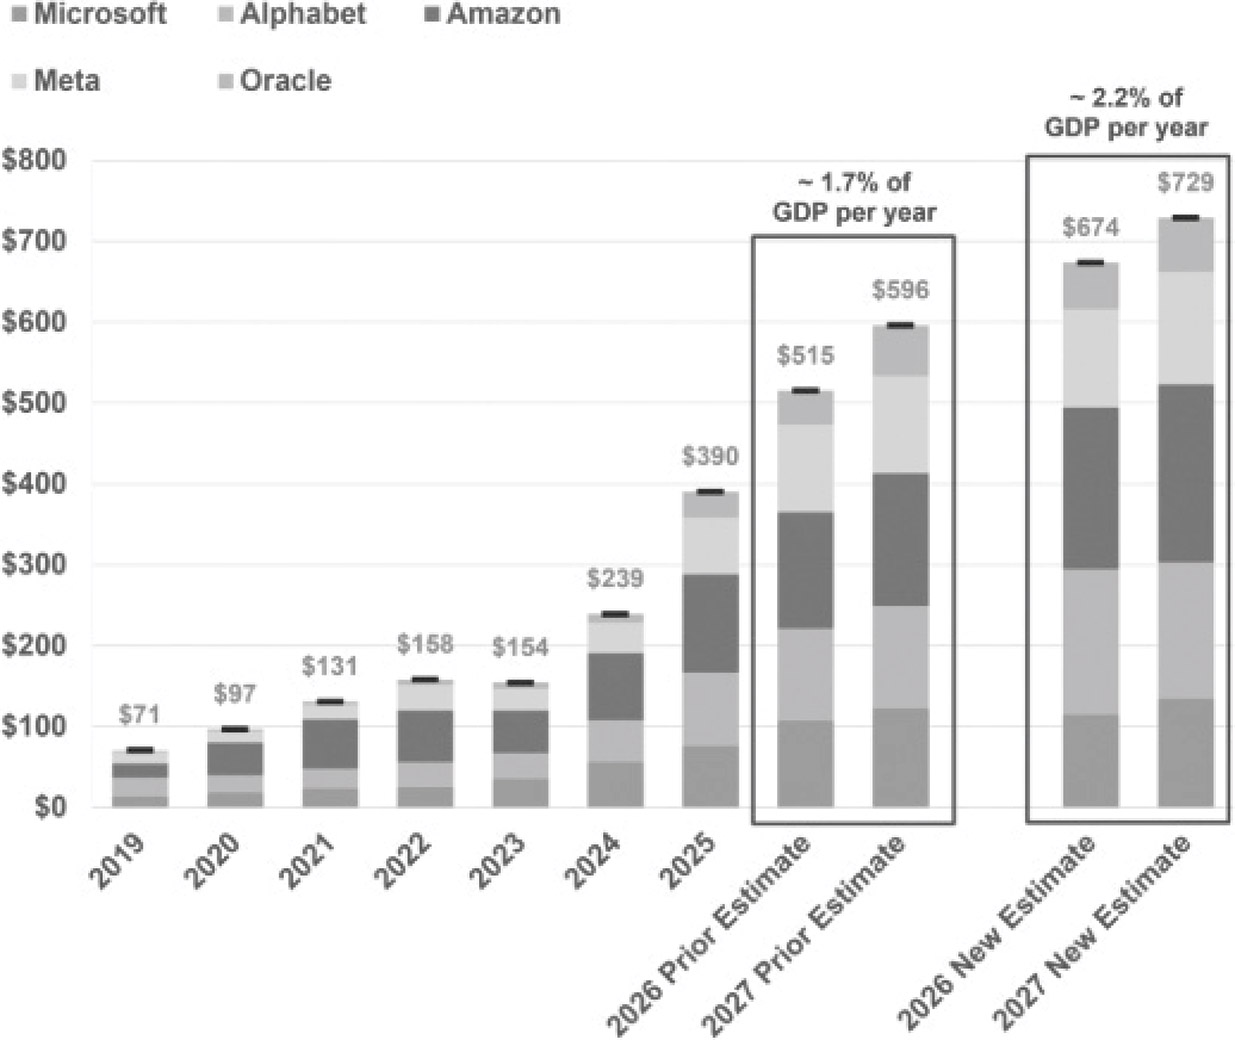
This spending is primarily supported by the hyperscalers.
Big Tech Capital Expenditures ($ billions)13
7
SOURCE CAPITAL
This capital spending comes from cash generated by strong businesses that have seen revenues accelerate over the past few years. More recently, the baton has been passed to the capital markets through both debt and equity issuance. There is some circularity to this activity, but the vortex of activity is real and well-financed (to date).
As of today, there appears to be no limit to demand for compute/data centers, which is a good thing because supply is coming.
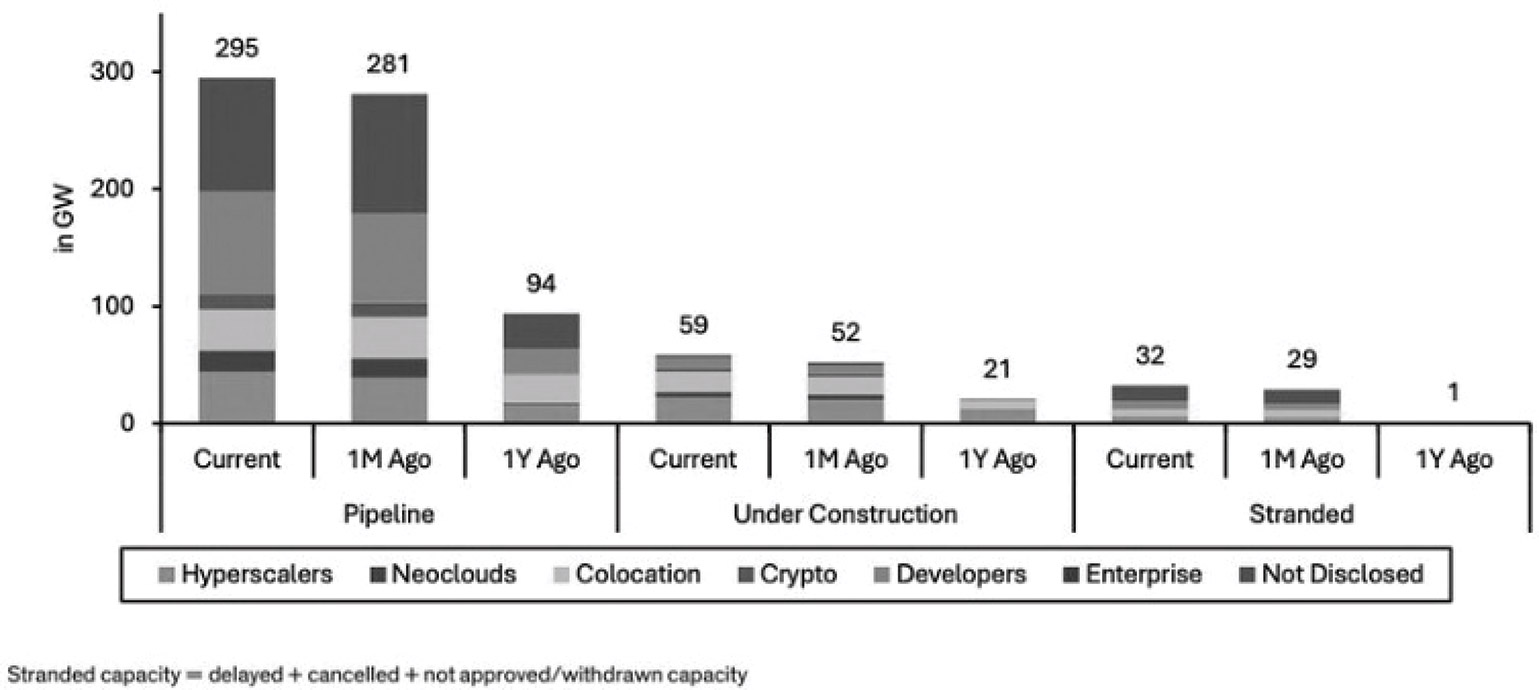
The US had 40‑53 GW of installed capacity at the beginning of 2026 and should double to 95 GW by the end of 2027.14 As shown below, the total pipeline is nearly 300 GW. There are well-known limits around permitting, power supply, semi/memory and other materials, so substantially less than the pipeline will be delivered, but it appears likely that capacity will multiply in the next few years.
Data Center Capacity by Stage (in GW)15
And that’s just on Earth. SpaceX went public in the second quarter at a $1.8T valuation. SpaceX is an awe-inspiring firm and has a credible claim to being the most consequential company on the planet. Still, according to sell-side reports, most of its IPO value is attributable to its speculative promise to build data centers in space. According to Elon, the company will deliver an additional 1 GW per year of capacity in 2027, 10 GW per year beginning in 2028, 100 GW per year beginning in 2030 and eventually 1 TW per year. That’s a lot, and the company appears entirely serious about these intentions, given their active building of mega facilities to supply the necessary equipment.
It appears that, on Earth or in space, the market has confidence (based on valuations of the various businesses pursuing/benefiting from the build-out) that significant compute capacity will be delivered over the next few years. We can’t help but wonder what the returns will be on all this compute spend? Could compute capacity exceed AI’s ability to diffuse usefully through the economy? Currently, the market for compute is in backwardation, with forward 12-to‑24-month prices 30 to 40% below the spot price (on, as best we can tell, a like-for-like unit). We are also struck by the recent contracts that SpaceX signed with Google and Anthropic for scaled compute capacity immediately available at prices 2 to 5x estimates of the long-term cost, but cancelable with 90-day notice.
8
SOURCE CAPITAL
We are bullish on AI and compute demand, but not more bullish than the bulls, and don’t feel that the market is offering us any easy question in the AI/hardware space.
Difficult Questions
Given the exciting future and economic importance of AI, we spend time using, reading, and thinking about the technology, its near-term impact, and longer-term potential. Currently, we have more questions than answers and must admit that, mostly, we just don’t know.
A recent Invest Like the Best podcast, titled “The Cone of Uncertainty” with Krishna Rao, Anthropic’s CFO, neatly captures our feelings. During the discussion, Rao said, “We think about the world as scenarios. It’s very hard to have a point estimate in this business. And then having a very low bar for updating your current priors, or your current perspective. It could be the case that something a month ago was true that’s just not true today, and that breaks your model, and you have to go back and update it.”
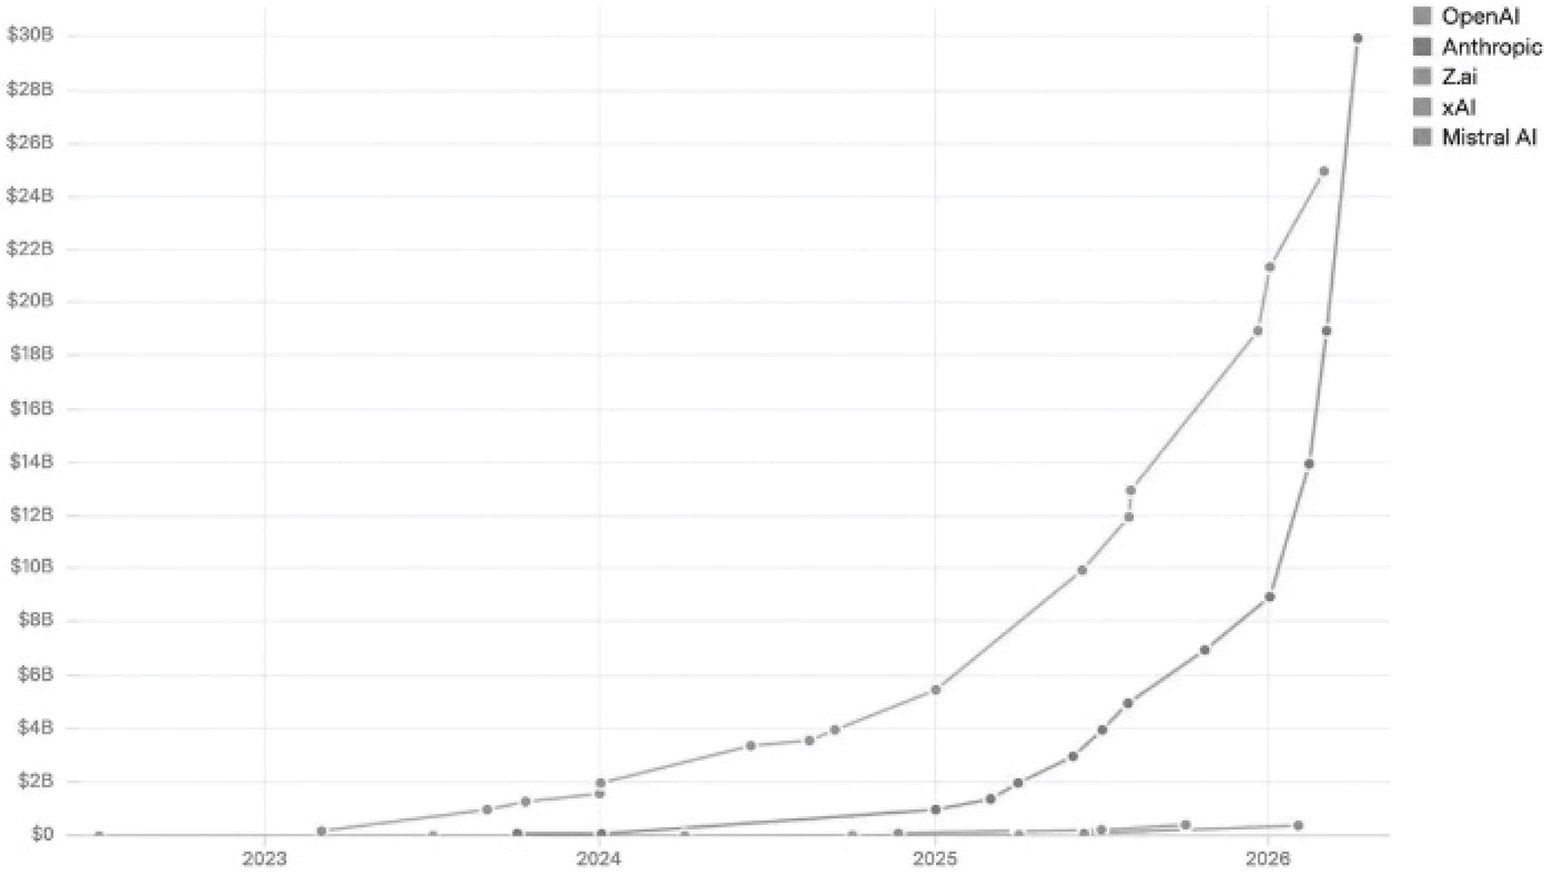
Thus far, all updates—capabilities, revenue, and compute demand—have been positive. Should we expect all future updates to be as favorable? And, has OpenAI had a somewhat different experience in the past six months? In early 2025, OpenAI appeared to be the clear leader among independent frontier labs; today, not so clear.
Annualized Revenue (USD)16
Will frontier lab leadership prove persistent or fleeting? The following chart suggests fleeting.
9
SOURCE CAPITAL
Selected Frontier LLMs by Aggregate Benchmark Score17
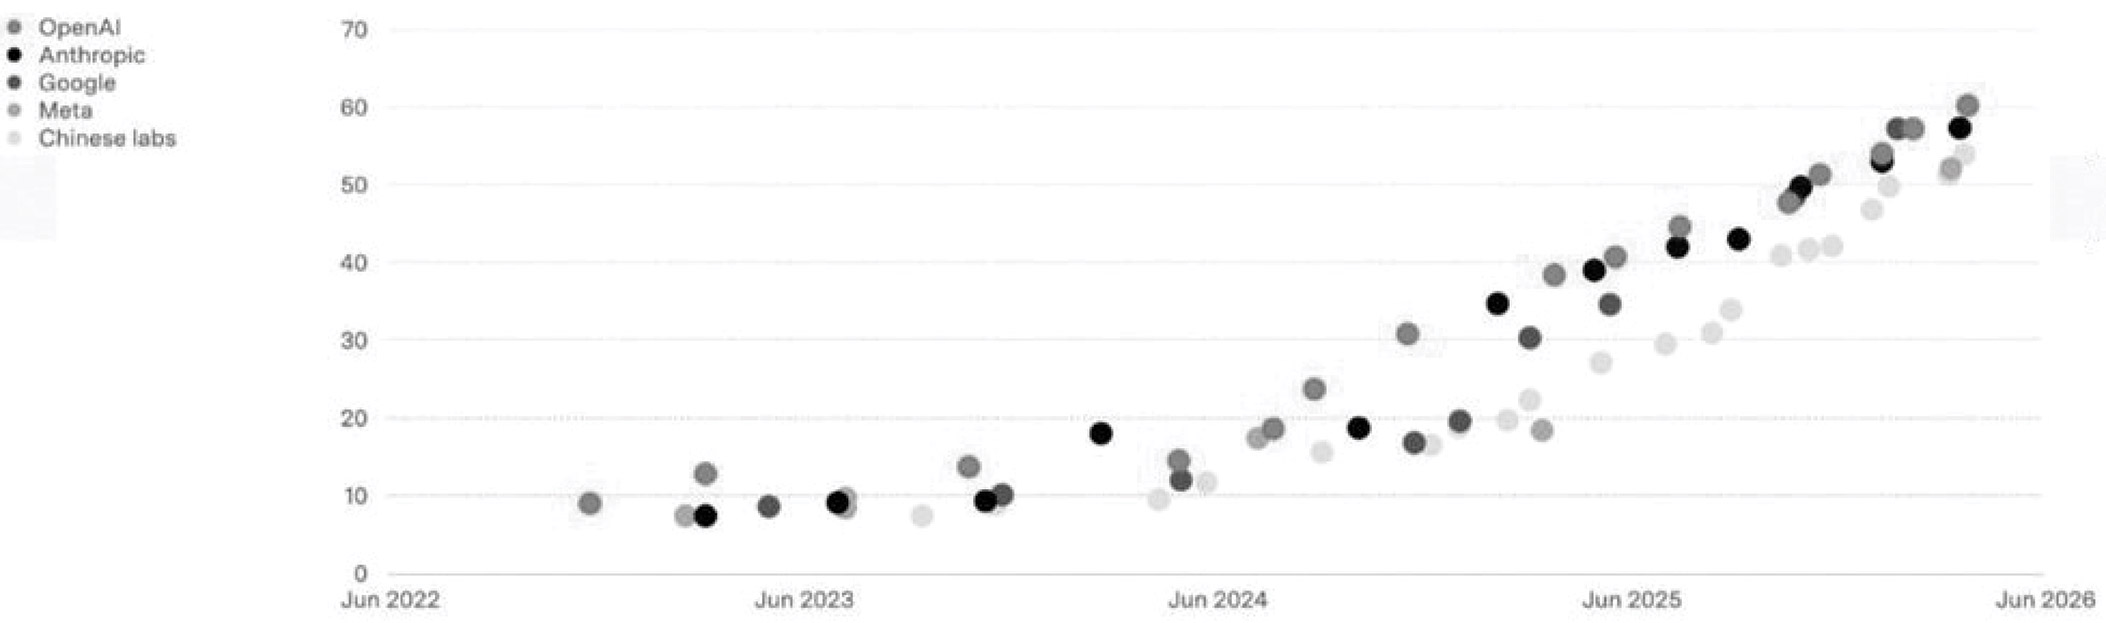
If fleeting, what is the long-term economic return to frontier lab innovation? Where will the economics stick?
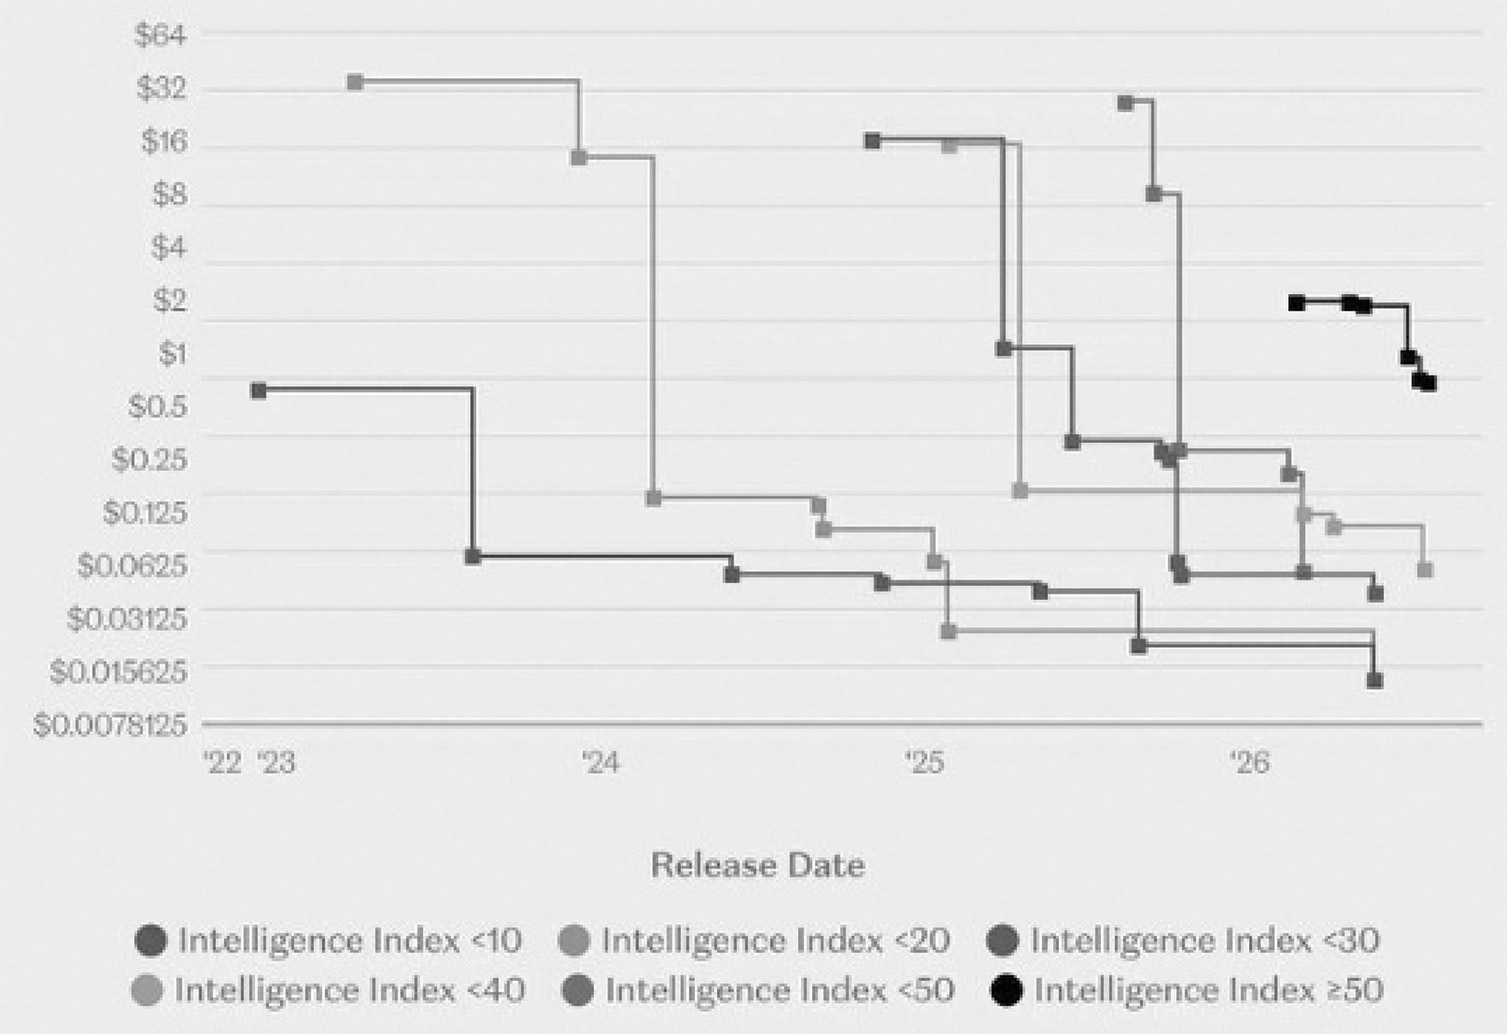
Perhaps leadership will be persistent, and if it is, will economic value accrue to the leader, or to the low-cost, slight laggard? Or to some other level of the stack? The following suggests that lagging models (open-source and low-cost) catch up quickly and cost a fraction of the frontier.
Language Model Inference Price ($/million tokens), by Model Intelligence18
10
SOURCE CAPITAL
Various reports suggest that companies are moving away from frontier models as costs become uneconomic relative to the value delivered. What activities require genuine frontier or super intelligence? At maturity, how much of the ‘intelligence layer’ can be served by good enough, low-cost commodity models?
Perhaps the most important near-term questions relate to the spend and sustainability of the data center buildout. Direct (semiconductors/memory) and indirect (power, building materials, commodities, engineering firms, and cooling business) beneficiaries are all experiencing massive tailwinds and driving both the economy and markets. The data center build is becoming large relative to GDP and relative to previous infrastructure buildouts.19,20
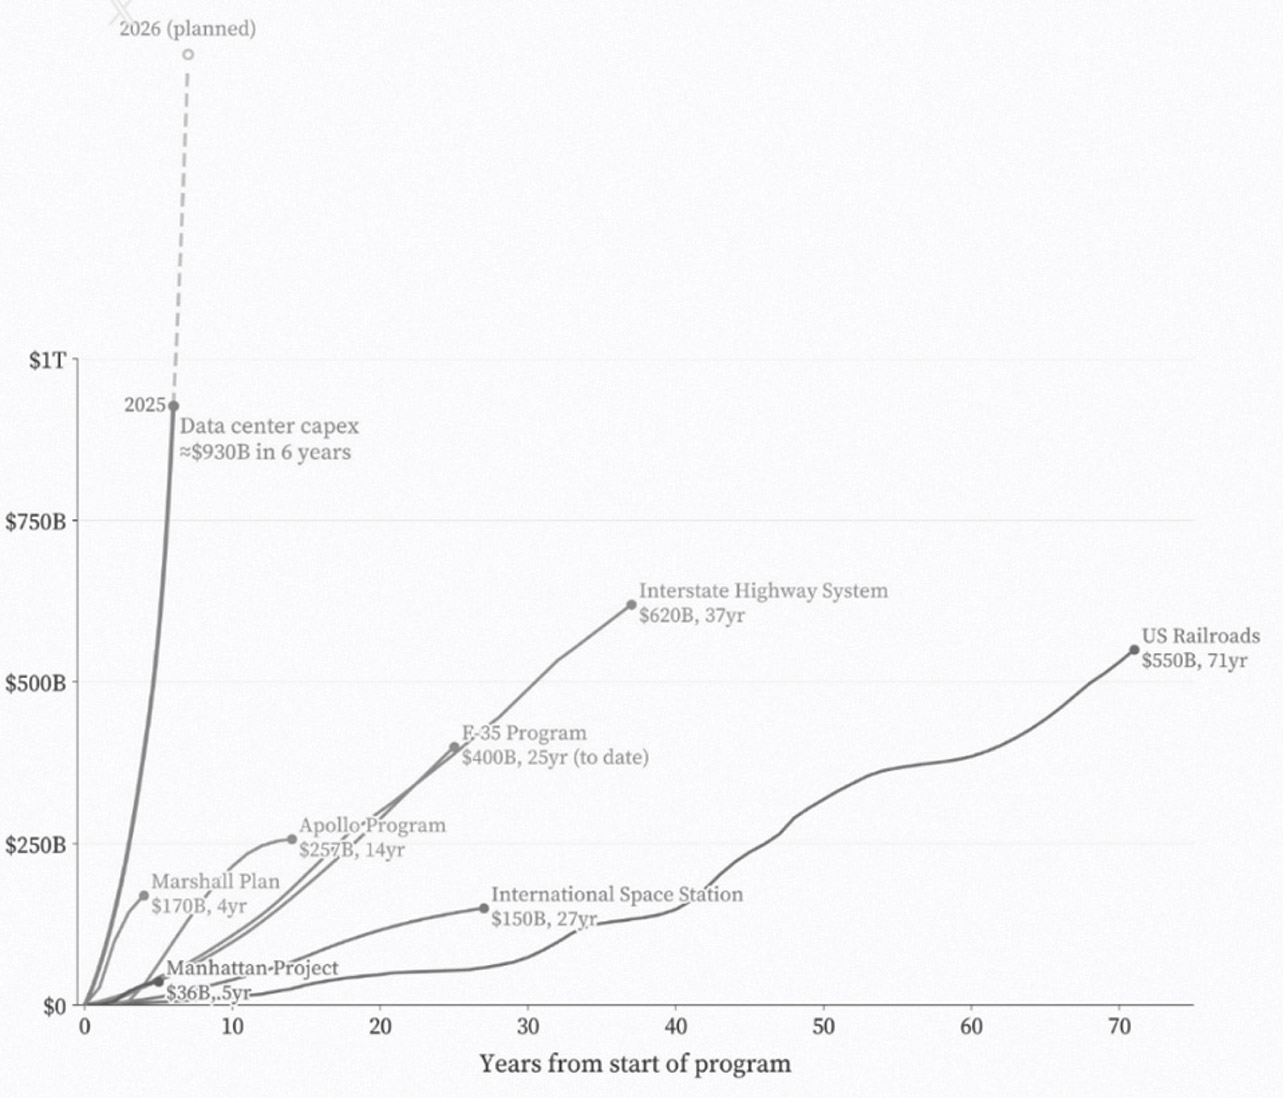
Some analysis proposes that the data center buildout is like nothing we have ever seen—multiples larger in inflation-adjusted terms than even the US railroad and interstate highway expansions of the 19th and 20th centuries.
Data Centers vs. Megaprojects Inflation-Adjusted Costs21
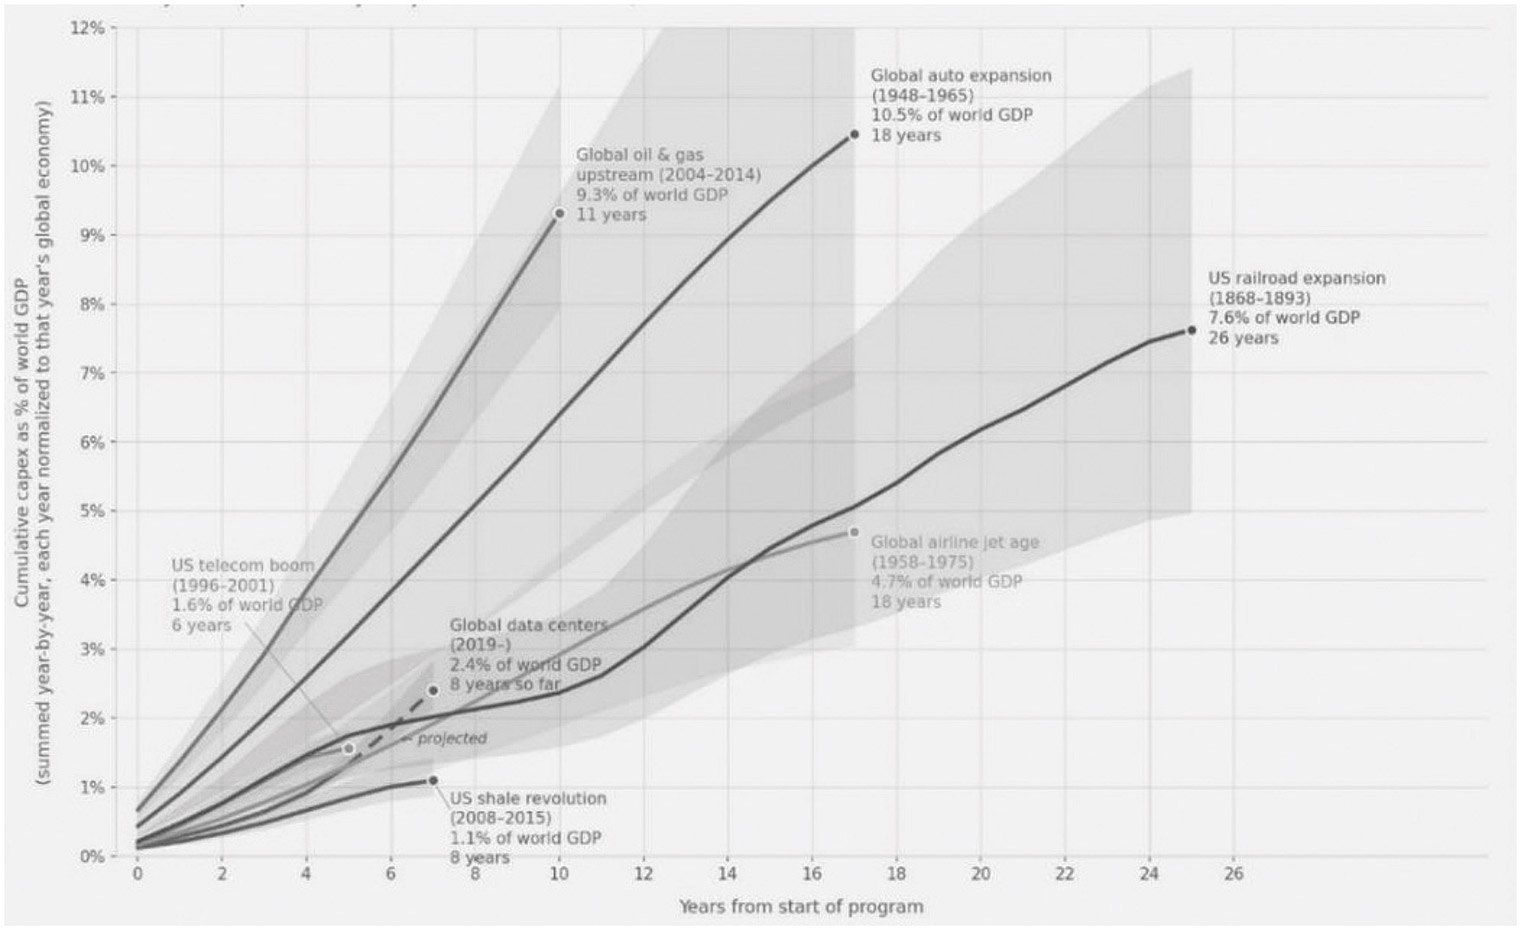
On the other hand, a slightly different lens supports the argument that the buildout is reasonably consistent with past large-scale fundamental infrastructure builds.
11
SOURCE CAPITAL
Infrastructure Buildout—Cumulative Capex as a Share of World GDP22
Even the data seems confused. If AI (and the robotic revolution it enables) ultimately satisfies all human needs without the need for traditional human labor, ‘Super-Abundance’, then, perhaps, historic precedents are irrelevant, and compute should represent a massive share of economic activity. But will there be a cycle in what is now a massively capital-intensive industry? And how do intelligence cycles work?
Together, these (and other) questions posed to long-term investors by the AI boom are difficult to answer. We are left uncertain about the sustainability of the current and projected level of AI capital spending and the prospect of it generating reasonable returns on the aggregate investment. Global spending influenced by AI is projected to skyrocket to a record $2.59 trillion in just this year. To achieve even a relatively low unlevered return on investment suggests (an improbable?) $207 billion in after-tax income, per year, starting immediately.23
In some important ways, AI is unique, and we have long invested in businesses that we believe are well positioned for the digital future. Many of the businesses we own (Semiconductors/Hyper-scalers/Connectors) benefit from robust tailwinds from data center expansion and compute utilization. On average, we have owned these companies for over a decade and currently believe that they will each be larger and more profitable 5 and 10 years from now. These businesses are diverse, serve markets beyond just datacenters, and are growing faster than we expected a few years ago. Given expanded valuations and the stage of their capital cycle (far from depressed), we are scaling back exposure because we believe the risk-adjusted returns are less attractive—the margin of safety is shrinking, if not disappearing. We have been more aggressive in exiting the names that have benefited most directly from compute shortages.
12
SOURCE CAPITAL
Given our excitement about the technology, strength of the companies’ positions and belief that compute demand will be greater over time, we think it is advisable to own a bit of the ‘future’ at a supportable (but potentially stretched valuation) should the capital cycle peter out.
AI is not the first theme markets have focused on that requires long-term investors to answer difficult questions in the affirmative. Since we have been managing our flagship Contrarian Value strategy, we recall the early web companies in the Dot-com era, Commodity Super-Cycle, EM Premium (remember the BRICs), MLP enthusiasm, SAAS, and Healthcare/Covid ‘winners’. In each of those cases, we generally avoided the theme based on what we viewed as unsustainable valuations at stretched points in the capital cycle.
Our strategy is similar in the current environment. We seek investments that are asking long-term investors easier questions. Today, we have the opportunity to buy businesses we consider relatively AI-agnostic businesses at valuations that support what we see as an attractive expected absolute return. In the first half of the year, we added 13 new companies and increased our holdings in several companies purchased last year. They fit nicely in the Venn diagram we shared at the end of last year, updated below through June.24
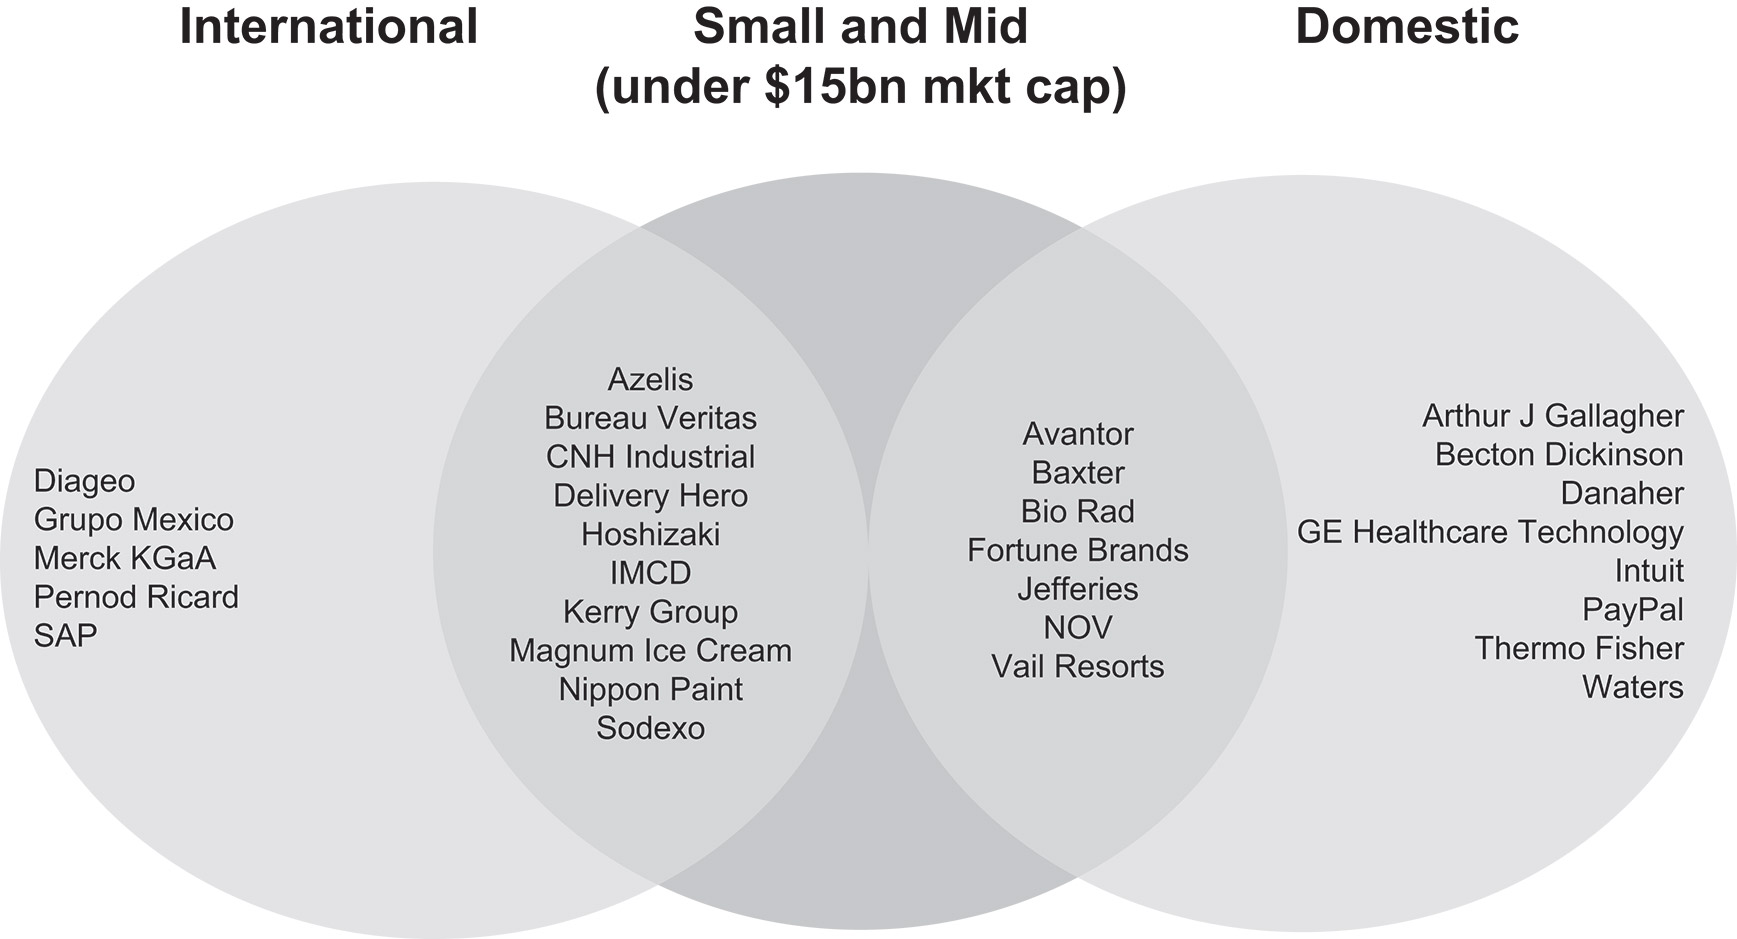
These businesses range from specialty chemical distribution to biotech equipment and were generally purchased at 10‑15x our estimate on NTM earnings. While significantly smaller than the index leaders, our recent purchases are industry leaders, with strong balance sheets and attractive growth profiles.
In fact, we believe the generic profile of our portfolio has improved—faster growth and reasonable valuation.
13
SOURCE CAPITAL
Price/Earnings | Price/Book | 3-Year Forward Estimated | |||||||||||||||||||
As of June 30, 2026 | 6/30/2025 | 6/30/2026 | 6/30/2025 | 6/30/2026 | 6/30/2025 | 6/30/2026 | |||||||||||||||
Source Capital |
Long Equity Portfolio | 16.1x | 16.0x | 2.0x | 2.2x | 23% | 25% |
MSCI ACWI | 18.6x | 17.7x | 3.3x | 3.9x | 13% | 18% |
S&P 500 | 22.1x | 20.4x | 5.1x | 5.6x | 14% | 19% |
vs. MSCI ACWI | ‑14% | ‑10% | ‑39% | ‑44% | 78% | 37% |
vs. S&P 500 | ‑27% | ‑22% | ‑61% | ‑62% | 65% | 30% |
In our view, a portfolio of the companies in the Venn diagram (at our basis) we believe is likely to produce sound returns. This is the type of portfolio we are always striving to create: a diversified mix of high-quality businesses, with good management, purchased at valuation math based on conservative assumptions that should support competitive performance over the long term.
These holdings are primarily mid-cap businesses that look nothing like the index. We are willing to look foolish relative to others and to miss out on the bullish scenarios for AI in order to own a portfolio that we believe is highly likely to result in an acceptable absolute result.
Being out of step is nothing new. You may remember the healthcare/biotech boom that took place in 2020 and 2021. At the time, we had taken our exposure to zero—down from our largest exposure at the time of Obamacare concerns in the early 2010s (in the reference strategy, FPA Contrarian Value). We recall being asked repeatedly whether we understood that there was an exciting future in biotech and cell and gene therapy.
In fact, we were excited, but just not at the prices available at the time. We continued to research the sector and developed a view towards a number of businesses we’d like to own. In the past year we have bought many of those very same businesses at valuations less than half the prevailing rate in 2020/21, and we submit that the future is just as bright and perhaps enhanced by potential AI innovation. Willingness to ignore investments with terrific momentum at valuations and long-term fundamentals that ask difficult questions (Will Covid spending be sustainable? Are these new multiples reflective of fundamentally different businesses?), combined with actively deploying capital when fundamentals and valuation are supportive of equity-like returns, will always be our preferred approach. However, we accept the risk of looking foolish at times and humbly settle for reasonable absolute returns when parts of the market are delivering spectacular returns based on thinking that we don’t quite understand.
In short, we are seldom more bullish than the bulls. Though when analysis and consideration support the position, we are happy to be less bearish than the bears, which we believe should continue to help us generate returns that are attractive on an absolute basis and not risk taking the Fund (and you) off a cliff.
Fixed Income
Traditional
Risk-free rates remain high, but the price of credit risk appears very expensive. That led us to own little credit risk.
Spread measures the compensation that debt investors receive for an uncertain return profile. Treasuries are considered the “risk-free” asset because the market views it as a certainty (or near certainty) that Treasuries will be repaid in full at maturity with no possibility of prepayment, extension of payment, or haircut to the amount owed (at least in nominal terms). In comparison, most everything else with a similar expected maturity bears a higher yield than Treasuries because other types of debt may be repaid early, late, or not at all, and that difference in yield versus Treasuries is the spread.
A big driver of whether and when debt is repaid (in addition to call or extension features) is the credit quality of the borrower. Viewed through that lens, spread can be seen as the compensation that debt investors receive for taking on credit risk—the risk that a borrower will not repay debt in full and/or by maturity. Over the past few months, spreads have decreased into historically low territory. In other words, the compensation for credit risk has decreased into historically low territory.
The chart and table below show yields and spreads on the Bloomberg U.S. Corporate High Yield Index and the BB component of that index, excluding energy. The latter is a measure of the high yield market that we believe provides a more consistent price comparison over time due to changes in the composition of the high yield market. Spreads in the high yield market ended the quarter at the fourth percentile (a lower percentile indicates a more expensive market, i.e., the compensation for credit risk is low). Said another way, historically 96% of the time spreads have been higher than they were at June 30.
14
SOURCE CAPITAL
Bloomberg U.S. Corporate High-Yield and BB ex. Energy Index Yield-To-Worst (YTW) and Spread25
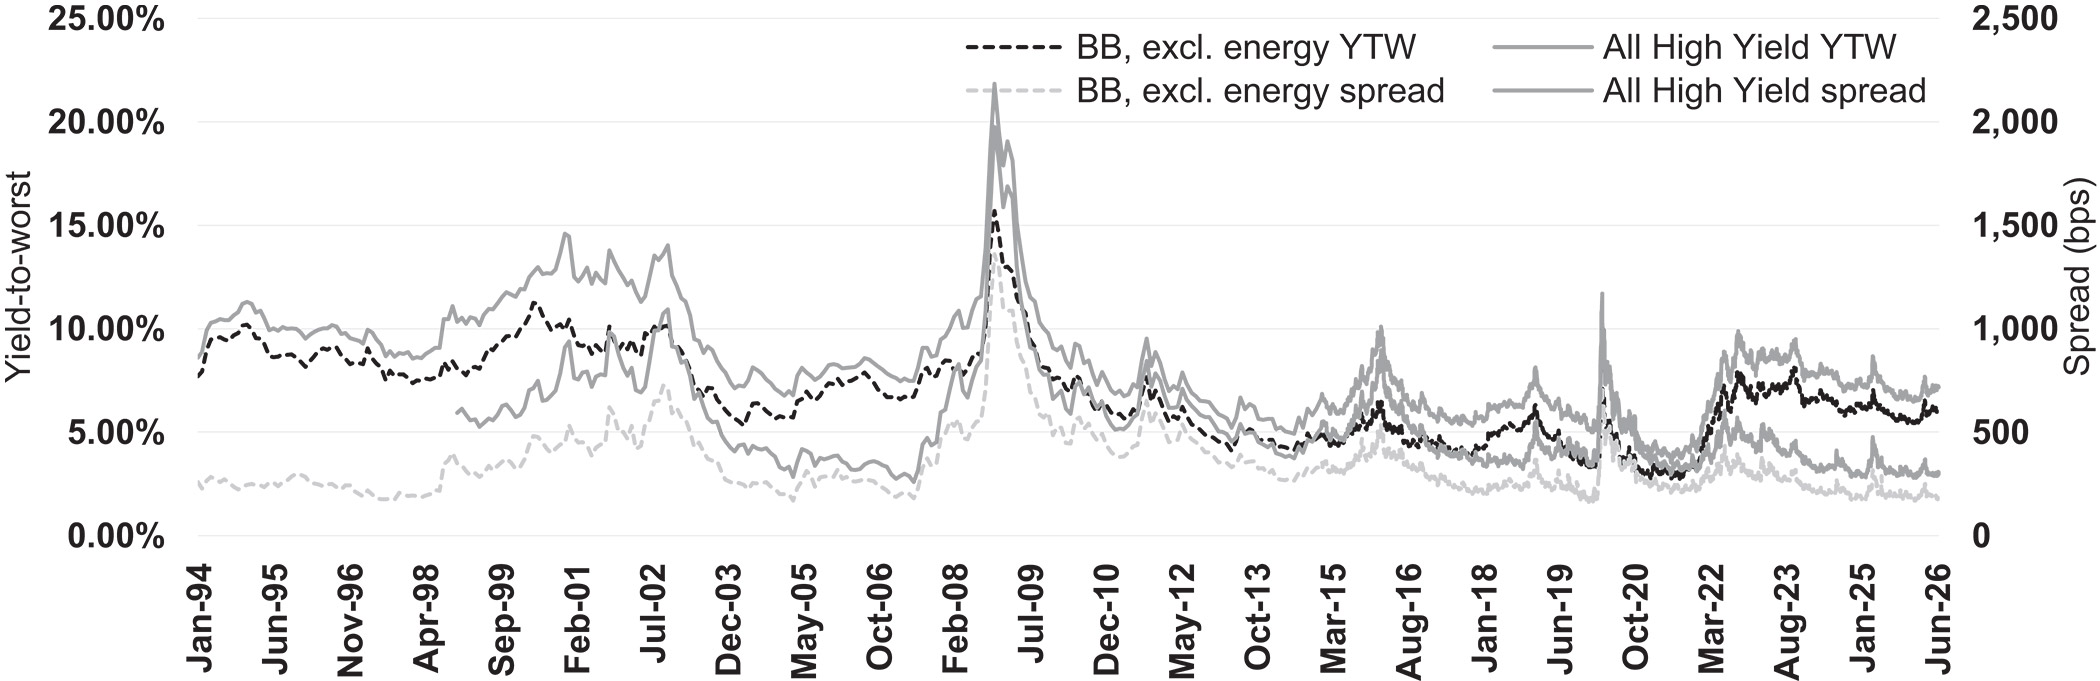
Spread | Percentile | ||||
All High Yield | 297 bps | 4% | |||
BB, ex. Energy | 183 bps | 4% | |||
The market is priced as if nothing could go wrong. We have concerns, but even if we didn’t, at historically low spreads, are we getting paid to find out that things are not going well? We do not think so. Due to such low spreads, when evaluating individual investment opportunities, more often than not we find that the compensation for credit risk is inadequate. Further, we believe that low spreads increase the likelihood and magnitude of a potential short-term drawdown related to an increase in spreads.
To be clear, we are not categorically waving off everything with a high yield rating. We make our decisions at the individual investment level. Repeating those decisions led us to low Credit exposure at the portfolio level. Some may not find this positioning exciting. We do. We are excited about not owning a portfolio laden with overpriced credit risk.
Lastly, our look through software-related exposure is 2.3% of the overall fund and we are not concerned about this exposure from an overall portfolio exposure or the credit quality of the individual bonds.
Private Credit
Source has 26.0% committed to private credit (including called and uncalled capital) as of quarter-end. We continue to look for opportunities to increase that exposure.
On the private side, our look through software-related exposure is approximately 0.3% of the overall fund and we are not concerned about this exposure either from an overall portfolio exposure.
Corporate & Other
Distribution
On July 21, 2026, the Fund’s Board approved maintaining the current rate of 20.83 cents per share for its regular monthly distribution through November 2026.26 This equates to an annualized unlevered distribution rate of 5.44% based on the Fund’s closing market price on June 30, 2026.
15
SOURCE CAPITAL
Discount to NAV
The Fund’s discount to NAV closed at 7.13% at quarter-end. The average discount to NAV for the trailing twelve months was 4.69%.27
Closing
We are grateful for the trust our investors continue to place in our disciplined approach to capital stewardship.
Respectfully submitted,
Source Capital Portfolio Managers
August 17, 2026
16
SOURCE CAPITAL
Important Information
This Commentary is for informational and discussion purposes only and does not constitute, and should not be construed as, an offer or solicitation for the purchase or sale with respect to any securities, products or services discussed, and neither does it provide investment advice. This Commentary does not constitute an investment management agreement or offering circular.
Current performance information is updated monthly and is available by calling 1‑800‑982‑4372 or by visiting fpa.com. Performance data quoted represents past performance, which is no guarantee of future results. Current performance may vary from the performance quoted. The returns shown for Source Capital are calculated at net asset value per share, including reinvestment of all distributions. Returns do not reflect the deduction of taxes that a shareholder would pay on Fund distributions, which would lower these figures. Since Source Capital is a closed-end investment company and its shares are bought and sold on the New York Stock Exchange, your performance may also vary based upon the market price of the common stock.
The Fund is managed according to its investment strategy which may differ significantly in terms of security holdings, industry weightings, and asset allocation from those of the comparative indices. Overall Fund performance, characteristics and volatility may differ from the comparative indices shown.
There is no guarantee the Fund’s investment objectives will be achieved. You should consider the Fund’s investment objectives, risks, and charges and expenses carefully before you invest. You can obtain additional information by visiting the website at https://fpa.com/fund/source-capital/, by email at crm@fpa.com, or toll-free by calling 1‑800‑279‑1241.
Effective January 1, 2025, Source Capital, Inc. was reorganized into a Delaware Trust. The Fund’s new name is Source Capital, but it continues to trade on the NYSE under the SOR ticker. There was no change in its investment objective, investment strategy, or fundamental investment policies. FPA continues to be the adviser to the Fund.
The views expressed herein and any forward-looking statements are highly speculative, current only as of the date of this publication and are those of the portfolio management team. Forward-looking statements can be identified by the use of terms such as “may”, “will”, “should”, “expect”, “anticipate”, “project”, “estimate”, “intend”, “continue” or “believe” (or the negatives thereof) or other variations thereof. Due to various risks and uncertainties, actual events or results or actual performance may differ materially and are subject to change at any time in response to changing circumstances and industry developments. This information and data has been prepared from sources believed reliable, but the accuracy and completeness of the information cannot be guaranteed and is not a complete summary or statement of all available data. FPA does not undertake to update any forward-looking statement because of new information, future developments, or otherwise.
Portfolio composition will change due to ongoing management of the Fund. References to individual financial instruments or sectors are for informational purposes only and should not be construed as recommendations by the Fund or the portfolio managers. It should not be assumed that future investments will be profitable or will equal the performance of the financial instrument or sector examples discussed. The portfolio holdings as of the most recent quarter-end may be obtained at fpa.com.
Investing in closed-end funds involves risk, including loss of principal. Closed-end fund shares may frequently trade at a discount (less than) or premium (more than) to their net asset value. If the Fund’s shares trade at a premium to net asset value, there is no assurance that any such premium will be sustained for any period of time and will not decrease, or that the shares will not trade at a discount to net asset value thereafter.
Capital markets are volatile and can decline significantly in response to adverse issuer, political, regulatory, market, or economic developments. It is important to remember that there are risks inherent in any investment and there is no assurance that any investment or asset class will provide positive performance over time.
The Fund may purchase foreign securities, including American Depository Receipts (ADRs) and other depository receipts, which are subject to interest rate, currency exchange rate, economic and political risks; these risks may be heightened when investing in emerging markets. Non-U.S. investing presents additional risks, such as the potential for adverse political, currency, economic, social or regulatory developments in a country, including lack of liquidity, excessive taxation, and differing legal and accounting standards. Non-U.S. securities, including American Depository Receipts (ADRs) and other depository receipts, are also subject to interest rate and currency exchange rate risks.
The return of principal in a fund that invests in fixed income instruments is not guaranteed. The Fund’s investments in fixed income instruments have the same issuer, interest rate, inflation and credit risks that are associated with underlying fixed income instruments owned by the Fund. Such investments may be secured, partially secured or unsecured and may be unrated, and whether or not rated, may have speculative characteristics. The market price of the Fund’s fixed income investments will change in response to changes in interest rates and other factors.
Generally, when interest rates go up, the value of fixed income instruments, such as bonds, typically go down (and vice versa) and investors may lose principal value. Credit risk is the risk of loss of principal due to the issuer’s failure to repay a loan. Generally, the lower the quality rating of an instrument, the greater the risk that the issuer will fail to pay interest fully and return principal in a timely
17
SOURCE CAPITAL
manner. If an issuer defaults, the security may lose some or all its value. Lower rated bonds, convertible securities and other types of debt obligations involve greater risks than higher rated bonds.
Mortgage-related and asset-backed securities are subject to prepayment risk, can be highly sensitive to changes in interest rates, and are subject to credit risk/risk of default on the underlying assets. Convertible securities are generally not investment grade and are subject to greater credit risk than higher-rated investments. High yield securities can be volatile and subject to much higher instances of default. The Fund may experience increased costs, losses and delays in liquidating underlying securities should the seller of a repurchase agreement declare bankruptcy or default.
The ratings agencies that provide ratings are Standard and Poor’s (“S&P”), Fitch, Moody’s, Kroll, DBRS, and any other nationally recognized statistical rating organization (“NRSRO”). Credit ratings range from AAA (highest) to D (lowest). Bonds rated BBB or above are considered investment grade (IG). Credit ratings of BB and below are lower-rated securities (junk bonds). High-yielding, non-investment grade bonds (junk bonds) (HY) involve higher risks than investment grade bonds. Bonds with credit ratings of CCC or below have high default risk.
Private placement securities are securities that are not registered under the federal securities laws and are generally eligible for sale only to certain eligible investors. Private placements may be illiquid, and thus more difficult to sell, because there may be relatively few potential purchasers for such investments, and the sale of such investments may also be restricted under securities laws.
The Fund may use leverage. While the use of leverage may help increase the distribution and return potential of the Fund, it also increases the volatility of the Fund’s net asset value (NAV), and potentially increases volatility of its distributions and market price. There are costs associated with the use of leverage, including ongoing dividend and/or interest expenses. There also may be expenses for issuing or administering leverage. Leverage changes the Fund’s capital structure through the issuance of preferred shares and/or debt, both of which are senior to the common shares in priority of claims. If short-term interest rates rise, the cost of leverage will increase and likely will reduce returns earned by the Fund’s common stockholders.
Value style investing presents the risk that the holdings or securities may never reach their full market value because the market fails to recognize what the portfolio management team considers the true business value or because the portfolio management team has misjudged those values. In addition, value style investing may fall out of favor and underperform growth or other styles of investing during given periods.
Distribution Rate
Distributions may include the net income from dividends and interest earned by fund securities, net capital gains, or in certain cases it may include a return of capital. The Fund may also pay a special distribution at the end of a calendar year to comply with federal tax requirements. All mutual funds, including closed-end funds, periodically distribute profits they earn to investors. By law, if a fund has net gains from the sale of securities, or if it earns dividends and interest from securities, it must pass substantially all of those earnings to its shareholders or it will be subject to corporate income taxes and excise taxes. These taxes would, in effect, reduce investors’ total return. First Pacific Advisors, LP does not provide legal, accounting, or tax advice.
The Fund’s distribution rate may be affected by numerous factors, including changes in realized and projected market returns, Fund performance, and other factors. There can be no assurance that a change in market conditions or other factors will not result in a change in the Fund’s distribution rate at a future time.
Index Definitions
Comparison to any index is for illustrative purposes only and should not be relied upon as a fully accurate measure of comparison. The Fund may be less diversified than the indices noted herein and may hold non-index securities or securities that are not comparable to those contained in an index. Indices will hold positions that are not within the Fund’s investment strategy. Indices are unmanaged and do not reflect any commissions, transaction costs, or fees and expenses which would be incurred by an investor purchasing the underlying securities and which would reduce the performance in an actual account. You cannot invest directly in an index. The Fund does not include outperformance of any index in its investment objectives.
Bloomberg U.S. Aggregate Bond Index provides a measure of the performance of the US investment grade bonds market, which includes investment grade US Government bonds, investment grade corporate bonds, mortgage pass-through securities and asset-backed securities that are publicly offered for sale in the United States. The securities in the Index must have at least 1-year remaining in maturity. In addition, the securities must be denominated in US dollars and must be fixed rate, nonconvertible, and taxable.
MSCI ACWI NR USD Index (MSCI ACWI) is an unmanaged free float-adjusted market capitalization weighted index that is designed to measure the equity market performance of developed and emerging markets. Net Return (NR) indicates that withholding taxes are applied to dividend reinvestments. MSCI uses the withholding tax rate applicable to non-resident institutional investors that do not benefit from double taxation treaties.
18
SOURCE CAPITAL
Standard & Poor’s 500 Stock Index (S&P 500) is a capitalization-weighted index which covers industrial, utility, transportation and financial service companies, and represents approximately 75% of the New York Stock Exchange (NYSE) capitalization and 30% of NYSE issues. The S&P 500 is considered a measure of large capitalization stock performance.
60% MSCI ACWI / 40% BBG U.S. Aggregate Bond Index is a hypothetical combination of unmanaged indices and comprises 60% MSCI ACWI Index and 40% Bloomberg U.S. Aggregate Bond Index.
60% S&P500 / 40% BBG U.S. Aggregate Bond Index is a hypothetical combination of unmanaged indices and comprises 60% S&P 500 Index and 40% Bloomberg U.S. Aggregate Bond Index.
Bloomberg U.S. High Yield Index measures the market of USD-denominated, non-investment grade, fixed-rate, taxable corporate bonds.
Bloomberg U.S. High Yield BB ex Energy Index measures the market of USD-denominated, non-investment grade, fixed-rate, taxable BB-rated corporate bonds excluding energy sector.
Glossary of Terms
Capital expenditures (CapEx) are the funds companies allocate to acquire, upgrade, and maintain essential physical assets like property, technology, or equipment, crucial for expanding operational capacity and securing long-term economic benefits.
Credit is defined as investments rated BBB or lower, including non-rated investments.
Discount to Net Asset Value (NAV) is a pricing situation when a closed-end fund’s market trading price is lower than its daily net asset value (NAV).
Dividend Yield is the dividend per share divided by the price per share.
Equity-like returns refer to long-term returns that are comparable to those generated by equity markets.
Earnings Per Share (EPS) is calculated as a company’s profit divided by the outstanding shares of its common stock.
High-Yield (HY) Bond is a high paying bond with a lower credit rating than investment-grade corporate bonds, Treasury bonds and municipal bonds. Because of the higher risk of default, these bonds pay a higher yield than investment grade bonds.
Investment Grade (IG) is a rating that indicates that a bond has a relatively low risk of default.
Market Capitalization refers to the total dollar market value of a company’s outstanding shares of stock. Commonly referred to as “market cap,” it is calculated by multiplying the total number of a company’s outstanding shares by the current market price of one share.
Market Price is the price at which investors may purchase or sell shares of Source Capital, which is an exchange-traded closed-end fund. Market price is determined in the open market by buyers and sellers, based on supply and demand. The difference between the market price and the NAV (Premium/Discount) is expressed as a percentage of NAV.
Net Asset Value (NAV) is the market value of one share of the Fund. The NAV is calculated by subtracting the Fund’s liabilities from the value of the Fund’s total assets and dividing it by the number of the Fund’s outstanding shares.
On-the-run Treasuries are the most recently issued U.S. Treasury bonds, notes, or bills of a specific maturity and can serve as benchmarks for pricing other financial instruments.
Price/Earnings Ratio (P/E) is the price of a stock divided by its earnings per share. P/E is using weighted harmonic averaging, which helps avoid extreme results that may occur due to small relative numbers, and excludes Real Estate Investment Trusts (REITs). 12-Month Trailing P/E is based on the last 12 months of actual earnings. 12-Month Forward P/E utilizes forward earnings expectations over the next 12 months to calculate the ratio.
Risk-free rate of return is the theoretical rate of return of an investment with zero risk. The risk-free rate represents the interest an investor would expect from an absolutely risk-free investment over a specified period of time.
Spread reflects the quoted spread of a bond that is relative to the security off which it is priced, typically an on-the-run treasury.
Yield is the discount rate that links the bond’s cash flows to its current dollar price.
Yield to Worst (YTW) is presented gross of fees and reflects the lowest potential yield that can be received on a debt investment without the issuer defaulting. YTW considers the impact of expected prepayments, calls and/or sinking funds, among other things. Average YTW is based on the weighted average YTW of the investments held in the Fund’s portfolio. YTW is only one component of return and may not represent the yield an investor should expect to receive. YTW excludes convertible bonds with a YTW less than the comparable maturity Treasury yield plus the 20-Year average high yield spread to the Treasury yield, impaired/defaulted bonds, and letters of credit. The indices’ YTWs exclude all convertibles.
19
SOURCE CAPITAL
©2026 Morningstar, Inc. All Rights Reserved. The information contained herein: (1) is proprietary to Morningstar and/or its content providers; (2) may not be copied or distributed; and (3) is not warranted by Morningstar to be accurate, complete, or timely. Neither Morningstar nor its content providers are responsible for any damages or losses arising from any use of this information. Past performance is no guarantee, nor is it indicative, of future results.
20
SOURCE CAPITAL
SCHEDULE OF INVESTMENTS
As of June 30, 2026 (Unaudited)
BONDS & DEBENTURES — 13.4% | Principal | Value |
ASSET-BACKED SECURITIES — 3.0% | |||||||
COLLATERALIZED LOAN OBLIGATION — 1.5% | |||||||
Barings Middle Market Ltd. Series 2021-IA, Class D, 12.587% (3-Month Term SOFR+ | $ | 1,040,000 | $ | 1,033,144 | |||
Fortress Credit Opportunities Ltd. Series 2017‑9A, Class ER, 11.994% (3-Month Term SOFR+ | 5,186,000 | 5,154,350 | |||||
$ | 6,187,494 | ||||||
EQUIPMENT — 0.1% | |||||||
Prop 2017‑1A 5.300%, 3/15/2042(c)(d) | $ | 143,144 | $ | 136,702 | |||
OTHER — 1.4% | |||||||
Diamond Infrastructure Funding LLC Series 2021‑1A, Class C, 3.475%, 4/15/2049(a) | $ | 384,000 | $ | 379,742 | |||
Diamond Issuer LLC Series 2021‑1A, Class C, 3.787%, 11/20/2051(a) | 1,000,000 | 974,201 | |||||
Golub Capital Partners Funding Ltd. | 324,216 | 308,347 | |||||
Series 2021‑1A, Class B, 3.816%, 4/20/2029(a) | 713,874 | 664,634 | |||||
Series 2021‑2A, Class B, 3.994%, 10/19/2029(a) | 2,383,437 | 2,219,616 | |||||
Hotwire Funding LLC Series 2021‑1, Class C, 4.459%, 11/20/2051(a) | 750,000 | 746,399 | |||||
MetroNet Infrastructure Issuer LLC Series 2026‑1A, Class C, 7.100%, 4/20/2056(a) | 162,000 | 162,519 | |||||
VCP RRL Ltd. Series 2021‑1A, Class B, 2.848%, 10/20/2031(a) | 303,448 | 273,760 | |||||
$ | 5,729,218 | ||||||
TOTAL ASSET-BACKED SECURITIES (Cost $12,249,864) | $ | 12,053,414 | |||||
CONVERTIBLE BONDS — 0.0% | |||||||
Delivery Hero AG 1.500%, 1/15/2028 | $ | 100,000 | $ | 110,571 | |||
Wayfair, Inc. 1.000%, 8/15/2026 | 122,000 | 119,706 | |||||
TOTAL CONVERTIBLE BONDS (Cost $213,823) | $ | 230,277 | |||||
CORPORATE BANK DEBT — 5.8% | |||||||
Andromeda Funding LP 10.000% (1-Month Term SOFR+800 basis points), | $ | 3,000,000 | $ | — | |||
Banner Commercial Funding LP Term Loan 10.120% (1-Month Term SOFR+650 basis points), | 2,968,750 | 2,916,797 | |||||
Capstone Acquisition Holdings, Inc. Term Loan 8.244% (1-Month Term SOFR+460 basis points), | 2,256,572 | 2,299,876 | |||||
Cornerstone OnDemand, Inc. 7.744% (1-Month Term SOFR+375 basis points), | 71,210 | 44,387 | |||||
EQS Legacy Holdings LLC Term Loan 11.000%, 3/27/2032(b)(c)(d)(e)(g) | 9,306,019 | 9,306,019 | |||||
JC Penney Corp., Inc. 5.568% (3-Month USD Libor+425 basis points), | 455,468 | 46 | |||||
Lealand Finance Company B.V. Senior Exit LC | 1,234,380 | (61,719 | ) | ||||
4.750%, 6/30/2027(b)(c)(d)(e)(f)(i) | 3,927,194 | (196,360 | ) | ||||
Lealand Reficar LC Term Loan 11.494% (3-Month Term SOFR+750 basis points), | 36,048 | 32,443 | |||||
McDermott LC 7.953% (3-Month Term SOFR+426.16 basis points), 6/30/2027(b)(c)(d)(e)(f) | 834,170 | 767,436 | |||||
McDermott Technology Americas, Inc. | 141,927 | 134,830 | |||||
7.759% (1-Month Term SOFR+400 basis points), 12/31/2027(b)(c)(d)(e)(g) | 1,641,292 | 1,559,228 | |||||
One Camelback Loan 7.500% (1-Month Term SOFR+350 basis points), | 2,050,000 | 1,447,390 | |||||
Plantation Loan 10.500% (1-Month Term SOFR+620 basis points), 1/25/2027(b)(c)(d)(e) | 3,500,000 | 3,500,000 | |||||
See accompanying Notes to Financial Statements.
21
SOURCE CAPITAL
SCHEDULE OF INVESTMENTS (Continued)
As of June 30, 2026 (Unaudited)
BONDS & DEBENTURES (Continued) | Principal | Value |
Vision Solutions, Inc. 7.928% (3-Month Term SOFR+400 basis points), 4/24/2028(b)(d)(e) | $ | 71,197 | $ | 53,754 | ||
WH Borrower LLC 8.142% (3-Month Term SOFR+450 basis points), 2/20/2032(b)(d)(e) | 1,678,686 | 1,682,882 | ||||
TOTAL CORPORATE BANK DEBT (Cost $23,398,894) | $ | 23,487,009 | ||||
CORPORATE BONDS — 4.6% | ||||||
COMMUNICATIONS — 0.6% | ||||||
Echostar Corp. 3.875%, 11/30/2030 | $ | 846,895 | $ | 2,644,430 | ||
CONSUMER DISCRETIONARY — 0.7% | ||||||
Air Canada Pass Through Trust Series 2020‑1, Class C, 10.500%, 7/15/2026(a) | $ | 1,500,000 | $ | 1,499,361 | ||
VT Topco, Inc. 8.500%, 8/15/2030(a) | 1,289,000 | 1,308,335 | ||||
$ | 2,807,696 | |||||
FINANCIALS — 3.3% | ||||||
Apollo Debt Solutions BDC Senior Notes 8.620%, 9/28/2028(c)(d) | $ | 2,333,000 | $ | 2,333,000 | ||
Charles Schwab Corp. 5.000% (3-Month USD Libor+257.5 basis points), 10/31/2069(b)(j) | 75,000 | 74,063 | ||||
Drawbridge Special Opportunities Fund LP 5.950%, 9/17/2030(a) | 1,314,000 | 1,258,287 | ||||
Five Point Operating Co. LP 8.000%, 10/1/2030(a) | 100,000 | 102,336 | ||||
Hlend Senior Notes 8.170%, 3/15/2028(c)(d) | 3,500,000 | 3,500,000 | ||||
HPS Corporate Lending Fund 6.750%, 1/30/2029 | 520,000 | 528,881 | ||||
Midcap Financial Issuer Trust 6.500%, 5/1/2028(a) | 3,466,000 | 3,461,292 | ||||
Oaktree Strategic Credit Fund 8.400%, 11/14/2028 | 1,615,000 | 1,692,454 | ||||
OCREDIT BDC Senior Notes 7.770%, 3/7/2029(c)(d) | 552,000 | 552,000 | ||||
$ | 13,502,313 | |||||
TOTAL CORPORATE BONDS (Cost $16,963,678) | $ | 18,954,439 | ||||
TOTAL BONDS & DEBENTURES (Cost $52,826,259) | $ | 54,725,139 | ||||
CLOSED-END FUNDS — 0.1% | Number | ||||||
Altegrity, Inc.(c)(d) | 142,220 | $ | 163,553 | ||||
TOTAL CLOSED-END FUNDS (Cost $0) | $ | 163,553 | |||||
COMMON STOCKS — 46.3% | |||||||
AEROSPACE & DEFENSE — 1.5% | |||||||
Safran S.A. | 15,343 | $ | 6,048,143 | ||||
APPAREL & TEXTILE PRODUCTS — 0.5% | |||||||
Cie Financiere Richemont S.A. — Class A | 8,295 | $ | 1,915,139 | ||||
ASSET MANAGEMENT — 0.0% | |||||||
Pershing Square SPARC Holdings, Ltd.(c) | 3,652 | $ | — | ||||
Pershing Square Tontine Holdings Ltd.(c)(d) | 14,610 | — | |||||
$ | — | ||||||
BANKING — 2.0% | |||||||
Citigroup, Inc. | 50,767 | $ | 7,105,349 | ||||
Wells Fargo & Co. | 12,923 | 1,067,957 | |||||
$ | 8,173,306 | ||||||
BEVERAGES — 2.2% | |||||||
Diageo PLC | 2,956 | $ | 59,697 | ||||
Heineken Holding N.V. | 87,208 | 6,651,204 | |||||
See accompanying Notes to Financial Statements.
22
SOURCE CAPITAL
SCHEDULE OF INVESTMENTS (Continued)
As of June 30, 2026 (Unaudited)
COMMON STOCKS (Continued) | Number | Value |
Pernod Ricard S.A. | 28,147 | $ | 2,053,779 | ||
$ | 8,764,680 | ||||
BIOTECH & PHARMA — 0.5% | |||||
Merck KGaA | 12,774 | $ | 2,143,352 | ||
CABLE & SATELLITE — 1.6% | |||||
Comcast Corp. — Class A | 215,600 | $ | 5,292,980 | ||
Liberty Broadband Corp. — Class C* | 32,000 | 1,064,320 | |||
$ | 6,357,300 | ||||
CHEMICALS — 4.2% | |||||
Azelis Group N.V. | 511,487 | $ | 5,438,056 | ||
IMCD N.V. | 18,125 | 1,636,055 | |||
International Flavors & Fragrances, Inc. | 87,852 | 6,959,635 | |||
Nippon Paint Holdings Co., Ltd. | 489,100 | 3,167,516 | |||
$ | 17,201,262 | ||||
COMMERCIAL SUPPORT SERVICES — 1.9% | |||||
Bureau Veritas S.A. | 49,847 | $ | 1,525,254 | ||
Eurofins Scientific S.E. | 48,797 | 3,822,580 | |||
Sodexo S.A. | 43,190 | 2,499,513 | |||
$ | 7,847,347 | ||||
CONSTRUCTION MATERIALS — 1.2% | |||||
Amrize Ltd.* | 50,328 | $ | 2,682,483 | ||
Holcim AG* | 23,170 | 2,089,888 | |||
$ | 4,772,371 | ||||
E-COMMERCE DISCRETIONARY — 0.7% | |||||
Amazon.com, Inc.* | 11,949 | $ | 2,847,925 | ||
ELECTRIC UTILITIES — 0.0% | |||||
PG&E Corp. | 9,047 | $ | 152,171 | ||
ELECTRICAL EQUIPMENT — 1.4% | |||||
TE Connectivity Ltd. | 27,734 | $ | 5,591,452 | ||
ENGINEERING & CONSTRUCTION — 1.6% | |||||
McDermott International, Ltd.*,(c)(d) | 86,705 | $ | 2,158,955 | ||
Samsung C&T Corp. | 14,711 | 4,448,527 | |||
$ | 6,607,482 | ||||
ENTERTAINMENT CONTENT — 0.2% | |||||
Epic Games, Inc.(c)(d) | 4,347 | $ | 994,767 | ||
FOOD — 1.4% | |||||
Kerry Group PLC—Class A | 36,208 | $ | 3,324,169 | ||
Magnum Ice Cream Co. N.V.* | 23,964 | 417,213 | |||
Magnum Ice Cream Co. N.V.* | 6,405 | 111,423 | |||
Magnum Ice Cream Co. N.V.* | 99,545 | 1,732,938 | |||
$ | 5,585,743 | ||||
HEALTH CARE FACILITIES & SVCS — 0.2% | |||||
ICON PLC* | 5,363 | $ | 931,607 | ||
HOME CONSTRUCTION — 0.9% | |||||
Fortune Brands Innovations, Inc. | 66,893 | $ | 3,672,426 | ||
See accompanying Notes to Financial Statements.
23
SOURCE CAPITAL
SCHEDULE OF INVESTMENTS (Continued)
As of June 30, 2026 (Unaudited)
COMMON STOCKS (Continued) | Number | Value |
INSTITUTIONAL FINANCIAL SVCS — 0.1% | |||||
Jefferies Financial Group, Inc. | 5,974 | $ | 298,581 | ||
INSURANCE — 2.3% | |||||
Aon PLC — Class A | 13,283 | $ | 4,405,838 | ||
Arthur J. Gallagher & Co. | 21,830 | 5,011,513 | |||
$ | 9,417,351 | ||||
INTERNET MEDIA & SERVICES — 6.5% | |||||
Alphabet, Inc. — Class A | 25,690 | $ | 9,180,836 | ||
Alphabet, Inc. — Class C | 18,429 | 6,511,519 | |||
Delivery Hero S.E.* | 11,504 | 473,199 | |||
Meta Platforms, Inc. — Class A | 10,387 | 5,850,893 | |||
Prosus N.V.* | 92,699 | 4,023,806 | |||
Uber Technologies, Inc.* | 8,195 | 591,351 | |||
$ | 26,631,604 | ||||
LEISURE FACILITIES & SERVICES — 0.8% | |||||
Marriott International, Inc. — Class A | 634 | $ | 234,954 | ||
Vail Resorts, Inc. | 21,846 | 2,974,333 | |||
$ | 3,209,287 | ||||
MACHINERY — 0.6% | |||||
CNH Industrial NV | 119,582 | $ | 1,342,906 | ||
Hoshizaki Corp. | 32,900 | 1,071,407 | |||
$ | 2,414,313 | ||||
MEDICAL EQUIPMENT & DEVICES — 4.1% | |||||
Avantor, Inc.* | 129,302 | $ | 1,280,090 | ||
Baxter International, Inc. | 122,816 | 2,618,437 | |||
Becton, Dickinson and Co. | 34,880 | 5,278,390 | |||
Bio-Rad Laboratories, Inc.* | 3,413 | 1,002,091 | |||
Danaher Corp. | 9,508 | 1,811,084 | |||
GE HealthCare Technologies, Inc. | 13,655 | 874,057 | |||
Thermo Fisher Scientific, Inc. | 4,087 | 2,049,058 | |||
Waters Corp.* | 4,504 | 1,689,180 | |||
$ | 16,602,387 | ||||
METALS & MINING — 1.5% | |||||
Glencore PLC* | 668,107 | $ | 4,553,301 | ||
Grupo Mexico S.A.B. de C.V. | 118,987 | 1,348,848 | |||
$ | 5,902,149 | ||||
OIL & GAS SERVICES & EQUIP — 0.5% | |||||
NOV, Inc. | 106,740 | $ | 1,980,027 | ||
REAL ESTATE SERVICES — 0.0% | |||||
Copper Property CTL Pass Through Trust(d) | 16,058 | $ | 170,215 | ||
RETAIL — DISCRETIONARY — 1.1% | |||||
CarMax, Inc.* | 25,555 | $ | 1,351,604 | ||
Ferguson Enterprises, Inc. | 13,797 | 3,274,442 | |||
$ | 4,626,046 | ||||
SEMICONDUCTORS — 3.8% | |||||
Analog Devices, Inc. | 29,989 | $ | 11,910,731 | ||
Broadcom, Inc. | 1,217 | 459,722 | |||
See accompanying Notes to Financial Statements.
24
SOURCE CAPITAL
SCHEDULE OF INVESTMENTS (Continued)
As of June 30, 2026 (Unaudited)
COMMON STOCKS (Continued) | Number | Value |
NXP Semiconductors N.V. | 11,714 | $ | 3,291,985 | ||
$ | 15,662,438 | ||||
SOFTWARE — 0.7% | |||||
Intuit, Inc. | 5,730 | $ | 1,495,530 | ||
SAP S.E. — ADR | 6,257 | 964,266 | |||
SAP SE | 3,772 | 577,523 | |||
$ | 3,037,319 | ||||
SPECIALTY FINANCE — 0.4% | |||||
PayPal Holdings, Inc. | 36,541 | $ | 1,577,840 | ||
TECHNOLOGY HARDWARE — 0.5% | |||||
Nintendo Co., Ltd. | 44,644 | $ | 1,871,207 | ||
TECHNOLOGY SERVICES — 0.5% | |||||
LG Corp. | 30,673 | $ | 1,926,343 | ||
TELECOMMUNICATIONS — 0.0% | |||||
Uniti Group, Inc.* | 10,312 | $ | 118,279 | ||
TRANSPORTATION & LOGISTICS — 0.7% | |||||
PHI Group, Inc.(c)(d) | 84,452 | $ | 2,702,464 | ||
TRANSPORTATION EQUIPMENT — 0.2% | |||||
Westinghouse Air Brake Technologies Corp. | 3,059 | $ | 824,706 | ||
TOTAL COMMON STOCKS (Cost $121,330,698) | $ | 188,579,029 | |||
LIMITED PARTNERSHIPS — 19.0% | |||||
BH3 Debt Opportunity Fund II-Parallel, LP(d)(k) | 2,300,000 | $ | 1,521,978 | ||
Blue Torch Credit Opportunities Fund II LP(d)(k) | 55,000 | 2,960,647 | |||
Castlelake Asset-Based Private Credit III Evergreen A, L.P.(d)(k) | 3,900,000 | 3,673,805 | |||
Clover Private Credit Opportunities Fund LP(c)(d) | 60,000 | 2,044,167 | |||
FPS Holdco II LLC(c)(d)(l) | 10,507,864 | 8,700,735 | |||
HIG WhiteHorse Direct Lending 2020 LP(d)(k) | 55,000 | 3,621,837 | |||
Jett Texas LLC(d)(k) | 6,000,000 | 7,045,800 | |||
Metro Partners Fund VII LP(d)(k) | 80,000 | 9,032,443 | |||
MRP Evergreen Income Fund LP(d)(k) | 3,900,000 | 3,900,000 | |||
MSD Private Credit Opportunities Fund II LP(d)(k) | 80,000 | 4,936,889 | |||
MSD Real Estate Credit Opportunities Fund(d)(k) | 30,000 | 1,376,685 | |||
Nebari Natural Resources Credit Fund I LP(d)(k) | 55,000 | 1,648,010 | |||
Piney Lake Opportunities Fund LP(d)(k) | 30,000 | 3,212,165 | |||
Post Road Special Opportunity Fund II LP(c)(d) | 18,000 | 1,989,132 | |||
Silverview Credit Opportunities Onshore Fund LP(d)(k) | 35,000 | 1,425,100 | |||
Silverview Special Situations Lending LP(c)(d) | 48,500 | 3,391,513 | |||
Sound Point Strategic Capital Fund III LP(c)(d) | 2,750,000 | 401,699 | |||
Tioga Partners IV, LP(d)(k) | 14,000,000 | 13,591,717 | |||
TPG A.G. Asset Based Credit Evergreen LP(d)(k) | 4,275,000 | — | |||
Trevian Capital Debt Fund, LP(d)(k) | 3,000,000 | 3,000,000 | |||
TOTAL LIMITED PARTNERSHIPS (Cost $71,118,177) | $ | 77,474,322 | |||
PREFERRED STOCKS — 0.0% | |||||
INDUSTRIALS — 0.0% | |||||
Uniti Group, Inc. — Series A, 11.000%(c)(d) | 65 | $ | 65,370 | ||
TOTAL PREFERRED STOCKS (Cost $124,813) | $ | 65,370 | |||
See accompanying Notes to Financial Statements.
25
SOURCE CAPITAL
SCHEDULE OF INVESTMENTS (Continued)
As of June 30, 2026 (Unaudited)
WARRANTS — 0.0% | Number | Value |
Electriq Power Holdings, Inc., Expiration Date: July 31, 2028*,(c) | 31,567 | $ | — | ||
MariaDB PLC, Expiration Date: December 16, 2027*,(c) | 24,015 | — | |||
Ross Acquisition Corp. II, Expiration Date: September 16, 2026*,(c) | 5,878 | — | |||
Uniti Group, Inc. , Expiration Date: August 11, 2035*,(c)(d) | 1,996 | 22,096 | |||
TOTAL WARRANTS (Cost $17,489) | $ | 22,096 | |||
SHORT-TERM INVESTMENTS — 20.7% | |||||
MONEY MARKET INVESTMENTS — 0.4% | |||||
Morgan Stanley Institutional Liquidity Treasury Portfolio — Institutional Class, 3.44%(m) | 1,747,848 | $ | 1,747,848 | ||
TREASURY BILLS — 20.3% | Principal | |||||||
U.S. Treasury Bill | $ | 27,200,000 | $ | 27,183,684 | ||||
3.64%, 8/6/2026(n) | 27,950,000 | 27,850,195 | ||||||
3.65%, 9/10/2026(n) | 27,600,000 | 27,402,139 | ||||||
$ | 82,436,018 | |||||||
TOTAL SHORT-TERM INVESTMENTS (Cost $84,187,083) | $ | 84,183,866 | ||||||
TOTAL INVESTMENTS — 99.5% (Cost $329,604,519) | $ | 405,213,375 | ||||||
Other Assets in Excess of Liabilities — 0.5% | 2,191,066 | |||||||
TOTAL NET ASSETS — 100.0% | $ | 407,404,441 | ||||||
ADR — American Depository Receipt
BDC — Business Development Company
LLC — Limited Liability Company
LP — Limited Partnership
PLC — Public Limited Company
See accompanying Notes to Financial Statements.
26
SOURCE CAPITAL
SCHEDULE OF INVESTMENTS (Continued)
As of June 30, 2026 (Unaudited)
See accompanying Notes to Financial Statements.
27
SOURCE CAPITAL
SUMMARY OF INVESTMENTS
As of June 30, 2026 (Unaudited)
Security Type/Industry | Percent of Total | |||||
Bonds & Debentures | ||||||
Corporate Bank Debt | 5.8 | % | ||||
Corporate Bonds | 4.6 | % | ||||
Asset-Backed Securities | 3.0 | % | ||||
Convertible Bonds | 0.0 | % | ||||
Total Bonds & Debentures | 13.4 | % | ||||
Closed-End Funds | 0.1 | % | ||||
Common Stocks | ||||||
Internet Media & Services | 6.5 | % | ||||
Chemicals | 4.2 | % | ||||
Medical Equipment & Devices | 4.1 | % | ||||
Semiconductors | 3.8 | % | ||||
Insurance | 2.3 | % | ||||
Beverages | 2.2 | % | ||||
Banking | 2.0 | % | ||||
Commercial Support Services | 1.9 | % | ||||
Engineering & Construction | 1.6 | % | ||||
Cable & Satellite | 1.6 | % | ||||
Aerospace & Defense | 1.5 | % | ||||
Metals & Mining | 1.5 | % | ||||
Electrical Equipment | 1.4 | % | ||||
Food | 1.4 | % | ||||
Construction Materials | 1.2 | % | ||||
Retail — Discretionary | 1.1 | % | ||||
Home Construction | 0.9 | % | ||||
Leisure Facilities & Services | 0.8 | % | ||||
Software | 0.7 | % | ||||
E-Commerce Discretionary | 0.7 | % | ||||
Transportation & Logistics | 0.7 | % | ||||
Machinery | 0.6 | % | ||||
Biotech & Pharma | 0.5 | % | ||||
Oil & Gas Services & Equip | 0.5 | % | ||||
Technology Services | 0.5 | % | ||||
Apparel & Textile Products | 0.5 | % | ||||
Technology Hardware | 0.5 | % | ||||
Specialty Finance | 0.4 | % | ||||
Entertainment Content | 0.2 | % | ||||
Health Care Facilities & Svcs | 0.2 | % | ||||
Transportation Equipment | 0.2 | % | ||||
Institutional Financial Svcs | 0.1 | % | ||||
Real Estate Services | 0.0 | % | ||||
Electric Utilities | 0.0 | % | ||||
Telecommunications | 0.0 | % | ||||
Asset Management | 0.0 | % | ||||
Total Common Stocks | 46.3 | % | ||||
Preferred Stocks | ||||||
Industrials | 0.0 | % | ||||
Limited Partnerships | 19.0 | % | ||||
Warrants | 0.0 | % | ||||
Short-Term Investments | 20.7 | % | ||||
Total Investments | 99.5 | % | ||||
Other Assets in Excess of Liabilities | 0.5 | % | ||||
Total Net Assets | 100.0 | % | ||||
See accompanying Notes to Financial Statements.
28
SOURCE CAPITAL
STATEMENT OF ASSETS AND LIABILITIES
As of June 30, 2026
(Unaudited)
|
ASSETS |
||||||
|
Investments, at value (cost $322,558,988) |
$ |
396,512,640 |
||||
|
Investments in affiliates, at value (cost $7,045,531) |
8,700,735 |
|||||
|
Foreign currency, at value (cost $31,853) |
31,690 |
|||||
|
Cash |
662 |
|||||
|
Deposits held at broker |
551,248 |
|||||
|
Receivables: |
||||||
|
Dividends and interest |
1,747,426 |
|||||
|
Reclaims receivable |
280,292 |
|||||
|
Prepaid expenses |
17,486 |
|||||
|
Other assets |
42,139 |
|||||
|
Total assets |
407,884,318 |
|||||
|
LIABILITIES |
||||||
|
Payables: |
||||||
|
Investment securities purchased |
913 |
|||||
|
Advisory fees |
233,352 |
|||||
|
Fund services fees |
18,833 |
|||||
|
Commitment fees payable (Note 13) |
76,337 |
|||||
|
Shareholder reporting fees |
31,593 |
|||||
|
Auditing fees |
12,668 |
|||||
|
Chief Compliance Officer fees |
2,748 |
|||||
|
Directors’ fees and expenses |
1,883 |
|||||
|
Legal fees |
451 |
|||||
|
Accrued other expenses |
101,099 |
|||||
|
Total liabilities |
479,877 |
|||||
|
Commitments and contingencies (Note 7) |
||||||
|
NET ASSETS |
$ |
407,404,441 |
||||
|
COMPONENTS OF NET ASSETS |
||||||
|
Capital Stock — par value $1 per share; authorized 12,000,000 shares; outstanding 8,230,971 shares |
$ |
330,641,980 |
||||
|
Total distributable earnings (accumulated deficit) |
76,762,461 |
|||||
|
NET ASSETS |
$ |
407,404,441 |
||||
|
MAXIMUM OFFERING PRICE PER SHARE |
||||||
|
Number of shares issued and outstanding |
|
|||||
|
Net asset value per share |
$ |
|
||||
|
Market price per share |
$ |
|
||||
See accompanying Notes to Financial Statements.
29
SOURCE CAPITAL
STATEMENT OF OPERATIONS
For the six months ended June 30, 2026
(Unaudited)
|
INVESTMENT INCOME |
||||||
|
Interest (net of foreign withholding taxes of $146) |
$ |
5,305,660 |
||||
|
Dividends (net of foreign withholding taxes of $111,264) |
3,331,338 |
|||||
|
Total investment income |
8,636,998 |
|||||
|
EXPENSES |
||||||
|
Advisory fees |
1,388,034 |
|||||
|
Fund services fees |
165,947 |
|||||
|
Interest expense |
45,693 |
|||||
|
Legal fees |
23,856 |
|||||
|
Directors’ fees and expenses |
17,423 |
|||||
|
Auditing fees |
15,372 |
|||||
|
Listing fee expense |
12,397 |
|||||
|
Shareholder reporting fees |
8,500 |
|||||
|
Tax fees(1) |
5,240 |
|||||
|
Insurance fees |
3,124 |
|||||
|
Chief Compliance Officer fees |
1,128 |
|||||
|
Miscellaneous |
729 |
|||||
|
Total expenses |
1,687,443 |
|||||
|
Net investment income (loss) |
6,949,555 |
|||||
|
REALIZED AND UNREALIZED GAIN (LOSS) |
||||||
|
Net realized gain (loss) on: |
||||||
|
Total realized gain (loss) |
10,467,613 |
||
|
Net change in unrealized appreciation (depreciation) on: |
|||
|
Net change in unrealized appreciation (depreciation) |
2,992,814 |
|||
|
Net realized and unrealized gain (loss) |
13,460,427 |
|||
|
NET INCREASE (DECREASE) IN NET ASSETS FROM OPERATIONS |
$ |
20,409,982 |
||
See accompanying Notes to Financial Statements.
30
SOURCE CAPITAL
STATEMENTS OF CHANGES IN NET ASSETS
|
For the |
For the |
||||||||||
|
INCREASE (DECREASE) IN NET ASSETS FROM |
|||||||||||
|
Operations: |
|||||||||||
|
Net investment income (loss) |
$ |
6,949,555 |
$ |
17,036,321 |
|||||||
|
Total realized gain (loss) on investments and foreign currency transactions |
10,467,613 |
22,169,699 |
|||||||||
|
Net change in unrealized appreciation (depreciation) on investments, Investments in |
2,992,814 |
20,302,729 |
|||||||||
|
Net increase (decrease) in net assets resulting from operations |
20,409,982 |
59,508,749 |
|||||||||
|
Distributions to Shareholders: |
|||||||||||
|
Distributions |
(10,287,068 |
) |
(20,563,182 |
) |
|||||||
|
Total distributions to shareholders |
(10,287,068 |
) |
(20,563,182 |
) |
|||||||
|
Capital Transactions: |
|||||||||||
|
Reinvestment of distributions |
— |
1,378,757 |
|||||||||
|
Net increase (decrease) in net assets from capital transactions |
— |
1,378,757 |
|||||||||
|
Total increase (decrease) in net assets |
10,122,914 |
40,324,324 |
|||||||||
|
NET ASSETS |
|||||||||||
|
Beginning of period |
397,281,527 |
356,957,203 |
|||||||||
|
End of period |
$ |
407,404,441 |
$ |
397,281,527 |
|||||||
|
CAPITAL SHARE TRANSACTIONS |
|||||||||||
|
Shares reinvested |
— |
31,226 |
|||||||||
|
Net increase (decrease) in capital share transactions |
— |
31,226 |
|||||||||
See accompanying Notes to Financial Statements.
31
SOURCE CAPITAL
FINANCIAL HIGHLIGHTS
Per share operating performance. For a capital share outstanding throughout each period.
|
For the |
For the year ended December 31, |
|||||||||||||||||||||||||||||||||||||||
|
(Unaudited) |
2025 |
2024 |
2023 |
2022(1) |
2021(1) |
|||||||||||||||||||||||||||||||||||
|
Net asset value, beginning of period |
$ |
|
$ |
|
$ |
|
$ |
|
$ |
|
$ |
|
||||||||||||||||||||||||||||
|
Income from Investment Operations: |
||||||||||||||||||||||||||||||||||||||||
|
Net investment income(2) |
$ |
0.84 |
$ |
2.07 |
$ |
2.06 |
$ |
1.96 |
$ |
1.16 |
$ |
0.99 |
||||||||||||||||||||||||||||
|
Net realized and unrealized gain (loss) |
2.17 |
5.70 |
2.72 |
4.54 |
(4.40 |
) |
3.94 |
|||||||||||||||||||||||||||||||||
|
Less: Federal income tax on undistributed gains |
— |
(0.53 |
)(3) |
— |
— |
— |
— |
|||||||||||||||||||||||||||||||||
|
Total from investment operations |
$ |
3.01 |
$ |
7.24 |
$ |
4.78 |
$ |
6.50 |
$ |
(3.24 |
) |
$ |
4.93 |
|||||||||||||||||||||||||||
|
Less Distributions: |
||||||||||||||||||||||||||||||||||||||||
|
From net investment income |
$ |
(1.25 |
) |
$ |
(1.75 |
) |
$ |
(2.21 |
) |
$ |
(2.09 |
) |
$ |
(1.06 |
) |
$ |
(2.02 |
) |
||||||||||||||||||||||
|
From net realized gains |
(0.53 |
) |
(0.75 |
) |
(2.95 |
) |
(0.82 |
) |
(1.16 |
) |
(2.59 |
) |
||||||||||||||||||||||||||||
|
Total distributions |
$ |
( |
) |
$ |
( |
) |
$ |
( |
) |
$ |
( |
) |
$ |
( |
) |
$ |
( |
) |
||||||||||||||||||||||
|
Capital stock repurchased |
— |
— |
— (4) |
0.05 |
0.03 |
0.03 |
||||||||||||||||||||||||||||||||||
|
Net asset value, end of period |
$ |
|
$ |
|
$ |
|
$ |
|
$ |
|
$ |
|
||||||||||||||||||||||||||||
|
Per share market value at end of period |
$ |
|
$ |
|
$ |
|
$ |
|
$ |
|
$ |
|
||||||||||||||||||||||||||||
|
Total investment return(5) |
4.25% |
11.33% |
(6) |
21.09% |
12.46% |
(5.28)% |
19.95% |
|||||||||||||||||||||||||||||||||
|
Net asset value total return(7) |
5.18% |
18.40% |
(8) |
11.11% |
16.74% |
(7.09)% |
11.16% |
|||||||||||||||||||||||||||||||||
|
Ratios and Supplemental Data: |
||||||||||||||||||||||||||||||||||||||||
|
Net assets, end of period (in thousands) |
$407,404 |
$397,282 |
$356,957 |
$360,414 |
$334,832 |
$382,795 |
||||||||||||||||||||||||||||||||||
|
Ratio of expenses to average net assets |
0.84% |
(9),(10) |
0.98% |
(10) |
0.98% |
0.97% |
0.99% |
0.91% |
||||||||||||||||||||||||||||||||
|
Ratio of net investment income (loss) to average |
3.47% |
(9) |
4.53% |
4.52% |
4.65% |
2.76% |
2.05% |
|||||||||||||||||||||||||||||||||
|
Portfolio turnover rate |
13% |
(11) |
28% |
11% |
13% |
18% |
47% |
|||||||||||||||||||||||||||||||||
See accompanying Notes to Financial Statements.
32
SOURCE CAPITAL
NOTES TO FINANCIAL STATEMENTS
June 30, 2026
(Unaudited)
NOTE 1—Organization
Source Capital (the “Fund”), is registered under the Investment Company Act of 1940 as a diversified, closed-end management investment company.
The Fund is an investment company and accordingly follows the investment company accounting and reporting guidance of the Financial Accounting Standard Board Accounting Standards Codification No. 946 “Financial Services—Investment Companies.”
The Fund is deemed to be an individual reporting segment and is not part of a consolidated reporting entity. The objective and strategy of the Fund is used by the Adviser to make investment decisions, and the results of the operations, as shown on the Statements of Operations and the financial highlights for the Fund is the information utilized for the day-to-day management of the Fund. The Fund is party to the expense agreements as disclosed in the Notes to the Financial Statements and there are no resources allocated to a Fund based on performance measurements. The management of the Fund’s Adviser is deemed to be the Chief Operating Decision Maker with respect to the Fund’s investment decisions.
NOTE 2—Accounting Policies
The following is a summary of the significant accounting policies consistently followed by the Fund in the preparation of its financial statements. The preparation of financial statements in conformity with accounting principles generally accepted in the United States of America (“GAAP”) requires management to make estimates and assumptions that affect the reported amounts and disclosures in the financial statements. Actual results could differ from these estimates.
(a) Valuation of Investments
The Fund values equity securities at the last reported sale price on the principal exchange or in the principal over the counter (“OTC”) market in which such securities are traded, as of the close of regular trading on the NYSE on the day the securities are being valued or, if the last-quoted sales price is not readily available, the securities will be valued at the last bid or the mean between the last available bid and ask price. Securities traded on the NASDAQ are valued at the NASDAQ Official Closing Price (“NOCP”). Investments in open-end investment companies are valued at the daily closing net asset value of the respective investment company. Debt securities are valued by utilizing a price supplied by independent pricing service providers. The independent pricing service providers may use various valuation methodologies including matrix pricing and other analytical pricing models as well as market transactions and dealer quotations. These models generally consider such factors as yields or prices of bonds of comparable quality, type of issue, coupon, maturity, ratings and general market conditions. If a price is not readily available for a portfolio security, the security will be valued at fair value (the amount which the Fund might reasonably expect to receive for the security upon its current sale). The Board of Directors has designated the Adviser as the Fund’s valuation designee (the “Valuation Designee”) to make all fair value determinations with respect to the Fund’s portfolio investments, subject to the Board’s oversight. As the Valuation Designee, the Adviser has adopted and implemented policies and procedures to be followed when the Fund must utilize fair value pricing.
(b) Investment Transactions, Investment Income and Expenses
Investment transactions are accounted for on the trade date. Realized gains and losses on investments are determined on the identified cost basis. Dividend income is recorded net of applicable withholding taxes on the ex-dividend date and interest income is recorded on an accrual basis. Withholding taxes on foreign dividends, if applicable, are paid (a portion of which may be reclaimable) or provided for in accordance with the applicable country’s tax rules and rates and are disclosed in the Statement of Operations. Withholding tax reclaims are filed in certain countries to recover a portion of the amounts previously withheld. The Fund records a reclaim receivable based on a number of factors, including a jurisdiction’s legal obligation to pay reclaims as well as payment history and market convention. Discounts on debt securities are accreted or amortized to interest income over the lives of the respective securities using the effective interest method. Premiums for callable debt securities are amortized to the earliest call date, if the call price was less than the purchase price. If the call price was not at par and the security was not called, the security is amortized to the next call price and date.
(c) Mortgage-Backed Securities
The Fund may invest in mortgage-backed securities (“MBS”), representing direct or indirect interests in pools of underlying residential or commercial mortgage loans that are secured by real property. These securities provide investors with payments consisting of both principal and interest as the mortgages in the underlying mortgage pools are paid.
The timely payment of principal and interest (but not the market value) on MBS issued or guaranteed by Ginnie Mae (formally known as the Government National Mortgage Association or GNMA) is backed by Ginnie Mae and the full faith and credit of the US government. Obligations issued by Fannie Mae (formally known as the Federal National Mortgage Association or FNMA) and Freddie
33
SOURCE CAPITAL
NOTES TO FINANCIAL STATEMENTS (Continued)
June 30, 2026
(Unaudited)
Mac (formally known as the Federal Home Loan Mortgage Corporation or FHLMC) are historically supported only by the credit of the issuer, but currently are guaranteed by the US government in connection with such agencies being placed temporarily into conservatorship by the US government.Some MBS are sponsored or issued by private entities. Payments of principal and interest (but not the market value) of such private MBS may be supported by pools of residential or commercial mortgage loans or other MBS that are guaranteed, directly or indirectly, by the US government or one of its agencies or instrumentalities, or they may be issued without any government guarantee of the underlying mortgage assets but may contain some form of non-government credit enhancement.
Collateralized mortgage obligations (“CMO”) are a type of MBS. A CMO is a debt security that may be collateralized by whole mortgage loans or mortgage pass-through securities. The mortgage loans or mortgage pass-through securities are divided into classes or tranches with each class having its own characteristics. Investors typically receive payments out of the interest and principal on the underlying mortgages. The portions of these payments that investors receive, as well as the priority of their rights to receive payments, are determined by the specific terms of the CMO class.
The yield characteristics of MBS differ from those of traditional debt securities. Among the major differences are that interest and principal payments are made more frequently, usually monthly, and that principal may be prepaid at any time because the underlying mortgage loans or other obligations generally may be prepaid at any time. Prepayments on a pool of mortgage loans are influenced by a variety of economic, geographic, social and other factors. Generally, prepayments on fixed-rate mortgage loans will increase during a period of falling interest rates and decrease during a period of rising interest rates. Certain classes of CMOs and other MBS are structured in a manner that makes them extremely sensitive to changes in prepayment rates.
(d) Asset-Backed Securities
Asset-backed securities include pools of mortgages, loans, receivables or other assets. Payment of principal and interest may be largely dependent upon the cash flows generated by the assets backing the securities, and, in certain cases, supported by letters of credit, surety bonds, or other credit enhancements. The value of asset-backed securities may also be affected by the creditworthiness of the servicing agent for the pool, the originator of the loans or receivables, or the financial institution(s) providing the credit support. In addition, asset-backed securities are not backed by any governmental agency.
Collateralized Debt Obligations (“CDOs”) include Collateralized Bond Obligations (“CBOs”), Collateralized Loan Obligations (“CLOs”) and other similarly structured securities. CBOs and CLOs are types of asset backed securities. A CBO is a trust which is backed by a diversified pool of high risk, below investment grade fixed income securities. A CLO is a trust typically collateralized by a pool of loans, which may include, among others, domestic and foreign senior secured loans, senior unsecured loans, and subordinate corporate loans, including loans that may be rated below investment grade or equivalent unrated loans. The risks of an investment in a CDO depend largely on the type of the collateral securities and the class of the CDO in which a Fund invests. CDOs carry additional risks including, but not limited to, (i) the possibility that distributions from collateral securities will not be adequate to make interest or other payments, (ii) the collateral may decline in value or default, (iii) a Fund may invest in CDOs that are subordinate to other classes, and (iv) the complex structure of the security may not be fully understood at the time of investment and may produce disputes with the issuer or unexpected investment results.
(e) Stripped Mortgage-Backed Interest Only (“I/O”) and Principal Only (“P/O”) Securities
Stripped mortgage-backed securities are usually structured with two classes that receive different proportions of the interest and principal distributions on a pool of mortgage assets. In certain cases, one class will receive all of the interest payments on the underlying mortgages (the I/O class), while the other class will receive all of the principal payments (the P/O class). The Fund currently has investments in I/O securities. The yield to maturity on I/Os is sensitive to the rate of principal repayments (including prepayments) on the related underlying mortgage assets, and principal payments may have a material effect on yield-to-maturity. If the underlying mortgage assets experience greater than anticipated prepayments of principal, a Fund may not fully recoup its initial investment in I/Os.
(f) Credit Risk
Debt securities are subject to credit risk, meaning that the issuer of the debt security may default or fail to make timely payments of principal or interest. The values of any of the Fund’s investments may also decline in response to events affecting the issuer or its credit rating. The lower rated debt securities in which the Fund may invest are considered speculative and are generally subject to greater volatility and risk of loss than investment grade securities, particularly in deteriorating economic conditions. The Fund invests a significant portion of its assets in securities of issuers that hold mortgage-and asset-backed securities and direct investments in securities backed by commercial and residential mortgage loans and other financial assets. The value and related income of these securities is sensitive to changes in economic conditions, including delinquencies and/or defaults. Continuing shifts in the market’s perception of credit quality on securities backed by commercial and residential mortgage loans and other financial assets may result in increased volatility of market price and periods of illiquidity that can negatively impact the valuation of certain securities held by the Fund.
34
SOURCE CAPITAL
NOTES TO FINANCIAL STATEMENTS (Continued)
June 30, 2026
(Unaudited)
(g) Special Purpose Acquisition Companies
The Fund may invest in stock, warrants, and other securities of special purpose acquisition companies (“SPACs”) or similar special purpose entities that pool funds to seek potential acquisition opportunities. Because SPACs and similar entities are in essence blank check companies without operating history or ongoing business other than seeking acquisitions, the value of their securities is particularly dependent on the ability of the entity’s management to identify and complete a profitable acquisition. An investment in a SPAC is subject to a variety of risks, including that (i) a portion of the monies raised by the SPAC for the purpose of effecting an acquisition or merger may be expended prior to the transaction for payment of taxes and other purposes; (ii) prior to any acquisition or merger, a SPAC’s assets are typically invested in government securities, money market funds and similar investments whose returns or yields may be significantly lower than those of the Fund’s other investments; (iii) the Fund generally will not receive significant income from its investments in SPACs (both prior to and after any acquisition or merger) and, therefore, the Fund’s investments in SPACs will not significantly contribute to the Fund’s distributions to shareholders; (iv) an attractive acquisition or merger target may not be identified at all, in which case the SPAC will be required to return any remaining monies to shareholders; (v) if an acquisition or merger target is identified, the Fund may elect not to participate in the proposed transaction or the Fund may be required to divest its interests in the SPAC due to regulatory or other considerations, in which case the warrants or other rights with respect to the SPAC held by the Fund may expire worthless or may be repurchased or retired by the SPAC at an unfavorable price; (vi) any proposed merger or acquisition may be unable to obtain the requisite approval, if any, of SPAC shareholders; (vii) under any circumstances in which the Fund receives a refund of all or a portion of its original investment (which typically represents a pro rata share of the proceeds of the SPAC’s assets, less any applicable taxes), the returns on that investment may be negligible, and the Fund may be subject to opportunity costs to the extent that alternative investments would have produced higher returns; (viii) to the extent an acquisition or merger is announced or completed, shareholders who redeem their shares prior to that time may not reap any resulting benefits; (ix) the Fund may be delayed in receiving any redemption or liquidation proceeds from a SPAC to which it is entitled; (x) an acquisition or merger once effected may prove unsuccessful and an investment in the SPAC may lose value; (xi) an investment in a SPAC may be diluted by additional later offerings of interests in the SPAC or by other investors exercising existing rights to purchase shares of the SPAC; (xii) only a thinly traded market for shares of or interests in a SPAC may develop, or there may be no market at all, leaving the Fund unable to sell its interest in a SPAC or to sell its interest only at a price below what the Fund believes is the SPAC interest’s intrinsic value; and (xiii) the values of investments in SPACs may be highly volatile and may depreciate significantly over time. There were no Private Investment in Public Equity (“PIPE”) share purchase commitments for the SPACs the Fund invested in as of June 30, 2026.
(h) Repurchase Agreements
Repurchase agreements permit the Fund to maintain liquidity and earn income over periods of time as short as overnight. Repurchase agreements held by the Fund are fully collateralized by U.S. Government securities, or securities issued by U.S. Government agencies, or securities that are within the three highest credit categories assigned by established rating agencies (Aaa, Aa, or A by Moody’s or AAA, AA or A by Standard & Poor’s) or, if not rated by Moody’s or Standard & Poor’s, are of equivalent investment quality as determined by the Adviser. Such collateral is in the possession of the Fund’s custodian. The collateral is evaluated daily to ensure its fair value equals or exceeds the current fair value of the repurchase agreements including accrued interest. In the event of default on the obligation to repurchase, the Fund has the right to liquidate the collateral and apply the proceeds in satisfaction of the obligation.
The Fund may enter into repurchase agreements, under the terms of a Master Repurchase Agreement (“MRA”). The MRA permits the Fund, under certain circumstances including an event of default (such as bankruptcy or insolvency), to offset payables and/or receivables under the MRA with collateral held and/or posted to the counterparty and create one single net payment due to or from the Fund. However, bankruptcy or insolvency laws of a particular jurisdiction may impose restrictions on or prohibitions against such a right of offset in the event of a MRA counterparty’s bankruptcy or insolvency. Pursuant to the terms of the MRA, the Fund receives securities as collateral with a fair value in excess of the repurchase price to be received by the Fund upon the maturity of the repurchase transaction. Upon a bankruptcy or insolvency of the MRA counterparty, the Fund recognizes a liability with respect to such excess collateral to reflect the Fund’s obligation under bankruptcy law to return the excess to the counterparty. There were no repurchase agreements as of June 30, 2026.
(i) Currency Translation
Assets and liabilities denominated in foreign currencies are translated into U.S. dollars at the mean of the quoted bid and ask prices of such currencies against the U.S. dollar. Purchases and sales of portfolio securities are translated into U.S. dollars at the rates of exchange prevailing when such securities were acquired or sold. Income and expenses are translated into U.S. dollars at rates of exchange prevailing when accrued.
35
SOURCE CAPITAL
NOTES TO FINANCIAL STATEMENTS (Continued)
June 30, 2026
(Unaudited)
Net realized gain or loss on foreign currency transactions represents foreign exchange gains and losses from sales and maturities of foreign fixed income investments, holding of foreign currencies, currency gains or losses realized between the trade and settlement dates on foreign investment transactions, and the difference between the amounts of dividends, interest and foreign withholding taxes recorded on the Fund’s books and the U.S. dollar equivalent amounts actually received or paid. Net unrealized currency gains and losses from valuing foreign currency denominated assets and liabilities at year-end exchange rates are reflected as a component of net unrealized appreciation or depreciation of foreign currency denominated assets and liabilities.
(j) Use of Estimates
The presentation of financial statements in conformity with GAAP requires management to make estimates and assumptions that affect the reported amounts of assets and liabilities at the date of the financial statements and the reported amounts of income and expenses during the reporting period. Actual results could differ from those estimates.
(k) Federal Income Taxes
The Fund intends to comply with the requirements of Subchapter M of the Internal Revenue Code applicable to regulated investment companies and to distribute substantially all of their net investment income and any net realized gains to their shareholders. Therefore, no provision is made for federal income or excise taxes. Due to the timing of dividend distributions and the differences in accounting for income and realized gains and losses for financial statement and federal income tax purposes, the fiscal year in which amounts are distributed may differ from the year in which the income and realized gains and losses are recorded by the Fund.
Accounting for Uncertainty in Income Taxes (the “Income Tax Statement”) requires an evaluation of tax positions taken (or expected to be taken) in the course of preparing a Fund’s tax returns to determine whether these positions meet a “more-likely-than-not” standard that, based on the technical merits, have a more than fifty percent likelihood of being sustained by a taxing authority upon examination. A tax position that meets the “more-likely-than-not” recognition threshold is measured to determine the amount of benefit to recognize in the financial statements. The Fund recognizes interest and penalties, if any, related to unrecognized tax benefits as income tax expense in the Statement of Operations.
The Income Tax Statement requires management of the Fund to analyze tax positions taken in the prior three open tax years, if any, and tax positions expected to be taken in the Fund’s current tax year, as defined by the IRS statute of limitations for all major jurisdictions, including federal tax authorities and certain state tax authorities. As of June 30, 2026, and during the prior three open tax years, the Fund did not have a liability for any unrecognized tax benefits. The Fund has no examinations in progress and is not aware of any tax positions for which it is reasonably possible that the total amounts of unrecognized tax benefits will significantly change in the next twelve months.
(l) Distributions to Shareholders
The Fund will make distributions of net investment income monthly and net capital gains, if any, at least annually. Distributions to shareholders are recorded on the ex-dividend date. The amount and timing of distributions are determined in accordance with federal income tax regulations, which may differ from GAAP.
The character of distributions made during the year from net investment income or net realized gains may differ from the characterization for federal income tax purposes due to differences in the recognition of income, expense and gain (loss) items for financial statement and tax purposes.
NOTE 3—Investment Advisory and Other Agreements
Pursuant to an investment advisory agreement (“the “Agreement”), the Fund pays a monthly investment advisory fee to the Adviser at the annual rate of 0.725% for the first $100 million, 0.700% for the next $100 million, and 0.675% in excess of $200 million of average total net assets of the last business day of each month.
The Agreement obligates the Adviser to waive its fees and/or pay for operating expenses of the Fund to ensure that total annual fund operating expenses (exclusive of interest, taxes, the cost of brokerage and research services, legal expenses related to portfolio securities, and extraordinary expenses such as litigation) do not exceed 1.50% of the first $30 million and 1.00% of the remaining average total net assets of the last business day of each month. For the six months ended June 30, 2026, the Adviser did not waive any portion of its advisory fee.
UMB Fund Services, Inc. (“UMBFS”) serves as the Fund’s fund accountant and co-administrator; and Mutual Fund Administration, LLC (“MFAC”) serves as the Fund’s other co-administrator. UMB Bank, n.a., an affiliate of UMBFS, serves as the Fund’s custodian. Equiniti Trust Company, LLC serves as the Fund’s transfer agent. The Fund’s allocated fees incurred for fund accounting, fund administration, custody, and transfer agent services for the six months ended June 30, 2026 are reported as Fund services fees on the Statement of Operations. Certain directors and officers of the Fund are employees of UMBFS, MFAC or the Adviser. The Fund does not compensate directors and officers affiliated with the Fund’s co-administrators or the Adviser. For the six months ended
36
SOURCE CAPITAL
NOTES TO FINANCIAL STATEMENTS (Continued)
June 30, 2026
(Unaudited)
June 30, 2026, the Fund’s allocated fees incurred to directors of the Fund who are not “interested persons” of the Fund, as that term is defined in the 1940 Act (collectively, the “Independent Directors”) are reported as Directors’ fees and expenses on the Statement of Operations.
The Fund’s Board of Directors adopted a Deferred Compensation Plan (the “Plan”) for the Independent Directors that enables Directors to elect to receive payment in cash or the option to defer some or all of their fees. If a director elects to defer payment, the Plan provides for the creation of a deferred payment account. A Director’s deferred fees are deemed to be invested in designated mutual funds available under the Plan. The Fund’s liability for these amounts is adjusted for market value changes in the invested fund and remains a liability to the Fund until distributed in accordance with the Plan. The Directors Deferred compensation liability under the Plan constitutes a general unsecured obligation of the Fund and is disclosed in the Statement of Assets and Liabilities. Contributions made under the plan and the change in unrealized appreciation/depreciation and income are included in the Directors’ fees and expenses in the Statement of Operations. For the six months ended June 30, 2026, no Directors fees were deferred.
Dziura Compliance Consulting, LLC provides Chief Compliance Officer (“CCO”) services to the Fund. The Fund’s allocated fees incurred for CCO services for the six months ended June 30, 2026 are reported on the Statement of Operations.
NOTE 4—Federal Income Taxes
At June 30, 2026, gross unrealized appreciation/(depreciation) of investments, based on cost for federal income tax purposes were as follows:
|
Cost of investments |
$ |
329,914,258 |
|
|
Gross unrealized appreciation |
$ |
90,526,274 |
|
|
Gross unrealized depreciation |
(15,227,157 |
) |
|
|
Net unrealized appreciation/(depreciation) |
$ |
75,229,117 |
The difference between cost amounts for financial statement and federal income tax purposes is due primarily to timing differences in recognizing certain gains and losses in security transactions.
NOTE 5—Investment Transactions
For the six months ended June 30, 2026, purchases and sales of investments, excluding short-term investments, were $43,005,746 and $52,247,788, respectively.
NOTE 6—Indemnifications
In the normal course of business, the Fund enters into contracts that contain a variety of representations which provide general indemnifications. The Fund’s maximum exposure under these arrangements is unknown, as this would involve future claims that may be made against the Fund that have not yet occurred. However, the Fund expects the risk of loss to be remote.
NOTE 7—Commitments and Contingencies
The Fund may enter into unfunded loan commitments. Unfunded loan commitments may be partially or wholly unfunded. During the contractual period, the Fund is obliged to provide funding to the borrower upon demand. Unfunded loan commitments are fair valued in accordance with the valuation policy described in Note 2(a) and unrealized appreciation or depreciation, if any, is recorded on the Statement of Assets and Liabilities. As of June 30, 2026, the total unfunded amount was 1.85% of the Fund’s net assets.
As of June 30, 2026, the Fund had the following unfunded loan commitments outstanding:
|
Loan |
Principal |
Cost |
Value |
Unrealized |
Unfunded |
||||||||||||||||
|
Andromeda Funding LP |
$ |
3,000,000 |
$ |
— |
$ |
— |
$ |
— |
$ |
3,000,000 |
|||||||||||
|
Lealand Finance Company B.V. |
3,927,194 |
(8,859 |
) |
(196,360 |
) |
(187,501 |
) |
3,927,194 |
|||||||||||||
|
Lealand Finance Company B.V. |
1,234,380 |
(743,146 |
) |
(61,719 |
) |
681,427 |
61,719 |
||||||||||||||
|
One Camelback Loan |
2,050,000 |
1,447,390 |
1,447,390 |
— |
602,610 |
||||||||||||||||
37
SOURCE CAPITAL
NOTES TO FINANCIAL STATEMENTS (Continued)
June 30, 2026
(Unaudited)
As of June 30, 2026, the Fund valued its limited partnerships using NAV as a practical expedient. These limited partnerships are closed-end credit partnerships and the Fund was liable for unfunded commitments of $17,768,194. The Fund cannot redeem from these partnerships and will receive distributions from the limited partnerships as their credit investments are liquidated.
NOTE 8—Fair Value Measurements and Disclosure
Fair Value Measurements and Disclosures defines fair value, establishes a framework for measuring fair value in accordance with GAAP, and expands disclosure about fair value measurements. It also provides guidance on determining when there has been a significant decrease in the volume and level of activity for an asset or a liability, when a transaction is not orderly, and how that information must be incorporated into a fair value measurement.
Under Fair Value Measurements and Disclosures, various inputs are used in determining the value of the Fund’s investments. These inputs are summarized into three broad Levels as described below:
The availability of observable inputs can vary from security to security and is affected by a wide variety of factors, including, for example, the type of security, whether the security is new and not yet established in the marketplace, the liquidity of markets, and other characteristics particular to the security. To the extent that valuation is based on models or inputs that are less observable or unobservable in the market, the determination of fair value requires more judgment. Accordingly, the degree of judgment exercised in determining fair value is greatest for instruments categorized in Level 3.
The inputs used to measure fair value may fall into different Levels of the fair value hierarchy. In such cases, for disclosure purposes, the Level in the fair value hierarchy within which the fair value measurement falls in its entirety, is determined based on the lowest Level input that is significant to the fair value measurement in its entirety.
The inputs or methodology used for valuing securities are not an indication of the risk associated with investing in those securities. The following is a summary of the inputs used, as of June 30, 2026, in valuing the Fund’s assets carried at fair value:
|
Investments |
Level 1 |
Level 2 |
Level 3 |
NAV as |
Total |
Asset-Backed Securities
|
Collateralized Loan Obligation |
$ |
— |
$ |
6,187,494 |
$ |
— |
$ |
— |
$ |
6,187,494 |
|||||
|
Equipment |
— |
— |
136,702 |
— |
136,702 |
||||||||||
|
Other |
— |
5,729,218 |
— |
— |
5,729,218 |
||||||||||
|
Convertible Bonds |
— |
230,277 |
— |
— |
230,277 |
||||||||||
|
Corporate Bank Debt |
— |
1,781,023 |
21,705,986 |
— |
23,487,009 |
||||||||||
Corporate Bonds
|
Communications |
— |
2,644,430 |
— |
— |
2,644,430 |
|
|
Consumer Discretionary |
— |
2,807,696 |
— |
— |
2,807,696 |
|
|
Financials |
— |
7,117,313 |
6,385,000 |
— |
13,502,313 |
|
|
Closed-End Funds |
— |
— |
163,553 |
— |
163,553 |
|
Common Stocks
|
Aerospace & Defense |
6,048,143 |
— |
— |
— |
6,048,143 |
|
Apparel & Textile Products |
1,915,139 |
— |
— |
— |
1,915,139 |
|
Asset Management |
— |
— |
— |
— |
— |
|
Banking |
8,173,306 |
— |
— |
— |
8,173,306 |
|
Beverages |
8,764,680 |
— |
— |
— |
8,764,680 |
|
Biotech & Pharma |
2,143,352 |
— |
— |
— |
2,143,352 |
|
Cable & Satellite |
6,357,300 |
— |
— |
— |
6,357,300 |
|
Chemicals |
17,201,262 |
— |
— |
— |
17,201,262 |
|
Commercial Support Services |
7,847,347 |
— |
— |
— |
7,847,347 |
|
Construction Materials |
4,772,371 |
— |
— |
— |
4,772,371 |
38
SOURCE CAPITAL
NOTES TO FINANCIAL STATEMENTS (Continued)
June 30, 2026
(Unaudited)
|
Investments |
Level 1 |
Level 2 |
Level 3 |
NAV as |
Total |
||||||||||||||||
|
E-Commerce Discretionary |
$ |
2,847,925 |
$ |
— |
$ |
— |
$ |
— |
$ |
2,847,925 |
|||||||||||
|
Electric Utilities |
152,171 |
— |
— |
— |
152,171 |
||||||||||||||||
|
Electrical Equipment |
5,591,452 |
— |
— |
— |
5,591,452 |
||||||||||||||||
|
Engineering & Construction |
4,448,527 |
— |
2,158,955 |
— |
6,607,482 |
||||||||||||||||
|
Entertainment Content |
— |
— |
994,767 |
— |
994,767 |
||||||||||||||||
|
Food |
5,585,743 |
— |
— |
— |
5,585,743 |
||||||||||||||||
|
Health Care Facilities & Svcs |
931,607 |
— |
— |
— |
931,607 |
||||||||||||||||
|
Home Construction |
3,672,426 |
— |
— |
— |
3,672,426 |
||||||||||||||||
|
Institutional Financial Svcs |
298,581 |
— |
— |
— |
298,581 |
||||||||||||||||
|
Insurance |
9,417,351 |
— |
— |
— |
9,417,351 |
||||||||||||||||
|
Internet Media & Services |
26,631,604 |
— |
— |
— |
26,631,604 |
||||||||||||||||
|
Leisure Facilities & Services |
3,209,287 |
— |
— |
— |
3,209,287 |
||||||||||||||||
|
Machinery |
2,414,313 |
— |
— |
— |
2,414,313 |
||||||||||||||||
|
Medical Equipment & Devices |
16,602,387 |
— |
— |
— |
16,602,387 |
||||||||||||||||
|
Metals & Mining |
5,902,149 |
— |
— |
— |
5,902,149 |
||||||||||||||||
|
Oil & Gas Services & Equip |
1,980,027 |
— |
— |
— |
1,980,027 |
||||||||||||||||
|
Real Estate Services |
170,215 |
— |
— |
— |
170,215 |
||||||||||||||||
|
Retail—Discretionary |
4,626,046 |
— |
— |
— |
4,626,046 |
||||||||||||||||
|
Semiconductors |
15,662,438 |
— |
— |
— |
15,662,438 |
||||||||||||||||
|
Software |
3,037,319 |
— |
— |
— |
3,037,319 |
||||||||||||||||
|
Specialty Finance |
1,577,840 |
— |
— |
— |
1,577,840 |
||||||||||||||||
|
Technology Hardware |
1,871,207 |
— |
— |
— |
1,871,207 |
||||||||||||||||
|
Technology Services |
1,926,343 |
— |
— |
— |
1,926,343 |
||||||||||||||||
|
Telecommunications |
118,279 |
— |
— |
— |
118,279 |
||||||||||||||||
|
Transportation & Logistics |
— |
— |
2,702,464 |
— |
2,702,464 |
||||||||||||||||
|
Transportation Equipment |
824,706 |
— |
— |
— |
824,706 |
||||||||||||||||
|
Limited Partnerships |
— |
— |
16,125,547 |
61,348,775 |
77,474,322 |
||||||||||||||||
Preferred Stocks
|
Industrials |
— |
— |
65,370 |
— |
65,370 |
|||||||||||
|
Warrants |
— |
— |
22,096 |
— |
22,096 |
|||||||||||
|
Short-Term Investments |
1,747,848 |
82,436,018 |
— |
— |
84,183,866 |
|||||||||||
|
$ |
184,470,691 |
$ |
108,933,469 |
$ |
50,460,440 |
$ |
61,348,775 |
$ |
405,213,375 |
|||||||
The following is a reconciliation of assets in which significant unobservable inputs (Level 3) were used in determining value:
|
Invesments |
Beginning |
Transfers |
Total |
Total change |
Accretion of |
Net |
Net |
Ending |
|||||||||||||||||||||||||||||
|
Asset-Backed |
$ |
202,724 |
— |
$ |
35 |
$ |
3,076 |
$ |
— |
$ |
— |
$ |
(69,133 |
) |
$ |
136,702 |
|||||||||||||||||||||
|
Corporate |
25,760,157 |
— |
55,638 |
1,327,131 |
23,015 |
26,529 |
(5,486,484 |
) |
21,705,986 |
||||||||||||||||||||||||||||
|
Corporate Bonds |
6,385,000 |
— |
— |
— |
— |
— |
— |
6,385,000 |
|||||||||||||||||||||||||||||
39
SOURCE CAPITAL
NOTES TO FINANCIAL STATEMENTS (Continued)
June 30, 2026
(Unaudited)
|
Invesments |
Beginning |
Transfers |
Total |
Total change |
Accretion of |
Net |
Net |
Ending |
|||||||||||||||||||||||||||||||
|
Closed-End Funds |
$ |
163,553 |
— |
$ |
— |
$ |
— |
$ |
— |
$ |
— |
$ |
— |
$ |
163,553 |
||||||||||||||||||||||||
|
Common Stocks |
5,876,046 |
— |
(1,520,729 |
) |
1,764,978 |
— |
— |
(264,109 |
) |
5,856,186 |
|||||||||||||||||||||||||||||
|
Limited |
17,285,427 |
— |
— |
(525,887 |
) |
(633,993 |
) |
— |
— |
16,125,547 |
|||||||||||||||||||||||||||||
|
Preferred Stocks |
65,370 |
— |
— |
— |
— |
— |
— |
65,370 |
|||||||||||||||||||||||||||||||
|
Warrants |
13,813 |
— |
— |
8,283 |
— |
— |
— |
22,096 |
|||||||||||||||||||||||||||||||
|
$ |
55,752,090 |
— |
$ |
(1,465,056 |
) |
$ |
2,577,581 |
$ |
(610,978 |
) |
$ |
26,529 |
$ |
(5,819,726 |
) |
$ |
50,460,440 |
||||||||||||||||||||||
The change in unrealized gains or losses attributable to Level 3 investments held at June 30, 2026 was $2,546,555.
The following table presents additional quantitative information about valuation methodologies and inputs used for investments that are measured at fair value and categorized within Level 3 as of June 30, 2026:
|
Asset Class |
Fair Value |
Valuation |
Unobservable |
Input |
Valuation |
Impact to |
|||||||||||||||||||||
|
Asset-Backed Securities— |
$ |
136,702 |
Third-Party Broker Quote(2) |
Quotes/Prices |
$ |
95.50 |
$ |
95.50 |
Increase |
||||||||||||||||||
|
Corporate Bank Debt |
$ |
17,170,206 |
Pricing Model(3) |
Cost |
$ |
98.25-$100.00 |
$ |
99.70 |
Increase |
||||||||||||||||||
|
$ |
46 |
Asset Approach(4) |
Estimated Recovery Proceeds |
$ |
0.01 |
$ |
0.01 |
Increase |
|||||||||||||||||||
|
$ |
2,434,706 |
Third-Party Broker Quote(2) |
Quotes/Prices |
$ |
95.00-$101.92 |
$ |
101.54 |
Increase |
|||||||||||||||||||
|
$ |
2,101,028 |
Pricing Model(5) |
Quotes/Prices |
$ |
5.00-$95.00 |
$ |
91.86 |
Increase |
|||||||||||||||||||
|
Corporate Bonds |
$ |
6,385,000 |
Pricing Model(3) |
Cost |
$ |
100.00 |
$ |
100.00 |
Increase |
||||||||||||||||||
|
Closed-End Funds |
$ |
163,553 |
Pricing Model(6) |
Last Reported Trade |
$ |
1.15 |
$ |
1.15 |
Increase |
||||||||||||||||||
|
Common Stocks |
$ |
— |
Pricing Model(7) |
Corporate Action |
$ |
0.00 |
$ |
0.00 |
Increase |
||||||||||||||||||
|
$ |
994,767 |
Most Recent Capitalization |
Revenue Multiple |
$ |
228.84 |
2x |
Increase |
||||||||||||||||||||
|
$ |
2,158,955 |
Pricing Model(9) |
Quotes/Prices |
$ |
24.90 |
$ |
24.90 |
Increase |
|||||||||||||||||||
|
$ |
2,702,464 |
Pricing Model(6) |
Last Reported Trade |
$ |
32.00 |
$ |
32.00 |
Increase |
|||||||||||||||||||
|
Preferred Stocks |
$ |
65,370 |
Pricing Model(3) |
Cost |
$ |
1,000.00 |
$ |
1,000.00 |
Increase |
||||||||||||||||||
|
Warrants |
$ |
22,096 |
Pricing Model(10) |
Price of Similar Security |
$ |
11.07 |
$ |
11.07 |
Increase |
||||||||||||||||||
|
$ |
— |
Asset Approach(11) |
Estimated Recovery Proceeds |
$ |
0.00 |
$ |
0.00 |
Increase |
|||||||||||||||||||
|
Limited Partnerships |
$ |
16,125,547 |
Adjusted NAV as Practical |
Quotes/Prices |
(5 |
%)-20% |
$ |
0.12 |
Increase |
||||||||||||||||||
40
SOURCE CAPITAL
NOTES TO FINANCIAL STATEMENTS (Continued)
June 30, 2026
(Unaudited)
The following is the fair value measurement of investments that are valued at NAV per share (or its equivalent) as a practical expedient:
|
Limited Partnerships |
Investment |
Value |
Unfunded |
Redemption |
Redemption |
Lock Up Period |
|||||||||||||||||||||
|
BH3 Debt Opportunity Fund II-Parallel, LP |
Private Credit |
$ |
1,521,978 |
$ |
769,796 |
Closed End Fund |
N/A |
N/A |
|||||||||||||||||||
|
Blue Torch Credit Opportunities Fund II LP |
Private Credit |
2,960,647 |
1,136,269 |
Closed End Fund |
N/A |
N/A |
|||||||||||||||||||||
|
Castlelake Asset LP Based Private Credit |
Private Credit |
3,673,805 |
— |
Quarterly |
60 days |
1 year |
|||||||||||||||||||||
|
HIG WhiteHorse Direct Lending 2020 LP |
Private Credit |
3,621,837 |
1,872,729 |
Annual |
30 days |
27 months |
|||||||||||||||||||||
|
Jett Texas LLC |
Long-term Equity |
7,045,800 |
— |
Closed End Fund |
N/A |
N/A |
|||||||||||||||||||||
|
Metro Partners Fund VII LP |
Private Credit |
9,032,443 |
— |
Closed End Fund |
N/A |
N/A |
|||||||||||||||||||||
|
MRP Evergreen Income Fund LP |
Private Credit |
3,900,000 |
— |
Annual |
90 days |
2 years |
|||||||||||||||||||||
|
MSD Private Credit Opportunities Fund II LP |
Private Credit |
4,936,889 |
3,847,059 |
Closed End Fund |
N/A |
N/A |
|||||||||||||||||||||
|
MSD Real Estate Credit Opportunities Fund |
Private Credit |
1,376,685 |
2,306,185 |
Closed End Fund |
N/A |
N/A |
|||||||||||||||||||||
|
Nebari Natural Resources Credit Fund I LP |
Private Credit |
1,648,010 |
— |
Closed End Fund |
N/A |
N/A |
|||||||||||||||||||||
|
Piney Lake Opportunities Fund LP |
Private Credit |
3,212,165 |
— |
Semi-annual |
65 days |
5 years |
|||||||||||||||||||||
|
Silverview Credit Opportunities Onshore Fund LP |
Private Credit |
1,425,100 |
— |
Closed End Fund |
N/A |
N/A |
|||||||||||||||||||||
|
Sound Point Strategic Capital Fund III LP |
Private Credit |
401,699 |
2,348,301 |
Closed End Fund |
N/A |
N/A |
|||||||||||||||||||||
|
Tioga Partners IV, LP |
Private Credit |
13,591,717 |
— |
Closed End Fund |
N/A |
N/A |
|||||||||||||||||||||
|
TPG A.G. Asset Based Credit Evergreen LP |
Private Credit |
— |
4,275,000 |
Annual |
90 Days |
1 Year |
|||||||||||||||||||||
|
Trevian Capital Debt Fund, LP |
Private Credit |
3,000,000 |
— |
Monthly |
60 days |
2 years |
|||||||||||||||||||||
|
$ |
61,348,775 |
$ |
16,555,339 |
||||||||||||||||||||||||
NOTE 9—Capital Stock
During the six months ended June 30, 2026, the Fund did not issue shares of
NOTE 10—Investments in Affiliated Issuers
An affiliated issuer is an entity in which the Fund has ownership of a least 5% of the voting securities. Issuers that are affiliates of the Fund at period-end are noted in the Fund’s Schedule of Investments. Additional security purchases and the reduction of certain securities shares outstanding of existing portfolio holdings that were not considered affiliated in prior years may result in the Fund owning in excess of 5% of the outstanding shares at period-end. The table below reflects transactions during the period with entities
41
SOURCE CAPITAL
NOTES TO FINANCIAL STATEMENTS (Continued)
June 30, 2026
(Unaudited)
that are affiliates as of June 30, 2026 and may include acquisitions of new investments, prior year holdings that became affiliated during the period and prior period affiliated holdings that are no longer affiliated as of period-end:
|
Affiliated |
Shares |
Beginning |
Purchases |
Proceeds |
Net |
Accretion |
Change in |
Transfer |
Ending |
Ending |
Income |
|||||||||||||||||||||||||||||||||
|
FPS |
Holdco II |
10,507,864 |
$ |
8,549,412 |
— |
— |
— |
— |
$ |
151,323 |
— |
$ |
8,700,735 |
10,507,864 |
— |
|||||||||||||||||||||||||||||
|
Total |
$ |
8,549,412 |
— |
— |
— |
— |
$ |
151,323 |
— |
$ |
8,700,735 |
— |
||||||||||||||||||||||||||||||||
NOTE 11—Restricted Securities
Restricted securities include securities that have not been registered under the Securities Act of 1933, as amended, and securities that are subject to restrictions on resale. The Fund may invest in restricted securities that are consistent with the Fund’s investment objective and investment strategies. Investments in restricted securities are valued at net asset value as a practical expedient for fair value, or fair value as determined in good faith in accordance with procedures adopted by the Board. It is possible that the estimated value may differ significantly from the amount that might ultimately be realized in the near term, and the difference could be material.
As of June 30, 2026, the Fund invested in the following restricted securities:
|
Restricted Security |
Initial |
Cost |
Fair Value |
Fair Value as a |
||||||||
|
Altegrity, Inc. |
9/1/2021 |
$ |
— |
$ |
163,553 |
0.04 |
% |
|||||
|
Andromeda Funding LP, 10.000% |
4/1/2026 |
— |
— |
0.00 |
% |
|||||||
|
Apollo Debt Solutions BDC Senior Notes, |
8/10/2023 |
2,333,000 |
2,333,000 |
0.57 |
% |
|||||||
|
Banner Commercial Funding LP Term Loan, |
6/10/2025 |
2,928,821 |
2,916,797 |
0.72 |
% |
|||||||
|
BH3 Debt Opportunity Fund II-Parallel, LP |
9/10/2024 |
1,530,204 |
1,521,978 |
0.37 |
% |
|||||||
|
Blue Torch Credit Opportunities Fund II LP |
2/16/2021 |
4,331,454 |
2,960,647 |
0.73 |
% |
|||||||
|
Capstone Acquisition Holdings, Inc. |
11/12/2020 |
2,243,024 |
2,299,876 |
0.56 |
% |
|||||||
|
Castlelake Asset-Based Private Credit III |
4/1/2025 |
3,900,000 |
3,673,805 |
0.90 |
% |
|||||||
|
Clover Private Credit Opportunities Fund LP |
12/13/2021 |
3,145,637 |
2,044,167 |
0.50 |
% |
|||||||
|
Copper Property CTL Pass Through Trust |
10/5/2017 |
528,672 |
170,215 |
0.04 |
% |
|||||||
|
Cornerstone OnDemand, Inc., 7.744% |
12/7/2022 |
71,209 |
44,387 |
0.01 |
% |
|||||||
|
Epic Games, Inc. |
6/25/2020 |
2,499,525 |
994,767 |
0.24 |
% |
|||||||
|
EQS Legacy Holdings LLC Term Loan, |
3/27/2025 |
9,306,019 |
9,306,019 |
2.28 |
% |
|||||||
|
FPS Holdco II LLC |
8/9/2024 |
7,045,531 |
8,700,735 |
2.14 |
% |
|||||||
|
HIG WhiteHorse Direct Lending 2020 LP |
7/30/2021 |
3,653,803 |
3,621,837 |
0.89 |
% |
|||||||
|
Hlend Senior Notes, 8.170% 3/15/2028 |
2/16/2023 |
3,500,000 |
3,500,000 |
0.86 |
% |
|||||||
42
SOURCE CAPITAL
NOTES TO FINANCIAL STATEMENTS (Continued)
June 30, 2026
(Unaudited)
|
Restricted Security |
Initial |
Cost |
Fair Value |
Fair Value as a |
||||||||||
|
JC Penney Corp., Inc., 5.568% |
2/3/2021 |
$ |
— |
$ |
46 |
0.00 |
% |
|||||||
|
Jett Texas LLC |
12/2/2024 |
6,000,000 |
7,045,800 |
1.73 |
% |
|||||||||
|
Lealand Finance Company B.V. Senior Exit LC, |
11/12/2019 |
(743,146 |
) |
(61,719 |
) |
‑0.02 |
% |
|||||||
|
Lealand Finance Company B.V. Senior Exit LC, |
2/28/2020 |
(8,859 |
) |
(196,360 |
) |
‑0.05 |
% |
|||||||
|
Lealand Reficar LC Term Loan, 11.494% |
4/5/2024 |
36,048 |
32,443 |
0.01 |
% |
|||||||||
|
McDermott International, Ltd. |
7/1/2020 |
294,091 |
2,158,955 |
0.53 |
% |
|||||||||
|
McDermott LC, 7.953% (3-Month Term |
12/31/2020 |
834,171 |
767,436 |
0.19 |
% |
|||||||||
|
McDermott Technology Americas, Inc., |
7/1/2020 |
141,925 |
134,830 |
0.03 |
% |
|||||||||
|
McDermott Technology Americas, Inc., |
7/1/2020 |
1,916,439 |
1,559,228 |
0.38 |
% |
|||||||||
|
Metro Partners Fund VII LP |
5/13/2021 |
6,124,327 |
9,032,443 |
2.22 |
% |
|||||||||
|
MRP Evergreen Income Fund LP |
11/19/2025 |
3,900,000 |
3,900,000 |
0.96 |
% |
|||||||||
|
MSD Private Credit Opportunities Fund II LP |
3/8/2021 |
2,646,103 |
4,936,889 |
1.21 |
% |
|||||||||
|
MSD Real Estate Credit Opportunities Fund |
6/11/2020 |
693,815 |
1,376,685 |
0.34 |
% |
|||||||||
|
Nebari Natural Resources Credit Fund I LP |
8/18/2020 |
2,446,960 |
1,648,010 |
0.40 |
% |
|||||||||
|
OCREDIT BDC Senior Notes, 7.770% 3/7/2029 |
2/22/2024 |
552,000 |
552,000 |
0.14 |
% |
|||||||||
|
One Camelback Loan, 7.500% (1-Month Term |
12/4/2025 |
1,447,390 |
1,447,390 |
0.36 |
% |
|||||||||
|
Pershing Square SPARC Holdings, Ltd. |
6/12/2026 |
— |
— |
0.00 |
% |
|||||||||
|
Pershing Square Tontine Holdings Ltd. |
7/26/2022 |
— |
— |
0.00 |
% |
|||||||||
|
PHI Group, Inc. |
8/19/2019 |
690,707 |
2,702,464 |
0.66 |
% |
|||||||||
|
Piney Lake Opportunities Fund LP |
6/30/2021 |
1,796,043 |
3,212,165 |
0.79 |
% |
|||||||||
|
Plantation Loan, 10.500% (1-Month Term |
8/5/2025 |
3,489,772 |
3,500,000 |
0.86 |
% |
|||||||||
|
Post Road Special Opportunity Fund II LP |
1/26/2021 |
1,525,290 |
1,989,132 |
0.49 |
% |
|||||||||
|
Prop 2017‑1A, 5.300% 3/15/2042 |
2/9/2017 |
143,072 |
136,702 |
0.03 |
% |
|||||||||
|
Silverview Credit Opportunities Onshore Fund LP |
11/18/2019 |
769,932 |
1,425,100 |
0.35 |
% |
|||||||||
|
Silverview Special Situations Lending LP |
9/25/2020 |
4,207,379 |
3,391,513 |
0.83 |
% |
|||||||||
|
Sound Point Strategic Capital Fund III LP |
12/29/2025 |
401,699 |
401,699 |
0.10 |
% |
|||||||||
|
Tioga Partners IV, LP |
1/15/2025 |
14,000,000 |
13,591,717 |
3.34 |
% |
|||||||||
|
TPG A.G. Asset Based Credit Evergreen LP |
5/29/2026 |
— |
— |
0.00 |
% |
|||||||||
|
Trevian Capital Debt Fund, LP |
3/13/2025 |
3,000,000 |
3,000,000 |
0.74 |
% |
|||||||||
|
Uniti Group, Inc. |
11/16/2020 |
— |
22,096 |
0.01 |
% |
|||||||||
|
Uniti Group, Inc.—Series A |
11/16/2020 |
124,813 |
65,370 |
0.02 |
% |
|||||||||
|
Vision Solutions, Inc., 7.928% (3-Month Term |
12/7/2022 |
65,789 |
53,754 |
0.01 |
% |
|||||||||
|
WH Borrower LLC, 8.142% (3-Month Term |
2/12/2025 |
1,670,292 |
1,682,882 |
0.41 |
% |
|||||||||
|
$ |
105,182,951 |
$ |
113,760,453 |
27.92 |
% |
|||||||||
43
SOURCE CAPITAL
NOTES TO FINANCIAL STATEMENTS (Continued)
June 30, 2026
(Unaudited)
NOTE 12—Market Disruption and Geopolitical Risks
Certain local, regional or global events such as war, acts of terrorism, the spread of infectious illness and/or other public health issues, financial institution instability or other events may have a significant impact on a security or instrument. These types of events and other like them are collectively referred to as “Market Disruptions and Geopolitical Risks” and they may have adverse impacts on the worldwide economy, as well as the economies of individual countries, the financial health of individual companies and the market in general in significant and unforeseen ways. Some of the impacts noted in recent times include but are not limited to embargos, political actions, supply chain disruptions, tariffs, bank failures, restrictions to investment and/or monetary movement including the forced selling of securities or the inability to participate impacted markets. The duration of these events could adversely affect the Funds’ performance, the performance of the securities in which the Funds invest and may lead to losses on your investment. The ultimate impact of “Market Disruptions and Geopolitical Risks” on the financial performance of the Funds’ investments is not reasonably estimable at this time. Management is actively monitoring these events.
NOTE 13—Line of Credit
The Fund has entered into a Senior Secured Revolving Credit Facility (“Facility”) of $20,000,000 with UMB Bank, n.a. The Fund is permitted to borrow up to the lesser of the available credit line amount or an amount up to 33.3% of the adjusted net assets of the Fund. Borrowings under this agreement bear interest SOFR plus 250 bps. As compensation for holding the lending commitment available, the Fund is charged a commitment fee on the average daily unused balance of the Facility at the rate of 0.20% per annum. The commitment fees for the six months ended June 30, 2026 are disclosed in the Statement of Operations. During the six months ended June 30, 2026, the fund did not borrow under the line of credit.
NOTE 14—Investment in Private Funds
The Fund invests in certain private funds that would be investment companies but for the exemptions under Sections 3(c)(1) or 3(c)(7) of the 1940 Act. The Fund may invest in such private funds to the extent consistent with its investment objective, investment strategy and otherwise as permitted under the 1940 Act. Previously, the staff of the SEC generally required that closed-end funds limit their investment in private funds to no more than 15% of their assets unless they limit their offers to investors who qualify as “accredited investors” under Regulation D under the Securities Act of 1933 and have required minimum initial investments of at least $25,000. The SEC staff issued guidance on August 15, 2025 that it will no longer request such a limitation. Therefore, the Fund may invest greater than 15% of its assets in private funds.
Accordingly, the Fund may invest in private funds that pursue various strategies, including but not limited to private credit investments in private funds as well as direct investments.
When selecting private fund investments, the Adviser conducts a qualitative and quantitative evaluation of potential external managers, their respective strategies, and pertinent funds. The Adviser seeks to identify private fund managers that, among other considerations, possess extensive experience in their area of expertise, are part of a professional organization with operational depth, and have clear, well-developed strategies to which they have consistently adhered. The Adviser judges such private fund managers based on their key personnel’s experience, character, professional qualifications, investment style, organizational resources, and emphasis on protecting capital. The Adviser also seeks to develop a working relationship with private fund managers to ensure timely and accurate reporting, accurate and verifiable valuation information, adequate transparency, a healthy flow of information, and acceptable documentation.
When lending directly, the Adviser will underwrite a total expected return (including interest and other fees) in the context of understandable collateral that the Adviser believes should offer attractive asset coverage.
Private fund investments are subject to the following risks, among others:
A shareholder’s investment in the Fund will be affected by the investment policies and decisions of the portfolio managers of each private fund in which the Fund invests, which may impact the strategies, risks, and costs of and for the Fund itself. The Fund’s NAV may fluctuate in response to, among other things, various market and economic factors related to the markets in which the private funds invest and the financial condition and prospects of issuers in which the private funds invest. Shareholders of the Fund may have limited information about the private funds in which the Fund invests, including with respect to the private funds’ holdings, liquidity, and valuation.
The Fund is registered as an investment company under the 1940 Act, which is designed to afford various protections to investors in pooled investment vehicles. However, the private funds in which the Fund invests are not subject to the provisions of the 1940 Act. Accordingly, the provisions of the 1940 Act (which, among other things, require investment companies to have a majority of disinterested directors, require securities to be held in custody by a bank or broker in accordance with rules requiring the segregation of securities, prohibit the investment companies from engaging in certain transactions with its affiliates and regulate the relationship
44
SOURCE CAPITAL
NOTES TO FINANCIAL STATEMENTS (Continued)
June 30, 2026
(Unaudited)
between advisers and investment companies) are not applicable to such private funds. Managers of private funds might not be registered as investment advisers under the Investment Advisers Act of 1940, as amended (the “Investment Advisers Act”). If the Fund invests in private funds managed by managers that are not registered as investment advisers, or that comply with an exemption from registration as an investment adviser, the Fund will not have the benefit of certain of the protections of the Investment Advisers Act.
The interests of the private funds in which the Fund invests are illiquid. There is often no secondary market for interests in many private funds, which typically must be sold in privately negotiated transactions. In addition, the Fund’s interests in private funds may be subject to substantial restrictions on transfer, and the Fund may liquidate an interest and withdraw from a private fund pursuant to limited withdrawal rights. Private funds may impose a lockup period or otherwise suspend withdrawal rights of shareholders, including the Fund, from time to time. If the Adviser determines to cause the Fund to sell its interest in a private fund, the Fund may be unable to sell such interest quickly, if at all, and could therefore be obligated to continue to hold such interest for an extended period of time, or to accept a lower price for a quick sale.
The Fund will bear its pro rata share of a private fund’s expenses, including its management fees, performance fees and other expenses. The level of such fees and expenses impacts the Fund’s performance. A shareholder of the Fund bears a proportionate share of the fees and expenses of the Fund (including, among other things and as applicable, offering expenses, operating costs, brokerage transaction expenses, management fees, and administrative and custody fees) and, indirectly, similar expenses of the private funds. Thus, a shareholder of the Fund may be subject to higher operating expenses than if he or she invested in a private fund directly or in a fund that did not invest in private funds.
Performance fees are fees paid to a private fund’s manager based on the private fund’s investment performance (or returns) as compared to some benchmark. The performance fees payable to the manager of a private fund may create an incentive for the manager to make investments that are riskier or more speculative than those it might make in the absence of a performance fee. Managers of certain of the underlying private funds may receive performance fees, even if the performance of other underlying private funds—or the overall performance of the Fund itself—is negative (i.e., “netting risk”).
The Fund may invest in private funds that use borrowings to finance investments or to meet operating expenses. The use of leverage may enable private funds to produce higher total returns. However, since any fall in the value of a private fund’s investments is borne by that private fund, when there is a decline in the value of such investments, the use of leverage can also result in a greater decrease in the Fund’s investment and therefore have a material adverse impact on returns to the Fund.
Private funds in which the Fund invests will not typically have a readily determinable market price and will be fair valued by the Fund. The valuation of the Fund’s interests in private funds is ordinarily determined each business day based in part on estimated valuations provided by private fund managers and also on valuation determinations made by the Adviser, which may be based in whole or in part on information from third-party valuation services, under the general supervision of the Board. Pursuant to Rule 2a‑5 under the 1940 Act, the Board has designated the Adviser as the Fund’s “Valuation Designee” to perform the Fund’s fair value determinations, which are subject to Board oversight, as applicable, and certain reporting and other requirements intended to ensure that the Board receives the information it needs to oversee the Adviser’s fair value determinations.
The Fund may maintain a sizeable cash and/or liquid investments position in anticipation of funding private fund capital calls or near-term investment opportunities. Additionally, the Fund has a $20 million credit facility with UMB Bank, N.A. that may be used to fund private fund capital calls. Any failure by the Fund to make timely capital contributions in respect of its commitments may (i) impair the ability of the Fund to pursue its investment strategy, (ii) force the Fund to borrow, (iii) cause the Fund, and, indirectly, the shareholders to be subject to certain penalties from the private funds (including the forfeiture of the Fund’s investment in a private fund), or (iv) otherwise impair the value of the Fund’s investments (including the devaluation of the Fund).
Additional risks associated with investing in private funds include, among other things, that private funds generally may invest without limitation in restricted and illiquid investments; the external managers of the private funds often have broad indemnification rights from the private fund and limitations on liability; neither the Fund nor the Adviser controls the external managers of these private funds; and there can be no assurances that an external manager will manage its private funds in a manner consistent with either the Fund’s investment objectives and strategies or with the stated investment policies and restrictions of the private fund. These characteristics present additional risks, including the possibility of risk of total loss, for shareholders of private funds.
NOTE 15—New Accounting Pronouncements
In the reporting period, the Fund adopted FASB Accounting Standards Update 2023‑09, Income Taxes (Topic 740)—Improvements to Income Tax Disclosures (ASU 2023‑09), which enhances income tax disclosures, including disclosure of income taxes paid disaggregated by jurisdiction. Adoption of the new standard did not materially impact financial statement disclosures and did not affect the Fund’s financial position or the results of its operations.
45
SOURCE CAPITAL
NOTES TO FINANCIAL STATEMENTS (Continued)
June 30, 2026
(Unaudited)
NOTE 16—Events Subsequent to the Fiscal Period End
The Fund has adopted financial reporting rules regarding subsequent events which require an entity to recognize in the financial statements the effects of all subsequent events that provide additional evidence about conditions that existed at the date of the balance sheet. Management has evaluated the Fund’s related events and transactions that occurred through the date of issuance of the Fund’s financial statements.
There were no events or transactions that occurred during this period that materially impacted the amounts or disclosures in the Fund’s financial statements.
46
SOURCE CAPITAL
APPROVAL OF INVESTMENT ADVISORY AGREEMENT
(Unaudited)
At an in-person meeting held on April 21, 2026, the Board of Trustees (the “Board”) of Source Capital (the “Fund”), including the trustees who are not “interested persons” of the Fund (the “Independent Trustees”) as defined in the Investment Company Act of 1940, as amended (the “1940 Act”), reviewed and unanimously approved the renewal of the investment advisory agreement (the “Advisory Agreement”) between the Fund and First Pacific Advisors, LP (the “Advisor”) for an additional one-year period from when it otherwise would expire. In approving the renewal of the Advisory Agreement, the Board, including the Independent Trustees, determined that such renewal was in the best interests of the Fund and its shareholders.
Background. In advance of the meeting, the Board received information about the Fund and the Advisory Agreement from the Advisor and from Mutual Fund Administration, LLC and UMB Fund Services, Inc., the Fund’s co-administrators, certain portions of which are discussed below. The materials, among other things, included information about the Advisor’s organization and financial condition; information regarding the background, experience, and compensation structure of relevant personnel providing services to the Fund; information about the Advisor’s compliance policies and procedures, cybersecurity, disaster recovery and contingency planning, and policies with respect to portfolio execution and trading; information regarding the profitability of the Advisor’s overall relationship with the Fund; reports comparing the performance of the Fund with returns of a blended index consisting of 60% MSCI All Country World Net Return Index and 40% Bloomberg U.S. Aggregate Bond Total Return Index (the “MSCI/Bloomberg 60/40 Blended Index”), a blended index consisting of 60% S&P 500 Index and 40% Bloomberg U.S. Aggregate Bond Total Return Index (the “S&P/Bloomberg 60/40 Blended Index”), and a group of comparable funds (the “Peer Group”) selected by Broadridge Financial Solutions, Inc. (“Broadridge”) from Morningstar, Inc.’s Moderate Allocation category (the “Fund Universe”) for the one-, three-, five-, and ten-year periods ended December 31, 2025; and reports comparing the investment advisory fee and total expenses of the Fund with those of the Peer Group and Fund Universe. The Board also received a memorandum from legal counsel to the Fund and the Independent Trustees discussing the legal standards under the 1940 Act and other applicable law for their consideration of the proposed renewal of the Advisory Agreement. In addition, the Board considered information reviewed by the Board during the year at other Board and Board committee meetings.
In renewing the Advisory Agreement, the Independent Trustees met separately in an executive session prior to the meeting with the Board to consider the Advisory Agreement, including the items discussed below, and were represented by their legal counsel with respect to the matters considered. The Board, including all of the Independent Trustees, then met and also considered a variety of factors for renewal of the Advisory Agreement, including those discussed below. In their deliberations, the Board and the Independent Trustees did not identify any particular factor that was controlling, and each Trustee may have attributed different weights to the various factors.
Nature, Extent, and Quality of Services. With respect to the performance results of the Fund, the meeting materials indicated that the Fund’s annualized total returns for the one- and five-year periods were above the Peer Group and Fund Universe median returns, the returns of the MSCI/Bloomberg 60/40 Blended Index, and the returns of the S&P/Bloomberg 60/40 Blended Index. For the three‑year period, the Fund’s annualized total return was above the Peer Group and Fund Universe median returns and the MSCI/Bloomberg 60/40 Blended Index return, but below the S&P/Bloomberg 60/40 Blended Index return by 0.09%. The Fund’s annualized total return for the ten-year period was above the Fund Universe median return and the MSCI/Bloomberg 60/40 Blended Index return and was the same as the Peer Group median return, but was below the S&P/Bloomberg 60/40 Blended Index return by 0.95%. The Trustees observed that the Fund’s performance ranked in the first or second quartile of the funds in the Peer Group and Fund Universe for the one-, three- five-, and ten-year periods. The Trustees also observed that the Fund’s volatility of returns, as measured by its standard deviation; its risk-adjusted returns, as measured by its Sharpe ratio; and its downside volatility, as measured by its Morningstar risk score, ranked it in the first quartile of funds (which is the most favorable) in the Peer Group and Fund Universe for the one-, three-, five-, and ten-year periods.
The Board considered the overall quality of services provided by the Advisor to the Fund. In doing so, the Board considered the Advisor’s specific responsibilities in day-to-day management and oversight of the Fund, as well as the qualifications, experience, and responsibilities of the personnel involved in the activities of the Fund. The Board also considered the overall quality of the organization and operations of the Advisor, as well as its compliance structure. The Board and the Independent Trustees concluded that based on the various factors they had reviewed, the nature, overall quality, and extent of the management and oversight services provided by the Advisor to the Fund were satisfactory.
47
SOURCE CAPITAL
APPROVAL OF INVESTMENT ADVISORY AGREEMENT
(Unaudited) (Continued)
Advisory Fee and Expense Ratio. With respect to the advisory fee paid by the Fund, the meeting materials indicated that the annual investment advisory fee (gross of fee waivers) was lower than the Peer Group and Fund Universe medians. The Trustees considered that the Advisor does not manage any other accounts with the same objectives and policies as the Fund, and therefore they did not have a good basis for comparing the Fund’s advisory fee with those of other similar client accounts of the Advisor. The Trustees also noted that the Fund’s advisory fee was within the range of advisory fees paid by other registered funds managed by the Advisor. The annual total expenses paid by the Fund (net of fee waivers) for the Fund’s most recent fiscal year were lower than the Peer Group and Fund Universe medians.
The Board and the Independent Trustees concluded that based on the factors they had reviewed, the compensation payable to the Advisor under the Advisory Agreement was fair and reasonable in light of the nature and quality of the services the Advisor provides to the Fund.
Advisor Profitability and Costs. The Board and the Independent Trustees considered information provided by the Advisor regarding the Advisor’s costs in providing services to the Fund, the profitability of the Advisor and the benefits to the Advisor from its relationship with the Fund. The Independent Trustees reviewed and considered the Advisor’s representations regarding its assumptions and methods of allocating certain costs, such as personnel costs, which constitute the Advisor’s largest operating cost, and overhead costs with respect to the provision of investment advisory services. The Independent Trustees discussed with the Advisor the general process through which individuals’ compensation is determined and then reviewed by the management committee of the Advisor, as well as the Advisor’s methods for determining that its compensation levels are set at appropriate levels to attract and retain the personnel necessary to provide high quality professional investment advice. The Independent Trustees recognized that the Advisor is entitled under the law to earn a reasonable level of profits for the services that it provides to the Fund. Recognizing the difficulty in evaluating an investment advisor’s profitability with respect to the funds it manages in the context of an advisor with multiple lines of business, and noting that other profitability methodologies might also be reasonable, the Board and the Independent Trustees concluded that the profits of the Advisor from its relationship with the Fund were reasonable.
Economies of Scale. The Board and the Independent Trustees considered, and discussed with the Advisor, whether there have been economies of scale with respect to the management of the Fund, whether the Fund has appropriately benefited from any economies of scale, and whether the advisory fee rate is reasonable in relation to the Fund’s asset levels and any economies of scale that may exist. The Board and the Independent Trustees recognized that the advisory fee schedule for the Fund includes advisory fee breakpoints at the $100 million and $200 million asset levels, and that such breakpoints are designed to pass any benefits of economies of scale to the Fund’s shareholders. The Independent Trustees also considered the Advisor’s representation that its internal costs of providing investment management services to the Fund have increased in recent years as a result of a number of factors, including the ongoing and growing complexity of the Fund’s investments, as well as the Advisor’s investment in building a highly-seasoned trading, compliance, valuation, client service and operations staff to support the Advisor’s investment teams. The Trustees also noted the Advisor’s representation that it would continue making such investments in its personnel, systems, and facilities in an effort to maintain and increase the level and quality of services that it provides to the Fund. The Trustees also considered the Advisor’s willingness to close funds to new investors when it believes that a fund has limited capacity to grow or when it otherwise would be detrimental to fund shareholders.
Benefits to the Advisor. The Board and the Independent Trustees considered other “fall out” benefits to the Advisor as a result of its relationship with the Fund, other than the advisory fee, including research services provided to it by broker-dealers providing execution services to the Fund, the beneficial effects from the review by the Fund’s Chief Compliance Officer of the Advisor’s compliance program, the intangible benefits of its association with the Fund generally, and any favorable publicity arising in connection with the Fund’s performance.
Conclusion. Based on these and other factors, the Board and the Independent Trustees concluded that renewal of the Advisory Agreement was in the best interests of the Fund and its shareholders and, accordingly, approved the renewal of the Advisory Agreement.
48
SOURCE CAPITAL
DIRECTOR AND OFFICER INFORMATION
(Unaudited)
Sandra Brown, Robert F. Goldrich, and John P. Zader are all Directors of the Fund who are not “interested persons” of the Fund, as that term is defined in the 1940 Act (collectively, the “Independent Director”). Directors serve until their resignation, removal or retirement. The Statement of Additional Information includes additional information about the Directors and is available, without charge, upon request by calling (800) 982‑4372.
Name, Address(1) and Year of Birth |
| Position(s) Held with the Fund |
| Year First Elected as Director of the Fund |
| Principal Occupation(s) |
| Number of FPA Funds Overseen by Director |
| Other Directorships Held by Director During the Past Five Years |
Independent Directors | ||||||||||
Sandra Brown, 1955 |
| Director |
| 2016 |
| Consultant (since 2009). Formerly, CEO and President of Transamerica Financial Advisers, Inc. (1999‑2009); President, Transamerica Securities Sales Corp. (1998‑2009); Vice President, Bank of America Mutual Fund Administration (1990‑1998). Director/Trustee of each FPA Fund (Bragg Capital Trust since 2020). |
| 7 |
| None |
Robert F. Goldrich, 1962 |
| Director |
| 2022 |
| Senior Vice President for Strategic Initiatives of CMW Strategies LLC (since 2022). Formerly, President/CFO of the Leon Levy Foundation (2015‑2022). Director/Trustee of each FPA Fund (since 2022). |
| 7 |
| Uluru, Inc. (2015‑2017) |
John P. Zader, 1962 |
| Director |
| 2023 |
| Retired (June 2014-present); CEO, Formerly, UMB Fund Services, Inc. (December 2006-June 2014), a mutual fund and hedge fund service provider. President, Investment Managers Series Trust (2007‑2014). |
| 7 |
| Investment Managers Series Trust (2007‑2022) and Investment Managers Series Trust II (2013-present) |
“Interested” Director | ||||||||||
J. Richard Atwood,(2) 1960 |
| Director |
| 2016 |
| Director and President of FPA GP, Inc., the General Partner of the Adviser (since 2018). Director/Trustee of each FPA Fund (Bragg Capital Trust since 2020). President of each FPA Fund (since 2015). Formerly, Managing Partner of FPA (2006‑2018). |
| 7 |
| None |
Maureen Quill(3), 1963 |
| Director |
| 2023 |
| President, FPA Funds Trust (2023-present); President (2019-present), Investment Managers Series Trust; EVP/Executive Director Registered Funds (January 2018-present), Chief Operating Officer (June 2014-January 2018), and Executive Vice President (January 2007-June 2014), UMB Fund Services, Inc.; President, UMB Distribution Services (March 2013-December 2020); Vice President, Investment Managers Series Trust (December 2013-June 2014). |
| 7 |
| Investment Managers Series Trust (2019-present) |
49
SOURCE CAPITAL
DIRECTOR AND OFFICER INFORMATION
(Unaudited) (Continued)
Officers of the Fund. Officers of the Fund are elected annually by the Board.
Name, Address(1) |
| Position with Fund |
| Year First Elected as Officer of the Fund |
| Principal Occupation(s) |
Rita Dam 1966 |
| Treasurer |
| 2023 |
| Co-Chief Executive Officer (2016-present), and Vice President (2006‑2015), Mutual Fund Administration, LLC; Treasurer and Assistant Secretary, Investment Managers Series Trust (December 2007-present); Co-President, Foothill Capital Management, LLC, a registered investment advisor (2018‑2022). |
Diane Drake 1967 |
| Secretary |
| 2023 |
| Senior Counsel, Mutual Fund Administration, LLC (October 2015-present); Chief Compliance Officer, Foothill Capital Management, LLC, a registered investment advisor (2018‑2019). |
Martin Dziura 1959 |
| Chief Compliance Officer |
| 2023 |
| Principal, Dziura Compliance Consulting, LLC (October 2014-present); Managing Director, Cipperman Compliance Services (2010-September 2014); Chief Compliance Officer, Hanlon Investment Management (2009‑2010); Vice President—Compliance, Morgan Stanley Investment Management (2000‑2009). |
Ryan A. Leggio, 1980 |
| Vice President, Strategy |
| 2024 |
| Partner of FPA (since 2018), and previously Senior Vice President (2014‑2017) and Vice President (2011‑2013). |
Max Banhazl 1987 |
| Vice President |
| 2023 |
| Vice President, Mutual Fund Administration, LLC (2012-present); Managing Director, Marketing and Sales Director, Foothill Capital Management (2018‑2022). |
Korey Bauer 1989 |
| Vice President |
| 2023 |
| Vice President/Business Development, Mutual Fund Administration, LLC (2022-present); Chief Investment Officer, Managing Director, and Portfolio Manager of Foothill Capital Management (2018‑2022); Portfolio Manager, AXS Investments, LLC (2020‑2022); President, Chief Executive Officer and Chief Compliance Officer of Bauer Capital Management, LLC (2014‑2018). |
OTHER IMPORTANT FUND INFORMATION
A description of the policies and procedures that the Adviser uses to vote proxies related to the Fund’s portfolio securities is set forth in the Fund’s Annual Report, additional copies of which are available without charge, upon request, on the Fund’s website at fpa.com or by calling (800) 982‑4372 and on the Securities and Exchange Commission’s website at www.sec.gov.
The Fund’s complete proxy voting record for the 12 months ended June 30, 2026, is available without charge, upon request by calling (800) 982‑4372 and on the SEC’s website at www.sec.gov.
The Fund’s schedule of portfolio holdings, filed the first and third quarter of the Fund’s fiscal year on Form N-PORT with the SEC, is available on the SEC’s website at www.sec.gov.
Additional information about the Fund is available online at fpa.com. This information includes, among other things, holdings, top sectors, and performance, and is updated on or about the 15th business day after the end of each quarter.
50
(This page has been left blank intentionally.)
SOURCE CAPITAL
INVESTMENT ADVISER
First Pacific Advisors, LP
11601 Wilshire Boulevard, Suite 1200
Los Angeles, California 90025
FUND CO-ADMINISTRATOR AND FUND ACCOUNTANT
UMB Fund Services, Inc.
235 West Galena Street
Milwaukee, Wisconsin 53212‑3948
CO-ADMINISTRATOR
Mutual Fund Administration, LLC
2220 E. Route 66, Suite 226
Glendora, California 91740
CUSTODIAN
UMB Bank, n.a.,
928 Grand Boulevard
Kansas City, Missouri 64106
TRANSFER AND SHAREHOLDER SERVICE AGENT AND REGISTRAR
Equiniti Trust Company, LLC
6201 15th Avenue
Brooklyn, New York 11219
(800) 279‑1241 or (718) 921‑8124
www.equiniti.com
LEGAL COUNSEL
Morgan, Lewis & Bockius LLP
600 Anton Boulevard, Suite 1800
Costa Mesa, California 92626
INDEPENDENT REGISTERED PUBLIC ACCOUNTING FIRM
Tait, Weller & Baker LLP
Two Liberty Place
50 South 16th Street, Suite 2900
Philadelphia, Pennsylvania 19102
STOCK EXCHANGE LISTING
New York Stock Exchange: SOR
SUMMARY OF DIVIDEND REINVESTMENT PLAN
Holders of record (other than brokers or nominees of banks and other financial institutions) of Common Stock are eligible to participate in the Dividend Reinvestment Plan (“Plan”), pursuant to which distributions to shareholders are paid in or reinvested in shares of Common Stock of the Fund (“Dividend Shares”). Equiniti Trust Company, LLC, acts as the “Agent” for Plan participants. All correspondence with the Agent should be sent to: Equiniti Trust Company, LLC, Attn: Shareholder Relations Department, 6201 15th Avenue, Brooklyn, New York, 11219.
A shareholder may join the Plan by signing and returning an authorization form that may be obtained from the Agent. A shareholder may elect to withdraw from the Plan at any time by written notice to the Agent and thereby elect to receive cash in lieu of Dividend Shares. There is no penalty for withdrawal from the Plan, and shareholders who have previously withdrawn from the Plan may rejoin at any time. The Fund reserves the right to amend or terminate the Plan.
Purchases of the Fund’s shares are made by the Agent, on behalf of the participants in the Plan, promptly after receipt of funds, and in no event later than 30 days from such receipt except when restricted under applicable federal securities laws. The Agent purchases outstanding shares in the market when the price plus estimated commissions of the Fund’s Common Stock on the NYSE is lower than the Fund’s most recently calculated net asset value per share. To the extent that outstanding shares are not available at a cost of less than per share net asset value, the Agent, on behalf of the participants in the Plan, accepts payment of the dividend, or the remaining portion thereof, in authorized but unissued shares of Common Stock of the Fund on the payment date. Such shares are issued at a per share price equal to the higher of (1) the net asset value per share on the payment date, or (2) 95% of the closing market price per share on the payment date. There are no brokerage charges with
respect to shares issued directly by the Fund to satisfy the dividend reinvestment requirements. However, each participant pays a pro rata share of brokerage commissions incurred with respect to the Agent’s open market purchases of shares. In each case, the cost per share of shares purchased for each shareholder’s account is the average cost, including brokerage commissions, of any shares purchased in the open market plus the cost of any shares issued by the Fund.
For Federal income tax purposes, shareholders who reinvest distributions are treated as receiving distributions in an amount equal to the fair market value, determined as of the payment date, of the shares received if the shares are purchased from the Fund. Such value may exceed the amount of the cash distribution that would have been paid. If outstanding shares are purchased in the open market, the taxable distribution equals the cash distribution that would have been paid. In either event, the cost basis in the shares received equals the amount recognized as a taxable distribution.
In the case of foreign participants whose dividends are subject to United States income tax withholding and in the case of any participants subject to 31% federal backup withholding, the Agent will reinvest dividends after deduction of the amount required to be withheld.
All record holders of Common Stock are also offered the opportunity, on a voluntary basis, to send in cash payments of not less than $100 each up to a total of $7,500 per month to purchase additional shares of the Common Stock of the Fund through participation in the Cash Investment Plan (“Cash Plan”). Under the Cash Plan, shares are purchased in the market and no shares are issued by the Fund. A brochure describing the terms and conditions of the Cash Plan, including fees and expenses, is available from the Agent.
52