Please wait
Q30000095552--12-31falsehttp://fasb.org/us-gaap/2025#OtherAssetsNoncurrenthttp://fasb.org/us-gaap/2025#OtherAssetsNoncurrenthttp://fasb.org/us-gaap/2025#AccruedLiabilitiesCurrenthttp://fasb.org/us-gaap/2025#AccruedLiabilitiesCurrenthttp://fasb.org/us-gaap/2025#OtherLiabilitiesNoncurrenthttp://fasb.org/us-gaap/2025#OtherLiabilitiesNoncurrenthttp://fasb.org/us-gaap/2025#OtherLiabilitiesNoncurrenthttp://fasb.org/us-gaap/2025#OtherLiabilitiesNoncurrenthttp://fasb.org/us-gaap/2025#OtherAssetsNoncurrenthttp://fasb.org/us-gaap/2025#OtherAssetsNoncurrenthttp://fasb.org/us-gaap/2025#AccruedLiabilitiesCurrenthttp://fasb.org/us-gaap/2025#AccruedLiabilitiesCurrenthttp://fasb.org/us-gaap/2025#LongTermDebtNoncurrenthttp://fasb.org/us-gaap/2025#LongTermDebtNoncurrenthttp://fasb.org/us-gaap/2025#OtherLiabilitiesNoncurrenthttp://fasb.org/us-gaap/2025#OtherLiabilitiesNoncurrent0000095552us-gaap:DesignatedAsHedgingInstrumentMemberus-gaap:ForeignExchangeContractMember2024-12-310000095552us-gaap:NondesignatedMemberus-gaap:DerivativeMember2025-07-012025-09-300000095552us-gaap:DesignatedAsHedgingInstrumentMemberus-gaap:FairValueInputsLevel2Memberssup:CurrentAssetMemberus-gaap:InterestRateContractMember2025-09-300000095552us-gaap:RestrictedStockUnitsRSUMemberssup:MergerAgreementMemberus-gaap:SubsequentEventMember2025-12-080000095552us-gaap:AccumulatedGainLossNetCashFlowHedgeParentMember2025-06-300000095552ssup:SeniorSecuredTermLoanFacilityMemberus-gaap:RevolvingCreditFacilityMember2022-12-150000095552us-gaap:AccumulatedTranslationAdjustmentMember2025-07-012025-09-300000095552us-gaap:CommonStockIncludingAdditionalPaidInCapitalMember2023-12-310000095552country:MX2024-12-310000095552us-gaap:CommonStockIncludingAdditionalPaidInCapitalMember2024-06-300000095552us-gaap:AccumulatedDefinedBenefitPlansAdjustmentMember2024-09-300000095552us-gaap:AccumulatedTranslationAdjustmentMember2025-01-012025-09-300000095552us-gaap:FairValueInputsLevel3Memberus-gaap:AccruedLiabilitiesMemberus-gaap:NondesignatedMemberus-gaap:EmbeddedDerivativeFinancialInstrumentsMember2025-09-300000095552ssup:TermLoanFacilityMember2025-09-300000095552us-gaap:RestrictedStockUnitsRSUMemberssup:LongTermCashIncentivePlanMember2025-09-300000095552us-gaap:DesignatedAsHedgingInstrumentMemberus-gaap:DerivativeMember2025-01-012025-09-300000095552country:PL2024-12-310000095552us-gaap:AccumulatedDefinedBenefitPlansAdjustmentMember2024-12-3100000955522023-12-310000095552us-gaap:DesignatedAsHedgingInstrumentMemberus-gaap:FairValueInputsLevel2Memberus-gaap:AccruedLiabilitiesMemberus-gaap:ForeignExchangeContractMember2024-12-3100000955522024-06-300000095552country:MX2025-09-300000095552us-gaap:SubsequentEventMember2025-12-080000095552us-gaap:DesignatedAsHedgingInstrumentMemberus-gaap:FairValueInputsLevel2Memberus-gaap:ForeignExchangeContractMemberssup:CurrentAssetMember2024-12-310000095552srt:EuropeMember2024-12-310000095552us-gaap:PerformanceSharesMember2025-01-012025-09-300000095552us-gaap:RetainedEarningsMember2024-12-310000095552country:US2025-01-012025-09-300000095552us-gaap:SeniorNotesMemberssup:SeniorSecuredTermLoanFacilityMember2025-09-300000095552us-gaap:NondesignatedMemberus-gaap:DerivativeMember2024-01-012024-09-300000095552us-gaap:PerformanceSharesMemberssup:LongTermCashIncentivePlanMember2025-01-012025-09-300000095552country:MX2025-07-012025-09-300000095552us-gaap:DesignatedAsHedgingInstrumentMemberus-gaap:DerivativeMember2025-07-012025-09-300000095552us-gaap:FairValueInputsLevel3Memberus-gaap:AccruedLiabilitiesMemberus-gaap:NondesignatedMemberus-gaap:EmbeddedDerivativeFinancialInstrumentsMember2024-12-310000095552us-gaap:DesignatedAsHedgingInstrumentMemberus-gaap:FairValueInputsLevel2Memberus-gaap:OtherNoncurrentLiabilitiesMemberus-gaap:CommodityContractMember2024-12-310000095552us-gaap:DesignatedAsHedgingInstrumentMemberus-gaap:FairValueInputsLevel2Memberssup:CurrentAssetMemberus-gaap:CommodityContractMember2025-09-300000095552us-gaap:DesignatedAsHedgingInstrumentMemberus-gaap:FairValueInputsLevel2Memberssup:CurrentAssetMemberus-gaap:InterestRateContractMember2024-12-310000095552us-gaap:DesignatedAsHedgingInstrumentMemberus-gaap:FairValueInputsLevel2Memberus-gaap:AccruedLiabilitiesMemberus-gaap:CommodityContractMember2025-09-3000000955522025-01-012025-09-3000000955522025-04-012025-06-3000000955522025-06-300000095552ssup:AmendedAndRestatedTermLoanAgreementMembersrt:MaximumMember2025-03-312025-03-310000095552ssup:ConvertiblePreferredStockRedemptionPeriodTwoMember2025-09-300000095552us-gaap:NondesignatedMemberus-gaap:ForeignExchangeContractMember2025-09-300000095552us-gaap:RetainedEarningsMember2025-01-012025-09-300000095552ssup:SeniorSecuredTermLoanFacilityMemberssup:TermLoanFacilityMember2024-08-140000095552us-gaap:AccumulatedDefinedBenefitPlansAdjustmentMember2024-07-012024-09-3000000955522022-12-310000095552ssup:CashSettledShareBasedCompensationExpenseBenefitMember2025-07-012025-09-300000095552us-gaap:RetainedEarningsMember2024-07-012024-09-300000095552us-gaap:RestrictedStockUnitsRSUMember2024-12-310000095552srt:NorthAmericaMember2025-01-012025-09-300000095552us-gaap:DesignatedAsHedgingInstrumentMemberus-gaap:ForeignExchangeContractMember2025-09-300000095552us-gaap:DesignatedAsHedgingInstrumentMemberus-gaap:InterestRateContractMember2024-12-310000095552us-gaap:DesignatedAsHedgingInstrumentMemberus-gaap:FairValueInputsLevel2Memberus-gaap:ForeignExchangeContractMemberssup:NoncurrentAssetMember2024-12-310000095552us-gaap:PerformanceSharesMember2024-12-310000095552us-gaap:CommonStockIncludingAdditionalPaidInCapitalMember2025-09-300000095552us-gaap:AccumulatedGainLossNetCashFlowHedgeParentMember2024-06-300000095552us-gaap:AccumulatedDefinedBenefitPlansAdjustmentMember2025-06-3000000955522025-03-310000095552country:MX2024-07-012024-09-300000095552us-gaap:NondesignatedMemberus-gaap:DerivativeMember2024-07-012024-09-3000000955522025-09-300000095552us-gaap:RetainedEarningsMember2025-06-300000095552ssup:MergerAgreementMemberus-gaap:SubsequentEventMember2025-12-080000095552us-gaap:AccumulatedTranslationAdjustmentMember2024-01-012024-09-300000095552us-gaap:DesignatedAsHedgingInstrumentMemberus-gaap:FairValueInputsLevel2Memberus-gaap:ForeignExchangeContractMemberus-gaap:OtherNoncurrentLiabilitiesMember2025-09-300000095552country:DE2025-09-300000095552srt:ScenarioForecastMember2025-01-012025-12-310000095552us-gaap:PerformanceSharesMemberssup:LongTermCashIncentivePlanMember2025-09-300000095552us-gaap:AccumulatedTranslationAdjustmentMember2024-12-310000095552us-gaap:DelayedDrawTermLoanMember2025-06-0400000955522024-01-012024-09-300000095552us-gaap:CommonStockIncludingAdditionalPaidInCapitalMember2024-01-012024-09-300000095552ssup:CashSettledShareBasedCompensationExpenseBenefitMember2025-01-012025-09-300000095552us-gaap:RestrictedStockUnitsRSUMember2025-01-012025-09-300000095552us-gaap:AccumulatedTranslationAdjustmentMember2025-06-300000095552country:PL2024-01-012024-09-300000095552us-gaap:AccumulatedGainLossNetCashFlowHedgeParentMember2024-01-012024-09-300000095552ssup:SeniorSecuredTermLoanFacilityMemberssup:TermLoanFacilityMember2024-08-142024-08-140000095552us-gaap:DesignatedAsHedgingInstrumentMembersrt:NaturalGasReservesMemberus-gaap:CommodityContractMember2024-12-310000095552us-gaap:FairValueInputsLevel3Memberus-gaap:NondesignatedMemberus-gaap:OtherNoncurrentLiabilitiesMemberus-gaap:EmbeddedDerivativeFinancialInstrumentsMember2024-12-310000095552country:PL2025-09-300000095552ssup:SeniorSecuredTermLoanFacilityMember2025-01-012025-09-300000095552us-gaap:AccumulatedGainLossNetCashFlowHedgeParentMember2024-12-310000095552srt:EuropeMember2024-01-012024-09-300000095552us-gaap:LoansPayableMember2024-12-310000095552us-gaap:DesignatedAsHedgingInstrumentMemberus-gaap:DerivativeMember2024-07-012024-09-300000095552ssup:SeniorSecuredTermLoanFacilityMemberus-gaap:RevolvingCreditFacilityMember2025-09-300000095552us-gaap:FairValueInputsLevel2Memberus-gaap:NondesignatedMemberssup:CurrentAssetMemberus-gaap:ForeignExchangeContractMember2024-12-310000095552us-gaap:DesignatedAsHedgingInstrumentMemberus-gaap:FairValueInputsLevel2Memberus-gaap:ForeignExchangeContractMemberus-gaap:OtherNoncurrentLiabilitiesMember2024-12-310000095552country:DE2025-01-012025-09-300000095552us-gaap:DesignatedAsHedgingInstrumentMemberus-gaap:FairValueInputsLevel2Memberus-gaap:AccruedLiabilitiesMemberus-gaap:ForeignExchangeContractMember2025-09-300000095552ssup:CashSettledShareBasedCompensationExpenseBenefitMember2024-01-012024-09-300000095552country:DE2024-12-310000095552us-gaap:AccumulatedTranslationAdjustmentMember2025-09-300000095552country:US2024-07-012024-09-300000095552country:PL2025-07-012025-09-300000095552us-gaap:AccumulatedDefinedBenefitPlansAdjustmentMember2025-09-300000095552us-gaap:DesignatedAsHedgingInstrumentMemberus-gaap:FairValueInputsLevel2Memberssup:CurrentAssetMemberus-gaap:CommodityContractMember2024-12-310000095552us-gaap:NondesignatedMemberus-gaap:DerivativeMember2025-01-012025-09-300000095552us-gaap:RetainedEarningsMember2024-09-300000095552us-gaap:CommonStockIncludingAdditionalPaidInCapitalMember2025-01-012025-09-300000095552srt:EuropeMember2025-01-012025-09-300000095552us-gaap:AccumulatedDefinedBenefitPlansAdjustmentMember2024-06-300000095552srt:EuropeMember2025-07-012025-09-300000095552us-gaap:RetainedEarningsMember2025-07-012025-09-300000095552us-gaap:DelayedDrawTermLoanMember2025-09-3000000955522024-09-300000095552ssup:MergerAgreementMemberus-gaap:SubsequentEventMember2025-12-082025-12-0800000955522024-12-310000095552us-gaap:NondesignatedMemberus-gaap:ForeignExchangeContractMember2024-12-310000095552us-gaap:PerformanceSharesMemberssup:MergerAgreementMemberus-gaap:SubsequentEventMember2025-12-0800000955522024-01-012024-03-310000095552us-gaap:DesignatedAsHedgingInstrumentMemberus-gaap:DerivativeMember2024-01-012024-09-300000095552country:DE2024-07-012024-09-300000095552us-gaap:AccumulatedTranslationAdjustmentMember2023-12-310000095552us-gaap:RetainedEarningsMember2024-01-012024-09-300000095552ssup:ShareSettledShareBasedCompensationExpenseBenefitMember2024-01-012024-09-300000095552us-gaap:DesignatedAsHedgingInstrumentMemberus-gaap:FairValueInputsLevel2Memberus-gaap:AccruedLiabilitiesMemberus-gaap:CommodityContractMember2024-12-3100000955522023-01-012023-12-310000095552country:PL2024-07-012024-09-3000000955522024-04-012024-06-300000095552us-gaap:OtherNonoperatingIncomeExpenseMember2025-07-012025-09-300000095552ssup:SeniorSecuredTermLoanFacilityMemberus-gaap:SeniorNotesMemberus-gaap:RevolvingCreditFacilityMember2025-09-300000095552us-gaap:AccumulatedDefinedBenefitPlansAdjustmentMember2024-01-012024-09-300000095552us-gaap:AccumulatedGainLossNetCashFlowHedgeParentMember2025-09-300000095552srt:NorthAmericaMember2024-01-012024-09-3000000955522025-07-012025-09-300000095552us-gaap:AccumulatedTranslationAdjustmentMember2024-06-300000095552us-gaap:DesignatedAsHedgingInstrumentMemberus-gaap:InterestRateContractMember2025-09-300000095552ssup:ShareSettledShareBasedCompensationExpenseBenefitMember2024-07-012024-09-300000095552ssup:ShareSettledShareBasedCompensationExpenseBenefitMember2025-07-012025-09-300000095552us-gaap:OtherNonoperatingIncomeExpenseMember2024-07-012024-09-300000095552us-gaap:AccumulatedGainLossNetCashFlowHedgeParentMember2024-07-012024-09-3000000955522025-11-070000095552srt:EuropeMember2024-07-012024-09-300000095552us-gaap:AccumulatedGainLossNetCashFlowHedgeParentMember2025-07-012025-09-300000095552us-gaap:RetainedEarningsMember2023-12-310000095552country:US2024-12-310000095552us-gaap:AccumulatedDefinedBenefitPlansAdjustmentMember2023-12-3100000955522024-07-012024-09-300000095552us-gaap:RevolvingCreditFacilityMember2025-09-300000095552us-gaap:AccumulatedGainLossNetCashFlowHedgeParentMember2023-12-310000095552ssup:FinanceLeasesMember2024-12-310000095552us-gaap:CommonStockIncludingAdditionalPaidInCapitalMember2024-12-310000095552srt:NorthAmericaMember2024-12-310000095552us-gaap:LoansPayableMember2025-09-300000095552us-gaap:AccumulatedTranslationAdjustmentMember2024-09-300000095552country:US2025-07-012025-09-300000095552ssup:SeniorSecuredTermLoanFacilityMemberus-gaap:DelayedDrawTermLoanMember2024-08-142024-08-140000095552us-gaap:DesignatedAsHedgingInstrumentMemberus-gaap:FairValueInputsLevel2Memberssup:CurrentAssetMemberus-gaap:ForeignExchangeContractMember2025-09-300000095552srt:MinimumMemberssup:AmendedAndRestatedTermLoanAgreementMember2025-03-312025-03-310000095552us-gaap:OtherNonoperatingIncomeExpenseMember2024-01-012024-09-300000095552us-gaap:RetainedEarningsMember2025-09-300000095552srt:NorthAmericaMember2025-09-300000095552country:MX2024-01-012024-09-300000095552ssup:SeniorSecuredTermLoanFacilityMemberus-gaap:RevolvingCreditFacilityMember2022-12-152022-12-150000095552us-gaap:LoansPayableMember2025-01-012025-09-300000095552us-gaap:CommonStockIncludingAdditionalPaidInCapitalMember2025-07-012025-09-300000095552country:DE2024-01-012024-09-300000095552us-gaap:RestrictedStockUnitsRSUMember2025-09-300000095552country:US2024-01-012024-09-300000095552ssup:CashSettledShareBasedCompensationExpenseBenefitMember2024-07-012024-09-300000095552country:PL2025-01-012025-09-300000095552us-gaap:CommonStockIncludingAdditionalPaidInCapitalMember2024-09-300000095552us-gaap:DesignatedAsHedgingInstrumentMemberus-gaap:FairValueInputsLevel2Memberssup:NoncurrentAssetMemberus-gaap:CommodityContractMember2024-12-310000095552country:DE2025-07-012025-09-300000095552us-gaap:AccumulatedGainLossNetCashFlowHedgeParentMember2025-01-012025-09-300000095552us-gaap:RevolvingCreditFacilityMember2025-01-012025-09-300000095552srt:NorthAmericaMember2024-07-012024-09-300000095552country:US2025-09-300000095552srt:NorthAmericaMember2025-07-012025-09-300000095552us-gaap:OtherNonoperatingIncomeExpenseMember2025-01-012025-09-300000095552srt:EuropeMember2025-09-300000095552us-gaap:FairValueInputsLevel2Memberus-gaap:NondesignatedMemberus-gaap:ForeignExchangeContractMemberssup:CurrentAssetMember2025-09-300000095552us-gaap:DesignatedAsHedgingInstrumentMemberus-gaap:FairValueInputsLevel2Memberus-gaap:OtherNoncurrentLiabilitiesMemberus-gaap:CommodityContractMember2025-09-300000095552us-gaap:PerformanceSharesMember2025-09-3000000955522024-01-012024-12-3100000955522025-01-012025-03-310000095552us-gaap:RetainedEarningsMember2024-06-300000095552us-gaap:AccumulatedTranslationAdjustmentMember2024-07-012024-09-300000095552us-gaap:AccumulatedGainLossNetCashFlowHedgeParentMember2024-09-300000095552us-gaap:FairValueInputsLevel3Memberus-gaap:NondesignatedMemberus-gaap:OtherNoncurrentLiabilitiesMemberus-gaap:EmbeddedDerivativeFinancialInstrumentsMember2025-09-300000095552ssup:FinanceLeasesMember2025-09-3000000955522024-03-310000095552us-gaap:CommonStockIncludingAdditionalPaidInCapitalMember2024-07-012024-09-3000000955522024-01-012024-01-010000095552us-gaap:CommonStockIncludingAdditionalPaidInCapitalMember2025-06-300000095552ssup:ConvertiblePreferredStockRedemptionPeriodTwoMember2025-01-012025-09-300000095552us-gaap:RestrictedStockUnitsRSUMemberssup:LongTermCashIncentivePlanMember2025-01-012025-09-300000095552us-gaap:DesignatedAsHedgingInstrumentMemberus-gaap:FairValueInputsLevel2Memberus-gaap:ForeignExchangeContractMemberssup:NoncurrentAssetMember2025-09-300000095552ssup:ShareSettledShareBasedCompensationExpenseBenefitMember2025-01-012025-09-300000095552country:MX2025-01-012025-09-30ssup:TradingDaysxbrli:purexbrli:sharesutr:Btuiso4217:USD
UNITED STATES
SECURITIES AND EXCHANGE COMMISSION
WASHINGTON, D.C. 20549
FORM 10-Q
|
|
|
☒ |
QUARTERLY REPORT PURSUANT TO SECTION 13 OR 15(d) OF THE SECURITIES EXCHANGE ACT OF 1934 |
For the quarterly period ended September 30, 2025
|
|
|
☐ |
TRANSITION REPORT PURSUANT TO SECTION 13 OR 15(d) OF THE SECURITIES EXCHANGE ACT OF 1934 |
For the transition period from to .
Commission file number: 001-06615
SUPERIOR INDUSTRIES INTERNATIONAL, INC.
(Exact Name of Registrant as Specified in Its Charter)
|
|
|
Delaware |
95-2594729 |
(State or Other Jurisdiction of Incorporation or Organization) |
(I.R.S. Employer Identification No.) |
|
|
26600 Telegraph Road, Suite 400 |
|
Southfield, Michigan |
48033 |
(Address of Principal Executive Offices) |
(Zip Code) |
Registrant’s Telephone Number, Including Area Code: (248) 352-7300
Securities registered pursuant to Section 12(b) of the Act:
|
|
|
|
|
|
|
|
|
|
|
Title of Each Class |
|
Trading Symbol |
|
Name of Each Exchange on Which Registered |
None |
|
None |
|
None |
Indicate by check mark whether the registrant: (1) has filed all reports required to be filed by Section 13 or 15(d) of the Securities Exchange Act of 1934 during the preceding 12 months (or for such shorter period that the registrant was required to file such reports), and (2) has been subject to such filing requirements for the past 90 days. Yes ☒ No ☐
Indicate by check mark whether the registrant has submitted electronically every Interactive Data File required to be submitted pursuant to Rule 405 of Regulation S-T (§232.405 of this chapter) during the preceding 12 months (or for such shorter period that the registrant was required to submit such files). Yes ☒ No ☐
Indicate by check mark whether the registrant is a large accelerated filer, an accelerated filer, a non-accelerated filer, a smaller reporting company, or an emerging growth company. See the definitions of “large accelerated filer,” “accelerated filer,” “smaller reporting company” and “emerging growth company” in Rule 12b-2 of the Exchange Act.
|
|
|
|
|
Large Accelerated Filer |
☐ |
Accelerated Filer |
☒ |
Non-Accelerated Filer |
☐ |
Smaller Reporting Company |
☒ |
|
|
Emerging Growth Company |
☐ |
If an emerging growth company, indicate by check mark if the registrant has elected not to use the extended transition period for complying with any new or revised financial accounting standards provided pursuant to Section 13(a) of the Exchange Act. ☐
Indicate by check mark whether the registrant is a shell company (as defined in Rule 12b-2 of the Exchange Act). Yes ☐ No ☒
Number of shares of common stock outstanding as of November 7, 2025: 37,298,422
PART I
FINANCIAL INFORMATION
Item 1. Condensed Consolidated Financial Statements
SUPERIOR INDUSTRIES INTERNATIONAL, INC.
CONDENSED CONSOLIDATED STATEMENTS OF INCOME (LOSS)
(Dollars in thousands, except per share amounts)
(Unaudited)
|
|
|
|
|
|
|
|
|
|
|
|
|
|
|
|
|
|
|
|
Three Months Ended |
|
|
Nine Months Ended |
|
|
|
September 30,
2025 |
|
|
September 30,
2024 |
|
|
September 30,
2025 |
|
|
September 30,
2024 |
|
NET SALES |
|
$ |
178,200 |
|
|
$ |
321,757 |
|
|
$ |
707,699 |
|
|
$ |
957,000 |
|
Cost of sales |
|
|
207,381 |
|
|
|
293,123 |
|
|
|
742,228 |
|
|
|
875,600 |
|
GROSS PROFIT (LOSS) |
|
|
(29,181 |
) |
|
|
28,634 |
|
|
|
(34,529 |
) |
|
|
81,400 |
|
Selling, general and administrative expenses |
|
|
26,360 |
|
|
|
23,900 |
|
|
|
66,699 |
|
|
|
66,108 |
|
Impairment of long-lived assets |
|
|
— |
|
|
|
— |
|
|
|
66,906 |
|
|
|
— |
|
INCOME (LOSS) FROM OPERATIONS |
|
|
(55,541 |
) |
|
|
4,734 |
|
|
|
(168,134 |
) |
|
|
15,292 |
|
Interest expense, net |
|
|
(21,445 |
) |
|
|
(17,857 |
) |
|
|
(56,610 |
) |
|
|
(49,558 |
) |
Loss on extinguishment of debt |
|
|
— |
|
|
|
(13,052 |
) |
|
|
— |
|
|
|
(13,052 |
) |
Other income (expense), net |
|
|
(3,147 |
) |
|
|
2,297 |
|
|
|
(9,342 |
) |
|
|
2,635 |
|
INCOME (LOSS) BEFORE INCOME TAXES |
|
|
(80,133 |
) |
|
|
(23,878 |
) |
|
|
(234,086 |
) |
|
|
(44,683 |
) |
Income tax (provision) benefit |
|
|
(4,856 |
) |
|
|
(875 |
) |
|
|
(44,885 |
) |
|
|
(23,943 |
) |
NET INCOME (LOSS) |
|
$ |
(84,989 |
) |
|
$ |
(24,753 |
) |
|
$ |
(278,971 |
) |
|
$ |
(68,626 |
) |
EARNINGS (LOSS) PER SHARE – BASIC |
|
$ |
(3.03 |
) |
|
$ |
(1.24 |
) |
|
$ |
(10.58 |
) |
|
$ |
(3.50 |
) |
EARNINGS (LOSS) PER SHARE – DILUTED |
|
$ |
(3.03 |
) |
|
$ |
(1.24 |
) |
|
$ |
(10.58 |
) |
|
$ |
(3.50 |
) |
The accompanying unaudited notes are an integral part of these condensed consolidated financial statements.
SUPERIOR INDUSTRIES INTERNATIONAL, INC.
CONDENSED CONSOLIDATED STATEMENTS OF COMPREHENSIVE INCOME (LOSS)
(Dollars in thousands)
(Unaudited)
|
|
|
|
|
|
|
|
|
|
|
|
|
|
|
|
|
|
|
|
Three Months Ended |
|
|
Nine Months Ended |
|
|
|
September 30,
2025 |
|
|
September 30,
2024 |
|
|
September 30,
2025 |
|
|
September 30,
2024 |
|
Net income (loss) |
|
$ |
(84,989 |
) |
|
$ |
(24,753 |
) |
|
$ |
(278,971 |
) |
|
$ |
(68,626 |
) |
Other comprehensive income (loss), net of tax: |
|
|
|
|
|
|
|
|
|
|
|
|
Foreign currency translation gain (loss), net of tax |
|
|
3,745 |
|
|
|
(9,965 |
) |
|
|
52,669 |
|
|
|
(25,713 |
) |
Change in unrecognized gains (losses) on derivative instruments: |
|
|
|
|
|
|
|
|
|
|
|
|
Change in fair value of derivatives |
|
|
(6,589 |
) |
|
|
(14,790 |
) |
|
|
(1,184 |
) |
|
|
(32,047 |
) |
Tax (provision) benefit |
|
|
— |
|
|
|
3,179 |
|
|
|
— |
|
|
|
7,154 |
|
Change in unrecognized gains (losses) on derivative instruments, net of tax |
|
|
(6,589 |
) |
|
|
(11,611 |
) |
|
|
(1,184 |
) |
|
|
(24,893 |
) |
Defined benefit pension plan: |
|
|
|
|
|
|
|
|
|
|
|
|
Amortization of actuarial losses on pension obligation |
|
|
— |
|
|
|
1 |
|
|
|
— |
|
|
|
4 |
|
Tax (provision) benefit |
|
|
— |
|
|
|
— |
|
|
|
— |
|
|
|
178 |
|
Pension changes, net of tax |
|
|
— |
|
|
|
1 |
|
|
|
— |
|
|
|
182 |
|
Other comprehensive income (loss), net of tax |
|
|
(2,844 |
) |
|
|
(21,575 |
) |
|
|
51,485 |
|
|
|
(50,424 |
) |
Comprehensive income (loss) |
|
$ |
(87,833 |
) |
|
$ |
(46,328 |
) |
|
$ |
(227,486 |
) |
|
$ |
(119,050 |
) |
The accompanying unaudited notes are an integral part of these condensed consolidated financial statements.
SUPERIOR INDUSTRIES INTERNATIONAL, INC.
CONDENSED CONSOLIDATED BALANCE SHEETS
(Dollars in thousands)
(Unaudited)
|
|
|
|
|
|
|
|
|
|
|
|
September 30,
2025 |
|
|
December 31,
2024 |
|
ASSETS |
|
|
|
|
|
|
Current assets: |
|
|
|
|
|
|
Cash and cash equivalents |
|
$ |
60,619 |
|
|
$ |
40,110 |
|
Accounts receivable, net |
|
|
74,270 |
|
|
|
69,503 |
|
Inventories, net |
|
|
124,158 |
|
|
|
145,736 |
|
Income taxes receivable |
|
|
6,158 |
|
|
|
11,374 |
|
Current derivative financial instruments |
|
|
— |
|
|
|
22,578 |
|
Other current assets |
|
|
18,819 |
|
|
|
19,460 |
|
Total current assets |
|
|
284,024 |
|
|
|
308,761 |
|
Property, plant and equipment, net |
|
|
274,039 |
|
|
|
329,892 |
|
Deferred income tax assets, net |
|
|
2 |
|
|
|
39,046 |
|
Intangibles, net |
|
|
4,516 |
|
|
|
12,612 |
|
Derivative financial instruments |
|
|
— |
|
|
|
14,736 |
|
Other noncurrent assets |
|
|
29,388 |
|
|
|
35,082 |
|
Total assets |
|
$ |
591,969 |
|
|
$ |
740,129 |
|
LIABILITIES, MEZZANINE EQUITY AND SHAREHOLDERS’ EQUITY (DEFICIT) |
|
|
|
|
|
|
Current liabilities: |
|
|
|
|
|
|
Accounts payable |
|
$ |
75,216 |
|
|
$ |
120,351 |
|
Short-term debt |
|
|
631,430 |
|
|
|
7,939 |
|
Accrued expenses |
|
|
55,104 |
|
|
|
65,731 |
|
Income taxes payable |
|
|
367 |
|
|
|
1,905 |
|
Total current liabilities |
|
|
762,117 |
|
|
|
195,926 |
|
Long-term debt (less current portion) |
|
|
524 |
|
|
|
481,449 |
|
Noncurrent income tax liabilities |
|
|
3,003 |
|
|
|
5,341 |
|
Deferred income tax liabilities, net |
|
|
— |
|
|
|
1,105 |
|
Other noncurrent liabilities |
|
|
38,253 |
|
|
|
43,581 |
|
Commitments and contingent liabilities (Note 15) |
|
|
|
|
|
|
Mezzanine equity: |
|
|
|
|
|
|
Preferred stock, $0.01 par value |
|
|
|
|
|
|
Authorized – 1,000,000 shares |
|
|
|
|
|
|
Issued and outstanding – 150,000 shares outstanding at
September 30, 2025 and December 31, 2024 |
|
|
335,800 |
|
|
|
288,465 |
|
Noncontrolling redeemable equity |
|
|
523 |
|
|
|
480 |
|
Shareholders’ equity (deficit): |
|
|
|
|
|
|
Common stock, $0.01 par value |
|
|
|
|
|
|
Authorized – 100,000,000 shares |
|
|
|
|
|
|
Issued and outstanding – 37,298,422 and 28,886,053 shares at
September 30, 2025 and December 31, 2024 |
|
|
125,231 |
|
|
|
123,039 |
|
Accumulated other comprehensive income (loss) |
|
|
(46,986 |
) |
|
|
(98,471 |
) |
Retained earnings (deficit) |
|
|
(626,496 |
) |
|
|
(300,786 |
) |
Total shareholders’ equity (deficit) |
|
|
(548,251 |
) |
|
|
(276,218 |
) |
Total liabilities, mezzanine equity and shareholders’ equity (deficit) |
|
$ |
591,969 |
|
|
$ |
740,129 |
|
The accompanying unaudited notes are an integral part of these condensed consolidated financial statements.
SUPERIOR INDUSTRIES INTERNATIONAL, INC.
CONDENSED CONSOLIDATED STATEMENTS OF CASH FLOWS
(Dollars in thousands)
(Unaudited)
|
|
|
|
|
|
|
|
|
|
|
|
Nine Months Ended |
|
|
|
September 30,
2025 |
|
|
September 30,
2024 |
|
CASH FLOWS FROM OPERATING ACTIVITIES: |
|
|
|
|
|
|
Net income (loss) |
|
$ |
(278,971 |
) |
|
$ |
(68,626 |
) |
Adjustments to reconcile net income (loss) to net cash provided (used) by operating activities: |
|
|
|
|
|
|
Depreciation and amortization |
|
|
50,610 |
|
|
|
65,534 |
|
Income tax, noncash changes |
|
|
40,074 |
|
|
|
16,254 |
|
Stock-based compensation |
|
|
2,289 |
|
|
|
6,098 |
|
Amortization of debt issuance costs |
|
|
6,717 |
|
|
|
3,974 |
|
Interest paid-in-kind on long-term debt |
|
|
27,888 |
|
|
|
— |
|
Loss on extinguishment of debt |
|
|
— |
|
|
|
13,052 |
|
Impairment of long-lived assets |
|
|
66,906 |
|
|
|
— |
|
Other noncash items |
|
|
10,332 |
|
|
|
(8,978 |
) |
Changes in operating assets and liabilities: |
|
|
|
|
|
|
Accounts receivable |
|
|
(2,630 |
) |
|
|
(54,373 |
) |
Inventories |
|
|
32,605 |
|
|
|
(2,744 |
) |
Other assets and liabilities |
|
|
(8,874 |
) |
|
|
6,283 |
|
Cash proceeds from early termination of derivative instruments |
|
|
37,537 |
|
|
|
— |
|
Accounts payable |
|
|
(58,422 |
) |
|
|
21,411 |
|
Income taxes |
|
|
1,871 |
|
|
|
(5,742 |
) |
NET CASH PROVIDED (USED) BY OPERATING ACTIVITIES |
|
|
(72,068 |
) |
|
|
(7,857 |
) |
CASH FLOWS FROM INVESTING ACTIVITIES: |
|
|
|
|
|
|
Additions to property, plant, and equipment |
|
|
(18,933 |
) |
|
|
(20,985 |
) |
NET CASH PROVIDED (USED) BY INVESTING ACTIVITIES |
|
|
(18,933 |
) |
|
|
(20,985 |
) |
CASH FLOWS FROM FINANCING ACTIVITIES: |
|
|
|
|
|
|
Proceeds from issuance of long-term debt |
|
|
— |
|
|
|
337,317 |
|
Proceeds from issuance of short-term debt |
|
|
70,000 |
|
|
|
— |
|
Repayments on term loans and notes |
|
|
(3,475 |
) |
|
|
(466,294 |
) |
Proceeds from borrowings on revolving credit facility |
|
|
65,473 |
|
|
|
28,000 |
|
Repayments of borrowings on revolving credit facility |
|
|
(23,000 |
) |
|
|
(28,000 |
) |
Cash dividends paid |
|
|
(30 |
) |
|
|
(3,413 |
) |
Financing costs paid and other |
|
|
(1,081 |
) |
|
|
(8,967 |
) |
Redemption premium paid on term loan repayment |
|
|
— |
|
|
|
(3,680 |
) |
Payments related to tax withholdings for stock-based compensation |
|
|
(781 |
) |
|
|
(1,345 |
) |
Finance lease payments |
|
|
(664 |
) |
|
|
(452 |
) |
Proceeds from common stock issuance |
|
|
684 |
|
|
|
— |
|
NET CASH PROVIDED (USED) BY FINANCING ACTIVITIES |
|
|
107,126 |
|
|
|
(146,834 |
) |
Effect of exchange rate changes on cash |
|
|
4,384 |
|
|
|
(1,650 |
) |
Net changes in cash and cash equivalents |
|
|
20,509 |
|
|
|
(177,326 |
) |
Cash and cash equivalents at the beginning of the period |
|
|
40,110 |
|
|
|
201,606 |
|
Cash and cash equivalents at the end of the period |
|
$ |
60,619 |
|
|
$ |
24,280 |
|
Supplemental Cash Flow Information |
|
|
|
|
|
|
Cash paid during the period for interest |
|
$ |
22,408 |
|
|
$ |
46,507 |
|
Cash paid during the period for taxes, net of refunds |
|
$ |
4,190 |
|
|
$ |
13,316 |
|
Non-cash asset charge due to customer resourcing actions |
|
$ |
16,001 |
|
|
$ |
— |
|
Non-cash Investing Activities |
|
|
|
|
|
|
Period end balance of accounts payable for property, plant, and equipment |
|
$ |
6,621 |
|
|
$ |
3,860 |
|
Non-cash Financing Activities |
|
|
|
|
|
|
Debt modification |
|
$ |
— |
|
|
$ |
169,683 |
|
The accompanying unaudited notes are an integral part of these condensed consolidated financial statements.
SUPERIOR INDUSTRIES INTERNATIONAL, INC.
CONDENSED CONSOLIDATED STATEMENTS OF SHAREHOLDERS’ EQUITY (DEFICIT)
(Dollars in thousands)
(Unaudited)
|
|
|
|
|
|
|
|
|
|
|
|
|
|
|
|
|
|
|
|
|
|
|
|
|
|
|
|
|
|
For the three months ended September 30, 2025 |
|
|
|
|
|
|
|
|
|
|
|
|
|
|
|
|
|
|
|
|
|
Common Stock |
|
|
Accumulated Other Comprehensive Income (Loss) |
|
|
|
|
|
|
|
|
|
Number of
Shares |
|
|
Amount |
|
|
Cumulative
Translation
Adjustment |
|
|
Hedging Instruments |
|
|
Pension
Obligations |
|
|
Retained
Earnings (Deficit) |
|
|
Total |
|
BALANCE AT JULY 1, 2025 |
|
|
29,698,422 |
|
|
$ |
123,913 |
|
|
$ |
(79,254 |
) |
|
$ |
33,051 |
|
|
$ |
2,061 |
|
|
$ |
(524,476 |
) |
|
$ |
(444,705 |
) |
Net income (loss) |
|
|
— |
|
|
|
— |
|
|
|
— |
|
|
|
— |
|
|
|
— |
|
|
|
(84,989 |
) |
|
|
(84,989 |
) |
Change in accumulated other comprehensive
income (loss), net of tax |
|
|
— |
|
|
|
— |
|
|
|
3,745 |
|
|
|
(6,589 |
) |
|
|
— |
|
|
|
— |
|
|
|
(2,844 |
) |
Common stock issued, net of shares
withheld for employee taxes |
|
|
7,600,000 |
|
|
|
684 |
|
|
|
— |
|
|
|
— |
|
|
|
— |
|
|
|
— |
|
|
|
684 |
|
Stock-based compensation |
|
|
— |
|
|
|
634 |
|
|
|
— |
|
|
|
— |
|
|
|
— |
|
|
|
— |
|
|
|
634 |
|
Redeemable preferred 9% dividend
and accretion |
|
|
— |
|
|
|
— |
|
|
|
— |
|
|
|
— |
|
|
|
— |
|
|
|
(17,025 |
) |
|
|
(17,025 |
) |
Noncontrolling redeemable equity
dividend |
|
|
— |
|
|
|
— |
|
|
|
— |
|
|
|
— |
|
|
|
— |
|
|
|
(6 |
) |
|
|
(6 |
) |
BALANCE AT SEPTEMBER 30, 2025 |
|
|
37,298,422 |
|
|
$ |
125,231 |
|
|
$ |
(75,509 |
) |
|
$ |
26,462 |
|
|
$ |
2,061 |
|
|
$ |
(626,496 |
) |
|
$ |
(548,251 |
) |
|
|
|
|
|
|
|
|
|
|
|
|
|
|
|
|
|
|
|
|
|
|
For the nine months ended September 30, 2025 |
|
|
|
|
|
|
|
|
|
|
|
|
|
|
|
|
|
|
|
|
|
Common Stock |
|
|
Accumulated Other Comprehensive Income (Loss) |
|
|
|
|
|
|
|
|
|
Number of
Shares |
|
|
Amount |
|
|
Cumulative
Translation
Adjustment |
|
|
Hedging Instruments |
|
|
Pension
Obligations |
|
|
Retained
Earnings (Deficit) |
|
|
Total |
|
BALANCE AT JANUARY 1, 2025 |
|
|
28,886,053 |
|
|
$ |
123,039 |
|
|
$ |
(128,178 |
) |
|
$ |
27,646 |
|
|
$ |
2,061 |
|
|
$ |
(300,786 |
) |
|
$ |
(276,218 |
) |
Net income (loss) |
|
|
— |
|
|
|
— |
|
|
|
— |
|
|
|
— |
|
|
|
— |
|
|
|
(278,971 |
) |
|
|
(278,971 |
) |
Change in accumulated other comprehensive
income (loss), net of tax |
|
|
— |
|
|
|
— |
|
|
|
52,669 |
|
|
|
(1,184 |
) |
|
|
— |
|
|
|
— |
|
|
|
51,485 |
|
Common stock issued, net of shares
withheld for employee taxes |
|
|
8,412,369 |
|
|
|
684 |
|
|
|
— |
|
|
|
— |
|
|
|
— |
|
|
|
— |
|
|
|
684 |
|
Stock-based compensation |
|
|
— |
|
|
|
1,508 |
|
|
|
— |
|
|
|
— |
|
|
|
— |
|
|
|
— |
|
|
|
1,508 |
|
Redeemable preferred 9% dividend
and accretion |
|
|
— |
|
|
|
— |
|
|
|
— |
|
|
|
— |
|
|
|
— |
|
|
|
(46,722 |
) |
|
|
(46,722 |
) |
Noncontrolling redeemable equity
dividend |
|
|
— |
|
|
|
— |
|
|
|
— |
|
|
|
— |
|
|
|
— |
|
|
|
(17 |
) |
|
|
(17 |
) |
BALANCE AT SEPTEMBER 30, 2025 |
|
|
37,298,422 |
|
|
$ |
125,231 |
|
|
$ |
(75,509 |
) |
|
$ |
26,462 |
|
|
$ |
2,061 |
|
|
$ |
(626,496 |
) |
|
$ |
(548,251 |
) |
|
|
|
|
|
|
|
|
|
|
|
|
|
|
|
|
|
|
|
|
|
|
|
|
|
|
|
|
|
|
For the three months ended September 30, 2024 |
|
|
|
|
|
|
|
|
|
|
|
|
|
|
|
|
|
|
|
|
|
Common Stock |
|
|
Accumulated Other Comprehensive Income (Loss) |
|
|
|
|
|
|
|
|
|
Number of
Shares |
|
|
Amount |
|
|
Cumulative
Translation
Adjustment |
|
|
Hedging Instruments |
|
|
Pension
Obligations |
|
|
Retained
Earnings (Deficit) |
|
|
Total |
|
BALANCE AT JULY 1, 2024 |
|
|
28,886,053 |
|
|
$ |
118,082 |
|
|
$ |
(98,750 |
) |
|
$ |
46,577 |
|
|
$ |
1,033 |
|
|
$ |
(243,388 |
) |
|
$ |
(176,446 |
) |
Net income (loss) |
|
|
— |
|
|
|
— |
|
|
|
— |
|
|
|
— |
|
|
|
— |
|
|
|
(24,753 |
) |
|
|
(24,753 |
) |
Change in accumulated other comprehensive
income (loss), net of tax |
|
|
— |
|
|
|
— |
|
|
|
(9,965 |
) |
|
|
(11,611 |
) |
|
|
1 |
|
|
|
— |
|
|
|
(21,575 |
) |
Common stock issued, net of shares
withheld for employee taxes |
|
|
— |
|
|
|
— |
|
|
|
— |
|
|
|
— |
|
|
|
— |
|
|
|
— |
|
|
|
— |
|
Stock-based compensation |
|
|
— |
|
|
|
2,011 |
|
|
|
— |
|
|
|
— |
|
|
|
— |
|
|
|
— |
|
|
|
2,011 |
|
Redeemable preferred 9% dividend
and accretion |
|
|
— |
|
|
|
— |
|
|
|
— |
|
|
|
— |
|
|
|
— |
|
|
|
(11,081 |
) |
|
|
(11,081 |
) |
Noncontrolling redeemable equity
dividend |
|
|
— |
|
|
|
— |
|
|
|
— |
|
|
|
— |
|
|
|
— |
|
|
|
(5 |
) |
|
|
(5 |
) |
BALANCE AT SEPTEMBER 30, 2024 |
|
|
28,886,053 |
|
|
$ |
120,093 |
|
|
$ |
(108,715 |
) |
|
$ |
34,966 |
|
|
$ |
1,034 |
|
|
$ |
(279,227 |
) |
|
$ |
(231,849 |
) |
|
|
|
|
|
|
|
|
|
|
|
|
|
|
|
|
|
|
|
|
|
|
For the nine months ended September 30, 2024 |
|
|
|
|
|
|
|
|
|
|
|
|
|
|
|
|
|
|
|
|
|
Common Stock |
|
|
Accumulated Other Comprehensive Income (Loss) |
|
|
|
|
|
|
|
|
|
Number of
Shares |
|
|
Amount |
|
|
Cumulative
Translation
Adjustment |
|
|
Hedging Instruments |
|
|
Pension
Obligations |
|
|
Retained
Earnings (Deficit) |
|
|
Total |
|
BALANCE AT JANUARY 1, 2024 |
|
|
28,091,440 |
|
|
$ |
115,340 |
|
|
$ |
(83,002 |
) |
|
$ |
59,859 |
|
|
$ |
852 |
|
|
$ |
(178,989 |
) |
|
$ |
(85,940 |
) |
Net income (loss) |
|
|
— |
|
|
|
— |
|
|
|
— |
|
|
|
— |
|
|
|
— |
|
|
|
(68,626 |
) |
|
|
(68,626 |
) |
Change in accumulated other comprehensive
income (loss), net of tax |
|
|
— |
|
|
|
— |
|
|
|
(25,713 |
) |
|
|
(24,893 |
) |
|
|
182 |
|
|
|
— |
|
|
|
(50,424 |
) |
Common stock issued, net of shares
withheld for employee taxes |
|
|
794,613 |
|
|
|
— |
|
|
|
— |
|
|
|
— |
|
|
|
— |
|
|
|
— |
|
|
|
— |
|
Stock-based compensation |
|
|
— |
|
|
|
4,753 |
|
|
|
— |
|
|
|
— |
|
|
|
— |
|
|
|
— |
|
|
|
4,753 |
|
Redeemable preferred 9% dividend
and accretion |
|
|
— |
|
|
|
— |
|
|
|
— |
|
|
|
— |
|
|
|
— |
|
|
|
(31,601 |
) |
|
|
(31,601 |
) |
Noncontrolling redeemable equity
dividend |
|
|
— |
|
|
|
— |
|
|
|
— |
|
|
|
— |
|
|
|
— |
|
|
|
(11 |
) |
|
|
(11 |
) |
BALANCE AT SEPTEMBER 30, 2024 |
|
|
28,886,053 |
|
|
$ |
120,093 |
|
|
$ |
(108,715 |
) |
|
$ |
34,966 |
|
|
$ |
1,034 |
|
|
$ |
(279,227 |
) |
|
$ |
(231,849 |
) |
The accompanying unaudited notes are an integral part of these condensed consolidated financial statements.
Superior Industries International, Inc.
Notes to Condensed Consolidated Financial Statements (Unaudited)
September 30, 2025
(in thousands, or as otherwise noted)
NOTE 1 – DESCRIPTION OF THE BUSINESS
Description of the Business
The principal business of Superior Industries International, Inc. (referred herein as the “Company” or “Superior”) is the design and manufacture of aluminum wheels for sale to original equipment manufacturers (“OEMs”) in North America and Europe, and to the aftermarket in Europe. The Company’s aluminum wheels are primarily sold to OEMs for factory installation on new light vehicles. Aluminum wheels sold in the European aftermarket are under the brands ATS, RIAL, ALUTEC, and ANZIO. North America and Europe represent the primary markets for the Company’s products, but it has a diversified global customer base consisting of North American, European, and Asian OEMs.
Merger
On December 8, 2025 (the “Closing Date”), the Company, SUP Parent Holdings, LLC, a Delaware limited liability company (“Parent”), and SUP Merger Sub, Inc., a Delaware corporation and a wholly owned subsidiary of Parent (“Merger Sub”) completed the previously announced Merger, contemplated by that certain Agreement and Plan of Merger, dated as of July 8, 2025 (the “Merger Agreement”). At the effective time of the Merger on the Closing Date (the “Effective Time”), in accordance with the Merger Agreement, Merger Sub merged with and into the Company (the “Merger”), with the Company surviving the Merger as a direct wholly owned subsidiary of Parent. Immediately prior to the Effective Time, Parent held Common Shares that represented approximately 17.6% of the total voting power of the Company.
At the Effective Time, in accordance with the terms and conditions set forth in the Merger Agreement, each Common Share and each share of preferred stock, par value $0.01 per share designated as Series A Preferred Shares (the “Series A Preferred Shares” and, together with the Common Shares, the “Shares”), in each case, issued and outstanding immediately prior to the Effective Time (other than Shares owned by (i) Parent or Merger Sub or any of their respective Subsidiaries, (ii) the Company as treasury stock and (iii) holders of Common Shares who have not voted in favor of the Merger or consented thereto and have properly exercised and perfected and not withdrawn, waived or lost a demand for appraisal rights pursuant to Section 262 of the Delaware General Corporation Law) was converted into the right to receive:
•with respect to each Common Share, $0.09 per Common Share in cash, without interest thereon; and
•with respect to each Series A Preferred Share, (1) $39.49 per Series A Preferred Share in cash and (2) 0.23 units of limited liability company interests of Parent per Series A Preferred Share.
At the Effective Time, in accordance with the Merger Agreement:
•each outstanding time-based restricted stock unit (a “Company Restricted Stock Unit”) that was granted under the Company’s 2018 Equity Incentive Plan (the “Company Stock Plan”) that was outstanding as of immediately prior to the Effective Time, whether vested or unvested, became fully vested and terminated and automatically cancelled as of immediately prior to the Effective Time in exchange for the right to receive a lump sum cash payment of an amount equal to $0.09 per Company Restricted Stock Unit; and
•each outstanding performance-based restricted stock unit (a “Company Performance Stock Unit”) that was granted under the Company Stock Plan that was outstanding as of immediately prior to the Effective Time, whether vested or unvested, became fully vested as if the applicable level of performance was achieved at target and terminated and automatically cancelled as of immediately prior to the Effective Time in exchange for the right to receive a lump sum cash payment of an amount equal to $0.09 per Company Performance Stock Unit.
The Company used the proceeds of borrowings under the Third Amendment (as defined in Note 8 “Debt and Other Financing Arrangements”) to pay the cash consideration in the Merger.
Additional information about the Merger is set forth in the Company’s Current Report on Form 8-K filed with the SEC on December 8, 2025.
NOTE 2 – BASIS OF PRESENTATION
Basis of Presentation - Interim Financial Statements
The accompanying unaudited condensed consolidated financial statements have been prepared in conformity with generally accepted accounting principles in the United States (“U.S. GAAP”) pursuant to the rules and regulations of the Securities and Exchange Commission (the “SEC”) for interim financial information. Accordingly, they do not include all the information and notes required by U.S. GAAP for complete financial statements. These unaudited condensed consolidated financial statements include all adjustments, of a normal and recurring nature, which management believes are necessary for fair presentation of the financial statements. This Quarterly Report on Form 10-Q should be read in conjunction with the audited consolidated financial statements and the notes thereto included in the Company’s Annual Report on Form 10-K for the year ended December 31, 2024, which was filed with the SEC on March 6, 2025 (the “2024 Form 10-K”).
These unaudited condensed consolidated financial statements include the accounts of the Company and its subsidiaries. All intercompany transactions are eliminated in consolidation.
Interim financial reporting standards require the use of estimates that are based on assumptions regarding the outcome of future events and circumstances not known at that time. Inevitably, some assumptions may not materialize, unanticipated events or circumstances may occur which vary from those estimates and such variations may significantly affect future results. Additionally, operating results for the three and nine months ended September 30, 2025 are not necessarily indicative of the results that may be expected for the year ending December 31, 2025.
Going Concern
During the second quarter of 2025, certain of the Company's customers in North America began to resource to other suppliers substantially all outstanding purchase orders and not issue any additional purchase orders to the Company thereafter. Prior to these resourcing actions, the Company estimated these customers to represent approximately 33% of its projected consolidated net sales for the 2025 fiscal year. These customers represented approximately 40% of the Company’s consolidated net sales for the year ended December 31, 2024, and approximately 36% of the Company’s consolidated net sales for the year ended December 31, 2023. During the nine months ended September 30, 2025, the Company borrowed $42.5 million on its revolving credit facility, as the actions described above significantly affected the Company’s ability to generate cash from operating activities or from the sale of trade receivables. In addition, as of September 30, 2025, the Company was in violation of its financial covenants under the Senior Secured Credit Facilities.
On December 8, 2025 the Company completed the previously announced Merger with Parent, and Merger Sub pursuant to the Merger Agreement, and entered into amendments to its Senior Secured Credit Facilities. The Third Amendment to the Company’s Senior Secured Credit Facilities entered into on December 8, 2025, removed certain financial covenants under the Term Loan Facility and waived the financial covenants under the Revolving Credit Facility through June 30, 2026. In addition, the Revolving Credit Facility was amended to mature on June 30, 2026. The Senior Secured Credit Facilities now also contain a monthly minimum liquidity threshold of not less than $10.0 million as of the last business day of each month. Refer to Note 1 “Description of the Business” and Note 8 “Debt and Other Financing Arrangements” for a full description of the transactions.
While the Company has completed the previously announced Merger, it does not expect that it will have the cash and cash equivalents or sufficient liquidity to meet its financial obligations and comply with its minimum liquidity covenant over the next twelve months from the issuance date of these unaudited condensed consolidated financial statements. To address these conditions, management plans to obtain additional sources of funding or amend the applicable provisions in its credit agreements. However, such plans are not solely in the Company’s control and therefore cannot be considered probable of occurring. Therefore, these adverse conditions and events described above raise substantial doubt about the Company’s ability to continue as a going concern as of the issuance date.
The unaudited condensed consolidated financial statements as of September 30, 2025, do not include any adjustments that might result from the outcome of this uncertainty.
Cash and Cash Equivalents
Cash and cash equivalents generally consist of cash, certificates of deposit, fixed deposits, and money market funds with original maturities of three months or less. The Company is required to provide cash collateral in connection with certain contractual arrangements. The Company has $0.8 million and $0.4 million of restricted cash as of September 30, 2025 and December 31, 2024 in support of these arrangements and requirements.
Accounting Standards Issued But Not Yet Adopted
Accounting Standards Update (ASU) 2023-09, “Income Taxes (Topic 740).” In December 2023, the FASB issued ASU 2023-09, “Income Taxes (Topic 740): Improvements to Income Tax Disclosures,” which is intended to enhance the transparency, decision usefulness, and effectiveness of income tax disclosures. This amendment requires a public entity to disclose a tabular tax rate reconciliation, using both percentages and currency, with specific categories. A public entity is also required to provide a qualitative description of the states and local jurisdictions that make up the majority of the effect of the state and local income tax category and the net amount of income taxes paid, disaggregated by federal, state, and foreign taxes and also disaggregated by individual jurisdictions. The amendment is effective prospectively for annual periods beginning after December 15, 2024, and early adoption and retrospective application are permitted. The Company is currently evaluating the effect of adopting this guidance.
Accounting Standards Update (ASU) 2024-03, “Income Statement—Reporting Comprehensive Income—Expense Disaggregation Disclosures.” In November 2024, the FASB issued ASU 2024-03, “Disaggregation of Income Statement Expenses (Subtopic 220-40): Disaggregation of Income Statement Expenses”, which is intended to provide disaggregated information about a public business entity’s expenses to help financial statement users better understand the entity’s performance, better assess the entity’s prospects for future cash flows, and compare an entity’s performance over time and with that of other entities. The amendment is effective for fiscal years beginning after December 15, 2026 and interim periods within fiscal years beginning after December 15, 2027. Early adoption is permitted. The new standard may be applied either on a prospective or retrospective basis. The Company is currently evaluating the effect of adopting this guidance.
NOTE 3 – REVENUE
The Company disaggregates revenue from contracts by its reportable segments, North America and Europe. Revenues by segment for the three and nine months ended September 30, 2025 and 2024 are summarized in Note 5, “Business Segments.”
The opening and closing balances of the Company’s trade receivables, and current and long-term contract liabilities are as follows:
|
|
|
|
|
|
|
|
|
|
|
|
September 30,
2025 |
|
|
December 31,
2024 |
|
Trade receivables |
|
|
62,077 |
|
|
|
56,690 |
|
Contract liabilities—current |
|
|
4,726 |
|
|
|
6,819 |
|
Contract liabilities—noncurrent |
|
|
5,575 |
|
|
|
6,845 |
|
During the nine months ended September 30, 2025 the Company recorded a non-cash charge of $3.1 million to write-down a customer trade receivable associated with customer resourcing actions.
NOTE 4 - DERIVATIVE FINANCIAL INSTRUMENTS AND FAIR VALUE
The Company is exposed to market risks such as fluctuations in foreign currency exchange rates, interest rates, and aluminum and other commodity prices. Derivative financial instruments may be used to offset some of the effects of these market risks on the expected future cash flows and on certain existing assets and liabilities. In certain cases, the Company may or may not designate certain derivative instruments as hedges for accounting purposes. The Company may choose not to hedge certain exposures for a variety of reasons including, but not limited to, accounting considerations and the prohibitive economic cost of hedging particular exposures.
Market Risks
Foreign Currency Exchange Rate Risk
The Company has manufacturing locations primarily in Mexico and Poland and sells its products globally. As a result, the Company’s financial results could be significantly affected by foreign currency exchange rates. To help mitigate gross margin and cash flow fluctuations due to changes in foreign currency exchange rates, certain subsidiaries in Mexico and Poland, whose functional currency is the U.S. dollar or the Euro, may hedge a portion of their forecasted foreign currency exposure denominated in the Mexican Peso and Polish Zloty using foreign currency forward contracts up to 48 months. The Company has designated some of its foreign currency contracts as cash flow hedging instruments.
Interest Rate Risk
The borrowings under the Company’s Senior Secured Credit Facilities (as subsequently defined) are at variable rates of interest and expose it to interest rate risk. If interest rates increase, debt service obligations on the variable rate indebtedness will increase even though the amount borrowed remains the same. The Company hedges a portion of its interest rate risk through interest rate swaps that exchange floating for fixed-rate interest payments and has designated these contracts as cash flow hedging instruments.
Commodity Price Risk
The principal raw material used in manufacturing aluminum wheels is aluminum alloys. While wheel prices under OEM customer contracts are adjusted for fluctuations in the cost of this material, the prices of its aftermarket wheels are generally fixed months in advance of the spring and winter sales seasons. Accordingly, the Company hedges a portion of its aftermarket aluminum purchases to offset the effect of fluctuating aluminum cost on its margins. In addition, the manufacture of aluminum wheels is energy-intensive so, the Company also fixes a portion of its natural gas and electricity purchases with derivatives or contractual arrangements with energy suppliers.
Assets and Fair Values Measured at Fair Value on a Recurring Basis
Asset and Liability Instruments
The carrying amounts for cash and cash equivalents, accounts receivable, accounts payable, and accrued expenses approximate their fair values due to the short period of time until maturity.
Derivative Financial Instruments
During the second quarter of 2025, the Company terminated its outstanding foreign exchange, commodity, and interest rate derivative instruments. The derivative instruments have been derecognized and amounts in accumulated other comprehensive income (loss) remain there until the forecasted transactions affect earnings unless the forecasted transaction becomes probable of not occurring.
The fair value of the Company’s derivative instruments is estimated using the income valuation approach, which projects future cash flows and discounts the future amounts to a present value using market-based expectations for interest rates, foreign exchange rates, commodity prices, and the contractual terms of the derivative instruments (Level 2). The discount rate used is the relevant benchmark rate (e.g., the secured overnight financing rate, “SOFR”) plus an adjustment for counterparty risk.
The fair value of the Company’s embedded derivatives is estimated using either a market based approach or an income based approach, which uses Company-specific inputs and assumptions (Level 3), such as discount rates.
The following tables display the fair value of derivatives by financial statement line item as of September 30, 2025 and December 31, 2024:
|
|
|
|
|
|
|
|
|
|
|
|
|
|
|
|
|
|
|
|
|
|
|
|
September 30, 2025 |
|
|
|
Fair Value Hierarchy |
|
Current Derivative Financial Instruments |
|
|
Derivative Financial Instruments |
|
|
Accrued
Liabilities |
|
|
Other
Noncurrent
Liabilities |
|
Derivatives designated as hedging instruments: |
|
|
|
|
|
|
|
|
|
|
|
|
|
|
Foreign exchange contracts |
|
Level 2 |
|
$ |
— |
|
|
$ |
— |
|
|
$ |
— |
|
|
$ |
— |
|
Commodity contracts |
|
Level 2 |
|
|
— |
|
|
|
— |
|
|
|
— |
|
|
|
— |
|
Interest rate contracts |
|
Level 2 |
|
|
— |
|
|
|
— |
|
|
|
— |
|
|
|
— |
|
Derivatives not designated as hedging instruments: |
|
|
|
|
|
|
|
|
|
|
|
|
|
|
Foreign exchange contracts |
|
Level 2 |
|
|
— |
|
|
|
— |
|
|
|
— |
|
|
|
— |
|
Embedded derivative contracts |
|
Level 3 |
|
|
— |
|
|
|
— |
|
|
|
— |
|
|
|
572 |
|
|
|
|
|
|
|
|
|
|
|
|
|
|
|
|
|
|
|
|
|
|
|
|
|
December 31, 2024 |
|
|
|
Fair Value Hierarchy |
|
Current Derivative Financial Instruments |
|
|
Derivative Financial Instruments |
|
|
Accrued
Liabilities |
|
|
Other
Noncurrent
Liabilities |
|
Derivatives designated as hedging instruments: |
|
|
|
|
|
|
|
|
|
|
|
|
|
|
Foreign exchange contracts |
|
Level 2 |
|
$ |
20,443 |
|
|
$ |
14,722 |
|
|
$ |
451 |
|
|
$ |
3,664 |
|
Commodity contracts |
|
Level 2 |
|
|
258 |
|
|
|
14 |
|
|
|
2,341 |
|
|
|
1,233 |
|
Interest rate contracts |
|
Level 2 |
|
|
1,536 |
|
|
|
— |
|
|
|
— |
|
|
|
— |
|
Derivatives not designated as hedging instruments: |
|
|
|
|
|
|
|
|
|
|
|
|
|
|
Foreign exchange contracts |
|
Level 2 |
|
|
341 |
|
|
|
— |
|
|
|
— |
|
|
|
— |
|
Embedded derivative contracts |
|
Level 3 |
|
|
— |
|
|
|
— |
|
|
|
626 |
|
|
|
1,403 |
|
The following table summarizes the notional amount of the Company’s derivative financial instruments as of September 30, 2025 and December 31, 2024:
|
|
|
|
|
|
|
|
|
|
|
|
Notional Amount |
|
|
|
September 30,
2025 |
|
|
December 31,
2024 |
|
Derivatives designated as hedging instruments: |
|
|
|
|
|
|
Foreign exchange contracts |
|
$ |
— |
|
|
$ |
434,327 |
|
Commodity contracts - Natural Gas (1) |
|
|
— |
|
|
3,402 Btu |
|
Commodity contracts - Aluminum (2) |
|
|
— |
|
|
— MT |
|
Interest rate contracts |
|
$ |
— |
|
|
$ |
150,000 |
|
Derivatives not designated as hedging instruments: |
|
|
|
|
|
|
Foreign exchange contracts |
|
$ |
— |
|
|
$ |
25,856 |
|
|
|
|
|
|
|
|
(1) Notional units are in thousands of British thermal units (Btu)
(2) Notional units are in thousands of Metric Tons (MT)
Notional amounts are presented on a net basis. The notional amounts of the derivative financial instruments do not represent amounts exchanged by the parties and, therefore, are not a direct measure of the exposure to the financial risks described above. The amounts exchanged are calculated by reference to the notional amounts and by other terms of the derivatives.
The following table summarizes the gain or loss recognized in other comprehensive income (loss) (“OCI (OCL)”), the amounts reclassified from accumulated OCI or OCL into earnings, and the amounts recognized directly into earnings for the three and nine months ended September 30, 2025 and 2024:
|
|
|
|
|
|
|
|
|
|
|
|
|
|
|
|
|
|
|
|
Three Months Ended |
|
|
Nine Months Ended |
|
|
|
September 30,
2025 |
|
|
September 30,
2024 |
|
|
September 30,
2025 |
|
|
September 30,
2024 |
|
Derivatives designated as hedging instruments: |
|
|
|
|
|
|
|
|
|
|
|
|
Amount of gain or (loss) recognized in OCI on derivatives, net of tax |
|
$ |
(6,589 |
) |
|
$ |
(11,611 |
) |
|
$ |
(1,184 |
) |
|
$ |
(24,893 |
) |
Amount of pre-tax gain or (loss) reclassified from accumulated OCI into: |
|
|
|
|
|
|
|
|
|
|
|
|
Cost of sales |
|
|
6,186 |
|
|
|
6,291 |
|
|
|
16,169 |
|
|
|
23,106 |
|
Interest expense, net |
|
|
403 |
|
|
|
1,171 |
|
|
|
1,321 |
|
|
|
3,459 |
|
Derivatives not designated as hedging instruments: |
|
|
|
|
|
|
|
|
|
|
|
|
Amount of pre-tax gain or (loss) recognized in other income (expense), net of tax |
|
|
291 |
|
|
|
(1,054 |
) |
|
|
3,426 |
|
|
|
(2,878 |
) |
The Company estimates approximately $22.5 million included in OCI or OCL at September 30, 2025 will be reclassified into net income (loss) within the following twelve months.
The Company has derivative liabilities associated with embedded features within its redeemable preferred stock (refer to Note 10 “Redeemable Shares”) and its term loan facility (refer to Note 8 “Debt and Other Financing Arrangements”).
Assets and Liabilities Measured at Fair Value on a Nonrecurring Basis
In addition to items measured at fair value on a recurring basis, assets may be measured at fair value on a nonrecurring basis. These assets include long-lived assets and intangible assets which may be written down to fair value as a result of impairment.
Long-Lived Assets
The Company evaluates its long-lived assets for impairment whenever events or circumstances indicate the value of these long-lived asset groups are not recoverable. As a result of the customer actions described in Note 2 “Basis of Presentation”, the Company concluded certain impairment triggers had occurred for its North America asset group during the second quarter of 2025. After failing the undiscounted cash flow recoverability test, the Company estimated the fair values of the long-lived assets within the North America asset group at June 30, 2025 and compared it to the net carrying value. The fair value measurements related to this long-lived asset group relies primarily on Company-specific inputs and the Company’s assumptions about the use of the assets, as observable inputs are not available (level 3). To determine the fair value of the long-lived asset group, the Company utilized an income-based and market-based approach. The Company believes the assumptions and estimates used to determine the estimated fair values of the long-lived asset group are reasonable; however, the estimates and assumptions are subject to a high degree of uncertainty. Due to the many variables inherent in estimating fair value differences in assumptions could have a material effect on the results of the analyses.
As the fair value of the North America long-lived asset group exceeded its net carrying value, the Company recorded a non-cash impairment charge of $66.9 million to property, plant, and equipment, during the second quarter of 2025.
Financial Instruments Not Carried at Fair Value
Debt Instruments
The carrying values of the Company’s debt instruments vary from their fair values. The fair values are determined by reference to quoted prices for similar instruments (Level 2). The estimated fair value, as well as the carrying value, of the Company’s debt instruments are shown below:
|
|
|
|
|
|
|
|
|
|
|
|
September 30,
2025 |
|
|
December 31,
2024 |
|
Estimated fair value |
|
$ |
676,876 |
|
|
$ |
531,461 |
|
Carrying value |
|
|
631,954 |
|
|
|
489,388 |
|
NOTE 5 - BUSINESS SEGMENTS
North America and Europe comprise the Company’s reportable segments. Segment operating results for the three and nine months ended September 30, 2025 and 2024 are as follows:
|
|
|
|
|
|
|
|
|
|
|
|
|
|
|
|
|
|
|
|
|
|
|
|
|
|
|
|
|
|
Three Months Ended |
|
|
September 30, 2025 |
|
|
September 30, 2024 |
|
|
North
America |
|
|
|
Europe |
|
|
Total |
|
|
North
America |
|
|
|
Europe |
|
|
Total |
|
Net Sales |
$ |
73,538 |
|
|
|
$ |
104,662 |
|
|
$ |
178,200 |
|
|
$ |
206,233 |
|
|
|
$ |
115,524 |
|
|
$ |
321,757 |
|
|
|
|
|
|
|
|
|
|
|
|
|
|
|
|
|
|
|
|
|
Less: |
|
|
|
|
|
|
|
|
|
|
|
|
|
|
|
|
|
|
|
Aluminum and other material costs |
|
42,475 |
|
|
|
|
49,723 |
|
|
|
92,198 |
|
|
|
106,925 |
|
|
|
|
44,963 |
|
|
|
151,888 |
|
Manufacturing costs |
|
55,123 |
|
|
|
|
47,748 |
|
|
|
102,871 |
|
|
|
63,811 |
|
|
|
|
55,886 |
|
|
|
119,697 |
|
Manufacturing depreciation and amortization |
|
4,853 |
|
|
|
|
7,459 |
|
|
|
12,312 |
|
|
|
9,865 |
|
|
|
|
11,673 |
|
|
|
21,538 |
|
Selling, general, and administrative expenses |
|
20,125 |
|
|
|
|
6,235 |
|
|
|
26,360 |
|
|
|
11,739 |
|
|
|
|
12,161 |
|
|
|
23,900 |
|
Segment expenses |
|
122,576 |
|
|
|
|
111,165 |
|
|
|
233,741 |
|
|
|
192,340 |
|
|
|
|
124,683 |
|
|
|
317,023 |
|
Income (loss) from operations |
$ |
(49,038 |
) |
|
|
$ |
(6,503 |
) |
|
$ |
(55,541 |
) |
|
$ |
13,893 |
|
|
|
$ |
(9,159 |
) |
|
$ |
4,734 |
|
|
|
|
|
|
|
|
|
|
|
|
|
|
|
|
|
|
|
|
|
Supplemental Segment Financial Information: |
|
Depreciation and amortization |
$ |
4,960 |
|
|
|
|
$ |
7,485 |
|
|
$ |
12,445 |
|
|
$ |
9,968 |
|
|
|
|
$ |
11,732 |
|
|
$ |
21,700 |
|
Capital expenditures |
|
2,708 |
|
|
|
|
|
4,314 |
|
|
|
7,022 |
|
|
|
3,041 |
|
|
|
|
|
3,100 |
|
|
|
6,141 |
|
|
|
|
|
|
|
|
|
|
|
|
|
|
|
|
|
|
|
|
|
|
|
|
|
|
|
Nine Months Ended |
|
|
September 30, 2025 |
|
|
September 30, 2024 |
|
|
North
America |
|
|
Europe |
|
|
Total |
|
|
North
America |
|
|
Europe |
|
|
Total |
|
Net Sales |
$ |
371,050 |
|
|
$ |
336,649 |
|
|
$ |
707,699 |
|
|
$ |
602,944 |
|
|
$ |
354,056 |
|
|
$ |
957,000 |
|
|
|
|
|
|
|
|
|
|
|
|
|
|
|
|
|
|
|
Less: |
|
|
|
|
|
|
|
|
|
|
|
|
|
|
|
|
|
Aluminum and other material costs |
|
209,221 |
|
|
|
150,133 |
|
|
|
359,354 |
|
|
|
313,937 |
|
|
|
146,887 |
|
|
|
460,824 |
|
Manufacturing costs |
|
177,085 |
|
|
|
155,609 |
|
|
|
332,694 |
|
|
|
190,880 |
|
|
|
158,873 |
|
|
|
349,753 |
|
Manufacturing depreciation and amortization |
|
21,697 |
|
|
|
28,483 |
|
|
|
50,180 |
|
|
|
30,325 |
|
|
|
34,698 |
|
|
|
65,023 |
|
Selling, general, and administrative expenses |
|
47,648 |
|
|
|
19,051 |
|
|
|
66,699 |
|
|
|
32,632 |
|
|
|
33,476 |
|
|
|
66,108 |
|
Impairment of long-lived assets |
|
66,906 |
|
|
|
— |
|
|
|
66,906 |
|
|
|
— |
|
|
|
— |
|
|
|
— |
|
Segment expenses |
|
522,557 |
|
|
|
353,276 |
|
|
|
875,833 |
|
|
|
567,774 |
|
|
|
373,934 |
|
|
|
941,708 |
|
Income (loss) from operations |
$ |
(151,507 |
) |
|
$ |
(16,627 |
) |
|
$ |
(168,134 |
) |
|
$ |
35,170 |
|
|
$ |
(19,878 |
) |
|
$ |
15,292 |
|
|
|
|
|
|
|
|
|
|
|
|
|
|
|
|
|
|
|
Supplemental Segment Financial Information: |
|
Depreciation and amortization |
$ |
22,009 |
|
|
$ |
28,601 |
|
|
$ |
50,610 |
|
|
$ |
30,645 |
|
|
$ |
34,889 |
|
|
$ |
65,534 |
|
Capital expenditures |
|
7,615 |
|
|
|
11,318 |
|
|
|
18,933 |
|
|
|
11,611 |
|
|
|
9,374 |
|
|
|
20,985 |
|
|
|
|
|
|
|
|
|
|
|
|
|
|
|
|
|
|
|
|
|
|
|
|
|
|
|
September 30, 2025 |
|
|
December 31, 2024 |
|
|
North
America |
|
|
Europe |
|
|
Total |
|
|
North
America |
|
|
Europe |
|
|
Total |
|
Long-lived assets: |
|
|
|
|
|
|
|
|
|
|
|
|
|
|
|
|
|
Property, plant, and equipment |
$ |
104,336 |
|
|
$ |
169,703 |
|
|
$ |
274,039 |
|
|
$ |
174,180 |
|
|
$ |
155,712 |
|
|
$ |
329,892 |
|
Intangible assets |
|
— |
|
|
|
4,516 |
|
|
|
4,516 |
|
|
|
— |
|
|
|
12,612 |
|
|
|
12,612 |
|
|
|
|
|
|
|
|
|
|
|
|
|
|
|
|
|
|
|
Segment assets |
|
276,382 |
|
|
|
315,587 |
|
|
|
591,969 |
|
|
|
407,800 |
|
|
|
332,329 |
|
|
|
740,129 |
|
Geographic Information
See table below for the Company’s net sales and property, plant and equipment by location:
|
|
|
|
|
|
|
|
|
|
|
|
|
|
|
|
|
|
|
|
Net Sales (1) |
|
|
|
Three Months Ended |
|
|
Nine Months Ended |
|
|
|
September 30,
2025 |
|
|
September 30,
2024 |
|
|
September 30,
2025 |
|
|
September 30,
2024 |
|
U.S. |
|
$ |
679 |
|
|
$ |
1,484 |
|
|
$ |
7,206 |
|
|
$ |
4,344 |
|
Mexico |
|
|
72,859 |
|
|
|
204,749 |
|
|
|
363,844 |
|
|
$ |
598,600 |
|
Germany |
|
|
9,418 |
|
|
|
20,032 |
|
|
|
34,372 |
|
|
$ |
50,893 |
|
Poland |
|
|
95,244 |
|
|
|
95,492 |
|
|
|
302,277 |
|
|
$ |
303,163 |
|
Consolidated net sales |
|
$ |
178,200 |
|
|
$ |
321,757 |
|
|
$ |
707,699 |
|
|
$ |
957,000 |
|
(1) Revenues are attributed based on location of legal entity.
|
|
|
|
|
|
|
|
|
|
|
|
Property, Plant and Equipment, net |
|
|
|
September 30,
2025 |
|
|
December 31,
2024 |
|
U.S. |
|
$ |
1,226 |
|
|
$ |
1,505 |
|
Mexico |
|
|
103,110 |
|
|
|
172,674 |
|
Germany |
|
|
753 |
|
|
|
573 |
|
Poland |
|
|
168,950 |
|
|
|
155,140 |
|
Property, plant and equipment, net |
|
$ |
274,039 |
|
|
$ |
329,892 |
|
NOTE 6 - INVENTORIES
Inventory by major classification as of September 30, 2025 and December 31, 2024 was as follows:
|
|
|
|
|
|
|
|
|
|
|
|
September 30,
2025 |
|
|
December 31,
2024 |
|
Raw materials |
|
$ |
29,581 |
|
|
$ |
34,339 |
|
Work in process |
|
|
27,954 |
|
|
|
34,449 |
|
Finished goods |
|
|
66,623 |
|
|
|
76,948 |
|
Inventories, net |
|
$ |
124,158 |
|
|
$ |
145,736 |
|
Service wheel and supplies inventory are included in other noncurrent assets and were $4.6 million and $7.7 million at September 30, 2025 and December 31, 2024.
During the three and nine months ended September 30, 2025, the Company recognized a non-cash charge of $1.8 million and $13.9 million to write-down inventory to its net realizable value related to certain customers resourcing to other suppliers.
NOTE 7 – INTANGIBLE ASSETS
Amortization for the three and nine months ended September 30, 2025 and 2024 were as follows:
|
|
|
|
|
|
|
|
|
|
|
|
|
|
|
|
|
|
|
|
Three Months Ended |
|
|
Nine Months Ended |
|
|
|
September 30,
2025 |
|
|
September 30,
2024 |
|
|
September 30,
2025 |
|
|
September 30,
2024 |
|
Amortization expense |
|
$ |
676 |
|
|
$ |
4,943 |
|
|
$ |
9,000 |
|
|
$ |
14,669 |
|
|
|
|
|
|
|
Annual Anticipated Future Amortization |
|
Amount |
|
Three Remaining Months of 2025 |
|
$ |
675 |
|
2026 |
|
|
2,711 |
|
2027 |
|
|
1,130 |
|
Total anticipated future amortization |
|
$ |
4,516 |
|
|
|
|
|
NOTE 8 – DEBT AND OTHER FINANCING ARRANGEMENTS
A summary of the Company’s long-term obligations as of September 30, 2025 and December 31, 2024 are as follows:
|
|
|
|
|
|
|
|
|
|
|
|
|
|
|
|
|
|
|
|
|
|
|
|
|
|
|
|
|
September 30, 2025 |
|
|
December 31, 2024 |
|
|
|
|
Principal |
|
|
Carrying Value |
|
|
Effective Interest Rate |
|
|
Principal |
|
|
Carrying Value |
|
|
Effective Interest Rate |
|
|
Senior Secured Credit Facilities: |
|
|
|
|
|
|
|
|
|
|
|
|
|
|
|
|
|
|
|
Revolving Credit Facility |
|
$ |
42,473 |
|
|
$ |
42,473 |
|
|
|
12.7 |
% |
|
$ |
— |
|
|
$ |
— |
|
|
|
— |
|
|
Term Loan Facility (1) |
|
|
543,113 |
|
|
|
517,251 |
|
|
|
11.6 |
% |
|
|
518,700 |
|
|
|
488,298 |
|
|
|
11.1 |
% |
|
Delayed Draw Term Loan Facility (2) |
|
|
75,600 |
|
|
|
71,235 |
|
|
|
12.6 |
% |
|
|
— |
|
|
|
— |
|
|
|
— |
|
|
Other debt: |
|
|
|
|
|
|
|
|
|
|
|
|
|
|
|
|
|
|
|
Finance leases |
|
|
995 |
|
|
|
995 |
|
|
|
8.2 |
% |
|
|
1,090 |
|
|
|
1,090 |
|
|
|
5.6 |
% |
|
|
|
|
|
|
|
631,954 |
|
|
|
|
|
|
|
|
|
489,388 |
|
|
|
|
|
Less: Current portion of long-term debt |
|
|
|
|
|
(631,430 |
) |
|
|
|
|
|
|
|
|
(7,939 |
) |
|
|
|
|
Long-term debt |
|
|
|
|
$ |
524 |
|
|
|
|
|
|
|
|
$ |
481,449 |
|
|
|
|
|
(1)The Term Loan Facility includes paid-in-kind interest of $27.9 million as of September 30, 2025.
(2)The Delayed Draw Term Loan Facility principal includes an upfront one-time 3.0% fee that was paid-in-kind as of September 30, 2025. Additionally, a 5.0% exit fee is included in the principal amount, which becomes payable on the maturity date.
Debt maturities as of September 30, 2025, which are due in the next five years are as follows:
|
|
|
|
|
|
Debt Maturities |
|
Amount |
|
Three remaining months of 2025 |
|
$ |
661,657 |
|
2026 |
|
|
205 |
|
2027 |
|
|
307 |
|
2028 |
|
|
12 |
|
Total debt liabilities |
|
$ |
662,181 |
|
The weighted average interest rate on outstanding short-term borrowings as of September 30, 2025 was 12.3%.
Exchange Agreement
On December 8, 2025, the Company entered into that certain Exchange and Contribution Agreement (the “Exchange Agreement”), by and among the Company, each of its subsidiaries, certain lenders (the “Pre-Exchange Term Lenders”) party to the Revolving Credit Agreement (as in effect prior to the effectiveness of the Third Revolving Credit Facility Amendment (as defined below), the “Pre-Exchange Term Loan Agreement”) , SUP Parent Holdings, LLC (“Parent”) and Oaktree Fund Administration, LLC, as administrative agent. Pursuant to the Exchange Agreement, immediately following the consummation of the Merger, each Pre-Exchange Term Lender (a) exchanged with the Company all of its rights, title, and interest in, to, and under its Exchanged Term Loan Claims and Bridge Loan Claims (each as defined in the Exchange Agreement) in return for a certain portion of the aggregate principal amount of Take Back Term Loans (as defined in the Exchange Agreement) and (b) contributed to Parent all of its rights, title, and interest in, to and under its Contributed Existing Term Loan Claims (as defined in the Exchange Agreement) in exchange for a certain number of units representing limited liability company interests in Parent, if any. Upon the consummation of the foregoing, (i) all Exchanged Term Loan Claims, Bridge Loan Claims, and Contributed Existing Term Loan Claims were deemed satisfied, discharged, terminated, and extinguished in full and (ii) all commitments, if any, under the Pre-Exchange Term Loan Agreement were terminated.
Senior Secured Credit Facilities
Revolving Credit Facility
The Company is a party to a Credit Agreement, dated as of December 15, 2022 (as amended, amended and restated, restated, supplemented or modified from time to time, the “Revolving Credit Agreement”), pursuant to which the lenders thereto have provided
a $60.0 million revolving credit facility (“the Revolving Credit Facility”). The Revolving Credit Facility will mature on December 15, 2027.
Simultaneously with the execution of the Term Loan Second Amendment (as defined below), the Company, the other borrowers party thereto, JPMorgan Chase Bank, N.A., in its capacity as administrative agent and collateral agent, and the lenders and issuing banks party thereto, entered into a Second Amendment (the “Second Revolving Credit Facility Amendment”) to the Revolving Credit Agreement, pursuant to which, among other things, the lenders party thereto agreed to (i) a limited waiver of the financial covenants under the Revolving Credit Facility for the test period ending on June 30, 2025, (ii) the Company’s unwinding of its hedging arrangements and the retention by the Company of the proceeds thereof and (iii) the incurrence of the Delayed Draw Term Loan Facility.
On December 8, 2025, the Company entered into a Third Amendment (the “Third Revolving Credit Facility Amendment”) to the Revolving Credit Agreement, by and among the Company, certain subsidiaries of the Company party thereto, the lenders party thereto (the “Revolving Lenders”), and JPMorgan Chase Bank, N.A., as administrative and collateral agent, which amends the Revolving Credit Agreement. Pursuant to the Third Revolving Credit Facility Amendment, among other things, (i) the Revolving Lenders agreed to waive certain defaults and events of default outstanding under the Revolving Credit Agreement (as in effect prior to the effectiveness of the Third Revolving Credit Facility Amendment) and compliance with the financial covenants under the Revolving Credit Agreement through (and including) June 30, 2026 and (ii) the maturity of the Revolving Credit Facility was amended to June 30, 2026.
Term Loan Facility
The Company is also party to an Amended and Restated Credit Agreement, dated as of August 14, 2024 (as amended, amended and restated, restated, supplemented or modified from time to time, the “Term Loan Agreement” and, together with the Revolving Credit Agreement, the “Credit Agreements”), pursuant to which the lenders thereto have provided (i) a $520 million term loan facility (the “Pre-Recapitalization Term Loan Facility”) and (ii) the Delayed Draw Term Loan Facility (as defined below). The Term Loan Facility matures on December 15, 2028 and the Delayed Draw Term Loan Facility matures on June 4, 2026.
On March 31, 2025, the Company entered into an amendment (the “Term Loan First Amendment”) to its Term Loan Agreement which, among other things, (i) increased the liquidity threshold which would trigger a mandatory prepayment of the Pre-Recapitalization Term Loan Facility, from $80.0 million to $115.0 million and (ii) included the Company’s and its subsidiaries’ ability to factor assets under certain securitization agreements in the calculation of liquidity for the purposes of determining whether a mandatory prepayment is required.
On June 4, 2025, the Company entered into an amendment (the “Term Loan Second Amendment”) to its Term Loan Agreement to, among other things, provide an incremental $70.0 million delayed draw term loan facility (the “Delayed Draw Term Loan Facility” ).
The Pre-Recapitalization Term Loan Facility contains a mandatory prepayment provision upon the event of default, which the Company has accounted for separately as a derivative liability. As of September 30, 2025, the Company has recorded a derivative liability of $0.6 million in the condensed consolidated balance sheet.
During the nine months ended September 30, 2025, the Company prepaid $2.2 million in principal of the Term Loan Facility under one of the mandatory prepayment provisions applicable thereto.
As of September 30, 2025, the interest rate in effect on borrowings under the Pre-Recapitalization Term Loan Facility and the Delayed Draw Term Loan Facility were 11.7% and 12.3%. As of September 30, 2025, the interest rate in effect on borrowings under the Revolving Credit Facility was 10.8%.
Upon the consummation of the transactions contemplated in the Exchange Agreement, no obligations under the Pre-Recapitalization Term Loan Facility or the Delayed Draw Term Loan Facility remain.
On December 8, 2025, the Company also entered into an amendment (the “Term Loan Third Amendment”) to its Term Loan Agreement pursuant to which, among other things, (i) an additional $27.5 million of aggregate principal amount of term loans were made to the Company, (ii) $172.5 million of aggregate principal amount of term loans (which amount was increased from the amount provided in the Recapitalization Support Agreement, dated as of July 8, 2025, by mutual agreement of the Company, the lenders party thereto, and TPG Growth III Sidewall, L.P. (“TPG”)) were deemed made to the Company by (a) the Pre-Exchange Term Lenders in exchange for an equivalent amount of obligations owed to them under the Term Loan Agreement (as in effect prior to the Term Loan Third Amendment) and (b) TPG in consideration for its agreement with respect to the increased aggregate principal amount of term loan and (iii) the lenders party thereto agreed to waive defaults and events of default outstanding under the Term Loan Agreement (as in effect prior to the Term Loan Third Amendment).
Further information on prepayments, interest rates, guarantees and collateral security, covenants, and other terms and conditions of the Senior Secured Credit Facilities is included in the Company’s 2024 Form 10-K and the Company’s Forms 8-K filed on April 2, 2025 and June 6, 2025.
As of September 30, 2025, the Company was in violation of its financial covenants under the Senior Secured Credit Facilities. The Third Amendment to the Company’s Senior Secured Credit Facilities entered into on December 8, 2025 removed certain financial covenants under the Term Loan Facility and waived the financial covenants under the Revolving Credit Facility through June 30, 2026. The Senior Secured Credit Facilities also contain a monthly minimum liquidity threshold of not less than $10.0 million as of the last business day of each month.
Available Unused Commitments under the Revolving Credit Facility
As of September 30, 2025, the Company had $42.5 million in outstanding borrowings under the Revolving Credit Facility and unused commitments of $0.1 million, which has been reduced for outstanding letters of credit of $17.4 million.
Factoring Arrangements
The Company sells certain customer trade receivables under factoring arrangements with designated financial institutions, which are accounted for as a sale. The fair value of assets received as proceeds in exchange for the transfer of accounts receivable under these factoring arrangements approximates fair value of such receivables and cash proceeds are included in cash provided by operating activities. The Company’s ongoing involvement under the factoring arrangements is limited to processing of customer payments on the factored receivables. Factoring arrangements incorporate customary representations and warranties, including representations as to validity of amounts due, completeness of performance obligations, and absence of commercial disputes.
During the three months ended September 30, 2025 and 2024, the Company sold trade receivables totaling $59.0 million and $222.6 million and incurred factoring fees of $0.8 million and $1.9 million. During the nine months ended September 30, 2025 and 2024, the Company sold trade receivables totaling $358.4 million and $520.2 million and incurred factoring fees of $3.5 million and $4.2 million.
As of September 30, 2025 and December 31, 2024, receivables of $23.7 million and $70.9 million had been factored and had not yet been paid by customers to the respective financial institutions.
NOTE 9 - SUPPLIER FINANCE PROGRAM
The Company receives extended payment terms for a portion of its purchases (90 days rather than 60 days) with one of its principal aluminum suppliers in exchange for a nominal adjustment to the product pricing. The supplier factors receivables due from the Company with a financial institution. During the second quarter of 2025, the financial institution that is the party to this supply chain finance arrangement suspended the Company’s use of the program. Obligations due to the financial institution under this program as of September 30, 2025 and December 31, 2024 were $13.7 million and $26.0 million.
NOTE 10 - REDEEMABLE SHARES
Preferred Stock
During the three and nine months ended September 30, 2025, preferred stock dividends of $0.3 million and $7.8 million were paid-in-kind, which increased the stated value of the preferred stock. As of September 30, 2025 and December 31, 2024, the stated values of the preferred stock were $167.9 million and $160.1 million, and the corresponding carrying values were $335.8 million and $288.5 million.
Pursuant to a Voting and Support Agreement (the “Preferred VSA”), dated as of July 8, 2025, by and between the Company and TPG Growth III Sidewall, L.P. (“TPG”), TPG, as the holder of all of the Series A Preferred Shares, agreed to waive its right to receive dividends it would have otherwise been entitled to receive under the Certificate of Designations until the earlier of the Effective Time and the termination of the Preferred VSA. If the Preferred VSA is terminated, the preferred shares will continue to accrue dividends at 9.0% on the stated value, and the associated redemption premium on the increase in the stated value will be accreted using the interest method.
In the event the redeemable preferred stock is redeemed, the redemption value will be the greater of (i) two times the then-current Stated Value (defined in the Certificate of Designations as $1,000 per share, plus any accumulated and unpaid dividends or dividends paid-in-kind), which as of September 30, 2025 would be equivalent to a $335.8 million redemption value, and (ii) the product of the number of shares of common stock into which the redeemable preferred stock could be converted at the time of such redemption (approximately 6.0 million shares as of September 30, 2025) and the then-Current Market Price (defined in the Certificate of Designations as the arithmetic average of the volume-weighted average price (VWAP) per share of common stock for each of the thirty (30) consecutive full trading days ending on the trading day before the record date with respect to such action) of our common stock.
The redeemable preferred stock may be redeemed at the holder’s election on or after September 14, 2025 or upon the occurrence of a redemption event (including in the event the common stock of the Company ceases to be listed on the NYSE or another U.S. national securities exchange), provided the Company has cash legally available to pay such redemption. Pursuant to the terms of the Preferred VSA, TPG has agreed to (i) waive any rights and remedies (including any redemption rights) it may have in connection with or related to the Merger and any other transactions entered into by the Company in connection therewith and (ii) that receipt of the aggregate amount of the consideration provided for the Series A Preferred Shares under the Merger Agreement shall constitute payment in full for all shares of Series A Preferred Shares owned of record or beneficially by TPG. Subject to the terms of the Preferred VSA, if the Company is unable to redeem the shares of preferred stock in full, any shares of preferred stock not redeemed would continue to receive an annual dividend of 9.0% on the stated value which would be payable quarterly. The Board of Directors would have to evaluate periodically the ability of the Company to make any redemption payments until the full redemption amount has been paid.
The Company has determined that the conversion option and the redemption option exercisable upon the occurrence of a “redemption event” which are embedded in the redeemable preferred stock must be accounted for separately from the redeemable preferred stock as a derivative liability.
As of September 30, 2025, other than as described above, there have been no changes in the preferred shareholder rights, including conversion and redemption rights from those described in the Company’s 2024 Form 10-K.
On December 8, 2025, in accordance with the terms and conditions set forth in the Merger Agreement, each share of preferred stock, par value $0.01 per share designated as Series A Preferred Shares (the “Series A Preferred Shares” and, together with the Common Shares, the “Shares”), in each case, issued and outstanding immediately prior to the Effective Time was converted into the right to receive (a) $39.49 per Series A Preferred Share in cash and (b) 0.23 units of limited liability company interests of Parent per Series A Preferred Share.
Additional information about the Preferred VSA and the Merger is set forth in our Current Report on Form 8-K/A filed with the SEC on July 9, 2025, our definitive proxy statement filed with the SEC on August 15, 2025, and our Current Report on Form 8-K filed with the SEC on December 8, 2025.
Noncontrolling Redeemable Equity
The Company has a noncontrolling interest that is currently redeemable. It is presented in the temporary equity section of the condensed consolidated balance sheets and is adjusted to its redemption value at the end of each reporting period.
NOTE 11 – EARNINGS PER SHARE
Basic earnings per share is computed by dividing net income (loss), after deducting preferred dividends and accretion, and European noncontrolling redeemable equity dividends, by the weighted average number of common shares outstanding. In calculating diluted earnings per share, the weighted average shares outstanding considers the dilutive effect of outstanding stock options, and time and performance based restricted stock units under the treasury stock method. Approximately 793.0 thousand stock-based compensation shares discussed in Note 14, “Stock-Based Compensation” have not been included in the diluted earnings per share because they would be anti-dilutive for the three months ended September 30, 2024. Approximately 64.7 thousand and 677.0 thousand stock-based
compensation shares discussed in Note 14, “Stock-Based Compensation” have not been included in the diluted earnings per share because they would be anti-dilutive for the nine months ended September 30, 2025 and 2024.
In calculating basic and diluted earnings per share, a company with participating securities must allocate earnings to the participating securities with a corresponding reduction in the earnings attributable to common shares under the two-class method. Losses are only allocated to participating securities when the security holders have a contractual obligation to share in the losses of the Company with common stockholders. Because the redeemable preferred shareholders do not have a contractual obligation to share in the Company’s losses with common stockholders, the full amount of the Company’s losses for the three and nine months ended September 30, 2025 and 2024 were attributed to the common shares. Thus, the redeemable preferred shares discussed in Note 10, “Redeemable Shares” (convertible into 5,962 thousand shares) have not been included in the diluted earnings per share for the three and nine months ended September 30, 2025 and 2024.
|
|
|
|
|
|
|
|
|
|
|
|
|
|
|
|
|
|
|
|
Three Months Ended |
|
|
Nine Months Ended |
|
|
|
September 30,
2025 |
|
|
September 30,
2024 |
|
|
September 30,
2025 |
|
|
September 30,
2024 |
|
(Dollars in thousands, except per share amounts) |
|
|
|
|
|
|
|
|
|
|
|
|
Net income (loss) attributable to common shareholders |
|
$ |
(84,989 |
) |
|
$ |
(24,753 |
) |
|
$ |
(278,971 |
) |
|
$ |
(68,626 |
) |
Redeemable preferred stock dividends and accretion |
|
|
(17,025 |
) |
|
|
(11,081 |
) |
|
|
(46,722 |
) |
|
|
(31,601 |
) |
Noncontrolling redeemable equity dividend |
|
|
(6 |
) |
|
|
(5 |
) |
|
|
(17 |
) |
|
|
(11 |
) |
Basic numerator |
|
$ |
(102,020 |
) |
|
$ |
(35,839 |
) |
|
$ |
(325,710 |
) |
|
$ |
(100,238 |
) |
|
|
|
|
|
|
|
|
|
|
|
|
|
Weighted average shares outstanding – Basic |
|
|
33,664 |
|
|
|
28,886 |
|
|
|
30,782 |
|
|
|
28,625 |
|
Dilutive effect of common share equivalents |
|
|
— |
|
|
|
— |
|
|
|
— |
|
|
|
— |
|
Weighted average shares outstanding – Diluted |
|
|
33,664 |
|
|
|
28,886 |
|
|
|
30,782 |
|
|
|
28,625 |
|
|
|
|
|
|
|
|
|
|
|
|
|
|
Basic earnings (loss) per share |
|
$ |
(3.03 |
) |
|
$ |
(1.24 |
) |
|
$ |
(10.58 |
) |
|
$ |
(3.50 |
) |
Diluted earnings (loss) per share |
|
$ |
(3.03 |
) |
|
$ |
(1.24 |
) |
|
$ |
(10.58 |
) |
|
$ |
(3.50 |
) |
NOTE 12 - INCOME TAXES
For interim periods, we generally utilize the estimated annual effective tax rate method under which the estimated annual effective tax rate is forecasted quarterly using actual historical information and forward-looking estimates and applied to year-to-date ordinary income. The tax effects of unusual or infrequently occurring items, including changes in judgment about valuation allowances, settlements with taxing authorities and effects of changes in tax laws or rates, and changes due to tax restructuring are reported in the interim period in which they occur.
Income taxes for the three and nine months ended September 30, 2025 were a $4.9 million and $44.9 million tax provision on pre-tax losses of $80.1 million and $234.1 million, resulting in an effective income tax rate of (6.1) percent and (19.2) percent. The effective income tax rate for the three months ended September 30, 2025 differs from the statutory rate primarily due to valuation allowances, the effect of Pillar Two, and the mix of earnings among tax jurisdictions. The effective income tax rate for the nine months ended September 30, 2025 differs from the statutory rate primarily due to valuation allowances, the reversal of an uncertain tax position, the effect of Pillar Two, and the mix of earnings among tax jurisdictions.
The income tax provision for the three and nine months ended September 30, 2024 was $0.9 million and $23.9 million on pre-tax losses of $23.9 million and $44.7 million, resulting in an effective income tax rate of (3.7)% and (53.6)%. The effective income tax rate for the three months ended September 30, 2024 differs from the statutory rate primarily due to valuation allowances and the mix of earnings among tax jurisdictions. The effective income tax rate for the nine months ended September 30, 2024 differs from the statutory rate primarily due to valuation allowances, the reversal of an uncertain tax position, the mix of earnings among tax jurisdictions, and a deferred tax charge related to a tax restructuring of $17.8 million.
The Company continuously evaluates the realizability of its net deferred tax assets. As of September 30, 2025, substantially all U.S., Mexico, Poland, and its German deferred tax assets, net of deferred tax liabilities, were subject to valuation allowances.
The Organization for Economic Co-operation and Development issued Pillar Two model rules introducing a new global minimum tax of 15.0% effective January 1, 2024. While the United States has not yet adopted the Pillar Two rules, various other governments around the world have enacted part of the legislation. As currently designed, Pillar Two ultimately applies to the Company’s worldwide operations. The Company has included the effect of Pillar Two in the condensed consolidated financial statements and continues to assess U.S. and global legislative action related to Pillar Two for potential effect changes of the current assessment. On July 4, 2025, Public Law 119-21, the “Act” (otherwise known as the “One Big Beautiful Bill Act”) was signed into law. The Act
includes the extension and modification of certain key provisions of the U.S. Tax Cuts and Jobs Act of 2017 (TCJA) and other provisions. The Company is analyzing the provisions within the Act. However, it does not expect a material effect on our consolidated financial statements.
NOTE 13 - LEASES
The Company has operating and finance leases for office facilities, a data center, vehicles, and certain equipment.
Lease expense and cash flow for the three and nine months ended September 30, 2025 and 2024 are as follows:
|
|
|
|
|
|
|
|
|
|
|
|
|
|
|
|
|
|
|
|
Three Months Ended |
|
|
Nine Months Ended |
|
|
|
September 30,
2025 |
|
|
September 30,
2024 |
|
|
September 30,
2025 |
|
|
September 30,
2024 |
|
Lease Expense |
|
|
|
|
|
|
|
|
|
|
|
|
Finance lease expense: |
|
|
|
|
|
|
|
|
|
|
|
|
Amortization of right-of-use assets |
|
$ |
199 |
|
|
$ |
141 |
|
|
$ |
624 |
|
|
$ |
404 |
|
Interest on lease liabilities |
|
|
22 |
|
|
|
8 |
|
|
|
70 |
|
|
|
19 |
|
Operating lease expense |
|
|
796 |
|
|
|
809 |
|
|
|
2,379 |
|
|
|
2,443 |
|
Total lease expense |
|
$ |
1,017 |
|
|
$ |
958 |
|
|
$ |
3,073 |
|
|
$ |
2,866 |
|
|
|
|
|
|
|
|
|
|
|
|
|
|
Cash Flow Components |
|
|
|
|
|
|
|
|
|
|
|
|
Cash paid for amounts included in the measurement of lease liabilities: |
|
|
|
|
|
|
|
|
|
|
|
|
Operating cash outflows from finance leases |
|
$ |
22 |
|
|
$ |
8 |
|
|
$ |
70 |
|
|
$ |
19 |
|
Operating cash outflows from operating leases |
|
|
817 |
|
|
|
833 |
|
|
|
2,449 |
|
|
|
2,518 |
|
Financing cash outflows from finance leases |
|
|
208 |
|
|
|
159 |
|
|
|
664 |
|
|
|
452 |
|
Right-of-use assets obtained in exchange for finance lease liabilities,
net of terminations and disposals |
|
|
— |
|
|
|
340 |
|
|
|
412 |
|
|
|
354 |
|
Right-of-use assets obtained in exchange for operating lease
liabilities, net of terminations and disposals |
|
|
748 |
|
|
|
28 |
|
|
|
860 |
|
|
|
68 |
|
Operating and finance lease assets and liabilities, average lease term, and average discount rate as of September 30, 2025 and December 31, 2024 are as follows:
|
|
|
|
|
|
|
|
|
|
|
|
September 30,
2025 |
|
|
December 31,
2024 |
|
Balance Sheet Information |
|
|
|
|
|
|
Operating leases: |
|
|
|
|
|
|
Other noncurrent assets |
|
$ |
6,205 |
|
|
$ |
7,057 |
|
Accrued liabilities |
|
$ |
3,188 |
|
|
$ |
2,870 |
|
Other noncurrent liabilities |
|
|
2,808 |
|
|
|
4,082 |
|
Total operating lease liabilities |
|
$ |
5,996 |
|
|
$ |
6,952 |
|
|
|
|
|
|
|
|
Finance leases: |
|
|
|
|
|
|
Property, plant and equipment gross |
|
$ |
3,462 |
|
|
$ |
3,000 |
|
Accumulated depreciation |
|
|
(2,066 |
) |
|
|
(1,441 |
) |
Property, plant and equipment, net |
|
$ |
1,396 |
|
|
$ |
1,559 |
|
Current portion of long-term debt |
|
$ |
471 |
|
|
$ |
564 |
|
Long-term debt (less current portion) |
|
|
524 |
|
|
|
526 |
|
Total finance lease liabilities |
|
$ |
995 |
|
|
$ |
1,090 |
|
|
|
|
|
|
|
|
Lease Term and Discount Rates |
|
|
|
|
|
|
Weighted-average remaining lease term - finance leases (years) |
|
|
1.9 |
|
|
|
2.0 |
|
Weighted-average remaining lease term - operating leases (years) |
|
|
2.2 |
|
|
|
3.3 |
|
Weighted-average discount rate - finance leases |
|
|
8.2 |
% |
|
|
5.6 |
% |
Weighted-average discount rate - operating leases |
|
|
5.0 |
% |
|
|
5.0 |
% |
Future minimum payments under our leases as of September 30, 2025 are as follows:
|
|
|
|
|
|
|
|
|
|
|
|
Amount |
|
Lease Maturities |
|
Finance Leases |
|
|
Operating Leases |
|
2025 |
|
$ |
471 |
|
|
$ |
911 |
|
2026 |
|
|
204 |
|
|
|
3,226 |
|
2027 |
|
|
393 |
|
|
|
1,617 |
|
2028 |
|
|
13 |
|
|
|
180 |
|
2029 |
|
|
- |
|
|
|
163 |
|
Thereafter |
|
|
- |
|
|
|
219 |
|
Total |
|
|
1,081 |
|
|
|
6,316 |
|
Less: Imputed interest |
|
|
(86 |
) |
|
|
(320 |
) |
Total lease liabilities, net of interest |
|
$ |
995 |
|
|
$ |
5,996 |
|
NOTE 14 - STOCK-BASED COMPENSATION
Equity Incentive Plan
The Company’s 2018 Equity Incentive Plan (the “Plan”), as amended, authorizes it to issue up to 11.45 million shares of common stock, along with non-qualified stock options, stock appreciation rights, restricted stock units and performance restricted stock units to officers, key employees, non-employee directors and consultants. At September 30, 2025, there were 3.3 million shares available for future grants under this Plan. It is the Company’s policy to issue shares from authorized but not issued shares upon the exercise of stock options.
Under the terms of the Plan, each year eligible participants are granted time value restricted stock units (“RSUs”), vesting ratably over a three-year period, and performance restricted stock units (“PSUs”) with three-year cliff vesting. Upon vesting, each restricted stock award is exchangeable for one share of the Company’s common stock, with accrued dividends. Unrecognized stock-based compensation expense related to nonvested awards of $2.1 million is expected to be recognized over a weighted average period of approximately 1.1 years as of September 30, 2025.
RSU and PSU activity for the nine months ended September 30, 2025 is summarized in the following table:
|
|
|
|
|
|
|
|
|
|
|
|
|
|
|
|
|
|
|
|
|
Equity Incentive Awards |
|
|
Restricted
Stock Units |
|
|
Weighted
Average
Grant Date
Fair Value |
|
|
Performance
Shares |
|
|
Weighted
Average
Grant Date
Fair Value |
|
|
Balance at January 1, 2025 |
|
|
1,048,973 |
|
|
$ |
3.66 |
|
|
|
1,476,920 |
|
|
$ |
4.22 |
|
|
Granted |
|
|
— |
|
|
|
— |
|
|
|
19,009 |
|
|
|
4.29 |
|
|
Settled |
|
|
(609,850 |
) |
|
|
3.77 |
|
|
|
(644,823 |
) |
|
|
4.28 |
|
|
Forfeited or expired |
|
|
(62,291 |
) |
|
|
4.30 |
|
|
|
(97,440 |
) |
|
|
4.56 |
|
|
Balance at September 30, 2025 |
|
|
376,832 |
|
|
$ |
3.38 |
|
|
|
753,666 |
|
|
$ |
4.13 |
|
|
|
|
|
|
|
|
|
|
|
|
|
|
|
|
Awards estimated to vest in the future |
|
|
376,832 |
|
|
$ |
3.38 |
|
|
|
753,666 |
|
|
$ |
4.13 |
|
|
Long Term Cash Incentive Plan
In 2025, the Company amended its Long Term Cash Incentive Plan (“Cash Plan”) to allow it to grant RSUs and PSUs to certain key employees that are payable in cash. These awards are classified as liabilities, which will increase as the Company’s stock price increases and decrease as its stock price decreases. Under the terms of the Cash Plan, the RSUs vest ratably over a three-year period and are valued based on the fair value of the award at the grant date, then re-measured at each reporting date until settlement with compensation expense being recognized in proportion to the completed requisite period up until the date of settlement. The PSUs have a three-year cliff vesting period and compensation expense is recognized ratably over the requisite service period if it is probable the performance target related to the PSUs will be achieved, then subsequently adjusted if this probability assessment changes in future reporting periods. As of September 30, 2025, the cash-settled share-based liability for these RSUs and PSUs was $0.1 million.
Stock-based Compensation Expense
Stock-based compensation expense is recognized in selling, general and administrative expenses in the condensed consolidated statement of income (loss). Total compensation expense for the three and nine months ended September 30, 2025 and 2024 is as follows:
|
|
|
|
|
|
|
|
|
|
|
|
|
|
|
|
|
|
|
|
Three Months Ended |
|
|
Nine Months Ended |
|
|
|
September 30,
2025 |
|
|
September 30,
2024 |
|
|
September 30,
2025 |
|
|
September 30,
2024 |
|
Cash-settled share-based compensation expense (benefit) |
|
$ |
(131 |
) |
|
$ |
— |
|
|
$ |
132 |
|
|
$ |
— |
|
Share-settled share-based compensation expense (benefit) |
|
|
634 |
|
|
|
2,011 |
|
|
|
2,289 |
|
|
|
6,098 |
|
|
|
$ |
503 |
|
|
$ |
2,011 |
|
|
$ |
2,421 |
|
|
$ |
6,098 |
|
NOTE 15 – COMMITMENTS AND CONTINGENCIES
Purchase Commitments
When market conditions warrant, the Company may enter into purchase commitments to secure the supply of certain commodities used in the manufacturing process of its products, such as aluminum, electricity, natural gas, and other raw materials. Prices under the Company’s aluminum contracts are based on a market index and regional premiums for processing, transportation, and alloy components, which are adjusted quarterly for purchases in the ensuing quarter. Certain purchase agreements include volume commitments; however, any excess commitments are generally negotiated with suppliers, and those that have occurred in the past have been carried over to future periods.
Contingencies
The Company is party to various legal and environmental proceedings incidental to its business. Certain claims, suits and complaints arising in the ordinary course of business have been filed or are pending against the Company. Based on facts now known, except as provided below, it believes all such matters are adequately provided for, covered by insurance, are without merit and/or involve such amounts that would not materially adversely affect the consolidated results of operations, cash flows or financial position.
In June 2025, the Office of the United States Trade Representative invoked the Rapid Response Labor Mechanism (RRLM) under the United States-Mexico-Canada Agreement (USMCA) to review whether the Company’s employees at Superior Industries de Mexico, S. de R.L. de C.V. had been denied the right to freedom of association and collective bargaining. In August 2025, the investigation was completed, and the Company has no further actions or obligations related to this matter.
In March 2022, the German Federal Cartel Office initiated an investigation related to European light alloy wheel manufacturers, including Superior Industries Europe AG (a wholly owned subsidiary of the Company), on suspicion of conduct restricting competition. The Company is cooperating fully with the German Federal Cartel Office. In the event Superior Industries Europe AG is deemed to have violated the applicable statutes, it could be subject to a fine or civil proceedings. At this point, the Company is unable to predict the duration or the outcome of the investigation.
The Company purchases electricity and natural gas requirements for its manufacturing operations in Poland from a single energy distributor. Superior and its energy distributor, as well as the parent company of the energy distributor, have filed various claims against one another. These claims generally request the court to determine whether Superior’s energy contracts with the energy distributor were valid during the period December 2021 through May 2022.
In December 2021, the Company’s energy distributor informed the Company that it would no longer supply energy, notwithstanding its contractual obligation to continue supply. Following a request from the Company, the court issued an injunction ordering the energy distributor to continue supplying energy and gas to the Company. In 2022, the Company obtained a final and binding judgment confirming that the original contracts with the energy distributor had not been effectively dissolved, and thus remained binding.
In September of 2022, the energy distributor’s parent company filed a suit against the Company asserting that the Company’s energy contracts were no longer valid and asserted the Company owed additional amounts for its purchases between December 2021 and May 2022 equal to the excess of market prices over prices set forth in the original energy contracts. In June 2023, the Company obtained a judgment dismissing the claim in its entirety. In August 2023, the energy distributor’s parent company filed an appeal. Based on developments at an appellate hearing, the Company has concluded that an adverse judgment is now probable. Accordingly, the Company has recognized a provision of $1.5 million which represents the low end of the estimated range of the potential loss. The remaining potential loss is immaterial.
NOTE 16 – RESTRUCTURING
The Company initiates restructuring activities to execute management’s strategy, such as gaining operational efficiencies and achieving net cost reductions. Restructuring charges primarily consist of employee severance costs.
The changes in the restructuring reserve balance for the three and nine months ended September 30, 2025 and 2024 were as follows:
|
|
|
|
|
|
|
|
|
|
|
|
2025 |
|
|
2024 |
|
Balance at beginning of period |
|
$ |
5,152 |
|
|
$ |
3,386 |
|
Provision (1) |
|
|
4,399 |
|
|
|
(933 |
) |
Cash payment |
|
|
(6,735 |
) |
|
|
(907 |
) |
Foreign exchange |
|
|
140 |
|
|
|
(77 |
) |
Balance at March 31 |
|
|
2,956 |
|
|
|
1,469 |
|
Provision (1) |
|
|
1,329 |
|
|
|
1,014 |
|
Cash payment |
|
|
(2,379 |
) |
|
|
(45 |
) |
Foreign exchange |
|
|
159 |
|
|
|
(11 |
) |
Balance at June 30 |
|
|
2,065 |
|
|
|
2,427 |
|
Provision (1) |
|
|
17,008 |
|
|
|
2,535 |
|
Cash payment |
|
|
(18,006 |
) |
|
|
(1,681 |
) |
Foreign exchange |
|
|
— |
|
|
|
102 |
|
Balance at September 30 |
|
$ |
1,067 |
|
|
$ |
3,383 |
|
(1) Provision is net of revisions to previous estimates.
Item 2. Management’s Discussion and Analysis of Financial Condition and Results of Operations
Forward-Looking Statements
The Private Securities Litigation Reform Act of 1995 provides a safe harbor for forward-looking statements made by us or on our behalf. We have included or incorporated by reference in this Quarterly Report on Form 10-Q (including in the sections entitled “Risk Factors” and “Management’s Discussion and Analysis of Financial Condition and Results of Operations”), and from time to time our management may make, statements that may constitute “forward-looking statements” within the meaning of Section 27A of the Securities Act of 1933 and Section 21E of the Securities Exchange Act of 1934. These forward-looking statements are based upon management’s current expectations, estimates, assumptions, and beliefs concerning future events and conditions and may discuss, among other things, the consummation of the transactions contemplated by the Merger Agreement, including the Merger, the increase in cost of raw materials, labor and energy, supply chain disruptions, material shortages, higher interest rates, the effect of changes in international trade, including as a result of new or higher tariffs, taxes or other limitations on global trade, the effect of geopolitical conflicts, such as the Russian military invasion of Ukraine (the “Ukraine Conflict”), on our future growth and earnings. Any statement that is not historical in nature is a forward-looking statement and may be identified using words and phrases such as “expects,” “anticipates,” “believes,” “will,” “will likely result,” “will continue,” “plans to,” “could,” “continue,” “estimates,” and similar expressions. These statements include our belief regarding general automotive industry and market conditions and growth rates, as well as general domestic and international economic conditions.
Readers are cautioned not to place undue reliance on forward-looking statements. Forward-looking statements are necessarily subject to risks, uncertainties and other factors, many of which are outside the control of the Company, which could cause actual results to differ materially from such statements and from the Company’s historical results and experience. These risks, uncertainties and other factors include, but are not limited to, those described in Part I, Item 1A, “Risk Factors” and Part II, Item 7 “Management’s Discussion and Analysis of Financial Condition and Results of Operations” of our Annual Report on Form 10-K for the year ended December 31, 2024 (the “2024 Form 10-K”) and Part I, Item 2 “Management’s Discussion and Analysis of Financial Condition and Results of Operations,” in Part II, Item 1A “Risk Factors” in our Quarterly Report on Form 10-Q for the quarter ended June 30, 2025 (the “Q2 10-Q”) and elsewhere in this Quarterly Report and those described from time to time in our other reports filed with the Securities and Exchange Commission.
Readers are cautioned that it is not possible to predict or identify all the risks, uncertainties and other factors that may affect future results and that the risks described herein should not be considered to be a complete list. Any forward-looking statement speaks only as of the date on which such statement is made, and the Company undertakes no obligation to update or revise any forward-looking statement, whether as a result of new information, future events or otherwise.
Management’s Discussion and Analysis of Financial Condition and Results of Operations should be read in conjunction with the accompanying unaudited condensed consolidated financial statements and notes thereto and with the audited consolidated financial statements and notes thereto and Management’s Discussion and Analysis of Financial Condition and Results of Operations included in our 2024 Form 10-K.
Executive Overview
Overview of Superior
The principal business of Superior Industries International, Inc. (referred herein as the “Company,” “Superior,” or “we,” “us,” and “our”) is the design and manufacture of aluminum wheels for sale to original equipment manufacturers (“OEMs”) in North America and Europe, and to the aftermarket in Europe. Our aluminum wheels are primarily sold to OEMs for factory installation on new light vehicles. We also sell aluminum wheels to the European aftermarket under the brands ATS, RIAL, ALUTEC and ANZIO. North America and Europe represent the primary markets for our products, but we have a diversified global customer base consisting of North American, European, and Asian OEMs.
Demand for our products is mainly driven by light vehicle production levels in North America and Europe and customer take rates on specific vehicle platforms that we serve and wheel SKUs that we produce. The majority of our customers’ wheel programs are awarded two to four years before actual production is expected to begin. Our purchase orders with OEMs are typically specific to a particular vehicle model.
The related percentages of total sales for the following customers each accounted for 10% or more of the Company’s total sales for the three and nine months ended September 30, 2025 and 2024:
|
|
|
|
|
|
|
|
|
|
|
|
|
|
|
|
|
|
|
|
Three Months Ended September 30, |
|
|
Nine Months Ended September 30, |
|
Percent of Sales |
|
2025 |
|
|
2024 |
|
|
2025 |
|
|
2024 |
|
GM |
|
|
0 |
% |
|
|
26 |
% |
|
|
10 |
% |
|
|
25 |
% |
Ford |
|
|
0 |
% |
|
|
17 |
% |
|
|
10 |
% |
|
|
16 |
% |
VW Group |
|
|
26 |
% |
|
|
12 |
% |
|
|
21 |
% |
|
|
11 |
% |
Toyota |
|
|
27 |
% |
|
|
12 |
% |
|
|
20 |
% |
|
|
12 |
% |
BMW |
|
|
13 |
% |
|
|
6 |
% |
|
|
9 |
% |
|
|
7 |
% |
Merger
On December 8, 2025 (the “Closing Date”), the Company, SUP Parent Holdings, LLC, a Delaware limited liability company (“Parent”), and SUP Merger Sub, Inc., a Delaware corporation and a wholly owned subsidiary of Parent (“Merger Sub”) completed the previously announced Merger, contemplated by that certain Agreement and Plan of Merger, dated as of July 8, 2025 (the “Merger Agreement”). At the effective time of the Merger on the Closing Date (the “Effective Time”), in accordance with the Merger Agreement, Merger Sub merged with and into the Company (the “Merger”), with the Company surviving the Merger as a direct wholly owned subsidiary of Parent. Immediately prior to the Effective Time, Parent held Common Shares that represented approximately 17.6% of the total voting power of the Company.
At the Effective Time, in accordance with the terms and conditions set forth in the Merger Agreement, each Common Share and each share of preferred stock, par value $0.01 per share designated as Series A Preferred Shares (the “Series A Preferred Shares” and, together with the Common Shares, the “Shares”), in each case, issued and outstanding immediately prior to the Effective Time (other than Shares owned by (i) Parent or Merger Sub or any of their respective Subsidiaries, (ii) the Company as treasury stock and (iii) holders of Common Shares who have not voted in favor of the Merger or consented thereto and have properly exercised and perfected and not withdrawn, waived or lost a demand for appraisal rights pursuant to Section 262 of the Delaware General Corporation Law) was converted into the right to receive:
•with respect to each Common Share, $0.09 per Common Share in cash, without interest thereon; and
•with respect to each Series A Preferred Share, (1) $39.49 per Series A Preferred Share in cash and (2) 0.23 units of limited liability company interests of Parent per Series A Preferred Share.
At the Effective Time, in accordance with the Merger Agreement:
•each outstanding time-based restricted stock unit (a “Company Restricted Stock Unit”) that was granted under the Company’s 2018 Equity Incentive Plan (the “Company Stock Plan”) that was outstanding as of immediately prior to the Effective Time, whether vested or unvested, became fully vested and terminated and automatically cancelled as of immediately prior to the Effective Time in exchange for the right to receive a lump sum cash payment of an amount equal to $0.09 per Company Restricted Stock Unit; and
•each outstanding performance-based restricted stock unit (a “Company Performance Stock Unit”) that was granted under the Company Stock Plan that was outstanding as of immediately prior to the Effective Time, whether vested or unvested, became fully vested as if the applicable level of performance was achieved at target and terminated and automatically cancelled as of immediately prior to the Effective Time in exchange for the right to receive a lump sum cash payment of an amount equal to $0.09 per Company Performance Stock Unit.
The Company used the proceeds of borrowings under the Third Amendment (as defined in Note 8 “Debt and Other Financing Arrangements”) to pay the cash consideration in the Merger.
Additional information about the Merger is set forth in our Current Report on Form 8-K filed with the SEC on December 8, 2025.
Recent Customer Resourcing Actions
During the second quarter of 2025, certain of the Company's customers in North America began to resource to other suppliers substantially all outstanding purchase orders and not issue any additional purchase orders to the Company thereafter. Prior to these resourcing actions, the Company estimated these customers to represent approximately 33% of its projected consolidated net sales for the 2025 fiscal year. These customers represented approximately 40% of the Company’s consolidated net sales for the year ended December 31, 2024, and approximately 36% of the Company’s consolidated net sales for the year ended December 31, 2023. During the nine months ended September 30, 2025, the Company borrowed $42.5 million on its revolving credit facility, as the actions
described above significantly affected the Company’s ability to generate cash from operating activities or from the sale of trade receivables. In addition, as of September 30, 2025, the Company was in violation of its financial covenants under the Senior Secured Credit Facilities. Refer to Note 2 “Basis of Presentation” for additional information.
On December 8, 2025 the Company completed the previously announced Merger with Parent, and Merger Sub pursuant to the Merger Agreement, and entered into amendments to its Senior Secured Credit Facilities. The Third Amendment to the Company’s Senior Secured Credit Facilities entered into on December 8, 2025, removed certain financial covenants under the Term Loan Facility and waived the financial covenants under the Revolving Credit Facility through June 30, 2026. In addition, the Revolving Credit Facility was amended to mature on June 30, 2026. The Senior Secured Credit Facilities now also contain a monthly minimum liquidity threshold of not less than $10.0 million as of the last business day of each month. Refer to Note 1 “Description of the Business” and Note 8 “Debt and Other Financing Arrangements” for a full description of the transactions.
While the Company has completed the previously announced Merger, it does not expect that it will have the cash and cash equivalents or sufficient liquidity to meet its financial obligations and comply with its minimum liquidity covenant over the next twelve months from the issuance date of these unaudited condensed consolidated financial statements. To address these conditions, management plans to obtain additional sources of funding or amend the applicable provisions in its credit agreements. However, such plans are not solely in the Company’s control and therefore cannot be considered probable of occurring. Therefore, these adverse conditions and events described above raise substantial doubt about the Company’s ability to continue as a going concern as of the issuance date. Refer to “Financial Condition, Liquidity and Capital Resources” for additional information, as well as Note 2 “Basis of Presentation” to the unaudited condensed consolidated financial statements.
Industry Overview, Supply Chain Disruption, and the Ukraine Conflict
There is a broad range of factors which affect automotive industry sales and production volumes, including consumer demand and preferences, dealer inventory levels, labor relations issues, trade agreements, cost and availability of raw materials and components, energy prices, regulatory requirements, government initiatives, availability and cost of credit, changing consumer attitudes toward vehicle ownership, and other factors. Our sales are driven generally by overall automotive industry production volumes and, more specifically, by the volumes of the vehicles for which we supply wheels. In addition, larger diameter wheels and premium finishes command higher unit prices. Larger cars and light trucks, as well as premium vehicle platforms, such as luxury, sport utility and crossover vehicles, typically employ larger diameter wheels and premium finishes.
The automotive industry has been affected by supply chain disruptions and cost inflation. The supply chain disruptions included shortages of semiconductors. Additionally, in early 2022 the Ukraine Conflict contributed to order volatility and intensified inflationary cost pressures, specifically the cost of energy. Cost inflation has moderated somewhat but has resulted in an increase in the cost of raw materials, labor, and energy. In addition, higher interest rates have adversely affected, and will likely continue to affect, our earnings and cash flow from operations.
The prices under our OEM contracts are adjusted for changes in the cost of aluminum and certain other costs; however, our aftermarket contracts do not provide such pass through of aluminum or other costs. Future increases in raw material costs and OEM production volatility may cause our inventory levels to increase, negatively affecting our results of operations and cash flow from operations.
Trade and Regulatory Uncertainty
In April 2025, the U.S. government announced additional tariffs on various goods imported to the U.S. and other countries announced reciprocal tariffs on goods imported to such countries, including goods manufactured by us. Some of these additional tariffs have been implemented and others have been conditionally paused, and it is reasonably possible that new or additional tariffs will be periodically announced given the current global trade environment. We continue to monitor and evaluate the direct and indirect effects of these tariffs and heightened global trade disputes. However, these matters are changing rapidly and there is significant uncertainty as to how long and to what degree Superior and the automotive industry will be affected by these additional tariffs, the adverse global trade environment and the resulting economic uncertainty.
Light Vehicle Production Levels
Automotive industry production volumes in the North American and Western and Central European regions in the three and nine months ended September 30, 2025 (as published in October 2025 by IHS for Light Vehicles, an automotive industry analyst), as compared to the corresponding period of 2024, are shown below:
|
|
|
|
|
|
|
|
|
|
|
Three Months Ended |
|
September 30, |
|
|
2025 vs 2024 |
(Units in thousands) |
|
2025 |
|
2024 |
|
|
% Change |
North America |
|
|
3,948 |
|
|
3,769 |
|
|
4.7% |
Western and Central Europe |
|
|
3,097 |
|
|
3,099 |
|
|
(0.1%) |
Total |
|
|
7,045 |
|
|
6,868 |
|
|
2.6% |
Nine Months Ended |
|
|
|
|
|
|
|
(Units in thousands) |
|
|
|
|
|
|
|
North America |
|
|
11,672 |
|
|
11,834 |
|
|
(1.4%) |
Western and Central Europe |
|
|
10,560 |
|
|
10,831 |
|
|
(2.5%) |
Total |
|
|
22,232 |
|
|
22,665 |
|
|
(1.9%) |
Automotive industry production volumes in our primary markets increased 2.6% during the three months ended September 30, 2025 (an increase of 4.7% in North America, which was partially offset by a decline of 0.1% in Western and Central Europe). Production volumes of our key customers increased 0.3% (an increase of 4.4% in North America, which was offset by a decrease of 7.1% in Western and Central Europe).
Automotive industry production volumes in our primary markets declined 1.9% during the nine months ended September 30, 2025 (a decline of 2.5% in Western and Central Europe and a decline of 1.4% in North America). Production volumes of our key customers decreased 0.8% (a decline of 3.2% in Western and Central Europe, which was partially offset by an increase of 0.7% in North America).
The IHS October 2025 forecast projects that production volumes in our primary markets are expected to decline 2.2% in 2025 (a decline of 2.5% in Western and Central Europe and a decline of 2.0% in North America). IHS forecasts production volumes of our key customers to decrease 2.5% (a decline of 4.2% in Western and Central Europe and a decline of 1.4% in North America). Due to the customer resourcing actions described above, we expect our North America volumes to decline more than the current IHS projections for the remainder of fiscal year 2025.
Overview of the Third Quarter of 2025
The following charts show the operational performance in the quarter ended September 30, 2025 in comparison to the quarter ended September 30, 2024 (dollars in millions):
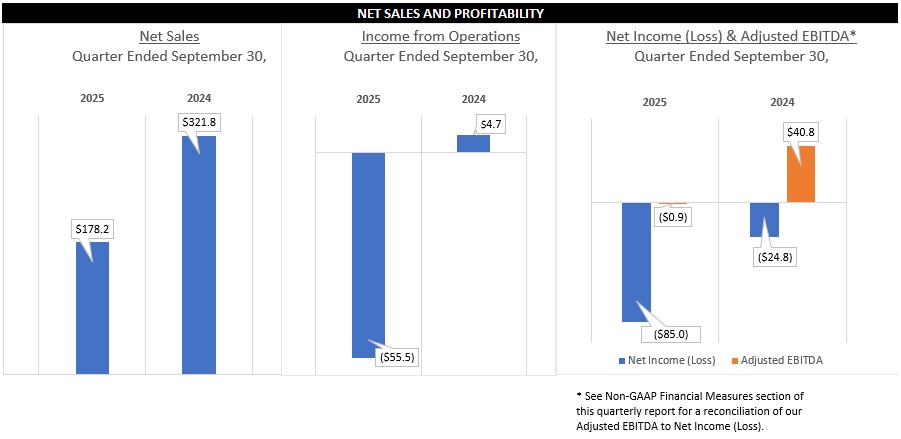
SALES AND PROFITABILITY FOR THE 3RD QUARTER OF 2019 AND 2018 ($ in millions) Sales for 3rd Quarter 2019 & 2018 $352.0 $347.6 2019 2019 Income from Operations 3rd Quarter 2019 & 2018$(0.2) $7.7 2019 218 Net Income & Adjusted EBITDA* for 3rd Quarter 2019 & 2018 Net Income Adjusted EBITDA $38.9 $30.6 $(6.6) 2019 2018 * See the Non-GAAP Financial Measures section of this quarterly report for a reconciliation of our Adjusted EBITDA to Net Income (Loss).
Results of Operations
|
|
|
|
|
|
|
|
|
|
|
|
|
|
|
|
Three Months Ended |
|
|
|
|
|
|
September 30,
2025 |
|
|
September 30,
2024 |
|
|
Net
Change |
|
(Dollars in thousands, except per share data) |
|
|
|
|
|
|
|
|
|
Net sales |
|
$ |
178,200 |
|
|
$ |
321,757 |
|
|
|
(143,557 |
) |
Cost of sales |
|
|
207,381 |
|
|
|
293,123 |
|
|
|
85,742 |
|
Gross profit (loss) |
|
|
(29,181 |
) |
|
|
28,634 |
|
|
|
(57,815 |
) |
Gross profit percentage |
|
|
(16.4 |
)% |
|
|
8.9 |
% |
|
|
(25.3 |
)% |
Selling, general and administrative expenses |
|
|
26,360 |
|
|
|
23,900 |
|
|
|
(2,460 |
) |
Income (loss) from operations |
|
|
(55,541 |
) |
|
|
4,734 |
|
|
|
(60,275 |
) |
Interest expense, net |
|
|
(21,445 |
) |
|
|
(17,857 |
) |
|
|
(3,588 |
) |
Loss on extinguishment of debt |
|
|
— |
|
|
|
(13,052 |
) |
|
|
13,052 |
|
Other income (expense), net |
|
|
(3,147 |
) |
|
|
2,297 |
|
|
|
(5,444 |
) |
Income tax (provision) benefit |
|
|
(4,856 |
) |
|
|
(875 |
) |
|
|
(3,981 |
) |
Net income (loss) |
|
$ |
(84,989 |
) |
|
$ |
(24,753 |
) |
|
$ |
(60,236 |
) |
|
|
|
|
|
|
|
|
|
|
Value added sales (1) |
|
$ |
95,042 |
|
|
$ |
171,020 |
|
|
$ |
(75,978 |
) |
Value added sales adjusted for foreign exchange (1) |
|
$ |
91,499 |
|
|
$ |
171,020 |
|
|
$ |
(79,521 |
) |
Adjusted EBITDA (2) |
|
$ |
(867 |
) |
|
$ |
40,799 |
|
|
$ |
(41,666 |
) |
Percentage of net sales |
|
|
(0.5 |
)% |
|
|
12.7 |
% |
|
|
(13.2 |
)% |
Percentage of value added sales |
|
|
(0.9 |
)% |
|
|
23.9 |
% |
|
|
(24.8 |
)% |
(1)Value added sales and value added sales adjusted for foreign exchange are key measures that are not calculated in accordance with U.S. GAAP. Refer to “Non-GAAP Financial Measures” for a definition of value added sales and value added sales adjusted for foreign exchange and a reconciliation of value added sales and value added sales adjusted for foreign exchange to net sales, the most comparable U.S. GAAP measure.
(2)Adjusted EBITDA is a key measure that is not calculated in accordance with U.S. GAAP. Refer to “Non-GAAP Financial Measures” for a definition of adjusted EBITDA and a reconciliation of our adjusted EBITDA to net income, the most comparable U.S. GAAP measure.
Net Sales
The following table lists the primary drivers behind the change in net sales (amounts in millions):
|
|
|
|
|
|
Three months ended September 30, 2024 |
|
$ |
321.8 |
|
Volume |
|
|
(70.4 |
) |
Aluminum and other pass through costs |
|
|
(67.6 |
) |
Product mix and pricing |
|
|
(9.4 |
) |
Foreign exchange |
|
|
3.8 |
|
Three months ended September 30, 2025 |
|
$ |
178.2 |
|
Value Added Sales Adjusted for Foreign Exchange
Value added sales adjusted for foreign exchange was $91.5 million for the third quarter of 2025 compared to value added sales of $171.0 million for the same period in 2024, a decrease of 46.5%.
Cost of Sales
The following table lists the primary drivers behind the change in cost of sales (amounts in millions):
|
|
|
|
|
|
Three months ended September 30, 2024 |
|
$ |
293.1 |
|
Volume |
|
|
(39.1 |
) |
Material and conversion costs |
|
|
(45.8 |
) |
Mix |
|
|
(5.4 |
) |
Foreign exchange |
|
|
4.6 |
|
Three months ended September 30, 2025 |
|
$ |
207.4 |
|
Material and conversion costs during the three months ended September 30, 2025 includes restructuring costs of $17.0 million and a non-cash charge of $3.9 million to write-down assets to their net realizable value related to certain customers resourcing to other suppliers.
Selling, General and Administrative Expenses
Selling, general and administrative (“SG&A”) expenses of $26.4 million for the third quarter of 2025 increased $2.5 million compared to the same period in 2024 primarily due to an increase in professional services fees related to strategic initiatives, which was partially offset by a decrease in wage and salaries expenses as a result of restructuring actions and a decrease in incentive compensation expense.
Interest Expense, Net
Net interest expense was $21.4 million for the third quarter of 2025 compared to net interest expense of $17.9 million for the same period in 2024, an increase of 20.1%. The increase in net interest expense was primarily due to the upsizing of the borrowings under the amended and restated term loan, a decrease in interest income, and an increase in interest expense on borrowings under the Revolving Credit Facility, which was partially offset by a decrease in interest related to the senior notes, which were redeemed during 2024.
Other Income (Expense), Net
Other expense was $3.1 million for the third quarter of 2025 compared to other income of $2.3 million for the same period in 2024. This increase in expense was primarily due to an increase of foreign exchange loss of $6.1 million during the third quarter of 2025.
Income Tax (Provision) Benefit
The income tax provision for the third quarter of 2025 was $4.9 million on a pre-tax loss of $80.1 million, representing an effective income tax rate of (6.1) percent. This differs from the statutory rate primarily due to valuation allowances, the effect of Pillar Two, and the mix of earnings among tax jurisdictions. The income tax provision for the third quarter of 2024 was $0.9 million on a pre-tax loss of $23.9 million, representing an effective income tax rate of (3.7) percent. This differs from the statutory rate primarily due to valuation allowances and the mix of earnings among tax jurisdictions.
Net Income (Loss)
Net loss for the third quarter of 2025 was $85.0 million compared to a net loss of $24.8 million for the same period in 2024. The increase in the net loss is attributable to the aforementioned items above.
Segment Sales and Income from Operations
|
|
|
|
|
|
|
|
|
|
|
|
|
|
|
|
Three Months Ended |
|
|
|
|
|
|
September 30,
2025 |
|
|
September 30,
2024 |
|
|
Net
Change |
|
(Dollars in thousands) |
|
|
|
|
|
|
|
|
|
Selected data |
|
|
|
|
|
|
|
|
|
Net sales |
|
|
|
|
|
|
|
|
|
North America |
|
$ |
73,538 |
|
|
$ |
206,233 |
|
|
$ |
(132,695 |
) |
Europe |
|
|
104,662 |
|
|
|
115,524 |
|
|
|
(10,862 |
) |
Total net sales |
|
$ |
178,200 |
|
|
$ |
321,757 |
|
|
$ |
(143,557 |
) |
Income (loss) from operations |
|
|
|
|
|
|
|
|
|
North America |
|
$ |
(49,038 |
) |
|
$ |
13,893 |
|
|
$ |
(62,931 |
) |
Europe |
|
|
(6,503 |
) |
|
|
(9,159 |
) |
|
|
2,656 |
|
Total income (loss) from operations |
|
$ |
(55,541 |
) |
|
$ |
4,734 |
|
|
$ |
(60,275 |
) |
North America
Net sales for our North America segment for the third quarter of 2025 decreased 64.3% compared to the same period in 2024. The $132.7 million decrease in net sales was primarily due to lower aluminum and other pass through costs to our OEM customers of $63.2 million, lower volumes of $62.5 million, and lower product mix and pricing of $7.0 million. The decline in volume was primarily attributable to certain customers resourcing to other suppliers.
North America segment income from operations for the third quarter of 2025 decreased by $62.9 million, as compared to the same period in 2024, primarily due to higher material and conversion costs of $26.3 million, lower volumes of $25.1 million, higher SG&A expenses of $8.4 million primarily related to professional service fees associated with strategic initiatives, and lower product mix and pricing of $3.1 million. Material and conversion costs mentioned above includes restructuring costs of $16.8 million and a non-cash charge of $3.9 million to write-down assets to their net realizable value related to certain customers resourcing to other suppliers.
Europe
Net sales for our European segment for the third quarter of 2025 decreased 9.4% compared to the same period in 2024. The $10.9 million decrease in net sales was primarily due to lower volumes of $8.0 million, lower aluminum and other pass through costs to our OEM customers of $4.4 million, and lower product mix and pricing of $2.4 million, which was partially offset by favorable foreign exchange of $3.9 million.
The European segment loss from operations for the third quarter of 2025 was $6.5 million as compared to the loss from operations of $9.2 million in the same period in 2024. This decrease in loss was primarily due to lower SG&A expenses of $5.9 million associated with the European Transformation and lower material and conversion costs of $3.8 million, which was partially offset by lower volumes of $6.2 million and lower product mix and pricing of $0.8 million.
Overview of the First Nine Months of 2025
The following chart shows the operational performance in the nine months ended September 30, 2025 in comparison to the nine months ended September 30, 2024 ($ in millions):
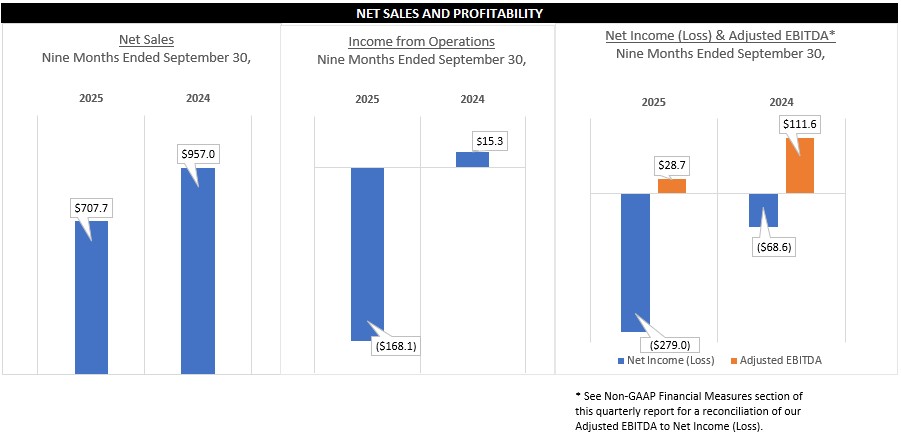
Results of Operations
|
|
|
|
|
|
|
|
|
|
|
|
|
|
|
|
Nine Months Ended |
|
|
|
|
|
|
September 30,
2025 |
|
|
September 30,
2024 |
|
|
Net
Change |
|
(Dollars in thousands, except per share data) |
|
|
|
|
|
|
|
|
|
Net sales |
|
$ |
707,699 |
|
|
$ |
957,000 |
|
|
|
(249,301 |
) |
Cost of sales |
|
|
742,228 |
|
|
|
875,600 |
|
|
|
133,372 |
|
Gross profit (loss) |
|
|
(34,529 |
) |
|
|
81,400 |
|
|
|
(115,929 |
) |
Gross profit percentage |
|
|
(4.9 |
)% |
|
|
8.5 |
% |
|
|
(13.4 |
)% |
Selling, general and administrative expenses |
|
|
66,699 |
|
|
|
66,108 |
|
|
|
(591 |
) |
Impairment of long-lived assets |
|
|
66,906 |
|
|
|
— |
|
|
|
(66,906 |
) |
Income (loss) from operations |
|
|
(168,134 |
) |
|
|
15,292 |
|
|
|
(183,426 |
) |
Interest expense, net |
|
|
(56,610 |
) |
|
|
(49,558 |
) |
|
|
(7,052 |
) |
Loss on extinguishment of debt |
|
|
— |
|
|
|
(13,052 |
) |
|
|
13,052 |
|
Other income (expense), net |
|
|
(9,342 |
) |
|
|
2,635 |
|
|
|
(11,977 |
) |
Income tax (provision) benefit |
|
|
(44,885 |
) |
|
|
(23,943 |
) |
|
|
(20,942 |
) |
Net income (loss) |
|
$ |
(278,971 |
) |
|
$ |
(68,626 |
) |
|
$ |
(210,345 |
) |
|
|
|
|
|
|
|
|
|
|
Value added sales (1) |
|
$ |
375,894 |
|
|
$ |
523,518 |
|
|
$ |
(147,624 |
) |
Value added sales adjusted for foreign exchange (1) |
|
$ |
371,248 |
|
|
$ |
523,518 |
|
|
$ |
(152,270 |
) |
Adjusted EBITDA (2) |
|
$ |
28,741 |
|
|
$ |
111,626 |
|
|
$ |
(82,884 |
) |
Percentage of net sales |
|
|
4.1 |
% |
|
|
11.7 |
% |
|
|
(7.6 |
)% |
Percentage of value added sales |
|
|
7.6 |
% |
|
|
21.3 |
% |
|
|
(13.7 |
)% |
(1)Value added sales and value added sales adjusted for foreign exchange are key measures that are not calculated according to U.S. GAAP. Refer to “Non-GAAP Financial Measures” for a definition of value added sales and value added sales adjusted for foreign exchange and a reconciliation of value added sales and value added sales adjusted for foreign exchange to net sales, the most comparable U.S. GAAP measure.
(2)Adjusted EBITDA is a key measure that is not calculated according to U.S. GAAP. Refer to “Non-GAAP Financial Measures” for a definition of adjusted EBITDA and a reconciliation of our adjusted EBITDA to net income, the most comparable U.S. GAAP measure.
Net Sales
The following table lists the primary drivers behind the change in net sales (amounts in millions):
|
|
|
|
|
|
Nine months ended September 30, 2024 |
|
$ |
957.0 |
|
Volume |
|
|
(130.0 |
) |
Aluminum and other pass through costs |
|
|
(101.7 |
) |
Product mix and pricing |
|
|
(22.6 |
) |
Foreign exchange |
|
|
5.0 |
|
Nine months ended September 30, 2025 |
|
$ |
707.7 |
|
Value Added Sales Adjusted for Foreign Exchange
Value added sales adjusted for foreign exchange was $371.2 million for the first nine months of 2025 compared to value added sales adjusted for foreign exchange of $523.5 million for the same period in 2024, a decrease of 29.1%.
Cost of Sales
The following table lists the primary drivers behind the change in cost of sales (amounts in millions):
|
|
|
|
|
|
Nine months ended September 30, 2024 |
|
$ |
875.6 |
|
Volume |
|
|
(76.8 |
) |
Material and conversion costs |
|
|
(47.7 |
) |
Mix |
|
|
(10.2 |
) |
Foreign exchange |
|
|
1.3 |
|
Nine months ended September 30, 2025 |
|
$ |
742.2 |
|
Material and conversion costs during the nine months ended September 30, 2025 includes restructuring costs of $21.7 million and a non-cash charge of $15.9 million to write-down assets to their net realizable value related to certain customers resourcing to other suppliers.
Selling, General and Administrative Expenses
Selling, general and administrative (“SG&A”) expenses were $66.7 million for the first nine months of 2025 as compared to $66.1 million for the same period in 2024, an increase of $0.6 million. This increase was primarily due to an increase in professional services fees related to strategic initiatives, which was partially offset by a decrease in incentive compensation expense and a decrease in wage and salaries expenses as a result of restructuring actions.
Impairment of Long-Lived Assets
During the first nine months of 2025, we recognized an impairment of long-lived assets charge of $66.9 million relating to our North America long-lived asset group.
Interest Expense, Net
Net interest expense was $56.6 million for the first nine months of 2025 compared to net interest expense of $49.6 million for the same period in 2024, an increase of 14.2%. The increase in net interest expense was primarily due to the upsizing of the borrowings under the amended and restated term loan, a decrease in interest income, and an increase in interest expense on borrowings under the Revolving Credit Facility, which was partially offset by a decrease in interest related to the senior notes, which were redeemed during 2024.
Other Income (Expense), Net
Other expense was $9.3 million in the first nine months of 2025 compared to other income of $2.6 million for the same period in 2024. This increase in expense was primarily due to an increase of foreign exchange loss of $12.4 million during the first nine months of 2025.
Income Tax (Provision) Benefit
The income tax provision for the first nine months of 2025 was $44.9 million on a pre-tax loss of $234.1 million, representing an effective income tax rate of (19.2) percent. The effective income tax rate for the first nine months of 2025 differs from the statutory rate primarily due to valuation allowances, the reversal of an uncertain tax position, the effect of Pillar Two, and the mix of earnings among tax jurisdictions. The income tax provision for the first nine months of 2024 was $23.9 million on a pre-tax loss of $44.7 million, representing an effective income tax rate of (53.6) percent. The effective income tax rate for the first nine months of 2024 differs from the statutory rate primarily due to valuation allowances, the reversal of an uncertain tax position, the mix of earnings among tax jurisdictions, and a tax charge affecting deferred tax assets related to tax restructuring of $17.8 million.
Net Income (Loss)
Net loss for the nine months of 2025 was $279.0 million compared to a net loss of $68.6 million for the same period in 2024. The increase in net loss was attributable to the aforementioned items above.
Segment Sales and Income from Operations
|
|
|
|
|
|
|
|
|
|
|
|
|
|
|
|
Nine Months Ended |
|
|
|
|
|
|
September 30,
2025 |
|
|
September 30,
2024 |
|
|
Net
Change |
|
(Dollars in thousands) |
|
|
|
|
|
|
|
|
|
Selected data |
|
|
|
|
|
|
|
|
|
Net sales |
|
|
|
|
|
|
|
|
|
North America |
|
$ |
371,050 |
|
|
$ |
602,944 |
|
|
$ |
(231,894 |
) |
Europe |
|
|
336,649 |
|
|
|
354,056 |
|
|
|
(17,407 |
) |
Total net sales |
|
$ |
707,699 |
|
|
$ |
957,000 |
|
|
$ |
(249,301 |
) |
Income (loss) from operations |
|
|
|
|
|
|
|
|
|
North America |
|
$ |
(151,507 |
) |
|
$ |
35,170 |
|
|
$ |
(186,677 |
) |
Europe |
|
|
(16,627 |
) |
|
|
(19,878 |
) |
|
|
3,251 |
|
Total income (loss) from operations |
|
$ |
(168,134 |
) |
|
$ |
15,292 |
|
|
$ |
(183,426 |
) |
North America
Net sales for our North American segment for the first nine months of 2025 decreased 38.5% compared to the same period in 2024. The $231.9 million decrease in net sales was primarily due to lower volumes of $113.7 million, lower aluminum cost pass throughs to our OEM customers of $104.3 million, and lower product mix and pricing of $13.6 million. The decline in volume was primarily attributable to certain customers resourcing to other suppliers.
North American segment income from operations for the first nine months of 2025 decreased by $186.7 million, as compared to the same period in 2024, primarily due to a non-cash long-lived asset impairment charge of $66.9 million, higher material and conversion costs of $49.9 million, lower volumes of $46.1 million, higher SG&A expenses of $15.0 million primarily related to professional service fees associated with strategic initiatives, and a lower product mix and pricing of $8.8 million. Material and conversion costs mentioned above includes restructuring costs of $21.2 million and a non-cash charge of $15.9 million to write-down assets to their net realizable value related to certain customers resourcing to other suppliers.
Europe
Net sales for our European segment for the first nine months of 2025 decreased 4.9% compared to the same period in 2024. The $17.4 million decrease in net sales was due to lower volumes of $16.3 million and lower product mix and pricing of $9.0 million, which was partially offset by favorable foreign exchange of $5.2 million and higher aluminum cost pass throughs to our OEM customers of $2.6 million.
The European segment loss from operations for the first nine months of 2025 was $3.3 million lower than the same period in 2024. The decrease in the loss from operations was primarily due to lower SG&A expenses of $14.4 million associated with the European Transformation, which was partially offset by lower volumes of $7.2 million, lower product mix and pricing of $3.5 million, and higher material and conversion costs of $0.4 million.
Financial Condition, Liquidity and Capital Resources
We have historically met our cash requirements and funded our operations from a combination of cash and cash equivalents, cash generated from operating activities, cash from our debt facilities, and cash from the sale of trade receivables under our factoring arrangements.
The actions described under “Executive Overview - Recent Customer Resourcing Actions,” are expected to significantly affect our ability to generate cash from operating activities or from the sale of trade receivables in the near term. As a result, we have executed the following actions:
•We borrowed $42.5 million on our revolving credit facility during the nine months ended September 30, 2025.
•We engaged third party financial advisors to assist us in seeking opportunities to improve liquidity and operational performance, evaluate additional debt and/or equity financing opportunities, and seek other strategic transactions.
•On June 4, 2025, we entered into an amendment to our Term Loan Agreement to, among other things, provide for an incremental $70.0 million delayed draw term loan facility (the “Delayed Draw Term Loan Facility”); refer to Note 8 “Debt and Other Financing Arrangements” for additional details on these amendments. As of September 30, 2025, the Company drew down the full capacity of $70.0 million on the Delayed Draw Term Loan Facility.
•The amendment to the Term Loan Agreement includes additional reporting covenants, including a requirement to deliver periodic 13-week cash flow reports, as well as a requirement to limit our disbursements to no greater than 110% of budgeted disbursements. Accordingly, we have been actively managing our working capital requirements under these new
reporting covenants which have resulted in deferring payments to certain vendors and suppliers. At September 30, 2025, we had approximately $20.0 million of accounts payable past due, which includes a $13.7 million obligation under our supply chain financing program.
On December 8, 2025 the Company completed the previously announced Merger with Parent, and Merger Sub pursuant to the Merger Agreement, and entered into amendments to its Senior Secured Credit Facilities. The Third Amendment to the Company’s Senior Secured Credit Facilities entered into on December 8, 2025, removed certain financial covenants under the Term Loan Facility and waived the financial covenants under the Revolving Credit Facility through June 30, 2026. In addition, the Revolving Credit Facility was amended to mature on June 30, 2026. The Senior Secured Credit Facilities now also contain a monthly minimum liquidity threshold of not less than $10.0 million as of the last business day of each month. Refer to Note 1 “Description of the Business” and Note 8 “Debt and Other Financing Arrangements” for a full description of the transactions.
While the Company has completed the previously announced Merger, it does not expect that it will have the cash and cash equivalents or sufficient liquidity to meet its financial obligations and comply with its minimum liquidity covenant over the next twelve months from the issuance date of these unaudited condensed consolidated financial statements. To address these conditions, management plans to obtain additional sources of funding or amend the applicable provisions in its credit agreements. However, such plans are not solely in the Company’s control and therefore cannot be considered probable of occurring. Therefore, these adverse conditions and events described above raise substantial doubt about the Company’s ability to continue as a going concern as of the issuance date. Refer to Note 2 “Basis of Presentation” to the unaudited condensed consolidated financial statements and Item 1A, “Risk Factors” for additional information.
Capital expenditures relate to improving production quality and efficiency and extending the useful lives of our existing equipment, and expenditures for new product offerings, as well as expanded capacity for existing products. During 2025, we expect that capital expenditures will be approximately $25.0 million.
As of September 30, 2025 our primary sources of liquidity include the following (in millions):
|
|
|
|
|
|
|
|
Available Liquidity |
|
Cash and cash equivalents (1) |
|
$ |
59.8 |
|
Unused commitments on the revolving credit facility (2) |
|
|
0.1 |
|
Unfactored available trade receivables |
|
|
8.7 |
|
Minimum contractual liquidity per the Credit Agreement |
|
|
(37.5 |
) |
Total available liquidity |
|
$ |
31.1 |
|
(1)Reduced by restricted cash at September 30, 2025 of $0.8M.
(2)Reduced by outstanding letters of credit and borrowings at September 30, 2025 of $17.4 million and $42.5 million.
Exchange Agreement
On December 8, 2025, we entered into that certain Exchange and Contribution Agreement (the “Exchange Agreement”), by and among the Company, each of its subsidiaries, certain lenders (the “Pre-Exchange Term Lenders”) party to the Revolving Credit Agreement (as in effect prior to the effectiveness of the Third Revolving Credit Facility Amendment (as defined below), the “Pre-Exchange Term Loan Agreement”) SUP Parent Holdings, LLC (“Parent”) and Oaktree Fund Administration, LLC, as administrative agent. Pursuant to the Exchange Agreement, immediately following the consummation of the Merger, each Pre-Exchange Term Lender (a) exchanged with the Company all of its rights, title, and interest in, to, and under its Exchanged Term Loan Claims and Bridge Loan Claims (each as defined in the Exchange Agreement) in return for a certain portion of the aggregate principal amount of Take Back Term Loans (as defined in the Exchange Agreement) and (b) contributed to Parent all of its rights, title, and interest in, to and under its Contributed Existing Term Loan Claims (as defined in the Exchange Agreement) in exchange for a certain number of units representing limited liability company interests in Parent, if any. Upon the consummation of the foregoing, (i) all Exchanged Term Loan Claims, Bridge Loan Claims, and Contributed Existing Term Loan Claims were deemed satisfied, discharged, terminated, and extinguished in full and (ii) all commitments, if any, under the Pre-Exchange Term Loan Agreement were terminated.
Senior Secured Credit Facilities
A summary of our senior secured credit facilities at September 30, 2025 are as follows (amounts in thousands):
|
|
|
|
|
|
|
|
|
|
|
|
|
|
|
|
|
|
|
|
September 30, 2025 |
|
|
|
|
|
|
|
Principal |
|
|
Carrying Value |
|
Senior Secured Credit Facilities: |
|
|
|
|
|
|
|
|
|
|
Revolving Credit Facility |
|
|
|
|
|
$ |
42,473 |
|
|
$ |
42,473 |
|
Term Loan Facility |
|
|
|
|
|
$ |
543,113 |
|
|
$ |
517,251 |
|
Delayed Draw Term Loan Facility (1) |
|
|
|
|
|
$ |
75,600 |
|
|
$ |
71,235 |
|
(1)Principal includes a 3.0% one-time fee, which was paid-in-kind as of September 30, 2025. Additionally, a 5.0% exit fee is included in the principal amount, which becomes payable on the maturity date.
Revolving Credit Facility
We are a party to a Credit Agreement, dated as of December 15, 2022 (as amended, amended and restated, restated, supplemented or modified from time to time, the “Revolving Credit Agreement”), pursuant to which the lenders thereto have provided a $60.0 million revolving credit facility (the “Revolving Credit Facility”). The Revolving Credit Facility will mature on December 15, 2027.
Simultaneously with the execution of the Term Loan Second Amendment, we, the other borrowers party thereto, JPMorgan Chase Bank, N.A., in its capacity as administrative agent and collateral agent, and the lenders and issuing banks party thereto, entered into a Second Amendment (the “Second Revolving Credit Facility Amendment”) to the Revolving Credit Agreement, pursuant to which, among other things, the lenders party thereto agreed to (i) a limited waiver of the financial covenants under the Revolving Credit Facility for the test period ending on June 30, 2025, (ii) the unwinding of our hedging arrangements and the retention by us of the proceeds thereof and (iii) the incurrence of the Delayed Draw Term Loan Facility.
On December 8, 2025, we entered into a Third Amendment (the “Third Revolving Credit Facility Amendment”) to the Revolving Credit Agreement, by and among the Company, certain subsidiaries of the Company party thereto, the lenders party thereto (the “Revolving Lenders”), and JPMorgan Chase Bank, N.A., as administrative and collateral agent, which amends the Revolving Credit Agreement. Pursuant to the Third Revolving Credit Facility Amendment, among other things, (i) the Revolving Lenders agreed to waive certain defaults and events of default outstanding under the Revolving Credit Agreement (as in effect prior to the effectiveness of the Third Revolving Credit Facility Amendment) and compliance with the financial covenants under the Revolving Credit Agreement through (and including) June 30, 2026 and (ii) the maturity of the Revolving Credit Facility was amended to June 30, 2026.
Term Loan Facility
We are also party to an Amended and Restated Credit Agreement, dated as of August 14, 2024 (as amended, amended and restated, restated, supplemented or modified from time to time, the “Term Loan Agreement” and, together with the Revolving Credit Agreement, the “Credit Agreements”), pursuant to which the lenders thereto have provided (i) a $520 million term loan facility (the “Pre-Recapitalization Term Loan Facility”) and (ii) the Delayed Draw Term Loan Facility (as defined below). The Term Loan Facility matures on December 15, 2028 and the Delayed Draw Term Loan Facility matures on June 4, 2026.
On March 31, 2025, we entered into an amendment (the “Term Loan First Amendment”) to our Term Loan Agreement which, among other things, (i) increased the liquidity threshold which would trigger a mandatory prepayment of the Pre-Recapitalization Term Loan Facility, from $80.0 million to $115.0 million and (ii) included our and our subsidiaries’ ability to factor assets under certain securitization agreements in the calculation of liquidity for the purposes of determining whether a mandatory prepayment is required.
On June 4, 2025, we entered into an amendment (the “Term Loan Second Amendment”) to our Term Loan Agreement to, among other things, provide an incremental $70.0 million delayed draw term loan facility (the “Delayed Draw Term Loan Facility” ).
The Pre-Recapitalization Term Loan Facility contains a mandatory prepayment provision upon the event of default, which we have accounted for separately as a derivative liability. As of September 30, 2025, we have recorded a derivative liability of $0.6 million in the condensed consolidated balance sheet.
During the nine months ended September 30, 2025, we prepaid $2.2 million in principal for the Term Loan Facility under one of the mandatory prepayment provisions applicable thereto.
As of September 30, 2025, the interest rate in effect on borrowings under the Pre-Recapitalization Term Loan Facility and the Delayed Draw Term Loan Facility were 11.7% and 12.3%. As of September 30, 2025, the interest rate in effect on borrowings under the Revolving Credit Facility was 10.8%.
Upon the consummation of the transactions contemplated in the Exchange Agreement, no obligations under the Pre-Recapitalization Term Loan Facility or the Delayed Draw Term Loan Facility remain.
On December 8, 2025, we also entered into an amendment (the “Term Loan Third Amendment”) to our Term Loan Agreement pursuant to which, among other things, (i) an additional $27.5 million of aggregate principal amount of term loans were made to the Company, (ii) $172.5 million of aggregate principal amount of term loans (which amount was increased from the amount provided in the Recapitalization Support Agreement, dated as of July 8, 2025, by mutual agreement of the Company, the lenders party thereto, and TPG Growth III Sidewall, L.P. (“TPG”)) were deemed made to the Company by (a) the Pre-Exchange Term Lenders in exchange for an equivalent amount of obligations owed to them under the Term Loan Agreement (as in effect prior to the Term Loan Third Amendment) and (b) TPG in consideration for its agreement with respect to the increased aggregate principal amount of term loan and (iii) the lenders party thereto agreed to waive defaults and events of default outstanding under the Term Loan Agreement (as in effect prior to the Term Loan Third Amendment).
Further information on prepayments, interest rates, guarantees and collateral security, covenants, and other terms and conditions of the Senior Secured Credit Facilities is included in our 2024 Form 10-K and our Forms 8-K filed on April 2, 2025 and June 6, 2025.
As of September 30, 2025, we were in violation of our financial covenants under the Senior Secured Credit Facilities. The Third Amendment to our Senior Secured Credit Facilities entered into on December 8, 2025 removed certain financial covenants under the Term Loan Facility and waived the financial covenants under the Revolving Credit Facility through June 30, 2026. The Senior Secured Credit Facilities also contain a monthly minimum liquidity threshold of not less than $10.0 million as of the last business day of each month.
Available Unused Commitments under the Revolving Credit Facility
As of September 30, 2025, we had $42.5 million in outstanding borrowings under the Revolving Credit Facility and unused commitments of $0.1 million, which has been reduced for outstanding letters of credit of $17.4 million.
Redeemable Preferred Stock
During the three and nine months ended September 30, 2025, preferred stock dividends of $0.3 million and $7.8 million were paid-in-kind, which increased the stated value of the preferred stock. As of September 30, 2025 and December 31, 2024, the stated values of the preferred stock were $167.9 million and $160.1 million, and the corresponding carrying values were $335.8 million and $288.5 million.
Pursuant to a Voting and Support Agreement (the “Preferred VSA”), dated as of July 8, 2025, by and between the Company and TPG Growth III Sidewall, L.P. (“TPG”), TPG, as the holder of all of the Series A Preferred Shares, agreed to waive its right to receive dividends it would have otherwise been entitled to receive under the Certificate of Designations until the earlier of the Effective Time and the termination of the Preferred VSA. If the Preferred VSA is terminated, the preferred shares will continue to accrue dividends at 9.0% on the stated value, and the associated redemption premium on the increase in the stated value will be accreted using the interest method.
In the event the redeemable preferred stock is redeemed, the redemption value will be the greater of (i) two times the then-current Stated Value (defined in the Certificate of Designations as $1,000 per share, plus any accumulated and unpaid dividends or dividends paid-in-kind), which as of September 30, 2025 would be equivalent to a $335.8 million redemption value, and (ii) the product of the number of shares of common stock into which the redeemable preferred stock could be converted at the time of such redemption (approximately 6.0 million shares as of September 30, 2025) and the then-Current Market Price (defined in the Certificate of Designations as the arithmetic average of the volume-weighted average price (VWAP) per share of common stock for each of the thirty (30) consecutive full trading days ending on the trading day before the record date with respect to such action) of our common stock.
The redeemable preferred stock may be redeemed at the holder’s election on or after September 14, 2025 or upon the occurrence of a redemption event (including in the event the common stock of the Company ceases to be listed on the NYSE or another U.S. national securities exchange), provided the Company has cash legally available to pay such redemption. Pursuant to the terms of the Preferred VSA, TPG has agreed (i) to waive any rights and remedies (including any redemption rights) it may have in connection with or related to the Merger and any other transactions entered into by the Company in connection therewith and (ii) that receipt of the aggregate amount of the consideration provided for the Series A Preferred Shares under the Merger Agreement shall constitute payment in full for all shares of Series A Preferred Shares owned of record or beneficially by TPG. Subject to the terms of the Preferred VSA, if the Company is unable to redeem the shares of preferred stock in full, any shares of preferred stock not redeemed would continue to receive an annual dividend of 9.0% on the stated value which would be payable quarterly. The Board of Directors would have to evaluate periodically the ability of the Company to make any redemption payments until the full redemption amount has been paid.
As of September 30, 2025, other than as described above, there have been no changes in the preferred shareholder rights, including conversion and redemption rights from those described in the Company’s 2024 Form 10-K.
On December 8, 2025, in accordance with the terms and conditions set forth in the Merger Agreement, each share of preferred stock, par value $0.01 per share designated as Series A Preferred Shares (the “Series A Preferred Shares” and, together with the Common Shares, the “Shares”), in each case, issued and outstanding immediately prior to the Effective Time was converted into the right to receive (a) $39.49 per Series A Preferred Share in cash and (b) 0.23 units of limited liability company interests of Parent per Series A Preferred Share.
Additional information about the Preferred VSA and the Merger is set forth in our Current Report on Form 8-K/A filed with the SEC on July 9, 2025, our definitive proxy statement filed with the SEC on August 15, 2025, and our Current Report on Form 8-K filed with the SEC on December 8, 2025.
Factoring Arrangements
As of September 30, 2025, we had no other significant off-balance sheet arrangements other than factoring of $23.7 million.
Supplier Finance Program
During the second quarter of 2025, the financial institution that is the party to our supply chain finance arrangement suspended our use of the program. Obligations due to the financial institution under our program as of September 30, 2025 was $13.7 million.
Cash Flows
The following table summarizes the cash flows from operating, investing and financing activities as reflected in the condensed consolidated statements of cash flows.
|
|
|
|
|
|
|
|
|
|
|
|
Nine Months Ended |
|
|
|
September 30,
2025 |
|
|
September 30,
2024 |
|
(Dollars in thousands) |
|
|
|
|
|
|
Net cash provided (used) by operating activities |
|
|
(72,068 |
) |
|
|
(7,857 |
) |
Net cash provided (used) by investing activities |
|
|
(18,933 |
) |
|
|
(20,985 |
) |
Net cash provided (used) by financing activities |
|
|
107,126 |
|
|
|
(146,834 |
) |
Effect of exchange rate changes on cash |
|
|
4,384 |
|
|
|
(1,650 |
) |
Net changes in cash and cash equivalents |
|
$ |
20,509 |
|
|
$ |
(177,326 |
) |
Operating Activities
Net cash used by operating activities was $72.1 million for the first nine months of 2025 compared to net cash used by operating activities of $7.9 million for the same period in 2024. The increase in net cash used by operating activities was primarily due to lower gross profit, partially offset by cash received from the early termination of our hedging instruments, reduction in cash interest paid as interest was paid-in-kind on long-term debt, and changes in working capital. Net cash provided by operating activities during the first nine months of 2025 includes approximately $20.0 million of accounts payable past due.
Investing Activities
Net cash used by investing activities of $18.9 million for the first nine months of 2025 was $2.1 million lower than the same period in 2024 due to lower capital expenditures.
Financing Activities
Net cash provided by financing activities of $107.1 million for the first nine months of 2025 was $254.0 million higher than the same period in 2024. This increase was primarily due to a net decrease of debt repayments of $125.5 million, proceeds from the issuance of short-term debt of $70.0 million, proceeds from borrowings on the revolving credit facility of $42.5 million, a decrease in financing costs paid and other of $7.9 million, a decrease in redemption premium paid on term loan repayments of $3.7 million from 2024, and a decrease in cash dividends paid of $3.4 million as preferred stock dividends were paid-in-kind.
Non-GAAP Financial Measures
In this Quarterly Report, we discuss three important measures that are not calculated in accordance with U.S. GAAP: value added sales, value added sales adjusted for foreign exchange, and adjusted EBITDA.
Value added sales represents net sales less the value of aluminum and other costs, as well as outsourced service provider (“OSPs”) costs that are included in net sales. Contractual arrangements with our customers allow us to pass on changes in aluminum and certain other costs. Value added sales adjusted for foreign exchange represents value added sales on a constant currency basis. For entities reporting in currencies other than the U.S. dollar, the current period amounts are translated using the prior year comparative period exchange rates, rather than the actual exchange rates in effect during the current period. Value added sales adjusted for foreign exchange allows users of the financial statements to consider our net sales information both with and without the aluminum, other costs and OSP costs and fluctuations in foreign exchange rates. Management utilizes value added sales adjusted for foreign exchange as a key metric in measuring and evaluating the growth of the Company because it eliminates the volatility of the cost of aluminum and changes in foreign exchange rates. Management utilizes value added sales in calculating adjusted EBITDA margin to eliminate volatility of the cost of aluminum in evaluating year-over-year margin growth.
The following table reconciles our net sales, the most directly comparable U.S. GAAP financial measure, to our value added sales and value added sales adjusted for foreign exchange:
|
|
|
|
|
|
|
|
|
|
|
|
|
|
|
|
|
|
|
|
Three Months Ended |
|
|
Nine Months Ended |
|
|
|
September 30,
2025 |
|
|
September 30,
2024 |
|
|
September 30,
2025 |
|
|
September 30,
2024 |
|
(Dollars in thousands) |
|
|
|
|
|
|
|
|
|
|
|
|
Net sales |
|
$ |
178,200 |
|
|
$ |
321,757 |
|
|
$ |
707,699 |
|
|
$ |
957,000 |
|
Less: aluminum, other costs, and outside service provider costs |
|
|
(83,158 |
) |
|
|
(150,737 |
) |
|
|
(331,805 |
) |
|
|
(433,482 |
) |
Value added sales |
|
$ |
95,042 |
|
|
$ |
171,020 |
|
|
$ |
375,894 |
|
|
$ |
523,518 |
|
Currency impact on current period value added sales |
|
|
(3,543 |
) |
|
|
— |
|
|
|
(4,646 |
) |
|
|
— |
|
Value added sales adjusted for foreign exchange |
|
$ |
91,499 |
|
|
$ |
171,020 |
|
|
$ |
371,248 |
|
|
$ |
523,518 |
|
Adjusted EBITDA is defined as earnings before interest income and expense, income taxes, depreciation, amortization, restructuring charges and other closure costs and impairments of long-lived assets and investments, change in fair value of embedded derivative liabilities, acquisition and integration costs, certain hiring and separation related costs, proxy contest fees, gains and losses associated with early debt extinguishment and other refinancing costs, and accounts receivable factoring fees. We use adjusted EBITDA as an important indicator of the operating performance of our business. Adjusted EBITDA is used in our internal forecasts and models when establishing internal operating budgets, supplementing the financial results and forecasts reported to our Board of Directors and evaluating short-term and long-term operating trends in our operations. We believe the adjusted EBITDA financial measure assists in providing a more complete understanding of our underlying operational measures to manage our business, to evaluate our performance compared to prior periods and the marketplace and to establish operational goals. Adjusted EBITDA is a non-GAAP financial measure and should not be considered in isolation or as a substitute for financial information provided in accordance with U.S. GAAP. This non-GAAP financial measure may not be computed in the same manner as similarly titled measures used by other companies.
The following table reconciles our net income (loss), the most directly comparable U.S. GAAP financial measure, to our adjusted EBITDA:
|
|
|
|
|
|
|
|
|
|
|
|
|
|
|
|
|
|
|
|
Three Months Ended |
|
|
Nine Months Ended |
|
|
|
September 30,
2025 |
|
|
September 30,
2024 |
|
|
September 30,
2025 |
|
|
September 30,
2024 |
|
(Dollars in thousands) |
|
|
|
|
|
|
|
|
|
|
|
|
Net income (loss) |
|
$ |
(84,989 |
) |
|
$ |
(24,753 |
) |
|
$ |
(278,971 |
) |
|
$ |
(68,626 |
) |
Interest expense, net |
|
|
21,445 |
|
|
|
17,857 |
|
|
|
56,610 |
|
|
|
49,558 |
|
Income tax provision (benefit) |
|
|
4,856 |
|
|
|
875 |
|
|
|
44,885 |
|
|
|
23,942 |
|
Depreciation |
|
|
11,770 |
|
|
|
16,756 |
|
|
|
41,610 |
|
|
|
50,865 |
|
Amortization |
|
|
676 |
|
|
|
4,943 |
|
|
|
9,000 |
|
|
|
14,669 |
|
Factoring fees |
|
|
842 |
|
|
|
1,853 |
|
|
|
3,540 |
|
|
|
4,166 |
|
Accelerated recognition of hedging termination |
|
|
— |
|
|
|
— |
|
|
|
300 |
|
|
|
— |
|
Plant inefficiencies due to customer resourcing actions |
|
|
6,588 |
|
|
|
— |
|
|
|
13,547 |
|
|
|
— |
|
Restructuring costs |
|
|
17,008 |
|
|
|
2,535 |
|
|
|
22,736 |
|
|
|
2,616 |
|
Restructuring related costs (1) |
|
|
2,288 |
|
|
|
3,683 |
|
|
|
3,635 |
|
|
|
15,885 |
|
Asset write downs to net realizable value (2) |
|
|
3,854 |
|
|
|
— |
|
|
|
19,049 |
|
|
|
— |
|
Strategic initiatives and other costs (3) |
|
|
15,086 |
|
|
|
— |
|
|
|
27,351 |
|
|
|
— |
|
Impairment of long-lived assets (4) |
|
|
— |
|
|
|
— |
|
|
|
66,906 |
|
|
|
— |
|
Change in fair value of embedded derivative liabilities |
|
|
(291 |
) |
|
|
(281 |
) |
|
|
(1,457 |
) |
|
|
(281 |
) |
Loss on extinguishment of debt and other refinancing cost (5) |
|
|
— |
|
|
|
17,331 |
|
|
|
— |
|
|
|
18,832 |
|
Adjusted EBITDA |
|
$ |
(867 |
) |
|
$ |
40,799 |
|
|
$ |
28,741 |
|
|
$ |
111,626 |
|
Adjusted EBITDA as a percentage of net sales |
|
|
(0.5 |
)% |
|
|
12.7 |
% |
|
|
4.1 |
% |
|
|
11.7 |
% |
Adjusted EBITDA as a percentage of value added sales |
|
|
(0.9 |
)% |
|
|
23.9 |
% |
|
|
7.6 |
% |
|
|
21.3 |
% |
(1)In the three and nine months ended September 30, 2025, we incurred $2.3 million and $3.6 million in restructuring related costs primarily attributable to a write down of certain assets and warehouse relocation costs in connection with our European Transformation. In the three and nine months ended September 30, 2024, we incurred $3.7 million and $15.9 million in restructuring related costs primarily for advisor and legal fees incurred in connection with our European Transformation.
(2)In the three and nine months ended September 30, 2025, we recognized a non-cash charge of $3.9 million and $15.9 million related to a write-down of assets to their net realizable value associated with certain customers resourcing to other suppliers. In the nine months ended September 30, 2025, we also recognized a non-cash charge of $3.1 million related to a write-down of a customer trade receivable associated with a certain customer that resourced to another supplier.
(3)We have engaged third party financial advisors to assist us in seeking opportunities to improve liquidity and operational performance, evaluate additional debt or equity refinancing opportunities, and seek other strategic transactions. In the three and nine months ended September 30, 2025, we recognized charges of $15.1 million and $27.4 million associated with these strategic initiatives, which includes third-party financial advisor and legal fees incurred in connection with our financing and Merger-related activities.
(4)During the nine months ended September 30, 2025, we recognized a non-cash impairment charge of $66.9 million related to our North America long-lived asset group.
(5)In the three and nine months ended September 30, 2024, we recognized a $13.1 million loss on extinguishment of debt in connection with the debt refinancing. In addition, we incurred $4.2 million and $5.7 million in additional expenses recognized in SG&A expenses associated with the debt refinancing.
Critical Accounting Policies and Estimates
The preparation of consolidated financial statements in conformity with U.S. GAAP requires management to apply significant judgment in making estimates and assumptions that affect amounts reported therein, as well as financial information included in this Management’s Discussion and Analysis of Financial Condition and Results of Operations. These estimates and assumptions, which are based upon historical experience, industry trends, terms of various past and present agreements and contracts, and information available from other sources that are believed to be reasonable under the circumstances, form the basis for making judgments about the carrying values of assets and liabilities that are not readily apparent through other sources. We believe the accounting estimates employed are appropriate and the resulting balances are reasonable; however, due to the inherent uncertainties in developing estimates, actual results could differ from the original estimates, requiring adjustments to these balances in future periods. Critical accounting estimates that affect the condensed consolidated financial statements and the judgments and assumptions used are consistent with those described in the management’s discussion and analysis in our 2024 Form 10-K (refer to “Management’s Discussion and Analysis of Financial Condition and Results of Operations” in Part II, Item 7 of our 2024 Form 10-K.
Item 3. Quantitative and Qualitative Disclosures about Market Risk
As a smaller reporting company, as defined in Rule 10(f)(1) of Regulation S-K under the Securities and Exchange Act of 1934, as amended (the “Exchange Act”), the Company is not required to provide the information required by this item.
Item 4. Controls and Procedures
Evaluation of Disclosure Controls and Procedures
The Company’s management, with the participation of our Chief Executive Officer and Interim Chief Financial Officer, evaluated the effectiveness of the Company’s disclosure controls and procedures (as defined in Rules 13a-15(e) and 15d-15(e) under the Exchange Act) as of September 30, 2025. Our disclosure controls and procedures are designed to ensure that information required to be disclosed in reports we file or submit under the Exchange Act is recorded, processed, summarized and reported within the time periods specified in SEC rules and forms and that such information is accumulated and communicated to our management, including our Chief Executive Officer and Interim Chief Financial Officer, to allow timely decisions regarding required disclosures.
Based on this evaluation, our Chief Executive Officer and Interim Chief Financial Officer concluded that, as of September 30, 2025, our disclosure controls and procedures were effective.
Changes in Internal Control over Financial Reporting
There has been no change in our internal control over financial reporting during the three months ended September 30, 2025 that has materially affected, or is reasonably likely to materially affect, our internal control over financial reporting.
PART II
OTHER INFORMATION
Item 1. Legal Proceedings
We are party to various legal and environmental proceedings incidental to our business. Certain claims, suits and complaints arising in the ordinary course of business have been filed or are pending against us. Based on facts now known, except as provided below, we believe all such matters are adequately provided for, covered by insurance, are without merit, and/or involve such amounts that would not materially adversely affect our consolidated results of operations, cash flows or financial position.
In March 2022, the German Federal Cartel Office initiated an investigation related to European light alloy wheel manufacturers, including Superior Industries Europe AG (a wholly owned subsidiary of the Company), on suspicion of conduct restricting competition. The Company is cooperating fully with the German Federal Cartel Office. In the event Superior Industries Europe AG is deemed to have violated the applicable statutes, the Company could be subject to a fine or civil proceedings. At this point, we are unable to predict the duration or the outcome of the investigation.
Refer to Note 15 “Commitments and Contingencies” for information relating to other legal proceedings.
Refer also to Item 1A, “Risk Factors” “We are from time to time subject to litigation, which could adversely affect our results of operations, financial condition or cash flows” in Part I of our 2024 Form 10-K.
Item 1A. Risk Factors
There have been no changes to the risk factors as described in Part I, Item 1A, “Risk Factors” in our 2024 Form 10-K and in our Q2 10-Q, except the removal of certain risk factors related to the Proposed Merger and as follows:
Our current cash and liquidity projections raise substantial doubt about our ability to continue as a going concern.
A limited number of customers represent a large percentage of our consolidated net sales. As discussed in Item 1. “Note 2. Basis of Presentation” and in Item 2. “Management’s Discussion and Analysis of Financial Condition and Results of Operations – Executive Overview – Recent Customer Resourcing Actions” and “– Financial Condition, Liquidity and Capital Resources,” during the second quarter of 2025, certain of the Company's customers in North America began to resource to other suppliers substantially all outstanding purchase orders and not issue any additional purchase orders to the Company thereafter. Prior to these resourcing actions, the Company estimated these customers to represent approximately 33% of its projected consolidated net sales for the 2025 fiscal year. These customers represented approximately 40% of the Company’s consolidated net sales for the year ended December 31, 2024, and approximately 36% of the Company’s consolidated net sales for the year ended December 31, 2023. During the nine months ended September 30, 2025, the Company borrowed $42.5 million on its revolving credit facility, as the actions described above significantly affected the Company’s ability to generate cash from operating activities or from the sale of trade receivables. In addition, as of September 30, 2025, the Company was in violation of its financial covenants under the Senior Secured Credit Facilities. Therefore, we have evaluated whether these events, considered in the aggregate, give rise to substantial doubt about our ability to continue as a going concern over the next twelve months.
On December 8, 2025 the Company completed the previously announced Merger with Parent, and Merger Sub pursuant to the Merger Agreement, and entered into amendments to its Senior Secured Credit Facilities. The Third Amendment to the Company’s Senior Secured Credit Facilities entered into on December 8, 2025, removed certain financial covenants under the Term Loan Facility and waived the financial covenants under the Revolving Credit Facility through June 30, 2026. In addition, the Revolving Credit Facility was amended to mature on June 30, 2026. The Senior Secured Credit Facilities now also contain a monthly minimum liquidity threshold of not less than $10.0 million as of the last business day of each month.
While the Company has completed the previously announced Merger, it does not expect that it will have the cash and cash equivalents or sufficient liquidity to meet its financial obligations and comply with its minimum liquidity covenant over the next twelve months from the issuance date of these unaudited condensed consolidated financial statements. To address these conditions, management plans to obtain additional sources of funding or amend the applicable provisions in its credit agreements. However, such plans are not solely in the Company’s control and therefore cannot be considered probable of occurring. Therefore, these adverse conditions and events described above raise substantial doubt about the Company’s ability to continue as a going concern as of the issuance date.
The perception that we may not be able to continue as a going concern may cause customers, vendors, and others to review and alter their business relationships and terms with us, including choosing not to extend an existing relationship with us, and may affect our credit rating. If we seek additional financing to fund operations and there remains substantial doubt about our ability to continue as a going concern, financing sources may be unwilling to provide such funding to us on commercially reasonable terms, or at all. Additional information about the Merger is set forth in our Current Report on Form 8-K filed with the SEC on December 8, 2025.
Item 2. Unregistered Sales of Equity Securities and Use of Proceeds
Concurrently with the execution of the Merger Agreement on July 8, 2025, the Company entered into a Subscription Agreement (the “Subscription Agreement”) with Parent, pursuant to which Parent agreed to purchase, and the Company agreed to issue and sell to Parent, 7,600,000 Common Shares (the “Subscription Shares”) for a purchase price of $0.09 per share. On August 13, 2025, Parent purchased the Subscription Shares for an aggregate purchase price of $684,000 pursuant to the terms of the Subscription Agreement.
Item 3. Defaults upon Senior Securities
None.
Item 4. Mine Safety Disclosures
Not applicable.
Item 5. Other Information
None.
Item 6. Exhibits
|
|
|
|
2.1 |
|
Agreement and Plan of Merger, dated as of July 8, 2025, by and among Superior Industries International, Inc., SUP Parent Holdings, LLC and SUP Merger Sub, Inc. (Incorporated by reference to Exhibit 2.1 of the Registrant’s Current Report on Form 8-K/A filed on July 9, 2025).†† |
|
|
|
10.1 |
|
Voting and Support Agreement, dated as of July 8, 2025, by and between Superior Industries International, Inc. and TPG Growth III Sidewall, L.P. (Incorporated by reference to Exhibit 10.1 of the Registrant’s Current Report on Form 8-K/A filed on July 9, 2025). |
|
|
|
10.2 |
|
Form of Voting and Support Agreement for Common Supporting Stockholders (Incorporated by reference to Exhibit 10.2 of the Registrant’s Current Report on Form 8-K/A filed on July 9, 2025). |
|
|
|
10.3 |
|
Subscription Agreement, dated as of July 8, 2025, by and between the Company and SUP Parent Holdings, LLC. (Incorporated by reference to Exhibit 10.3 of the Registrant’s Current Report on Form 8-K/A filed on July 9, 2025). |
|
|
|
10.4 |
|
Recapitalization Support Agreement, dated as of July 8, 2025, by and among the Company, its subsidiaries and the Consenting Parties (Incorporated by reference to Exhibit 10.4 of the Registrant’s Current Report on Form 8-K/A filed on July 9, 2025). †† |
|
|
|
10.5 |
|
Third Amendment to Amended and Restated Credit Agreement, dated as of December 8, 2025, among Superior Industries International, Inc., each other loan party party thereto, the lenders party thereto, and Oaktree Fund Administration, LLC, in its capacity as administrative agent. ** |
|
|
|
10.6 |
|
Third Amendment to Credit Agreement, dated as of December 8, 2025, among Superior Industries International, Inc., each other loan party party thereto, the lenders party thereto, and JPMorgan Chase Bank, N.A., in its capacity as administrative agent and collateral agent. ** |
|
|
|
31.1 |
|
Chief Executive Officer Certification Pursuant to 18 U.S.C. Section 1350, as Adopted Pursuant to Section 302(a) of the Sarbanes-Oxley Act of 2002.** |
|
|
|
31.2 |
|
Chief Financial Officer Certification Pursuant to 18 U.S.C. Section 1350, as Adopted Pursuant to Section 302(a) of the Sarbanes-Oxley Act of 2002.** |
|
|
|
32 |
|
Certification of Michael Dorah, President and Chief Executive Officer, and Shane Giebel, Chief Financial Officer, Pursuant to 18 U.S.C. Section 1350, as Adopted Pursuant to Section 906 of the Sarbanes-Oxley Act of 2002.**† |
|
|
|
101.INS |
|
Inline XBRL Instance Document. **** |
|
|
|
101.SCH |
|
Inline XBRL Taxonomy Extension Schema With Embedded Linkbases Document. **** |
|
|
|
104 |
|
Cover Page Interactive Data File (embedded within the Inline XBRL Document). **** |
** Filed herewith.
**** Submitted electronically with the report.
† These certifications are furnished to the SEC pursuant to Section 906 of the Sarbanes-Oxley Act of 2002 and are deemed not filed for purposes of Section 18 of the Securities Exchange Act of 1934, as amended, nor shall they be deemed incorporated by reference in any filing under the Securities Act of 1933, except as shall be expressly set forth by specific reference in such filing.
†† Schedules (and similar attachments) have been omitted pursuant to Item 601(a)(5) and Item 601(b)(2) of Regulation S-K. The Company hereby undertakes to furnish supplemental copies of any of the omitted schedules (and similar attachments) upon request by the SEC; provided, however, that the Company may request confidential treatment pursuant to Rule 24b-2 of the Exchange Act, for any schedules (and similar attachments) so furnished.
SIGNATURES
Pursuant to the requirements of the Securities Exchange Act of 1934, the registrant has duly caused this report to be signed on its behalf by the undersigned thereunto duly authorized.
SUPERIOR INDUSTRIES INTERNATIONAL, INC.
(Registrant)
|
|
|
Date: December 19, 2025 |
/s/ Michael Dorah |
|
Michael Dorah President and Chief Executive Officer |
|
|
|
Date: December 19, 2025 |
/s/ Shane Giebel |
|
Shane Giebel Chief Financial Officer |