and 9.9% of the equity tranche of each of its managed CLOs plus
a portion of the other senior tranches in an amount to comply
with applicable securitization risk-retention rules.
Off-Balance Sheet Arrangements
We have contractual commitments arising in the ordinary course
of business for securities loaned or purchased under agreements
to resell, repurchase agreements, future purchases and sales of
foreign currencies, securities transactions on a when-issued
basis, purchases and sales of corporate loans in the secondary
market and underwriting. Each of these financial instruments and
activities contains varying degrees of off-balance sheet risk
whereby the fair values of the securities underlying the financial
instruments may be in excess of, or less than, the contract
amount. The settlement of these transactions is not expected to
have a material effect upon our consolidated financial
statements.
In the normal course of business, we engage in other off balance-
sheet arrangements, including derivative contracts. Neither
derivatives’ notional amounts nor underlying instrument values
are reflected as assets or liabilities in our Consolidated
Statements of Financial Condition. Rather, the fair values of
derivative contracts are reported in our Consolidated Statements
of Financial Condition as Financial instruments owned or
Financial instruments sold, not yet purchased as applicable.
Derivative contracts are reflected net of cash paid or received
pursuant to credit support agreements and are reported on a net
by counterparty basis when a legal right of offset exists under an
enforceable master netting agreement. For additional information
about our accounting policies and our derivative activities, refer
to Note 2, Summary of Significant Accounting Policies, in our
consolidated financial statements included in Part II, Item 8 of
our Annual Report on Form 10-K for the year ended November 30,
2024 and Note 6, Fair Value Disclosures and Note 7, Derivative
Financial Instruments in our consolidated financial statements
included in this Quarterly Report on Form 10-Q.
Risk Management
Overview
Risk is an inherent part of our business and activities. The extent
to which we properly and effectively identify, assess, monitor and
manage each of the various types of risk involved in our activities
is critical to our financial soundness, viability and profitability.
Accordingly, we have a comprehensive risk management
approach, with a formal governance structure and policies and
procedures outlining frameworks and processes to identify,
assess, monitor and manage risk. Principal risks involved in our
business activities include market, credit, liquidity and capital,
operational, model and strategic risk. Legal and compliance, new
business and reputational risk are also included within our
principal risks.
Risk management is a multifaceted process that requires
communication, judgment and knowledge of financial products
and markets. Our risk management process encompasses the
active involvement of executive and senior management, and
also many departments independent of the revenue-producing
business units, including Risk Management, Operations,
Information Technology, Compliance, Legal and Finance. Our risk
management policies, procedures and methodologies are flexible
in nature and are subject to ongoing review and modification.
In achieving our strategic business objectives, our risk appetite
incorporates keeping our clients’ interests as top priority and
ensuring we are in compliance with applicable laws, rules and
regulations, as well as adhering to the highest ethical standards.
We undertake prudent risk-taking that protects the capital base
and franchise, utilizing risk limits and tolerances that avoid
outsized risk-taking. We maintain a diversified business mix and
avoid significant concentrations to any sector, product,
geography or activity and set quantitative concentration limits to
manage this risk. We consider contagion, second order effects
and correlation in our risk assessment process and actively seek
out value opportunities of all sizes. We manage the risk of
opportunities larger than our approved risk levels through risk
sharing and risk distribution, sell-down and hedging as
appropriate. We have a limited appetite for illiquid assets and
complex derivative financial instruments. We maintain the asset
quality of our balance sheet through conducting trading activity in
liquid markets and generally ensure high turnover of our
inventory. We subject less liquid positions and derivative financial
instruments to particular scrutiny and use a wide variety of
specific metrics, limits and constraints to manage these risks.
We protect our reputation and franchise, as well as our standing
within the market. We operate a federated approach to risk
management and assign risk oversight responsibilities to a
number of functions with specific areas of focus.
For discussion of liquidity and capital risk management, refer to
the “Liquidity, Financial Condition and Capital Resources” section
herein.
Governance and Risk Management Structure
For a discussion of our governance and risk management
structure and our risk management framework, see
“Management’s Discussion and Analysis of Financial Condition
and Results of Operations—Risk Management” in Part II, Item 7 of
our Annual Report on Form 10-K for the year ended November 30,
2024.
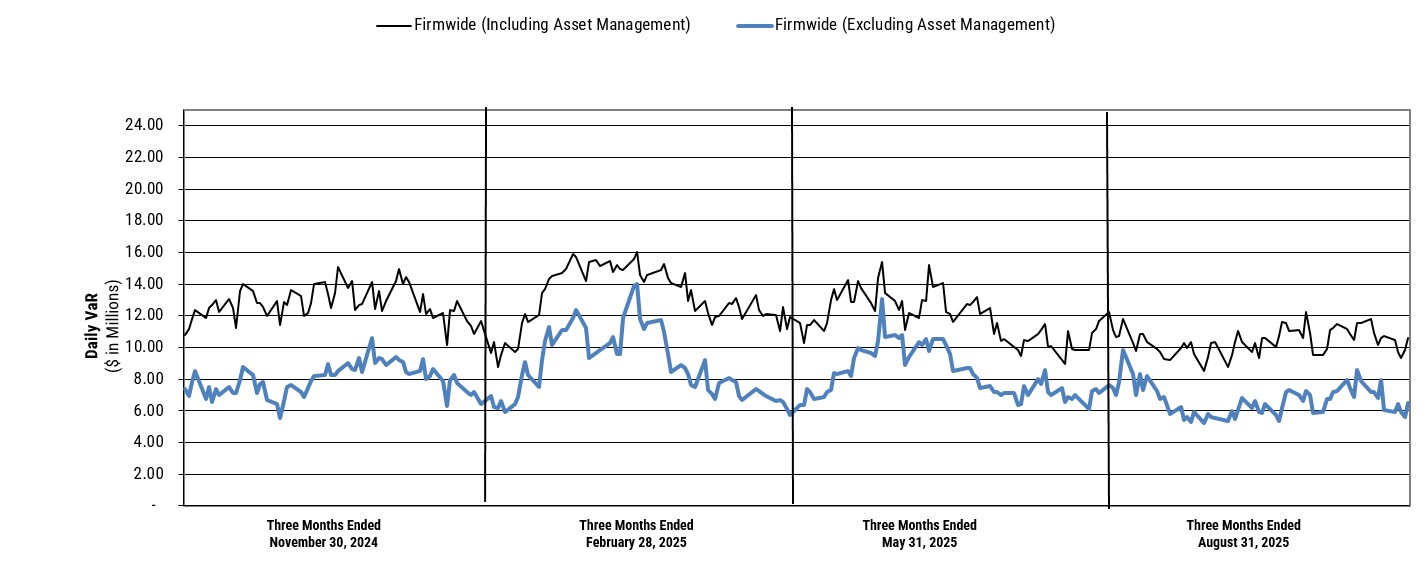
Risk Considerations
We apply a comprehensive framework of limits on a variety of
key metrics to constrain the risk profile of our business activities.
The size of the limits reflects our risk appetite for a certain
activity under normal business conditions. Key metrics included
in our risk management framework include inventory position
and exposure limits on a gross and net basis, scenario analysis
and stress tests, Value-at-Risk (“VaR”), sensitivities, exposure
concentrations, aged inventory, Level 3 assets, counterparty
exposure, leverage and cash capital.
Market Risk
Market risk is defined as the risk of loss due to fluctuations in the
market value of financial assets and liabilities attributable to
changes in market variables.
Our market risk principally arises from interest rate risk, from
exposure to changes in the yield curve, the volatility of interest
rates, and credit spreads, and from equity price risks from
exposure to changes in prices and volatilities of individual
equities, equity baskets and equity indices. In addition,
commodity price risk results from exposure to the changes in
prices and volatilities of individual commodities, commodity
baskets and commodity indices, and foreign exchange risk
results from changes in foreign currency rates.
Market risk is present in our capital markets business through
market making, proprietary trading, underwriting and investing
activities and is present in our asset management business
through investments in separately managed accounts and direct
investments in funds. Given our involvement in a broad set of
financial products and markets, market risk exposures are
diversified and economic hedges are established as appropriate.