
2025Investor Meeting October 16th, 2025 Jefferies Financial Group Inc.
Important Disclosures 2 Forward Looking Statements. Certain statements
contained herein may constitute “forward-looking statements," within the meaning of Section 27A of the Securities Act of 1933, Section 21E of the Securities Exchange Act of 1934 and/or the Private Securities Litigation Reform Act of 1995,
regarding Jefferies Financial Group Inc., and its subsidiaries. These forward-looking statements reflect our current views relating to, among other things, future revenues, earnings, operations, and other financial results, and may include
statements of future performance, plans, and objectives. Forward-looking statements may also include statements pertaining to our strategies for the future development of its business and products. These forward-looking statements are not
historical facts and are based on management expectations, estimates, projections, beliefs and certain other assumptions, many of which, by their nature, are inherently uncertain and beyond management’s control. It is possible that the actual
results may differ, possibly materially, from the anticipated results indicated in these forward-looking statements. Accordingly, readers are cautioned that any such forward-looking statements are not guarantees of future performance and are
subject to certain risks, uncertainties and assumptions that are difficult to predict including, without limitation, the cautionary statements and risks set forth in our Annual and Quarterly Reports and other reports or documents filed with,
or furnished to, the SEC from time to time, which are accessible on the SEC website at sec.gov. This information should also be read in conjunction with Jefferies Financial Group Inc. Consolidated Financial Statements and the Notes thereto
contained in the Annual, Quarterly and Periodic Reports filed by the issuer that are also accessible on the SEC website at sec.gov. Readers are cautioned not to place undue reliance on forward-looking statements, which speak only as of the
date they are made. We do not undertake to update any forward-looking statements to reflect the impact of circumstances or events that arise after the date of such forward-looking statements. Not an Offer. These materials are provided for
shareholders of Jefferies Financial Group Inc. and are for informational purposes only. These materials do not constitute an offer to sell, or a solicitation of an offer to buy, any security or instrument, or a solicitation of interest in any
fund, account or strategy described herein. Performance Information. Past performance is not necessarily indicative of future results.

9:00 AM Jefferies Overview Rich Handler, CEO Brian Friedman, President 9:20
AM Financial Review Matt Larson, CFO 9:40 AM Investment Banking Raphael Bejarano, Global Head of Investment Banking John Miller, Global Head of Investment Banking Andrea Lee, Co-Head of Global Investment Banking 10:00
AM Equities Peter Forlenza, Global Head of Equities 10:20 AM Fixed Income Fred Orlan, Global Head of Fixed Income 10:40 AM Asset Management Nick Daraviras, Co-Head of Asset Management Sol Kumin, Co-Head of Asset Management 11:00
AM Q&A 2025 Investor Meeting Agenda 3

JefferiesOverviewRich Handler, CEOBrian Friedman, President 4

5 Exceptional Opportunities for Continued Growth Favorable “Normal”
Environment Focused on Execution and Realization Unique Wall Street Firm
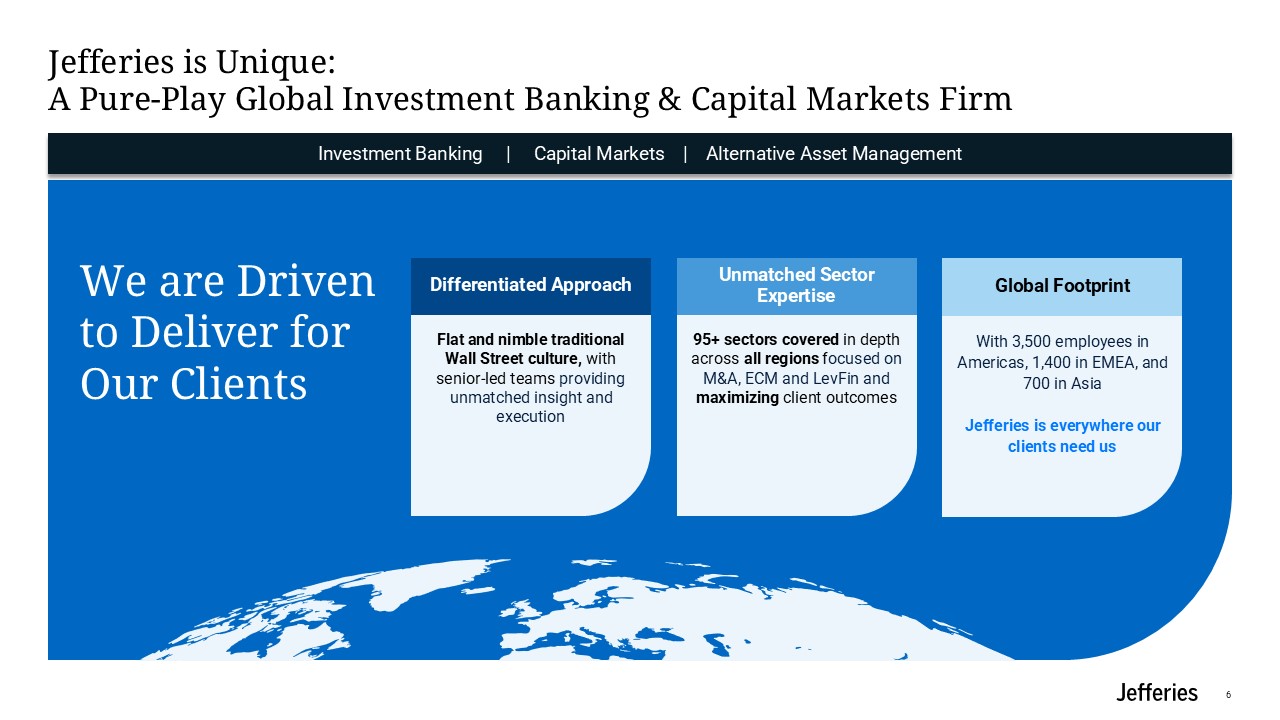
We are Driven to Deliver for Our Clients Jefferies is Unique: A Pure-Play
Global Investment Banking & Capital Markets Firm 6 Investment Banking | Capital Markets | Alternative Asset Management Flat and nimble traditional Wall Street culture, with senior-led teams providing unmatched insight and
execution Differentiated Approach 95+ sectors covered in depth across all regions focused on M&A, ECM and LevFin and maximizing client outcomes Unmatched Sector Expertise With 3,500 employees in Americas, 1,400 in EMEA, and 700 in
AsiaJefferies is everywhere our clients need us Global Footprint
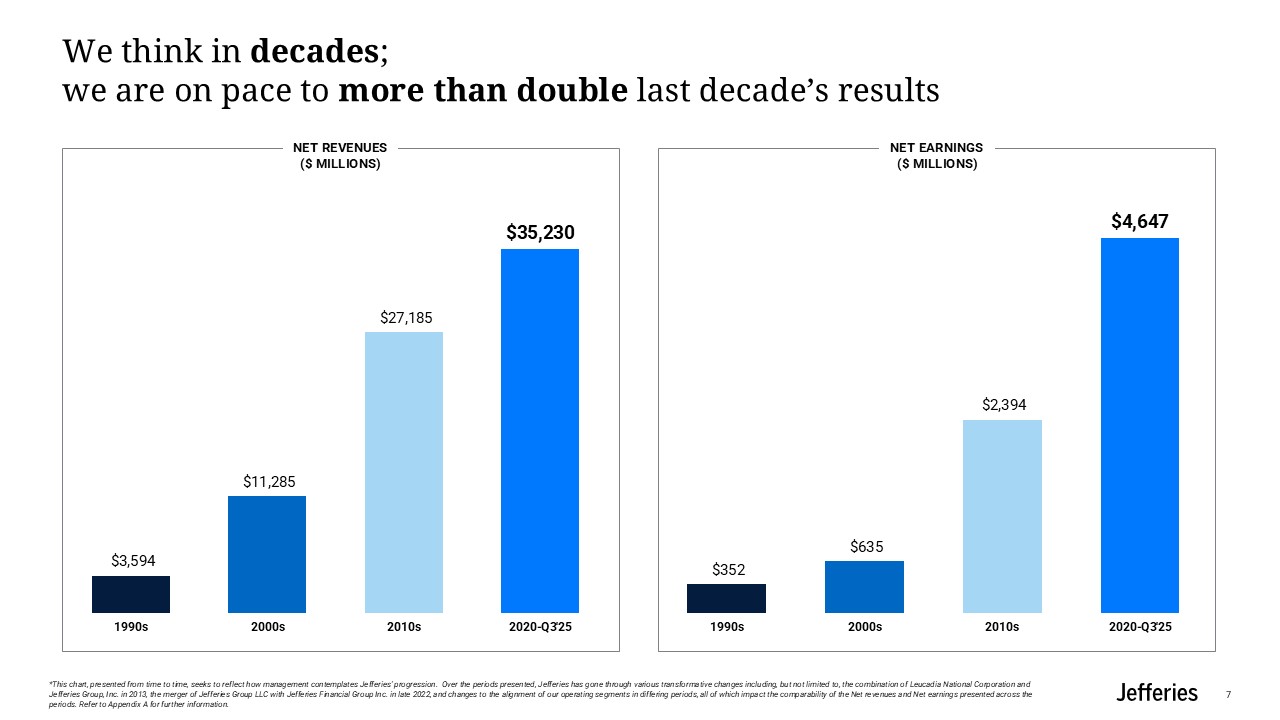
We think in decades; we are on pace to more than double last decade’s results
*This chart, presented from time to time, seeks to reflect how management contemplates Jefferies’ progression. Over the periods presented, Jefferies has gone through various transformative changes including, but not limited to, the
combination of Leucadia National Corporation and Jefferies Group, Inc. in 2013, the merger of Jefferies Group LLC with Jefferies Financial Group Inc. in late 2022, and changes to the alignment of our operating segments in differing periods,
all of which impact the comparability of the Net revenues and Net earnings presented across the periods. Refer to Appendix A for further information. Net Earnings ($ Millions) Net Revenues ($ Millions) 7
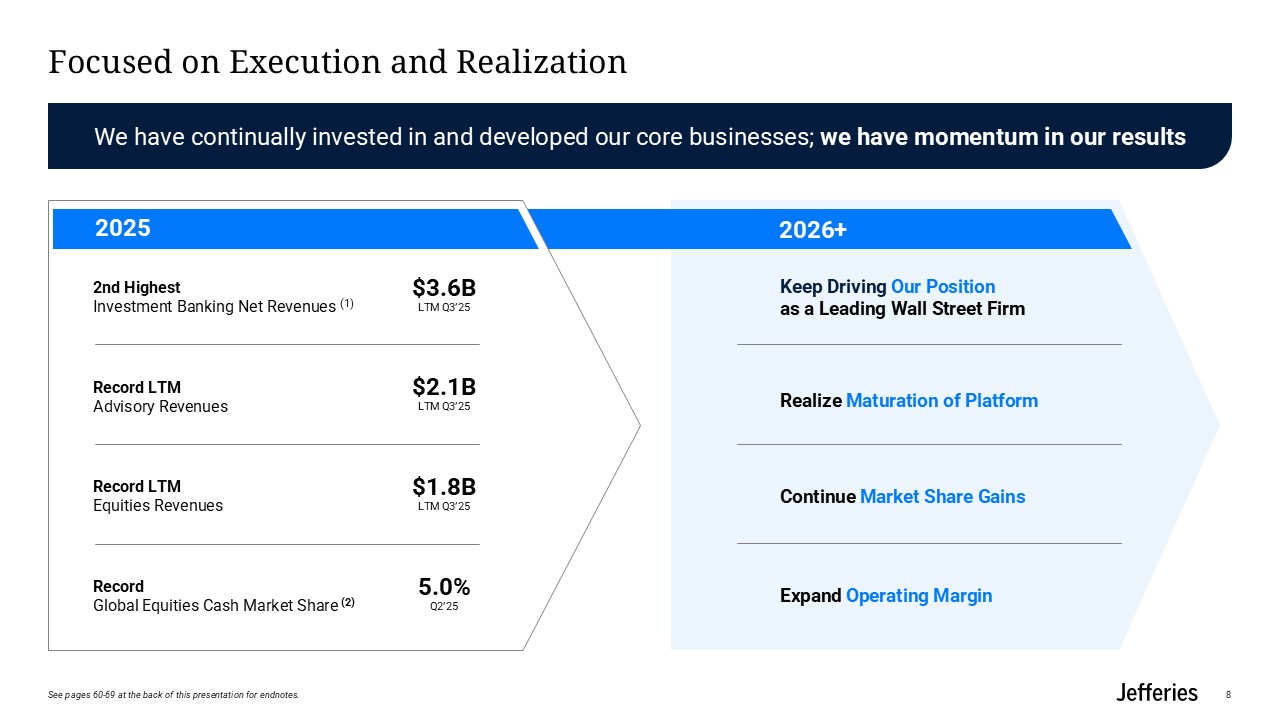
2026+ Focused on Execution and Realization 8 2nd Highest Investment
Banking Net Revenues (1) $3.6B LTM Q3’25 Record LTM Equities Revenues $1.8B LTM Q3’25 Record Global Equities Cash Market Share (2) 5.0% Q2’25 Keep Driving Our Position as a Leading Wall Street Firm Realize Maturation of
Platform Continue Market Share Gains Expand Operating Margin Record LTM Advisory Revenues $2.1B LTM Q3’25 We have continually invested in and developed our core businesses; we have momentum in our results 2025 See pages 60-69 at the
back of this presentation for endnotes.
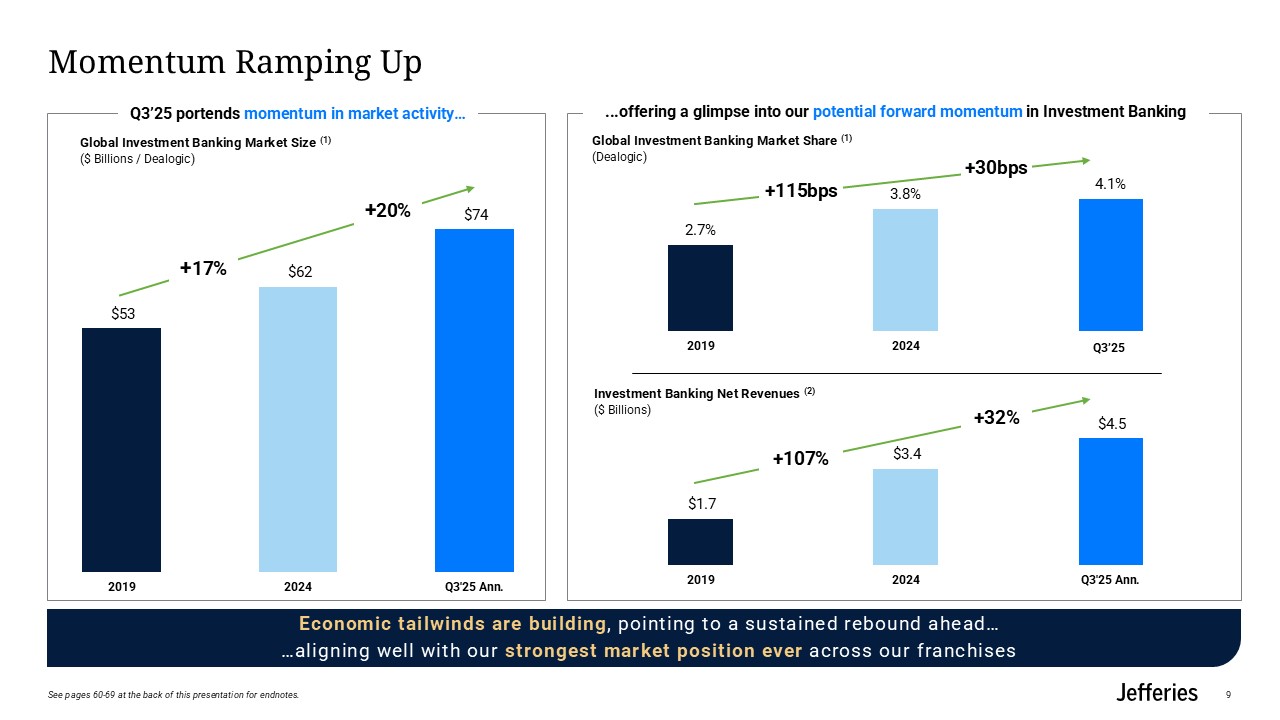
Q3’25 portends momentum in market activity… Momentum Ramping Up Economic
tailwinds are building, pointing to a sustained rebound ahead… …aligning well with our strongest market position ever across our franchises 9 ...offering a glimpse into our potential forward momentum in Investment Banking +20% Global
Investment Banking Market Size (1) ($ Billions / Dealogic) +17% Global Investment Banking Market Share (1) (Dealogic) Investment Banking Net Revenues (2) ($ Billions) +30bps +32% +115bps +107% Q3’25 See pages 60-69 at the back of
this presentation for endnotes.
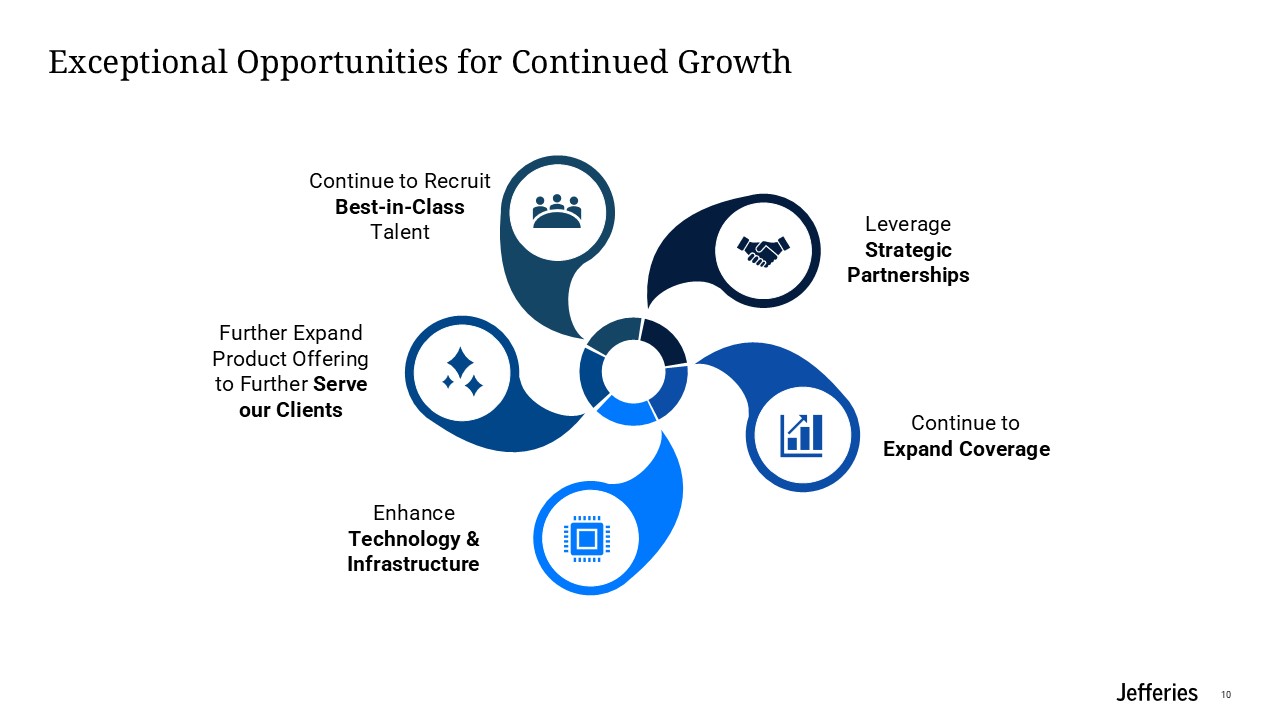
Exceptional Opportunities for Continued Growth 10 Further Expand Product
Offering to Further Serve our Clients Leverage Strategic Partnerships Enhance Technology & Infrastructure Continue to Expand Coverage Continue to Recruit Best-in-Class Talent
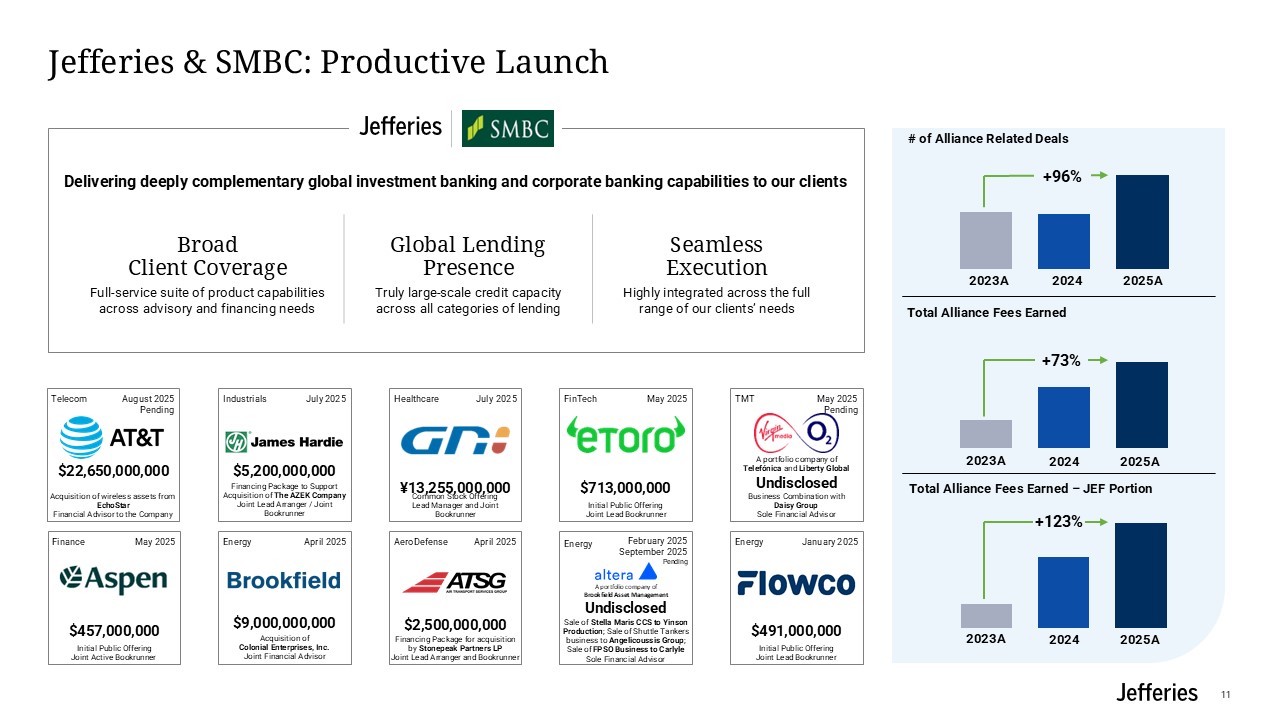
Jefferies & SMBC: Productive Launch 11 Broad Client Coverage Full-service
suite of product capabilities across advisory and financing needs Global Lending Presence Truly large-scale credit capacity across all categories of lending Seamless Execution Highly integrated across the full range of our clients’
needs Delivering deeply complementary global investment banking and corporate banking capabilities to our clients +123% 2023A 2024 2025A +73% +96% Business Combination with Daisy Group Sole Financial Advisor May 2025
Pending TMT Undisclosed A portfolio company of Telefónica and Liberty Global Initial Public Offering Joint Lead Bookrunner May 2025 FinTech $713,000,000 Initial Public Offering Joint Lead Bookrunner January
2025 Energy $491,000,000 Initial Public Offering Joint Active Bookrunner May 2025 Finance $457,000,000 Sale of Stella Maris CCS to Yinson Production; Sale of Shuttle Tankers business to Angelicoussis Group; Sale of FPSO Business to
Carlyle Sole Financial Advisor February 2025 September 2025 Pending Energy Undisclosed A portfolio company of Brookfield Asset Management Financing Package for acquisition by Stonepeak Partners LP Joint Lead Arranger and
Bookrunner April 2025 AeroDefense $2,500,000,000 Acquisition of wireless assets from EchoStar Financial Advisor to the Company August 2025 Pending Telecom $22,650,000,000 Acquisition of Colonial Enterprises, Inc. Joint Financial
Advisor April 2025 Energy $9,000,000,000 Common Stock Offering Lead Manager and Joint Bookrunner July 2025 Healthcare ¥13,255,000,000 Financing Package to Support Acquisition of The AZEK Company Joint Lead Arranger / Joint
Bookrunner July 2025 Industrials $5,200,000,000 2023A 2024 2025A 2023A 2024 2025A
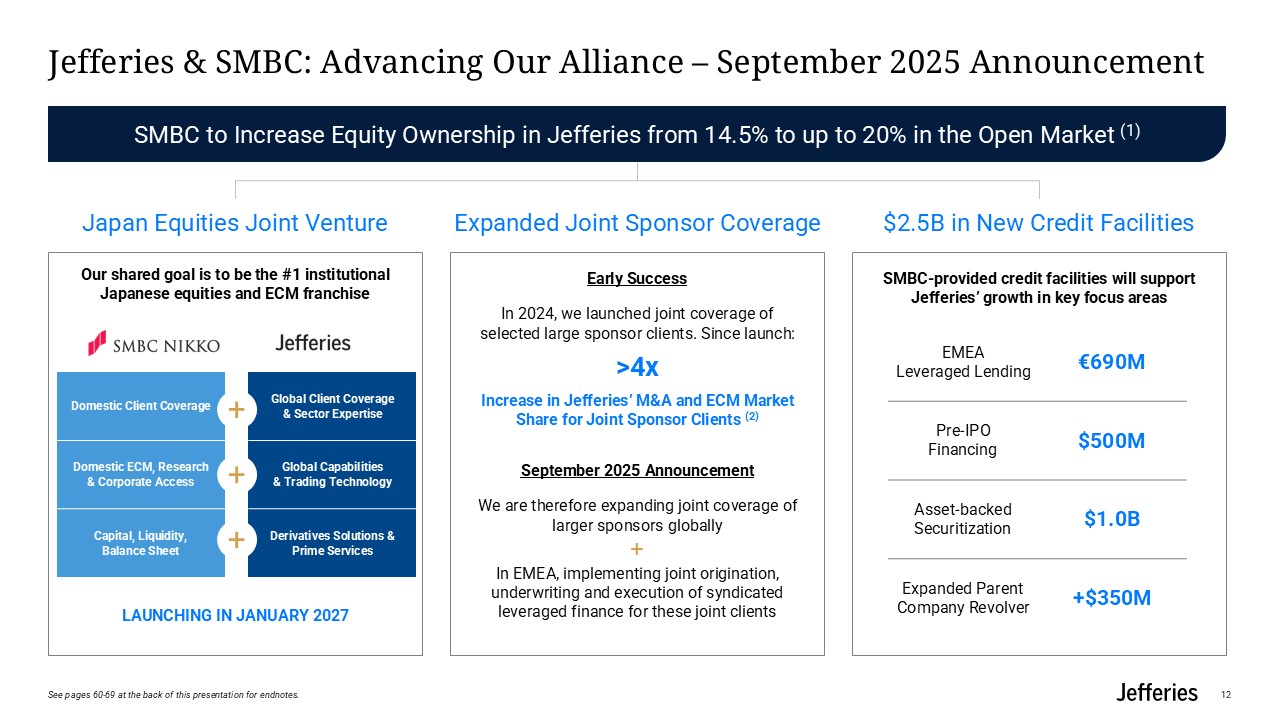
12 Jefferies & SMBC: Advancing Our Alliance – September 2025
Announcement Our shared goal is to be the #1 institutional Japanese equities and ECM franchise Early Success In 2024, we launched joint coverage of selected large sponsor clients. Since launch: >4x Increase in Jefferies’ M&A and
ECM Market Share for Joint Sponsor Clients (2) September 2025 Announcement We are therefore expanding joint coverage of larger sponsors globally + In EMEA, implementing joint origination, underwriting and execution of syndicated leveraged
finance for these joint clients SMBC-provided credit facilities will support Jefferies’ growth in key focus areas SMBC to Increase Equity Ownership in Jefferies from 14.5% to up to 20% in the Open Market (1) Japan Equities Joint
Venture Expanded Joint Sponsor Coverage $2.5B in New Credit Facilities Launching in January 2027 EMEA Leveraged Lending €690M Pre-IPO Financing $500M Asset-backed Securitization $1.0B Expanded Parent Company
Revolver +$350M Domestic Client Coverage Domestic ECM, Research & Corporate Access Capital, Liquidity, Balance Sheet Global Client Coverage & Sector Expertise Global Capabilities & Trading Technology Derivatives
Solutions & Prime Services + + + See pages 60-69 at the back of this presentation for endnotes.
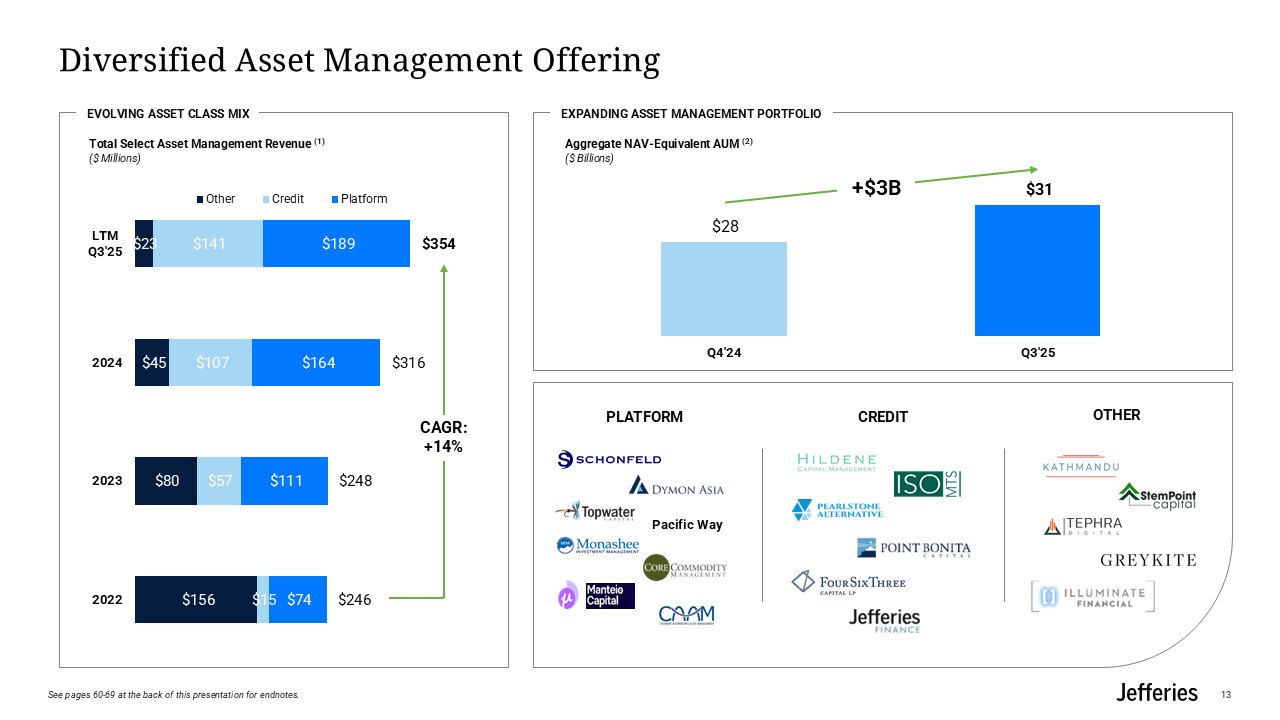
Diversified Asset Management Offering PLATFORM Pacific
Way CREDIT OTHER EXPANDING ASSET MANAGEMENT PORTFOLIO Aggregate NAV-Equivalent AUM (2) ($ Billions) +$3B EVOLVING ASSET CLASS MIX Total Select Asset Management Revenue (1) ($ Millions) CAGR:+14% 13 See pages 60-69 at the back of
this presentation for endnotes.
14 Exceptional Opportunities for Continued Growth Favorable “Normal”
Environment Focused on Execution and Realization Unique Wall Street Firm

Financial Review 15
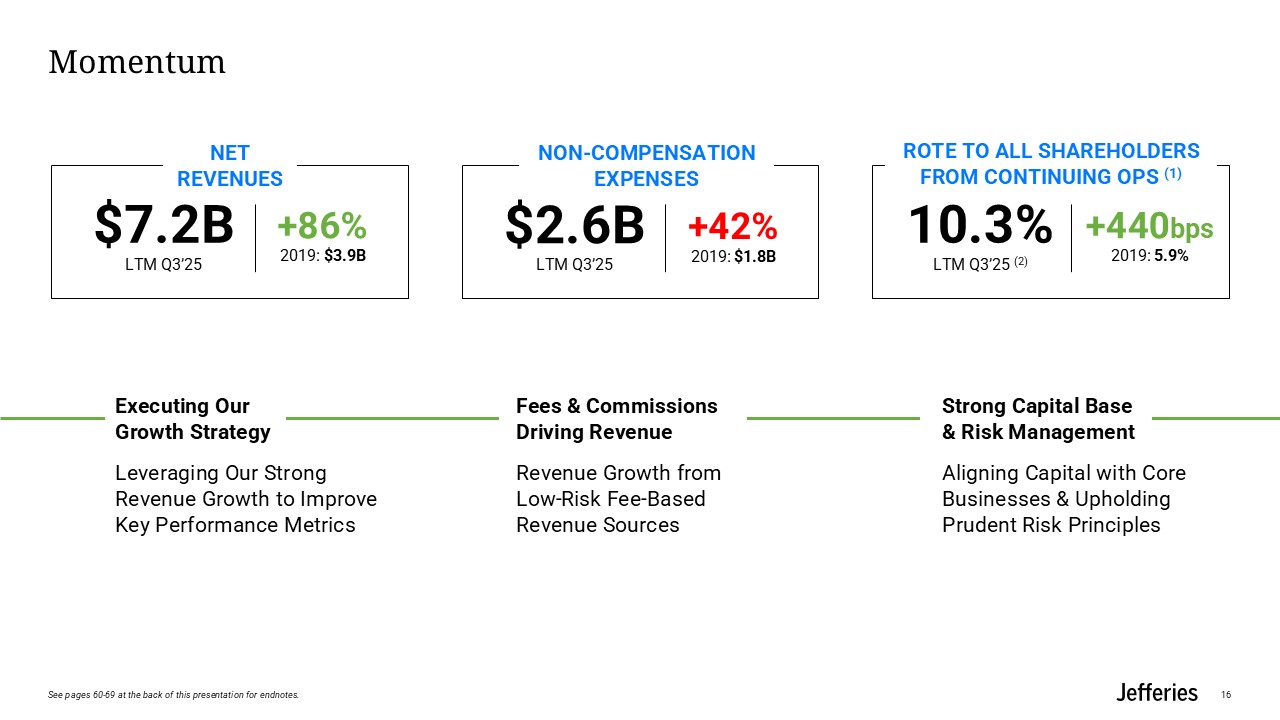
Fees & Commissions Driving Revenue Revenue Growth from Low-Risk Fee-Based
Revenue Sources Momentum 16 NET REVENUES NON-COMPENSATION EXPENSES ROTE TO ALL SHAREHOLDERS from Continuing Ops (1) $7.2BLTM Q3’25 +86%2019: $3.9B $2.6BLTM Q3’25 +42%2019: $1.8B 10.3%LTM Q3’25 (2) +440bps2019: 5.9% Executing
Our Growth Strategy Leveraging Our Strong Revenue Growth to Improve Key Performance Metrics Strong Capital Base & Risk Management Aligning Capital with Core Businesses & Upholding Prudent Risk Principles See pages 60-69 at the
back of this presentation for endnotes.
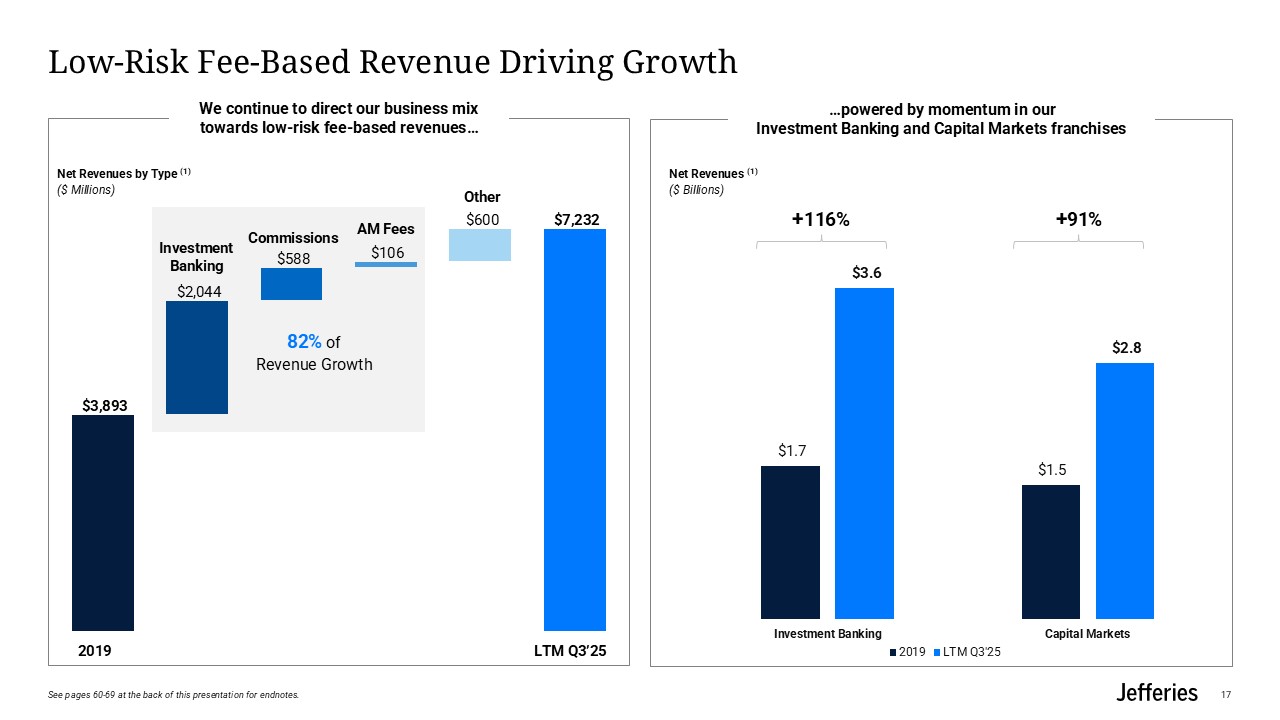
Net Revenues by Type (1) ($ Millions) 17 Net Revenues (1) ($
Billions) +116% +91% 82% of Revenue Growth Low-Risk Fee-Based Revenue Driving Growth 2019 Investment Banking Commissions Other LTM Q3’25 AM Fees We continue to direct our business mix towards low-risk fee-based
revenues… …powered by momentum in our Investment Banking and Capital Markets franchises See pages 60-69 at the back of this presentation for endnotes.
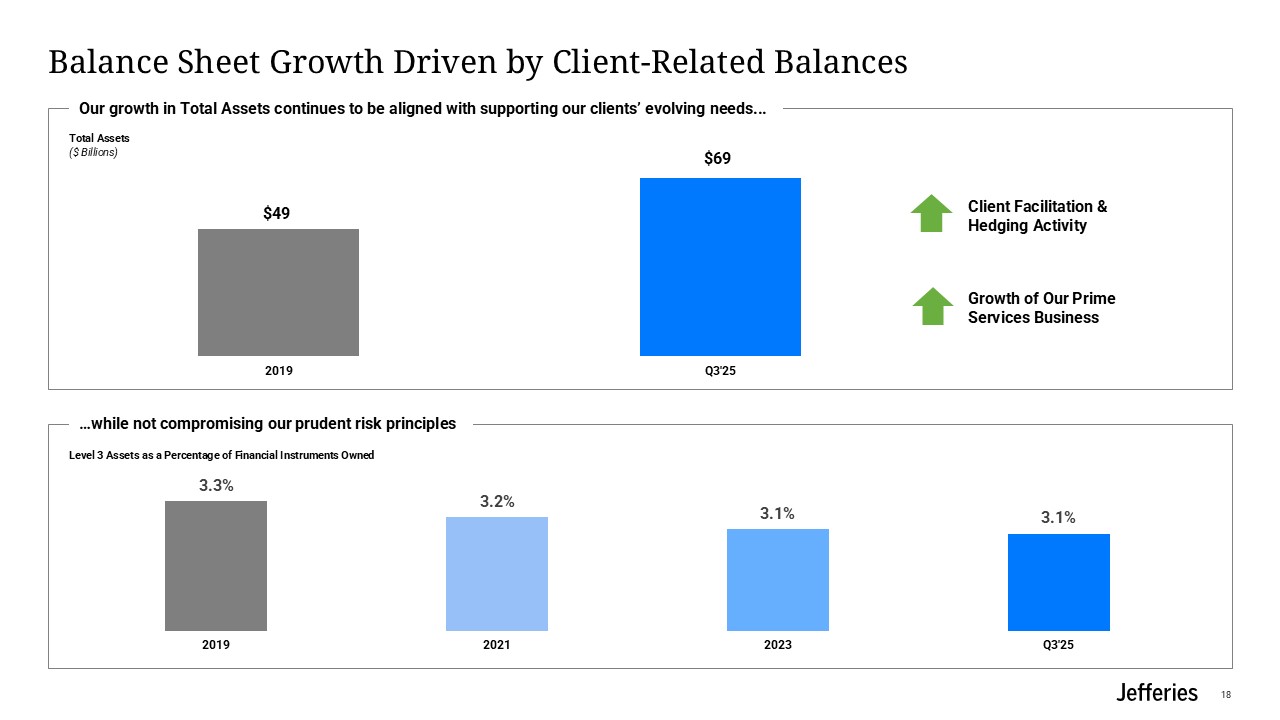
Balance Sheet Growth Driven by Client-Related Balances 18 Level 3 Assets as a
Percentage of Financial Instruments Owned $49 $69 Total Assets ($ Billions) Client Facilitation & Hedging Activity Growth of Our Prime Services Business Our growth in Total Assets continues to be aligned with supporting our
clients’ evolving needs... …while not compromising our prudent risk principles
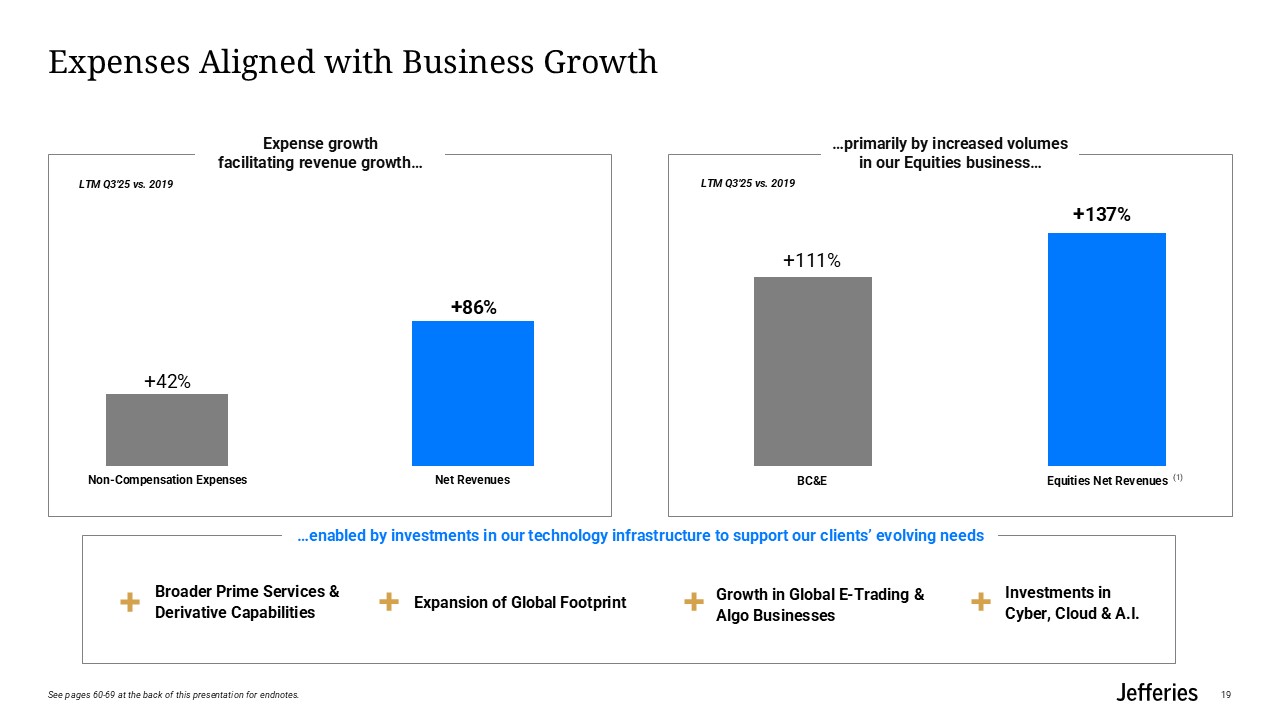
Expenses Aligned with Business Growth 19 +137% +111% …enabled by investments
in our technology infrastructure to support our clients’ evolving needs Broader Prime Services & Derivative Capabilities Investments in Cyber, Cloud & A.I. Growth in Global E-Trading & Algo Businesses LTM Q3’25 vs. 2019 LTM
Q3’25 vs. 2019 Expansion of Global Footprint +86% +42% (1) Expense growth facilitating revenue growth… …primarily by increased volumes in our Equities business… See pages 60-69 at the back of this presentation for endnotes.
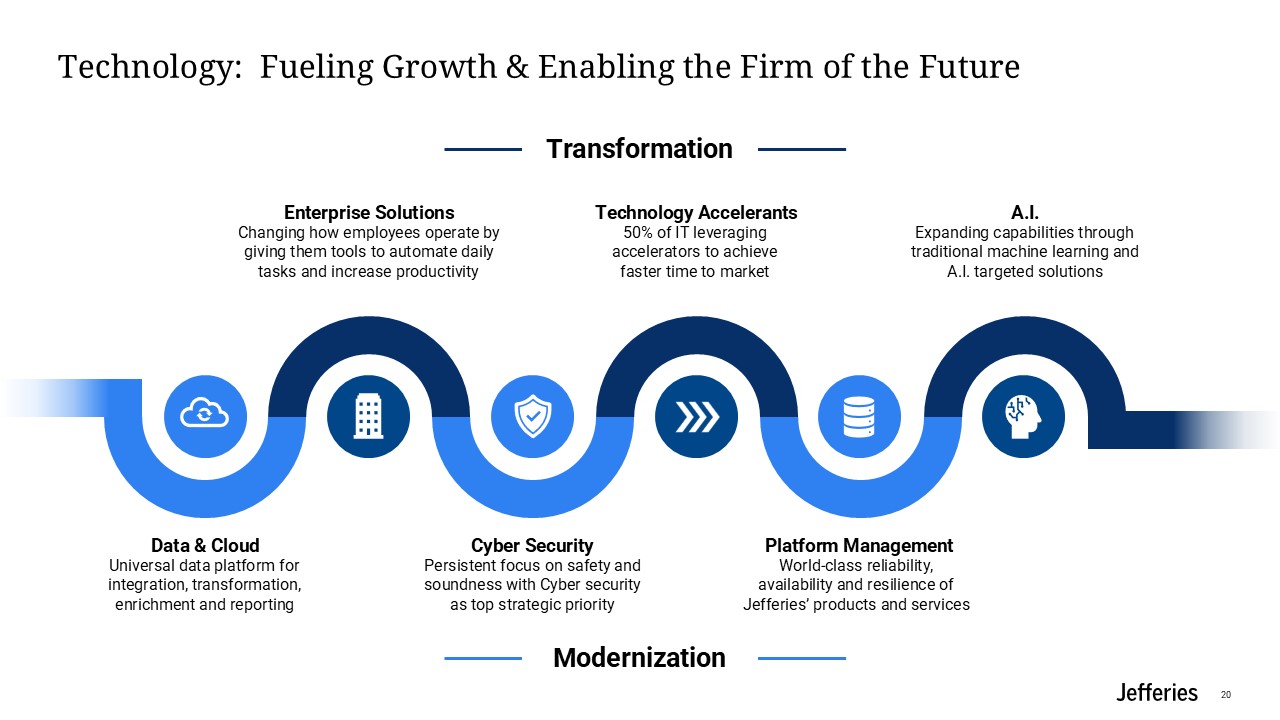
Changing how employees operate by giving them tools to automate daily tasks and
increase productivity Enterprise Solutions 50% of IT leveraging accelerators to achieve faster time to market Technology Accelerants Expanding capabilities through traditional machine learning and A.I. targeted solutions A.I. Universal
data platform for integration, transformation, enrichment and reporting Data & Cloud Persistent focus on safety and soundness with Cyber security as top strategic priority Cyber Security World-class reliability, availability and
resilience of Jefferies’ products and services Platform Management Technology: Fueling Growth & Enabling the Firm of the Future Modernization Transformation 20

Business Review 21

Investment Banking Business Review 22
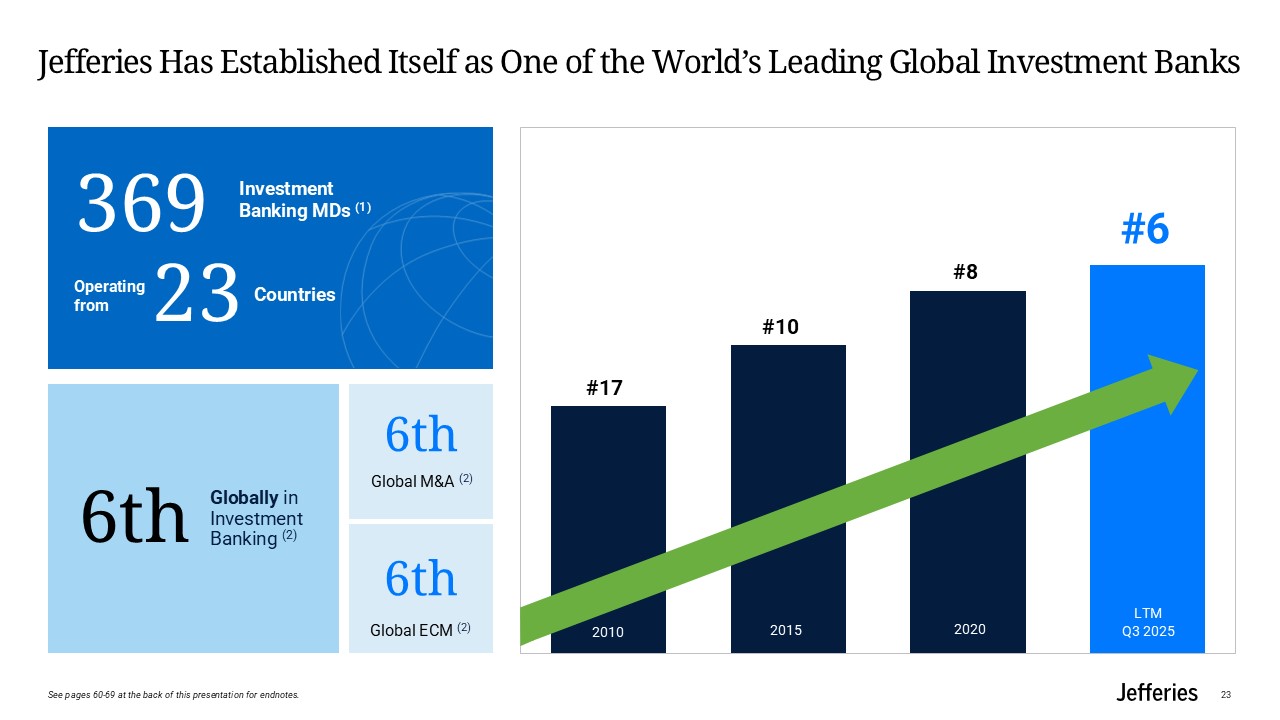
Jefferies Has Established Itself as One of the World’s Leading Global Investment
Banks LTM Q3 2025 8 6 2010 #17 2015 2020 2020 #10 #8 #6 369 Investment Banking MDs (1) 6th Globally in Investment Banking (2) 6th Global M&A (2) 6th Global ECM (2) Countries Operating from 23 23 See pages 60-69 at
the back of this presentation for endnotes.
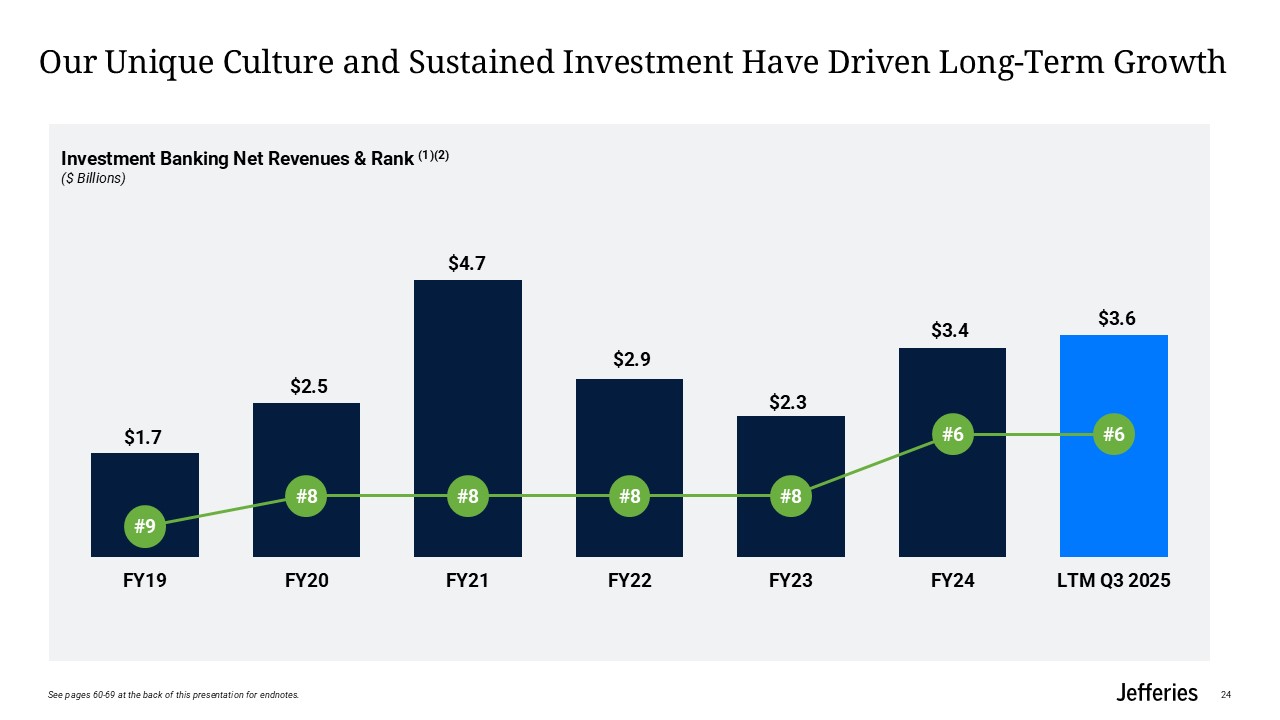
Our Unique Culture and Sustained Investment Have Driven Long-Term
Growth 24 Investment Banking Net Revenues & Rank (1)(2) ($ Billions) See pages 60-69 at the back of this presentation for endnotes.
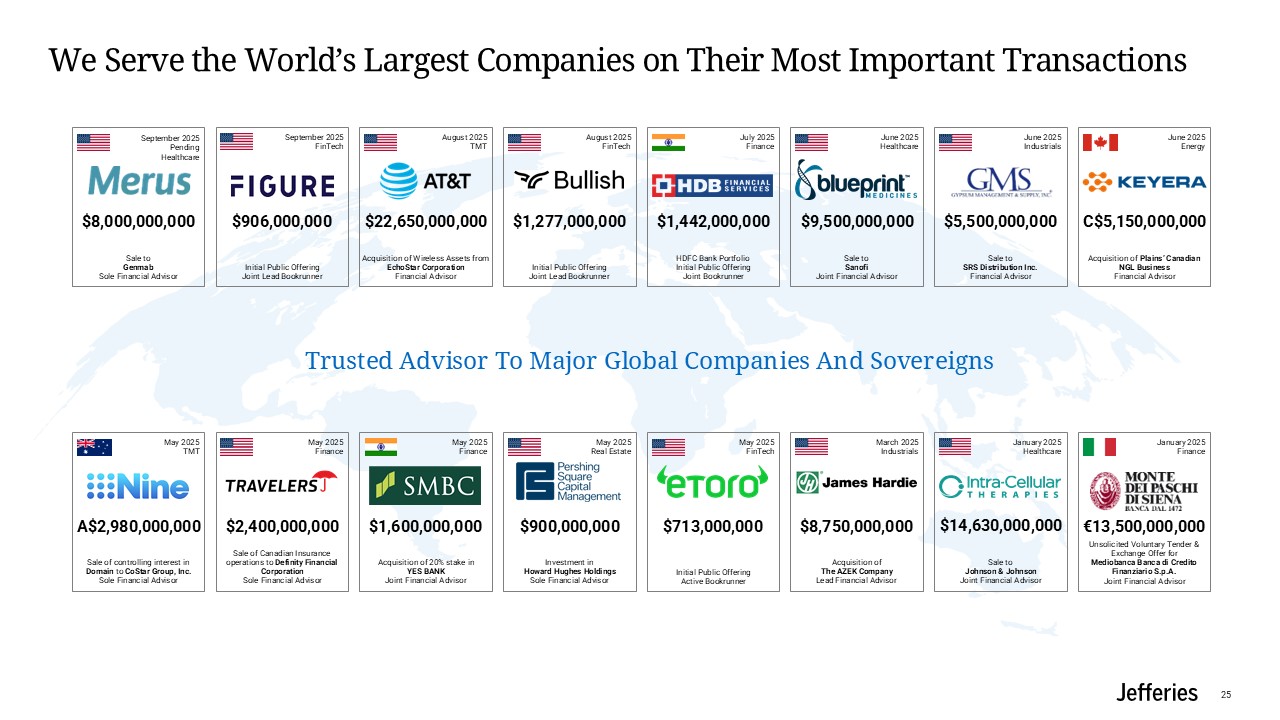
We Serve the World’s Largest Companies on Their Most Important
Transactions Trusted Advisor To Major Global Companies And Sovereigns Sale of Canadian Insurance operations to Definity Financial Corporation Sole Financial Advisor May 2025 Finance $2,400,000,000 Acquisition of 20% stake in YES
BANK Joint Financial Advisor May 2025 Finance $1,600,000,000 Investment in Howard Hughes Holdings Sole Financial Advisor May 2025 Real Estate $900,000,000 Initial Public Offering Active Bookrunner May
2025 FinTech $713,000,000 Acquisition of The AZEK Company Lead Financial Advisor March 2025 Industrials $8,750,000,000 January 2025 Healthcare $14,630,000,000 Sale to Johnson & Johnson Joint Financial Advisor Unsolicited
Voluntary Tender & Exchange Offer for Mediobanca Banca di Credito Finanziario S.p.A. Joint Financial Advisor January 2025 Finance €13,500,000,000 Sale of controlling interest in Domain to CoStar Group, Inc. Sole Financial
Advisor May 2025 TMT A$2,980,000,000 Acquisition of Plains’ Canadian NGL Business Financial Advisor June 2025 Energy C$5,150,000,000 Sale to Sanofi Joint Financial Advisor June 2025 Healthcare $9,500,000,000 Sale to SRS
Distribution Inc. Financial Advisor June 2025 Industrials $5,500,000,000 HDFC Bank Portfolio Initial Public Offering Joint Bookrunner July 2025 Finance $1,442,000,000 Initial Public Offering Joint Lead Bookrunner August
2025 FinTech $1,277,000,000 Acquisition of Wireless Assets from EchoStar Corporation Financial Advisor August 2025 TMT $22,650,000,000 Sale to Genmab Sole Financial Advisor $8,000,000,000 September
2025 Pending Healthcare Initial Public Offering Joint Lead Bookrunner September 2025 FinTech $906,000,000 25
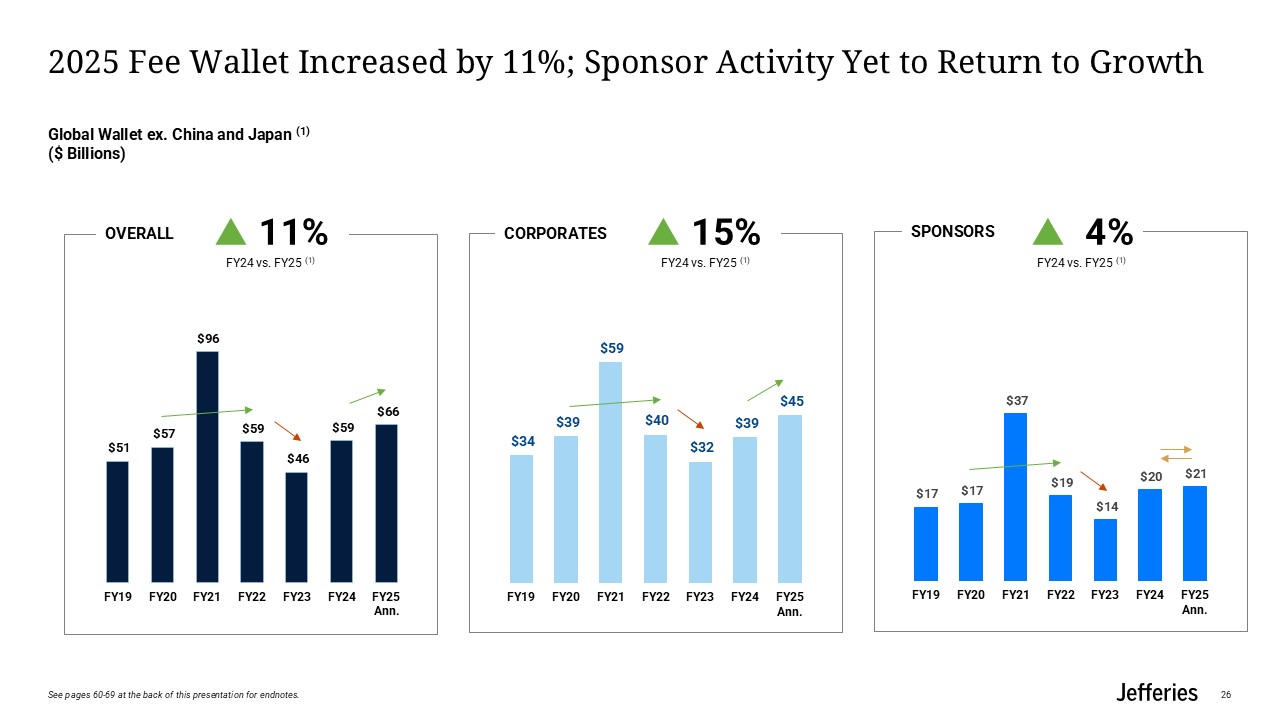
2025 Fee Wallet Increased by 11%; Sponsor Activity Yet to Return to
Growth 26 Global Wallet ex. China and Japan (1) ($ Billions) FY24 vs. FY25 (1) FY24 vs. FY25 (1) Corporates Sponsors Overall 11% 15% 4% FY24 vs. FY25 (1) See pages 60-69 at the back of this presentation for endnotes.
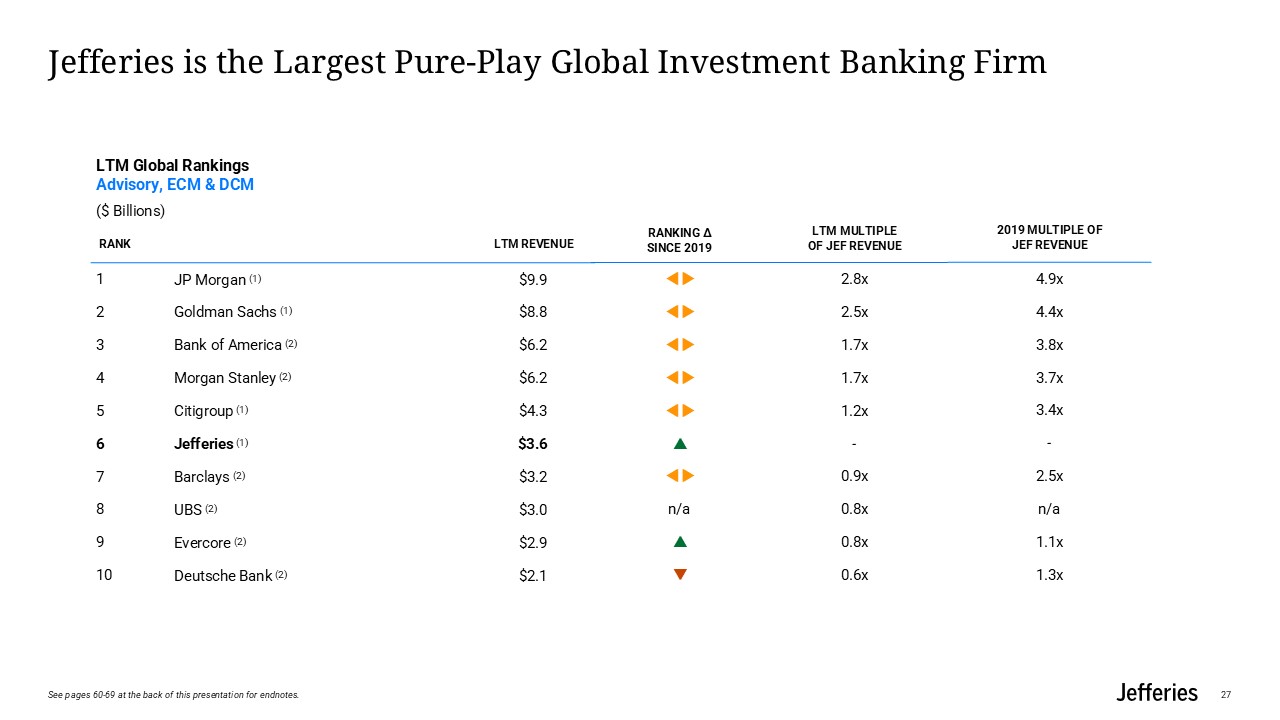
Jefferies is the Largest Pure-Play Global Investment Banking Firm 27 LTM
Global Rankings Advisory, ECM & DCM ($ Billions) Rank LTM Revenue 1 JP Morgan (1) $9.9 2 Goldman Sachs (1) $8.8 3 Bank of America (2) $6.2 4 Morgan Stanley (2) $6.2 5 Citigroup (1) $4.3 6 Jefferies (1)
$3.6 7 Barclays (2) $3.2 8 UBS (2) $3.0 9 Evercore (2) $2.9 10 Deutsche Bank (2) $2.1 Ranking Δ Since 2019 n/a LTM Multiple of JEF Revenue
2.8x 2.5x 1.7x 1.7x 1.2x - 0.9x 0.8x 0.8x 0.6x 2019 Multiple of JEF Revenue 4.9x 4.4x 3.8x 3.7x 3.4x - 2.5x n/a 1.1x 1.3x See pages 60-69 at the back of this presentation for endnotes.
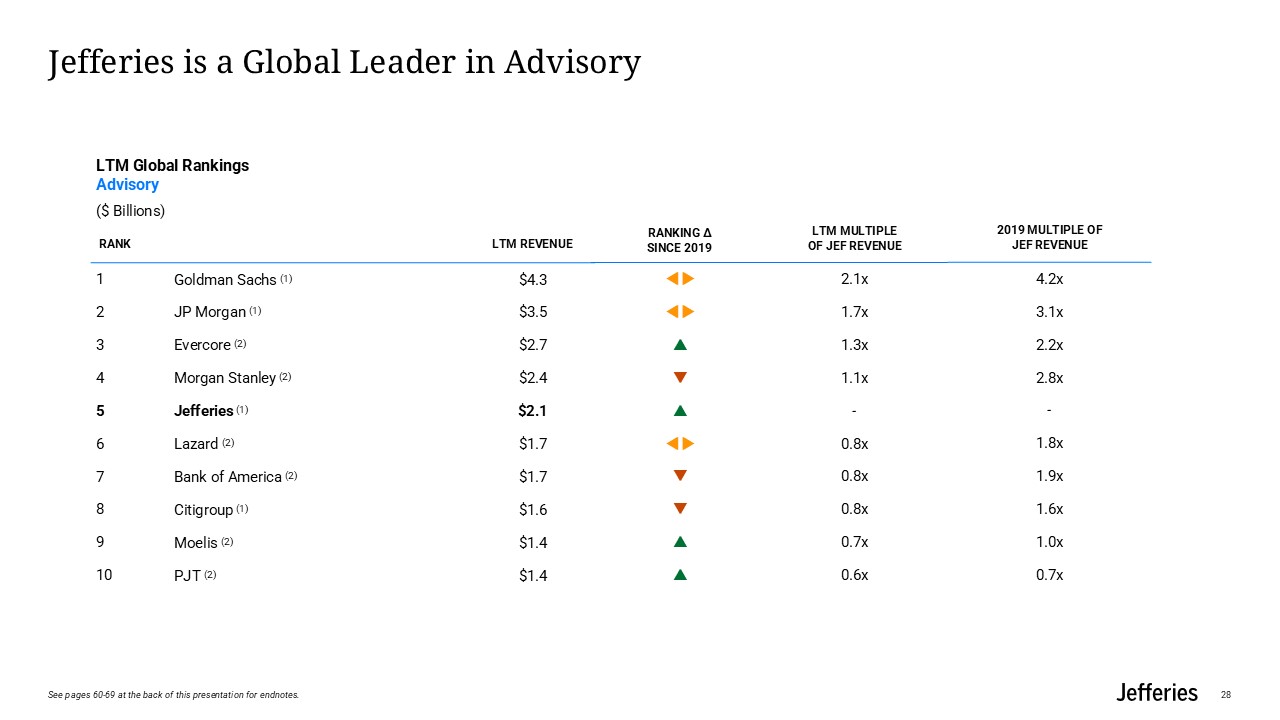
Jefferies is a Global Leader in Advisory 28 LTM Global Rankings Advisory ($
Billions) Rank LTM Revenue 1 Goldman Sachs (1) $4.3 2 JP Morgan (1) $3.5 3 Evercore (2) $2.7 4 Morgan Stanley (2) $2.4 5 Jefferies (1) $2.1 6 Lazard (2) $1.7 7 Bank of America (2) $1.7 8 Citigroup (1)
$1.6 9 Moelis (2) $1.4 10 PJT (2) $1.4 Ranking Δ Since 2019 LTM Multiple of JEF Revenue 2.1x 1.7x 1.3x 1.1x - 0.8x 0.8x 0.8x 0.7x 0.6x 2019 Multiple of JEF Revenue
4.2x 3.1x 2.2x 2.8x - 1.8x 1.9x 1.6x 1.0x 0.7x See pages 60-69 at the back of this presentation for endnotes.
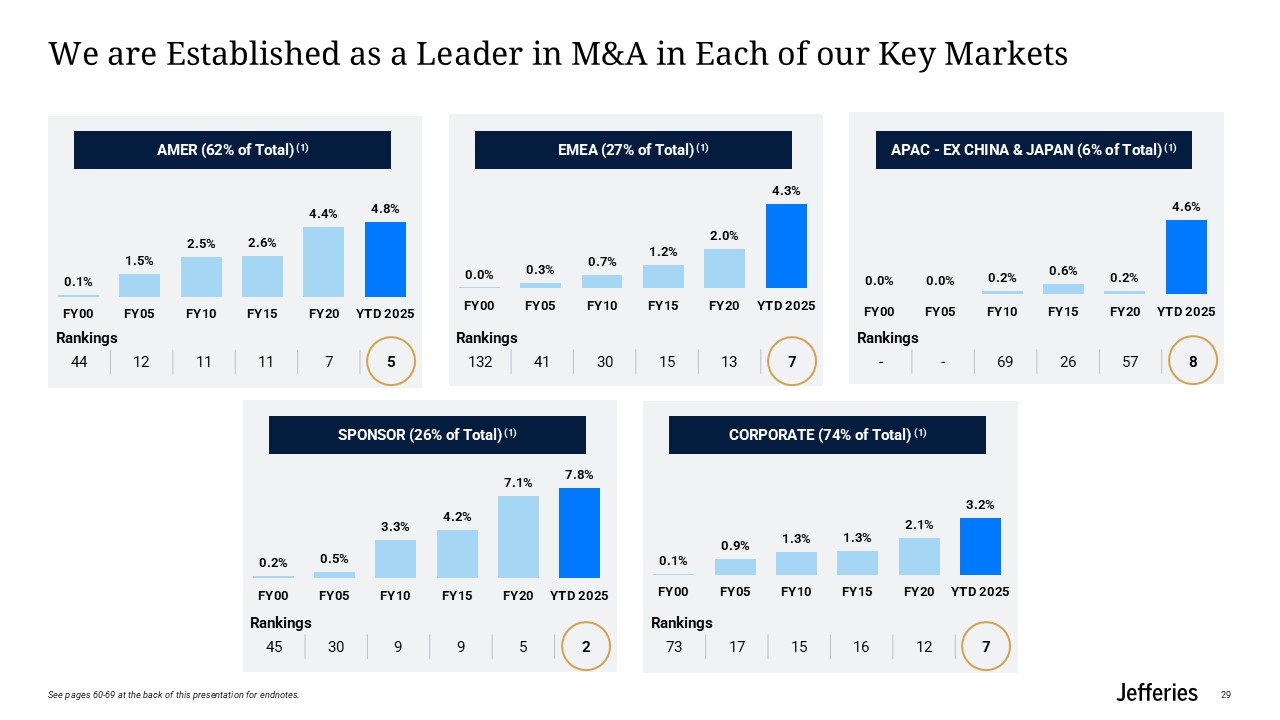
We are Established as a Leader in M&A in Each of our Key Markets 29 AMER
(62% of Total) (1) EMEA (27% of Total) (1) APAC - EX CHINA & JAPAN (6% of Total) (1) SPONSOR (26% of Total) (1) CORPORATE (74% of Total)
(1) Rankings 44 12 11 11 7 5 Rankings 132 41 30 15 13 7 Rankings - - 69 26 57 8 Rankings 45 30 9 9 5 2 Rankings 73 17 15 16 12 7 See pages 60-69 at the back of this presentation for endnotes.
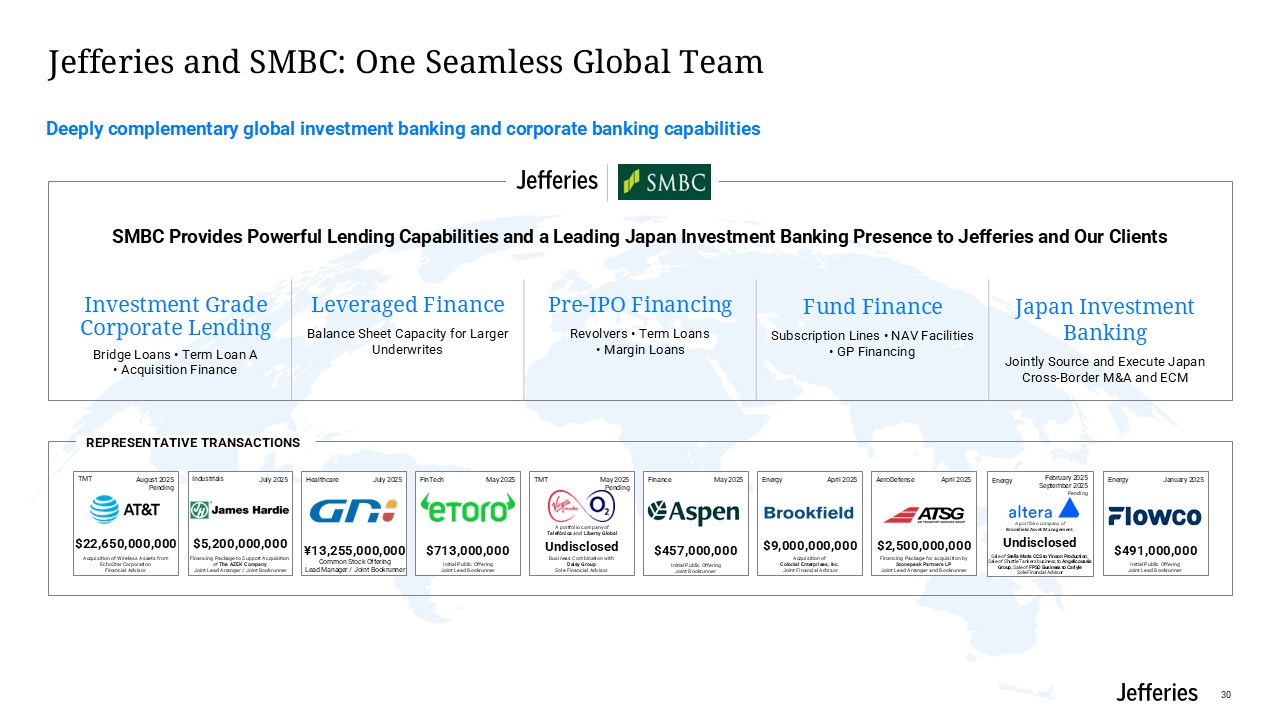
Jefferies and SMBC: One Seamless Global Team 30 Investment Grade Corporate
Lending Bridge Loans • Term Loan A • Acquisition Finance Leveraged Finance Balance Sheet Capacity for Larger Underwrites Pre-IPO Financing Revolvers • Term Loans• Margin Loans Fund Finance Subscription Lines • NAV Facilities• GP
Financing Japan Investment Banking Jointly Source and Execute Japan Cross-Border M&A and ECM SMBC Provides Powerful Lending Capabilities and a Leading Japan Investment Banking Presence to Jefferies and Our Clients Business Combination
with Daisy Group Sole Financial Advisor May 2025 Pending TMT Undisclosed A portfolio company of Telefónica and Liberty Global Initial Public Offering Joint Lead Bookrunner May 2025 FinTech $713,000,000 Initial Public
Offering Joint Lead Bookrunner January 2025 Energy $491,000,000 Sale of Stella Maris CCS to Yinson Production; Sale of Shuttle Tankers business to Angelicoussis Group; Sale of FPSO Business to Carlyle Sole Financial Advisor February
2025 September 2025Pending Energy Undisclosed A portfolio company of Brookfield Asset Management Financing Package for acquisition by Stonepeak Partners LP Joint Lead Arranger and Bookrunner April
2025 AeroDefense $2,500,000,000 Acquisition of Colonial Enterprises, Inc. Joint Financial Advisor April 2025 Energy $9,000,000,000 Representative Transactions Deeply complementary global investment banking and corporate banking
capabilities TMT Acquisition of Wireless Assets from EchoStar Corporation Financial Advisor August 2025 Pending $22,650,000,000 Financing Package to Support Acquisition of The AZEK Company Joint Lead Arranger / Joint
Bookrunner July 2025 Industrials $5,200,000,000 Common Stock Offering Lead Manager / Joint Bookrunner July 2025 Healthcare ¥13,255,000,000 Initial Public Offering Joint Bookrunner May 2025 Finance $457,000,000
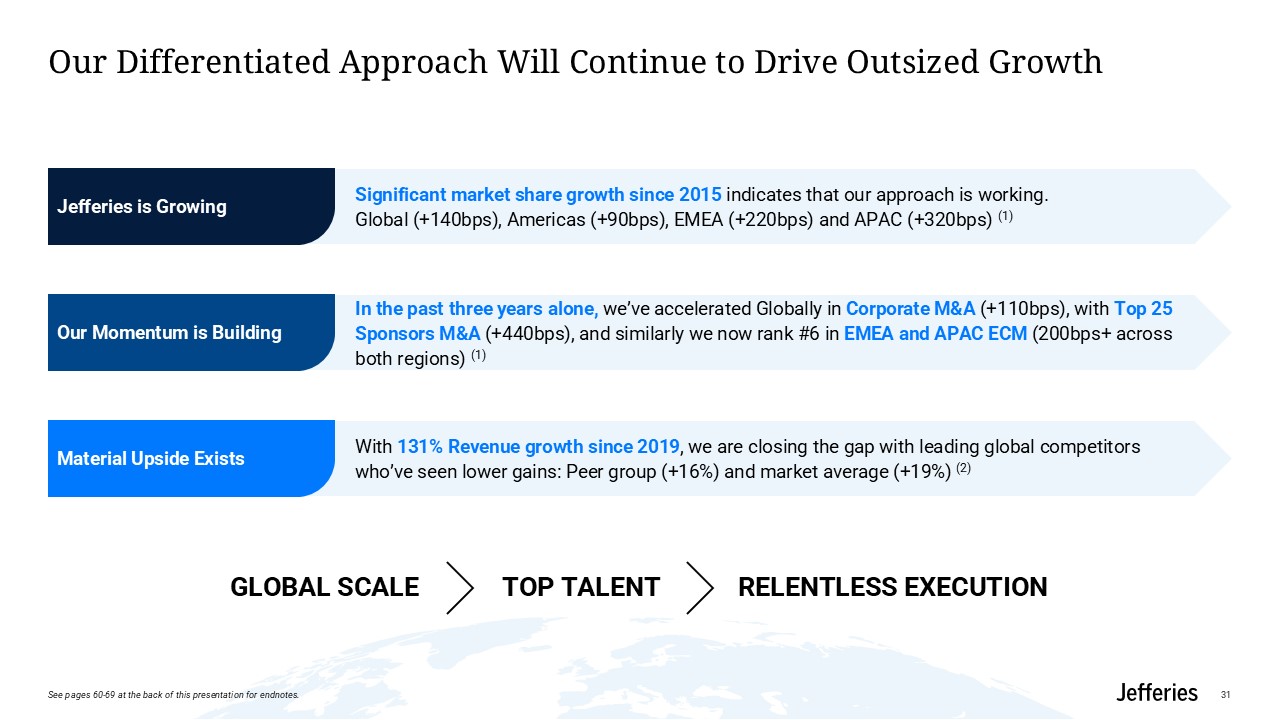
Our Differentiated Approach Will Continue to Drive Outsized Growth With 131%
Revenue growth since 2019, we are closing the gap with leading global competitors who’ve seen lower gains: Peer group (+16%) and market average (+19%) (2) Material Upside Exists In the past three years alone, we’ve accelerated Globally in
Corporate M&A (+110bps), with Top 25 Sponsors M&A (+440bps), and similarly we now rank #6 in EMEA and APAC ECM (200bps+ across both regions) (1) Our Momentum is Building Significant market share growth since 2015 indicates that our
approach is working.Global (+140bps), Americas (+90bps), EMEA (+220bps) and APAC (+320bps) (1) Jefferies is Growing GLOBAL SCALE RELENTLESS EXECUTION TOP TALENT 31 See pages 60-69 at the back of this presentation for endnotes.

Equities Business Review 32
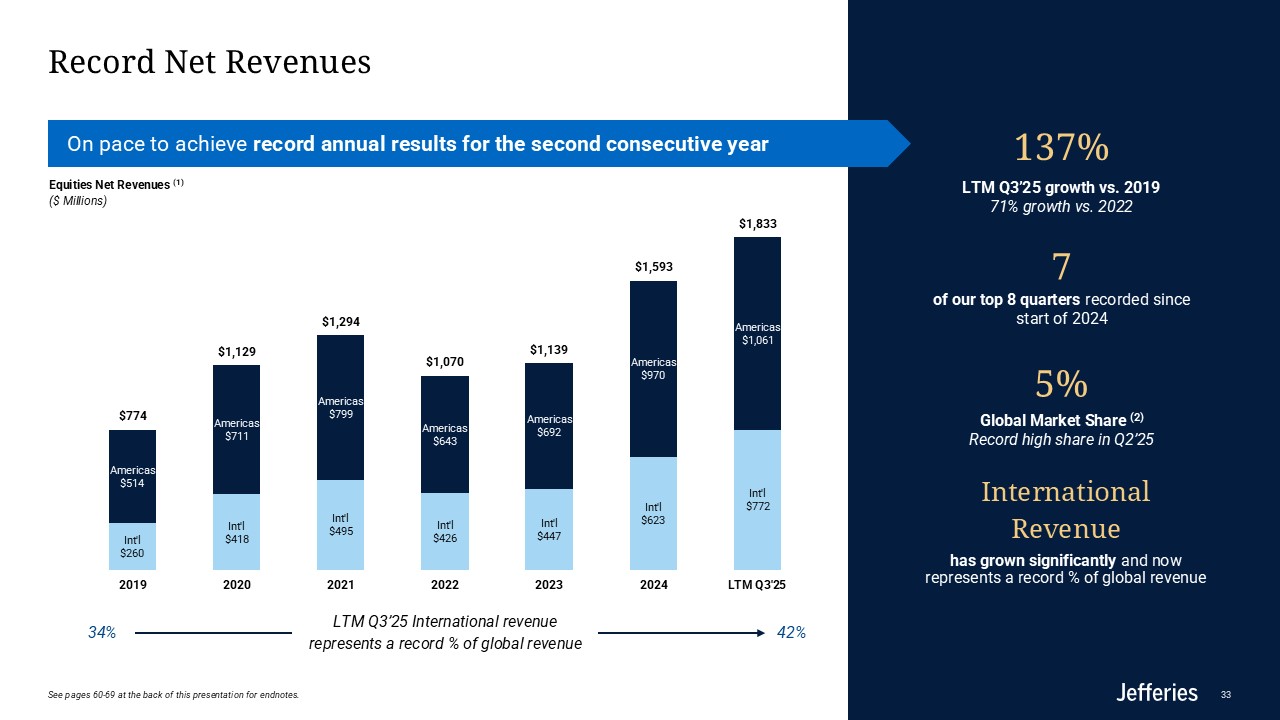
On pace to achieve record annual results for the second consecutive year Record
Net Revenues 33 International Revenue has grown significantly and now represents a record % of global revenue 137% LTM Q3’25 growth vs. 201971% growth vs. 2022 7of our top 8 quarters recorded since start of 2024 5% Global Market
Share (2)Record high share in Q2’25 Equities Net Revenues (1) ($ Millions) 34% 42% LTM Q3’25 International revenue represents a record % of global revenue See pages 60-69 at the back of this presentation for endnotes.
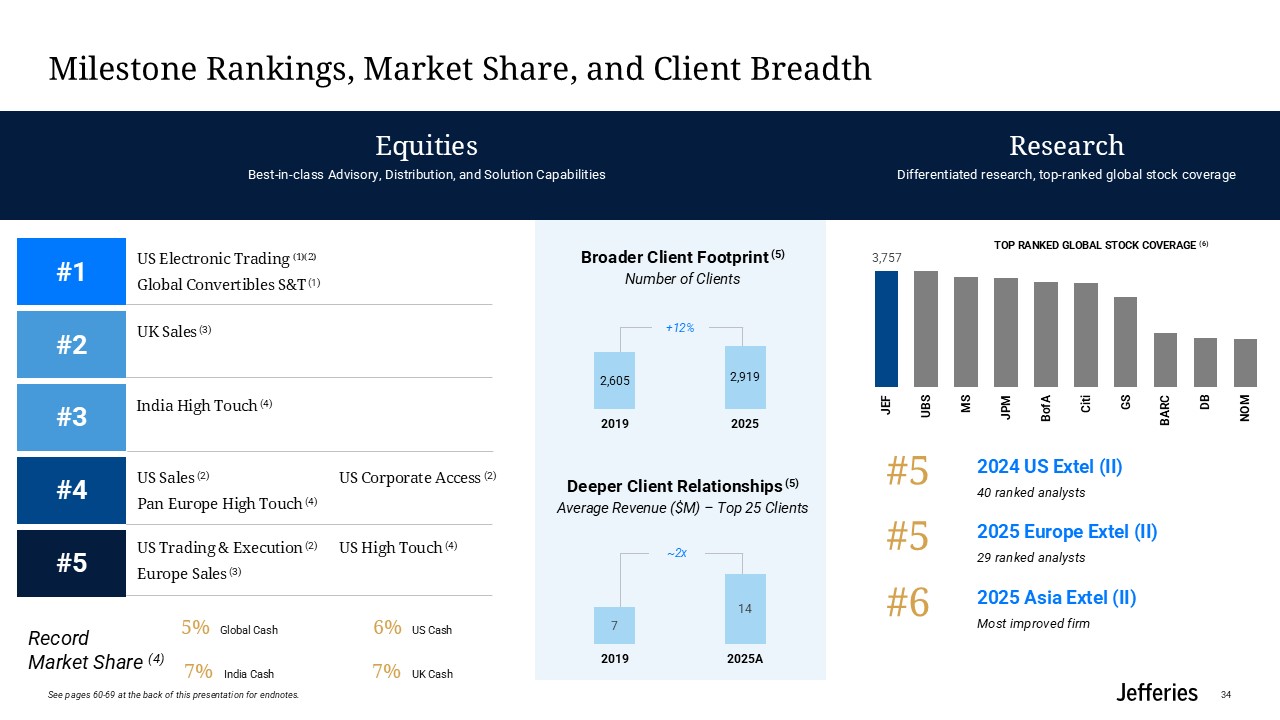
Milestone Rankings, Market Share, and Client
Breadth 34 Equities Best-in-class Advisory, Distribution, and Solution Capabilities Research Differentiated research, top-ranked global stock coverage Top Ranked Global Stock coverage (6) Broader Client Footprint (5) Number of
Clients 6% US Cash 7% UK Cash 7% India Cash 5% Global Cash +12% #4 #5 Record Market Share (4) #2 #1 US Electronic Trading (1)(2) Global Convertibles S&T (1) UK Sales (3) US Sales (2) Pan Europe High Touch (4) US Trading
& Execution (2) Europe Sales (3) US Corporate Access (2) US High Touch (4) #3 India High Touch (4) Deeper Client Relationships (5) Average Revenue ($M) – Top 25 Clients ~2x #5 2024 US Extel (II) 40 ranked analysts #5 2025
Europe Extel (II) 29 ranked analysts #6 2025 Asia Extel (II) Most improved firm See pages 60-69 at the back of this presentation for endnotes.
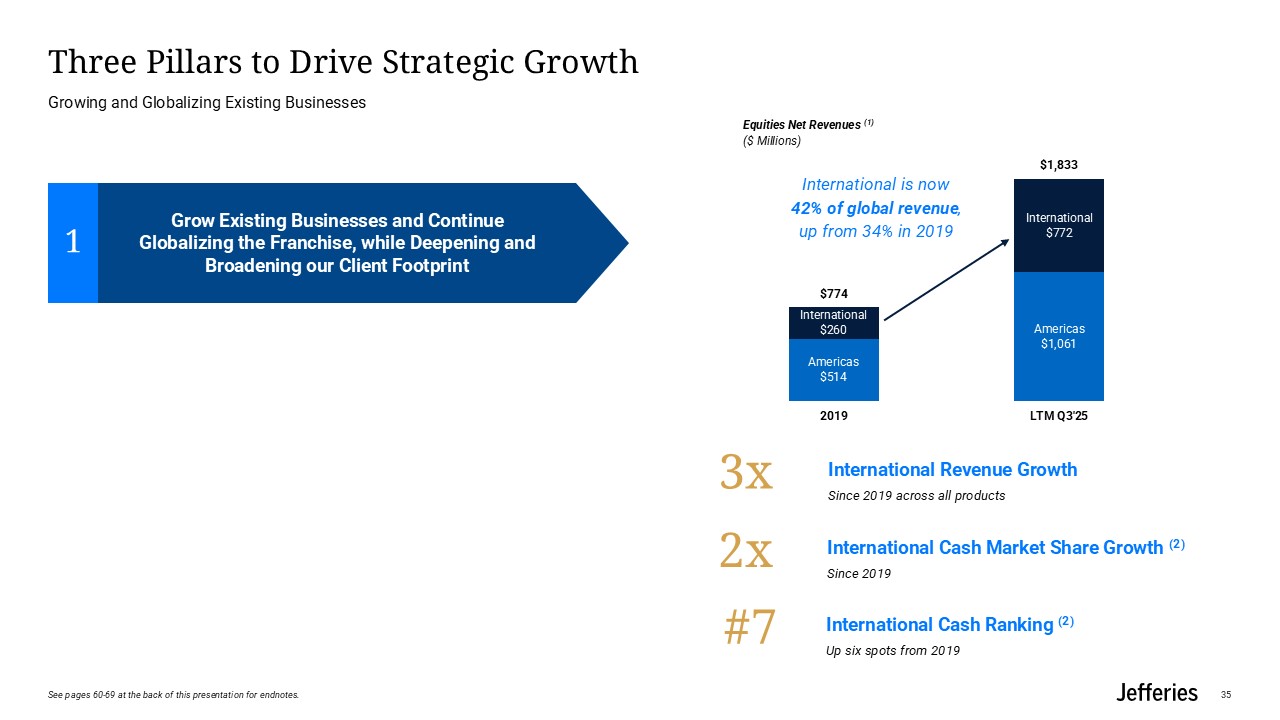
Three Pillars to Drive Strategic Growth Growing and Globalizing Existing
Businesses Grow Existing Businesses and Continue Globalizing the Franchise, while Deepening and Broadening our Client Footprint 1 35 International is now 42% of global revenue, up from 34% in 2019 3x International Revenue
Growth Since 2019 across all products 2x International Cash Market Share Growth (2) Since 2019 #7 International Cash Ranking (2) Up six spots from 2019 Equities Net Revenues (1) ($ Millions) See pages 60-69 at the back of this
presentation for endnotes.
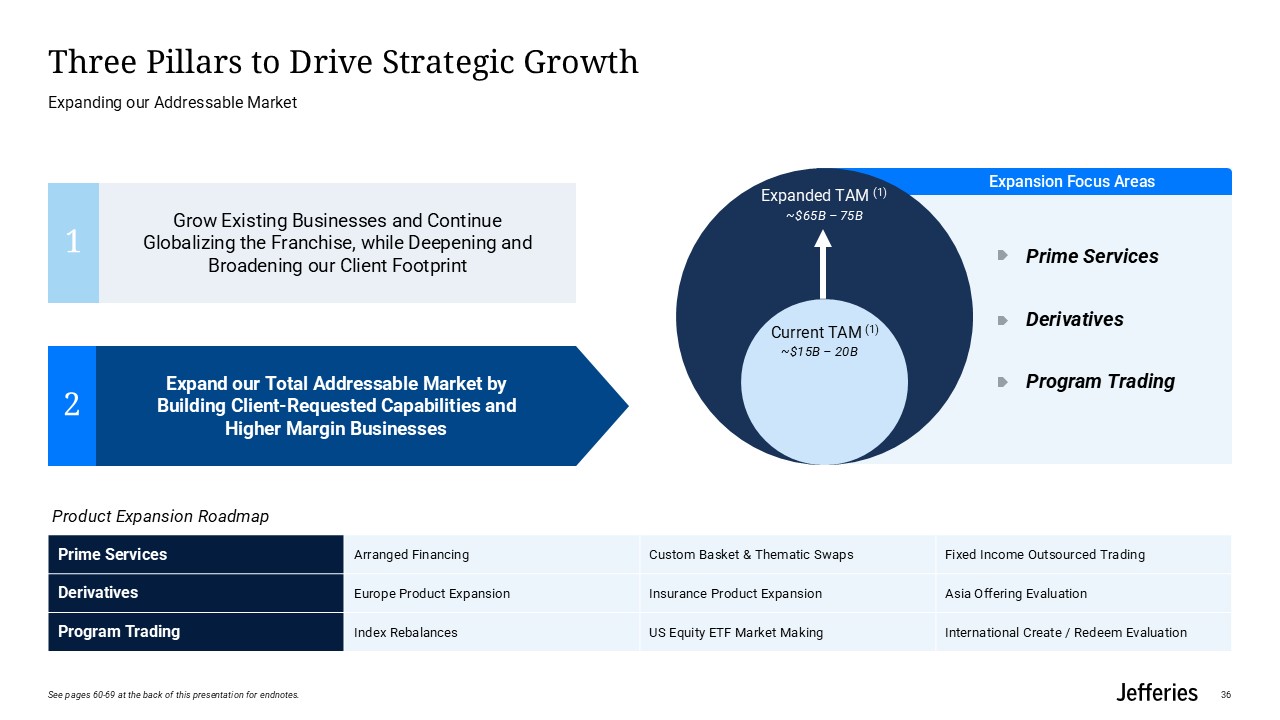
Expansion Focus Areas Expand our Total Addressable Market by Building
Client-Requested Capabilities and Higher Margin Businesses 2 Three Pillars to Drive Strategic Growth Expanding our Addressable Market Grow Existing Businesses and Continue Globalizing the Franchise, while Deepening and Broadening our
Client Footprint 1 Current TAM (1) ~$15B – 20B ~$65B – 75B Expanded TAM (1) 36 Prime Services Arranged Financing Custom Basket & Thematic Swaps Fixed Income Outsourced Trading Derivatives Europe Product Expansion Insurance
Product Expansion Asia Offering Evaluation Program Trading Index Rebalances US Equity ETF Market Making International Create / Redeem Evaluation Product Expansion Roadmap Prime Services Derivatives Program Trading See pages 60-69 at
the back of this presentation for endnotes.
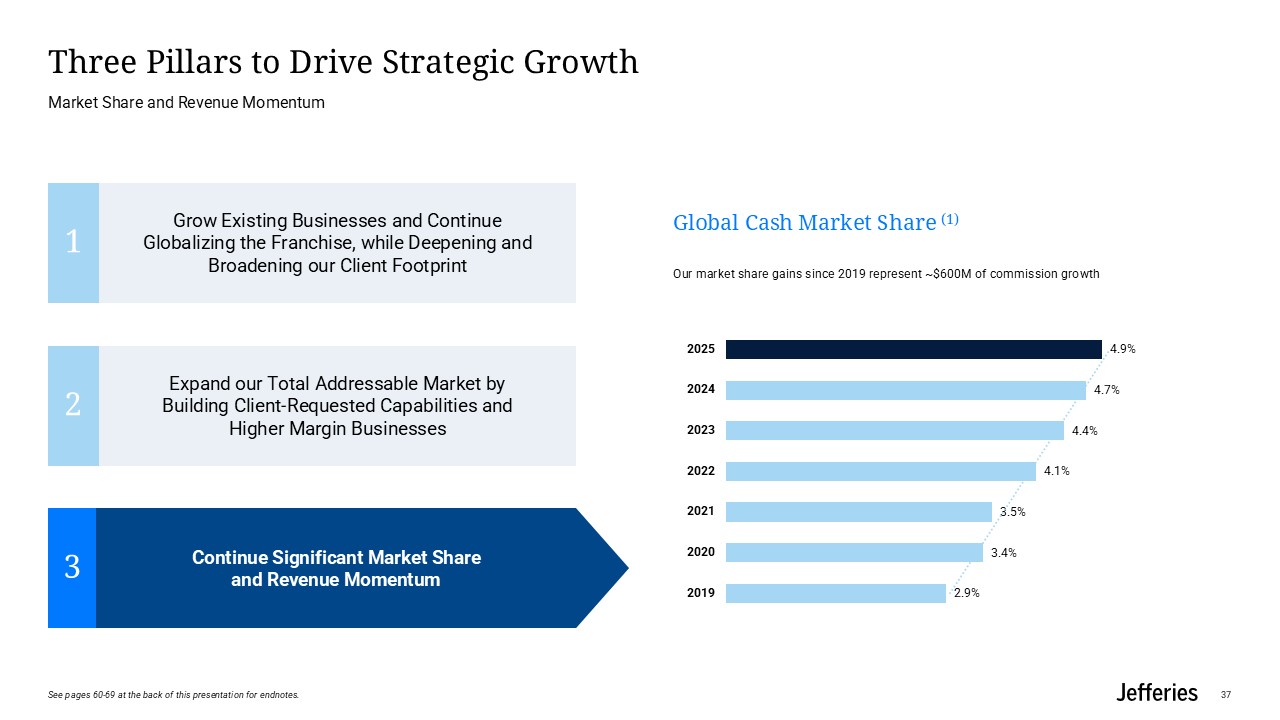
Three Pillars to Drive Strategic Growth Market Share and Revenue
Momentum Continue Significant Market Share and Revenue Momentum 3 Grow Existing Businesses and Continue Globalizing the Franchise, while Deepening and Broadening our Client Footprint 1 Expand our Total Addressable Market by Building
Client-Requested Capabilities and Higher Margin Businesses 2 Global Cash Market Share (1) Our market share gains since 2019 represent ~$600M of commission growth 37 See pages 60-69 at the back of this presentation for endnotes.
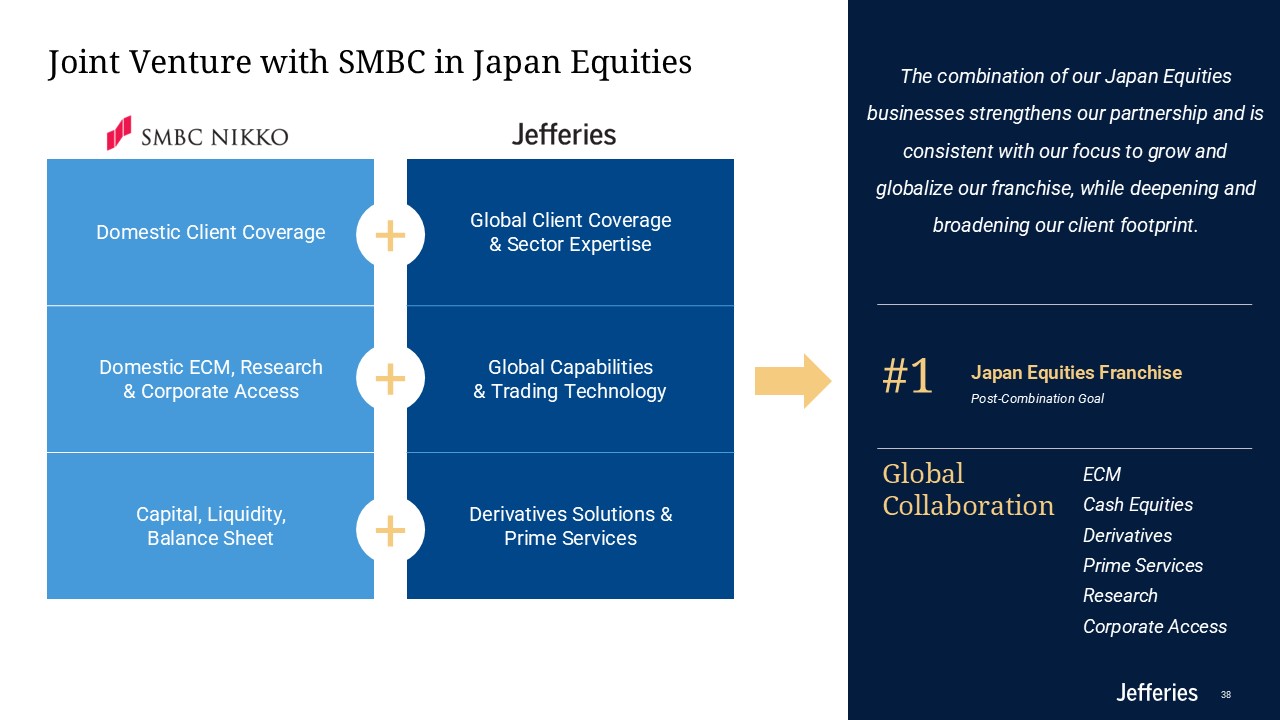
Global Collaboration ECM Cash Equities Derivatives Prime
Services Research Corporate Access Domestic Client Coverage Domestic ECM, Research & Corporate Access Capital, Liquidity, Balance Sheet Global Client Coverage & Sector Expertise Global Capabilities & Trading
Technology Derivatives Solutions & Prime Services Joint Venture with SMBC in Japan Equities 38 #1 Japan Equities Franchise Post-Combination Goal 38 The combination of our Japan Equities businesses strengthens our partnership and
is consistent with our focus to grow and globalize our franchise, while deepening and broadening our client footprint. + + +

Fixed Income Business Review 39
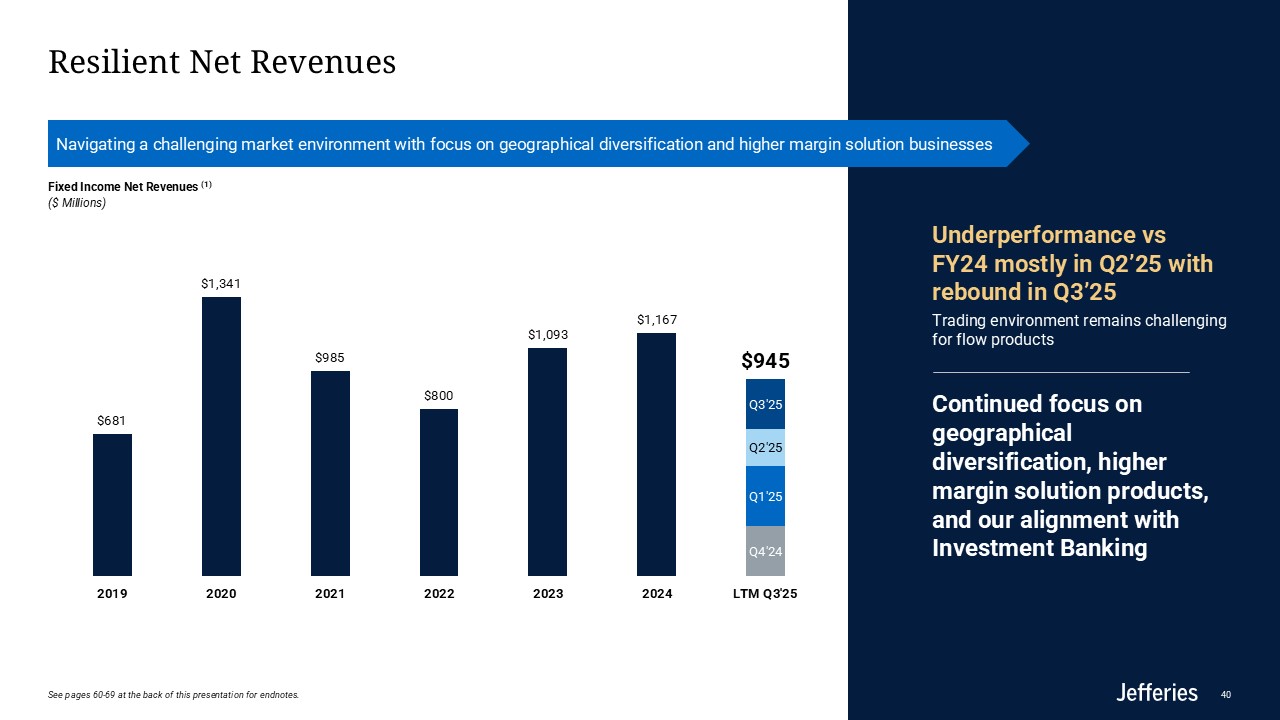
Resilient Net Revenues 40 Underperformance vs FY24 mostly in Q2’25 with
rebound in Q3’25 Trading environment remains challenging for flow products Continued focus on geographical diversification, higher margin solution products, and our alignment with Investment Banking Fixed Income Net Revenues (1) ($
Millions) Navigating a challenging market environment with focus on geographical diversification and higher margin solution businesses See pages 60-69 at the back of this presentation for endnotes.
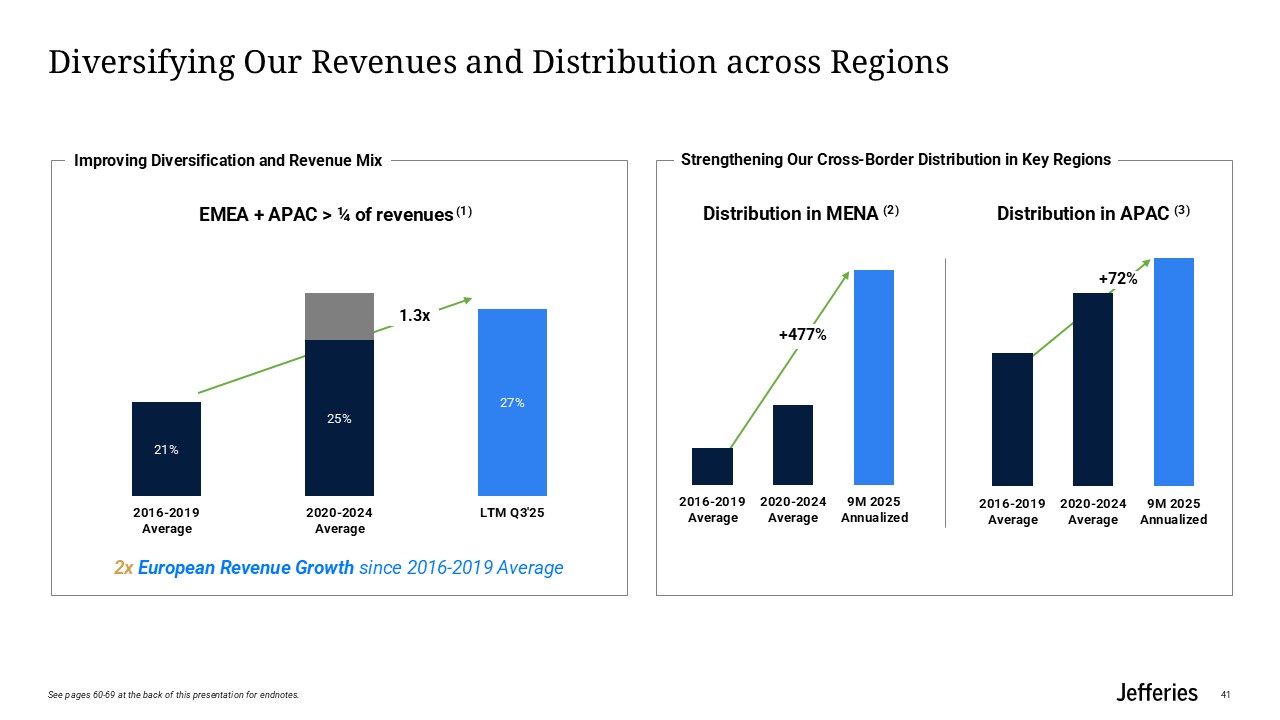
EMEA + APAC > ¼ of revenues (1) Diversifying Our Revenues and Distribution
across Regions 41 Distribution in MENA (2) Distribution in APAC (3) Improving Diversification and Revenue Mix Strengthening Our Cross-Border Distribution in Key Regions +72% 1.3x +477% 2x European Revenue Growth since 2016-2019
Average See pages 60-69 at the back of this presentation for endnotes.
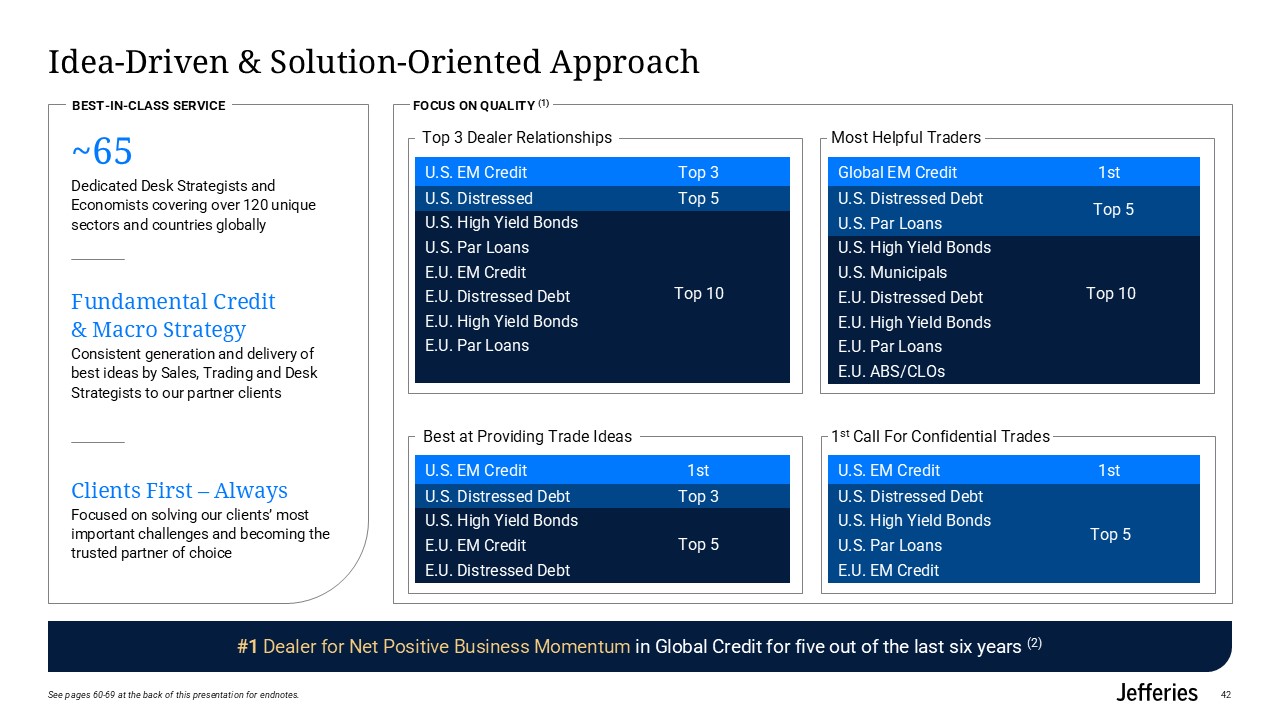
Idea-Driven & Solution-Oriented Approach 42 BEST-IN-CLASS
SERVICE ~65 Dedicated Desk Strategists and Economists covering over 120 unique sectors and countries globally Fundamental Credit & Macro Strategy Consistent generation and delivery of best ideas by Sales, Trading and Desk Strategists
to our partner clients Clients First – Always Focused on solving our clients’ most important challenges and becoming the trusted partner of choice FOCUS ON QUALITY (1) U.S. EM Credit Top 3 U.S. Distressed Top 5 U.S. High Yield
Bonds U.S. Par Loans E.U. EM Credit E.U. Distressed Debt E.U. High Yield Bonds E.U. Par Loans Top 10 Top 3 Dealer Relationships Global EM Credit 1st U.S. Distressed Debt U.S. Par Loans U.S. High Yield Bonds U.S. Municipals E.U.
Distressed Debt E.U. High Yield Bonds E.U. Par Loans E.U. ABS/CLOs Top 10 Most Helpful Traders Top 5 U.S. EM Credit 1st U.S. Distressed Debt Top 3 U.S. High Yield Bonds E.U. EM Credit E.U. Distressed Debt Top 5 Best at
Providing Trade Ideas U.S. EM Credit 1st U.S. Distressed Debt U.S. High Yield Bonds U.S. Par Loans E.U. EM Credit 1st Call For Confidential Trades Top 5 #1 Dealer for Net Positive Business Momentum in Global Credit for five out of
the last six years (2) See pages 60-69 at the back of this presentation for endnotes.
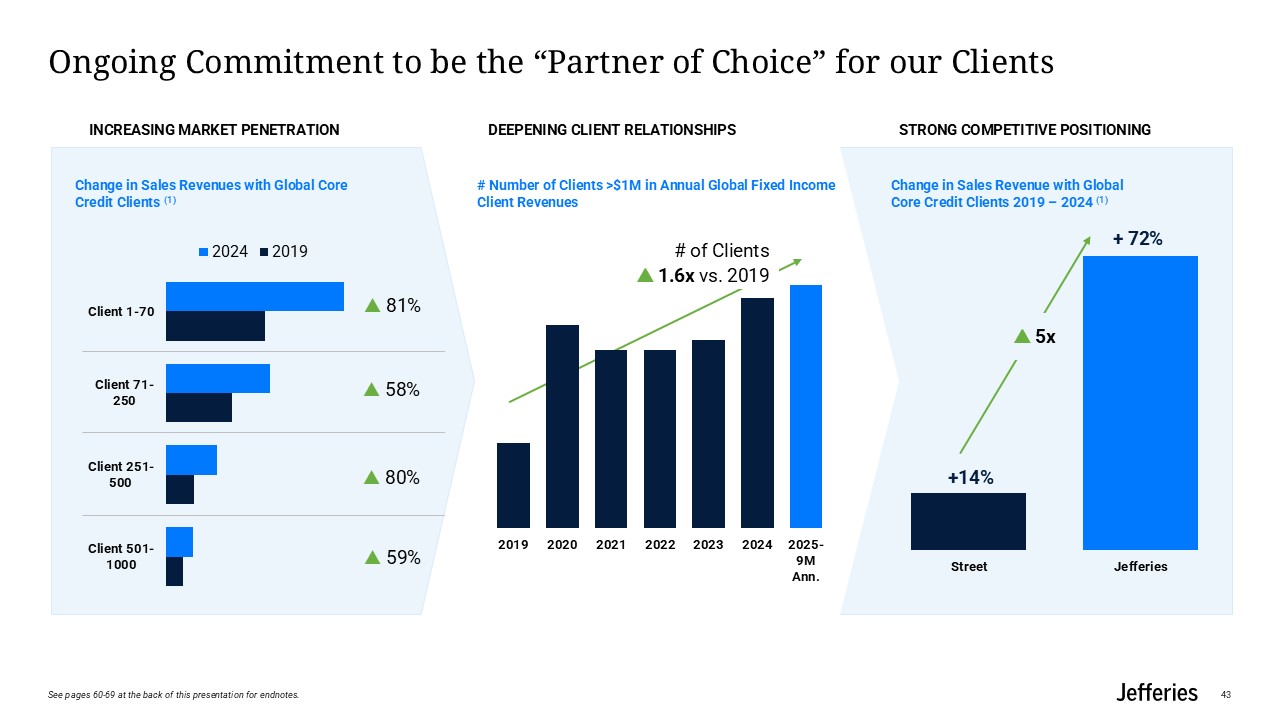
43 STRONG COMPETITIVE POSITIONING Ongoing Commitment to be the “Partner of
Choice” for our Clients Change in Sales Revenue with Global Core Credit Clients 2019 – 2024 (1) Change in Sales Revenues with Global Core Credit Clients (1) 81% 58% 80% 59% # Number of Clients >$1M in Annual Global Fixed
Income Client Revenues # of Clients 1.6x vs. 2019 INCREASING MARKET PENETRATION DEEPENING CLIENT RELATIONSHIPS +14% + 72% 5x See pages 60-69 at the back of this presentation for endnotes.
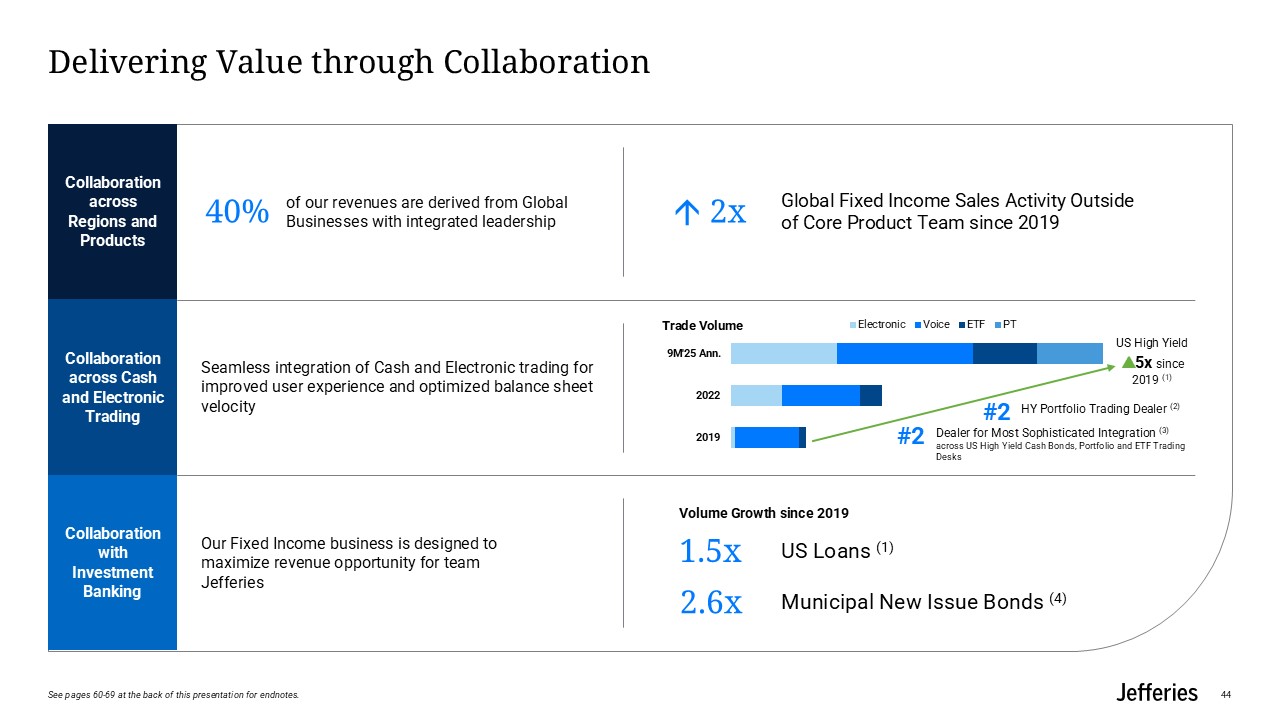
Delivering Value through Collaboration 44 of our revenues are derived from
Global Businesses with integrated leadership Collaboration across Regions and Products Seamless integration of Cash and Electronic trading for improved user experience and optimized balance sheet velocity Our Fixed Income business is
designed to maximize revenue opportunity for team Jefferies Global Fixed Income Sales Activity Outside of Core Product Team since 2019 2x Collaboration across Cash and Electronic Trading Collaboration with Investment Banking US High
Yield 5x since 2019 (1) HY Portfolio Trading Dealer (2) #2 1.5x Volume Growth since 2019 US Loans (1) 2.6x Municipal New Issue Bonds (4) Dealer for Most Sophisticated Integration (3) across US High Yield Cash Bonds, Portfolio
and ETF Trading Desks #2 40% See pages 60-69 at the back of this presentation for endnotes.
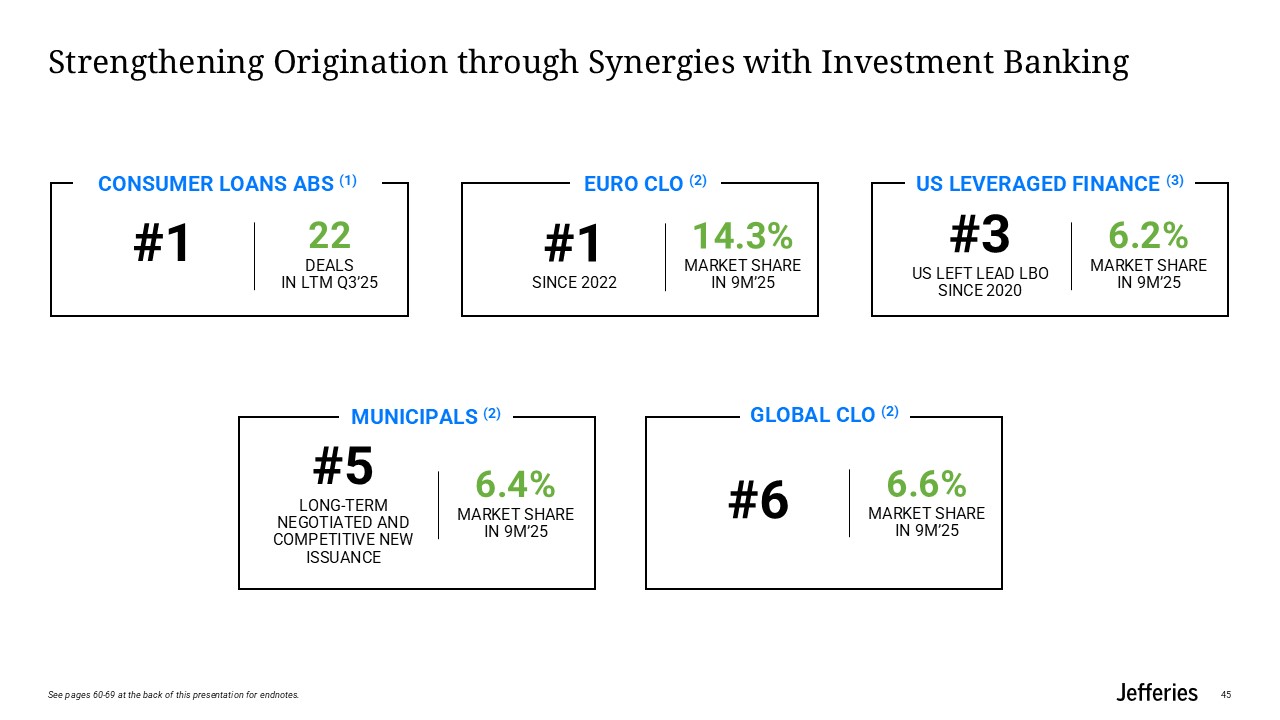
Strengthening Origination through Synergies with Investment
Banking 45 CONSUMER LOANS ABS (1) EURO CLO (2) US LEVERAGED FINANCE (3) #1 22deals In ltm q3’25 #1since 2022 14.3%market share in 9M’25 #3US LEFT LEAD LBO SINCE 2020 6.2%market share in 9M’25 MUNICIPALS (2) #5Long-term
negotiated and competitive new issuance 6.4%market share in 9M’25 GLOBAL CLO (2) #6 6.6%market share in 9M’25 See pages 60-69 at the back of this presentation for endnotes.
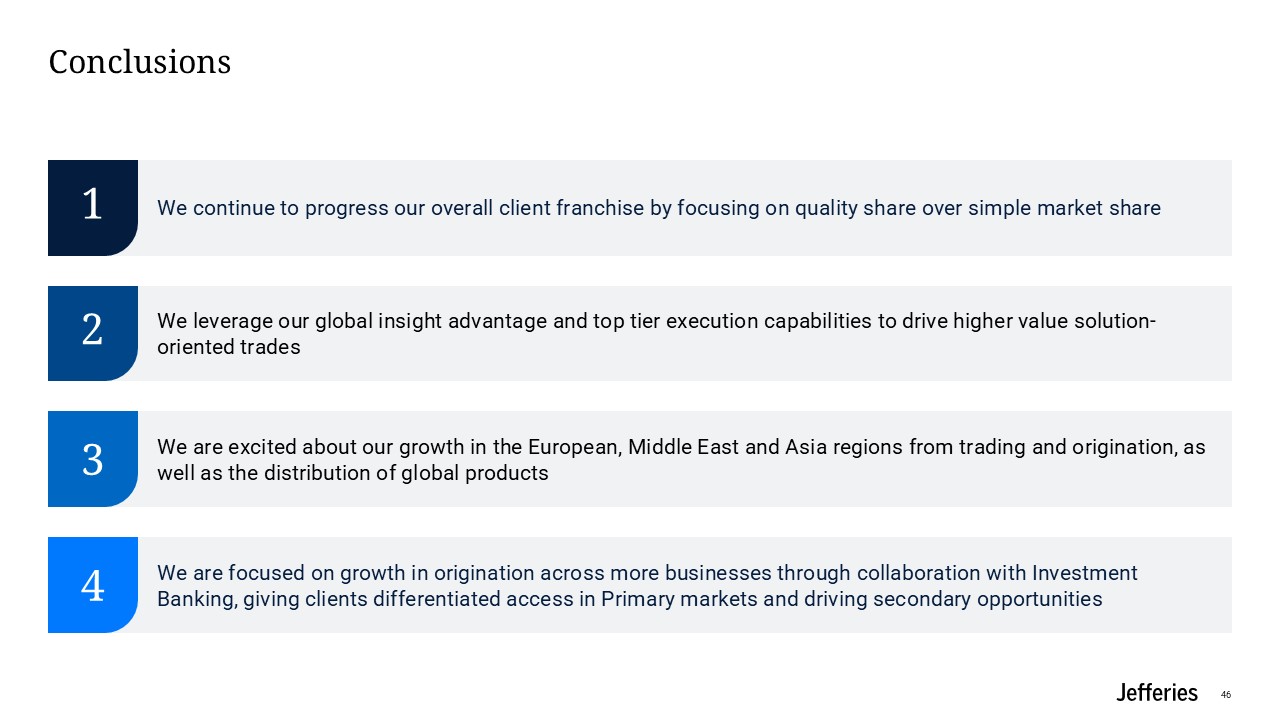
Conclusions 46 We continue to progress our overall client franchise by
focusing on quality share over simple market share 1 We leverage our global insight advantage and top tier execution capabilities to drive higher value solution-oriented trades 2 We are excited about our growth in the European, Middle
East and Asia regions from trading and origination, as well as the distribution of global products 3 We are focused on growth in origination across more businesses through collaboration with Investment Banking, giving clients differentiated
access in Primary markets and driving secondary opportunities 4

Asset Management Business Review 47
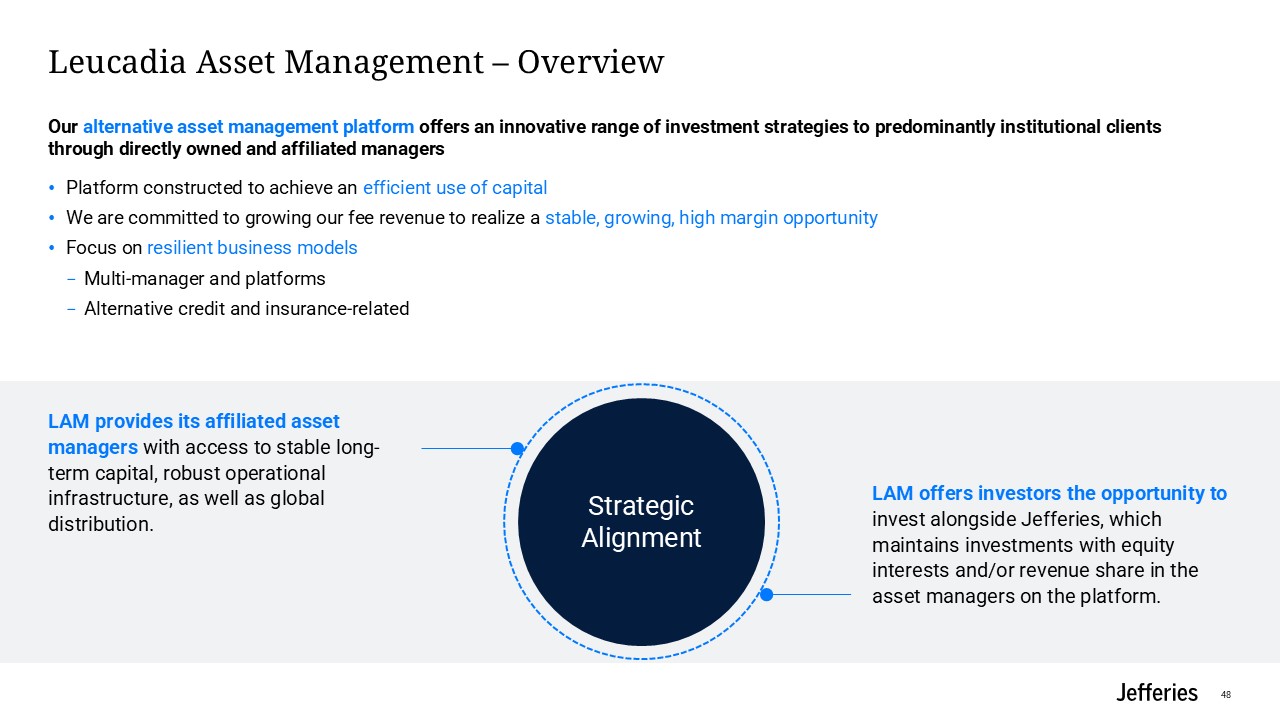
Leucadia Asset Management – Overview LAM provides its affiliated asset managers
with access to stable long-term capital, robust operational infrastructure, as well as global distribution. LAM offers investors the opportunity to invest alongside Jefferies, which maintains investments with equity interests and/or revenue
share in the asset managers on the platform. Strategic Alignment Our alternative asset management platform offers an innovative range of investment strategies to predominantly institutional clients through directly owned and affiliated
managers Platform constructed to achieve an efficient use of capital We are committed to growing our fee revenue to realize a stable, growing, high margin opportunity Focus on resilient business models Multi-manager and
platforms Alternative credit and insurance-related 48
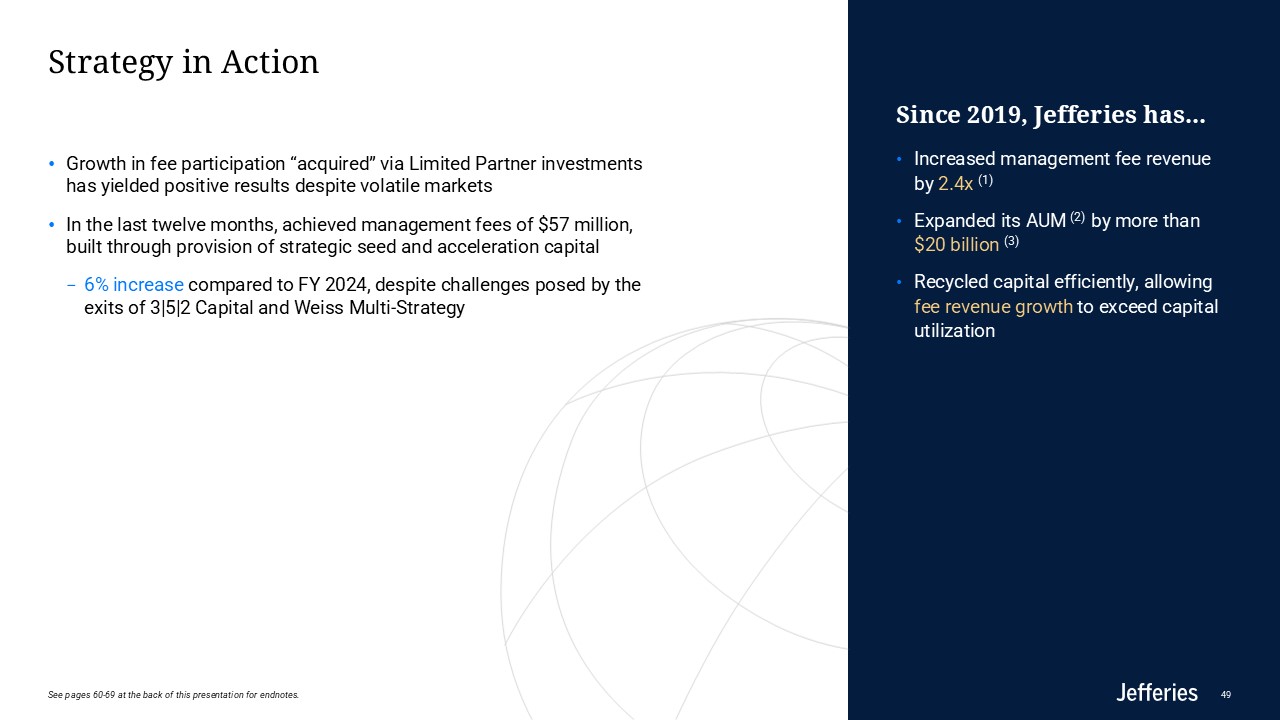
Strategy in Action Growth in fee participation “acquired” via Limited Partner
investments has yielded positive results despite volatile markets In the last twelve months, achieved management fees of $57 million, built through provision of strategic seed and acceleration capital 6% increase compared to FY 2024,
despite challenges posed by the exits of 3|5|2 Capital and Weiss Multi-Strategy Increased management fee revenue by 2.4x (1) Expanded its AUM (2) by more than $20 billion (3) Recycled capital efficiently, allowing fee revenue growth to
exceed capital utilization Since 2019, Jefferies has... 49 See pages 60-69 at the back of this presentation for endnotes.
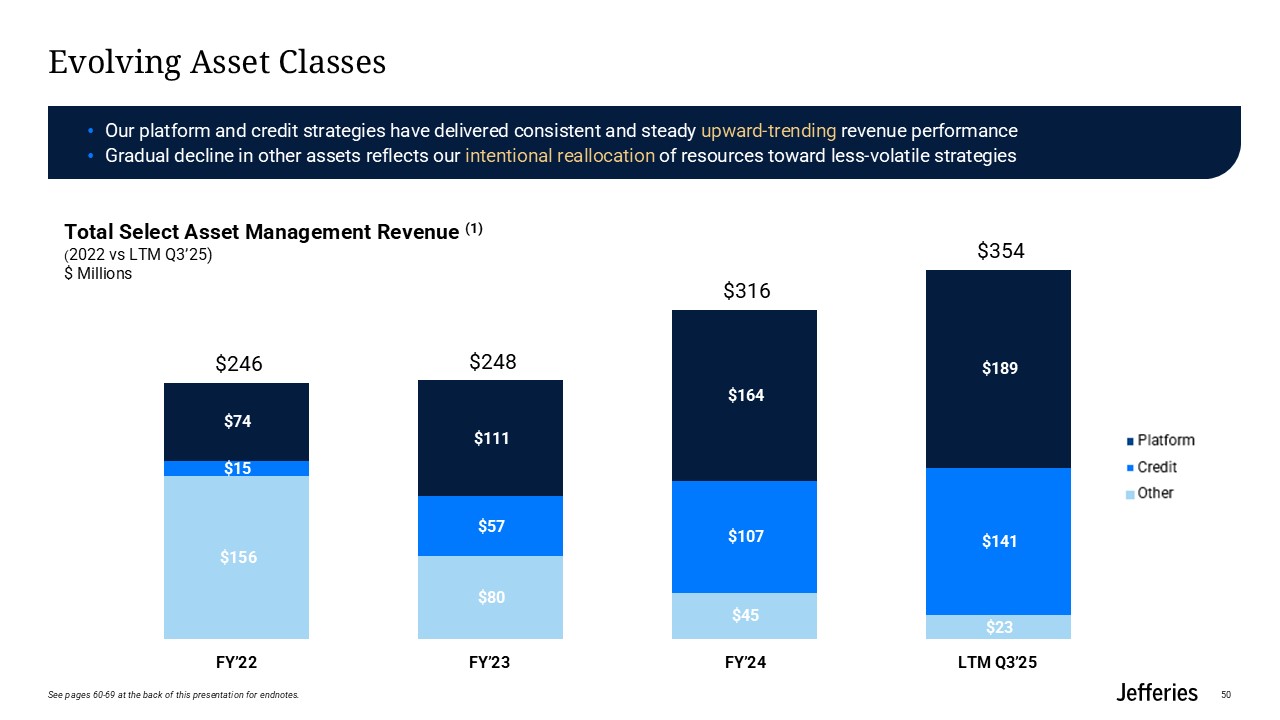
Evolving Asset Classes Total Select Asset Management Revenue (1) (2022 vs LTM
Q3’25) $ Millions 50 FY’22 FY’23 FY’24 LTM Q3’25 Our platform and credit strategies have delivered consistent and steady upward-trending revenue performance Gradual decline in other assets reflects our intentional reallocation of
resources toward less-volatile strategies See pages 60-69 at the back of this presentation for endnotes.
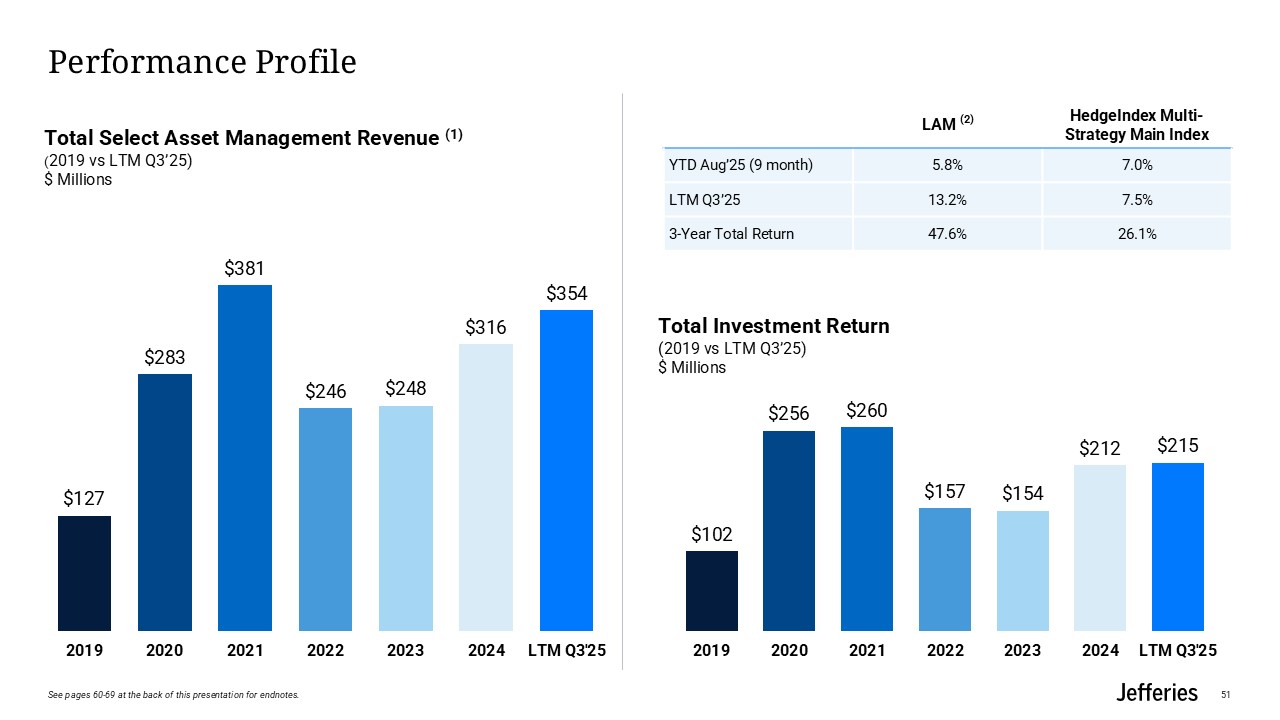
Total Investment Return (2019 vs LTM Q3’25) $ Millions Performance
Profile Total Select Asset Management Revenue (1) (2019 vs LTM Q3’25) $ Millions 51 LAM (2) HedgeIndex Multi-Strategy Main Index YTD Aug’25 (9 month) 5.8% 7.0% LTM Q3’25 13.2% 7.5% 3-Year Total Return 47.6% 26.1% See pages
60-69 at the back of this presentation for endnotes.
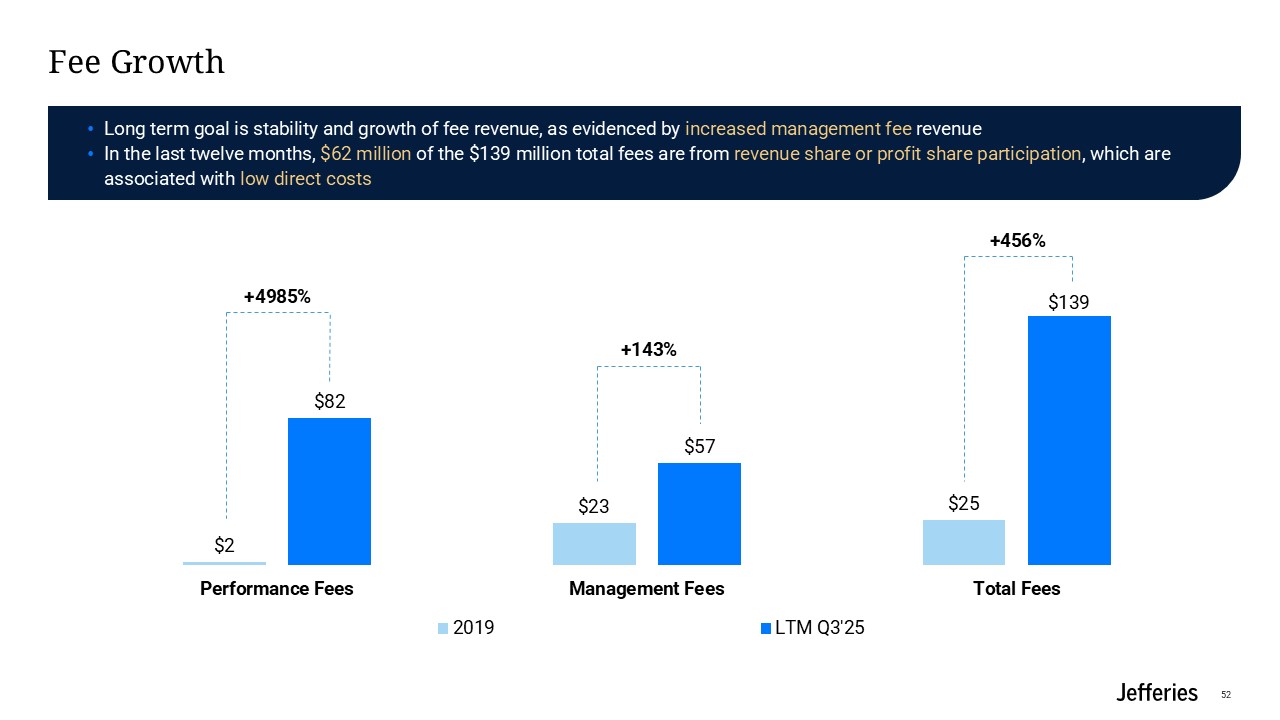
Fee Growth +4985% +143% +456% 52 Long term goal is stability and growth of
fee revenue, as evidenced by increased management fee revenue In the last twelve months, $62 million of the $139 million total fees are from revenue share or profit share participation, which are associated with low direct costs
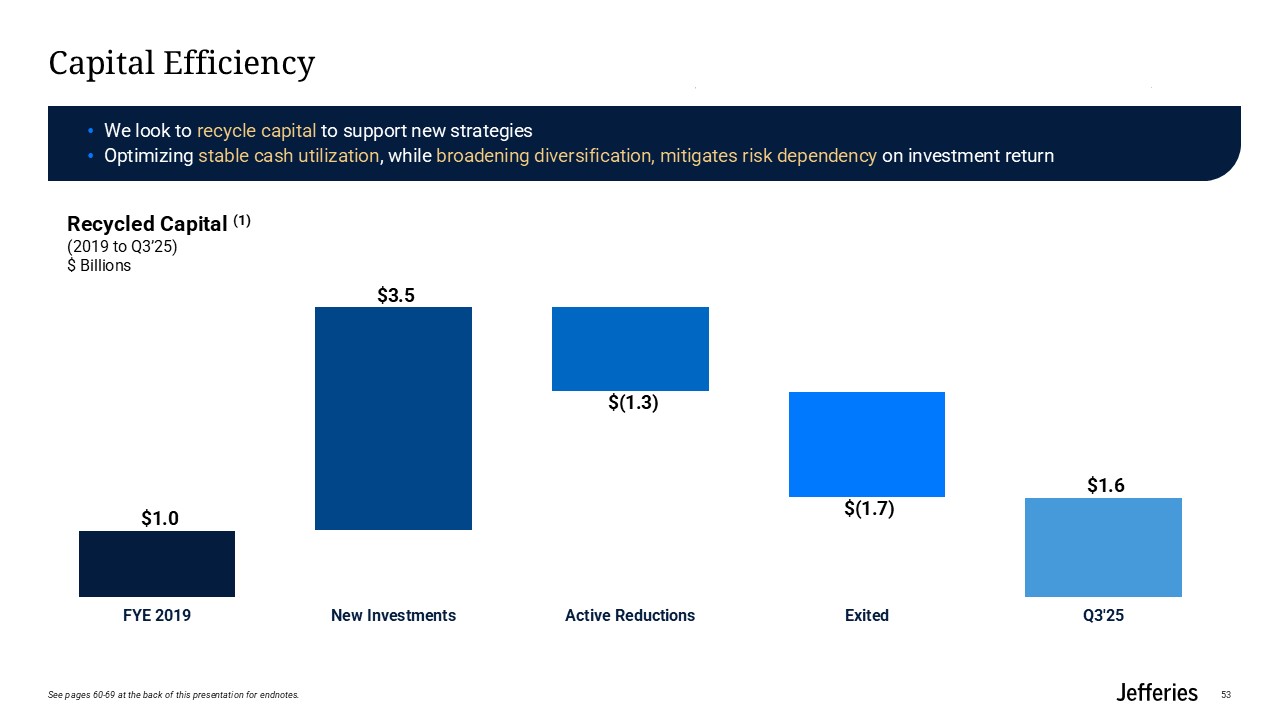
Capital Efficiency Recycled Capital (1) (2019 to Q3’25) $ Billions 53 We
look to recycle capital to support new strategies Optimizing stable cash utilization, while broadening diversification, mitigates risk dependency on investment return See pages 60-69 at the back of this presentation for endnotes.
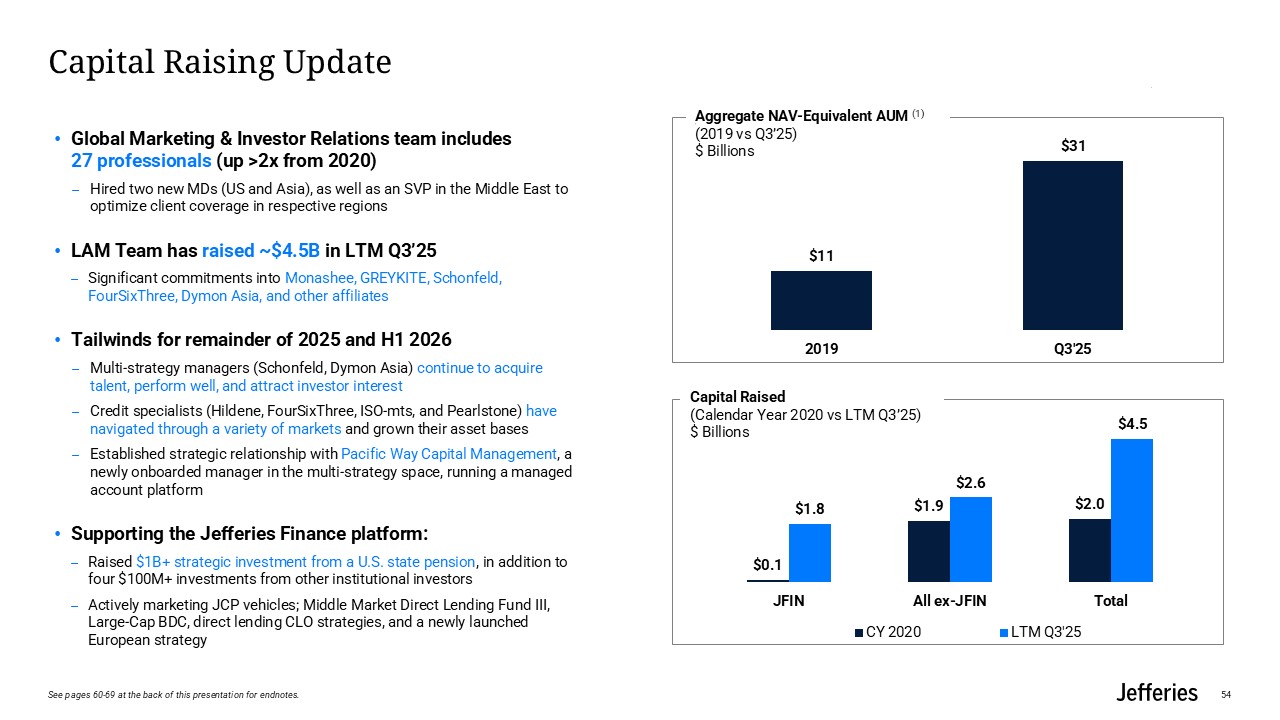
Capital Raising Update 54 Aggregate NAV-Equivalent AUM (1) (2019 vs Q3’25) $
Billions Capital Raised (Calendar Year 2020 vs LTM Q3’25) $ Billions Global Marketing & Investor Relations team includes 27 professionals (up >2x from 2020) Hired two new MDs (US and Asia), as well as an SVP in the Middle East to
optimize client coverage in respective regions LAM Team has raised ~$4.5B in LTM Q3’25 Significant commitments into Monashee, GREYKITE, Schonfeld, FourSixThree, Dymon Asia, and other affiliates Tailwinds for remainder of 2025 and H1
2026 Multi-strategy managers (Schonfeld, Dymon Asia) continue to acquire talent, perform well, and attract investor interest Credit specialists (Hildene, FourSixThree, ISO-mts, and Pearlstone) have navigated through a variety of markets and
grown their asset bases Established strategic relationship with Pacific Way Capital Management, a newly onboarded manager in the multi-strategy space, running a managed account platform Supporting the Jefferies Finance platform: Raised
$1B+ strategic investment from a U.S. state pension, in addition to four $100M+ investments from other institutional investors Actively marketing JCP vehicles; Middle Market Direct Lending Fund III, Large-Cap BDC, direct lending CLO
strategies, and a newly launched European strategy See pages 60-69 at the back of this presentation for endnotes.
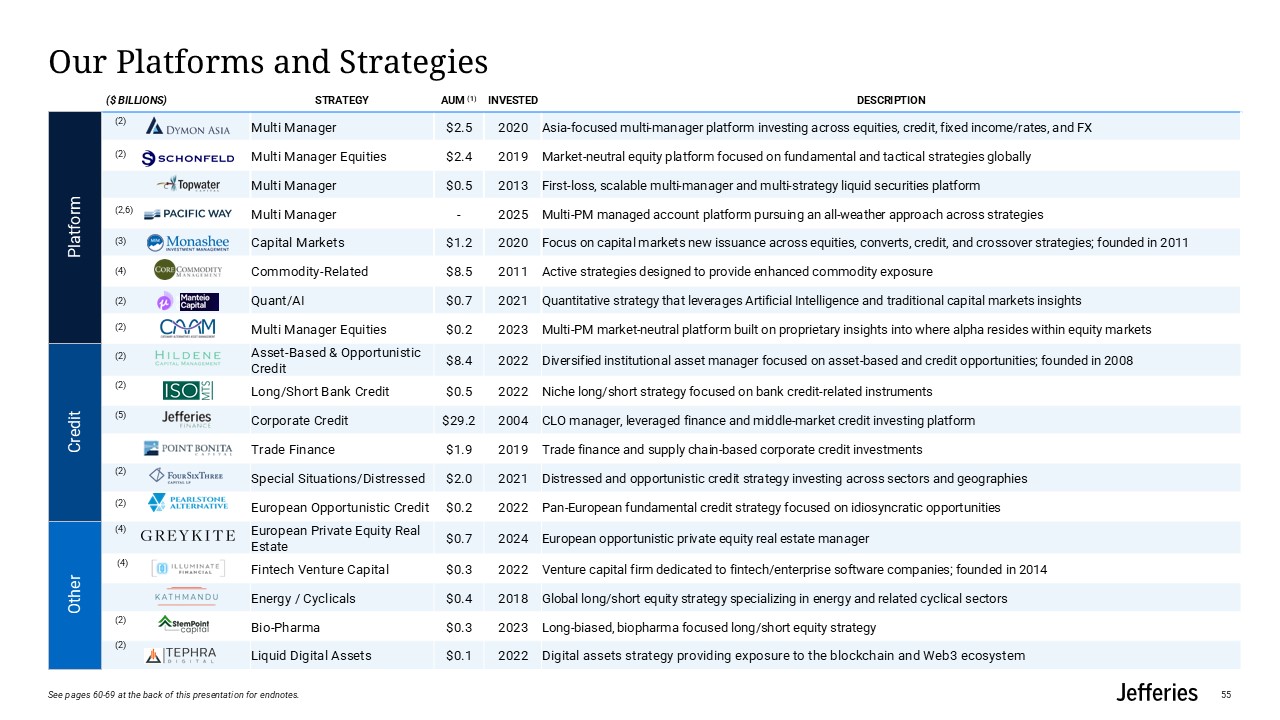
Our Platforms and Strategies ($ Billions) Strategy AUM
(1) Invested Description Multi Manager $2.5 2020 Asia-focused multi-manager platform investing across equities, credit, fixed income/rates, and FX Multi Manager Equities $2.4 2019 Market-neutral equity platform focused on
fundamental and tactical strategies globally Multi Manager $0.5 2013 First-loss, scalable multi-manager and multi-strategy liquid securities platform Multi Manager - 2025 Multi-PM managed account platform pursuing an all-weather
approach across strategies Capital Markets $1.2 2020 Focus on capital markets new issuance across equities, converts, credit, and crossover strategies; founded in 2011 Commodity-Related $8.5 2011 Active strategies designed to provide
enhanced commodity exposure Quant/AI $0.7 2021 Quantitative strategy that leverages Artificial Intelligence and traditional capital markets insights Multi Manager Equities $0.2 2023 Multi-PM market-neutral platform built on
proprietary insights into where alpha resides within equity markets Asset-Based & Opportunistic Credit $8.4 2022 Diversified institutional asset manager focused on asset-based and credit opportunities; founded in 2008 Long/Short Bank
Credit $0.5 2022 Niche long/short strategy focused on bank credit-related instruments Corporate Credit $29.2 2004 CLO manager, leveraged finance and middle-market credit investing platform Trade Finance $1.9 2019 Trade finance and
supply chain-based corporate credit investments Special Situations/Distressed $2.0 2021 Distressed and opportunistic credit strategy investing across sectors and geographies European Opportunistic Credit $0.2 2022 Pan-European
fundamental credit strategy focused on idiosyncratic opportunities European Private Equity Real Estate $0.7 2024 European opportunistic private equity real estate manager Fintech Venture Capital $0.3 2022 Venture capital firm
dedicated to fintech/enterprise software companies; founded in 2014 Energy / Cyclicals $0.4 2018 Global long/short equity strategy specializing in energy and related cyclical sectors Bio-Pharma $0.3 2023 Long-biased, biopharma focused
long/short equity strategy Liquid Digital Assets $0.1 2022 Digital assets strategy providing exposure to the blockchain and Web3
ecosystem Platform Credit Other (2) (2) (2,6) (3) (4) (2) (2) (2) (2) (5) (2) (4) (4) (2) (2) (2) 55 See pages 60-69 at the back of this presentation for endnotes.

Appendix AData Related to Slide 7 56
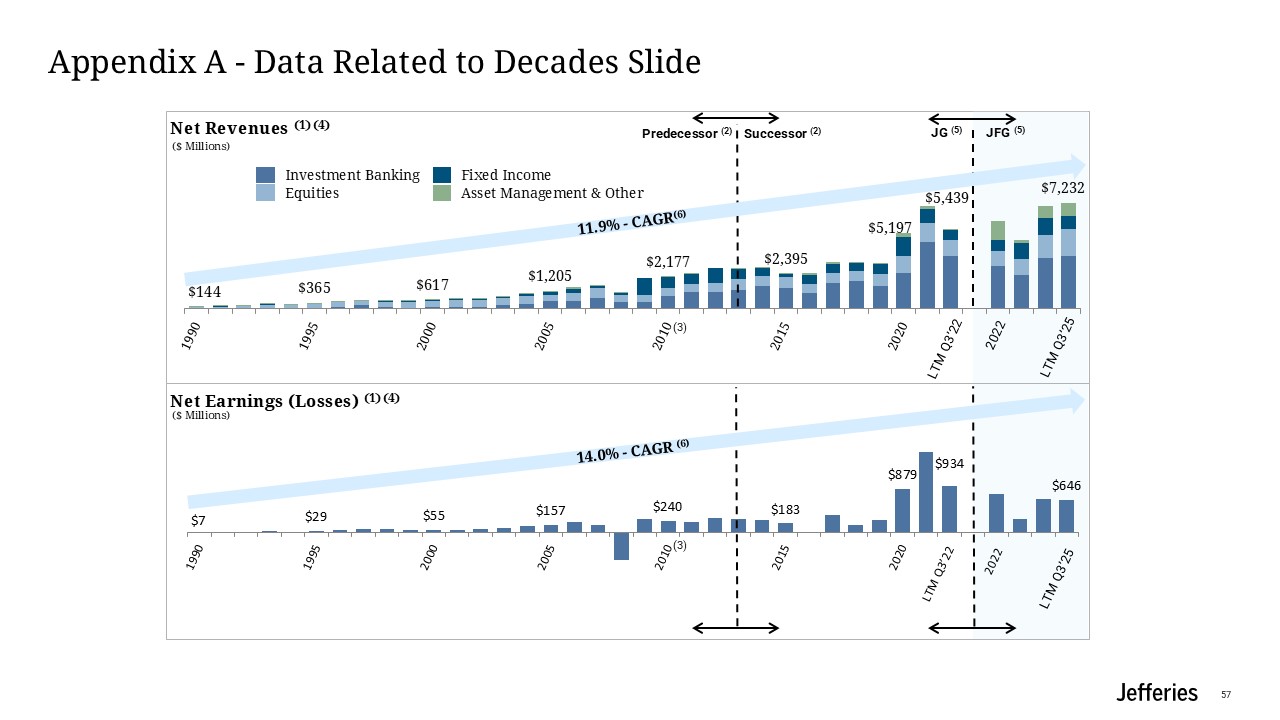
Appendix A - Data Related to Decades Slide Net Revenues (1) (4) Net Earnings
(Losses) (1) (4) ($ Millions) Equities Investment Banking Fixed Income Asset Management & Other ($ Millions) Predecessor (2) Successor (2) JG (5) JFG (5) 14.0% - CAGR (6) 11.9% - CAGR(6) 2022 LTM Q3’22 LTM Q3’25 LTM
Q3’25 57 (3) (3)
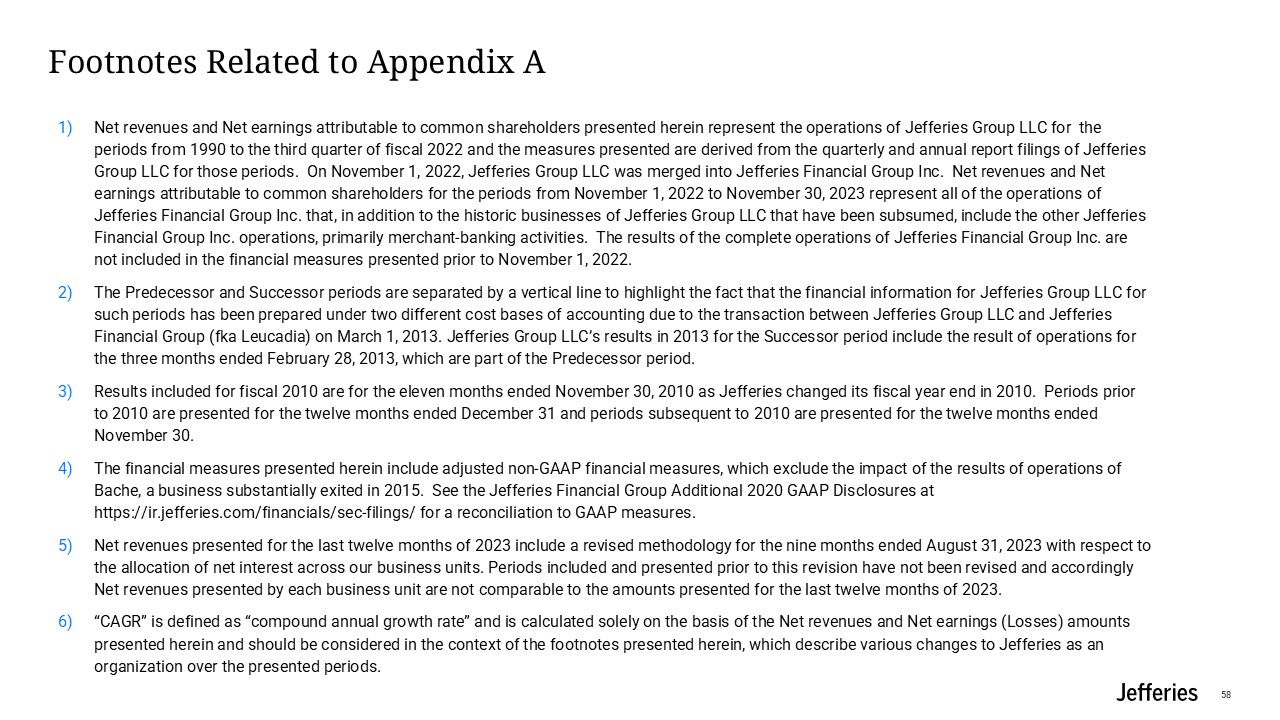
Footnotes Related to Appendix A Net revenues and Net earnings attributable to
common shareholders presented herein represent the operations of Jefferies Group LLC for the periods from 1990 to the third quarter of fiscal 2022 and the measures presented are derived from the quarterly and annual report filings of
Jefferies Group LLC for those periods. On November 1, 2022, Jefferies Group LLC was merged into Jefferies Financial Group Inc. Net revenues and Net earnings attributable to common shareholders for the periods from November 1, 2022 to November
30, 2023 represent all of the operations of Jefferies Financial Group Inc. that, in addition to the historic businesses of Jefferies Group LLC that have been subsumed, include the other Jefferies Financial Group Inc. operations, primarily
merchant-banking activities. The results of the complete operations of Jefferies Financial Group Inc. are not included in the financial measures presented prior to November 1, 2022. The Predecessor and Successor periods are separated by a
vertical line to highlight the fact that the financial information for Jefferies Group LLC for such periods has been prepared under two different cost bases of accounting due to the transaction between Jefferies Group LLC and Jefferies
Financial Group (fka Leucadia) on March 1, 2013. Jefferies Group LLC’s results in 2013 for the Successor period include the result of operations for the three months ended February 28, 2013, which are part of the Predecessor period. Results
included for fiscal 2010 are for the eleven months ended November 30, 2010 as Jefferies changed its fiscal year end in 2010. Periods prior to 2010 are presented for the twelve months ended December 31 and periods subsequent to 2010 are
presented for the twelve months ended November 30. The financial measures presented herein include adjusted non-GAAP financial measures, which exclude the impact of the results of operations of Bache, a business substantially exited in 2015.
See the Jefferies Financial Group Additional 2020 GAAP Disclosures at https://ir.jefferies.com/financials/sec-filings/ for a reconciliation to GAAP measures. Net revenues presented for the last twelve months of 2023 include a revised
methodology for the nine months ended August 31, 2023 with respect to the allocation of net interest across our business units. Periods included and presented prior to this revision have not been revised and accordingly Net revenues presented
by each business unit are not comparable to the amounts presented for the last twelve months of 2023. “CAGR” is defined as “compound annual growth rate” and is calculated solely on the basis of the Net revenues and Net earnings (Losses)
amounts presented herein and should be considered in the context of the footnotes presented herein, which describe various changes to Jefferies as an organization over the presented periods. 58

Appendix BEndnotes 59
Endnotes These notes refer to page 8 Revenues are presented net of allocations
of interest income and interest expense. During the third quarter ended August 31, 2023, we refined our allocated net interest methodology to better reflect net interest expense across our business units based on use of capital. Historical
periods have been recast to conform with the revised methodology back to 2019 Source: Third Party Market Survey These notes refer to page 9 Source: Dealogic for M&A, ECM and LevFin Revenues are presented net of allocations of interest
income and interest expense. During the third quarter ended August 31, 2023, we refined our allocated net interest methodology to better reflect net interest expense across our business units based on use of capital. Historical periods have
been recast to conform with the revised methodology back to 2019 These notes refer to page 12 On an as-converted and fully diluted basis. Subject to receipt of required applicable regulatory approvals Per Dealogic, comparing Jefferies’
2022-2023 market share to 2024-2025 YTD market share as of 8/31/25 for those sponsor clients jointly covered between SMBC and Jefferies These notes refer to page 13 Total Select Asset Management Revenue is a non-GAAP measure. See page
Appendix C for the non-GAAP reconciliation AUM includes aggregate NAV and NAV-equivalent assets under management held by us and our affiliated asset managers as of each period end These notes refer to page 16 ROTE to All Shareholders from
Continuing Operations is a non-GAAP measure. Please see Appendix C for the non-GAAP reconciliation LTM Q3’25 ROTE to All Shareholders for Continuing Operations is calculated by compounding the QTD ROTE for Q4’24, Q1’25, Q2’25 and Q3’25 60
Endnotes These notes refer to page 17 Revenues are presented net of
allocations of interest income and interest expense. During the third quarter ended August 31, 2023, we refined our allocated net interest methodology to better reflect net interest expense across our business units based on use of capital.
Historical periods have been recast to conform with the revised methodology back to 2019 These notes refer to page 19 Revenues are presented net of allocations of interest income and interest expense. During the third quarter ended August
31, 2023, we refined our allocated net interest methodology to better reflect net interest expense across our business units based on use of capital. Historical periods have been recast to conform with the revised methodology back to
2019 These notes refer to page 23 Projected FY25 ending headcount Source: Dealogic excludes China and Japan as of 8/31/25 These notes refer to page 24 Revenues are presented net of allocations of interest income and interest expense.
During the third quarter ended August 31, 2023, we refined our allocated net interest methodology to better reflect net interest expense across our business units based on use of capital. Historical periods have been recast to conform with
the revised methodology back to 2019 Source: Dealogic for M&A, ECM and LevFin These notes refer to page 26 Source: Dealogic. FY25 Annualized as of 8/31/25 61
Endnotes These notes refer to page 27 Source: As of LTM Q3’25 Source: As of
LTM Q2’25 These notes refer to page 28 Source: As of LTM Q3’25 Source: As of LTM Q2’25 These notes refer to page 29 Source: Dealogic - YTD 2025 as of 8/31/25 These notes refer to page 31 Source: Dealogic – YTD Q3’25 as of
8/31/25 Based on the most recently available LTM reported revenues. Peer data is based on results compiled by Jefferies and derived from publicly available company filings, including Form 10-Qs and 10-Ks, earnings releases and supplements.
includes Bank of America, Barclays, BNP, Citi, Deutsche, Evercore, Goldman Sachs, HSBC, JP Morgan, Lazard, Moelis, Morgan Stanley, Nomura, Perella Weinberg, Piper Sandler, PJT, Raymond James, RBC, Stifel, UBS and Wells Fargo These notes
refer to page 33 Revenues are presented net of allocations of interest income and interest expense. During the third quarter ended August 31, 2023, we refined our allocated net interest methodology to better reflect net interest expense
across our business units based on use of capital. Historical periods have been recast to conform with the revised methodology back to 2019 Source: Third Party Market Survey 62
Endnotes These notes refer to page 34 Source: 2024 Greenwich Source: 2024
Extel Source: 2025 Extel Source: 1H25 Third Party Market Survey Source: Internally sourced, FYTD 2025 through August Source: Starmine August 2025 These notes refer to page 35 Revenues are presented net of allocations of interest income
and interest expense. During the third quarter ended August 31, 2023, we refined our allocated net interest methodology to better reflect net interest expense across our business units based on use of capital. Historical periods have been
recast to conform with the revised methodology back to 2019 Source: 1H25 Third Party Market Survey These notes refer to page 36 Source: Third Party Market Survey These notes refer to page 37 Source: 1H25 Third Party Market Survey 63
Endnotes These notes refer to page 40 Revenues are presented net of
allocations of interest income and interest expense. During the third quarter ended August 31, 2023, we refined our allocated net interest methodology to better reflect net interest expense across our business units based on use of capital.
Historical periods have been recast to conform with the revised methodology back to 2019 These notes refer to page 41 Regional revenue diversification excludes revenues from, Russia/Ukraine and CMBS Trading in 2022. This contributed an
additional 3% to the average bringing it from 25% to 28% Sales credit to MENA based clients on US, APAC, or European products Sales credit to APAC based clients on US or EMEA products These notes refer to page 42 Source: Coalition
Greenwich Voice of Client 2024 US and EU Fixed Income Studies Source: Coalition Greenwich Voice of Client 2019-2024 Global Fixed Income Studies These notes refer to page 43 Source: Coalition Greenwich Institutional Client Analytics
illustrating directional changes in Jefferies’ sales revenue in Global Vanilla Credit Products between 2019-2024 These notes refer to page 44 Internal metrics based on notional trade volume for Loans and High Yield. 2025 YTD Annualized as
of 8/31/2025 Source: Trumid and Tradeweb YTD as of 8/31/2025 Source: Coalition Greenwich Voice of Client US Fixed Income Study 2024 Internal metrics based on notional distribution volume for Municipal New Issue. 2025 YTD Annualized as of
8/31/2025 64
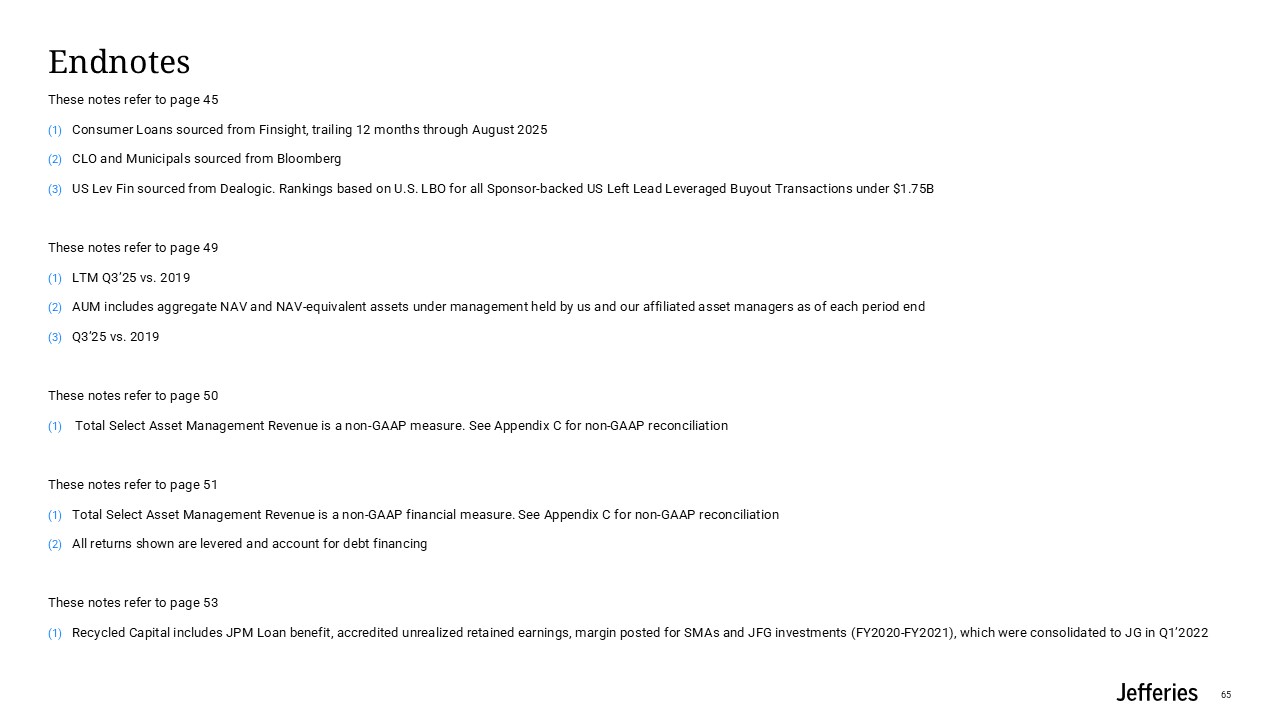
Endnotes These notes refer to page 45 Consumer Loans sourced from Finsight,
trailing 12 months through August 2025 CLO and Municipals sourced from Bloomberg US Lev Fin sourced from Dealogic. Rankings based on U.S. LBO for all Sponsor-backed US Left Lead Leveraged Buyout Transactions under $1.75B These notes refer
to page 49 LTM Q3’25 vs. 2019 AUM includes aggregate NAV and NAV-equivalent assets under management held by us and our affiliated asset managers as of each period end Q3’25 vs. 2019 These notes refer to page 50 Total Select Asset
Management Revenue is a non-GAAP measure. See Appendix C for non-GAAP reconciliation These notes refer to page 51 Total Select Asset Management Revenue is a non-GAAP financial measure. See Appendix C for non-GAAP reconciliation All returns
shown are levered and account for debt financing These notes refer to page 53 Recycled Capital includes JPM Loan benefit, accredited unrealized retained earnings, margin posted for SMAs and JFG investments (FY2020-FY2021), which were
consolidated to JG in Q1’2022 65
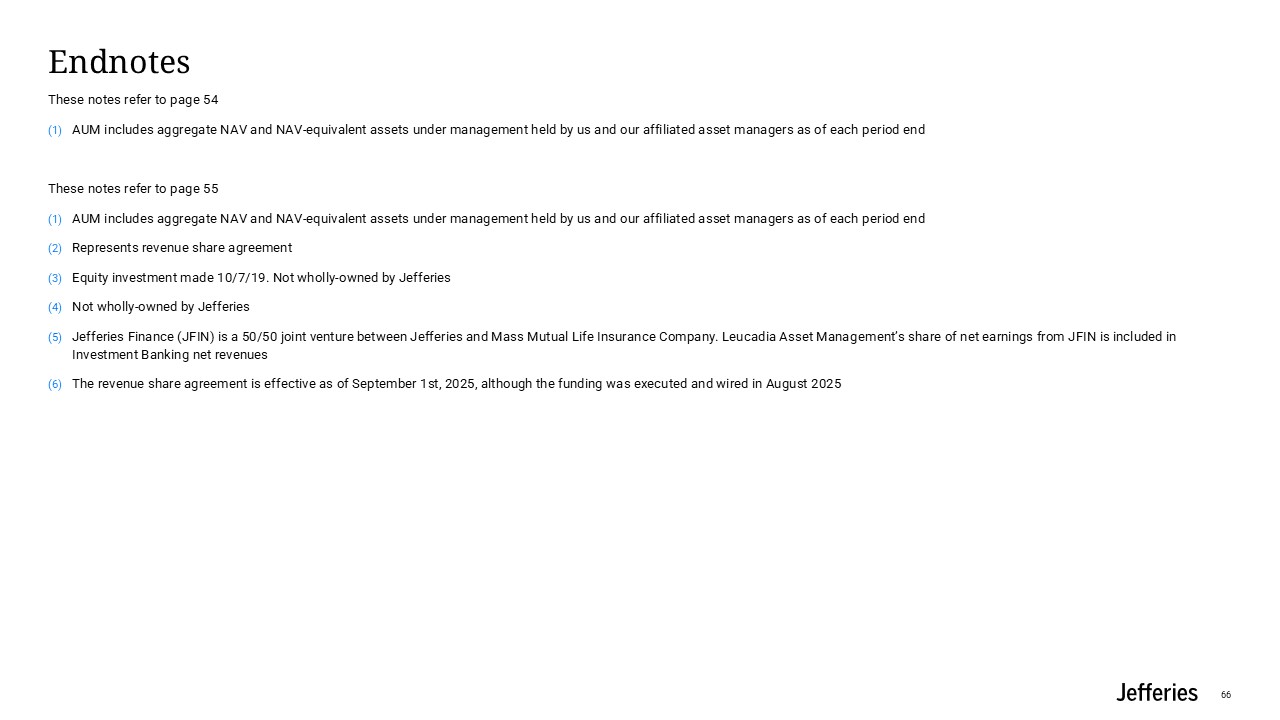
Endnotes These notes refer to page 54 AUM includes aggregate NAV and
NAV-equivalent assets under management held by us and our affiliated asset managers as of each period end These notes refer to page 55 AUM includes aggregate NAV and NAV-equivalent assets under management held by us and our affiliated asset
managers as of each period end Represents revenue share agreement Equity investment made 10/7/19. Not wholly-owned by Jefferies Not wholly-owned by Jefferies Jefferies Finance (JFIN) is a 50/50 joint venture between Jefferies and Mass
Mutual Life Insurance Company. Leucadia Asset Management’s share of net earnings from JFIN is included in Investment Banking net revenues The revenue share agreement is effective as of September 1st, 2025, although the funding was executed
and wired in August 2025 66

Appendix Cnon-GAAP Reconciliations 67
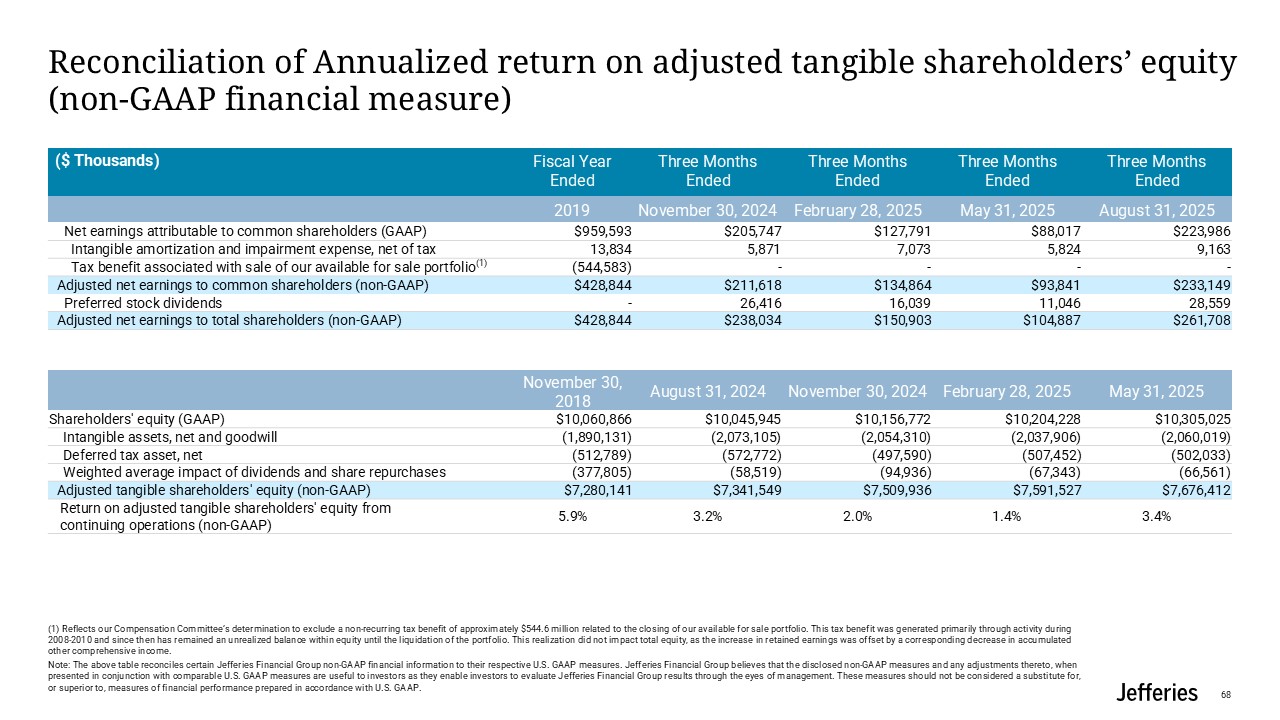
Fiscal Year Ended Three Months Ended Three Months Ended Three Months
Ended Three Months Ended 2019 November 30, 2024 February 28, 2025 May 31, 2025 August 31, 2025 Net earnings attributable to common shareholders (GAAP) $959,593 $205,747 $127,791 $88,017 $223,986 Intangible amortization and
impairment expense, net of tax 13,834 5,871 7,073 5,824 9,163 Tax benefit associated with sale of our available for sale portfolio(1) (544,583) - - - - Adjusted net earnings to common shareholders
(non-GAAP) $428,844 $211,618 $134,864 $93,841 $233,149 Preferred stock dividends - 26,416 16,039 11,046 28,559 Adjusted net earnings to total shareholders
(non-GAAP) $428,844 $238,034 $150,903 $104,887 $261,708 Reconciliation of Annualized return on adjusted tangible shareholders’ equity (non-GAAP financial measure) (1) Reflects our Compensation Committee’s determination to exclude a
non-recurring tax benefit of approximately $544.6 million related to the closing of our available for sale portfolio. This tax benefit was generated primarily through activity during 2008-2010 and since then has remained an unrealized balance
within equity until the liquidation of the portfolio. This realization did not impact total equity, as the increase in retained earnings was offset by a corresponding decrease in accumulated other comprehensive income. Note: The above table
reconciles certain Jefferies Financial Group non-GAAP financial information to their respective U.S. GAAP measures. Jefferies Financial Group believes that the disclosed non-GAAP measures and any adjustments thereto, when presented in
conjunction with comparable U.S. GAAP measures are useful to investors as they enable investors to evaluate Jefferies Financial Group results through the eyes of management. These measures should not be considered a substitute for, or
superior to, measures of financial performance prepared in accordance with U.S. GAAP. ($ Thousands) November 30, 2018 August 31, 2024 November 30, 2024 February 28, 2025 May 31, 2025 Shareholders' equity
(GAAP) $10,060,866 $10,045,945 $10,156,772 $10,204,228 $10,305,025 Intangible assets, net and goodwill (1,890,131) (2,073,105) (2,054,310) (2,037,906) (2,060,019) Deferred tax asset,
net (512,789) (572,772) (497,590) (507,452) (502,033) Weighted average impact of dividends and share repurchases (377,805) (58,519) (94,936) (67,343) (66,561) Adjusted tangible shareholders' equity
(non-GAAP) $7,280,141 $7,341,549 $7,509,936 $7,591,527 $7,676,412 Return on adjusted tangible shareholders' equity from continuing operations (non-GAAP) 5.9% 3.2% 2.0% 1.4% 3.4% 68
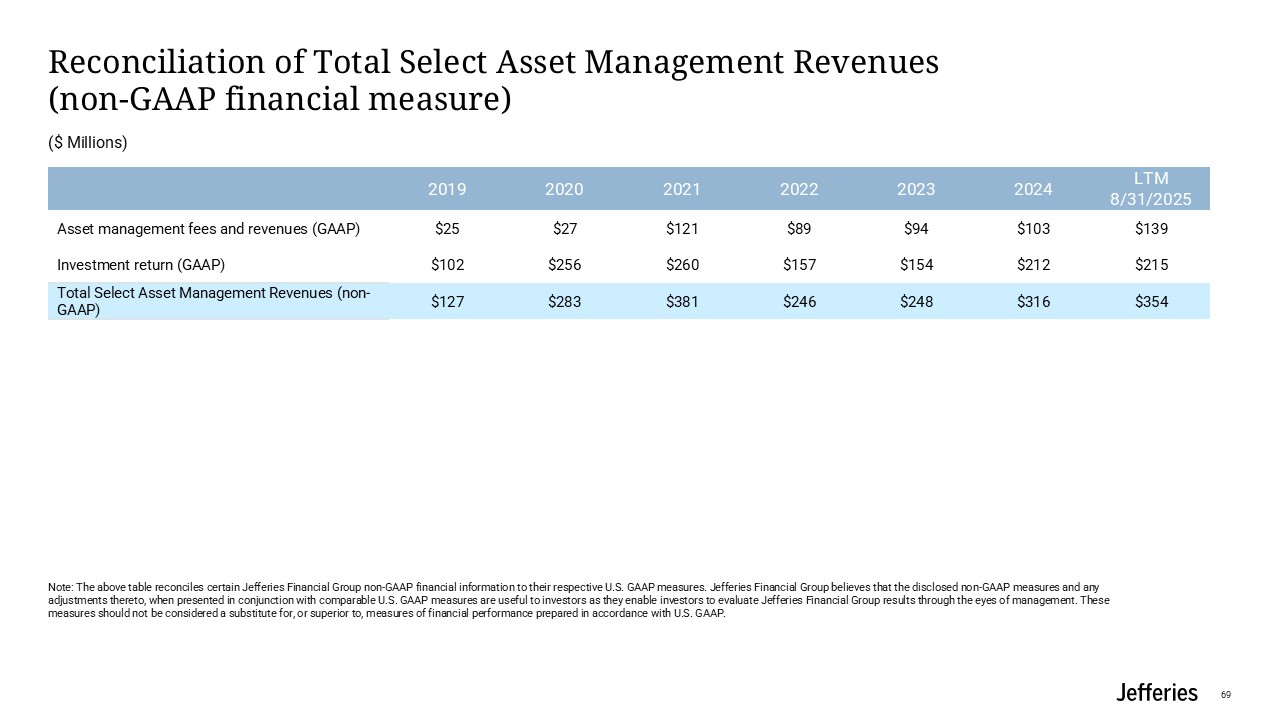
Reconciliation of Total Select Asset Management Revenues(non-GAAP financial
measure) Note: The above table reconciles certain Jefferies Financial Group non-GAAP financial information to their respective U.S. GAAP measures. Jefferies Financial Group believes that the disclosed non-GAAP measures and any adjustments
thereto, when presented in conjunction with comparable U.S. GAAP measures are useful to investors as they enable investors to evaluate Jefferies Financial Group results through the eyes of management. These measures should not be considered a
substitute for, or superior to, measures of financial performance prepared in accordance with U.S. GAAP. ($ Millions) 2019 2020 2021 2022 2023 2024 LTM 8/31/2025 Asset management fees and revenues (GAAP) $25 $27 $121 $89
$94 $103 $139 Investment return (GAAP) $102 $256 $260 $157 $154 $212 $215 Total Select Asset Management Revenues (non-GAAP) $127 $283 $381 $246 $248 $316 $354 69