
2026Investor Meeting October 19, 2026
Important Disclosures 2 Forward Looking Statements. Certain statements contained
herein may constitute “forward-looking statements," within the meaning of Section 27A of the Securities Act of 1933, Section 21E of the Securities Exchange Act of 1934 and/or the Private Securities Litigation Reform Act of 1995, regarding
Jefferies Financial Group Inc., and its subsidiaries. These forward-looking statements reflect our current views relating to, among other things, future revenues, earnings, operations, and other financial results, and may include statements of
future performance, plans, and objectives. Forward-looking statements may also include statements pertaining to our strategies for the future development of its business and products. These forward-looking statements are not historical facts
and are based on management expectations, estimates, projections, beliefs and certain other assumptions, many of which, by their nature, are inherently uncertain and beyond management’s control. It is possible that the actual results may
differ, possibly materially, from the anticipated results indicated in these forward-looking statements. Accordingly, readers are cautioned that any such forward-looking statements are not guarantees of future performance and are subject to
certain risks, uncertainties and assumptions that are difficult to predict including, without limitation, the cautionary statements and risks set forth in our Annual and Quarterly Reports and other reports or documents filed with, or furnished
to, the SEC from time to time, which are accessible on the SEC website at sec.gov. This information should also be read in conjunction with Jefferies Financial Group Inc. Consolidated Financial Statements and the Notes thereto contained in the
Annual, Quarterly and Periodic Reports filed by the issuer that are also accessible on the SEC website at sec.gov. Readers are cautioned not to place undue reliance on forward-looking statements, which speak only as of the date they are made.
We do not undertake to update any forward-looking statements to reflect the impact of circumstances or events that arise after the date of such forward-looking statements. Not an Offer. These materials are provided for shareholders of
Jefferies Financial Group Inc. and are for informational purposes only. These materials do not constitute an offer to sell, or a solicitation of an offer to buy, any security or instrument, or a solicitation of interest in any fund, account or
strategy described herein. Performance Information. Past performance is not necessarily indicative of future results.
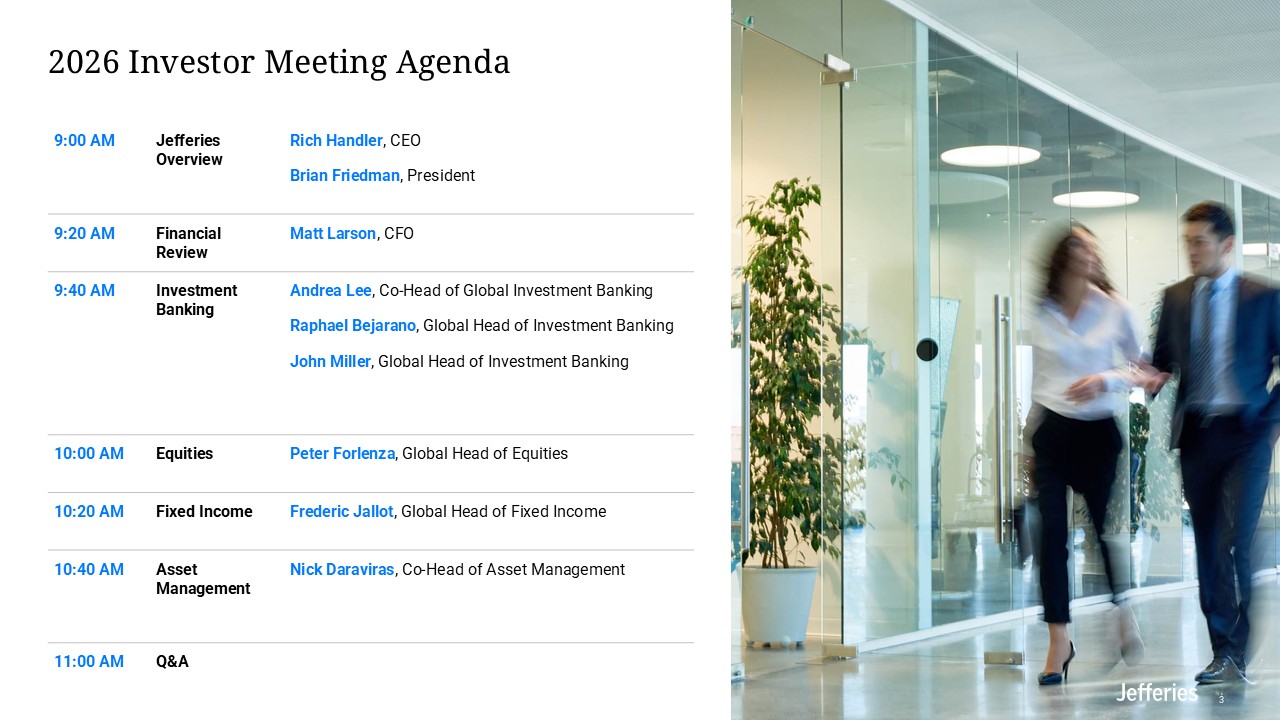
9:00 AM Jefferies Overview Rich Handler, CEO Brian Friedman, President 9:20
AM Financial Review Matt Larson, CFO 9:40 AM Investment Banking Andrea Lee, Co-Head of Global Investment Banking Raphael Bejarano, Global Head of Investment Banking John Miller, Global Head of Investment Banking 10:00
AM Equities Peter Forlenza, Global Head of Equities 10:20 AM Fixed Income Frederic Jallot, Global Head of Fixed Income 10:40 AM Asset Management Nick Daraviras, Co-Head of Asset Management 11:00 AM Q&A 2026 Investor Meeting
Agenda 3

JefferiesOverviewRich Handler, CEOBrian Friedman, President 4
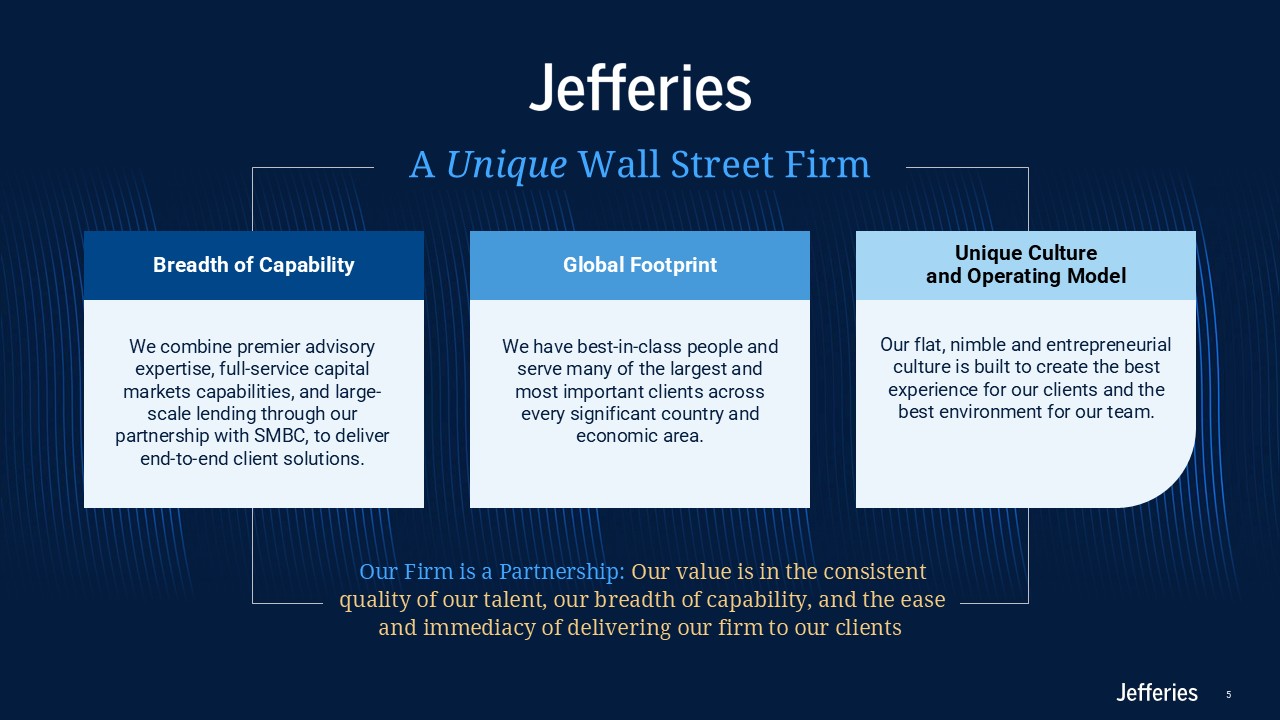
Global Footprint We have best-in-class people and serve many of the largest and
most important clients across every significant country and economic area. Unique Cultureand Operating Model Our flat, nimble and entrepreneurial culture is built to create the best experience for our clients and the best environment for our
team. Breadth of Capability We combine premier advisory expertise, full-service capital markets capabilities, and large-scale lending through our partnership with SMBC, to deliver end-to-end client solutions. A Unique Wall Street Firm Our
Firm is a Partnership: Our value is in the consistent quality of our talent, our breadth of capability, and the ease and immediacy of delivering our firm to our clients 5
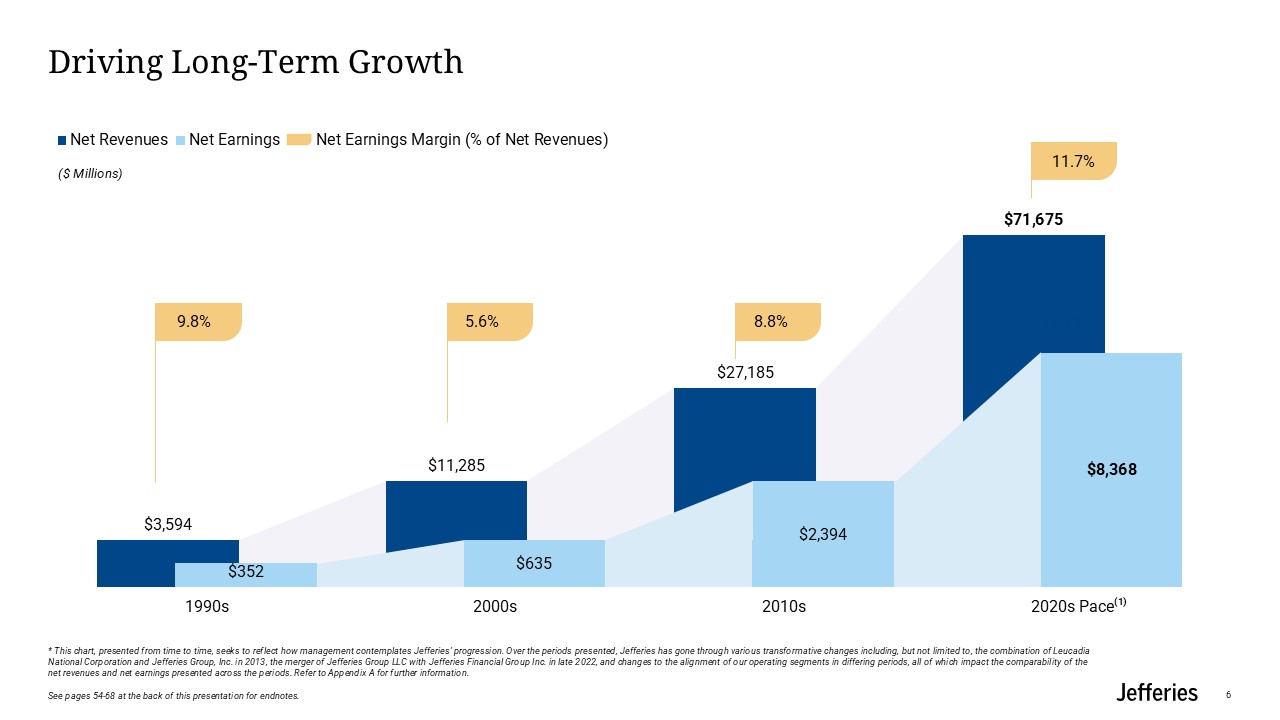
Driving Long-Term Growth * This chart, presented from time to time, seeks to
reflect how management contemplates Jefferies’ progression. Over the periods presented, Jefferies has gone through various transformative changes including, but not limited to, the combination of Leucadia National Corporation and Jefferies
Group, Inc. in 2013, the merger of Jefferies Group LLC with Jefferies Financial Group Inc. in late 2022, and changes to the alignment of our operating segments in differing periods, all of which impact the comparability of the net revenues and
net earnings presented across the periods. Refer to Appendix A for further information. See pages 54-68 at the back of this presentation for endnotes. (1) ($ Millions) 11.7% 6
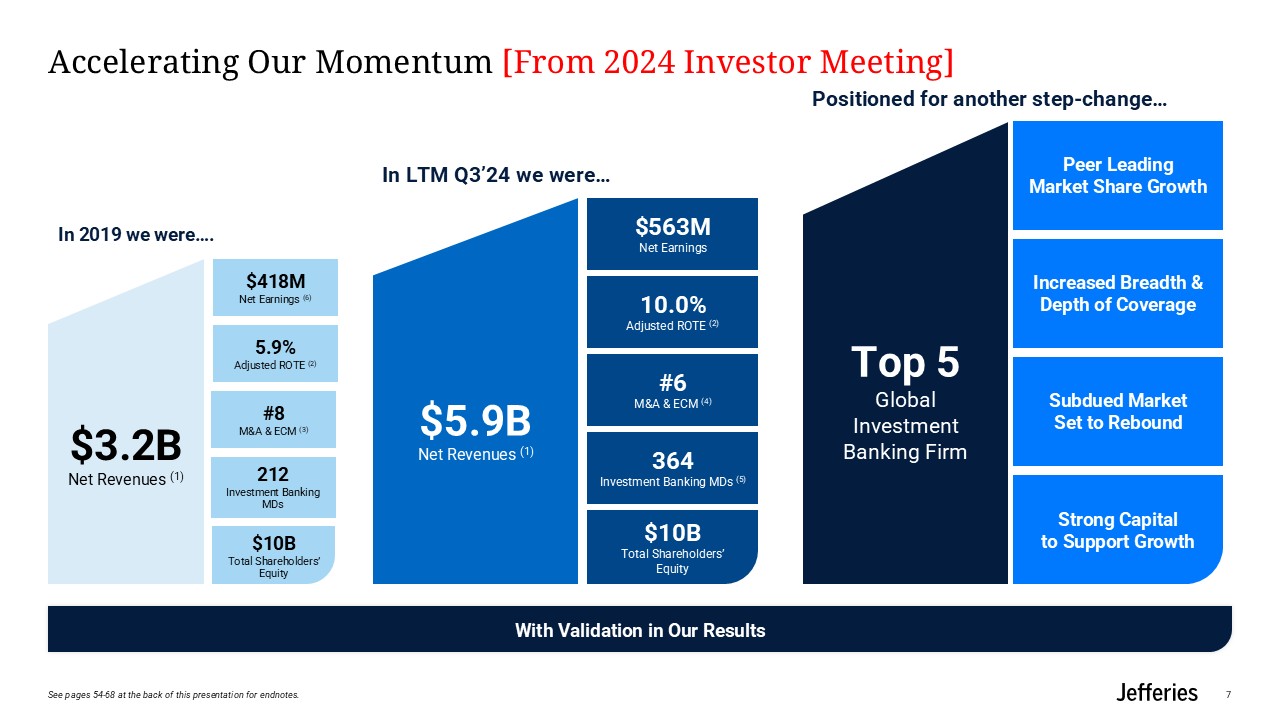
Accelerating Our Momentum [From 2024 Investor Meeting] 7 Top 5 Global
Investment Banking Firm Positioned for another step-change… Peer Leading Market Share Growth Strong Capital to Support Growth Increased Breadth & Depth of Coverage Subdued Market Set to Rebound In 2019 we were…. $10B Total
Shareholders’ Equity $3.2B Net Revenues (1) $10B Total Shareholders’ Equity In LTM Q3’24 we were… $5.9B Net Revenues (1) 212 Investment Banking MDs #6 M&A & ECM (4) #8 M&A & ECM (3) 364 Investment Banking MDs
(5) 10.0% Adjusted ROTE (2) $563M Net Earnings 5.9% Adjusted ROTE (2) $418M Net Earnings (6) With Validation in Our Results See pages 54-68 at the back of this presentation for endnotes.
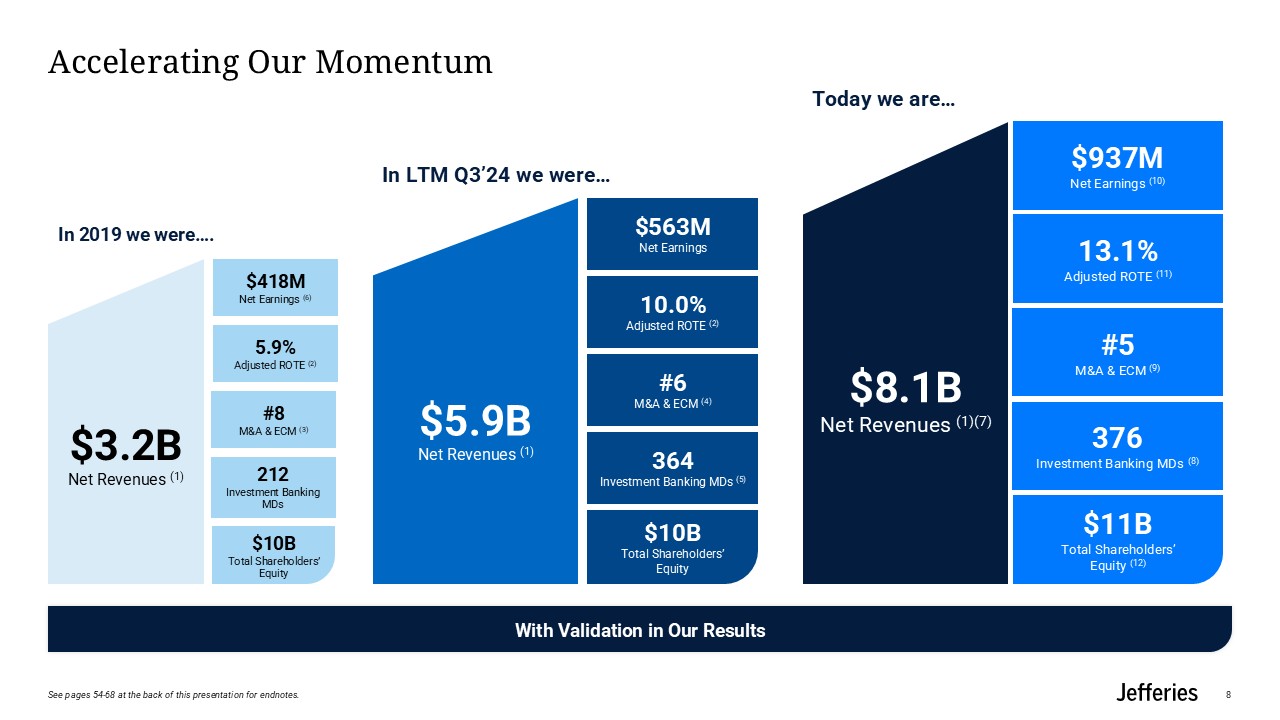
Accelerating Our Momentum 8 $8.1B Net Revenues (1)(7) Today we
are… $937M Net Earnings (10) $11B Total Shareholders’ Equity (12) 13.1% Adjusted ROTE (11) #5 M&A & ECM (9) In 2019 we were…. With Validation in Our Results In LTM Q3’24 we were… 376 Investment Banking MDs (8) $10B Total
Shareholders’ Equity $3.2B Net Revenues (1) 212 Investment Banking MDs #8 M&A & ECM (3) 5.9% Adjusted ROTE (2) $418M Net Earnings (6) $10B Total Shareholders’ Equity $5.9B Net Revenues (1) #6 M&A & ECM
(4) 364 Investment Banking MDs (5) 10.0% Adjusted ROTE (2) $563M Net Earnings See pages 54-68 at the back of this presentation for endnotes.
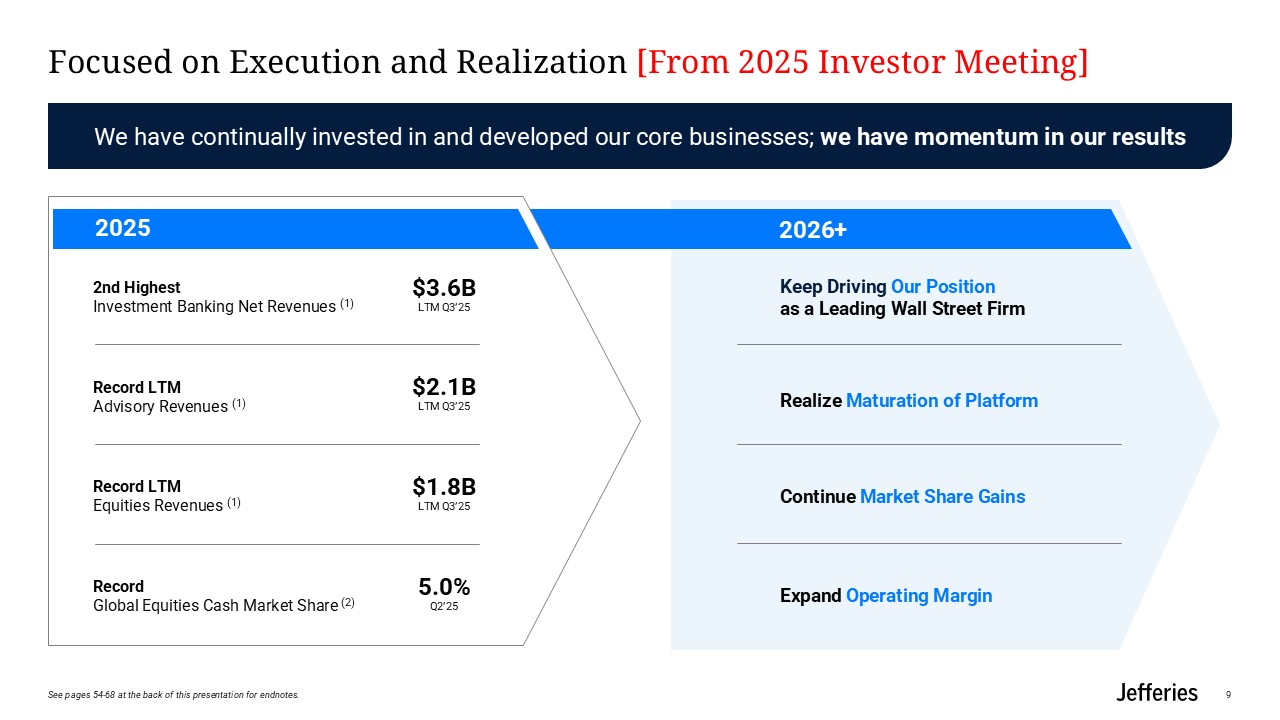
2026+ Focused on Execution and Realization [From 2025 Investor Meeting] 9 2nd
Highest Investment Banking Net Revenues (1) $3.6B LTM Q3’25 Record LTM Equities Revenues (1) $1.8B LTM Q3’25 Record Global Equities Cash Market Share (2) 5.0% Q2’25 Keep Driving Our Position as a Leading Wall Street Firm Realize
Maturation of Platform Continue Market Share Gains Expand Operating Margin Record LTM Advisory Revenues (1) $2.1B LTM Q3’25 We have continually invested in and developed our core businesses; we have momentum in our results 2025 See
pages 54-68 at the back of this presentation for endnotes.
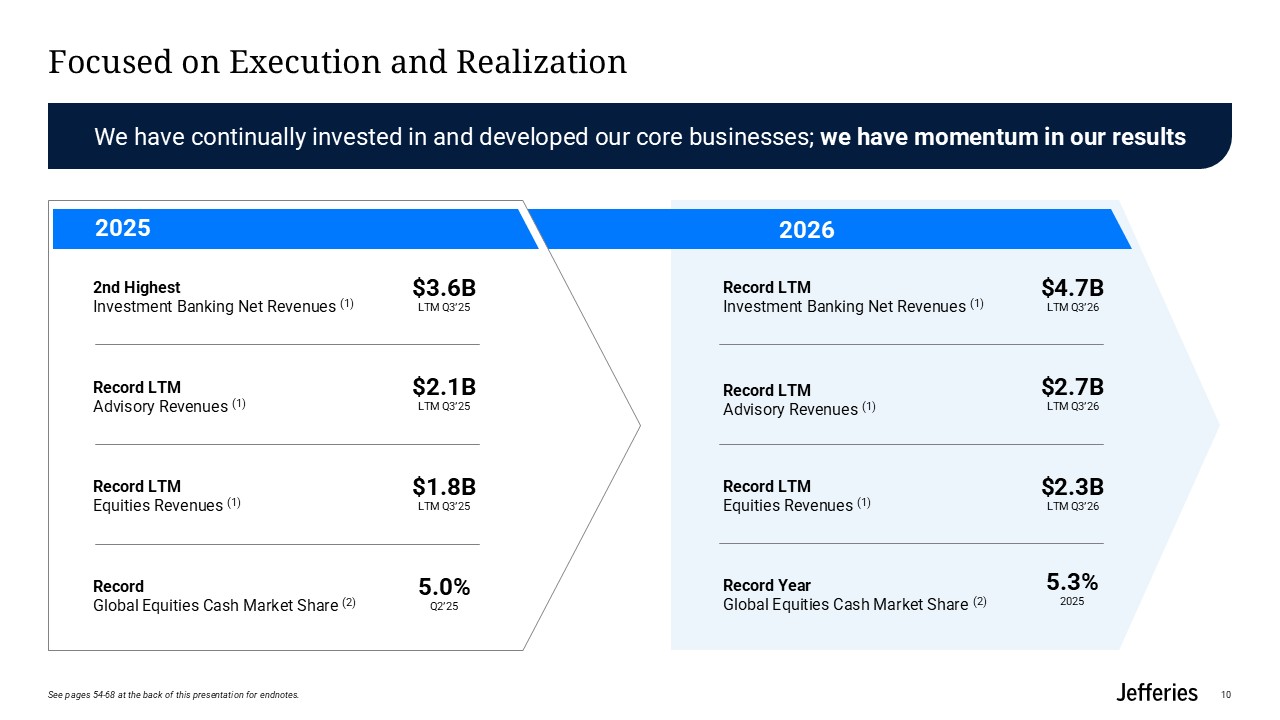
2026 Focused on Execution and Realization 10 2nd Highest Investment Banking
Net Revenues (1) $3.6B LTM Q3’25 Record LTM Equities Revenues (1) $1.8B LTM Q3’25 Record Global Equities Cash Market Share (2) 5.0% Q2’25 Record LTM Investment Banking Net Revenues (1) Record LTM Advisory Revenues (1) Record
LTM Equities Revenues (1) Record Year Global Equities Cash Market Share (2) Record LTM Advisory Revenues (1) $2.1B LTM Q3’25 We have continually invested in and developed our core businesses; we have momentum in our
results 2025 $4.7B LTM Q3’26 $2.7B LTM Q3’26 5.3% 2025 $2.3B LTM Q3’26 See pages 54-68 at the back of this presentation for endnotes.
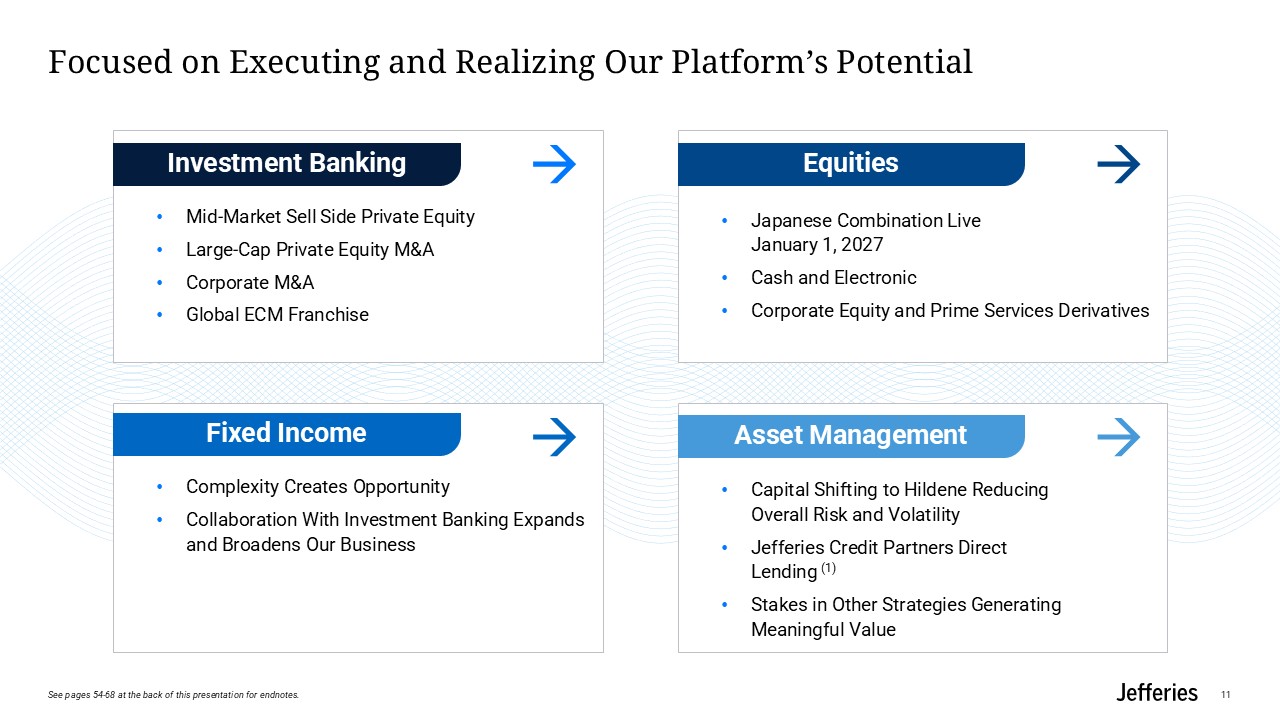
Focused on Executing and Realizing Our Platform’s Potential 11 Fixed
Income Complexity Creates Opportunity Collaboration With Investment Banking Expands and Broadens Our Business Investment Banking Mid-Market Sell Side Private Equity Large-Cap Private Equity M&A Corporate M&A Global ECM
Franchise Equities Japanese Combination Live January 1, 2027 Cash and Electronic Corporate Equity and Prime Services Derivatives Asset Management Capital Shifting to Hildene Reducing Overall Risk and Volatility Jefferies Credit
Partners Direct Lending (1) Stakes in Other Strategies Generating Meaningful Value Investment Banking Equities Asset Management Fixed Income See pages 54-68 at the back of this presentation for endnotes.
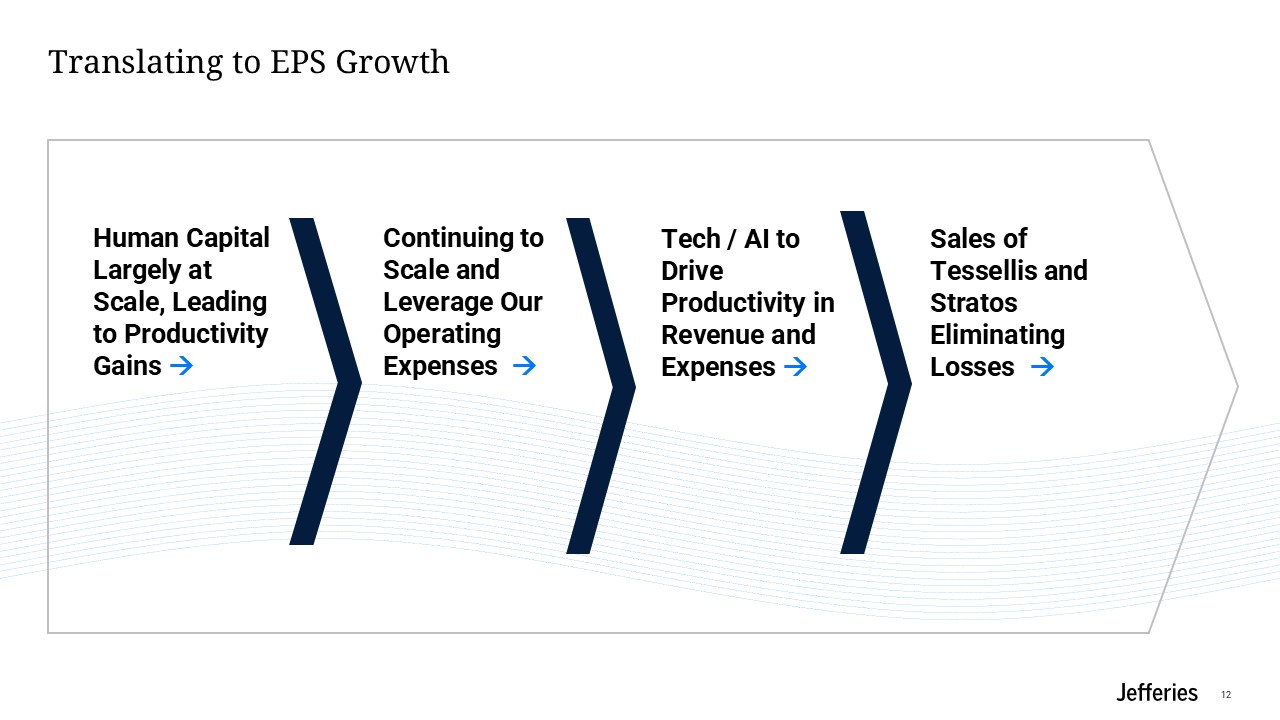
Translating to EPS Growth 12 Human Capital Largely at Scale, Leading to
Productivity Gains Continuing to Scale and Leverage Our Operating Expenses Sales of Tessellis and Stratos Eliminating Losses Tech / AI to Drive Productivity in Revenue and Expenses

Financial ReviewMatt Larson, CFO 13
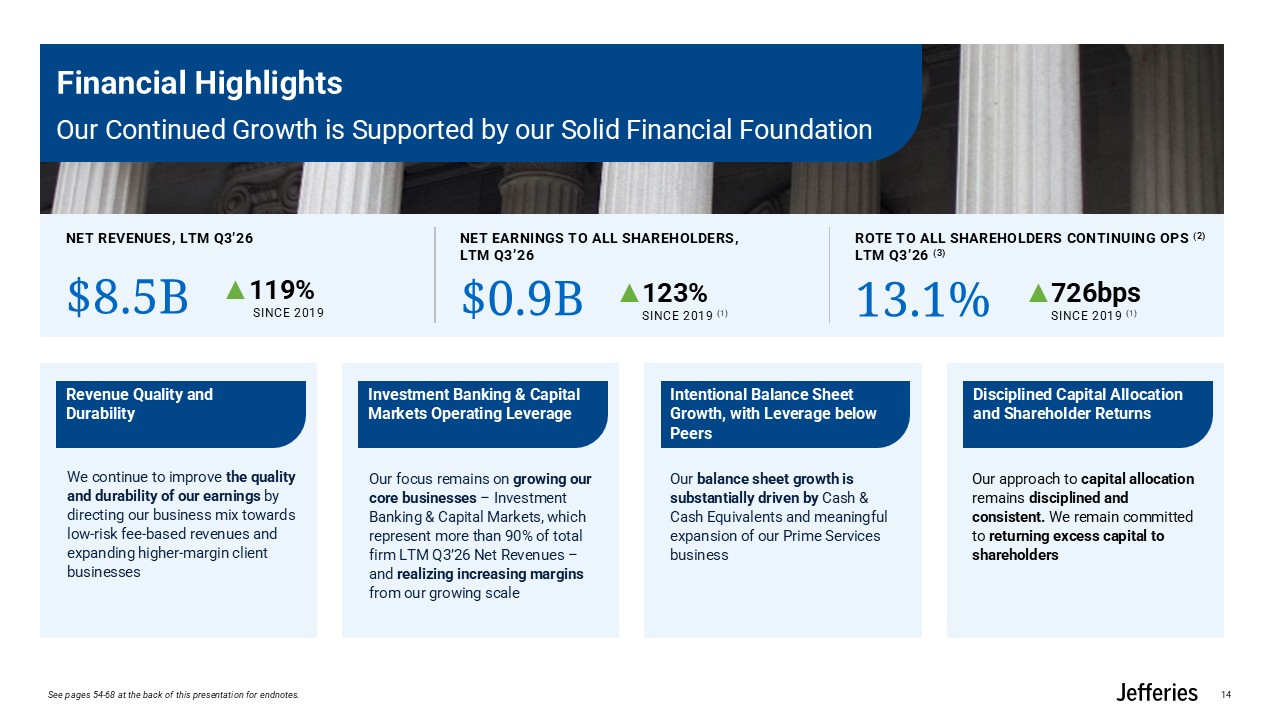
Financial Highlights Our Continued Growth is Supported by our Solid Financial
Foundation $8.5B ▲119% SINCE 2019 NET REVENUES, LTM Q3’26 $0.9B ▲123% SINCE 2019 (1) NET EARNINGS TO ALL SHAREHOLDERS, LTM Q3’26 13.1% ▲726bps SINCE 2019 (1) ROTE TO ALL SHAREHOLDERS CONTINUING OPS (2) LTM Q3’26 (3) Revenue
Quality and Durability We continue to improve the quality and durability of our earnings by directing our business mix towards low-risk fee-based revenues and expanding higher-margin client businesses Investment Banking & Capital Markets
Operating Leverage Our focus remains on growing our core businesses – Investment Banking & Capital Markets, which represent more than 90% of total firm LTM Q3’26 Net Revenues –and realizing increasing margins from our growing
scale Intentional Balance Sheet Growth, with Leverage below Peers Our balance sheet growth is substantially driven by Cash & Cash Equivalents and meaningful expansion of our Prime Services business Disciplined Capital Allocation and
Shareholder Returns Our approach to capital allocation remains disciplined and consistent. We remain committed to returning excess capital to shareholders 14 See pages 54-68 at the back of this presentation for endnotes.
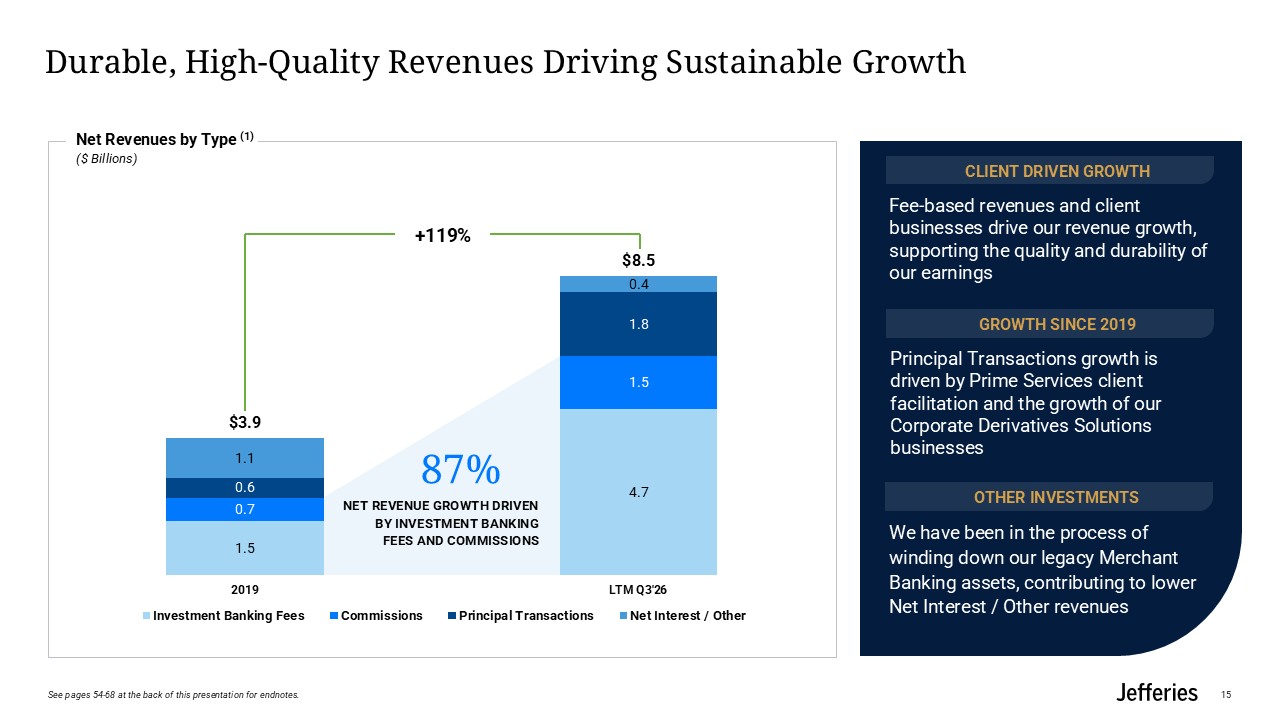
+119% Durable, High-Quality Revenues Driving Sustainable Growth Net Revenues by
Type (1) ($ Billions) 87% NET REVENUE GROWTH DRIVEN BY INVESTMENT BANKINGFEES AND COMMISSIONS Fee-based revenues and client businesses drive our revenue growth, supporting the quality and durability of our earnings CLIENT DRIVEN
GROWTH Principal Transactions growth is driven by Prime Services client facilitation and the growth of our Corporate Derivatives Solutions businesses GROWTH SINCE 2019 We have been in the process of winding down our legacy Merchant Banking
assets, contributing to lower Net Interest / Other revenues OTHER INVESTMENTS 15 See pages 54-68 at the back of this presentation for endnotes.
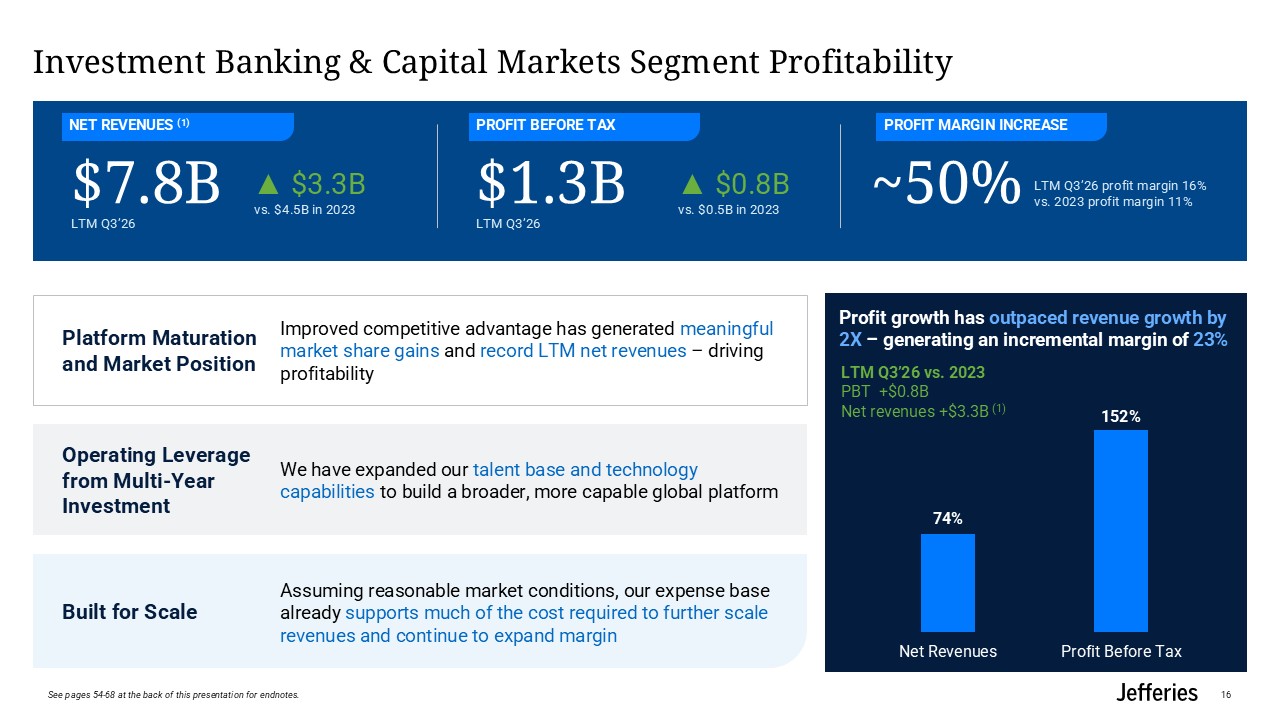
Investment Banking & Capital Markets Segment Profitability Incremental YTD
YoY Incremental Margin Platform Maturation and Market Position Improved competitive advantage has generated meaningful market share gains and record LTM net revenues – driving profitability Operating Leverage from Multi-Year Investment We
have expanded our talent base and technology capabilities to build a broader, more capable global platform Built for Scale Assuming reasonable market conditions, our expense base already supports much of the cost required to further scale
revenues and continue to expand margin Profit growth has outpaced revenue growth by 2X – generating an incremental margin of 23% PROFIT MARGIN INCREASE PROFIT BEFORE TAX NET REVENUES (1) $7.8B $1.3B ~50% LTM Q3’26 LTM Q3’26 ▲
$3.3B vs. $4.5B in 2023 ▲ $0.8B vs. $0.5B in 2023 LTM Q3’26 profit margin 16% vs. 2023 profit margin 11% LTM Q3’26 vs. 2023 PBT +$0.8B Net revenues +$3.3B (1) 16 See pages 54-68 at the back of this presentation for endnotes.
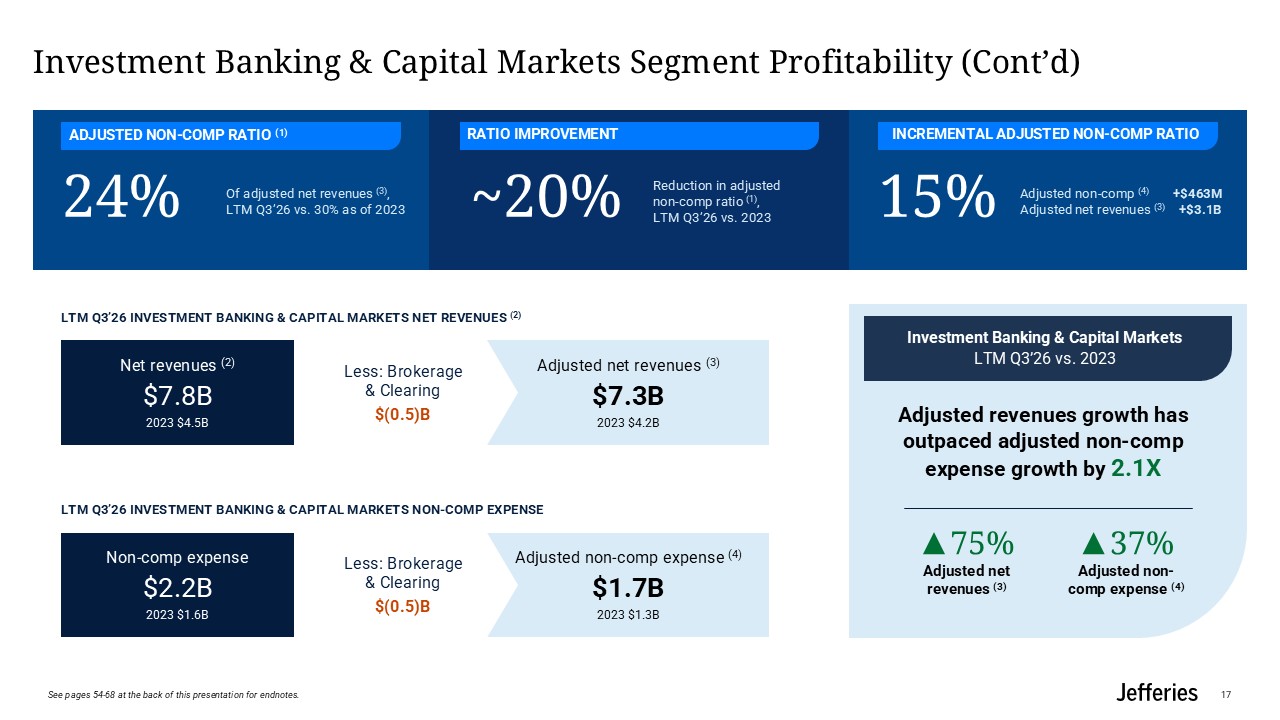
Investment Banking & Capital Markets Segment Profitability (Cont’d) Adjusted
non-comp expense (4) $1.7B 2023 $1.3B Adjusted net revenues (3) $7.3B 2023 $4.2B RATIO IMPROVEMENT 24% Of adjusted net revenues (3), LTM Q3’26 vs. 30% as of 2023 ~20% Reduction in adjusted non-comp ratio (1), LTM Q3’26 vs.
2023 15% Adjusted non-comp (4) +$463M Adjusted net revenues (3) +$3.1B LTM Q3’26 INVESTMENT BANKING & CAPITAL MARKETS NET REVENUES (2) Net revenues (2) $7.8B 2023 $4.5B LTM Q3’26 INVESTMENT BANKING & CAPITAL MARKETS NON-COMP
EXPENSE Non-comp expense $2.2B 2023 $1.6B Less: Brokerage & Clearing $(0.5)B Less: Brokerage & Clearing $(0.5)B Adjusted revenues growth has outpaced adjusted non-comp expense growth by 2.1X Investment Banking & Capital
Markets LTM Q3’26 vs. 2023 INCREMENTAL ADJUSTED NON-COMP RATIO ADJUSTED NON-COMP RATIO (1) ▲75% Adjusted net revenues (3) ▲37% Adjusted non-comp expense (4) 17 See pages 54-68 at the back of this presentation for endnotes.
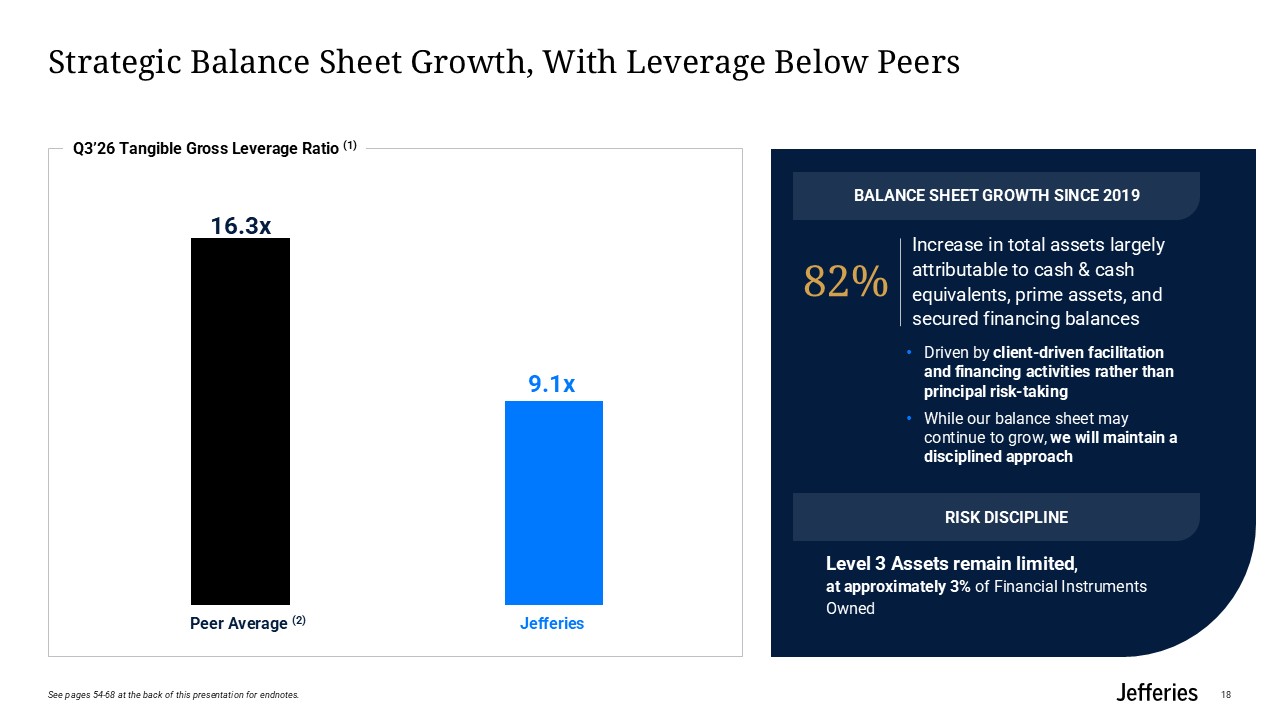
Q3’26 Tangible Gross Leverage Ratio (1) Peer Average
(2) 16.3x Jefferies 9.1x Strategic Balance Sheet Growth, With Leverage Below Peers Level 3 Assets remain limited, at approximately 3% of Financial Instruments Owned BALANCE SHEET GROWTH SINCE 2019 RISK DISCIPLINE 82% Increase in total
assets largely attributable to cash & cash equivalents, prime assets, and secured financing balances 18 See pages 54-68 at the back of this presentation for endnotes. Driven by client-driven facilitation and financing activities rather
than principal risk-taking While our balance sheet may continue to grow, we will maintain a disciplined approach
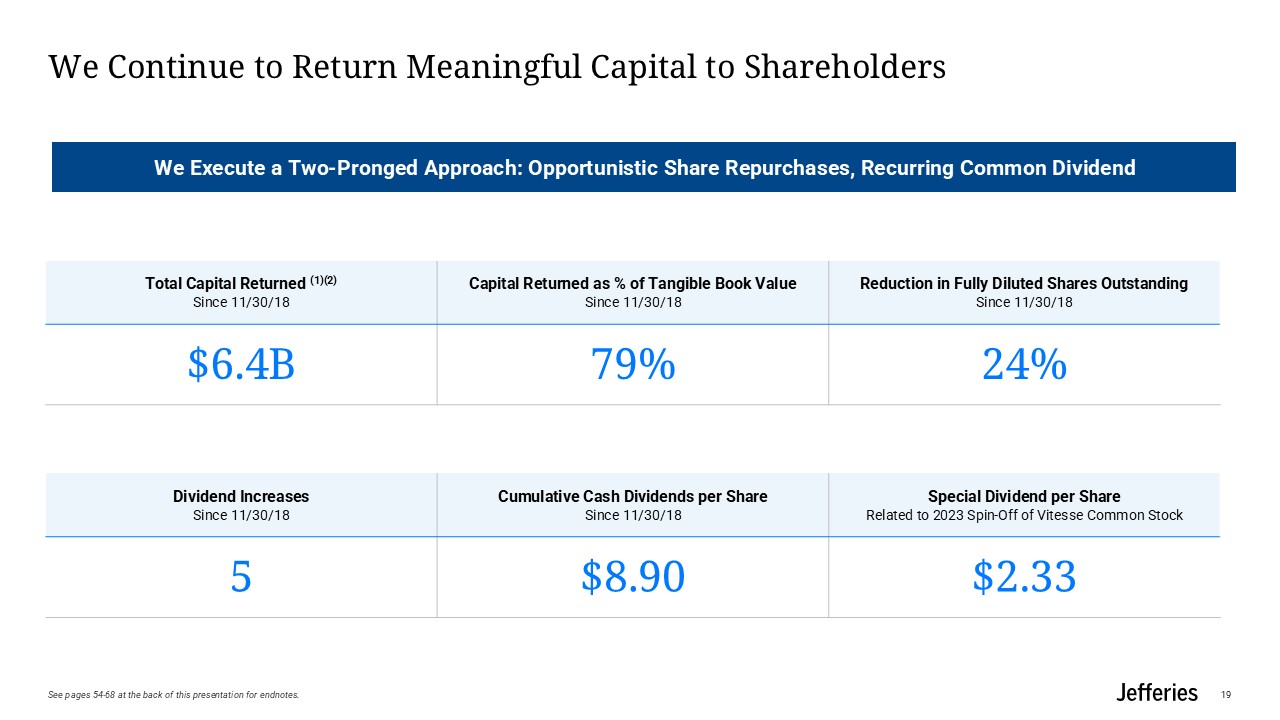
We Continue to Return Meaningful Capital to Shareholders See pages 54-68 at the
back of this presentation for endnotes. 19 Total Capital Returned (1)(2) Since 11/30/18 Capital Returned as % of Tangible Book Value Since 11/30/18 Reduction in Fully Diluted Shares Outstanding Since 11/30/18 $6.4B 79% 24% Dividend
Increases Since 11/30/18 Cumulative Cash Dividends per Share Since 11/30/18 Special Dividend per Share Related to 2023 Spin-Off of Vitesse Common Stock 5 $8.90 $2.33 We Execute a Two-Pronged Approach: Opportunistic Share Repurchases,
Recurring Common Dividend
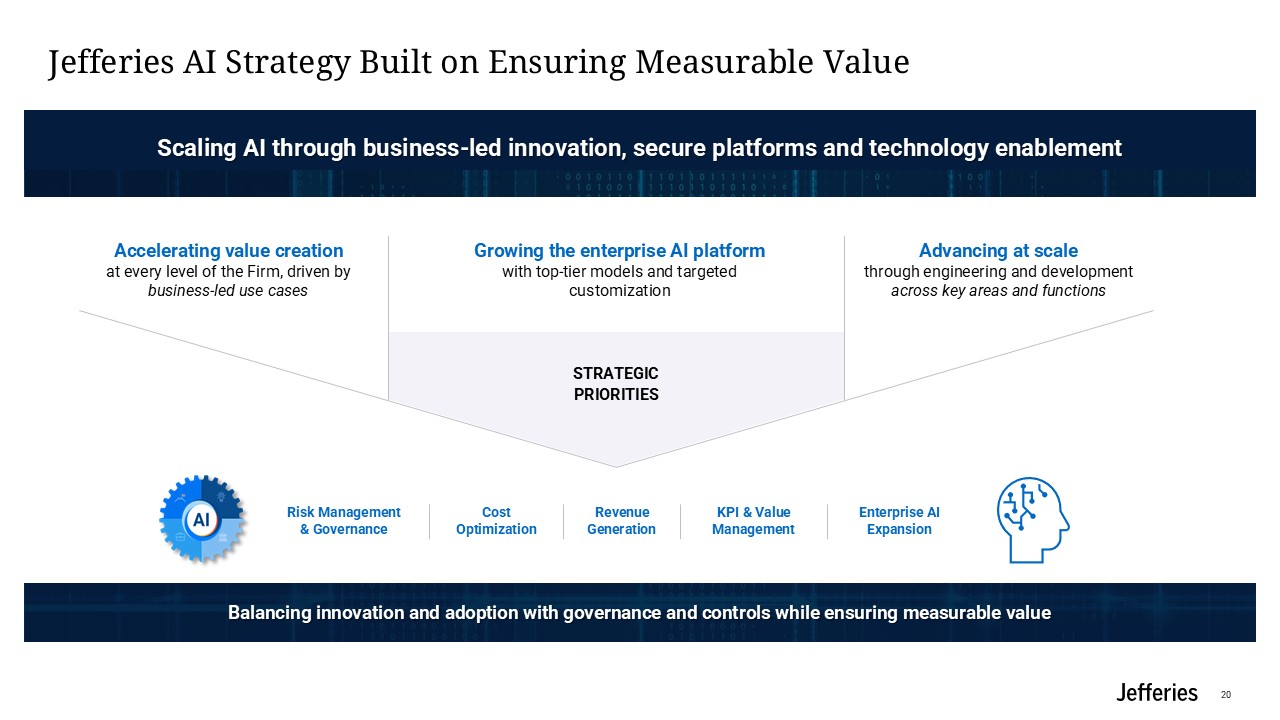
Jefferies AI Strategy Built on Ensuring Measurable Value Accelerating value
creation at every level of the Firm, driven by business-led use cases Growing the enterprise AI platform with top-tier models and targeted customization Advancing at scale through engineering and development across key areas and
functions Scaling AI through business-led innovation, secure platforms and technology enablement Balancing innovation and adoption with governance and controls while ensuring measurable value STRATEGIC PRIORITIES Risk Management &
Governance Cost Optimization Revenue Generation KPI & Value Management Enterprise AI Expansion 20

Investment Banking Business Review 21
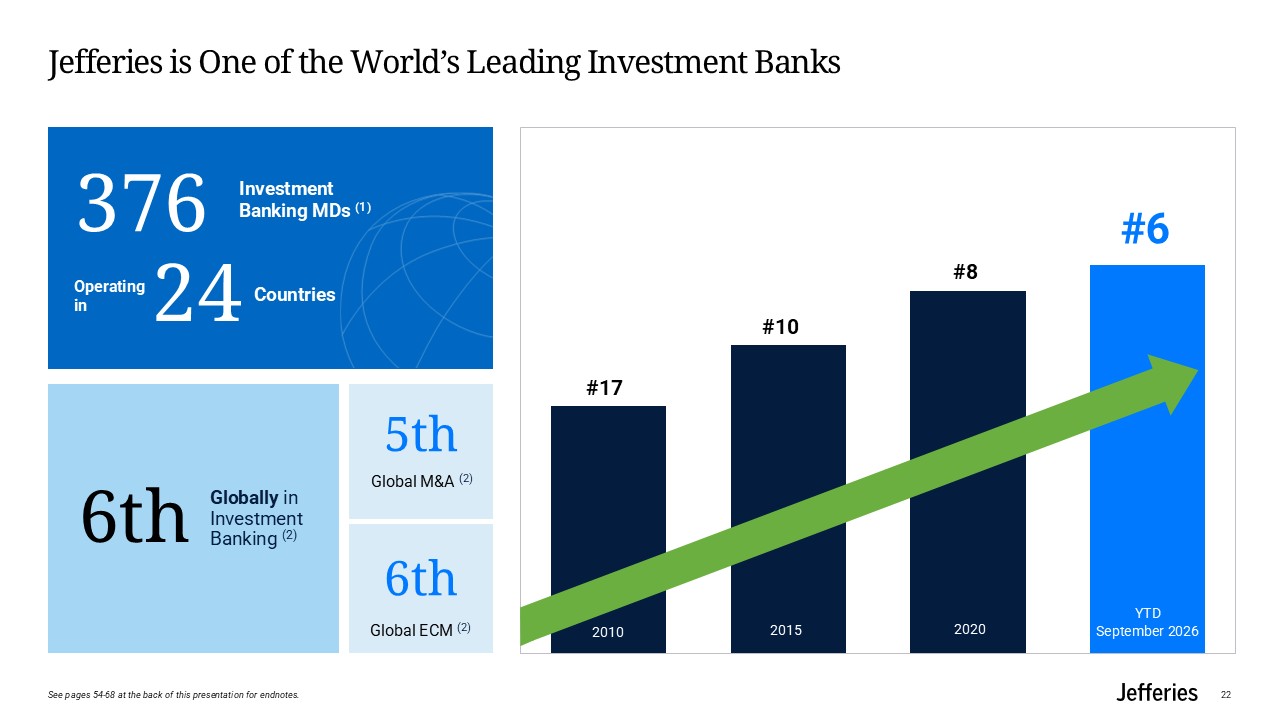
Jefferies is One of the World’s Leading Investment Banks 22 YTDSeptember
2026 8 6 2010 #17 2015 2020 2020 #10 #8 #6 376 Investment Banking MDs (1) 6th Globally in Investment Banking (2) 5th Global M&A (2) 6th Global ECM (2) Countries Operating in 24 See pages 54-68 at the back of this
presentation for endnotes.
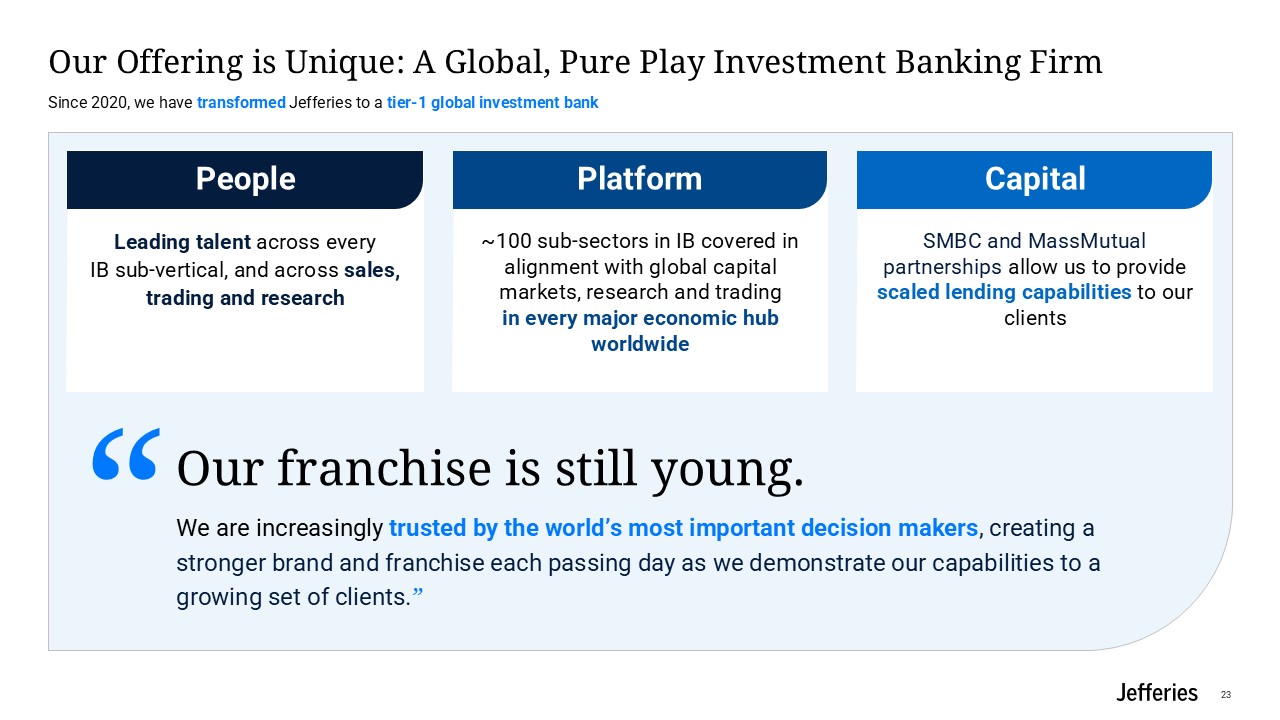
Our Offering is Unique: A Global, Pure Play Investment Banking Firm 23 Since
2020, we have transformed Jefferies to a tier-1 global investment bank Leading talent across every IB sub-vertical, and across sales, trading and research People SMBC and MassMutual partnerships allow us to provide scaled lending
capabilities to our clients Capital ~100 sub-sectors in IB covered in alignment with global capital markets, research and trading in every major economic hub worldwide Platform Our franchise is still young. We are increasingly trusted by
the world’s most important decision makers, creating a stronger brand and franchise each passing day as we demonstrate our capabilities to a growing set of clients.” “
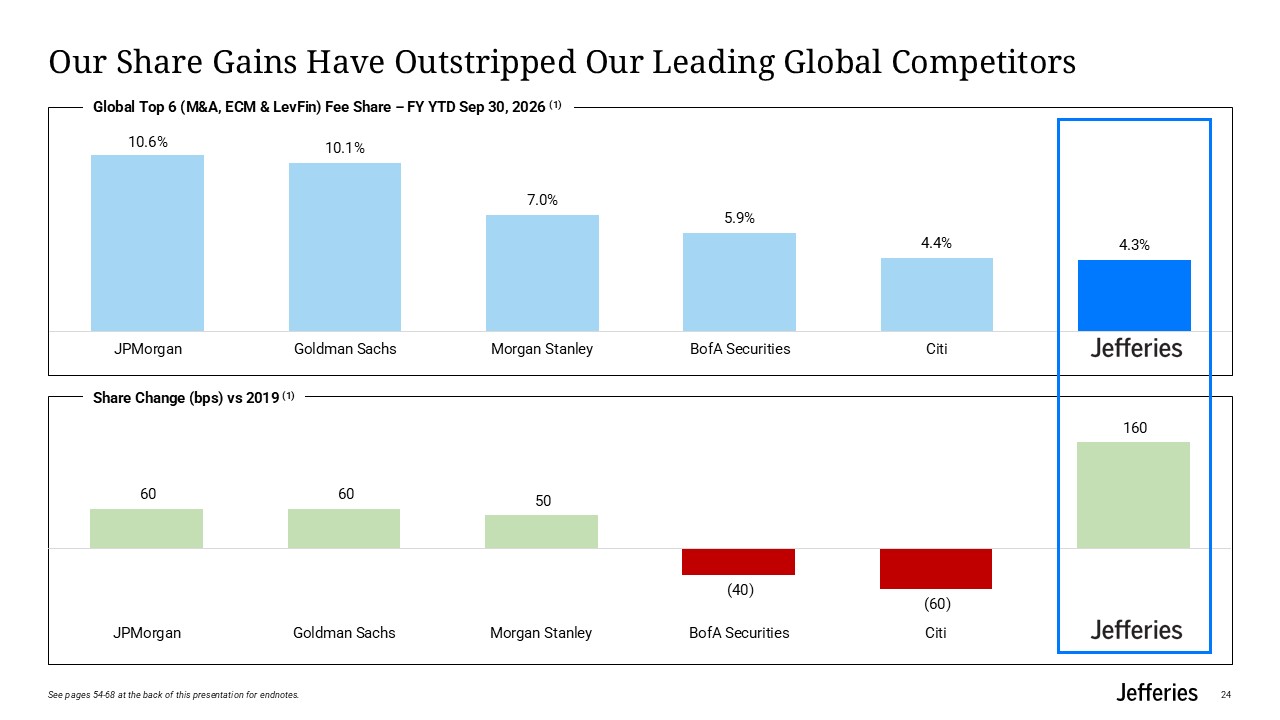
Our Share Gains Have Outstripped Our Leading Global Competitors Global Top 6
(M&A, ECM & LevFin) Fee Share – FY YTD Sep 30, 2026 (1) Share Change (bps) vs 2019 (1) 24 See pages 54-68 at the back of this presentation for endnotes.
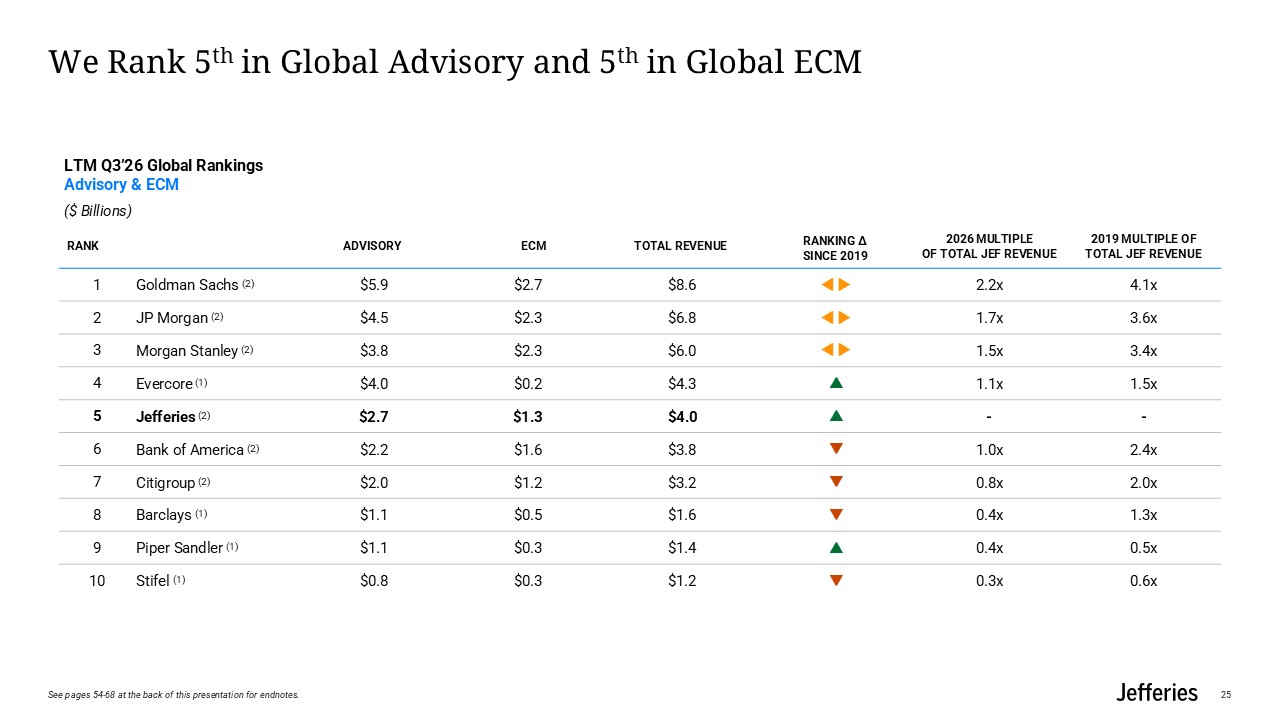
We Rank 5th in Global Advisory and 5th in Global ECM 25 LTM Q3’26 Global
Rankings Advisory & ECM ($ Billions) Rank Advisory Ecm Total Revenue Ranking Δ Since 2019 2026 Multiple of TOTAL JEF Revenue 2019 Multiple of TOTAL JEF Revenue 1 Goldman Sachs (2) $5.9 $2.7 $8.6
2.2x 4.1x 2 JP Morgan (2) $4.5 $2.3 $6.8 1.7x 3.6x 3 Morgan Stanley (2) $3.8 $2.3 $6.0 1.5x 3.4x 4 Evercore (1) $4.0 $0.2 $4.3 1.1x 1.5x 5 Jefferies (2) $2.7 $1.3 $4.0
- - 6 Bank of America (2) $2.2 $1.6 $3.8 1.0x 2.4x 7 Citigroup (2) $2.0 $1.2 $3.2 0.8x 2.0x 8 Barclays (1) $1.1 $0.5 $1.6 0.4x 1.3x 9 Piper Sandler (1) $1.1 $0.3 $1.4
0.4x 0.5x 10 Stifel (1) $0.8 $0.3 $1.2 0.3x 0.6x See pages 54-68 at the back of this presentation for endnotes.
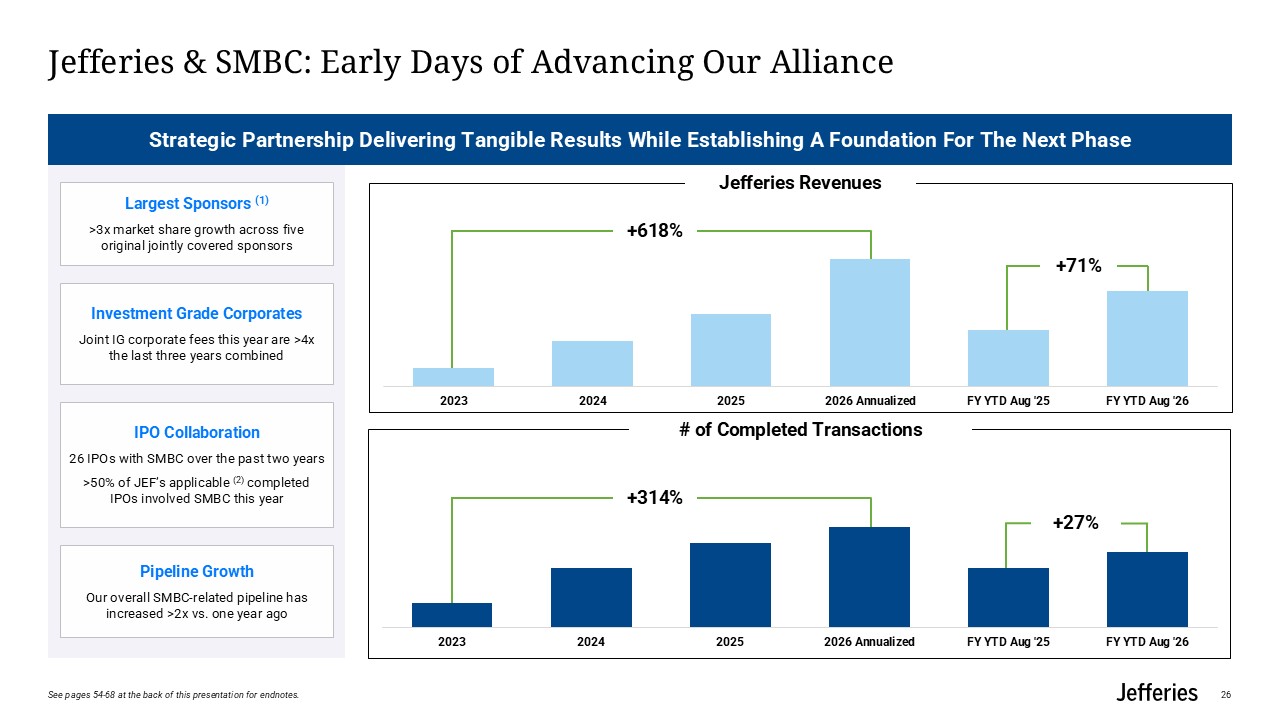
+27% +71% +314% +618% Jefferies & SMBC: Early Days of Advancing Our
Alliance Jefferies Revenues # of Completed Transactions Strategic Partnership Delivering Tangible Results While Establishing A Foundation For The Next Phase Largest Sponsors (1) >3x market share growth across five original jointly
covered sponsors Investment Grade Corporates Joint IG corporate fees this year are >4x the last three years combined IPO Collaboration 26 IPOs with SMBC over the past two years >50% of JEF’s applicable (2) completed IPOs involved
SMBC this year Pipeline Growth Our overall SMBC-related pipeline has increased >2x vs. one year ago 26 See pages 54-68 at the back of this presentation for endnotes.
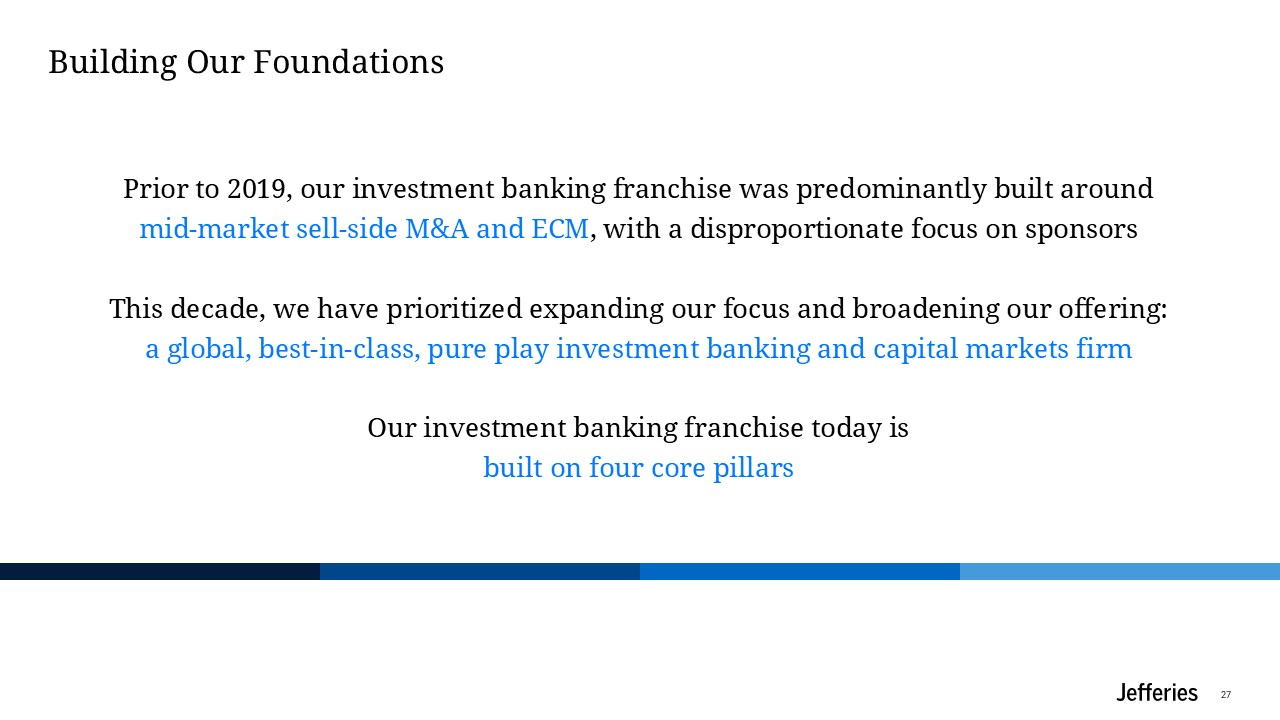
Building Our Foundations 27 Our investment banking franchise today is built on
four core pillars Prior to 2019, our investment banking franchise was predominantly built around mid-market sell-side M&A and ECM, with a disproportionate focus on sponsors This decade, we have prioritized expanding our focus and
broadening our offering: a global, best-in-class, pure play investment banking and capital markets firm
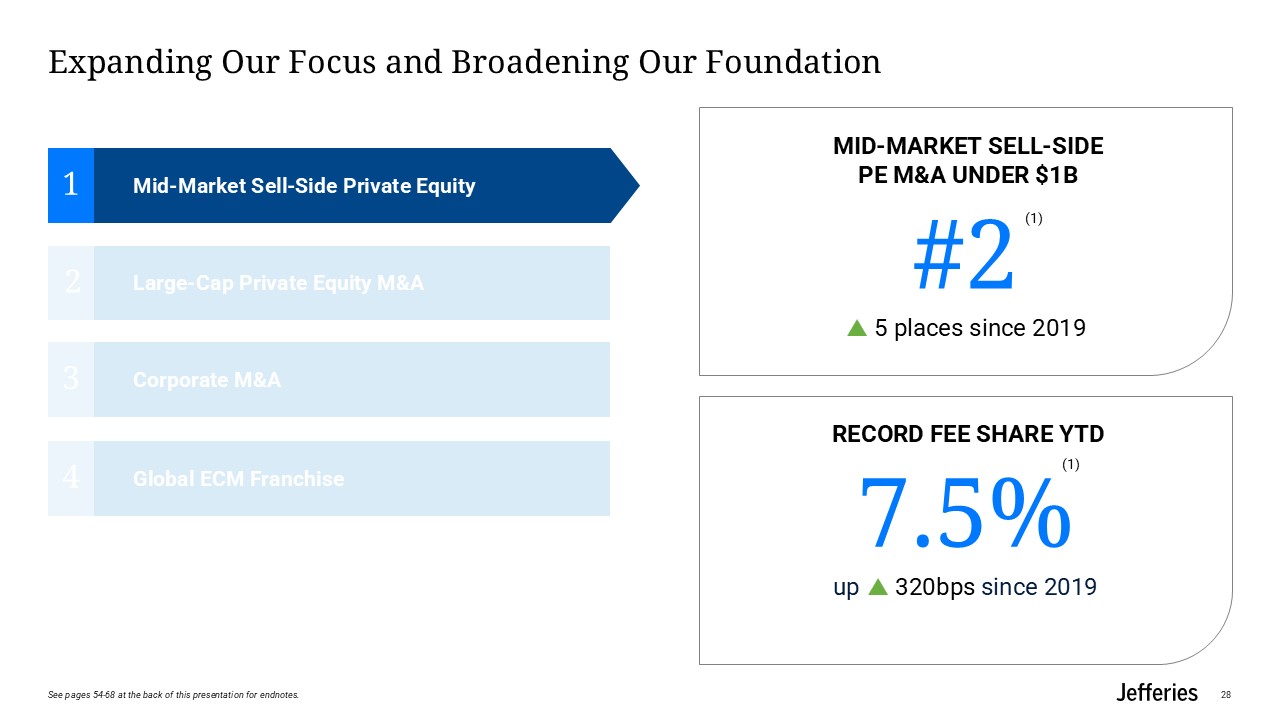
Expanding Our Focus and Broadening Our Foundation 28 Mid-Market Sell-Side
Private Equity 1 3 Corporate M&A 2 Large-Cap Private Equity M&A 4 Global ECM Franchise #2 5 places since 2019 7.5% up 320bps since 2019 Mid-market sell-side PE M&A under $1B Record Fee share YTD (1) (1) See
pages 54-68 at the back of this presentation for endnotes.
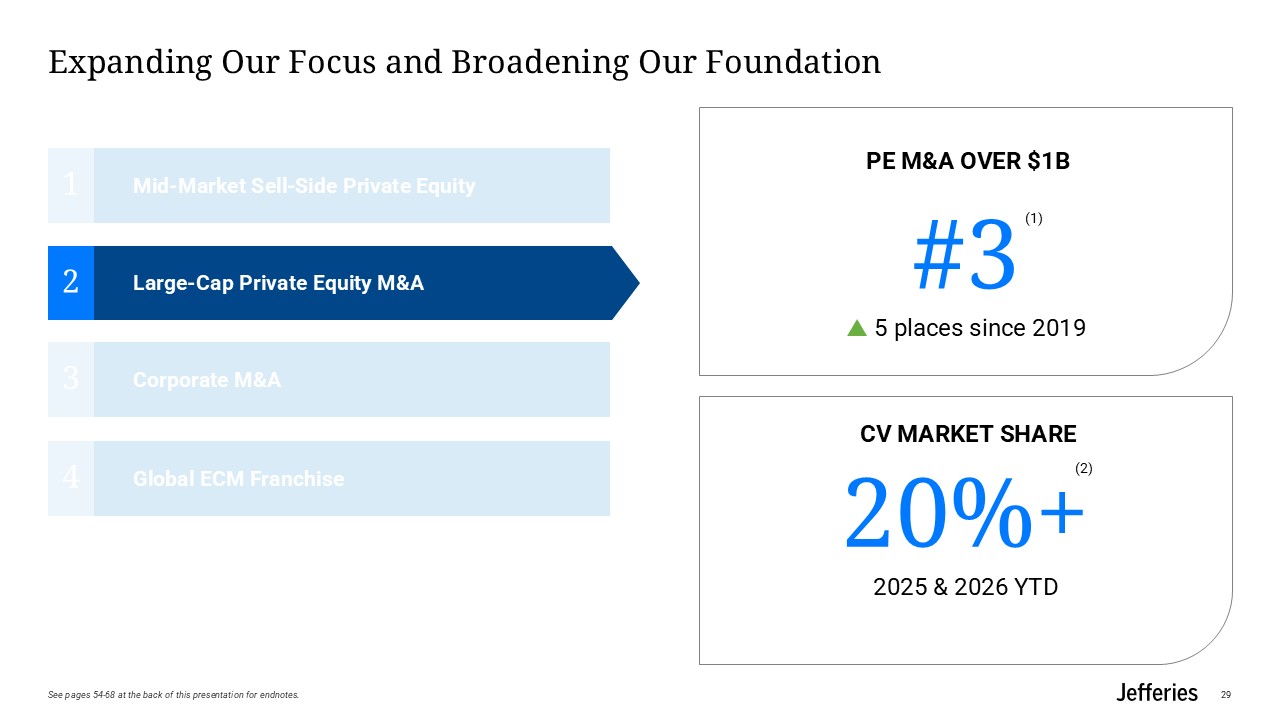
Expanding Our Focus and Broadening Our Foundation 29 Mid-Market Sell-Side
Private Equity 1 4 Global ECM Franchise 2 Large-Cap Private Equity M&A 3 Corporate M&A #3 5 places since 2019 20%+ 2025 & 2026 YTD PE M&A over $1B CV market Share (1) (2) See pages 54-68 at the back of this
presentation for endnotes.
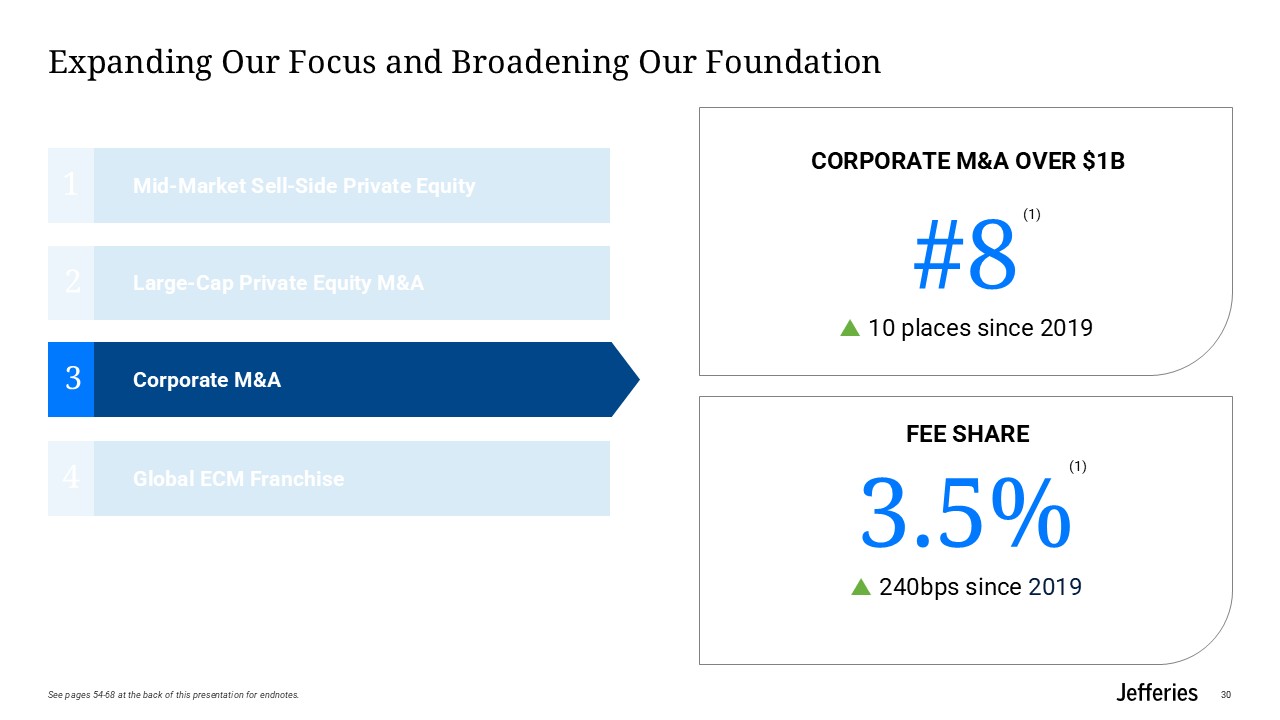
Expanding Our Focus and Broadening Our Foundation 30 Mid-Market Sell-Side
Private Equity 1 4 Global ECM Franchise 2 Large-Cap Private Equity M&A 3 Corporate M&A #8 10 places since 2019 3.5% 240bps since 2019 Corporate M&A over $1B Fee Share (1) (1) See pages 54-68 at the back of this
presentation for endnotes.
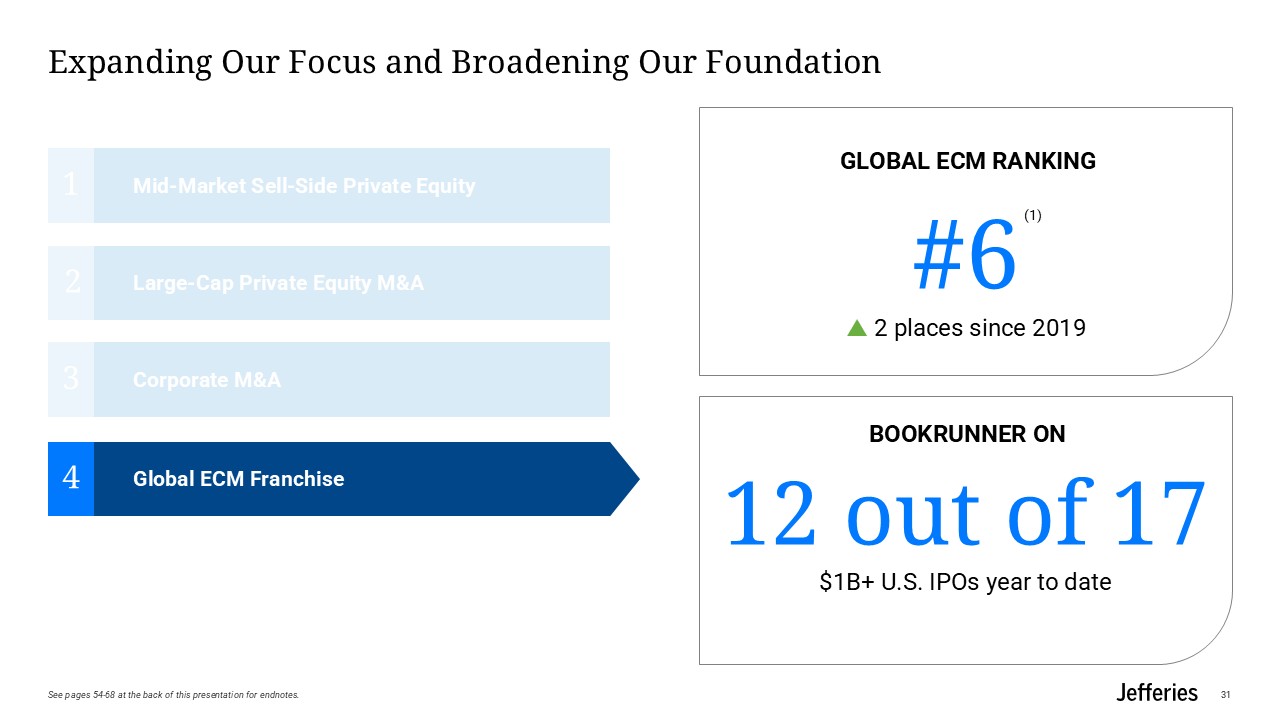
Expanding Our Focus and Broadening Our Foundation 31 Mid-Market Sell-Side
Private Equity 1 2 Large-Cap Private Equity M&A 4 Global ECM Franchise 3 Corporate M&A #6 2 places since 2019 12 out of 17 $1B+ U.S. IPOs year to date Global ecm ranking bookrunner on (1) See pages 54-68 at the back of
this presentation for endnotes.
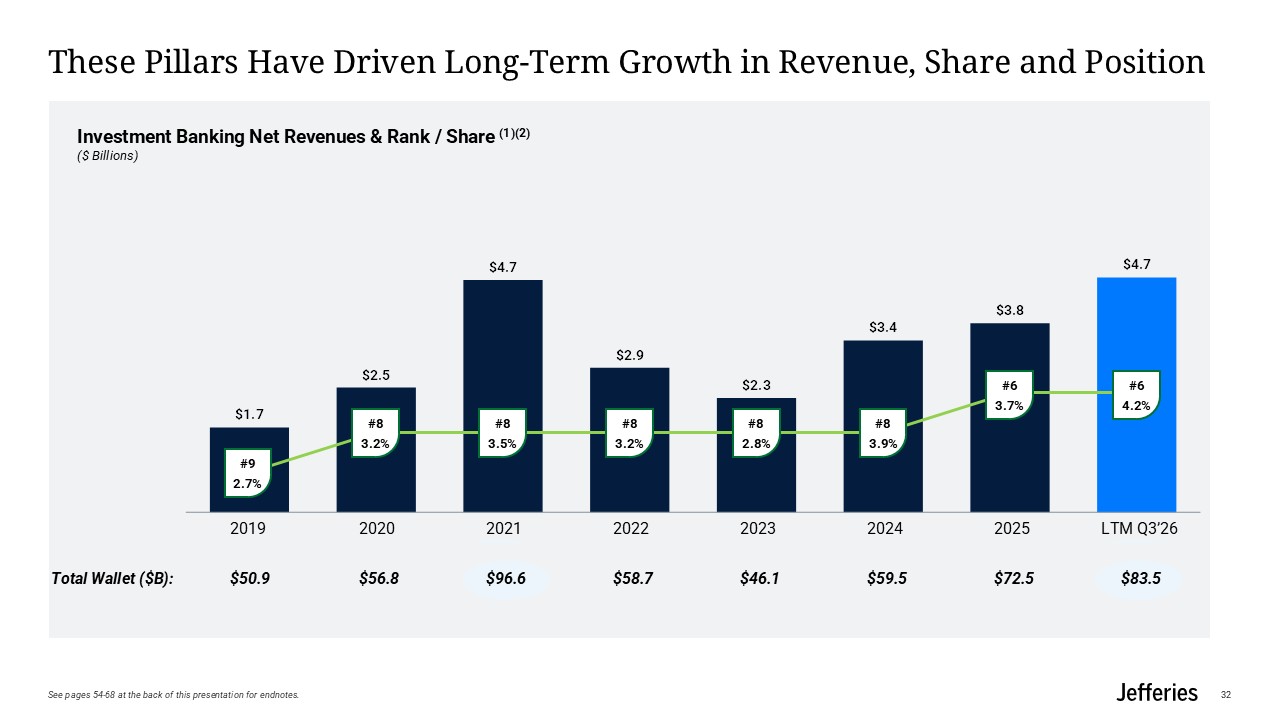
These Pillars Have Driven Long-Term Growth in Revenue, Share and
Position 32 Total Wallet ($B): $50.9 $56.8 $96.6 $58.7 $46.1 $59.5 $72.5 $83.5 #8 3.2% #8 3.5% #8 3.2% #8 2.8% #8 3.9% #6 3.7% #6 4.2% #9 2.7% Investment Banking Net Revenues & Rank / Share (1)(2) ($
Billions) 2019 2020 2021 2022 2023 2024 2025 LTM Q3’26 See pages 54-68 at the back of this presentation for endnotes.

Equities Business review 33
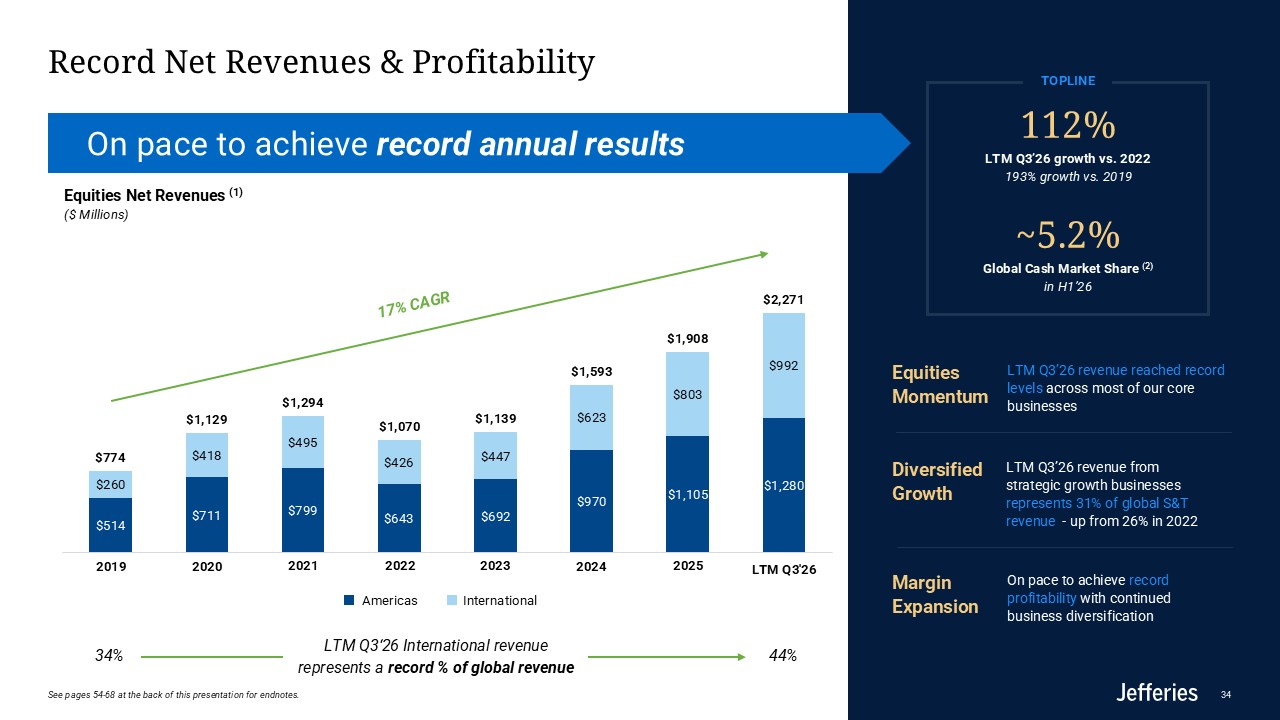
Record Net Revenues & Profitability On pace to achieve record annual
results Equities Net Revenues (1) ($ Millions) 34% 44% LTM Q3‘26 International revenue represents a record % of global revenue 17% CAGR International Americas 112% LTM Q3’26 growth vs. 2022 193% growth vs. 2019 ~5.2% Global Cash
Market Share (2) in H1’26 TOPLINE LTM Q3’26 revenue from strategic growth businesses represents 31% of global S&T revenue - up from 26% in 2022 Diversified Growth LTM Q3’26 revenue reached record levels across most of our core
businesses Equities Momentum On pace to achieve record profitability with continued business diversification Margin Expansion 2022 2021 2020 2019 2023 2024 2025 34 See pages 54-68 at the back of this presentation for endnotes.
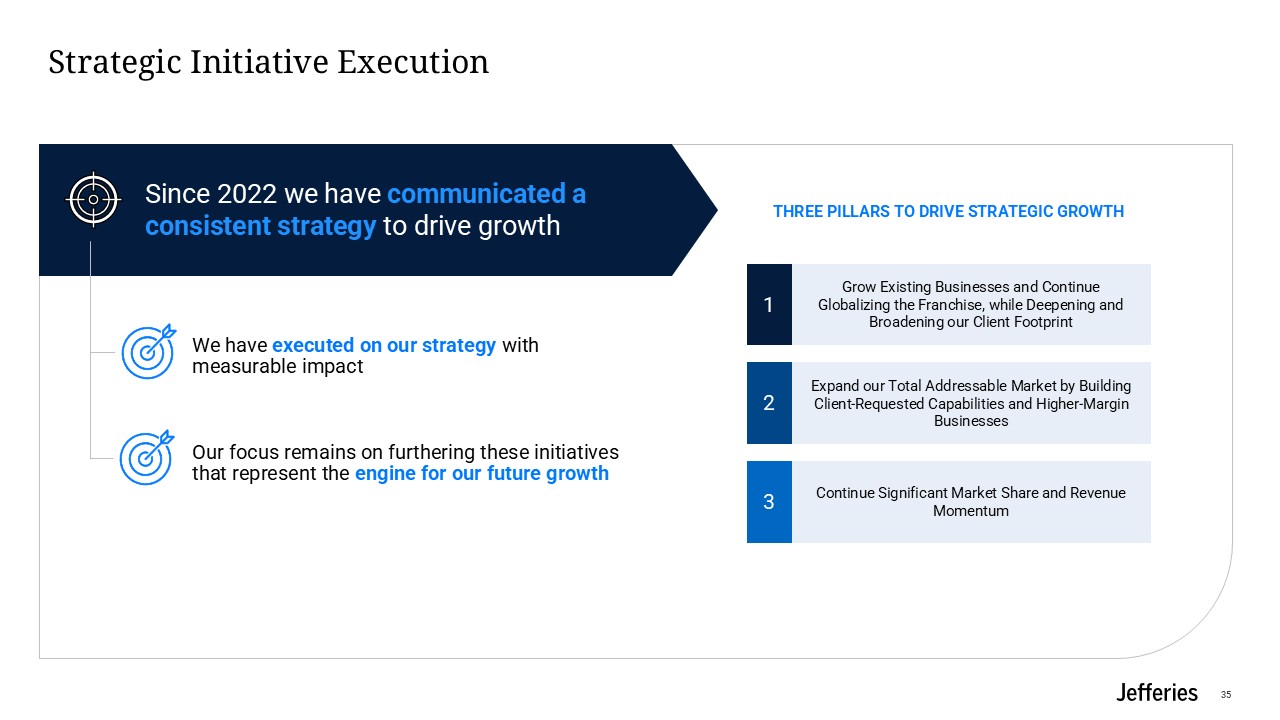
THREE PILLARS TO DRIVE STRATEGIC GROWTH 1 Grow Existing Businesses and Continue
Globalizing the Franchise, while Deepening and Broadening our Client Footprint 2 Expand our Total Addressable Market by Building Client-Requested Capabilities and Higher-Margin Businesses 3 Continue Significant Market Share and Revenue
Momentum Strategic Initiative Execution Our focus remains on furthering these initiatives that represent the engine for our future growth We have executed on our strategy with measurable impact Since 2022 we have communicated a consistent
strategy to drive growth 35
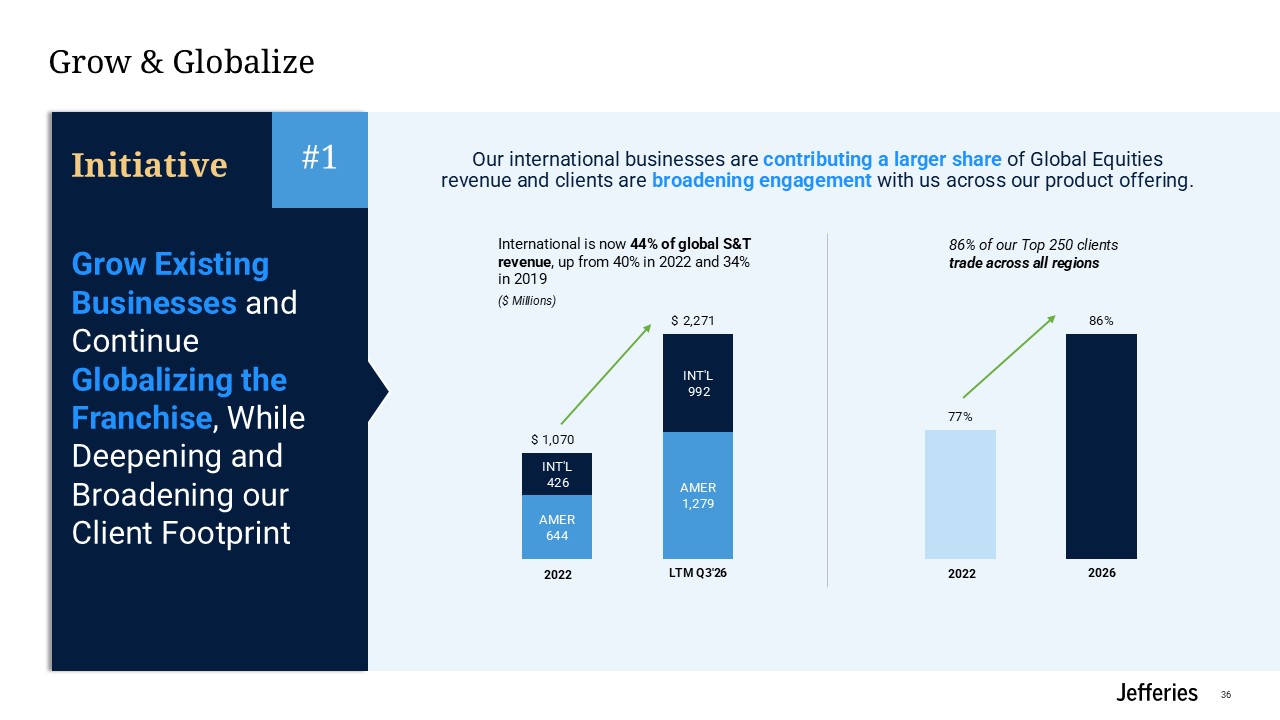
Initiative Grow Existing Businesses and Continue Globalizing the Franchise, While
Deepening and Broadening our Client Footprint Grow & Globalize International is now 44% of global S&T revenue, up from 40% in 2022 and 34% in 2019 86% of our Top 250 clients trade across all regions ($ Millions) Our international
businesses are contributing a larger share of Global Equities revenue and clients are broadening engagement with us across our product offering. #1 2022 2022 $ $ 36
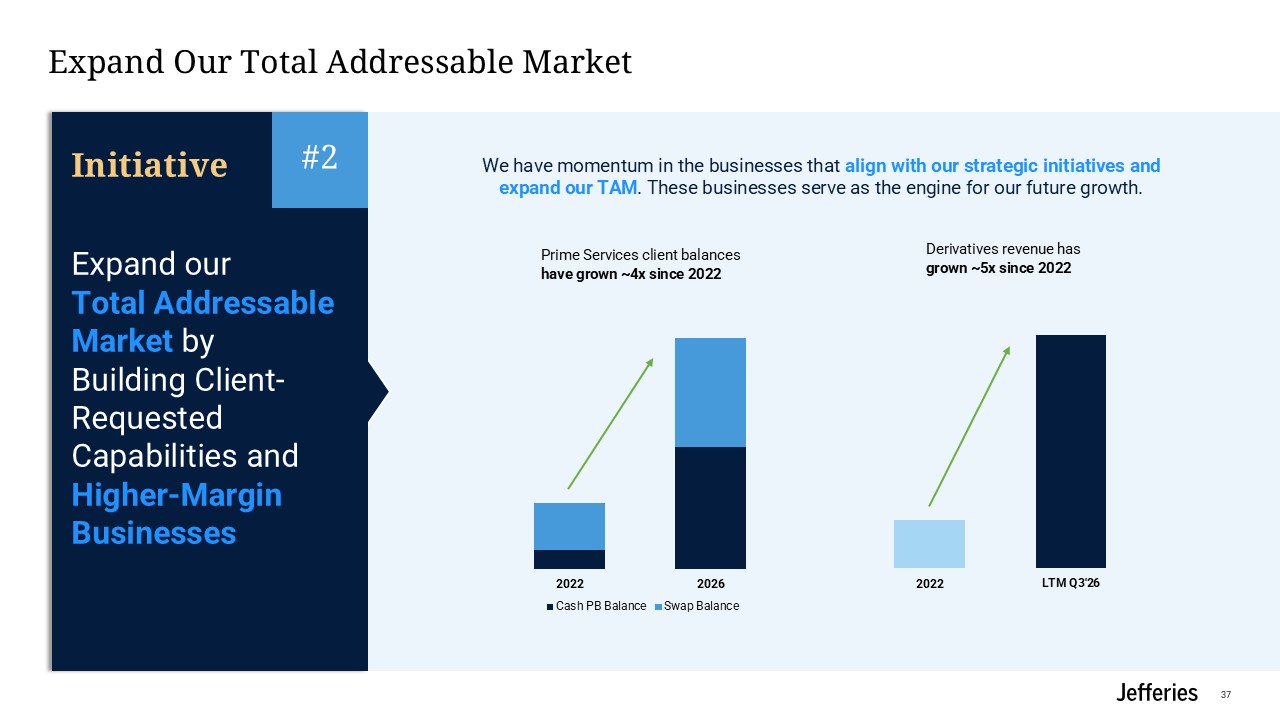
Initiative Expand our Total Addressable Market by Building Client-Requested
Capabilities and Higher-Margin Businesses Expand Our Total Addressable Market We have momentum in the businesses that align with our strategic initiatives and expand our TAM. These businesses serve as the engine for our future
growth. #2 #2 Prime Services client balances have grown ~4x since 2022 Derivatives revenue has grown ~5x since 2022 2022 37
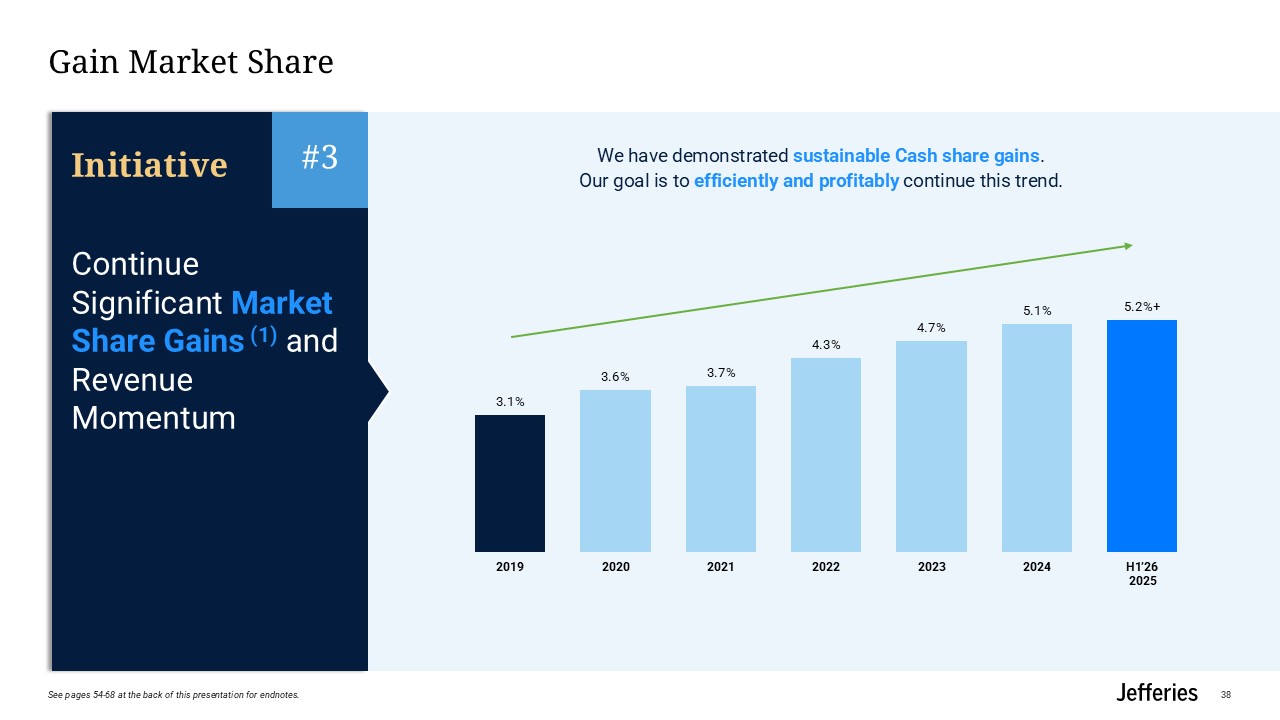
Initiative Continue Significant Market Share Gains (1) and Revenue Momentum Gain
Market Share We have demonstrated sustainable Cash share gains. Our goal is to efficiently and profitably continue this trend. #3 #3 H1’26 38 See pages 54-68 at the back of this presentation for endnotes.
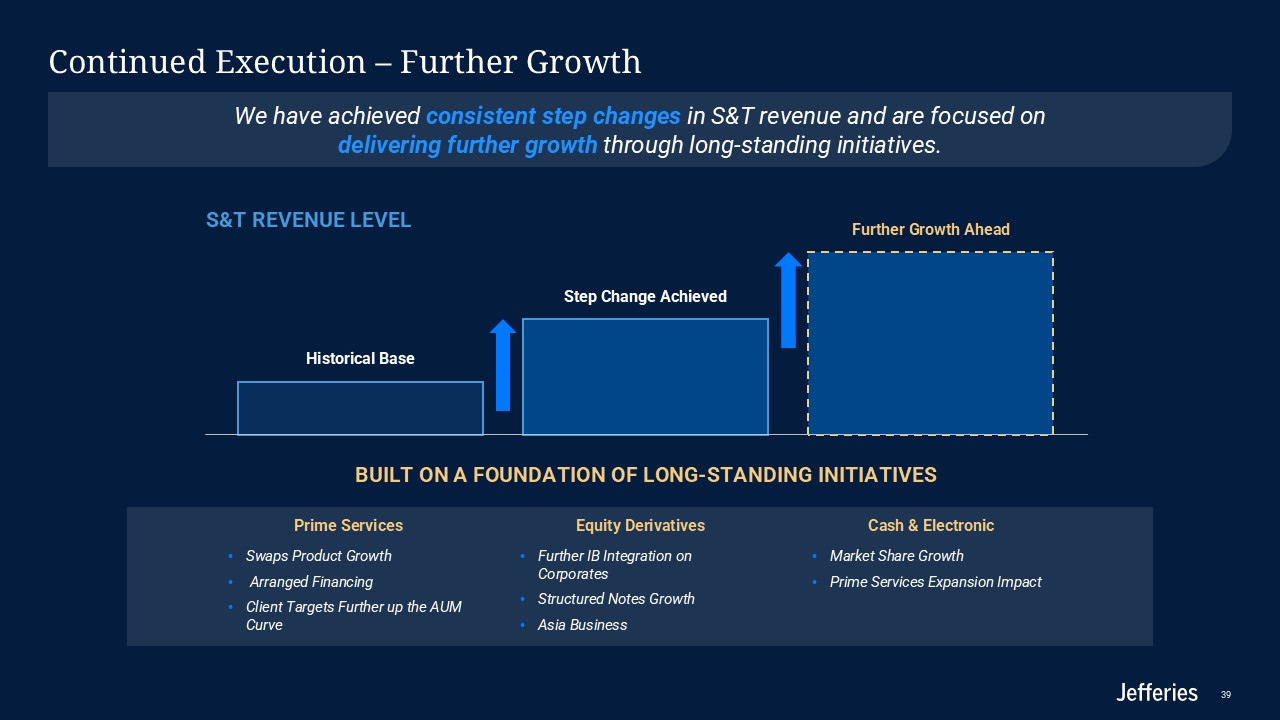
Continued Execution – Further Growth We have achieved consistent step changes in
S&T revenue and are focused on delivering further growth through long-standing initiatives. Historical Base Step Change Achieved Further Growth Ahead S&T REVENUE LEVEL BUILT ON A FOUNDATION OF LONG-STANDING INITIATIVES Cash &
Electronic Market Share Growth Prime Services Expansion Impact Prime Services Swaps Product Growth Arranged Financing Client Targets Further up the AUM Curve Equity Derivatives Further IB Integration on Corporates Structured Notes
Growth Asia Business 39
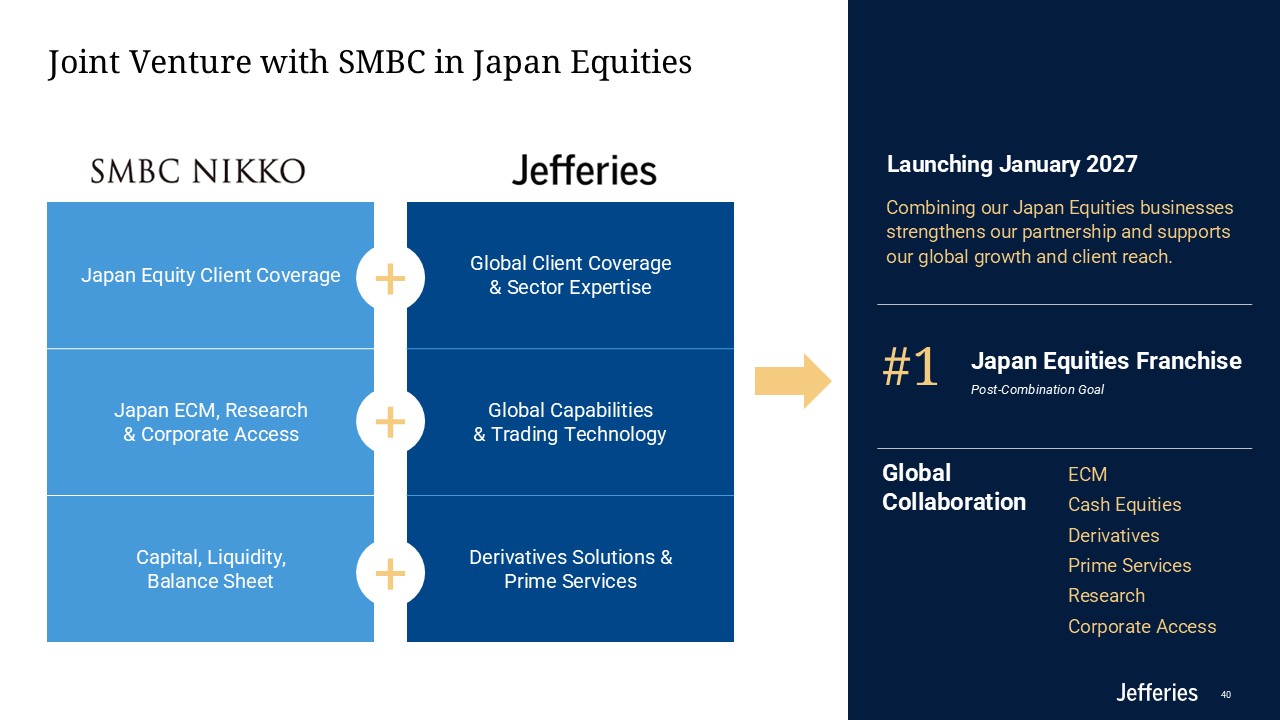
Global Collaboration ECM Cash Equities Derivatives Prime
Services Research Corporate Access Japan Equity Client Coverage Japan ECM, Research & Corporate Access Capital, Liquidity, Balance Sheet Global Client Coverage & Sector Expertise Global Capabilities & Trading
Technology Derivatives Solutions & Prime Services Joint Venture with SMBC in Japan Equities 40 #1 Japan Equities Franchise Post-Combination Goal Combining our Japan Equities businesses strengthens our partnership and supports our
global growth and client reach. + + + Launching January 2027 40

Fixed Income Business Review 41
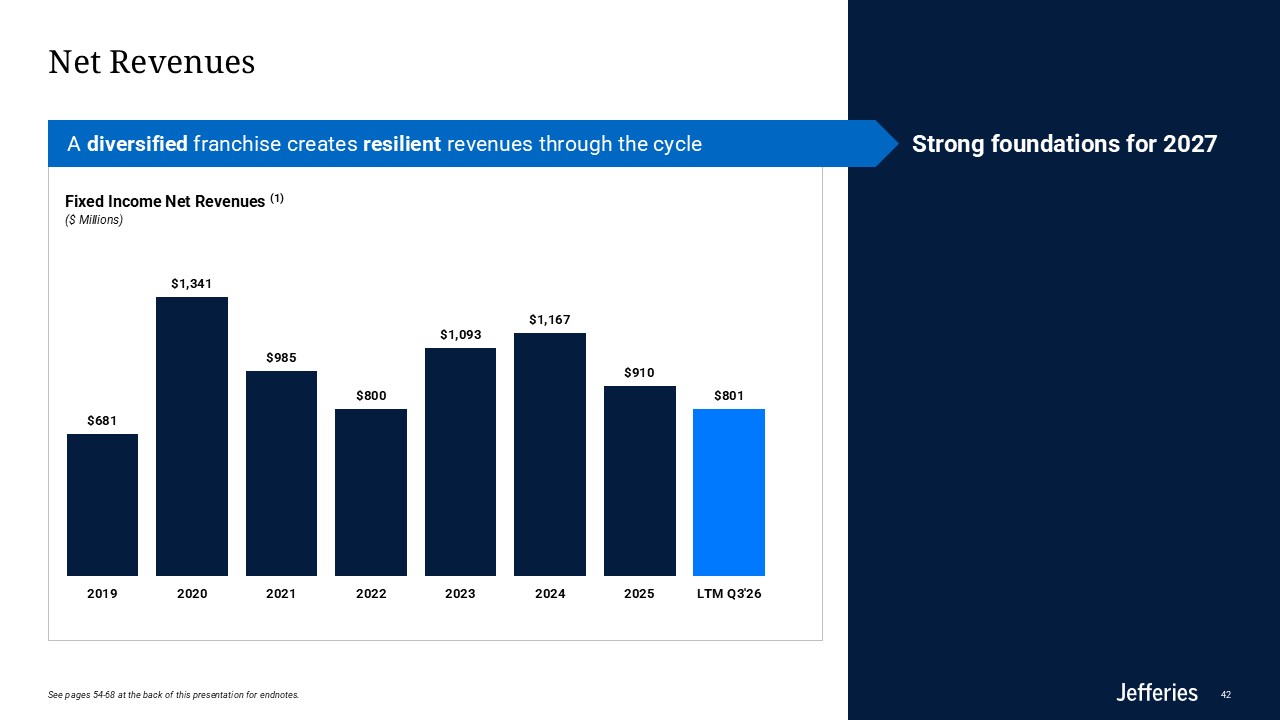
A diversified franchise creates resilient revenues through the cycle Net
Revenues 42 Fixed Income Net Revenues (1) ($ Millions) Strong foundations for 2027 See pages 54-68 at the back of this presentation for endnotes.
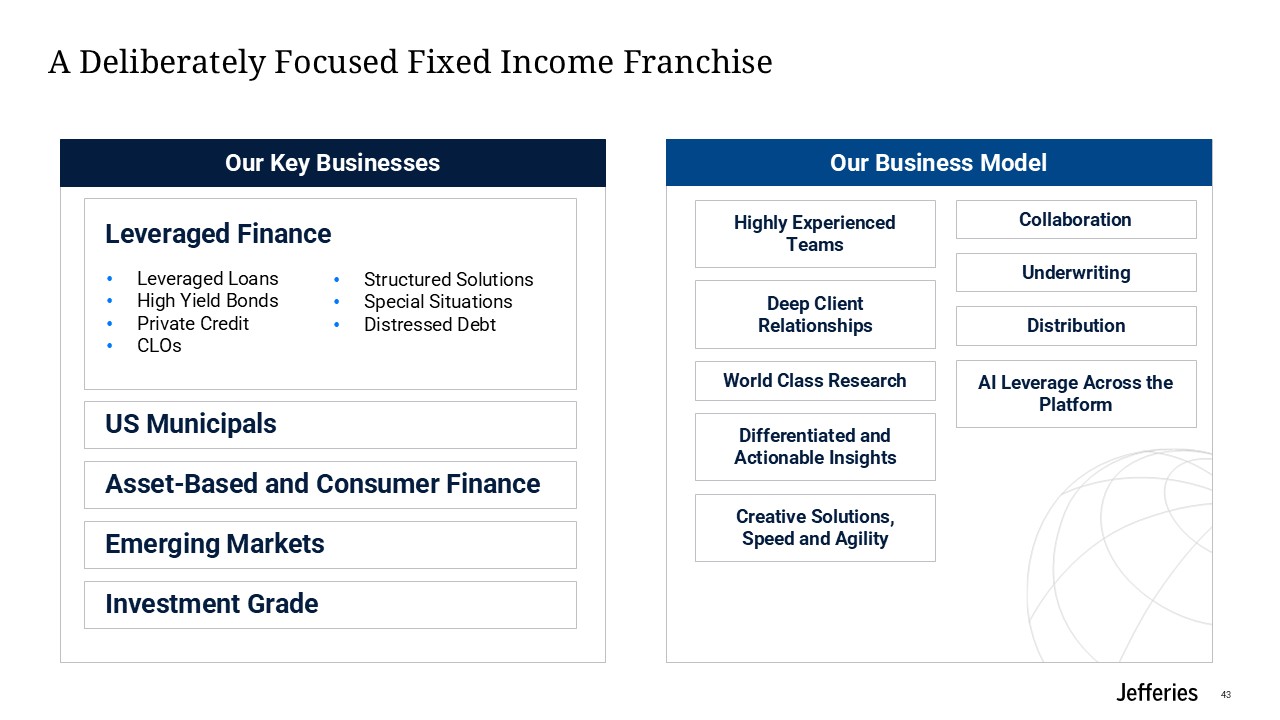
A Deliberately Focused Fixed Income Franchise 43 Our Business Model Our Key
Businesses Leveraged Finance US Municipals Asset-Based and Consumer Finance Emerging Markets Investment Grade Highly Experienced Teams Deep Client Relationships World Class Research Differentiated and Actionable Insights Creative
Solutions, Speed and Agility Distribution AI Leverage Across the Platform Collaboration Underwriting Structured Solutions Special Situations Distressed Debt Leveraged Loans High Yield Bonds Private Credit CLOs
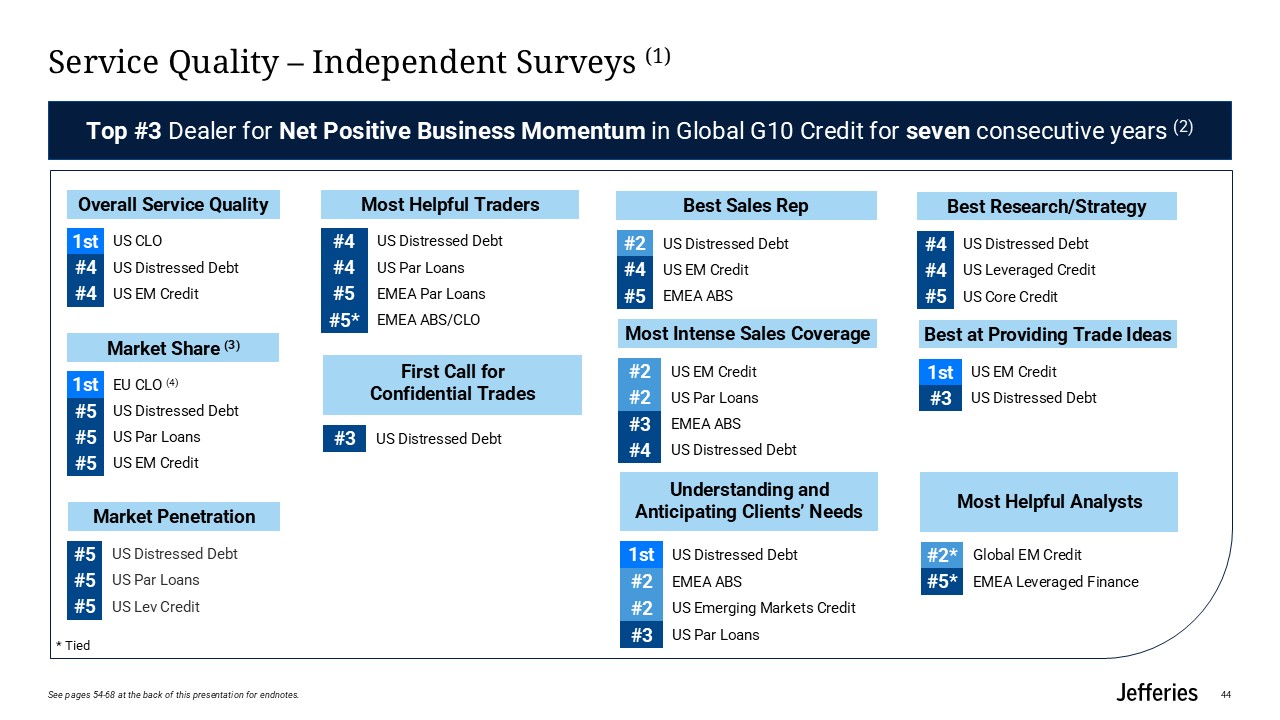
Service Quality – Independent Surveys (1) 44 #2 US Distressed Debt #4 US EM
Credit #5 EMEA ABS #4 US Distressed Debt #4 US Par Loans #5 EMEA Par Loans #5* EMEA ABS/CLO #2 US EM Credit #2 US Par Loans #3 EMEA ABS #4 US Distressed Debt #5 US Distressed Debt #5 US Par Loans #5 US Lev
Credit 1st EU CLO (4) #5 US Distressed Debt #5 US Par Loans #5 US EM Credit Market Penetration Market Share (3) Most Helpful Traders Most Intense Sales Coverage Best Sales Rep 1st US CLO #4 US Distressed Debt #4 US EM
Credit Overall Service Quality #3 US Distressed Debt First Call for Confidential Trades 1st US Distressed Debt #2 EMEA ABS #2 US Emerging Markets Credit #3 US Par Loans Understanding and Anticipating Clients’ Needs #4 US
Distressed Debt #4 US Leveraged Credit #5 US Core Credit 1st US EM Credit #3 US Distressed Debt Best at Providing Trade Ideas Best Research/Strategy #2* Global EM Credit #5* EMEA Leveraged Finance Most Helpful Analysts Top #3
Dealer for Net Positive Business Momentum in Global G10 Credit for seven consecutive years (2) * Tied See pages 54-68 at the back of this presentation for endnotes.

Asset Management Business Review 45
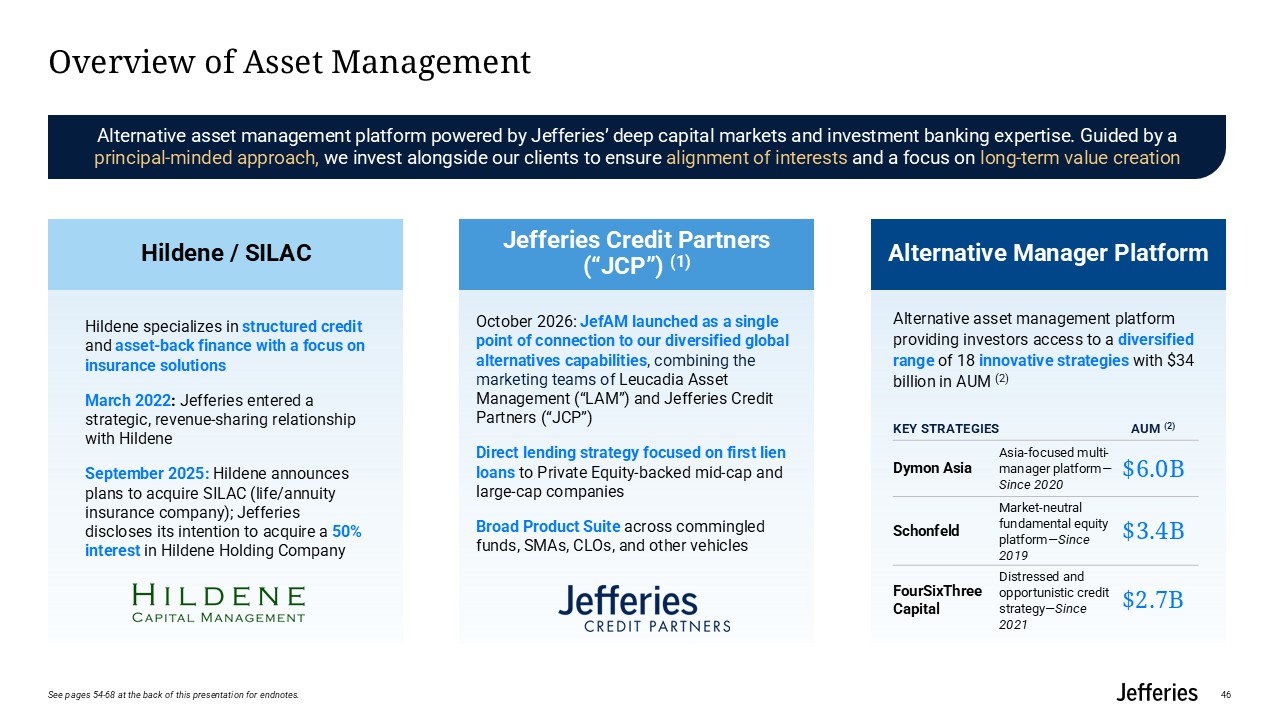
Jefferies Credit Partners (“JCP”) (1) October 2026: JefAM launched as a single
point of connection to our diversified global alternatives capabilities, combining the marketing teams of Leucadia Asset Management (“LAM”) and Jefferies Credit Partners (“JCP”) Direct lending strategy focused on first lien loans to Private
Equity-backed mid-cap and large-cap companies Broad Product Suite across commingled funds, SMAs, CLOs, and other vehicles Overview of Asset Management Hildene / SILAC Alternative Manager Platform Alternative asset management platform
powered by Jefferies’ deep capital markets and investment banking expertise. Guided by a principal-minded approach, we invest alongside our clients to ensure alignment of interests and a focus on long-term value creation Hildene specializes
in structured credit and asset-back finance with a focus on insurance solutions March 2022: Jefferies entered a strategic, revenue-sharing relationship with Hildene September 2025: Hildene announces plans to acquire SILAC (life/annuity
insurance company); Jefferies discloses its intention to acquire a 50% interest in Hildene Holding Company Alternative asset management platform providing investors access to a diversified range of 18 innovative strategies with $34 billion in
AUM (2) KEY STRATEGIES AUM (2) Dymon Asia Asia-focused multi-manager platform—Since 2020 $6.0B Schonfeld Market-neutral fundamental equity platform—Since 2019 $3.4B FourSixThree Capital Distressed and opportunistic credit
strategy—Since 2021 $2.7B 46 See pages 54-68 at the back of this presentation for endnotes.
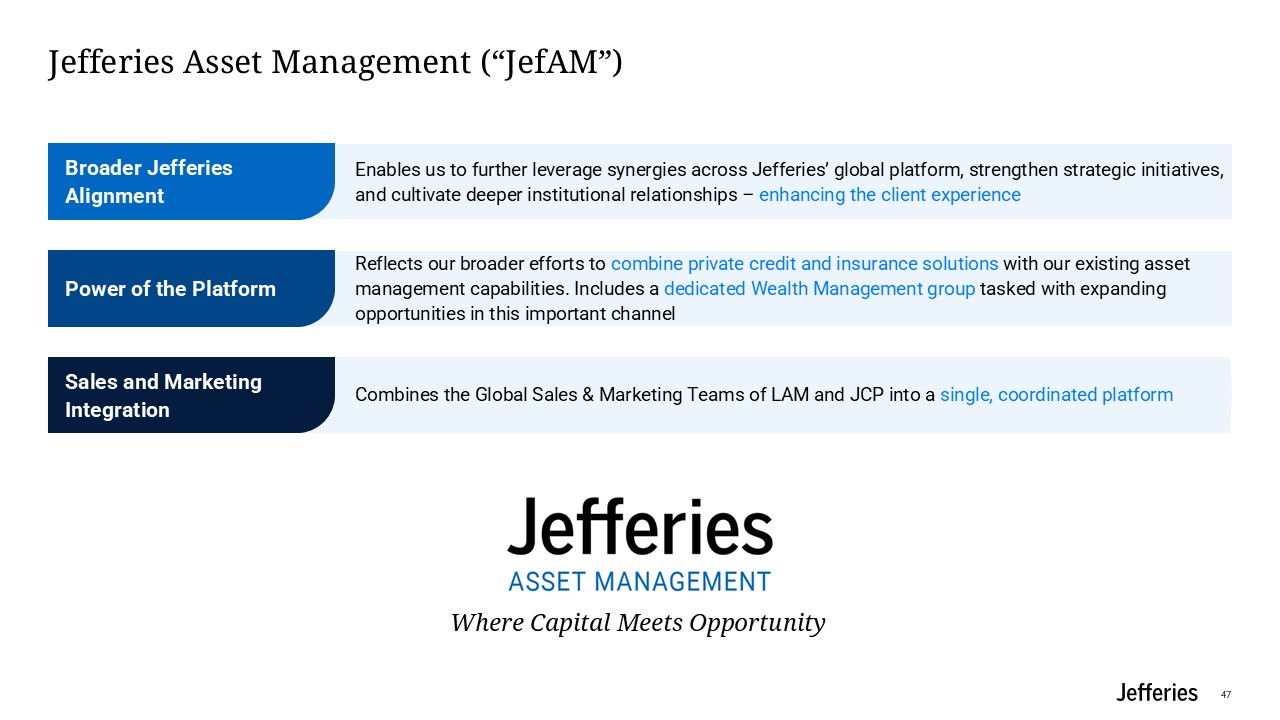
Enables us to further leverage synergies across Jefferies’ global platform,
strengthen strategic initiatives, and cultivate deeper institutional relationships – enhancing the client experience Broader Jefferies Alignment Reflects our broader efforts to combine private credit and insurance solutions with our existing
asset management capabilities. Includes a dedicated Wealth Management group tasked with expanding opportunities in this important channel Power of the Platform Combines the Global Sales & Marketing Teams of LAM and JCP into a single,
coordinated platform Sales and Marketing Integration Jefferies Asset Management (“JefAM”) Where Capital Meets Opportunity 47
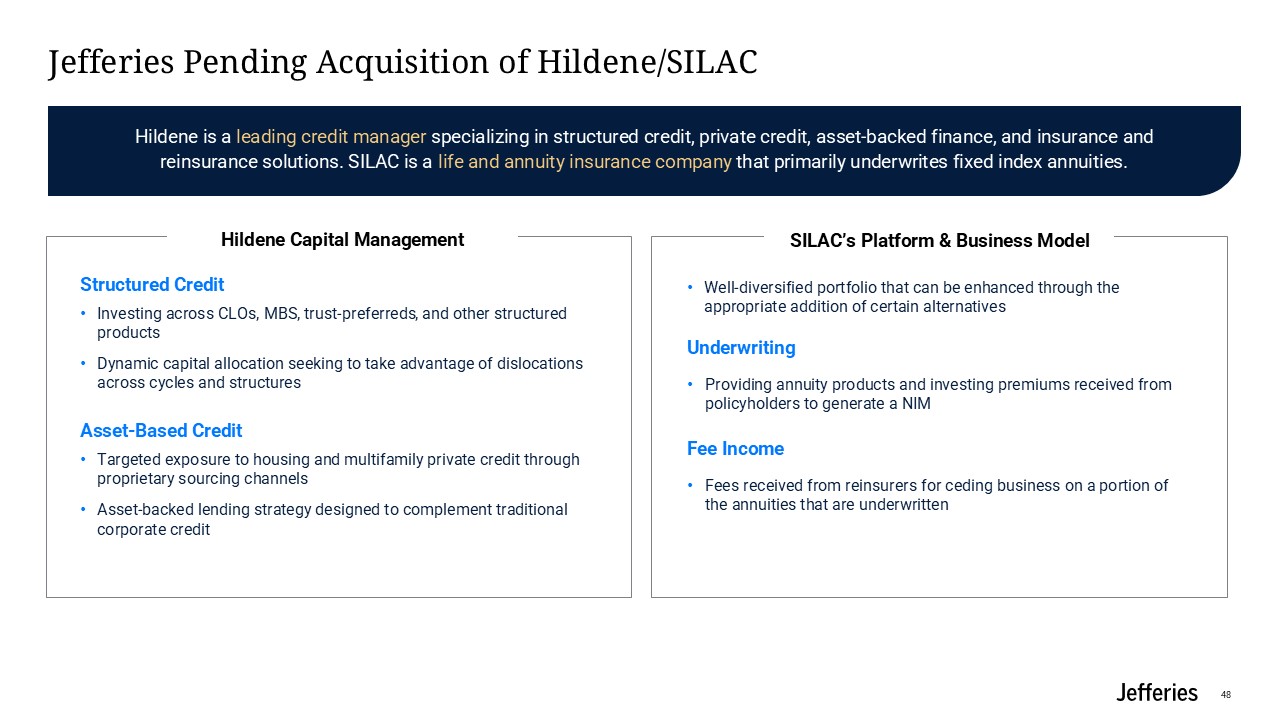
Jefferies Pending Acquisition of Hildene/SILAC Hildene Capital
Management SILAC’s Platform & Business Model Well-diversified portfolio that can be enhanced through the appropriate addition of certain alternatives Underwriting Providing annuity products and investing premiums received from
policyholders to generate a NIM Fee Income Fees received from reinsurers for ceding business on a portion of the annuities that are underwritten Hildene is a leading credit manager specializing in structured credit, private credit,
asset-backed finance, and insurance and reinsurance solutions. SILAC is a life and annuity insurance company that primarily underwrites fixed index annuities. Structured Credit Investing across CLOs, MBS, trust-preferreds, and other
structured products Dynamic capital allocation seeking to take advantage of dislocations across cycles and structures Asset-Based Credit Targeted exposure to housing and multifamily private credit through proprietary sourcing
channels Asset-backed lending strategy designed to complement traditional corporate credit 48
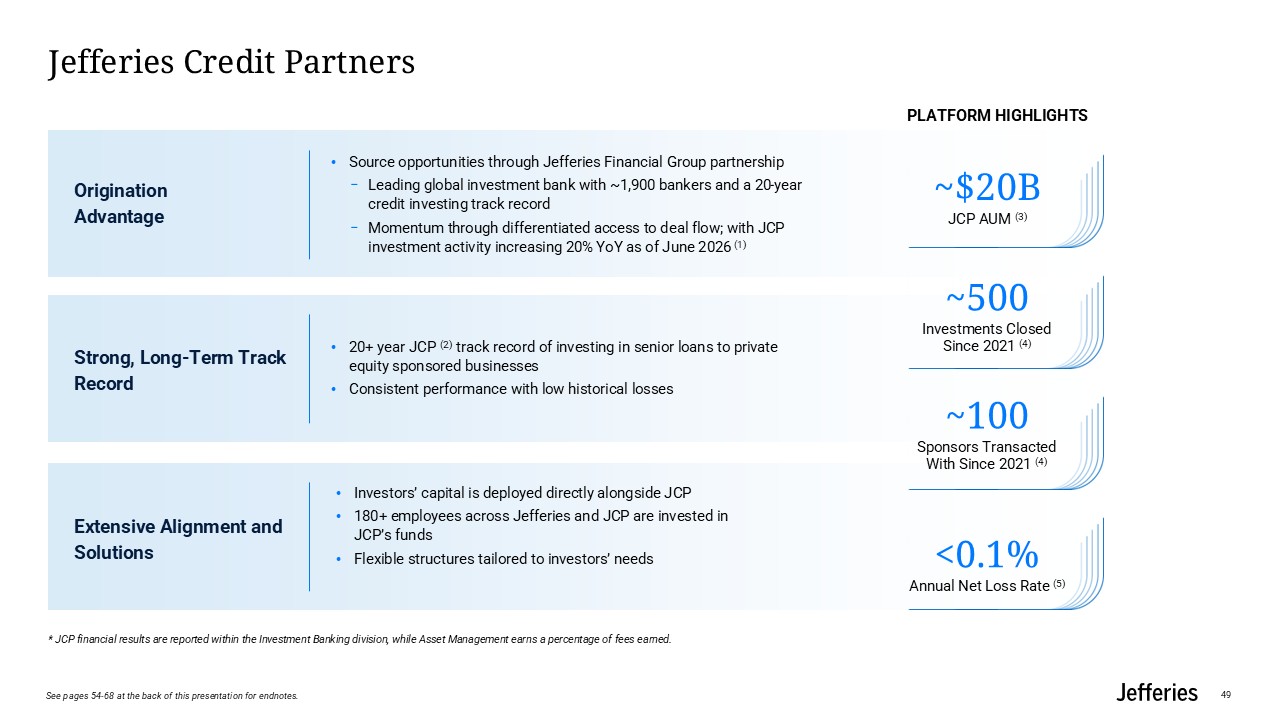
Source opportunities through Jefferies Financial Group partnership Leading global
investment bank with ~1,900 bankers and a 20-year credit investing track record Momentum through differentiated access to deal flow; with JCP investment activity increasing 20% YoY as of June 2026 (1) OriginationAdvantage ~$20B JCP AUM
(3) Jefferies Credit Partners 20+ year JCP (2) track record of investing in senior loans to private equity sponsored businesses Consistent performance with low historical losses Strong, Long-Term Track Record Investors’ capital is deployed
directly alongside JCP 180+ employees across Jefferies and JCP are invested in JCP’s funds Flexible structures tailored to investors’ needs Extensive Alignment and Solutions PLATFORM HIGHLIGHTS ~500 Investments Closed Since 2021
(4) ~100 Sponsors Transacted With Since 2021 (4) <0.1% Annual Net Loss Rate (5) * JCP financial results are reported within the Investment Banking division, while Asset Management earns a percentage of fees earned. 49 See pages
54-68 at the back of this presentation for endnotes.
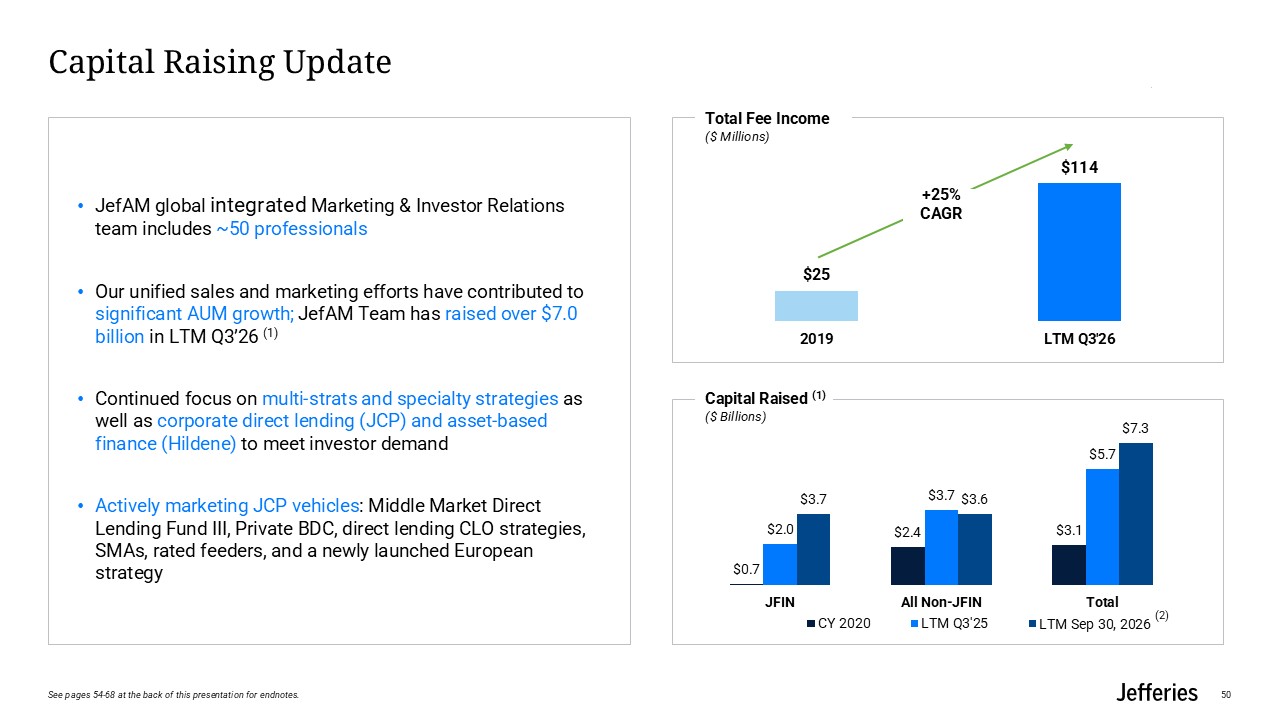
Capital Raising Update Capital Raised (1) ($ Billions) JefAM global integrated
Marketing & Investor Relations team includes ~50 professionals Our unified sales and marketing efforts have contributed to significant AUM growth; JefAM Team has raised over $7.0 billion in LTM Q3’26 (1) Continued focus on multi-strats
and specialty strategies as well as corporate direct lending (JCP) and asset-based finance (Hildene) to meet investor demand Actively marketing JCP vehicles: Middle Market Direct Lending Fund III, Private BDC, direct lending CLO strategies,
SMAs, rated feeders, and a newly launched European strategy Total Fee Income ($ Millions) +25% CAGR 50 See pages 54-68 at the back of this presentation for endnotes. LTM Sep 30, 2026 (2)

Appendix AData Related to Slide 6 51
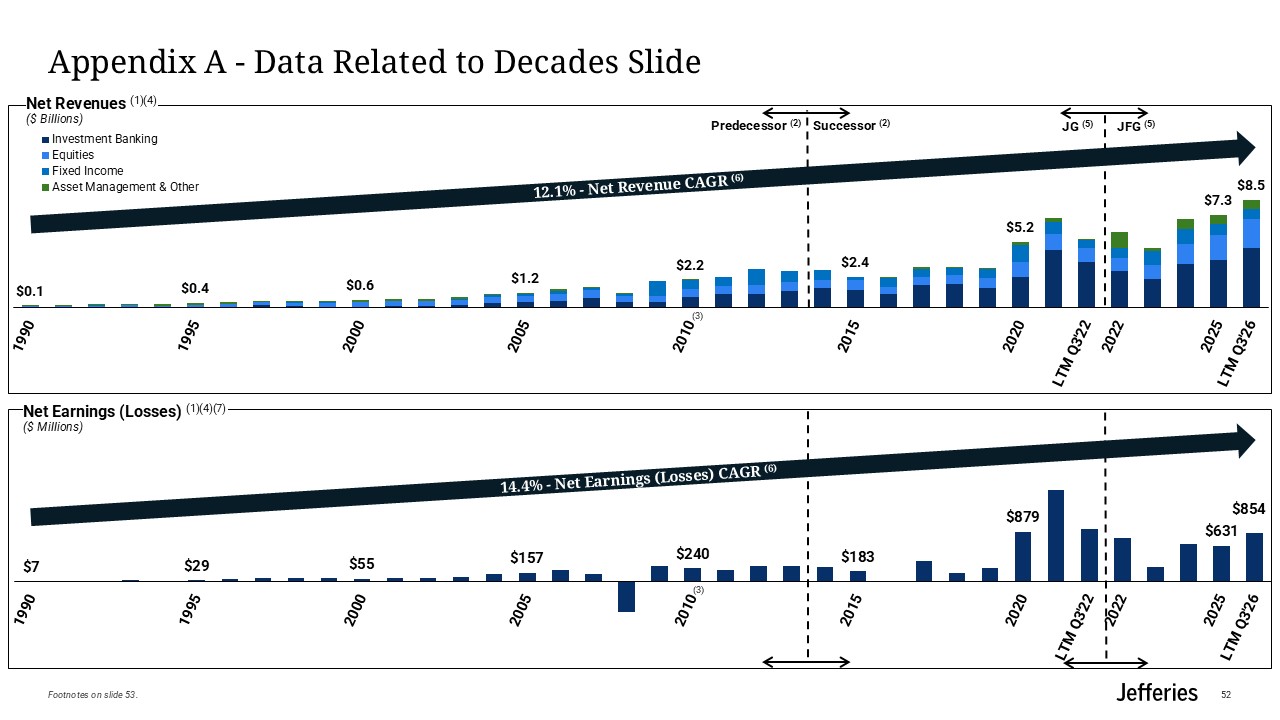
Appendix A - Data Related to Decades Slide Predecessor (2) Successor (2) JG (5)
JFG (5) 12.1% - Net Revenue CAGR (6) 14.4% - Net Earnings (Losses) CAGR (6) Net Revenues (1)(4) ($ Billions) Net Earnings (Losses) (1)(4)(7) ($ Millions) (3) (3) 52 Footnotes on slide 53.
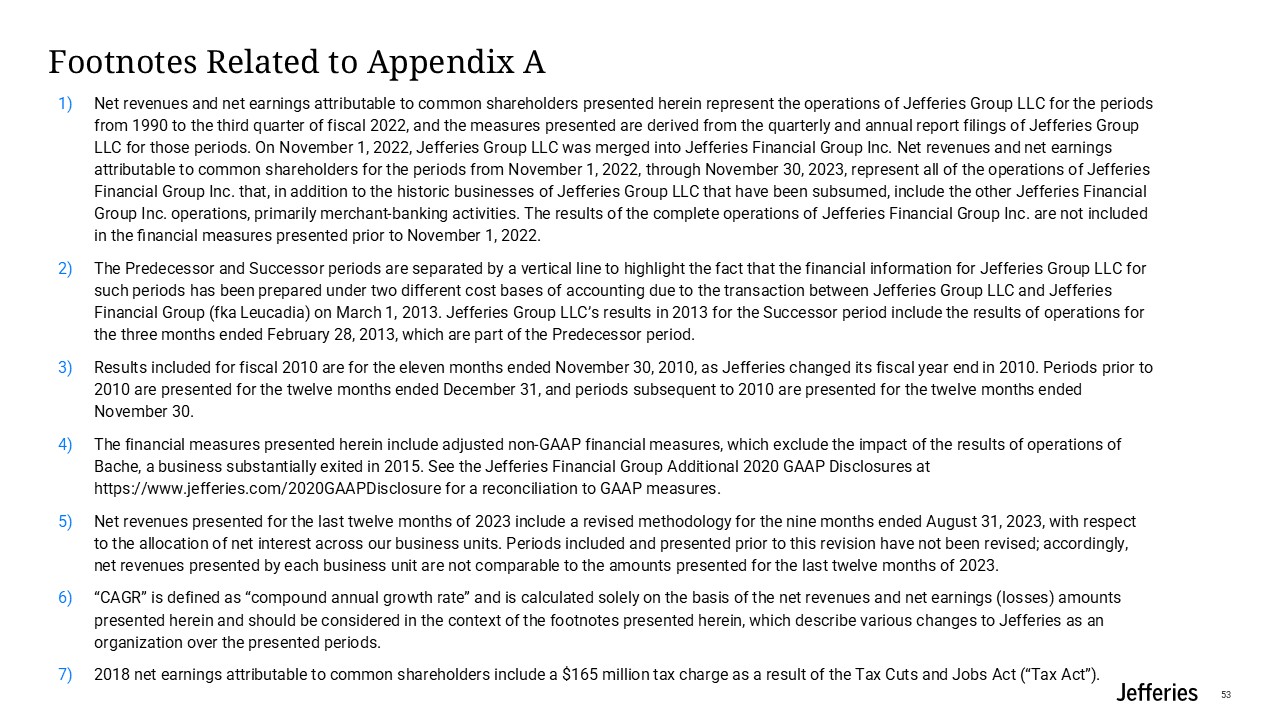
Footnotes Related to Appendix A Net revenues and net earnings attributable to
common shareholders presented herein represent the operations of Jefferies Group LLC for the periods from 1990 to the third quarter of fiscal 2022, and the measures presented are derived from the quarterly and annual report filings of Jefferies
Group LLC for those periods. On November 1, 2022, Jefferies Group LLC was merged into Jefferies Financial Group Inc. Net revenues and net earnings attributable to common shareholders for the periods from November 1, 2022, through November 30,
2023, represent all of the operations of Jefferies Financial Group Inc. that, in addition to the historic businesses of Jefferies Group LLC that have been subsumed, include the other Jefferies Financial Group Inc. operations, primarily
merchant-banking activities. The results of the complete operations of Jefferies Financial Group Inc. are not included in the financial measures presented prior to November 1, 2022. The Predecessor and Successor periods are separated by a
vertical line to highlight the fact that the financial information for Jefferies Group LLC for such periods has been prepared under two different cost bases of accounting due to the transaction between Jefferies Group LLC and Jefferies
Financial Group (fka Leucadia) on March 1, 2013. Jefferies Group LLC’s results in 2013 for the Successor period include the results of operations for the three months ended February 28, 2013, which are part of the Predecessor period. Results
included for fiscal 2010 are for the eleven months ended November 30, 2010, as Jefferies changed its fiscal year end in 2010. Periods prior to 2010 are presented for the twelve months ended December 31, and periods subsequent to 2010 are
presented for the twelve months ended November 30. The financial measures presented herein include adjusted non-GAAP financial measures, which exclude the impact of the results of operations of Bache, a business substantially exited in 2015.
See the Jefferies Financial Group Additional 2020 GAAP Disclosures at https://www.jefferies.com/2020GAAPDisclosure for a reconciliation to GAAP measures. Net revenues presented for the last twelve months of 2023 include a revised methodology
for the nine months ended August 31, 2023, with respect to the allocation of net interest across our business units. Periods included and presented prior to this revision have not been revised; accordingly, net revenues presented by each
business unit are not comparable to the amounts presented for the last twelve months of 2023. “CAGR” is defined as “compound annual growth rate” and is calculated solely on the basis of the net revenues and net earnings (losses) amounts
presented herein and should be considered in the context of the footnotes presented herein, which describe various changes to Jefferies as an organization over the presented periods. 2018 net earnings attributable to common shareholders
include a $165 million tax charge as a result of the Tax Cuts and Jobs Act (“Tax Act”). 53

Appendix BEndnotes 54
Jefferies Overview and Financial Review - Appendix Endnotes 55
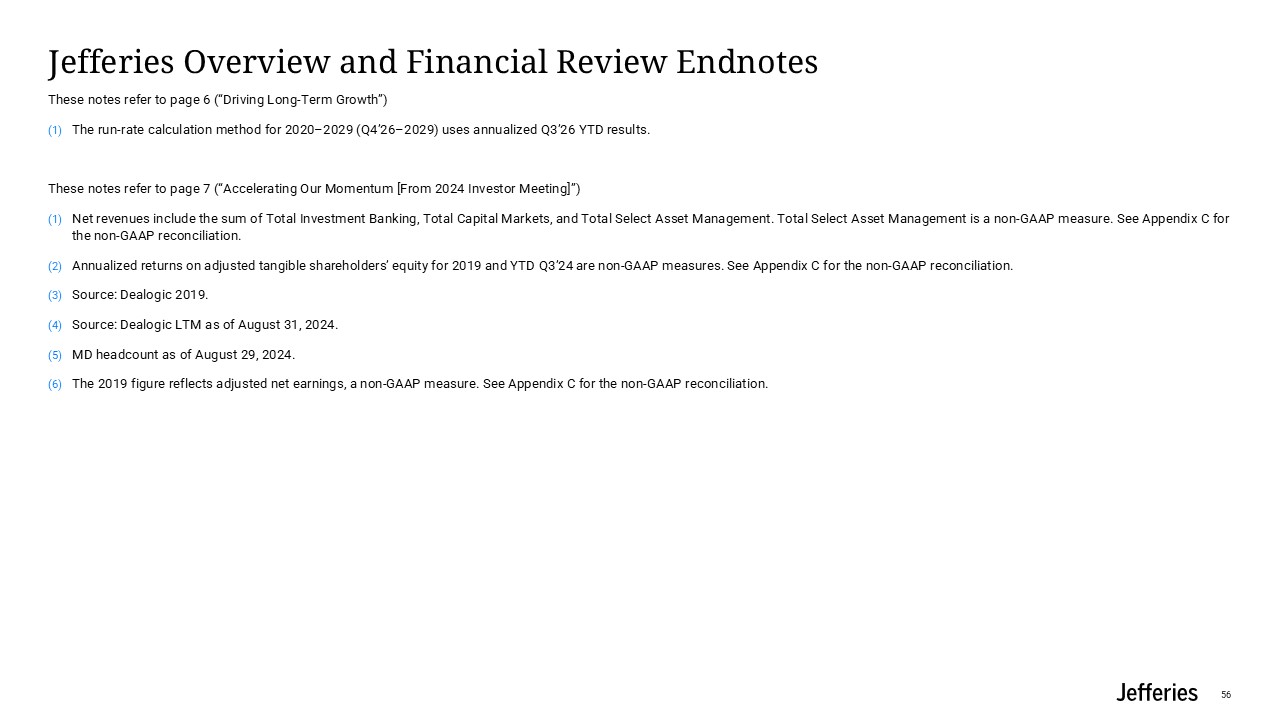
Jefferies Overview and Financial Review Endnotes These notes refer to page 6
(“Driving Long-Term Growth”) The run-rate calculation method for 2020–2029 (Q4’26–2029) uses annualized Q3’26 YTD results. These notes refer to page 7 (“Accelerating Our Momentum [From 2024 Investor Meeting]”) Net revenues include the sum of
Total Investment Banking, Total Capital Markets, and Total Select Asset Management. Total Select Asset Management is a non-GAAP measure. See Appendix C for the non-GAAP reconciliation. Annualized returns on adjusted tangible shareholders’
equity for 2019 and YTD Q3’24 are non-GAAP measures. See Appendix C for the non-GAAP reconciliation. Source: Dealogic 2019. Source: Dealogic LTM as of August 31, 2024. MD headcount as of August 29, 2024. The 2019 figure reflects adjusted
net earnings, a non-GAAP measure. See Appendix C for the non-GAAP reconciliation. 56
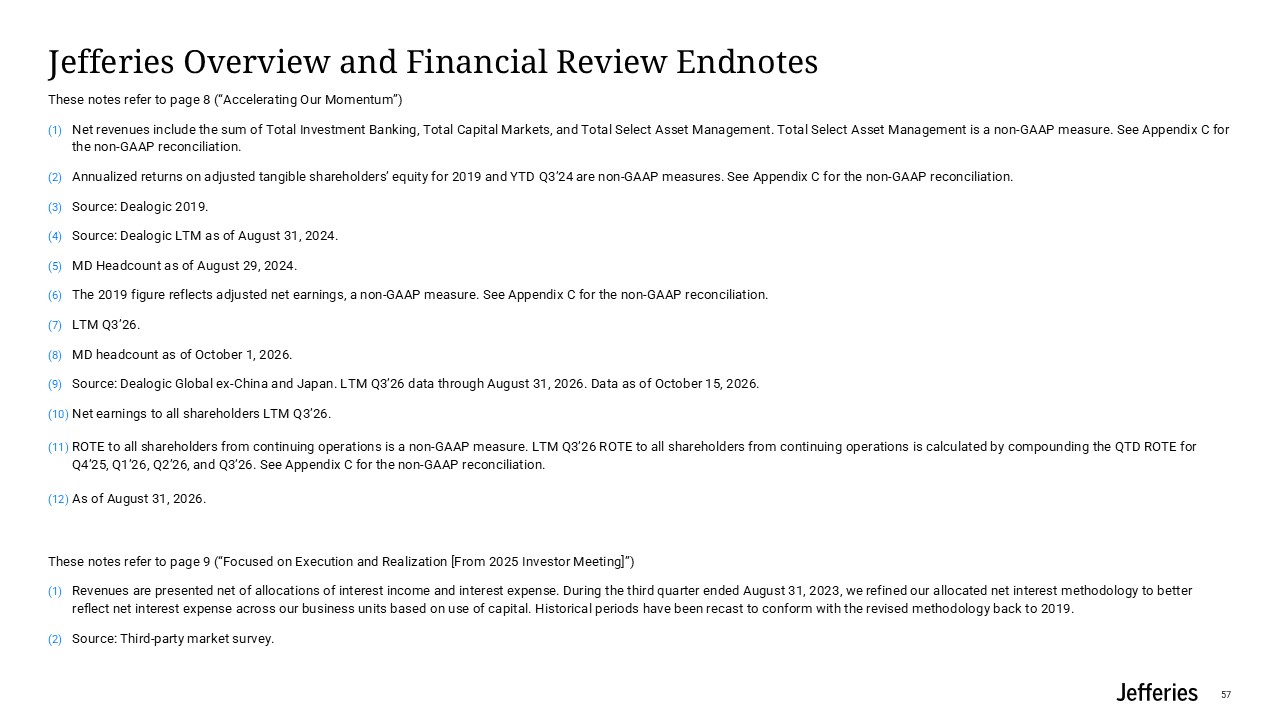
Jefferies Overview and Financial Review Endnotes These notes refer to page 8
(“Accelerating Our Momentum”) Net revenues include the sum of Total Investment Banking, Total Capital Markets, and Total Select Asset Management. Total Select Asset Management is a non-GAAP measure. See Appendix C for the non-GAAP
reconciliation. Annualized returns on adjusted tangible shareholders’ equity for 2019 and YTD Q3’24 are non-GAAP measures. See Appendix C for the non-GAAP reconciliation. Source: Dealogic 2019. Source: Dealogic LTM as of August 31, 2024. MD
Headcount as of August 29, 2024. The 2019 figure reflects adjusted net earnings, a non-GAAP measure. See Appendix C for the non-GAAP reconciliation. LTM Q3’26. MD headcount as of October 1, 2026. Source: Dealogic Global ex-China and Japan.
LTM Q3’26 data through August 31, 2026. Data as of October 15, 2026. Net earnings to all shareholders LTM Q3’26. ROTE to all shareholders from continuing operations is a non-GAAP measure. LTM Q3’26 ROTE to all shareholders from continuing
operations is calculated by compounding the QTD ROTE for Q4’25, Q1’26, Q2’26, and Q3’26. See Appendix C for the non-GAAP reconciliation. As of August 31, 2026. These notes refer to page 9 (“Focused on Execution and Realization [From 2025
Investor Meeting]”) Revenues are presented net of allocations of interest income and interest expense. During the third quarter ended August 31, 2023, we refined our allocated net interest methodology to better reflect net interest expense
across our business units based on use of capital. Historical periods have been recast to conform with the revised methodology back to 2019. Source: Third-party market survey. 57
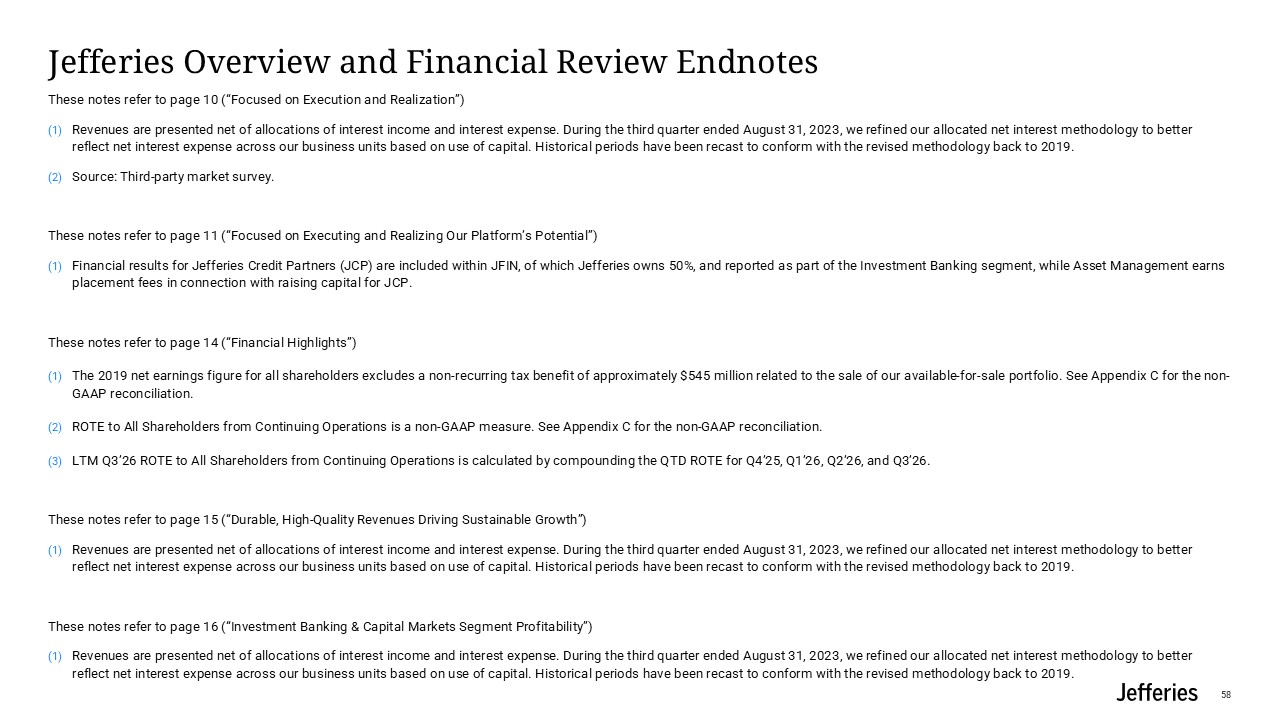
Jefferies Overview and Financial Review Endnotes These notes refer to page 10
(“Focused on Execution and Realization”) Revenues are presented net of allocations of interest income and interest expense. During the third quarter ended August 31, 2023, we refined our allocated net interest methodology to better reflect net
interest expense across our business units based on use of capital. Historical periods have been recast to conform with the revised methodology back to 2019. Source: Third-party market survey. These notes refer to page 11 (“Focused on
Executing and Realizing Our Platform’s Potential”) Financial results for Jefferies Credit Partners (JCP) are included within JFIN, of which Jefferies owns 50%, and reported as part of the Investment Banking segment, while Asset Management
earns placement fees in connection with raising capital for JCP. These notes refer to page 14 (“Financial Highlights”) The 2019 net earnings figure for all shareholders excludes a non-recurring tax benefit of approximately $545 million
related to the sale of our available-for-sale portfolio. See Appendix C for the non-GAAP reconciliation. ROTE to All Shareholders from Continuing Operations is a non-GAAP measure. See Appendix C for the non-GAAP reconciliation. LTM Q3’26 ROTE
to All Shareholders from Continuing Operations is calculated by compounding the QTD ROTE for Q4’25, Q1’26, Q2’26, and Q3’26. These notes refer to page 15 (“Durable, High-Quality Revenues Driving Sustainable Growth”) Revenues are presented net
of allocations of interest income and interest expense. During the third quarter ended August 31, 2023, we refined our allocated net interest methodology to better reflect net interest expense across our business units based on use of capital.
Historical periods have been recast to conform with the revised methodology back to 2019. These notes refer to page 16 (“Investment Banking & Capital Markets Segment Profitability”) Revenues are presented net of allocations of interest
income and interest expense. During the third quarter ended August 31, 2023, we refined our allocated net interest methodology to better reflect net interest expense across our business units based on use of capital. Historical periods have
been recast to conform with the revised methodology back to 2019. 58
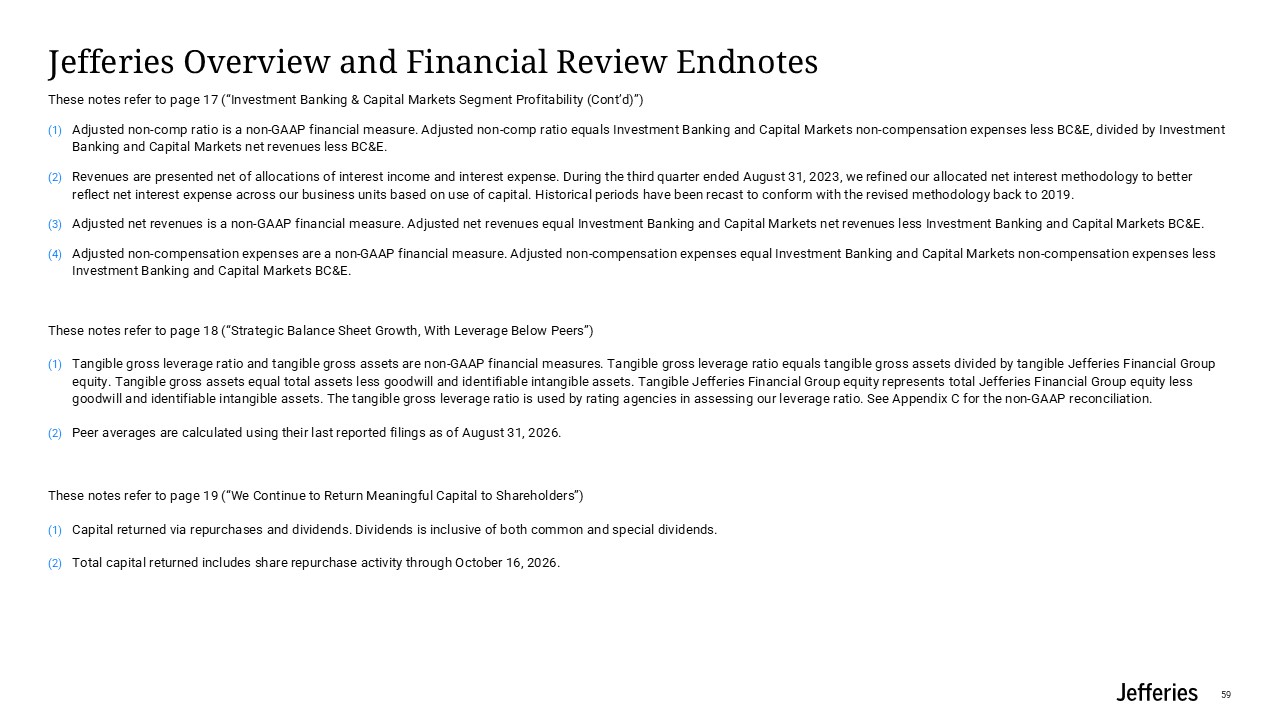
Jefferies Overview and Financial Review Endnotes These notes refer to page 17
(“Investment Banking & Capital Markets Segment Profitability (Cont’d)”) Adjusted non-comp ratio is a non-GAAP financial measure. Adjusted non-comp ratio equals Investment Banking and Capital Markets non-compensation expenses less BC&E,
divided by Investment Banking and Capital Markets net revenues less BC&E. Revenues are presented net of allocations of interest income and interest expense. During the third quarter ended August 31, 2023, we refined our allocated net
interest methodology to better reflect net interest expense across our business units based on use of capital. Historical periods have been recast to conform with the revised methodology back to 2019. Adjusted net revenues is a non-GAAP
financial measure. Adjusted net revenues equal Investment Banking and Capital Markets net revenues less Investment Banking and Capital Markets BC&E. Adjusted non-compensation expenses are a non-GAAP financial measure. Adjusted
non-compensation expenses equal Investment Banking and Capital Markets non-compensation expenses less Investment Banking and Capital Markets BC&E. These notes refer to page 18 (“Strategic Balance Sheet Growth, With Leverage Below
Peers”) Tangible gross leverage ratio and tangible gross assets are non-GAAP financial measures. Tangible gross leverage ratio equals tangible gross assets divided by tangible Jefferies Financial Group equity. Tangible gross assets equal total
assets less goodwill and identifiable intangible assets. Tangible Jefferies Financial Group equity represents total Jefferies Financial Group equity less goodwill and identifiable intangible assets. The tangible gross leverage ratio is used by
rating agencies in assessing our leverage ratio. See Appendix C for the non-GAAP reconciliation. Peer averages are calculated using their last reported filings as of August 31, 2026. These notes refer to page 19 (“We Continue to Return
Meaningful Capital to Shareholders”) Capital returned via repurchases and dividends. Dividends is inclusive of both common and special dividends. Total capital returned includes share repurchase activity through October 16, 2026. 59
Investment Banking - Appendix Endnotes 60
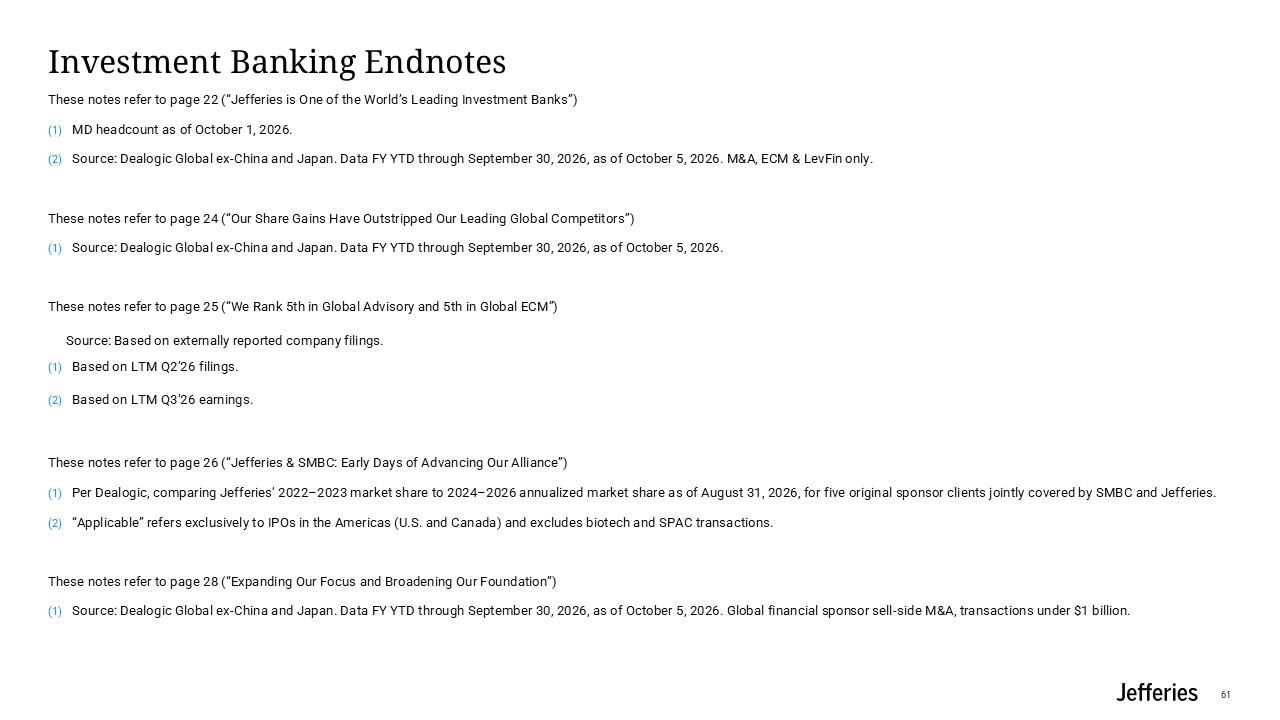
Investment Banking Endnotes These notes refer to page 22 (“Jefferies is One of
the World’s Leading Investment Banks”) MD headcount as of October 1, 2026. Source: Dealogic Global ex-China and Japan. Data FY YTD through September 30, 2026, as of October 5, 2026. M&A, ECM & LevFin only. These notes refer to page
24 (“Our Share Gains Have Outstripped Our Leading Global Competitors”) Source: Dealogic Global ex-China and Japan. Data FY YTD through September 30, 2026, as of October 5, 2026. These notes refer to page 25 (“We Rank 5th in Global Advisory
and 5th in Global ECM”) Source: Based on externally reported company filings. Based on LTM Q2’26 filings. Based on LTM Q3’26 earnings. These notes refer to page 26 (“Jefferies & SMBC: Early Days of Advancing Our Alliance”) Per
Dealogic, comparing Jefferies’ 2022–2023 market share to 2024–2026 annualized market share as of August 31, 2026, for five original sponsor clients jointly covered by SMBC and Jefferies. “Applicable” refers exclusively to IPOs in the Americas
(U.S. and Canada) and excludes biotech and SPAC transactions. These notes refer to page 28 (“Expanding Our Focus and Broadening Our Foundation”) Source: Dealogic Global ex-China and Japan. Data FY YTD through September 30, 2026, as of October
5, 2026. Global financial sponsor sell-side M&A, transactions under $1 billion. 61
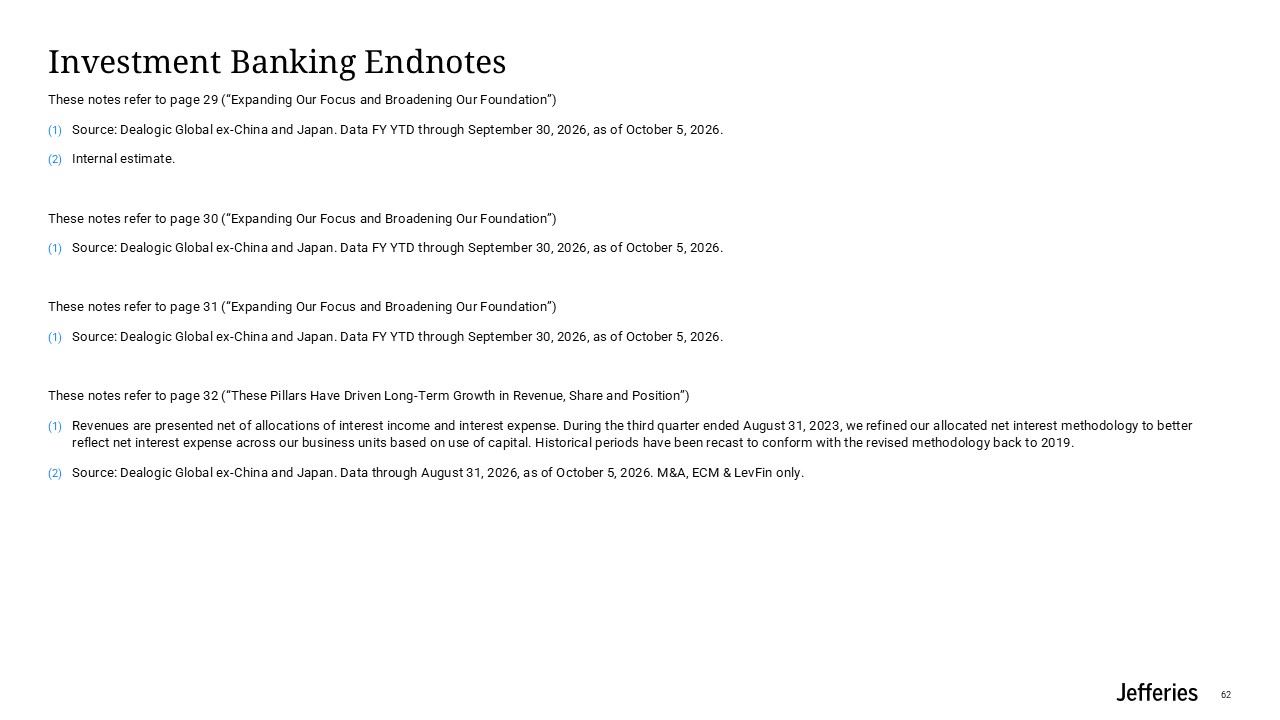
Investment Banking Endnotes These notes refer to page 29 (“Expanding Our Focus
and Broadening Our Foundation”) Source: Dealogic Global ex-China and Japan. Data FY YTD through September 30, 2026, as of October 5, 2026. Internal estimate. These notes refer to page 30 (“Expanding Our Focus and Broadening Our
Foundation”) Source: Dealogic Global ex-China and Japan. Data FY YTD through September 30, 2026, as of October 5, 2026. These notes refer to page 31 (“Expanding Our Focus and Broadening Our Foundation”) Source: Dealogic Global ex-China and
Japan. Data FY YTD through September 30, 2026, as of October 5, 2026. These notes refer to page 32 (“These Pillars Have Driven Long-Term Growth in Revenue, Share and Position”) Revenues are presented net of allocations of interest income and
interest expense. During the third quarter ended August 31, 2023, we refined our allocated net interest methodology to better reflect net interest expense across our business units based on use of capital. Historical periods have been recast to
conform with the revised methodology back to 2019. Source: Dealogic Global ex-China and Japan. Data through August 31, 2026, as of October 5, 2026. M&A, ECM & LevFin only. 62
Equities - Appendix Endnotes 63
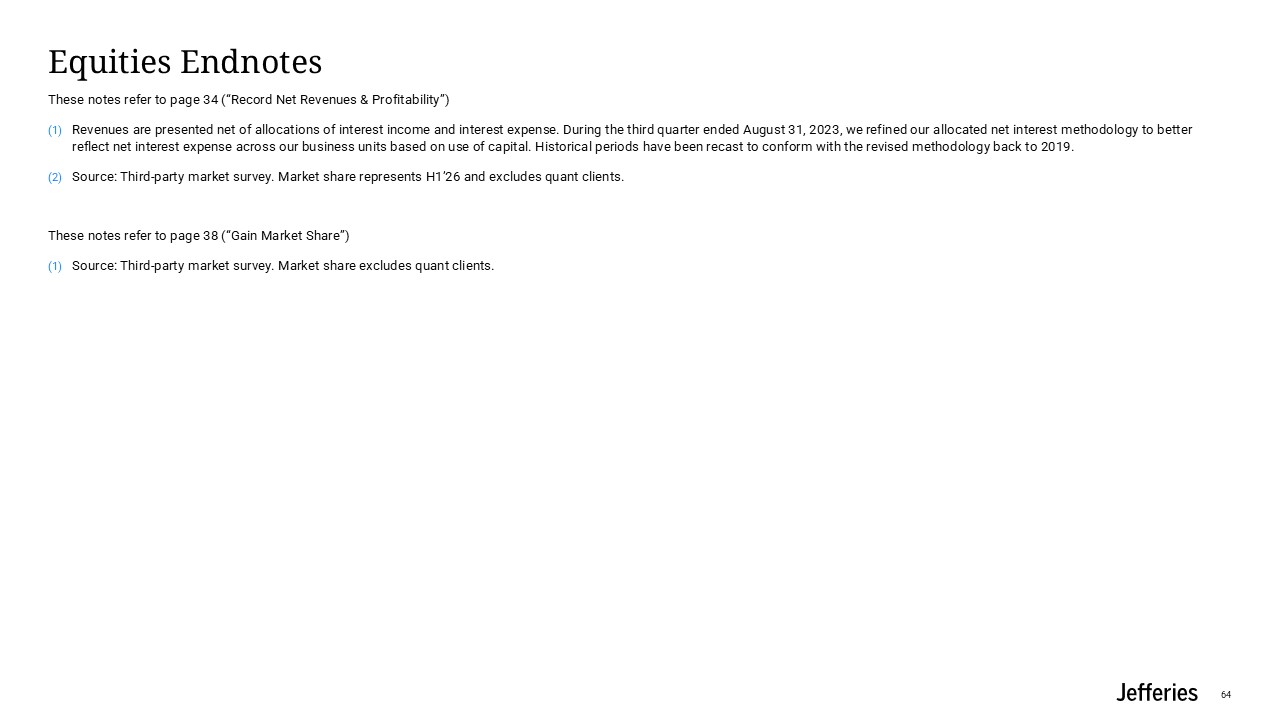
Equities Endnotes These notes refer to page 34 (“Record Net Revenues &
Profitability”) Revenues are presented net of allocations of interest income and interest expense. During the third quarter ended August 31, 2023, we refined our allocated net interest methodology to better reflect net interest expense across
our business units based on use of capital. Historical periods have been recast to conform with the revised methodology back to 2019. Source: Third-party market survey. Market share represents H1’26 and excludes quant clients. These notes
refer to page 38 (“Gain Market Share”) Source: Third-party market survey. Market share excludes quant clients. 64
Fixed Income - Appendix Endnotes 65
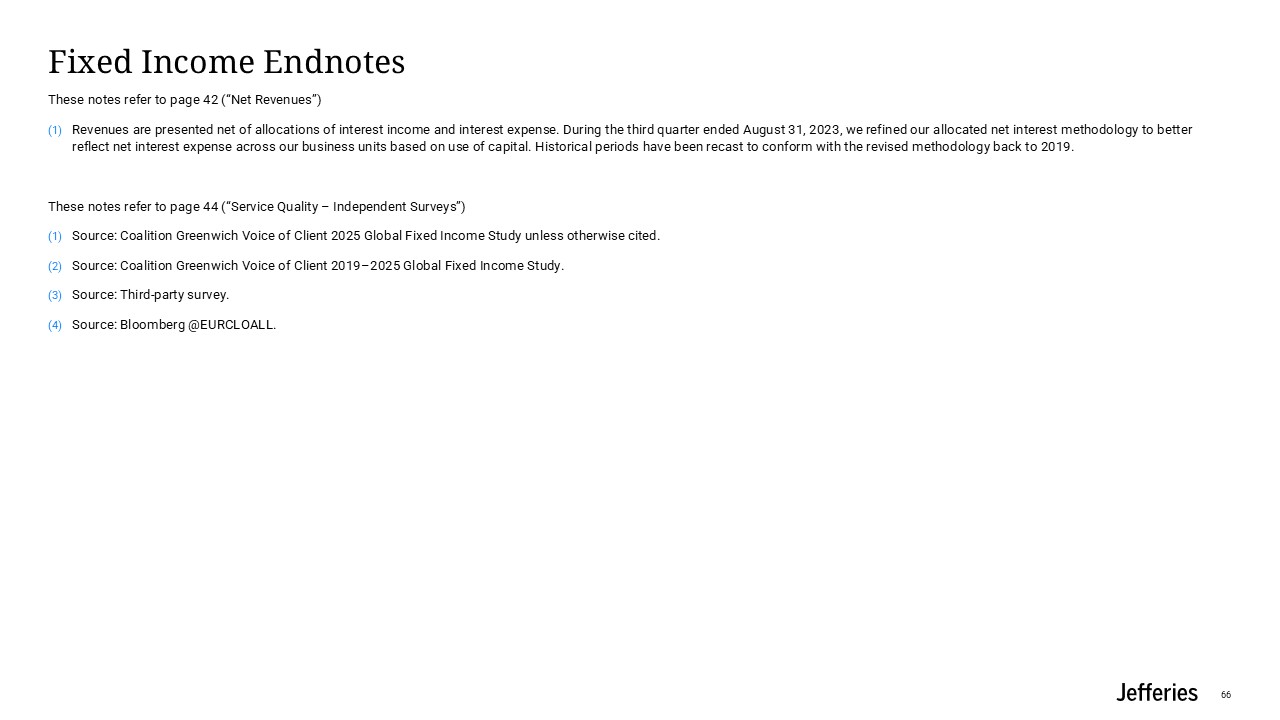
Fixed Income Endnotes These notes refer to page 42 (“Net Revenues”) Revenues are
presented net of allocations of interest income and interest expense. During the third quarter ended August 31, 2023, we refined our allocated net interest methodology to better reflect net interest expense across our business units based on
use of capital. Historical periods have been recast to conform with the revised methodology back to 2019. These notes refer to page 44 (“Service Quality – Independent Surveys”) Source: Coalition Greenwich Voice of Client 2025 Global Fixed
Income Study unless otherwise cited. Source: Coalition Greenwich Voice of Client 2019–2025 Global Fixed Income Study. Source: Third-party survey. Source: Bloomberg @EURCLOALL. 66
Asset Management - Appendix Endnotes 67
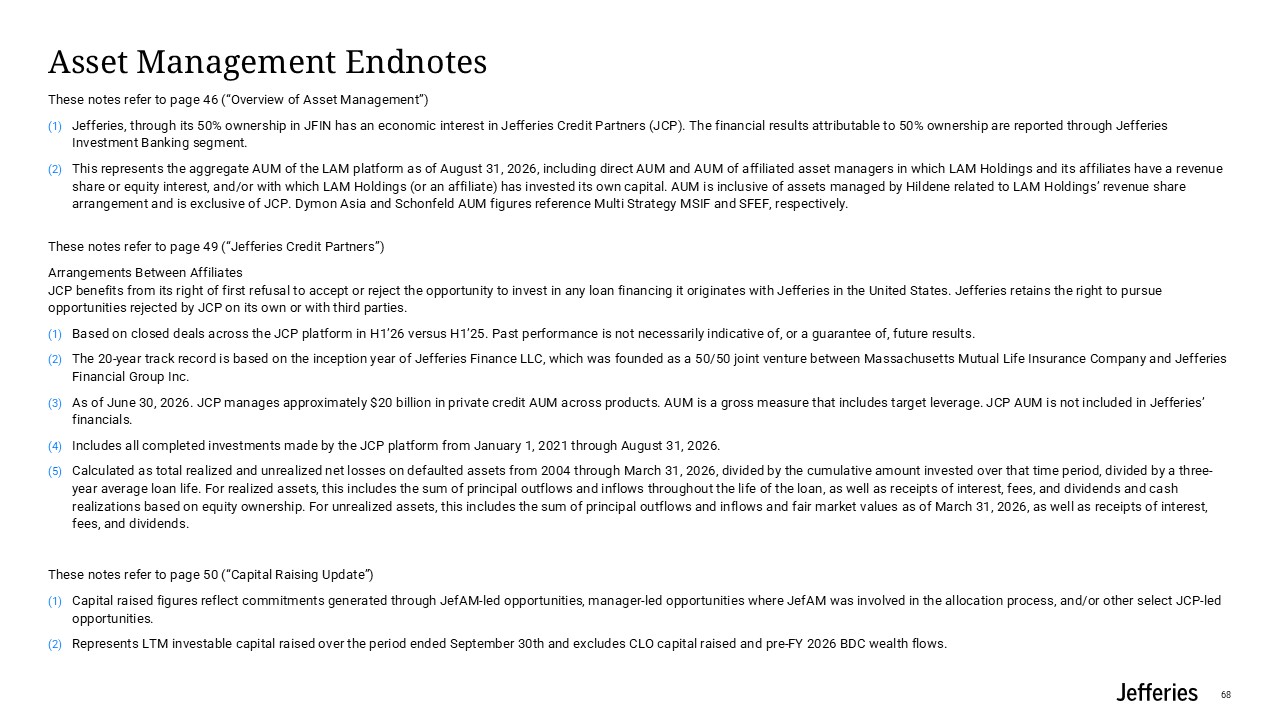
Asset Management Endnotes These notes refer to page 46 (“Overview of Asset
Management”) Jefferies, through its 50% ownership in JFIN has an economic interest in Jefferies Credit Partners (JCP). The financial results attributable to 50% ownership are reported through Jefferies Investment Banking segment. This
represents the aggregate AUM of the LAM platform as of August 31, 2026, including direct AUM and AUM of affiliated asset managers in which LAM Holdings and its affiliates have a revenue share or equity interest, and/or with which LAM Holdings
(or an affiliate) has invested its own capital. AUM is inclusive of assets managed by Hildene related to LAM Holdings’ revenue share arrangement and is exclusive of JCP. Dymon Asia and Schonfeld AUM figures reference Multi Strategy MSIF and
SFEF, respectively. These notes refer to page 49 (“Jefferies Credit Partners”) Arrangements Between AffiliatesJCP benefits from its right of first refusal to accept or reject the opportunity to invest in any loan financing it originates with
Jefferies in the United States. Jefferies retains the right to pursue opportunities rejected by JCP on its own or with third parties. Based on closed deals across the JCP platform in H1’26 versus H1’25. Past performance is not necessarily
indicative of, or a guarantee of, future results. The 20-year track record is based on the inception year of Jefferies Finance LLC, which was founded as a 50/50 joint venture between Massachusetts Mutual Life Insurance Company and Jefferies
Financial Group Inc. As of June 30, 2026. JCP manages approximately $20 billion in private credit AUM across products. AUM is a gross measure that includes target leverage. JCP AUM is not included in Jefferies’ financials. Includes all
completed investments made by the JCP platform from January 1, 2021 through August 31, 2026. Calculated as total realized and unrealized net losses on defaulted assets from 2004 through March 31, 2026, divided by the cumulative amount invested
over that time period, divided by a three-year average loan life. For realized assets, this includes the sum of principal outflows and inflows throughout the life of the loan, as well as receipts of interest, fees, and dividends and cash
realizations based on equity ownership. For unrealized assets, this includes the sum of principal outflows and inflows and fair market values as of March 31, 2026, as well as receipts of interest, fees, and dividends. These notes refer to page
50 (“Capital Raising Update”) Capital raised figures reflect commitments generated through JefAM-led opportunities, manager-led opportunities where JefAM was involved in the allocation process, and/or other select JCP-led opportunities.
Represents LTM investable capital raised over the period ended September 30th and excludes CLO capital raised and pre-FY 2026 BDC wealth flows. 68
Appendix CNon-GAAP Reconciliations 69
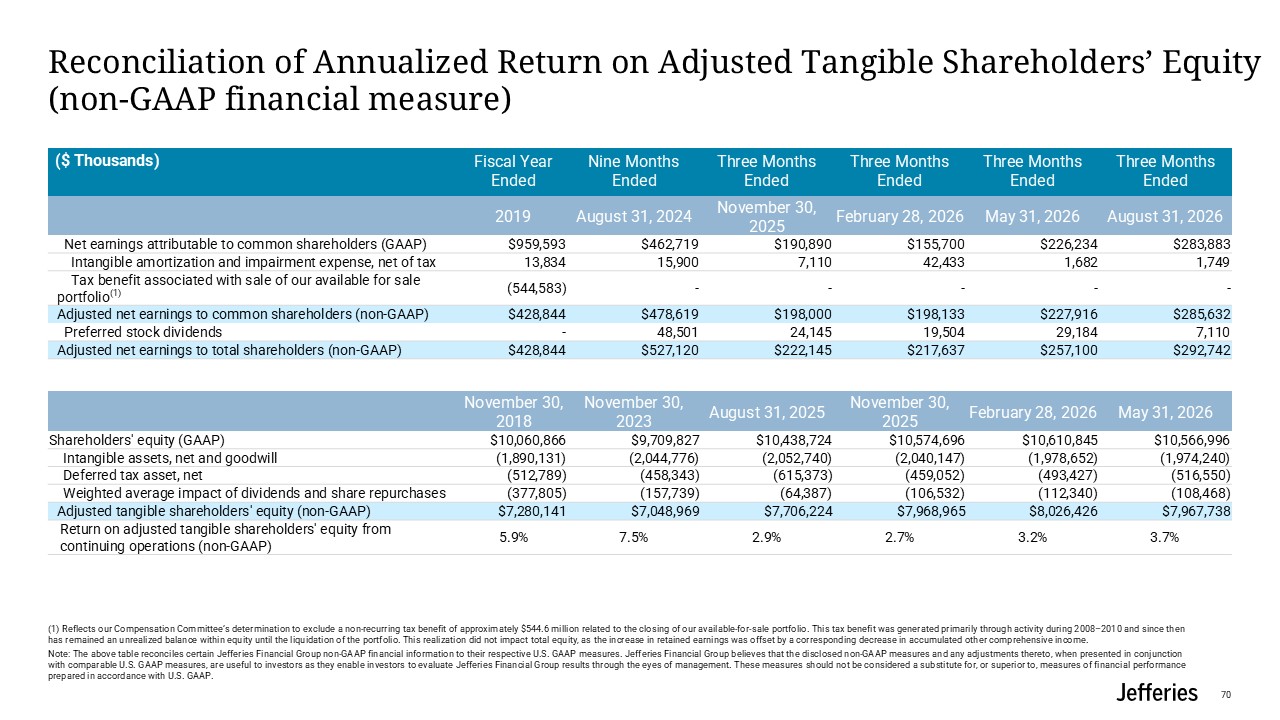
Fiscal Year Ended Nine Months Ended Three Months Ended Three Months
Ended Three Months Ended Three Months Ended 2019 August 31, 2024 November 30, 2025 February 28, 2026 May 31, 2026 August 31, 2026 Net earnings attributable to common shareholders
(GAAP) $959,593 $462,719 $190,890 $155,700 $226,234 $283,883 Intangible amortization and impairment expense, net of tax 13,834 15,900 7,110 42,433 1,682 1,749 Tax benefit associated with sale of our available for sale
portfolio(1) (544,583) - - - - - Adjusted net earnings to common shareholders (non-GAAP) $428,844 $478,619 $198,000 $198,133 $227,916 $285,632 Preferred stock dividends - 48,501 24,145 19,504 29,184 7,110 Adjusted net
earnings to total shareholders (non-GAAP) $428,844 $527,120 $222,145 $217,637 $257,100 $292,742 Reconciliation of Annualized Return on Adjusted Tangible Shareholders’ Equity (non-GAAP financial measure) (1) Reflects our Compensation
Committee’s determination to exclude a non-recurring tax benefit of approximately $544.6 million related to the closing of our available-for-sale portfolio. This tax benefit was generated primarily through activity during 2008–2010 and since
then has remained an unrealized balance within equity until the liquidation of the portfolio. This realization did not impact total equity, as the increase in retained earnings was offset by a corresponding decrease in accumulated other
comprehensive income. Note: The above table reconciles certain Jefferies Financial Group non-GAAP financial information to their respective U.S. GAAP measures. Jefferies Financial Group believes that the disclosed non-GAAP measures and any
adjustments thereto, when presented in conjunction with comparable U.S. GAAP measures, are useful to investors as they enable investors to evaluate Jefferies Financial Group results through the eyes of management. These measures should not be
considered a substitute for, or superior to, measures of financial performance prepared in accordance with U.S. GAAP. ($ Thousands) November 30, 2018 November 30, 2023 August 31, 2025 November 30, 2025 February 28, 2026 May 31,
2026 Shareholders' equity (GAAP) $10,060,866 $9,709,827 $10,438,724 $10,574,696 $10,610,845 $10,566,996 Intangible assets, net and goodwill (1,890,131) (2,044,776) (2,052,740) (2,040,147) (1,978,652) (1,974,240) Deferred tax
asset, net (512,789) (458,343) (615,373) (459,052) (493,427) (516,550) Weighted average impact of dividends and share repurchases (377,805) (157,739) (64,387) (106,532) (112,340) (108,468) Adjusted tangible shareholders' equity
(non-GAAP) $7,280,141 $7,048,969 $7,706,224 $7,968,965 $8,026,426 $7,967,738 Return on adjusted tangible shareholders' equity from continuing operations (non-GAAP) 5.9% 7.5% 2.9% 2.7% 3.2% 3.7% 70
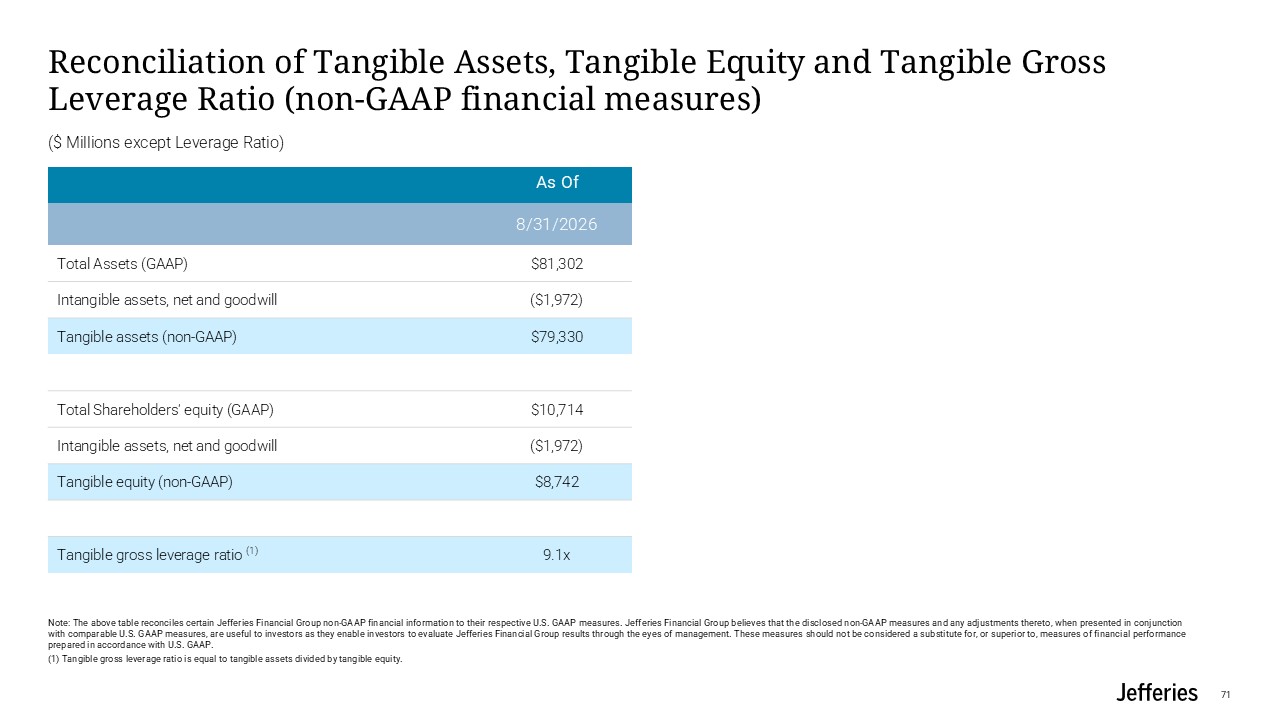
Reconciliation of Tangible Assets, Tangible Equity and Tangible Gross Leverage
Ratio (non-GAAP financial measures) Note: The above table reconciles certain Jefferies Financial Group non-GAAP financial information to their respective U.S. GAAP measures. Jefferies Financial Group believes that the disclosed non-GAAP
measures and any adjustments thereto, when presented in conjunction with comparable U.S. GAAP measures, are useful to investors as they enable investors to evaluate Jefferies Financial Group results through the eyes of management. These
measures should not be considered a substitute for, or superior to, measures of financial performance prepared in accordance with U.S. GAAP. (1) Tangible gross leverage ratio is equal to tangible assets divided by tangible equity. ($ Millions
except Leverage Ratio) As Of 8/31/2026 Total Assets (GAAP) $81,302 Intangible assets, net and goodwill ($1,972) Tangible assets (non-GAAP) $79,330 Total Shareholders' equity (GAAP) $10,714 Intangible assets, net and
goodwill ($1,972) Tangible equity (non-GAAP) $8,742 Tangible gross leverage ratio (1) 9.1x 71
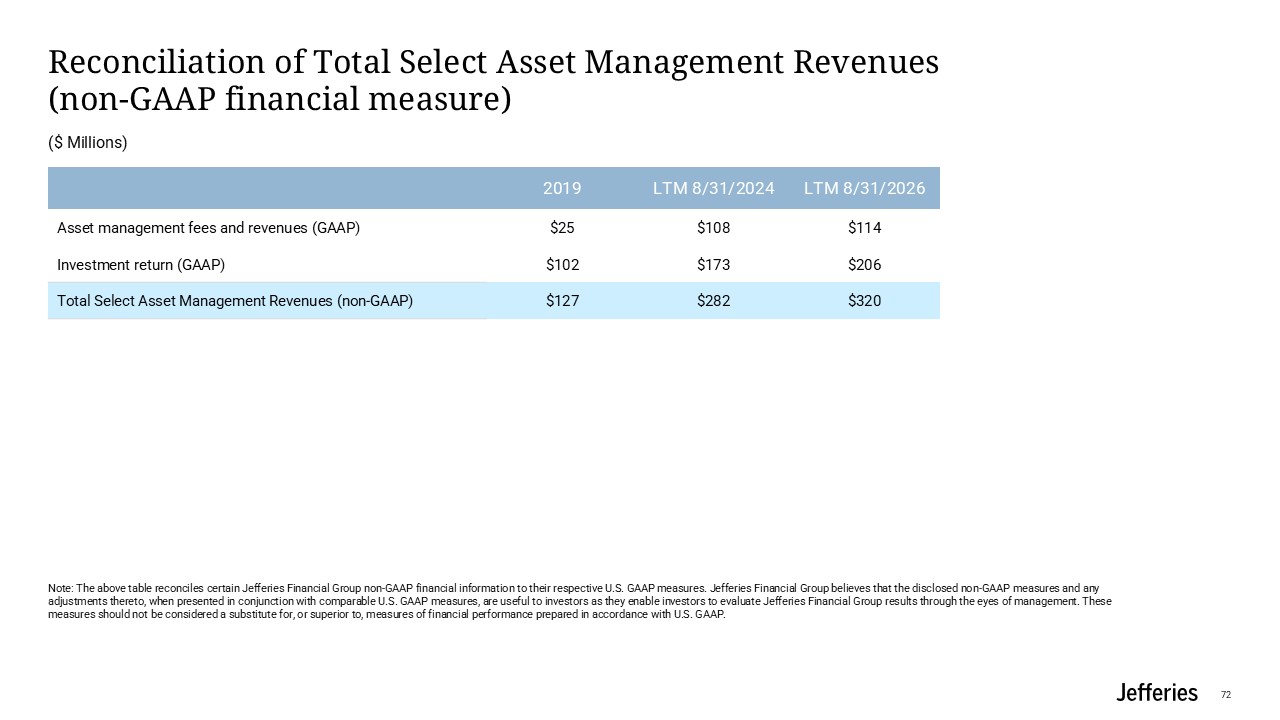
Reconciliation of Total Select Asset Management Revenues(non-GAAP financial
measure) Note: The above table reconciles certain Jefferies Financial Group non-GAAP financial information to their respective U.S. GAAP measures. Jefferies Financial Group believes that the disclosed non-GAAP measures and any adjustments
thereto, when presented in conjunction with comparable U.S. GAAP measures, are useful to investors as they enable investors to evaluate Jefferies Financial Group results through the eyes of management. These measures should not be considered a
substitute for, or superior to, measures of financial performance prepared in accordance with U.S. GAAP. ($ Millions) 2019 LTM 8/31/2024 LTM 8/31/2026 Asset management fees and revenues (GAAP) $25 $108 $114 Investment return
(GAAP) $102 $173 $206 Total Select Asset Management Revenues (non-GAAP) $127 $282 $320 72
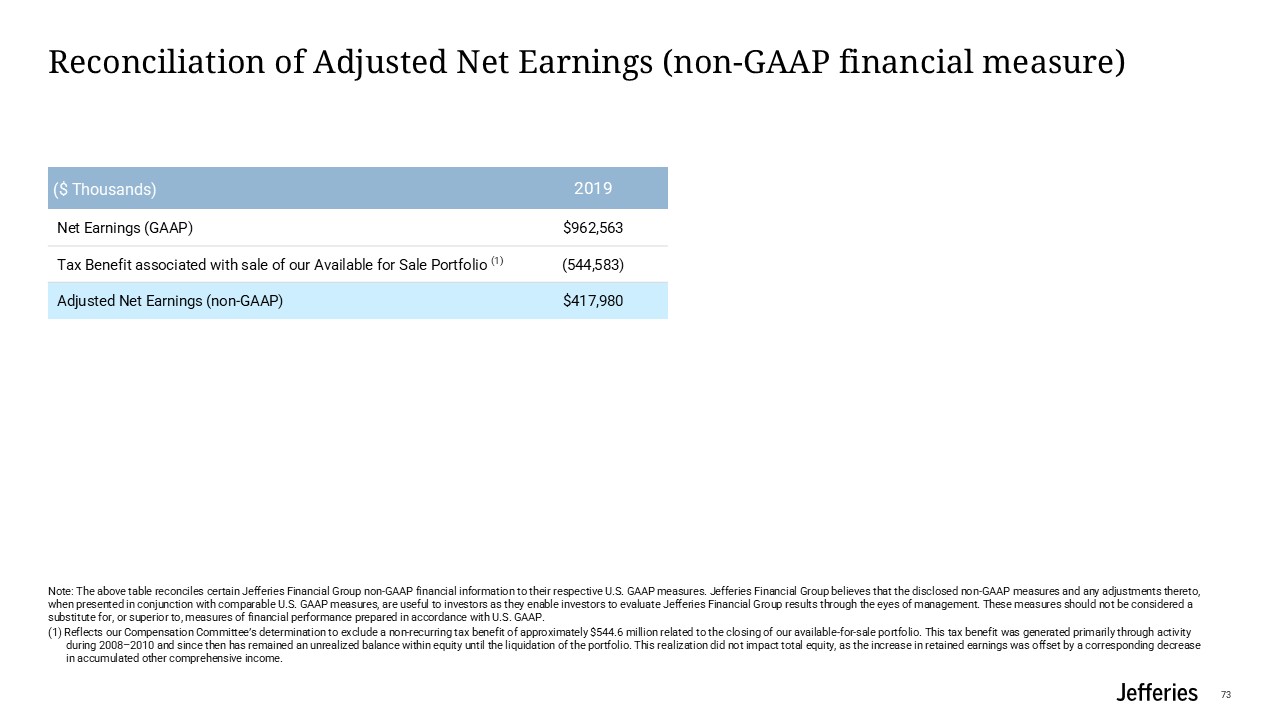
Reconciliation of Adjusted Net Earnings (non-GAAP financial measure) Note: The
above table reconciles certain Jefferies Financial Group non-GAAP financial information to their respective U.S. GAAP measures. Jefferies Financial Group believes that the disclosed non-GAAP measures and any adjustments thereto, when presented
in conjunction with comparable U.S. GAAP measures, are useful to investors as they enable investors to evaluate Jefferies Financial Group results through the eyes of management. These measures should not be considered a substitute for, or
superior to, measures of financial performance prepared in accordance with U.S. GAAP. (1) Reflects our Compensation Committee’s determination to exclude a non-recurring tax benefit of approximately $544.6 million related to the closing of our
available-for-sale portfolio. This tax benefit was generated primarily through activity during 2008–2010 and since then has remained an unrealized balance within equity until the liquidation of the portfolio. This realization did not impact
total equity, as the increase in retained earnings was offset by a corresponding decrease in accumulated other comprehensive income. ($ Thousands) 2019 Net Earnings (GAAP) $962,563 Tax Benefit associated with sale of our Available for
Sale Portfolio (1) (544,583) Adjusted Net Earnings (non-GAAP) $417,980 73