
Second Quarter 2025 Earnings Conference Call 7/31/2025 Teleflex Incorporated .2

The release, accompanying slides, and replay webcast are available online at www.teleflex.com (click on Investors) An audio replay of the call will be available beginning at 11:00 am Eastern Time on July 31, 2025 either on the Teleflex website or by telephone. The call can be accessed by dialing 1 800 770 2030 (U.S.) or 1 609 800 9909 (all other locations). The confirmation code is 69028. Conference Call Logistics

Today’s Speakers TELEFLEX EARNINGS CONFERENCE CALL 7/31/2025 Lawrence Keusch VP, Investor Relations and Strategy Development Liam Kelly Chairman, President and CEO John Deren Executive VP and CFO
TELEFLEX EARNINGS CONFERENCE CALL 7/31/20254 Additional Notes This document contains certain highlights with respect to our second quarter 2025 and developments and does not purport to be a complete summary thereof. Accordingly, we encourage you to read our Earnings Release for the quarter ended June 29, 2025 located in the investor section of our website at www.teleflex.com and our Quarterly Report on Form 10-Q for the quarter ended June 29, 2025 to be filed with the Securities and Exchange Commission. Unless otherwise noted, the following slides reflect continuing operations. This presentation contains forward-looking statements, including, but not limited to, our forecasted 2025: GAAP, adjusted revenue and adjusted constant currency growth, GAAP and adjusted gross and operating margins and GAAP and adjusted earnings per share and, in each case, our estimates with respect to the items expected to impact those forecasted results; statements with respect to our plans to spinoff certain of our businesses into an independent company (“Newco”), the benefits and synergies of the transaction, strategic and competitive advantages of each company, and future growth and other opportunities for each company; statements regarding the potential sale of Newco; statements regarding the potential benefits and future performance of the Vascular Intervention business we recently acquired from BIOTRONIK; and other matters which inherently involve risks and uncertainties which could cause actual results to differ from those projected or implied in the forward–looking statements. Any forward-looking statements contained herein are based on our management’s current beliefs and expectations, but are subject to a number of risks, uncertainties and changes in circumstances, which may cause actual results or company actions to differ materially from what is expressed or implied by these statements. These risks and uncertainties are identified and described in more detail in our filings with the Securities and Exchange Commission, including our Annual Report on Form 10-K. We expressly disclaim any obligation to update these forward-looking statements, except as otherwise explicitly stated by us or as required by law or regulation. You should not place undue reliance on these statements or the scientific data presented. Note on Forward-Looking Statements Note on Non-GAAP Financial Measures This presentation refers to certain non-GAAP financial measures, including, but not limited to, adjusted revenue, adjusted constant currency revenue growth, adjusted diluted earnings per share, adjusted gross and operating margins and adjusted tax rate. These non-GAAP financial measures should not be considered replacements for, and should be read together with, the most comparable GAAP financial measures. Tables reconciling these non-GAAP financial measures to the most comparable GAAP financial measures are contained within this presentation and the appendices at the end of this presentation.

Liam Kelly Chairman, President and CEO Executive Overview
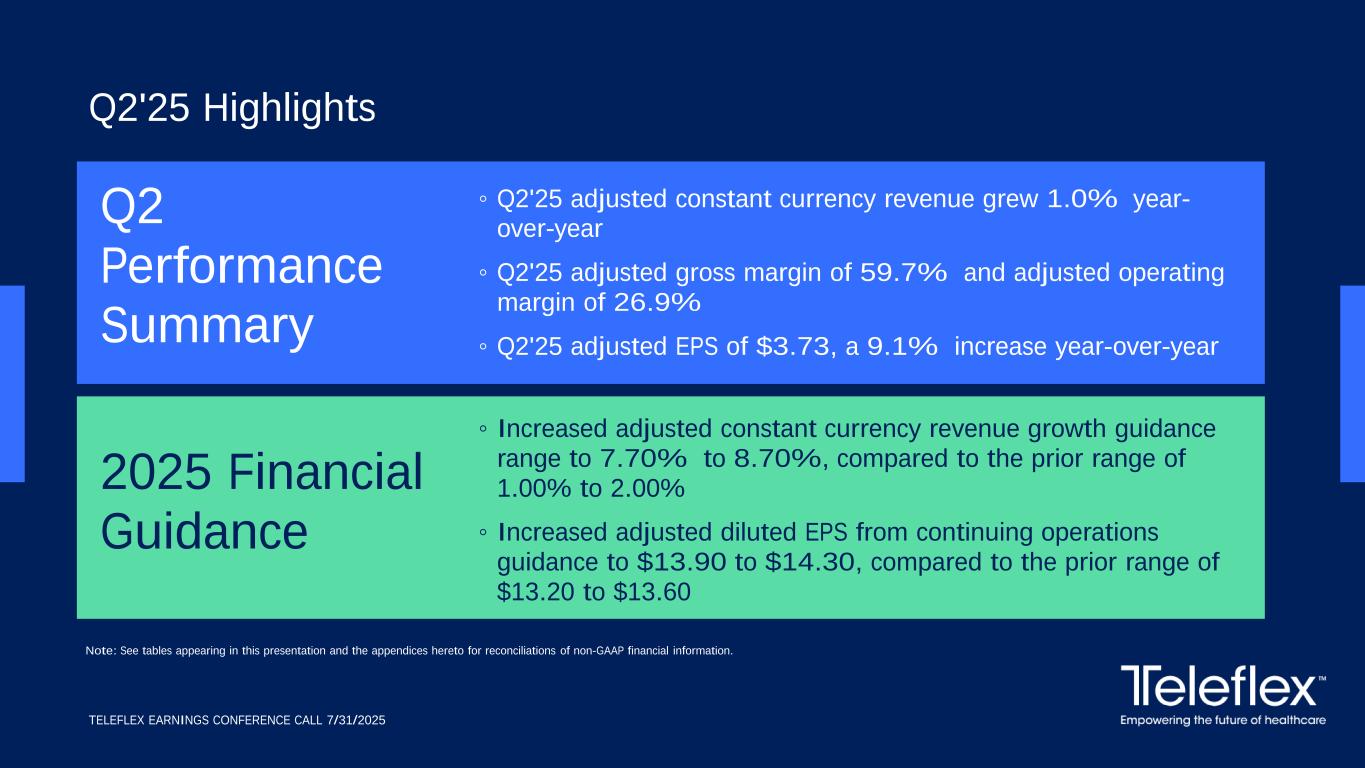
Q2 Performance Summary ◦ Increased adjusted constant currency revenue growth guidance range to 7.70% to 8.70%, compared to the prior range of 1.00% to 2.00% ◦ Increased adjusted diluted EPS from continuing operations guidance to $13.90 to $14.30, compared to the prior range of $13.20 to $13.60 ◦ Q2'25 adjusted constant currency revenue grew 1.0% year- over-year ◦ Q2'25 adjusted gross margin of 59.7% and adjusted operating margin of 26.9% ◦ Q2'25 adjusted EPS of $3.73, a 9.1% increase year-over-year Q2'25 Highlights 2025 Financial Guidance Note: See tables appearing in this presentation and the appendices hereto for reconciliations of non-GAAP financial information. TELEFLEX EARNINGS CONFERENCE CALL 7/31/2025
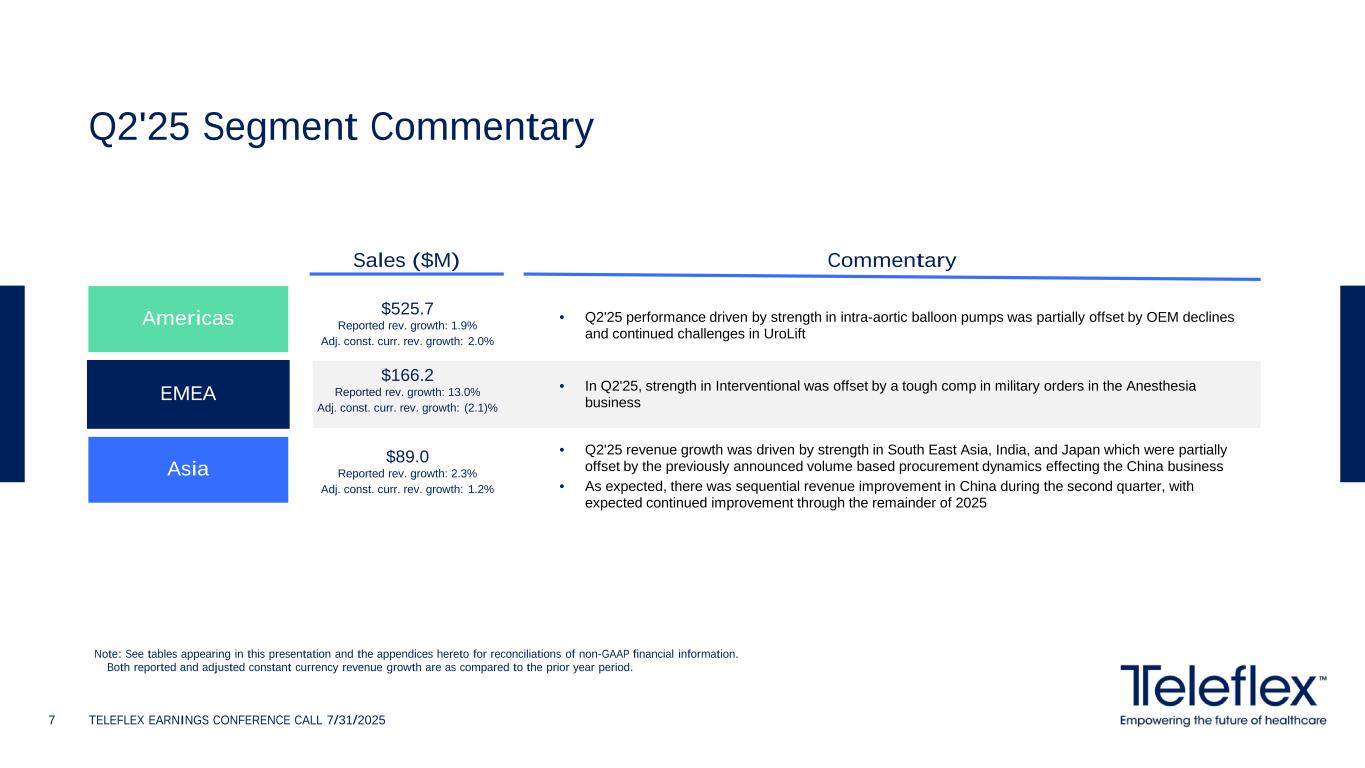
Q2'25 Segment Commentary TELEFLEX EARNINGS CONFERENCE CALL 7/31/20257 Americas Asia EMEA Sales ($M) Commentary • Q2'25 performance driven by strength in intra-aortic balloon pumps was partially offset by OEM declines and continued challenges in UroLift $525.7 Reported rev. growth: 1.9% Adj. const. curr. rev. growth: 2.0% Note: See tables appearing in this presentation and the appendices hereto for reconciliations of non-GAAP financial information. Both reported and adjusted constant currency revenue growth are as compared to the prior year period. $166.2 Reported rev. growth: 13.0% Adj. const. curr. rev. growth: (2.1)% $89.0 Reported rev. growth: 2.3% Adj. const. curr. rev. growth: 1.2% • In Q2'25, strength in Interventional was offset by a tough comp in military orders in the Anesthesia business • Q2'25 revenue growth was driven by strength in South East Asia, India, and Japan which were partially offset by the previously announced volume based procurement dynamics effecting the China business • As expected, there was sequential revenue improvement in China during the second quarter, with expected continued improvement through the remainder of 2025
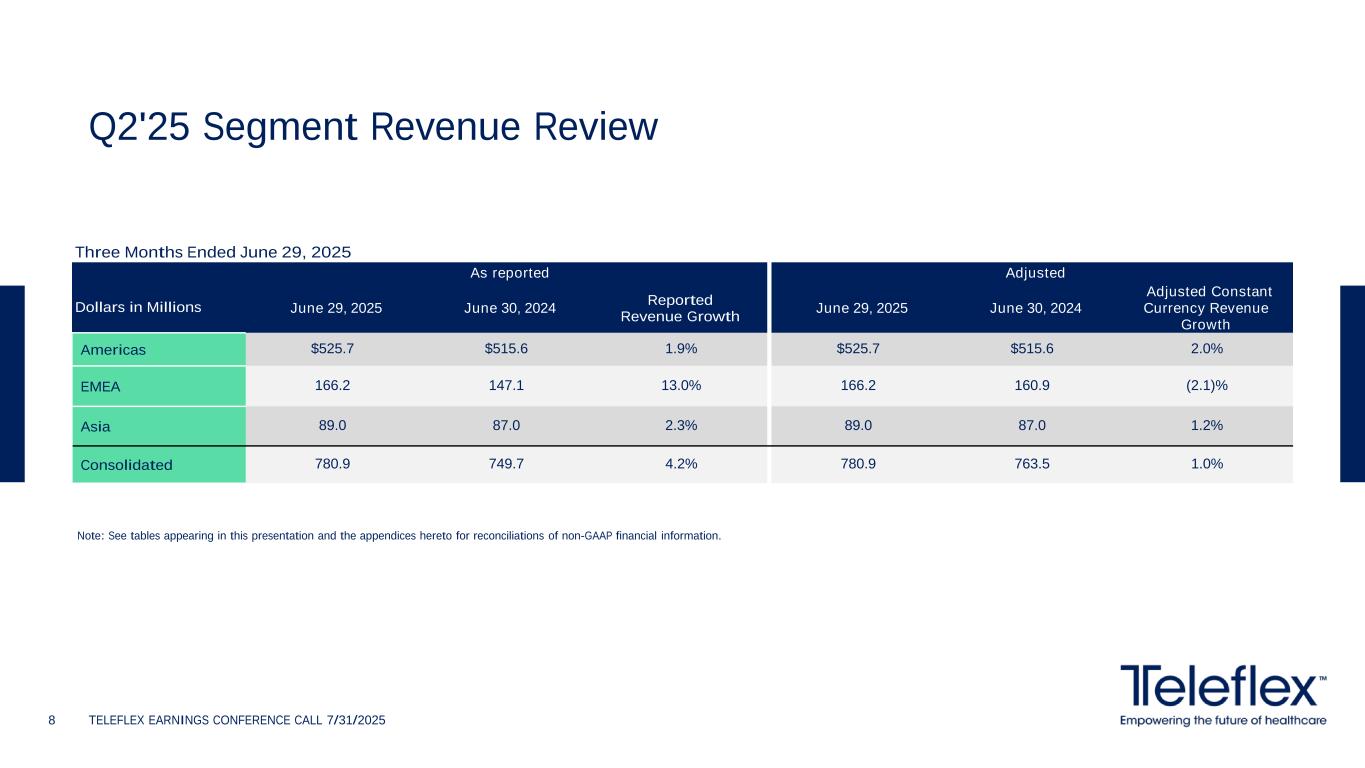
Q2'25 Segment Revenue Review TELEFLEX EARNINGS CONFERENCE CALL 7/31/20258 Three Months Ended June 29, 2025 As reported Adjusted Dollars in Millions June 29, 2025 June 30, 2024 Reported Revenue Growth June 29, 2025 June 30, 2024 Adjusted Constant Currency Revenue Growth Americas $525.7 $515.6 1.9% $525.7 $515.6 2.0% EMEA 166.2 147.1 13.0% 166.2 160.9 (2.1)% Asia 89.0 87.0 2.3% 89.0 87.0 1.2% Consolidated 780.9 749.7 4.2% 780.9 763.5 1.0% Note: See tables appearing in this presentation and the appendices hereto for reconciliations of non-GAAP financial information.
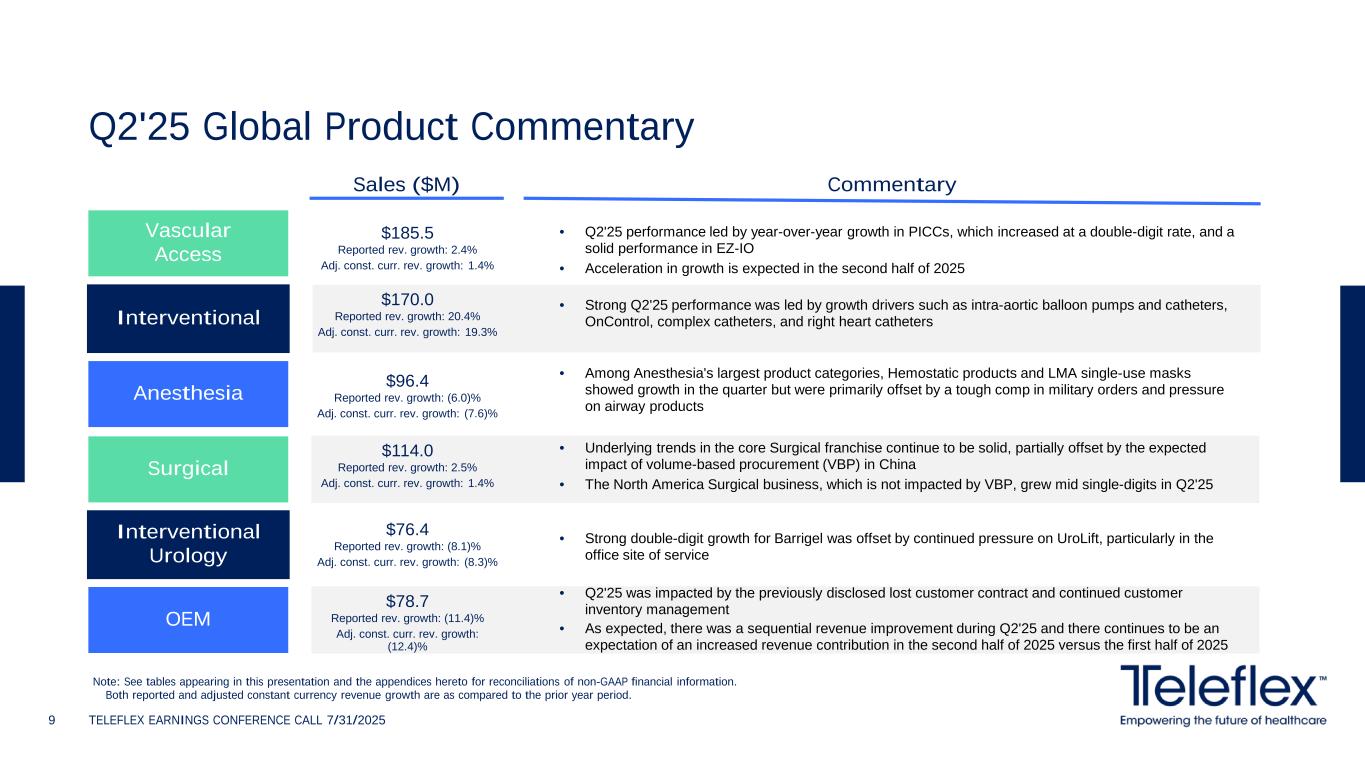
Q2'25 Global Product Commentary TELEFLEX EARNINGS CONFERENCE CALL 7/31/20259 Vascular Access Anesthesia Interventional Sales ($M) Commentary • Q2'25 performance led by year-over-year growth in PICCs, which increased at a double-digit rate, and a solid performance in EZ-IO Surgical OEM Interventional Urology • Strong Q2'25 performance was led by growth drivers such as intra-aortic balloon pumps and catheters, OnControl, complex catheters, and right heart catheters $185.5 Reported rev. growth: 2.4% Adj. const. curr. rev. growth: 1.4% Note: See tables appearing in this presentation and the appendices hereto for reconciliations of non-GAAP financial information. Both reported and adjusted constant currency revenue growth are as compared to the prior year period. $170.0 Reported rev. growth: 20.4% Adj. const. curr. rev. growth: 19.3% $96.4 Reported rev. growth: (6.0)% Adj. const. curr. rev. growth: (7.6)% $114.0 Reported rev. growth: 2.5% Adj. const. curr. rev. growth: 1.4% $76.4 Reported rev. growth: (8.1)% Adj. const. curr. rev. growth: (8.3)% $78.7 Reported rev. growth: (11.4)% Adj. const. curr. rev. growth: (12.4)% • Acceleration in growth is expected in the second half of 2025 • Among Anesthesia's largest product categories, Hemostatic products and LMA single-use masks showed growth in the quarter but were primarily offset by a tough comp in military orders and pressure on airway products • Underlying trends in the core Surgical franchise continue to be solid, partially offset by the expected impact of volume-based procurement (VBP) in China • The North America Surgical business, which is not impacted by VBP, grew mid single-digits in Q2'25 • Strong double-digit growth for Barrigel was offset by continued pressure on UroLift, particularly in the office site of service • Q2'25 was impacted by the previously disclosed lost customer contract and continued customer inventory management • As expected, there was a sequential revenue improvement during Q2'25 and there continues to be an expectation of an increased revenue contribution in the second half of 2025 versus the first half of 2025
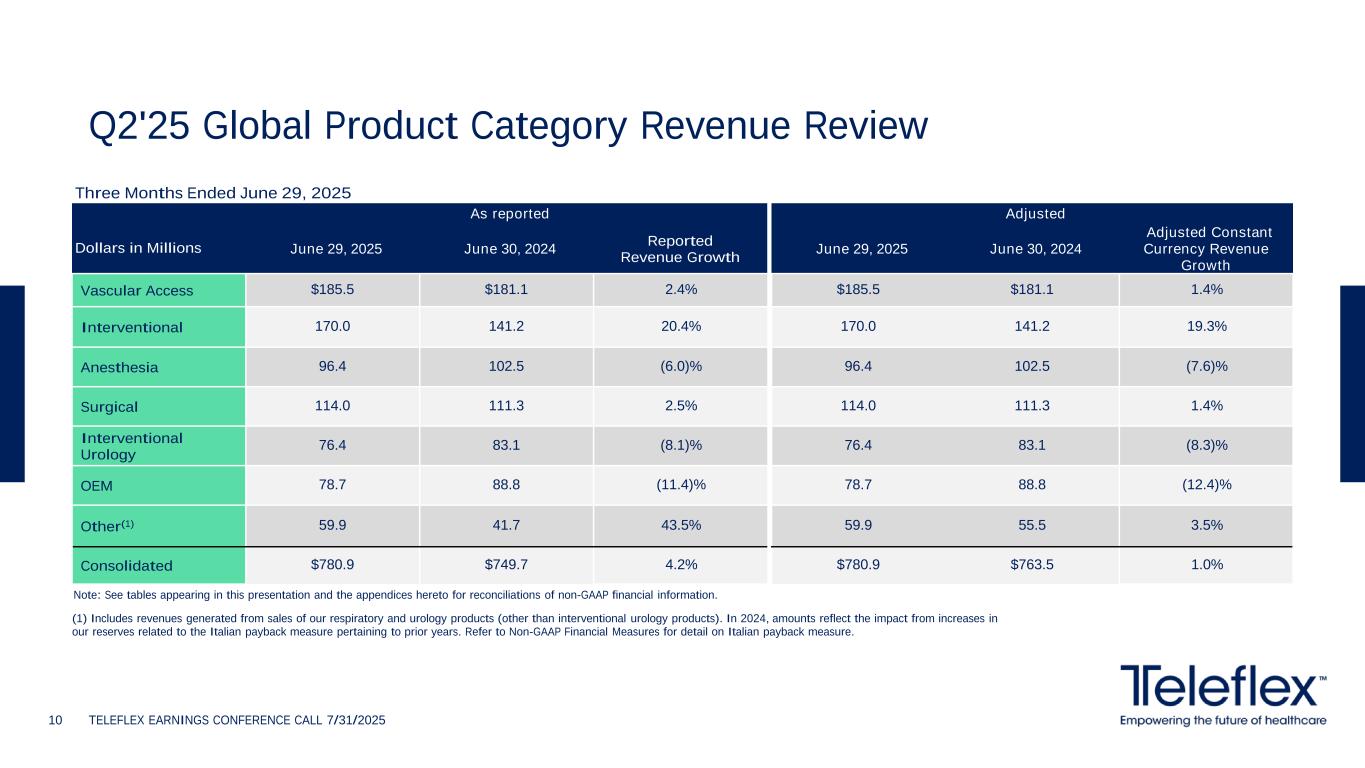
Q2'25 Global Product Category Revenue Review TELEFLEX EARNINGS CONFERENCE CALL 7/31/202510 (1) Includes revenues generated from sales of our respiratory and urology products (other than interventional urology products). In 2024, amounts reflect the impact from increases in our reserves related to the Italian payback measure pertaining to prior years. Refer to Non-GAAP Financial Measures for detail on Italian payback measure. Three Months Ended June 29, 2025 As reported Adjusted Dollars in Millions June 29, 2025 June 30, 2024 Reported Revenue Growth June 29, 2025 June 30, 2024 Adjusted Constant Currency Revenue Growth Vascular Access $185.5 $181.1 2.4% $185.5 $181.1 1.4% Interventional 170.0 141.2 20.4% 170.0 141.2 19.3% Anesthesia 96.4 102.5 (6.0)% 96.4 102.5 (7.6)% Surgical 114.0 111.3 2.5% 114.0 111.3 1.4% Interventional Urology 76.4 83.1 (8.1)% 76.4 83.1 (8.3)% OEM 78.7 88.8 (11.4)% 78.7 88.8 (12.4)% Other(1) 59.9 41.7 43.5% 59.9 55.5 3.5% Consolidated $780.9 $749.7 4.2% $780.9 $763.5 1.0% Note: See tables appearing in this presentation and the appendices hereto for reconciliations of non-GAAP financial information.
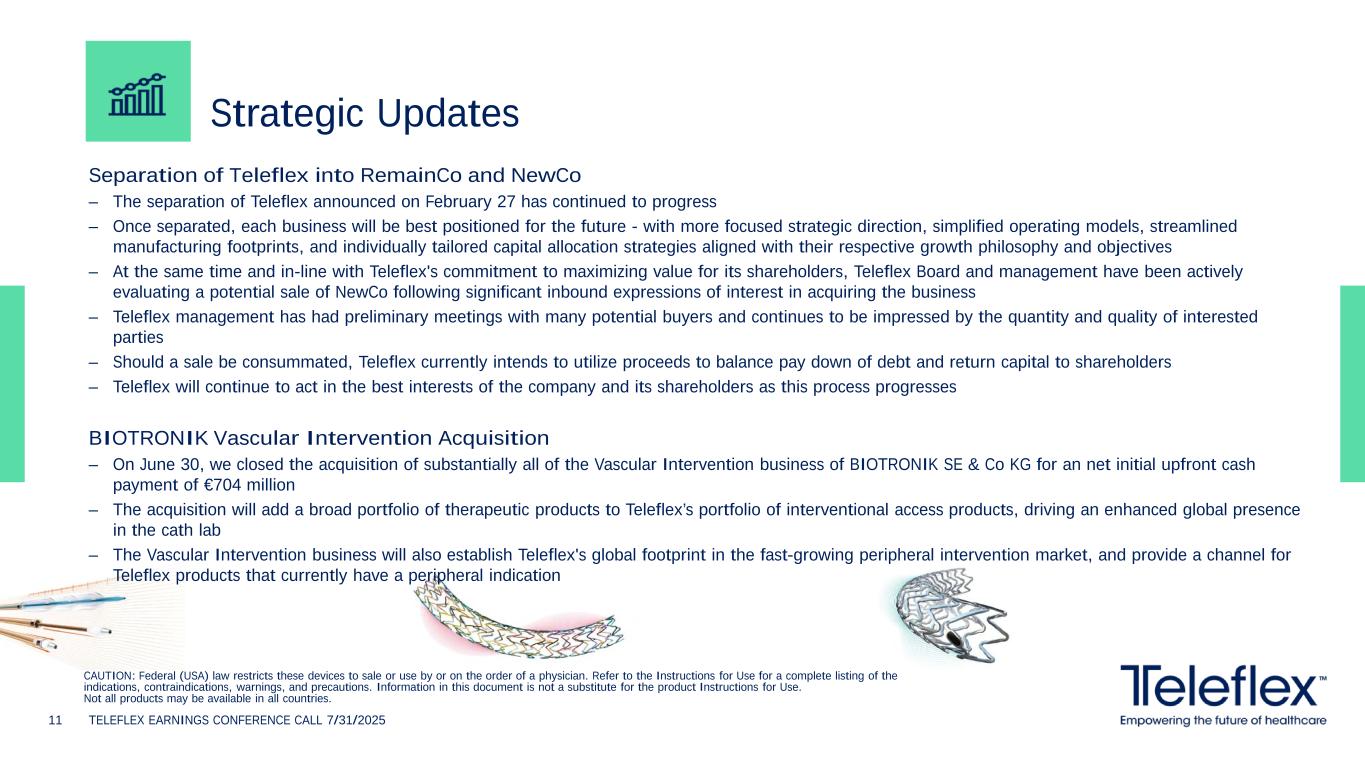
CAUTION: Federal (USA) law restricts these devices to sale or use by or on the order of a physician. Refer to the Instructions for Use for a complete listing of the indications, contraindications, warnings, and precautions. Information in this document is not a substitute for the product Instructions for Use. Not all products may be available in all countries. Separation of Teleflex into RemainCo and NewCo – The separation of Teleflex announced on February 27 has continued to progress – Once separated, each business will be best positioned for the future - with more focused strategic direction, simplified operating models, streamlined manufacturing footprints, and individually tailored capital allocation strategies aligned with their respective growth philosophy and objectives – At the same time and in-line with Teleflex's commitment to maximizing value for its shareholders, Teleflex Board and management have been actively evaluating a potential sale of NewCo following significant inbound expressions of interest in acquiring the business – Teleflex management has had preliminary meetings with many potential buyers and continues to be impressed by the quantity and quality of interested parties – Should a sale be consummated, Teleflex currently intends to utilize proceeds to balance pay down of debt and return capital to shareholders – Teleflex will continue to act in the best interests of the company and its shareholders as this process progresses BIOTRONIK Vascular Intervention Acquisition – On June 30, we closed the acquisition of substantially all of the Vascular Intervention business of BIOTRONIK SE & Co KG for an net initial upfront cash payment of €704 million – The acquisition will add a broad portfolio of therapeutic products to Teleflex’s portfolio of interventional access products, driving an enhanced global presence in the cath lab – The Vascular Intervention business will also establish Teleflex's global footprint in the fast-growing peripheral intervention market, and provide a channel for Teleflex products that currently have a peripheral indication Strategic Updates 11 TELEFLEX EARNINGS CONFERENCE CALL 7/31/2025
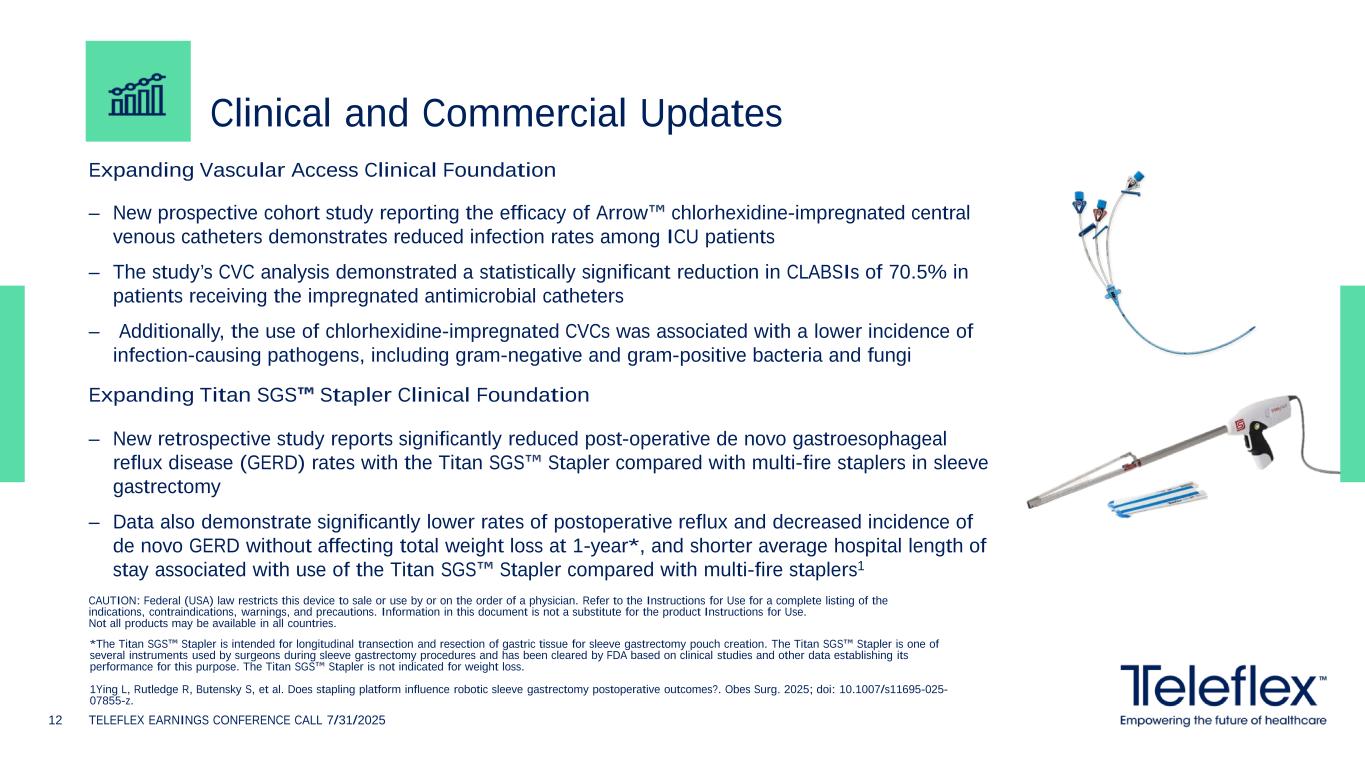
CAUTION: Federal (USA) law restricts this device to sale or use by or on the order of a physician. Refer to the Instructions for Use for a complete listing of the indications, contraindications, warnings, and precautions. Information in this document is not a substitute for the product Instructions for Use. Not all products may be available in all countries. Expanding Vascular Access Clinical Foundation – New prospective cohort study reporting the efficacy of Arrow chlorhexidine-impregnated central venous catheters demonstrates reduced infection rates among ICU patients – The study’s CVC analysis demonstrated a statistically significant reduction in CLABSIs of 70.5% in patients receiving the impregnated antimicrobial catheters – Additionally, the use of chlorhexidine-impregnated CVCs was associated with a lower incidence of infection-causing pathogens, including gram-negative and gram-positive bacteria and fungi Expanding Titan SGS Stapler Clinical Foundation – New retrospective study reports significantly reduced post-operative de novo gastroesophageal reflux disease (GERD) rates with the Titan SGS Stapler compared with multi-fire staplers in sleeve gastrectomy – Data also demonstrate significantly lower rates of postoperative reflux and decreased incidence of de novo GERD without affecting total weight loss at 1-year*, and shorter average hospital length of stay associated with use of the Titan SGS Stapler compared with multi-fire staplers1 Clinical and Commercial Updates TELEFLEX EARNINGS CONFERENCE CALL 7/31/202512 *The Titan SGS Stapler is intended for longitudinal transection and resection of gastric tissue for sleeve gastrectomy pouch creation. The Titan SGS Stapler is one of several instruments used by surgeons during sleeve gastrectomy procedures and has been cleared by FDA based on clinical studies and other data establishing its performance for this purpose. The Titan SGS Stapler is not indicated for weight loss. 1Ying L, Rutledge R, Butensky S, et al. Does stapling platform influence robotic sleeve gastrectomy postoperative outcomes?. Obes Surg. 2025; doi: 10.1007/s11695-025- 07855-z.

John Deren Executive VP and CFO Financial Overview
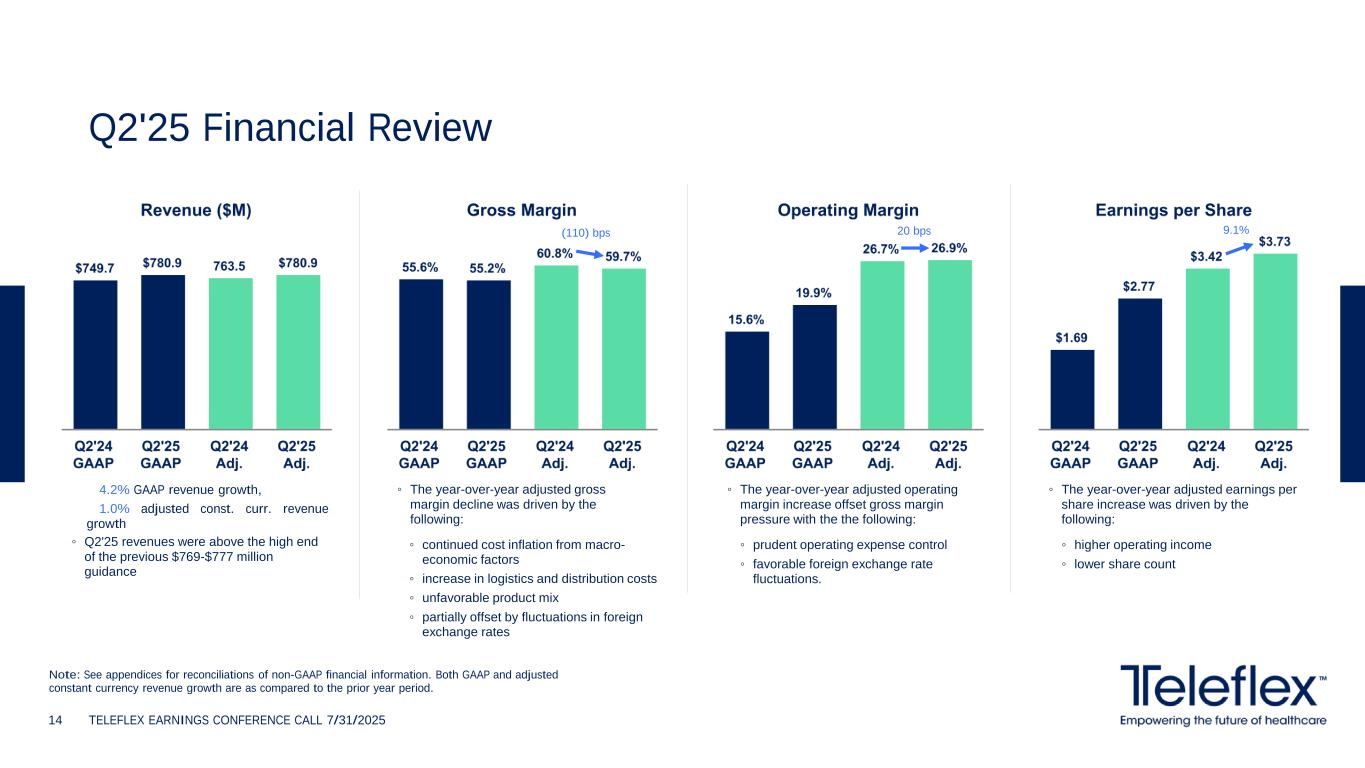
Q2'25 Financial Review TELEFLEX EARNINGS CONFERENCE CALL 7/31/202514 Note: See appendices for reconciliations of non-GAAP financial information. Both GAAP and adjusted constant currency revenue growth are as compared to the prior year period. 4.2% GAAP revenue growth, 1.0% adjusted const. curr. revenue growth ◦ Q2'25 revenues were above the high end of the previous $769-$777 million guidance ◦ The year-over-year adjusted operating margin increase offset gross margin pressure with the the following: ◦ The year-over-year adjusted gross margin decline was driven by the following: ◦ The year-over-year adjusted earnings per share increase was driven by the following: (110) bps 20 bps 9.1% ◦ continued cost inflation from macro- economic factors ◦ increase in logistics and distribution costs ◦ unfavorable product mix ◦ partially offset by fluctuations in foreign exchange rates ◦ prudent operating expense control ◦ favorable foreign exchange rate fluctuations. ◦ higher operating income ◦ lower share count
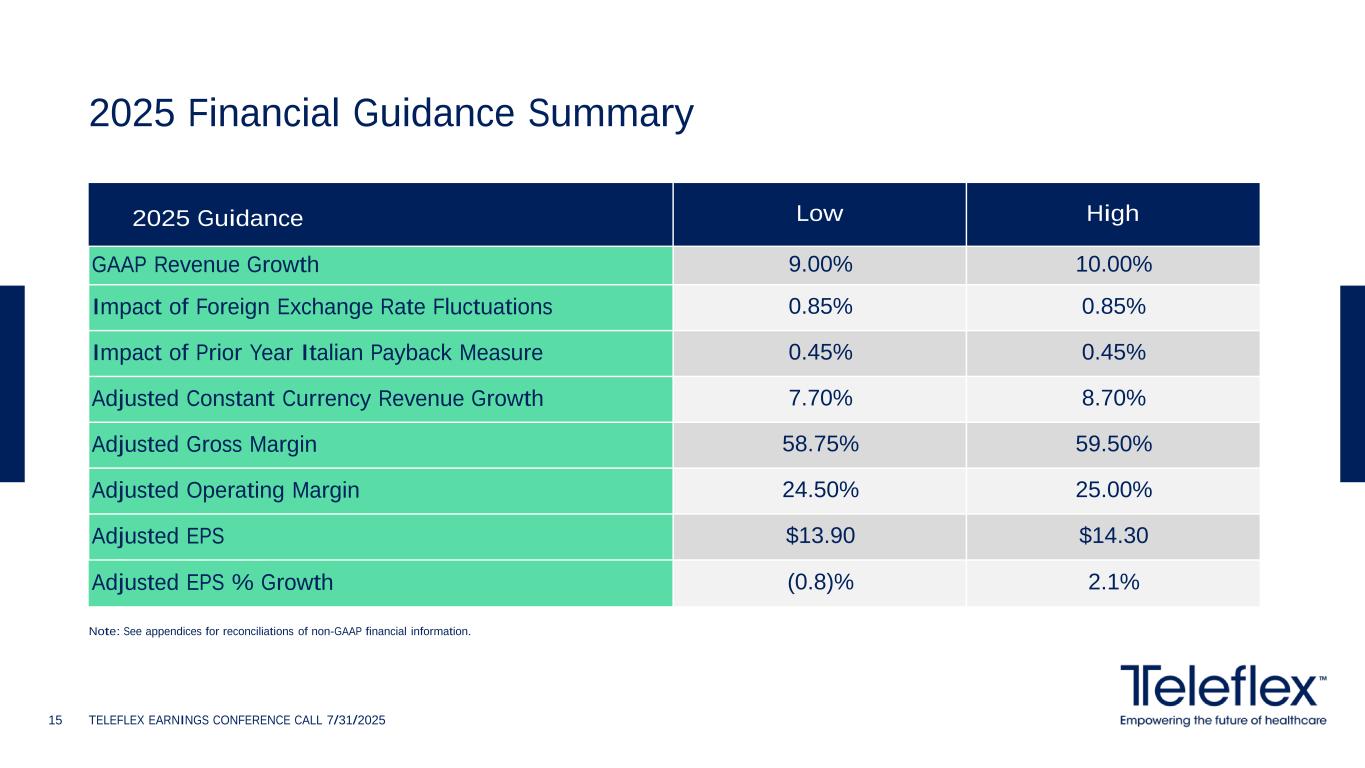
2025 Financial Guidance Summary TELEFLEX EARNINGS CONFERENCE CALL 7/31/202515 2025 Guidance Low High GAAP Revenue Growth 9.00% 10.00% Impact of Foreign Exchange Rate Fluctuations 0.85% 0.85% Impact of Prior Year Italian Payback Measure 0.45% 0.45% Adjusted Constant Currency Revenue Growth 7.70% 8.70% Adjusted Gross Margin 58.75% 59.50% Adjusted Operating Margin 24.50% 25.00% Adjusted EPS $13.90 $14.30 Adjusted EPS % Growth (0.8)% 2.1% Note: See appendices for reconciliations of non-GAAP financial information.
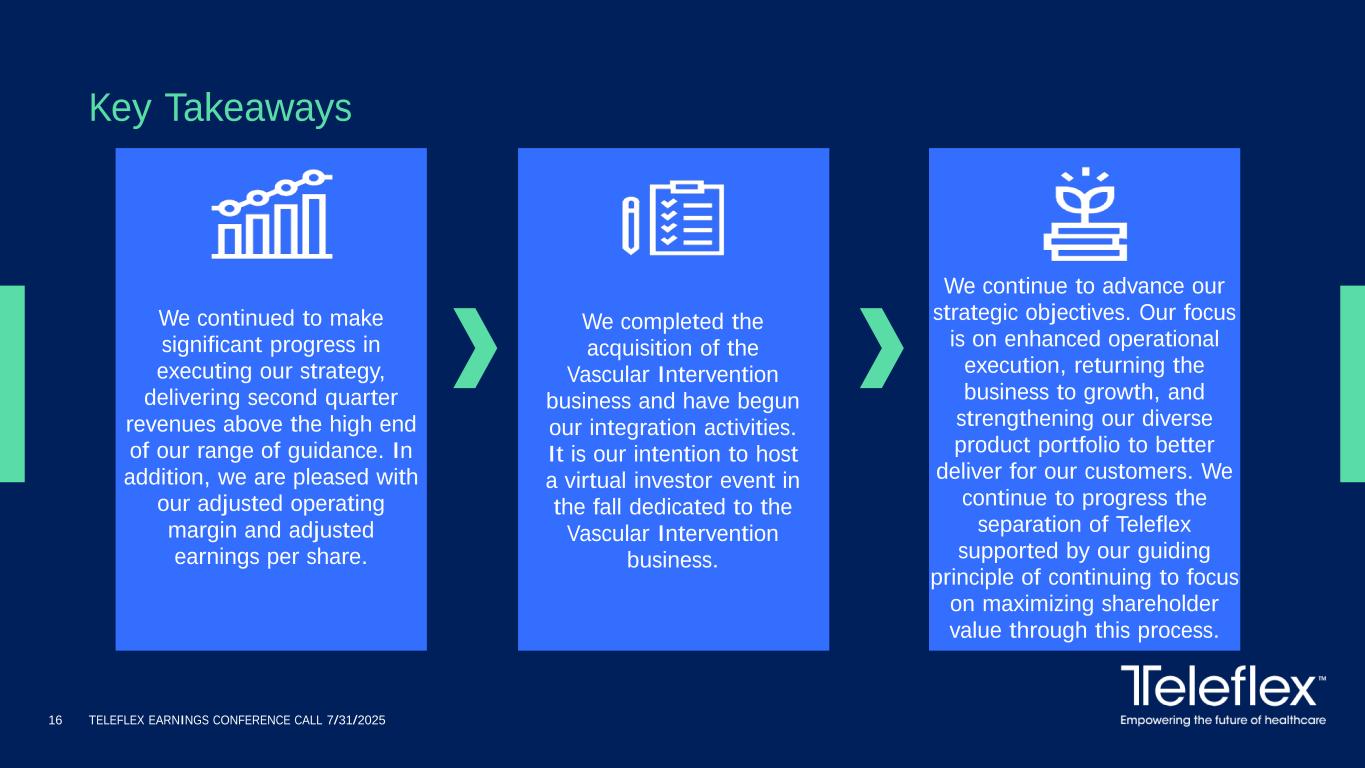
TELEFLEX EARNINGS CONFERENCE CALL 7/31/202516 Key Takeaways We continued to make significant progress in executing our strategy, delivering second quarter revenues above the high end of our range of guidance. In addition, we are pleased with our adjusted operating margin and adjusted earnings per share. We completed the acquisition of the Vascular Intervention business and have begun our integration activities. It is our intention to host a virtual investor event in the fall dedicated to the Vascular Intervention business. We continue to advance our strategic objectives. Our focus is on enhanced operational execution, returning the business to growth, and strengthening our diverse product portfolio to better deliver for our customers. We continue to progress the separation of Teleflex supported by our guiding principle of continuing to focus on maximizing shareholder value through this process.

TELEFLEX EARNINGS CONFERENCE CALL 7/31/202517 Thank You!

Appendices
The presentation to which these appendices are attached and the following appendices include, among other things, tables reconciling the following applicable non-GAAP financial measures to the most comparable GAAP financial measure: Adjusted revenue. This non-GAAP measure is based upon net revenues, adjusted to exclude the impact in the year ended December 31, 2024 of an increase in our reserves, and corresponding reduction to revenue within our EMEA segment, for prior years. The reserve relates to the Italian payback measure, a law that requires suppliers of medical devices to the Italian National Healthcare System to make payments to the Italian government if medical device expenditures in a given year exceed regional expenditure ceilings established for that year. As a result of a ruling from the Italian courts, we recognized an increase in our reserves in the year ended December 31, 2024, of which $13.8 million related to prior years. The prior year amounts do not represent normal adjustments to revenue, are not expected to recur in future periods and are not recurring in nature, making it difficult to contribute to a meaningful evaluation of our operating performance. Accordingly, management has excluded the $13.8 million prior year amount as it is not indicative of our underlying core performance or business trends. Adjusted constant currency revenue growth. This non-GAAP measure is based upon net revenues, adjusted to exclude, depending on the period presented, the items described in Adjusted revenue and to eliminate the impact of translating the results of international subsidiaries at different currency exchange rates from period to period. The impact of changes in foreign currency may vary significantly from period to period, and such changes generally are outside of the control of our management. We believe that this measure facilitates a comparison of our operating performance exclusive of currency exchange rate fluctuations that do not reflect our underlying performance or business trends. Adjusted diluted earnings per share. This non-GAAP measure is based upon diluted earnings per share from continuing operations, the most directly comparable GAAP measure, adjusted to exclude, depending on the period presented, the impact of (i) restructuring and rationalization charges; (ii) impairment charges; (iii) acquisition, integration and divestiture related items; (iv) separation costs; (v) Italian payback measure; (vi) costs incurred in connection with our implementation of a new global ERP solution and related IT transition costs; (vii) pension termination and related charges; (viii) certain costs associated with the registration of medical devices under the European Union Medical Device Regulation; (ix) intangible amortization expense; and (x) tax adjustments. Management does not believe that any of the excluded items are indicative of our underlying core performance or business trends. Adjusted gross profit and margin. These measures exclude, depending on the period presented, the impacts of (i) restructuring and rationalization charges; (ii) impairment charges; (iii) acquisition, integration and divestiture related items and (iv) Italian payback measure. Adjusted operating profit and margin. These measures exclude, depending on the period presented, the impact of (i) restructuring and rationalization charges; (ii) impairment charges; (iii) acquisition, integration and divestiture related items; (iv) separation costs; (v) Italian payback measure; (vi) costs incurred in connection with our implementation of a new global ERP solution and related IT transition costs; (vii) pension termination and related charges; (viii) intangible amortization expense; and (ix) certain costs associated with the registration of medical devices under the European Union Medical Device Regulation. Adjusted tax rate. This measure is the percentage of the Company’s adjusted taxes on income from continuing operations to its adjusted income from continuing operations before taxes. Adjusted taxes on income from continuing operations excludes, depending on the period presented, the impact of tax benefits or costs associated with (i) restructuring and rationalization charges; (ii) impairment charges; (iii) acquisition, integration and divestiture related items; (iv) separation costs; (v) Italian payback measure; (vi) costs incurred in connection with our implementation of a new global ERP solution and related IT transition costs; (vii) certain costs associated with the registration of medical devices under the European Union Medical Device Regulation; (viii) intangible amortization expense; and (ix) tax adjustments. Non-GAAP Financial Measures TELEFLEX EARNINGS CONFERENCE CALL 7/31/202519
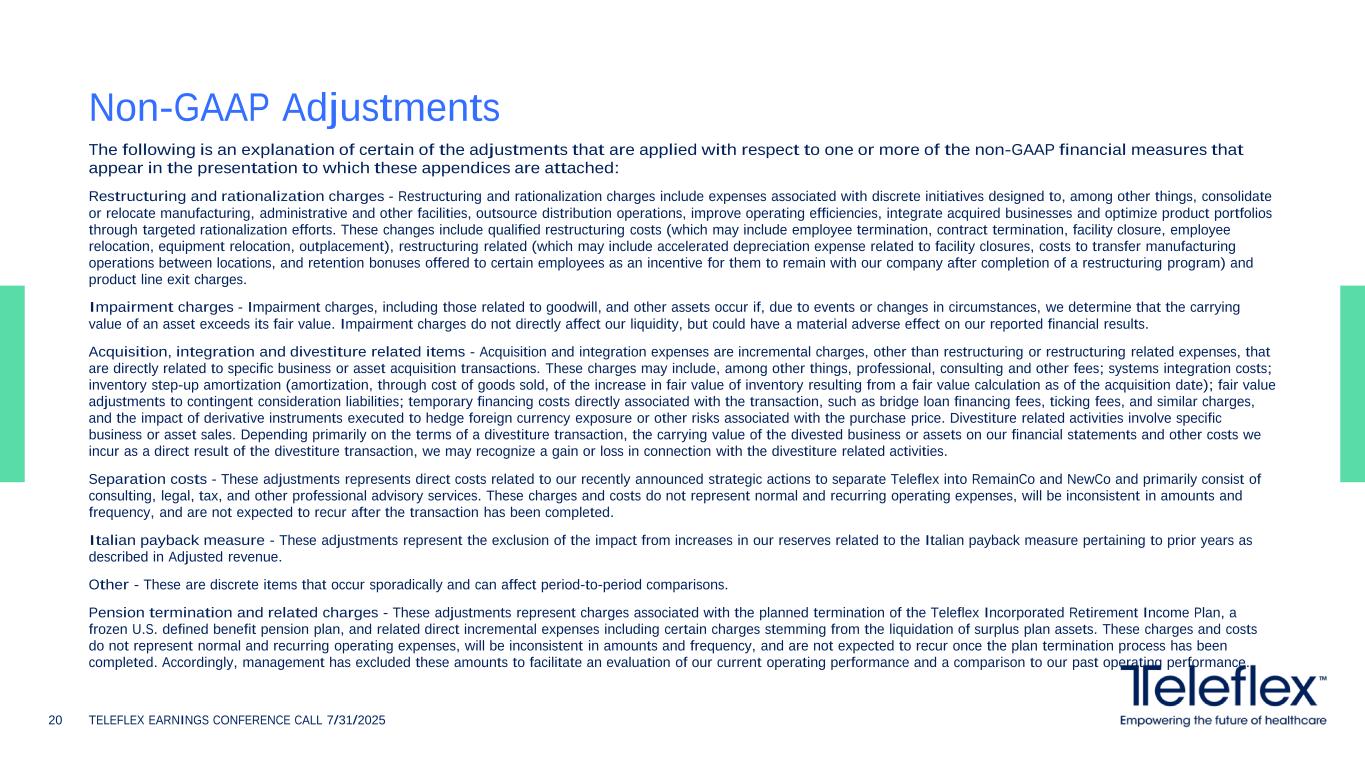
The following is an explanation of certain of the adjustments that are applied with respect to one or more of the non-GAAP financial measures that appear in the presentation to which these appendices are attached: Restructuring and rationalization charges - Restructuring and rationalization charges include expenses associated with discrete initiatives designed to, among other things, consolidate or relocate manufacturing, administrative and other facilities, outsource distribution operations, improve operating efficiencies, integrate acquired businesses and optimize product portfolios through targeted rationalization efforts. These changes include qualified restructuring costs (which may include employee termination, contract termination, facility closure, employee relocation, equipment relocation, outplacement), restructuring related (which may include accelerated depreciation expense related to facility closures, costs to transfer manufacturing operations between locations, and retention bonuses offered to certain employees as an incentive for them to remain with our company after completion of a restructuring program) and product line exit charges. Impairment charges - Impairment charges, including those related to goodwill, and other assets occur if, due to events or changes in circumstances, we determine that the carrying value of an asset exceeds its fair value. Impairment charges do not directly affect our liquidity, but could have a material adverse effect on our reported financial results. Acquisition, integration and divestiture related items - Acquisition and integration expenses are incremental charges, other than restructuring or restructuring related expenses, that are directly related to specific business or asset acquisition transactions. These charges may include, among other things, professional, consulting and other fees; systems integration costs; inventory step-up amortization (amortization, through cost of goods sold, of the increase in fair value of inventory resulting from a fair value calculation as of the acquisition date); fair value adjustments to contingent consideration liabilities; temporary financing costs directly associated with the transaction, such as bridge loan financing fees, ticking fees, and similar charges, and the impact of derivative instruments executed to hedge foreign currency exposure or other risks associated with the purchase price. Divestiture related activities involve specific business or asset sales. Depending primarily on the terms of a divestiture transaction, the carrying value of the divested business or assets on our financial statements and other costs we incur as a direct result of the divestiture transaction, we may recognize a gain or loss in connection with the divestiture related activities. Separation costs - These adjustments represents direct costs related to our recently announced strategic actions to separate Teleflex into RemainCo and NewCo and primarily consist of consulting, legal, tax, and other professional advisory services. These charges and costs do not represent normal and recurring operating expenses, will be inconsistent in amounts and frequency, and are not expected to recur after the transaction has been completed. Italian payback measure - These adjustments represent the exclusion of the impact from increases in our reserves related to the Italian payback measure pertaining to prior years as described in Adjusted revenue. Other - These are discrete items that occur sporadically and can affect period-to-period comparisons. Pension termination and related charges - These adjustments represent charges associated with the planned termination of the Teleflex Incorporated Retirement Income Plan, a frozen U.S. defined benefit pension plan, and related direct incremental expenses including certain charges stemming from the liquidation of surplus plan assets. These charges and costs do not represent normal and recurring operating expenses, will be inconsistent in amounts and frequency, and are not expected to recur once the plan termination process has been completed. Accordingly, management has excluded these amounts to facilitate an evaluation of our current operating performance and a comparison to our past operating performance. Non-GAAP Adjustments TELEFLEX EARNINGS CONFERENCE CALL 7/31/202520
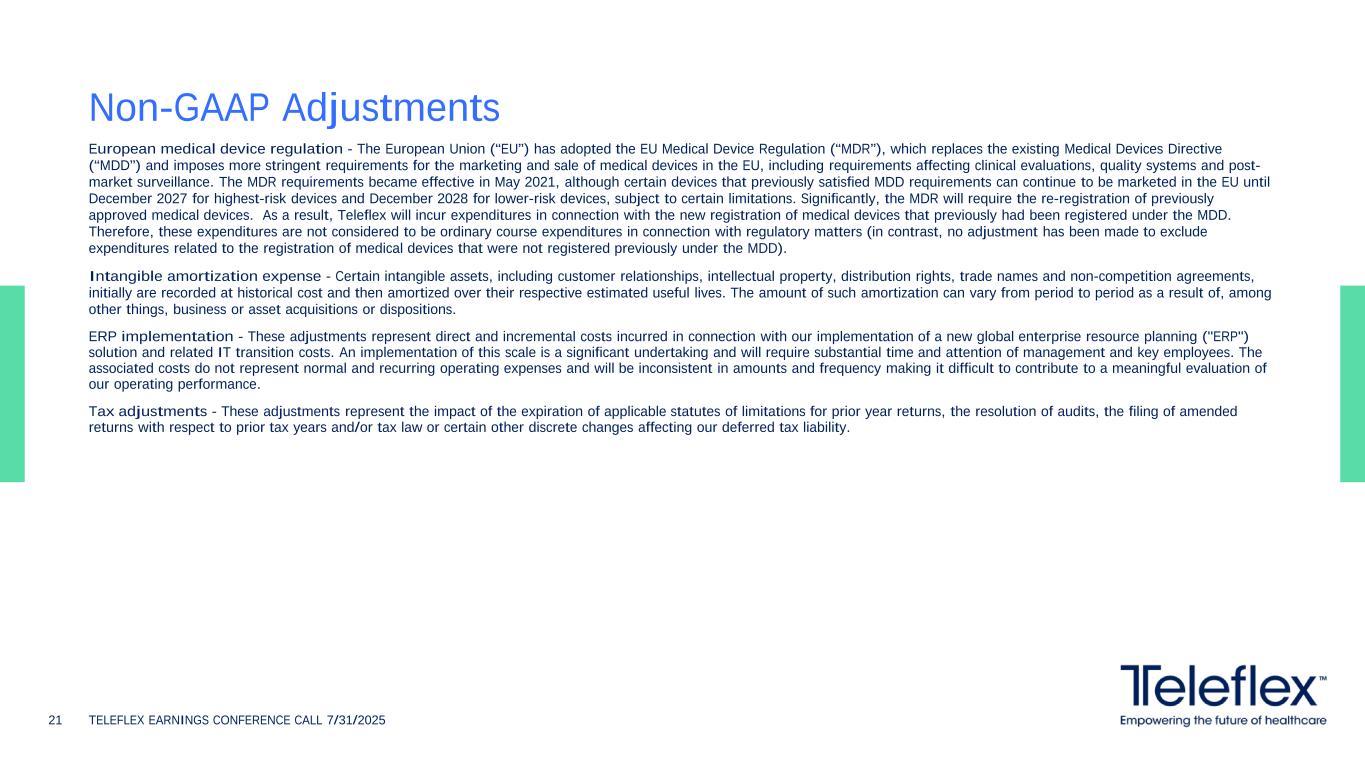
European medical device regulation - The European Union (“EU”) has adopted the EU Medical Device Regulation (“MDR”), which replaces the existing Medical Devices Directive (“MDD”) and imposes more stringent requirements for the marketing and sale of medical devices in the EU, including requirements affecting clinical evaluations, quality systems and post- market surveillance. The MDR requirements became effective in May 2021, although certain devices that previously satisfied MDD requirements can continue to be marketed in the EU until December 2027 for highest-risk devices and December 2028 for lower-risk devices, subject to certain limitations. Significantly, the MDR will require the re-registration of previously approved medical devices. As a result, Teleflex will incur expenditures in connection with the new registration of medical devices that previously had been registered under the MDD. Therefore, these expenditures are not considered to be ordinary course expenditures in connection with regulatory matters (in contrast, no adjustment has been made to exclude expenditures related to the registration of medical devices that were not registered previously under the MDD). Intangible amortization expense - Certain intangible assets, including customer relationships, intellectual property, distribution rights, trade names and non-competition agreements, initially are recorded at historical cost and then amortized over their respective estimated useful lives. The amount of such amortization can vary from period to period as a result of, among other things, business or asset acquisitions or dispositions. ERP implementation - These adjustments represent direct and incremental costs incurred in connection with our implementation of a new global enterprise resource planning ("ERP") solution and related IT transition costs. An implementation of this scale is a significant undertaking and will require substantial time and attention of management and key employees. The associated costs do not represent normal and recurring operating expenses and will be inconsistent in amounts and frequency making it difficult to contribute to a meaningful evaluation of our operating performance. Tax adjustments - These adjustments represent the impact of the expiration of applicable statutes of limitations for prior year returns, the resolution of audits, the filing of amended returns with respect to prior tax years and/or tax law or certain other discrete changes affecting our deferred tax liability. Non-GAAP Adjustments TELEFLEX EARNINGS CONFERENCE CALL 7/31/202521
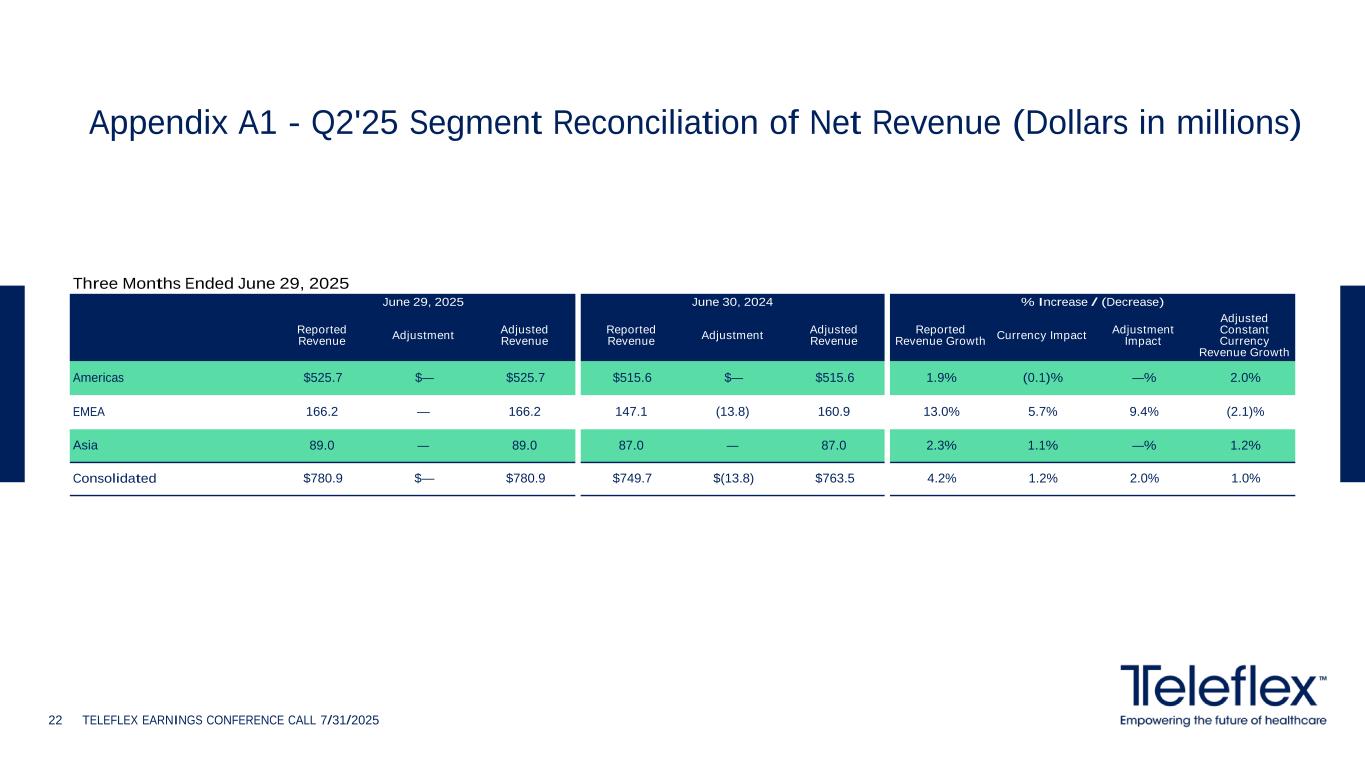
Three Months Ended June 29, 2025 June 29, 2025 June 30, 2024 % Increase / (Decrease) Reported Revenue Adjustment Adjusted Revenue Reported Revenue Adjustment Adjusted Revenue Reported Revenue Growth Currency Impact Adjustment Impact Adjusted Constant Currency Revenue Growth Americas $525.7 $— $525.7 $515.6 $— $515.6 1.9% (0.1)% —% 2.0% EMEA 166.2 — 166.2 147.1 (13.8) 160.9 13.0% 5.7% 9.4% (2.1)% Asia 89.0 — 89.0 87.0 — 87.0 2.3% 1.1% —% 1.2% Consolidated $780.9 $— $780.9 $749.7 $(13.8) $763.5 4.2% 1.2% 2.0% 1.0% TELEFLEX EARNINGS CONFERENCE CALL 7/31/202522 Appendix A1 - Q2'25 Segment Reconciliation of Net Revenue (Dollars in millions)
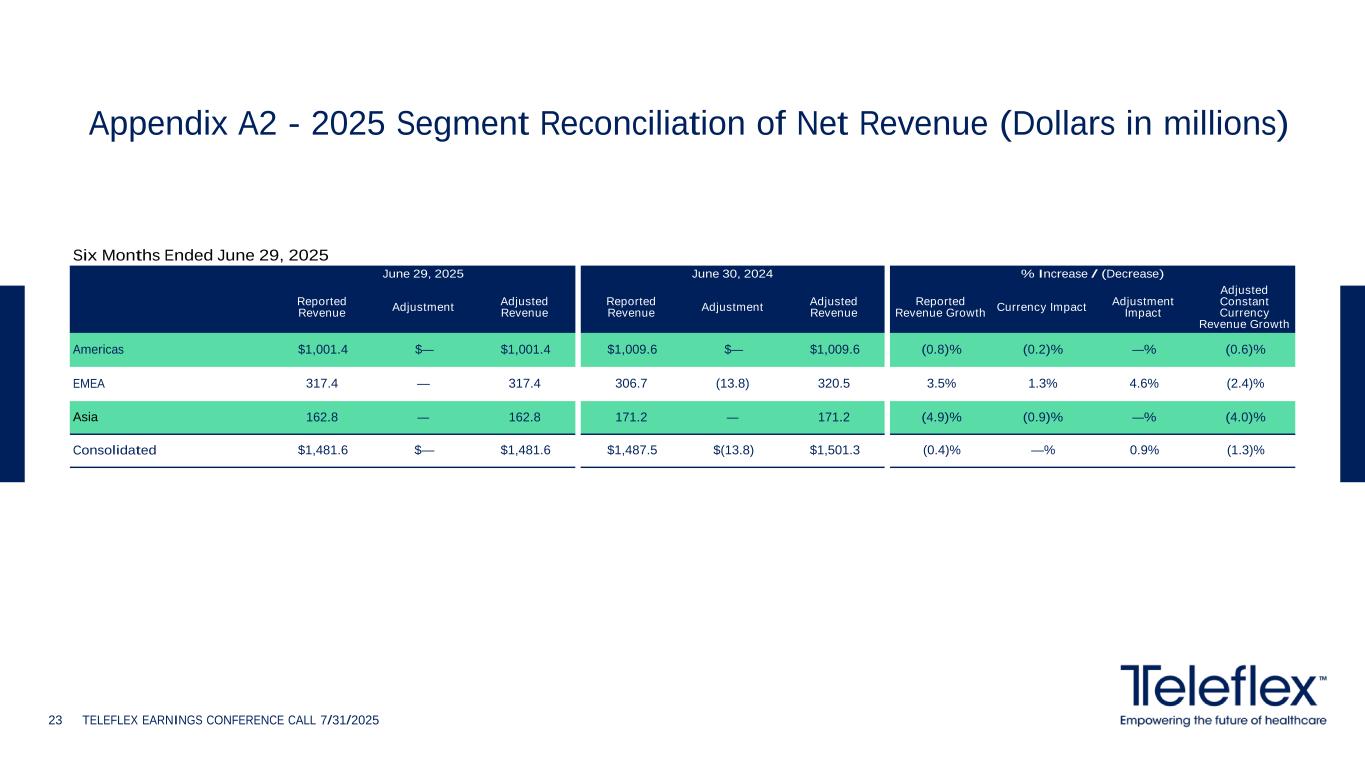
Six Months Ended June 29, 2025 June 29, 2025 June 30, 2024 % Increase / (Decrease) Reported Revenue Adjustment Adjusted Revenue Reported Revenue Adjustment Adjusted Revenue Reported Revenue Growth Currency Impact Adjustment Impact Adjusted Constant Currency Revenue Growth Americas $1,001.4 $— $1,001.4 $1,009.6 $— $1,009.6 (0.8)% (0.2)% —% (0.6)% EMEA 317.4 — 317.4 306.7 (13.8) 320.5 3.5% 1.3% 4.6% (2.4)% Asia 162.8 — 162.8 171.2 — 171.2 (4.9)% (0.9)% —% (4.0)% Consolidated $1,481.6 $— $1,481.6 $1,487.5 $(13.8) $1,501.3 (0.4)% —% 0.9% (1.3)% TELEFLEX EARNINGS CONFERENCE CALL 7/31/202523 Appendix A2 - 2025 Segment Reconciliation of Net Revenue (Dollars in millions)
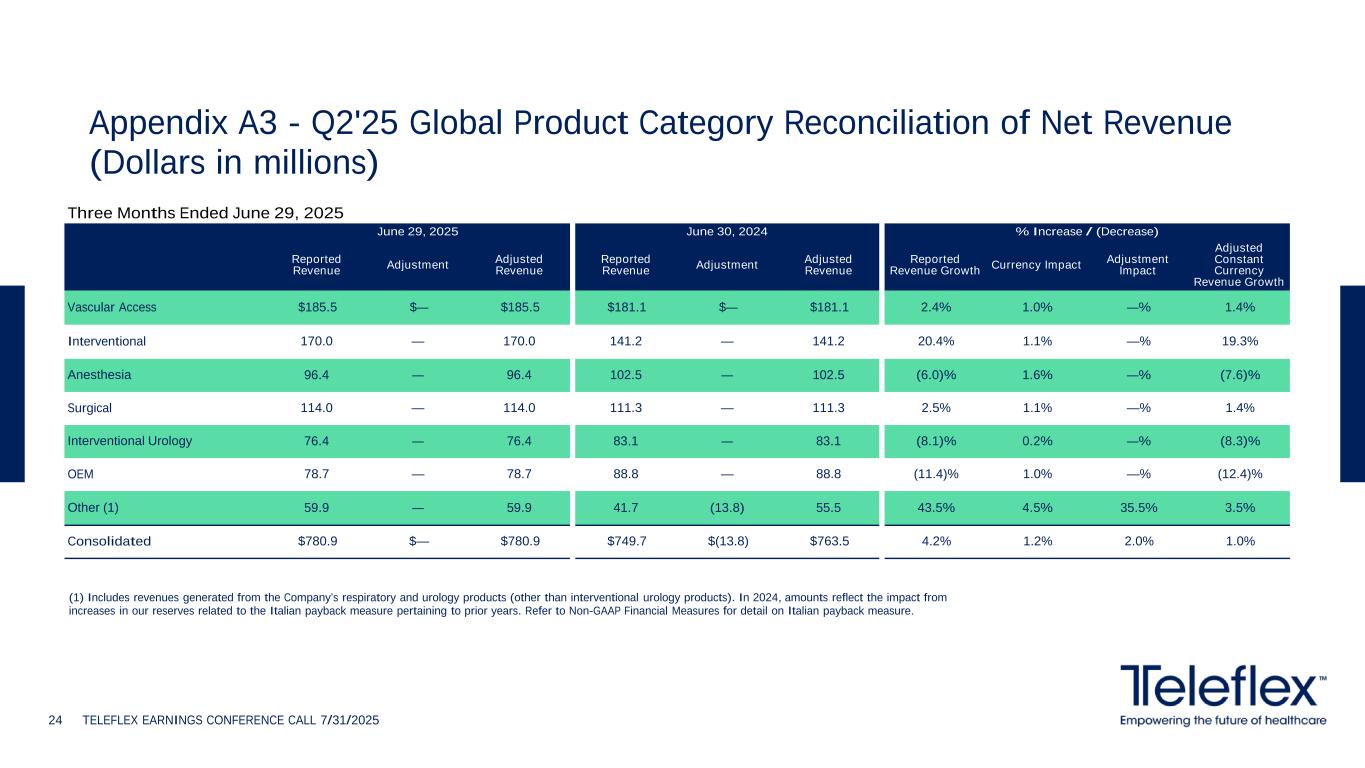
Three Months Ended June 29, 2025 June 29, 2025 June 30, 2024 % Increase / (Decrease) Reported Revenue Adjustment Adjusted Revenue Reported Revenue Adjustment Adjusted Revenue Reported Revenue Growth Currency Impact Adjustment Impact Adjusted Constant Currency Revenue Growth Vascular Access $185.5 $— $185.5 $181.1 $— $181.1 2.4% 1.0% —% 1.4% Interventional 170.0 — 170.0 141.2 — 141.2 20.4% 1.1% —% 19.3% Anesthesia 96.4 — 96.4 102.5 — 102.5 (6.0)% 1.6% —% (7.6)% Surgical 114.0 — 114.0 111.3 — 111.3 2.5% 1.1% —% 1.4% Interventional Urology 76.4 — 76.4 83.1 — 83.1 (8.1)% 0.2% —% (8.3)% OEM 78.7 — 78.7 88.8 — 88.8 (11.4)% 1.0% —% (12.4)% Other (1) 59.9 — 59.9 41.7 (13.8) 55.5 43.5% 4.5% 35.5% 3.5% Consolidated $780.9 $— $780.9 $749.7 $(13.8) $763.5 4.2% 1.2% 2.0% 1.0% TELEFLEX EARNINGS CONFERENCE CALL 7/31/202524 Appendix A3 - Q2'25 Global Product Category Reconciliation of Net Revenue (Dollars in millions) (1) Includes revenues generated from the Company’s respiratory and urology products (other than interventional urology products). In 2024, amounts reflect the impact from increases in our reserves related to the Italian payback measure pertaining to prior years. Refer to Non-GAAP Financial Measures for detail on Italian payback measure.
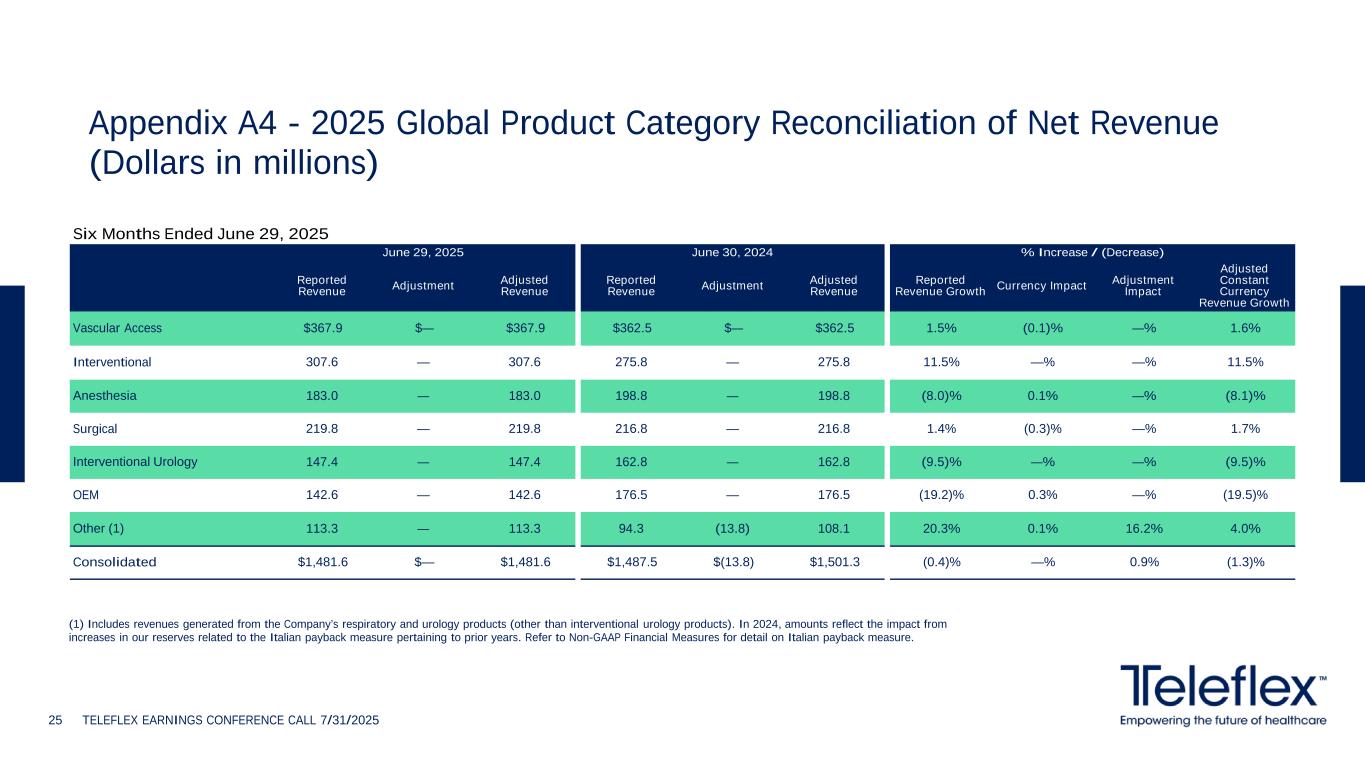
Six Months Ended June 29, 2025 June 29, 2025 June 30, 2024 % Increase / (Decrease) Reported Revenue Adjustment Adjusted Revenue Reported Revenue Adjustment Adjusted Revenue Reported Revenue Growth Currency Impact Adjustment Impact Adjusted Constant Currency Revenue Growth Vascular Access $367.9 $— $367.9 $362.5 $— $362.5 1.5% (0.1)% —% 1.6% Interventional 307.6 — 307.6 275.8 — 275.8 11.5% —% —% 11.5% Anesthesia 183.0 — 183.0 198.8 — 198.8 (8.0)% 0.1% —% (8.1)% Surgical 219.8 — 219.8 216.8 — 216.8 1.4% (0.3)% —% 1.7% Interventional Urology 147.4 — 147.4 162.8 — 162.8 (9.5)% —% —% (9.5)% OEM 142.6 — 142.6 176.5 — 176.5 (19.2)% 0.3% —% (19.5)% Other (1) 113.3 — 113.3 94.3 (13.8) 108.1 20.3% 0.1% 16.2% 4.0% Consolidated $1,481.6 $— $1,481.6 $1,487.5 $(13.8) $1,501.3 (0.4)% —% 0.9% (1.3)% TELEFLEX EARNINGS CONFERENCE CALL 7/31/202525 Appendix A4 - 2025 Global Product Category Reconciliation of Net Revenue (Dollars in millions) (1) Includes revenues generated from the Company’s respiratory and urology products (other than interventional urology products). In 2024, amounts reflect the impact from increases in our reserves related to the Italian payback measure pertaining to prior years. Refer to Non-GAAP Financial Measures for detail on Italian payback measure.
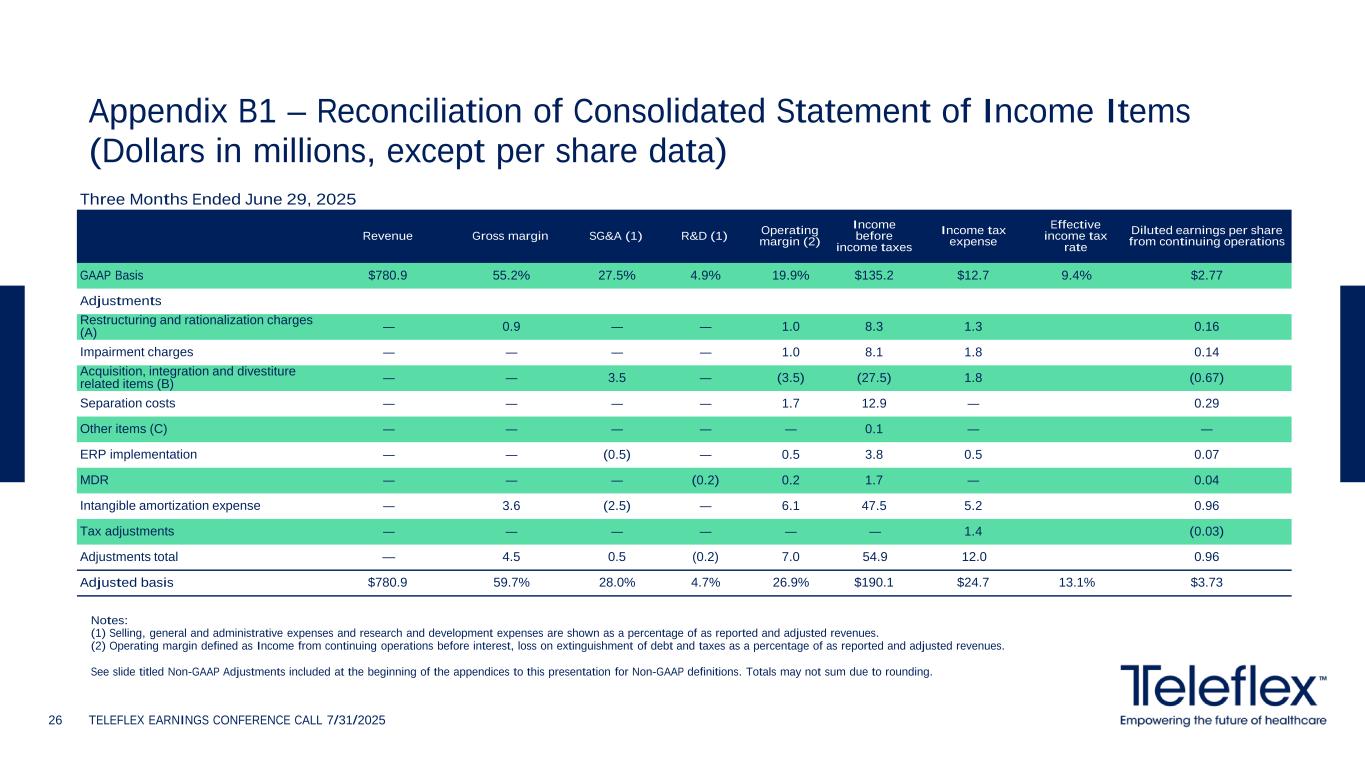
Appendix B1 – Reconciliation of Consolidated Statement of Income Items (Dollars in millions, except per share data) TELEFLEX EARNINGS CONFERENCE CALL 7/31/202526 Three Months Ended June 29, 2025 Revenue Gross margin SG&A (1) R&D (1) Operating margin (2) Income before income taxes Income tax expense Effective income tax rate Diluted earnings per share from continuing operations GAAP Basis $780.9 55.2% 27.5% 4.9% 19.9% $135.2 $12.7 9.4% $2.77 Adjustments Restructuring and rationalization charges (A) — 0.9 — — 1.0 8.3 1.3 0.16 Impairment charges — — — — 1.0 8.1 1.8 0.14 Acquisition, integration and divestiture related items (B) — — 3.5 — (3.5) (27.5) 1.8 (0.67) Separation costs — — — — 1.7 12.9 — 0.29 Other items (C) — — — — — 0.1 — — ERP implementation — — (0.5) — 0.5 3.8 0.5 0.07 MDR — — — (0.2) 0.2 1.7 — 0.04 Intangible amortization expense — 3.6 (2.5) — 6.1 47.5 5.2 0.96 Tax adjustments — — — — — — 1.4 (0.03) Adjustments total — 4.5 0.5 (0.2) 7.0 54.9 12.0 0.96 Adjusted basis $780.9 59.7% 28.0% 4.7% 26.9% $190.1 $24.7 13.1% $3.73 Notes: (1) Selling, general and administrative expenses and research and development expenses are shown as a percentage of as reported and adjusted revenues. (2) Operating margin defined as Income from continuing operations before interest, loss on extinguishment of debt and taxes as a percentage of as reported and adjusted revenues. See slide titled Non-GAAP Adjustments included at the beginning of the appendices to this presentation for Non-GAAP definitions. Totals may not sum due to rounding.
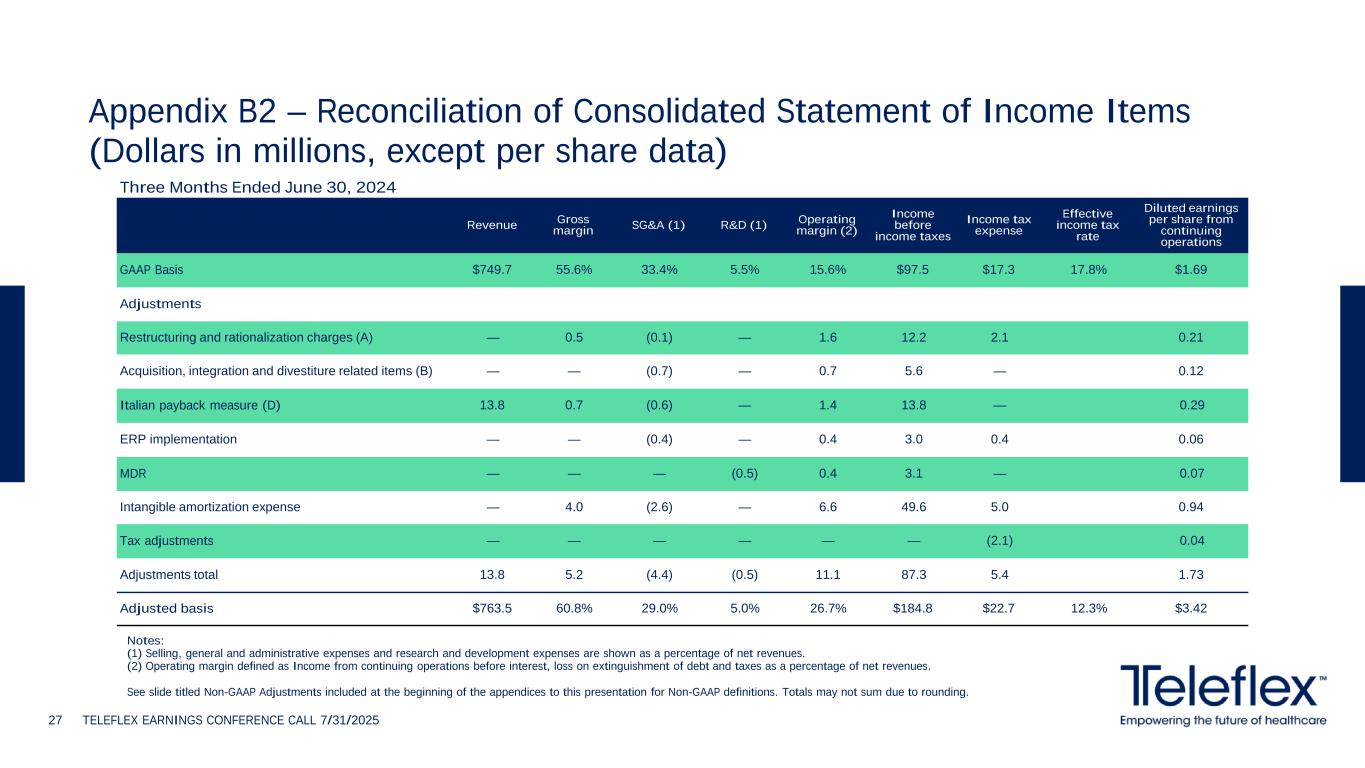
Three Months Ended June 30, 2024 Revenue Gross margin SG&A (1) R&D (1) Operating margin (2) Income before income taxes Income tax expense Effective income tax rate Diluted earnings per share from continuing operations GAAP Basis $749.7 55.6% 33.4% 5.5% 15.6% $97.5 $17.3 17.8% $1.69 Adjustments Restructuring and rationalization charges (A) — 0.5 (0.1) — 1.6 12.2 2.1 0.21 Acquisition, integration and divestiture related items (B) — — (0.7) — 0.7 5.6 — 0.12 Italian payback measure (D) 13.8 0.7 (0.6) — 1.4 13.8 — 0.29 ERP implementation — — (0.4) — 0.4 3.0 0.4 0.06 MDR — — — (0.5) 0.4 3.1 — 0.07 Intangible amortization expense — 4.0 (2.6) — 6.6 49.6 5.0 0.94 Tax adjustments — — — — — — (2.1) 0.04 Adjustments total 13.8 5.2 (4.4) (0.5) 11.1 87.3 5.4 1.73 Adjusted basis $763.5 60.8% 29.0% 5.0% 26.7% $184.8 $22.7 12.3% $3.42 TELEFLEX EARNINGS CONFERENCE CALL 7/31/202527 Notes: (1) Selling, general and administrative expenses and research and development expenses are shown as a percentage of net revenues. (2) Operating margin defined as Income from continuing operations before interest, loss on extinguishment of debt and taxes as a percentage of net revenues. See slide titled Non-GAAP Adjustments included at the beginning of the appendices to this presentation for Non-GAAP definitions. Totals may not sum due to rounding. Appendix B2 – Reconciliation of Consolidated Statement of Income Items (Dollars in millions, except per share data)
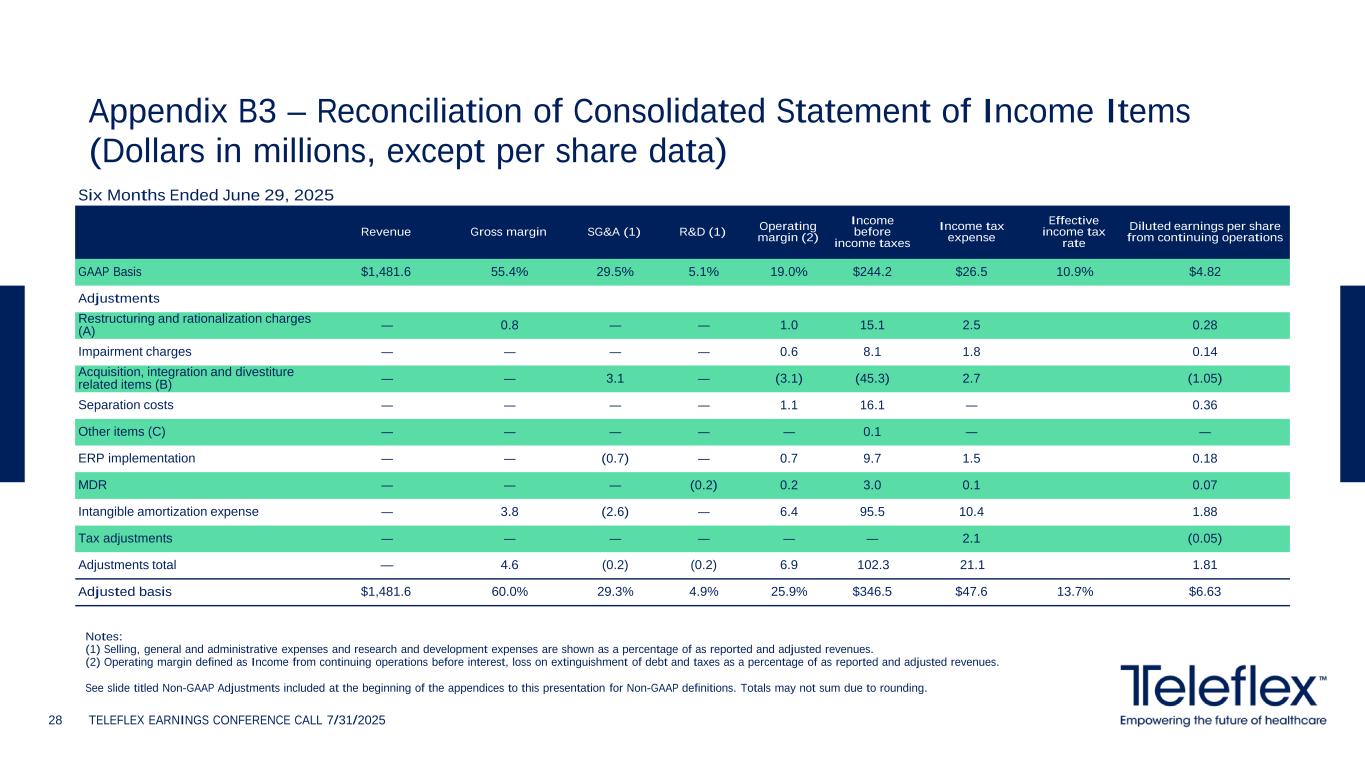
Appendix B3 – Reconciliation of Consolidated Statement of Income Items (Dollars in millions, except per share data) TELEFLEX EARNINGS CONFERENCE CALL 7/31/202528 Six Months Ended June 29, 2025 Revenue Gross margin SG&A (1) R&D (1) Operating margin (2) Income before income taxes Income tax expense Effective income tax rate Diluted earnings per share from continuing operations GAAP Basis $1,481.6 55.4% 29.5% 5.1% 19.0% $244.2 $26.5 10.9% $4.82 Adjustments Restructuring and rationalization charges (A) — 0.8 — — 1.0 15.1 2.5 0.28 Impairment charges — — — — 0.6 8.1 1.8 0.14 Acquisition, integration and divestiture related items (B) — — 3.1 — (3.1) (45.3) 2.7 (1.05) Separation costs — — — — 1.1 16.1 — 0.36 Other items (C) — — — — — 0.1 — — ERP implementation — — (0.7) — 0.7 9.7 1.5 0.18 MDR — — — (0.2) 0.2 3.0 0.1 0.07 Intangible amortization expense — 3.8 (2.6) — 6.4 95.5 10.4 1.88 Tax adjustments — — — — — — 2.1 (0.05) Adjustments total — 4.6 (0.2) (0.2) 6.9 102.3 21.1 1.81 Adjusted basis $1,481.6 60.0% 29.3% 4.9% 25.9% $346.5 $47.6 13.7% $6.63 Notes: (1) Selling, general and administrative expenses and research and development expenses are shown as a percentage of as reported and adjusted revenues. (2) Operating margin defined as Income from continuing operations before interest, loss on extinguishment of debt and taxes as a percentage of as reported and adjusted revenues. See slide titled Non-GAAP Adjustments included at the beginning of the appendices to this presentation for Non-GAAP definitions. Totals may not sum due to rounding.
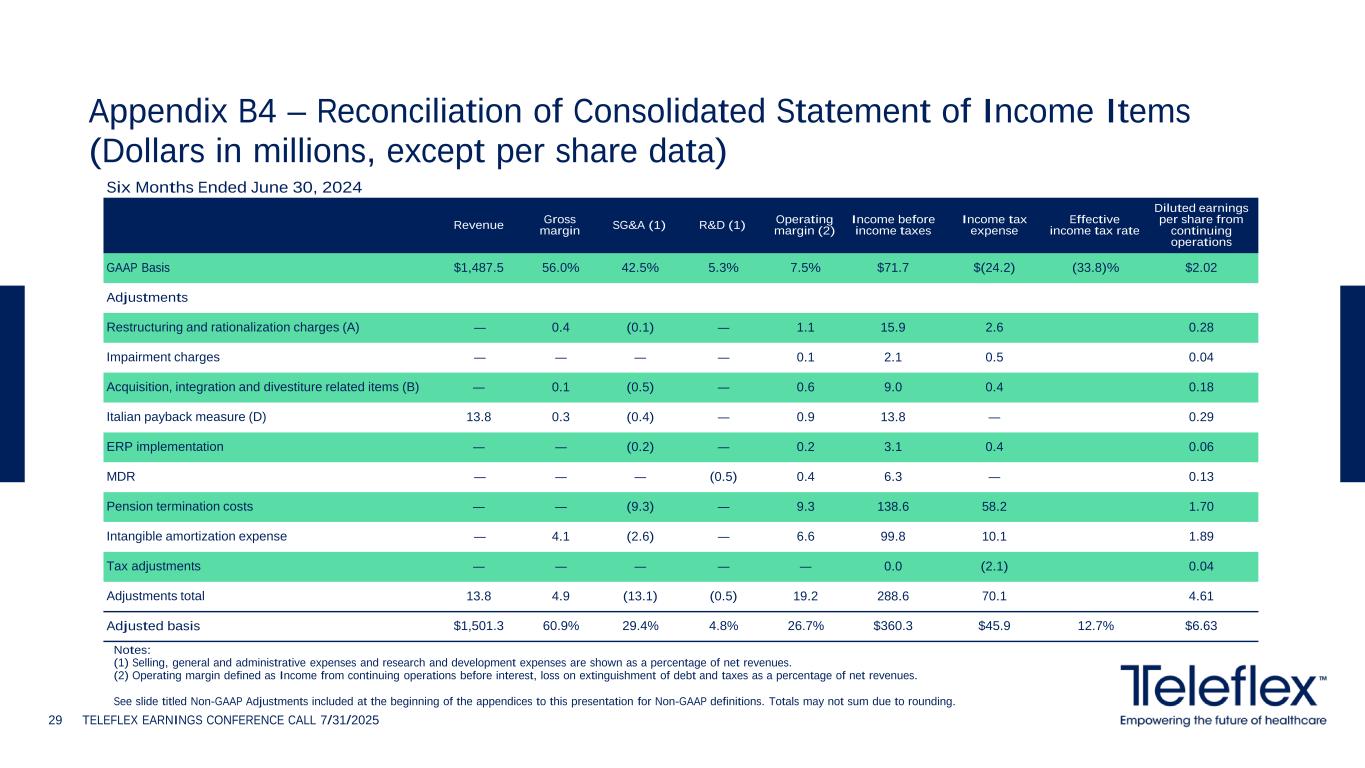
Six Months Ended June 30, 2024 Revenue Gross margin SG&A (1) R&D (1) Operating margin (2) Income before income taxes Income tax expense Effective income tax rate Diluted earnings per share from continuing operations GAAP Basis $1,487.5 56.0% 42.5% 5.3% 7.5% $71.7 $(24.2) (33.8)% $2.02 Adjustments Restructuring and rationalization charges (A) — 0.4 (0.1) — 1.1 15.9 2.6 0.28 Impairment charges — — — — 0.1 2.1 0.5 0.04 Acquisition, integration and divestiture related items (B) — 0.1 (0.5) — 0.6 9.0 0.4 0.18 Italian payback measure (D) 13.8 0.3 (0.4) — 0.9 13.8 — 0.29 ERP implementation — — (0.2) — 0.2 3.1 0.4 0.06 MDR — — — (0.5) 0.4 6.3 — 0.13 Pension termination costs — — (9.3) — 9.3 138.6 58.2 1.70 Intangible amortization expense — 4.1 (2.6) — 6.6 99.8 10.1 1.89 Tax adjustments — — — — — 0.0 (2.1) 0.04 Adjustments total 13.8 4.9 (13.1) (0.5) 19.2 288.6 70.1 4.61 Adjusted basis $1,501.3 60.9% 29.4% 4.8% 26.7% $360.3 $45.9 12.7% $6.63 TELEFLEX EARNINGS CONFERENCE CALL 7/31/202529 Notes: (1) Selling, general and administrative expenses and research and development expenses are shown as a percentage of net revenues. (2) Operating margin defined as Income from continuing operations before interest, loss on extinguishment of debt and taxes as a percentage of net revenues. See slide titled Non-GAAP Adjustments included at the beginning of the appendices to this presentation for Non-GAAP definitions. Totals may not sum due to rounding. Appendix B4 – Reconciliation of Consolidated Statement of Income Items (Dollars in millions, except per share data)
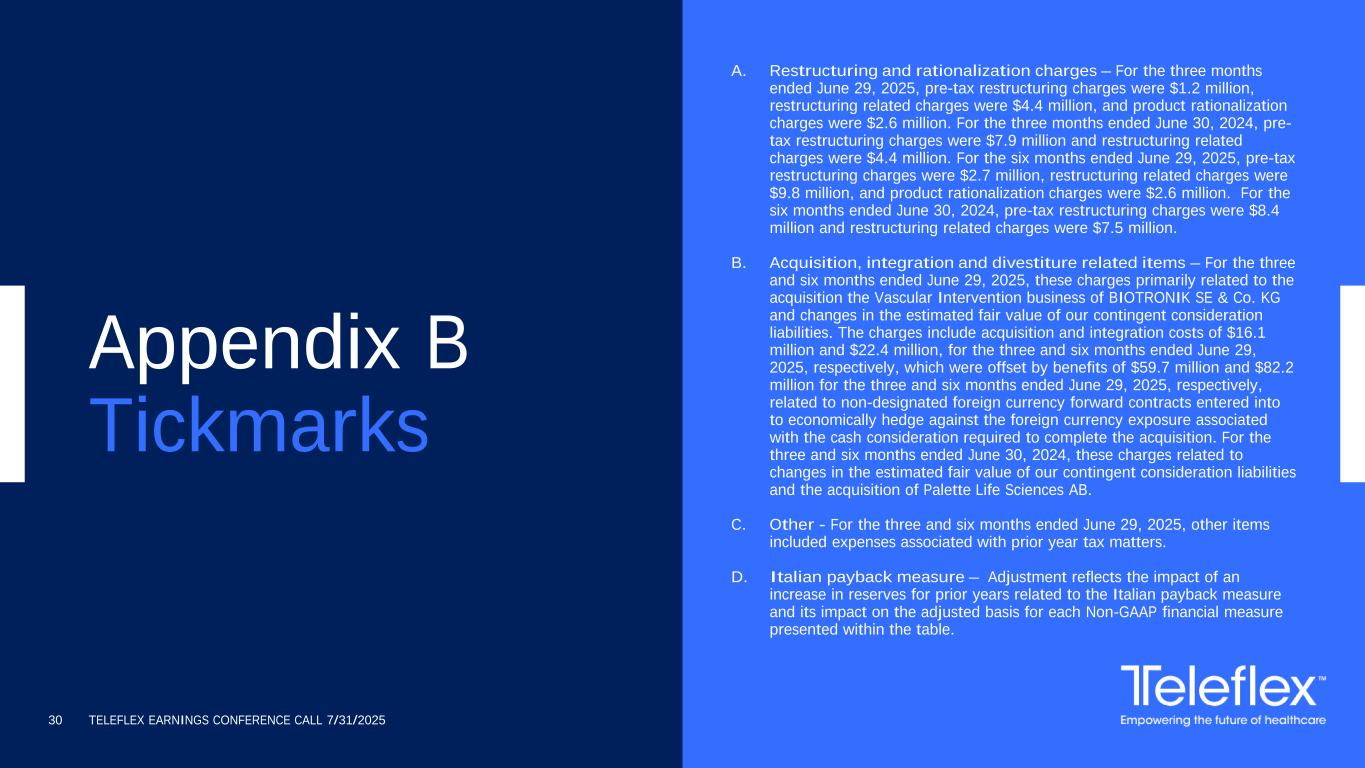
TELEFLEX EARNINGS CONFERENCE CALL 7/31/202530 A. Restructuring and rationalization charges – For the three months ended June 29, 2025, pre-tax restructuring charges were $1.2 million, restructuring related charges were $4.4 million, and product rationalization charges were $2.6 million. For the three months ended June 30, 2024, pre- tax restructuring charges were $7.9 million and restructuring related charges were $4.4 million. For the six months ended June 29, 2025, pre-tax restructuring charges were $2.7 million, restructuring related charges were $9.8 million, and product rationalization charges were $2.6 million. For the six months ended June 30, 2024, pre-tax restructuring charges were $8.4 million and restructuring related charges were $7.5 million. B. Acquisition, integration and divestiture related items – For the three and six months ended June 29, 2025, these charges primarily related to the acquisition the Vascular Intervention business of BIOTRONIK SE & Co. KG and changes in the estimated fair value of our contingent consideration liabilities. The charges include acquisition and integration costs of $16.1 million and $22.4 million, for the three and six months ended June 29, 2025, respectively, which were offset by benefits of $59.7 million and $82.2 million for the three and six months ended June 29, 2025, respectively, related to non-designated foreign currency forward contracts entered into to economically hedge against the foreign currency exposure associated with the cash consideration required to complete the acquisition. For the three and six months ended June 30, 2024, these charges related to changes in the estimated fair value of our contingent consideration liabilities and the acquisition of Palette Life Sciences AB. C. Other - For the three and six months ended June 29, 2025, other items included expenses associated with prior year tax matters. D. Italian payback measure – Adjustment reflects the impact of an increase in reserves for prior years related to the Italian payback measure and its impact on the adjusted basis for each Non-GAAP financial measure presented within the table. Appendix B Tickmarks
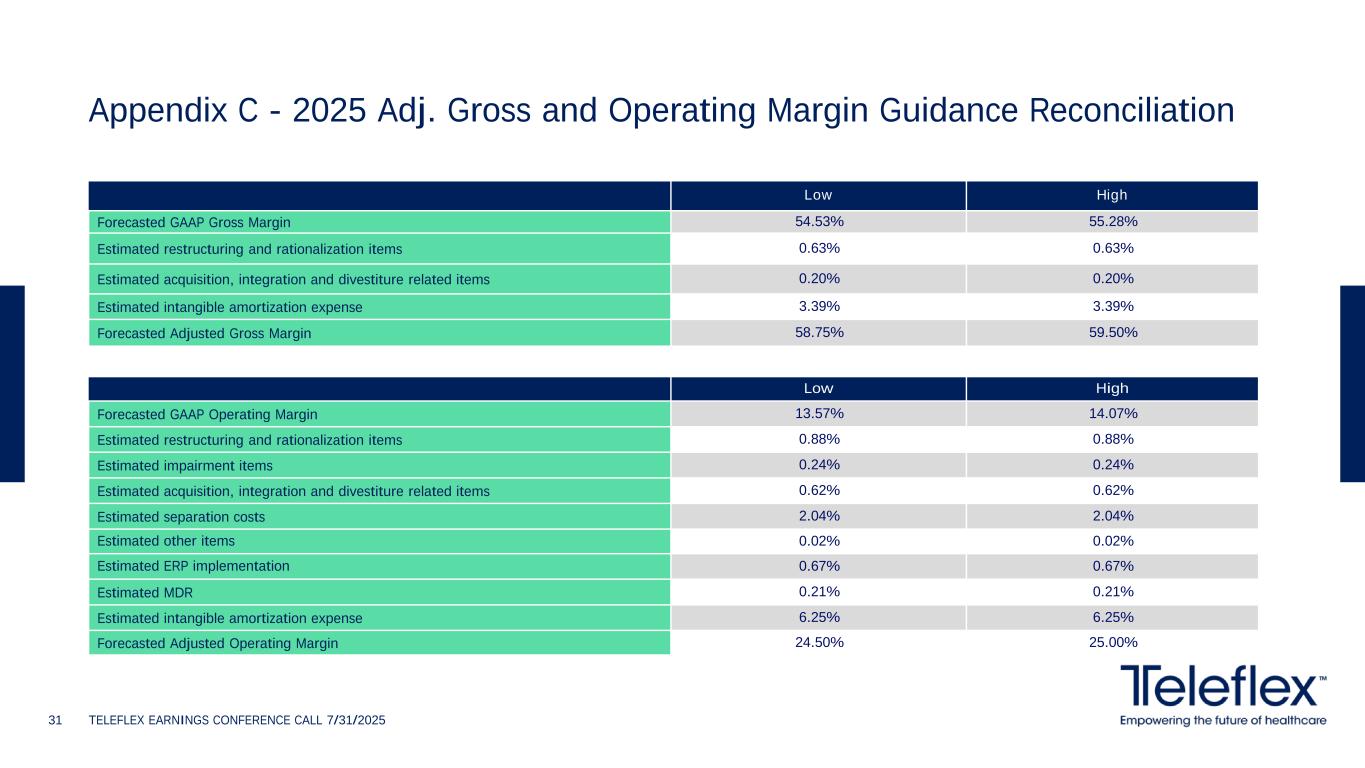
Appendix C - 2025 Adj. Gross and Operating Margin Guidance Reconciliation TELEFLEX EARNINGS CONFERENCE CALL 7/31/202531 Low High Forecasted GAAP Gross Margin 54.53% 55.28% Estimated restructuring and rationalization items 0.63% 0.63% Estimated acquisition, integration and divestiture related items 0.20% 0.20% Estimated intangible amortization expense 3.39% 3.39% Forecasted Adjusted Gross Margin 58.75% 59.50% Low High Forecasted GAAP Operating Margin 13.57% 14.07% Estimated restructuring and rationalization items 0.88% 0.88% Estimated impairment items 0.24% 0.24% Estimated acquisition, integration and divestiture related items 0.62% 0.62% Estimated separation costs 2.04% 2.04% Estimated other items 0.02% 0.02% Estimated ERP implementation 0.67% 0.67% Estimated MDR 0.21% 0.21% Estimated intangible amortization expense 6.25% 6.25% Forecasted Adjusted Operating Margin 24.50% 25.00%
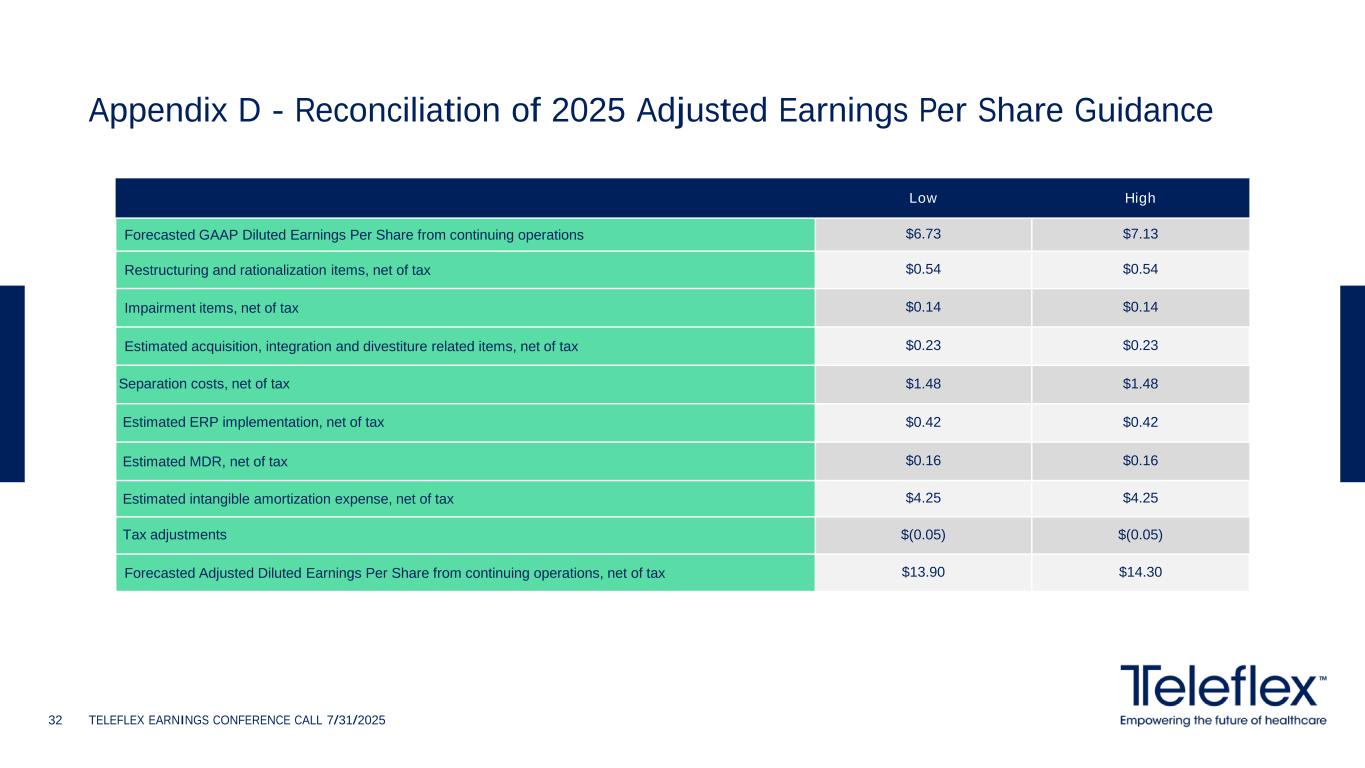
Appendix D - Reconciliation of 2025 Adjusted Earnings Per Share Guidance TELEFLEX EARNINGS CONFERENCE CALL 7/31/202532 Low High Forecasted GAAP Diluted Earnings Per Share from continuing operations $6.73 $7.13 Restructuring and rationalization items, net of tax $0.54 $0.54 Impairment items, net of tax $0.14 $0.14 Estimated acquisition, integration and divestiture related items, net of tax $0.23 $0.23 Separation costs, net of tax $1.48 $1.48 Estimated ERP implementation, net of tax $0.42 $0.42 Estimated MDR, net of tax $0.16 $0.16 Estimated intangible amortization expense, net of tax $4.25 $4.25 Tax adjustments $(0.05) $(0.05) Forecasted Adjusted Diluted Earnings Per Share from continuing operations, net of tax $13.90 $14.30
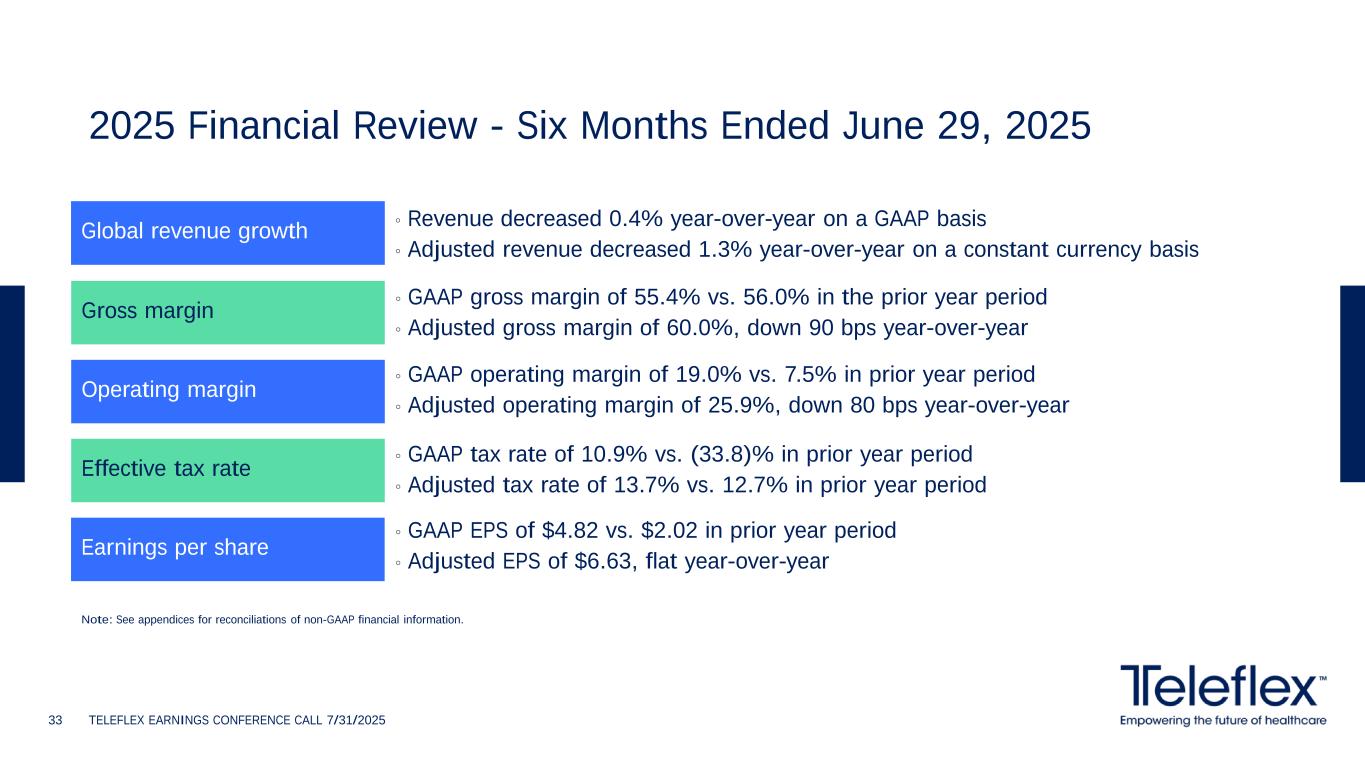
2025 Financial Review - Six Months Ended June 29, 2025 TELEFLEX EARNINGS CONFERENCE CALL 7/31/202533 Gross margin Operating margin Effective tax rate Earnings per share ◦ GAAP gross margin of 55.4% vs. 56.0% in the prior year period ◦ Adjusted gross margin of 60.0%, down 90 bps year-over-year ◦ GAAP operating margin of 19.0% vs. 7.5% in prior year period ◦ Adjusted operating margin of 25.9%, down 80 bps year-over-year ◦ GAAP tax rate of 10.9% vs. (33.8)% in prior year period ◦ Adjusted tax rate of 13.7% vs. 12.7% in prior year period ◦ GAAP EPS of $4.82 vs. $2.02 in prior year period ◦ Adjusted EPS of $6.63, flat year-over-year Global revenue growth ◦ Revenue decreased 0.4% year-over-year on a GAAP basis ◦ Adjusted revenue decreased 1.3% year-over-year on a constant currency basis Note: See appendices for reconciliations of non-GAAP financial information.