2nd Quarter 2026 Update July 28, 2026
Presentation Index Corporate Overview & Investment Thesis 2nd Quarter 2026 Results Long-Term Performance Trends Appendix 3 11 28 38 46 Board of Directors Forward-Looking Statements Non-GAAP Reconciliations Please refer to the Forward-Looking Statements on slide 48 for important disclosures about information contained in this presentation. Select Financial Statements Purchase Accounting Update 8 Line of Business Updates Peer Group
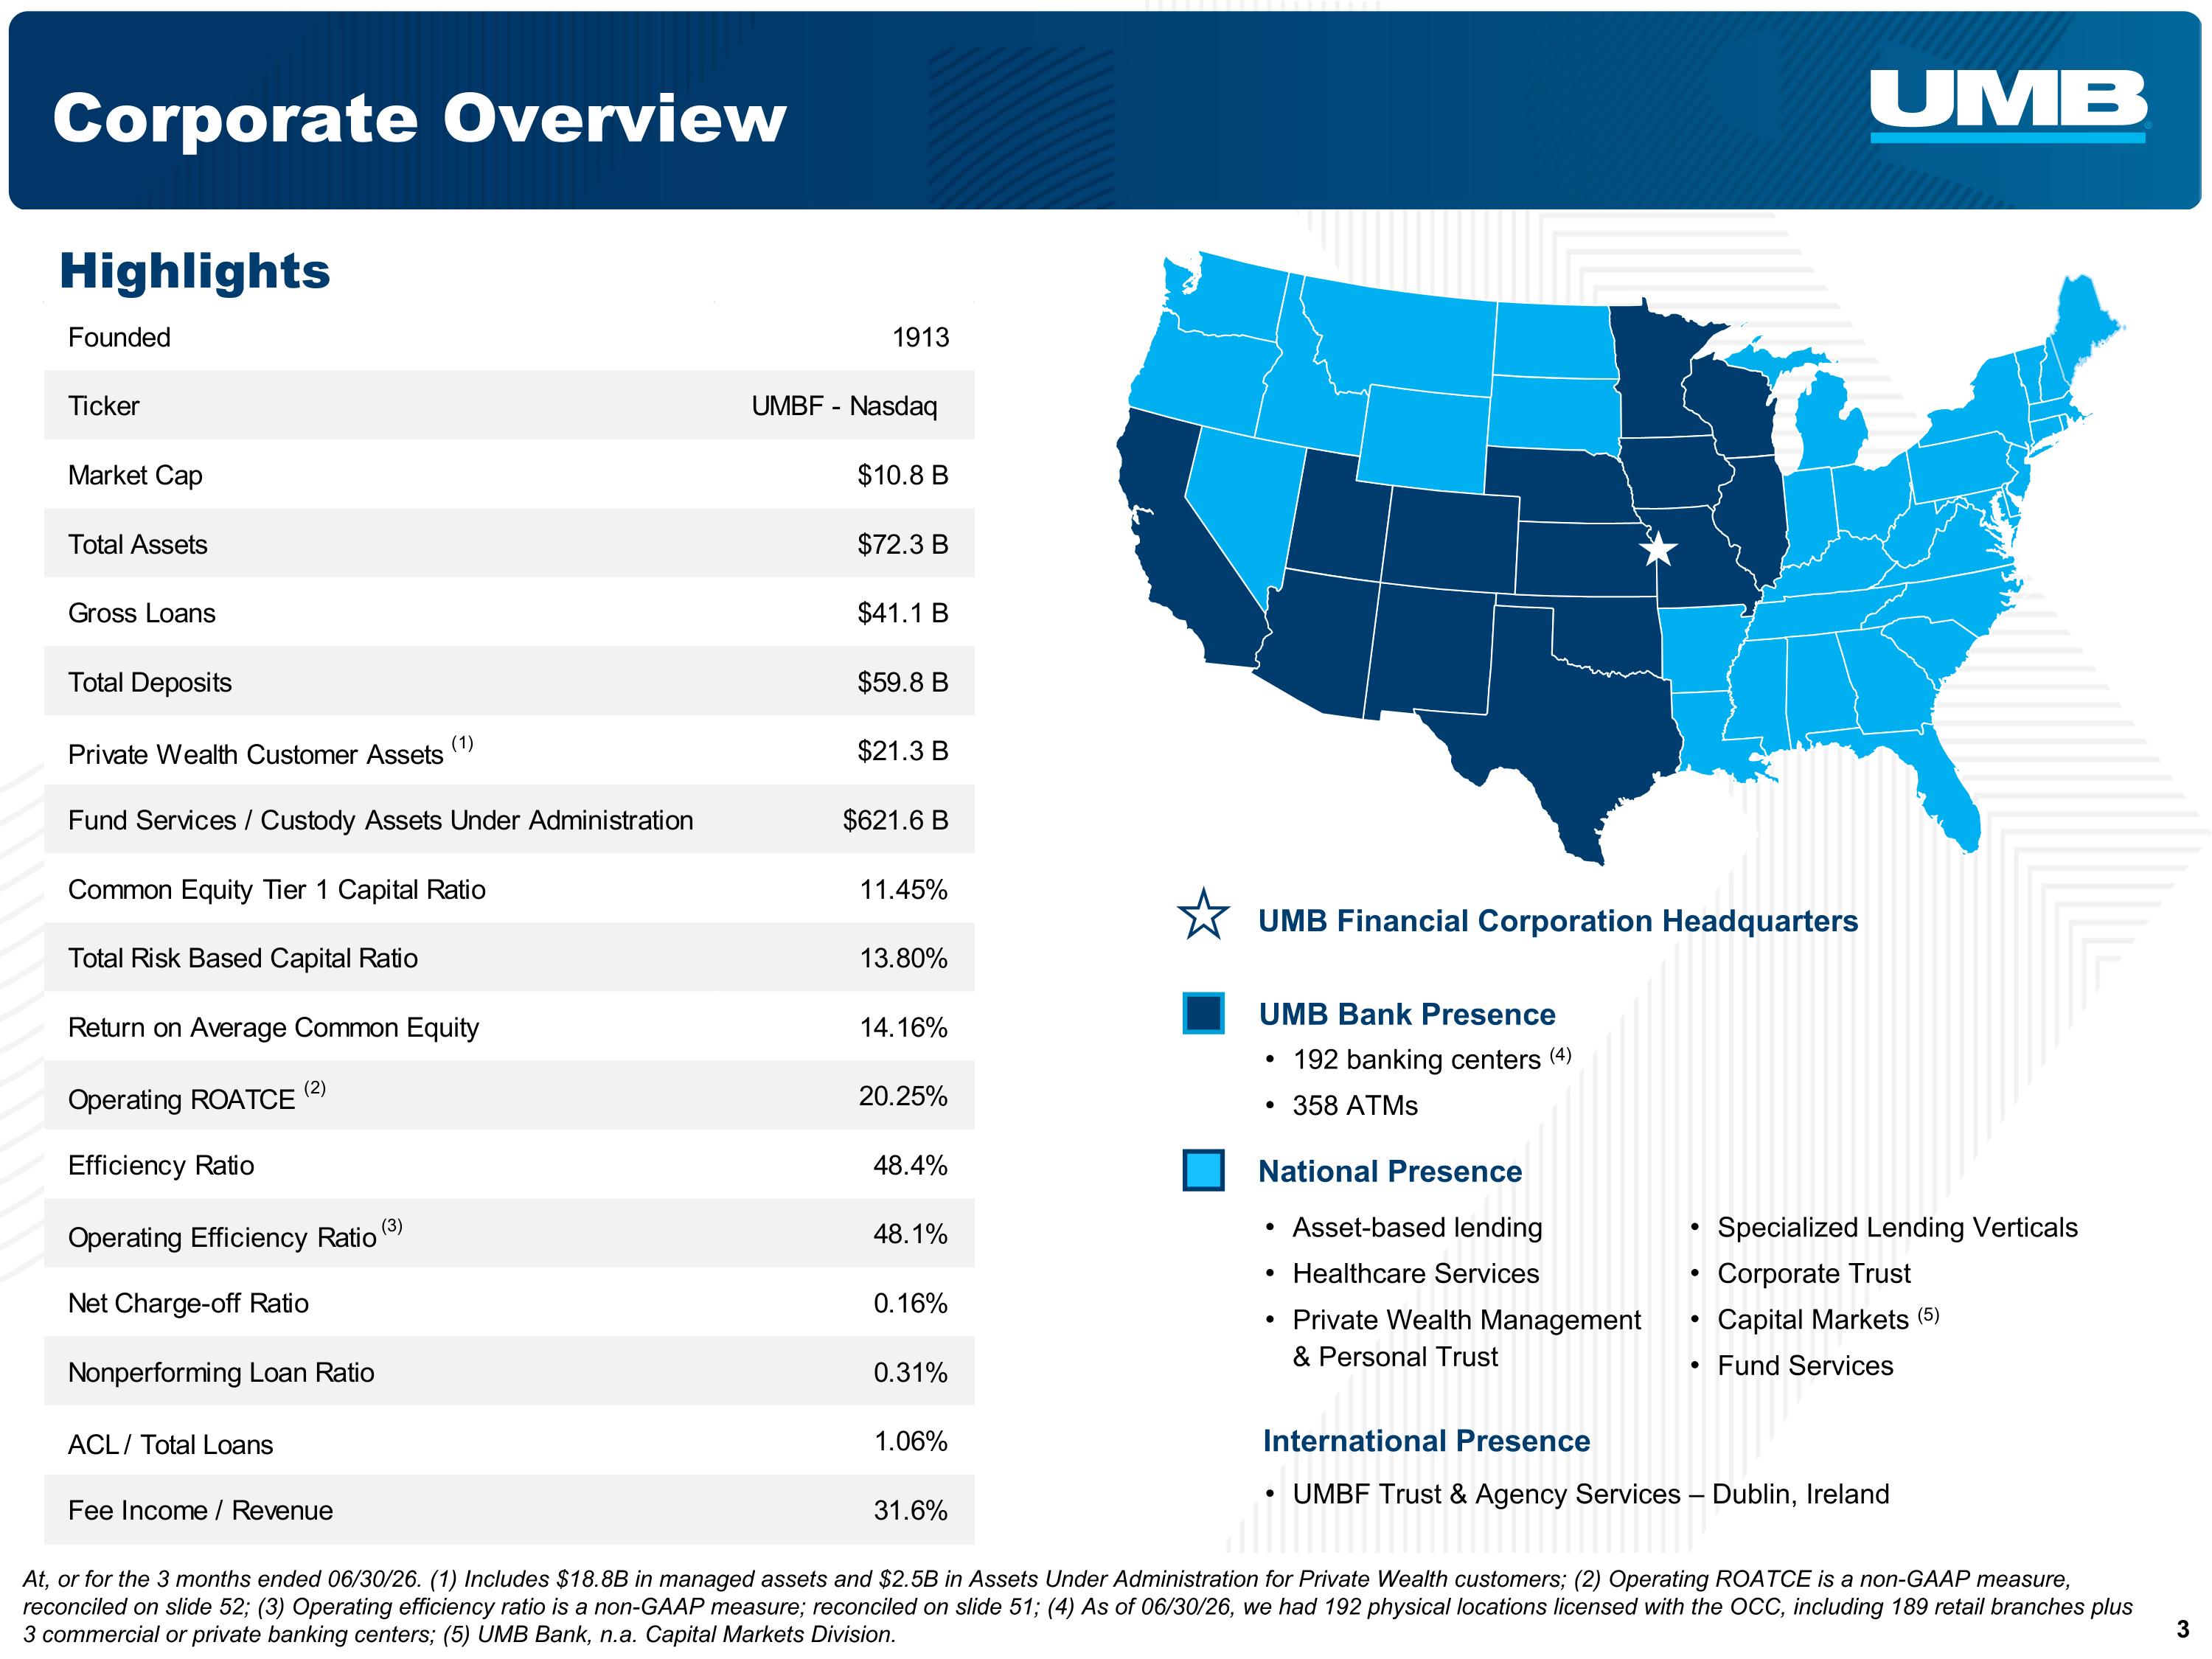
Corporate Overview Asset-based lending Healthcare Services National Presence International Presence UMBF Trust & Agency Services – Dublin, Ireland Specialized Lending Verticals Corporate Trust Capital Markets (5) Fund Services Private Wealth Management & Personal Trust 192 banking centers (4) 358 ATMs UMB Bank Presence UMB Financial Corporation Headquarters Highlights At, or for the 3 months ended 06/30/26. (1) Includes $18.8B in managed assets and $2.5B in Assets Under Administration for Private Wealth customers; (2) Operating ROATCE is a non-GAAP measure, reconciled on slide 52; (3) Operating efficiency ratio is a non-GAAP measure; reconciled on slide 51; (4) As of 06/30/26, we had 192 physical locations licensed with the OCC, including 189 retail branches plus 3 commercial or private banking centers; (5) UMB Bank, n.a. Capital Markets Division.
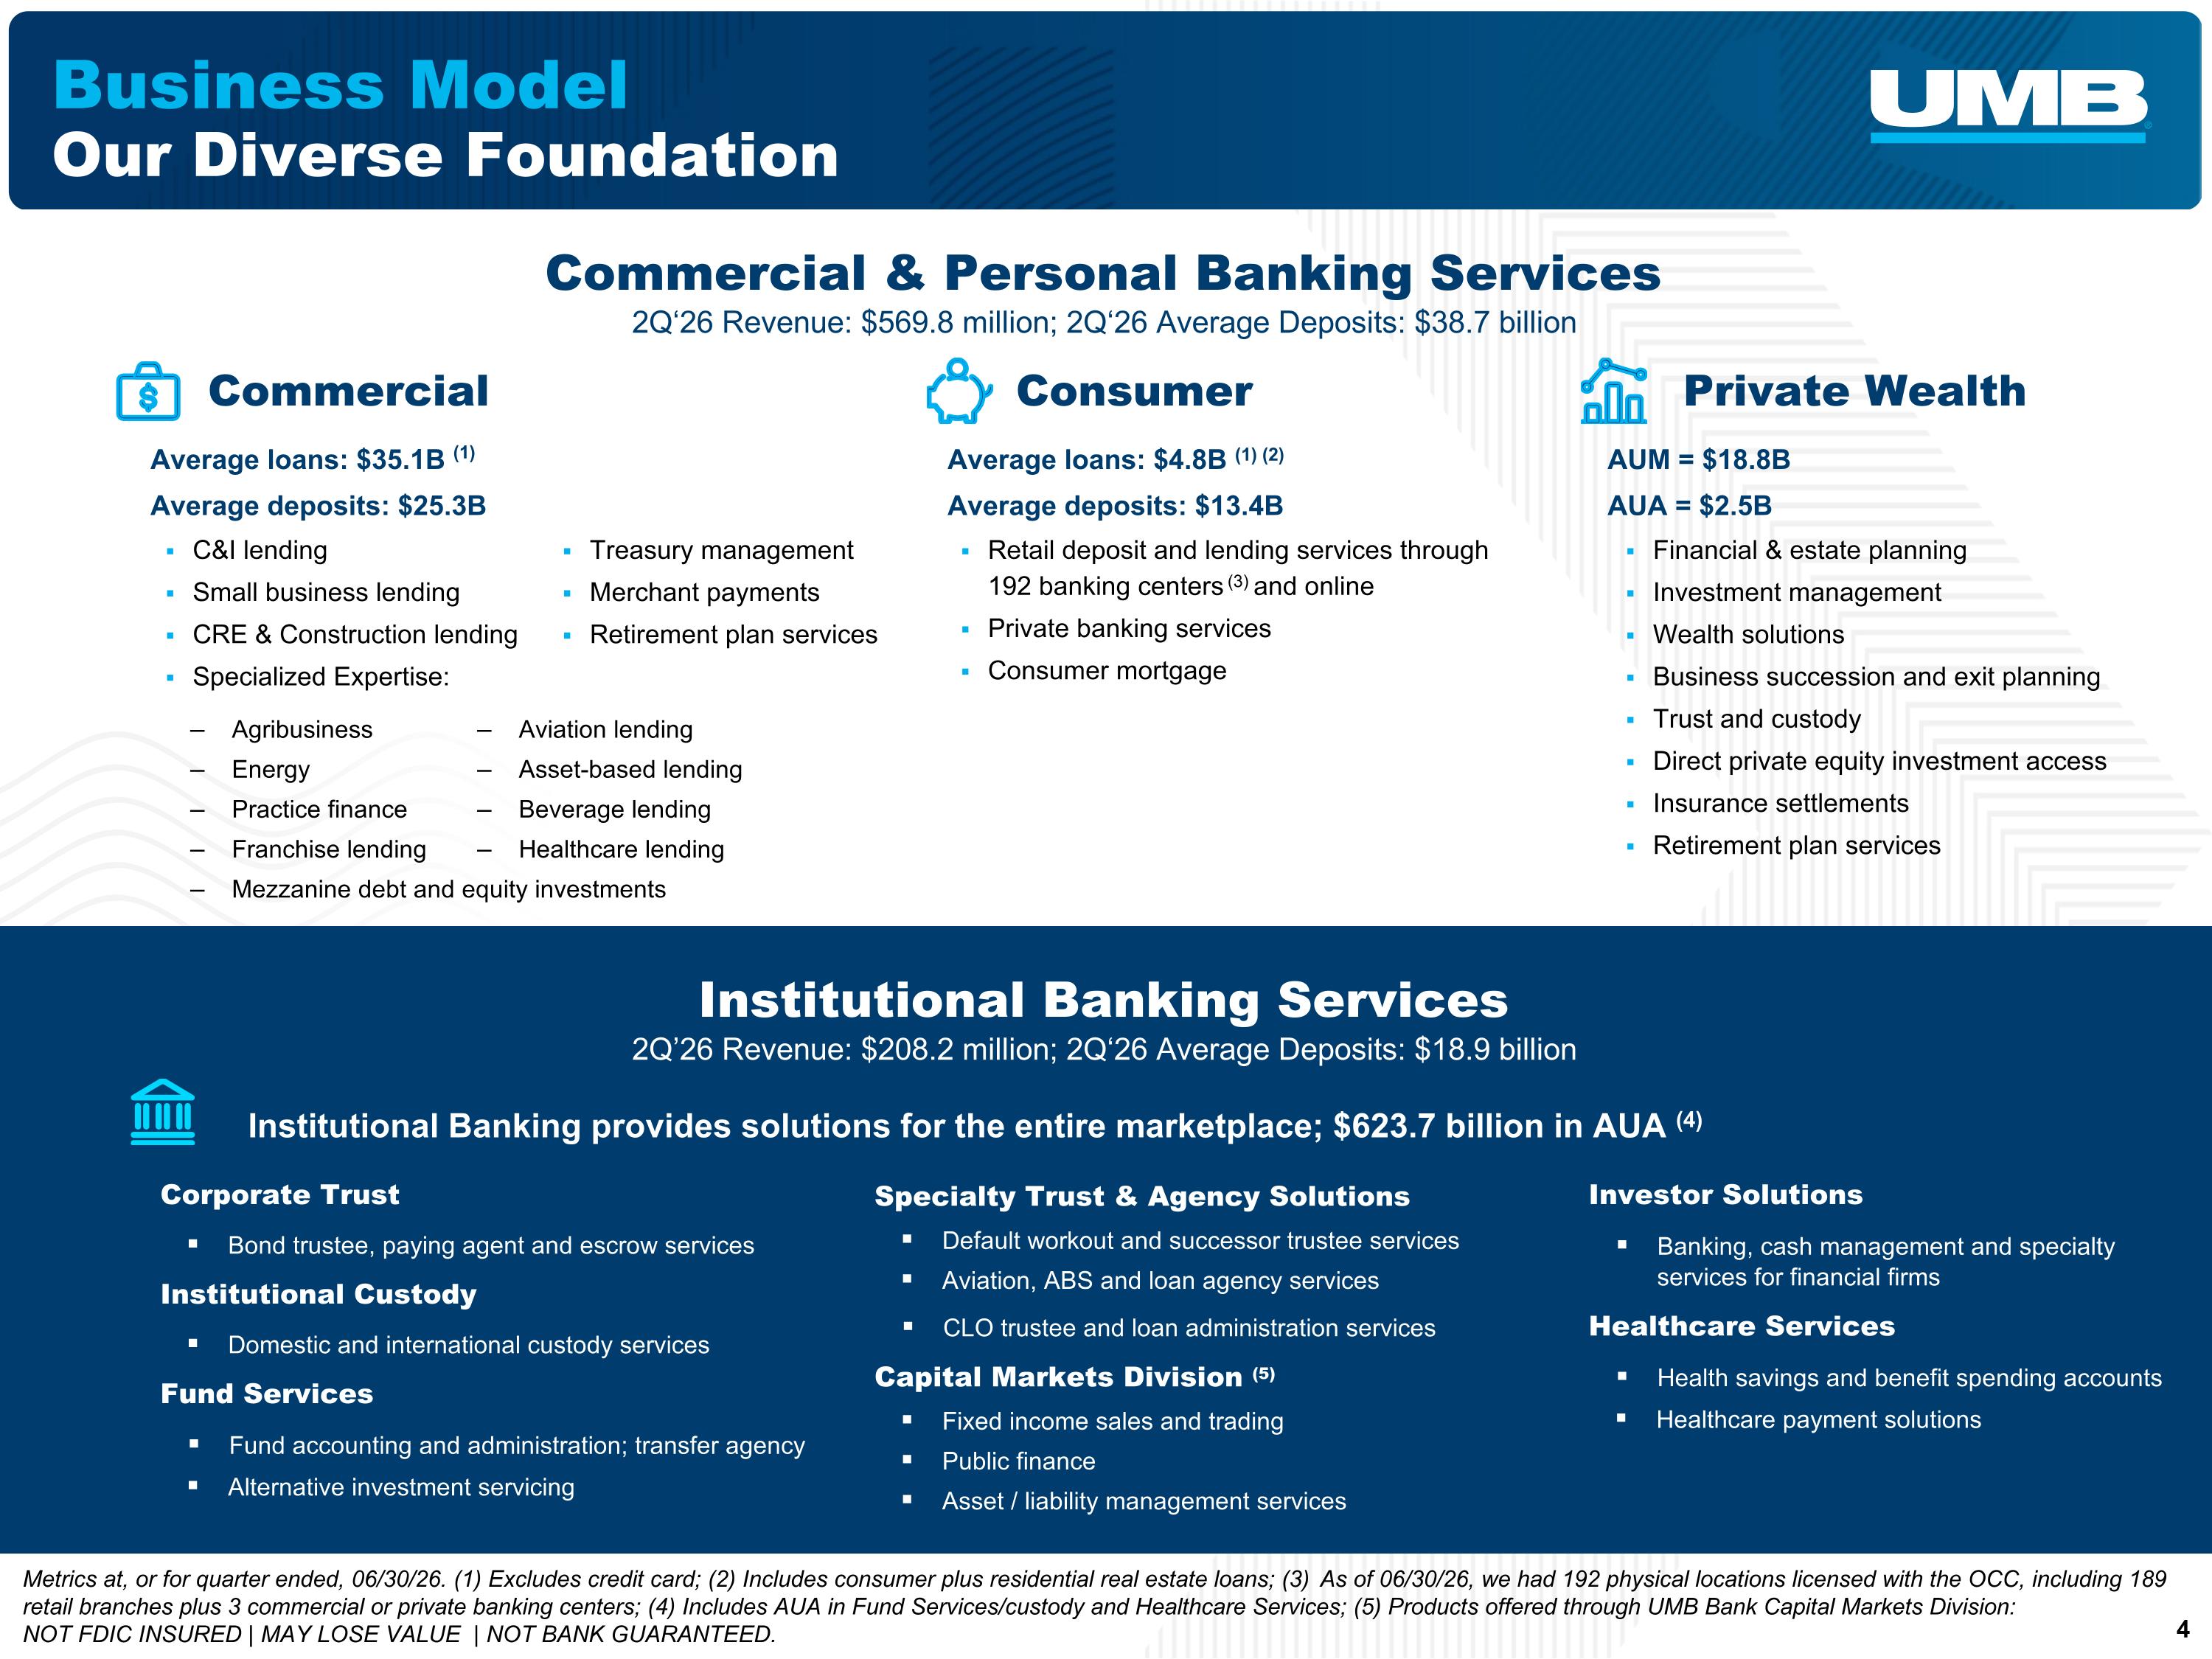
Business Model Our Diverse Foundation Commercial & Personal Banking Services 2Q‘26 Revenue: $569.8 million; 2Q‘26 Average Deposits: $38.7 billion Average loans: $4.8B (1) (2) Average deposits: $13.4B Retail deposit and lending services through 192 banking centers (3) and online Private banking services Consumer mortgage AUM = $18.8B AUA = $2.5B Financial & estate planning Investment management Wealth solutions Business succession and exit planning Trust and custody Direct private equity investment access Insurance settlements Retirement plan services C&I lending Small business lending CRE & Construction lending Specialized Expertise: Average loans: $35.1B (1) Average deposits: $25.3B Agribusiness Energy Practice finance Franchise lending Mezzanine debt and equity investments Commercial Consumer Private Wealth Institutional Banking Services 2Q’26 Revenue: $208.2 million; 2Q‘26 Average Deposits: $18.9 billion Institutional Banking provides solutions for the entire marketplace; $623.7 billion in AUA (4) Corporate Trust Bond trustee, paying agent and escrow services Institutional Custody Domestic and international custody services Fund Services Fund accounting and administration; transfer agency Alternative investment servicing Specialty Trust & Agency Solutions Default workout and successor trustee services Aviation, ABS and loan agency services CLO trustee and loan administration services Capital Markets Division (5) Fixed income sales and trading Public finance Asset / liability management services Investor Solutions Banking, cash management and specialty services for financial firms Healthcare Services Health savings and benefit spending accounts Healthcare payment solutions Aviation lending Asset-based lending Beverage lending Healthcare lending Treasury management Merchant payments Retirement plan services Metrics at, or for quarter ended, 06/30/26. (1) Excludes credit card; (2) Includes consumer plus residential real estate loans; (3) As of 06/30/26, we had 192 physical locations licensed with the OCC, including 189 retail branches plus 3 commercial or private banking centers; (4) Includes AUA in Fund Services/custody and Healthcare Services; (5) Products offered through UMB Bank Capital Markets Division: NOT FDIC INSURED | MAY LOSE VALUE | NOT BANK GUARANTEED.
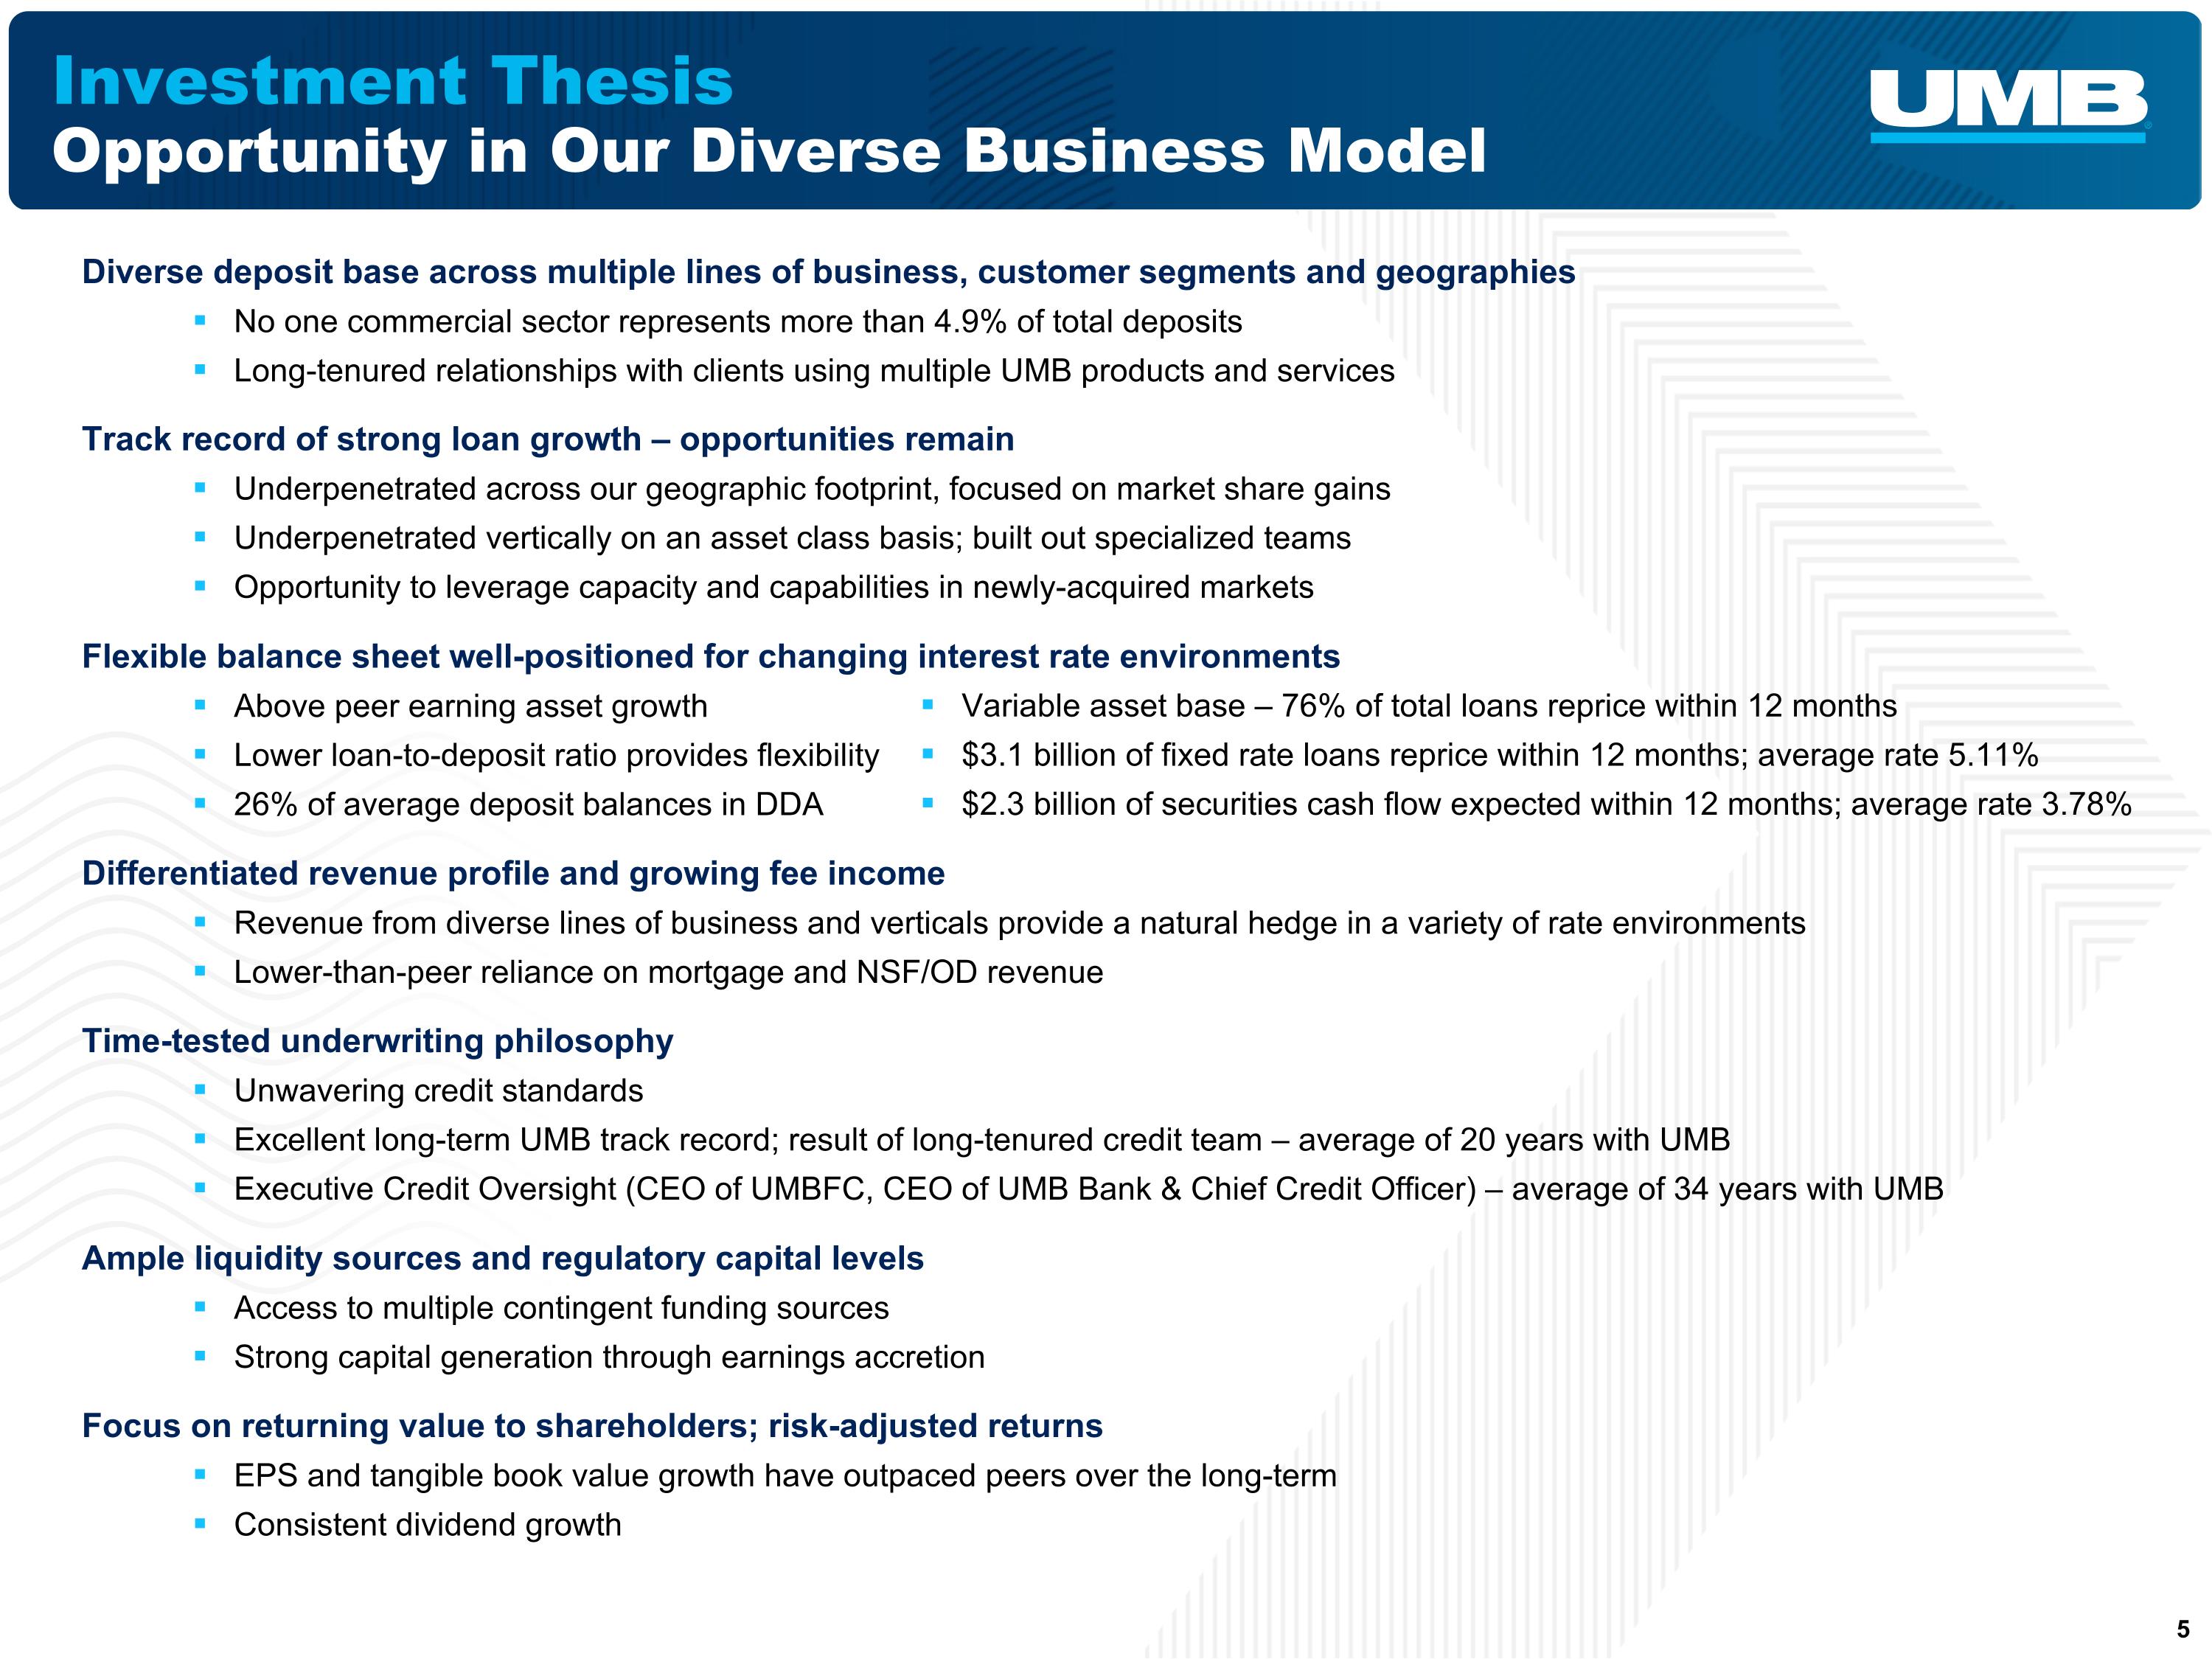
Investment Thesis Opportunity in Our Diverse Business Model Track record of strong loan growth – opportunities remain Underpenetrated across our geographic footprint, focused on market share gains Underpenetrated vertically on an asset class basis; built out specialized teams Opportunity to leverage capacity and capabilities in newly-acquired markets Diverse deposit base across multiple lines of business, customer segments and geographies No one commercial sector represents more than 4.9% of total deposits Long-tenured relationships with clients using multiple UMB products and services Flexible balance sheet well-positioned for changing interest rate environments Above peer earning asset growth Lower loan-to-deposit ratio provides flexibility 26% of average deposit balances in DDA Focus on returning value to shareholders; risk-adjusted returns EPS and tangible book value growth have outpaced peers over the long-term Consistent dividend growth Differentiated revenue profile and growing fee income Revenue from diverse lines of business and verticals provide a natural hedge in a variety of rate environments Lower-than-peer reliance on mortgage and NSF/OD revenue Time-tested underwriting philosophy Unwavering credit standards Excellent long-term UMB track record; result of long-tenured credit team – average of 20 years with UMB Executive Credit Oversight (CEO of UMBFC, CEO of UMB Bank & Chief Credit Officer) – average of 34 years with UMB Variable asset base – 76% of total loans reprice within 12 months $3.1 billion of fixed rate loans reprice within 12 months; average rate 5.11% $2.3 billion of securities cash flow expected within 12 months; average rate 3.78% Ample liquidity sources and regulatory capital levels Access to multiple contingent funding sources Strong capital generation through earnings accretion
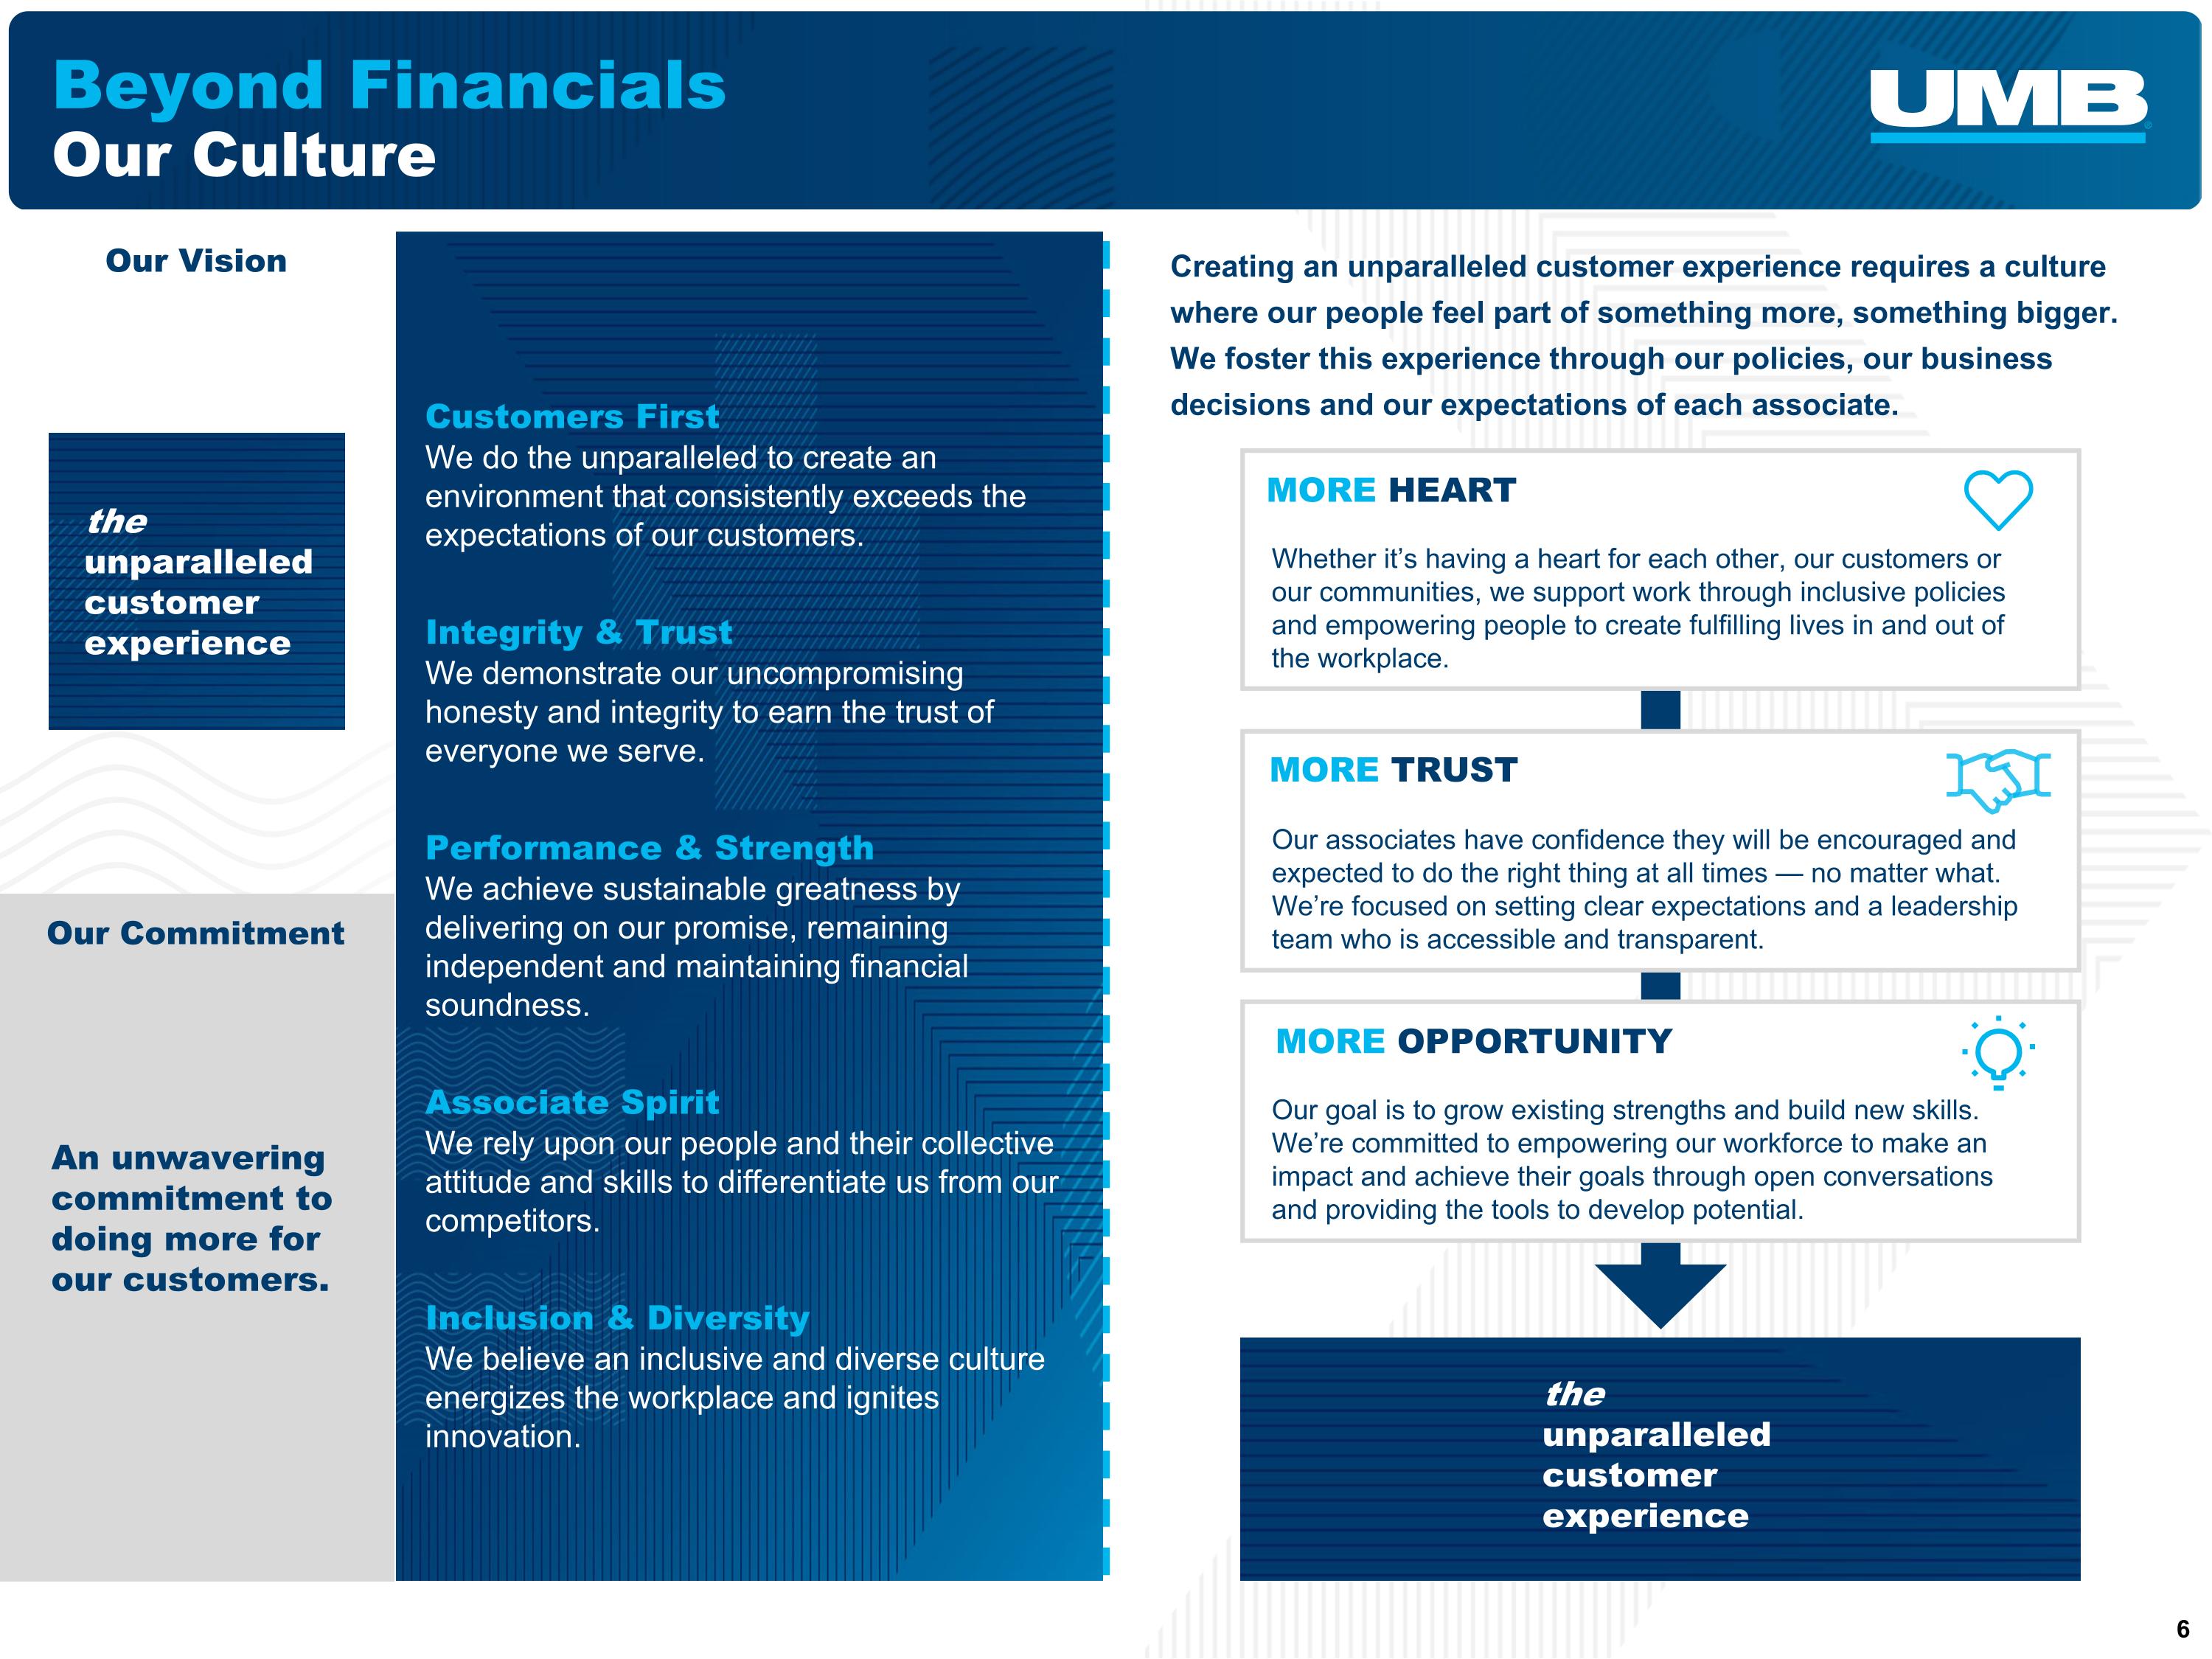
Beyond Financials Our Culture Our Values Our Commitment Our Vision the unparalleled customer experience Customers First We do the unparalleled to create an environment that consistently exceeds the expectations of our customers. Integrity & Trust We demonstrate our uncompromising honesty and integrity to earn the trust of everyone we serve. Performance & Strength We achieve sustainable greatness by delivering on our promise, remaining independent and maintaining financial soundness. Associate Spirit We rely upon our people and their collective attitude and skills to differentiate us from our competitors. Inclusion & Diversity We believe an inclusive and diverse culture energizes the workplace and ignites innovation. Creating an unparalleled customer experience requires a culture where our people feel part of something more, something bigger. We foster this experience through our policies, our business decisions and our expectations of each associate. the unparalleled customer experience An unwavering commitment to doing more for our customers. Whether it’s having a heart for each other, our customers or our communities, we support work through inclusive policies and empowering people to create fulfilling lives in and out of the workplace. MORE HEART Our goal is to grow existing strengths and build new skills. We’re committed to empowering our workforce to make an impact and achieve their goals through open conversations and providing the tools to develop potential. MORE OPPORTUNITY MORE TRUST Our associates have confidence they will be encouraged and expected to do the right thing at all times — no matter what. We’re focused on setting clear expectations and a leadership team who is accessible and transparent.
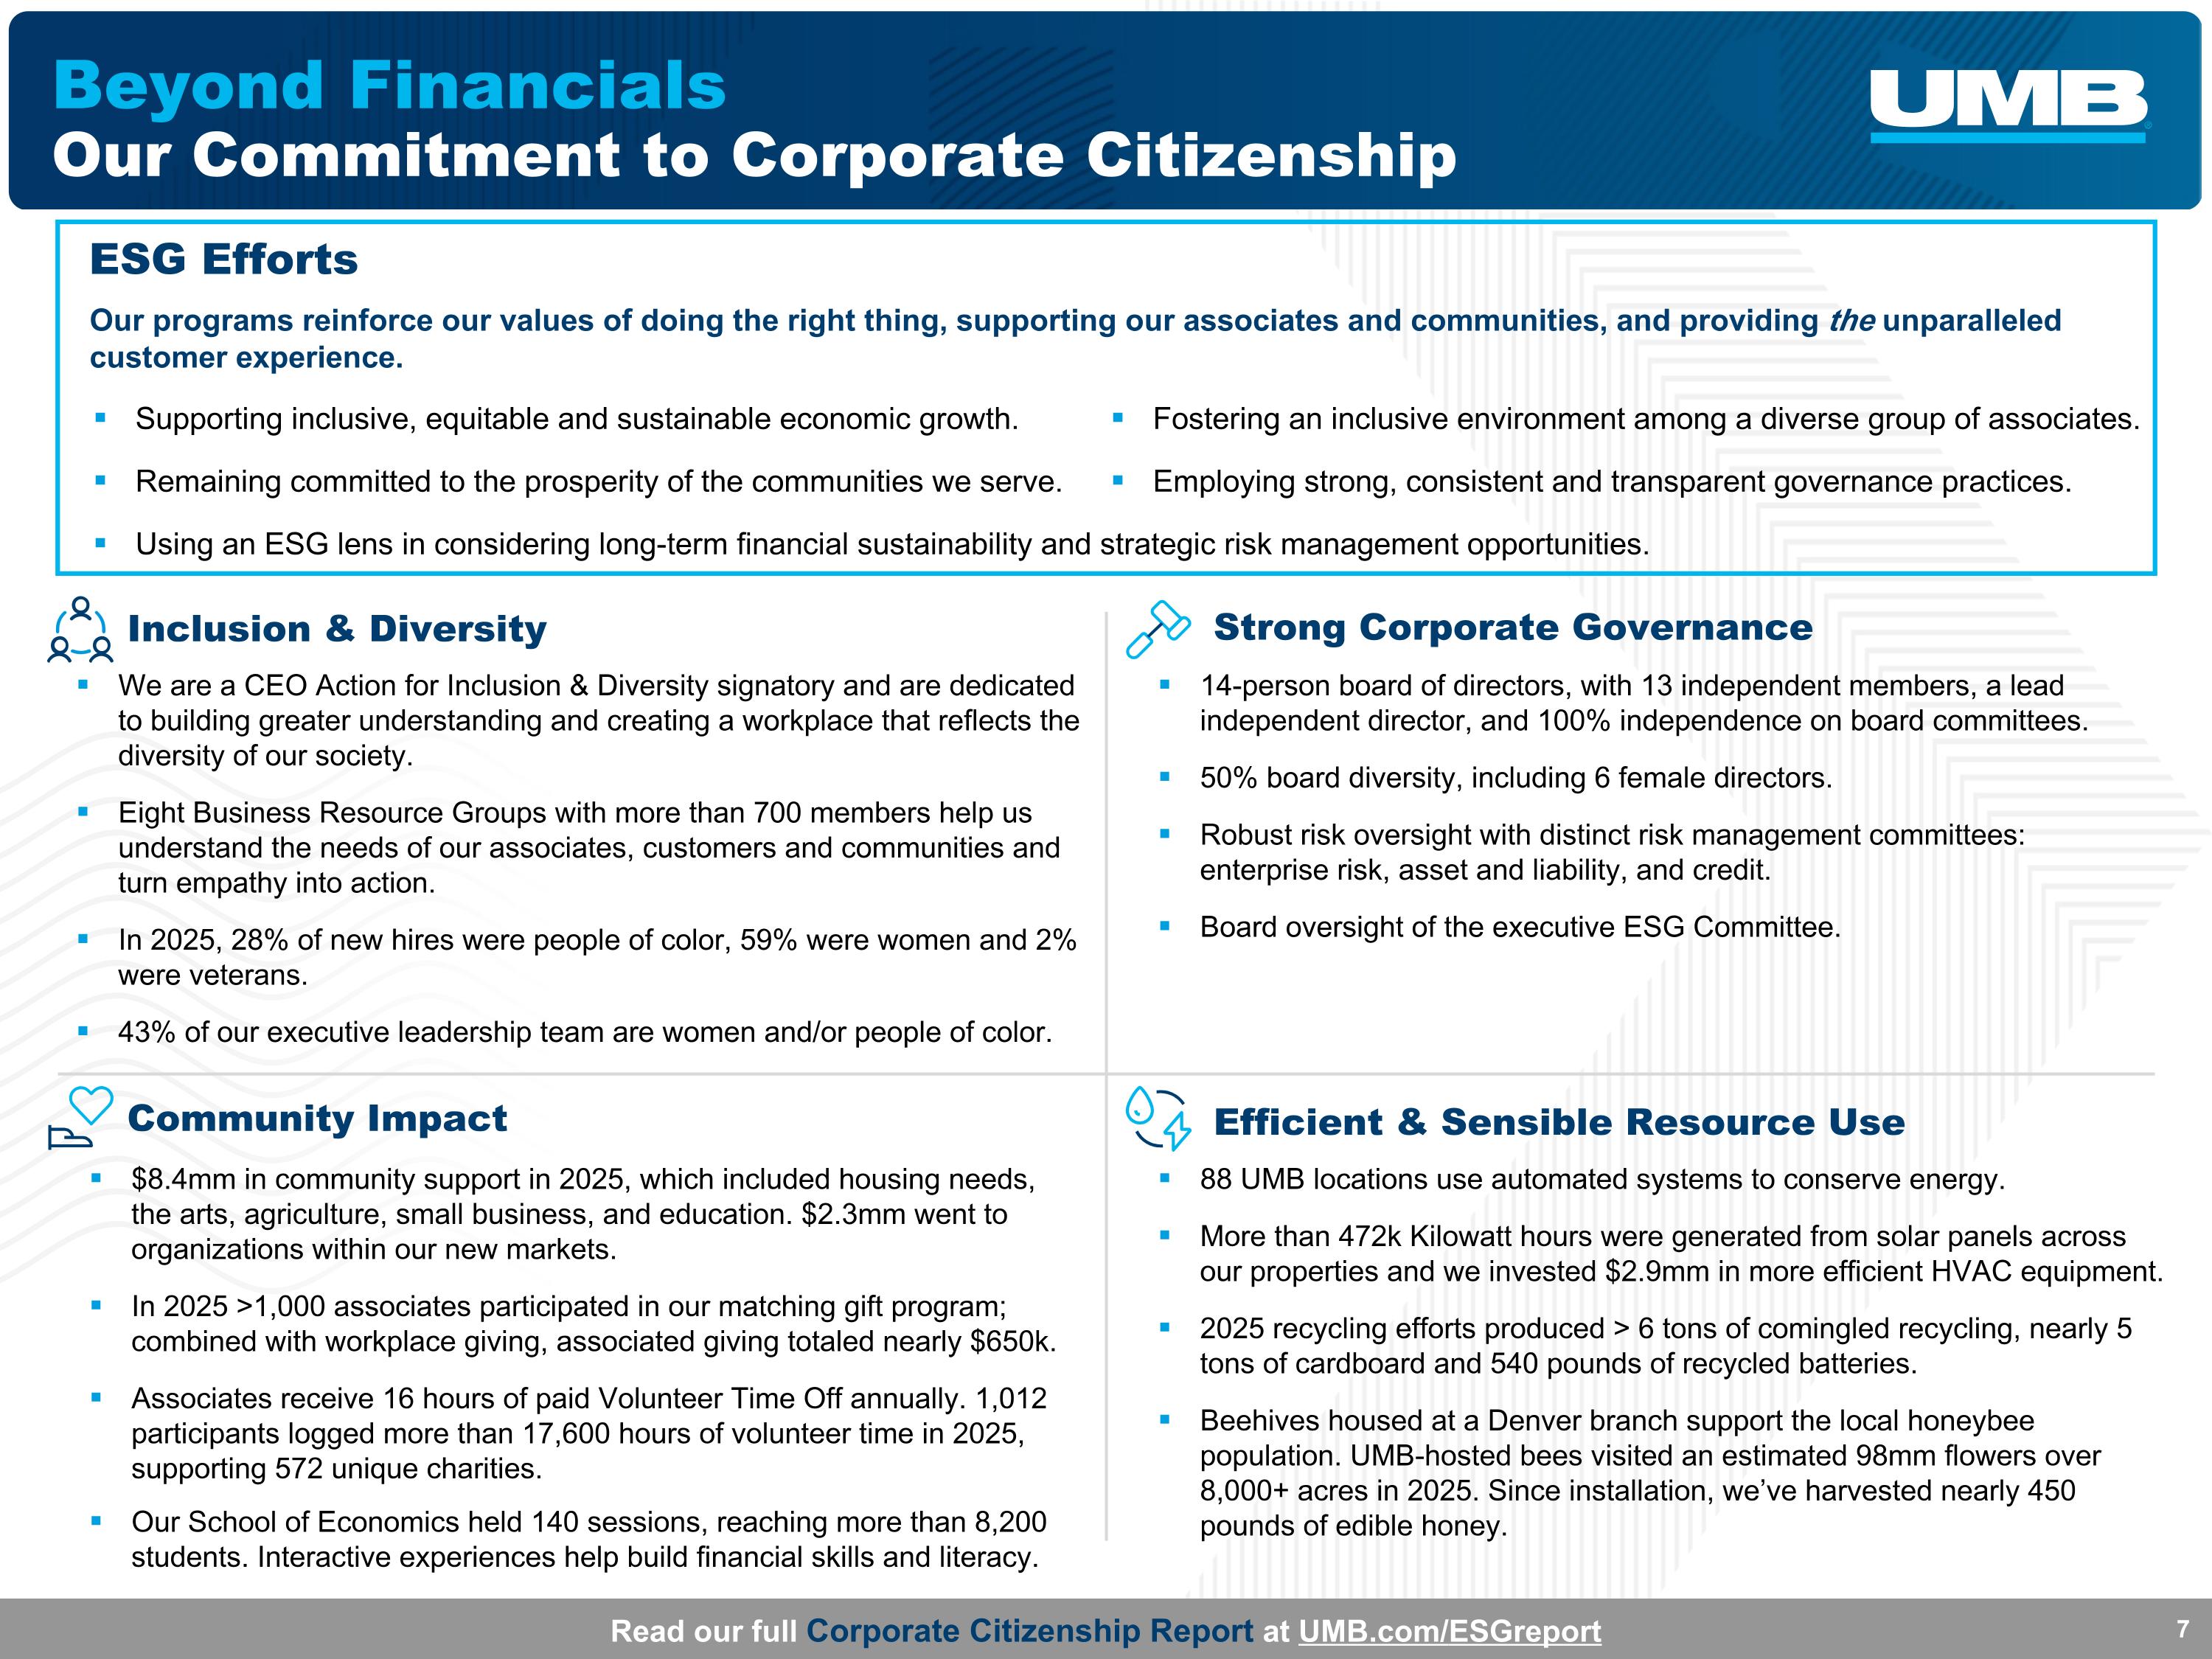
Beyond Financials Our Commitment to Corporate Citizenship Read our full Corporate Citizenship Report at UMB.com/ESGreport Our programs reinforce our values of doing the right thing, supporting our associates and communities, and providing the unparalleled customer experience. Supporting inclusive, equitable and sustainable economic growth. Remaining committed to the prosperity of the communities we serve. Using an ESG lens in considering long-term financial sustainability and strategic risk management opportunities. ESG Efforts We are a CEO Action for Inclusion & Diversity signatory and are dedicated to building greater understanding and creating a workplace that reflects the diversity of our society. Eight Business Resource Groups with more than 700 members help us understand the needs of our associates, customers and communities and turn empathy into action. In 2025, 28% of new hires were people of color, 59% were women and 2% were veterans. 43% of our executive leadership team are women and/or people of color. Fostering an inclusive environment among a diverse group of associates. Employing strong, consistent and transparent governance practices. Efficient & Sensible Resource Use Strong Corporate Governance Inclusion & Diversity 14-person board of directors, with 13 independent members, a lead independent director, and 100% independence on board committees. 50% board diversity, including 6 female directors. Robust risk oversight with distinct risk management committees: enterprise risk, asset and liability, and credit. Board oversight of the executive ESG Committee. Community Impact $8.4mm in community support in 2025, which included housing needs, the arts, agriculture, small business, and education. $2.3mm went to organizations within our new markets. In 2025 >1,000 associates participated in our matching gift program; combined with workplace giving, associated giving totaled nearly $650k. Associates receive 16 hours of paid Volunteer Time Off annually. 1,012 participants logged more than 17,600 hours of volunteer time in 2025, supporting 572 unique charities. Our School of Economics held 140 sessions, reaching more than 8,200 students. Interactive experiences help build financial skills and literacy. 88 UMB locations use automated systems to conserve energy. More than 472k Kilowatt hours were generated from solar panels across our properties and we invested $2.9mm in more efficient HVAC equipment. 2025 recycling efforts produced > 6 tons of comingled recycling, nearly 5 tons of cardboard and 540 pounds of recycled batteries. Beehives housed at a Denver branch support the local honeybee population. UMB-hosted bees visited an estimated 98mm flowers over 8,000+ acres in 2025. Since installation, we’ve harvested nearly 450 pounds of edible honey.

Purchase Accounting Update
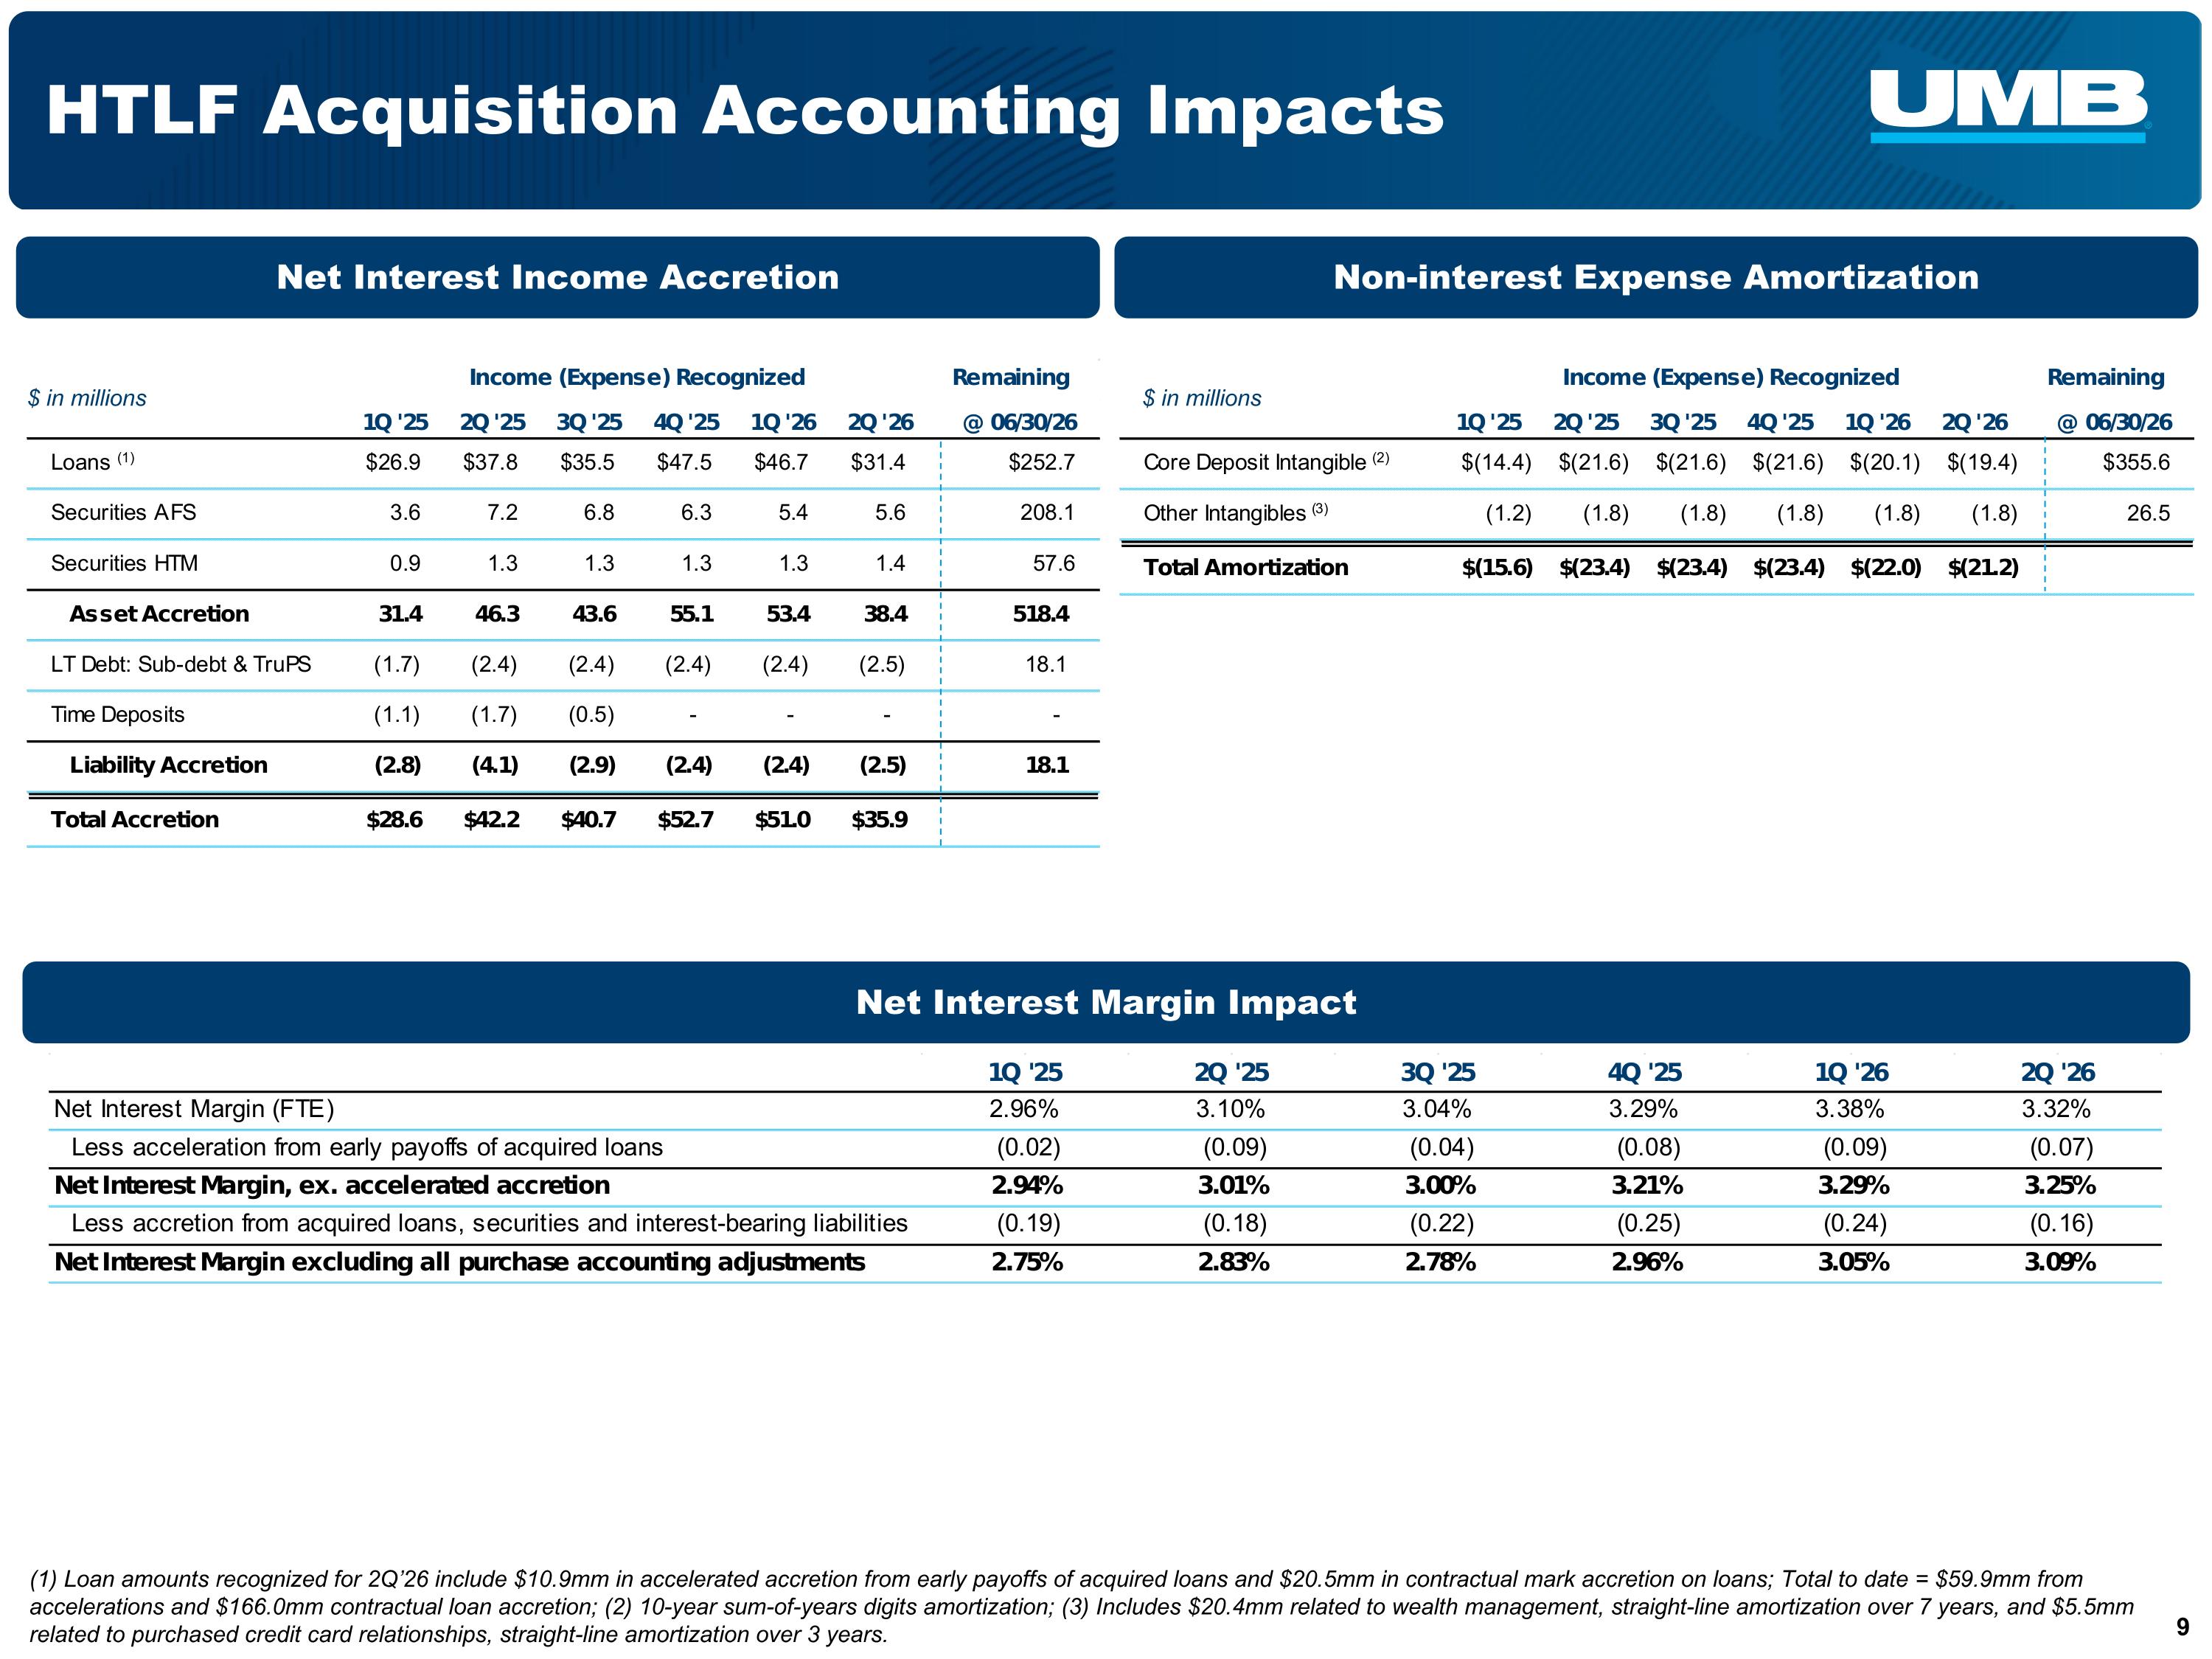
HTLF Acquisition Accounting Impacts (1) Loan amounts recognized for 2Q’26 include $10.9mm in accelerated accretion from early payoffs of acquired loans and $20.5mm in contractual mark accretion on loans; Total to date = $59.9mm from accelerations and $166.0mm contractual loan accretion; (2) 10-year sum-of-years digits amortization; (3) Includes $20.4mm related to wealth management, straight-line amortization over 7 years, and $5.5mm related to purchased credit card relationships, straight-line amortization over 3 years. Net Interest Margin Impact Net Interest Income Accretion Non-interest Expense Amortization $ in millions $ in millions
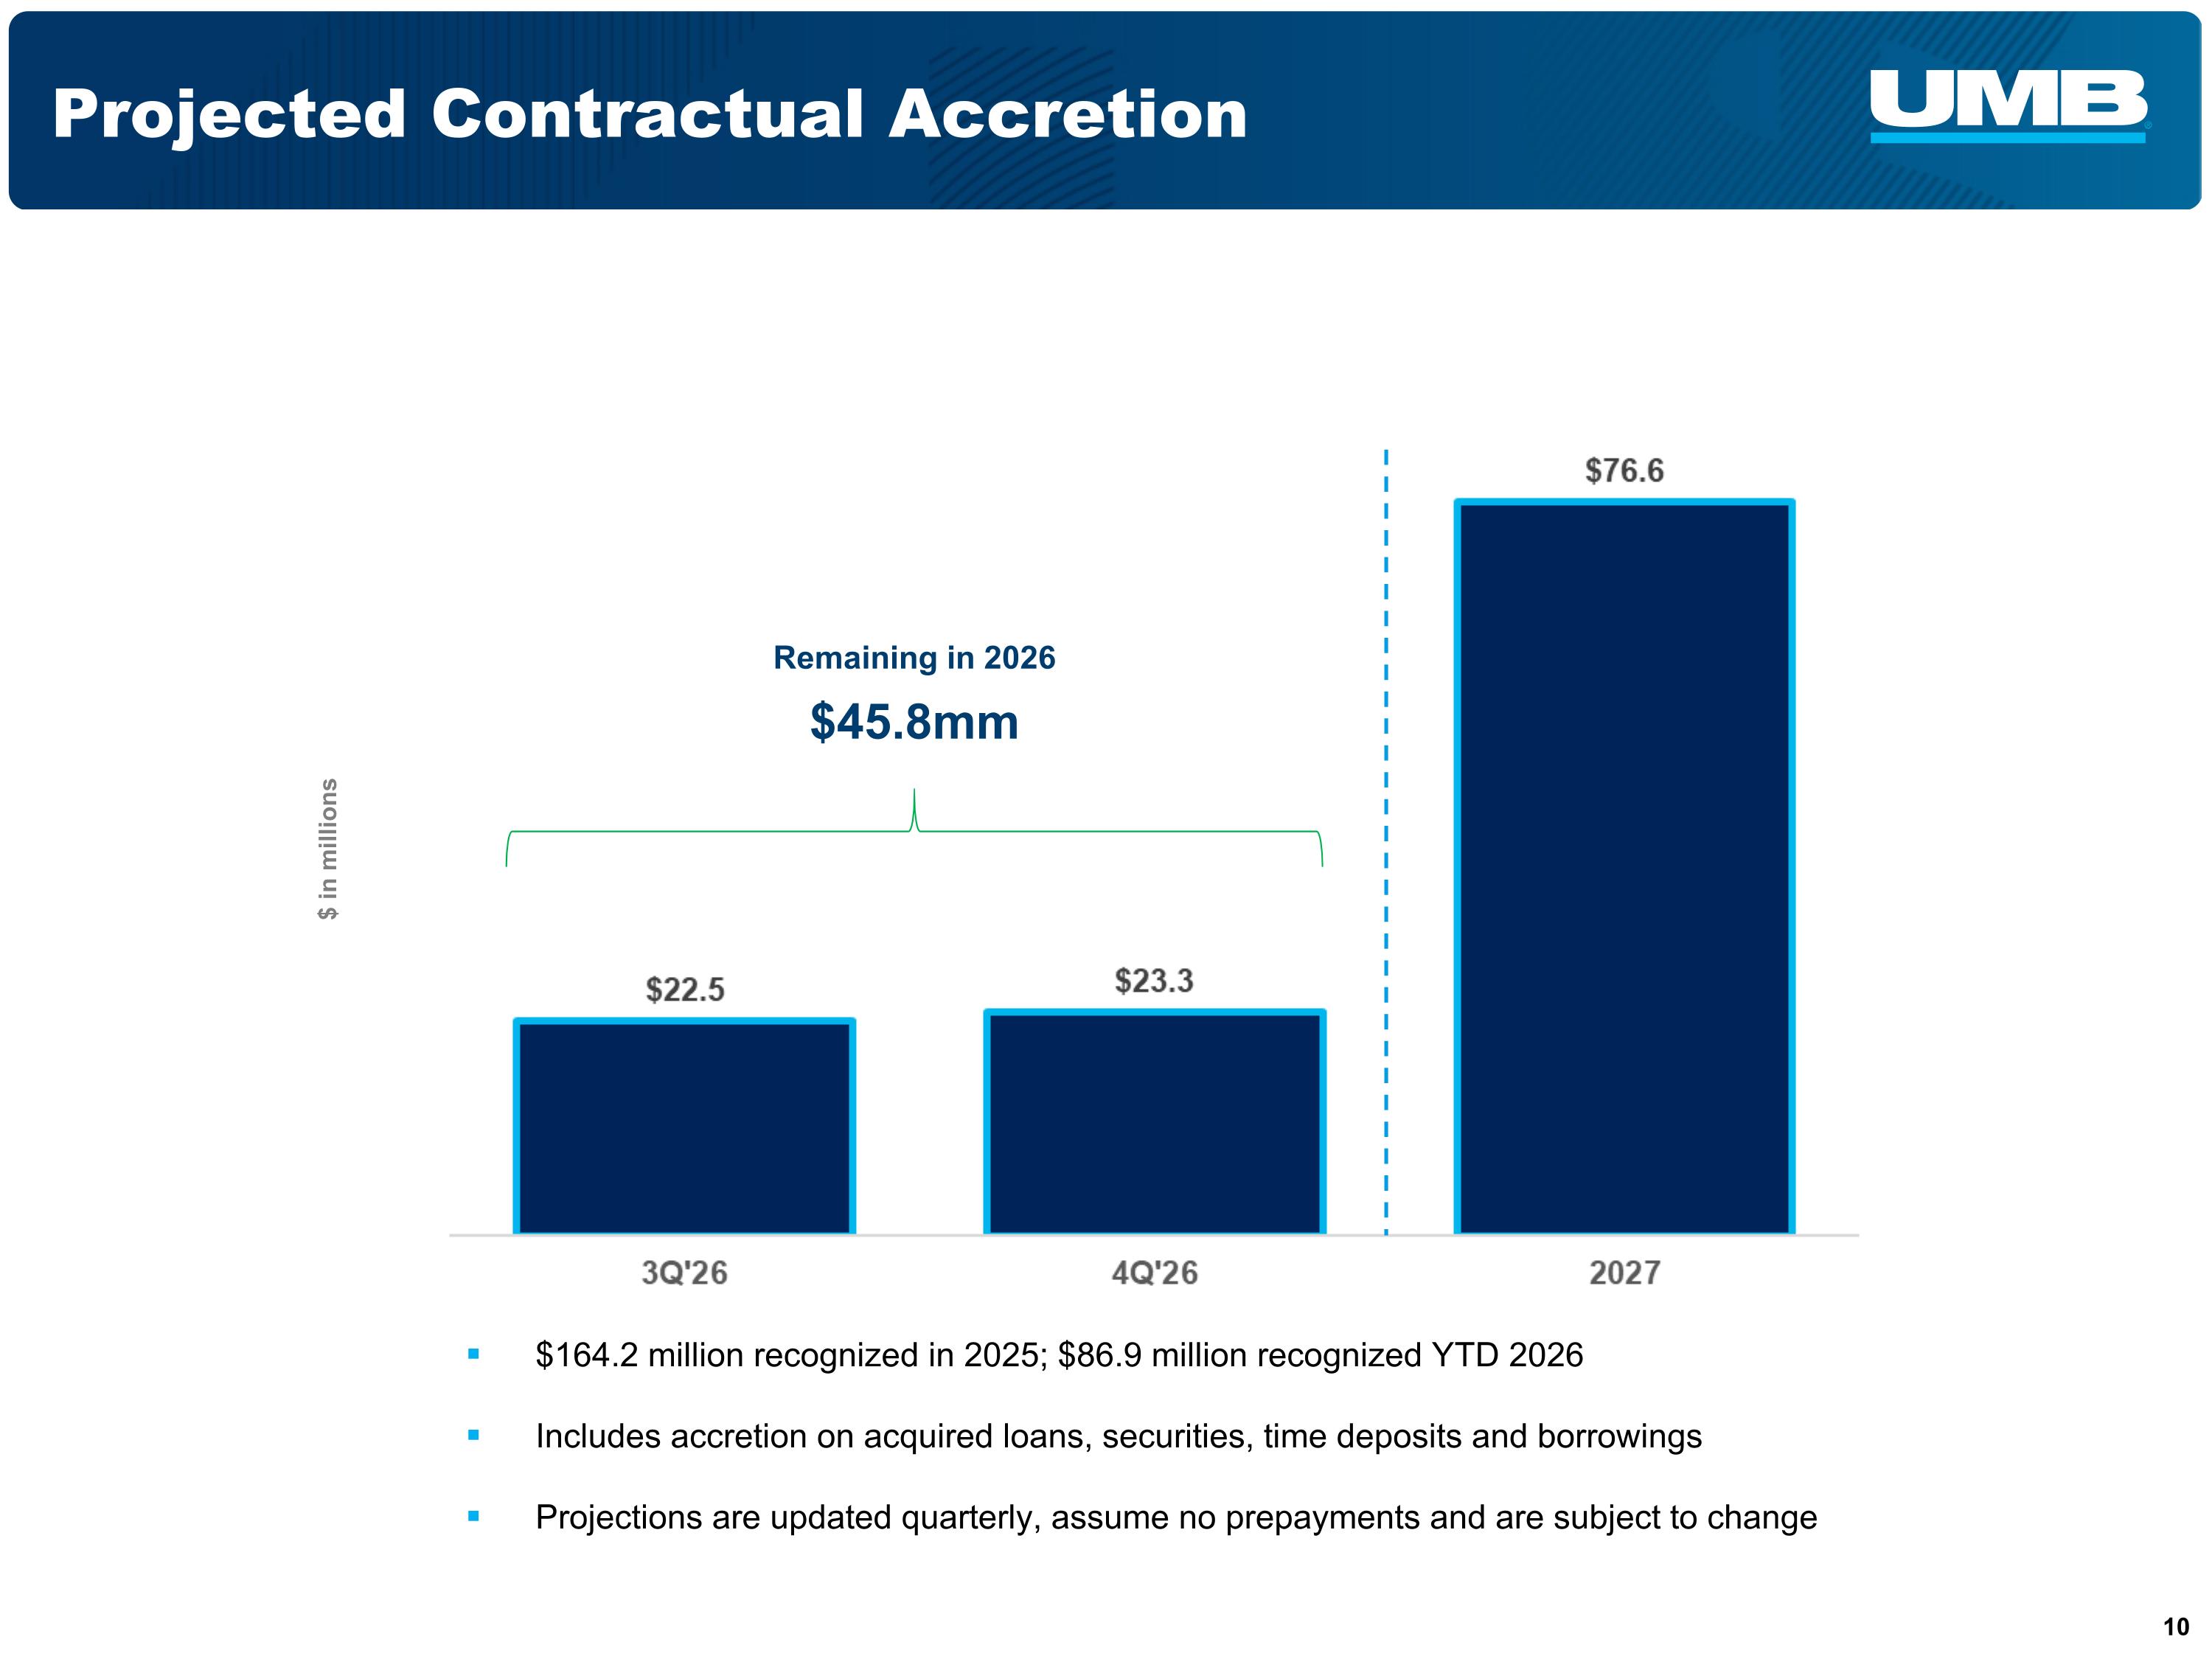
Projected Contractual Accretion $164.2 million recognized in 2025; $86.9 million recognized YTD 2026 Includes accretion on acquired loans, securities, time deposits and borrowings Projections are updated quarterly, assume no prepayments and are subject to change $ in millions Remaining in 2026 $45.8mm
2nd Quarter 2026 Financial Review
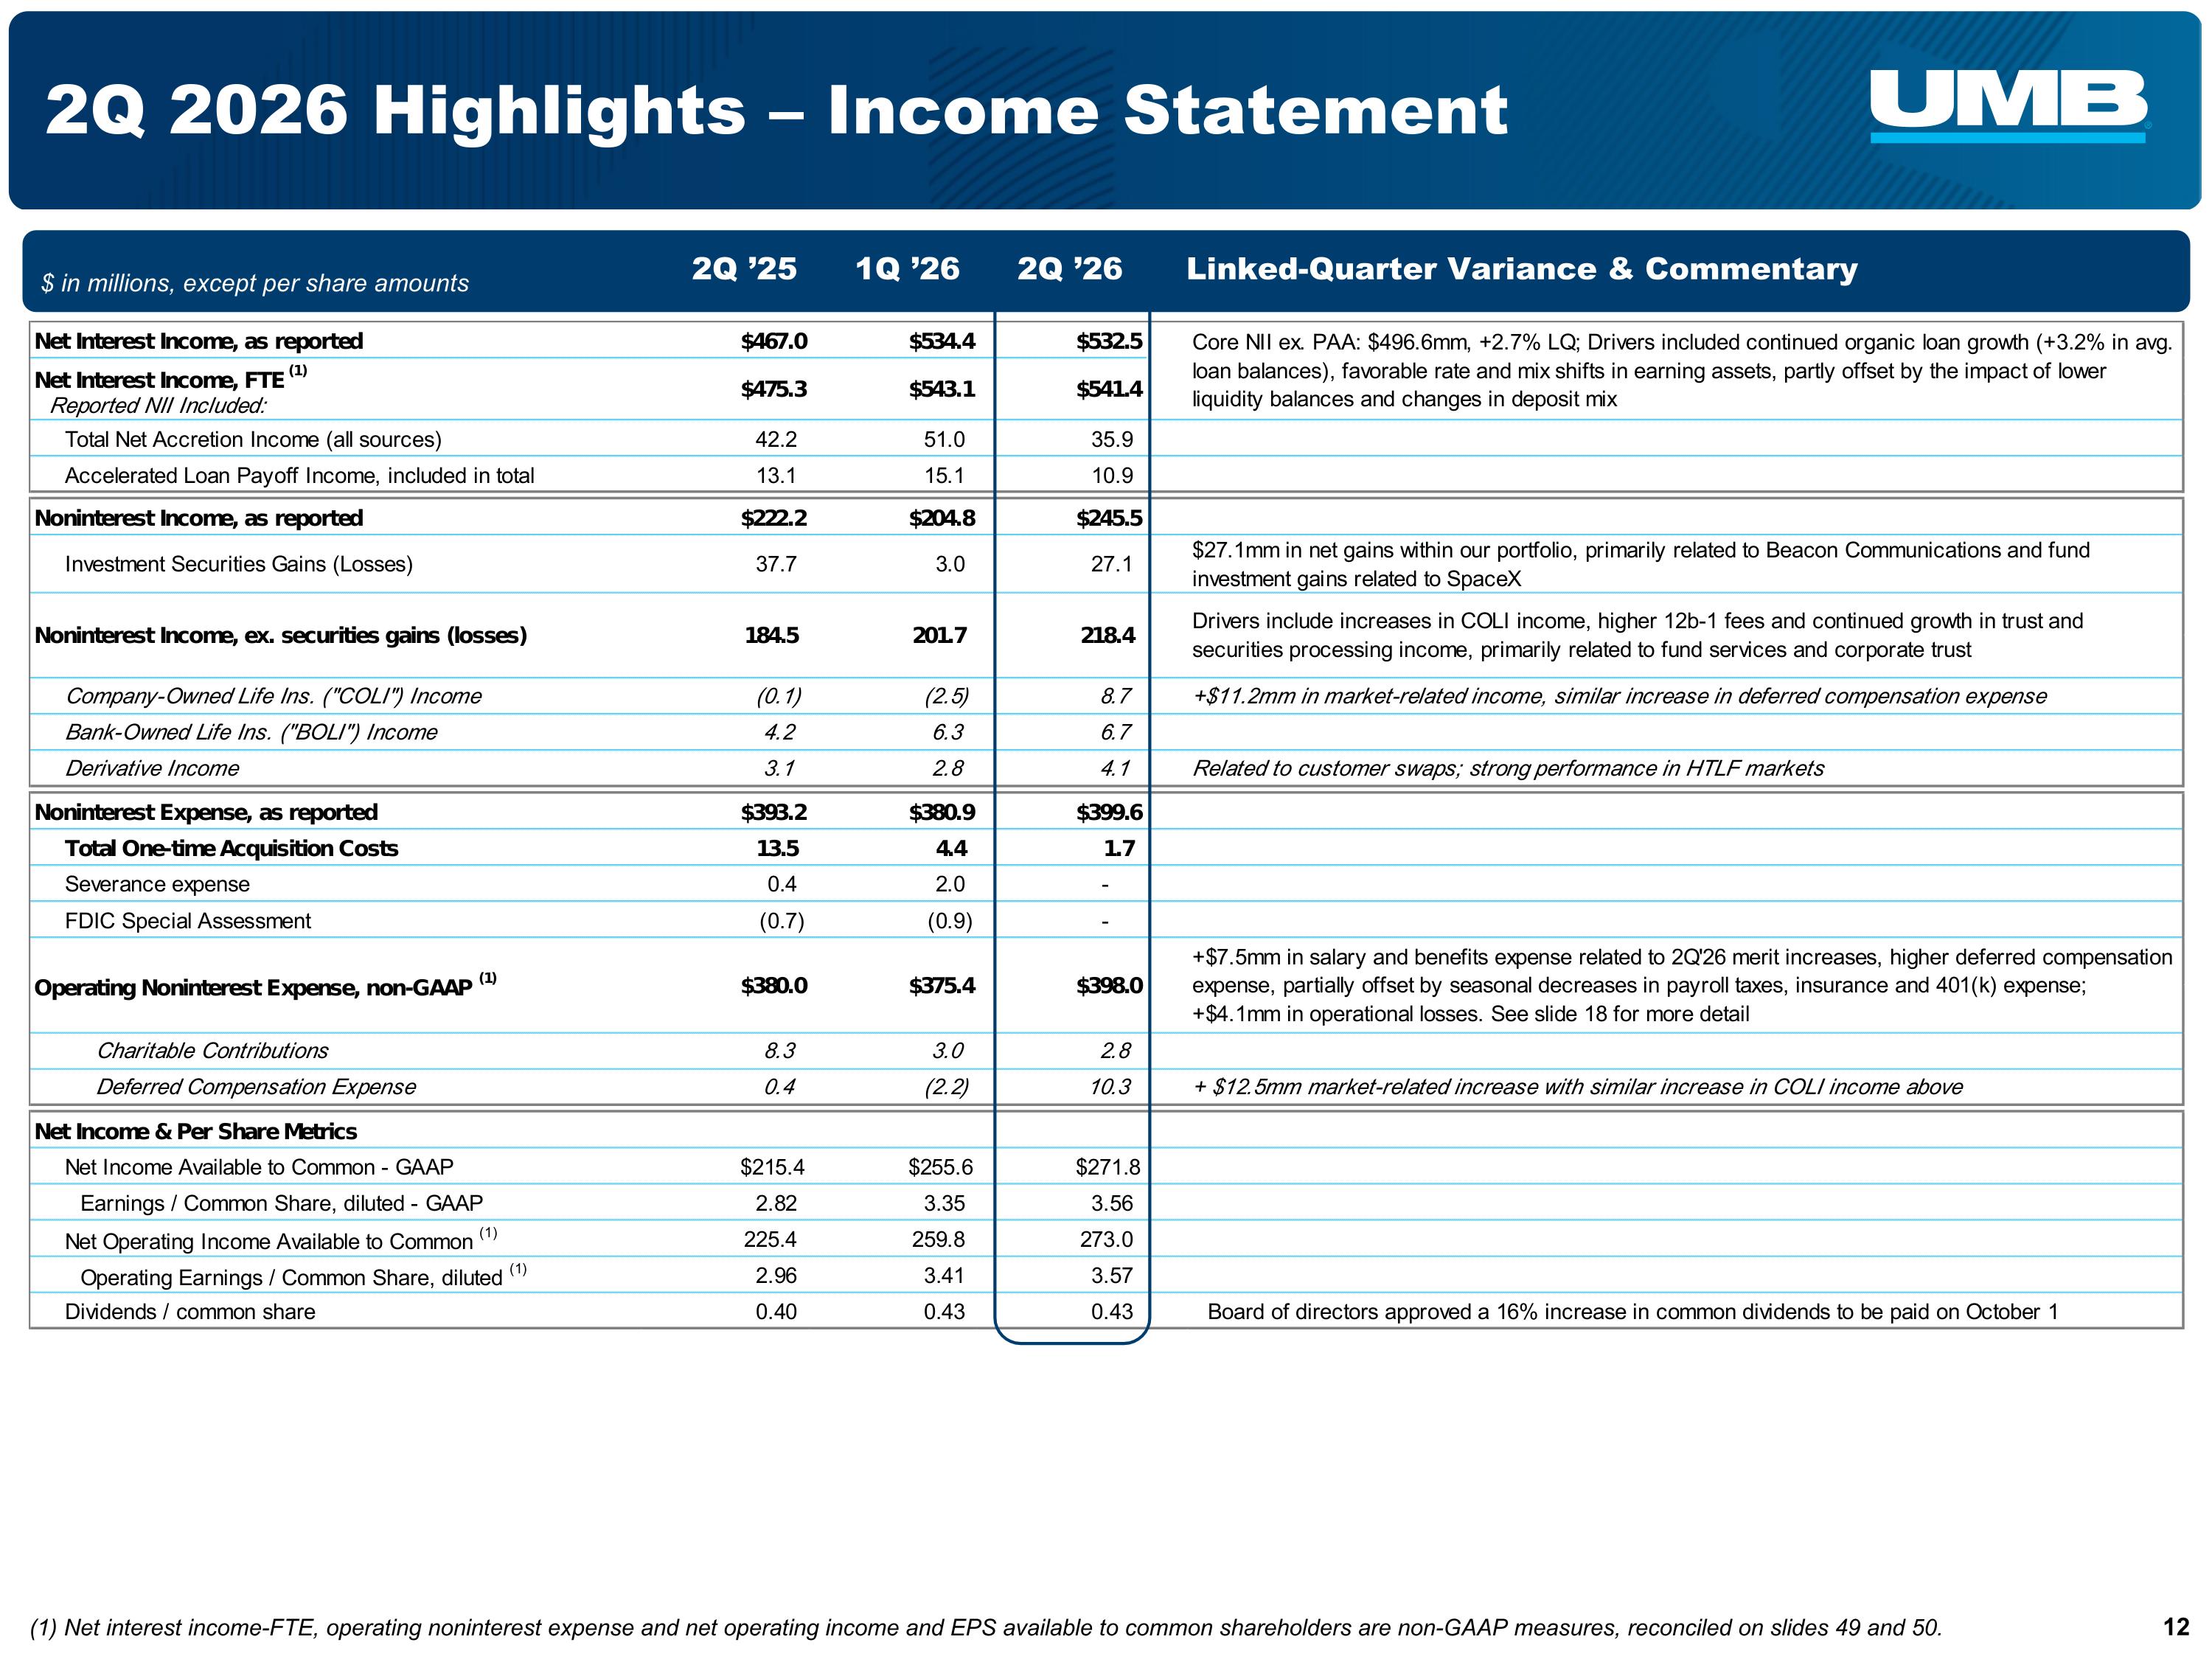
2Q 2026 Highlights – Income Statement (1) Net interest income-FTE, operating noninterest expense and net operating income and EPS available to common shareholders are non-GAAP measures, reconciled on slides 49 and 50. $ in millions, except per share amounts 1Q ’26 2Q ’26 2Q ’25 Linked-Quarter Variance & Commentary
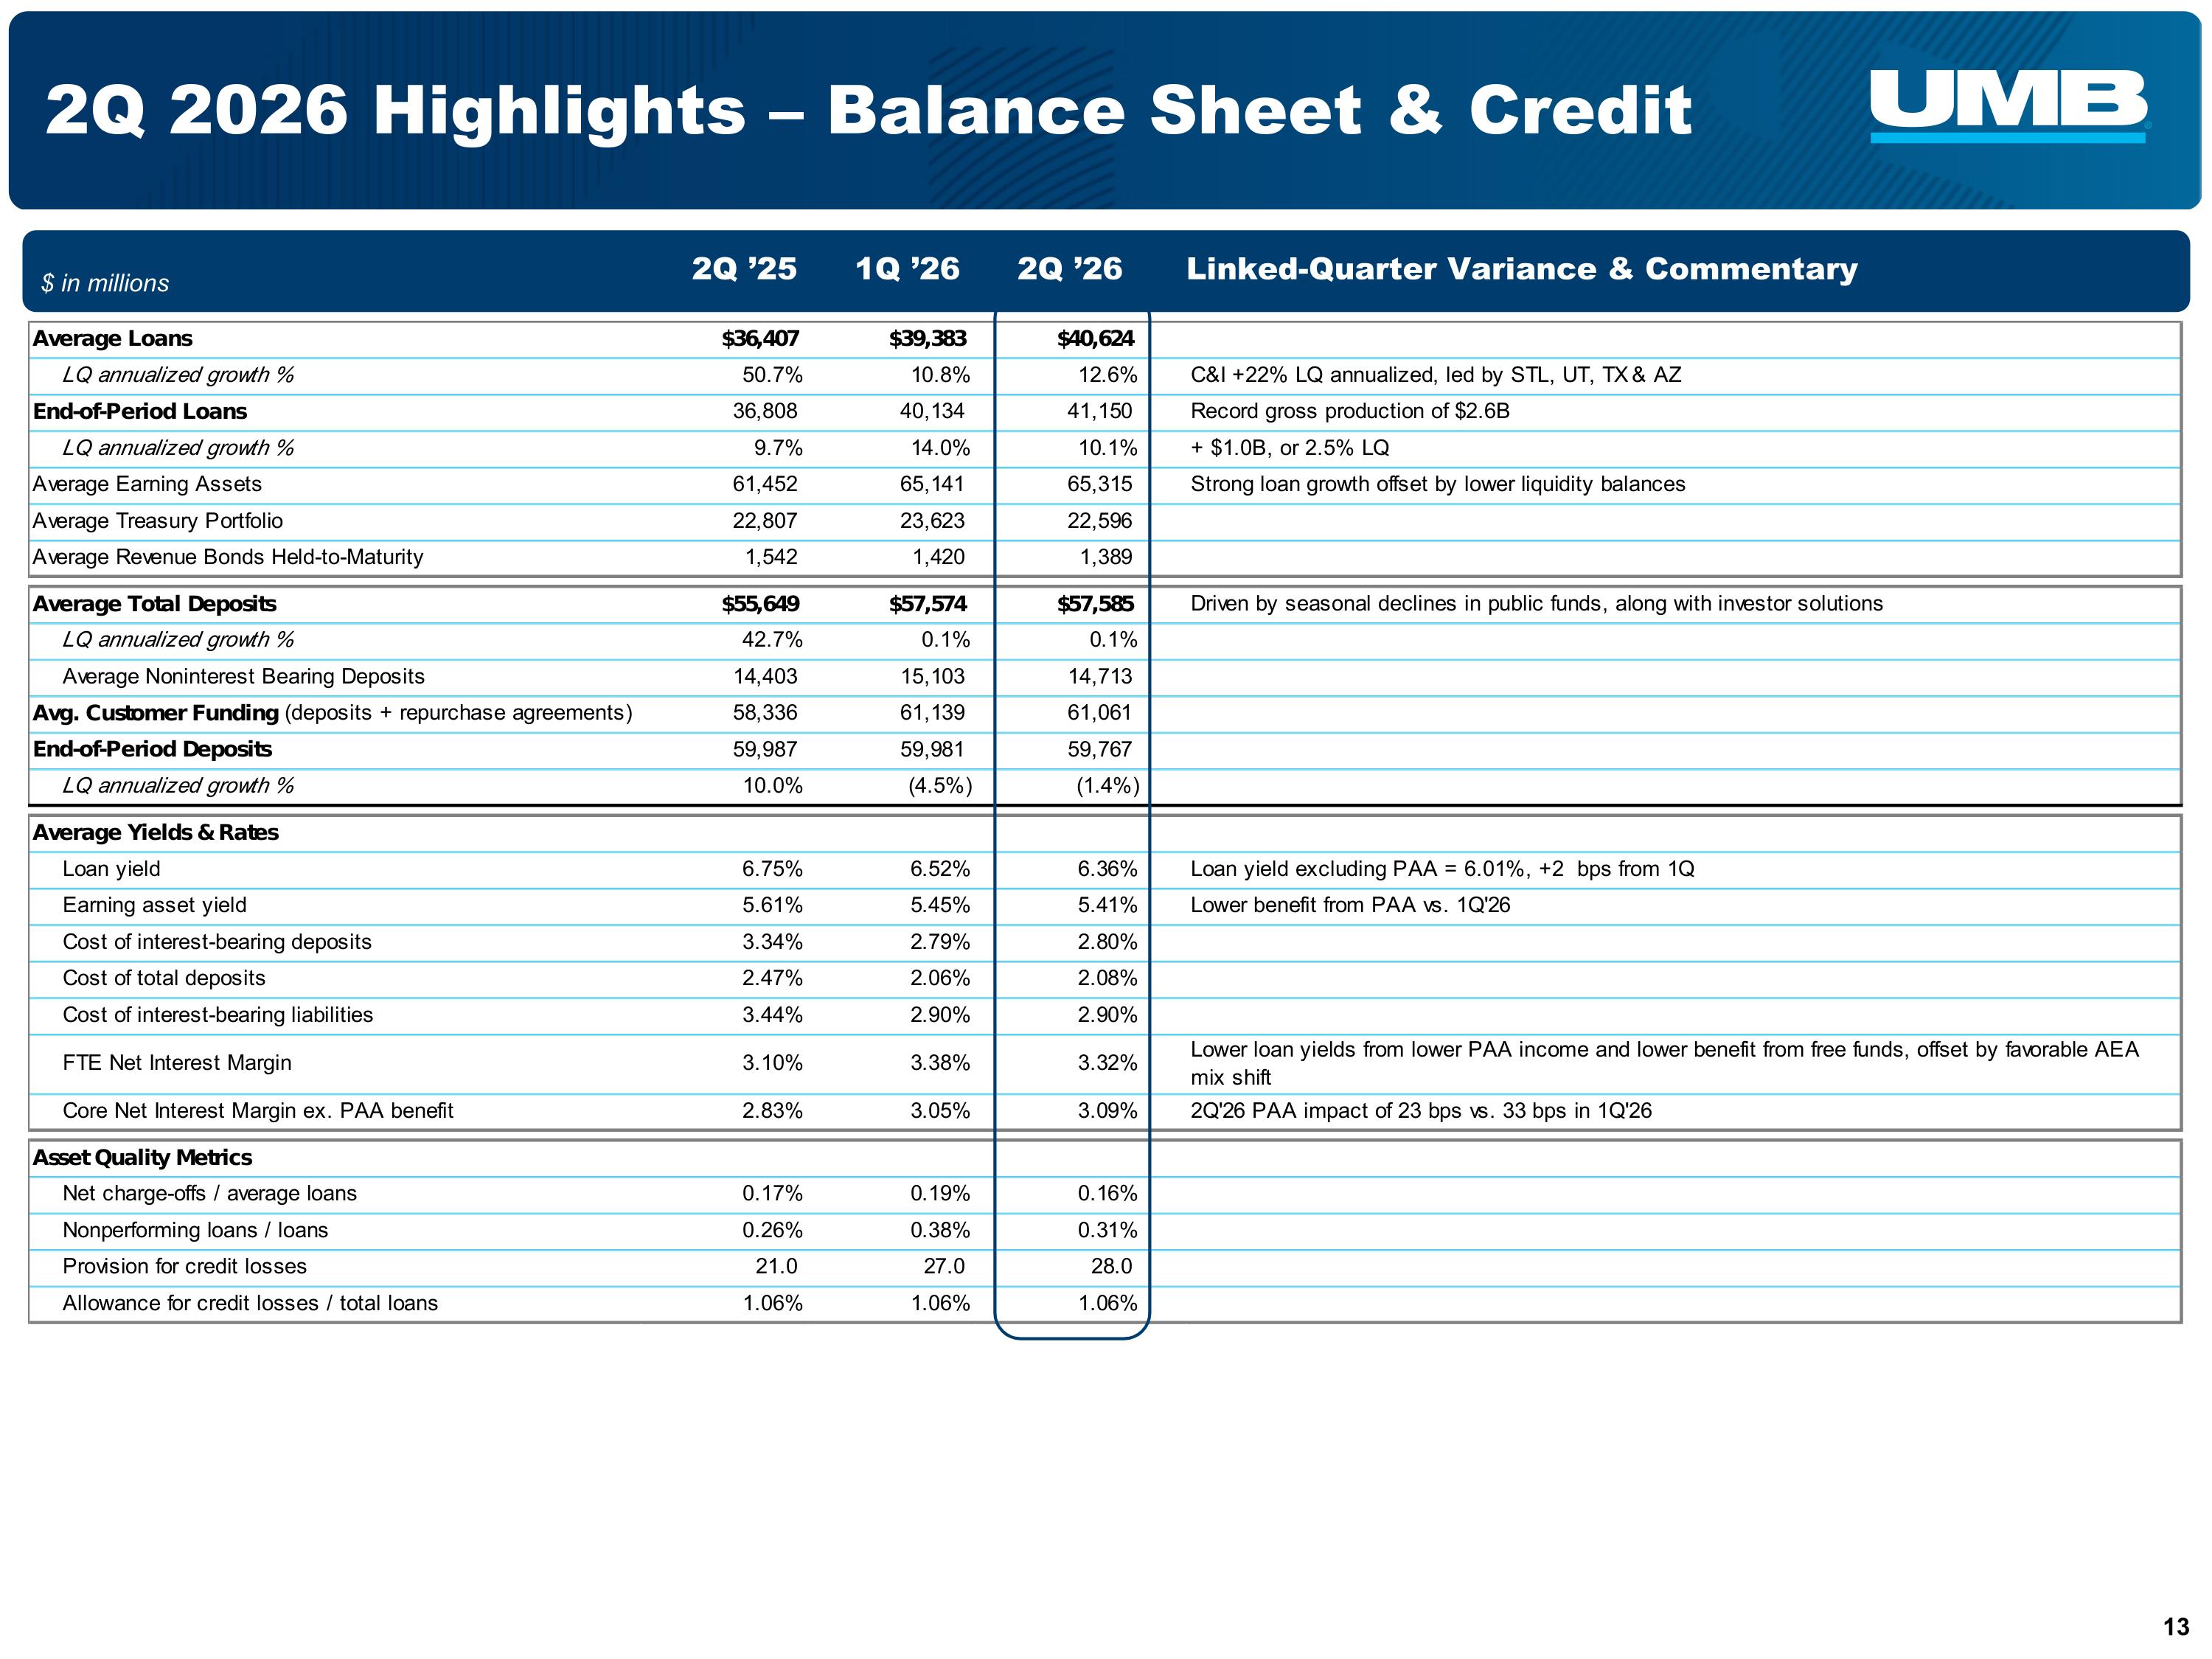
2Q 2026 Highlights – Balance Sheet & Credit $ in millions 1Q ’26 2Q ’26 2Q ’25 Linked-Quarter Variance & Commentary
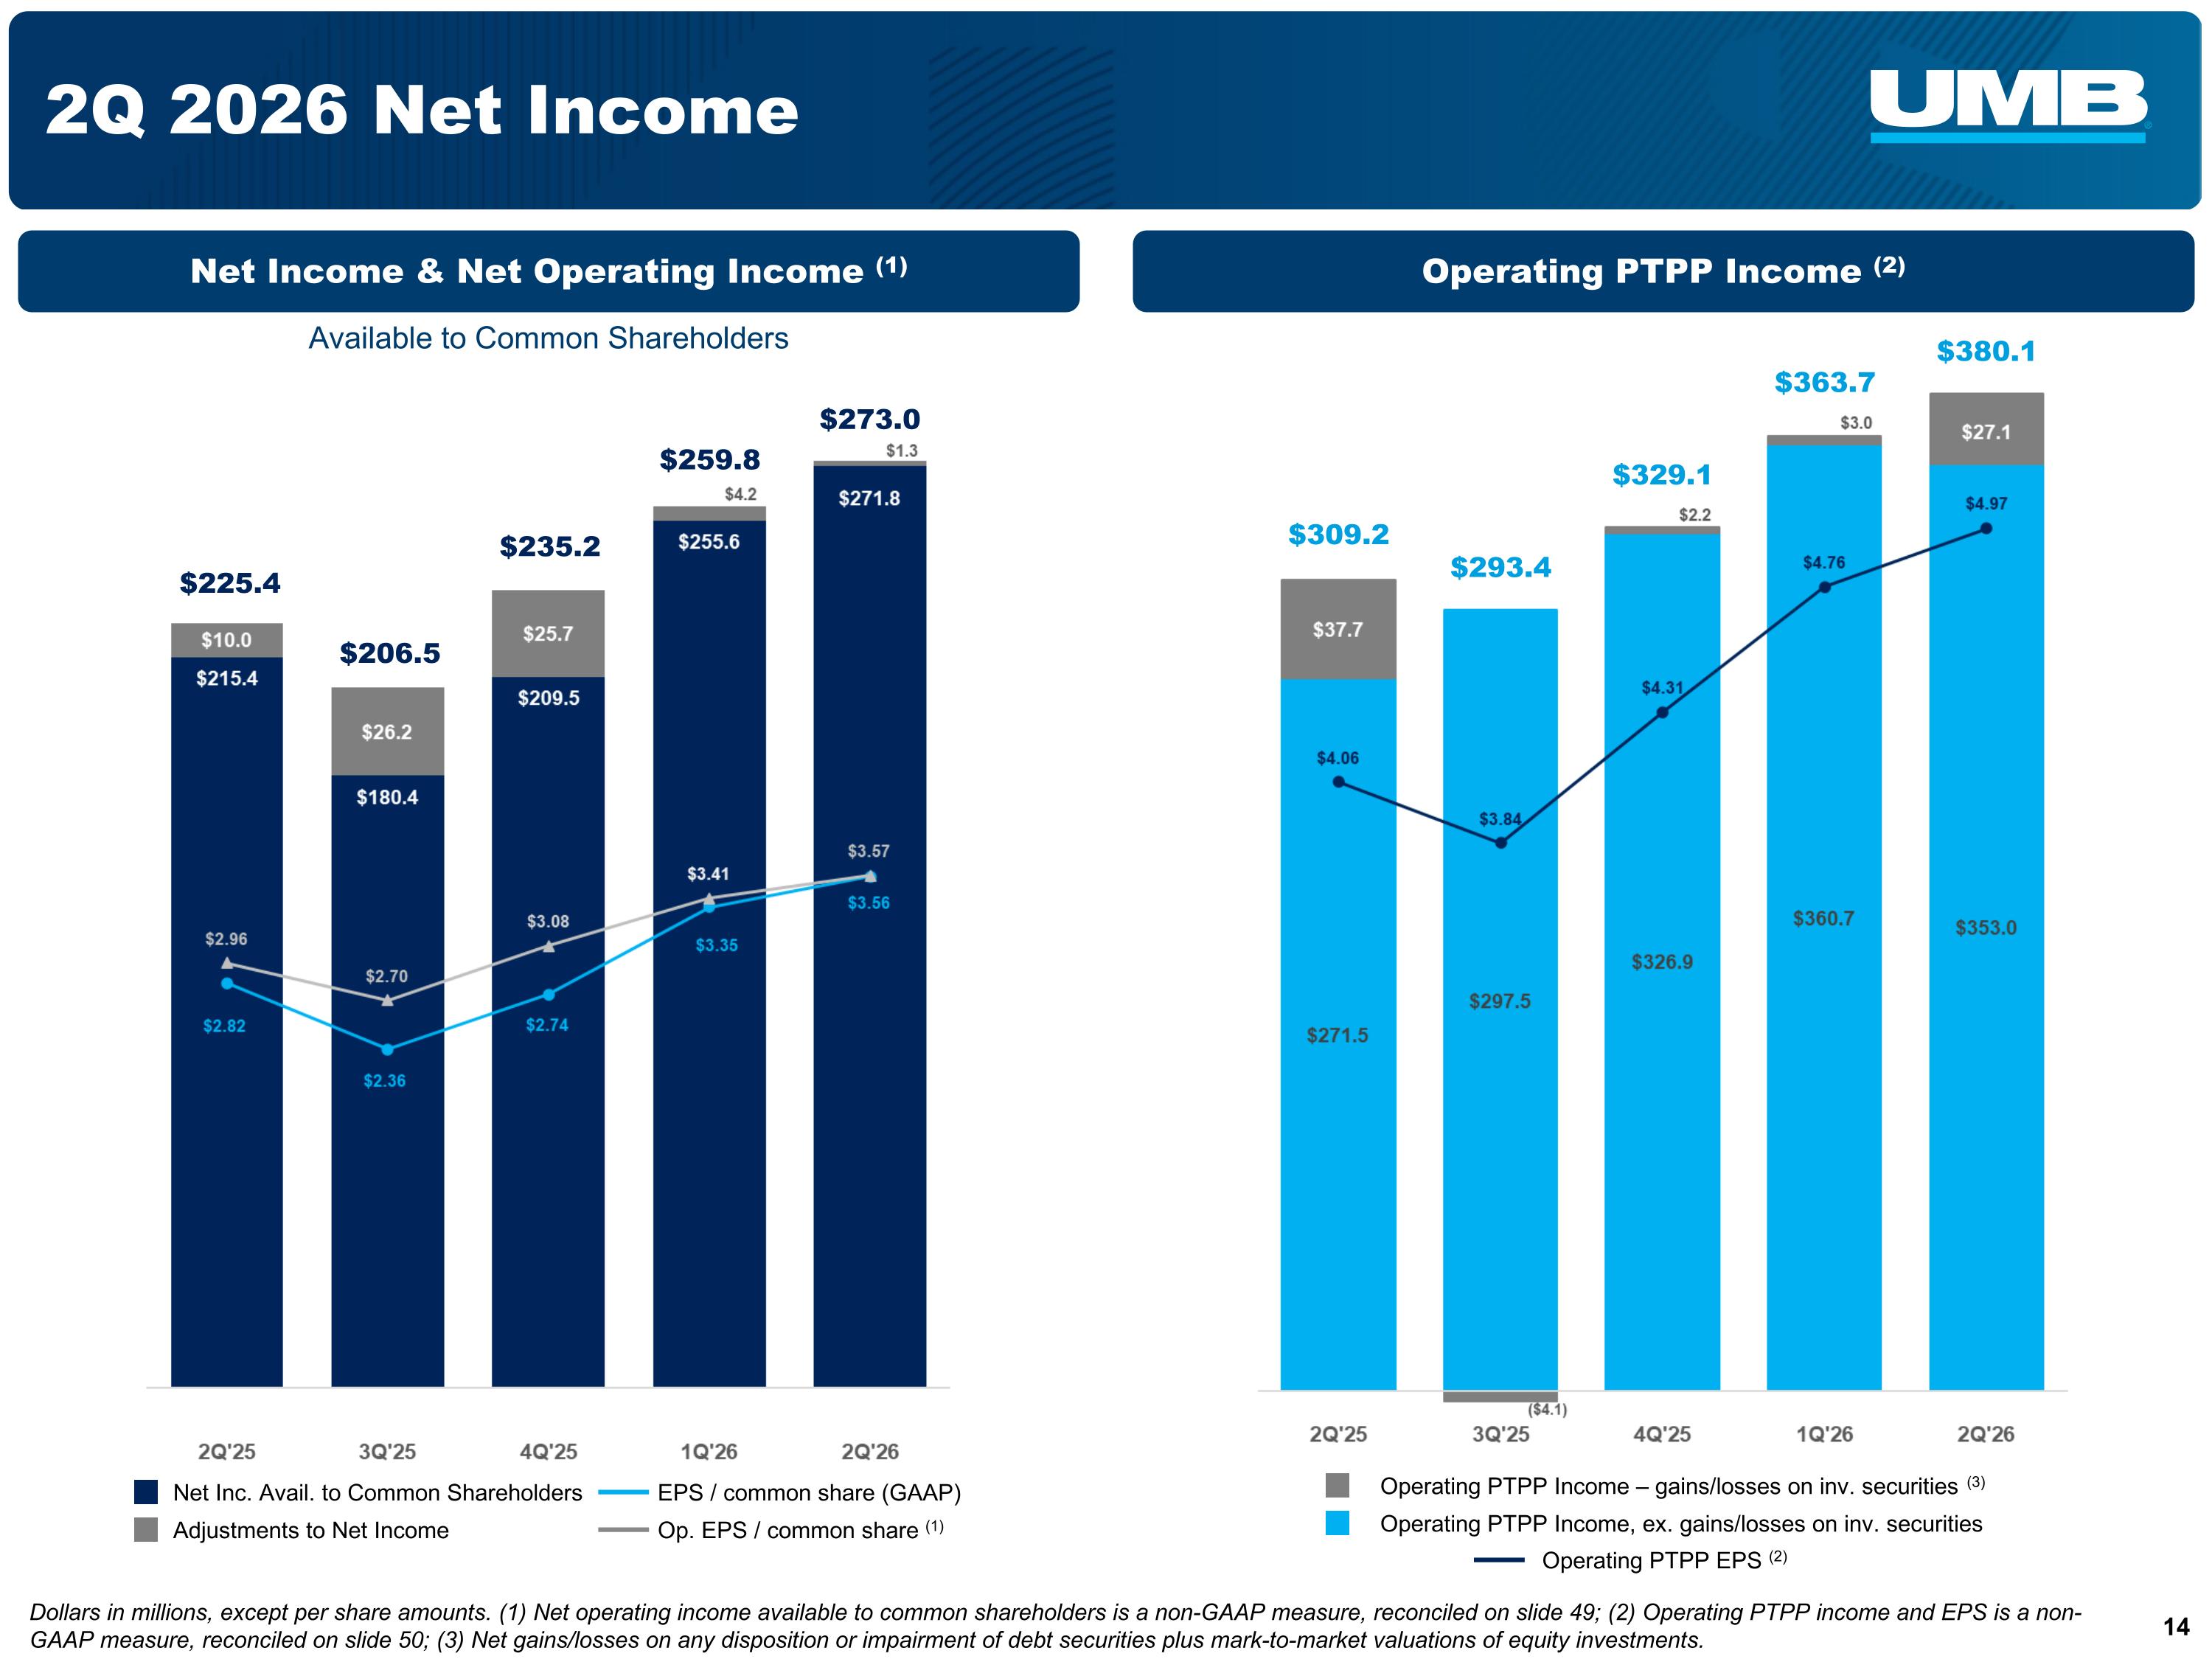
2Q 2026 Net Income $363.7 $380.1 $309.2 $293.4 $329.1 Dollars in millions, except per share amounts. (1) Net operating income available to common shareholders is a non-GAAP measure, reconciled on slide 49; (2) Operating PTPP income and EPS is a non-GAAP measure, reconciled on slide 50; (3) Net gains/losses on any disposition or impairment of debt securities plus mark-to-market valuations of equity investments. EPS / common share (GAAP) Net Inc. Avail. to Common Shareholders Op. EPS / common share (1) Adjustments to Net Income $235.2 $259.8 $273.0 $225.4 $206.5 Net Income & Net Operating Income (1) Operating PTPP Income (2) Operating PTPP Income – gains/losses on inv. securities (3) Operating PTPP Income, ex. gains/losses on inv. securities Operating PTPP EPS (2) Available to Common Shareholders
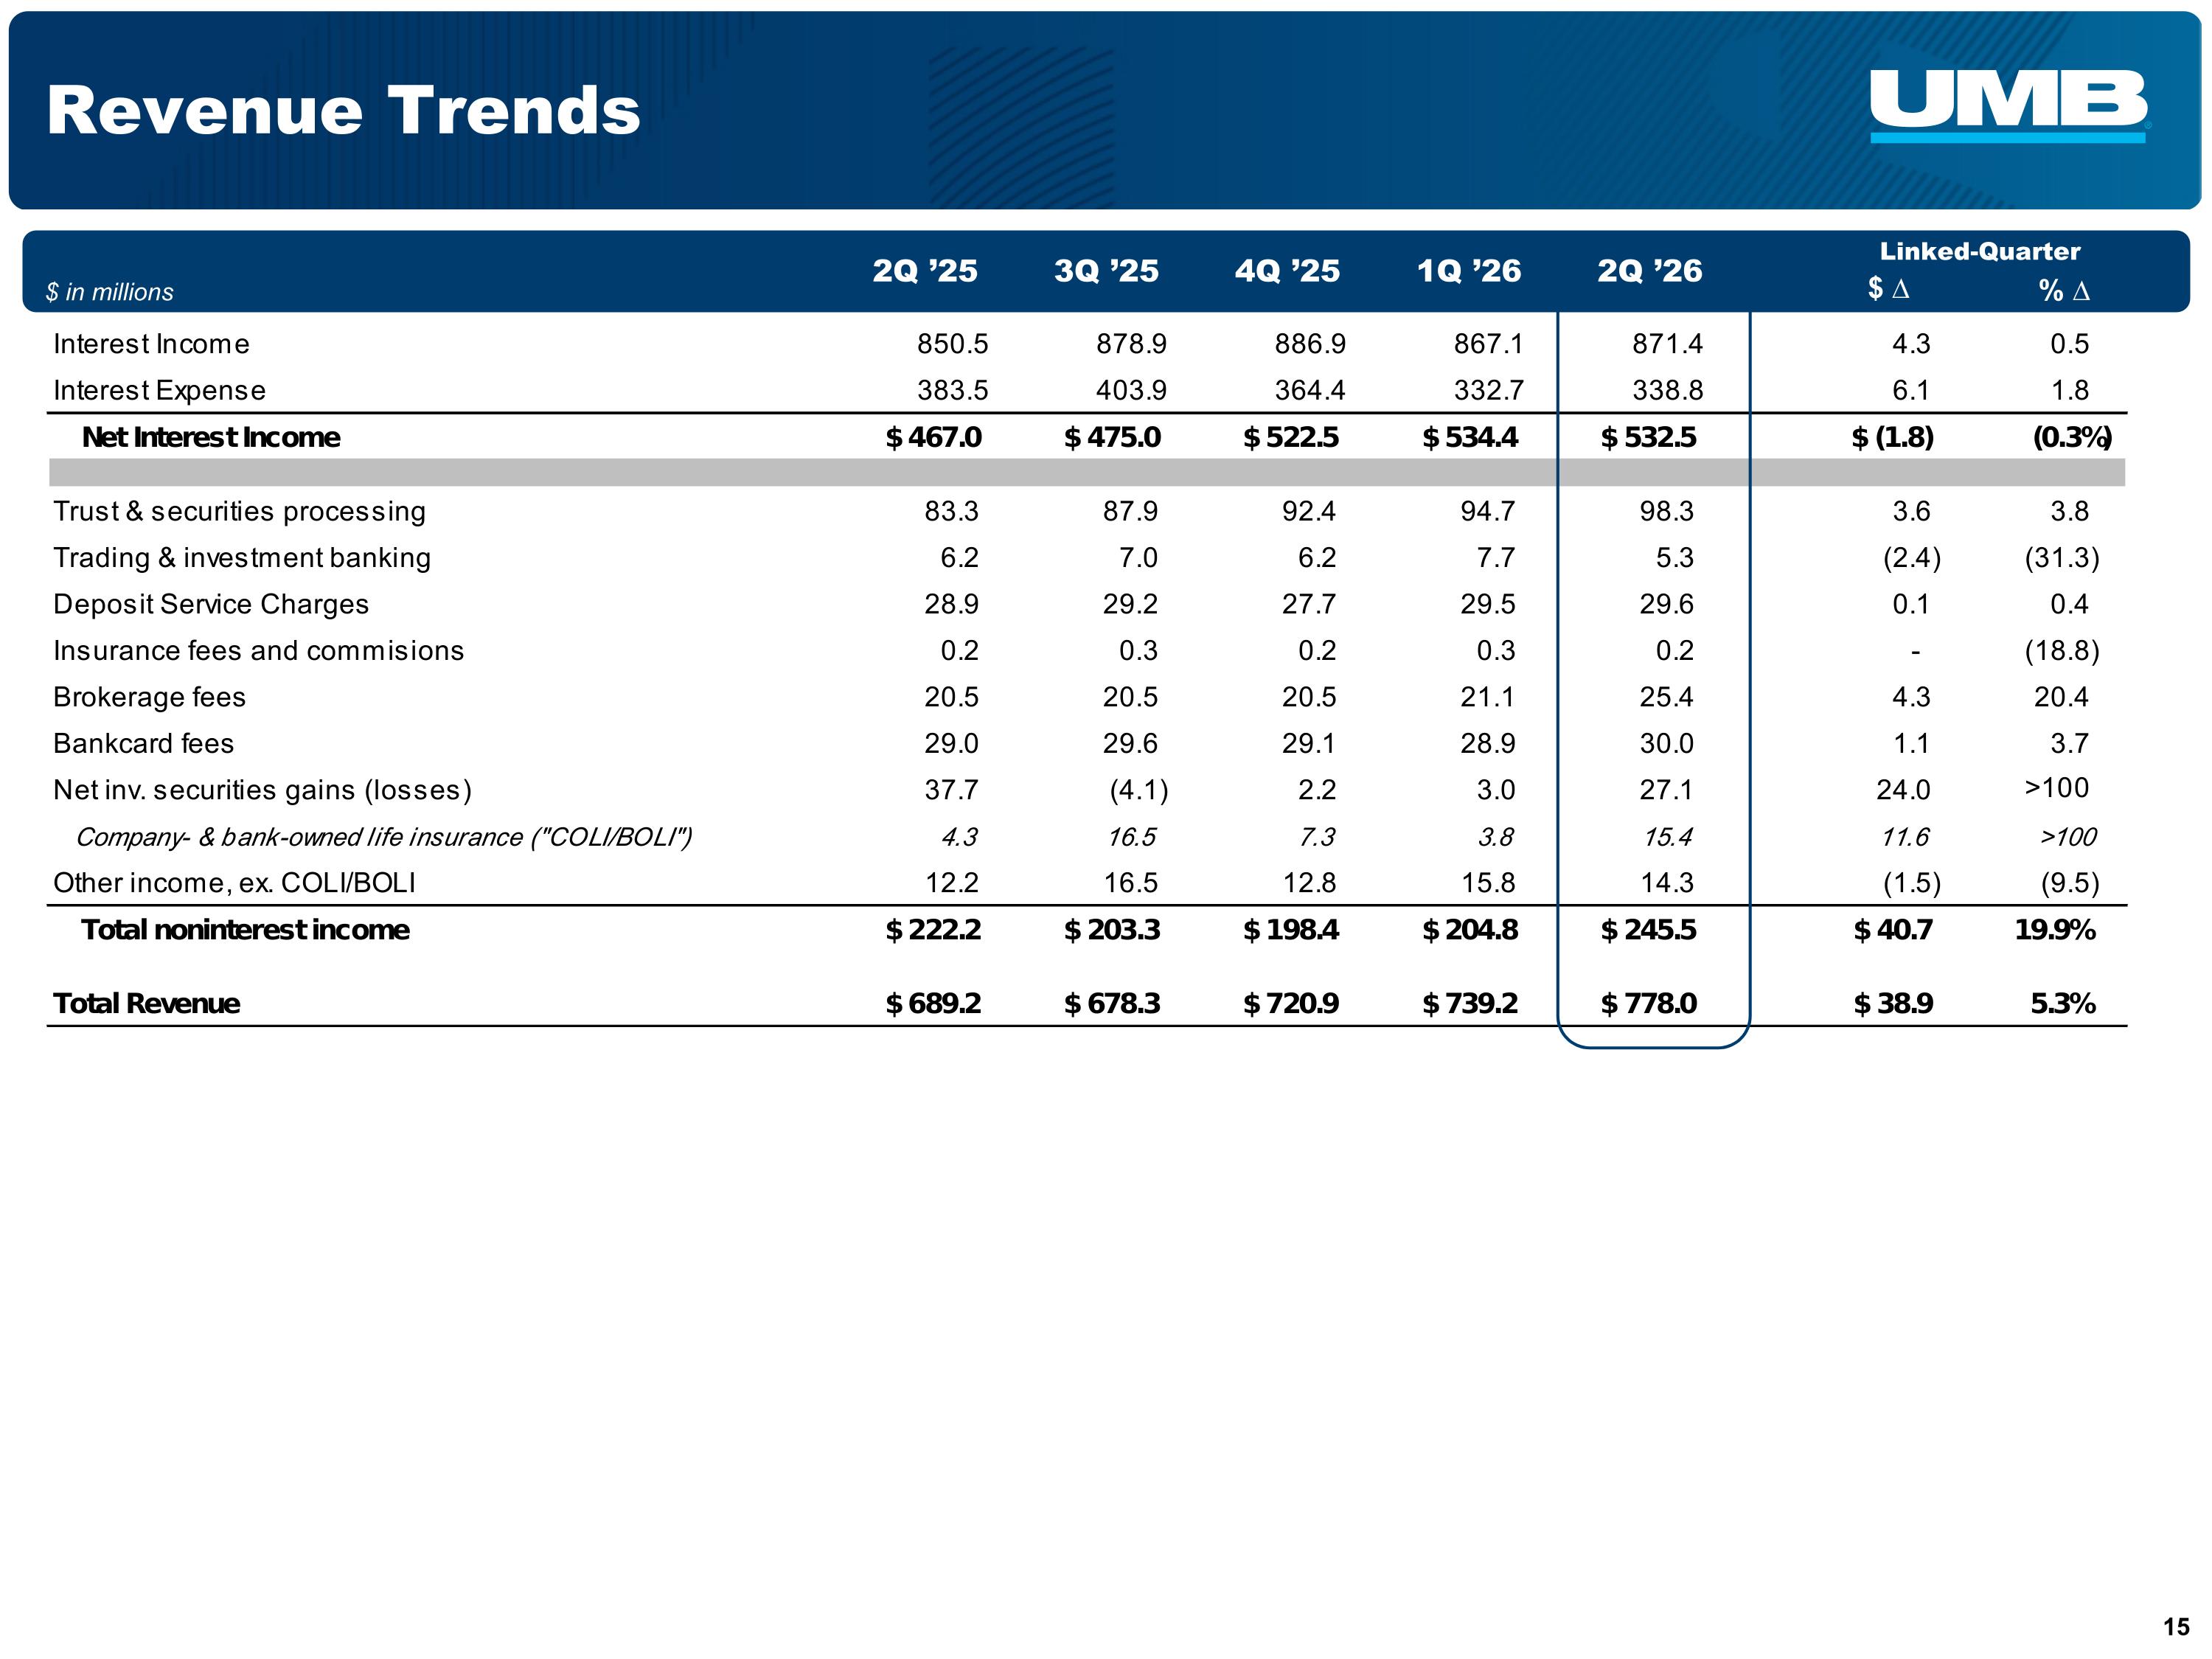
Revenue Trends $ in millions Linked-Quarter $ ∆ % ∆ 2Q ’26 1Q ’26 2Q ’25 3Q ’25 4Q ’25
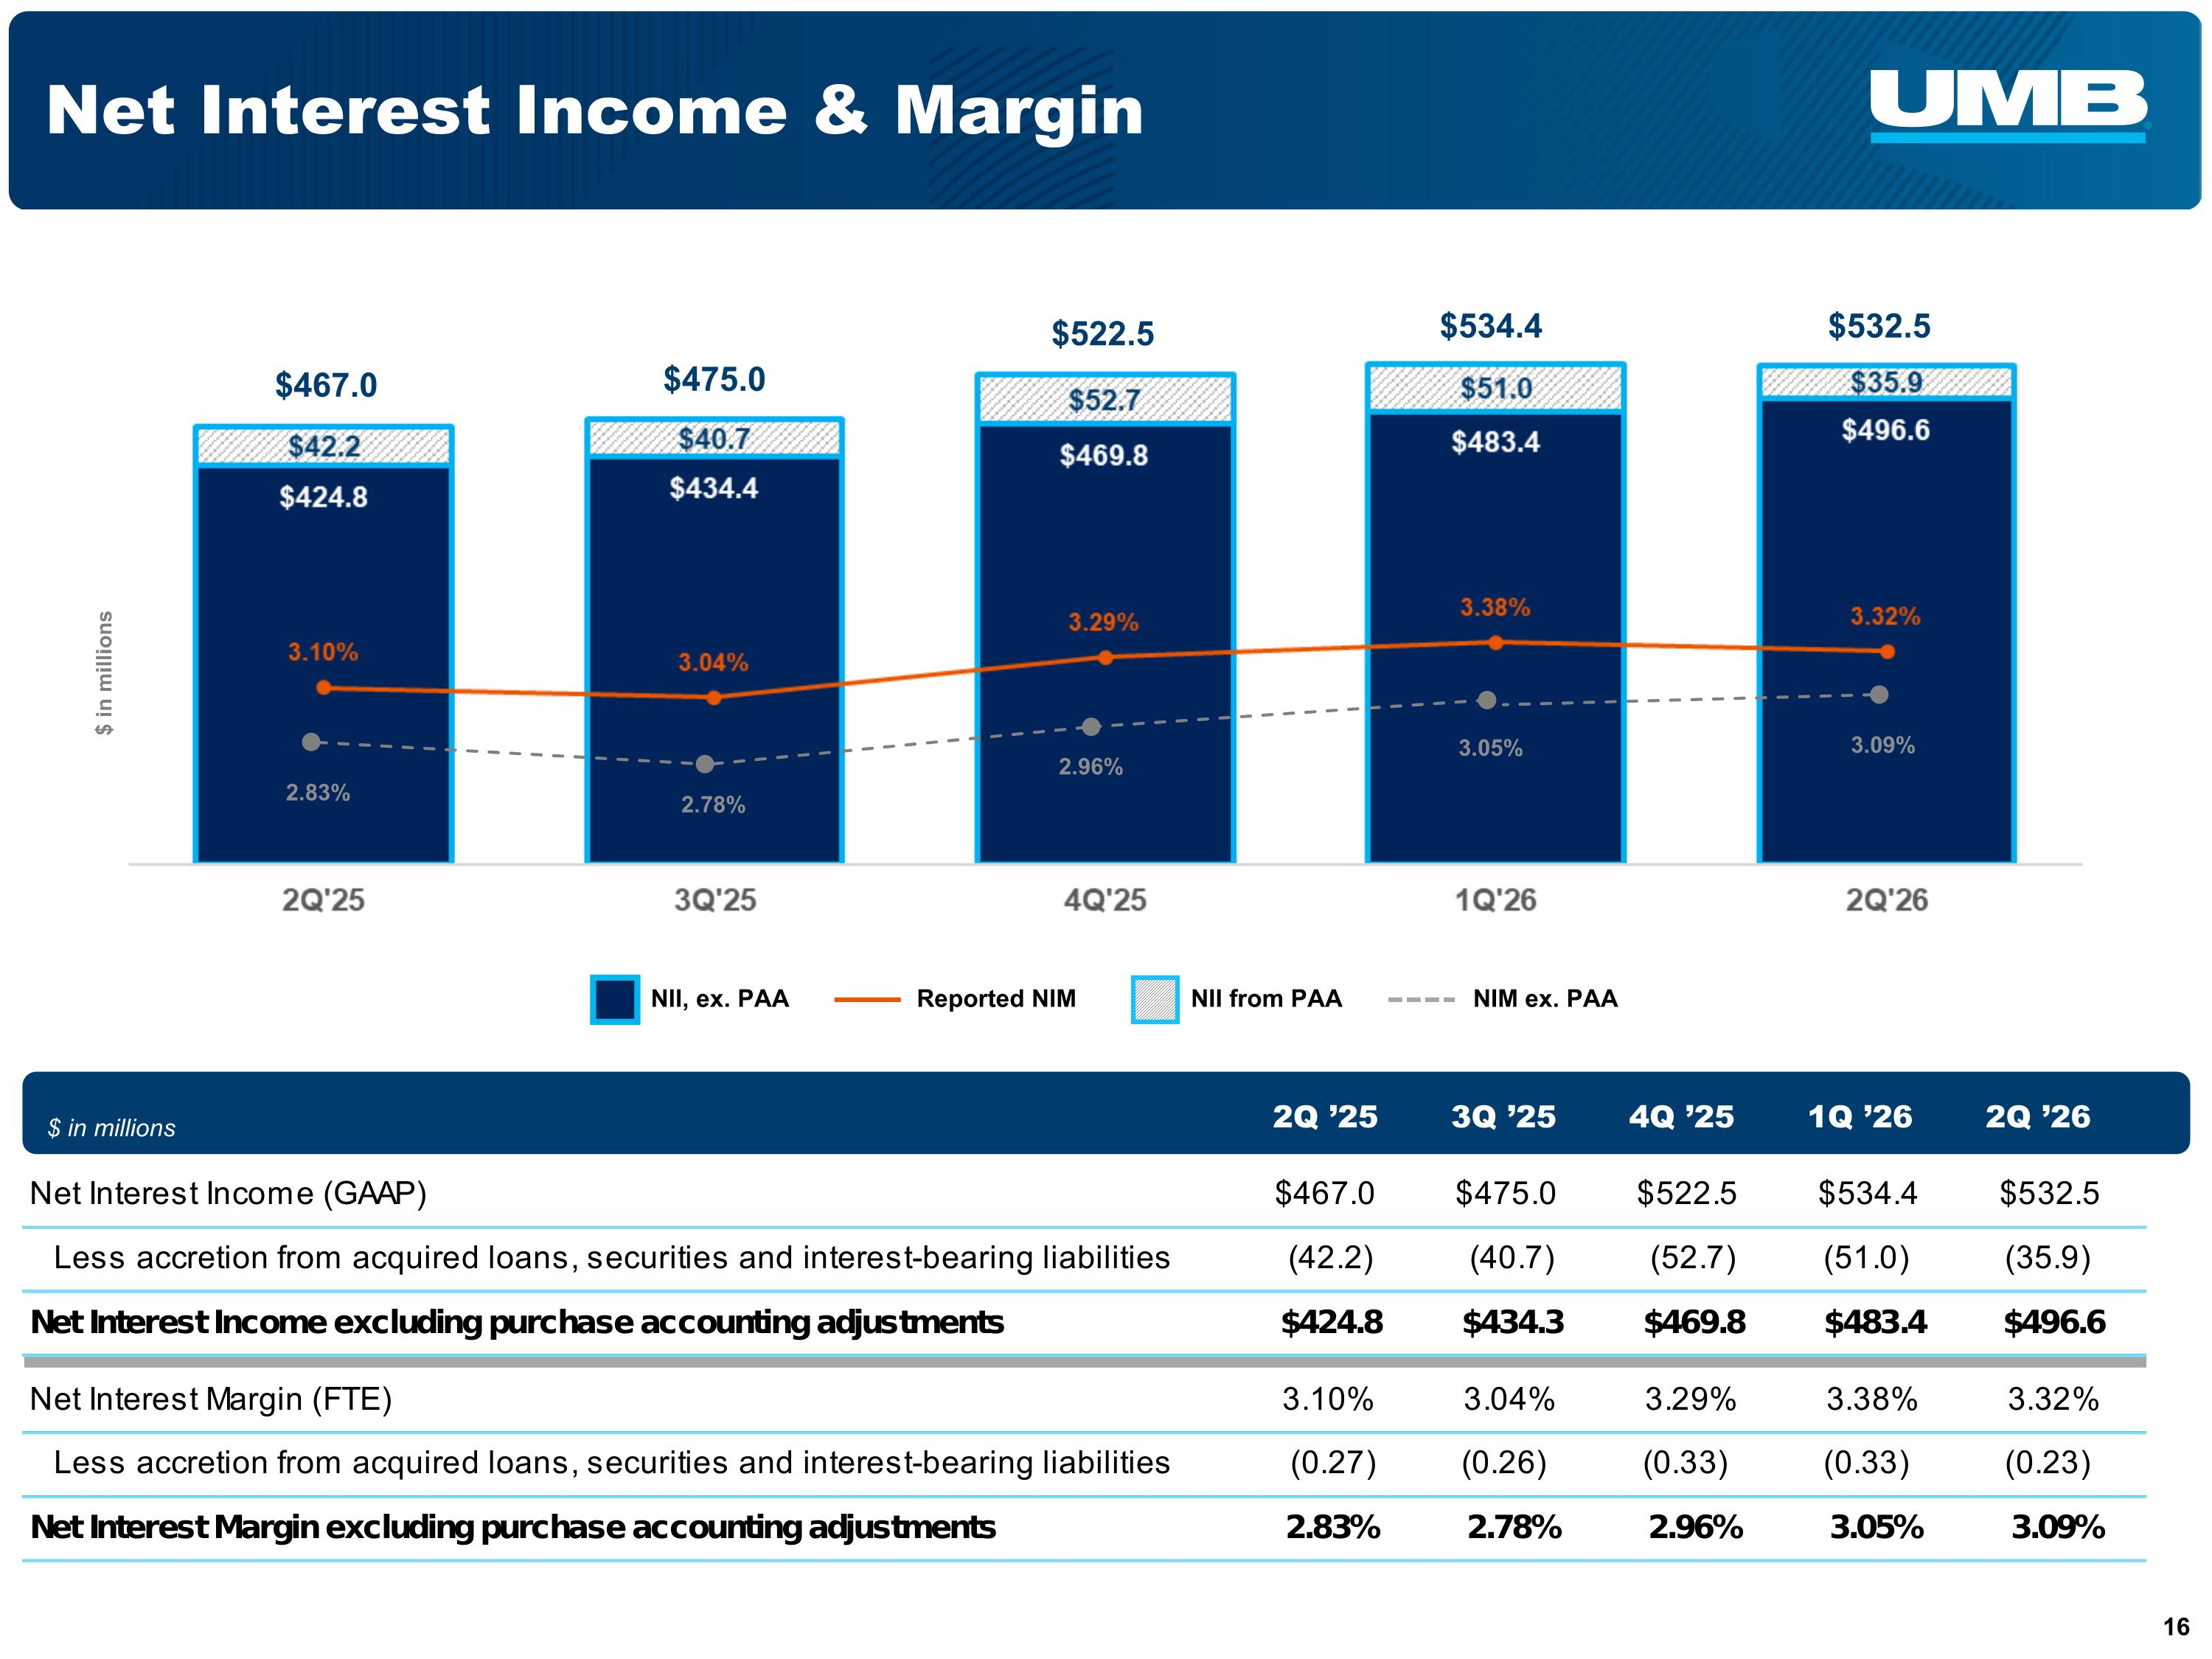
Net Interest Income & Margin NII, ex. PAA NII from PAA Reported NIM NIM ex. PAA $532.5 $467.0 $475.0 $522.5 $534.4 $ in millions 3.09% 2.83% 2.78% 2.96% 3.05% 2Q ’25 3Q ’25 4Q ’25 1Q ’26 2Q ’26 $ in millions
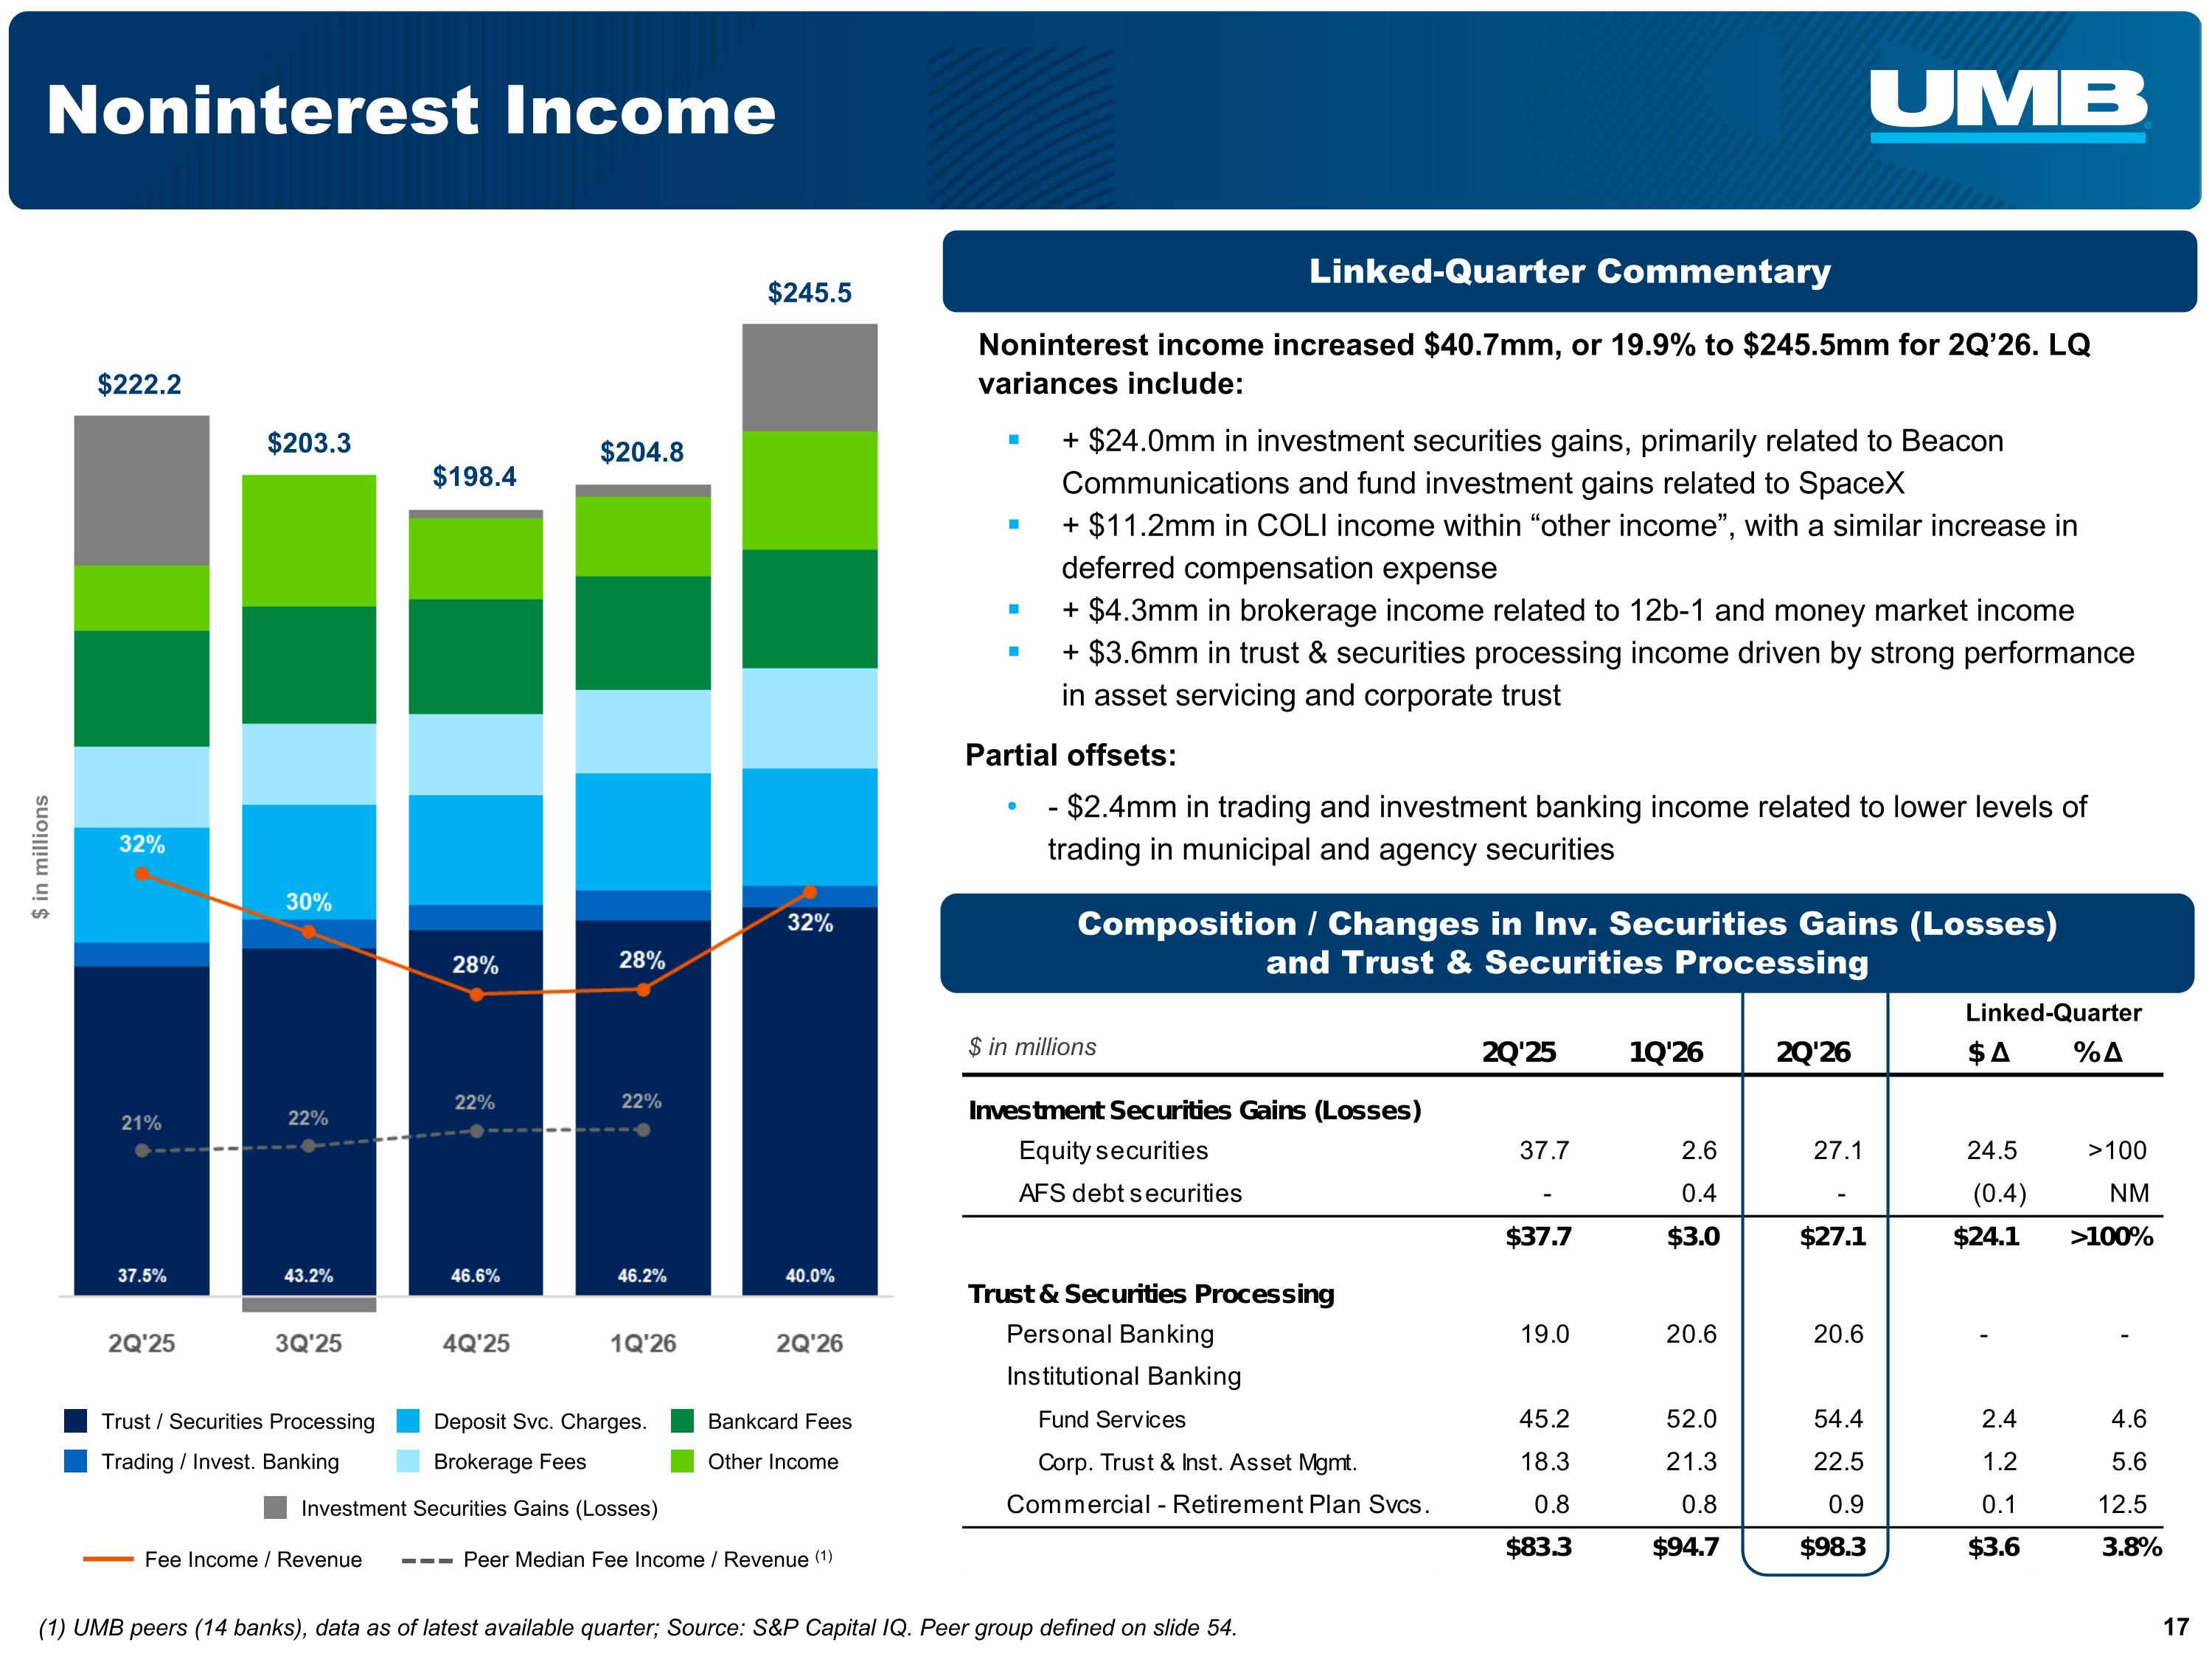
Noninterest Income Fee Income / Revenue Peer Median Fee Income / Revenue (1) (1) UMB peers (14 banks), data as of latest available quarter; Source: S&P Capital IQ. Peer group defined on slide 54. Investment Securities Gains (Losses) Brokerage Fees Trust / Securities Processing Bankcard Fees Trading / Invest. Banking Other Income Deposit Svc. Charges. $204.8 $245.5 $222.2 $203.3 $198.4 Composition / Changes in Inv. Securities Gains (Losses) and Trust & Securities Processing Linked-Quarter Commentary $ in millions $ in millions Linked-Quarter Noninterest income increased $40.7mm, or 19.9% to $245.5mm for 2Q’26. LQ variances include: + $24.0mm in investment securities gains, primarily related to Beacon Communications and fund investment gains related to SpaceX + $11.2mm in COLI income within “other income”, with a similar increase in deferred compensation expense + $4.3mm in brokerage income related to 12b-1 and money market income + $3.6mm in trust & securities processing income driven by strong performance in asset servicing and corporate trust Partial offsets: - $2.4mm in trading and investment banking income related to lower levels of trading in municipal and agency securities
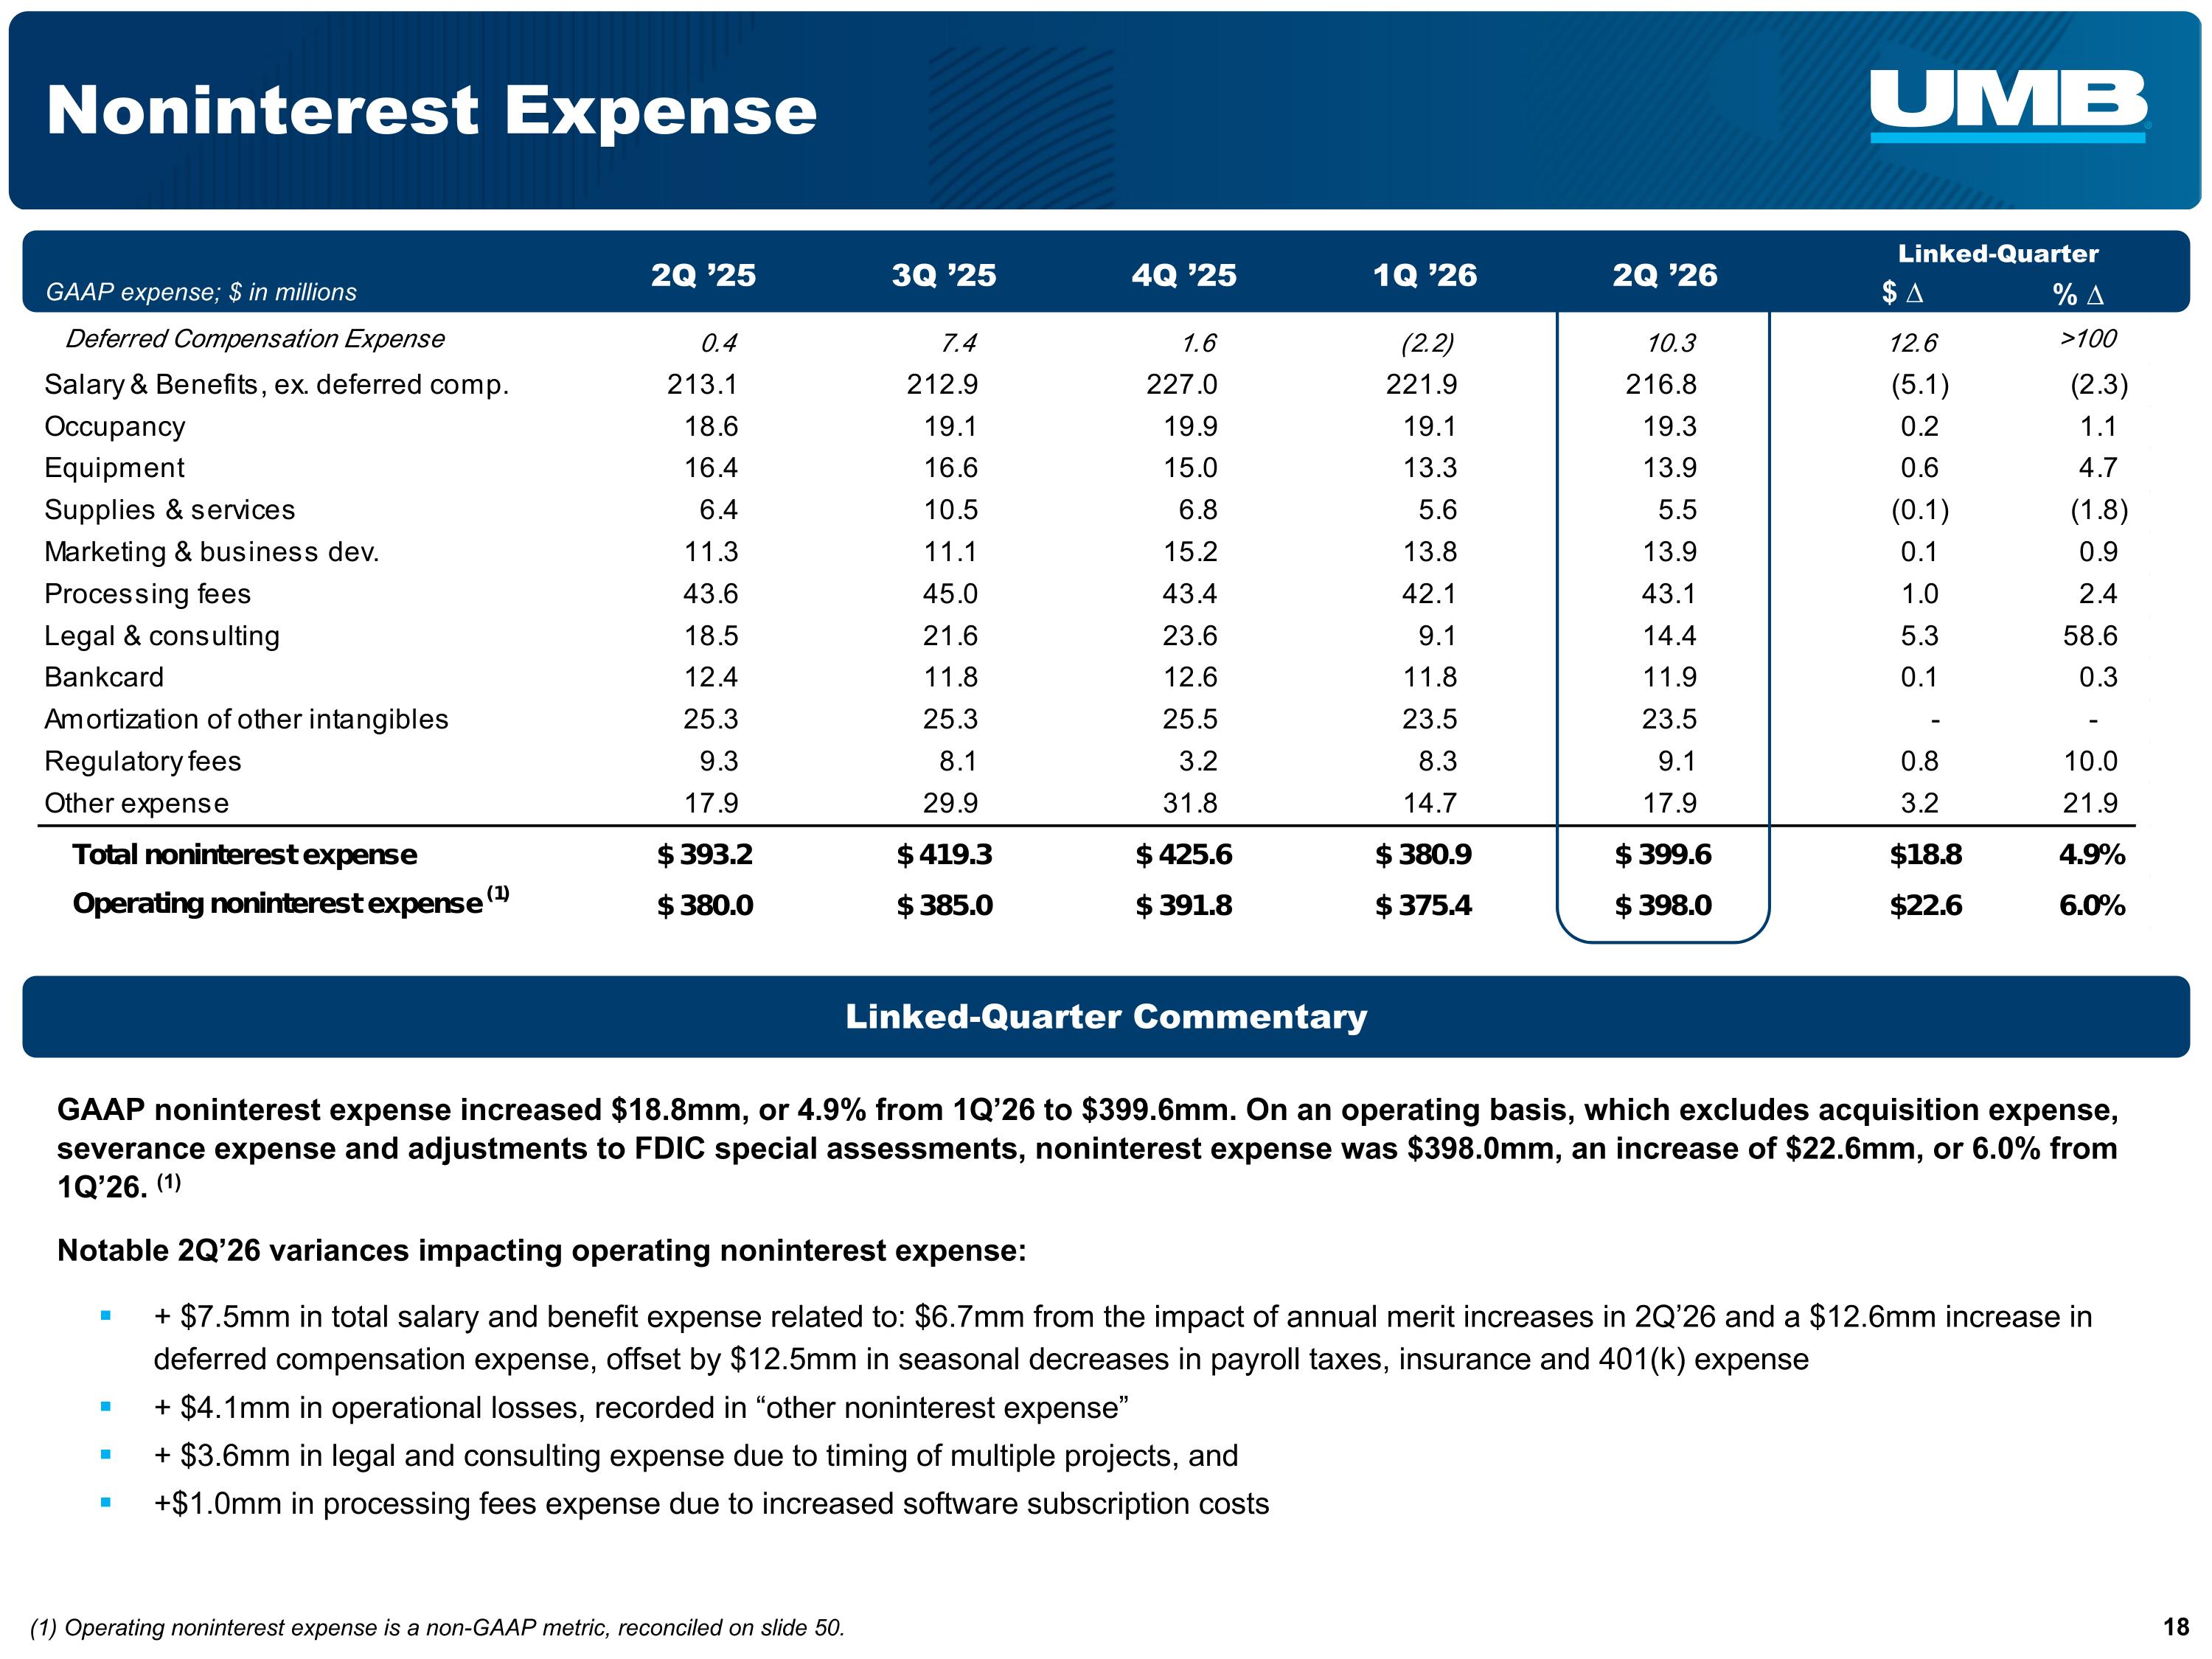
Noninterest Expense (1) Operating noninterest expense is a non-GAAP metric, reconciled on slide 50. Linked-Quarter Commentary 2Q ’25 3Q ’25 4Q ’25 1Q ’26 2Q ’26 GAAP expense; $ in millions Linked-Quarter $ ∆ % ∆ GAAP noninterest expense increased $18.8mm, or 4.9% from 1Q’26 to $399.6mm. On an operating basis, which excludes acquisition expense, severance expense and adjustments to FDIC special assessments, noninterest expense was $398.0mm, an increase of $22.6mm, or 6.0% from 1Q’26. (1) Notable 2Q’26 variances impacting operating noninterest expense: + $7.5mm in total salary and benefit expense related to: $6.7mm from the impact of annual merit increases in 2Q’26 and a $12.6mm increase in deferred compensation expense, offset by $12.5mm in seasonal decreases in payroll taxes, insurance and 401(k) expense + $4.1mm in operational losses, recorded in “other noninterest expense” + $3.6mm in legal and consulting expense due to timing of multiple projects, and +$1.0mm in processing fees expense due to increased software subscription costs
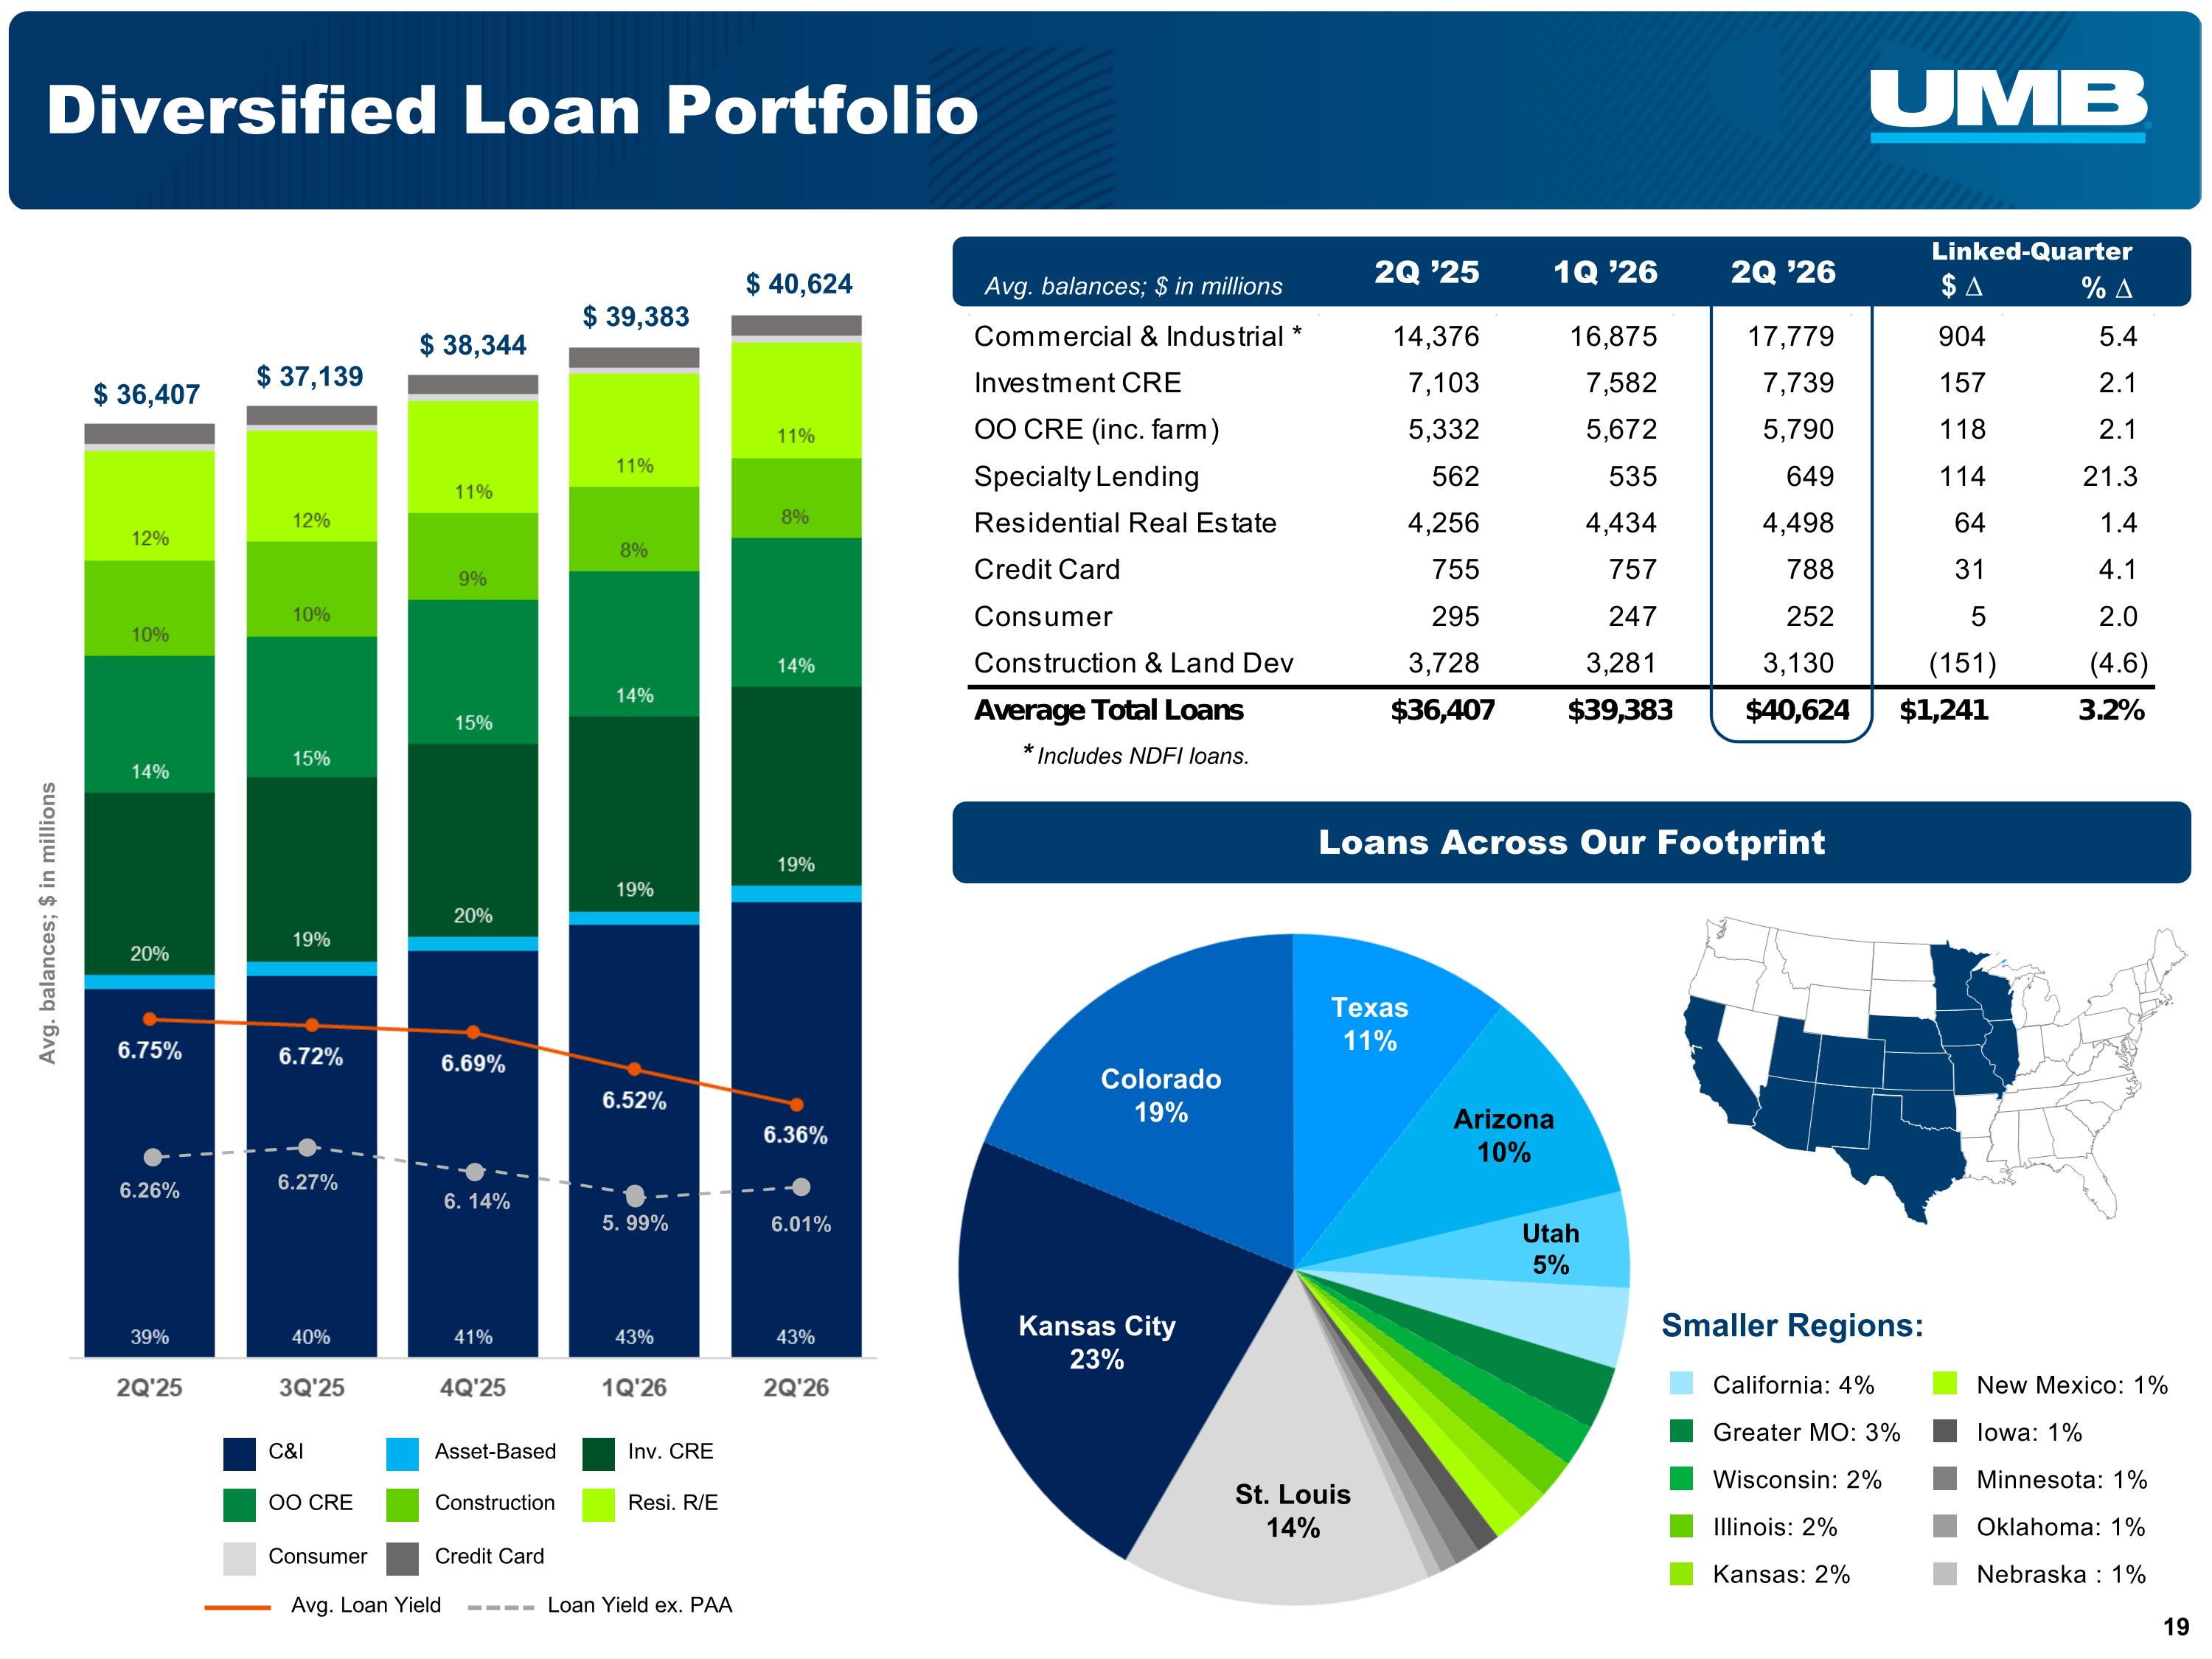
$ 37,139 $ 38,344 $ 39,383 $ 40,624 Diversified Loan Portfolio $ 36,407 2Q ’25 1Q ’26 2Q ’26 Linked-Quarter $ ∆ California: 4% Greater MO: 3% Wisconsin: 2% Illinois: 2% Kansas: 2% New Mexico: 1% Iowa: 1% Minnesota: 1% Oklahoma: 1% Nebraska : 1% Smaller Regions: Loans Across Our Footprint Avg. balances; $ in millions Avg. balances; $ in millions Inv. CRE Asset-Based C&I Resi. R/E Consumer Construction Credit Card Avg. Loan Yield Loan Yield ex. PAA OO CRE % ∆ * Includes NDFI loans. Kansas City 23% Colorado 19% Arizona 10% St. Louis 14% Texas 11% Utah 5% 6.01% 6.26% 6.27% 6. 14% 5. 99%
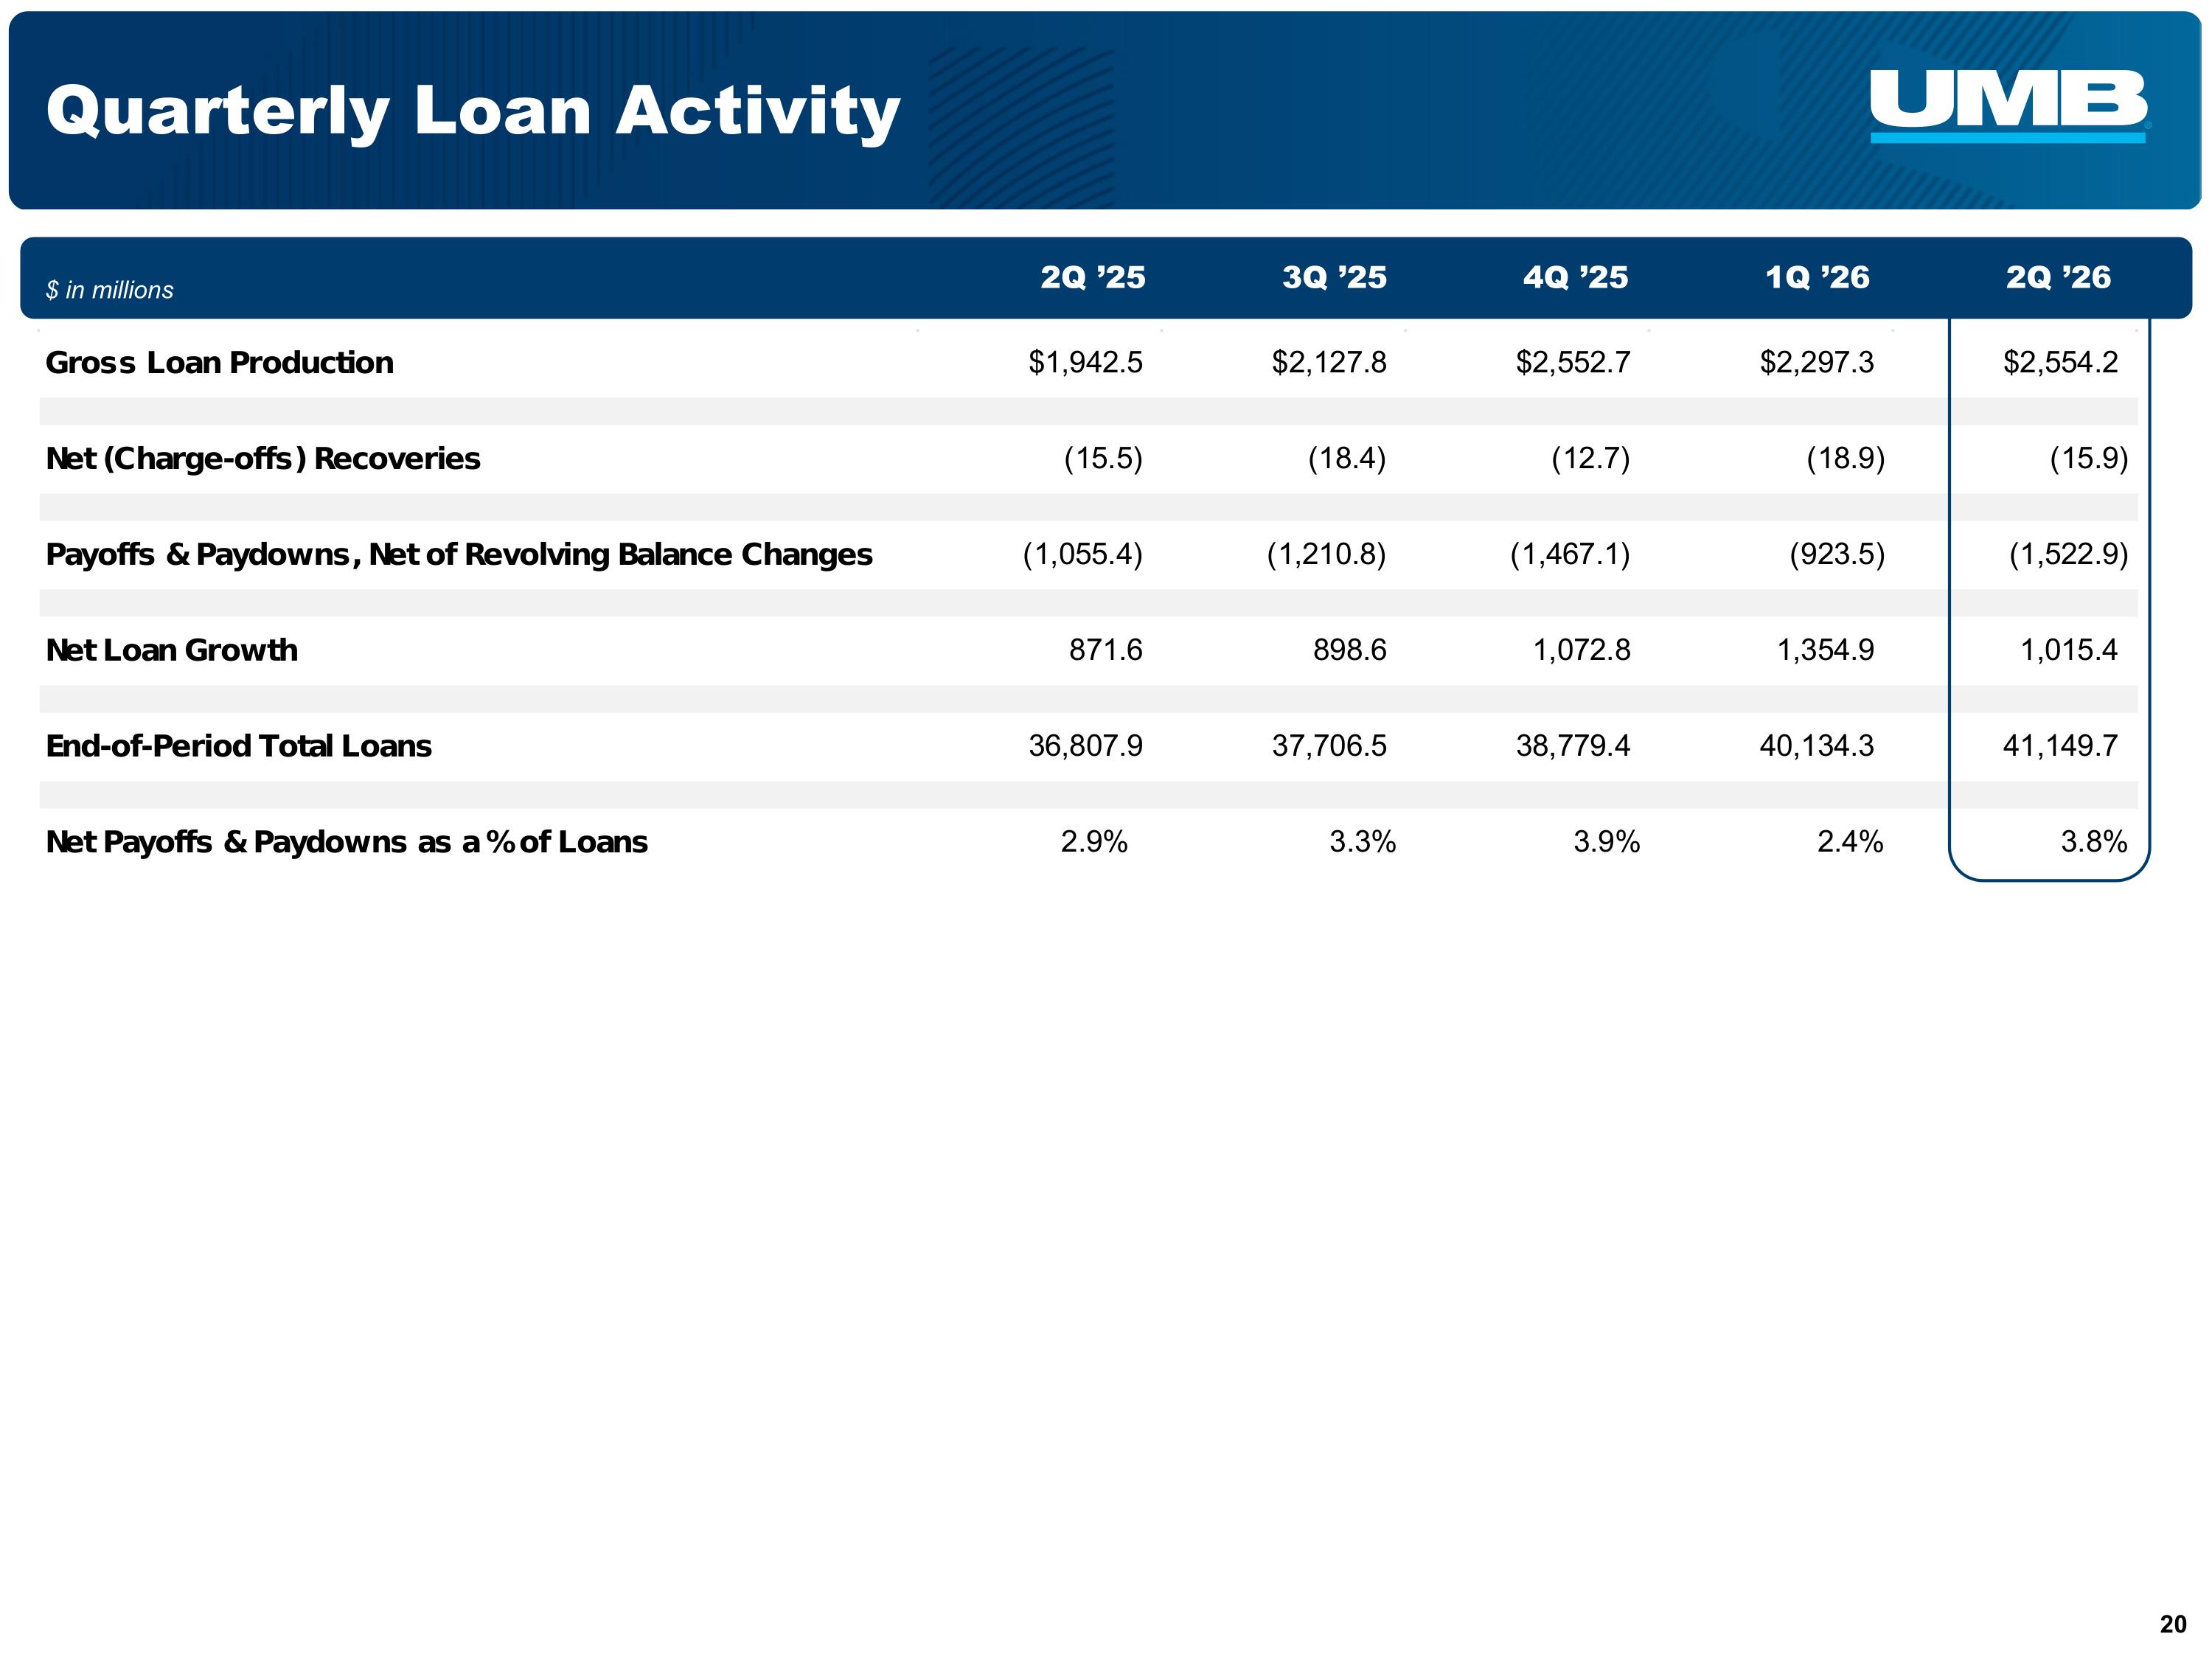
Quarterly Loan Activity 2Q ’26 1Q ’26 2Q ’25 3Q ’25 4Q ’25 $ in millions
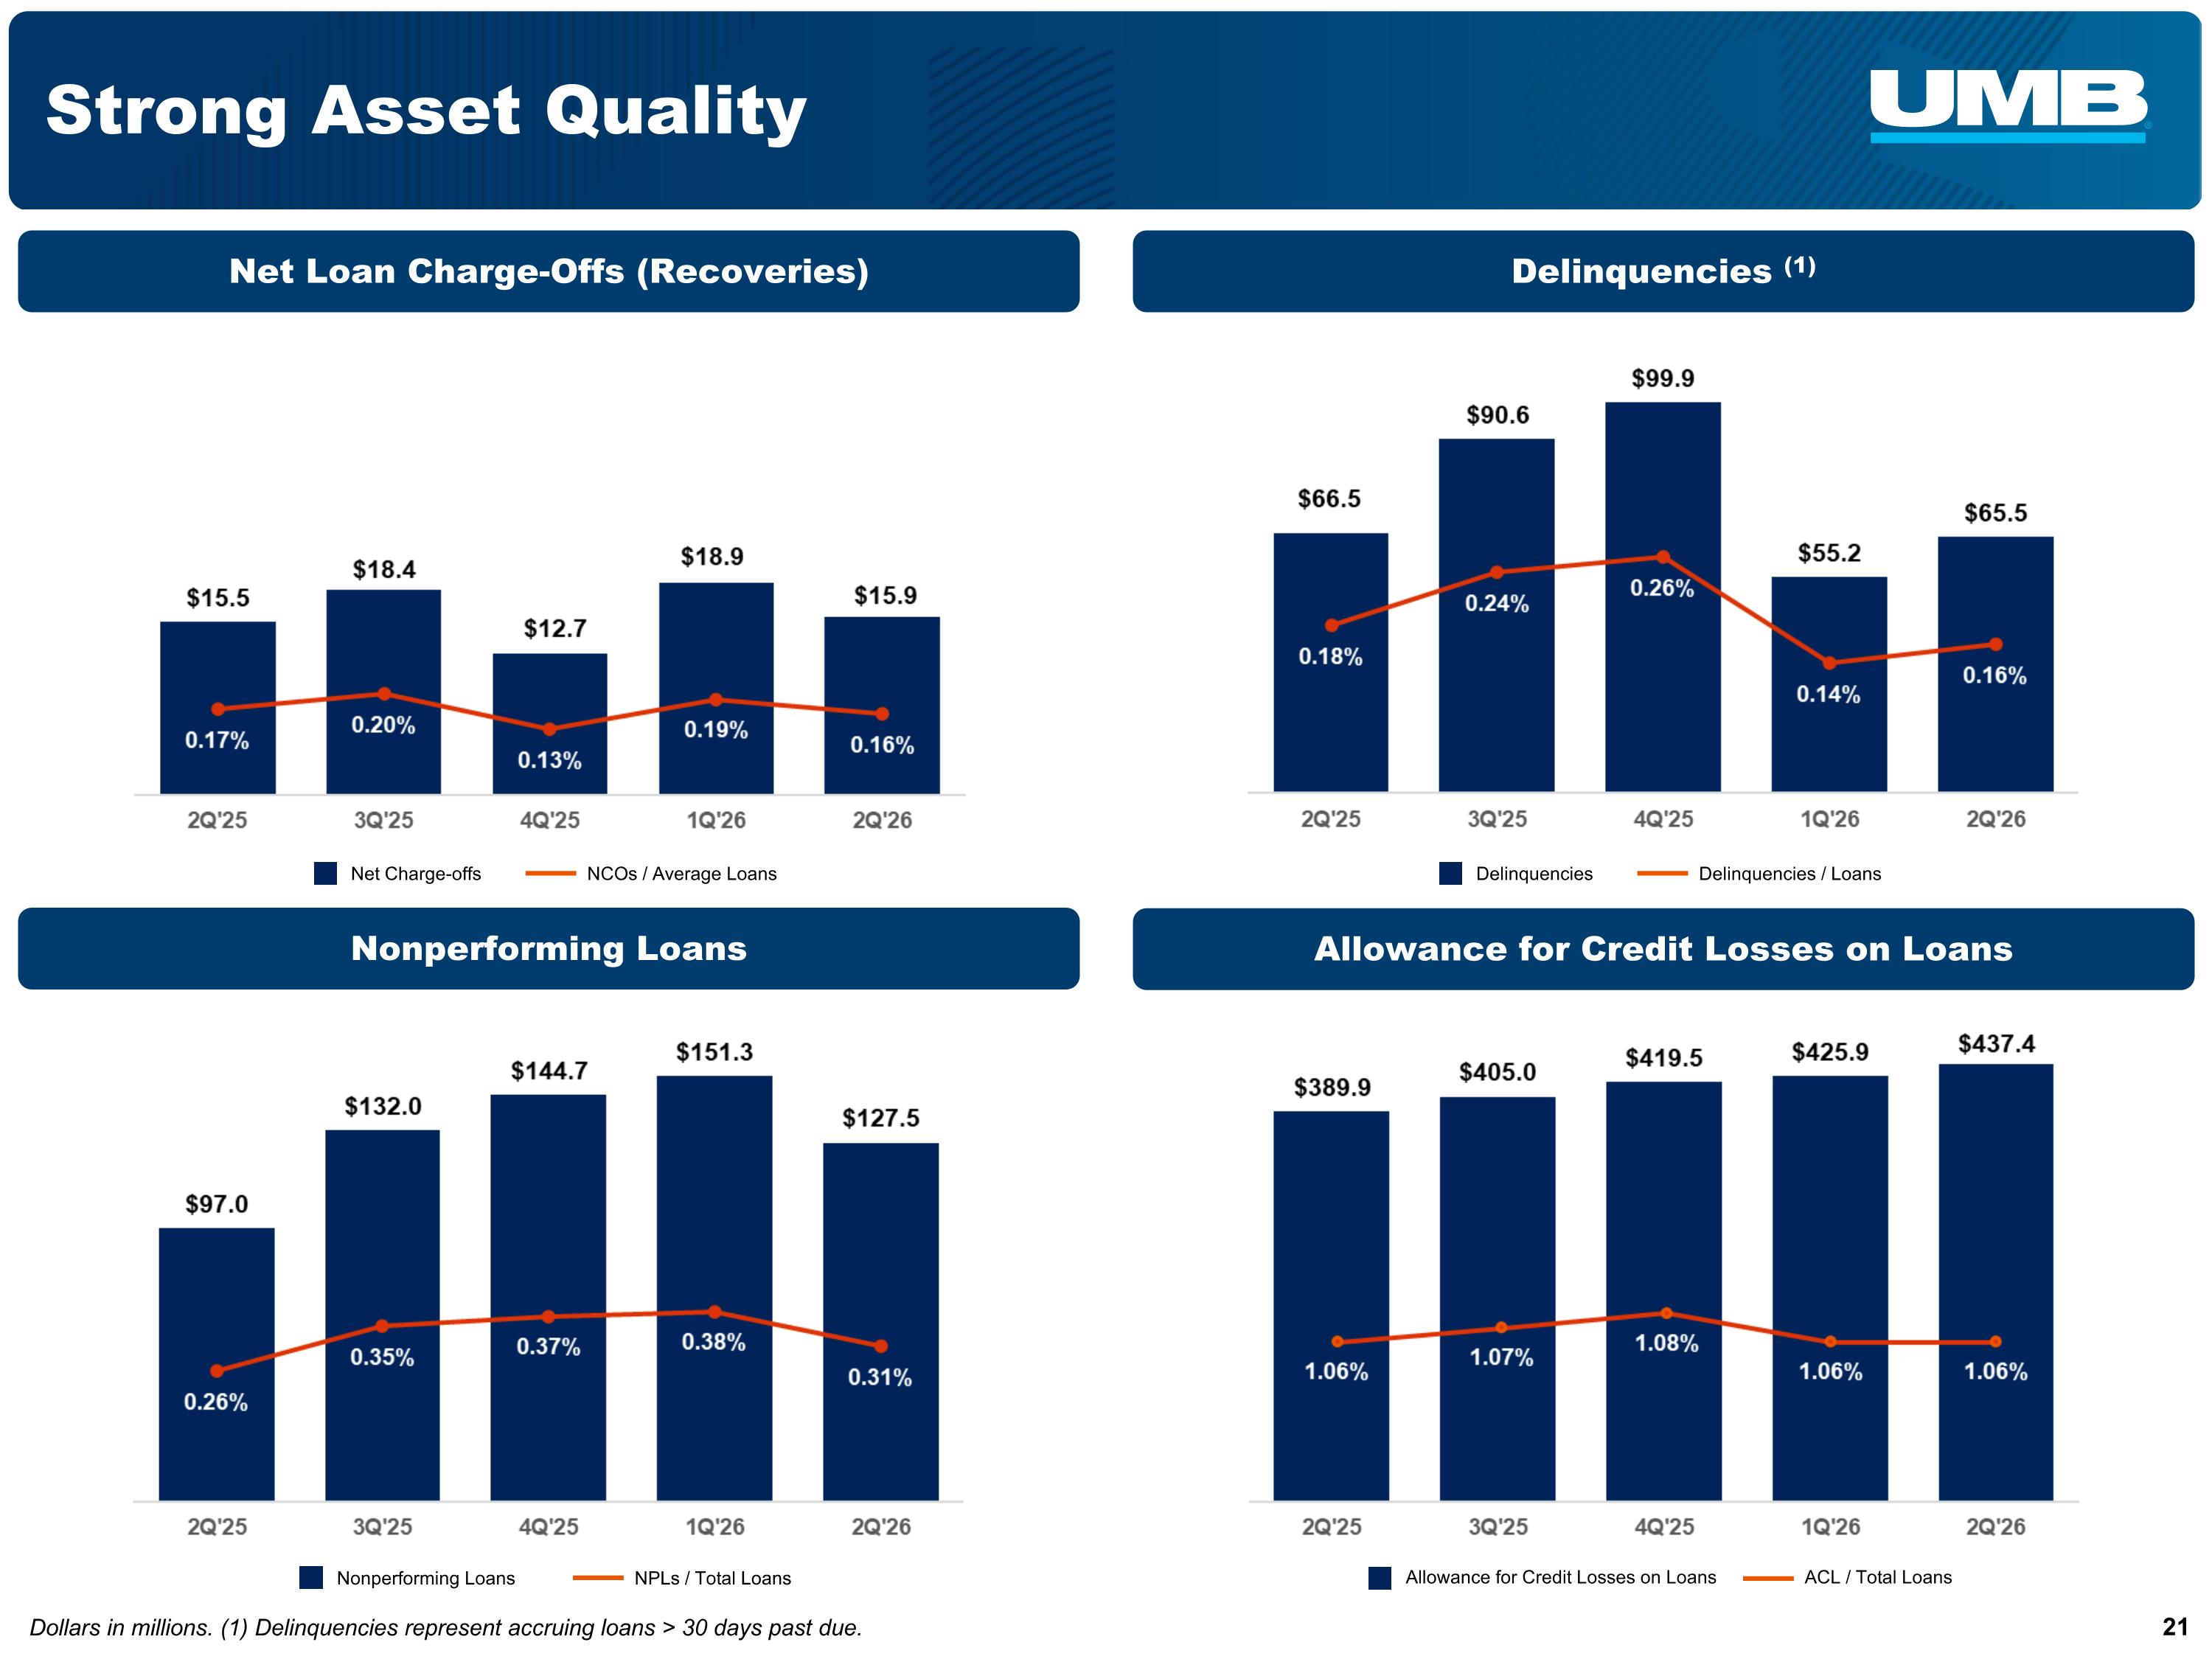
Strong Asset Quality Dollars in millions. (1) Delinquencies represent accruing loans > 30 days past due. Net Loan Charge-Offs (Recoveries) Delinquencies (1) Nonperforming Loans Allowance for Credit Losses on Loans Allowance for Credit Losses on Loans ACL / Total Loans Net Charge-offs NCOs / Average Loans Delinquencies Delinquencies / Loans Nonperforming Loans NPLs / Total Loans
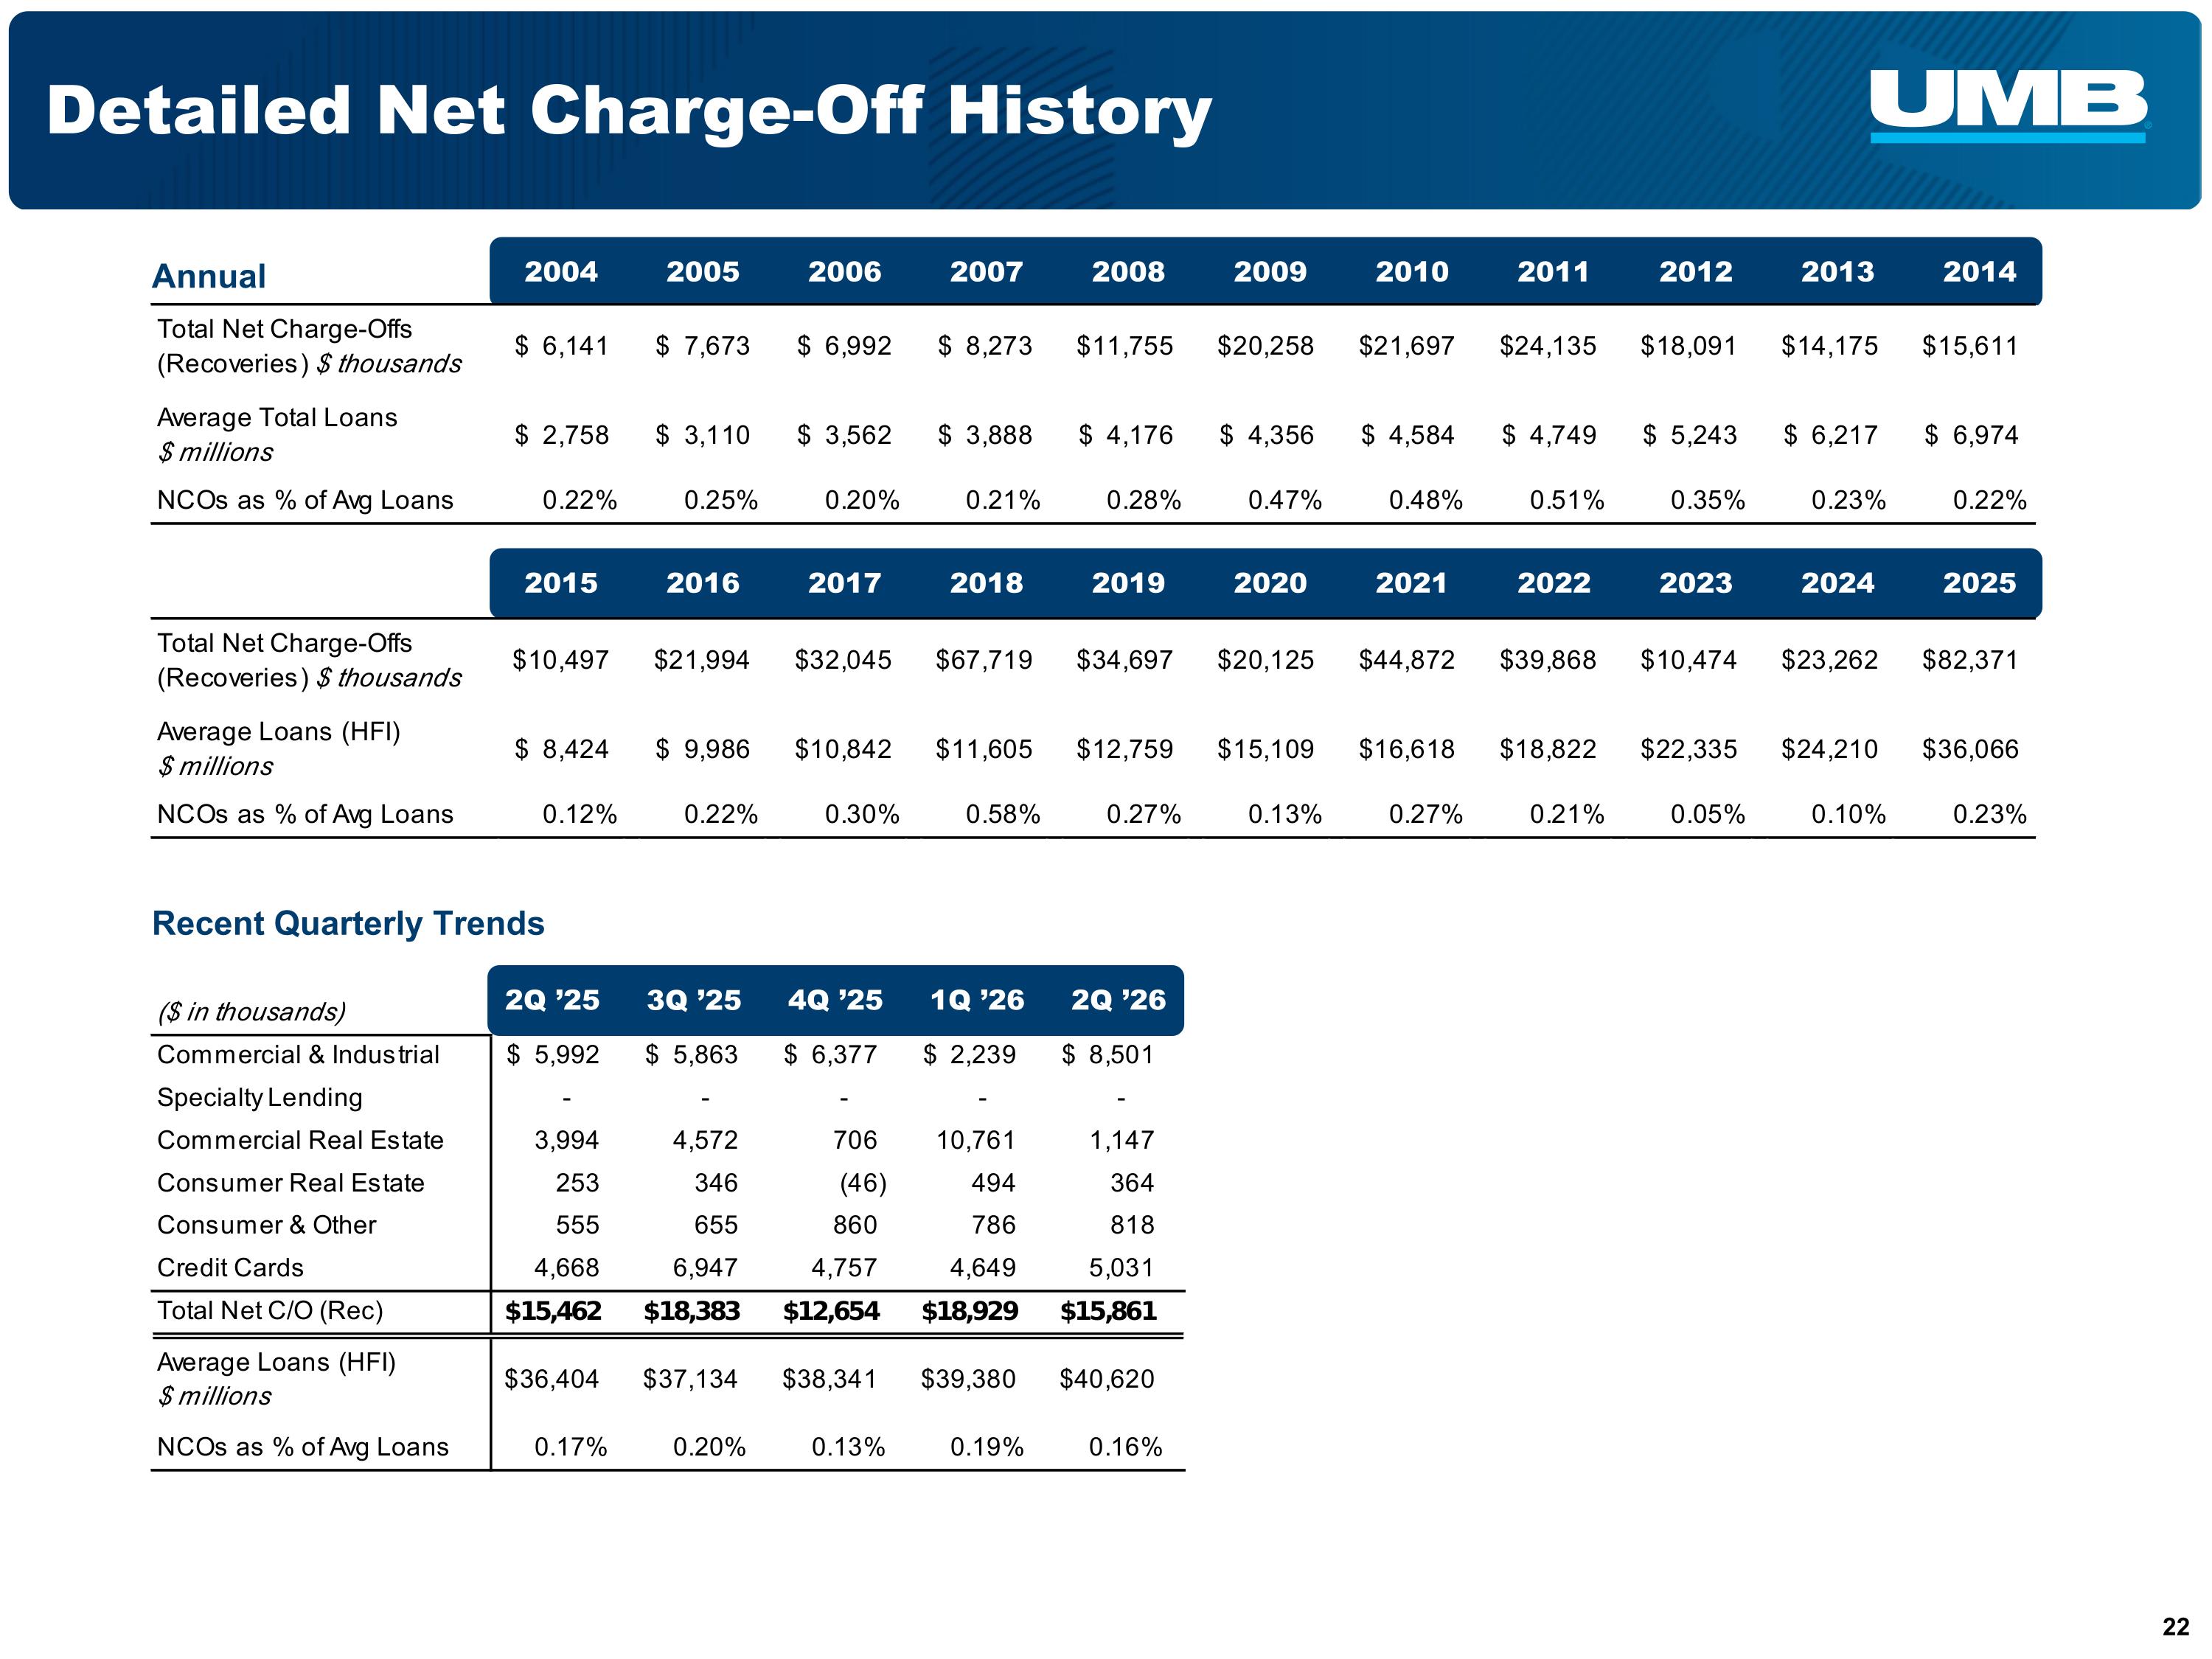
Detailed Net Charge-Off History Recent Quarterly Trends Annual 2009 2010 2008 2004 2005 2006 2007 2011 2012 2013 2014 2019 2020 2018 2015 2016 2017 2021 2022 2023 2024 2Q ’26 1Q ’26 2Q ’25 3Q ’25 4Q ’25 2025
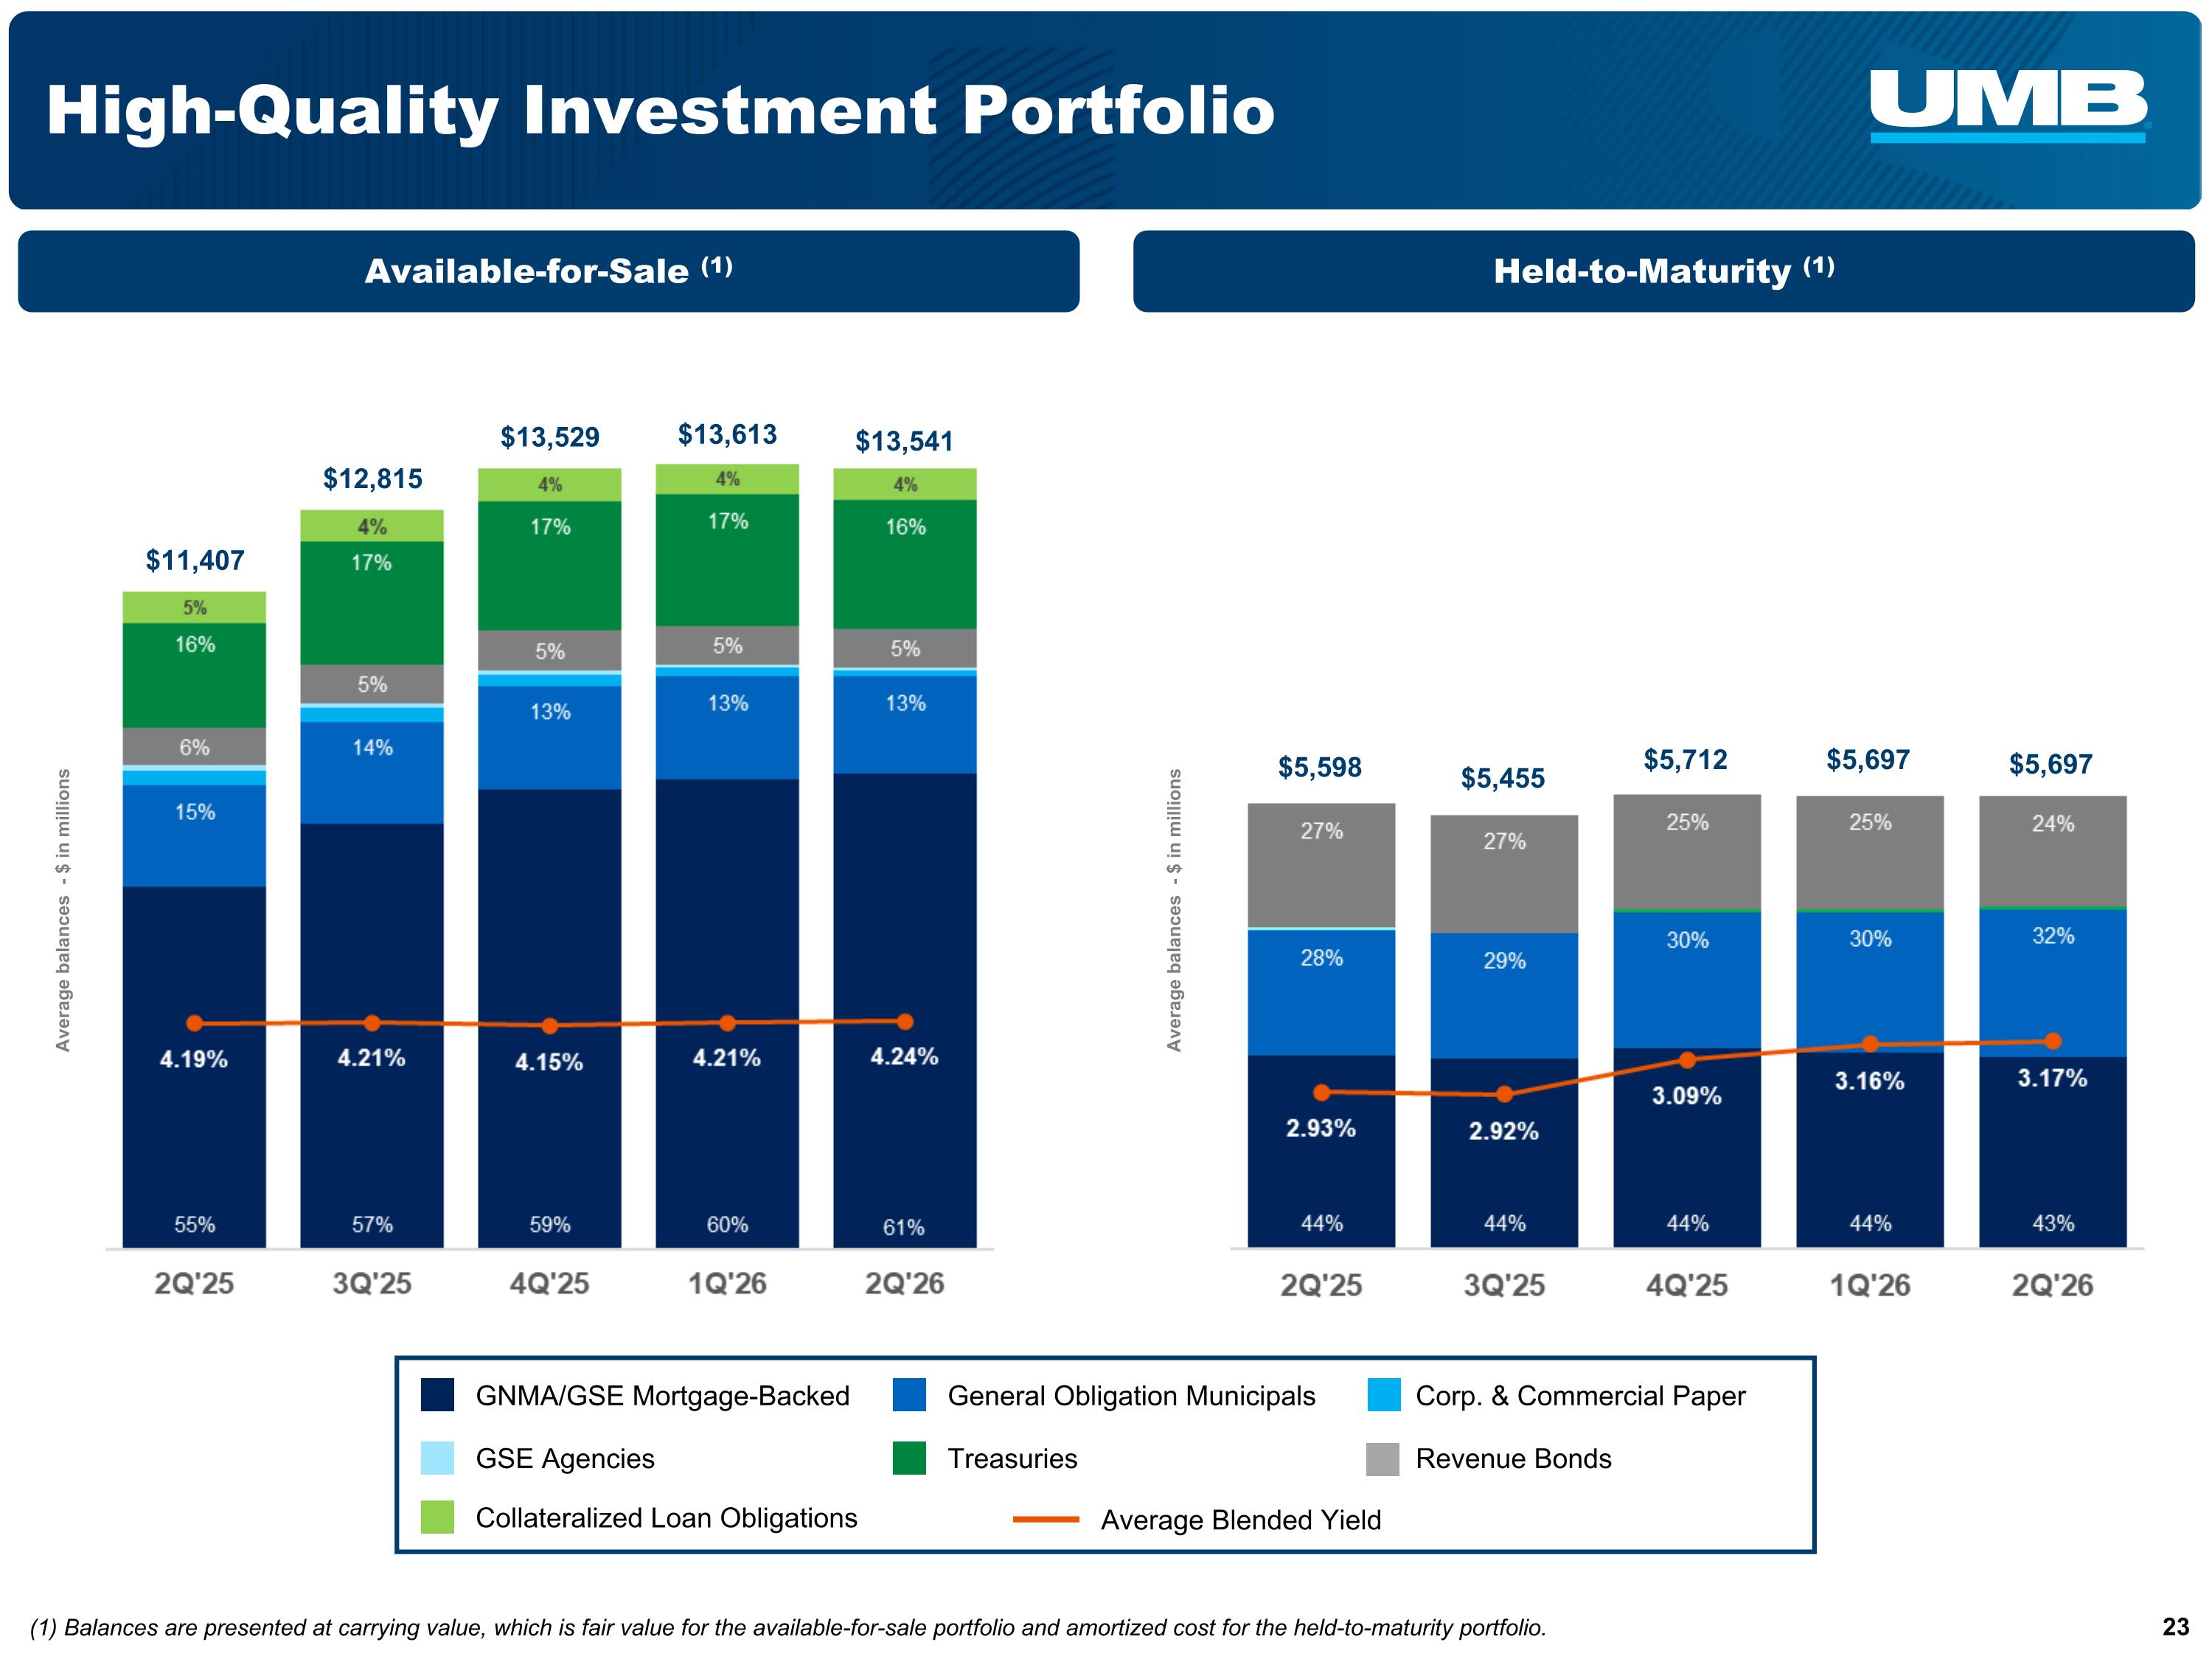
Available-for-Sale (1) High-Quality Investment Portfolio $13,613 $13,541 $11,407 $12,815 $5,697 $5,697 $5,598 $5,712 Average balances - $ in millions Average Blended Yield Treasuries Corp. & Commercial Paper GNMA/GSE Mortgage-Backed GSE Agencies General Obligation Municipals Collateralized Loan Obligations Revenue Bonds $13,529 (1) Balances are presented at carrying value, which is fair value for the available-for-sale portfolio and amortized cost for the held-to-maturity portfolio. Average balances - $ in millions Held-to-Maturity (1) $5,455
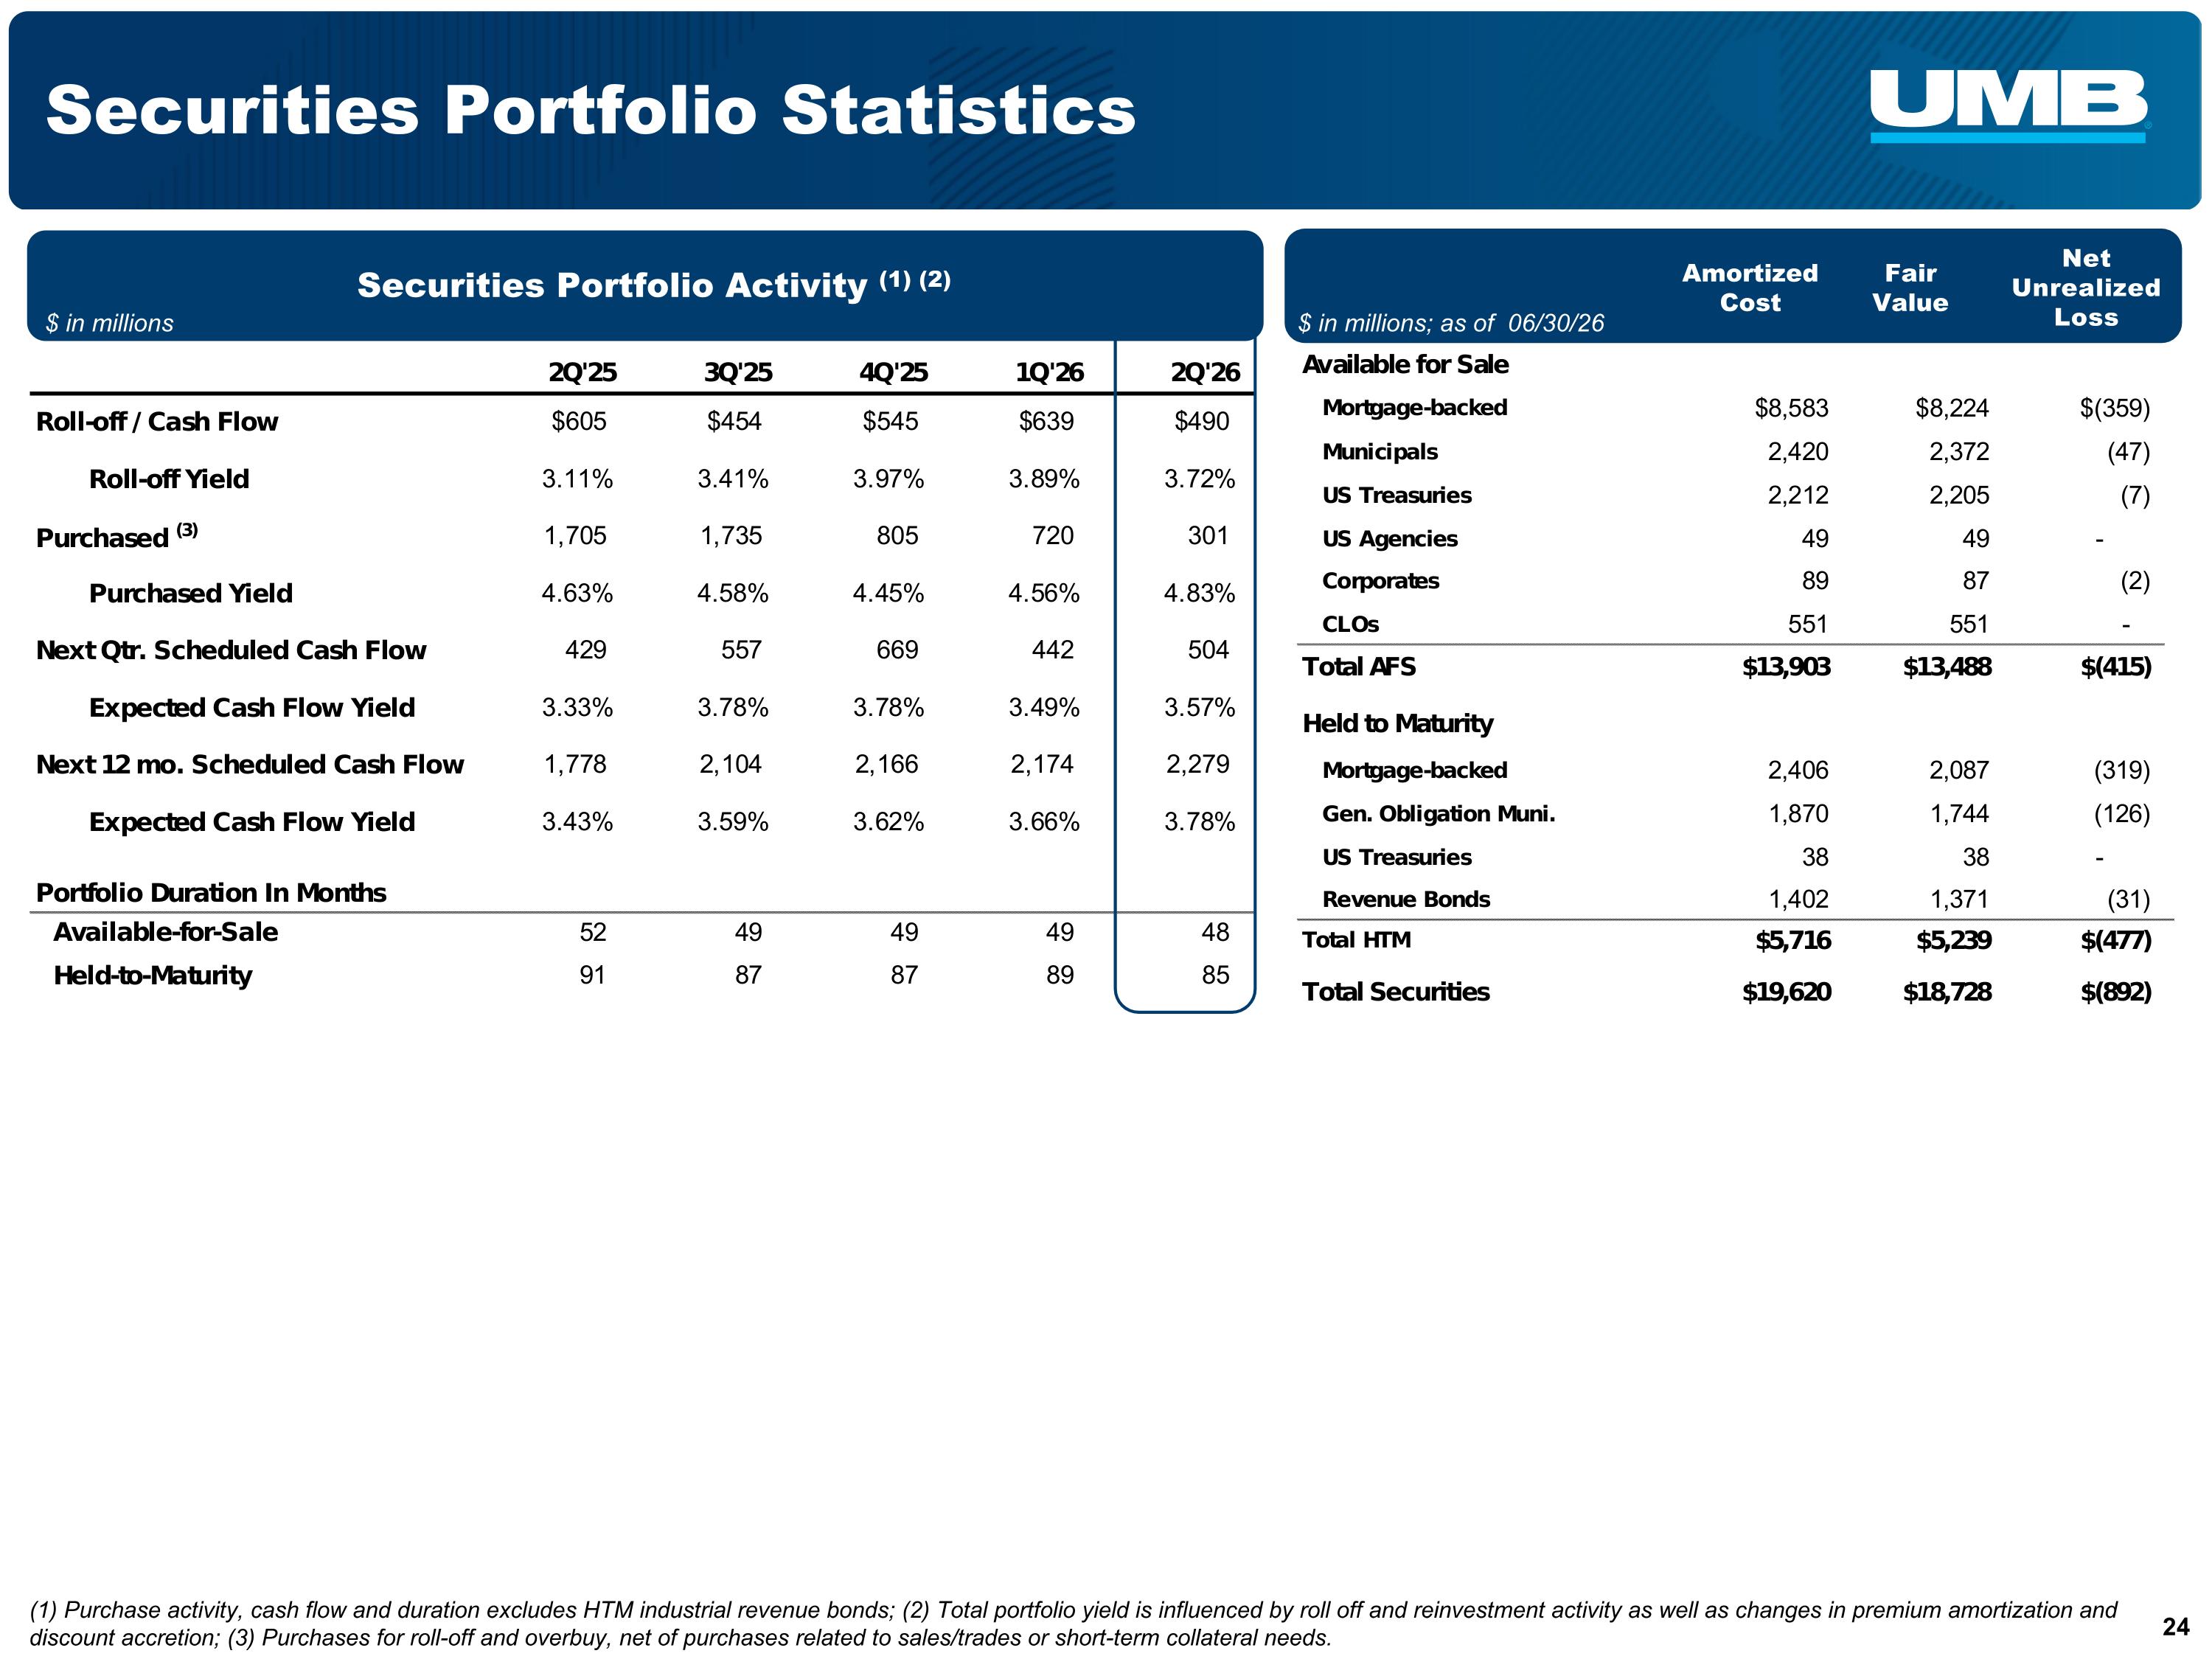
Securities Portfolio Statistics Amortized Cost Fair Value Net Unrealized Loss $ in millions; as of 06/30/26 (1) Purchase activity, cash flow and duration excludes HTM industrial revenue bonds; (2) Total portfolio yield is influenced by roll off and reinvestment activity as well as changes in premium amortization and discount accretion; (3) Purchases for roll-off and overbuy, net of purchases related to sales/trades or short-term collateral needs. Securities Portfolio Activity (1) (2) $ in millions
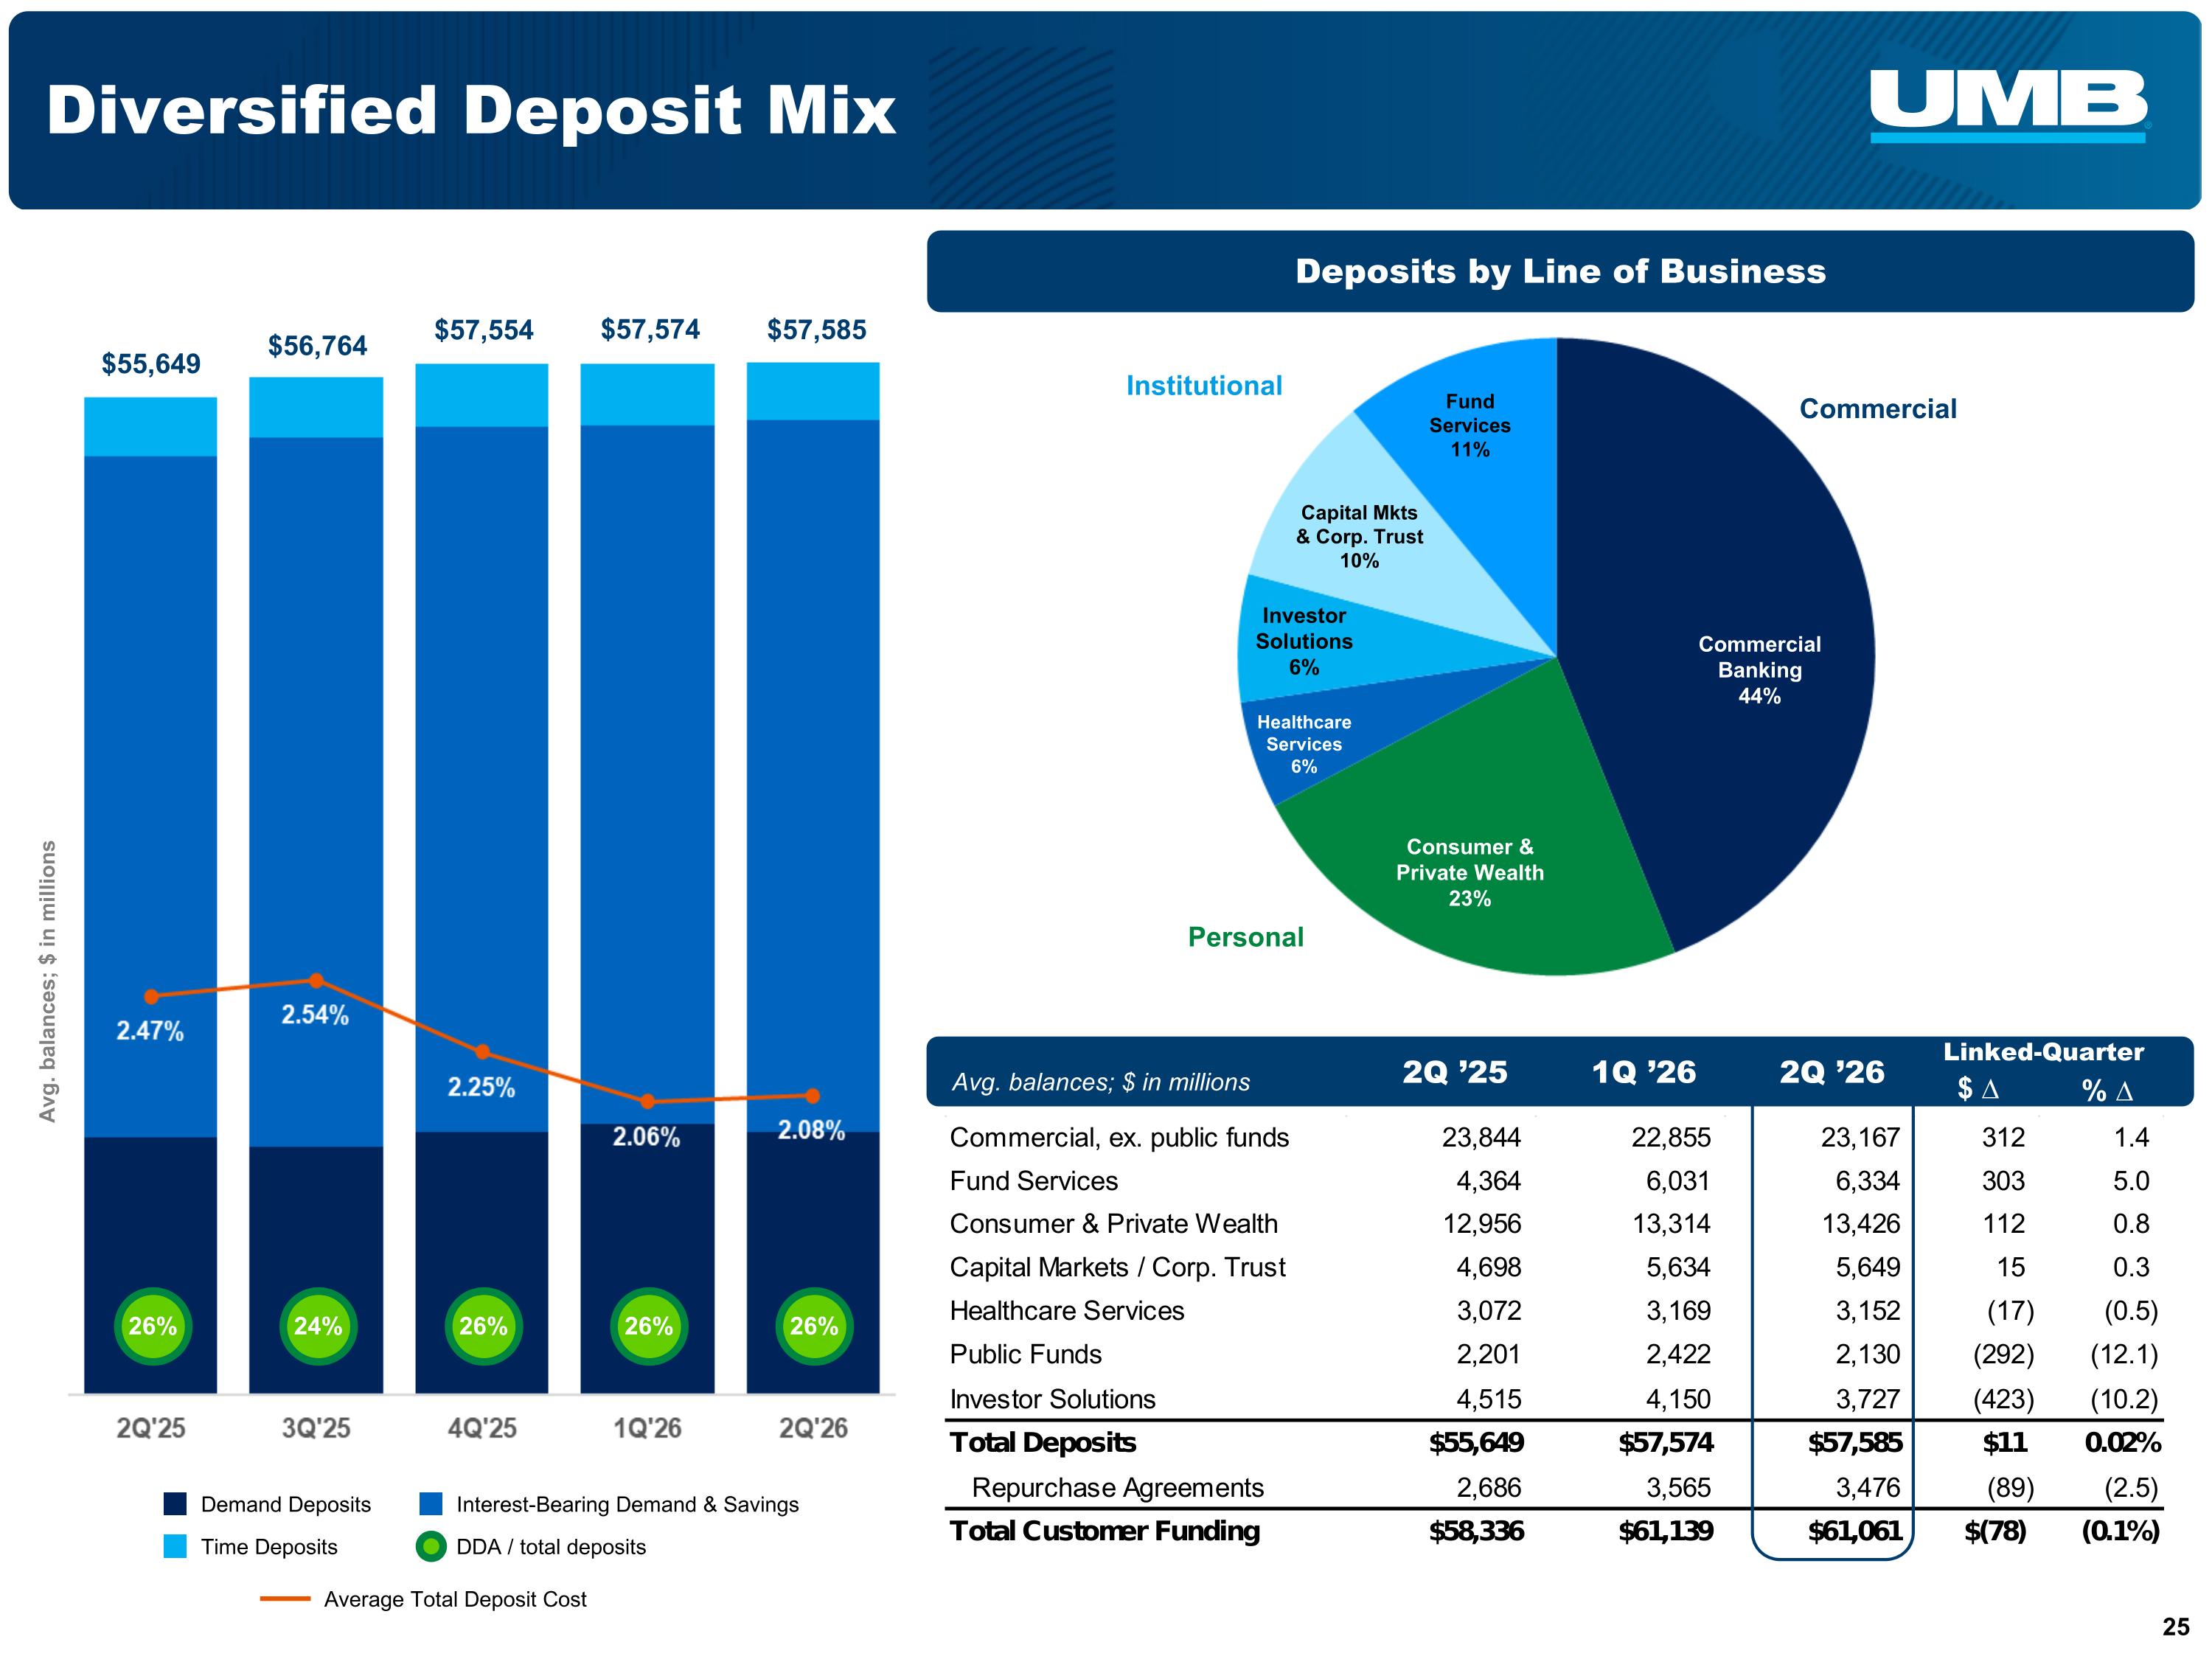
Diversified Deposit Mix $57,574 $55,649 $56,764 $57,554 Commercial Personal Institutional Commercial Banking 44% Consumer & Private Wealth 23% Capital Mkts & Corp. Trust 10% Healthcare Services 6% Fund Services 11% Investor Solutions 6% 26% 24% 26% 26% $57,585 Deposits by Line of Business Interest-Bearing Demand & Savings Demand Deposits Time Deposits DDA / total deposits Average Total Deposit Cost Avg. balances; $ in millions 26% 2Q ’25 1Q ’26 2Q ’26 Linked-Quarter $ ∆ Avg. balances; $ in millions % ∆
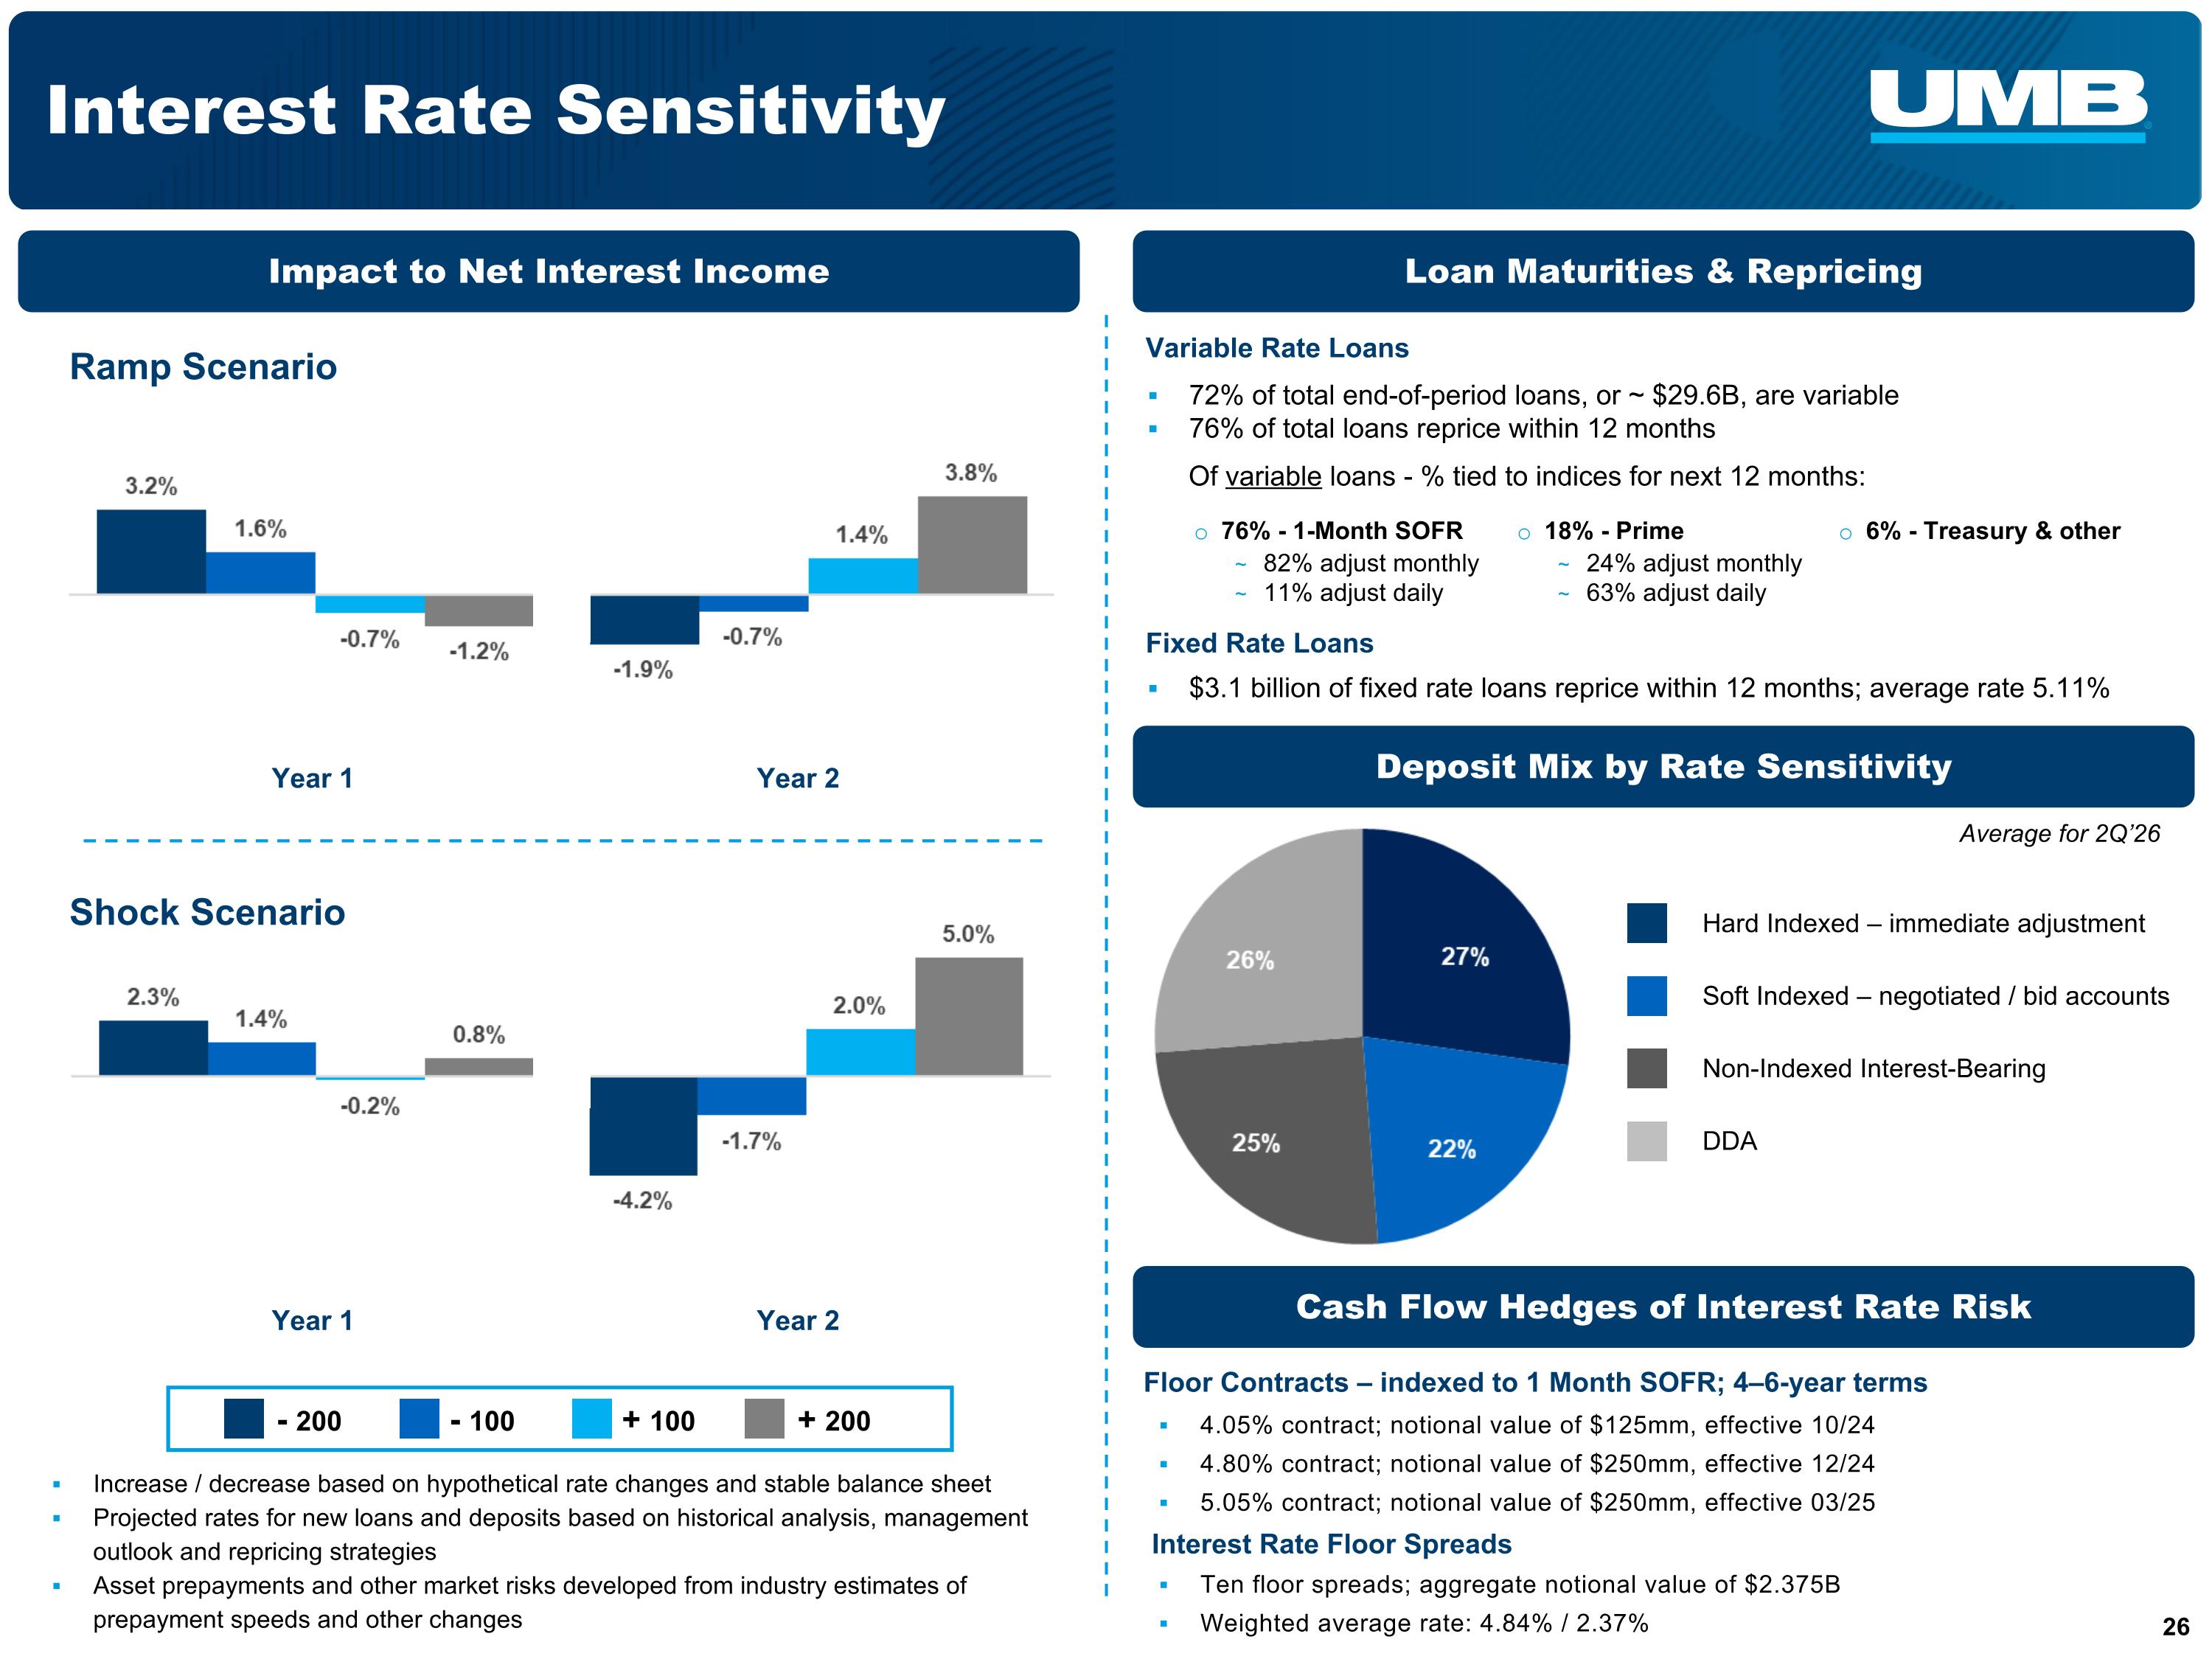
Interest Rate Sensitivity Increase / decrease based on hypothetical rate changes and stable balance sheet Projected rates for new loans and deposits based on historical analysis, management outlook and repricing strategies Asset prepayments and other market risks developed from industry estimates of prepayment speeds and other changes Ramp Scenario 72% of total end-of-period loans, or ~ $29.6B, are variable 76% of total loans reprice within 12 months Of variable loans - % tied to indices for next 12 months: Year 2 Year 1 - 200 - 100 + 100 + 200 Shock Scenario Year 2 Year 1 76% - 1-Month SOFR 82% adjust monthly 11% adjust daily 18% - Prime 24% adjust monthly 63% adjust daily Floor Contracts – indexed to 1 Month SOFR; 4–6-year terms Interest Rate Floor Spreads Impact to Net Interest Income Loan Maturities & Repricing Cash Flow Hedges of Interest Rate Risk 6% - Treasury & other 4.05% contract; notional value of $125mm, effective 10/24 4.80% contract; notional value of $250mm, effective 12/24 5.05% contract; notional value of $250mm, effective 03/25 Ten floor spreads; aggregate notional value of $2.375B Weighted average rate: 4.84% / 2.37% Deposit Mix by Rate Sensitivity Fixed Rate Loans Variable Rate Loans Hard Indexed – immediate adjustment Soft Indexed – negotiated / bid accounts Non-Indexed Interest-Bearing DDA $3.1 billion of fixed rate loans reprice within 12 months; average rate 5.11% Average for 2Q’26
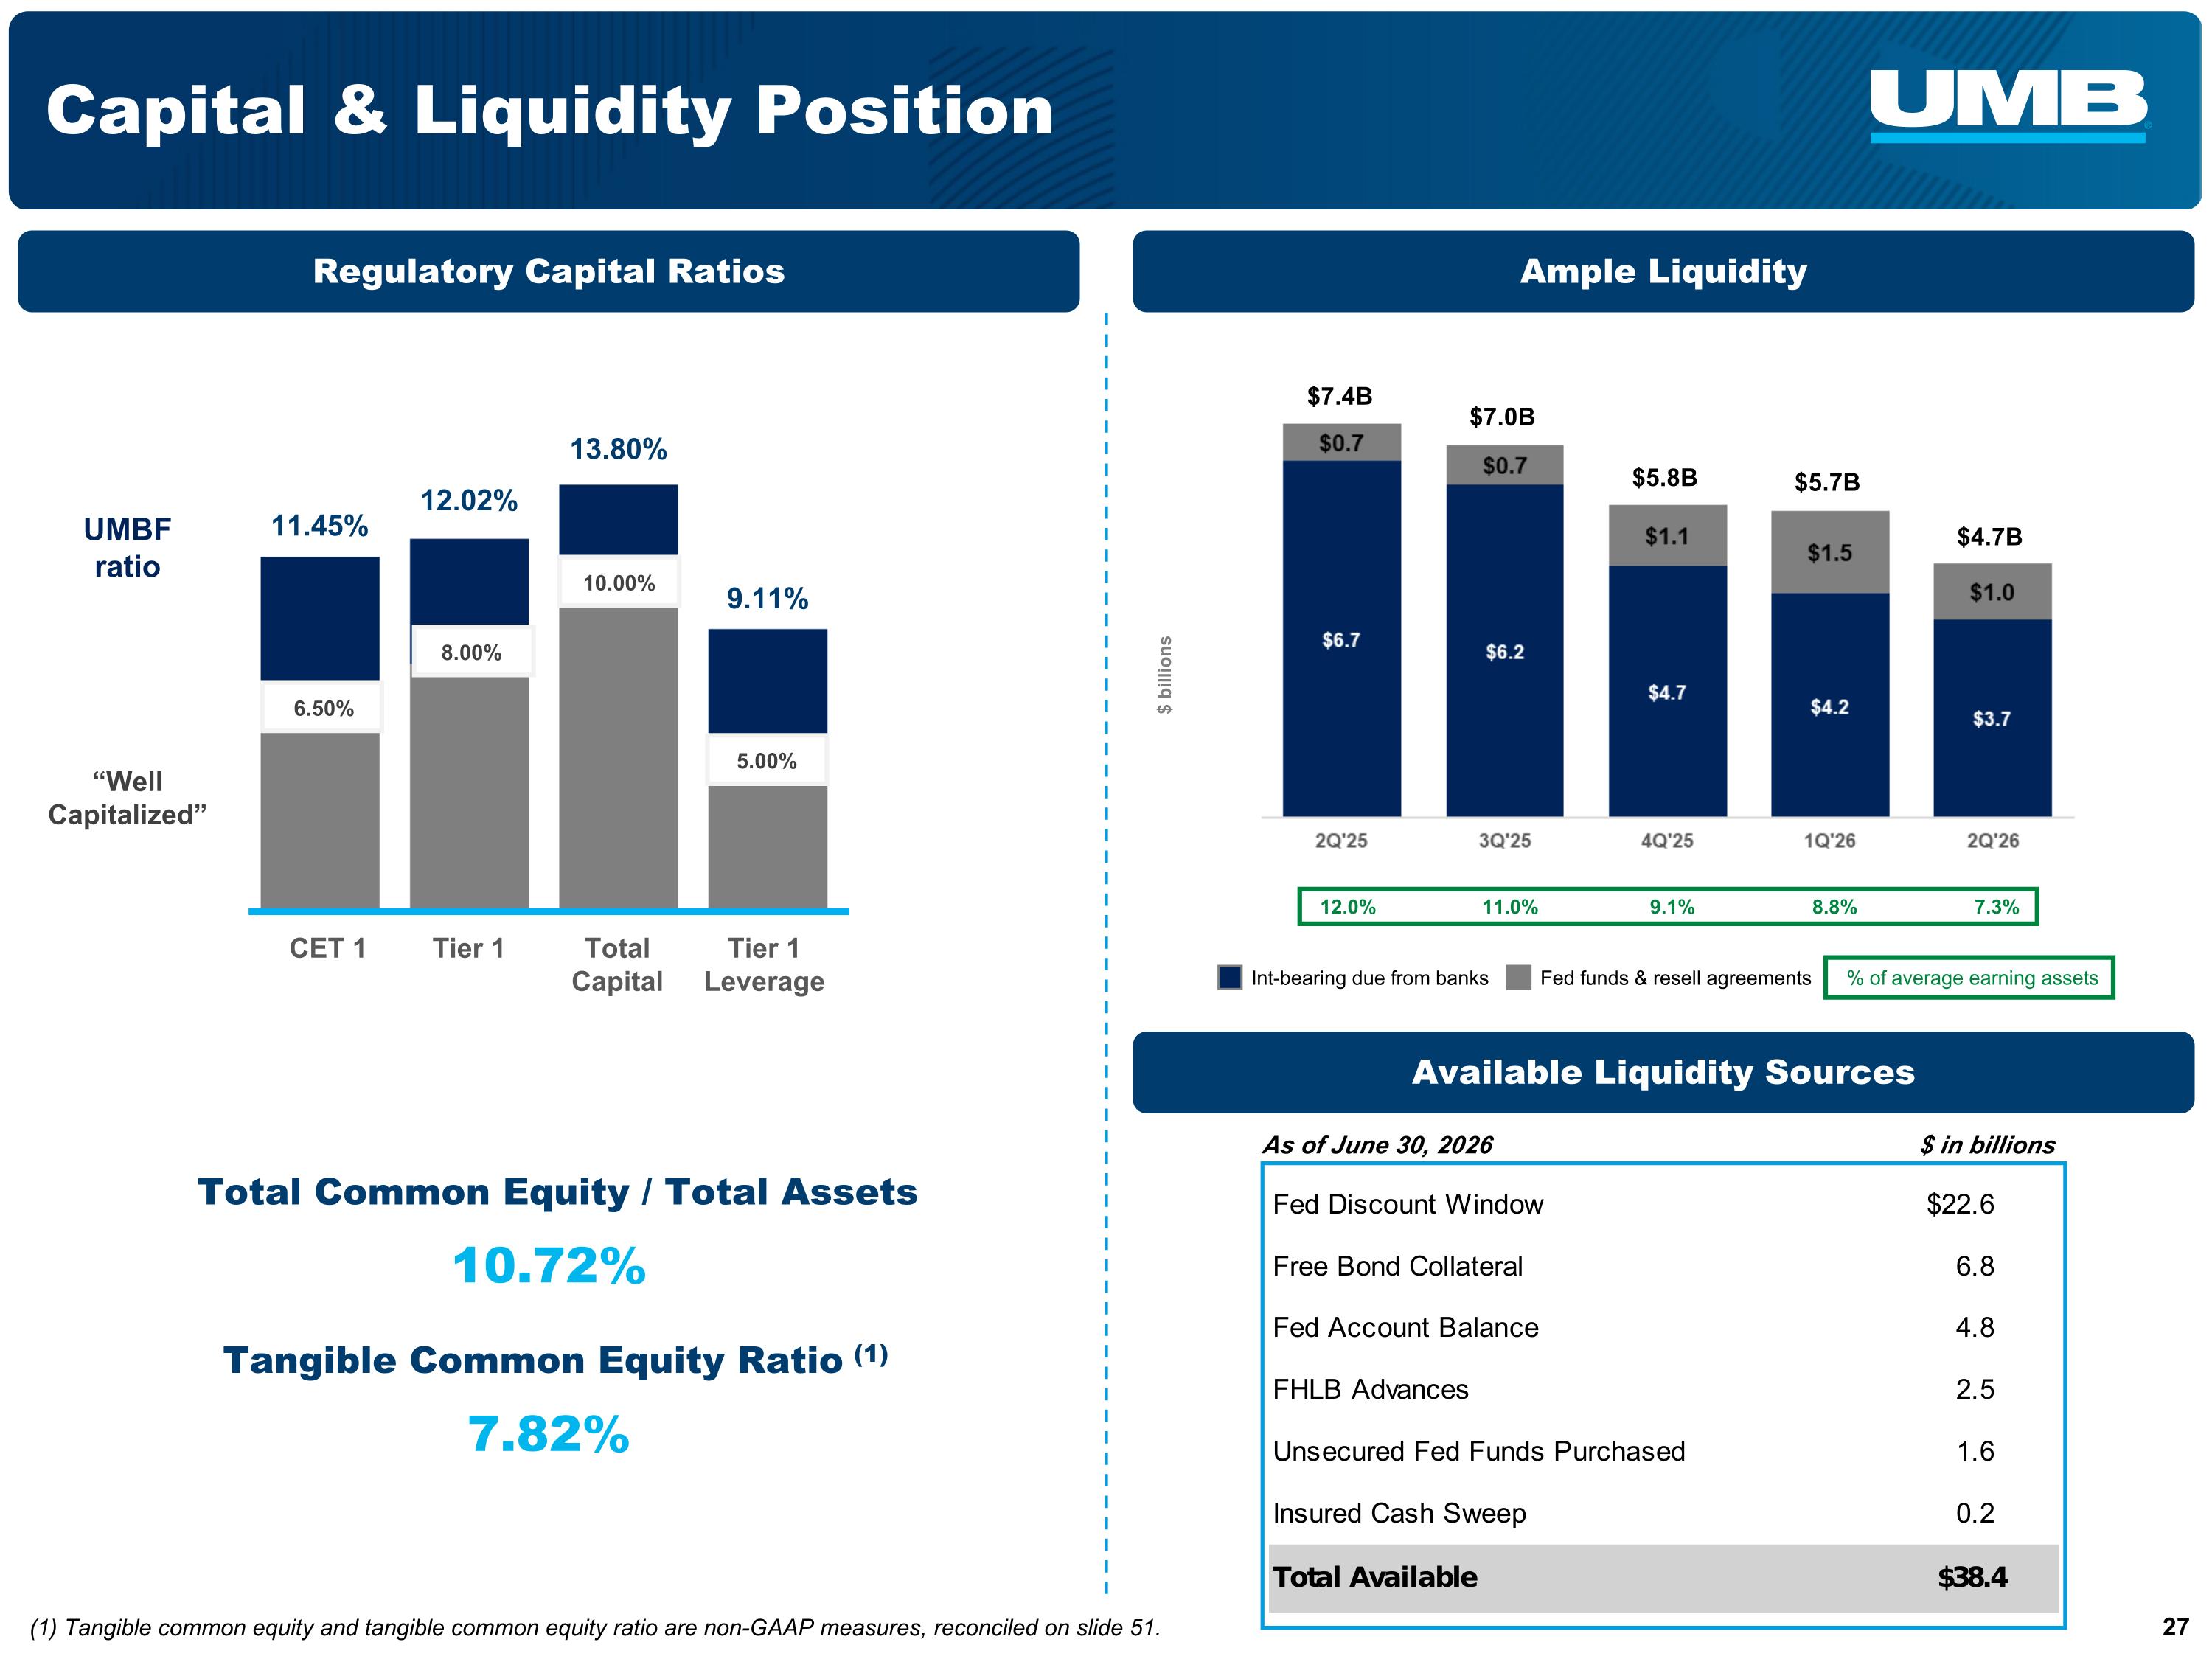
Capital & Liquidity Position As of June 30, 2026 $ in billions CET 1 Total Capital Tier 1 Leverage Tangible Common Equity Ratio (1) 7.82% Total Common Equity / Total Assets 10.72% 6.50% 10.00% 5.00% (1) Tangible common equity and tangible common equity ratio are non-GAAP measures, reconciled on slide 51. 13.80% 11.45% 9.11% Regulatory Capital Ratios Ample Liquidity Available Liquidity Sources $4.7B $7.4B $7.0B $5.8B $5.7B 8.8% 7.3% 12.0% 11.0% 9.1% Fed funds & resell agreements Int-bearing due from banks % of average earning assets $ billions UMBF ratio “Well Capitalized” 12.02% 8.00% Tier 1

Line of Business Updates
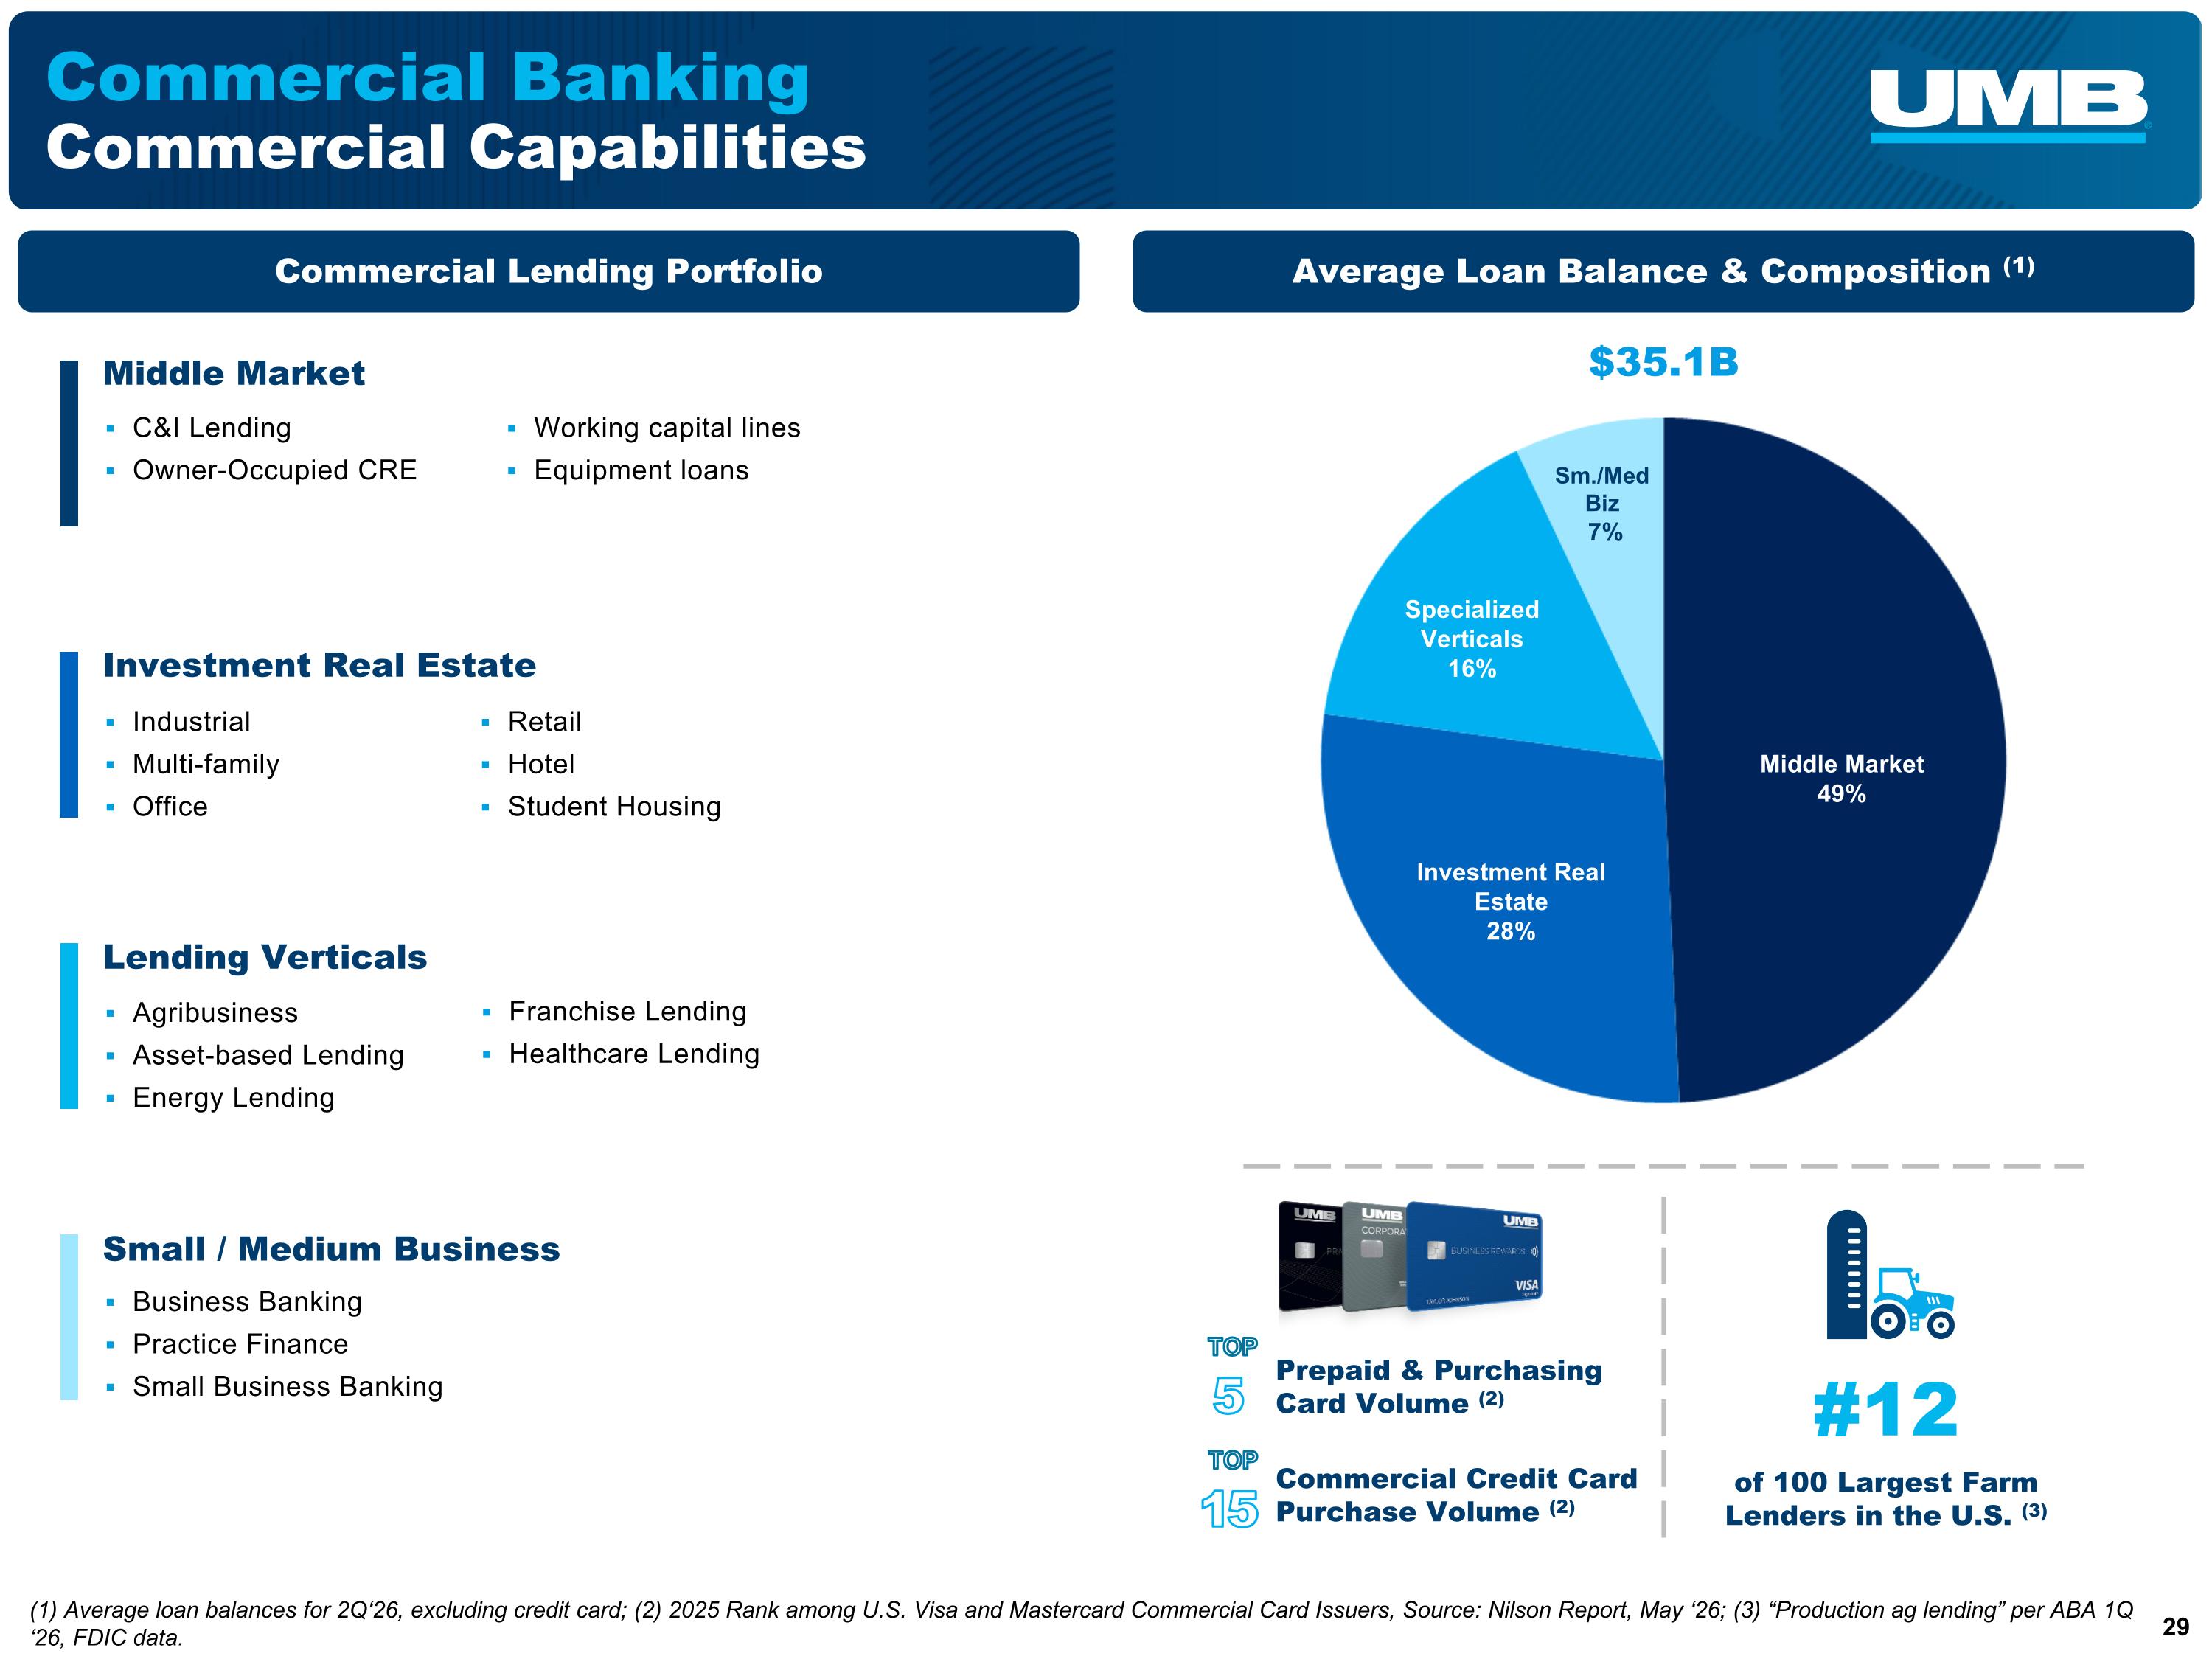
Commercial Banking Commercial Capabilities Investment Real Estate Industrial Multi-family Office Retail Hotel Student Housing Agribusiness Asset-based Lending Energy Lending Lending Verticals C&I Lending Owner-Occupied CRE Middle Market Working capital lines Equipment loans Business Banking Practice Finance Small Business Banking Small / Medium Business Middle Market 49% Investment Real Estate 28% Sm./Med Biz 7% Specialized Verticals 16% $35.1B (1) Average loan balances for 2Q‘26, excluding credit card; (2) 2025 Rank among U.S. Visa and Mastercard Commercial Card Issuers, Source: Nilson Report, May ‘26; (3) “Production ag lending” per ABA 1Q ‘26, FDIC data. #12 of 100 Largest Farm Lenders in the U.S. (3) Commercial Credit Card Purchase Volume (2) TOP 15 Prepaid & Purchasing Card Volume (2) TOP 5 Commercial Lending Portfolio Average Loan Balance & Composition (1) Franchise Lending Healthcare Lending
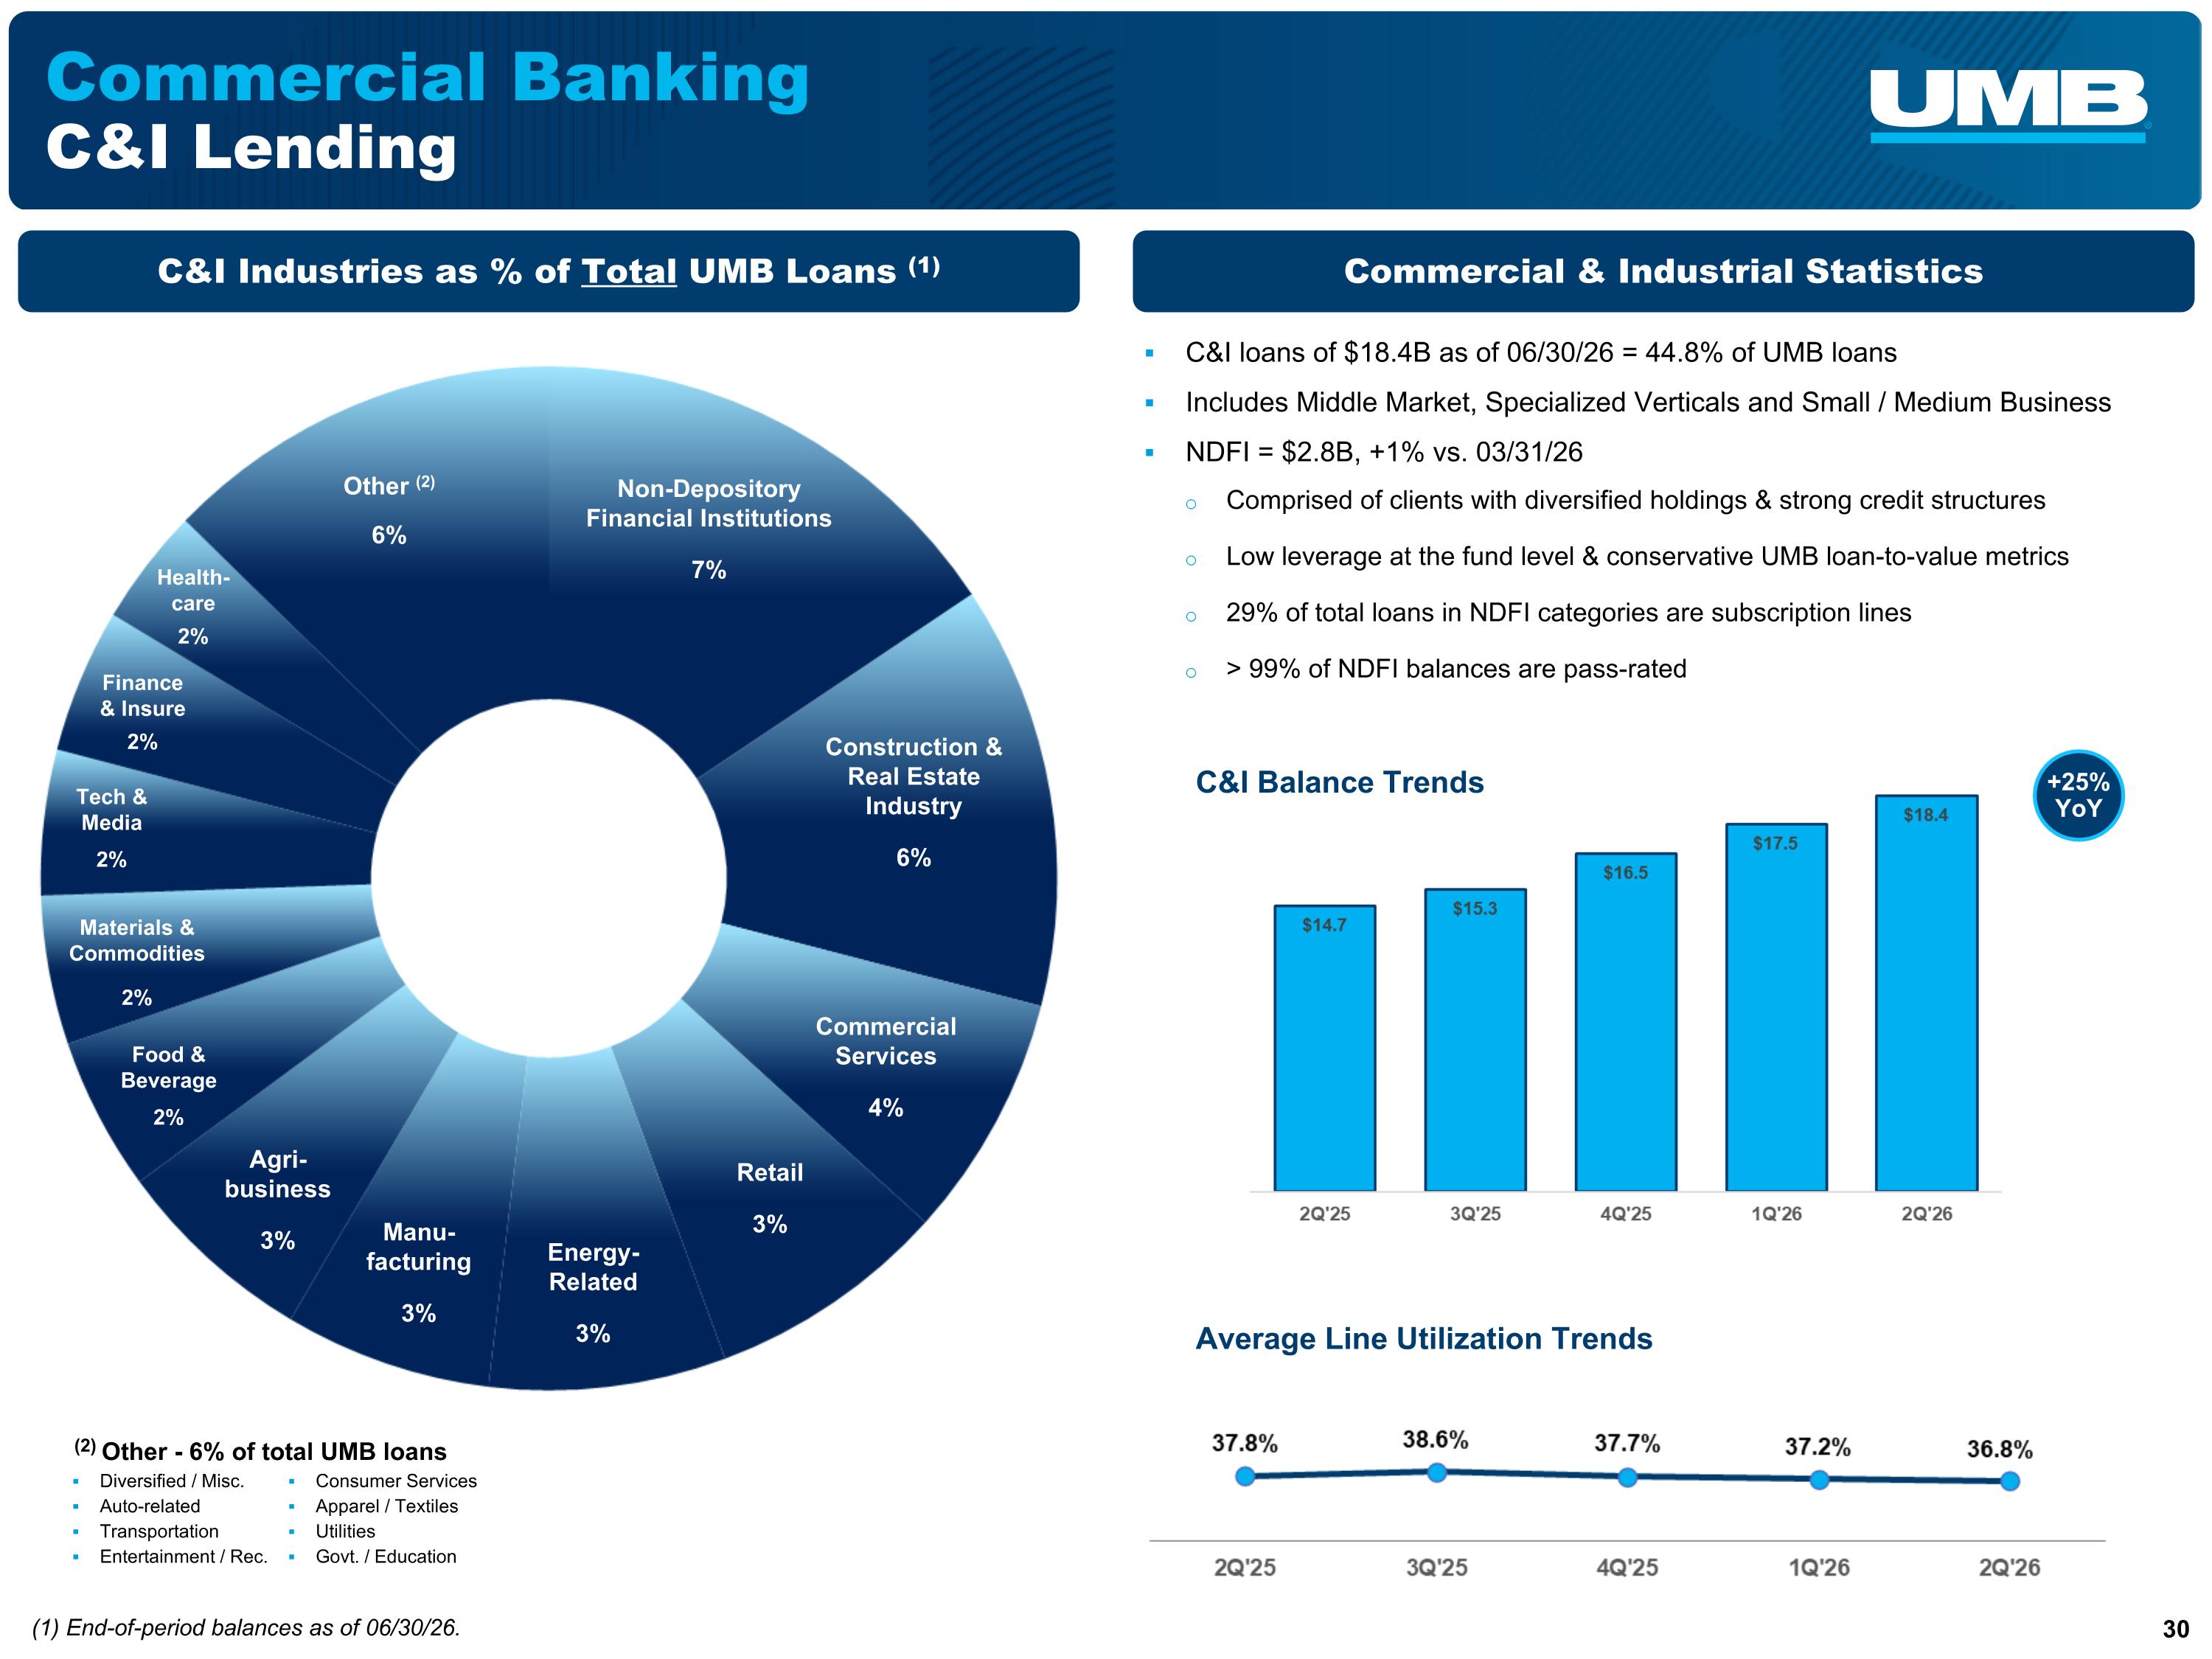
Commercial Banking C&I Lending C&I loans of $18.4B as of 06/30/26 = 44.8% of UMB loans Includes Middle Market, Specialized Verticals and Small / Medium Business NDFI = $2.8B, +1% vs. 03/31/26 Comprised of clients with diversified holdings & strong credit structures Low leverage at the fund level & conservative UMB loan-to-value metrics 29% of total loans in NDFI categories are subscription lines > 99% of NDFI balances are pass-rated Food & Beverage 2% Tech & Media 2% Finance & Insure 2% Materials & Commodities 2% Manu-facturing 3% Retail 3% Health-care 2% Commercial Services 4% Other (2) 6% Agri-business 3% Energy-Related 3% Average Line Utilization Trends Construction & Real Estate Industry 6% (1) End-of-period balances as of 06/30/26. C&I Industries as % of Total UMB Loans (1) Commercial & Industrial Statistics (2) Other - 6% of total UMB loans Diversified / Misc. Auto-related Transportation Entertainment / Rec. Consumer Services Apparel / Textiles Utilities Govt. / Education Non-Depository Financial Institutions 7% C&I Balance Trends +25% YoY
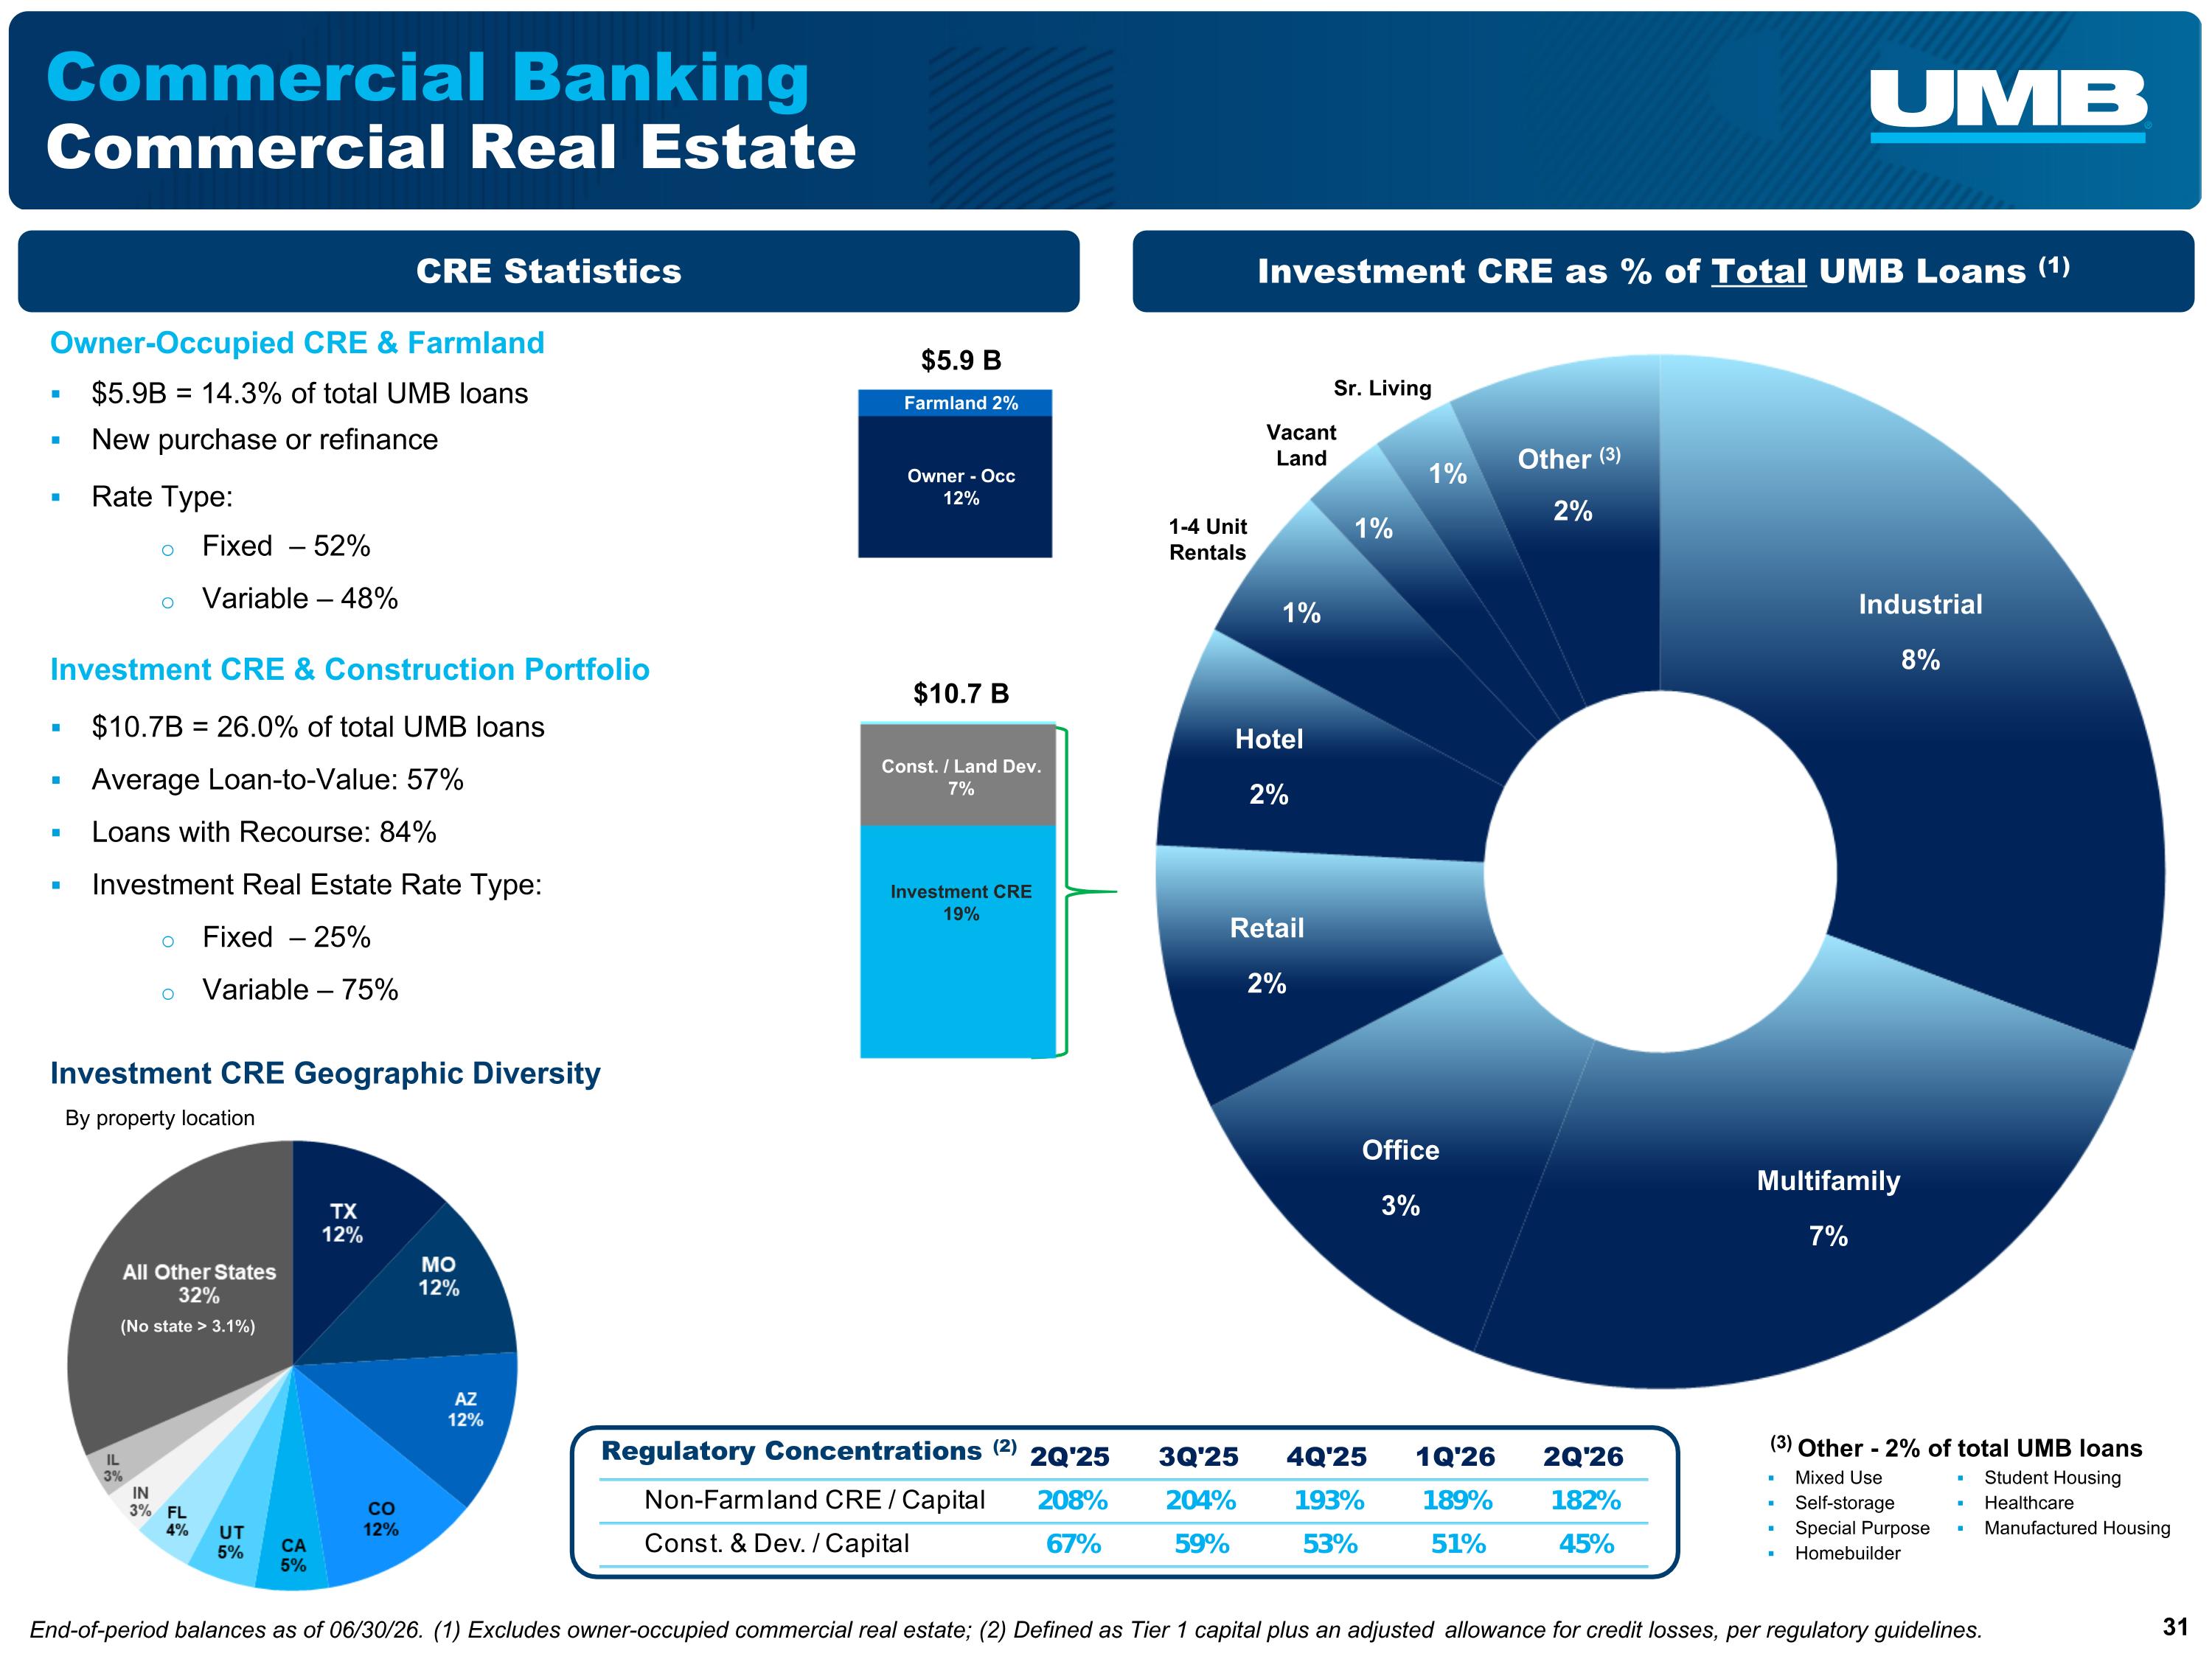
Commercial Banking Commercial Real Estate Sr. Living 1-4 Unit Rentals Vacant Land Other (3) Investment CRE & Construction Portfolio $10.7B = 26.0% of total UMB loans Average Loan-to-Value: 57% Loans with Recourse: 84% Investment Real Estate Rate Type: Fixed – 25% Variable – 75% End-of-period balances as of 06/30/26. (1) Excludes owner-occupied commercial real estate; (2) Defined as Tier 1 capital plus an adjusted allowance for credit losses, per regulatory guidelines. Investment CRE Geographic Diversity Owner-Occupied CRE & Farmland $5.9B = 14.3% of total UMB loans New purchase or refinance Rate Type: Fixed – 52% Variable – 48% Owner - Occ 12% Farmland 2% $5.9 B $10.7 B By property location (3) Other - 2% of total UMB loans Mixed Use Self-storage Special Purpose Homebuilder Student Housing Healthcare Manufactured Housing (No state > 3.1%) CRE Statistics Investment CRE as % of Total UMB Loans (1) Const. / Land Dev. 7% Investment CRE 19% Industrial 8% Multifamily 7% Office 3% Retail 2% Hotel 2% 2% 1% 1% 1% Regulatory Concentrations (2)
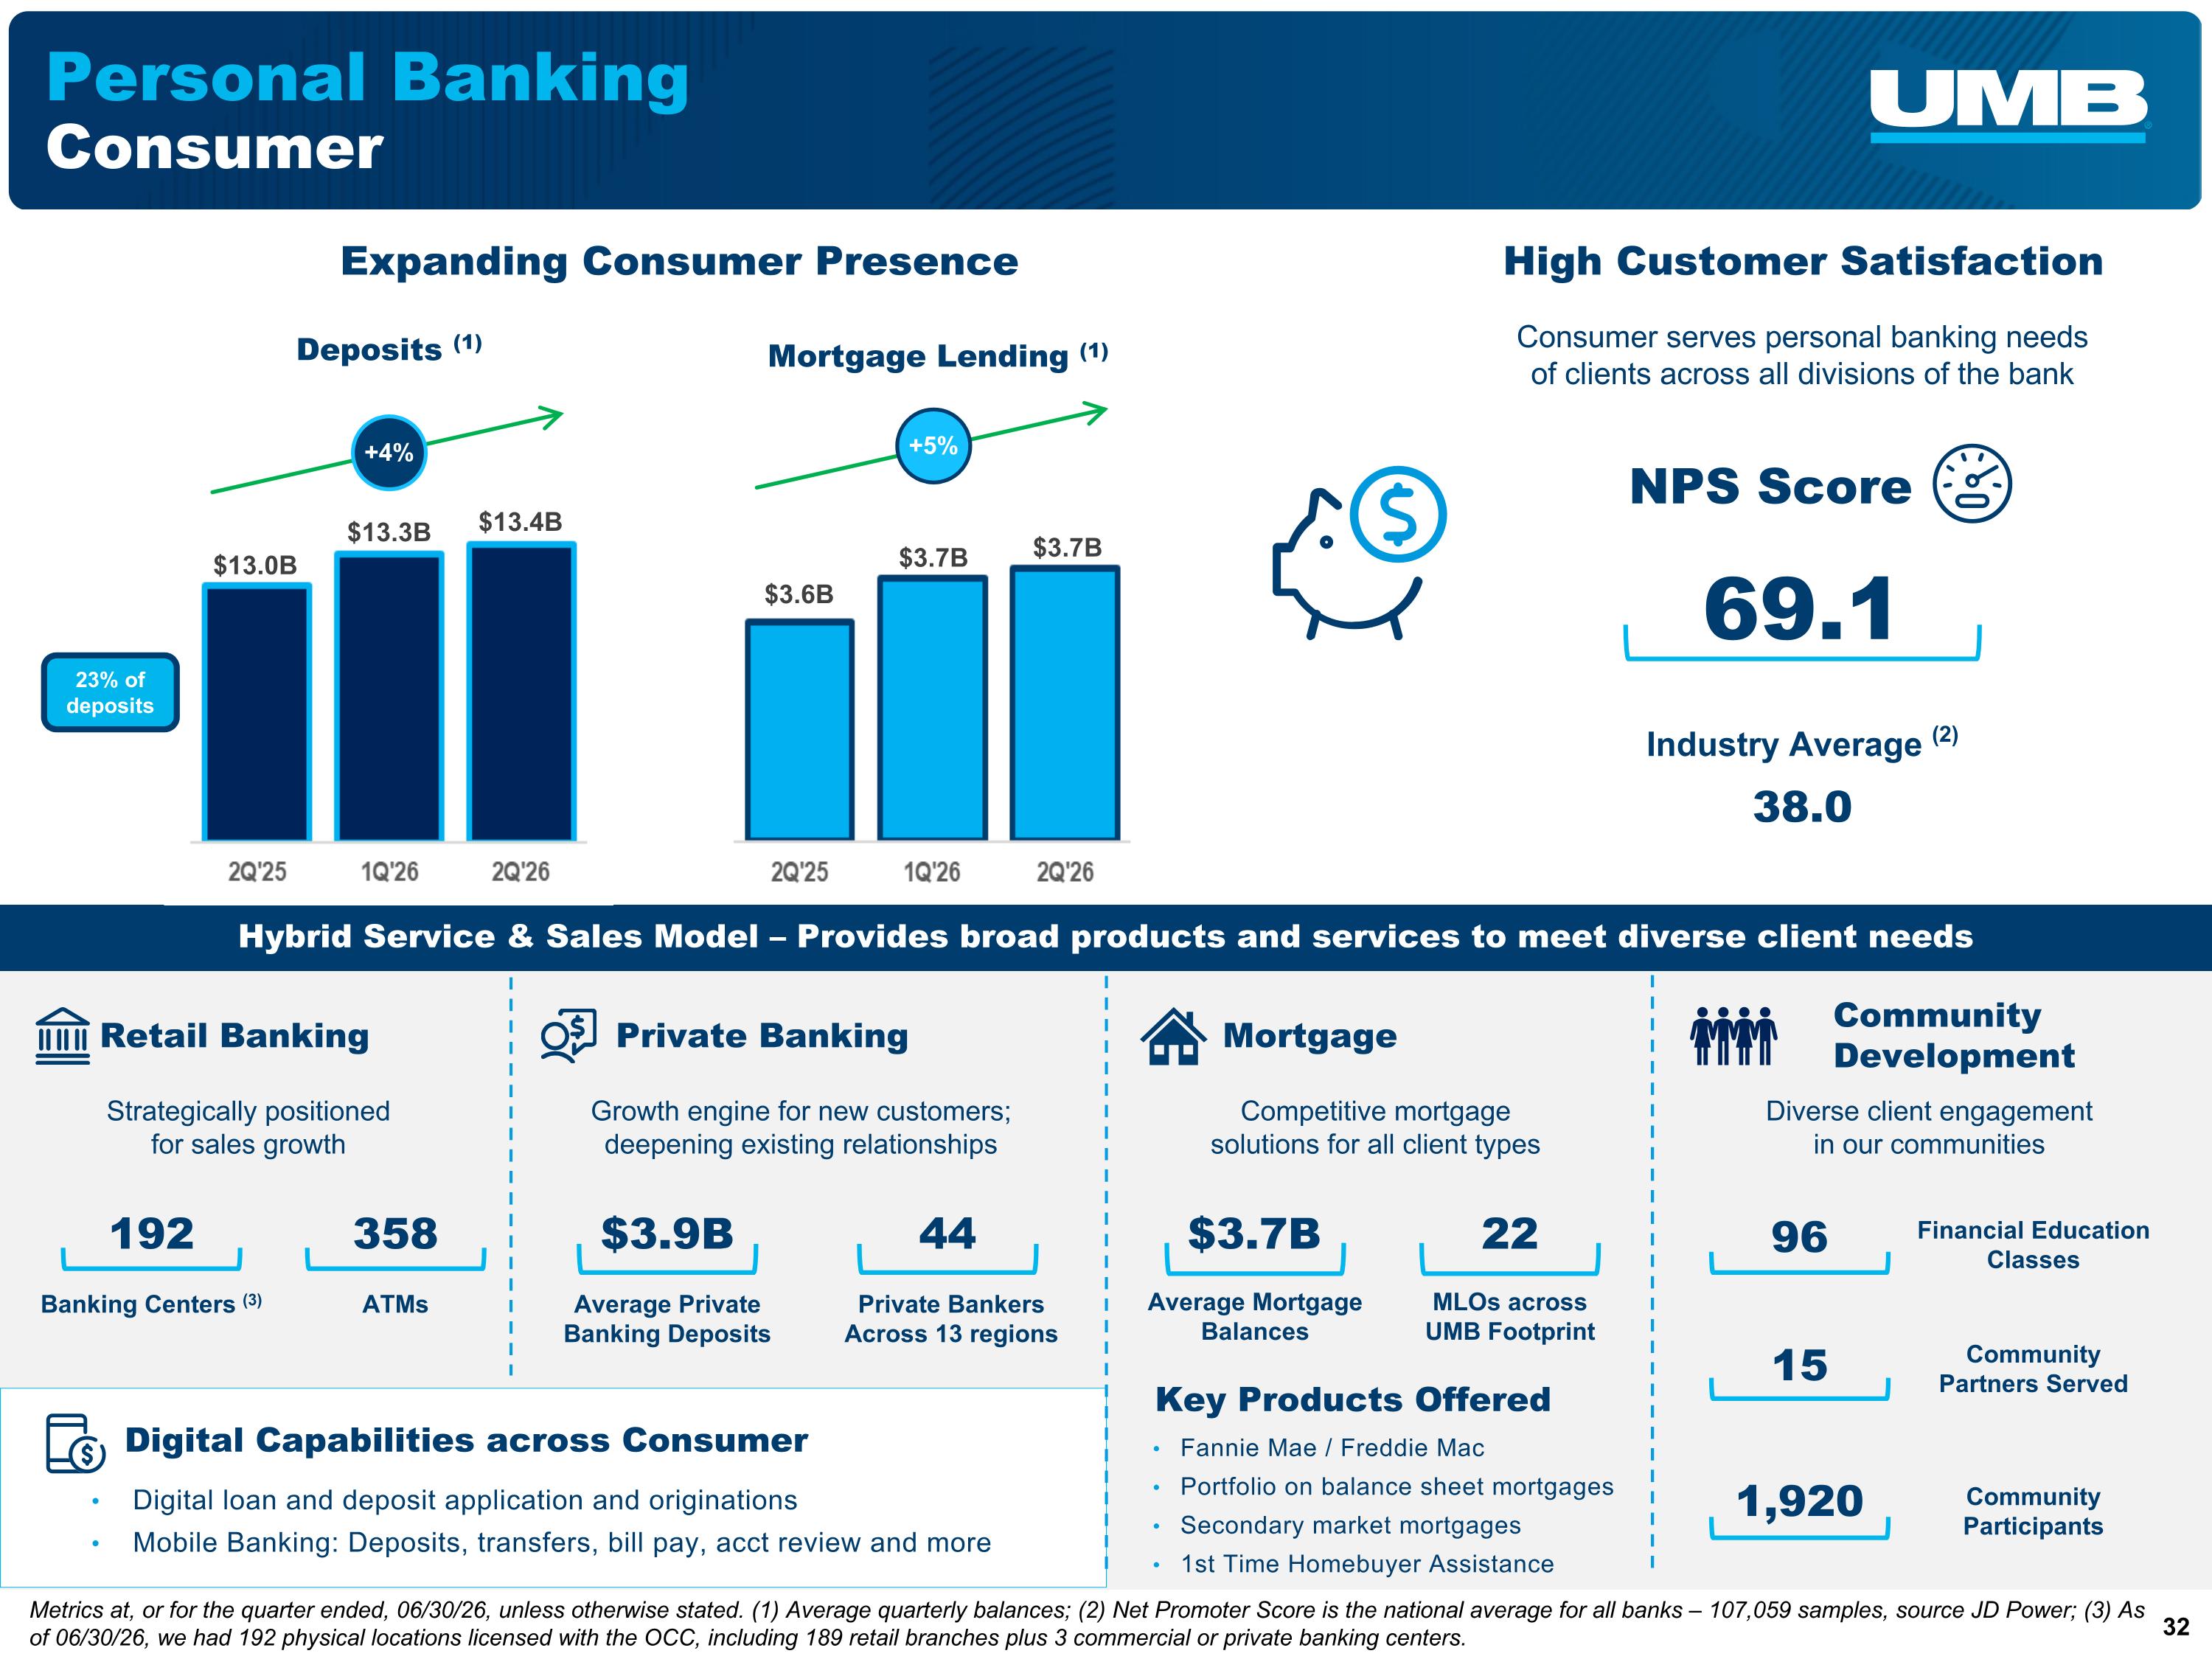
Personal Banking Consumer Growth engine for new customers; deepening existing relationships Private Banking Strategically positioned for sales growth Retail Banking Hybrid Service & Sales Model – Provides broad products and services to meet diverse client needs 192 Banking Centers (3) 358 ATMs $3.9B 44 Average Private Banking Deposits Private Bankers Across 13 regions Mortgage 22 MLOs across UMB Footprint Community Development Competitive mortgage solutions for all client types Average Mortgage Balances Diverse client engagement in our communities 96 Financial Education Classes 15 Community Partners Served 1,920 Community Participants Key Products Offered Fannie Mae / Freddie Mac Portfolio on balance sheet mortgages Secondary market mortgages 1st Time Homebuyer Assistance $3.7B Digital Capabilities across Consumer Digital loan and deposit application and originations Mobile Banking: Deposits, transfers, bill pay, acct review and more Metrics at, or for the quarter ended, 06/30/26, unless otherwise stated. (1) Average quarterly balances; (2) Net Promoter Score is the national average for all banks – 107,059 samples, source JD Power; (3) As of 06/30/26, we had 192 physical locations licensed with the OCC, including 189 retail branches plus 3 commercial or private banking centers. Mortgage Lending (1) 69.1 Industry Average (2) 38.0 NPS Score High Customer Satisfaction Consumer serves personal banking needs of clients across all divisions of the bank Deposits (1) Expanding Consumer Presence $13.0B $3.6B $3.7B +4% $13.3B $13.4B $3.7B +5% 23% of deposits
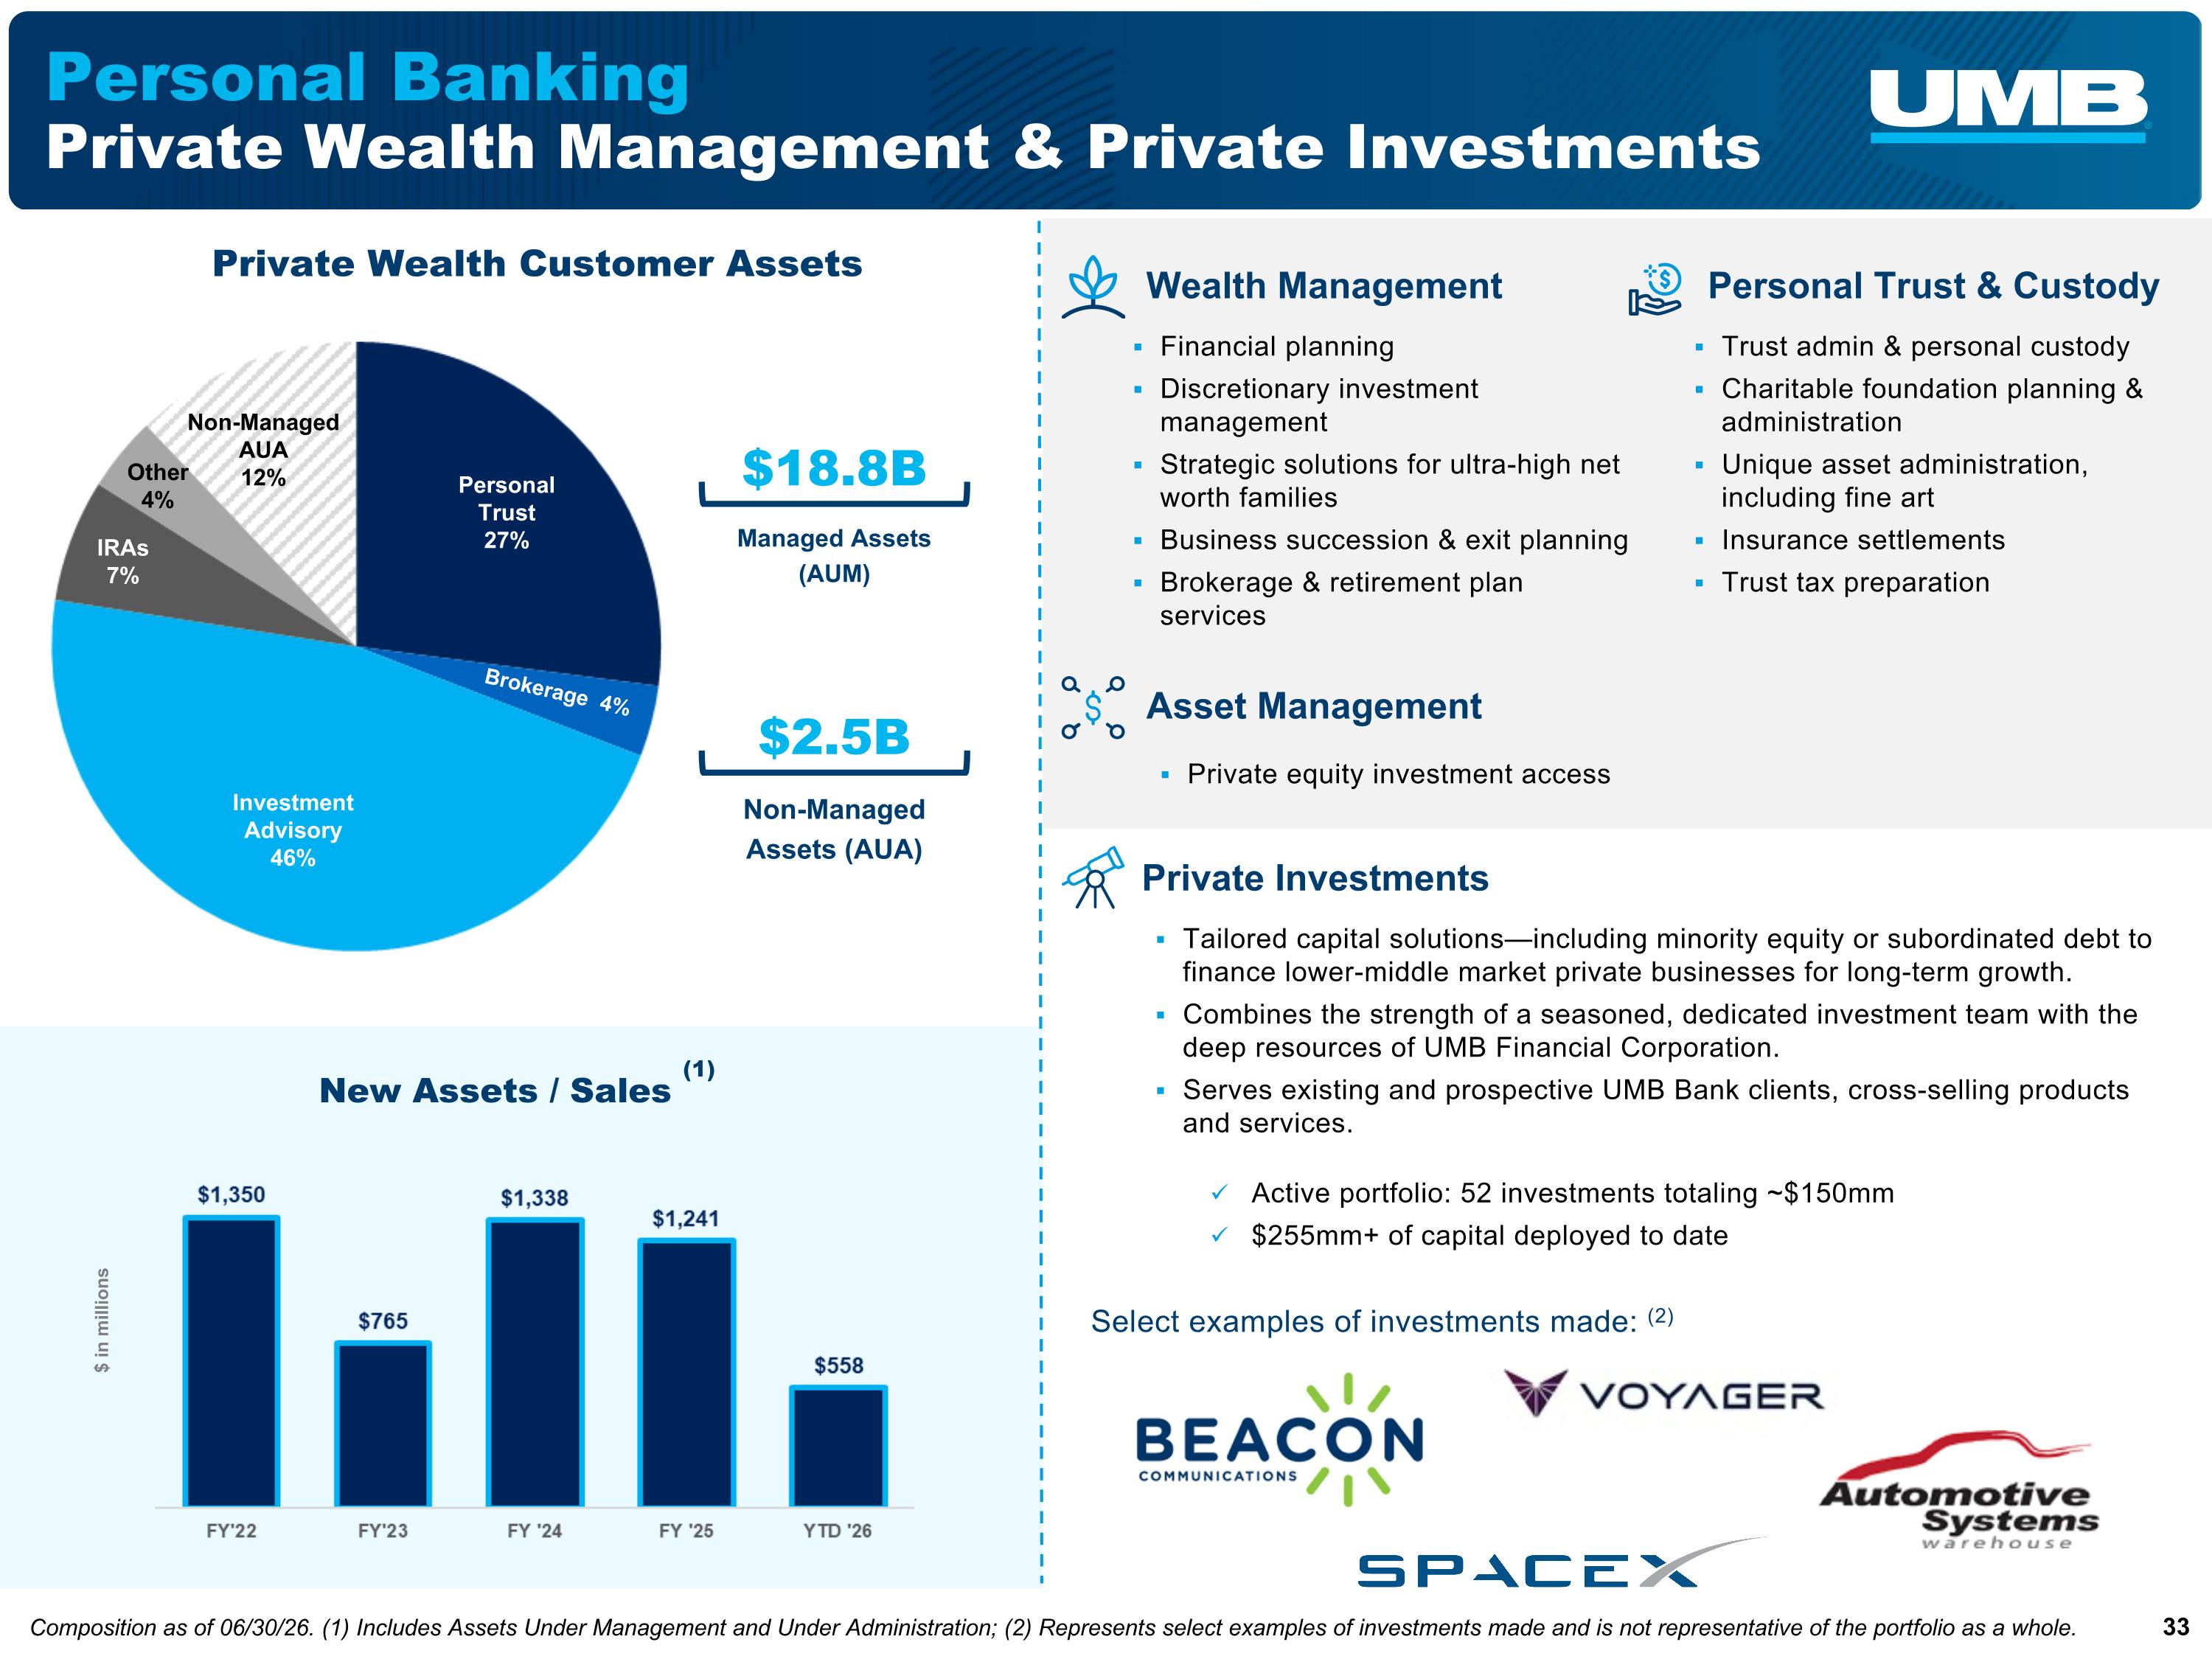
Personal Banking Private Wealth Management & Private Investments Composition as of 06/30/26. (1) Includes Assets Under Management and Under Administration; (2) Represents select examples of investments made and is not representative of the portfolio as a whole. Personal Trust 27% Investment Advisory 46% Non-Managed AUA 12% IRAs 7% Brokerage 4% Other 4% Private Wealth Customer Assets Wealth Management Financial planning Discretionary investment management Strategic solutions for ultra-high net worth families Business succession & exit planning Brokerage & retirement plan services Asset Management Private equity investment access $18.8B Managed Assets (AUM) $2.5B Non-Managed Assets (AUA) $ in millions New Assets / Sales (1) Personal Trust & Custody Trust admin & personal custody Charitable foundation planning & administration Unique asset administration, including fine art Insurance settlements Trust tax preparation Private Investments Tailored capital solutions—including minority equity or subordinated debt to finance lower-middle market private businesses for long-term growth. Combines the strength of a seasoned, dedicated investment team with the deep resources of UMB Financial Corporation. Serves existing and prospective UMB Bank clients, cross-selling products and services. Active portfolio: 52 investments totaling ~$150mm $255mm+ of capital deployed to date Select examples of investments made: (2)
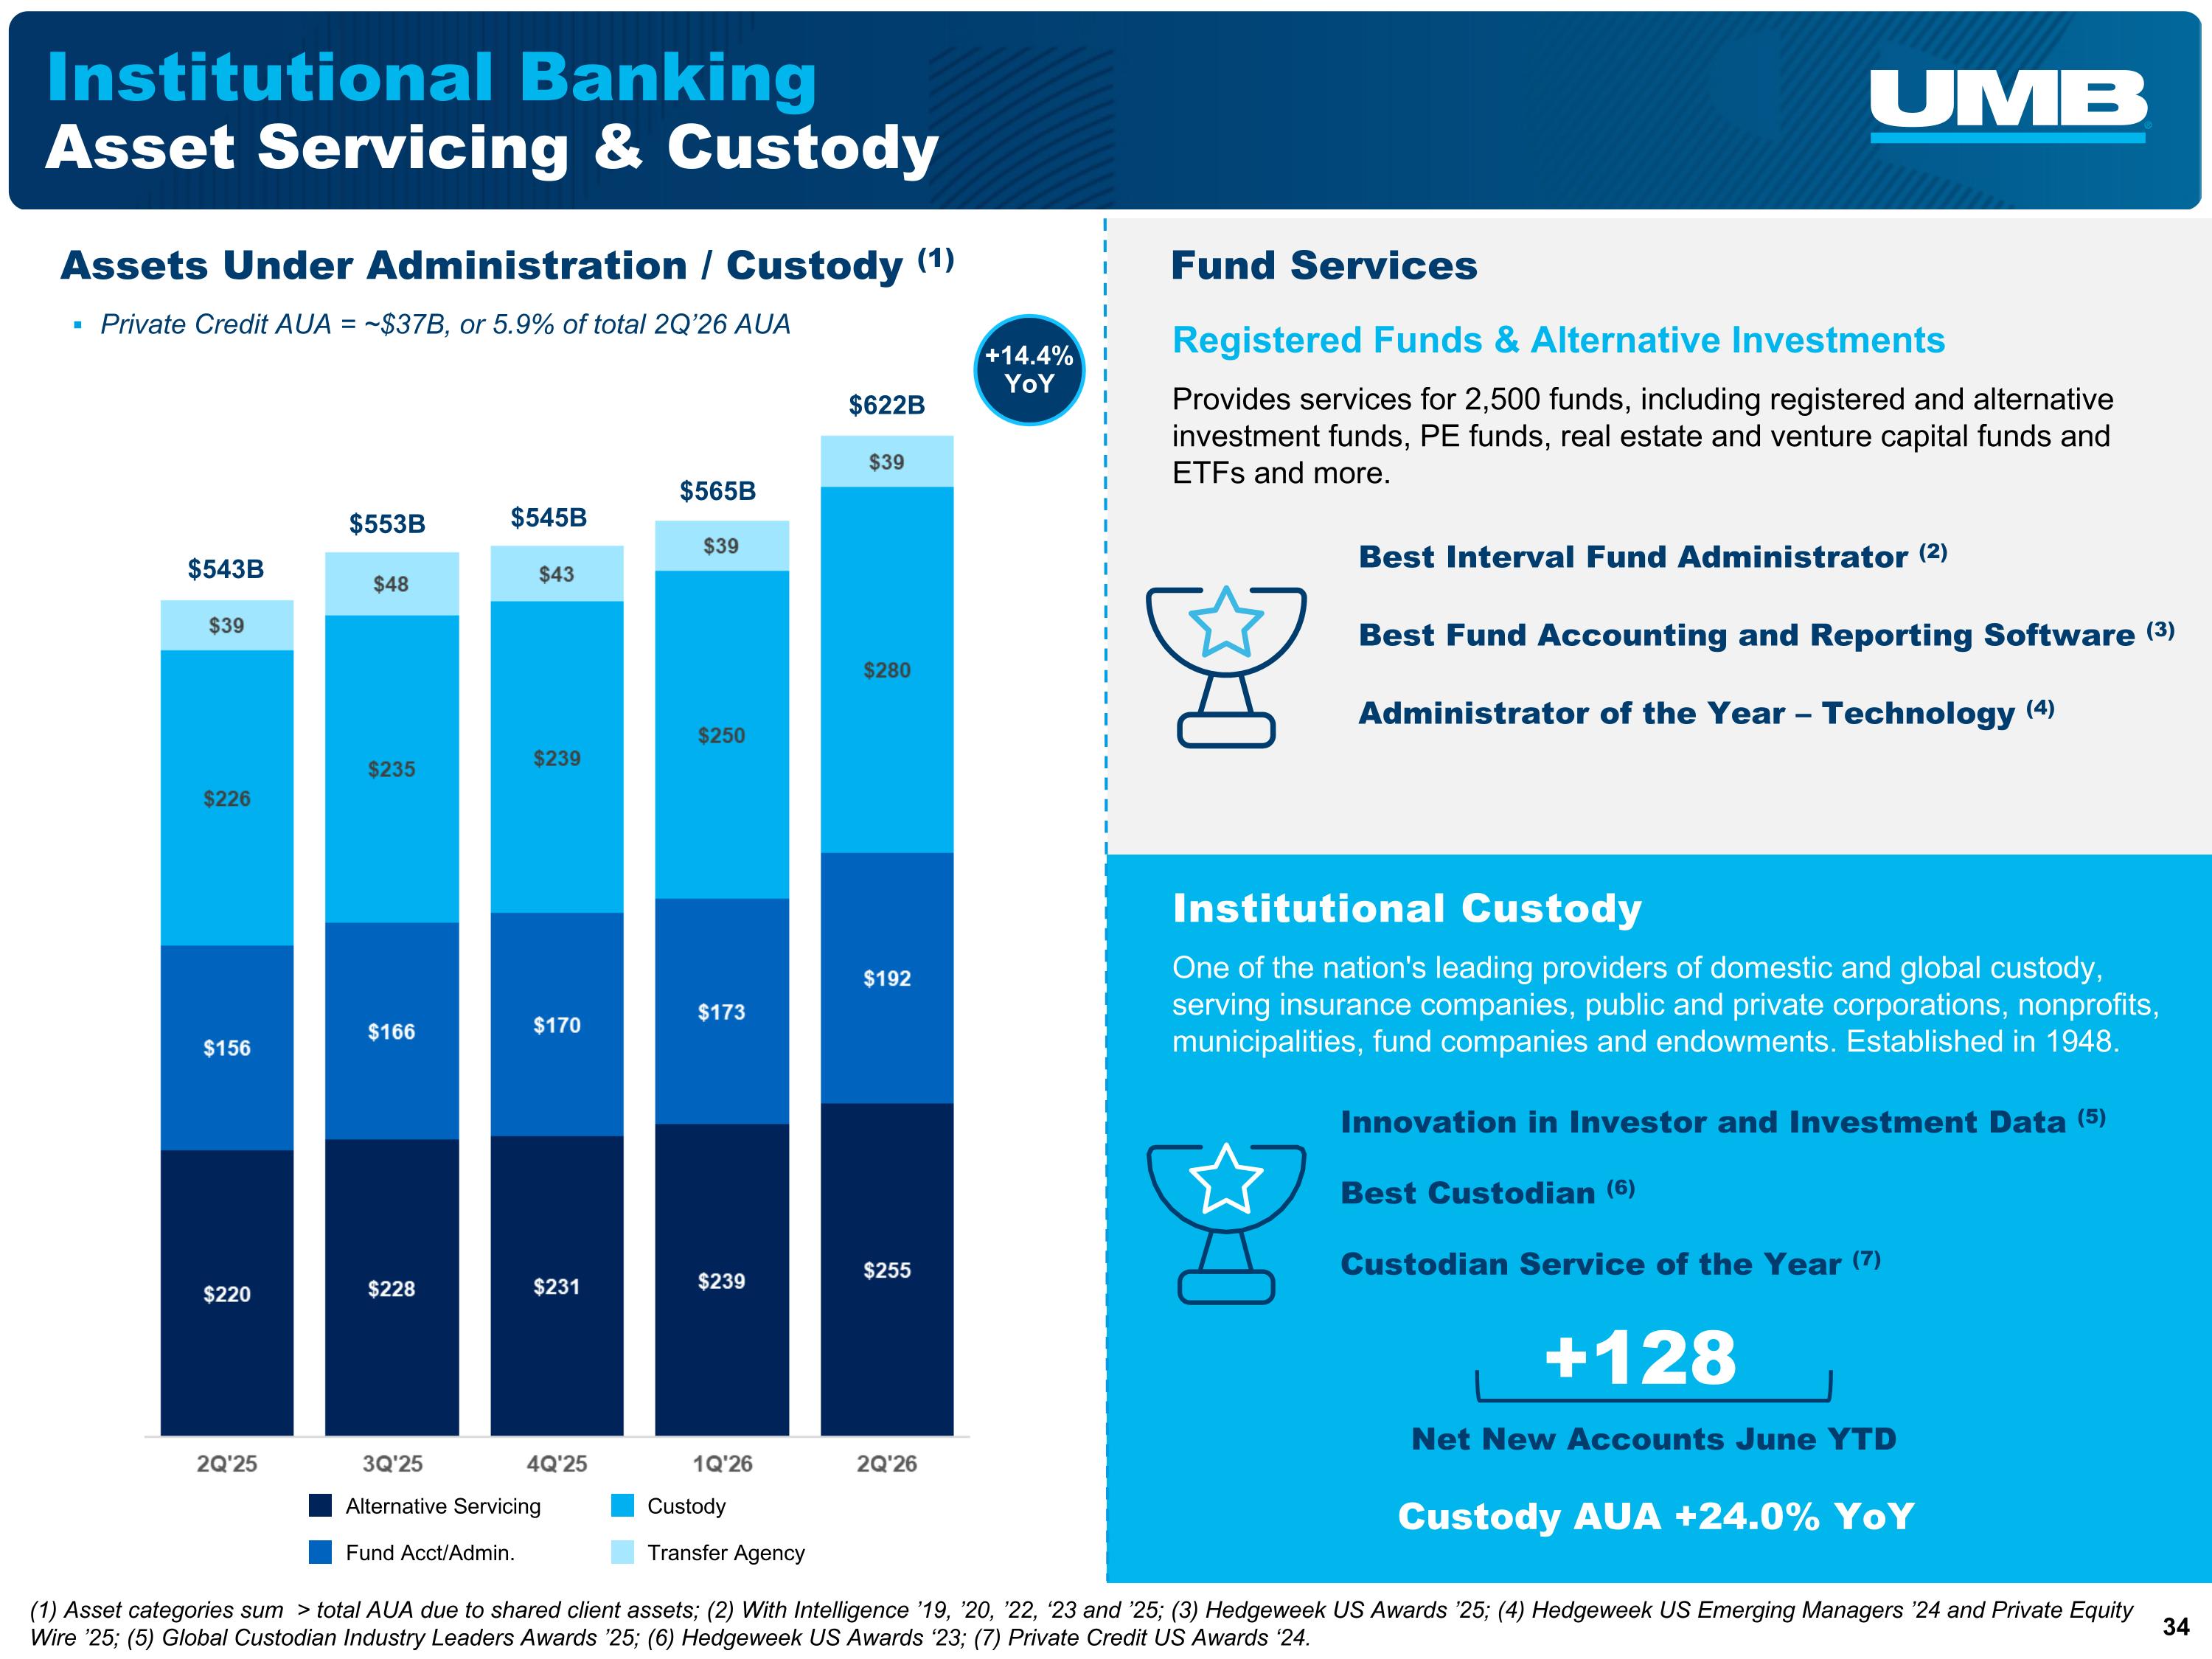
Institutional Banking Asset Servicing & Custody $622B $553B $545B $565B $543B Assets Under Administration / Custody (1) (1) Asset categories sum > total AUA due to shared client assets; (2) With Intelligence ’19, ’20, ’22, ‘23 and ’25; (3) Hedgeweek US Awards ’25; (4) Hedgeweek US Emerging Managers ’24 and Private Equity Wire ’25; (5) Global Custodian Industry Leaders Awards ’25; (6) Hedgeweek US Awards ‘23; (7) Private Credit US Awards ‘24. Transfer Agency Alternative Servicing Fund Acct/Admin. Custody Provides services for 2,500 funds, including registered and alternative investment funds, PE funds, real estate and venture capital funds and ETFs and more. One of the nation's leading providers of domestic and global custody, serving insurance companies, public and private corporations, nonprofits, municipalities, fund companies and endowments. Established in 1948. Net New Accounts June YTD Custody AUA +24.0% YoY +128 Registered Funds & Alternative Investments Institutional Custody Best Interval Fund Administrator (2) Best Fund Accounting and Reporting Software (3) Administrator of the Year – Technology (4) Custodian Service of the Year (7) Best Custodian (6) Innovation in Investor and Investment Data (5) +14.4% YoY Fund Services Private Credit AUA = ~$37B, or 5.9% of total 2Q’26 AUA
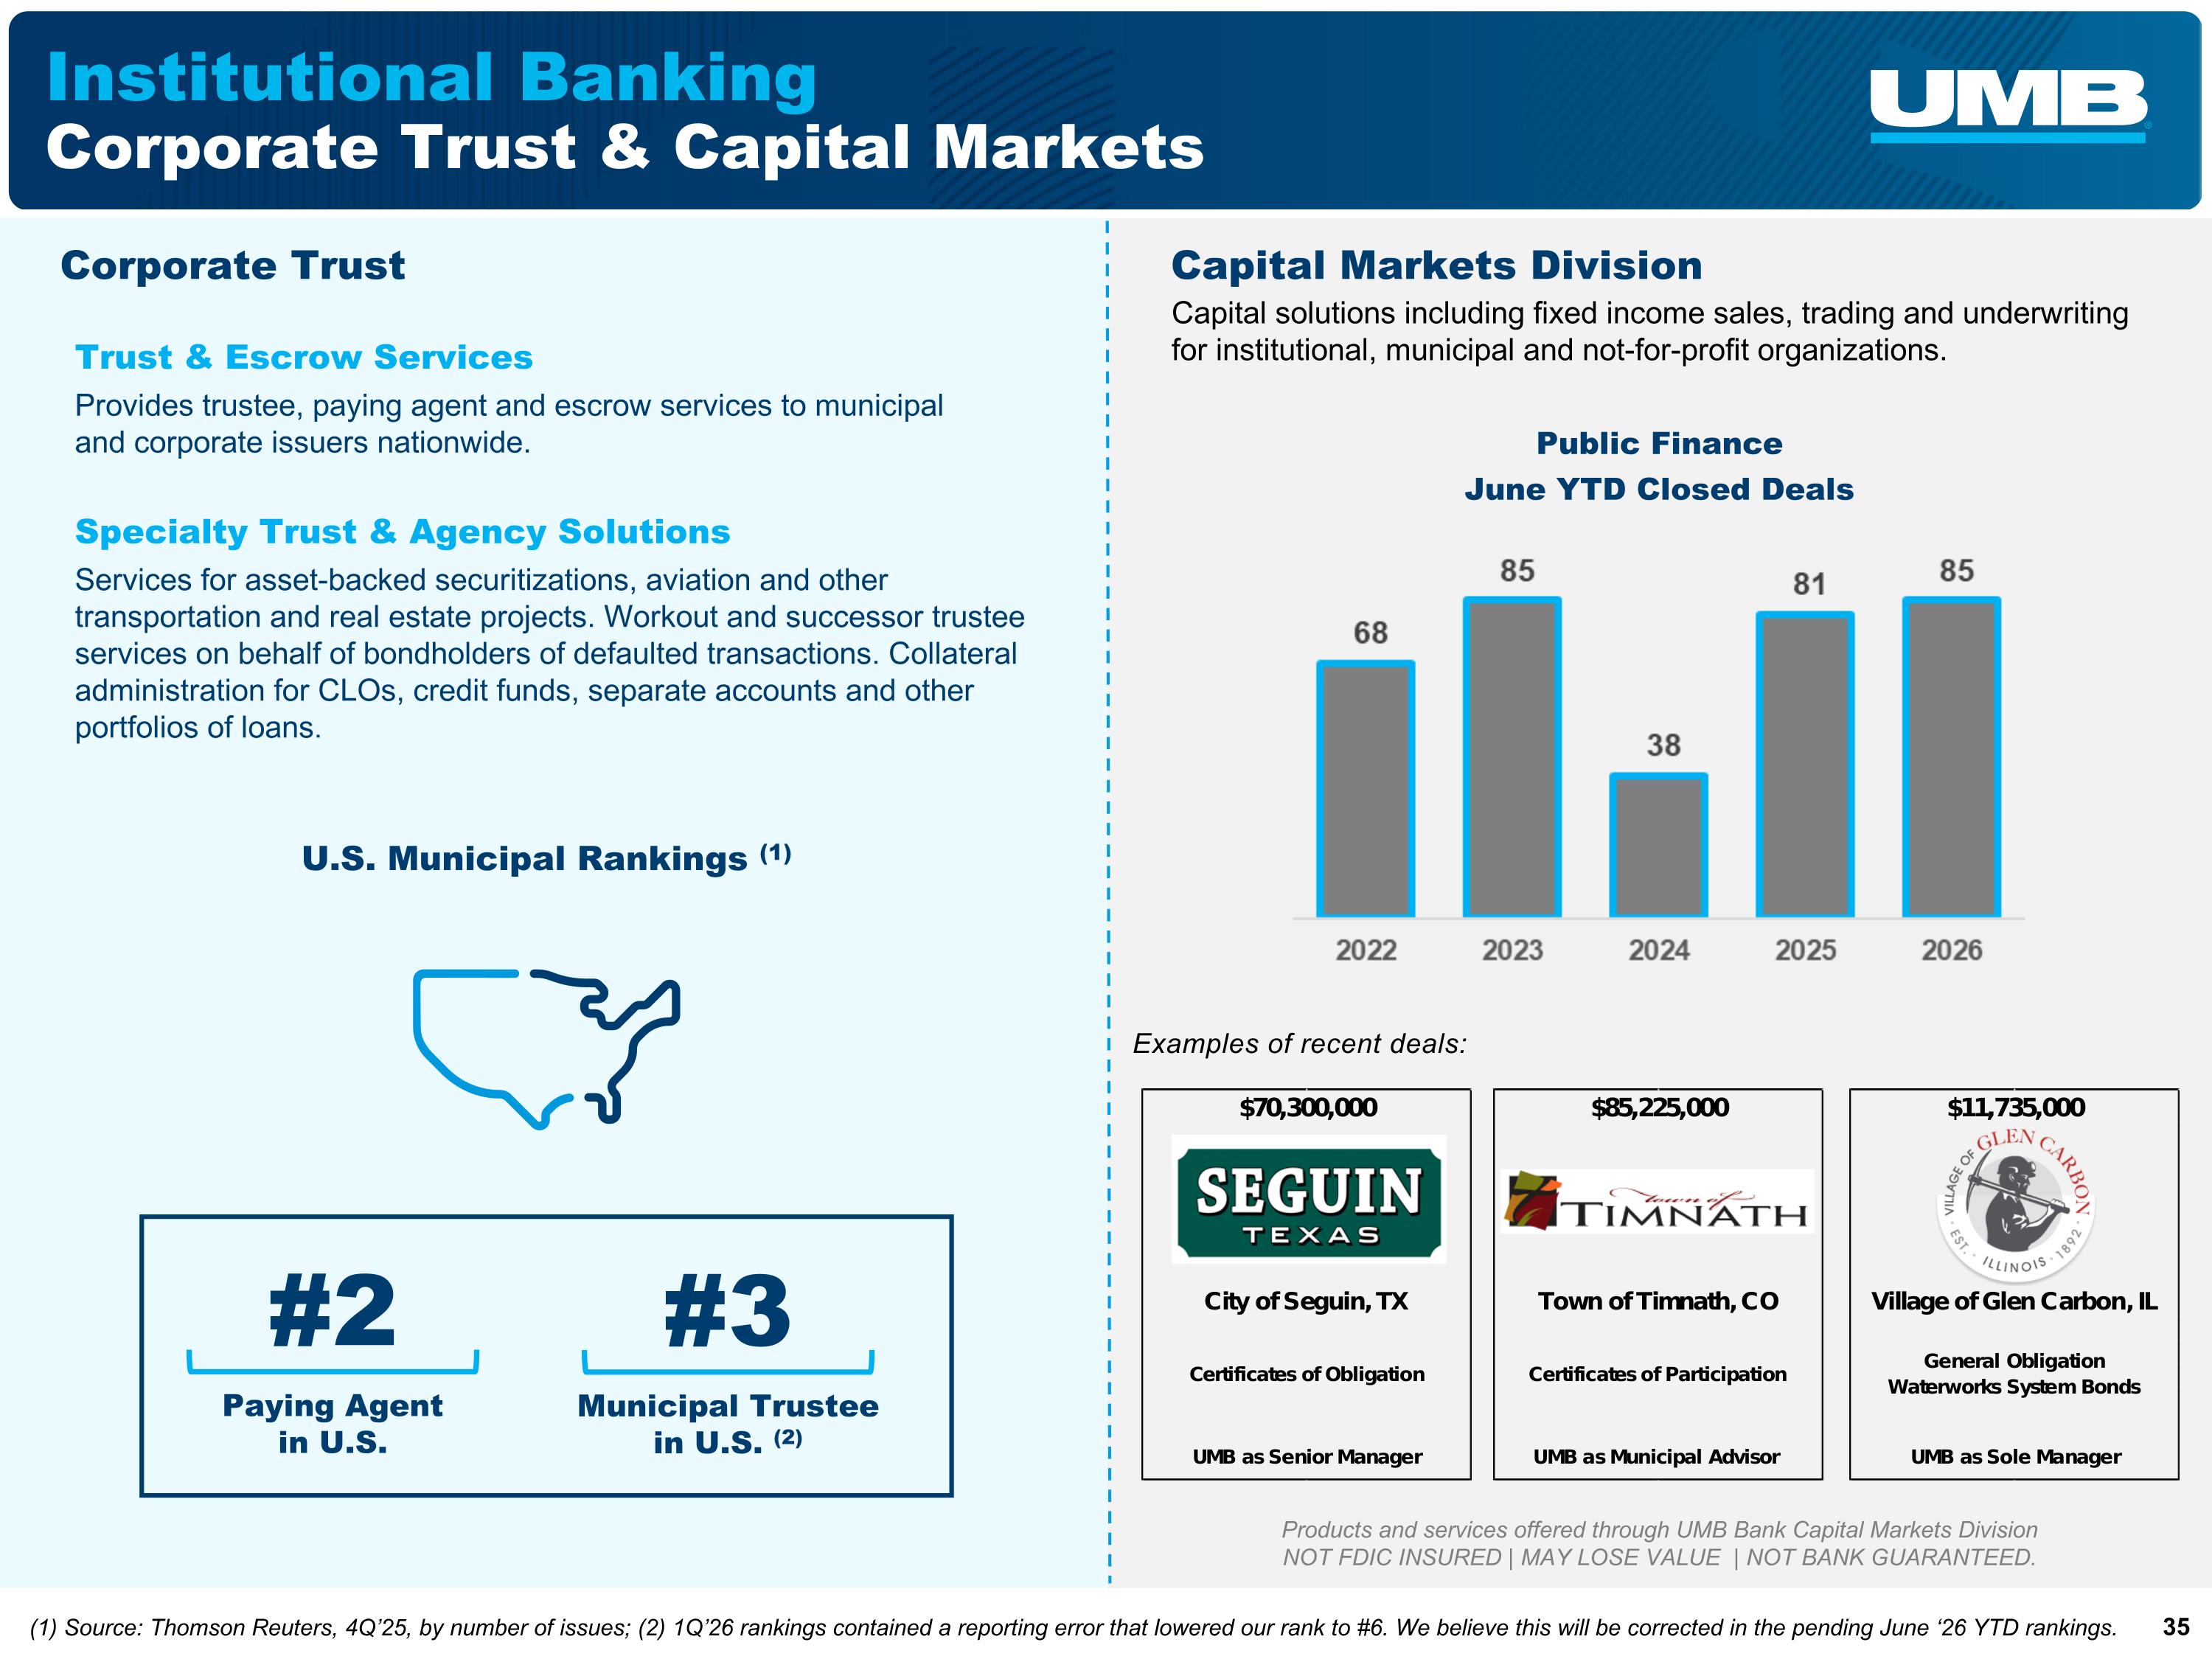
Institutional Banking Corporate Trust & Capital Markets Corporate Trust Provides trustee, paying agent and escrow services to municipal and corporate issuers nationwide. Specialty Trust & Agency Solutions Services for asset-backed securitizations, aviation and other transportation and real estate projects. Workout and successor trustee services on behalf of bondholders of defaulted transactions. Collateral administration for CLOs, credit funds, separate accounts and other portfolios of loans. Examples of recent deals: Products and services offered through UMB Bank Capital Markets Division NOT FDIC INSURED | MAY LOSE VALUE | NOT BANK GUARANTEED. Capital Markets Division Capital solutions including fixed income sales, trading and underwriting for institutional, municipal and not-for-profit organizations. Public Finance June YTD Closed Deals Trust & Escrow Services Paying Agent in U.S. #2 Municipal Trustee in U.S. (2) #3 (1) Source: Thomson Reuters, 4Q’25, by number of issues; (2) 1Q’26 rankings contained a reporting error that lowered our rank to #6. We believe this will be corrected in the pending June ‘26 YTD rankings. U.S. Municipal Rankings (1)
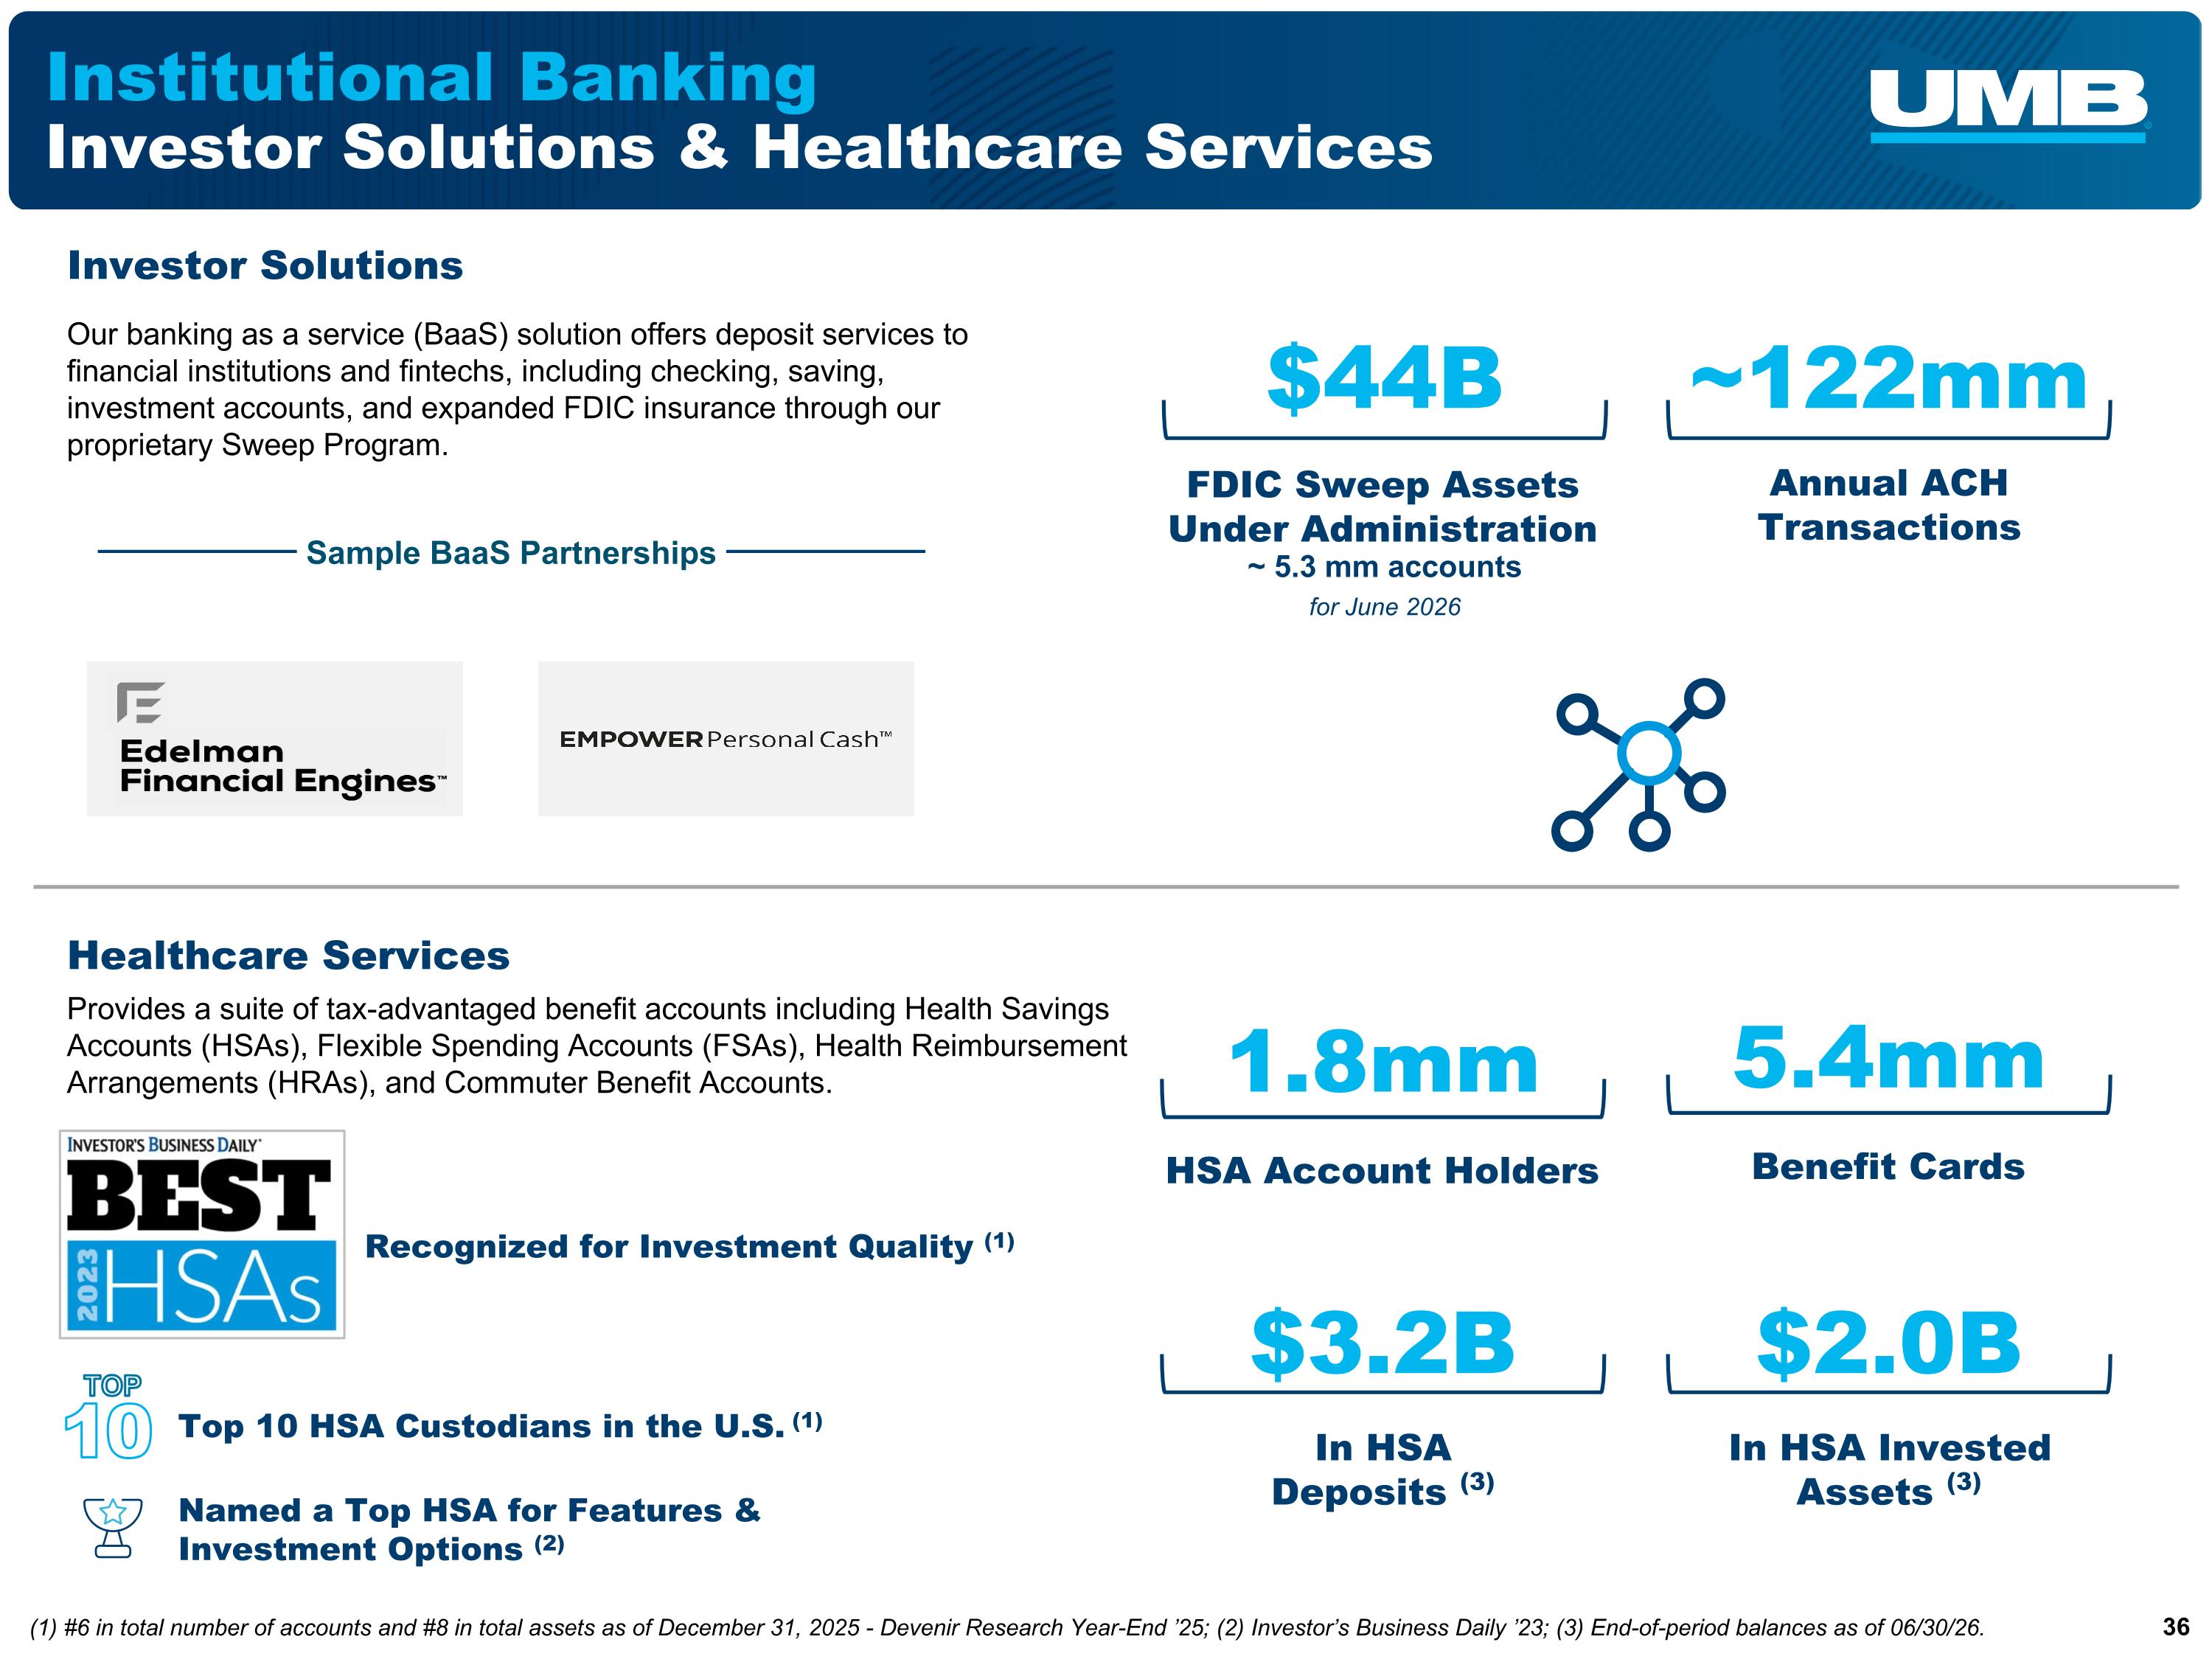
FDIC Sweep Assets Under Administration $44B Institutional Banking Investor Solutions & Healthcare Services Investor Solutions Annual ACH Transactions Healthcare Services Provides a suite of tax-advantaged benefit accounts including Health Savings Accounts (HSAs), Flexible Spending Accounts (FSAs), Health Reimbursement Arrangements (HRAs), and Commuter Benefit Accounts. HSA Account Holders 1.8mm In HSA Deposits (3) $3.2B Top 10 HSA Custodians in the U.S. (1) TOP 10 Benefit Cards 5.4mm ~122mm ~ 5.3 mm accounts for June 2026 Recognized for Investment Quality (1) Sample BaaS Partnerships Named a Top HSA for Features & Investment Options (2) (1) #6 in total number of accounts and #8 in total assets as of December 31, 2025 - Devenir Research Year-End ’25; (2) Investor’s Business Daily ’23; (3) End-of-period balances as of 06/30/26. Our banking as a service (BaaS) solution offers deposit services to financial institutions and fintechs, including checking, saving, investment accounts, and expanded FDIC insurance through our proprietary Sweep Program. In HSA Invested Assets (3) $2.0B
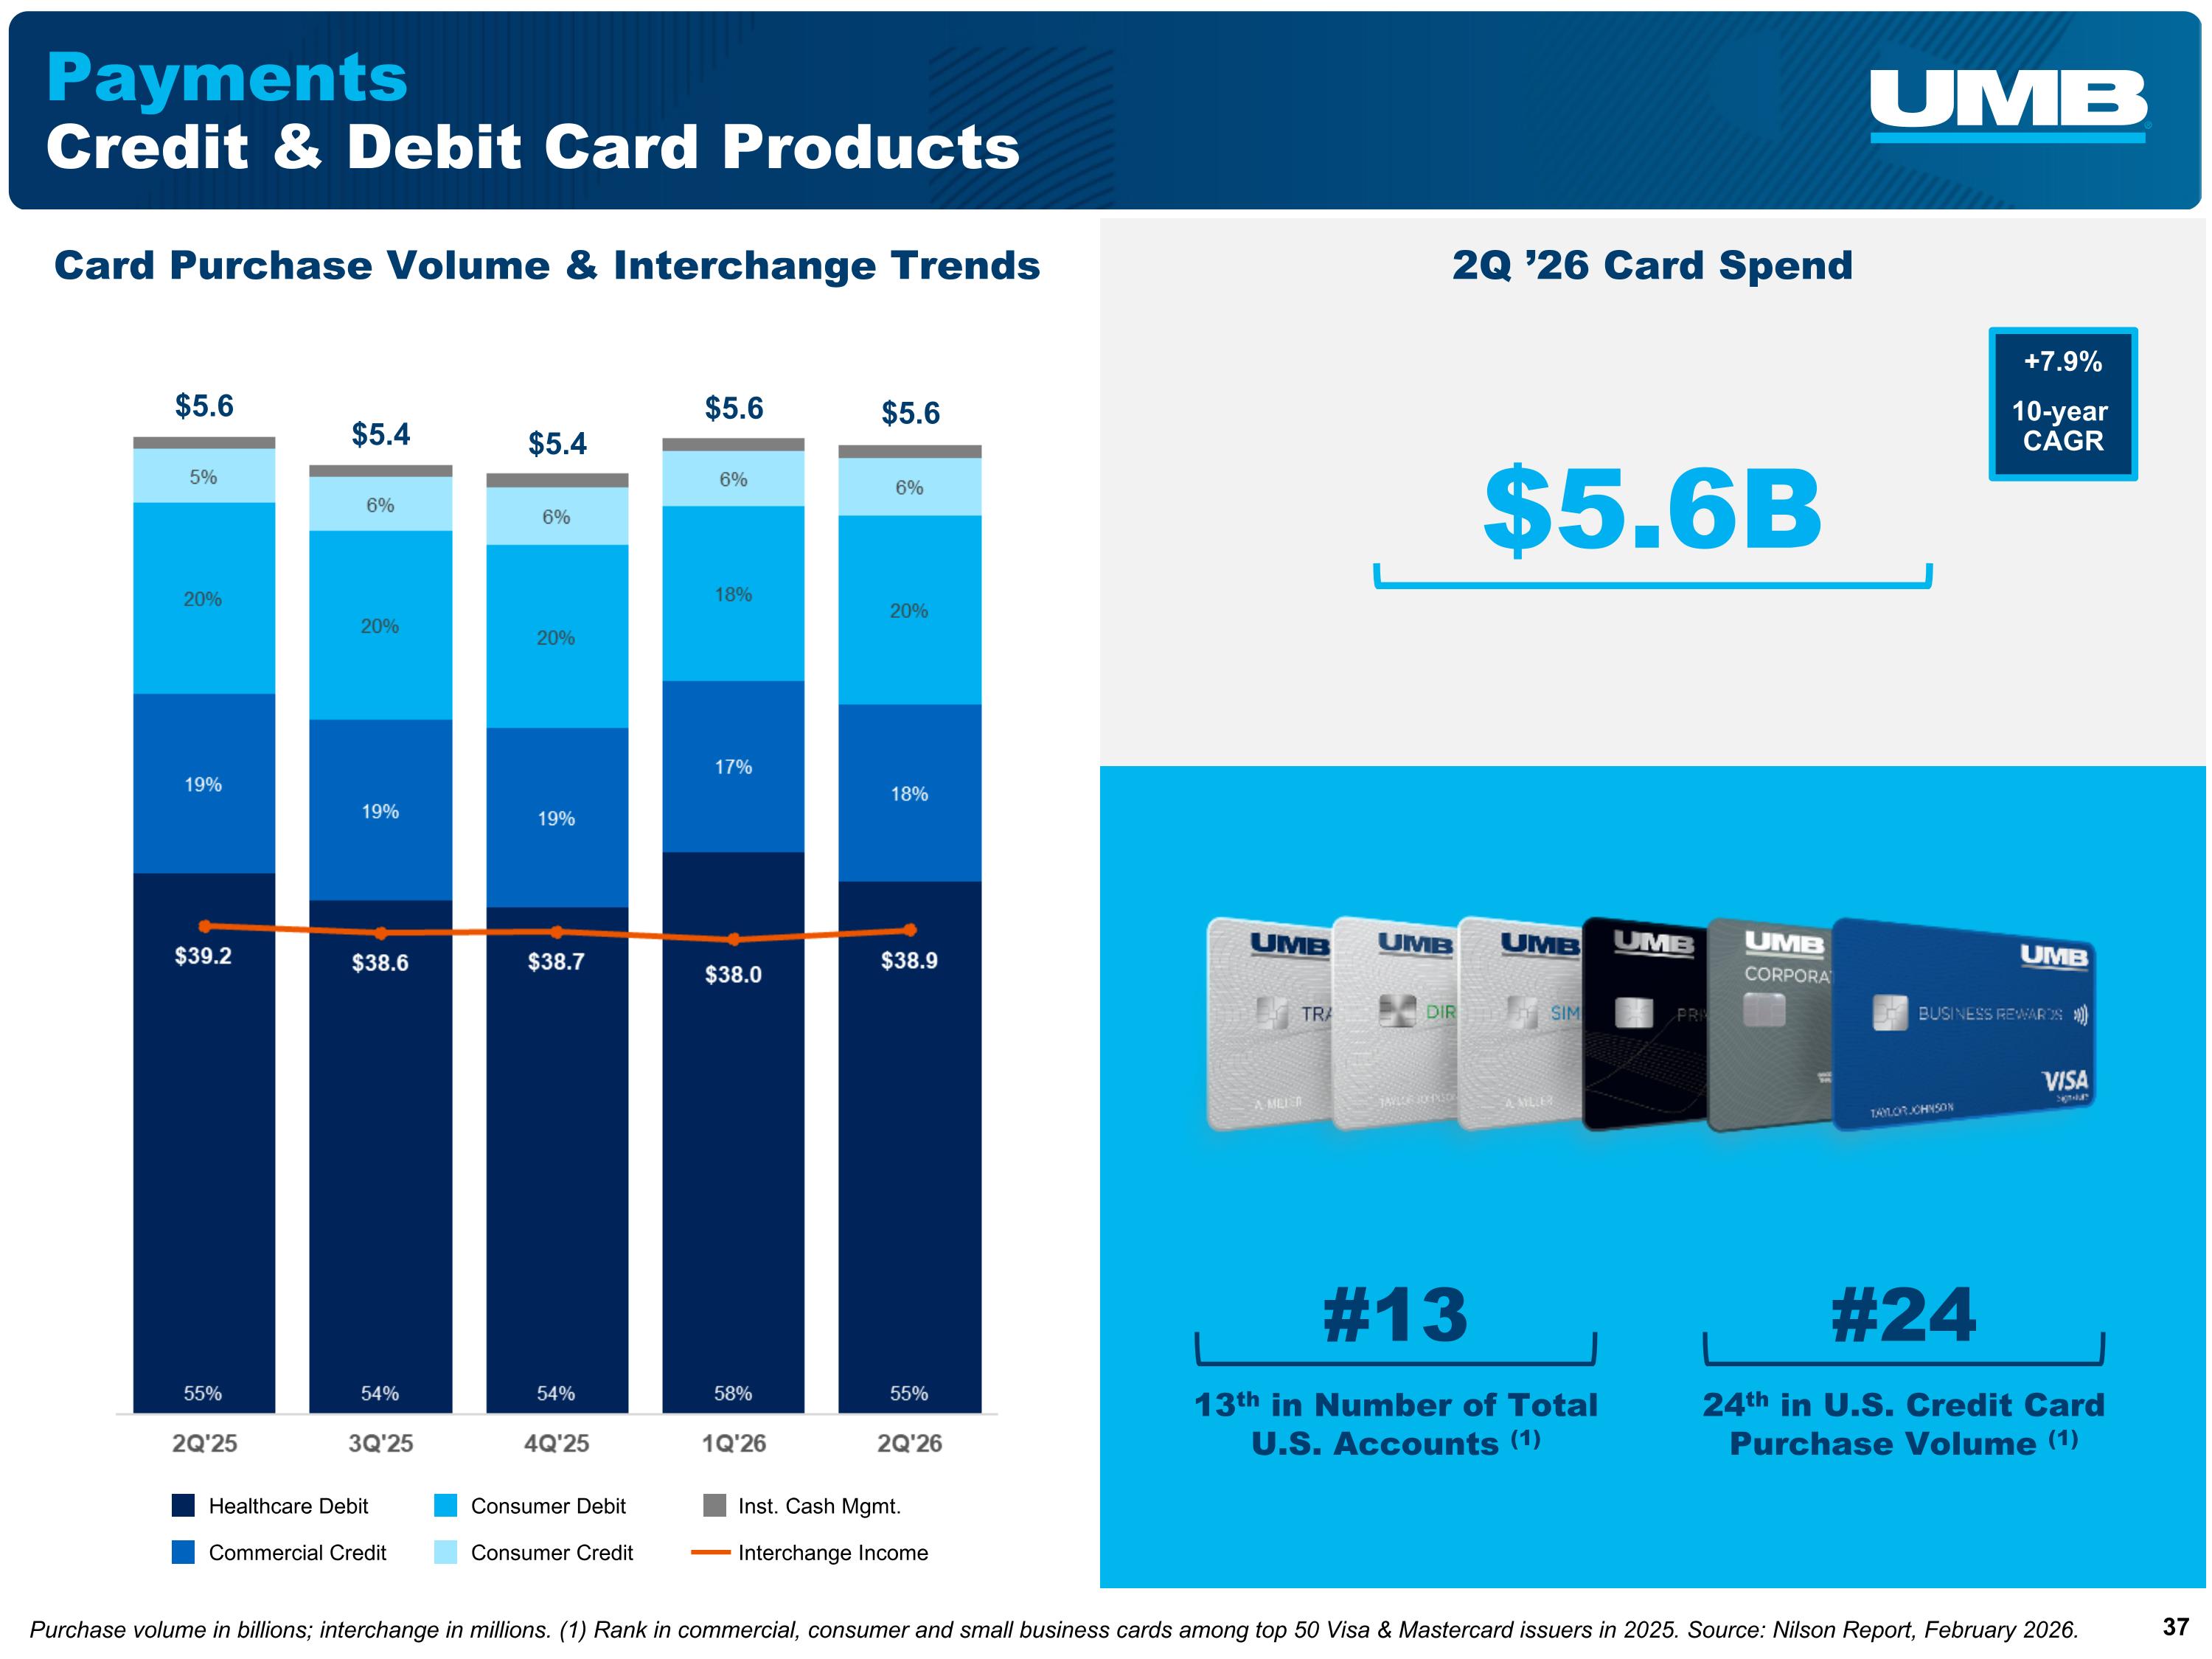
Payments Credit & Debit Card Products Card Purchase Volume & Interchange Trends 24th in U.S. Credit Card Purchase Volume (1) #24 $5.6 $5.6 $5.4 $5.4 $5.6 Interchange Income Consumer Credit Healthcare Debit Commercial Credit Inst. Cash Mgmt. Consumer Debit $5.6B 2Q ’26 Card Spend 13th in Number of Total U.S. Accounts (1) #13 +7.9% 10-year CAGR Purchase volume in billions; interchange in millions. (1) Rank in commercial, consumer and small business cards among top 50 Visa & Mastercard issuers in 2025. Source: Nilson Report, February 2026.
Long-Term Annual Performance Trends
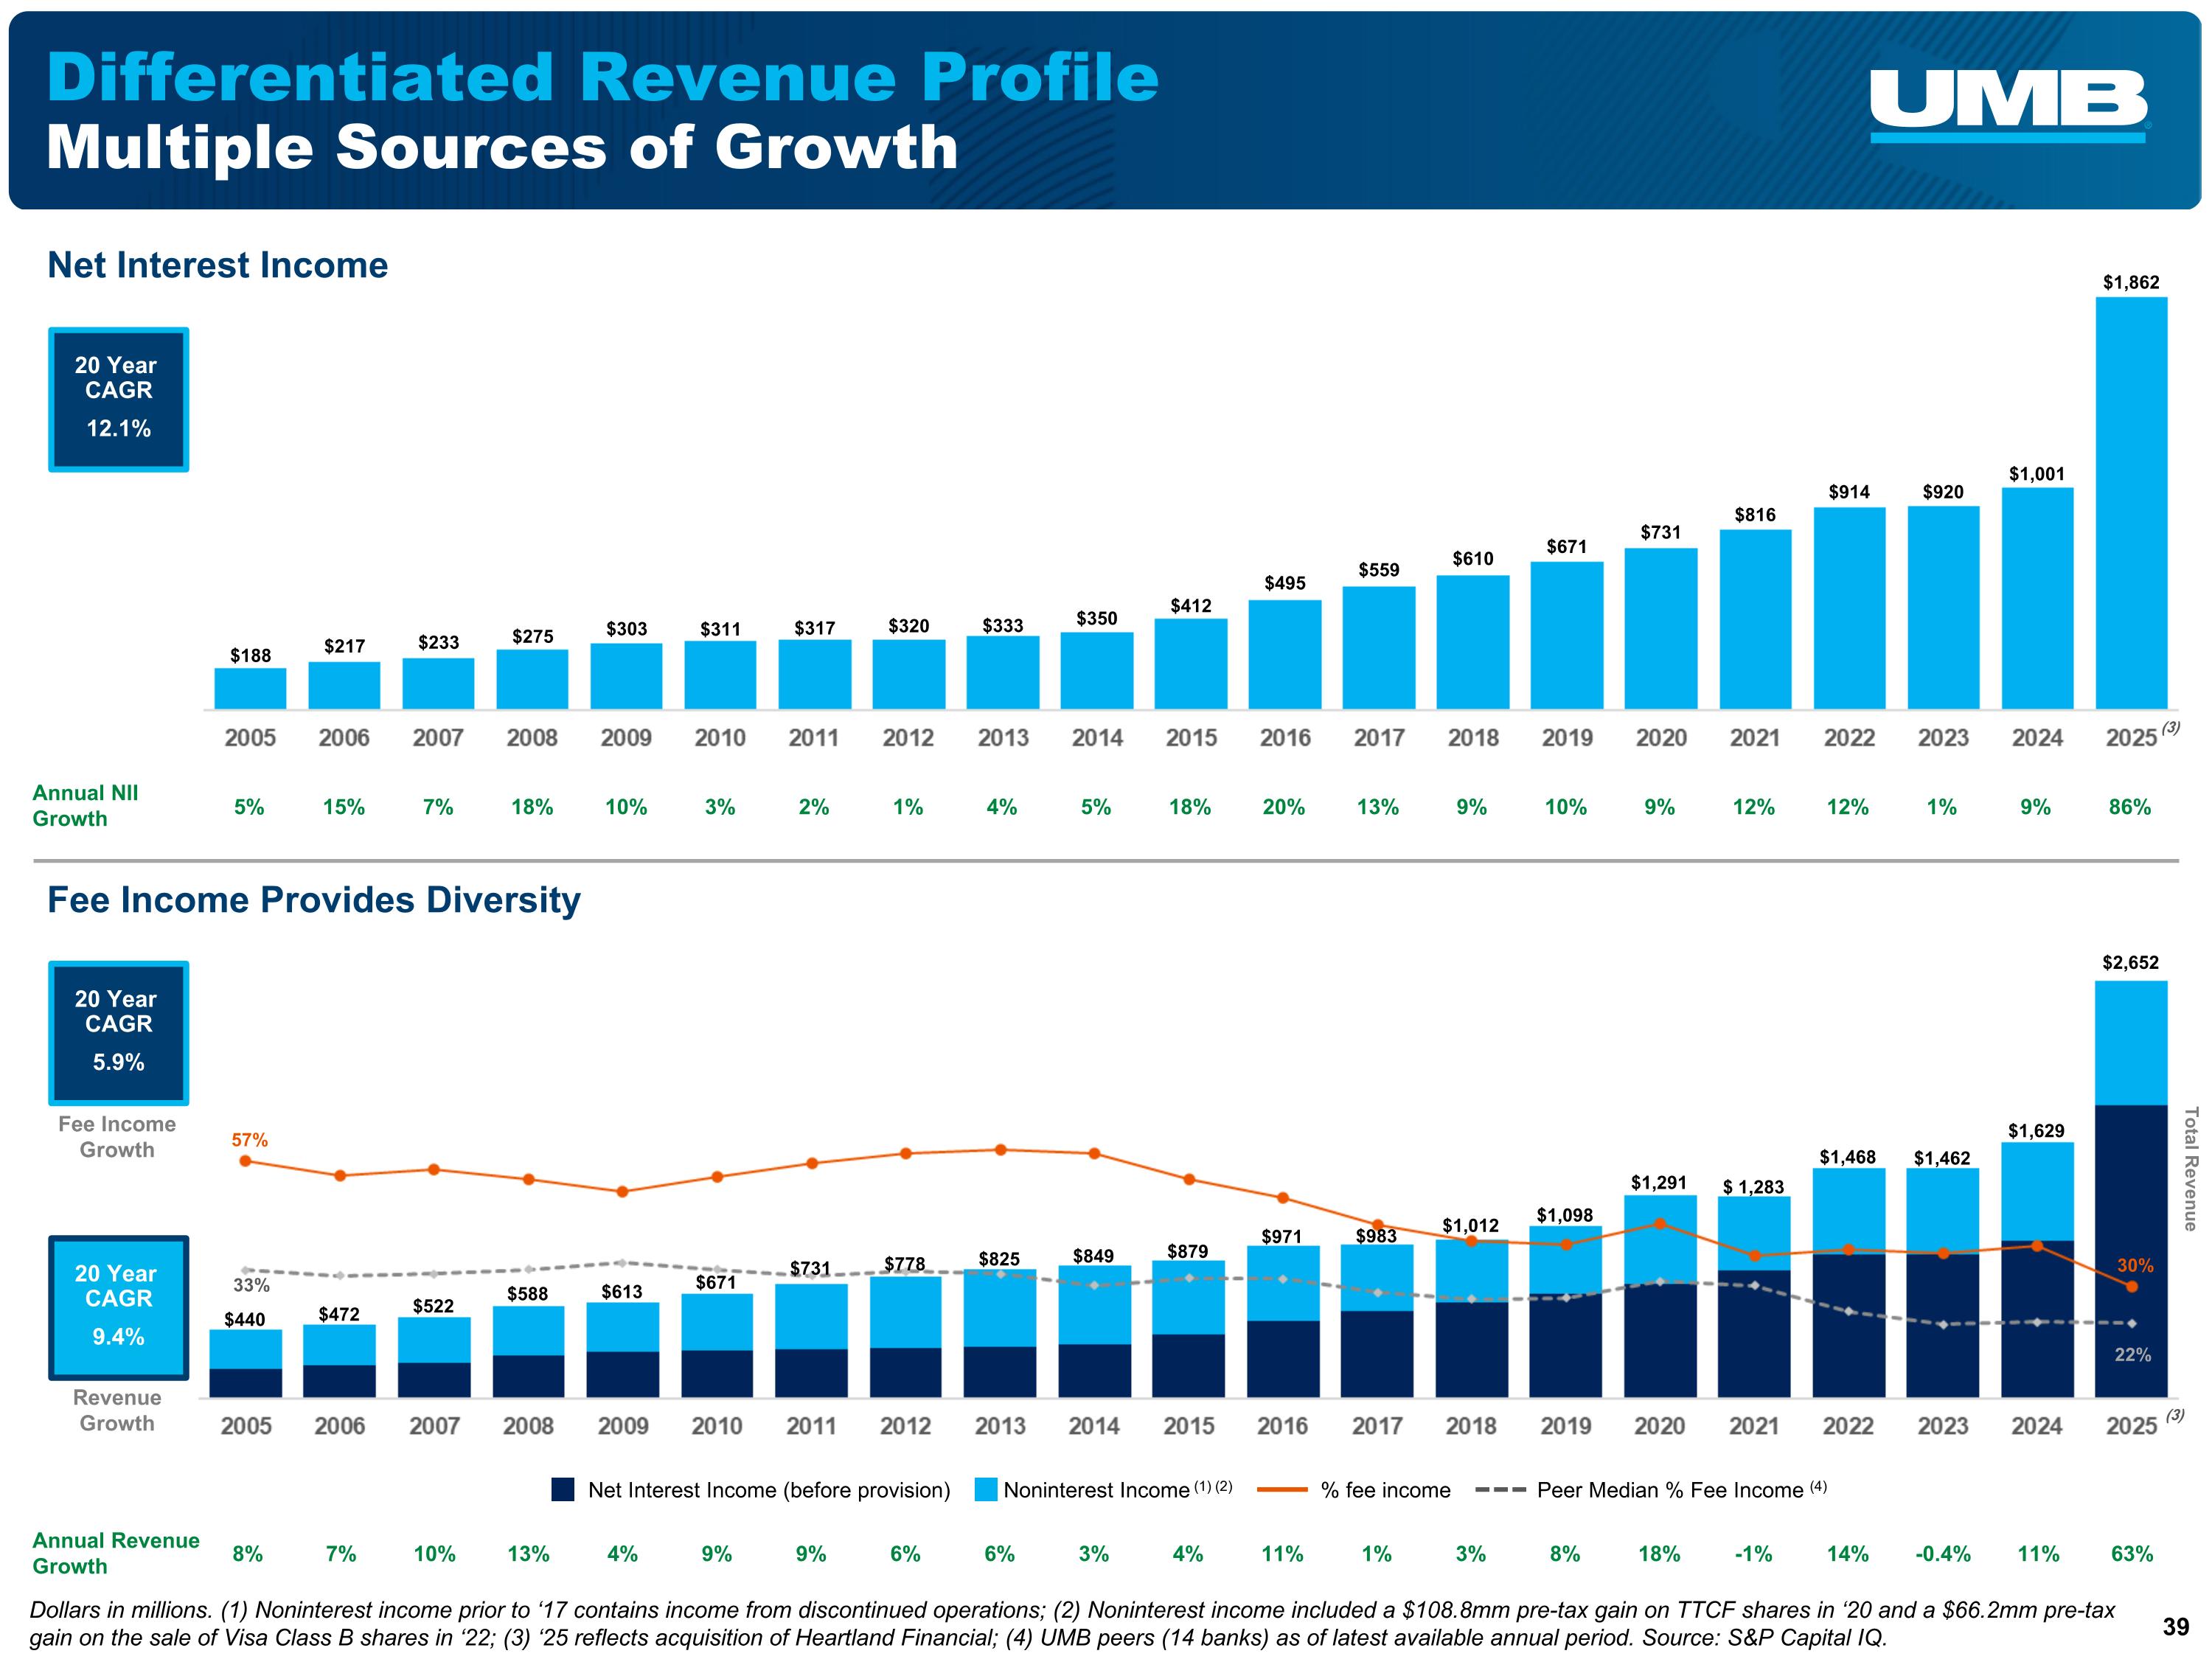
Differentiated Revenue Profile Multiple Sources of Growth Net Interest Income Fee Income Provides Diversity 33% 57% 30% $ 1,283 $1,291 $1,468 $613 $1,462 $731 $588 $778 $671 $825 $879 $983 $849 $1,012 $971 $1,098 Total Revenue 20 Year CAGR 9.4% Revenue Growth Annual NII Growth Annual Revenue Growth 12% 12% 18% 10% 3% 2% 1% 9% 4% 5% 18% 20% 13% 9% 10% -1% 14% -0.4% 13% 4% 9% 9% 6% 18% 6% 3% 4% 11% 1% 3% 8% 20 Year CAGR 5.9% Fee Income Growth $816 $731 $914 $303 $920 $317 $275 $320 $311 $333 $412 $559 $350 $610 $495 $671 1% 22% Net Interest Income (before provision) Noninterest Income (1) (2) % fee income Peer Median % Fee Income (4) Dollars in millions. (1) Noninterest income prior to ‘17 contains income from discontinued operations; (2) Noninterest income included a $108.8mm pre-tax gain on TTCF shares in ‘20 and a $66.2mm pre-tax gain on the sale of Visa Class B shares in ‘22; (3) ‘25 reflects acquisition of Heartland Financial; (4) UMB peers (14 banks) as of latest available annual period. Source: S&P Capital IQ. $188 $233 $1,862 $217 $1,001 $1,629 $440 $522 $2,652 $472 63% 8% 7% 10% 11% 86% 5% 15% 7% 9% 20 Year CAGR 12.1% (3) (3)
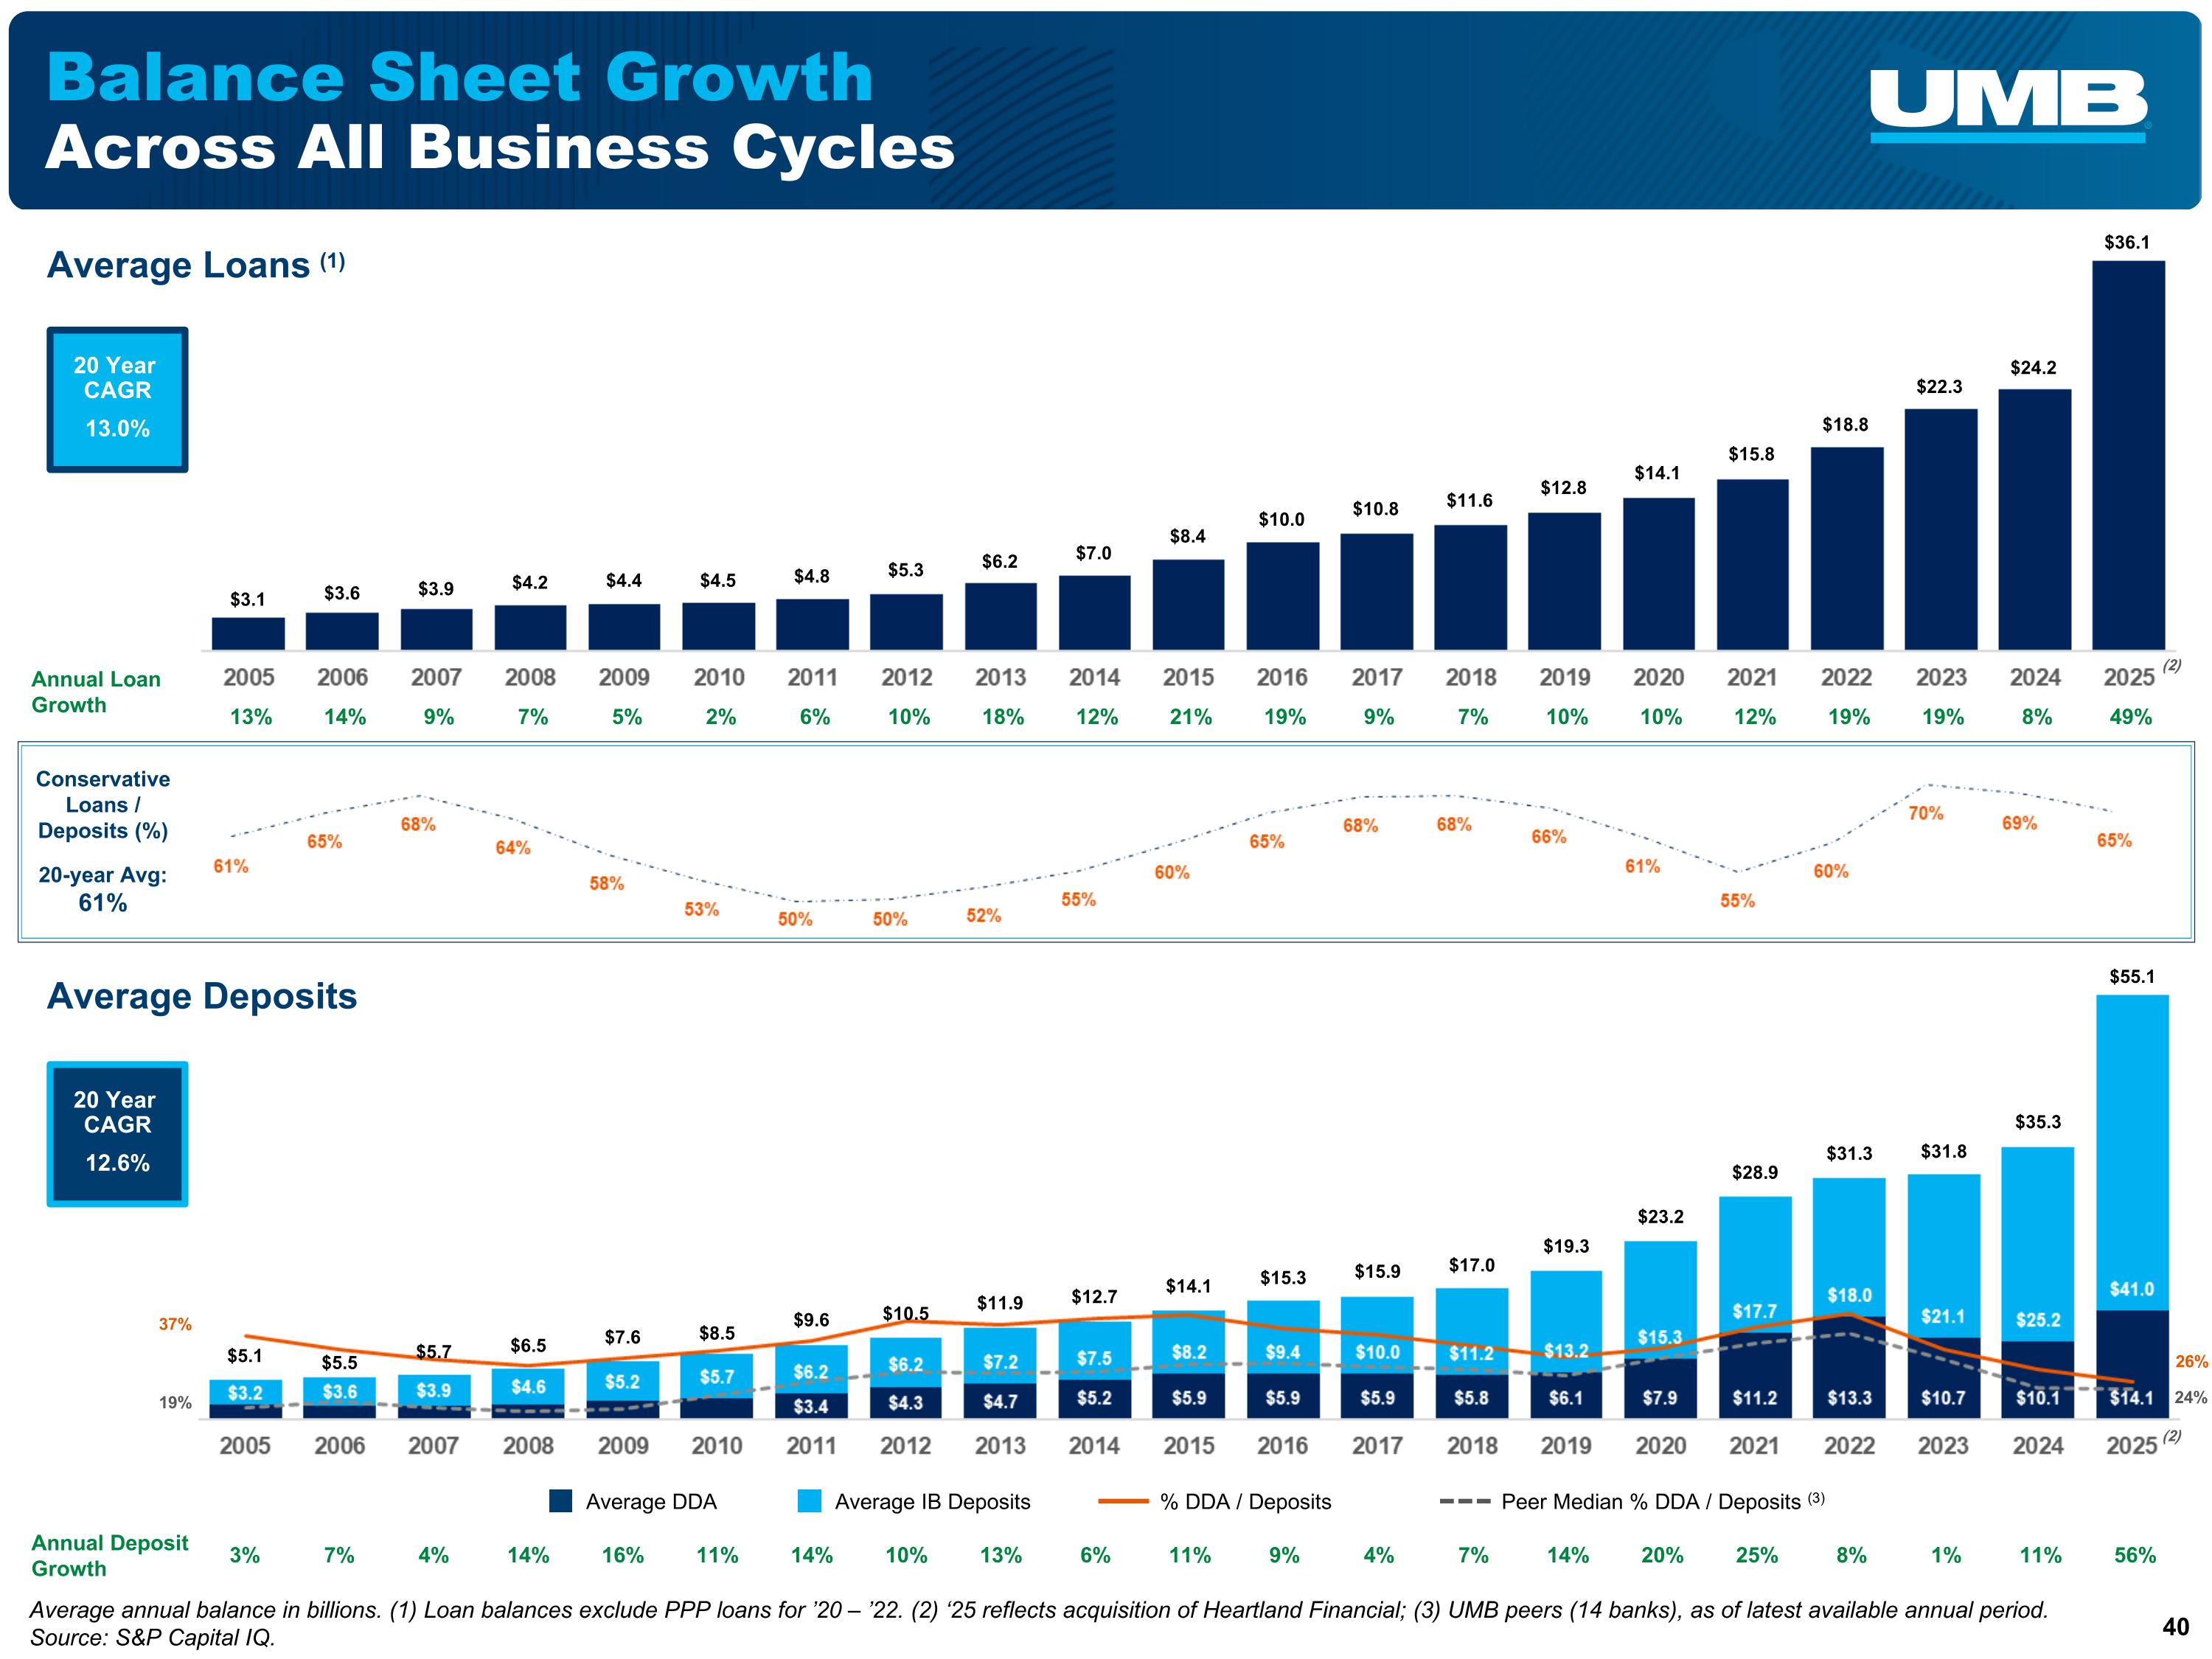
7% Balance Sheet Growth Across All Business Cycles Average Loans (1) Average annual balance in billions. (1) Loan balances exclude PPP loans for ’20 – ’22. (2) ‘25 reflects acquisition of Heartland Financial; (3) UMB peers (14 banks), as of latest available annual period. Source: S&P Capital IQ. Average Deposits Annual Loan Growth 12% 19% 19% 5% 2% 6% 10% 10% 18% 12% 21% 19% 9% 7% 10% 20 Year CAGR 13.0% 8% 49% 13% 14% 9% 8% 19% 37% 26% 25% 1% 14% 16% 11% 14% 10% 20% 13% 6% 11% 9% 4% 7% 14% 24% 20 Year CAGR 12.6% 11% 56% 3% 7% 4% Conservative Loans / Deposits (%) 20-year Avg: 61% Annual Deposit Growth Average IB Deposits % DDA / Deposits Peer Median % DDA / Deposits (3) Average DDA $28.9 $23.2 $31.3 $7.6 $31.8 $9.6 $6.5 $10.5 $8.5 $11.9 $14.1 $15.9 $12.7 $17.0 $15.3 $19.3 $5.1 $5.7 $55.1 $5.5 $35.3 $15.8 $14.1 $18.8 $4.4 $22.3 $4.8 $4.2 $5.3 $4.5 $6.2 $8.4 $10.8 $7.0 $11.6 $10.0 $12.8 $3.1 $3.9 $36.1 $3.6 $24.2 (2) (2)
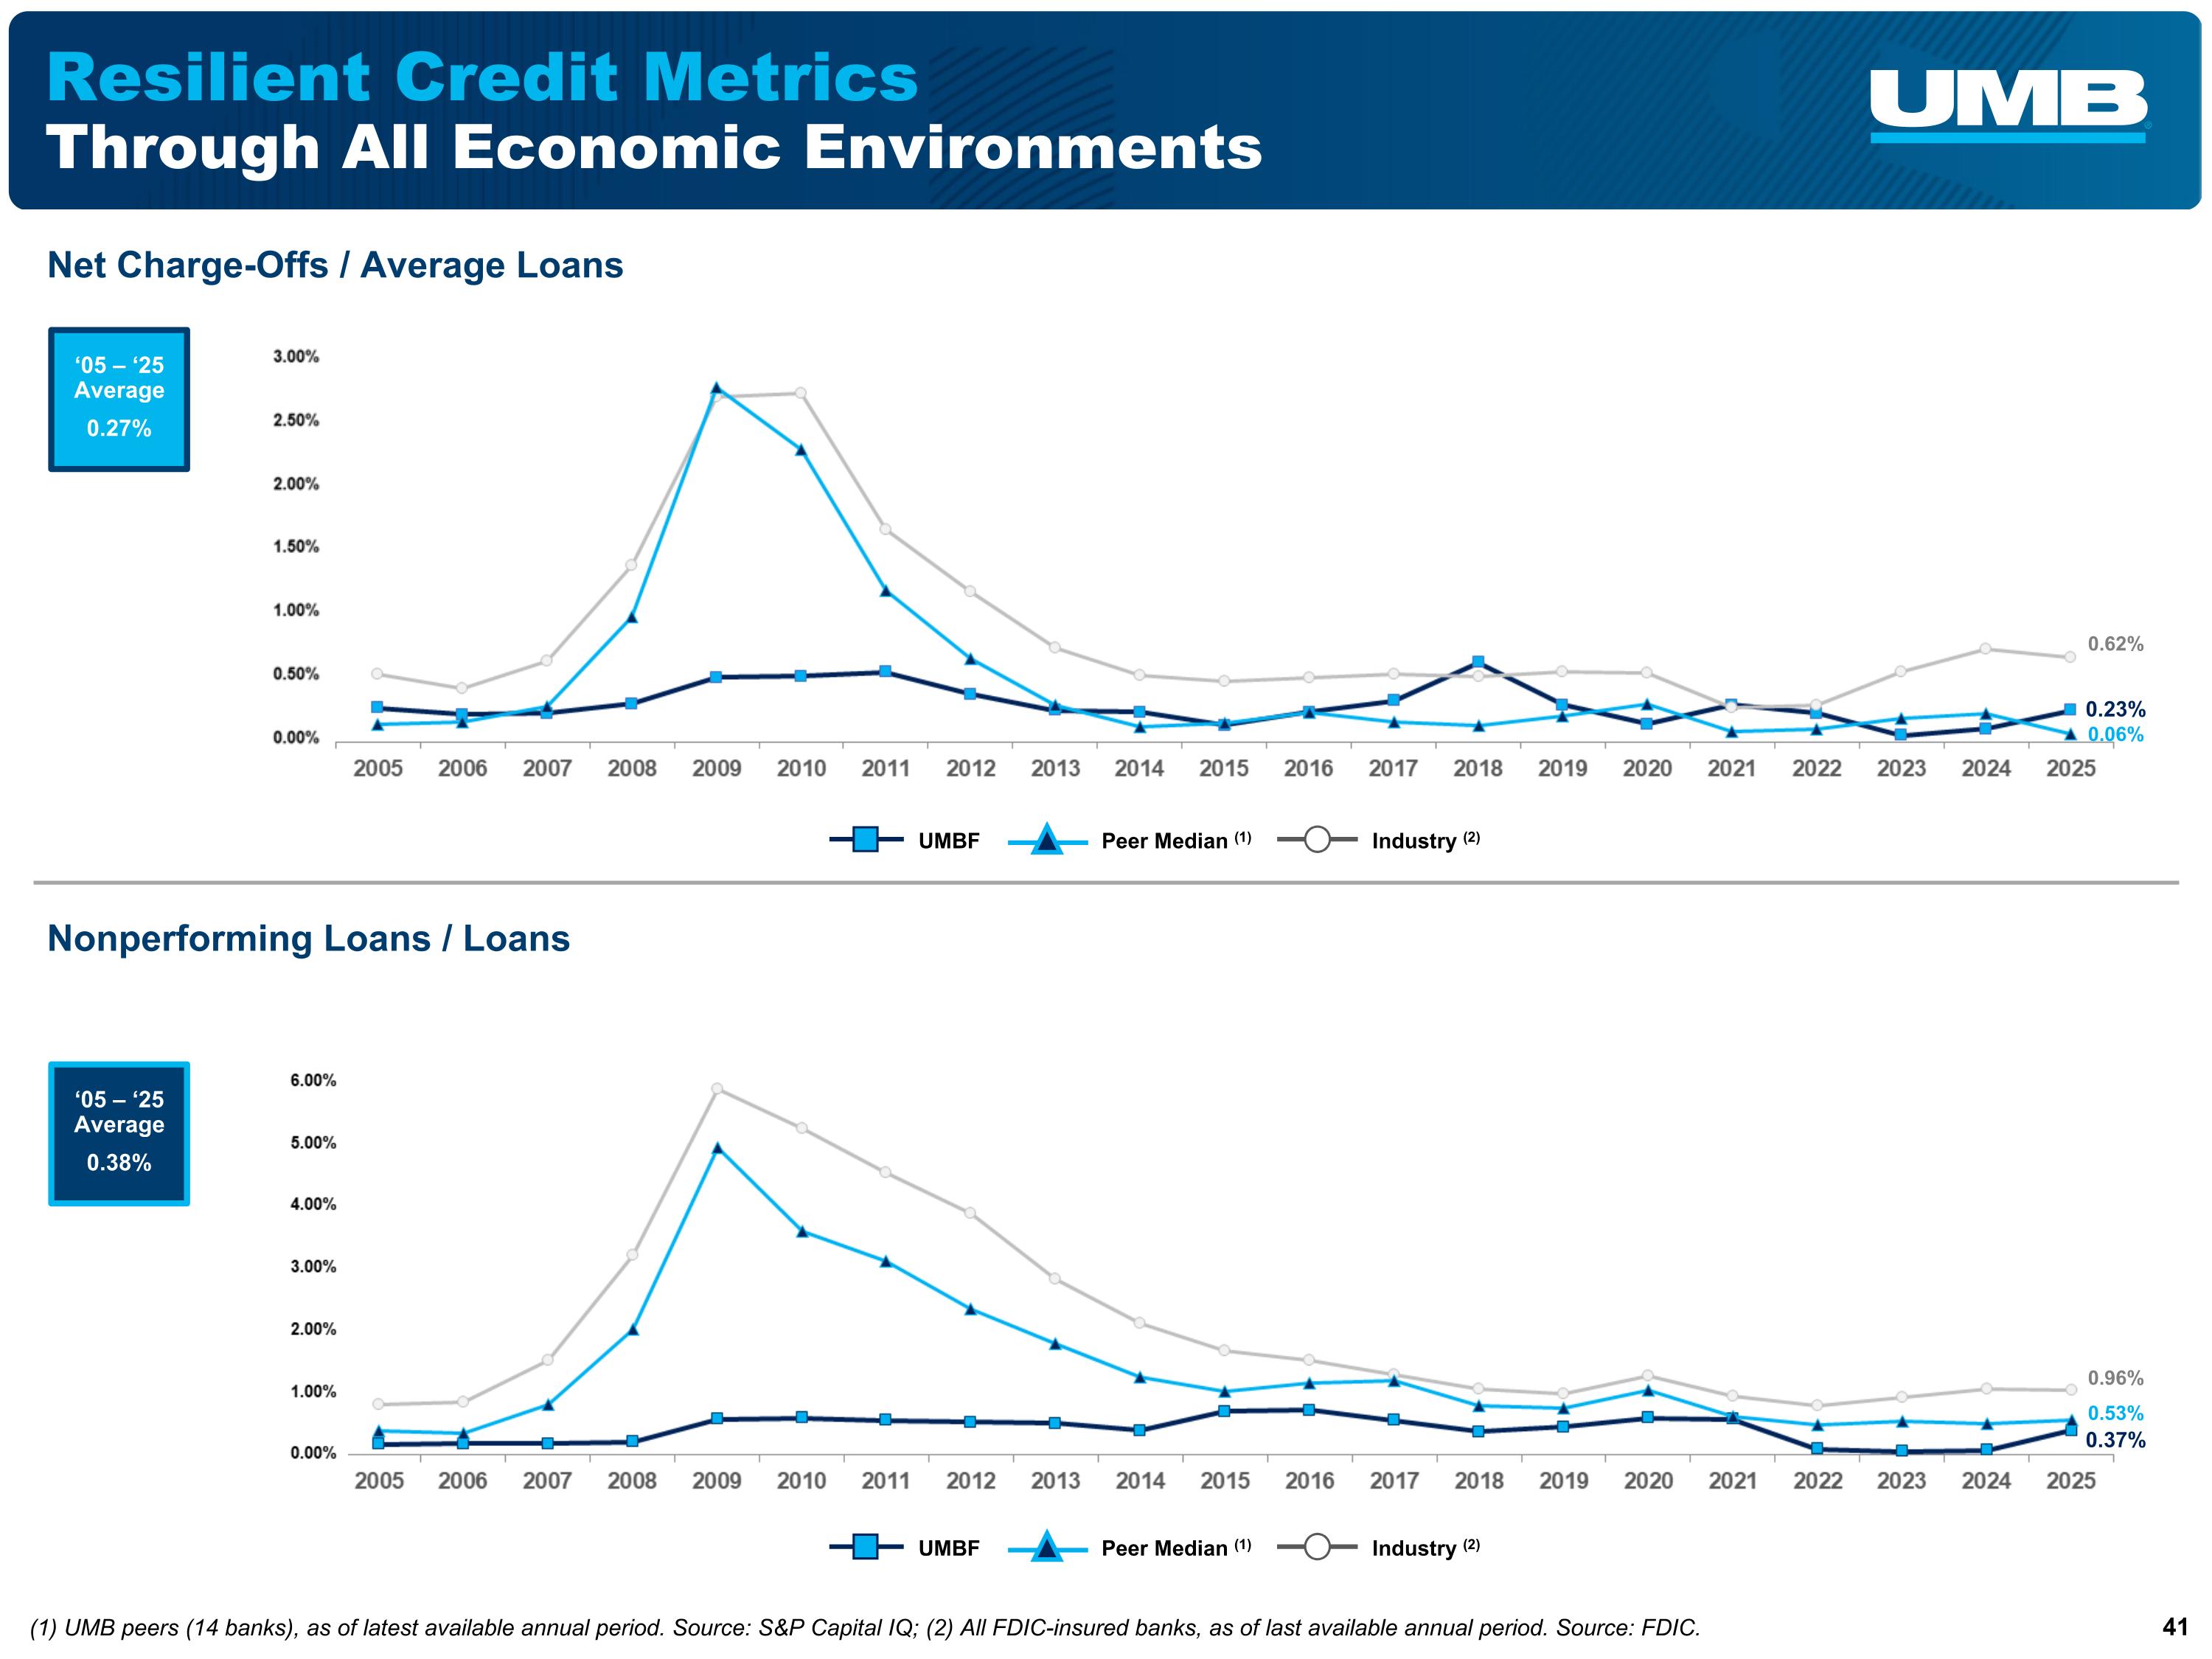
Resilient Credit Metrics Through All Economic Environments Net Charge-Offs / Average Loans Nonperforming Loans / Loans Industry (2) UMBF Peer Median (1) Industry (2) UMBF Peer Median (1) (1) UMB peers (14 banks), as of latest available annual period. Source: S&P Capital IQ; (2) All FDIC-insured banks, as of last available annual period. Source: FDIC. 0.23% ‘05 – ‘25 Average 0.27% ‘05 – ‘25 Average 0.38% 0.06% 0.62% 0.37% 0.53% 0.96%
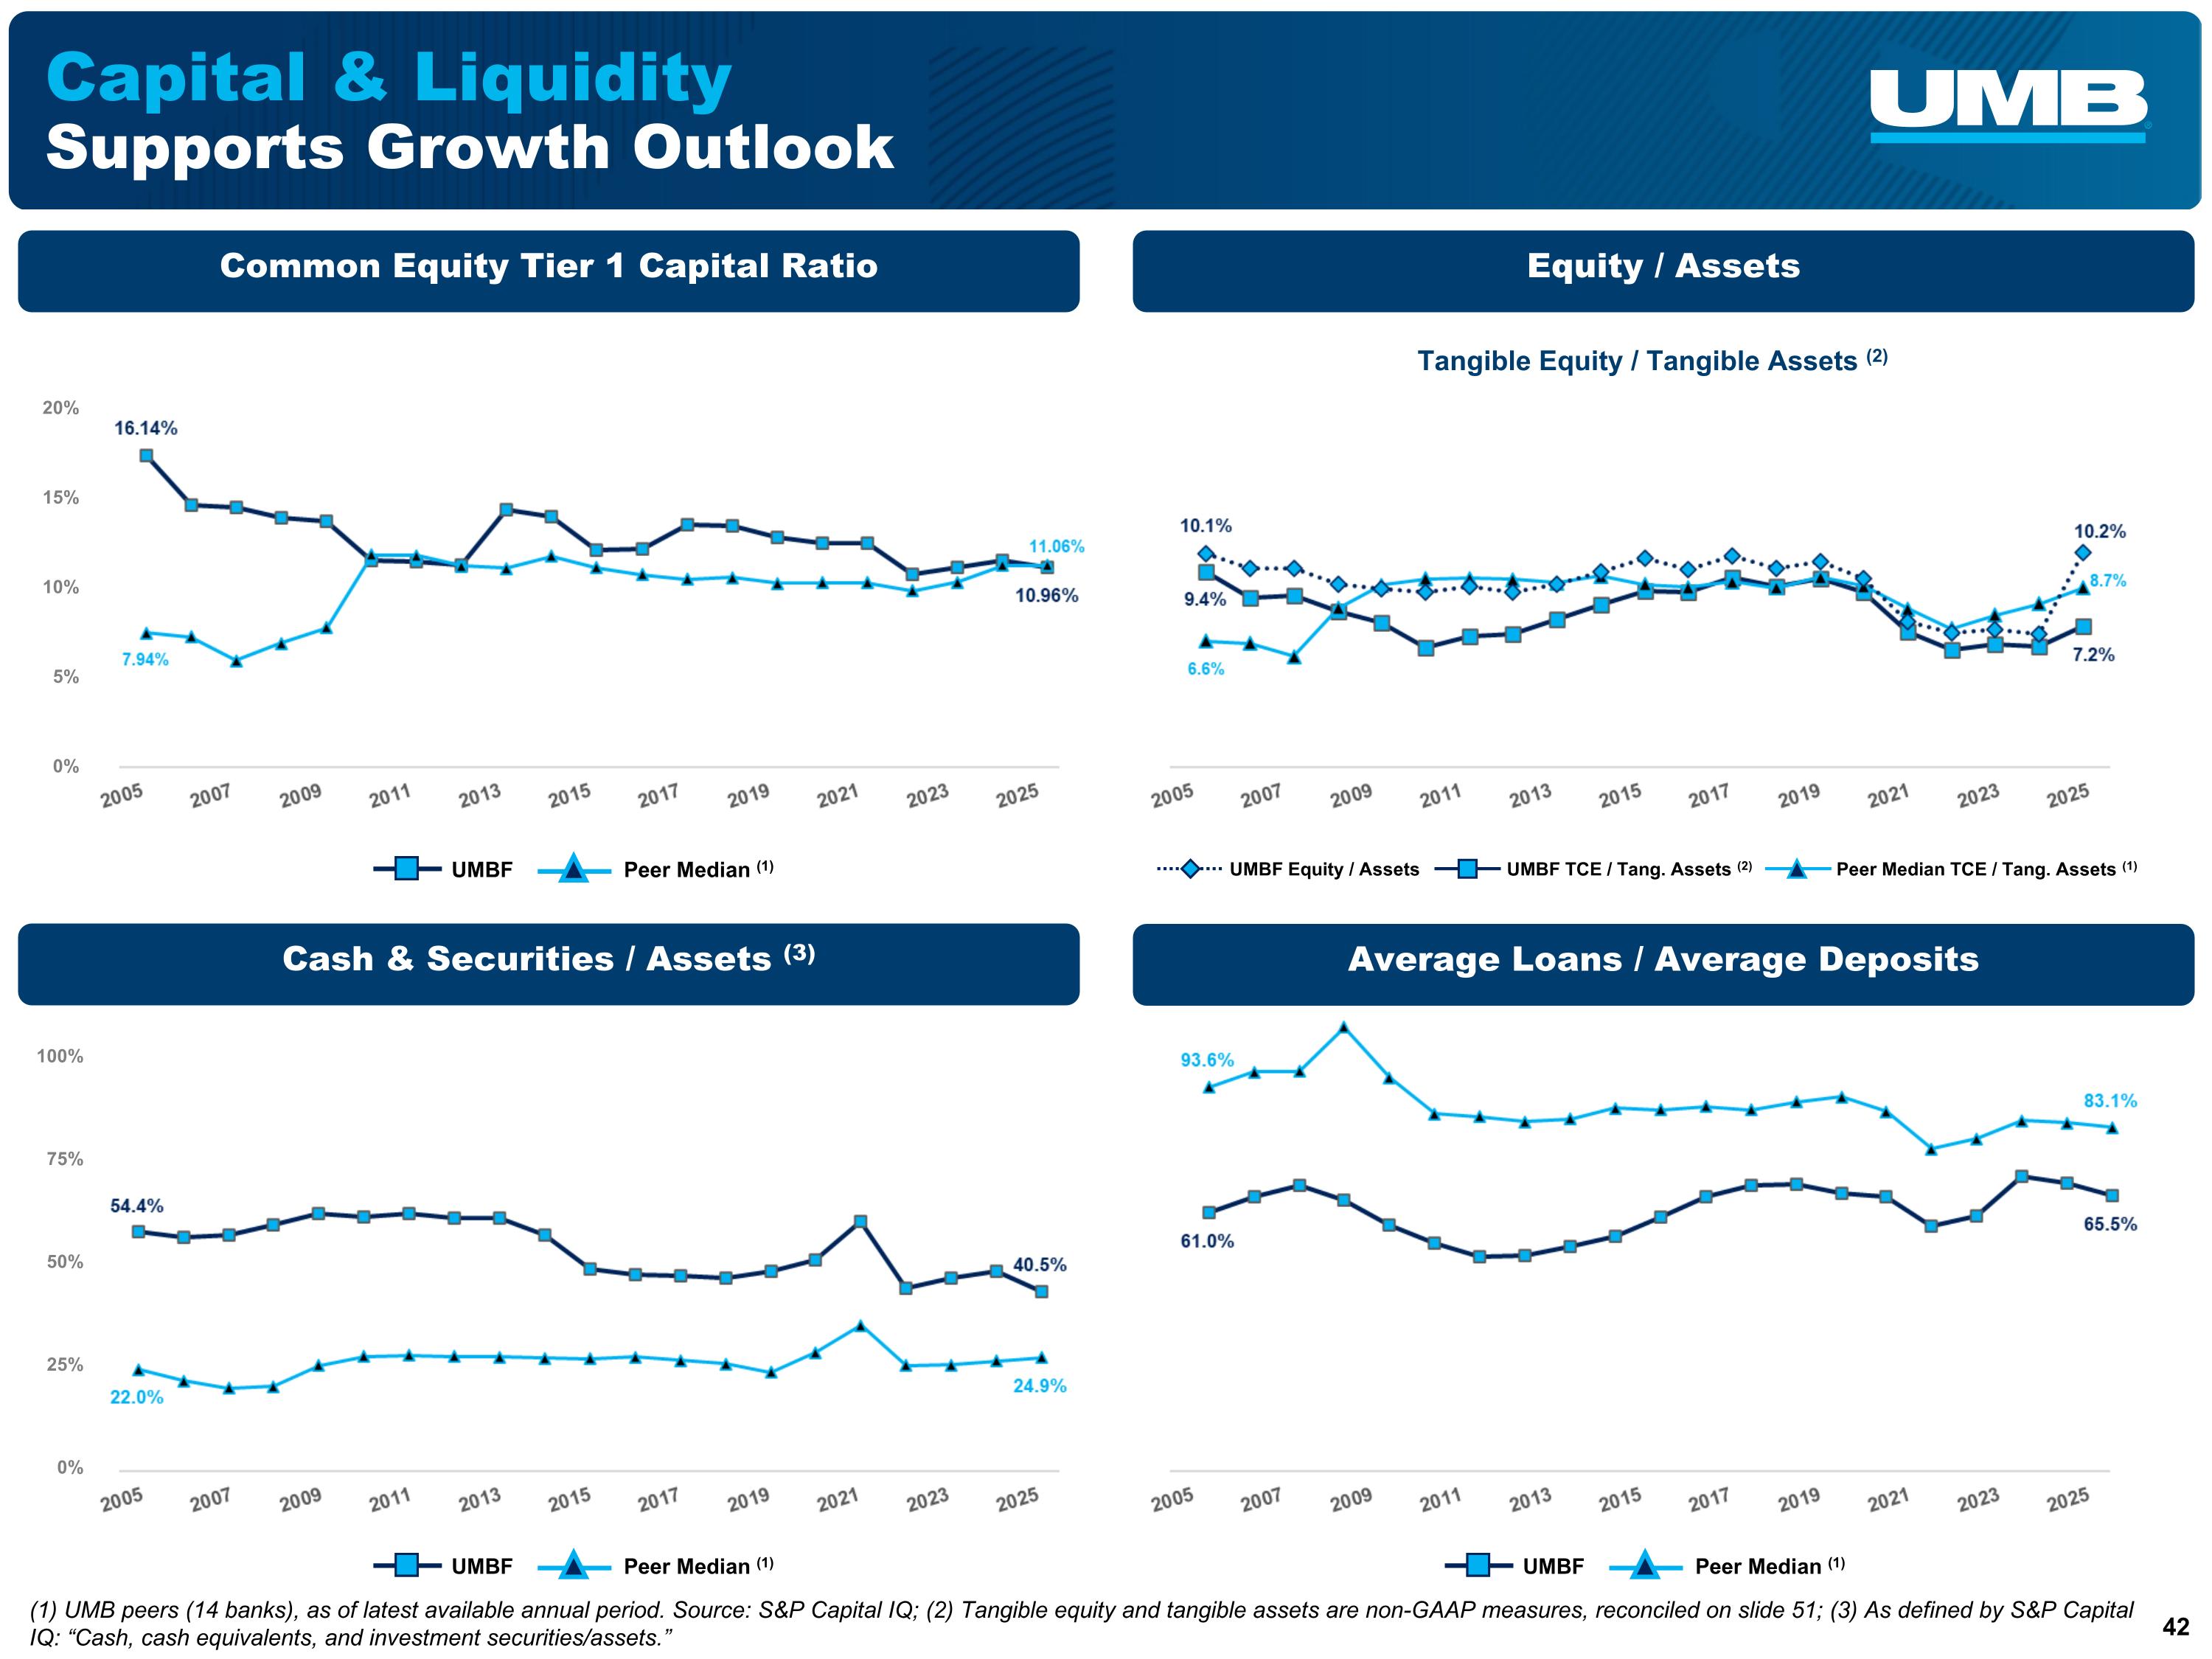
Capital & Liquidity Supports Growth Outlook UMBF Peer Median (1) UMBF Peer Median (1) UMBF Peer Median (1) (1) UMB peers (14 banks), as of latest available annual period. Source: S&P Capital IQ; (2) Tangible equity and tangible assets are non-GAAP measures, reconciled on slide 51; (3) As defined by S&P Capital IQ: “Cash, cash equivalents, and investment securities/assets.” Tangible Equity / Tangible Assets (2) Peer Median TCE / Tang. Assets (1) UMBF Equity / Assets UMBF TCE / Tang. Assets (2) Common Equity Tier 1 Capital Ratio Equity / Assets Cash & Securities / Assets (3) Average Loans / Average Deposits 20% 15% 10% 5% 0% 100% 75% 50% 25% 0%
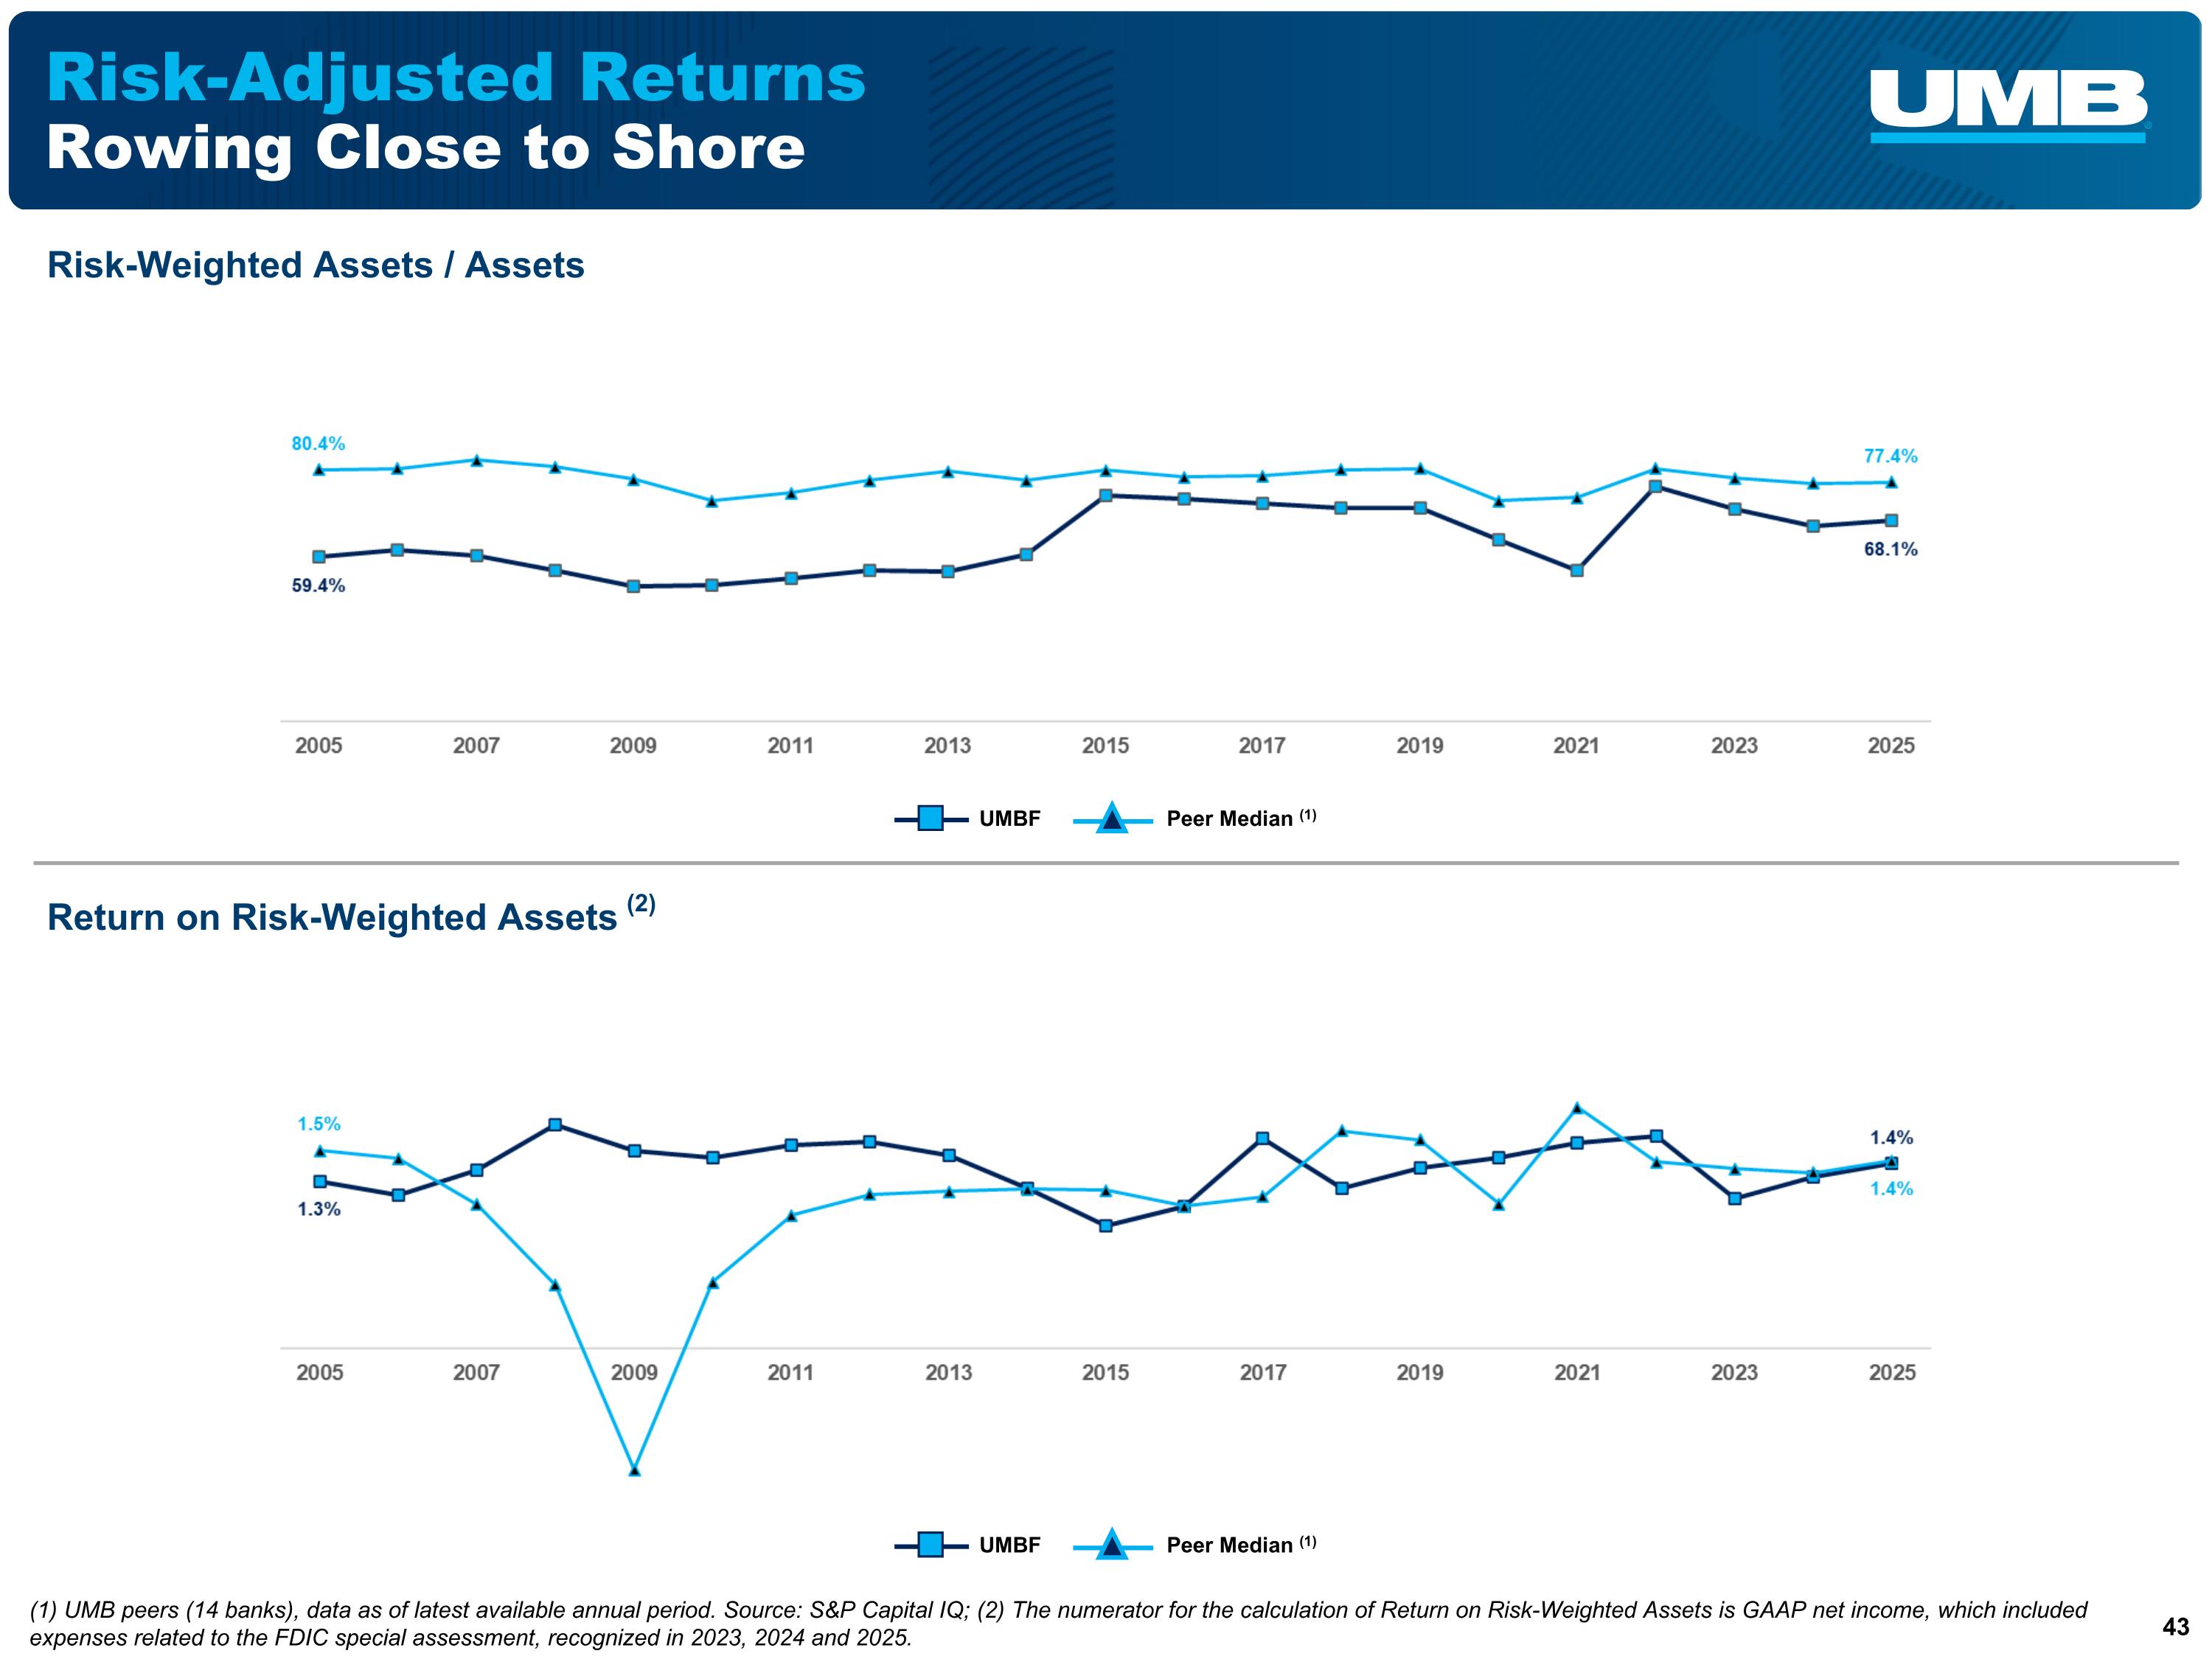
Risk-Adjusted Returns Rowing Close to Shore UMBF Peer Median (1) (1) UMB peers (14 banks), data as of latest available annual period. Source: S&P Capital IQ; (2) The numerator for the calculation of Return on Risk-Weighted Assets is GAAP net income, which included expenses related to the FDIC special assessment, recognized in 2023, 2024 and 2025. UMBF Peer Median (1) Risk-Weighted Assets / Assets Return on Risk-Weighted Assets (2)
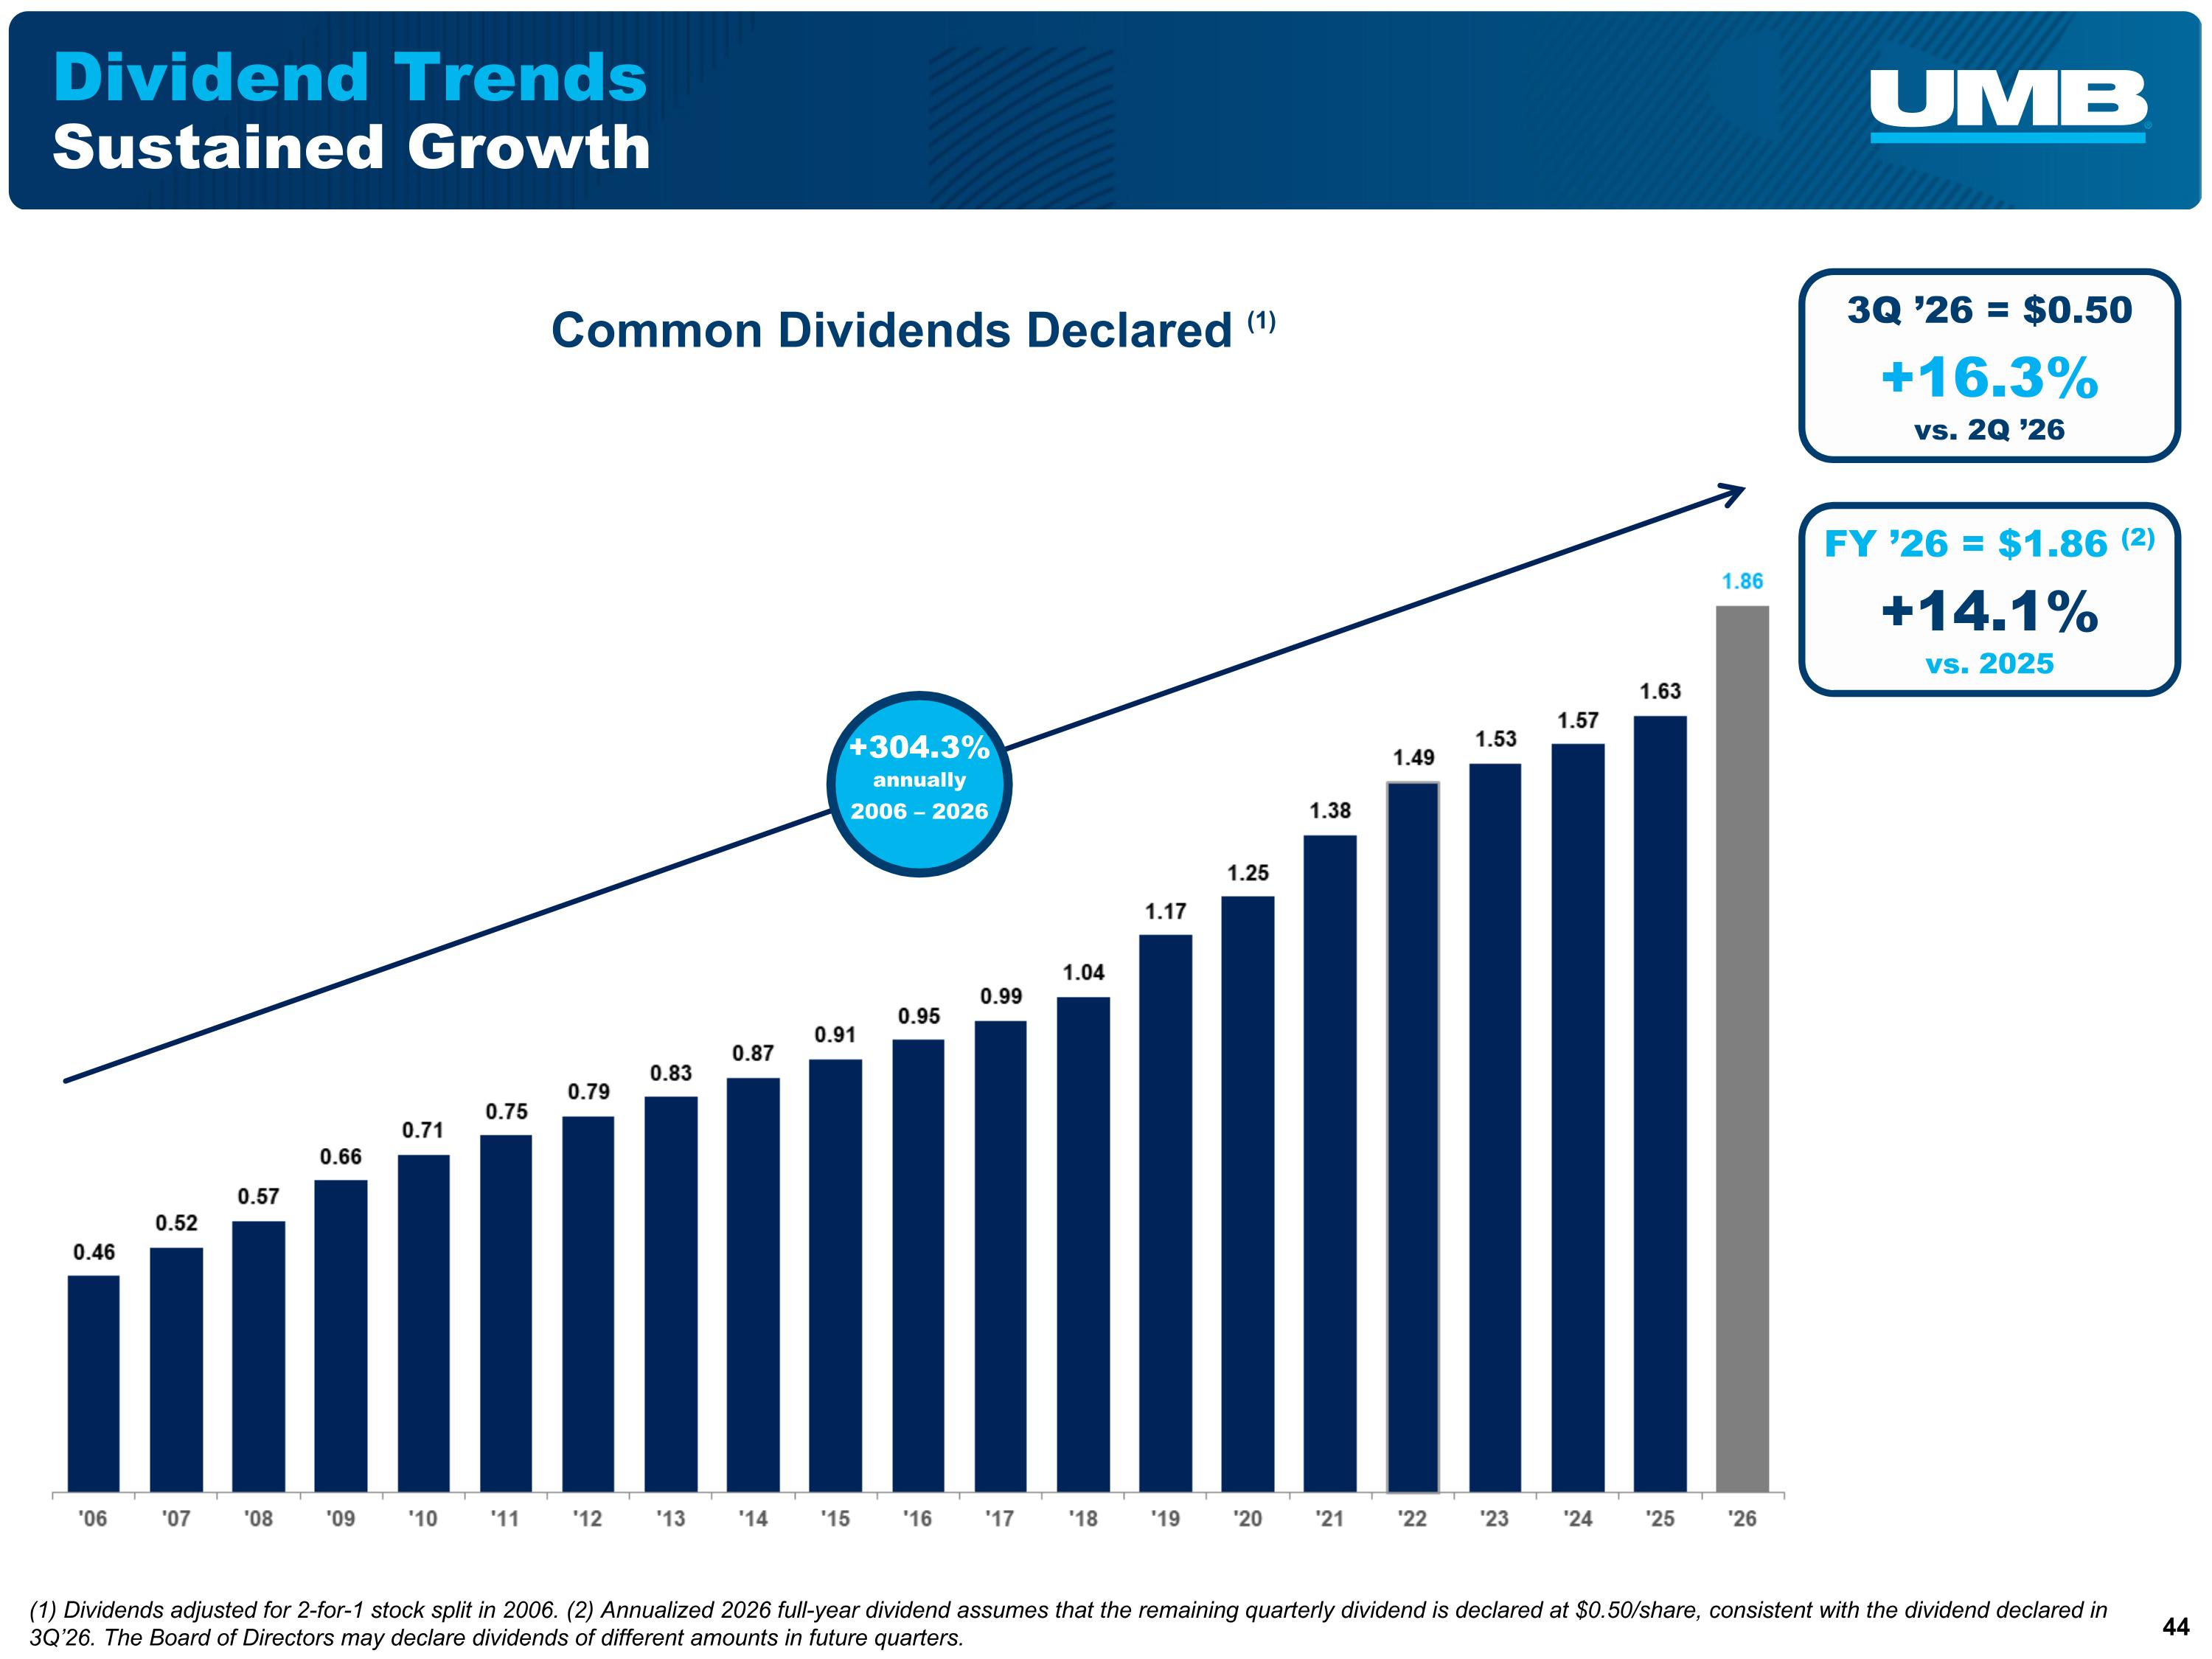
Dividend Trends Sustained Growth (1) Dividends adjusted for 2-for-1 stock split in 2006. (2) Annualized 2026 full-year dividend assumes that the remaining quarterly dividend is declared at $0.50/share, consistent with the dividend declared in 3Q’26. The Board of Directors may declare dividends of different amounts in future quarters. Common Dividends Declared (1) FY ’26 = $1.86 (2) +14.1% vs. 2025 +304.3% annually 2006 – 2026 3Q ’26 = $0.50 +16.3% vs. 2Q ’26
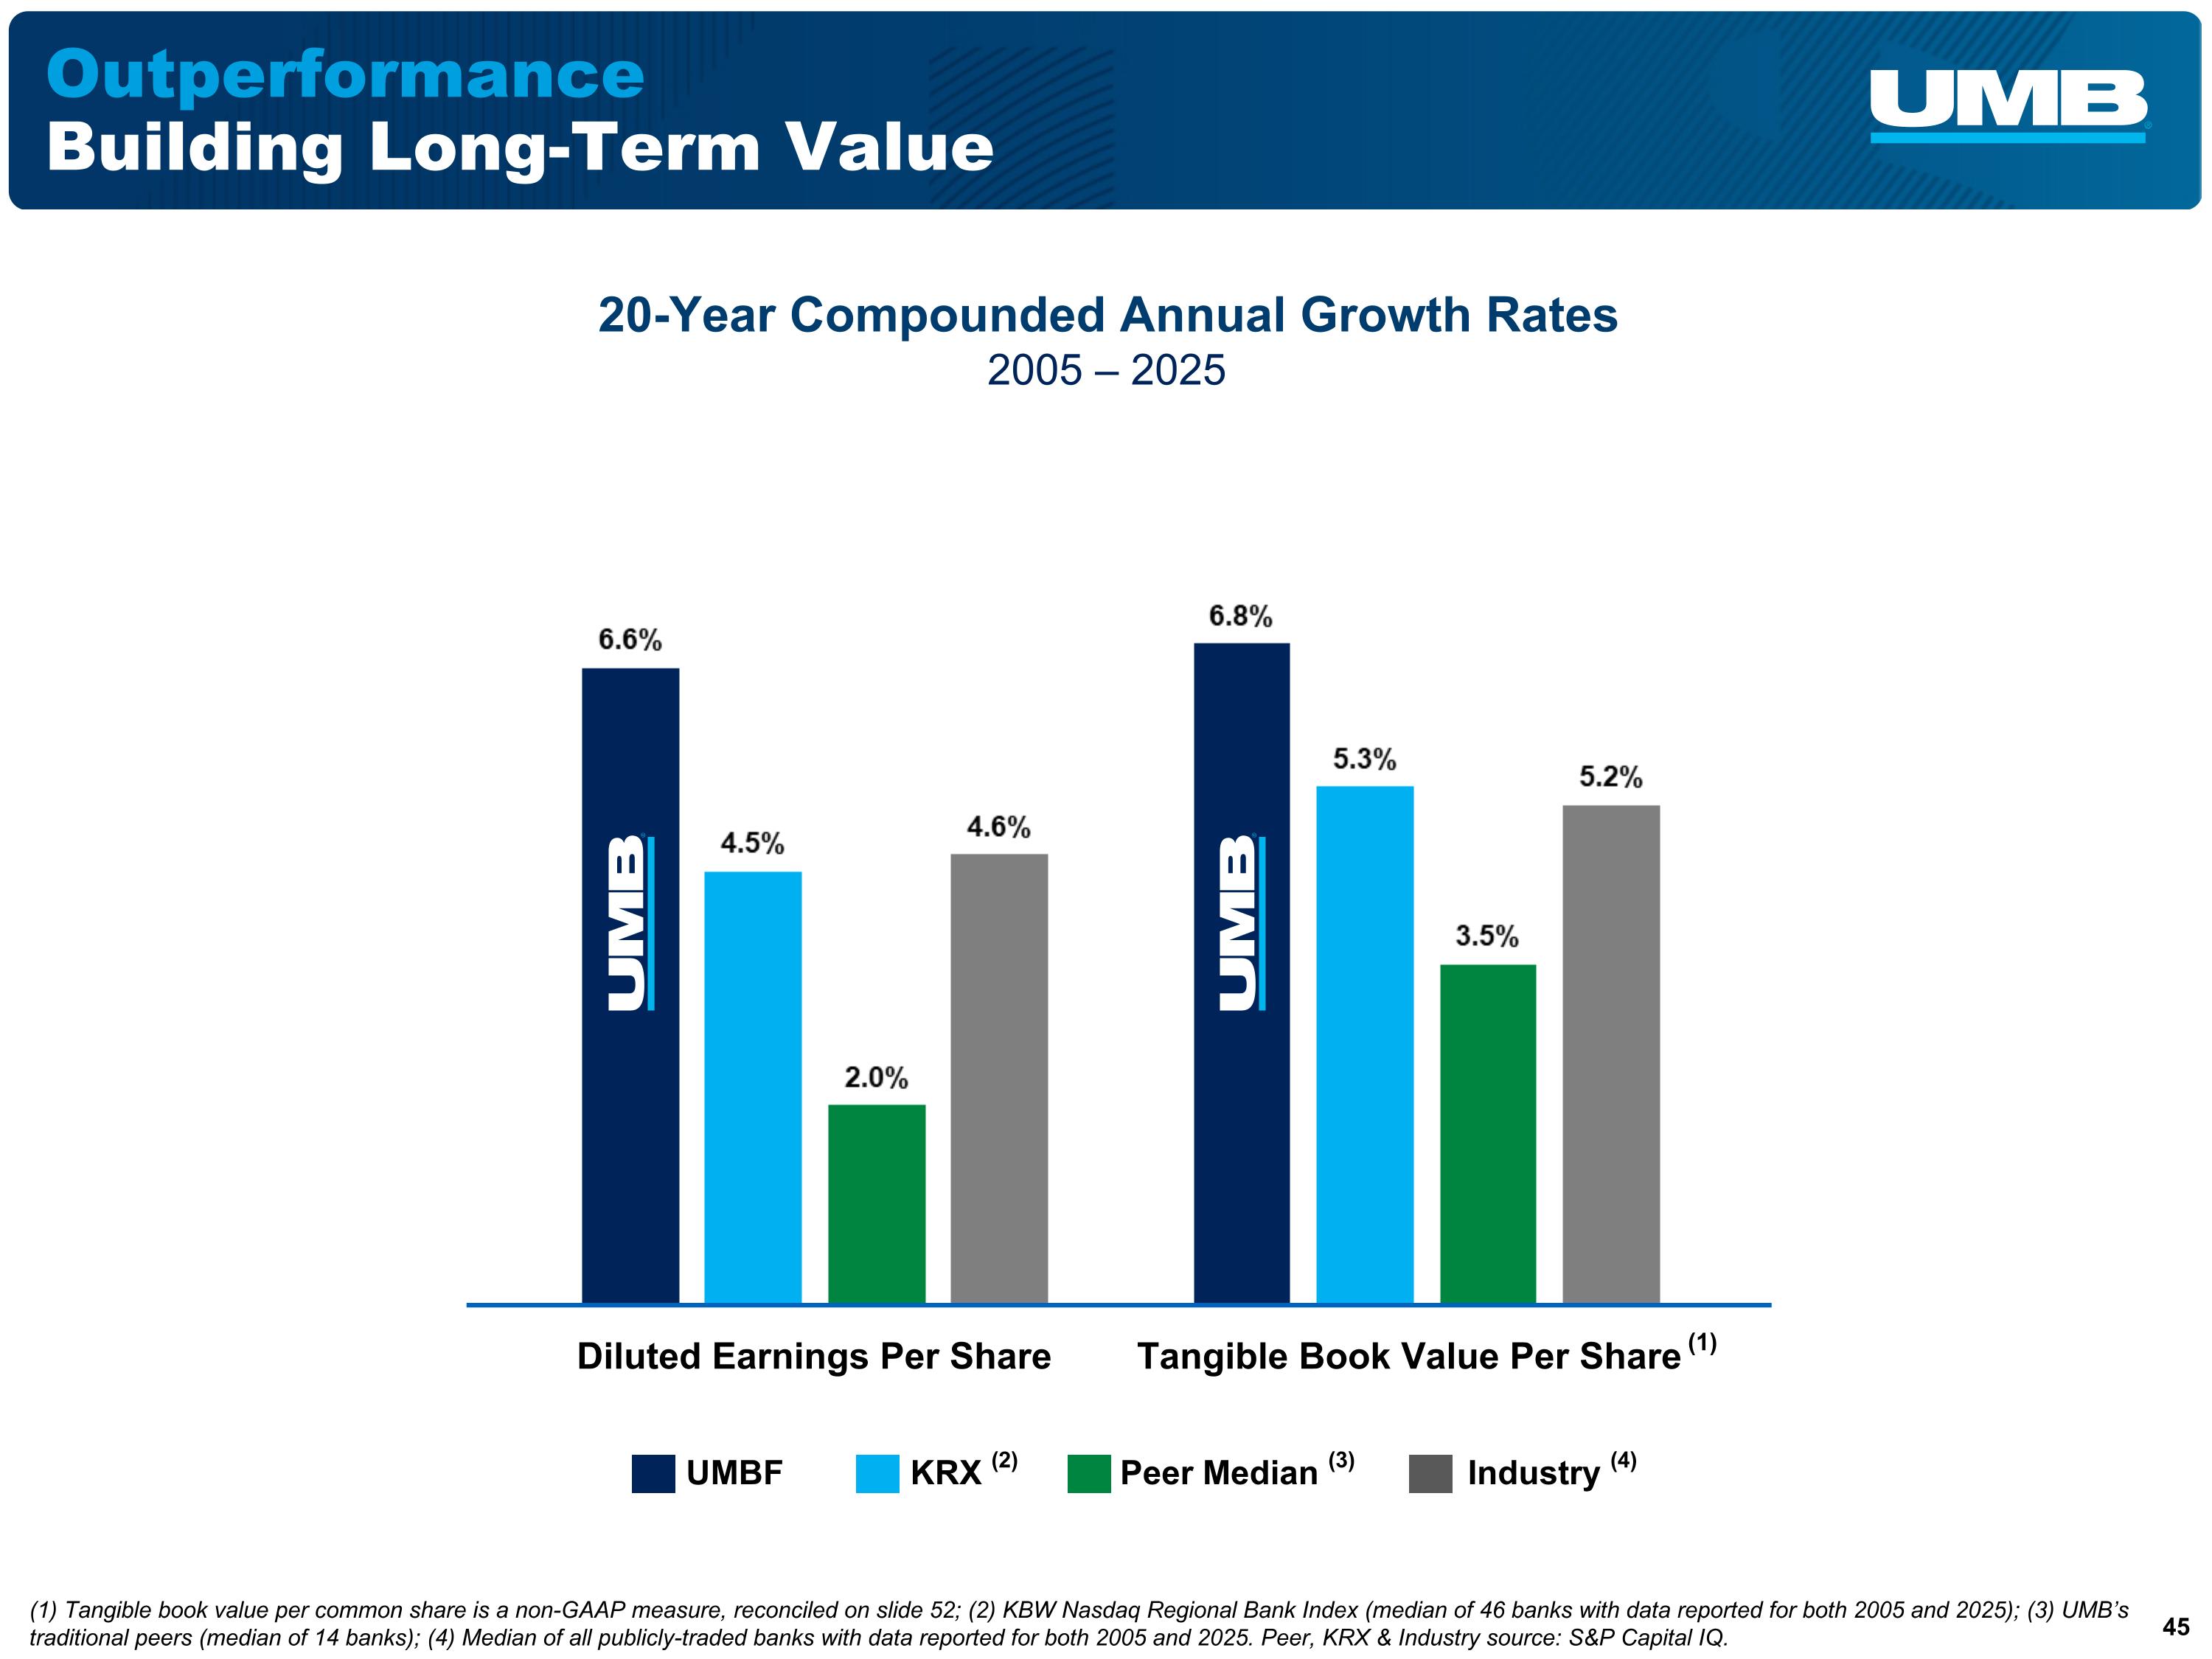
Outperformance Building Long-Term Value 20-Year Compounded Annual Growth Rates 2005 – 2025 UMBF KRX (2) Industry (4) Peer Median (3) Diluted Earnings Per Share Tangible Book Value Per Share (1) (1) Tangible book value per common share is a non-GAAP measure, reconciled on slide 52; (2) KBW Nasdaq Regional Bank Index (median of 46 banks with data reported for both 2005 and 2025); (3) UMB’s traditional peers (median of 14 banks); (4) Median of all publicly-traded banks with data reported for both 2005 and 2025. Peer, KRX & Industry source: S&P Capital IQ.

Appendix
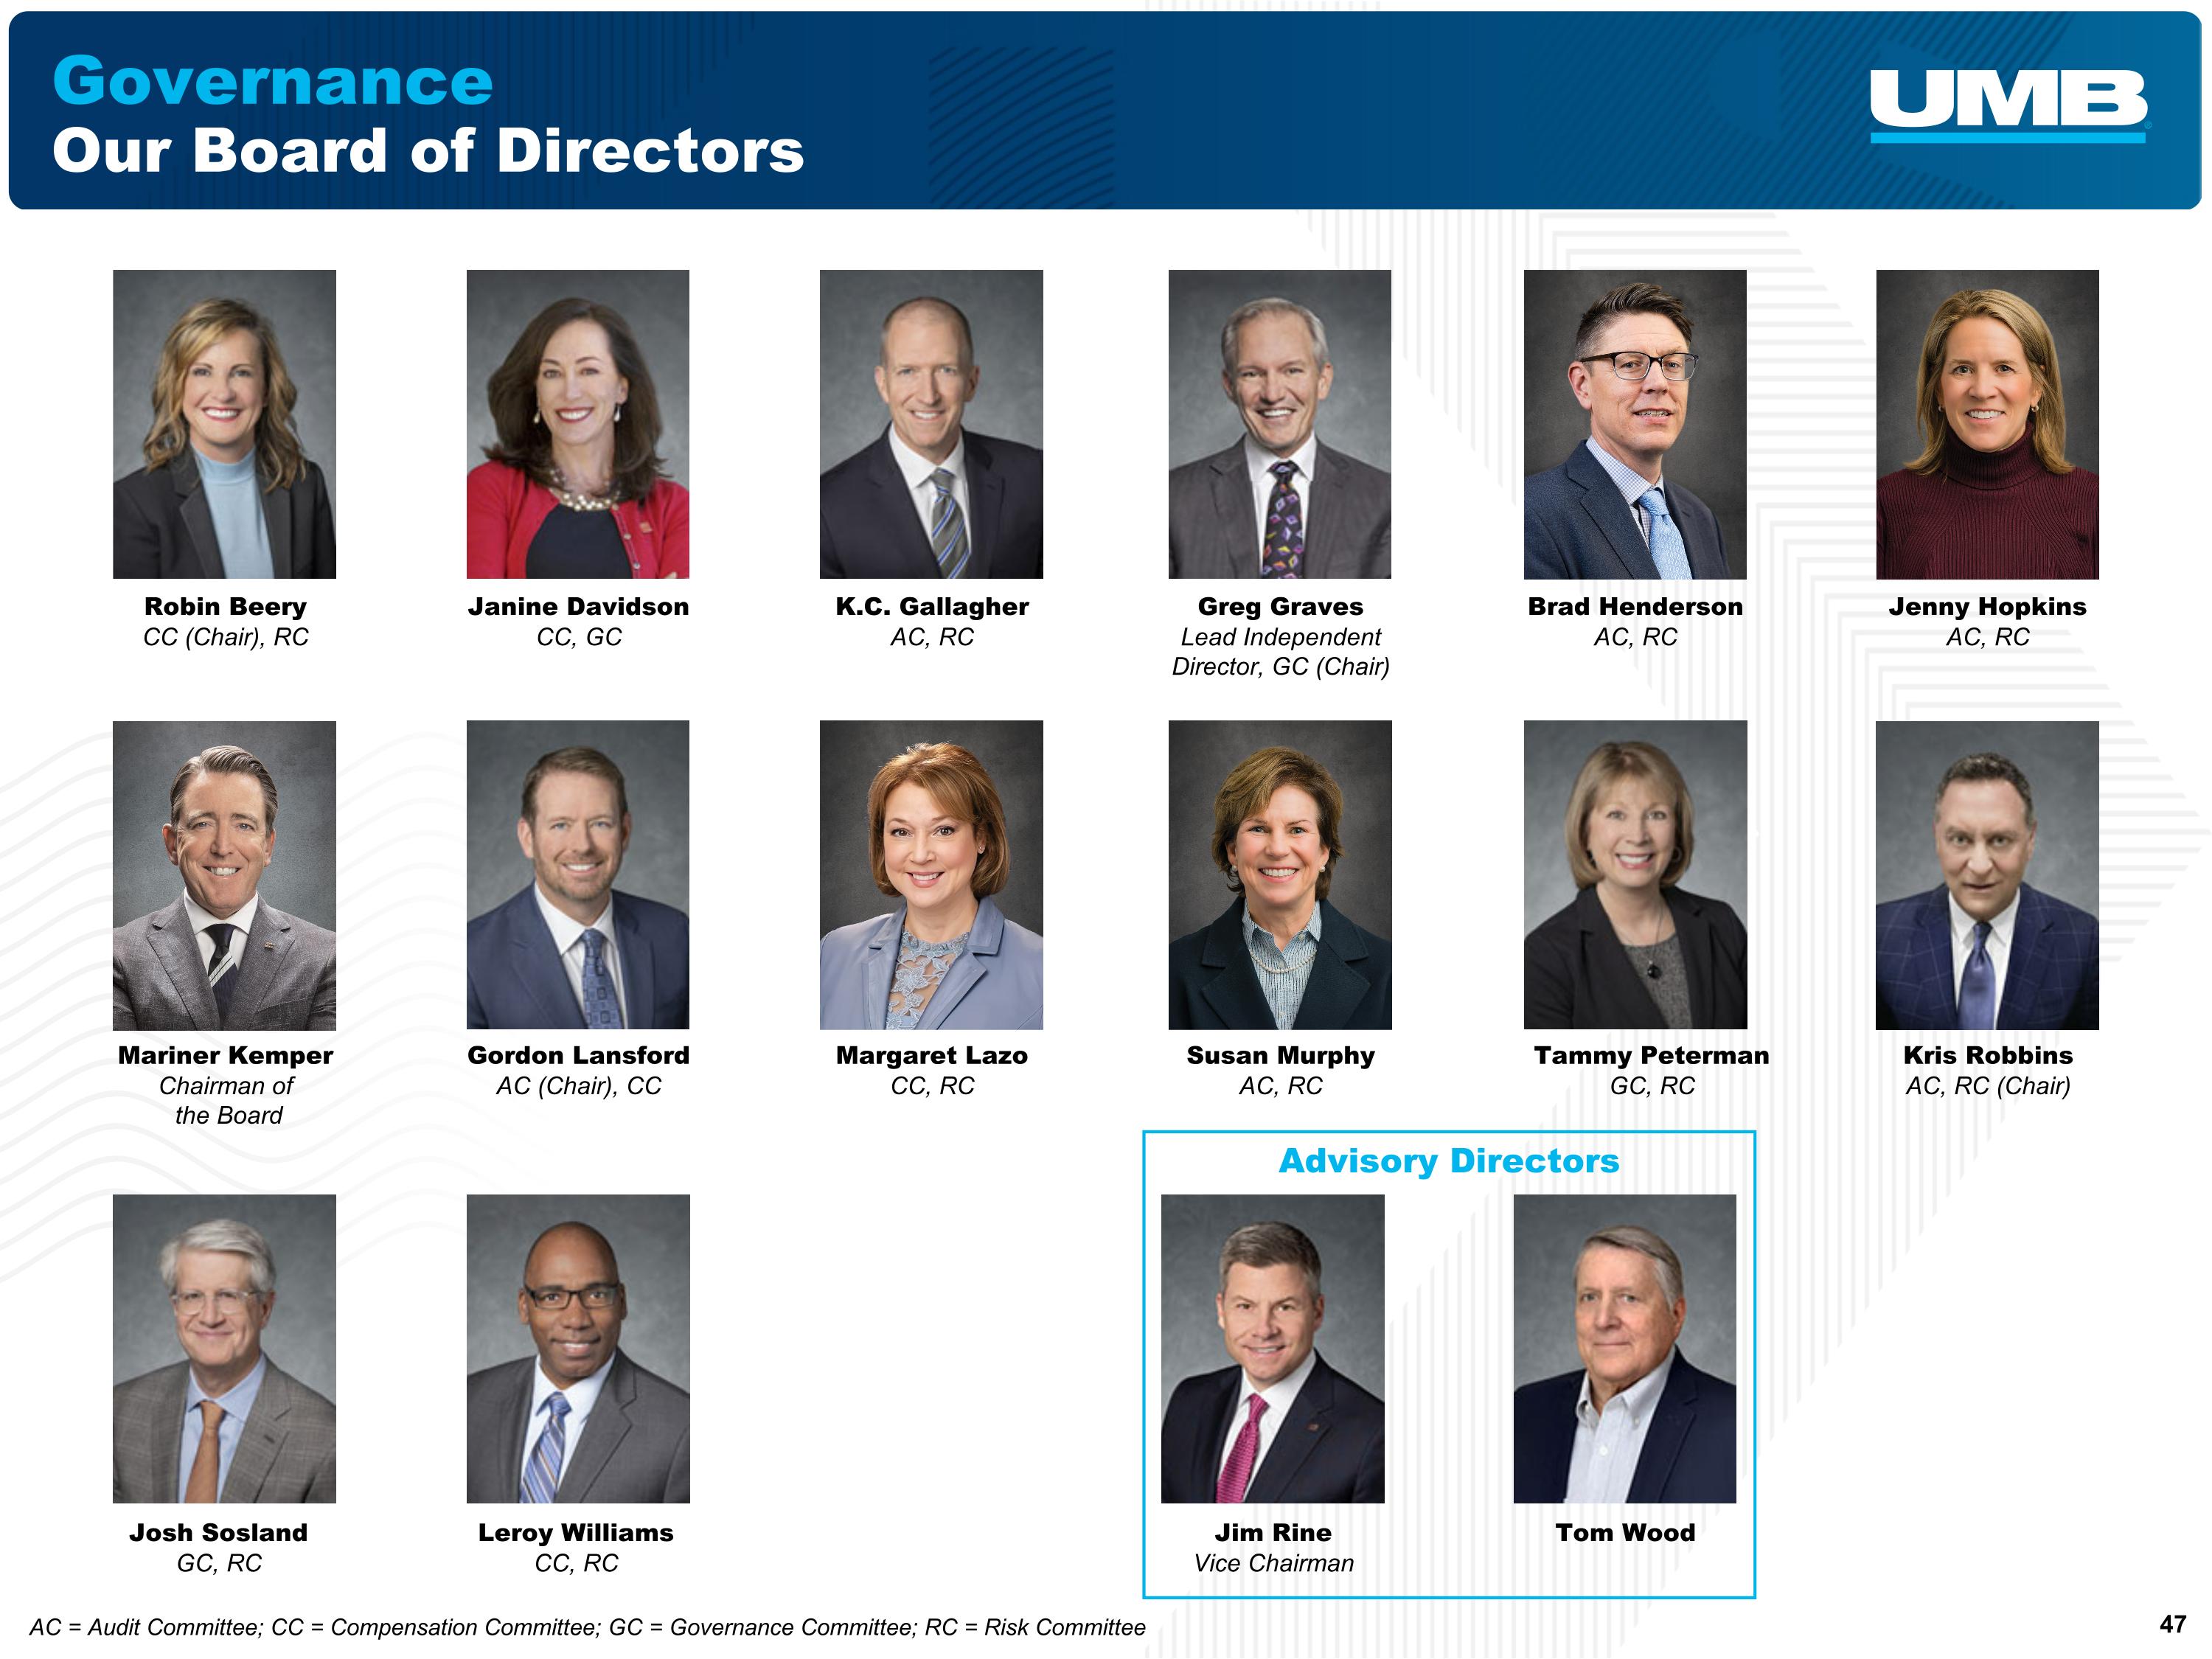
Governance Our Board of Directors AC = Audit Committee; CC = Compensation Committee; GC = Governance Committee; RC = Risk Committee Advisory Directors Mariner Kemper Chairman of the Board Margaret Lazo CC, RC Susan Murphy AC, RC Tammy Peterman GC, RC Gordon Lansford AC (Chair), CC Robin Beery CC (Chair), RC K.C. Gallagher AC, RC Greg Graves Lead Independent Director, GC (Chair) Jenny Hopkins AC, RC Janine Davidson CC, GC Brad Henderson AC, RC Kris Robbins AC, RC (Chair) Josh Sosland GC, RC Leroy Williams CC, RC Tom Wood Jim Rine Vice Chairman
Forward-Looking Statements This presentation contains, and our other communications, may contain forward-looking statements within the meaning of Section 27A of the Securities Act of 1933, as amended, and Rule 175 promulgated thereunder, and Section 21E of the Securities Exchange Act of 1934, as amended, and Rule 3b-6 promulgated thereunder, which statements involve inherent risks and uncertainties. Forward-looking statements convey our expectations, intentions, or forecasts about future events, circumstances, results, or aspirations. All forward-looking statements are subject to assumptions, risks, and uncertainties, which may change over time and many of which are beyond our control. You should not rely on any forward-looking statement as a prediction or guarantee about the future. Our actual future objectives, strategies, plans, prospects, performance, condition, or results may differ materially from those set forth in any forward-looking statement. Some of the factors that may cause actual results or other future events, circumstances, or aspirations to differ from those in forward-looking statements are described in annual, quarterly and other applicable documents that are filed or furnished with the U.S. Securities and Exchange Commission (“SEC”). In addition to such factors that have been disclosed previously: risks related to current or future tariffs or trade restrictions, sanctions and other trade policies and the impact to UMB or its customers; macroeconomic and adverse developments and uncertainties related to the collateral effects of the collapse of, and challenges for, domestic and international banks, including the impacts to the U.S. and global economies; sustained levels of high inflation and the potential for an economic recession; and impacts related to or resulting from instability with respect to geopolitical developments, including in Venezuela, the Middle East and Russia’s military action in Ukraine, such as the broader impacts to financial markets and the global macroeconomic and geopolitical environments, may also cause actual results or other future events, circumstances, or aspirations to differ from our forward-looking statements. Any forward-looking statement made by us or on our behalf speaks only as of the date that it was made. We do not undertake to update any forward-looking statement to reflect the impact of events, circumstances, or results that arise after the date that the statement was made, except to the extent required by applicable securities laws. You, however, should consult disclosures (including disclosures of a forward-looking nature) that we may make in any subsequent documents that are filed or furnished with the SEC. Any statements about UMB Financial Corporation’s (“UMB”) plans, objectives, expectations, strategies, beliefs, or future performance or events constitute forward-looking statements. Such statements are generally identified as those that include words or phrases such as “believes,” “expects,” “anticipates,” “plans,” “objective,” or similar expressions or future or conditional verbs such as “will,” “would,” “should,” “could,” “might,” “may,” or similar expressions. Forward-looking statements involve known and unknown risks, uncertainties, assumptions, estimates, and other important factors that change over time and could cause actual results to differ materially from any results, performance, or events expressed or implied by such forward-looking statements. These forward-looking statements are subject to risks and uncertainties that may cause actual results to differ materially from those projected. Further information regarding UMB and factors which could affect the forward-looking statements contained herein can be found in UMB’s Form 10-K for the year ended December 31, 2025 (and which is available at on the SEC’s archive site, here,) and its other filings with the SEC.
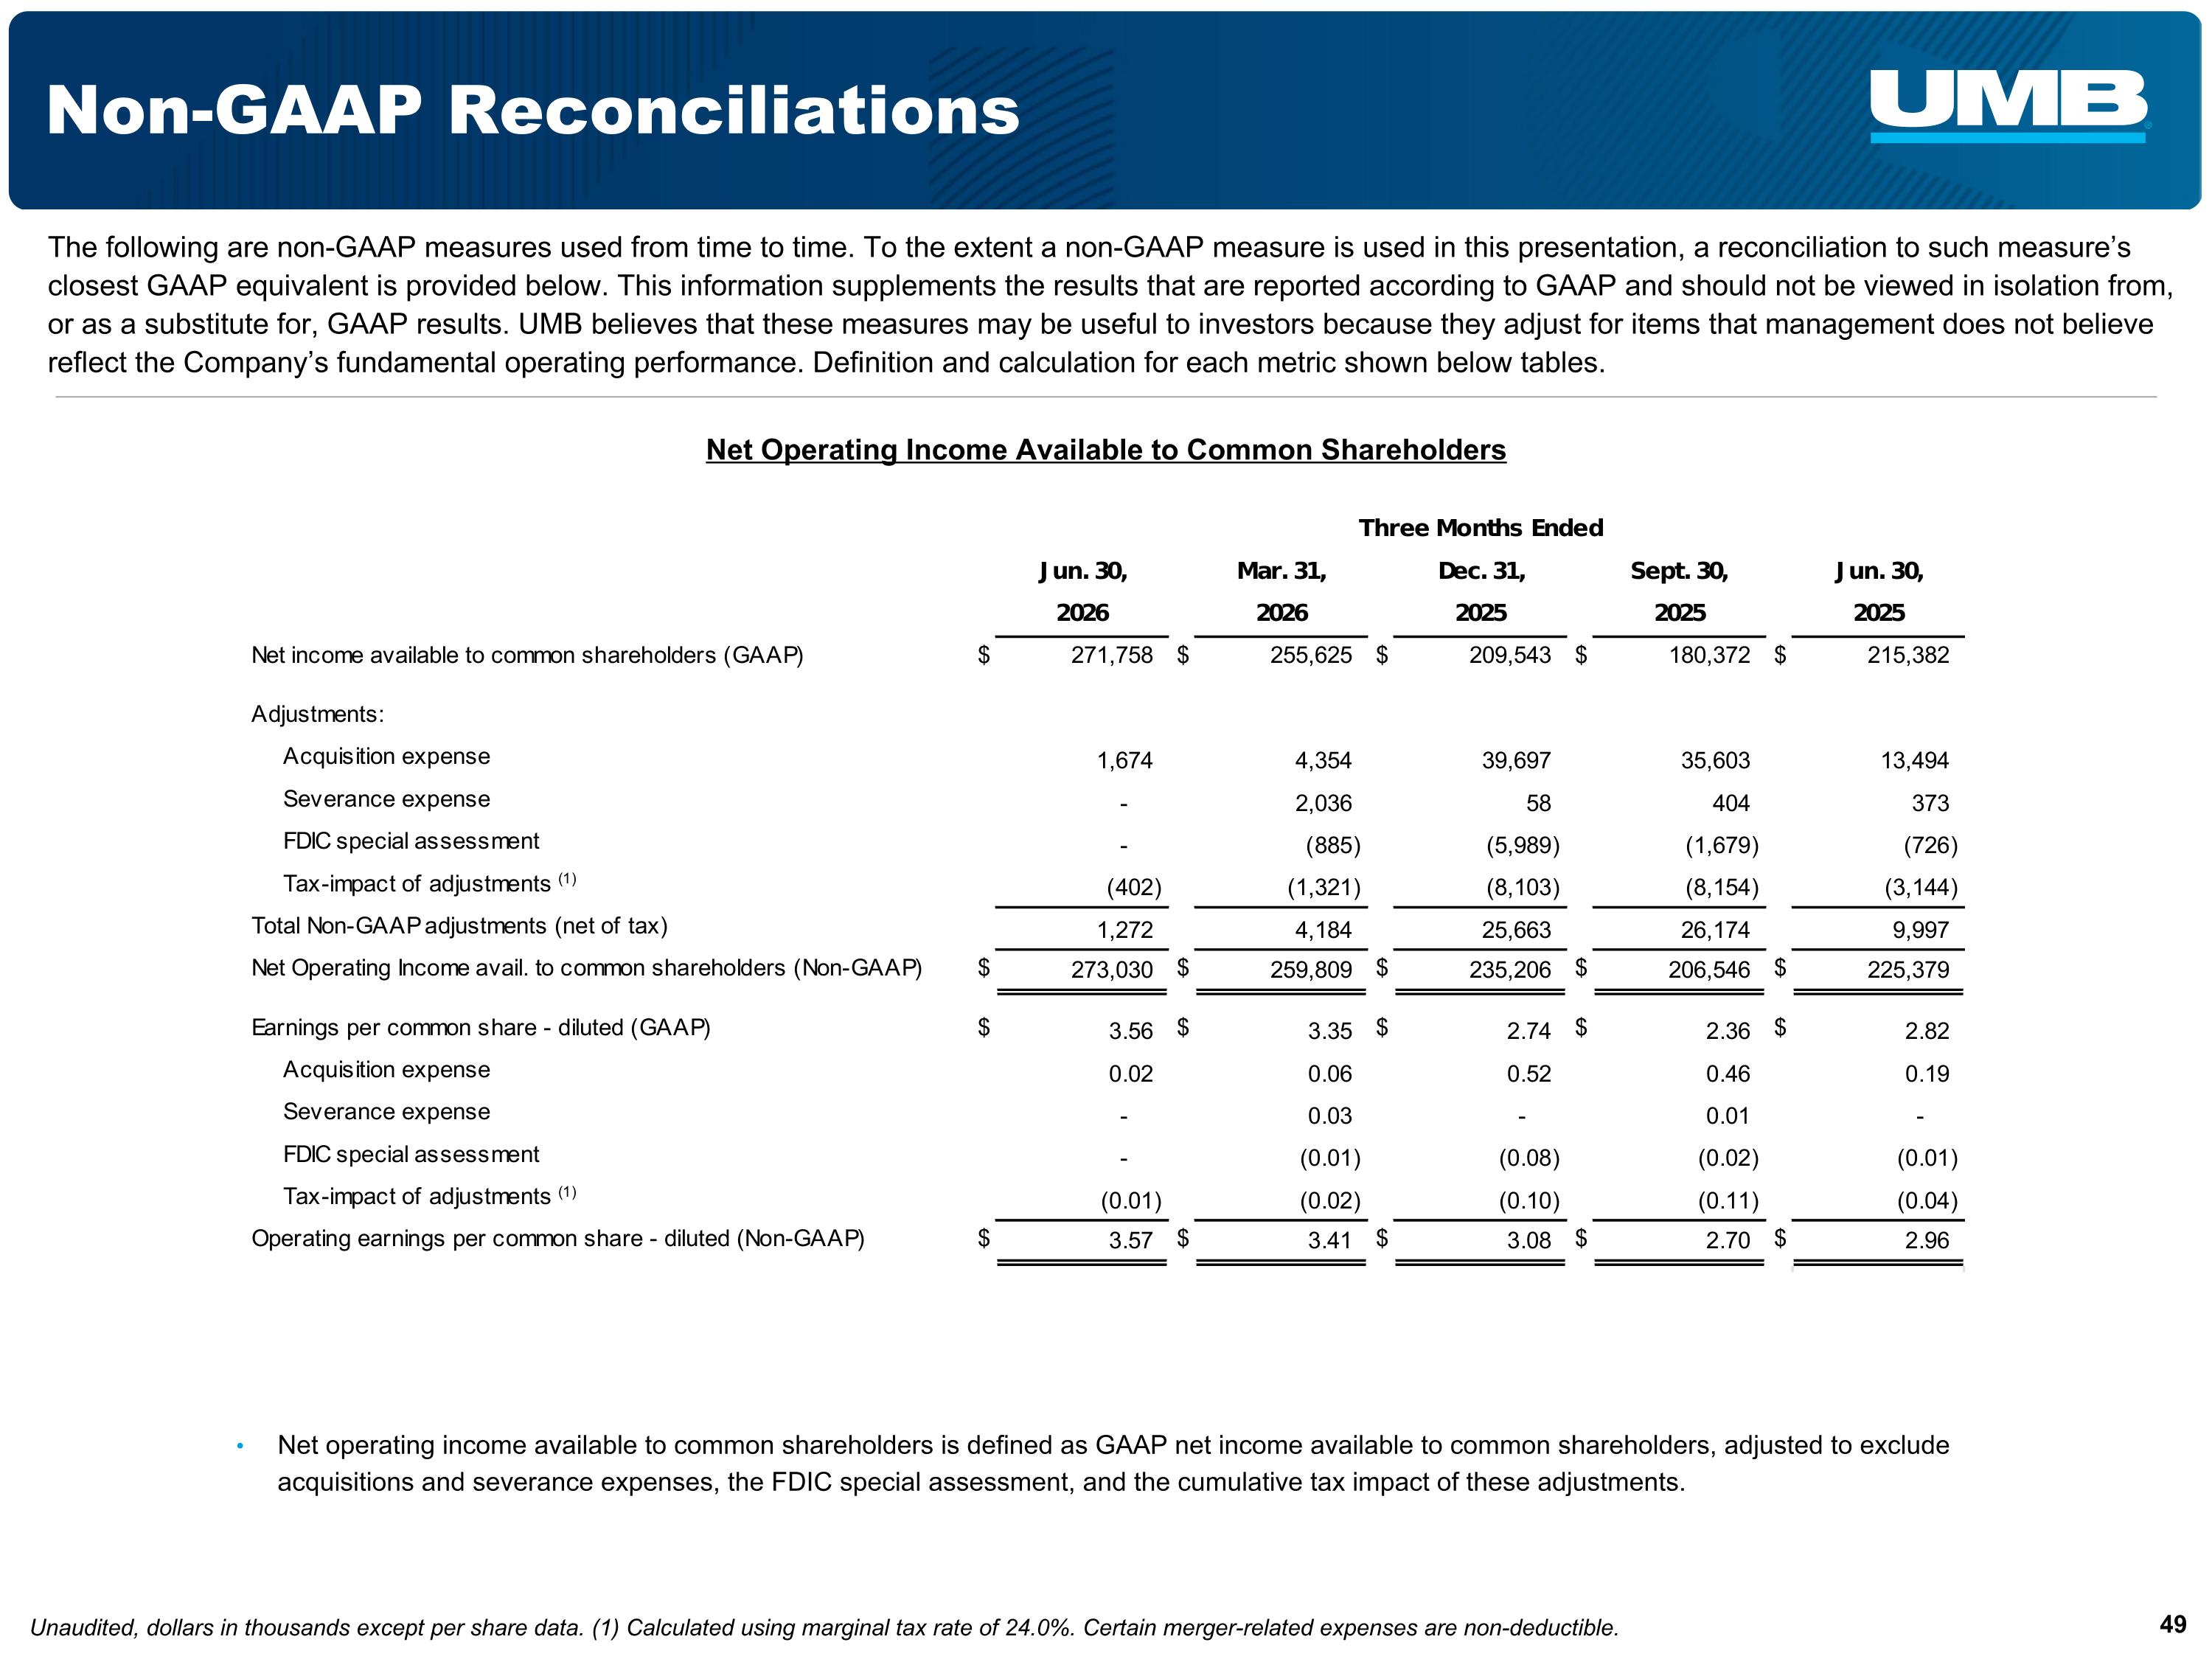
Unaudited, dollars in thousands except per share data. (1) Calculated using marginal tax rate of 24.0%. Certain merger-related expenses are non-deductible. Non-GAAP Reconciliations The following are non-GAAP measures used from time to time. To the extent a non-GAAP measure is used in this presentation, a reconciliation to such measure’s closest GAAP equivalent is provided below. This information supplements the results that are reported according to GAAP and should not be viewed in isolation from, or as a substitute for, GAAP results. UMB believes that these measures may be useful to investors because they adjust for items that management does not believe reflect the Company’s fundamental operating performance. Definition and calculation for each metric shown below tables. Net Operating Income Available to Common Shareholders Net operating income available to common shareholders is defined as GAAP net income available to common shareholders, adjusted to exclude acquisitions and severance expenses, the FDIC special assessment, and the cumulative tax impact of these adjustments.
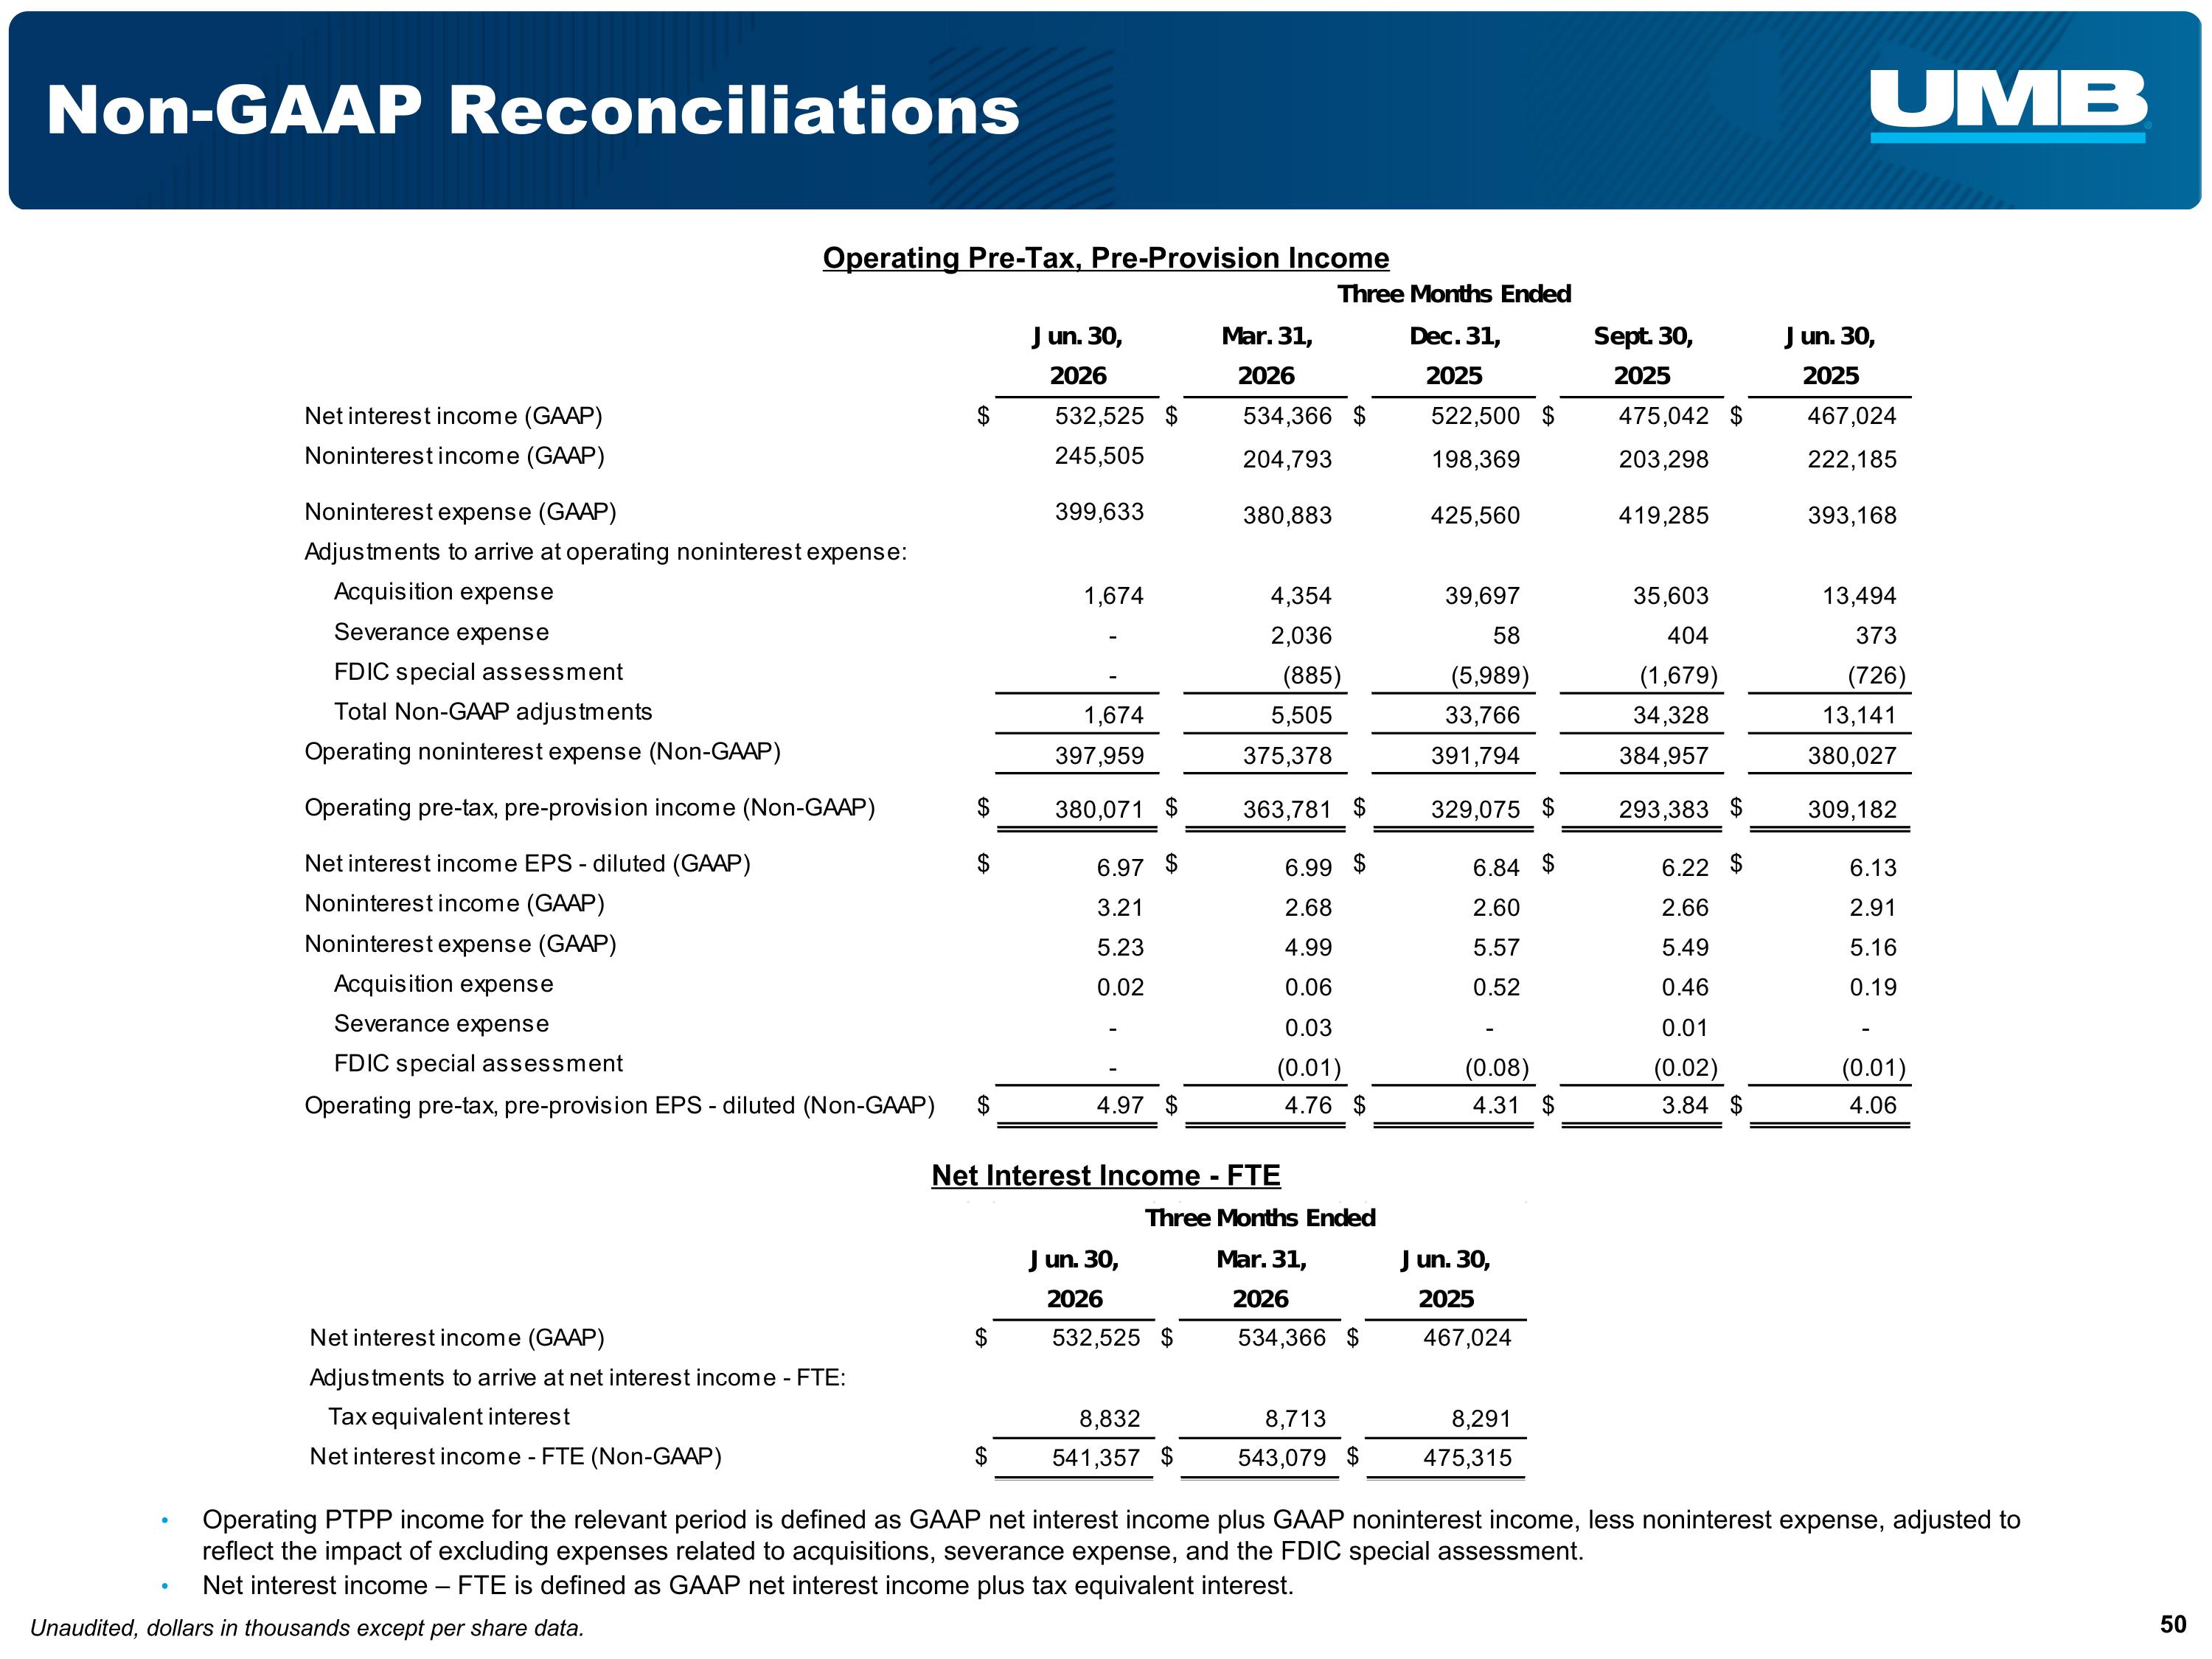
Non-GAAP Reconciliations Operating Pre-Tax, Pre-Provision Income Unaudited, dollars in thousands except per share data. Operating PTPP income for the relevant period is defined as GAAP net interest income plus GAAP noninterest income, less noninterest expense, adjusted to reflect the impact of excluding expenses related to acquisitions, severance expense, and the FDIC special assessment. Net interest income – FTE is defined as GAAP net interest income plus tax equivalent interest. Net Interest Income - FTE
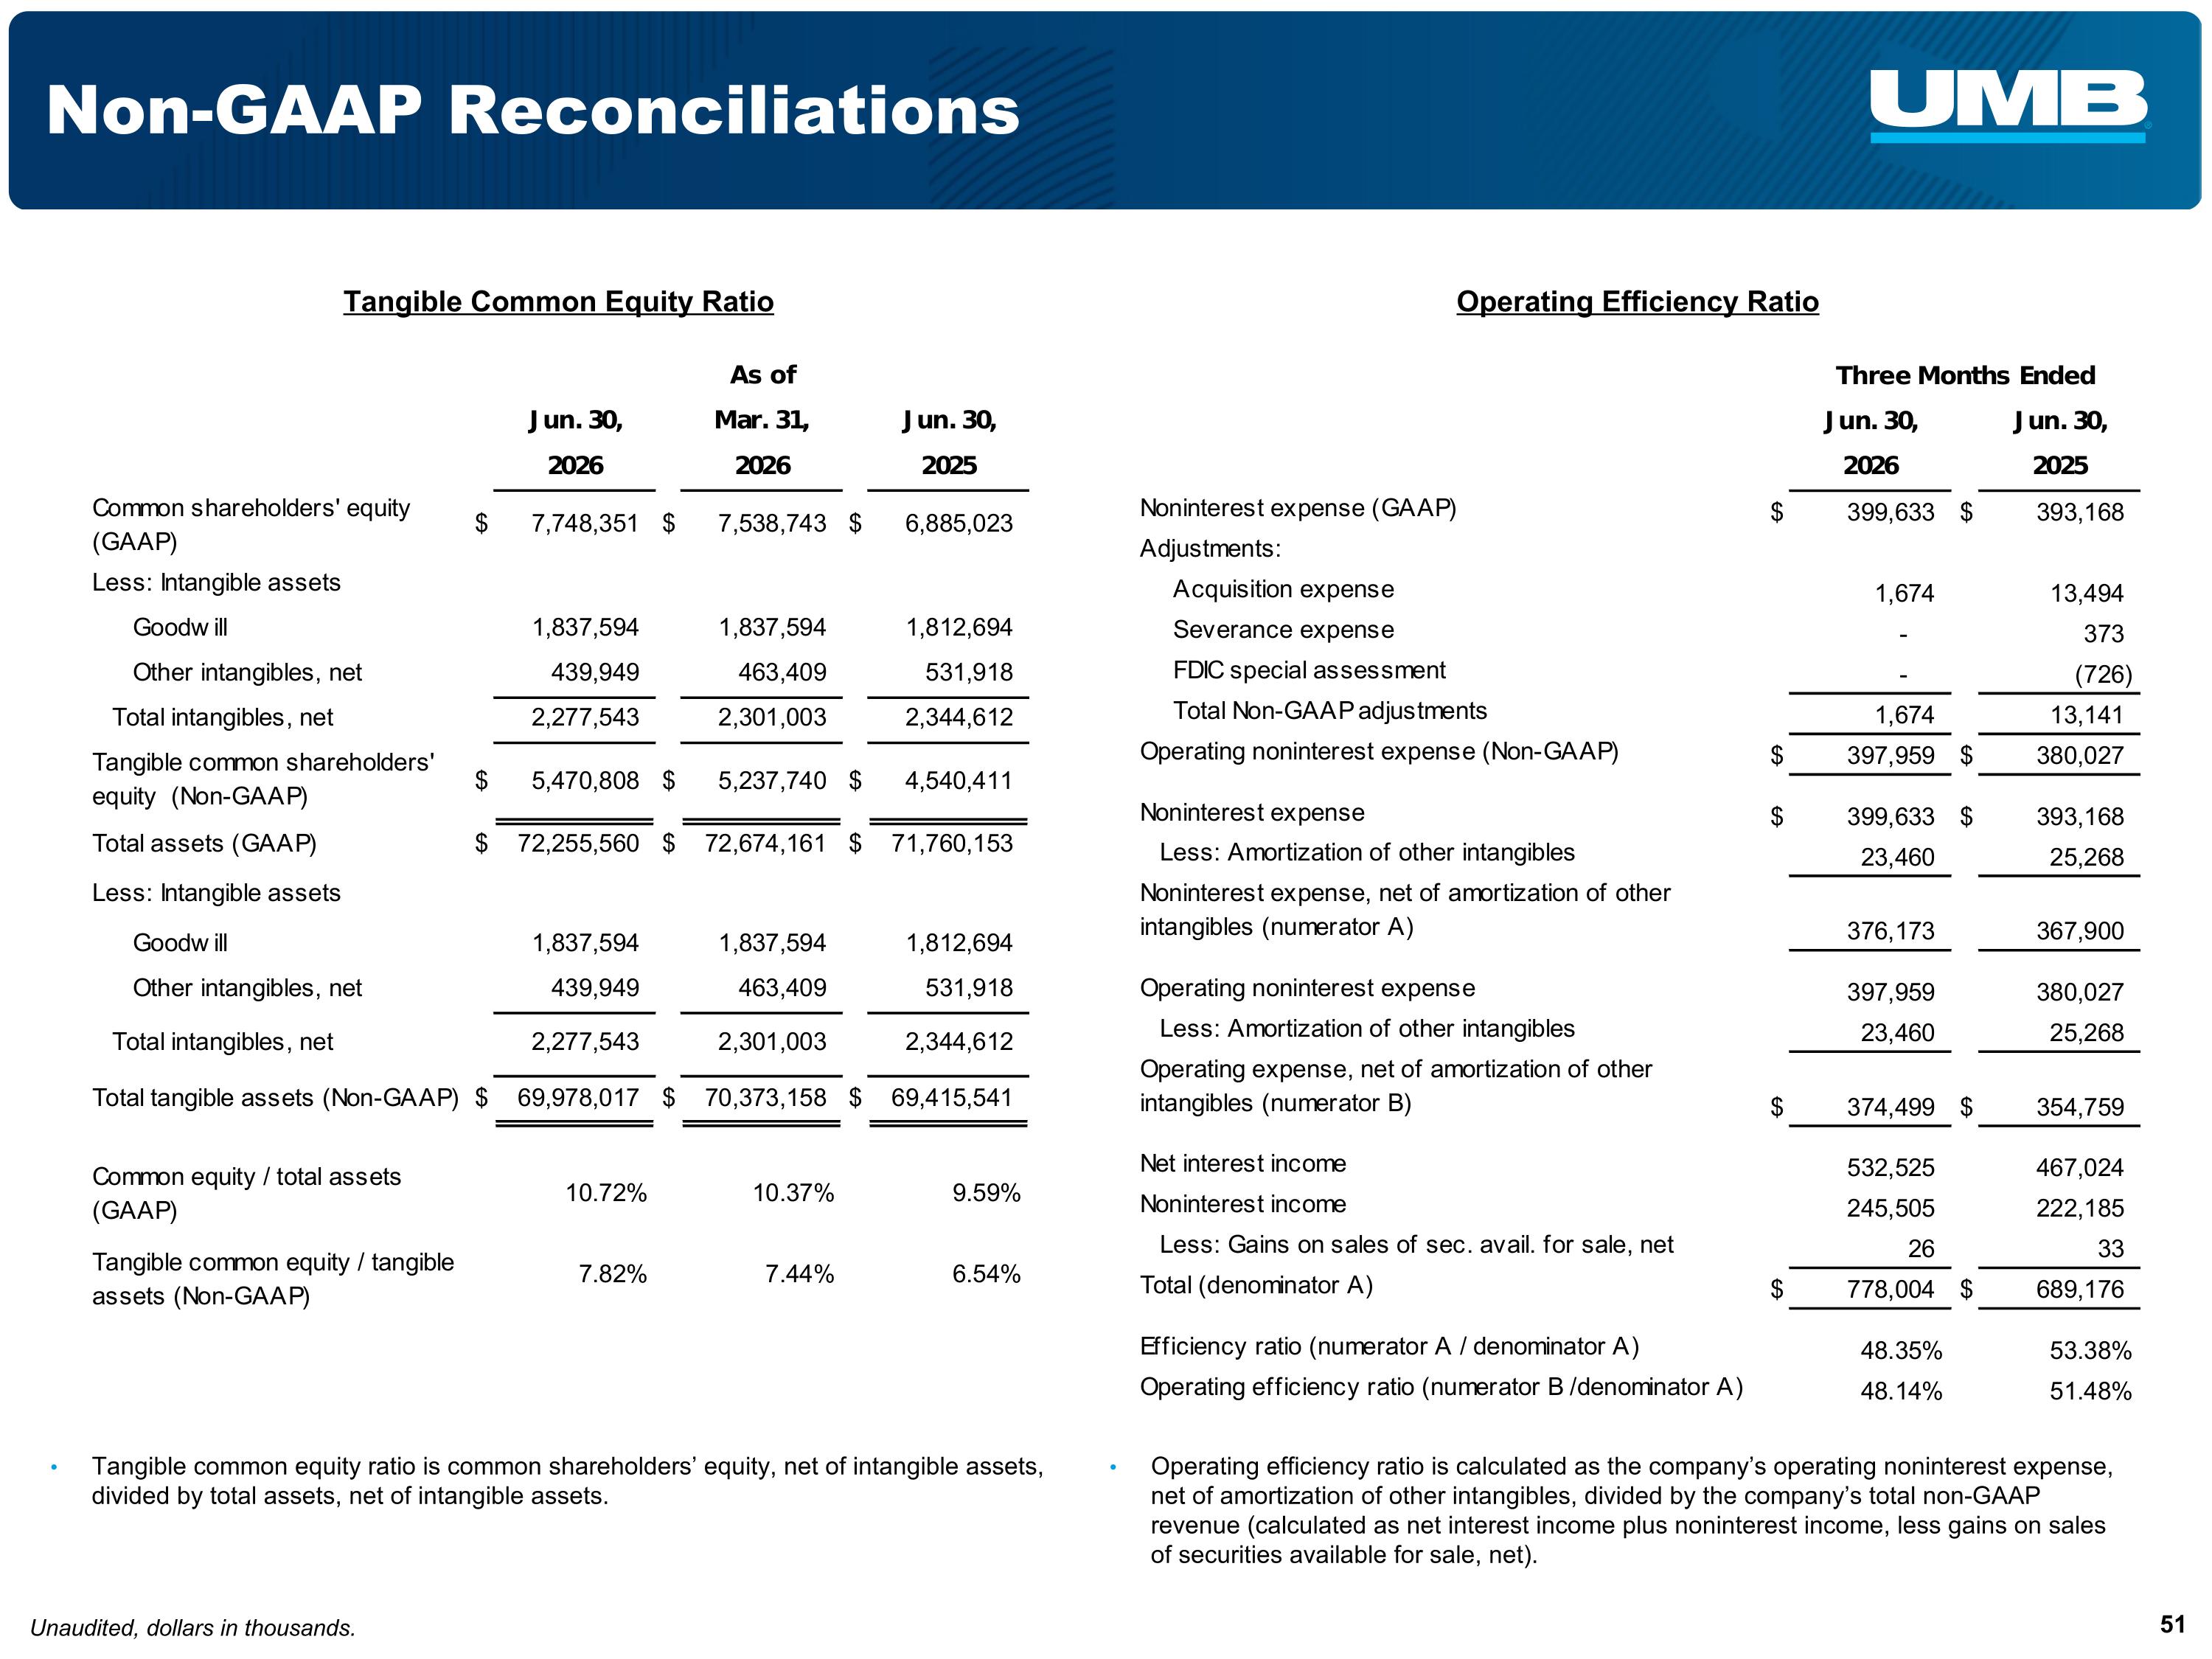
Tangible common equity ratio is common shareholders’ equity, net of intangible assets, divided by total assets, net of intangible assets. Non-GAAP Reconciliations Unaudited, dollars in thousands. Tangible Common Equity Ratio Operating efficiency ratio is calculated as the company’s operating noninterest expense, net of amortization of other intangibles, divided by the company’s total non-GAAP revenue (calculated as net interest income plus noninterest income, less gains on sales of securities available for sale, net). Operating Efficiency Ratio
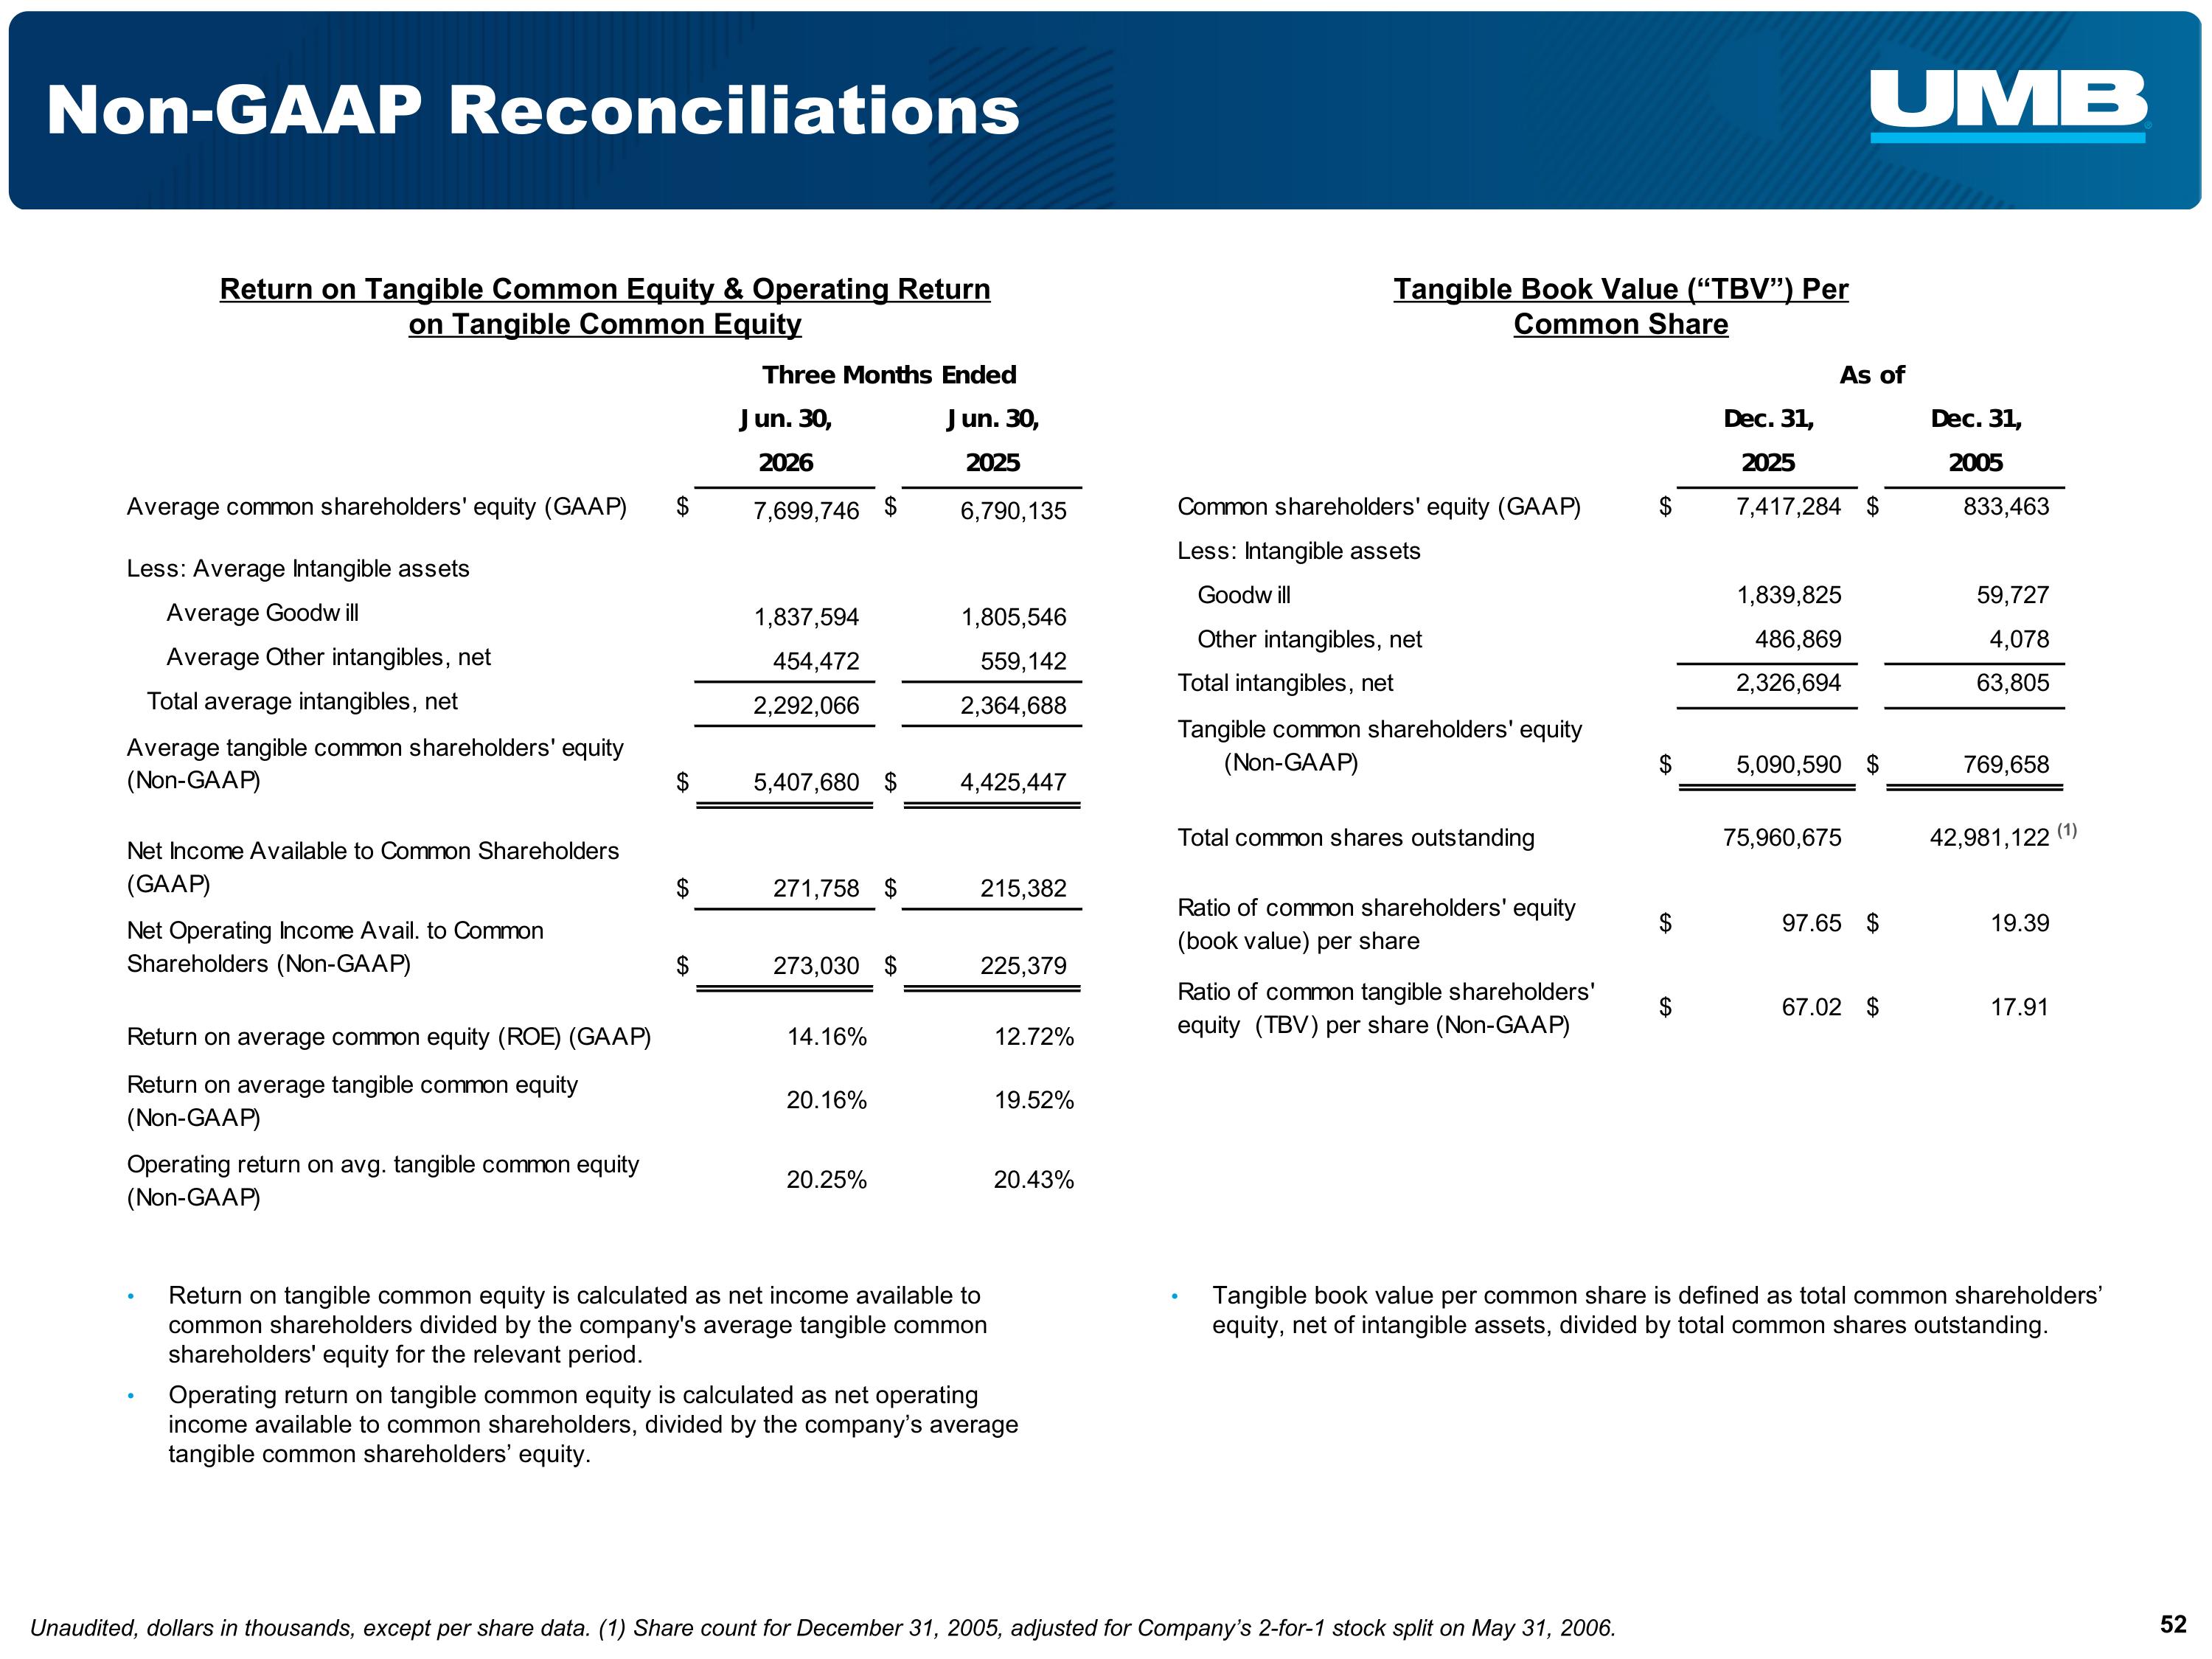
Non-GAAP Reconciliations Unaudited, dollars in thousands, except per share data. (1) Share count for December 31, 2005, adjusted for Company’s 2-for-1 stock split on May 31, 2006. Return on tangible common equity is calculated as net income available to common shareholders divided by the company's average tangible common shareholders' equity for the relevant period. Operating return on tangible common equity is calculated as net operating income available to common shareholders, divided by the company’s average tangible common shareholders’ equity. Return on Tangible Common Equity & Operating Return on Tangible Common Equity Tangible Book Value (“TBV”) Per Common Share Tangible book value per common share is defined as total common shareholders’ equity, net of intangible assets, divided by total common shares outstanding. (1)
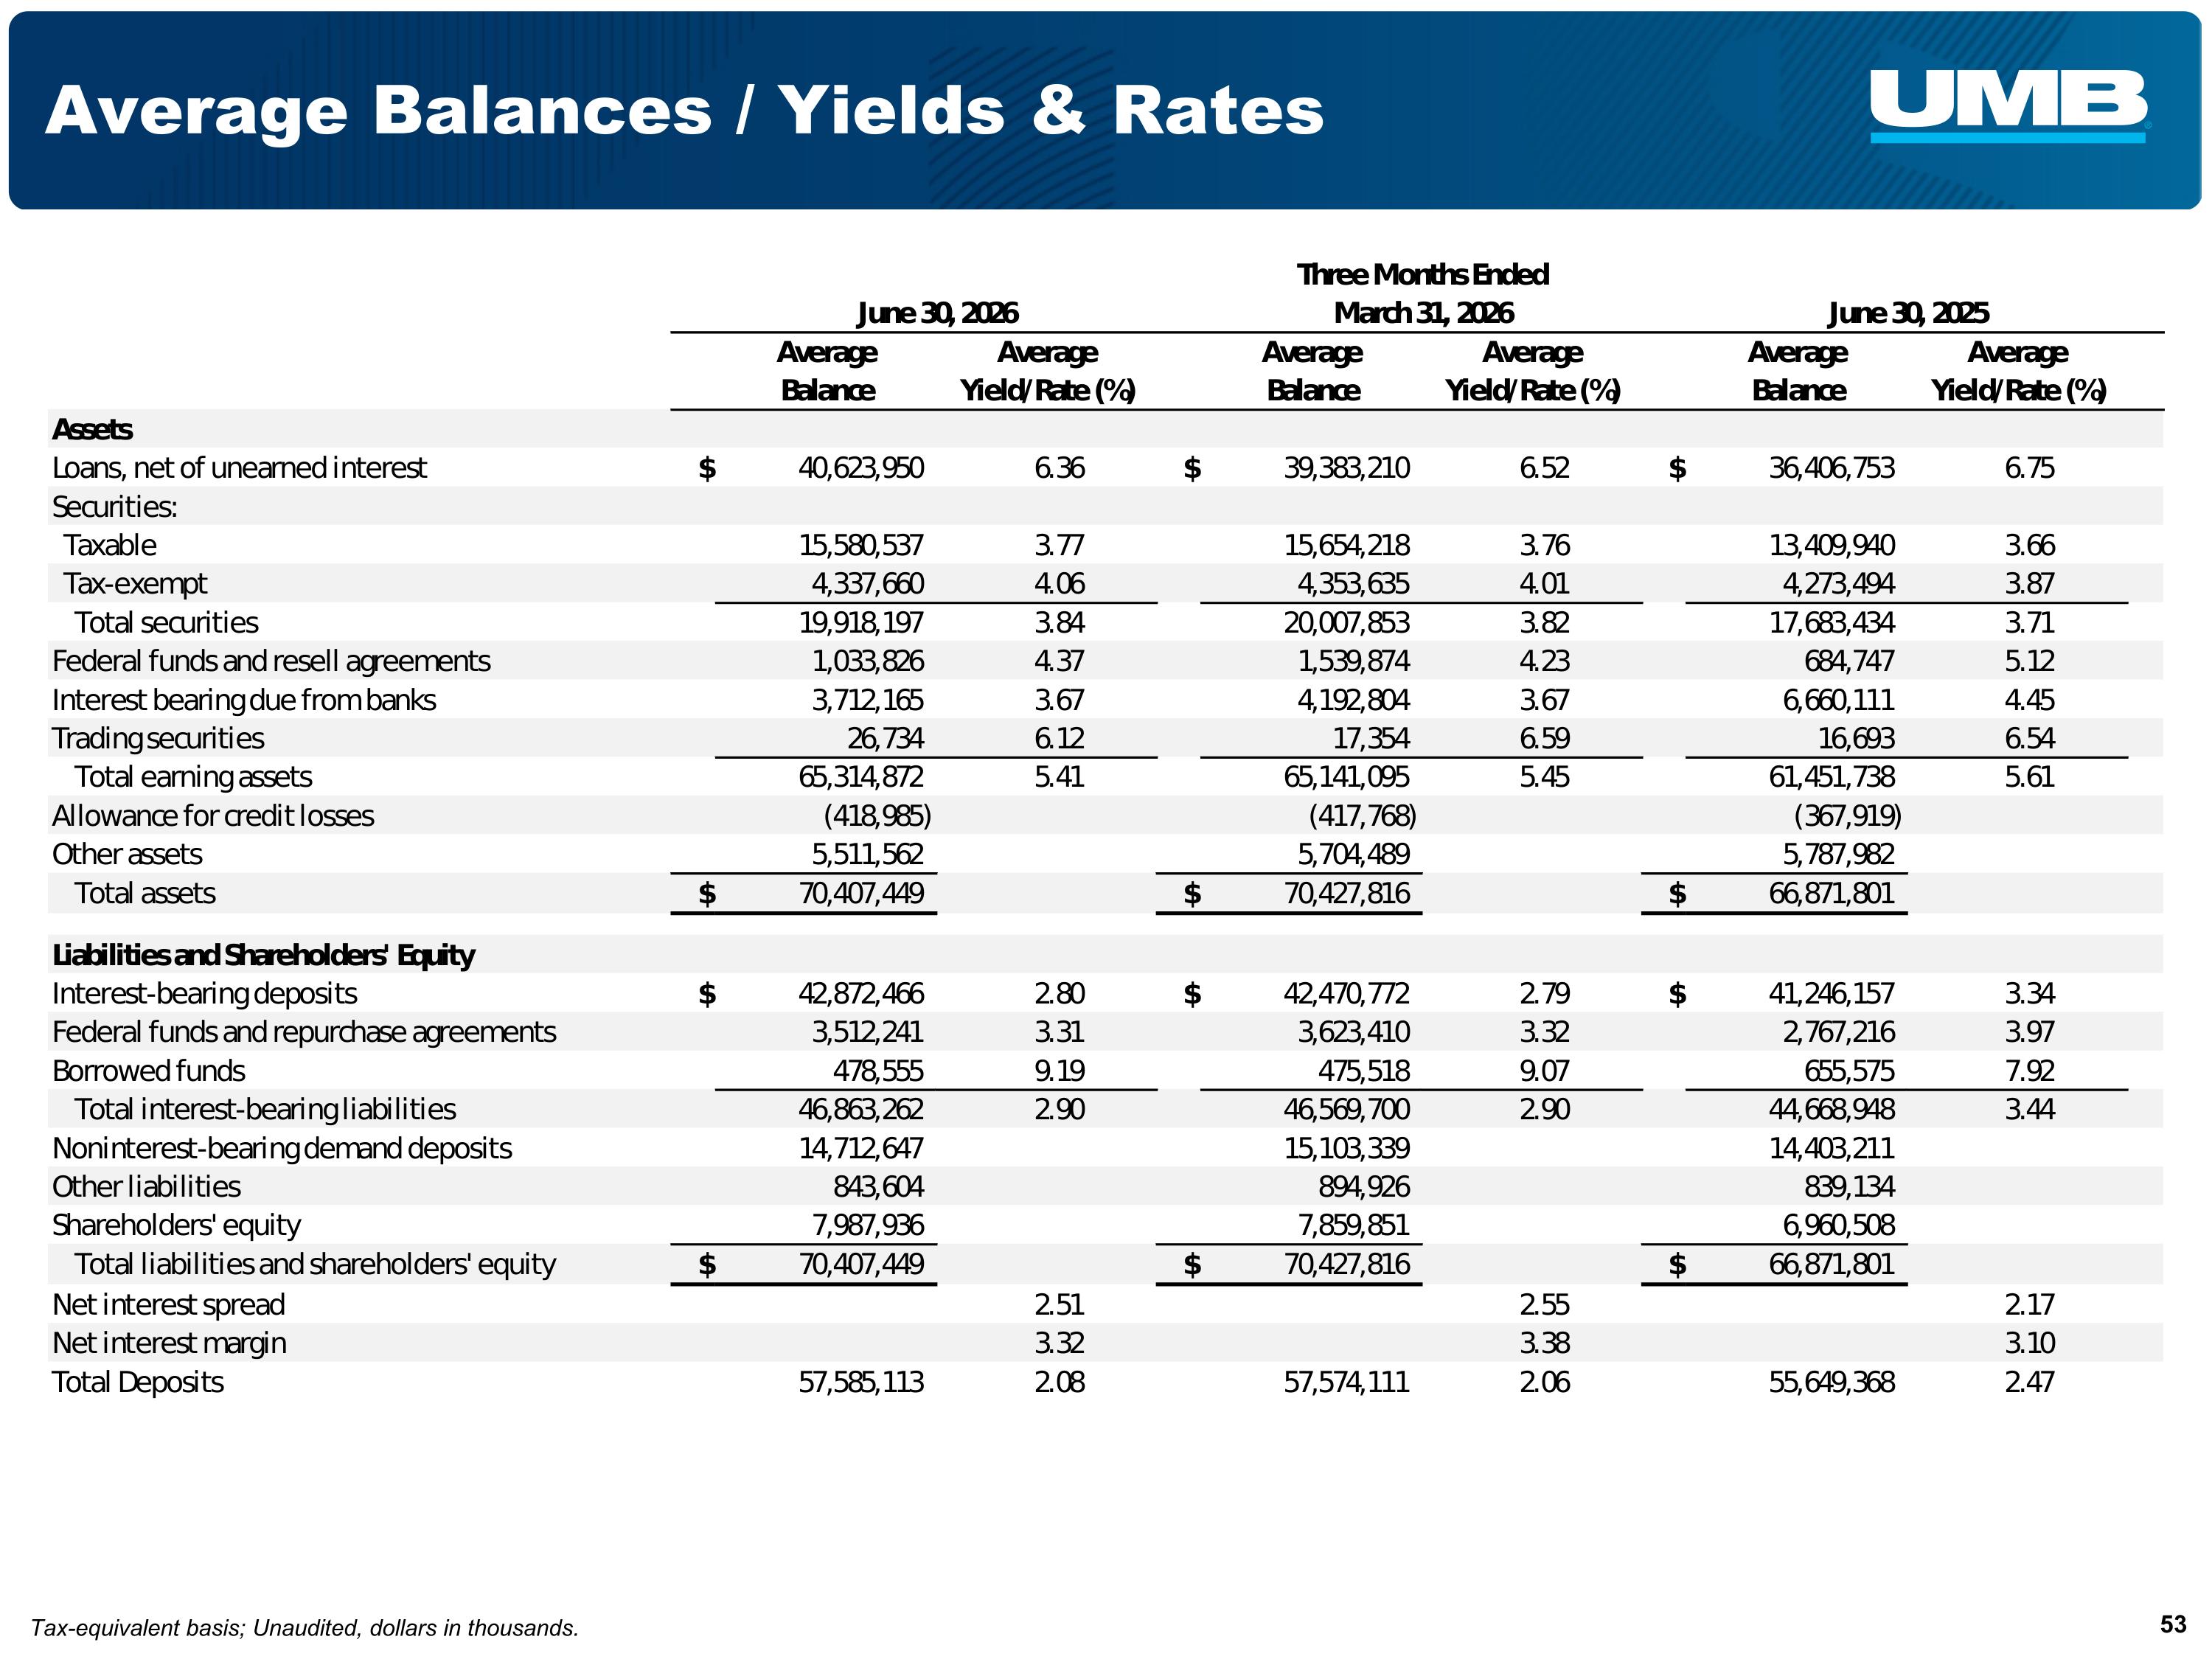
Average Balances / Yields & Rates Tax-equivalent basis; Unaudited, dollars in thousands.
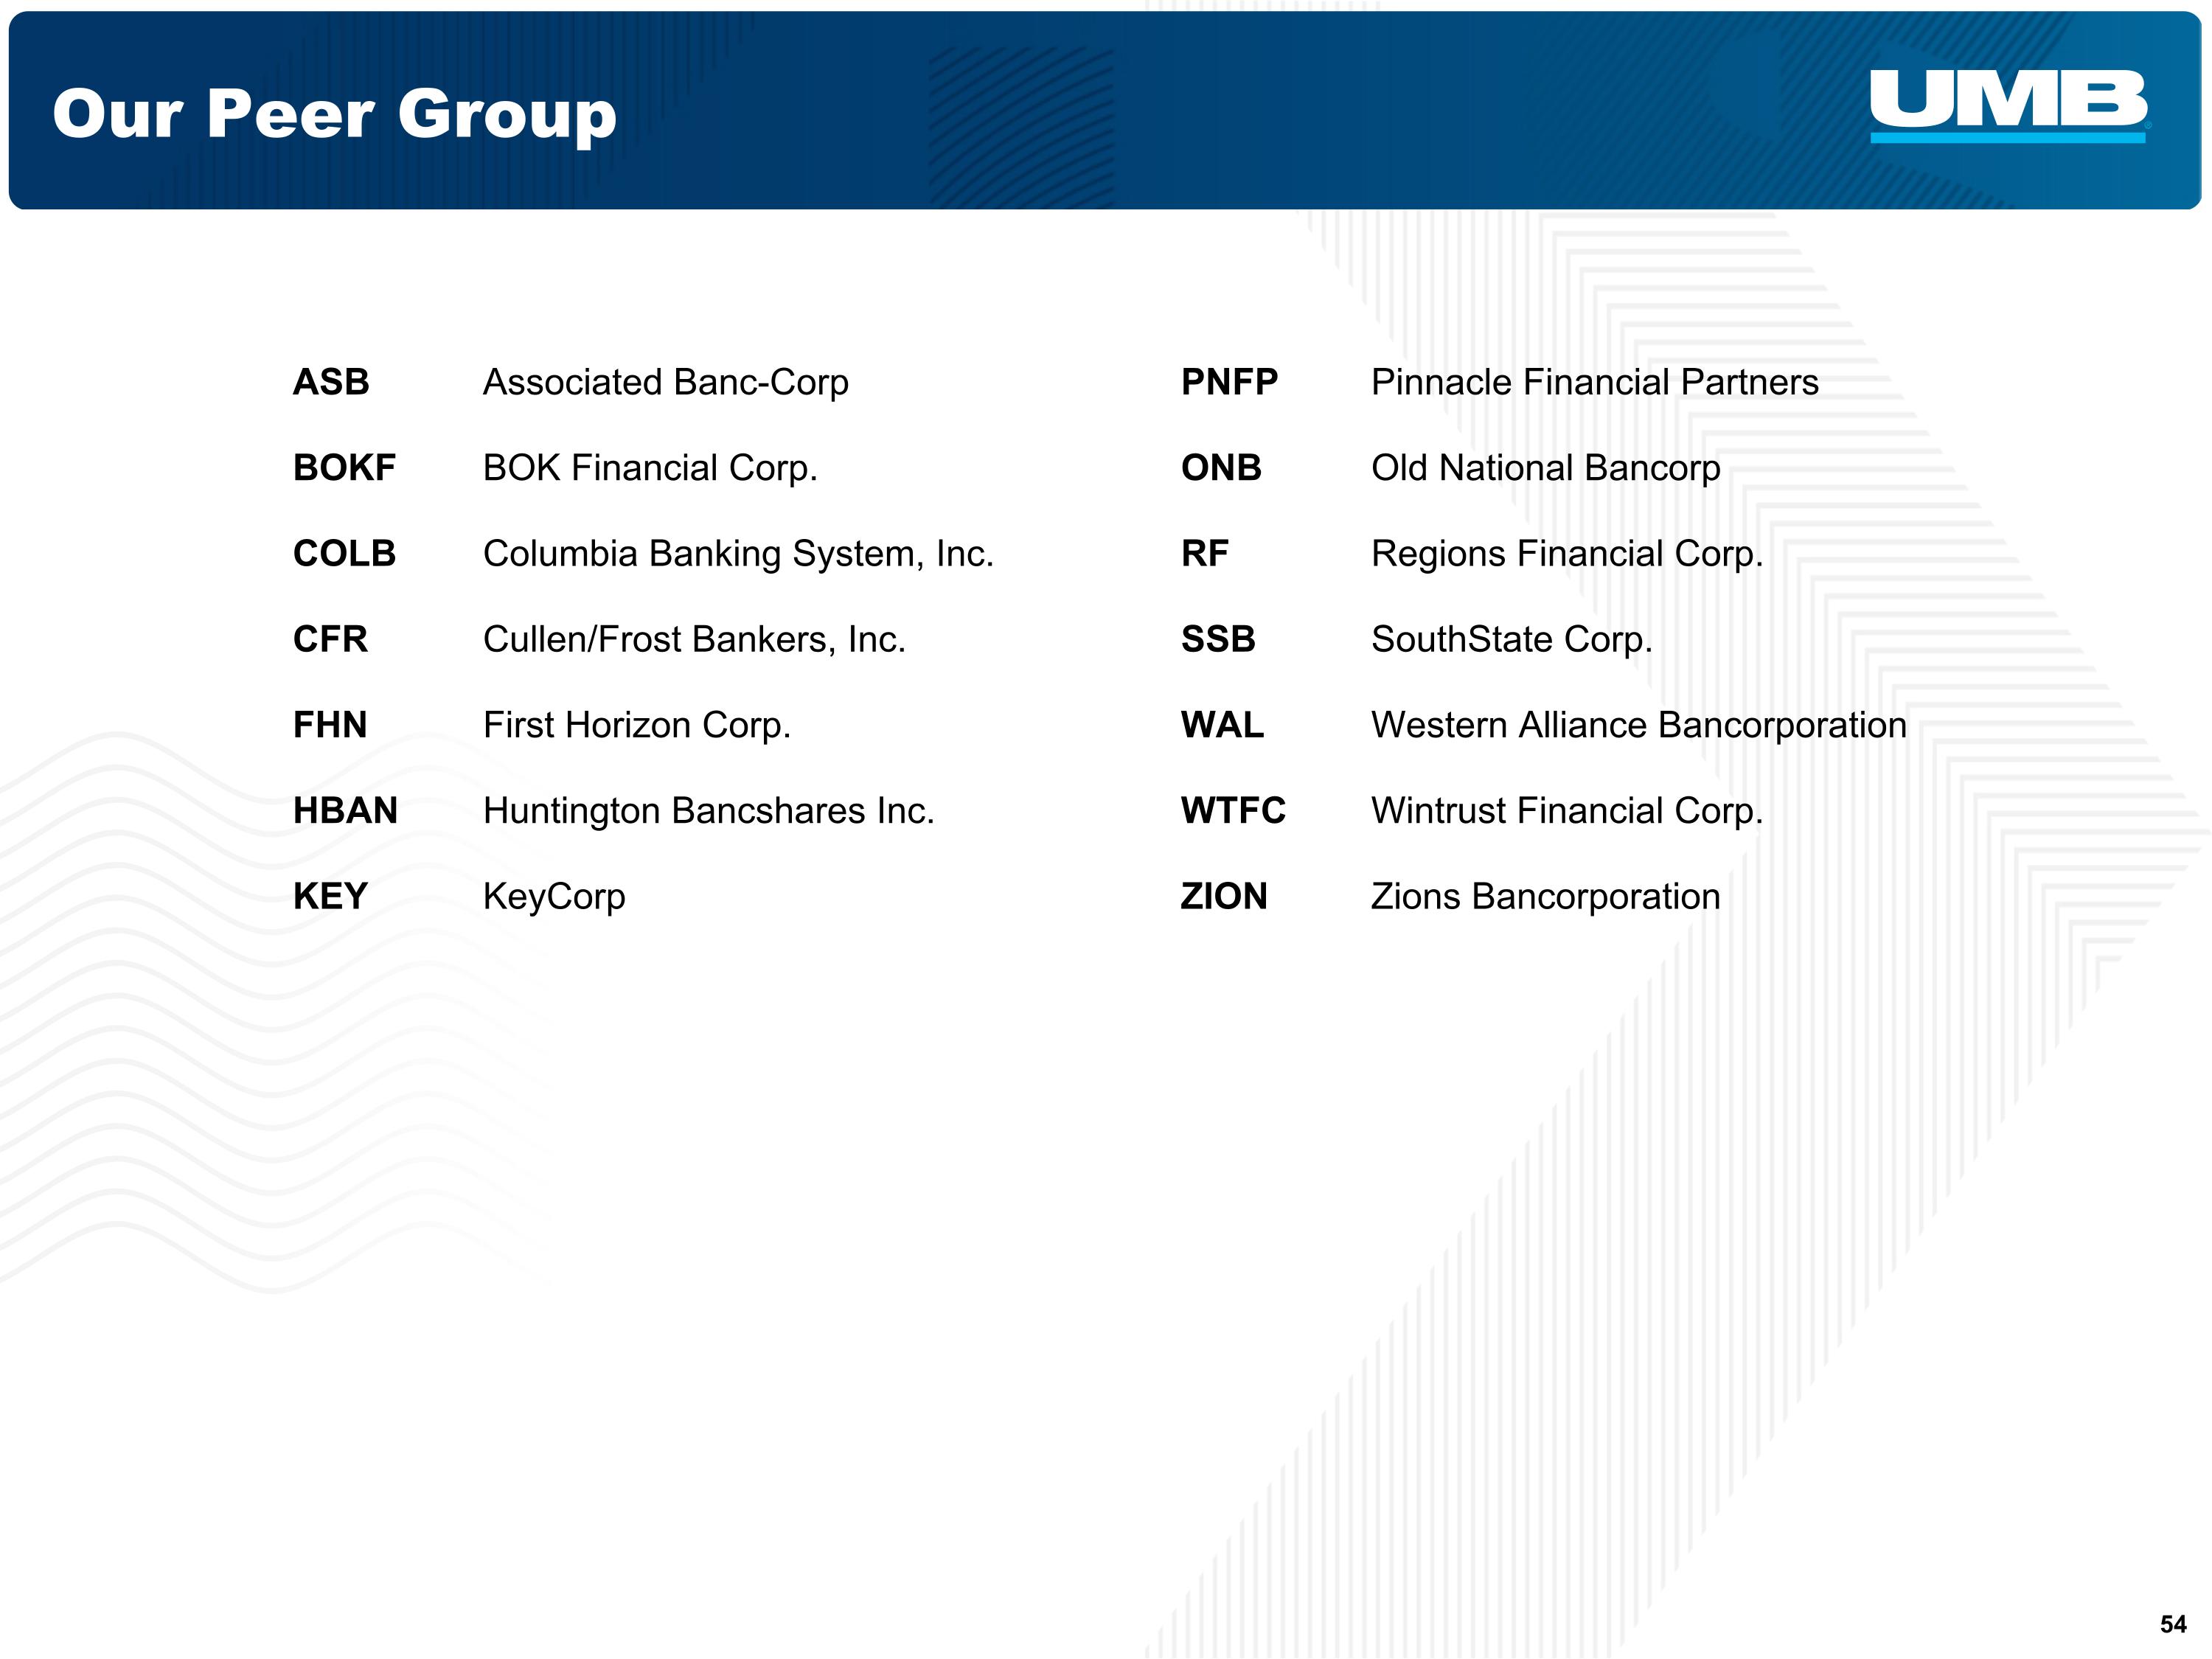
Our Peer Group ASB Associated Banc-Corp BOKF BOK Financial Corp. KEY KeyCorp COLB Columbia Banking System, Inc. HBAN Huntington Bancshares Inc. CFR Cullen/Frost Bankers, Inc. FHN First Horizon Corp. ONB Old National Bancorp PNFP Pinnacle Financial Partners SSB SouthState Corp. RF Regions Financial Corp. WAL Western Alliance Bancorporation WTFC Wintrust Financial Corp. ZION Zions Bancorporation