.2 Subordinated Notes Investor Presentation October 2025
Confidentiality Notice and Disclaimers This presentation has been prepared solely for informational purposes from information supplied by or on behalf of Univest Financial Corporation (“UVSP”) and its subsidiaries (collectively, the “Company,” “we,” “our” or “us”) and is confidential and does not constitute or form part of any offer to sell, or a solicitation of an offer to purchase, any of our securities or any of our affiliates or subsidiaries. Neither this presentation nor anything contained herein shall form the basis of any contract or commitment. The information in this presentation may not be reproduced or redistributed, passed on or divulged, directly or indirectly, to any other person. We reserve the right to request the return of this presentation at any time. This presentation is for informational purposes only and is being furnished on a confidential basis to a limited number of institutional accredited investors (as defined in Rule 501(a)(l), (2), (3), (7) or (9) under the Securities Act and qualified institutional buyers (as defined in Rule 144A under the Securities Act). Any such offering may be made only pursuant to a written purchase agreement and the information contained herein will be superseded in its entirety by such purchase agreement. This presentation does not contain all the information you should consider before investing in our securities and should not be construed as investment, legal, regulatory or tax advice. It does not purport to contain all the information that may be relevant. ln addition, the financial information presented in this presentation is derived from Company records including its filings with the SEC, including the audited and unaudited financial information therein. Each potential investor should review the purchase agreement, make such investigations as it deems necessary to arrive at an independent evaluation of an investment in the securities mentioned in this presentation and should consult its own legal counsel and financial, accounting, regulatory and tax advisors to determine the consequences of such an investment before making an investment decision and should not rely on any information set forth in this presentation. The securities referenced in this presentation have not been registered under the Securities Act or any state securities laws, and may not be offered or said absent registration or an exemption from registration under applicable law. Such securities have not been approved or disapproved by the SEC, any state securities commission, any federal or state banking regulators, or any other regulatory authority, nor have any of the foregoing authorities passed upon or endorsed the merits of any proposed offering of these securities or the accuracy or adequacy of this presentation. Any representation to the contrary is a criminal offense. The securities referenced in this presentation are not savings or deposit accounts and are not insured by the Federal Deposit Insurance Corporation or any other governmental agency or instrumentality. Certain information contained in this presentation may be derived from information provided by industry sources. We believe that such information is accurate and that the sources from which it has been obtained are reliable. We cannot guarantee the accuracy of such information, however, and have not independently verified such information. The delivery of this presentation will not, under any circumstances, create an implication that there has been no change in the affairs of the Company since the date of this presentation. The Company is not making any implied or express representation or warranty as to the accuracy or completeness of the information summarized herein or made available in connection with any further investigation of the Company. The Company expressly disclaims any and all liability which may be based on such information, errors therein or omissions therefrom. 2
Forward Looking Statements This presentation may contain forward-looking statements. When used or incorporated by reference in disclosure documents, the words “may,” “will,” “could,” “should,” “would,” “believe,” “anticipate,” “plan,” “estimate,” “expect,” “project,” “target,” and “goal,” the negative of these terms and other similar expressions are intended to identify forward-looking statements, but are not the exclusive means of identifying such statements, within the meaning of Section 27A of the Securities Act of 1933 (the “Securities Act”) and Section 21E of the Securities Exchange Act of 1934. These forward-looking statements may include but are not limited to: statements of goals, intentions and expectations; statements regarding business plans, prospects, growth and operating strategies; statements regarding the quality, growth and composition of loan, investment and deposit portfolios; statements regarding our financial performance, financial condition and liquidity; and estimates of our risks and future credit provision and non-interest expenses. These forward-looking statements are based on our current beliefs and expectations and are subject to significant business, economic and competitive uncertainties and contingencies, many of which are beyond our control. In addition, these forward-looking statements are subject to certain risks, uncertainties and assumptions with respect to future business strategies and decisions that are subject to change, including but not limited to those set forth below: • Operating, legal and regulatory risks; • Economic, political and competitive forces; • General economic conditions, either nationally or in our market areas, that are worse than expected, included as a result of employment levels and labor shortages, and the effect of potential recession or slowed economic growth caused by supply chain disruptions or otherwise; • Legislative, regulatory and accounting changes, including increased assessments by the Federal Deposit Insurance Corporation and change in the income tax laws and regulations; • Monetary and fiscal policies of the U.S. government, including policies of the U.S. Treasury and the Board of Governors of the Federal Reserve System; • Demand for our financial products and services in our market area; • Major catastrophes such as earthquakes, floods or other natural or human disasters and infectious disease outbreaks, the related disruption to local, regional and global economic activity and financial markets, and the impact that any of the foregoing may have on us and our customers and other constituencies; • Inflation or volatility in interest rates that reduce our margins and yields, the fair value of financial instruments or our level of loan originations or prepayments on loans we have made and make or the sale of loans or other assets and/or lead to higher operating costs and higher costs to retain or attract deposits; • The imposition of tariffs or other domestic or international governmental policies and retaliatory responses; • The impact of the current federal government shutdowns; • Fluctuations in real estate values in our market area; • A failure to maintain adequate levels of capital and liquidity to support our operations; • The composition and credit quality of our loan and investment portfolios; • Changes in the level and direction of loan delinquencies, classified and criticized loans and charge-offs and changes in estimates of the adequacy of the allowance for credit losses; • Changes in the economic assumptions or methodology utilized to calculate the allowance for credit losses; • Our ability to access cost-effective funding; • Changes in liquidity, including the size and composition of our deposit portfolio and the percentage of uninsured deposits in the portfolio; 3
Forward Looking Statements (Continued) • Our ability to implement our business strategies; • Our ability to manage market risk, credit risk, interest rate risk and operational risk; • Adverse changes in the securities markets; • The impact of any military conflict, terrorist act or other geopolitical acts; • Our ability to enter new markets successfully and capitalize on growth opportunities; • Competition for loans, deposits and employees; • System failures or cuber-security breaches of our information technology infrastructure and those our third-party service providers; • The failure to maintain current technologies and/or to successfully implement future information technology enhancements; • Changes in investor sentiment or consumer spending or savings behavior; • Our ability to attract and retain key employees; • Other risks and uncertainties, including those occurring in the U.S. and international financial systems; and • The risk that our analysis of these risks and forces could be incorrect and/or that the strategies developed to address them could be unsuccessful. Should one or more of these risks or uncertainties materialize, or should underlying assumptions prove incorrect, actual results may vary materially from those anticipated, estimated, expected or projected. These and other risk factors are more fully described in our Annual Report on Form 10-K for the year ended December 31, 2024 under the section entitled “Item 1A - Risk Factors,” and from time to time in other filings with the Securities and Exchange Commission (the “SEC”). These forward-looking statements speak only as of the date of this presentation. We expressly disclaim any obligation to publicly release any updates or revisions to reflect any change in our expectations with regard to any change in events, conditions or circumstances on which any such statement is based, unless otherwise required by law. Numbers in this presentation may not sum due to rounding. 4
Non-GAAP Financial Measures This presentation contains financial information determined by methods other than in accordance with accounting principles generally accepted in the United States of America (“GAAP”). These non-GAAP measures include tangible common equity, average tangible common equity, tangible assets, average assets excluding Paycheck Protection Program loans ( PPP ), total loans excluding PPP, average interest earning assets excluding excess liquidity and PPP, net interest income (tax equivalent), core net interest income, reported net interest margin (tax equivalent), core net interest margin, tax equivalent revenue, core tax equivalent revenue, core pre-tax pre-provision income less net charge-offs (“PTPP-NCO”), and core noninterest expense and core noninterest expense excluding PA shares tax. Management uses these “non-GAAP” measures in its analysis of the Corporation’s performance. Management believes these non-GAAP financial measures allow for better comparability of period to period operating performance. Additionally, the Corporation believes this information is utilized by regulators and market analysts to evaluate a company’s financial condition and therefore, such information is useful to investors. Non-GAAP financial measures have inherent limitations, are not uniformly applied and are not audited. Because non-GAAP financial measures are not standardized, it may not be possible to compare these financial measures with other companies’ non-GAAP financial measures having the same or similar names. These disclosures should not be viewed as a substitute for operating results determined in accordance with GAAP, nor are they necessarily comparable to non-GAAP performance measures that may be presented by other companies. A reconciliation of the non-GAAP measures used in this presentation to the most directly comparable GAAP measures is provided in the Appendix to this presentation. 5
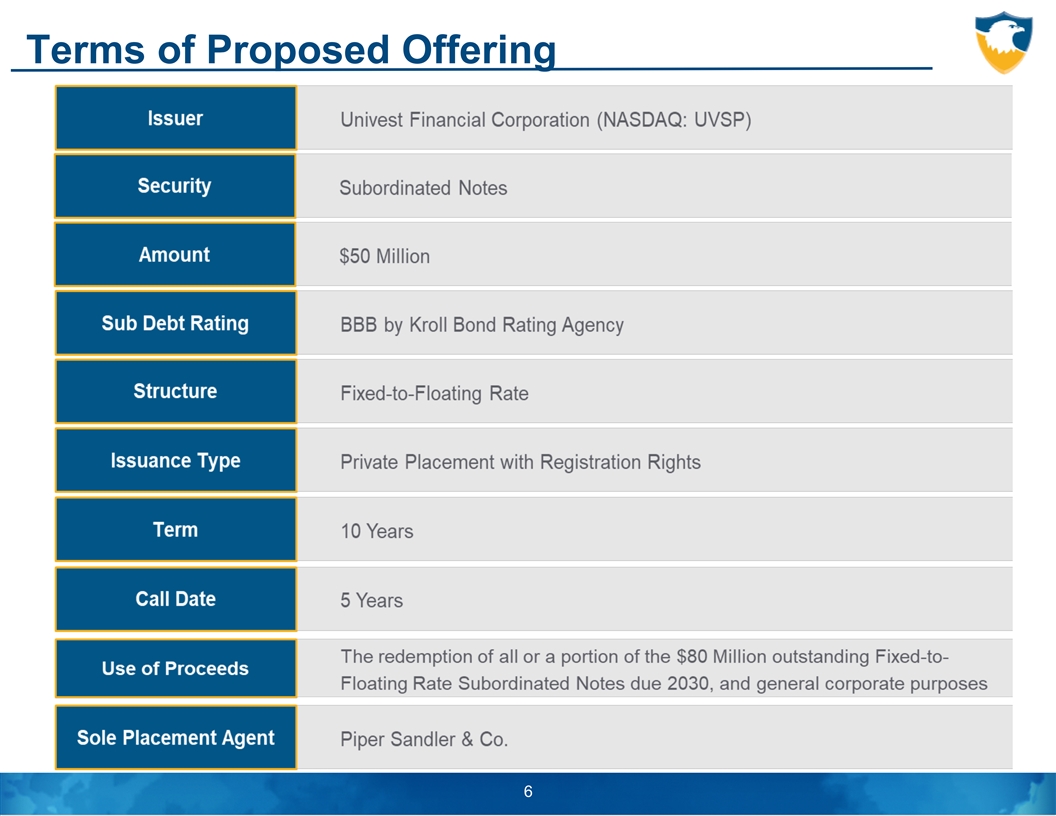
Terms of Proposed Offering 6

COMPANY OVERVIEW
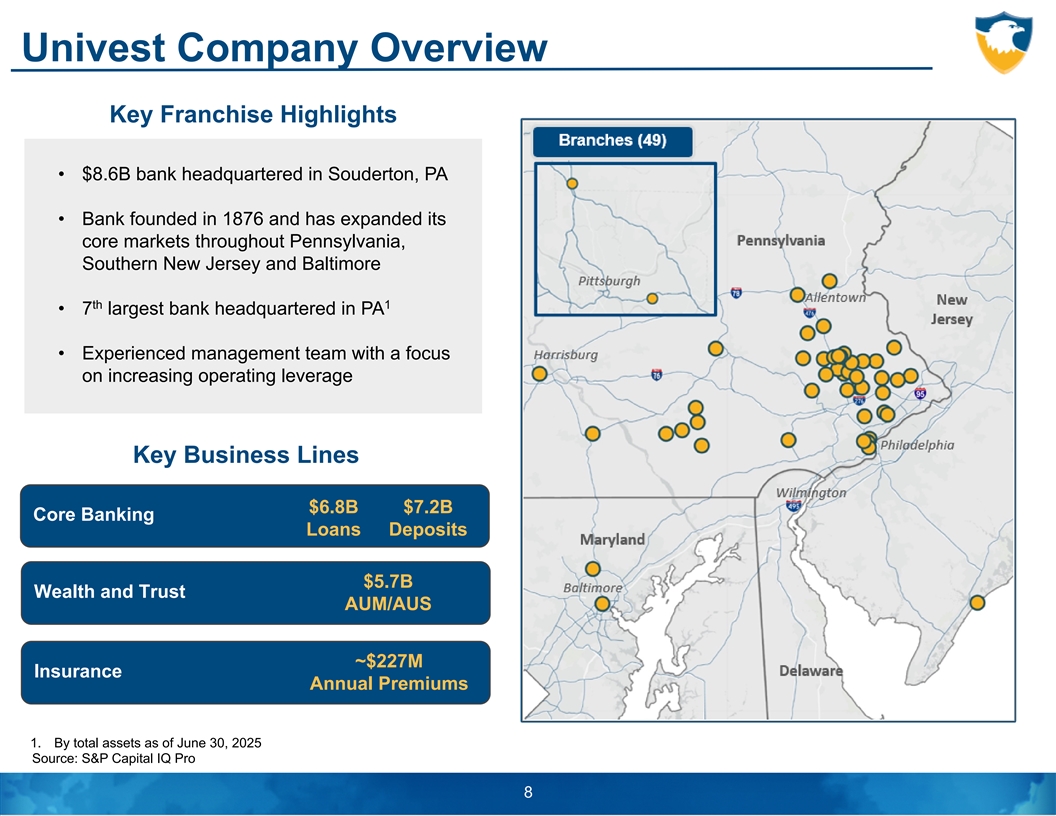
Univest Company Overview Key Franchise Highlights • $8.6B bank headquartered in Souderton, PA • Bank founded in 1876 and has expanded its core markets throughout Pennsylvania, Southern New Jersey and Baltimore th 1 • 7 largest bank headquartered in PA • Experienced management team with a focus on increasing operating leverage Key Business Lines $6.8B $7.2B Core Banking Loans Deposits $5.7B Wealth and Trust AUM/AUS ~$227M Insurance Annual Premiums 1. By total assets as of June 30, 2025 Source: S&P Capital IQ Pro 8
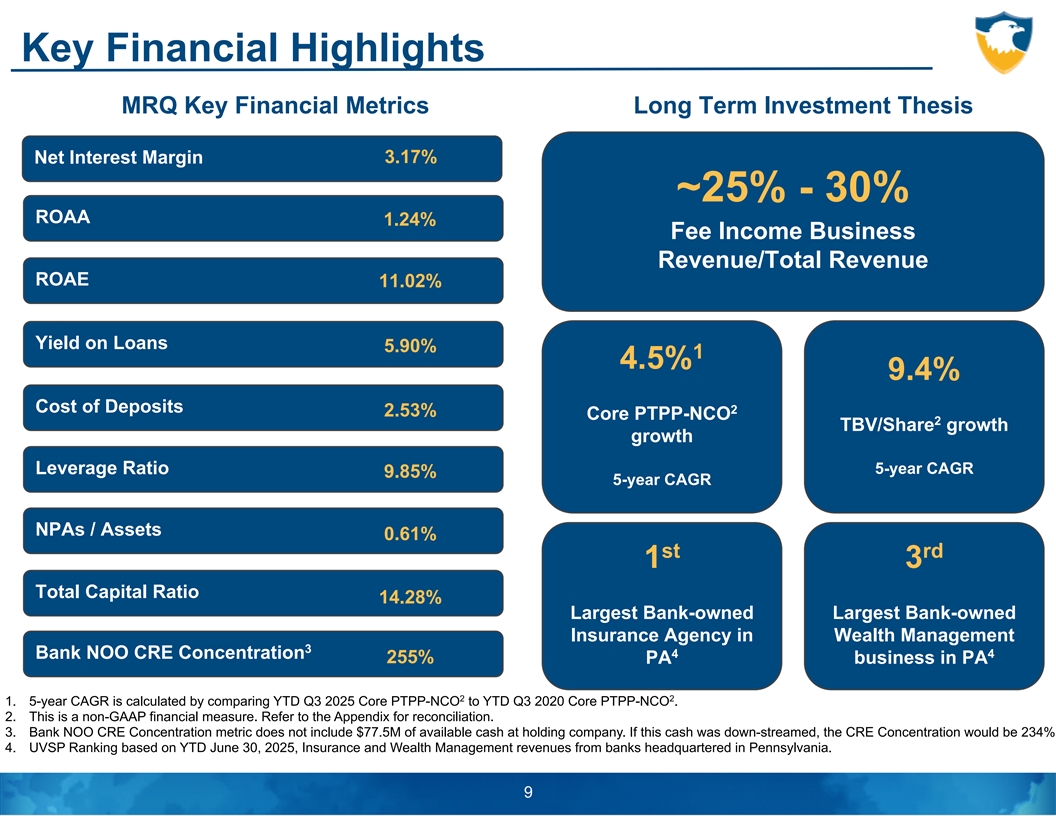
Key Financial Highlights MRQ Key Financial Metrics Long Term Investment Thesis Net Interest Margin 3.17% ~25% - 30% ROAA 1.24% Fee Income Business Revenue/Total Revenue ROAE 11.02% Yield on Loans 5.90% 1 4.5% 9.4% Cost of Deposits 2 2.53% Core PTPP-NCO 2 TBV/Share growth growth Leverage Ratio 5-year CAGR 9.85% 5-year CAGR NPAs / Assets 0.61% st rd 1 3 Total Capital Ratio 14.28% Largest Bank-owned Largest Bank-owned Insurance Agency in Wealth Management 3 Bank NOO CRE Concentration 4 4 255% PA business in PA 2 2 1. 5-year CAGR is calculated by comparing YTD Q3 2025 Core PTPP-NCO to YTD Q3 2020 Core PTPP-NCO . 2. This is a non-GAAP financial measure. Refer to the Appendix for reconciliation. 3. Bank NOO CRE Concentration metric does not include $77.5M of available cash at holding company. If this cash was down-streamed, the CRE Concentration would be 234% 4. UVSP Ranking based on YTD June 30, 2025, Insurance and Wealth Management revenues from banks headquartered in Pennsylvania. 9
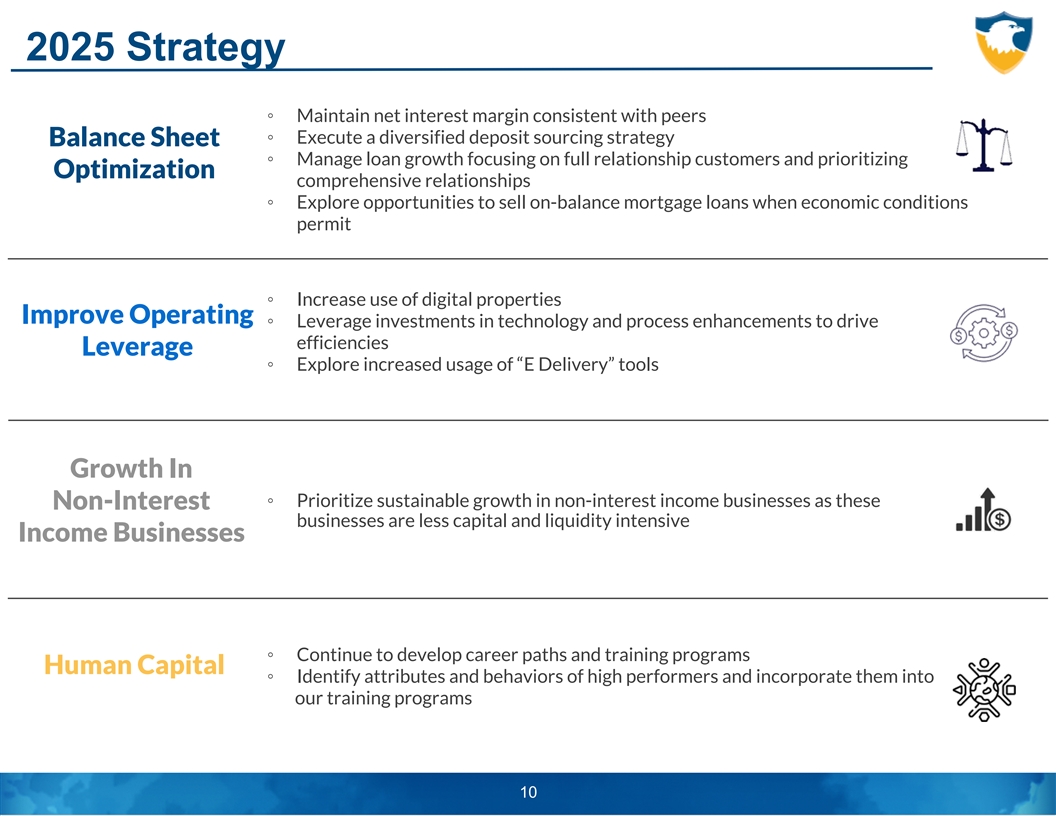
2025 Strategy ◦ Maintain net interest margin consistent with peers ◦ Execute a diversified deposit sourcing strategy Balance Sheet ◦ Manage loan growth focusing on full relationship customers and prioritizing Optimization comprehensive relationships ◦ Explore opportunities to sell on-balance mortgage loans when economic conditions permit ◦ Increase use of digital properties Improve Operating ◦ Leverage investments in technology and process enhancements to drive efficiencies Leverage ◦ Explore increased usage of “E Delivery” tools Growth In ◦ Prioritize sustainable growth in non-interest income businesses as these Non-Interest businesses are less capital and liquidity intensive Income Businesses ◦ Continue to develop career paths and training programs Human Capital ◦ Identify attributes and behaviors of high performers and incorporate them into our training programs 10
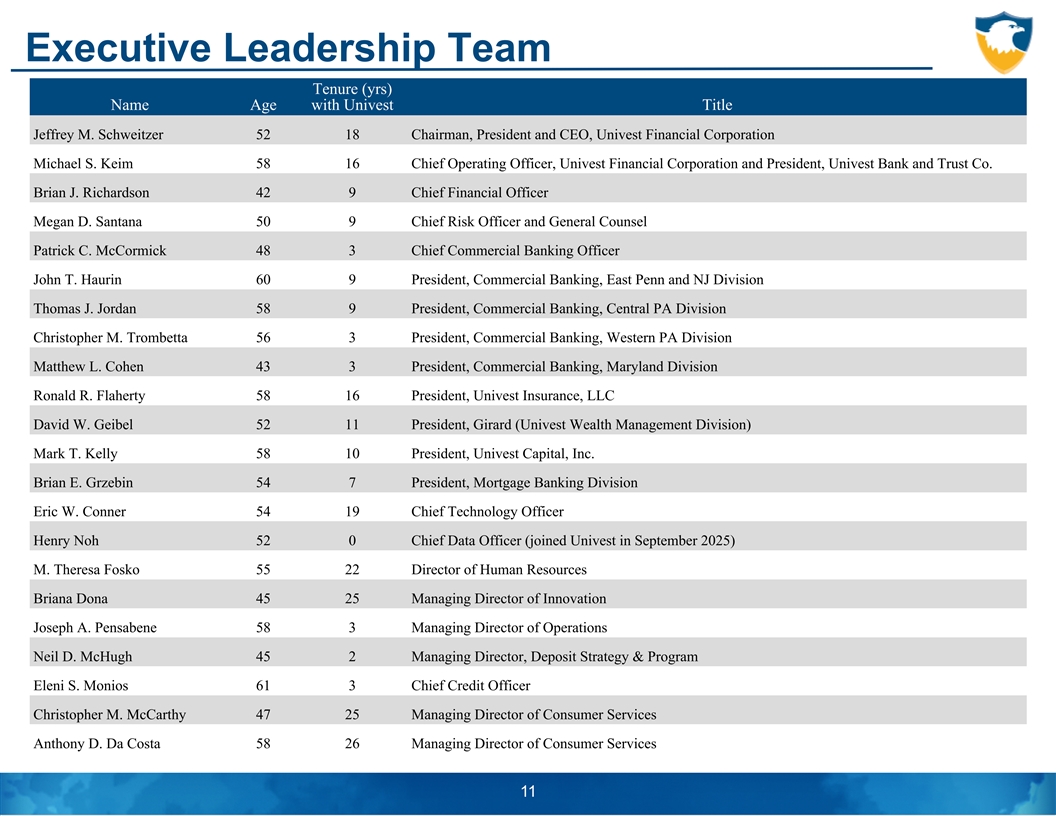
Executive Leadership Team Tenure (yrs) Name Age with Univest Title Jeffrey M. Schweitzer 52 18 Chairman, President and CEO, Univest Financial Corporation Michael S. Keim 58 16 Chief Operating Officer, Univest Financial Corporation and President, Univest Bank and Trust Co. Brian J. Richardson 42 9 Chief Financial Officer Megan D. Santana 50 9 Chief Risk Officer and General Counsel Patrick C. McCormick 48 3 Chief Commercial Banking Officer John T. Haurin 60 9 President, Commercial Banking, East Penn and NJ Division Thomas J. Jordan 58 9 President, Commercial Banking, Central PA Division Christopher M. Trombetta 56 3 President, Commercial Banking, Western PA Division Matthew L. Cohen 43 3 President, Commercial Banking, Maryland Division Ronald R. Flaherty 58 16 President, Univest Insurance, LLC David W. Geibel 52 11 President, Girard (Univest Wealth Management Division) Mark T. Kelly 58 10 President, Univest Capital, Inc. Brian E. Grzebin 54 7 President, Mortgage Banking Division Eric W. Conner 54 19 Chief Technology Officer Henry Noh 52 0 Chief Data Officer (joined Univest in September 2025) M. Theresa Fosko 55 22 Director of Human Resources Briana Dona 45 25 Managing Director of Innovation Joseph A. Pensabene 58 3 Managing Director of Operations Neil D. McHugh 45 2 Managing Director, Deposit Strategy & Program 11 Eleni S. Monios 61 3 Chief Credit Officer Christopher M. McCarthy 47 25 Managing Director of Consumer Services Anthony D. Da Costa 58 26 Managing Director of Consumer Services 11
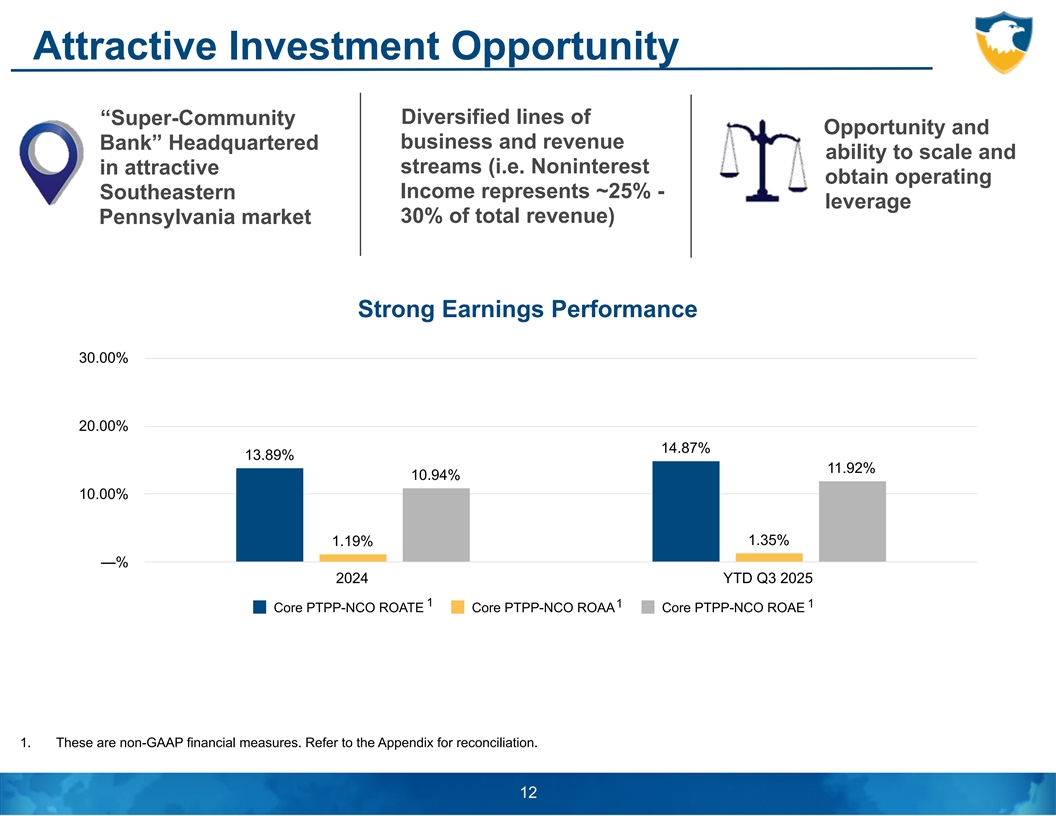
Attractive Investment Opportunity Diversified lines of “Super-Community Opportunity and business and revenue Bank” Headquartered ability to scale and streams (i.e. Noninterest in attractive obtain operating Income represents ~25% - Southeastern leverage 30% of total revenue) Pennsylvania market Strong Earnings Performance 30.00% 20.00% 14.87% 13.89% 11.92% 10.94% 10.00% 1.35% 1.19% —% 2024 YTD Q3 2025 1 1 1 Core PTPP-NCO ROATE Core PTPP-NCO ROAA Core PTPP-NCO ROAE 1. These are non-GAAP financial measures. Refer to the Appendix for reconciliation. 12
LINE OF BUSINESS OVERVIEW
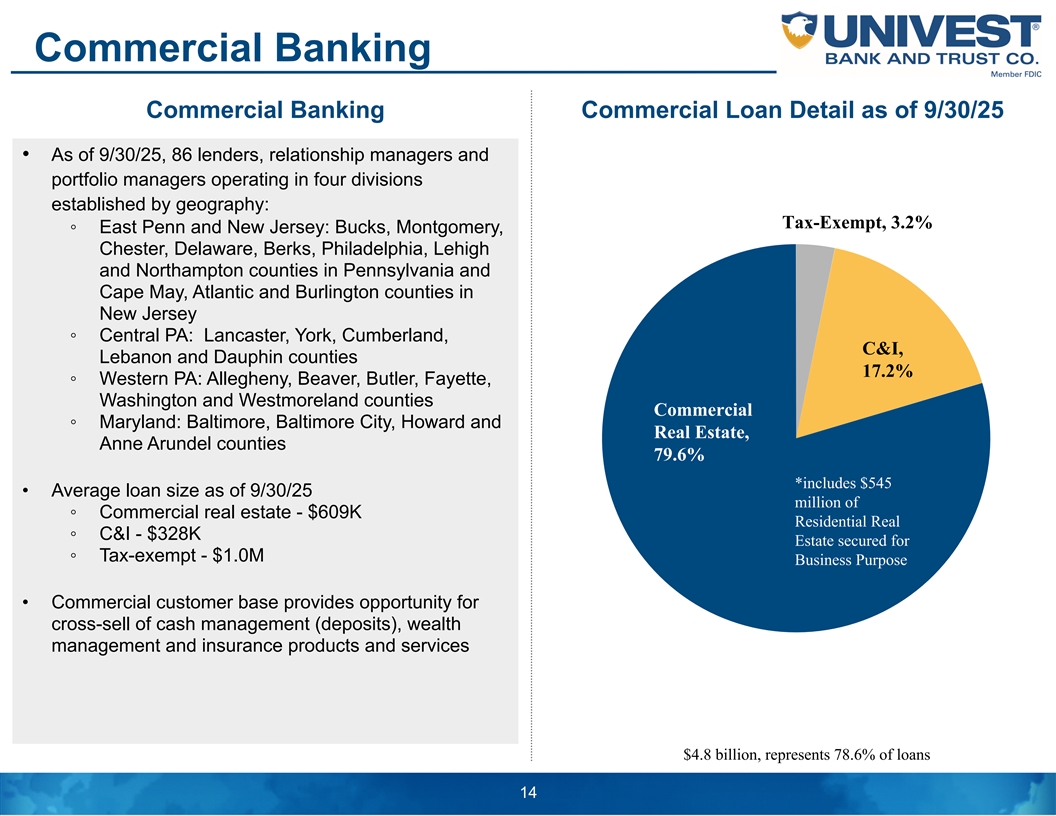
Commercial Banking Commercial Banking Commercial Loan Detail as of 9/30/25 • As of 9/30/25, 86 lenders, relationship managers and portfolio managers operating in four divisions established by geography: Tax-Exempt, 3.2% ◦ East Penn and New Jersey: Bucks, Montgomery, Chester, Delaware, Berks, Philadelphia, Lehigh and Northampton counties in Pennsylvania and Cape May, Atlantic and Burlington counties in New Jersey ◦ Central PA: Lancaster, York, Cumberland, C&I, Lebanon and Dauphin counties 17.2% ◦ Western PA: Allegheny, Beaver, Butler, Fayette, Washington and Westmoreland counties Commercial ◦ Maryland: Baltimore, Baltimore City, Howard and Real Estate, Anne Arundel counties 79.6% *includes $545 • Average loan size as of 9/30/25 million of ◦ Commercial real estate - $609K Residential Real ◦ C&I - $328K Estate secured for ◦ Tax-exempt - $1.0M Business Purpose • Commercial customer base provides opportunity for cross-sell of cash management (deposits), wealth management and insurance products and services $4.8 billion, represents 78.6% of loans 14
Consumer Banking • 27 financial service centers located in Bucks, Lancaster, Lehigh, Montgomery, Northampton and Philadelphia counties in PA; also operating 12 Regional Centers (Deposit Taking) and 10 retirement centers in Bucks and Montgomery counties in PA. • Proactively addressed continued reduction in transactional volume by closing 22 financial centers and four retirement centers since September 2015; reinvesting savings in our digital solutions and expanded operating footprint • Financial centers staffed by combination of personal bankers and tellers, providing both transaction and consultative services augmented by technology • Focused on creating seamless customer experience between in-person and digital • Growth strategy focused on obtaining consumer business from commercial customers and their employee base Note: Information above as of 9/30/25. 15
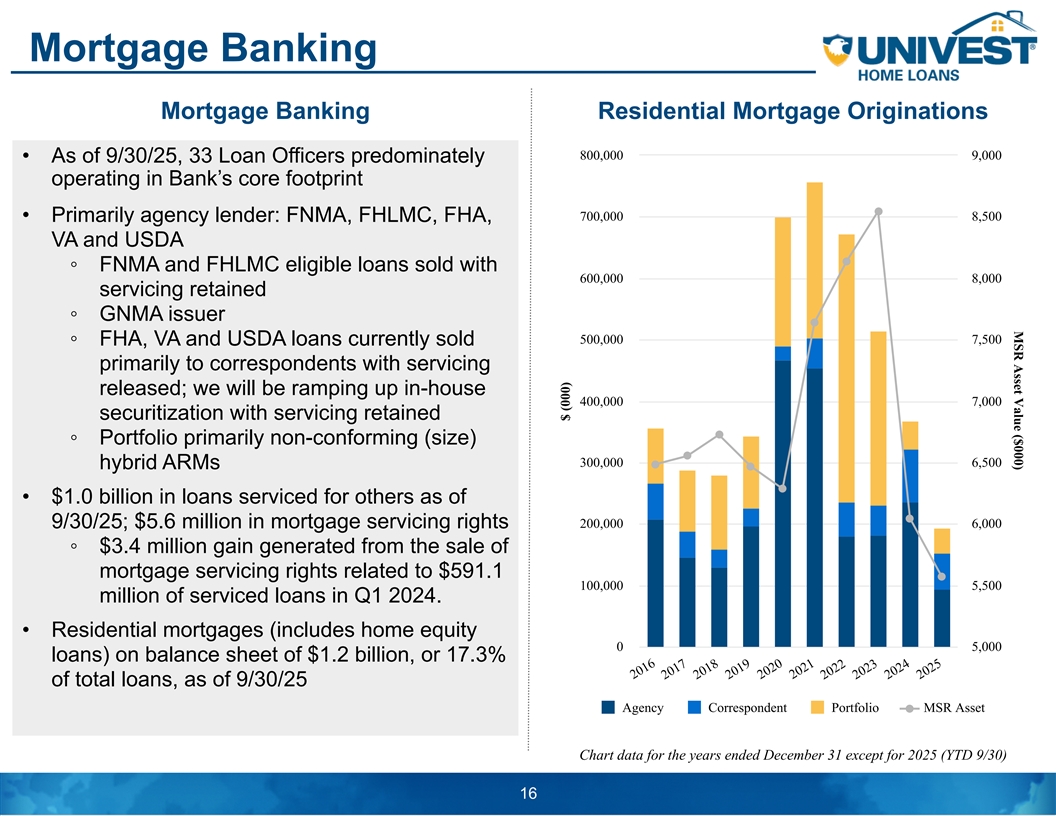
MSR Asset Value ($000) Mortgage Banking Mortgage Banking Residential Mortgage Originations 800,000 9,000 • As of 9/30/25, 33 Loan Officers predominately operating in Bank’s core footprint 700,000 8,500 • Primarily agency lender: FNMA, FHLMC, FHA, VA and USDA ◦ FNMA and FHLMC eligible loans sold with 600,000 8,000 servicing retained ◦ GNMA issuer 500,000 7,500 ◦ FHA, VA and USDA loans currently sold primarily to correspondents with servicing released; we will be ramping up in-house 400,000 7,000 securitization with servicing retained ◦ Portfolio primarily non-conforming (size) 300,000 6,500 hybrid ARMs • $1.0 billion in loans serviced for others as of 9/30/25; $5.6 million in mortgage servicing rights 200,000 6,000 ◦ $3.4 million gain generated from the sale of mortgage servicing rights related to $591.1 100,000 5,500 million of serviced loans in Q1 2024. • Residential mortgages (includes home equity 0 5,000 loans) on balance sheet of $1.2 billion, or 17.3% of total loans, as of 9/30/25 Agency Correspondent Portfolio MSR Asset Chart data for the years ended December 31 except for 2025 (YTD 9/30) 16 2016 2017 2018 2019 2020 2021 2022 2023 2024 2025 $ (000)
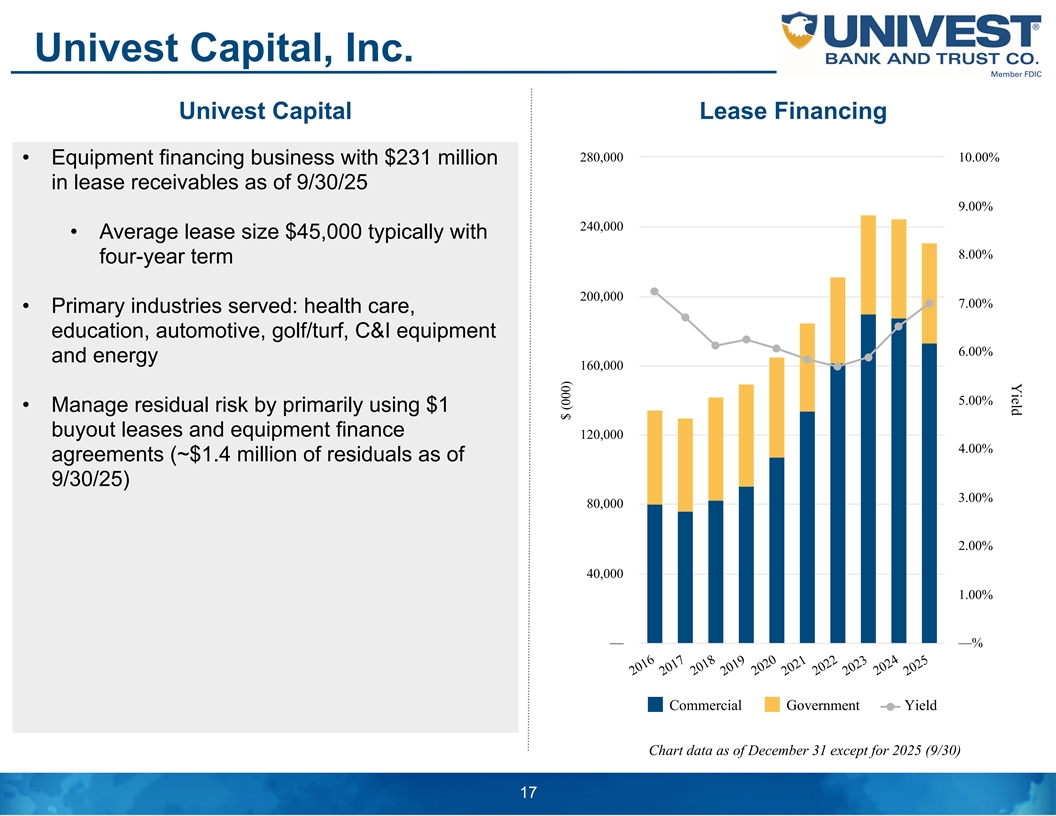
Yield Univest Capital, Inc. Univest Capital Lease Financing 280,000 10.00% • Equipment financing business with $231 million in lease receivables as of 9/30/25 9.00% 240,000 • Average lease size $45,000 typically with 8.00% four-year term 200,000 7.00% • Primary industries served: health care, education, automotive, golf/turf, C&I equipment 6.00% and energy 160,000 5.00% • Manage residual risk by primarily using $1 buyout leases and equipment finance 120,000 4.00% agreements (~$1.4 million of residuals as of 9/30/25) 3.00% 80,000 2.00% 40,000 1.00% — —% Commercial Government Yield Chart data as of December 31 except for 2025 (9/30) 17 2016 2017 2018 2019 2020 2021 2022 2023 2024 2025 $ (000)
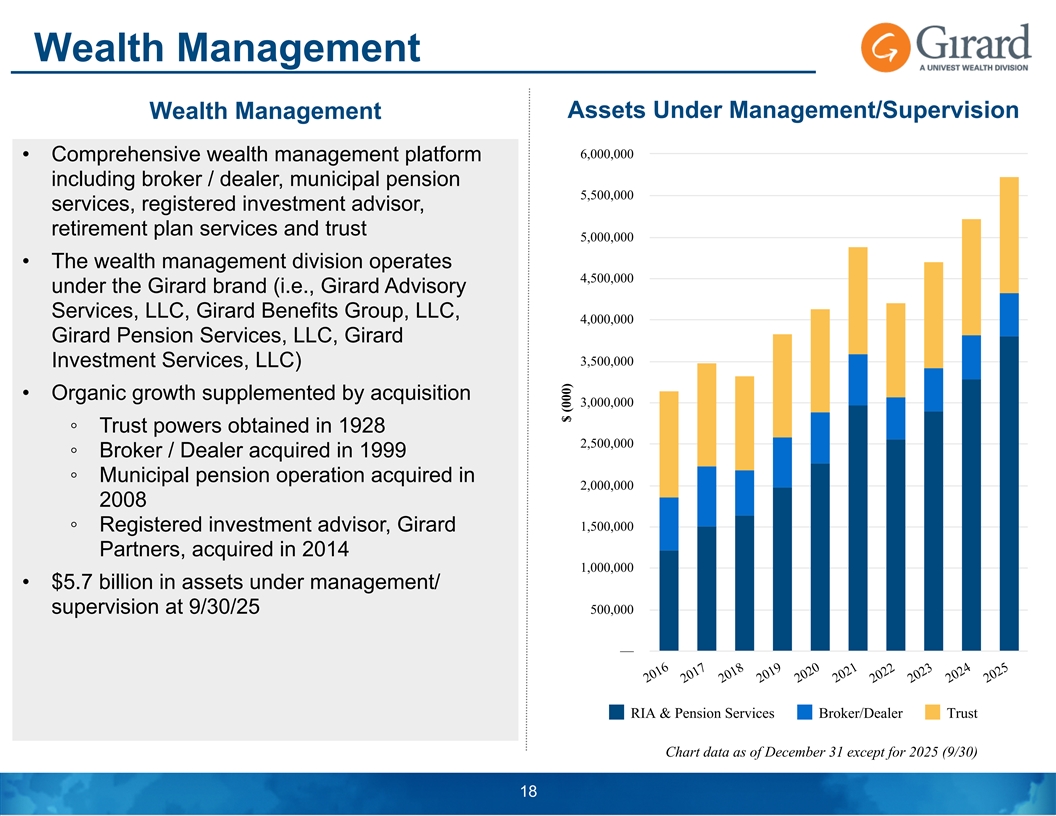
Wealth Management Wealth Management Assets Under Management/Supervision 6,000,000 • Comprehensive wealth management platform including broker / dealer, municipal pension 5,500,000 services, registered investment advisor, retirement plan services and trust 5,000,000 • The wealth management division operates 4,500,000 under the Girard brand (i.e., Girard Advisory Services, LLC, Girard Benefits Group, LLC, 4,000,000 Girard Pension Services, LLC, Girard 3,500,000 Investment Services, LLC) • Organic growth supplemented by acquisition 3,000,000 ◦ Trust powers obtained in 1928 2,500,000 ◦ Broker / Dealer acquired in 1999 ◦ Municipal pension operation acquired in 2,000,000 2008 1,500,000 ◦ Registered investment advisor, Girard Partners, acquired in 2014 1,000,000 • $5.7 billion in assets under management/ supervision at 9/30/25 500,000 — RIA & Pension Services Broker/Dealer Trust Chart data as of December 31 except for 2025 (9/30) 18 2016 2017 2018 2019 2020 2021 2022 2023 2024 2025 $ (000)
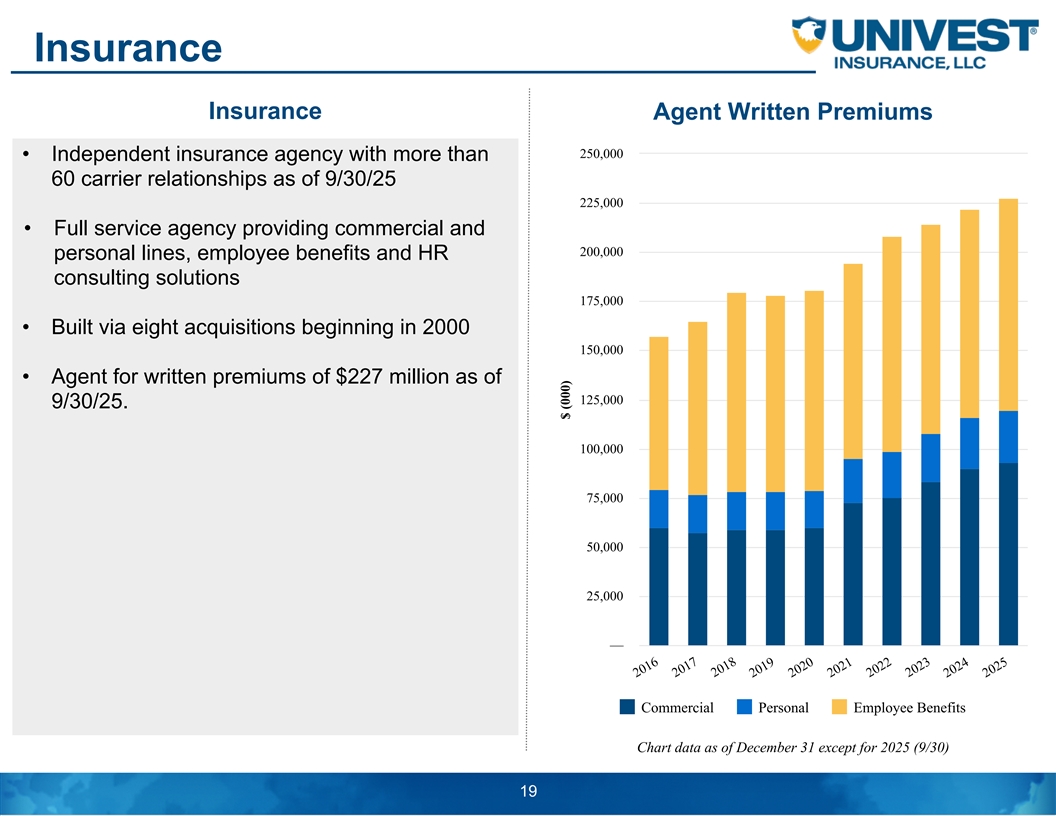
Insurance Insurance Agent Written Premiums 250,000 • Independent insurance agency with more than 60 carrier relationships as of 9/30/25 225,000 • Full service agency providing commercial and 200,000 personal lines, employee benefits and HR consulting solutions 175,000 • Built via eight acquisitions beginning in 2000 150,000 • Agent for written premiums of $227 million as of 125,000 9/30/25. 100,000 75,000 50,000 25,000 — Commercial Personal Employee Benefits Chart data as of December 31 except for 2025 (9/30) 19 2016 2017 2018 2019 2020 2021 2022 2023 2024 2025 $ (000)

SUMMARY FINANCIAL HIGHLIGHTS
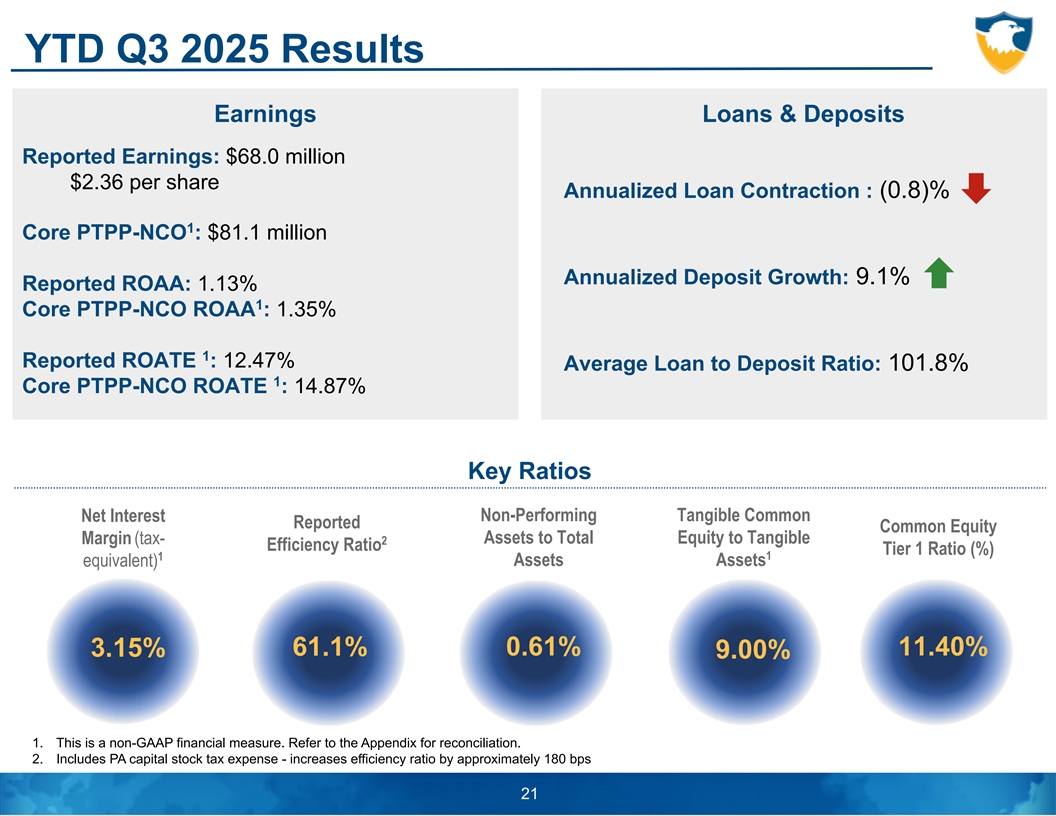
YTD Q3 2025 Results Earnings Loans & Deposits Reported Earnings: $68.0 million $2.36 per share Annualized Loan Contraction : (0.8)% 1 Core PTPP-NCO : $81.1 million Annualized Deposit Growth: 9.1% Reported ROAA: 1.13% 1 Core PTPP-NCO ROAA : 1.35% 1 Reported ROATE : 12.47% Average Loan to Deposit Ratio: 101.8% 1 Core PTPP-NCO ROATE : 14.87% Key Ratios Non-Performing Tangible Common Net Interest Reported Common Equity Margin (tax- Assets to Total Equity to Tangible 2 Efficiency Ratio Tier 1 Ratio (%) 1 1 equivalent) Assets Assets 61.1% 0.61% 11.40% 3.15% 9.00% 1. This is a non-GAAP financial measure. Refer to the Appendix for reconciliation. 2. Includes PA capital stock tax expense - increases efficiency ratio by approximately 180 bps 21
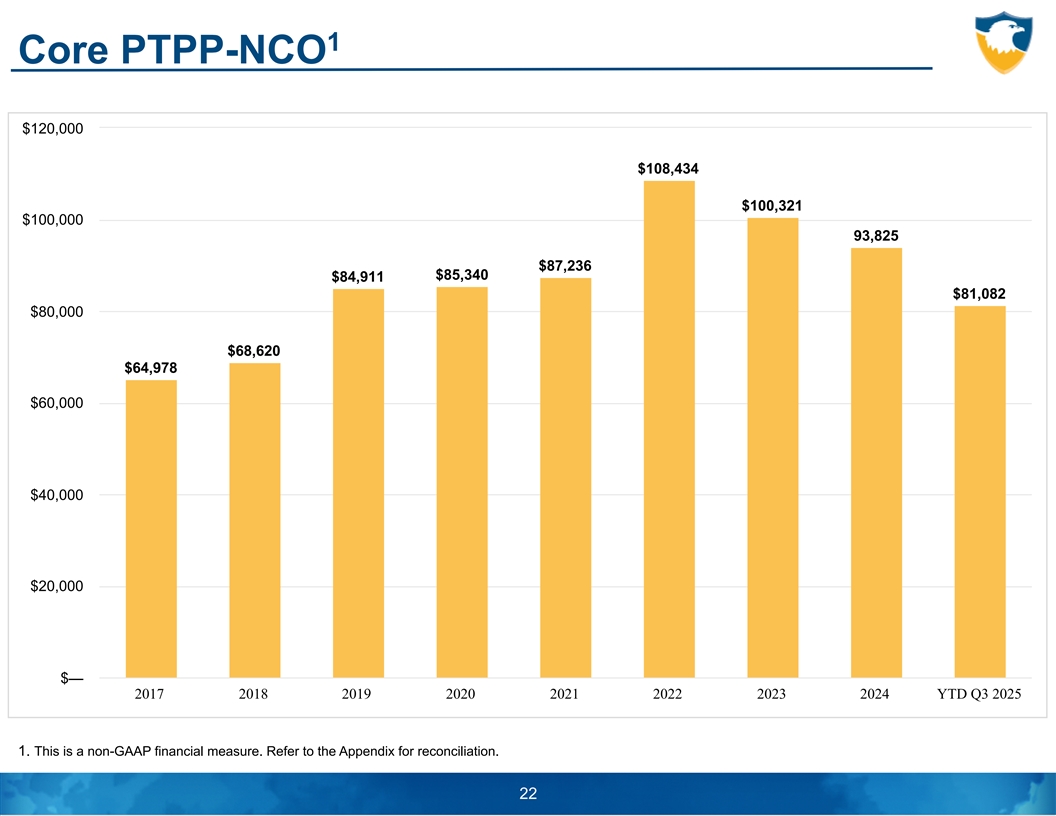
1 Core PTPP-NCO $120,000 $108,434 $100,321 $100,000 93,825 $87,236 $85,340 $84,911 $81,082 $80,000 $68,620 $64,978 $60,000 $40,000 $20,000 $— 2017 2018 2019 2020 2021 2022 2023 2024 YTD Q3 2025 1. This is a non-GAAP financial measure. Refer to the Appendix for reconciliation. 22
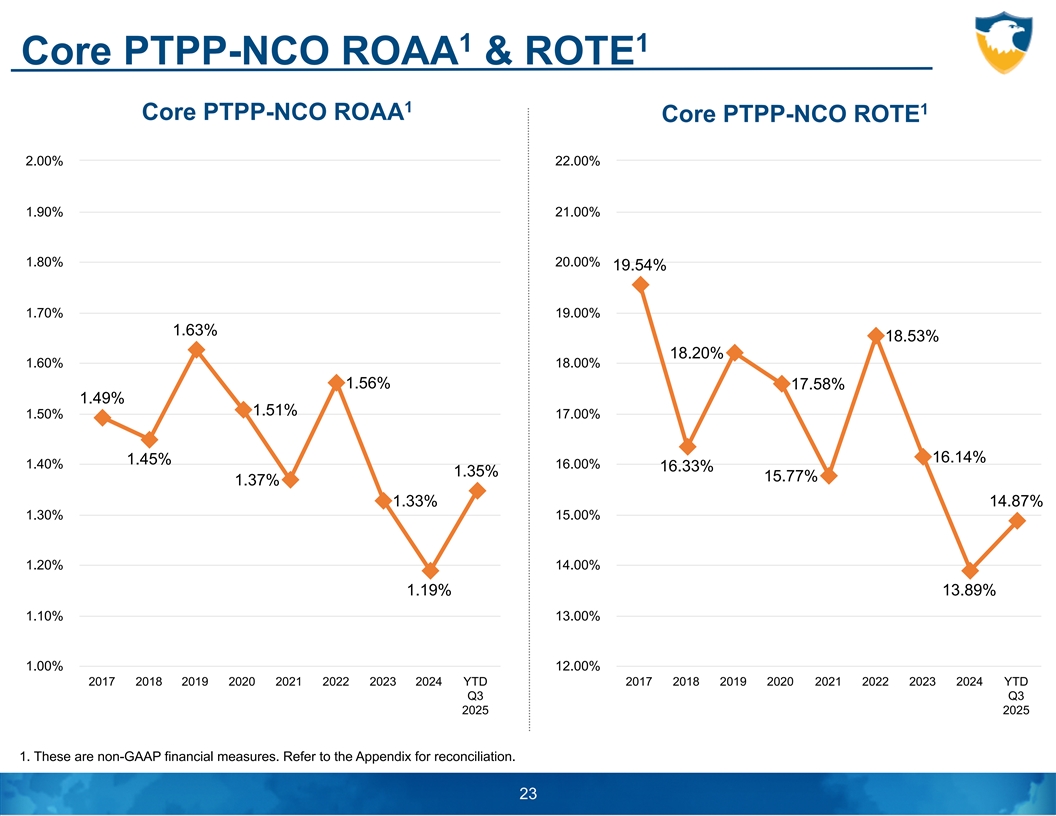
1 1 Core PTPP-NCO ROAA & ROTE 1 1 Core PTPP-NCO ROAA Core PTPP-NCO ROTE 2.00% 22.00% 1.90% 21.00% 1.80% 20.00% 19.54% 1.70% 19.00% 1.63% 18.53% 18.20% 1.60% 18.00% 1.56% 17.58% 1.49% 1.51% 1.50% 17.00% 16.14% 1.45% 1.40% 16.00% 16.33% 1.35% 15.77% 1.37% 1.33% 14.87% 1.30% 15.00% 1.20% 14.00% 1.19% 13.89% 1.10% 13.00% 1.00% 12.00% 2017 2018 2019 2020 2021 2022 2023 2024 YTD 2017 2018 2019 2020 2021 2022 2023 2024 YTD Q3 Q3 2025 2025 1. These are non-GAAP financial measures. Refer to the Appendix for reconciliation. 23
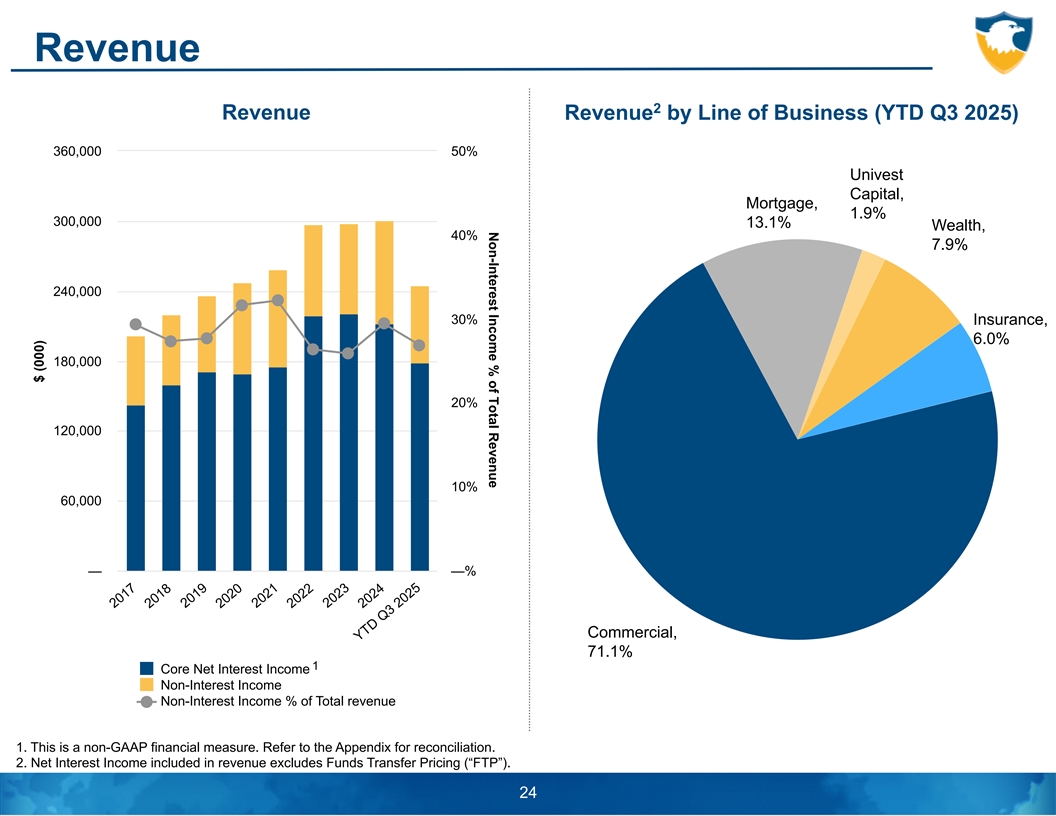
Non-Interest Income % of Total Revenue Revenue 2 Revenue Revenue by Line of Business (YTD Q3 2025) 360,000 50% Univest Capital, Mortgage, 1.9% 300,000 13.1% Wealth, 40% 7.9% 240,000 30% Insurance, 6.0% 180,000 20% 120,000 10% 60,000 — —% Commercial, 71.1% 1 Core Net Interest Income Non-Interest Income Non-Interest Income % of Total revenue 1. This is a non-GAAP financial measure. Refer to the Appendix for reconciliation. 2. Net Interest Income included in revenue excludes Funds Transfer Pricing (“FTP”). 24 Revenue = Net Interest Income + Noninterest Income 2017 2018 2019 2020 2021 2022 2023 2024 YTD Q3 2025 $ (000)
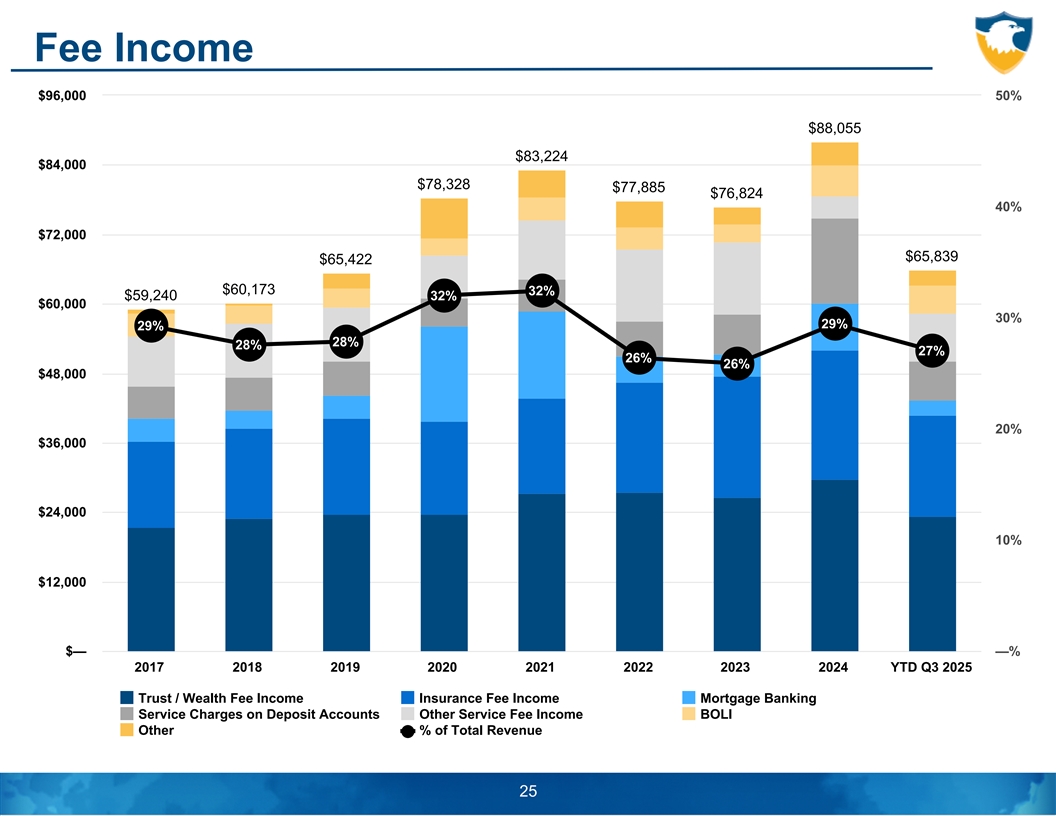
Fee Income $96,000 50% $88,055 $83,224 $84,000 $78,328 $77,885 $76,824 40% $72,000 $65,839 $65,422 $60,173 32% $59,240 32% $60,000 30% 29% 29% 28% 28% 27% 26% 26% $48,000 20% $36,000 $24,000 10% $12,000 $— —% 2017 2018 2019 2020 2021 2022 2023 2024 YTD Q3 2025 Trust / Wealth Fee Income Insurance Fee Income Mortgage Banking Service Charges on Deposit Accounts Other Service Fee Income BOLI Other % of Total Revenue 25
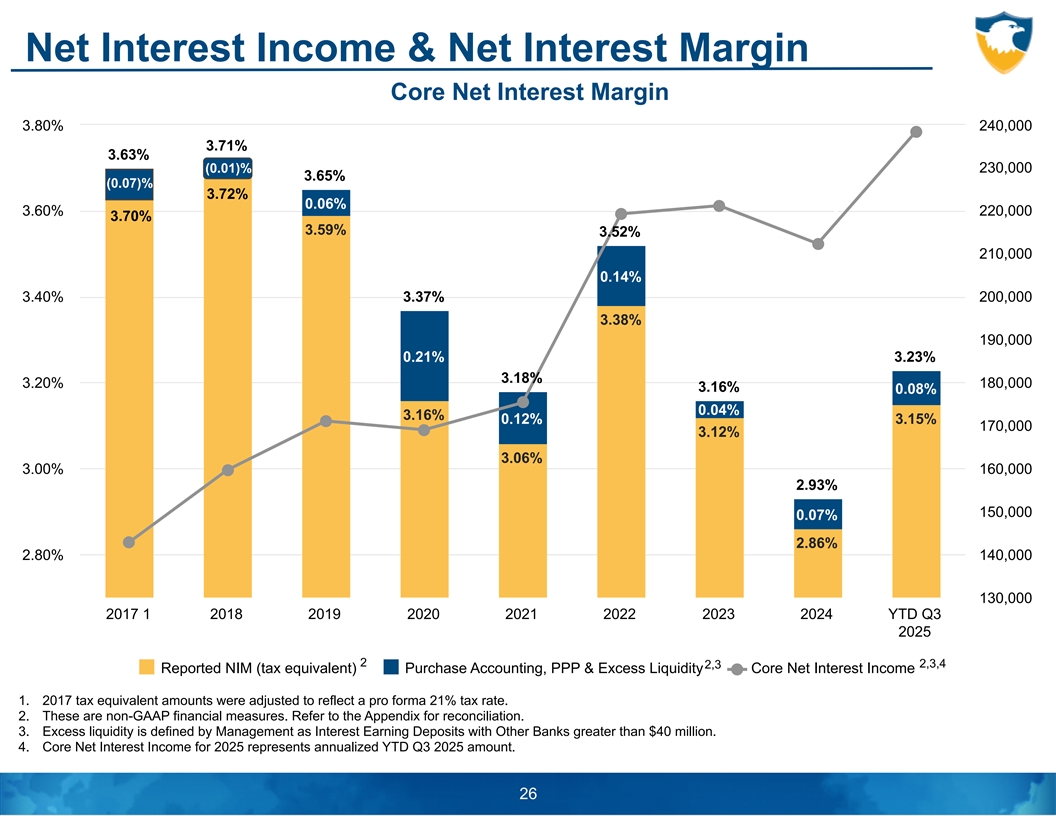
Net Interest Income & Net Interest Margin Core Net Interest Margin 3.80% 240,000 3.71% 3.63% (0.01)% 230,000 3.72% 3.65% (3 0..7 00 7% )% 3.72% 0.06% 3.60% 220,000 3.70% 3.59% 3.52% 210,000 0.14% 3.40% 3.37% 200,000 3.38% 190,000 0.21% 3.23% 3.18% 3.20% 180,000 3.16% 0.08% 0.04% 3.16% 0.12% 3.15% 170,000 3.12% 3.06% 3.00% 160,000 2.93% 150,000 0.07% 2.86% 2.80% 140,000 130,000 2017 1 2018 2019 2020 2021 2022 2023 2024 YTD Q3 2025 2 2,3,4 2,3 Reported NIM (tax equivalent) Purchase Accounting, PPP & Excess Liquidity Core Net Interest Income 1. 2017 tax equivalent amounts were adjusted to reflect a pro forma 21% tax rate. 2. These are non-GAAP financial measures. Refer to the Appendix for reconciliation. 3. Excess liquidity is defined by Management as Interest Earning Deposits with Other Banks greater than $40 million. 4. Core Net Interest Income for 2025 represents annualized YTD Q3 2025 amount. 26
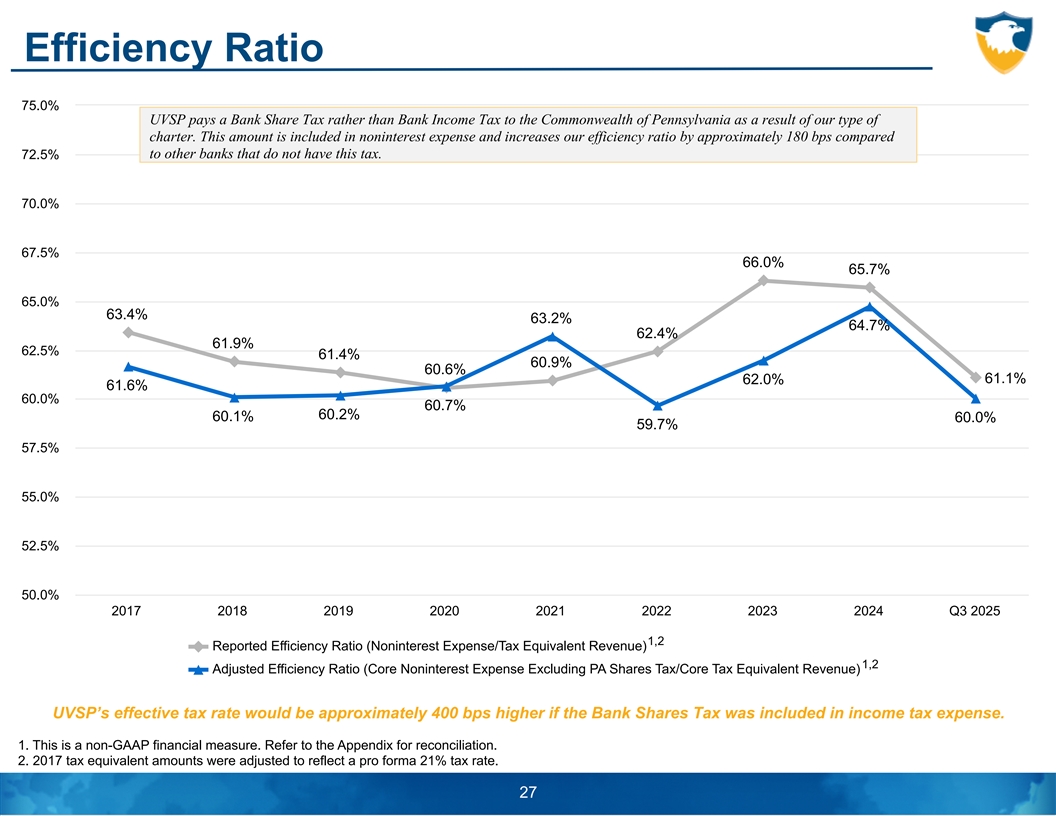
Efficiency Ratio UVSP’s effective tax rate would be approximately 400 bps higher if 75.0% the Bank Shares Tax was included UVSP pays a Bank Share Tax rather than Bank Income Tax to the Commonwealth of Pennsylvania as a result of our type of in income tax expense. charter. This amount is included in noninterest expense and increases our efficiency ratio by approximately 180 bps compared to other banks that do not have this tax. 72.5% 70.0% 67.5% 66.0% 65.7% 65.0% 63.4% 63.2% 64.7% 62.4% 61.9% 62.5% 61.4% 60.9% 60.6% 62.0% 61.1% 61.6% 60.0% 60.7% 60.2% 60.1% 60.0% 59.7% 57.5% 55.0% 52.5% 50.0% 2017 2018 2019 2020 2021 2022 2023 2024 Q3 2025 1,2 Reported Efficiency Ratio (Noninterest Expense/Tax Equivalent Revenue) 1,2 Adjusted Efficiency Ratio (Core Noninterest Expense Excluding PA Shares Tax/Core Tax Equivalent Revenue) UVSP’s effective tax rate would be approximately 400 bps higher if the Bank Shares Tax was included in income tax expense. 1. This is a non-GAAP financial measure. Refer to the Appendix for reconciliation. 2. 2017 tax equivalent amounts were adjusted to reflect a pro forma 21% tax rate. 27
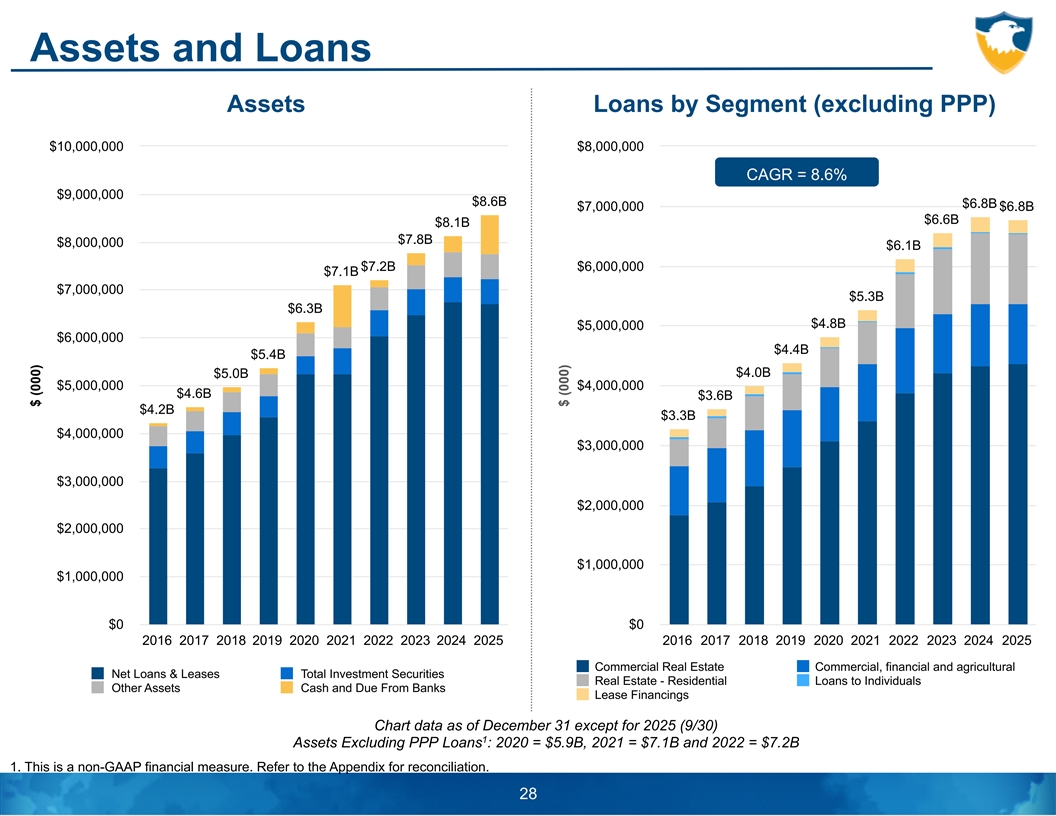
Assets and Loans Assets Loans by Segment (excluding PPP) $10,000,000 $8,000,000 CAGR = 8.6% $9,000,000 $8.6B $6.8B $7,000,000 $6.8B $6.6B $8.1B $7.8B $8,000,000 $6.1B $7.2B $6,000,000 $7.1B $7,000,000 $5.3B $6.3B $4.8B $5,000,000 $6,000,000 $4.4B $5.4B $4.0B $5.0B $5,000,000 $4,000,000 $4.6B $3.6B $4.2B $3.3B $4,000,000 $3,000,000 $3,000,000 $2,000,000 $2,000,000 $1,000,000 $1,000,000 $0 $0 2016 2017 2018 2019 2020 2021 2022 2023 2024 2025 2016 2017 2018 2019 2020 2021 2022 2023 2024 2025 Commercial Real Estate Commercial, financial and agricultural Net Loans & Leases Total Investment Securities Real Estate - Residential Loans to Individuals Other Assets Cash and Due From Banks Lease Financings Chart data as of December 31 except for 2025 (9/30) 1 Assets Excluding PPP Loans : 2020 = $5.9B, 2021 = $7.1B and 2022 = $7.2B 1. This is a non-GAAP financial measure. Refer to the Appendix for reconciliation. 28 $ (000) $ (000)
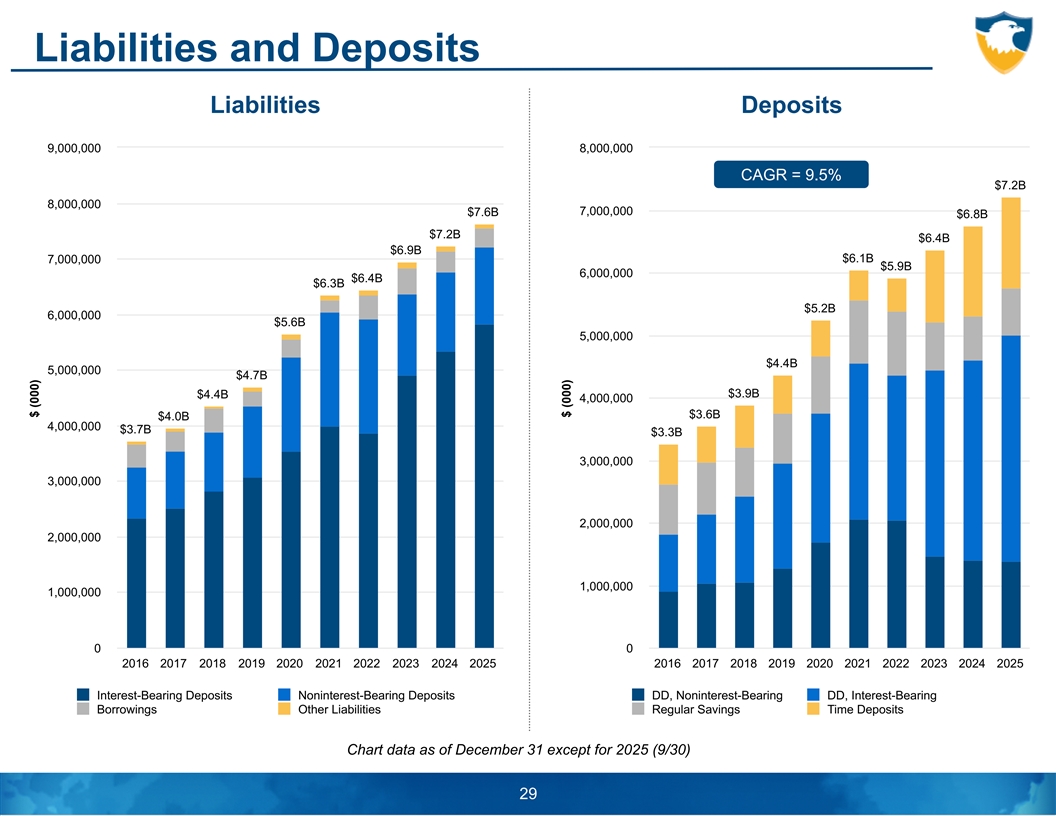
Liabilities and Deposits Liabilities Deposits 9,000,000 8,000,000 CAGR = 9.5% $7.2B 8,000,000 $7.6B 7,000,000 $6.8B $7.2B $6.4B $6.9B $6.1B 7,000,000 $5.9B 6,000,000 $6.4B $6.3B $5.2B 6,000,000 $5.6B 5,000,000 $4.4B 5,000,000 $4.7B $3.9B $4.4B 4,000,000 $3.6B $4.0B 4,000,000 $3.7B $3.3B 3,000,000 3,000,000 2,000,000 2,000,000 1,000,000 1,000,000 0 0 2016 2017 2018 2019 2020 2021 2022 2023 2024 2025 2016 2017 2018 2019 2020 2021 2022 2023 2024 2025 Interest-Bearing Deposits Noninterest-Bearing Deposits DD, Noninterest-Bearing DD, Interest-Bearing Borrowings Other Liabilities Regular Savings Time Deposits Chart data as of December 31 except for 2025 (9/30) 29 $ (000) $ (000)

LOAN PORTFOLIO DETAIL AND CREDIT OVERVIEW
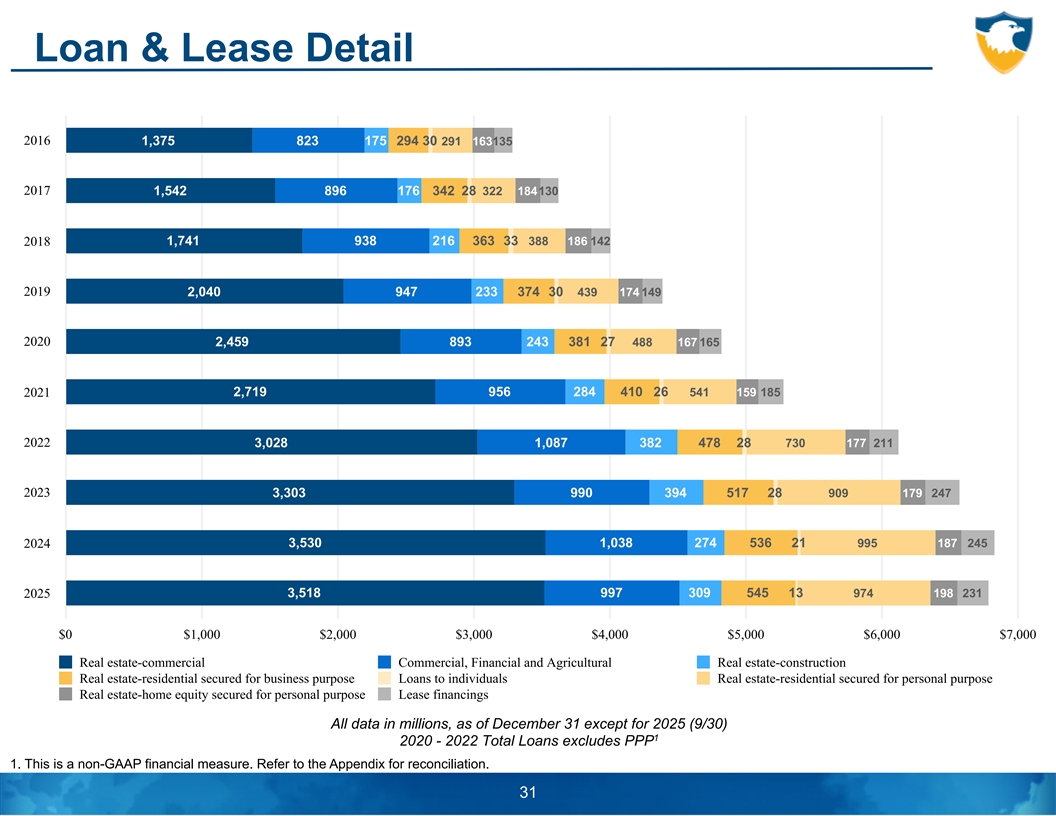
Loan & Lease Detail 2016 1,375 823 175 294 30 291 163135 2017 1,542 896 176 342 28 322 184130 1,741 938 216 363 33 388 186 142 2018 2019 2,040 947 233 374 30 439 174 149 2020 2,459 893 243 381 27 488 167 165 2,719 956 284 410 26 541 159 185 2021 2022 3,028 1,087 382 478 28 730 177 211 2023 3,303 990 394 517 28 909 179 247 2024 3,530 1,038 274 536 21 995 187 245 3,518 997 309 545 13 974 198 231 2025 $0 $1,000 $2,000 $3,000 $4,000 $5,000 $6,000 $7,000 Real estate-commercial Commercial, Financial and Agricultural Real estate-construction Real estate-residential secured for business purpose Loans to individuals Real estate-residential secured for personal purpose Real estate-home equity secured for personal purpose Lease financings All data in millions, as of December 31 except for 2025 (9/30) 1 2020 - 2022 Total Loans excludes PPP 1. This is a non-GAAP financial measure. Refer to the Appendix for reconciliation. 31
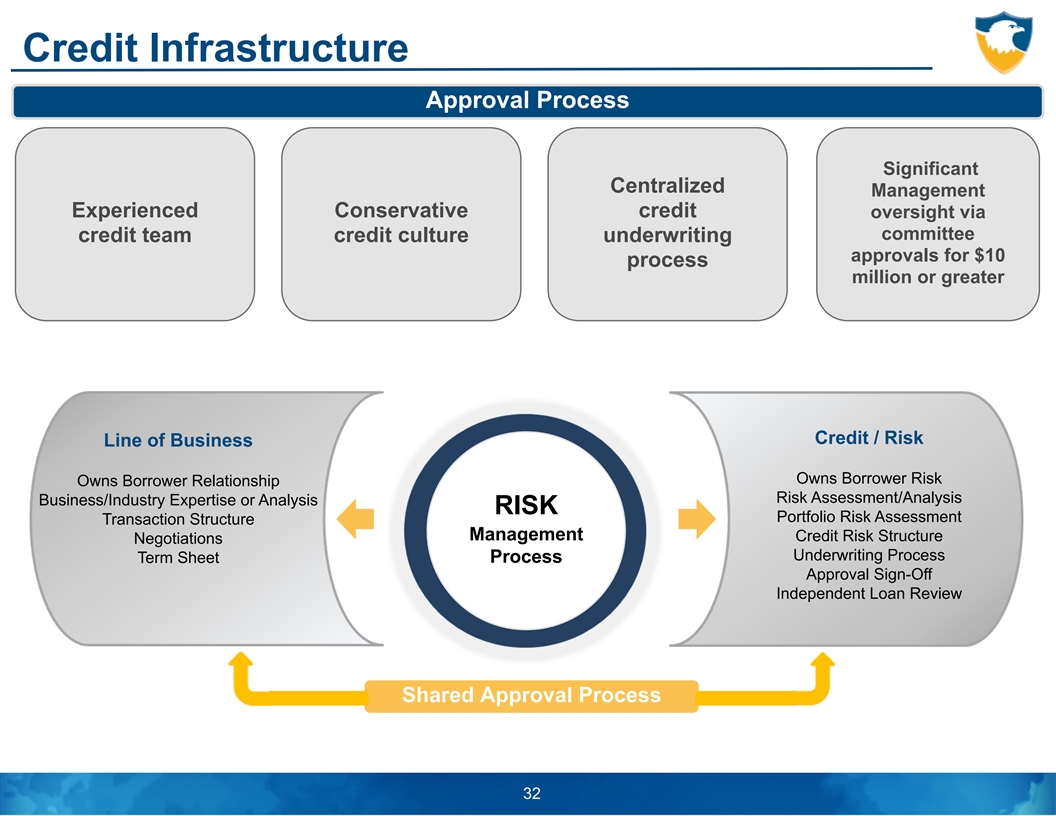
Credit Infrastructure Approval Process Significant Centralized Management Experienced Conservative credit oversight via committee credit team credit culture underwriting approvals for $10 process million or greater Credit / Risk Line of Business Owns Borrower Risk Owns Borrower Relationship Risk Assessment/Analysis Business/Industry Expertise or Analysis RISK Portfolio Risk Assessment Transaction Structure Management Credit Risk Structure Negotiations Underwriting Process Term Sheet Process Approval Sign-Off Independent Loan Review Shared Approval Process 32
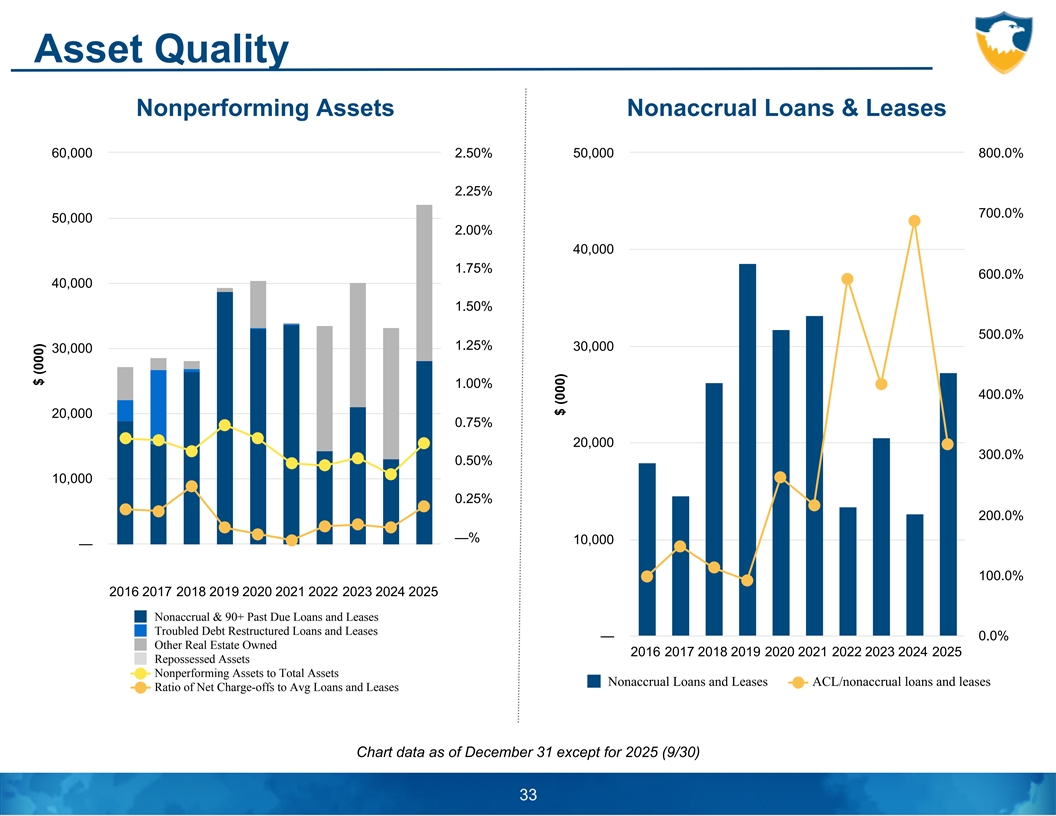
Asset Quality Nonperforming Assets Nonaccrual Loans & Leases 60,000 2.50% 50,000 800.0% 2.25% 700.0% 50,000 2.00% 40,000 1.75% 600.0% 40,000 1.50% 500.0% 1.25% 30,000 30,000 1.00% 400.0% 20,000 0.75% 20,000 300.0% 0.50% 10,000 0.25% 200.0% —% 10,000 — (0.25)% 100.0% 2016 2017 2018 2019 2020 2021 2022 2023 2024 2025 Nonaccrual & 90+ Past Due Loans and Leases Troubled Debt Restructured Loans and Leases — 0.0% Other Real Estate Owned 2016 2017 2018 2019 2020 2021 2022 2023 2024 2025 Repossessed Assets Nonperforming Assets to Total Assets Nonaccrual Loans and Leases ACL/nonaccrual loans and leases Ratio of Net Charge-offs to Avg Loans and Leases Chart data as of December 31 except for 2025 (9/30) 33 $ (000) $ (000)
Credit Overview • Joint signature up to $10.0MM, then management level loan committee for the largest exposures. ◦ Itemized report of all closed loans of $500K or more reported weekly to Officers Loan Committee. • Robust independent loan review process, using team-based audits with risk-based scope. • Generally, lending is in Pennsylvania, Delaware, New Jersey and Maryland. • Further management of risk appetite through quarterly reporting to Enterprise Risk Management Committee of the Board (“ERM”). ◦ In-house commercial concentrations levels vs. policy limits, out of market lending report, largest commercial borrowers, regulatory concentrations vs. risk based capital, CRE regulatory guidance report. • CRE portfolio trends and market analysis, with stress testing, presented annually to ERM Committee, meeting regulatory expectations for portfolio stress testing. • Independent departments for appraisal and environmental report ordering, construction loan disbursement and monitoring. • Chief Risk Officer reports directly to the Board of Directors. 34

LIQUIDITY AND CAPITAL
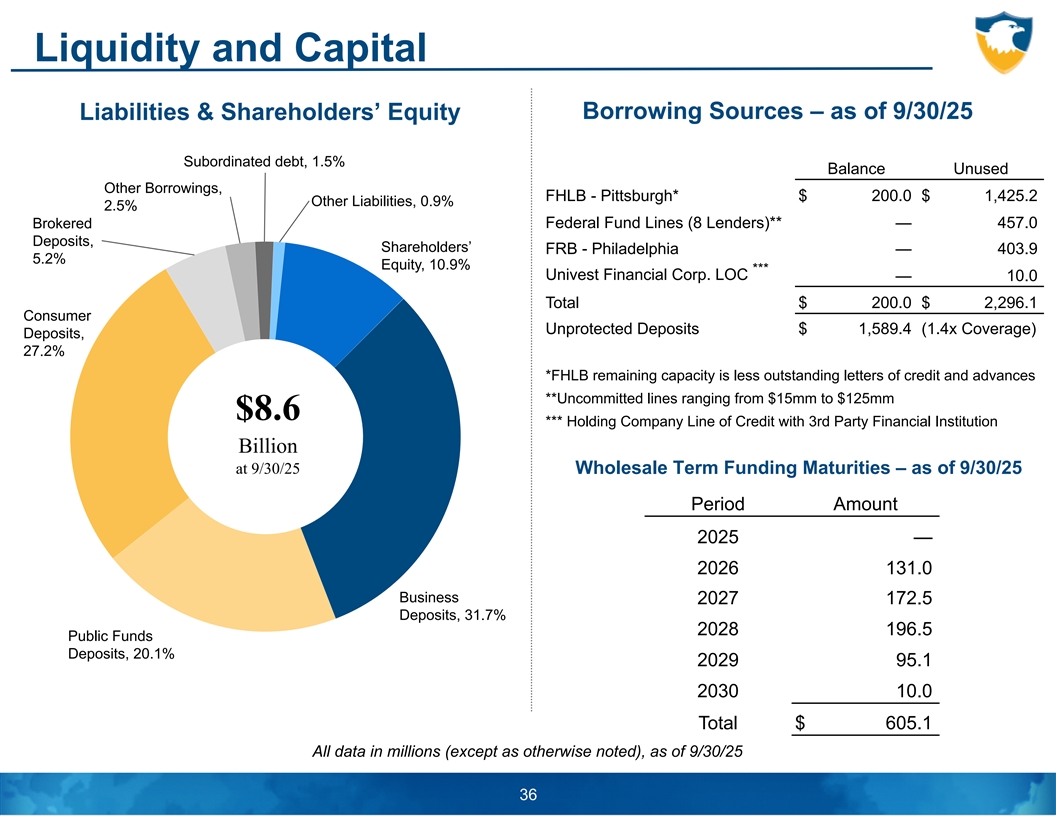
Liquidity and Capital Borrowing Sources – as of 9/30/25 Liabilities & Shareholders’ Equity Subordinated debt, 1.5% Balance Unused Other Borrowings, FHLB - Pittsburgh* $ 200.0 $ 1,425.2 Other Liabilities, 0.9% 2.5% Brokered Federal Fund Lines (8 Lenders)** — 457.0 Deposits, Shareholders’ FRB - Philadelphia — 403.9 5.2% Equity, 10.9% *** Univest Financial Corp. LOC — 10.0 Total $ 200.0 $ 2,296.1 Consumer Unprotected Deposits $ 1,589.4 (1.4x Coverage) Deposits, 27.2% *FHLB remaining capacity is less outstanding letters of credit and advances **Uncommitted lines ranging from $15mm to $125mm $8.6 *** Holding Company Line of Credit with 3rd Party Financial Institution Billion at 9/30/25 Wholesale Term Funding Maturities – as of 9/30/25 Period Amount 2025 — 2026 131.0 Business 2027 172.5 Deposits, 31.7% 2028 196.5 Public Funds Deposits, 20.1% 2029 95.1 2030 10.0 Total $ 605.1 All data in millions (except as otherwise noted), as of 9/30/25 36
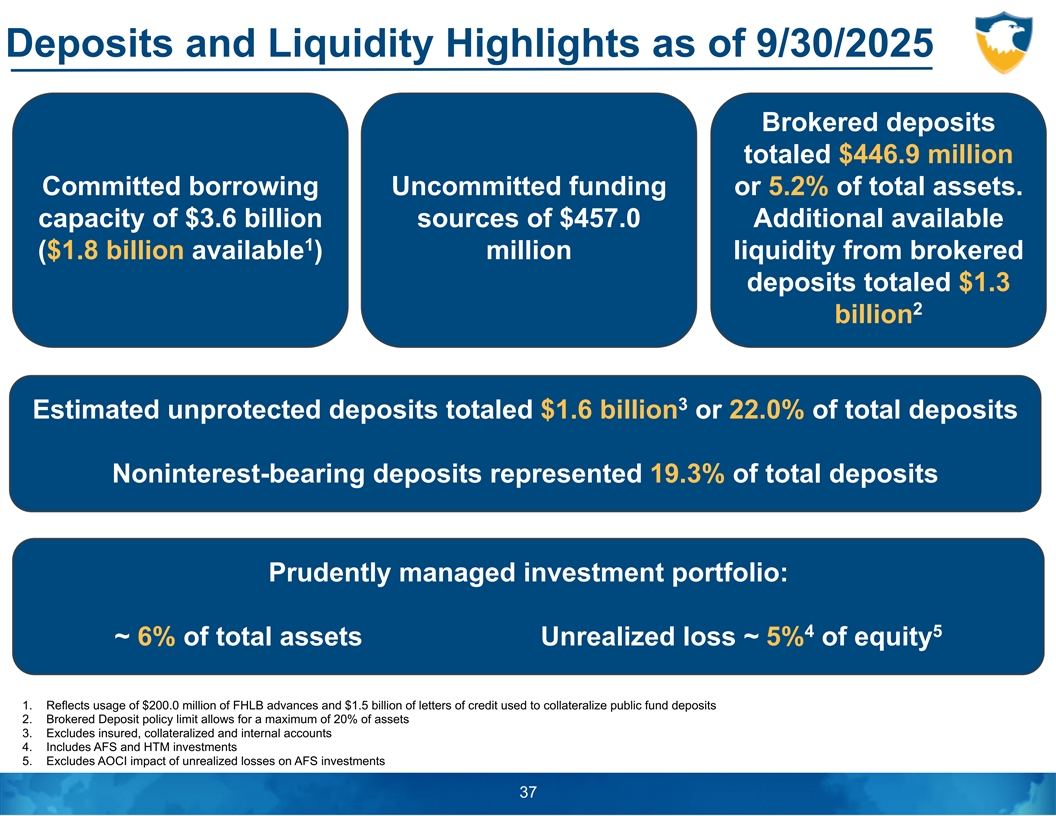
Deposits and Liquidity Highlights as of 9/30/2025 Brokered deposits totaled $446.9 million Committed borrowing Uncommitted funding or 5.2% of total assets. capacity of $3.6 billion sources of $457.0 Additional available 1 ($1.8 billion available ) million liquidity from brokered deposits totaled $1.3 2 billion 3 Estimated unprotected deposits totaled $1.6 billion or 22.0% of total deposits Noninterest-bearing deposits represented 19.3% of total deposits Prudently managed investment portfolio: 4 5 ~ 6% of total assets Unrealized loss ~ 5% of equity 1. Reflects usage of $200.0 million of FHLB advances and $1.5 billion of letters of credit used to collateralize public fund deposits 2. Brokered Deposit policy limit allows for a maximum of 20% of assets 3. Excludes insured, collateralized and internal accounts 4. Includes AFS and HTM investments 5. Excludes AOCI impact of unrealized losses on AFS investments 37
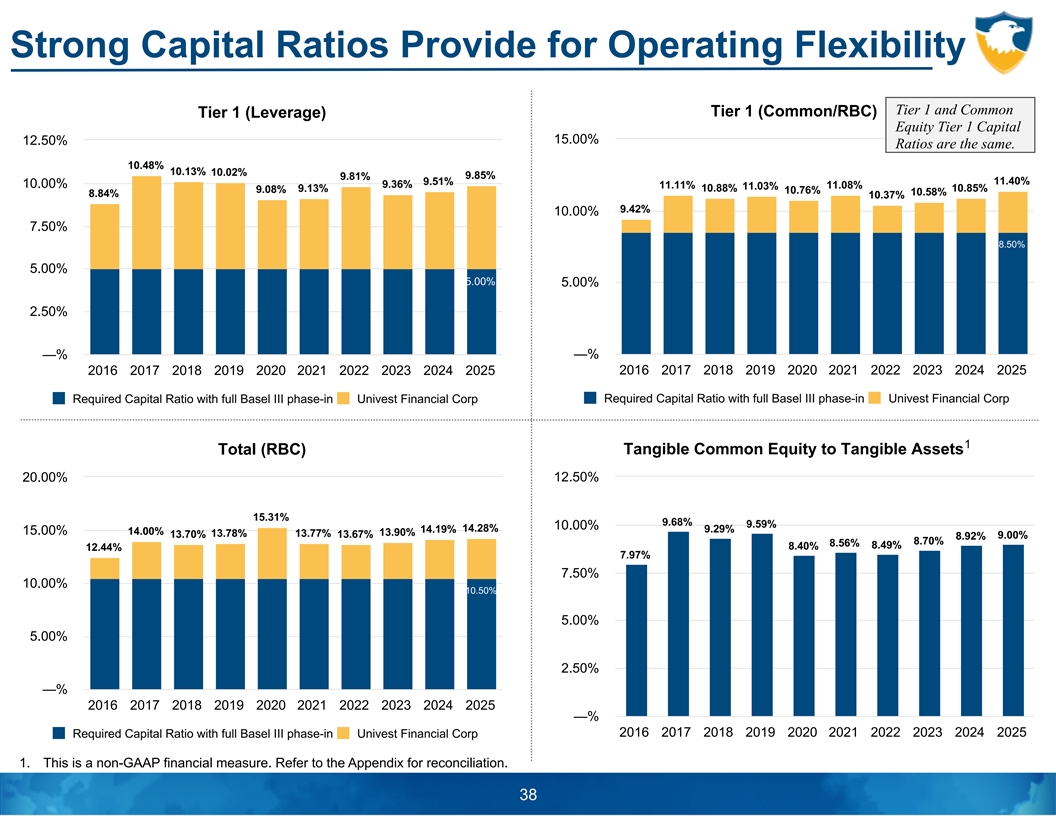
Strong Capital Ratios Provide for Operating Flexibility Tier 1 and Common Tier 1 (Common/RBC) Tier 1 (Leverage) Equity Tier 1 Capital 15.00% 12.50% Ratios are the same. 10.48% 10.13% 10.02% 9.85% 9.81% 9.51% 11.40% 10.00% 9.36% 11.11% 11.03% 11.08% 9.13% 10.88% 10.85% 9.08% 10.76% 10.58% 8.84% 10.37% 9.42% 10.00% 7.50% 8.50% 5.00% 5.00% 5.00% 2.50% —% —% 2016 2017 2018 2019 2020 2021 2022 2023 2024 2025 2016 2017 2018 2019 2020 2021 2022 2023 2024 2025 Required Capital Ratio with full Basel III phase-in Univest Financial Corp Required Capital Ratio with full Basel III phase-in Univest Financial Corp 1 Total (RBC) Tangible Common Equity to Tangible Assets 20.00% 12.50% 15.31% 9.68% 9.59% 10.00% 14.28% 14.19% 9.29% 15.00% 14.00% 13.90% 13.78% 13.77% 13.70% 13.67% 9.00% 8.92% 8.70% 8.56% 8.40% 8.49% 12.44% 7.97% 7.50% 10.00% 10.50% 5.00% 5.00% 2.50% —% 2016 2017 2018 2019 2020 2021 2022 2023 2024 2025 —% 2016 2017 2018 2019 2020 2021 2022 2023 2024 2025 Required Capital Ratio with full Basel III phase-in Univest Financial Corp 1. This is a non-GAAP financial measure. Refer to the Appendix for reconciliation. 38
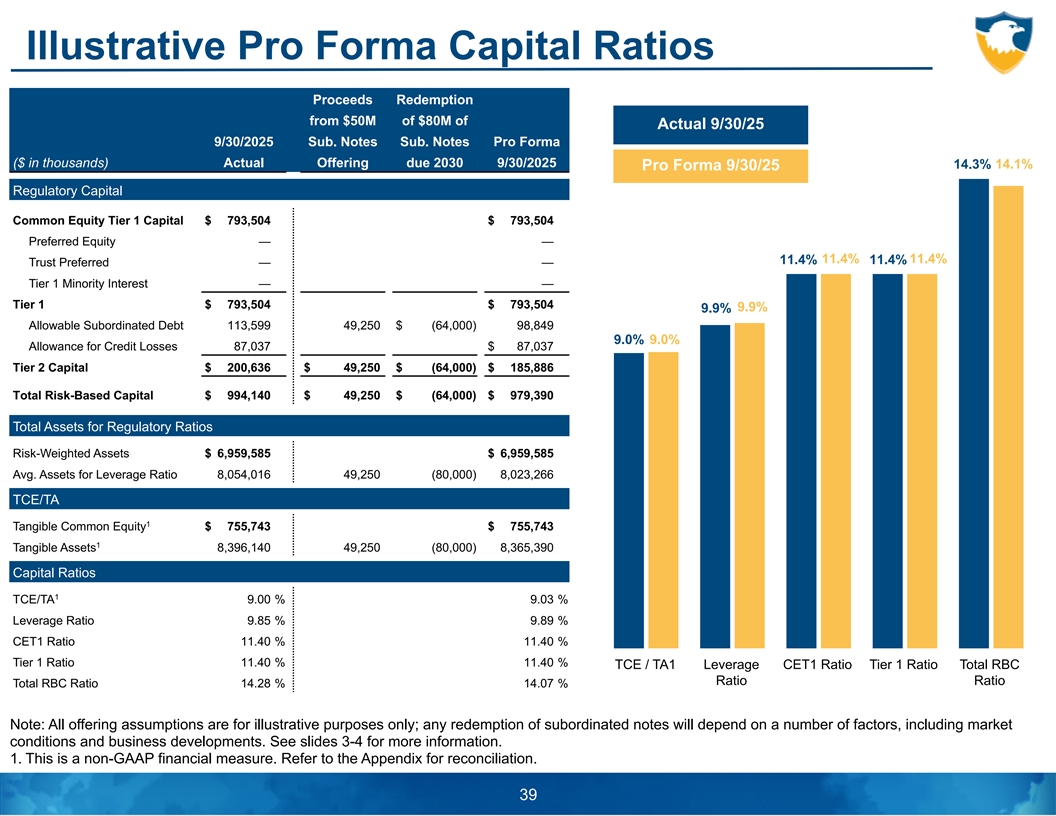
Illustrative Pro Forma Capital Ratios Proceeds Redemption from $50M of $80M of Actual 9/30/25 9/30/2025 Sub. Notes Sub. Notes Pro Forma ($ in thousands) Actual Offering due 2030 9/30/2025 14.3% 14.1% Pro Forma 9/30/25 Regulatory Capital Common Equity Tier 1 Capital $ 793,504 $ 793,504 Preferred Equity — — 11.4% 11.4% 11.4% 11.4% Trust Preferred — — Tier 1 Minority Interest — — Tier 1 $ 793,504 $ 793,504 9.9% 9.9% Allowable Subordinated Debt 113,599 49,250 $ (64,000) 98,849 9.0% 9.0% Allowance for Credit Losses 87,037 $ 87,037 Tier 2 Capital $ 200,636 $ 49,250 $ (64,000) $ 185,886 Total Risk-Based Capital $ 994,140 $ 49,250 $ (64,000) $ 979,390 Total Assets for Regulatory Ratios Risk-Weighted Assets $ 6,959,585 $ 6,959,585 Avg. Assets for Leverage Ratio 8,054,016 49,250 (80,000) 8,023,266 TCE/TA 1 Tangible Common Equity $ 755,743 $ 755,743 1 Tangible Assets 8,396,140 49,250 (80,000) 8,365,390 Capital Ratios 1 TCE/TA 9.00 % 9 .03 % Leverage Ratio 9 .85 % 9.89 % CET1 Ratio 11.40 % 1 1.40 % Tier 1 Ratio 1 1.40 % 11.40 % TCE / TA1 Leverage CET1 Ratio Tier 1 Ratio Total RBC Ratio Ratio Total RBC Ratio 14.28 % 14.07 % Note: All offering assumptions are for illustrative purposes only; any redemption of subordinated notes will depend on a number of factors, including market conditions and business developments. See slides 3-4 for more information. 1. This is a non-GAAP financial measure. Refer to the Appendix for reconciliation. 39
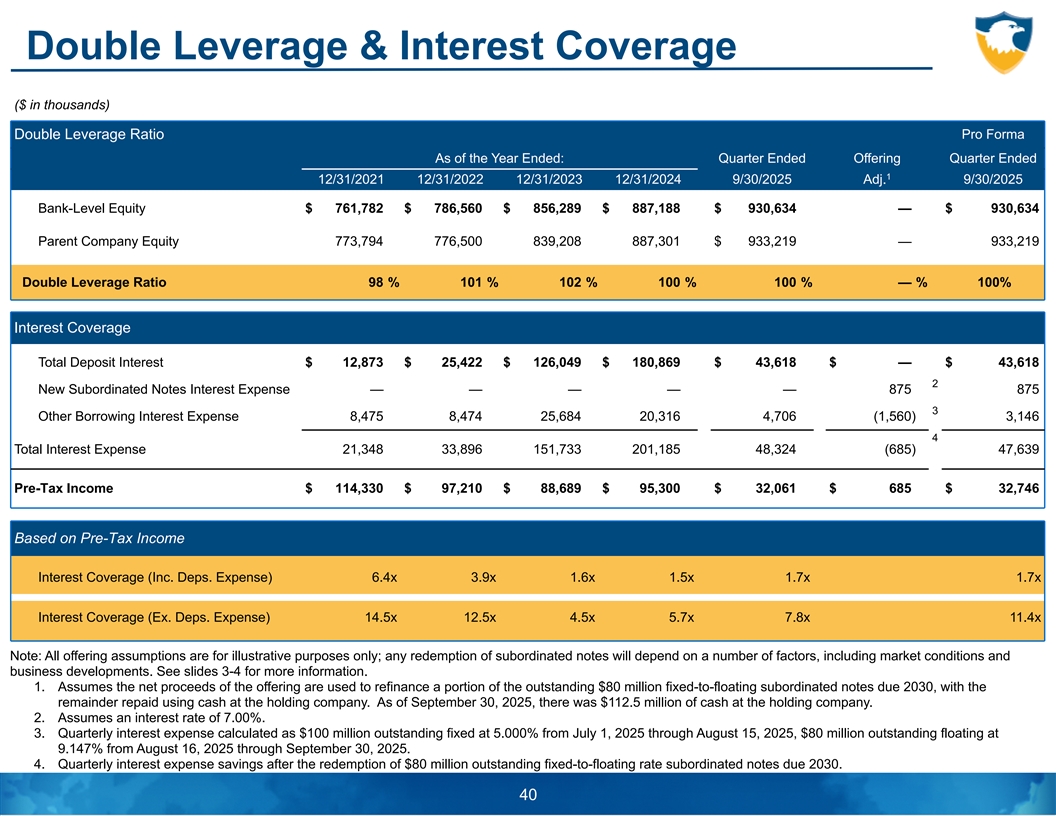
Double Leverage & Interest Coverage ($ in thousands) Pro Forma Double Leverage Ratio As of the Year Ended: Quarter Ended Offering Quarter Ended 1 12/31/2021 12/31/2022 12/31/2023 12/31/2024 9/30/2025 Adj. 9/30/2025 Bank-Level Equity $ 761,782 $ 786,560 $ 856,289 $ 887,188 $ 930,634 — $ 930,634 Parent Company Equity 773,794 776,500 839,208 887,301 $ 933,219 — 933,219 Double Leverage Ratio 9 8 % 1 01 % 1 02 % 1 00 % 100 % — % 100% Interest Coverage Total Deposit Interest $ 12,873 $ 25,422 $ 126,049 $ 180,869 $ 43,618 $ — $ 43,618 2 New Subordinated Notes Interest Expense — — — — — 875 875 3 Other Borrowing Interest Expense 8,475 8,474 25,684 20,316 4,706 (1,560) 3,146 4 Total Interest Expense 21,348 33,896 151,733 201,185 48,324 (685) 47,639 Pre-Tax Income $ 114,330 $ 97,210 $ 88,689 $ 95,300 $ 32,061 $ 685 $ 32,746 Based on Pre-Tax Income Interest Coverage (Inc. Deps. Expense) 6.4x 3.9x 1.6x 1.5x 1.7x 1.7x Interest Coverage (Ex. Deps. Expense) 14.5x 12.5x 4.5x 5.7x 7.8x 11.4x Note: All offering assumptions are for illustrative purposes only; any redemption of subordinated notes will depend on a number of factors, including market conditions and business developments. See slides 3-4 for more information. 1. Assumes the net proceeds of the offering are used to refinance a portion of the outstanding $80 million fixed-to-floating subordinated notes due 2030, with the remainder repaid using cash at the holding company. As of September 30, 2025, there was $112.5 million of cash at the holding company. 2. Assumes an interest rate of 7.00%. 3. Quarterly interest expense calculated as $100 million outstanding fixed at 5.000% from July 1, 2025 through August 15, 2025, $80 million outstanding floating at 9.147% from August 16, 2025 through September 30, 2025. 4. Quarterly interest expense savings after the redemption of $80 million outstanding fixed-to-floating rate subordinated notes due 2030. 40
APPENDIX (Including Non-GAAP Reconciliations)
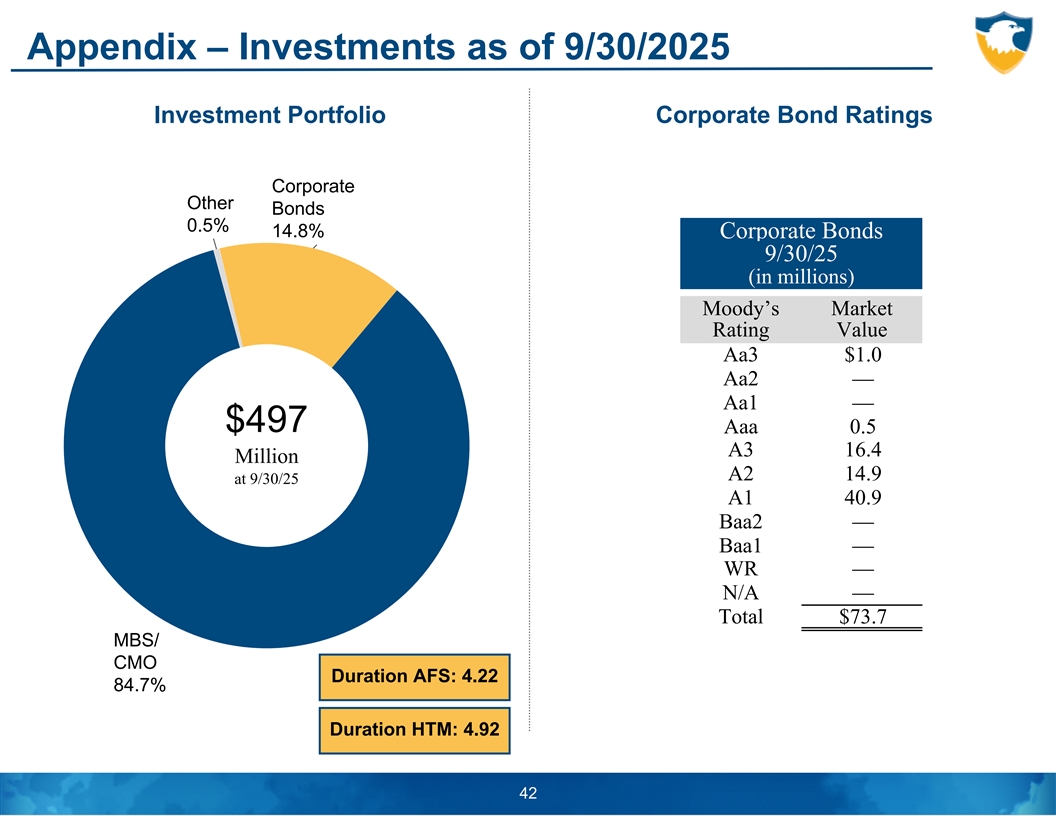
Appendix – Investments as of 9/30/2025 Investment Portfolio Corporate Bond Ratings Corporate Other Bonds 0.5% 14.8% Corporate Bonds 9/30/25 (in millions) Moody’s Market Rating Value Aa3 $1.0 Aa2 — Aa1 — $497 Aaa 0.5 A3 16.4 Million A2 14.9 at 9/30/25 A1 40.9 Baa2 — Baa1 — WR — N/A — Total $73.7 MBS/ CMO Duration AFS: 4.22 84.7% Duration HTM: 4.92 42
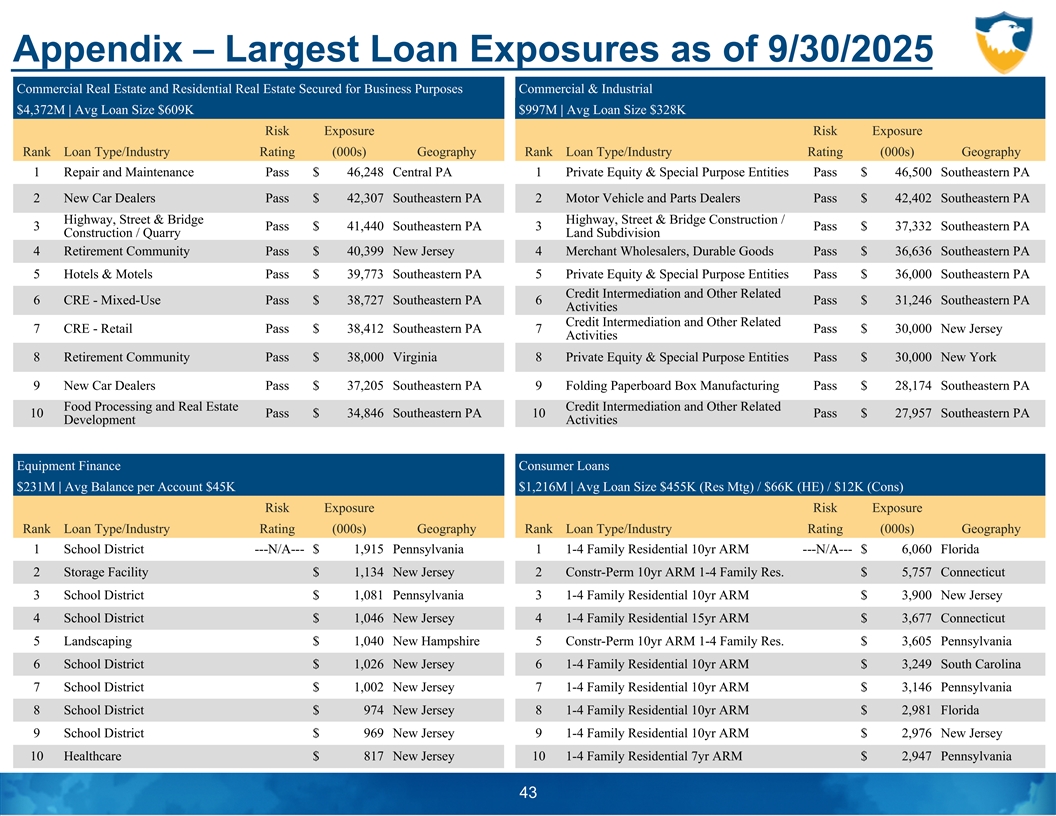
Appendix – Largest Loan Exposures as of 9/30/2025 Commercial Real Estate and Residential Real Estate Secured for Business Purposes Commercial & Industrial $4,372M | Avg Loan Size $609K $997M | Avg Loan Size $328K Risk Exposure Risk Exposure Rank Loan Type/Industry Rating (000s) Geography Rank Loan Type/Industry Rating (000s) Geography 1 Repair and Maintenance Pass $ 46,248 Central PA 1 Private Equity & Special Purpose Entities Pass $ 46,500 Southeastern PA 2 New Car Dealers Pass $ 42,307 Southeastern PA 2 Motor Vehicle and Parts Dealers Pass $ 42,402 Southeastern PA Highway, Street & Bridge Highway, Street & Bridge Construction / 3 Pass $ 41,440 Southeastern PA 3 Pass $ 37,332 Southeastern PA Construction / Quarry Land Subdivision 4 Retirement Community Pass $ 40,399 New Jersey 4 Merchant Wholesalers, Durable Goods Pass $ 36,636 Southeastern PA 5 Hotels & Motels Pass $ 39,773 Southeastern PA 5 Private Equity & Special Purpose Entities Pass $ 36,000 Southeastern PA Credit Intermediation and Other Related 6 CRE - Mixed-Use Pass $ 38,727 Southeastern PA 6 Pass $ 31,246 Southeastern PA Activities Credit Intermediation and Other Related 7 CRE - Retail Pass $ 38,412 Southeastern PA 7 Pass $ 30,000 New Jersey Activities 8 Retirement Community Pass $ 38,000 Virginia 8 Private Equity & Special Purpose Entities Pass $ 30,000 New York 9 New Car Dealers Pass $ 37,205 Southeastern PA 9 Folding Paperboard Box Manufacturing Pass $ 28,174 Southeastern PA Food Processing and Real Estate Credit Intermediation and Other Related 10 Pass $ 34,846 Southeastern PA 10 Pass $ 27,957 Southeastern PA Development Activities Equipment Finance Consumer Loans $231M | Avg Balance per Account $45K $1,216M | Avg Loan Size $455K (Res Mtg) / $66K (HE) / $12K (Cons) Risk Exposure Risk Exposure Rank Loan Type/Industry Rating (000s) Geography Rank Loan Type/Industry Rating (000s) Geography 1 School District ‘---N/A--- $ 1,915 Pennsylvania 1 1-4 Family Residential 10yr ARM ‘---N/A--- $ 6,060 Florida 2 Storage Facility $ 1,134 New Jersey 2 Constr-Perm 10yr ARM 1-4 Family Res. $ 5,757 Connecticut 3 School District $ 1,081 Pennsylvania 3 1-4 Family Residential 10yr ARM $ 3,900 New Jersey 4 School District $ 1,046 New Jersey 4 1-4 Family Residential 15yr ARM $ 3,677 Connecticut 5 Landscaping $ 1,040 New Hampshire 5 Constr-Perm 10yr ARM 1-4 Family Res. $ 3,605 Pennsylvania 6 School District $ 1,026 New Jersey 6 1-4 Family Residential 10yr ARM $ 3,249 South Carolina 7 School District $ 1,002 New Jersey 7 1-4 Family Residential 10yr ARM $ 3,146 Pennsylvania 8 School District $ 974 New Jersey 8 1-4 Family Residential 10yr ARM $ 2,981 Florida 9 School District $ 969 New Jersey 9 1-4 Family Residential 10yr ARM $ 2,976 New Jersey 10 Healthcare $ 817 New Jersey 10 1-4 Family Residential 7yr ARM $ 2,947 Pennsylvania 43
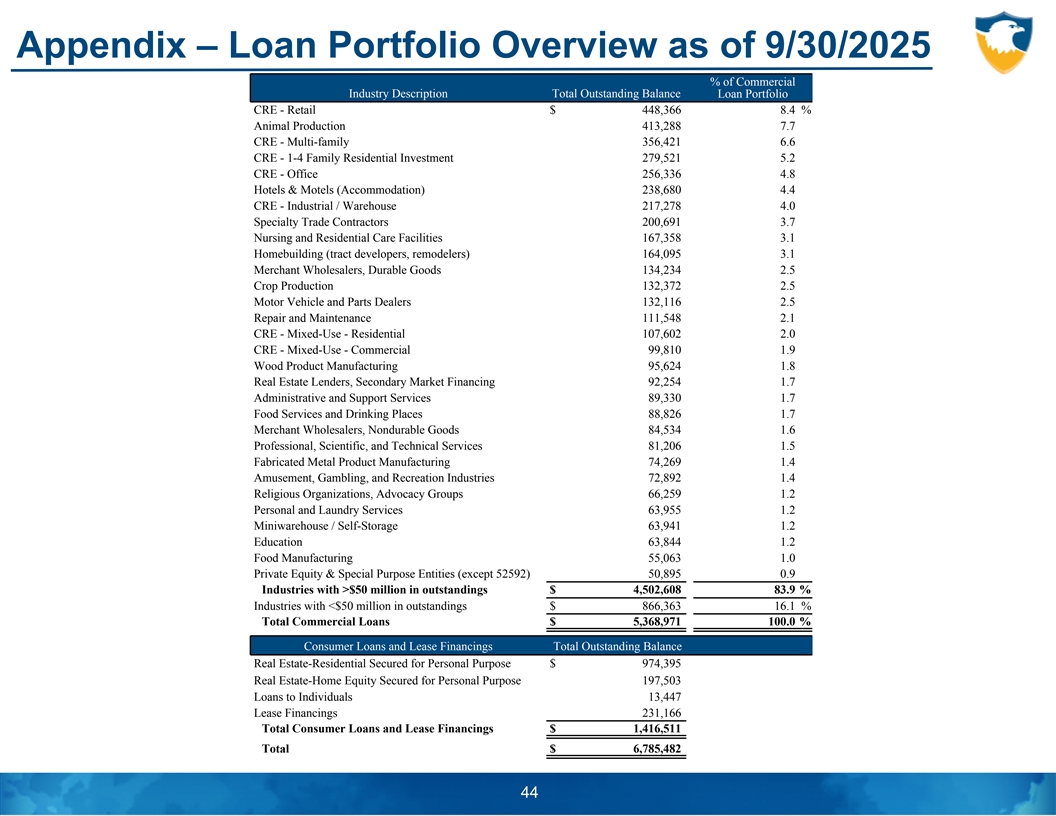
Appendix – Loan Portfolio Overview as of 9/30/2025 % of Commercial Industry Description Total Outstanding Balance Loan Portfolio CRE - Retail $ 448,366 8 .4 % Animal Production 413,288 7.7 CRE - Multi-family 356,421 6.6 CRE - 1-4 Family Residential Investment 279,521 5.2 CRE - Office 256,336 4.8 Hotels & Motels (Accommodation) 238,680 4.4 CRE - Industrial / Warehouse 217,278 4.0 Specialty Trade Contractors 200,691 3.7 Nursing and Residential Care Facilities 167,358 3.1 Homebuilding (tract developers, remodelers) 164,095 3 .1 Merchant Wholesalers, Durable Goods 134,234 2 .5 Crop Production 132,372 2 .5 Motor Vehicle and Parts Dealers 132,116 2 .5 Repair and Maintenance 111,548 2 .1 CRE - Mixed-Use - Residential 107,602 2.0 CRE - Mixed-Use - Commercial 99,810 1 .9 Wood Product Manufacturing 95,624 1 .8 Real Estate Lenders, Secondary Market Financing 92,254 1 .7 Administrative and Support Services 89,330 1 .7 Food Services and Drinking Places 88,826 1.7 Merchant Wholesalers, Nondurable Goods 84,534 1.6 Professional, Scientific, and Technical Services 81,206 1 .5 Fabricated Metal Product Manufacturing 74,269 1.4 Amusement, Gambling, and Recreation Industries 72,892 1 .4 Religious Organizations, Advocacy Groups 66,259 1 .2 Personal and Laundry Services 63,955 1 .2 Miniwarehouse / Self-Storage 63,941 1 .2 Education 63,844 1.2 Food Manufacturing 55,063 1.0 Private Equity & Special Purpose Entities (except 52592) 50,895 0.9 Industries with >$50 million in outstandings $ 4,502,608 8 3.9 % Industries with <$50 million in outstandings $ 866,363 1 6.1 % Total Commercial Loans $ 5,368,971 1 00.0 % Consumer Loans and Lease Financings Total Outstanding Balance Real Estate-Residential Secured for Personal Purpose $ 974,395 Real Estate-Home Equity Secured for Personal Purpose 197,503 Loans to Individuals 13,447 Lease Financings 231,166 Total Consumer Loans and Lease Financings $ 1,416,511 Total $ 6,785,482 44
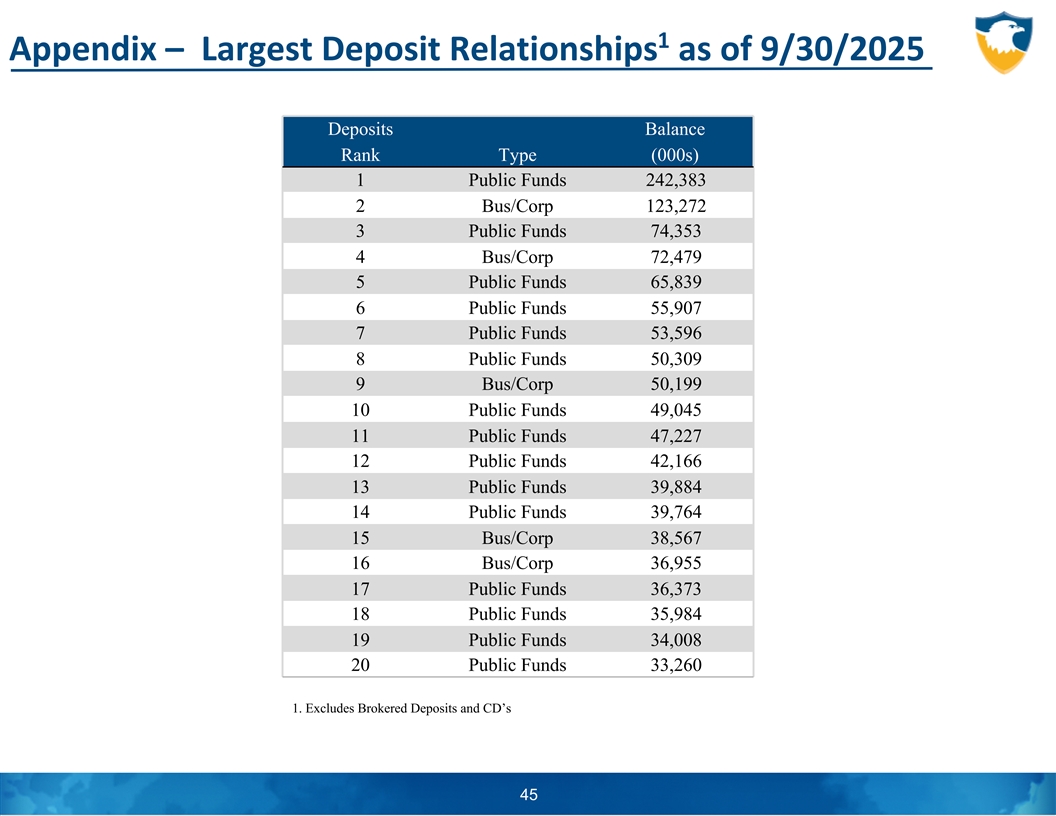
1 Appendix – Largest Deposit Relationships as of 9/30/2025 Deposits Balance Rank Type (000s) 1 Public Funds 242,383 2 Bus/Corp 123,272 3 Public Funds 74,353 4 Bus/Corp 72,479 5 Public Funds 65,839 6 Public Funds 55,907 7 Public Funds 53,596 8 Public Funds 50,309 9 Bus/Corp 50,199 10 Public Funds 49,045 11 Public Funds 47,227 12 Public Funds 42,166 13 Public Funds 39,884 14 Public Funds 39,764 15 Bus/Corp 38,567 16 Bus/Corp 36,955 17 Public Funds 36,373 18 Public Funds 35,984 19 Public Funds 34,008 20 Public Funds 33,260 1. Excludes Brokered Deposits and CD’s 45
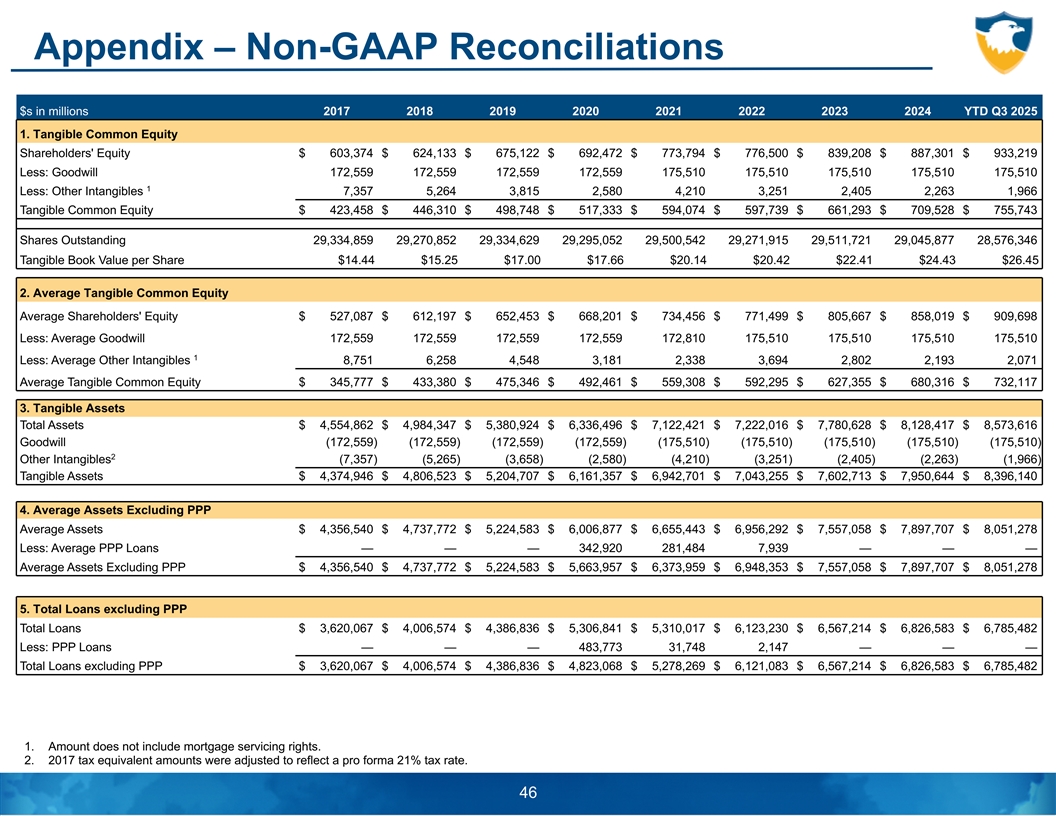
Appendix – Non-GAAP Reconciliations $s in millions 2017 2018 2019 2020 2021 2022 2023 2024 YTD Q3 2025 1. Tangible Common Equity Shareholders' Equity $ 603,374 $ 624,133 $ 675,122 $ 692,472 $ 773,794 $ 776,500 $ 839,208 $ 887,301 $ 933,219 Less: Goodwill 172,559 172,559 172,559 172,559 175,510 175,510 175,510 175,510 175,510 1 Less: Other Intangibles 7,357 5,264 3,815 2,580 4,210 3,251 2,405 2,263 1,966 Tangible Common Equity $ 423,458 $ 446,310 $ 498,748 $ 517,333 $ 594,074 $ 597,739 $ 661,293 $ 709,528 $ 755,743 Shares Outstanding 29,334,859 29,270,852 29,334,629 29,295,052 29,500,542 29,271,915 29,511,721 29,045,877 28,576,346 Tangible Book Value per Share $14.44 $15.25 $17.00 $17.66 $20.14 $20.42 $22.41 $24.43 $26.45 2. Average Tangible Common Equity Average Shareholders' Equity $ 527,087 $ 612,197 $ 652,453 $ 668,201 $ 734,456 $ 771,499 $ 805,667 $ 858,019 $ 909,698 Less: Average Goodwill 172,559 172,559 172,559 172,559 172,810 175,510 175,510 175,510 175,510 1 Less: Average Other Intangibles 8,751 6,258 4,548 3,181 2,338 3,694 2,802 2,193 2,071 Average Tangible Common Equity $ 345,777 $ 433,380 $ 475,346 $ 492,461 $ 559,308 $ 592,295 $ 627,355 $ 680,316 $ 732,117 3. Tangible Assets Total Assets $ 4,554,862 $ 4,984,347 $ 5,380,924 $ 6,336,496 $ 7,122,421 $ 7,222,016 $ 7,780,628 $ 8,128,417 $ 8,573,616 Goodwill (172,559) (172,559) (172,559) (172,559) (175,510) (175,510) (175,510) (175,510) (175,510) 2 Other Intangibles (7,357) (5,265) (3,658) (2,580) (4,210) (3,251) (2,405) (2,263) (1,966) Tangible Assets $ 4,374,946 $ 4,806,523 $ 5,204,707 $ 6,161,357 $ 6,942,701 $ 7,043,255 $ 7,602,713 $ 7,950,644 $ 8,396,140 4. Average Assets Excluding PPP Average Assets $ 4,356,540 $ 4,737,772 $ 5,224,583 $ 6,006,877 $ 6,655,443 $ 6,956,292 $ 7,557,058 $ 7,897,707 $ 8,051,278 Less: Average PPP Loans — — — 342,920 281,484 7,939 — — — Average Assets Excluding PPP $ 4,356,540 $ 4,737,772 $ 5,224,583 $ 5,663,957 $ 6,373,959 $ 6,948,353 $ 7,557,058 $ 7,897,707 $ 8,051,278 5. Total Loans excluding PPP Total Loans $ 3,620,067 $ 4,006,574 $ 4,386,836 $ 5,306,841 $ 5,310,017 $ 6,123,230 $ 6,567,214 $ 6,826,583 $ 6,785,482 Less: PPP Loans — — — 483,773 31,748 2,147 — — — Total Loans excluding PPP $ 3,620,067 $ 4,006,574 $ 4,386,836 $ 4,823,068 $ 5,278,269 $ 6,121,083 $ 6,567,214 $ 6,826,583 $ 6,785,482 1. Amount does not include mortgage servicing rights. 2. 2017 tax equivalent amounts were adjusted to reflect a pro forma 21% tax rate. 46
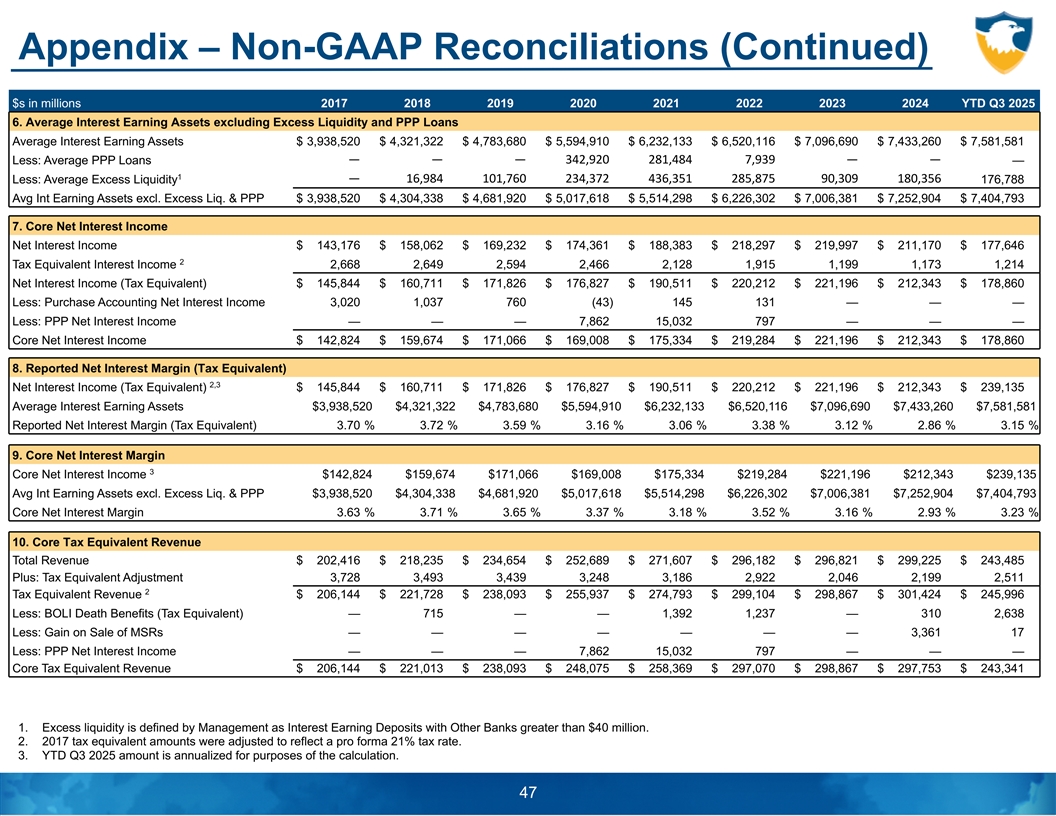
Appendix – Non-GAAP Reconciliations (Continued) $s in millions 2017 2018 2019 2020 2021 2022 2023 2024 YTD Q3 2025 6. Average Interest Earning Assets excluding Excess Liquidity and PPP Loans Average Interest Earning Assets $ 3,938,520 $ 4,321,322 $ 4,783,680 $ 5,594,910 $ 6,232,133 $ 6,520,116 $ 7,096,690 $ 7,433,260 $ 7,581,581 Less: Average PPP Loans — — — 342,920 281,484 7,939 — — — 1 — 16,984 101,760 234,372 436,351 285,875 90,309 180,356 Less: Average Excess Liquidity 176,788 Avg Int Earning Assets excl. Excess Liq. & PPP $ 3,938,520 $ 4,304,338 $ 4,681,920 $ 5,017,618 $ 5,514,298 $ 6,226,302 $ 7,006,381 $ 7,252,904 $ 7,404,793 7. Core Net Interest Income Net Interest Income $ 143,176 $ 158,062 $ 169,232 $ 174,361 $ 188,383 $ 218,297 $ 219,997 $ 211,170 $ 177,646 2 Tax Equivalent Interest Income 2,668 2,649 2,594 2,466 2,128 1,915 1,199 1,173 1,214 Net Interest Income (Tax Equivalent) $ 145,844 $ 160,711 $ 171,826 $ 176,827 $ 190,511 $ 220,212 $ 221,196 $ 212,343 $ 178,860 Less: Purchase Accounting Net Interest Income 3,020 1,037 760 (43) 145 131 — — — Less: PPP Net Interest Income — — — 7,862 15,032 797 — — — Core Net Interest Income $ 142,824 $ 159,674 $ 171,066 $ 169,008 $ 175,334 $ 219,284 $ 221,196 $ 212,343 $ 178,860 8. Reported Net Interest Margin (Tax Equivalent) 2,3 Net Interest Income (Tax Equivalent) $ 145,844 $ 160,711 $ 171,826 $ 176,827 $ 190,511 $ 220,212 $ 221,196 $ 212,343 $ 239,135 Average Interest Earning Assets $3,938,520 $4,321,322 $4,783,680 $5,594,910 $6,232,133 $6,520,116 $7,096,690 $7,433,260 $7,581,581 Reported Net Interest Margin (Tax Equivalent) 3 .70 % 3 .72 % 3 .59 % 3 .16 % 3.06 % 3 .38 % 3 .12 % 2.86 % 3 .15 % 9. Core Net Interest Margin 3 Core Net Interest Income $142,824 $159,674 $171,066 $169,008 $175,334 $219,284 $221,196 $212,343 $239,135 Avg Int Earning Assets excl. Excess Liq. & PPP $3,938,520 $4,304,338 $4,681,920 $5,017,618 $5,514,298 $6,226,302 $7,006,381 $7,252,904 $7,404,793 Core Net Interest Margin 3 .63 % 3 .71 % 3 .65 % 3 .37 % 3.18 % 3 .52 % 3.16 % 2.93 % 3 .23 % 10. Core Tax Equivalent Revenue Total Revenue $ 202,416 $ 218,235 $ 234,654 $ 252,689 $ 271,607 $ 296,182 $ 296,821 $ 299,225 $ 243,485 Plus: Tax Equivalent Adjustment 3,728 3,493 3,439 3,248 3,186 2,922 2,046 2,199 2,511 2 Tax Equivalent Revenue $ 206,144 $ 221,728 $ 238,093 $ 255,937 $ 274,793 $ 299,104 $ 298,867 $ 301,424 $ 245,996 Less: BOLI Death Benefits (Tax Equivalent) — 715 — — 1,392 1,237 — 310 2,638 Less: Gain on Sale of MSRs — — — — — — — 3,361 17 Less: PPP Net Interest Income — — — 7,862 15,032 797 — — — Core Tax Equivalent Revenue $ 206,144 $ 221,013 $ 238,093 $ 248,075 $ 258,369 $ 297,070 $ 298,867 $ 297,753 $ 243,341 1. Excess liquidity is defined by Management as Interest Earning Deposits with Other Banks greater than $40 million. 2. 2017 tax equivalent amounts were adjusted to reflect a pro forma 21% tax rate. 3. YTD Q3 2025 amount is annualized for purposes of the calculation. 47
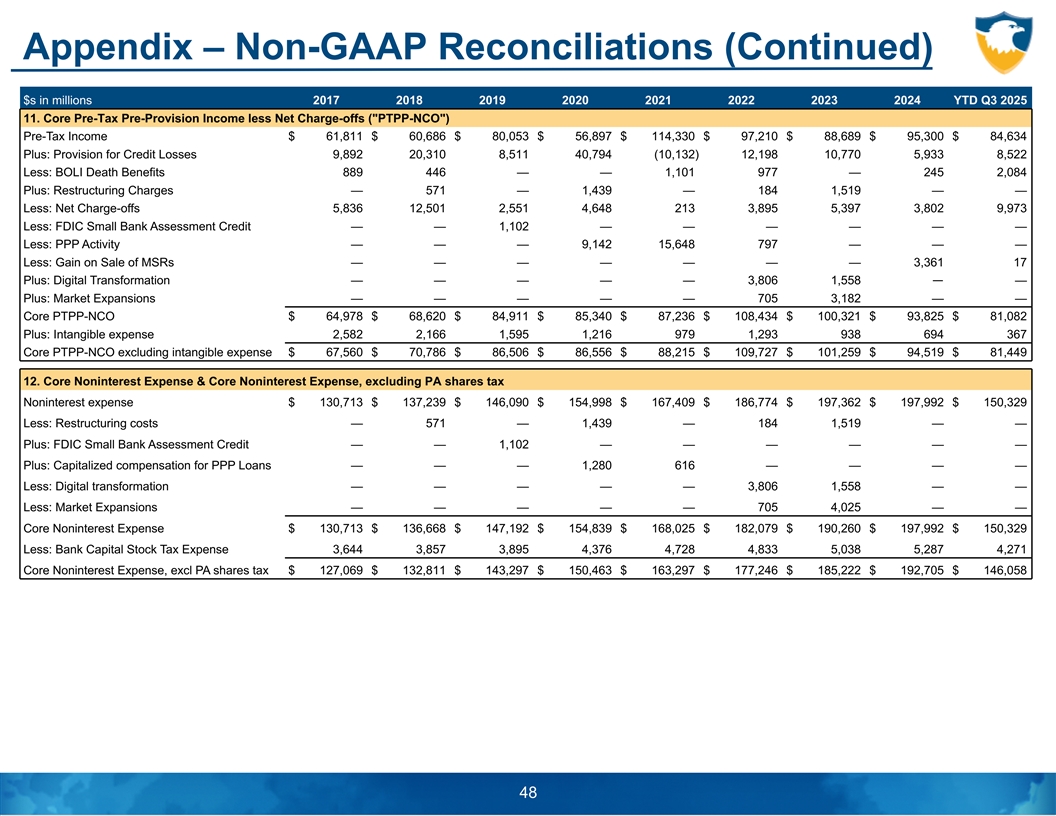
Appendix – Non-GAAP Reconciliations (Continued) $s in millions 2017 2018 2019 2020 2021 2022 2023 2024 YTD Q3 2025 11. Core Pre-Tax Pre-Provision Income less Net Charge-offs ( PTPP-NCO ) Pre-Tax Income $ 61,811 $ 60,686 $ 80,053 $ 56,897 $ 114,330 $ 97,210 $ 88,689 $ 95,300 $ 84,634 Plus: Provision for Credit Losses 9,892 20,310 8,511 40,794 (10,132) 12,198 10,770 5,933 8,522 Less: BOLI Death Benefits 889 446 — — 1,101 977 — 245 2,084 Plus: Restructuring Charges — 571 — 1,439 — 184 1,519 — — Less: Net Charge-offs 5,836 12,501 2,551 4,648 213 3,895 5,397 3,802 9,973 Less: FDIC Small Bank Assessment Credit — — 1,102 — — — — — — Less: PPP Activity — — — 9,142 15,648 797 — — — Less: Gain on Sale of MSRs — — — — — — — 3,361 17 Plus: Digital Transformation — — — — — 3,806 1,558 — — Plus: Market Expansions — — — — — 705 3,182 — — Core PTPP-NCO $ 64,978 $ 68,620 $ 84,911 $ 85,340 $ 87,236 $ 108,434 $ 100,321 $ 93,825 $ 81,082 Plus: Intangible expense 2,582 2,166 1,595 1,216 979 1,293 938 694 367 Core PTPP-NCO excluding intangible expense $ 67,560 $ 70,786 $ 86,506 $ 86,556 $ 88,215 $ 109,727 $ 101,259 $ 94,519 $ 81,449 12. Core Noninterest Expense & Core Noninterest Expense, excluding PA shares tax Noninterest expense $ 130,713 $ 137,239 $ 146,090 $ 154,998 $ 167,409 $ 186,774 $ 197,362 $ 197,992 $ 150,329 Less: Restructuring costs — 571 — 1,439 — 184 1,519 — — Plus: FDIC Small Bank Assessment Credit — — 1,102 — — — — — — Plus: Capitalized compensation for PPP Loans — — — 1,280 616 — — — — Less: Digital transformation — — — — — 3,806 1,558 — — Less: Market Expansions — — — — — 705 4,025 — — Core Noninterest Expense $ 130,713 $ 136,668 $ 147,192 $ 154,839 $ 168,025 $ 182,079 $ 190,260 $ 197,992 $ 150,329 Less: Bank Capital Stock Tax Expense 3,644 3,857 3,895 4,376 4,728 4,833 5,038 5,287 4,271 Core Noninterest Expense, excl PA shares tax $ 127,069 $ 132,811 $ 143,297 $ 150,463 $ 163,297 $ 177,246 $ 185,222 $ 192,705 $ 146,058 48