| Q3 2025 Financial Results Conference Call November 5th, 2025 Veeco Instruments |

| Disclaimer No Offer or Solicitation This communication is not intended to and shall not constitute an offer to purchase or the solicitation of an offer to buy or sell any securities, or a solicitation of any vote or approval, nor shall there be any sale of securities in any jurisdiction in which such offer, solicitation or sale would be unlawful prior to registration or qualification under the securities laws of any such jurisdiction. No offer of securities shall be made, except by means of a prospectus meeting the requirements of Section 10 of the Securities Act of 1933, as amended. How to Find Further Information In connection with a proposed merger (the “proposed transaction”) between Axcelis Technologies, Inc. (“Axcelis”) and Veeco Instruments Inc. (“Veeco”), Axcelis and Veeco intend to prepare, and Axcelis intends to file with U.S. Securities and Exchange Commission (the “SEC”), a Registration Statement on Form S-4 (the “Registration Statement”) containing a joint proxy statement/prospectus and certain other related documents, which will be both (i) the joint proxy statement to be distributed to Axcelis’ and Veeco’s respective stockholders in connection with Axcelis’ and Veeco’s solicitation of proxies for the vote by Axcelis’ and Veeco’s respective stockholders with respect to the proposed transaction and other matters as may be described in the joint proxy statement/prospectus and (ii) the prospectus relating to the offer and sale of the securities to be issued in connection with the proposed transaction. When available, Axcelis and Veeco will mail the definitive joint proxy statement/prospectus and other relevant documents to their respective stockholders as of the applicable record date to be established for voting on the proposed transaction. This communication is not a substitute for the Registration Statement, the definitive joint proxy statement/prospectus or any other document that Axcelis and/or Veeco will send to their respective stockholders in connection with the proposed transaction. Investors and security holders are urged to read, when available, the preliminary joint proxy statement/prospectus in connection with Axcelis’ and Veeco’s solicitation of proxies for their respective special meetings of stockholders to be held to approve the proposed transaction (and related matters) and general amendments thereto and the definitive joint proxy statement/prospectus because the joint proxy statement/prospectus will contain important information about the proposed transaction and the parties to the proposed transaction. Investors and security holders will be able to obtain free copies of the joint proxy statement/prospectus (if and when available) and other documents containing important information about Axcelis, Veeco and the proposed transaction, once such documents are filed with or furnished to the SEC through the website maintained by the SEC at www.sec.gov. Copies of the documents filed with or furnished to the SEC by Axcelis will be available free of charge on Axcelis’ website at investor.axcelis.com or by contacting Axcelis’ Investor Relations department by email at investor-relations@axcelis.com. Copies of the documents filed with or furnished to the SEC by Veeco will be available free of charge on Veeco’s website at ir.veeco.com or by contacting Veeco’s Investor Relations department by email at Investorrelations@veeco.com. Axcelis’ and Veeco’s respective website addresses are included in this communication for reference only. The information contained on, or accessible through, Axcelis’ or Veeco’s respective websites is not incorporated by reference into this communication or Axcelis’ and Veeco’s respective filings with the SEC. Forward-looking Statements This presentation contains “forward-looking statements”, within the meaning of the safe harbor provisions of the U.S. Private Securities Litigation Reform Act of 1995, as amended, that are based on management’s expectations, estimates, projections and assumptions. Words such as “expects,” “anticipates,” “plans,” “believes,” “scheduled,” “estimates” and variations of these words and similar expressions are intended to identify forward-looking statements. Forward-looking statements include, but are not limited to, those regarding anticipated growth and trends in our businesses and markets, industry outlooks and demand drivers, our investment and growth strategies, our development of new products and technologies, our business outlook for current and future periods, our ongoing transformation initiative and the effects thereof on our operations and financial results, the timing, completion and expected benefits of the proposed transaction and other statements that are not historical facts. These statements and their underlying assumptions are subject to risks and uncertainties and are not guarantees of future performance. Factors that could cause actual results to differ materially from those expressed or implied by such statements include, without limitation: the level of demand for our products; global economic and industry conditions; global trade issues, including the effects of foreign and domestic tariffs and the ongoing trade disputes between the U.S. and China, and changes in trade and export license policies; our dependency on third-party suppliers and outsourcing partners; the timing of customer orders; our ability to develop, deliver and support new products and technologies; our ability to expand our current markets, increase market share and develop new markets; the concentrated nature of our customer base; cybersecurity attacks and our ability to safeguard sensitive information and protect our intellectual property rights in key technologies; the effects of regional or global health epidemics; delays in or failure to complete the proposed transaction, whether due to an inability by either party to satisfy one or more conditions to closing, including an inability to obtain required shareholder approvals or certain regulatory approvals, the occurrence of events or changes in circumstances that give rise to the termination of the applicable merger agreement by either party, or otherwise; risks related to the pendency of the proposed transaction and its effect on our business, financial condition, results of operations, cash flows and stock price; our ability to achieve the objectives of operational and strategic initiatives and attract, motivate and retain key employees, including as a result of the proposed transaction; diversion of management time and attention from ordinary course business operations to the proposed transaction and other potential disruptions to our business relating thereto; the variability of results among products and end-markets, and our ability to accurately forecast future results, market conditions, and customer requirements; the impact of our indebtedness, including our convertible senior notes and our capped call transactions; and other risks and uncertainties described in our SEC filings on Forms 10-K, 10-Q and 8-K, and from time-to-time in our other SEC reports. All forward-looking statements speak only to management’s expectations, estimates, projections and assumptions as of the date of this presentation. The Company does not undertake any obligation to update or publicly revise any forward-looking statements to reflect events, circumstances or changes in expectations after the date of this presentation. Participants in the Solicitation Axcelis, Veeco and certain of their respective directors and executive officers may be deemed to be participants in the solicitation of proxies in respect of the proposed transaction. Information about the directors and executive officers of Axcelis, including a description of their direct or indirect interests, by security holdings or otherwise, is set forth in Axcelis’ proxy statement for its 2025 annual meeting of stockholders, which was filed with the SEC on March 31, 2025. Information about the directors and executive officers of Veeco, including a description of their direct or indirect interests, by security holdings or otherwise, is set forth in Veeco’s proxy statement for its 2025 annual meeting of stockholders, which was filed with the SEC on March 20, 2025. Other information regarding the participants in the proxy solicitations and a description of their direct and indirect interests, by security holdings or otherwise, will be contained in the joint proxy statement/prospectus and other relevant materials to be filed with or furnished to the SEC regarding the proposed transaction. You may obtain free copies of these documents using the sources indicated above. |
| Bill Miller, Ph.D. CEO Overview |

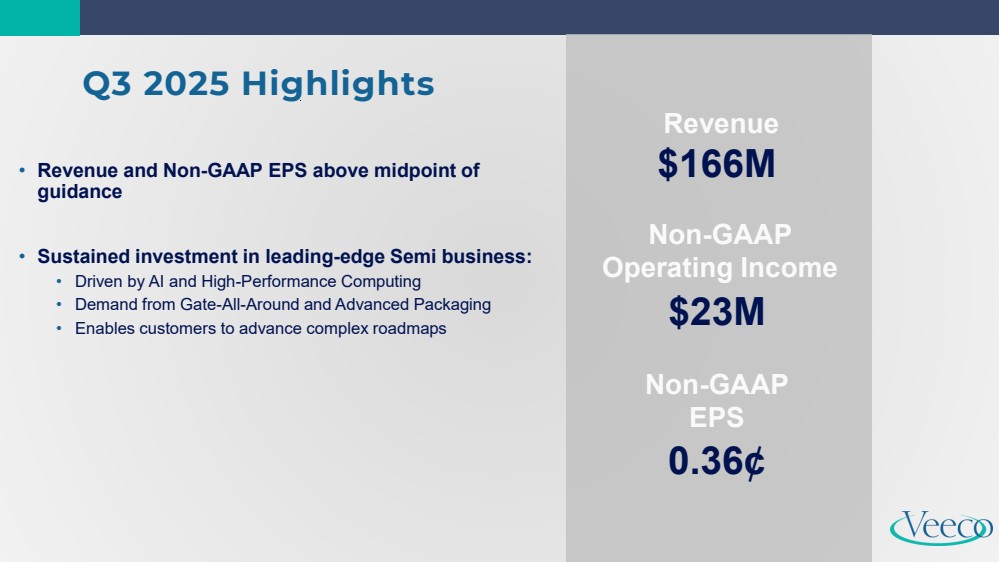
| Q3 2025 Highlights • Revenue and Non-GAAP EPS above midpoint of guidance • Sustained investment in leading-edge Semi business: • Driven by AI and High-Performance Computing • Demand from Gate-All-Around and Advanced Packaging • Enables customers to advance complex roadmaps Revenue $166M Non-GAAP Operating Income $23M Non-GAAP EPS 0.36¢ |
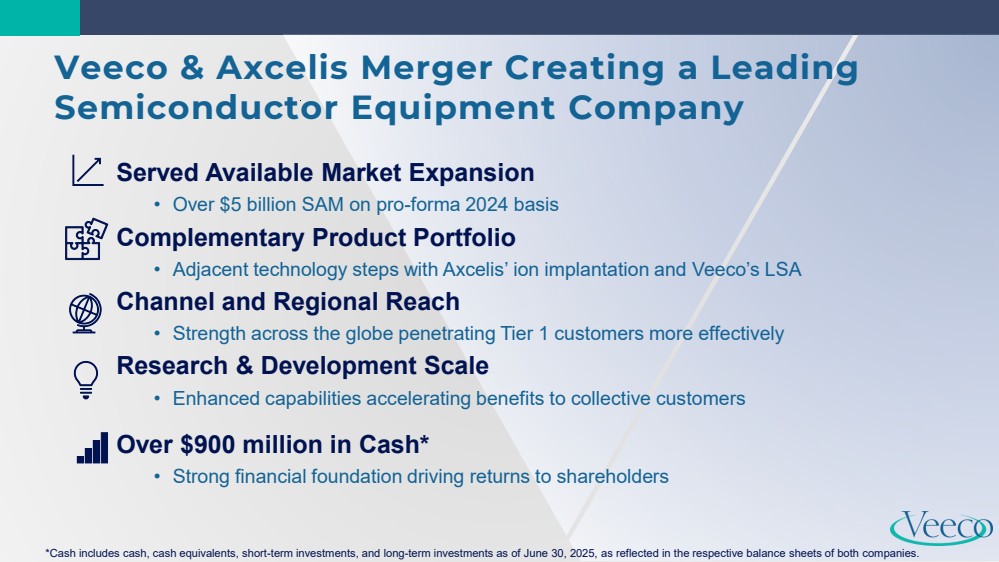
| Veeco & Axcelis Merger Creating a Leading Semiconductor Equipment Company Served Available Market Expansion • Over $5 billion SAM on pro-forma 2024 basis Complementary Product Portfolio • Adjacent technology steps with Axcelis’ ion implantation and Veeco’s LSA Channel and Regional Reach • Strength across the globe penetrating Tier 1 customers more effectively Research & Development Scale • Enhanced capabilities accelerating benefits to collective customers Over $900 million in Cash* • Strong financial foundation driving returns to shareholders *Cash includes cash, cash equivalents, short-term investments, and long-term investments as of June 30, 2025, as reflected in the respective balance sheets of both companies. |
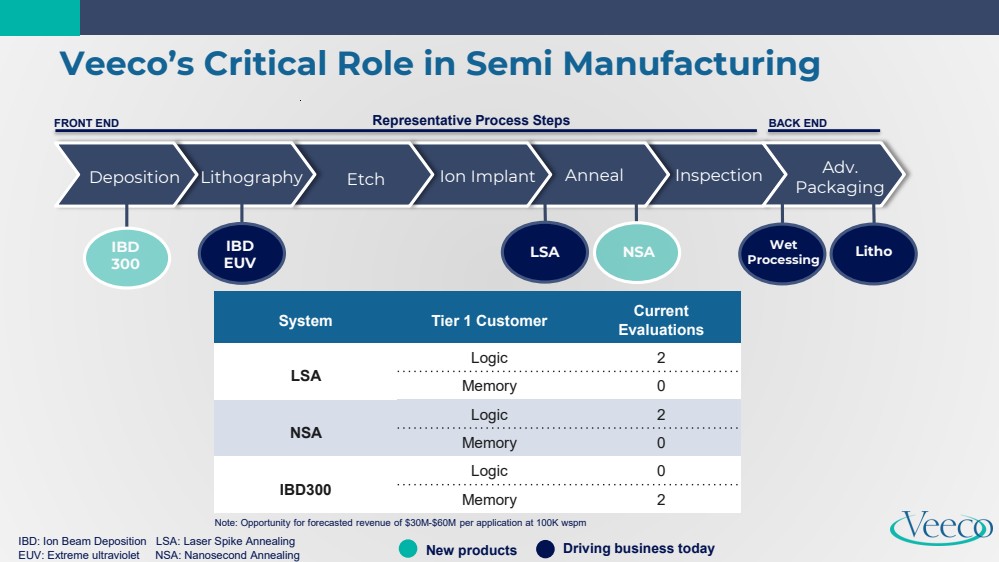
| Veeco’s Critical Role in Semi Manufacturing Deposition Lithography Etch Ion Implant Anneal Inspection Adv. Packaging IBD 300 IBD EUV LSA NSA Wet Processing Litho New products FRONT END BACK END Driving business today Representative Process Steps IBD: Ion Beam Deposition LSA: Laser Spike Annealing EUV: Extreme ultraviolet NSA: Nanosecond Annealing System Tier 1 Customer Current Evaluations LSA Logic 2 Memory 0 NSA Logic 2 Memory 0 IBD300 Logic 0 Memory 2 Note: Opportunity for forecasted revenue of $30M-$60M per application at 100K wspm |
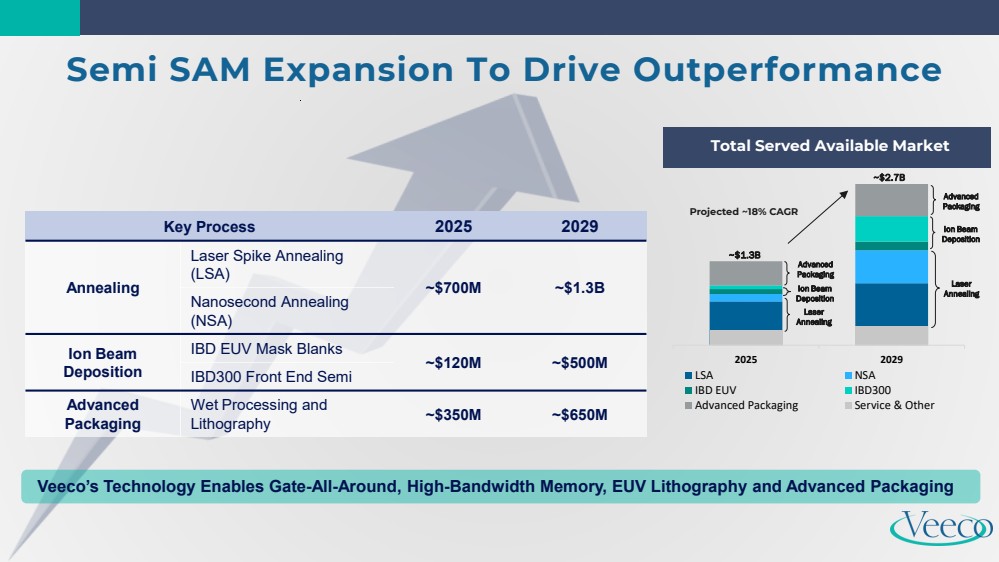
| 2025 2029 LSA NSA IBD EUV IBD300 Advanced Packaging Service & Other Projected ~18% CAGR ~$1.3B ~$2.7B Laser Annealing Ion Beam Deposition Ion Beam Deposition Laser Annealing Advanced Packaging Advanced Packaging Key Process 2025 2029 Annealing Laser Spike Annealing (LSA) ~$700M ~$1.3B Nanosecond Annealing (NSA) Ion Beam Deposition IBD EUV Mask Blanks ~$120M ~$500M IBD300 Front End Semi Advanced Packaging Wet Processing and Lithography ~$350M ~$650M Semi SAM Expansion To Drive Outperformance Veeco’s Technology Enables Gate-All-Around, High-Bandwidth Memory, EUV Lithography and Advanced Packaging Total Served Available Market |
| John Kiernan CFO Financial Overview |

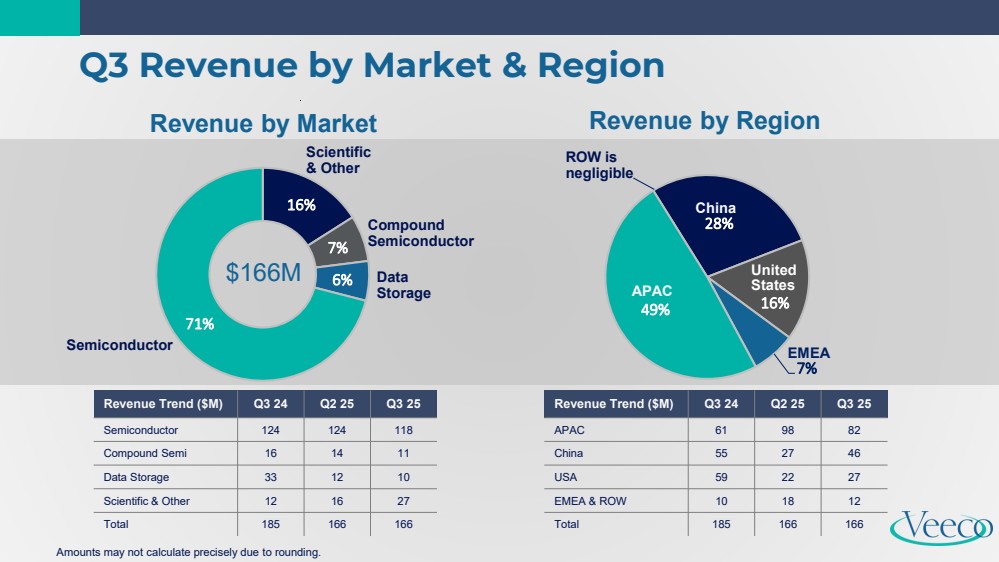
| Q3 Revenue by Market & Region Revenue by Market Revenue by Region Scientific & Other Semiconductor Compound Semiconductor Data Storage ROW is negligible 16% 7% 6% 71% 28% 16% 7% 49% United States EMEA APAC China $166M Amounts may not calculate precisely due to rounding. Revenue Trend ($M) Q3 24 Q2 25 Q3 25 Semiconductor 124 124 118 Compound Semi 16 14 11 Data Storage 33 12 10 Scientific & Other 12 16 27 Total 185 166 166 Revenue Trend ($M) Q3 24 Q2 25 Q3 25 APAC 61 98 82 China 55 27 46 USA 59 22 27 EMEA & ROW 10 18 12 Total 185 166 166 |
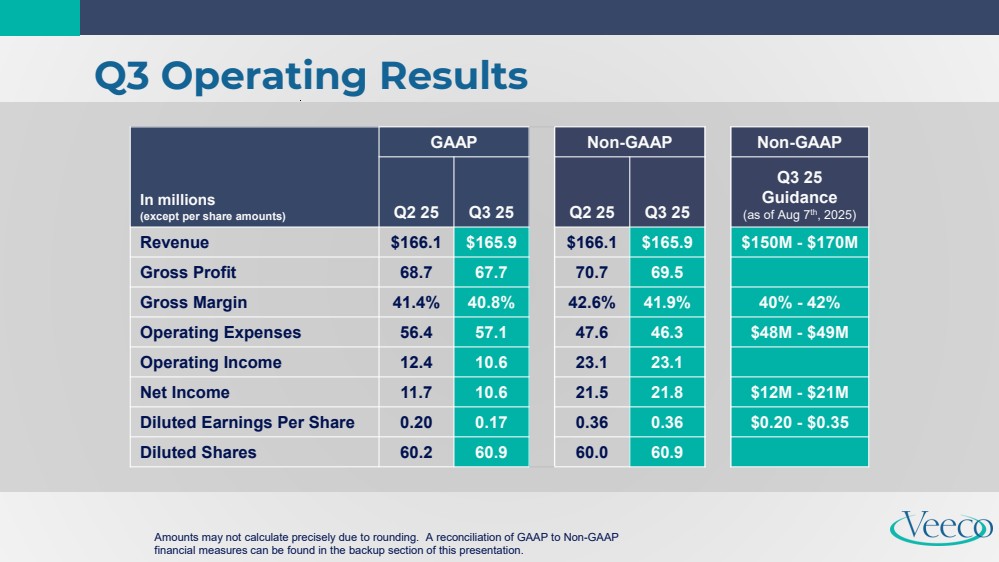
| Q3 Operating Results Amounts may not calculate precisely due to rounding. A reconciliation of GAAP to Non-GAAP financial measures can be found in the backup section of this presentation. In millions (except per share amounts) GAAP Non-GAAP Non-GAAP Q2 25 Q3 25 Q2 25 Q3 25 Q3 25 Guidance (as of Aug 7th, 2025) Revenue $166.1 $165.9 $166.1 $165.9 $150M - $170M Gross Profit 68.7 67.7 70.7 69.5 Gross Margin 41.4% 40.8% 42.6% 41.9% 40% - 42% Operating Expenses 56.4 57.1 47.6 46.3 $48M - $49M Operating Income 12.4 10.6 23.1 23.1 Net Income 11.7 10.6 21.5 21.8 $12M - $21M Diluted Earnings Per Share 0.20 0.17 0.36 0.36 $0.20 - $0.35 Diluted Shares 60.2 60.9 60.0 60.9 |
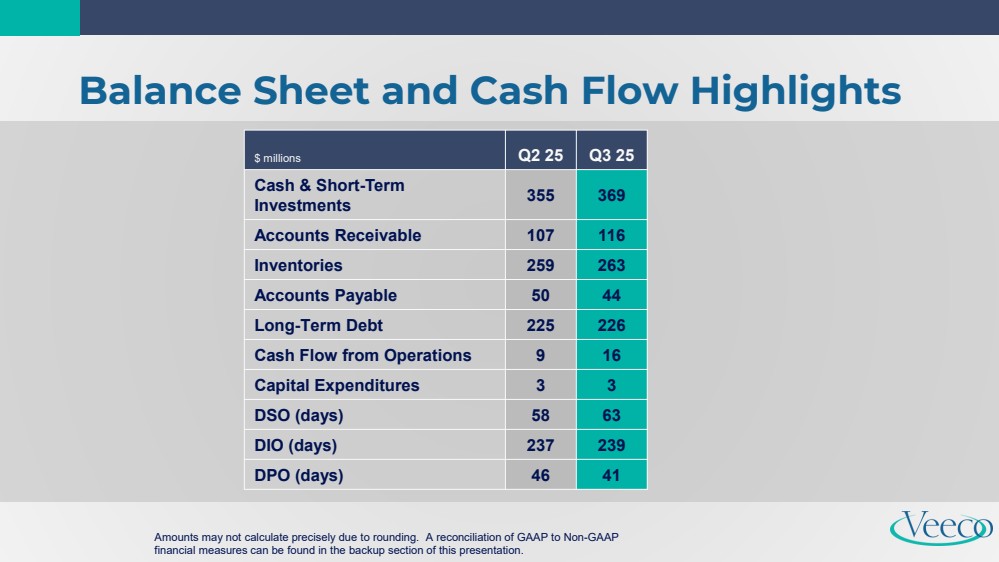
| Balance Sheet and Cash Flow Highlights Amounts may not calculate precisely due to rounding. A reconciliation of GAAP to Non-GAAP financial measures can be found in the backup section of this presentation. $ millions Q2 25 Q3 25 Cash & Short-Term Investments 355 369 Accounts Receivable 107 116 Inventories 259 263 Accounts Payable 50 44 Long-Term Debt 225 226 Cash Flow from Operations 9 16 Capital Expenditures 3 3 DSO (days) 58 63 DIO (days) 237 239 DPO (days) 46 41 |
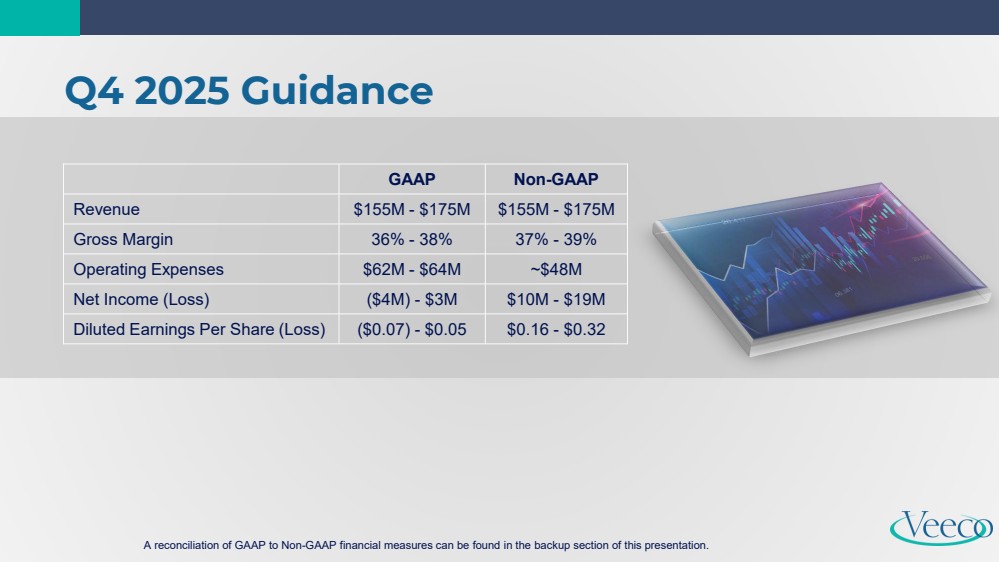
| Q4 2025 Guidance A reconciliation of GAAP to Non-GAAP financial measures can be found in the backup section of this presentation. GAAP Non-GAAP Revenue $155M - $175M $155M - $175M Gross Margin 36% - 38% 37% - 39% Operating Expenses $62M - $64M ~$48M Net Income (Loss) ($4M) - $3M $10M - $19M Diluted Earnings Per Share (Loss) ($0.07) - $0.05 $0.16 - $0.32 |
| Q&A |

| Backup & Financial Tables |

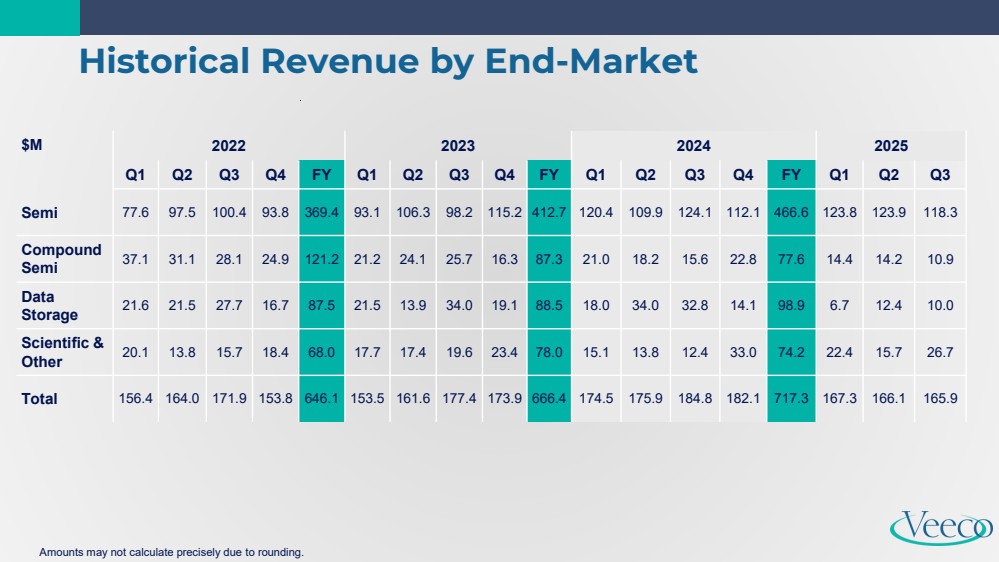
| Historical Revenue by End-Market Amounts may not calculate precisely due to rounding. $M 2022 2023 2024 2025 Q1 Q2 Q3 Q4 FY Q1 Q2 Q3 Q4 FY Q1 Q2 Q3 Q4 FY Q1 Q2 Q3 Semi 77.6 97.5 100.4 93.8 369.4 93.1 106.3 98.2 115.2 412.7 120.4 109.9 124.1 112.1 466.6 123.8 123.9 118.3 Compound Semi 37.1 31.1 28.1 24.9 121.2 21.2 24.1 25.7 16.3 87.3 21.0 18.2 15.6 22.8 77.6 14.4 14.2 10.9 Data Storage 21.6 21.5 27.7 16.7 87.5 21.5 13.9 34.0 19.1 88.5 18.0 34.0 32.8 14.1 98.9 6.7 12.4 10.0 Scientific & Other 20.1 13.8 15.7 18.4 68.0 17.7 17.4 19.6 23.4 78.0 15.1 13.8 12.4 33.0 74.2 22.4 15.7 26.7 Total 156.4 164.0 171.9 153.8 646.1 153.5 161.6 177.4 173.9 666.4 174.5 175.9 184.8 182.1 717.3 167.3 166.1 165.9 |
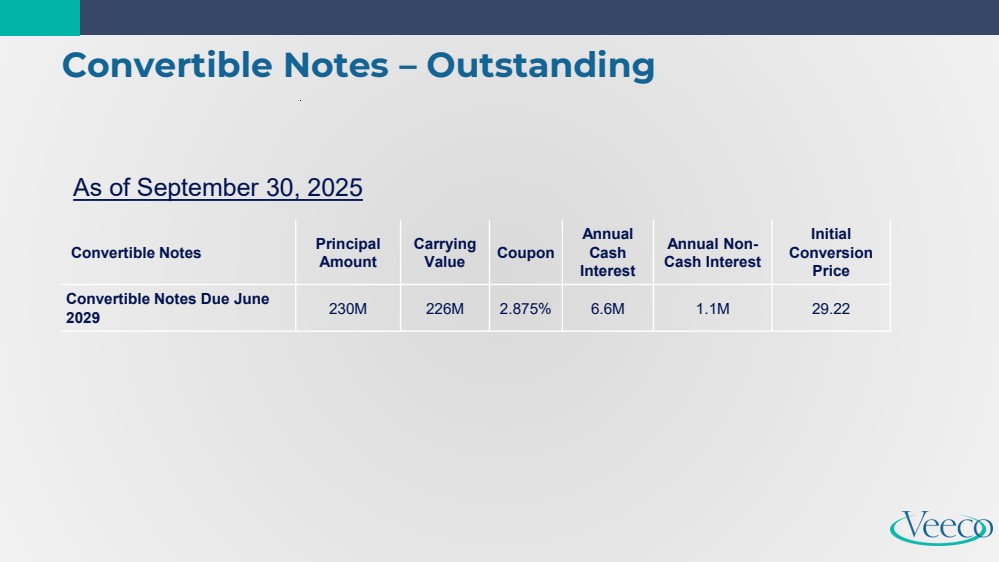
| Convertible Notes – Outstanding Convertible Notes Principal Amount Carrying Value Coupon Annual Cash Interest Annual Non-Cash Interest Initial Conversion Price Convertible Notes Due June 2029 230M 226M 2.875% 6.6M 1.1M 29.22 As of September 30, 2025 |
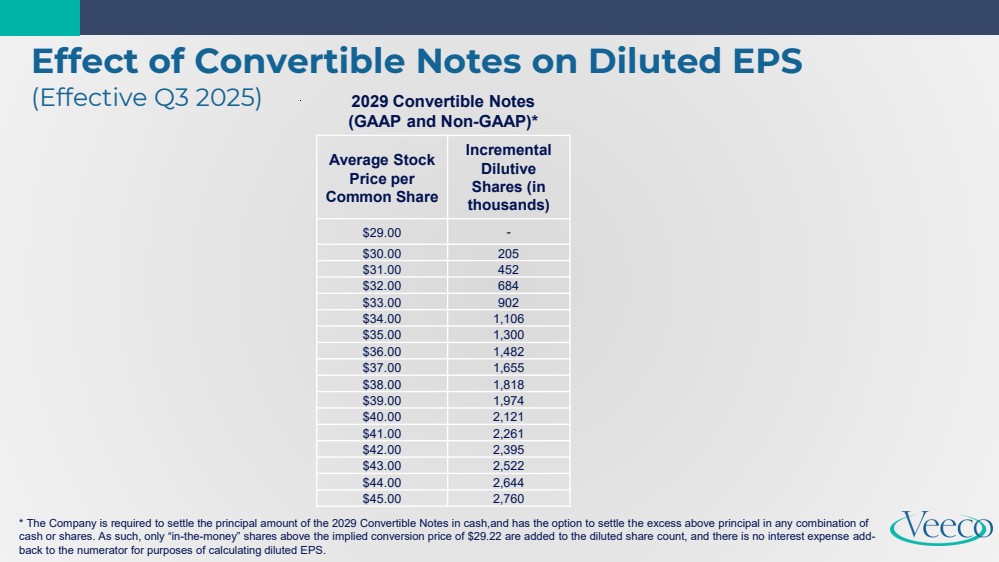
| Effect of Convertible Notes on Diluted EPS (Effective Q3 2025) * The Company is required to settle the principal amount of the 2029 Convertible Notes in cash,and has the option to settle the excess above principal in any combination of cash or shares. As such, only “in-the-money” shares above the implied conversion price of $29.22 are added to the diluted share count, and there is no interest expense add-back to the numerator for purposes of calculating diluted EPS. 2029 Convertible Notes (GAAP and Non-GAAP)* Average Stock Price per Common Share Incremental Dilutive Shares (in thousands) $29.00 - $30.00 205 $31.00 452 $32.00 684 $33.00 902 $34.00 1,106 $35.00 1,300 $36.00 1,482 $37.00 1,655 $38.00 1,818 $39.00 1,974 $40.00 2,121 $41.00 2,261 $42.00 2,395 $43.00 2,522 $44.00 2,644 $45.00 2,760 |
| Note on Reconciliation Tables These tables include financial measures adjusted for the impact of certain items; these financial measures are therefore not calculated in accordance with U.S. generally accepted accounting principles (“GAAP”). These Non-GAAP financial measures exclude items such as: share-based compensation expense; charges relating to restructuring initiatives; non-cash asset impairments; certain other non-operating gains and losses; and acquisition-related items such as transaction costs, non-cash amortization of acquired intangible assets, incremental transaction-related compensation, and certain integration costs. These Non-GAAP financial measures may be different from Non-GAAP financial measures used by other companies. Non-GAAP financial measures should not be considered a substitute for, or superior to, measures of financial performance prepared in accordance with GAAP. By excluding these items, Non-GAAP financial measures are intended to facilitate meaningful comparisons to historical operating results, competitors' operating results, and estimates made by securities analysts. Management is evaluated on key performance metrics including Non-GAAP Operating Income, which is used to determine management incentive compensation as well as to forecast future periods. These Non-GAAP financial measures may be useful to investors in allowing for greater transparency of supplemental information used by management in its financial and operational decision-making. In addition, similar Non-GAAP financial measures have historically been reported to investors; the inclusion of comparable numbers provides consistency in financial reporting. Investors are encouraged to review the reconciliation of the Non-GAAP financial measures used in this news release to their most directly comparable GAAP financial measures. |
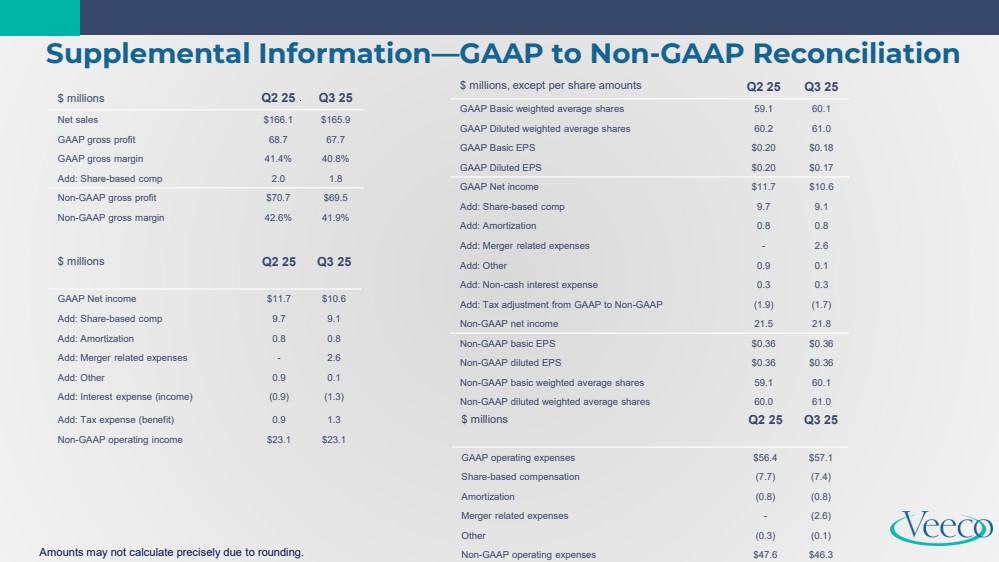
| Supplemental Information—GAAP to Non-GAAP Reconciliation $ millions Q2 25 Q3 25 Net sales $166.1 $165.9 GAAP gross profit 68.7 67.7 GAAP gross margin 41.4% 40.8% Add: Share-based comp 2.0 1.8 Non-GAAP gross profit $70.7 $69.5 Non-GAAP gross margin 42.6% 41.9% $ millions Q2 25 Q3 25 GAAP Net income $11.7 $10.6 Add: Share-based comp 9.7 9.1 Add: Amortization 0.8 0.8 Add: Merger related expenses - 2.6 Add: Other 0.9 0.1 Add: Interest expense (income) (0.9) (1.3) Add: Tax expense (benefit) 0.9 1.3 Non-GAAP operating income $23.1 $23.1 $ millions, except per share amounts Q2 25 Q3 25 GAAP Basic weighted average shares 59.1 60.1 GAAP Diluted weighted average shares 60.2 61.0 GAAP Basic EPS $0.20 $0.18 GAAP Diluted EPS $0.20 $0.17 GAAP Net income $11.7 $10.6 Add: Share-based comp 9.7 9.1 Add: Amortization 0.8 0.8 Add: Merger related expenses - 2.6 Add: Other 0.9 0.1 Add: Non-cash interest expense 0.3 0.3 Add: Tax adjustment from GAAP to Non-GAAP (1.9) (1.7) Non-GAAP net income 21.5 21.8 Non-GAAP basic EPS $0.36 $0.36 Non-GAAP diluted EPS $0.36 $0.36 Non-GAAP basic weighted average shares 59.1 60.1 Non-GAAP diluted weighted average shares 60.0 61.0 $ millions Q2 25 Q3 25 GAAP operating expenses $56.4 $57.1 Share-based compensation (7.7) (7.4) Amortization (0.8) (0.8) Merger related expenses - (2.6) Other (0.3) (0.1) Amounts may not calculate precisely due to rounding. Non-GAAP operating expenses $47.6 $46.3 |
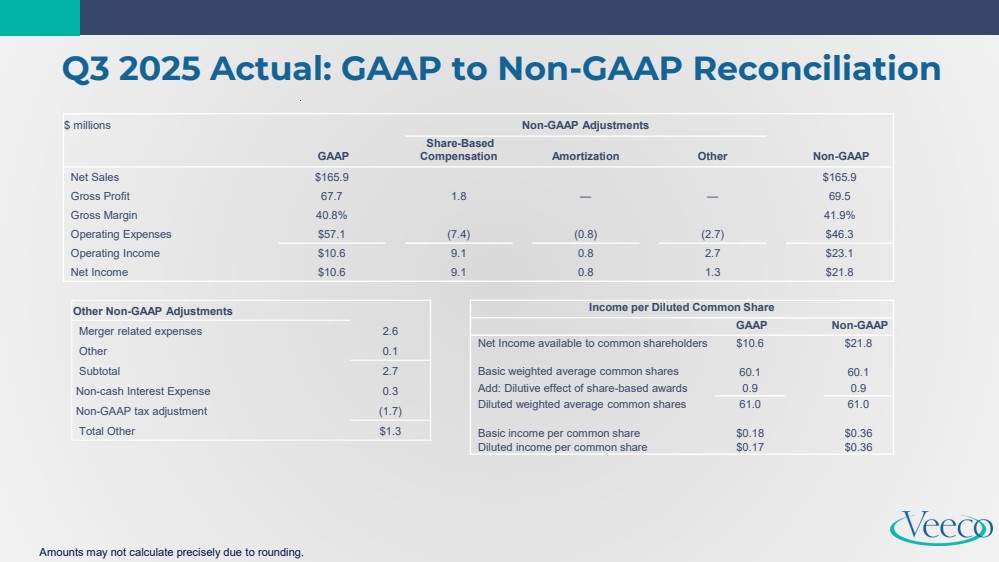
| $ millions Non-GAAP Adjustments GAAP Share-Based Compensation Amortization Other Non-GAAP Net Sales $165.9 $165.9 Gross Profit 67.7 1.8 — — 69.5 Gross Margin 40.8% 41.9% Operating Expenses $57.1 (7.4) (0.8) (2.7) $46.3 Operating Income $10.6 9.1 0.8 2.7 $23.1 Net Income $10.6 9.1 0.8 1.3 $21.8 Q3 2025 Actual: GAAP to Non-GAAP Reconciliation Income per Diluted Common Share GAAP Non-GAAP Net Income available to common shareholders $10.6 $21.8 Basic weighted average common shares 60.1 60.1 Add: Dilutive effect of share-based awards 0.9 0.9 Diluted weighted average common shares 61.0 61.0 Basic income per common share $0.18 $0.36 Diluted income per common share $0.17 $0.36 Other Non-GAAP Adjustments Merger related expenses 2.6 Other 0.1 Subtotal 2.7 Non-cash Interest Expense 0.3 Non-GAAP tax adjustment (1.7) Total Other $1.3 Amounts may not calculate precisely due to rounding. |
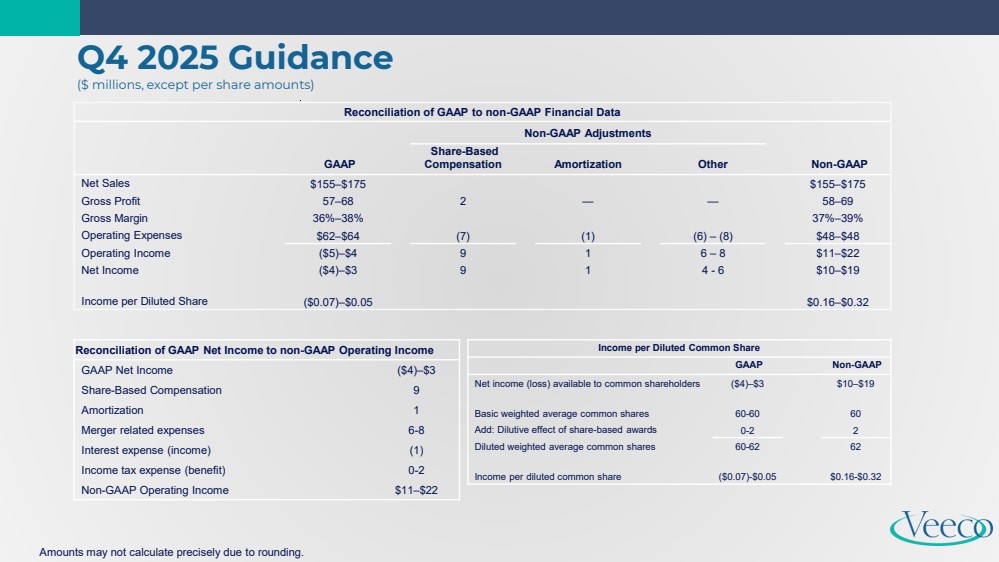
| Reconciliation of GAAP to non-GAAP Financial Data Non-GAAP Adjustments GAAP Share-Based Compensation Amortization Other Non-GAAP Net Sales $155–$175 $155–$175 Gross Profit 57–68 2 — — 58–69 Gross Margin 36%–38% 37%–39% Operating Expenses $62–$64 (7) (1) (6) – (8) $48–$48 Operating Income ($5)–$4 9 1 6 – 8 $11–$22 Net Income ($4)–$3 9 1 4 - 6 $10–$19 Income per Diluted Share ($0.07)–$0.05 $0.16–$0.32 Q4 2025 Guidance ($ millions, except per share amounts) Reconciliation of GAAP Net Income to non-GAAP Operating Income GAAP Net Income ($4)–$3 Share-Based Compensation 9 Amortization 1 Merger related expenses 6-8 Interest expense (income) (1) Income tax expense (benefit) 0-2 Non-GAAP Operating Income $11–$22 Amounts may not calculate precisely due to rounding. Income per Diluted Common Share GAAP Non-GAAP Net income (loss) available to common shareholders ($4)–$3 $10–$19 Basic weighted average common shares 60-60 60 Add: Dilutive effect of share-based awards 0-2 2 Diluted weighted average common shares 60-62 62 Income per diluted common share ($0.07)-$0.05 $0.16-$0.32 |