☒ QUARTERLY REPORT PURSUANT TO SECTION 13 OR 15(d) OF THE SECURITIES EXCHANGE ACT OF 1934 For the quarterly period ended March 31, 2026 OR
☐ TRANSITION REPORT PURSUANT TO SECTION 13 OR 15(d) OF THE SECURITIES EXCHANGE ACT OF 1934 For the transition period from __________ to __________
COMMISSION FILE NUMBER 001-12307
ZIONS BANCORPORATION, NATIONAL ASSOCIATION
(Exact name of registrant as specified in its charter)
United States of America
87-0189025
(State or other jurisdiction of incorporation or organization)
(I.R.S. Employer Identification No.)
One South Main
Salt Lake City,Utah
84133-1109
(Address of principal executive offices)
(Zip Code)
Registrant’s telephone number, including area code: (801) 844-7637
Securities registered pursuant to Section 12(b) of the Act:
Title of Each Class
Trading Symbols
Name of Each Exchange on Which Registered
Common Stock, par value $0.001
ZION
The NASDAQ Stock Market LLC
Depositary Shares each representing a 1/40th ownership interest in a share of:
Series A Floating-Rate Non-Cumulative Perpetual Preferred Stock
ZIONP
The NASDAQ Stock Market LLC
•Indicate by check mark whether the registrant (1) has filed all reports required to be filed by Section 13 or 15(d) of the Securities Exchange Act of 1934 during the preceding 12 months (or for such shorter period that the registrant was required to file such reports), and (2) has been subject to such filing requirements for the past 90 days. Yesý No ¨
•Indicate by check mark whether the registrant has submitted electronically every Interactive Data File required to be submitted pursuant to Rule 405 of Regulation S-T (§232.405 of this chapter) during the preceding 12 months (or for such shorter period that the registrant was required to submit such files). Yesý No ¨
•Indicate by check mark whether the registrant is a large accelerated filer, an accelerated filer, a non-accelerated filer, a smaller reporting company, or an emerging growth company. See the definitions of “large accelerated filer,” “accelerated filer,” “smaller reporting company,” and “emerging growth company” in Rule 12b-2 of the Exchange Act.
Large accelerated filerý Accelerated filer ¨ Non-accelerated filer ¨ Smaller reporting company ☐Emerging growth company ¨
•If an emerging growth company, indicate by check mark if the registrant has elected not to use the extended transition period for complying with any new or revised financial accounting standards provided pursuant to Section 13(a) of the Exchange Act. ¨
•Indicate by check mark whether the registrant is a shell company (as defined in Rule 12b-2 of the Exchange Act). Yes ¨ No ý
•Indicate the number of shares outstanding of each of the issuer’s classes of common stock, as of the latest practicable date.
Number of common shares outstanding at April 30, 2026: 147,091,817 shares
1
ZIONS BANCORPORATION, NATIONAL ASSOCIATION AND SUBSIDIARIES
ZIONS BANCORPORATION, NATIONAL ASSOCIATION AND SUBSIDIARIES
PART I. FINANCIAL INFORMATION
ITEM 2. MANAGEMENT’S DISCUSSION AND ANALYSIS OF FINANCIAL CONDITION AND RESULTS OF OPERATIONS
FORWARD-LOOKING INFORMATION
This quarterly report contains “forward-looking statements” as defined under the Private Securities Litigation Reform Act of 1995. These statements reflect management’s current expectations and assumptions regarding future events and outcomes. However, they are inherently subject to known and unknown risks, uncertainties, and other factors that could cause actual results, performance, achievements, industry developments, or regulatory outcomes to differ materially from those expressed or implied. Forward-looking statements may include, among others:
•Statements concerning the beliefs, plans, objectives, goals, targets, commitments, designs, guidelines, expectations, anticipations, and future financial condition, operating results, and performance of Zions Bancorporation, National Association, and its subsidiaries (collectively “Zions Bancorporation, N.A.,” “the Bank,” “we,” “our,” “us”); and
•Statements preceded or followed by, or that include, terminology such as “may,” “might,” “can,” “continue,” “could,” “should,” “would,” “believe,” “anticipate,” “estimate,” “forecast,” “expect,” “intend,” “target,” “commit,” “design,” “plan,” “project,” “will,” or similar words and expressions, including their negative forms.
Forward-looking statements are not guarantees and should not be relied upon as representing management’s views as of any subsequent date. Actual results and outcomes may differ materially from those presented. Although the following list is not comprehensive, key factors that may cause material differences include:
•The quality and composition of our loan portfolio, investment securities, and deposits;
•Changes in general industry, political, and economic conditions, including increases in the national debt, elevated or persistent inflation, economic slowdowns or recessions, and other macroeconomic challenges; changes in interest rates or reference rates, which could negatively impact our revenues and expenses, the valuation and performance of our assets and liabilities, and the availability and cost of capital and liquidity;
•Political developments, including government shutdowns and other significant disruptions and changes in the funding, size, scope, and effectiveness of the government and its agencies and services;
•The effects of newly enacted and proposed regulations affecting us and the banking industry, as well as changes and uncertainties in the interpretation, enforcement, and applicability of laws and fiscal, monetary, regulatory, trade, and tax policies;
•Actions taken by governments, agencies, central banks, and similar organizations, including those that result in decreases in revenue, increases in regulatory bank fees, insurance assessments, and capital standards; and other regulatory requirements;
•Evolving trade policies and disputes, including proposed and implemented tariffs, and the resulting economic uncertainty that may adversely affect supply chains, operating costs, and revenues for both us and our customers;
•Judicial, regulatory, and administrative inquiries, investigations, examinations or proceedings and the outcomes thereof that create uncertainty for, or are adverse to, us or the banking industry;
•Changes in our credit ratings;
•The growing presence of credit unions, financial technology companies (“fintechs”), and other emerging competitors within the financial services industry, including in the markets in which we operate;
•Our ability to innovate and address competitive pressures and other factors that may affect aspects of our business, such as pricing, the relevance of and demand for our products and services, and our ability to recruit and retain talent;
ZIONS BANCORPORATION, NATIONAL ASSOCIATION AND SUBSIDIARIES
•The potential for both positive and disruptive impacts of emerging technologies, including stablecoins and other digital currencies, tokenized deposits, blockchain, artificial intelligence (“AI”), quantum computing, and related innovations affecting both us and the banking industry;
•Our ability to complete projects and initiatives and execute our strategic plans, manage our risks, control compensation and other expenses, and achieve our business objectives;
•Our ability to develop and maintain technology and information security systems, along with effective controls designed to guard against fraud, cybersecurity, and privacy risks and related incidents, particularly given the accelerating pace at which threat actors are developing and deploying increasingly sophisticated and targeted tactics against the financial services industry;
•The occurrence of fraud, theft, or other forms of misconduct perpetrated by external parties, including customers and business partners, or by our own employees;
•Our ability to provide adequate oversight of our suppliers to help us prevent or mitigate effects upon us and our customers of inadequate performance, systems failures, or cyber and other incidents by, or affecting, third parties upon whom we rely for the delivery of various products and services;
•The effects of wars, geopolitical conflicts, and other local, national, or international disasters, crises, or conflicts that may occur in the future;
•Natural disasters, pandemics, wildfires, catastrophic events, and other emergencies and incidents, and their impact on our operations, our customers’ business, and the communities we serve, including the increasing difficulty and expense of obtaining property, auto, business, and other insurance products;
•Diverging and evolving policy, legal, regulatory, and political developments—combined with differing stakeholder perspectives related to governance, environmental, and social matters—may subject us to conflicting requirements and expectations;
•Volatility in securities and capital markets behavior, including changes in market liquidity and our ability to access funding or raise capital on favorable terms;
•The possibility that our recorded goodwill could become impaired, which may have an adverse impact on our earnings and shareholders’ equity;
•The impact of bank closures or adverse developments at other banks on general investor sentiment regarding the stability and liquidity of banks;
•Adverse news and other expressions of negative public opinion—whether directed at us, other financial institutions, the banking industry, or the broader market—that may adversely affect our reputation and the industry more broadly.
Factors that could cause actual results or outcomes to differ materially from those expressed or implied in forward-looking statements are described in our 2025 Form 10-K and subsequent filings with the Securities and Exchange Commission (“SEC”), available at www.zionsbancorporation.com and www.sec.gov.
We caution against placing undue reliance on forward-looking statements, as they reflect our views only as of the date they are issued. Except as required by law, we expressly disclaim any obligation to update any factors or publicly announce revisions to forward-looking statements to reflect future events or developments.
RESULTS OF OPERATIONS
Comparisons noted below are calculated for the current quarter versus the same prior year period, unless otherwise specified. Growth rates of 100% or more are considered not meaningful (“NM”) as they typically reflect a low starting point.
ZIONS BANCORPORATION, NATIONAL ASSOCIATION AND SUBSIDIARIES
First Quarter 2026 Financial Performance
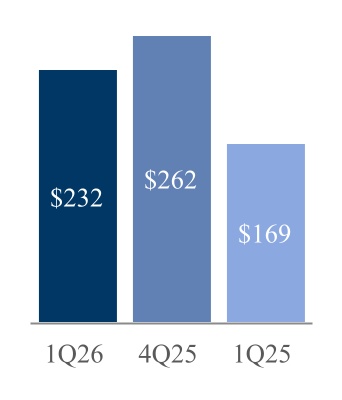
Net Earnings Applicable to Common Shareholders (in millions)
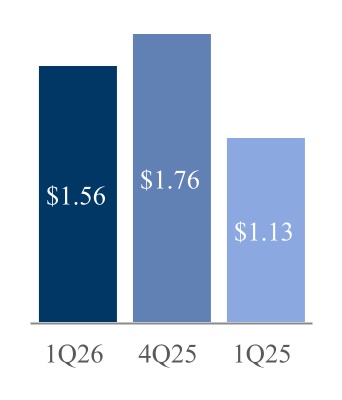
Diluted EPS
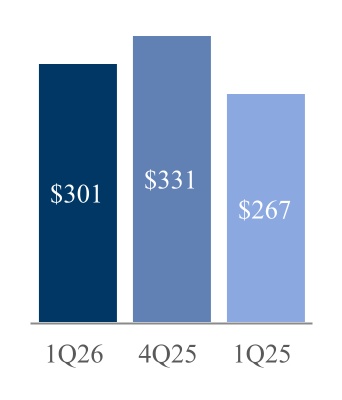
Adjusted PPNR
(in millions) 1
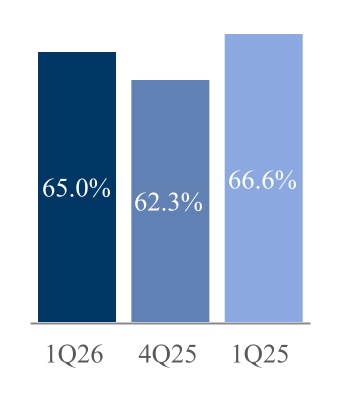
Efficiency Ratio 1
1For information on non-GAAP financial measures, see page 37.
Executive Summary
Our financial performance in the first quarter of 2026 demonstrated strong year-over-year growth in net earnings applicable to common shareholders, diluted earnings per share (“EPS”), and adjusted pre-provision net revenue (“PPNR”). Diluted EPS increased to $1.56 from $1.13 in the first quarter of 2025, driven by higher net interest income and noninterest income, along with a lower provision for credit losses. These favorable factors were partially offset by higher noninterest expense. The efficiency ratio improved to 65.0% from 66.6% in the prior year quarter, reflecting positive operating leverage. The efficiency ratio was 62.3% in the prior quarter, primarily due to higher seasonal compensation costs.
•Net interest income increased $38 million, or 6%, compared with the prior year period, largely reflecting lower funding costs. This increase was further supported by an improved mix of average interest-earning assets, driven by growth in higher-yielding loans and a reduction in lower-yielding investment securities and money market investments. As a result, the net interest margin increased to 3.27%, up from 3.10%. The net interest margin declined from 3.31% in the prior quarter, mainly due to lower earning asset yields and a decrease in average demand deposits.
◦Average interest-earning assets increased $399 million, or less than 1%, primarily due to an increase in average loans and leases. This increase was partially offset by declines in average investment securities and average money market investments.
◦Average interest-bearing liabilities declined $2.7 billion, or 5%, largely due to decreases in average interest-bearing deposits and average borrowed funds, partially offset by an increase in average long-term debt, driven by recent issuances of senior notes.
•The provision for credit losses was negative $7 million, compared with positive $18 million in the prior year period, primarily due to lower reserves associated with commercial real estate (“CRE”) portfolio-specific risks.
•Customer-related noninterest income increased $14 million, or 9%, reflecting broad-based growth across multiple revenue streams, primarily driven by higher loan-related fees and income, as well as growth in retail and business banking fees and commercial account fees.
•Noncustomer-related noninterest income increased $2 million, or 15%, mainly due to valuation adjustments on servicing rights and gains on the sale of fixed assets, partially offset by lower securities gains.
•Noninterest expense increased $24 million, or 4%, primarily due to higher incentive compensation accruals reflecting improved profitability, as well as increased base salaries and employee benefits costs. Additional
ZIONS BANCORPORATION, NATIONAL ASSOCIATION AND SUBSIDIARIES
increases in professional and legal services and in technology, telecom, and information processing expenses were partially offset by a decline in deposit insurance and regulatory expense.
•Total loans and leases increased $1.4 billion, or 2%, primarily driven by growth in the commercial and industrial loan portfolio and the consumer home equity credit line (“HECL”) portfolio.
◦Net loan and lease charge-offs totaled $4 million, or 0.03% of average loans and leases annualized, compared with $16 million, or 0.11%, in the prior year quarter.
◦Nonperforming assets totaled $292 million, or 0.48% of total loans and leases and other real estate owned, compared with $307 million, or 0.51%. The decrease was primarily attributable to improvement in the commercial and industrial loan portfolio. Classified loans totaled $2.3 billion, or 3.80% of total loans and leases, compared with $2.9 billion, or 4.82%, in the prior year quarter.
•Total deposits increased $1.2 billion, or 2%. Noninterest-bearing demand deposits increased primarily reflecting the migration of a consumer interest-bearing product into a new noninterest-bearing offering. This increase was partially offset by a decline in interest-bearing deposits, largely driven by a reduction in brokered deposits. Customer deposits, excluding brokered deposits, totaled $73.1 billion, compared with $70.9 billion.
•Total borrowed funds decreased $1.8 billion, or 44%, compared with the prior year quarter. The decrease was driven by a reduction in short-term Federal Home Loan Bank (“FHLB”) advances, partially offset by recent issuances of senior notes.
During the first quarter of 2026, we entered into an agreement to acquire the agency lending business of Basis Multifamily Finance I, LLC, a subsidiary of Basis Investment Group, subject to customary closing conditions and regulatory approvals. This acquisition will expand our ability to deliver permanent financing solutions to multifamily housing clients through our enhanced capabilities as an originator, underwriter, and servicer of government-sponsored agency loans, including the Fannie Mae DUS® program and the Freddie Mac Optigo® Conventional and Small Balance Loan programs. The transaction is expected to strengthen our capital markets franchise and further enhance our ability to serve commercial real estate clients across the Western United States and other key markets.
Net Interest Income and Net Interest Margin
NET INTEREST INCOME AND NET INTEREST MARGIN
Three Months Ended March 31,
Amount change
Percent change
(Dollar amounts in millions)
2026
2025
Interest and fees on loans 1
$
841
$
850
$
(9)
(1)
%
Interest on money market investments
39
53
(14)
(26)
Interest on securities
116
125
(9)
(7)
Total interest income
996
1,028
(32)
(3)
Interest on deposits
275
326
(51)
(16)
Interest on short- and long-term borrowings
59
78
(19)
(24)
Total interest expense
334
404
(70)
(17)
Net interest income
$
662
$
624
$
38
6
Average interest-earning assets
$
83,401
$
83,002
$
399
—
%
Average interest-bearing liabilities
$
54,654
$
57,322
$
(2,668)
(5)
%
bps
Net interest margin 2
3.27%
3.10%
17
1 Includes interest income recoveries of $1 million and $4 millionfor the three months endedMarch 31, 2026, and 2025, respectively.
ZIONS BANCORPORATION, NATIONAL ASSOCIATION AND SUBSIDIARIES
Net interest income accounted for 78% of our net revenue (the sum of net interest income and noninterest income) in both the first quarters of 2026 and 2025. It increased $38 million, or 6%, during the three months ended March 31, 2026, compared with the same prior year period. This increase was further supported by an improved mix of average interest-earning assets, driven by growth in higher-yielding loans and a reduction in lower-yielding investment securities and money market investments. As a result, the net interest margin increased to 3.27%, compared with 3.10%.
Yields on Interest-earning Assets and Rates Paid on Interest-bearing Liabilities
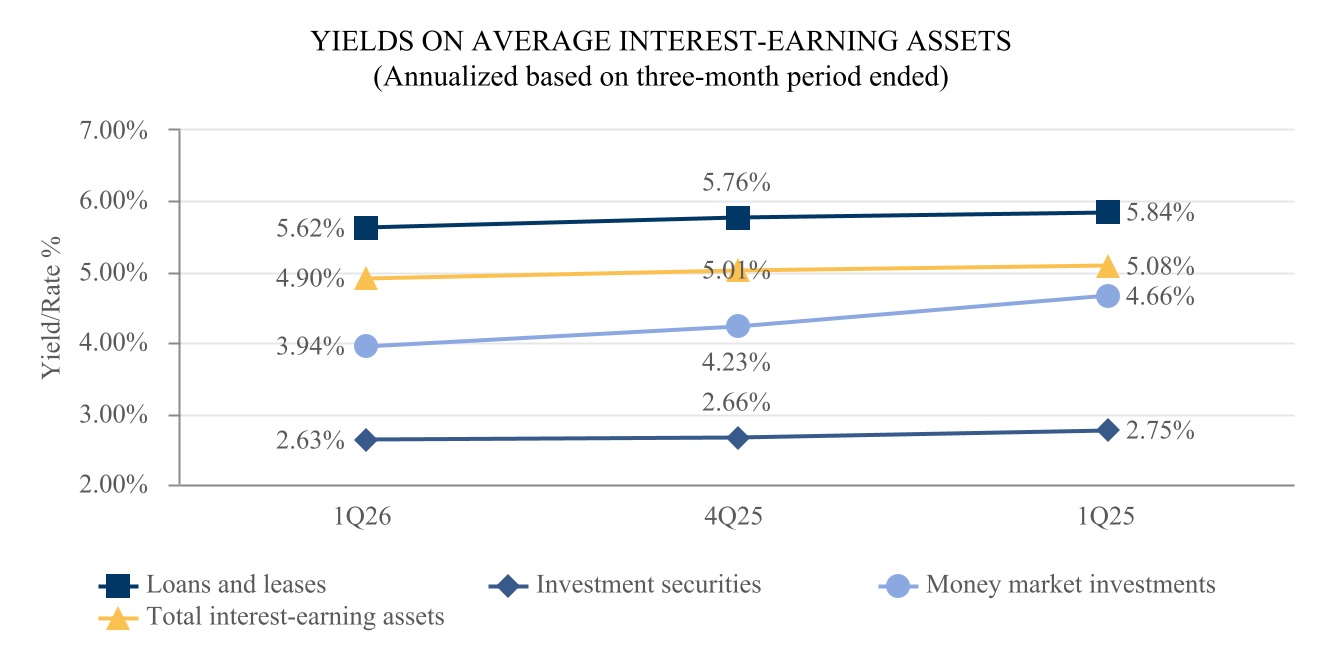
The following chart presents the changes in yields on average interest-earning assets:
The yield on average interest-earning assets, net of hedging activity, declined 18 basis points (“bps”) in the first quarter of 2026, compared with the prior year period, reflecting lower interest rates. The net yield on average loans and leases decreased 22 bps, while the net yield on average investment securities declined 12 bps. Additionally, the yield on average money market investments decreased 72 bps, as the short-term nature of these assets resulted in quicker repricing in the declining interest rate environment.
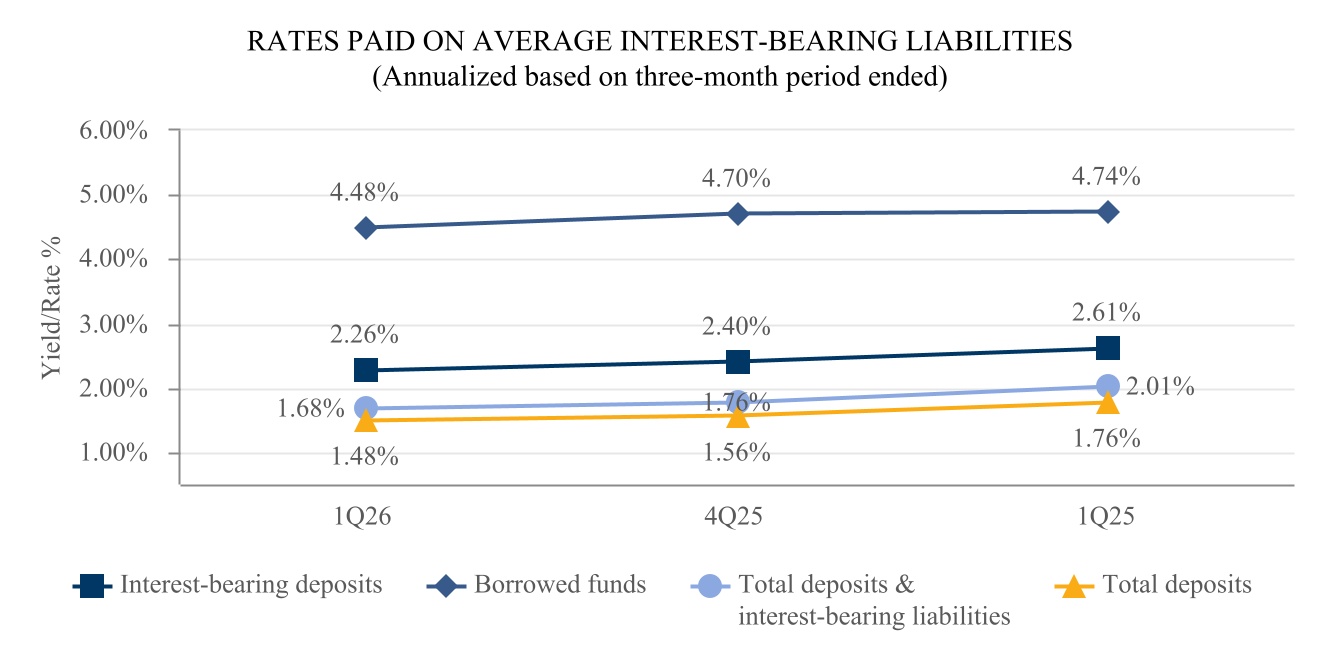
The following chart presents the changes in rates paid on average interest-bearing liabilities:
ZIONS BANCORPORATION, NATIONAL ASSOCIATION AND SUBSIDIARIES
The total cost of deposits decreased 28 bps, and the rate paid on total deposits and interest-bearing liabilities decreased 33 bps during the first quarter of 2026, compared with the prior year period, reflecting the lower interest rate environment. The rates paid on interest-bearing deposits and total borrowed funds decreased 35 bps and 26 bps, respectively.
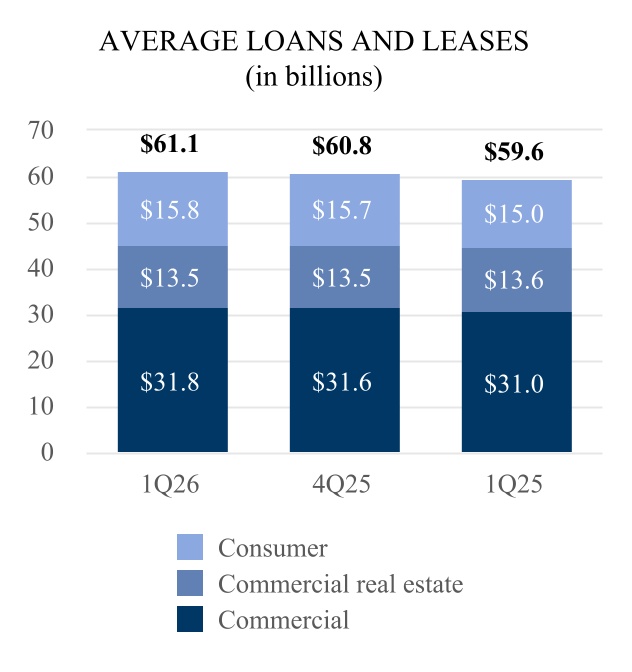
Interest-earning Assets
Average interest-earning assets increased $399 million, or less than 1%, from the prior year quarter, as an increase in average loans and leases was partially offset by declines in average investment securities and average money market investments.
Average loans and leases increased $1.5 billion, or 3%, to $61.1 billion, primarily due to growth in average commercial and consumer loans.
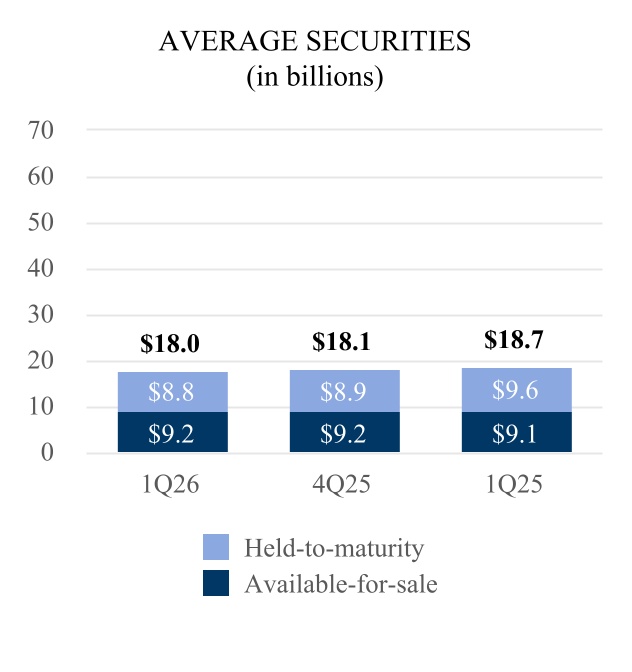
ZIONS BANCORPORATION, NATIONAL ASSOCIATION AND SUBSIDIARIES
Average investment securities decreased $666 million, or 4%, to $18.0 billion, largely due to principal reductions, net of reinvestments. The continued paydown of lower-yielding securities—consistent with the portfolio runoff that began in 2023—has improved the overall asset mix and contributed to a higher net interest margin.
Interest-bearing Liabilities
Average interest-bearing liabilities decreased $2.7 billion, or 5%, from the prior year quarter, as declines in average interest-bearing deposits and average borrowed funds were partially offset by an increase in average long-term debt.
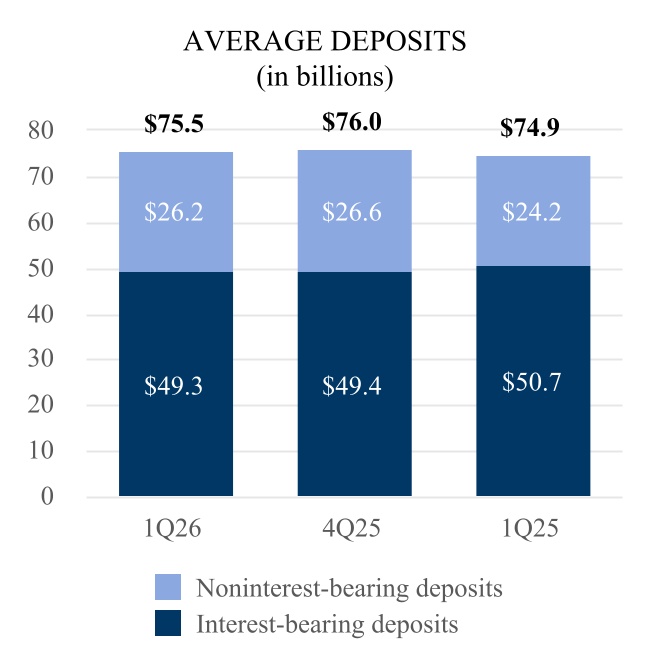
Average deposits increased $540 million, or 1%, to $75.5 billion. Average noninterest-bearing deposits increased $2.0 billion, or 8%, primarily reflecting the migration of a consumer interest-bearing product into a new noninterest-bearing offering. As a result, noninterest-bearing deposits accounted for 35% of total deposits during the quarter, compared with 32% in the same prior year period. This increase was partially offset by a $1.4 billion, or 3%, decline in average interest-bearing deposits, largely driven by lower brokered deposits and the aforementioned product migration.
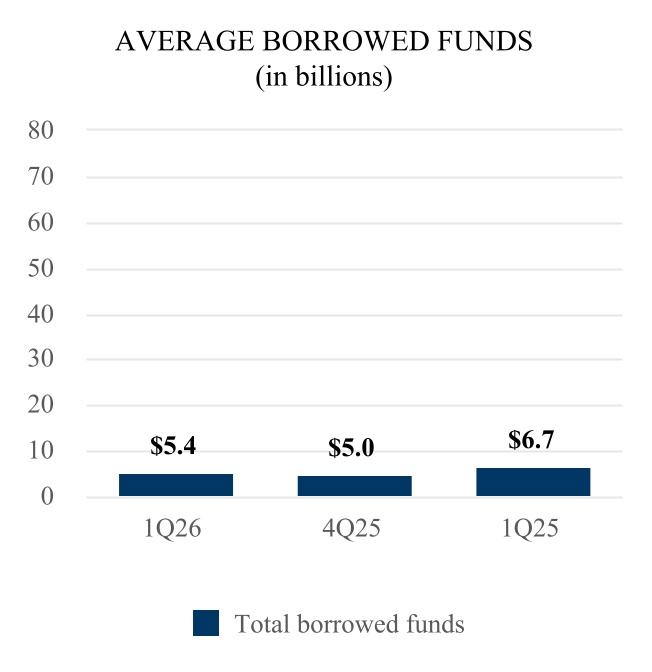
Average borrowed funds decreased $1.3 billion, or 19%, to $5.4 billion. This decline was primarily driven by a $2.1 billion, or 36%, reduction in average short-term borrowings, partially offset by a $798 million, or 84%, increase in average long-term debt. The increase in long-term debt reflected the issuance of $500 million of 4.48% Fixed-to-Floating Senior Notes in February 2026 and $500 million of 4.70% Fixed-to-Floating Senior Notes in August 2025.
For more information regarding our investment securities portfolio and borrowed funds, as well as our approach to managing liquidity risk, refer to the “Investment Securities Portfolio” section on page 16 and the “Liquidity Risk Management” section on page 32. For a further discussion of the impacts of market rates on net interest income and our interest rate risk management practices, see the “Interest Rate and Market Risk Management” section on page 30.
The following schedule summarizes the average balances, the amount of interest earned or paid, and the applicable yields for interest-earning assets and the costs of interest-bearing liabilities:
ZIONS BANCORPORATION, NATIONAL ASSOCIATION AND SUBSIDIARIES
The Allowance and Provision for Credit Losses
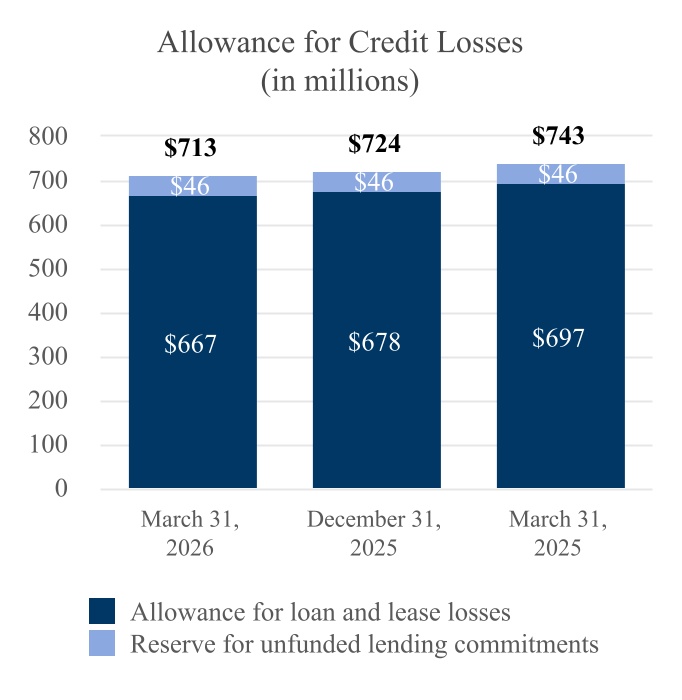
The allowance for credit losses (“ACL”) comprises both the allowance for loan and lease losses (“ALLL”) and the reserve for unfunded lending commitments (“RULC”). The ALLL represents the estimated current expected credit losses related to the loan and lease portfolio as of the balance sheet date. The RULC represents the estimated reserve for current expected credit losses associated with off-balance sheet commitments. Changes in the ALLL and RULC, net of charge-offs and recoveries, are recognized as the provision for loan and lease losses and the provision for unfunded lending commitments, respectively, on the consolidated statement of income. The ACL for debt securities is estimated separately from loans and is included in “Investment securities” on the consolidated balance sheet.
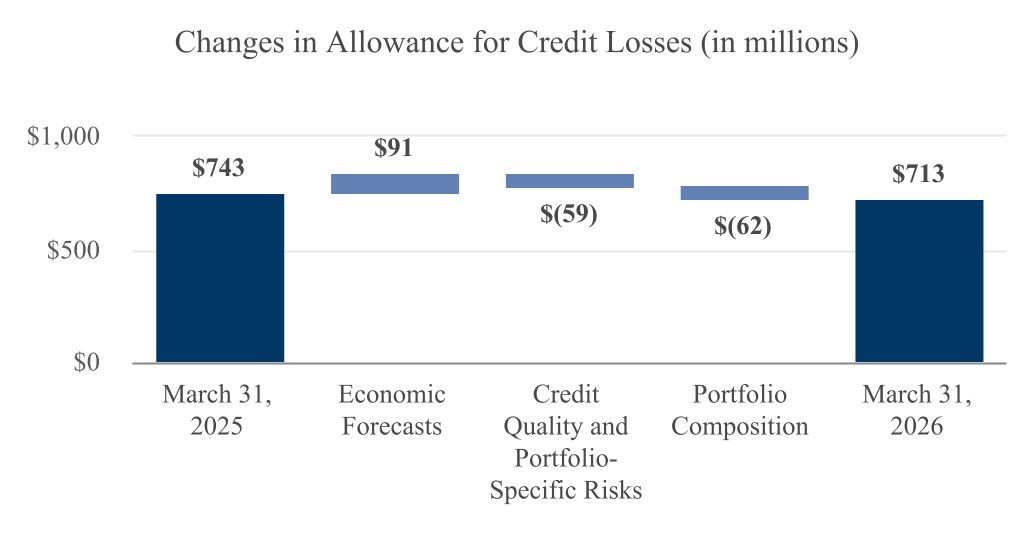
The ACL was $713 million at March 31, 2026, compared with $743 million at March 31, 2025. The year-over-year decrease in the ACL primarily reflects lower reserves associated with CRE portfolio-specific risks and changes in loan portfolio composition, partially offset by more adverse economic forecasts and increased lending activity. The ratio of ACL to total loans and leases was 1.16% at March 31, 2026, compared with 1.24% at March 31, 2025.
The following schedule illustrates the primary drivers of changes in the ACL compared with the prior year period:
ZIONS BANCORPORATION, NATIONAL ASSOCIATION AND SUBSIDIARIES
Our ACL estimate is derived using econometric loss models that incorporate multiple economic scenarios, including optimistic, baseline, and stressed conditions. These scenarios are weighted to determine the overall credit loss estimate, and management may adjust the weightings based on its assessment of current economic conditions and reasonable and supportable forecasts. The schedule above summarizes the key drivers of the year-over-year change in the ACL, reflecting the combined effect of economic forecasts, credit quality trends and portfolio-specific risks, and portfolio composition.
The second bar reflects the impact of changes in economic forecasts and current economic conditions, incorporating management’s judgment in determining the scenario weightings for the current period. These changes resulted in a $91 million increase in the ACL compared with the prior year, primarily driven by the increased weighting assigned to more adverse economic scenarios.
The third bar captures changes in credit quality factors, including risk grade migration, portfolio-specific risks, and specific reserves on loans. Collectively, these factors contributed to a $59 million decrease in the ACL, largely driven by reduced CRE portfolio-specific risks.
The fourth bar represents the effect of changes in the composition of the loan portfolio, including shifts in loan balances and mix, the aging of the portfolio, and other qualitative risk factors. These changes resulted in a $62 million decrease in the ACL, primarily driven by changes in the loan portfolio mix, partially offset by $1.4 billion in period-end loan growth.
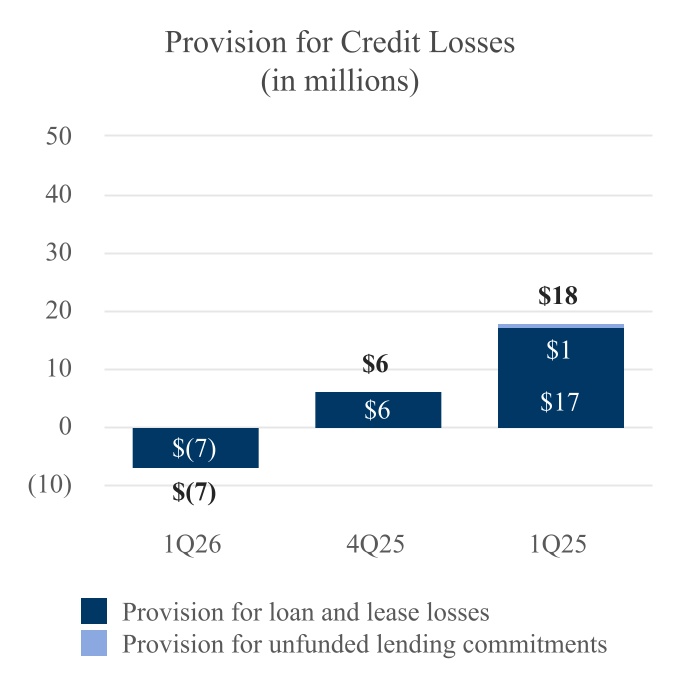
The provision for credit losses, which includes both the provision for loan and lease losses and the provision for unfunded lending commitments, was negative $7 million in the first quarter of 2026, compared with positive $18 million in the first quarter of 2025. The provision for securities losses was less than $1 million during both the first quarters of 2026 and 2025.
For more information regarding the methodology used to determine the appropriate levels of the ALLL and RULC, see “Credit Risk Management” on page 19 and Note 6 in our 2025 Form 10-K.
Noninterest Income
Noninterest income is comprised of revenue generated from products and services that typically do not bear an associated interest rate or yield. It is categorized as either customer-related or noncustomer-related. Customer-related noninterest income excludes items such as securities gains and losses, dividends, and insurance-related income.
Noninterest income accounted for 22% of total net revenue (the sum of net interest income and noninterest income) in both the first quarters of 2026 and 2025. In the first quarter of 2026, noninterest income increased $16 million, or 9%, relative to the same prior year period.
The following schedule presents a comparison of the major components of noninterest income:
ZIONS BANCORPORATION, NATIONAL ASSOCIATION AND SUBSIDIARIES
NONINTEREST INCOME
Three Months Ended March 31,
Amount change
Percent change
(Dollar amounts in millions)
2026
2025
Commercial account fees
$
48
$
45
$
3
7
%
Card fees
22
23
(1)
(4)
Retail and business banking fees
20
17
3
18
Loan-related fees and income
23
17
6
35
Capital markets fees and income
28
27
1
4
Wealth management fees
16
15
1
7
Other customer-related fees
15
14
1
7
Customer-related noninterest income
172
158
14
9
Dividends and other income
12
7
5
71
Securities gains (losses), net
3
6
(3)
(50)
Noncustomer-related noninterest income
15
13
2
15
Total noninterest income
$
187
$
171
$
16
9
Adjusted customer-related noninterest income 1
$
174
$
158
$
16
10
%
1 Net of credit valuation adjustment (“CVA”). For information on non-GAAP financial measures, see page 37.
Customer-related Noninterest Income
Customer-related noninterest income increased $14 million, or 9%, compared with the prior year period, reflecting broad-based growth across multiple revenue streams. The increase was primarily driven by a $6 million increase in loan-related fees and income, largely attributable to higher residential mortgage loan sales activity. Retail and business banking fees increased $3 million, primarily due to an increase in overdraft fee income, while commercial account fees increased $3 million, mainly driven by higher account analysis fees.
Noncustomer-related Noninterest Income
Noncustomer-related noninterest income increased $2 million, or 15%, compared with the prior year period, primarily due to valuation adjustments on servicing rights and gains on the sale of fixed assets. These increases were partially offset by lower securities gains in our Small Business Investment Company (“SBIC”) investment portfolio relative to the prior year quarter.
Noninterest Expense
The following schedule presents a comparison of the major components of noninterest expense:
ZIONS BANCORPORATION, NATIONAL ASSOCIATION AND SUBSIDIARIES
Noninterest expense increased $24 million, or 4%, compared with the prior year quarter. Salaries and employee benefits expense increased $19 million, primarily due to higher incentive compensation accruals reflecting improved profitability, as well as increased base salaries and employee benefits costs. Professional and legal services expense increased $7 million, largely reflecting higher outsourced services. Technology, telecom, and information processing expense increased $4 million, mainly due to higher application software, licensing, and maintenance costs. These increases were partially offset by a $7 million decrease in deposit insurance and regulatory expense, primarily due to higher Federal Deposit Insurance Corporation (“FDIC”) assessments related to increased classified loans in the prior year quarter.
Adjusted noninterest expense increased $25 million, or 5%, primarily due to the same factors previously discussed. The efficiency ratio improved to 65.0% from 66.6% in the prior year quarter, as adjusted taxable-equivalent revenue rose 7.4% and adjusted operating expenses increased 4.7%, resulting in positive operating leverage of 2.7%. For more information regarding non-GAAP financial measures, see page 37.
Technology Spend
We invest in technology initiatives designed to improve our products and services, increase our operational efficiency, and enable us to remain competitive. We report these investments as technology spend, which includes the following:
•Technology, telecom, and information processing expense — includes current period expenses presented on the consolidated statement of income related to application software licensing and maintenance, telecommunications, and data processing, less related amortization and depreciation of capitalized technology investments;
•Other technology-related expense — includes related noncapitalized salaries and employee benefits, occupancy and equipment, and professional and legal services; and
•Technology investments — includes capitalized technology infrastructure equipment, hardware, and software (both purchased and internally developed).
The following schedule presents the composition of our technology spend:
TECHNOLOGY SPEND
Three Months Ended March 31,
Amount change
Percent change
(Dollar amounts in millions)
2026
2025
Technology, telecom, and information processing expense
$
74
$
70
$
4
6
%
Less: related amortization and depreciation
(19)
(19)
—
—
Other technology-related expense
65
60
5
8
Capitalized technology investments
15
12
3
25
Total technology spend
$
135
$
123
$
12
10
Total technology spend increased $12 million, or 10%, compared with the same prior year quarter. The increase was primarily due to higher technology-related expense, driven by increased professional and outsourced services, as well as higher technology, telecom, and information processing expense, largely reflecting previously noted increases in application software, licensing, and maintenance costs. In addition, technology spend increased due to higher capitalized technology investments supporting ongoing lending and customer-focused technology initiatives.
Income Taxes
The following schedule summarizes the income tax expense and effective tax rates for the periods presented:
ZIONS BANCORPORATION, NATIONAL ASSOCIATION AND SUBSIDIARIES
INCOME TAXES
Three Months Ended March 31,
(Dollar amounts in millions)
2026
2025
Income before income taxes
$
294
$
239
Income tax expense
61
69
Effective tax rate
20.7
%
28.9
%
The effective tax rate was 20.7% and 28.9% for the three months ended March 31, 2026 and 2025, respectively. The year-over-year decrease was primarily attributable to new Utah state tax legislation enacted in the first quarter of 2025 related to our investment securities and trading assets, which required a revaluation of our net deferred tax asset (“DTA”)and resulted in additional tax expense in the prior year quarter.
For more information about the factors affecting our effective tax rates, as well as details on deferred income tax assets and liabilities, see Note 11 of the Notes to Consolidated Financial Statements.
BALANCE SHEET ANALYSIS
Investment Securities Portfolio
Investment securities are classified as either available-for-sale (“AFS”) or held-to-maturity (“HTM”), and are primarily used to provide balance sheet liquidity. The portfolio largely consists of securities that can be readily converted to cash or used to generate liquidity through secured borrowing agreements, without the need to sell the securities. Our investment securities portfolio also helps to balance the inherent interest rate mismatch between loans and deposits, thereby helping to preserve the economic value of shareholders’ equity. The estimated deposit duration at March 31, 2026 was assumed to be longer than the loan duration (including swaps). At March 31, 2026, the estimated duration of the investment securities portfolio, which measures price sensitivity to interest rate changes, was 3.7 years, compared with 3.8 years at December 31, 2025, primarily due to revised prepayment assumptions on certain securities.
For more information about our borrowing capacity associated with the investment securities portfolio and our approach to managing liquidity risk, refer to the “Liquidity Risk Management” section on page 32. For more information on fair value measurements and the accounting for our investment securities portfolio, refer to Note 3 and Note 5 of the Notes to Consolidated Financial Statements.
The following schedule presents the major components of our investment securities portfolio:
INVESTMENT SECURITIES PORTFOLIO
March 31, 2026
December 31, 2025
(In millions)
Par Value
Amortized cost
Fair value
Par Value
Amortized cost
Fair value
Available-for-sale
U.S. Treasury securities
$
1,800
$
1,799
$
1,691
$
1,500
$
1,500
$
1,411
U.S. Government agencies and corporations:
Agency securities
298
294
278
317
313
298
Agency guaranteed mortgage-backed securities
7,024
7,017
6,009
7,213
7,207
6,223
Small Business Administration loan-backed securities
ZIONS BANCORPORATION, NATIONAL ASSOCIATION AND SUBSIDIARIES
The amortized cost of total investment securities decreased $149 million, or 1%, from December 31, 2025, primarily due to principal reductions, net of reinvestments. At both March 31, 2026 and December 31, 2025, approximately 6% of the portfolio consisted of floating-rate instruments. At March 31, 2026, we maintained active pay-fixed interest rate swaps with an aggregate notional amount of $4.6 billion that are designated as fair value hedges of fixed-rate AFS securities and effectively convert the fixed interest income on the hedged portion of the securities to a floating rate.
At March 31, 2026, the AFS investment securities portfolio included approximately $71 million in net premium, distributed across various security categories. Taxable-equivalent premium amortization for these investment securities totaled $11 million for the first quarter of 2026, compared with $12 million in the same prior year period.
For more information regarding our investment securities portfolio, swaps, and related unrealized gains and losses, refer to the “Interest Rate Risk Management” section on page 30, the “Capital Management” section on page 34, and Note 5 of the Notes to Consolidated Financial Statements.
Municipal Investments and Extensions of Credit
We support our communities by offering a range of financial products and services to state and local governments (“municipalities”), including deposit services, lending solutions, and investment banking services. Additionally, we invest in securities issued by municipal entities. Our municipal lending portfolio generally includes obligations that are repaid from, or secured by, the general funds or pledged revenues of municipalities, as well as by real estate or equipment. We also extend credit to private commercial and 501(c)(3) not-for-profit organizations that utilize a pass-through municipal structure to benefit from favorable tax treatment.
The following schedule presents our total investments and extensions of credit to municipalities:
MUNICIPAL INVESTMENTS AND EXTENSIONS OF CREDIT
(In millions)
March 31, 2026
December 31, 2025
Loans and leases
$
4,272
$
4,294
Unfunded lending commitments
423
384
Available-for-sale securities
869
909
Held-to-maturity securities
258
271
Trading securities
104
64
Total
$
5,926
$
5,922
Our municipal loans and securities are primarily concentrated within our geographic footprint. At both March 31, 2026 and December 31, 2025, approximately $2 million of municipal loans and leases were classified as nonaccrual. These nonaccrual loans relate to private commercial entities utilizing a pass-through municipal structure.
Municipal securities are internally risk-graded, using methodologies aligned with those applied to loans, with grading frameworks tailored to the size and nature of the credit exposure. These internal risk grades—Pass, Special Mention, and Substandard—are consistent with published regulatory risk classifications. At March 31, 2026, all municipal securities were rated as Pass. For additional information regarding the credit quality of our municipal loans and securities, see Notes 5 and 6 of the Notes to Consolidated Financial Statements.
Loan and Lease Portfolio
We offer a wide range of lending products to commercial customers, primarily small- and medium-sized businesses, as well as other products secured by CRE. Additionally, we provide various retail banking products and services to consumers and small businesses. The following schedule presents the composition of our loan and lease portfolio:
ZIONS BANCORPORATION, NATIONAL ASSOCIATION AND SUBSIDIARIES
LOAN AND LEASE PORTFOLIO
March 31, 2026
December 31, 2025
(Dollar amounts in millions)
Amount
% of total loans
Amount
% of total loans
Commercial:
Commercial and industrial
$
18,263
29.7
%
$
18,111
29.7
%
Owner-occupied
9,323
15.2
9,274
15.2
Municipal
4,272
7.0
4,294
7.1
Total commercial
31,858
51.9
31,679
52.0
Commercial real estate:
Term
11,387
18.6
11,234
18.4
Construction and land development
2,271
3.7
2,162
3.6
Total commercial real estate
13,658
22.3
13,396
22.0
Consumer:
1-4 family residential
10,406
17.0
10,462
17.2
Home equity credit line
3,976
6.5
3,950
6.5
Construction and other consumer real estate
786
1.3
782
1.3
Bankcard and other revolving plans
515
0.8
515
0.8
Other
113
0.2
116
0.2
Total consumer
15,796
25.8
15,825
26.0
Total loans and leases
$
61,312
100.0
%
$
60,900
100.0
%
During the first quarter of 2026, the loan and lease portfolio increased $412 million, or 1%, to $61.3 billion at March 31, 2026. This growth was primarily driven by increases in the term CRE, commercial and industrial, and construction and land development loan portfolios. The ratio of loans and leases to total assets was 70% at March 31, 2026, compared with 68% at December 31, 2025. Commercial and industrial loans continued to represent the largest loan segment, comprising 30% for both periods.
Other Noninterest-Bearing Investments
Other noninterest-bearing investments consist of equity investments held primarily for capital appreciation, dividends, or to meet certain regulatory requirements. The following schedule presents our related investments.
OTHER NONINTEREST-BEARING INVESTMENTS
(Dollar amounts in millions)
March 31, 2026
December 31, 2025
Amount change
Percent change
Bank-owned life insurance
$
576
$
573
$
3
1
%
Federal Home Loan Bank stock
10
100
(90)
(90)
Federal Reserve stock
54
54
—
—
Farmer Mac stock
33
31
2
6
SBIC investments
273
271
2
1
Other
48
47
1
2
Total other noninterest-bearing investments
$
994
$
1,076
$
(82)
(8)
Other noninterest-bearing investments decreased $82 million, or 8%, during the first three months of 2026. The decline was primarily attributable to lower balances of FHLB stock, reflecting a significant reduction in FHLB borrowings. To maintain borrowing capacity, we are required to hold FHLB stock equal to approximately 4-5% of outstanding FHLB borrowings.
Premises, Equipment, and Software
We continue to invest in lending, deposit, and other customer-focused technology initiatives to further modernize our systems, enhance the customer experience, and improve operational efficiency. For additional information regarding related assets, capitalized costs, and their accounting treatment, see “Premises, Equipment, and Software” in MD&A and Note 9 of the Notes to Consolidated Financial Statements in our 2025 Form 10-K.
ZIONS BANCORPORATION, NATIONAL ASSOCIATION AND SUBSIDIARIES
Deposits
Deposits are our primary funding source. The following schedule presents the composition of our deposit portfolio:
DEPOSIT PORTFOLIO
March 31, 2026
December 31, 2025
(Dollar amounts in millions)
Amount
% of total deposits
Amount
% of total deposits
Deposits by type
Noninterest-bearing demand
$
27,081
35.2
%
$
25,823
34.1
%
Interest-bearing:
Savings and money market
40,165
52.3
39,914
52.8
Time
5,866
7.6
6,070
8.0
Brokered
3,795
4.9
3,837
5.1
Total interest-bearing
49,826
64.8
49,821
65.9
Total deposits
$
76,907
100.0
%
$
75,644
100.0
%
Customer deposits (excludes brokered deposits)
$
73,112
$
71,807
Deposit-related metrics
Estimated amount of insured deposits
$
41,889
54
%
$
41,228
55
%
Estimated amount of uninsured deposits
35,018
46
34,416
45
Estimated amount of collateralized deposits 1
2,650
3
3,212
4
Loan-to-deposit ratio
80%
81%
1 Includes both insured and uninsured deposits.
Total deposits increased $1.3 billion, or 2%, from December 31, 2025, driven by higher noninterest-bearing demand deposits. The increase was primarily attributable to seasonal large commercial deposits, complemented by continued growth in more granular depositor balances.
At March 31, 2026, customer deposits, excluding brokered deposits, totaled $73.1 billion, up from $71.8 billion at December 31, 2025. These balances included approximately $6.6 billion and $6.8 billion of reciprocal deposits, respectively.
At March 31, 2026, the total estimated amount of uninsured deposits was $35.0 billion, or 46% of total deposits, compared with $34.4 billion, or 45%, at December 31, 2025. The loan-to-deposit ratio was 80%, compared with 81% for the same periods. For additional information on liquidity, including the ratio of available liquidity to uninsured deposits, see “Liquidity Risk Management” on page 32.
RISK MANAGEMENT
We are exposed to a broad range of risks, including credit risk, interest rate and market risk, liquidity risk, strategic and business risk, operational risk, technology risk, cybersecurity risk, capital/financial reporting risk, legal/compliance risk (including regulatory risk), and reputational risk. Oversight of these risks is conducted through various management committees, with the Enterprise Risk Management Committee serving as the primary coordinating body. To address these risks, we employ comprehensive risk management practices designed to promote prudent risk-taking and effective oversight. Risk management is embedded in our operations and functions as a critical driver of overall performance, closely aligned with our key strategic objectives. For a more comprehensive discussion of these risks, see “Risk Factors” in our 2025 Form 10-K.
Credit Risk Management
Credit risk represents the potential for loss resulting from the failure of a borrower, guarantor, or other obligor to perform in accordance with the terms of a credit-related agreement. This risk arises primarily from our lending activities and from off-balance sheet credit instruments.
ZIONS BANCORPORATION, NATIONAL ASSOCIATION AND SUBSIDIARIES
Our approach to credit risk management is supported by formal credit policies and standards, risk management practices, and independent credit examination functions that together establish a consistent framework for sound underwriting and credit decision-making across our local banking affiliates. We emphasize strong underwriting standards and the early identification of potential problem credits to facilitate timely corrective actions and mitigate potential losses. For a more comprehensive discussion of our credit risk management, see “Credit Risk Management” in our 2025 Form 10-K.
U.S. Government Agency Guaranteed Loans
We participate in several guaranteed lending programs sponsored by United States (“U.S.”) government agencies, including the U.S. Small Business Administration (“SBA”), Federal Housing Authority, U.S. Department of Veterans Affairs, Export-Import Bank of the U.S., and the U.S. Department of Agriculture. At March 31, 2026, approximately $637 million in loans were guaranteed, primarily by the SBA.
The following schedule presents the composition of our U.S. government agency guaranteed loans:
U.S. GOVERNMENT AGENCY GUARANTEED LOANS
March 31, 2026
December 31, 2025
(Dollar amounts in millions)
Amount
Percent guaranteed
Amount
Percent guaranteed
Commercial
$
790
77
%
$
766
77
%
Commercial real estate
33
76
31
71
Consumer
4
100
4
100
Total loans
$
827
77
$
801
77
Commercial Lending
The following schedule presents the composition of our commercial lending portfolio:
COMMERCIAL LENDING PORTFOLIO
March 31, 2026
December 31, 2025
(Dollar amounts in millions)
Amount
% of total commercial loans
Amount
% of total commercial loans
Amount change
Percent change
Commercial:
Commercial and industrial 1
$
18,263
57.3
%
$
18,111
57.2
%
$
152
0.8
%
Owner-occupied
9,323
29.3
9,274
29.3
49
0.5
Municipal
4,272
13.4
4,294
13.5
(22)
(0.5)
Total commercial
$
31,858
100.0
%
$
31,679
100.0
%
$
179
0.6
1 Effective March 31, 2026, balances previously reported as “Leasing” are now included in the “Commercial and industrial” loan segment. Prior period amounts have been reclassified to conform to the current presentation. At March 31, 2026 and December 31, 2025, the leasing portfolio totaled $374 million and $367 million, respectively.
Our commercial loan portfolio spans a broad range of industries and generally carries maturities of one to five years, with amortization schedules determined by the nature of the underlying collateral and guarantees. These loans are typically structured to meet diverse financing needs and may take the form of seasonal, term, working capital, or bridge loans, offered as revolving and non-revolving lines of credit, amortizing term loans, guidance facilities, or single-payment loans. Loan agreements typically include covenants requiring borrowers to provide periodic financial statements, enabling ongoing monitoring of business performance, leverage, debt service coverage, and liquidity.
The underwriting process for commercial loans focuses on a comprehensive evaluation of management quality, financial performance, industry dynamics, sponsorship (where applicable), and transaction structure. Credit enhancements are generally secured through collateral and guarantees from the owners or sponsors. Prospective cash flows are stress-tested under various downside scenarios, including revenue decline, margin compression, and interest rate volatility.
ZIONS BANCORPORATION, NATIONAL ASSOCIATION AND SUBSIDIARIES
The following schedule presents the geographic distribution of our commercial lending portfolio, based on the location of the primary borrower:
COMMERCIAL LENDING BY GEOGRAPHY
March 31, 2026
December 31, 2025
(Dollar amounts in millions)
Amount
% of total
Nonaccrual loans
Amount
% of total
Nonaccrual loans
Commercial:
Arizona
$
2,263
7.1
%
$
6
$
2,338
7.4
%
$
7
California
6,432
20.2
69
6,351
20.0
68
Colorado
1,667
5.2
2
1,710
5.4
4
Nevada
1,439
4.5
2
1,384
4.4
2
Texas
8,110
25.5
27
7,978
25.2
32
Utah/Idaho
6,672
20.9
21
6,479
20.5
23
Washington/Oregon
1,332
4.2
5
1,425
4.5
8
Other 1
3,943
12.4
3
4,014
12.6
2
Total commercial
$
31,858
100.0
%
$
135
$
31,679
100.0
%
$
146
1 No other geography exceeded 2.0% and 2.1% for March 31, 2026 and December 31, 2025, respectively.
The following schedule presents the industry distribution of our commercial lending portfolio, classified based on the North American Industry Classification System:
COMMERCIAL LENDING BY INDUSTRY
March 31, 2026
December 31, 2025
(Dollar amounts in millions)
Amount
% of total
Nonaccrual loans
Amount
% of total
Nonaccrual loans
Real estate, rental, and leasing
$
3,443
10.8
%
$
22
$
3,321
10.5
%
$
32
Retail trade
2,771
8.7
6
2,810
8.9
6
Manufacturing
2,626
8.2
30
2,591
8.2
20
Finance and insurance
2,387
7.5
9
2,306
7.3
10
Healthcare and social assistance
2,334
7.3
8
2,342
7.4
7
Wholesale trade
2,215
7.0
1
1,870
5.9
1
Public administration
1,883
5.9
—
2,226
7.0
—
Hospitality and food services
1,625
5.1
2
1,423
4.5
2
Utilities 1
1,616
5.1
—
1,591
5.0
—
Transportation and warehousing
1,532
4.8
5
1,567
4.9
6
Construction
1,447
4.5
11
1,529
4.8
13
Educational services
1,272
4.0
—
1,187
3.7
—
Other Services (except Public administration)
1,226
3.8
2
1,098
3.5
2
Professional, scientific, and technical services
1,087
3.4
2
1,071
3.4
3
Mining, quarrying, and oil and gas extraction
1,040
3.3
—
1,284
4.1
—
Other 2
3,354
10.6
37
3,463
10.9
44
Total
$
31,858
100.0
%
$
135
$
31,679
100.0
%
$
146
1 Includes primarily utilities, power, and renewable energy.
2 No other industry group exceeded 3.0% and 3.2% for March 31, 2026 and December 31, 2025, respectively.
As previously noted, our commercial lending portfolio is well-diversified across both geographic regions and industry sectors. In light of increased investor interest in loans extended to nondepository financial institutions (“NDFIs”), we provide the following information regarding these exposures within our commercial lending portfolio.
ZIONS BANCORPORATION, NATIONAL ASSOCIATION AND SUBSIDIARIES
Loans to Nondepository Financial Institutions (NDFIs)
NDFIs encompass a broad range of financial entities that provide services similar to traditional banking institutions but do not accept public deposits and are generally not subject to federal banking regulation. We provide financing to NDFIs and actively manage these exposures through borrower-level concentration limits, portfolio stress testing, compliance monitoring, and ongoing assessments of portfolio quality, liquidity, and capital adequacy.
Our NDFI portfolio is diversified across various lending segments and asset classes, including:
•Mortgage credit intermediaries — Loans to mortgage companies engaged in residential or commercial mortgage origination and servicing; special purpose entities supporting mortgage-related securitization activities, such as real estate investment trusts (“REITs”) and collateralized debt obligations.
•Business credit intermediaries — Loans to finance companies, direct lenders, private debt funds, equipment leasing companies, business development companies (“BDCs”), SBICs, senior loan funds, and other nonbank business lenders.
•Private equity funds — Capital call commitment and subscription-based facilities extended to private equity, venture capital, and other general partnership funds.
•Consumer credit intermediaries — Loans to nonbank consumer secured and unsecured lending platforms, as well as special purposes entities, finance companies, direct lenders, private debt funds, equipment leasing companies, or other financial intermediaries whose underlying assets primarily consist of consumer loans.
•Other — Loans to insurance companies, investment banks, broker-dealers, publicly listed investment funds, hedge funds, family offices, and other investment firms and financial vehicles.
At March 31, 2026, loans to NDFIs totaled approximately $2.0 billion, representing 6.4% of total commercial loans and 3.3% of total loans. At December 31, 2025, loans to NDFIs were also $2.0 billion and represented 6.3% of total commercial loans and 3.3% of total loans.
The following schedule presents the composition of our NDFI lending portfolio:
NDFI LENDING PORTFOLIO
March 31, 2026
December 31, 2025
(Dollar amounts in millions)
Amount
% of total
Nonaccrual loans
Amount
% of total
Nonaccrual loans
Mortgage credit intermediaries
$
330
16.2
%
$
9
$
352
17.6
%
$
9
Business credit intermediaries
974
47.9
1
968
48.5
—
Private equity funds
124
6.1
—
121
6.1
—
Consumer credit intermediaries
316
15.5
—
303
15.2
—
Other financial institutions
290
14.3
—
253
12.7
$
1
Total NDFI portfolio
$
2,034
100.0
%
$
10
$
1,997
100.0
%
$
10
The following schedule presents NDFI credit quality metrics:
NDFI CREDIT QUALITY
(Dollar amounts in millions)
March 31, 2026
December 31, 2025
Credit quality metrics
Criticized loan ratio
0.7
%
0.8
%
Classified loan ratio
0.7
%
0.8
%
Nonaccrual loan ratio
0.5
%
0.5
%
Delinquency ratio
0.7
%
—
%
Annualized ratio of NDFI net charge-offs 1 (recoveries) to average loans
—
%
2.7
%
Ratio of allowance for credit losses to NDFI loans, at period end
1.40
%
1.03
%
1 Total NDFI net charge-offs for December 31, 2025 included a $50 million charge-off associated with revolving lines of credit extended to two related commercial borrowers to finance the origination and purchase of commercial and residential mortgages.
ZIONS BANCORPORATION, NATIONAL ASSOCIATION AND SUBSIDIARIES
Commercial Real Estate Lending
The following schedule presents the composition of our CRE lending portfolio:
COMMERCIAL REAL ESTATE LENDING PORTFOLIO
March 31, 2026
December 31, 2025
(Dollar amounts in millions)
Amount
% of total CRE loans
Amount
% of total CRE loans
Amount change
Percent change
Commercial real estate:
Term
$
11,387
83.4
%
$
11,234
83.9
%
$
153
1.4
%
Construction and land development
2,271
16.6
2,162
16.1
109
5.0
Total commercial real estate
$
13,658
100.0
%
$
13,396
100.0
%
$
262
2.0
Term CRE loans typically have maturities ranging from three to seven years and may incorporate full, partial, or non-recourse guarantee structures. Standard term CRE loan arrangements generally include annually tested operating covenants, requiring loan rebalancing based on minimum debt service coverage, debt yield, or loan-to-value (“LTV”) ratios.
Construction and land development loans generally mature within 18 to 36 months and may involve full or partial recourse guarantees. These loans often include one- to five-year extension options or roll-to-permanent features, which commonly convert into term loans upon completion.
Underwriting for commercial properties primarily emphasizes the economic viability of the project, while also giving considerable weight to the sponsor's creditworthiness and experience. Owners are generally required to contribute their equity prior to any loan advances. Loan agreements frequently include remargining provisions—requiring additional equity infusions if the collateral's value or cash flow declines—as well as sponsor guarantees.
At March 31, 2026, the weighted average LTV ratio for our term CRE portfolio was below 60%. For CRE loans, LTV is calculated as the loan amount divided by the most recent appraised value of the underlying collateral. For a more comprehensive discussion of our CRE loan portfolio, see “Commercial Real Estate Loans” in our 2025 Form 10-K. The following schedule presents the geographic distribution of our commercial real estate lending portfolio, based on the location of the primary collateral:
COMMERCIAL REAL ESTATE LENDING BY GEOGRAPHY
March 31, 2026
December 31, 2025
(Dollar amounts in millions)
Amount
% of total
Nonaccrual loans
Amount
% of total
Nonaccrual loans
Commercial real estate:
Arizona
$
1,771
13.0
%
$
—
$
1,709
12.8
%
$
—
California
3,363
24.6
21
3,549
26.5
22
Colorado
787
5.8
16
726
5.4
16
Nevada
1,031
7.5
—
1,016
7.6
—
Texas
2,702
19.8
4
2,566
19.2
5
Utah/Idaho
2,458
18.0
—
2,376
17.7
—
Washington/Oregon
1,210
8.9
1
1,122
8.4
30
Other
336
2.4
—
332
2.4
—
Total commercial real estate
$
13,658
100.0
%
$
42
$
13,396
100.0
%
$
73
The following schedule presents our commercial real estate lending portfolio by the type of collateral:
ZIONS BANCORPORATION, NATIONAL ASSOCIATION AND SUBSIDIARIES
COMMERCIAL REAL ESTATE LENDING BY COLLATERAL TYPE
March 31, 2026
December 31, 2025
(Dollar amounts in millions)
Amount
% of total
Nonaccrual loans
Amount
% of total
Nonaccrual loans
Commercial property
Multifamily
$
4,091
30.0
%
$
—
$
3,994
29.8
%
$
—
Industrial
3,100
22.7
—
3,045
22.7
—
Retail
1,647
12.1
—
1,586
11.8
—
Office
1,595
11.7
37
1,675
12.5
67
Hospitality
673
4.9
4
678
5.1
5
Land
299
2.2
—
286
2.1
—
Other 1
1,470
10.7
1
1,436
10.8
—
Residential property 2
Single family
430
3.2
—
398
3.0
1
Land
115
0.8
—
111
0.8
—
Condo/Townhome
33
0.2
—
29
0.2
—
Other 1
205
1.5
—
158
1.2
—
Total
$
13,658
100.0
%
$
42
$
13,396
100.0
%
$
73
1 Included in the total amount of the “Other” commercial and residential categories was approximately $294 million and $232 million of unsecured loans at March 31, 2026 and December 31, 2025, respectively.
2 Residential property consists primarily of loans provided to commercial homebuilders for land, lot, and single-family housing developments.
As previously noted, our CRE lending portfolio is diversified by both geography and collateral type, with the largest concentration in multifamily properties. In light of continued investor interest in multifamily, industrial, and office collateral types, we provide additional analysis of these segments within our CRE portfolio below. Across CRE loan portfolios with near-term maturities, we generally expect that substantially all borrowers to successfully refinance at maturity—either with the Bank or other lenders—supported by strong property cash flows, appropriate LTVs, sufficient borrower equity, and guarantor support.
Multifamily CRE
At March 31, 2026 and December 31, 2025, our multifamily CRE loan portfolio totaled $4.1 billion and $4.0 billion, respectively, representing 30% of the total CRE loan portfolio at each period end. Approximately 46% of the multifamily CRE loan portfolio is scheduled to mature within the next 12 months.
During the first quarter of 2026, we entered into an agreement to acquire the agency lending business of Basis Multifamily Finance I, LLC that will expand our ability to deliver permanent financing solutions to multifamily housing clients through our enhanced capabilities as an originator, underwriter, and servicer of government-sponsored agency loans. For more information, see “Executive Summary” on page 6.
The following schedule presents the composition of our multifamily CRE loan portfolio, along with related credit quality metrics:
ZIONS BANCORPORATION, NATIONAL ASSOCIATION AND SUBSIDIARIES
MULTIFAMILY CRE LOAN PORTFOLIO
(Dollar amounts in millions)
March 31, 2026
December 31, 2025
Multifamily CRE
Term
$
3,305
$
3,203
Construction and land development
786
791
Total multifamily CRE
$
4,091
$
3,994
Credit quality metrics
Criticized loan ratio
16.6
%
17.5
%
Classified loan ratio
13.6
%
15.0
%
Nonaccrual loan ratio
—
%
—
%
Delinquency ratio
—
%
—
%
Annualized ratio of multifamily CRE net charge-offs (recoveries) to average loans
—
%
—
%
Ratio of allowance for credit losses to multifamily CRE loans, at period end
1.42
%
1.50
%
Weighted average LTV for multifamily term CRE loans
60
%
59
%
Industrial CRE
At March 31, 2026 and December 31, 2025, our industrial CRE loan portfolio totaled $3.1 billion and $3.0 billion, respectively, representing 23% of the total CRE loan portfolio at each period end. Approximately 35% of the industrial CRE loan portfolio is scheduled to mature within the next 12 months.
The following schedule presents the composition of our industrial CRE loan portfolio and other related credit quality metrics:
INDUSTRIAL CRE LOAN PORTFOLIO
(Dollar amounts in millions)
March 31, 2026
December 31, 2025
Industrial CRE
Term
$
2,743
$
2,720
Construction and land development
357
325
Total industrial CRE
$
3,100
$
3,045
Credit quality metrics
Criticized loan ratio
11.7
%
11.3
%
Classified loan ratio
8.8
%
10.3
%
Nonaccrual loan ratio
—
%
—
%
Delinquency ratio
0.1
%
—
%
Annualized ratio of industrial CRE net charge-offs (recoveries) to average loans
—
%
—
%
Ratio of allowance for credit losses to industrial CRE loans, at period end
1.14
%
1.48
%
Weighted average LTV for industrial term CRE loans
64
%
63
%
Office CRE
At March 31, 2026 and December 31, 2025, our office CRE loan portfolio totaled $1.6 billion and $1.7 billion, respectively, representing 12% and 13% of the total CRE loan portfolio. Approximately 31% of the office CRE loan portfolio is scheduled to mature within the next 12 months.
The following schedule presents the composition of our office CRE loan portfolio and other related credit quality metrics:
ZIONS BANCORPORATION, NATIONAL ASSOCIATION AND SUBSIDIARIES
1-4 Family Residential Mortgages
We originate first-lien residential home mortgage loans considered to be of prime quality. At March 31, 2026, our 1-4 family residential mortgage loan portfolio totaled $10.4 billion, representing 66% of our total consumer loan portfolio, compared with $10.5 billion, or 66%, at December 31, 2025.
At both March 31, 2026 and December 31, 2025, approximately 90% of the portfolio consisted of variable-rate loans. During the first quarter of 2026, we sold $519 million of fixed- and variable-rate residential mortgage loans to third parties. In connection with these sales, we provided customary representations and warranties that the loans met specified underwriting standards and collateral documentation requirements.
Home Equity Credit Lines
We also originate home equity credit lines (“HECLs”). The HECL portfolio totaled $4.0 billion at both March 31, 2026 and December 31, 2025, with approximately 34% of the portfolio secured by first lien positions during each period. There were no material changes in credit quality, underwriting standards, portfolio composition, or risk characteristics of the HECL portfolio since December 31, 2025.
For additional information regarding our HECL portfolio, including underwriting standards, collateral characteristics, and credit quality, see “Home Equity Credit Lines” in our 2025 Form 10-K and Note 6 of the Notes to Consolidated Financial Statements.
Credit Quality
We monitor credit quality by assessing multiple factors, including nonperforming status, internal risk grades, and net charge-offs. These metrics are integral to our overall evaluation of the adequacy of the ACL. For more information on these factors and the ACL, see Note 6 of the Notes to Consolidated Financial Statements.
Nonperforming Assets
Nonperforming assets include nonaccrual loans and other real estate owned (“OREO”), or foreclosed properties. The following schedule presents the composition of our nonperforming assets:
NONPERFORMING ASSETS
(Dollar amounts in millions)
March 31, 2026
December 31, 2025
Nonaccrual loans 1
$
279
$
315
Other real estate owned 2
13
5
Total nonperforming assets
$
292
$
320
Ratio of nonperforming assets to net loans and leases1 and other real estate owned 2
0.48
%
0.52
%
Accruing loans past due 90 days or more
$
3
$
5
Ratio of accruing loans past due 90 days or more to loans and leases 1
—
%
0.01
%
Nonaccrual loans1 and accruing loans past due 90 days or more
$
282
$
320
Ratio of nonperforming assets1 and accruing loans past due 90 days or more to loans and leases1 and other real estate owned 2
0.48
%
0.53
%
Accruing loans past due 30-89 days
$
82
$
96
Classified loans
$
2,332
$
2,380
Ratio of classified loans to total loans and leases
3.80
%
3.91
%
Ratio of nonaccrual loans1 current as to principal and interest payments
54.5
%
56.8
%
1 Includes loans held for sale.
2 Does not include banking premises held for sale.
Nonperforming assets totaled $292 million, or 0.48% of total loans and leases and other real estate owned at March 31, 2026, compared with $320 million, or 0.52%, at December 31, 2025. Nonperforming assets decreased primarily within the term CRE loan portfolio. For more information about nonaccrual loans, see Note 6 of the Notes to Consolidated Financial Statements.
ZIONS BANCORPORATION, NATIONAL ASSOCIATION AND SUBSIDIARIES
Classified Loans
Classified loans are considered loans with well-defined weaknesses and are assigned using our internal risk grade definitions of substandard and doubtful, which are consistent with regulatory risk classifications. The following schedule presents our classified loans by loan segment:
CLASSIFIED LOANS
(Dollar amounts in millions)
March 31, 2026
December 31, 2025
Commercial
$
1,110
$
1,063
Commercial real estate
1,106
1,205
Consumer
116
112
Total classified loans
$
2,332
$
2,380
Ratio of classified loans to total loans and leases
3.80
%
3.91
%
Classified loans totaled $2.3 billion, or 3.80% of total loans and leases, at March 31, 2026, compared with $2.4 billion, or 3.91%, at December 31, 2025. The decline was primarily driven by reductions in classified CRE exposures, largely attributable to loan payoffs. The loss content of our CRE loan portfolio continues to be mitigated by strong underwriting, supported by significant borrower equity and guarantor support. As a result, our CRE nonperforming assets and net charge-offs have remained relatively low.
Allowance for Credit Losses
The ACL comprises both the ALLL and the RULC and represents our estimate of current expected credit losses related to the loan and lease portfolio and unfunded lending commitments as of the balance sheet date.
We estimate current expected credit losses using econometric loss models that incorporate historical credit loss experience, prevailing economic conditions, and multiple forward-looking economic scenarios. These scenarios—including optimistic, baseline, and stressed conditions—are weighted to produce the quantitative component of the ACL, and management may adjust the weightings based on its assessment of current economic conditions and reasonable and supportable forecasts. Because economic forecasts may not always align with observed credit quality trends, changes in the ACL may not necessarily correspond directionally with changes in credit quality.
Additionally, we consider qualitative and environmental factors that may indicate actual losses could differ from amounts estimated by the quantitative models. The influence of these factors on the ACL may vary from quarter to quarter.
During the first three months of 2026, the qualitative portion of the ACL decreased mainly due to loss model enhancements and lower qualitative reserves in the CRE portfolio, partially offset by increased weighting of recessionary economic scenarios.
For additional information on the ACL and credit trends by portfolio segment, see “The Allowance and Provision for Credit Losses” section on page 12 and Note 6 of the Notes to Consolidated Financial Statements.
ZIONS BANCORPORATION, NATIONAL ASSOCIATION AND SUBSIDIARIES
Interest Rate and Market Risk Management
Interest rate and market risk refer to the potential for adverse impacts on current or future earnings and capital arising from changes in interest rates and other market conditions. Given our involvement in transactions with a broad range of financial instruments, we are inherently exposed to these risks. For more information on our approach to managing interest rate and market risk, see “Interest Rate and Market Risk Management” in our 2025 Form 10-K.
We actively manage our exposure to interest rate fluctuations by positioning the balance sheet to reduce volatility in both net interest income and the economic value of equity (“EVE”). Given that a significant portion of our balance sheet funding is derived from non-maturity deposit products, we rely on behavioral models and assumptions to forecast the sensitivity of earnings to interest rate movements. These models and assumptions are subject to ongoing performance monitoring and refinement.
When observed deposit behavior diverges from model expectations, the models are updated accordingly, with greater emphasis placed on recently observed behavior. All model changes are independently reviewed by our Model Risk Management function.
Our deposit-behavior models incorporate assumptions about the correlation between the rates paid on interest-bearing deposits and fluctuations in average benchmark interest rates. This is commonly referred to as “deposit beta.” Certificates of deposit are typically modeled with a higher degree of correlation, whereas interest-bearing checking accounts are assumed to exhibit a lower sensitivity to rate changes.
Many consumer and business deposit accounts have historically demonstrated stability and limited sensitivity to rate changes, resulting in a longer duration relative to our loan portfolio. As a result, our balance sheet has typically been “asset-sensitive,” meaning that assets are expected to reprice more quickly or more significantly than our liabilities. Measures of asset sensitivity are particularly influenced by changes in deposit modeling assumptions.
To manage interest rate risk, we regularly employ a combination of interest rate derivatives, investments in fixed-rate securities, and funding strategies. Collectively, these tools help moderate the expected sensitivity of net interest income and EVE to changes in interest rates.
The following schedule presents deposit duration assumptions discussed previously:
DEPOSIT ASSUMPTIONS
March 31, 2026
December 31, 2025
Product
Effective duration (-200 bps)
Effective duration (unchanged)
Effective duration (+200 bps)
Effective duration (-200 bps)
Effective duration (unchanged)
Effective duration (+200 bps)
Demand deposits
4.8%
4.1%
3.6%
4.9%
4.2%
3.7%
Money market
1.9%
1.6%
1.4%
1.9%
1.5%
1.3%
Savings and interest-bearing checking
2.2%
1.8%
1.6%
2.2%
1.8%
1.6%
As previously discussed, we utilize derivative instruments to manage interest rate risk. The following schedule presents derivatives designated in qualifying hedging relationships, as well as certain derivatives used as economic hedges that are not designated as accounting hedges, at March 31, 2026. It includes the average outstanding derivative notional amounts for each reporting period presented and the weighted-average fixed rates paid or received across cash flow and fair value hedge categories. For more information regarding our hedge accounting strategies and the impact of these hedging relationships on interest income and expense, see Note 4 of the Notes to Consolidated Financial Statements.
ZIONS BANCORPORATION, NATIONAL ASSOCIATION AND SUBSIDIARIES
DERIVATIVES DESIGNATED IN QUALIFYING HEDGING RELATIONSHIPS AND CERTAIN ECONOMIC HEDGES
2026
2027
2028
2Q28 - 1Q29
2Q29 - 1Q30
(Dollar amounts in millions)
Second Quarter
Third Quarter
Fourth Quarter
First Quarter
Second Quarter
Third Quarter
Fourth Quarter
First Quarter
Cash flow hedges
Cash flow hedges of assets 1
Average outstanding notional 2
$
8,283
$
7,650
$
7,780
$
7,429
$
6,192
$
4,541
$
2,388
$
334
$
246
$
59
Weighted-average fixed-rate received
3.51
%
3.39
%
3.39
%
3.39
%
3.40
%
3.38
%
3.38
%
3.84
%
3.82
%
3.76
%
2026
2027
2028
2029
2030
2031
2032
2033
2034
2035
Fair value hedges
Fair value hedges of debt 3
Average outstanding notional
$
1,447
$
1,314
$
553
$
500
$
500
$
500
$
500
$
500
$
441
$
—
Weighted-average fixed-rate received
4.37
%
4.33
%
3.99
%
3.93
%
3.93
%
3.93
%
3.93
%
3.93
%
3.93
%
—
%
Fair value hedges of assets 4
Average outstanding notional 2
$
5,546
$
5,533
$
5,047
$
3,850
$
2,675
$
2,243
$
2,077
$
1,770
$
1,484
$
990
Weighted-average fixed-rate paid
3.34
%
3.34
%
3.29
%
3.17
%
3.03
%
2.94
%
2.91
%
2.81
%
2.84
%
2.46
%
1 Cash flow hedges of assets consist of receive-fixed interest rate swaps and purchased three-month SOFR futures that are used to hedge pools of floating-rate loans.
2 Notional amounts for forward-starting derivatives are excluded until the trades become effective.
3 Fair value hedges of debt consist of receive-fixed swaps that hedge fixed-rate subordinated and senior notes.
4 Fair value hedges of assets consist of pay-fixed swaps that hedge fixed-rate AFS securities and fixed-rate commercial loans.
At March 31, 2026, we had $27 million of net losses deferred in accumulated other comprehensive income (“AOCI”) related to terminated cash flow hedges. These deferred amounts are amortized into interest income on a straight-line basis over the original maturity periods of the respective hedges, provided the forecasted transactions are expected to occur. For more information regarding amounts deferred in AOCI from terminated cash flow hedges, see “Interest Rate and Market Risk Management” in our 2025 Form 10-K.
Earnings at Risk (EaR) and Economic Value of Equity (EVE)
Incorporating deposit assumptions, the effects of derivatives designated in qualifying hedging relationships, and certain short-dated economic hedges, the following schedule presents our earnings at risk (“EaR”) and estimated changes in EVE. EaR represents the percentage change in projected 12-month net interest income. Both EaR and EVE are based on a static balance sheet and reflect instantaneous, parallel shifts in interest rates ranging from -200 to +200 bps. These measures are intended to illustrate the sensitivity of net interest income and equity value to changes in interest rates across a range of scenarios and should not be interpreted as forecasts of expected net interest income.
INCOME SIMULATION – CHANGE IN NET INTEREST INCOME AND CHANGE IN ECONOMIC VALUE OF EQUITY
March 31, 2026
December 31, 2025
Parallel shift in rates (in bps) 1
Parallel shift in rates (in bps)
Repricing scenario
-200
-100
0
+100
+200
-200
-100
0
+100
+200
Earnings at Risk
(EaR)
(7.2)
%
(3.7)
%
—
%
3.7
%
7.4
%
(7.8)
%
(4.0)
%
—
%
4.0
%
7.9
%
Economic Value of Equity
(EVE)
(2.3)
%
(0.8)
%
—
%
(0.1)
%
(0.8)
%
(1.5)
%
(0.3)
%
—
%
(0.5)
%
(1.4)
%
1 Assumes rates do not decline below zero in the negative rate shifts.
ZIONS BANCORPORATION, NATIONAL ASSOCIATION AND SUBSIDIARIES
Asset sensitivity, as measured by EaR, decreased during the first three months of 2026, primarily due to increased hedging activity, partially offset by shifts in funding mix. Based on current deposit assumptions, interest rate risk remained within established policy limits. For interest-bearing deposits with indeterminable maturities, the weighted average modeled beta was 48%.
Prepayment assumptions are a key factor in the management of interest rate risk. Certain assets within our portfolio, including 1-4 family residential mortgages and mortgage-backed securities, are subject to borrower-driven prepayments that can significantly affect projected cash flows. At March 31, 2026 and December 31, 2025, estimated lifetime prepayment speeds for loans were 15.3% and 14.8%, respectively, reflecting the aging of the portfolio, as loans become more seasoned and borrowers are more likely to refinance or repay their loans early over time. Estimated prepayment speeds for mortgage-backed securities were 7.0% for both periods.
Our EaR analysis primarily evaluates the impact of parallel rate shocks across the term structure of benchmark interest rates. Additionally, we perform non-parallel rate shock scenarios to identify potential risks not captured under parallel rate assumptions. In these scenarios, the most significant effects on EaR typically result from movements in short-term interest rates.
Our strategic focus on business banking is a key component of our asset-liability management approach. At March 31, 2026, $30.2 billion of commercial and CRE loans were scheduled to reprice within the subsequent six months. To manage the interest rate risk associated with these variable-rate exposures, we maintained $8.3 billion in aggregate notional of active interest rate derivatives, including swaps and certain short-dated interest rate futures designated as cash flow hedges. In addition, $4.7 billion of variable-rate consumer loans were also scheduled to reprice during the same period. For further information on derivative instruments, see Notes 3 and 4 of the Notes to Consolidated Financial Statements.
Fixed Income
We are subject to market risk arising from fluctuations in the fair value of financial instruments, including trading securities and interest rate swaps used to hedge interest rate exposure. Our underwriting activities include municipal and corporate securities, and we actively trade in municipal, agency, and U.S. Treasury securities. These activities expose us to potential losses resulting from adverse price movements in fixed-income markets. Changes in the fair value of AFS securities and interest rate swaps that qualify as cash flow hedges are recognized in AOCI each reporting period. For additional information on investment securities and AOCI, refer to the “Capital Management” section on page 34. For more information on the accounting treatment of investment securities, see Note 5 of the Notes to Consolidated Financial Statements.
Equity Investments
Through our equity investment activities, we hold both publicly traded equity securities and non-marketable equity securities in governmental entities and institutions, such as the Federal Reserve Board (“FRB”) and the FHLB. For more information regarding our equity investments, see “Interest Rate and Market Risk Management” in our 2025 Form 10-K.
We hold investments primarily in pre-public companies, largely through a variety of SBIC funds. This investment strategy is intended to support the financing, growth, and expansion of diverse businesses, generally within our geographic footprint. At March 31, 2026 and December 31, 2025, our equity exposure to these investments totaled approximately $273 million and $271 million, respectively.
Occasionally, companies within our SBIC portfolio may complete an initial public offering (“IPO”), which introduces additional market risk due to post-IPO lock-up restrictions. For more information regarding the valuation of our SBIC investments, see Note 3 of the Notes to Consolidated Financial Statements.
Liquidity Risk Management
Liquidity represents our ability to meet cash, contractual, and collateral obligations while effectively managing both anticipated and unanticipated cash flow needs without adversely affecting our operations or financial condition. We
ZIONS BANCORPORATION, NATIONAL ASSOCIATION AND SUBSIDIARIES
manage liquidity to provide sufficient funding for customer credit requirements, financial and contractual commitments, and other corporate activities. Our primary sources of contingent liquidity include secured borrowings through repurchase agreements backed by investment securities, as well as other collateral prepositioned with the FHLB and the FRB. In addition, we maintain the capacity to issue brokered certificates of deposit and unsecured debt. For more information regarding our approach to managing liquidity risk, see “Liquidity Risk Management” in our 2025 Form 10-K.
For the first three months of 2026, the primary sources of cash were increased deposits, a reduction in money market investments, proceeds from the issuance of long-term debt, and net cash provided by operating activities. The primary uses of cash during the same period included a reduction in short-term borrowings, increased loans and leases, common stock repurchases, and dividends paid on common and preferred stock. Cash payments for interest, reflected in operating expenses, totaled $333 million and $423 million for the first three months of 2026 and 2025, respectively.
The FHLB and FRB continue to serve as important sources of contingent liquidity and funding. As a member of the FHLB of Des Moines, we have the ability to borrow against eligible loans and securities to support liquidity and funding needs. To maintain this borrowing capacity, we are required to hold investments in both FHLB and FRB stock. At March 31, 2026, our total investment in FHLB and FRB stock totaled $10 million and $54 million, respectively, compared with $100 million and $54 million, respectively, at December 31, 2025. The decline in FHLB stock holdings was due to a significant reduction in FHLB borrowings.
At March 31, 2026, loans with a carrying value of $25.1 billion and $18.3 billion were pledged at the FHLB and FRB, respectively, as collateral for current and potential borrowings, compared with $25.2 billion and $18.0 billion at December 31, 2025.
At March 31, 2026 and December 31, 2025, investment securities with carrying values of $17.2 billion and $17.5 billion, respectively, were pledged as collateral to support potential borrowings. These pledged securities included:
•$8.5 billion and $7.9 billion, respectively, designated for available use through the Fixed Income Clearing Corporation's General Collateral Finance (“GCF”) program and other repo programs;
•$4.4 billion and $4.5 billion, respectively, pledged to the FRB and FHLB in total; and
•$4.3 billion and $5.1 billion, respectively, pledged to secure public and trust deposits, advances, and other collateralized obligations.
A significant portion of these pledged assets is unencumbered, but remains pledged to provide immediate access to contingency funding sources. The following schedule presents our total available liquidity, including unused collateralized borrowing capacity:
AVAILABLE LIQUIDITY
March 31, 2026
December 31, 2025
(Dollar amounts in billions)
FHLB
FRB 1
GCF 2
Total
FHLB
FRB 1
GCF 2
Total
Total borrowing capacity
$
17.4
$
18.6
$
8.5
$
44.5
$
17.4
$
18.4
$
8.0
$
43.8
Borrowings outstanding
—
—
—
—
2.0
—
0.1
2.1
Remaining capacity, at period end
$
17.4
$
18.6
$
8.5
$
44.5
$
15.4
$
18.4
$
7.9
$
41.7
Cash and due from banks
$
0.7
$
0.7
Interest-bearing deposits 3
1.7
2.2
Total available liquidity
$
46.9
$
44.6
Ratio of available liquidity to uninsured deposits
134%
130%
1 Represents borrowing capacity and borrowings outstanding at the Federal Reserve Bank discount window.
2 Includes $778 million and $3.1 billion pledged for available use through other repo programs for the periods presented.
3 Represents funds deposited by the Bank primarily at the Federal Reserve Bank.
ZIONS BANCORPORATION, NATIONAL ASSOCIATION AND SUBSIDIARIES
At March 31, 2026, our total available liquidity was $46.9 billion, compared with $44.6 billion at December 31, 2025. At March 31, 2026, our sources of liquidity exceeded the estimated amount of uninsured deposits of $35.0 billion without the need to sell any investment securities.
Credit Ratings
General financial market and economic conditions affect our access to, and the cost of, external financing. Our ability to access funding markets is also directly influenced by the credit ratings assigned to us by various rating agencies. These ratings not only impact the costs associated with borrowings, but also influence the sources from which we can borrow. All credit rating agencies currently rate our debt at an investment-grade level.
The following schedule presents our credit ratings:
CREDIT RATINGS
as of April 30, 2026:
Rating agency
Outlook
Long-term issuer/senior debt rating
Subordinated debt rating
Short-term debt rating
Kroll
Stable
A-
BBB+
K2
S&P
Stable
BBB+
BBB
NR
Fitch
Stable
BBB+
BBB
F2
Moody's
Stable
Baa2
NR
P2
We may periodically issue or redeem preferred stock, senior or subordinated notes, or other capital or debt instruments based on our capital requirements, funding needs, asset-liability management objectives, and prevailing market conditions. Certain issuances may be subject to regulatory approval. In February 2026, we issued $500 million of 4.48% Fixed-to-Floating Senior Notes. In August 2025, we issued $500 million of 4.70% Fixed-to-Floating Senior Notes.
For additional information regarding our capital actions, see “Capital Management” below and in our 2025 Form 10-K.
Capital Management
We believe that maintaining a strong capital position is critical to achieving our key strategic objectives, sustaining long-term profitability, and reinforcing confidence among depositors, creditors, and investors. We focus on: (1) maintaining sufficient capital to support the current needs and growth of our businesses, aligned with our assessment of their potential to deliver shareholder value, and (2) meeting our obligations to depositors and bondholders while prudently managing capital distributions to shareholders through dividends and common stock repurchases.
We utilize stress testing as an important tool to inform our decisions on the appropriate level of capital to maintain, based on hypothetically stressed economic conditions, including the FRB’s supervisory severely adverse scenario. The timing and magnitude of capital actions are influenced by various factors, such as financial performance, business needs, prevailing and anticipated economic conditions, internal stress testing results, and approvals from both the Board of Directors (“Board”) and the Office of the Comptroller of the Currency (“OCC”). Share repurchases may occur periodically in the open market or through privately negotiated transactions.
For a more comprehensive discussion of our capital risk management, see “Capital Management” in our 2025 Form 10-K.
ZIONS BANCORPORATION, NATIONAL ASSOCIATION AND SUBSIDIARIES
SHAREHOLDERS' EQUITY
(Dollar amounts in millions)
March 31, 2026
December 31, 2025
Amount change
Percent change
Shareholders’ equity:
Preferred stock
$
66
$
66
$
—
—
%
Common stock and additional paid-in capital
1,669
1,726
(57)
(3)
Retained earnings
7,496
7,329
167
2
Accumulated other comprehensive loss
(1,935)
(1,941)
6
—
Total shareholders' equity
$
7,296
$
7,180
$
116
2
Total shareholders’ equity increased $116 million, or 2%, to $7.3 billion at March 31, 2026, compared with $7.2 billion at December 31, 2025. Common stock and additional paid-in capital decreased $57 million, primarily due to common stock repurchases. During the first quarter of 2026, we repurchased 1.3 million common shares outstanding for $77 million, which includes common shares acquired through our publicly announced plans and those acquired in connection with our stock compensation plan. In May 2026, we publicly announced a plan to repurchase up to $225 million of our common shares outstanding for the remainder of 2026.
At March 31, 2026, the AOCI balance reflected a net loss of $1.9 billion, primarily attributable to a decline in the fair value of fixed-rate AFS securities driven by changes in interest rates. This amount includes $1.5 billion ($1.2 billion after tax) of unrealized losses associated with securities previously transferred from AFS to HTM.
Absent any sales or credit impairment of the AFS securities, the unrealized losses will not be recognized in earnings. We do not intend to sell any securities in an unrealized loss position, nor do we believe it is more likely than not that we would be required to sell such securities prior to recovering their amortized cost basis. Although changes in AOCI are reflected in shareholders’ equity, they are currently excluded from regulatory capital and therefore do not impact our regulatory ratios. For more information on our investment securities portfolio and related unrealized gains and losses, see Note 5 of the Notes to Consolidated Financial Statements.
CAPITAL DISTRIBUTIONS
Three Months Ended March 31,
(In millions, except share amounts)
2026
2025
Capital distributions:
Preferred dividends paid
$
1
$
1
Total capital distributed to preferred shareholders
1
1
Common dividends paid
67
65
Bank common stock repurchased 1
77
41
Total capital distributed to common shareholders
144
106
Total capital distributed to preferred and common shareholders
$
145
$
107
Weighted average diluted common shares outstanding (in thousands)
147,038
147,387
Common shares outstanding, at period end (in thousands)
147,077
147,567
1 Includes amounts related to common shares acquired through our publicly announced plans and those acquired in connection with our stock compensation plan. These shares were acquired from employees to cover their payroll taxes and stock option exercise costs upon the exercise of stock options.
Pursuant to the OCC’s “Earnings Limitation Rule,” dividend payments are limited to the sum of net income for the current fiscal year and retained earnings for the two preceding years, unless prior approval is obtained from the OCC to exceed this threshold. As of April 1, 2026, we had $1.3 billion in retained net profits available for distribution.
In the first quarters of 2026 and 2025, dividends paid on preferred stock totaled $1 million in each period. Dividends paid on common stock totaled $67 million, or $0.45 per share, during the first quarter of 2026, compared with $65 million, or $0.43 per share, during the first quarter of 2025. In May 2026, the Board declared a quarterly
ZIONS BANCORPORATION, NATIONAL ASSOCIATION AND SUBSIDIARIES
common stock dividend of $0.45 per share, payable on May 21, 2026 to shareholders of record on May 14, 2026. For additional information regarding capital actions, see Note 8 of the Notes to Consolidated Financial Statements.
Basel III
We are subject to the Basel III capital requirements, which include specific minimum regulatory capital ratios. At March 31, 2026, we exceeded all capital adequacy requirements under the Basel III framework. Based on our internal stress testing and other capital adequacy assessments, we believe our capital levels sufficiently exceed both internal and regulatory requirements for well-capitalized institutions. For more information regarding our compliance with the Basel III capital requirements, see the “Supervision and Regulation” section and Note 15 of our 2025 Form 10-K.
In March 2026, the federal banking agencies issued notices of proposed rulemaking related to the Basel III Endgame framework that would revise aspects of the U.S. regulatory capital requirements, including risk‑weighted asset calculations and the treatment of AOCI. Under the proposals, most components of AOCI would be included in regulatory capital. The proposals are subject to ongoing regulatory review and potential modification, and while their potential impact remains uncertain, we are evaluating the proposals and expect to remain well capitalized as we continue to manage our capital position in light of evolving regulatory and supervisory requirements.
The following schedule presents our capital amounts, capital ratios, and other selected performance ratios:
CAPITAL AMOUNTS AND RATIOS
(Dollar amounts in millions, except per share amounts)
March 31, 2026
December 31, 2025
March 31, 2025
Basel III risk-based capital amounts:
Common equity tier 1 capital
$
8,050
$
7,936
$
7,379
Tier 1 risk-based
8,116
8,003
7,445
Total risk-based
9,610
9,510
9,057
Risk-weighted assets
69,651
69,142
68,132
Basel III risk-based capital ratios:
Common equity tier 1 capital ratio
11.6
%
11.5
%
10.8
%
Tier 1 risk-based ratio
11.7
%
11.6
%
10.9
%
Total risk-based ratio
13.8
%
13.8
%
13.3
%
Tier 1 leverage ratio
9.1
%
9.0
%
8.4
%
Other ratios:
Average equity to average assets (three months ended)
8.1
%
7.8
%
7.0
%
Return on average common equity (three months ended)
13.1
%
14.9
%
11.1
%
Return on average tangible common equity (three months ended) 1
15.5
%
17.9
%
13.4
%
Tangible equity ratio 1
7.1
%
7.0
%
6.0
%
Tangible common equity ratio 1
7.1
%
6.9
%
6.0
%
Tangible book value per common share 1
$
41.75
$
40.79
$
34.95
1 See “Non-GAAP Financial Measures” on page 37 for more information regarding these ratios.
At March 31, 2026, our common equity tier 1 (“CET1”) capital was $8.1 billion, an increase of 9%, compared with $7.4 billion in the prior year period. The CET1 capital ratio improved to 11.6%, compared with 10.8%. Tangible book value per common share increased 19% to $41.75, mainly due to higher retained earnings and reduced unrealized losses in AOCI. See the section below for more information regarding non-GAAP financial measures.
ZIONS BANCORPORATION, NATIONAL ASSOCIATION AND SUBSIDIARIES
NON-GAAP FINANCIAL MEASURES
This Form 10-Q includes certain non-GAAP financial measures in addition to those prepared in accordance with generally accepted accounting principles (“GAAP”). Reconciliations of the non-GAAP measures to the most directly comparable GAAP measures are included in the accompanying schedules. Management uses these non-GAAP measures to evaluate financial results and believes they provide useful supplemental information for period-to-period comparisons.
Non-GAAP financial measures have limitations and may not be directly comparable to similar measures reported by other financial institutions. These measures should not be considered in isolation and should be evaluated in conjunction with the corresponding GAAP measures and related reconciliations. Investors are encouraged to consider GAAP results as the primary basis for assessing our financial condition and results of operations.
Tangible Common Equity and Related Measures
Tangible common equity and related metrics are non-GAAP financial measures that exclude the impact of intangible assets and the related amortization. Management believes these measures provide useful supplemental information in evaluating the use of shareholders’ equity and assessing performance across both acquired and internally developed businesses.
RETURN ON AVERAGE TANGIBLE COMMON EQUITY (NON-GAAP)
Three Months Ended
(Dollar amounts in millions)
March 31, 2026
December 31, 2025
March 31, 2025
Net earnings applicable to common shareholders (GAAP)
$
232
$
262
$
169
Adjustment, net of tax:
Amortization of core deposit and other intangibles
2
2
1
Net earnings applicable to common shareholders, net of tax
(a)
$
234
$
264
$
170
Average common equity (GAAP)
$
7,194
$
6,956
$
6,182
Average goodwill and intangibles
(1,090)
(1,093)
(1,052)
Average tangible common equity (non-GAAP)
(b)
$
6,104
$
5,863
$
5,130
Number of days in quarter
(c)
90
92
90
Number of days in year
(d)
365
365
365
Return on average tangible common equity (non-GAAP) 1
(a/b/c)*d
15.5
%
17.9
%
13.4
%
1 Excluding the effect of AOCI from average tangible common equity would result in associated returns of 11.8%, 13.3%, and 9.2% for the periods presented, respectively.
TANGIBLE EQUITY RATIO, TANGIBLE COMMON EQUITY RATIO, AND TANGIBLE BOOK VALUE PER COMMON SHARE (ALL NON-GAAP MEASURES)
(Dollar amounts in millions, except shares and per share amounts)
ZIONS BANCORPORATION, NATIONAL ASSOCIATION AND SUBSIDIARIES
Efficiency Ratio and Adjusted Pre-Provision Net Revenue
The efficiency ratio measures operating expenses relative to revenue and is useful to assess the cost of generating revenue. The adjusted efficiency ratio excludes certain items not generally expected to recur frequently, as described in the accompanying schedule, and is intended to enhance comparability across reporting periods. Adjusted noninterest expense reflects management's effectiveness in managing operating costs, while adjusted pre-provision net revenue is used to evaluate our capacity to generate capital. Taxable-equivalent net interest income is presented to facilitate comparability between revenue earned from taxable and tax-exempt sources.
EFFICIENCY RATIO (NON-GAAP) AND ADJUSTED PRE-PROVISION NET REVENUE (NON-GAAP)
Three Months Ended
Year Ended
(Dollar amounts in millions)
March 31, 2026
December 31, 2025
March 31, 2025
December 31, 2025
Noninterest expense (GAAP)
(a)
$
562
$
546
$
538
$
2,138
Adjustments:
Severance costs
3
5
3
16
Other real estate expense, net
—
(2)
—
(2)
Amortization of core deposit and other intangibles
2
2
2
8
SBIC investment success fee accrual
—
2
—
5
FDIC special assessment
(1)
(9)
—
(11)
Total adjustments
(b)
4
(2)
5
16
Adjusted noninterest expense (non-GAAP)
(c)=(a-b)
$
558
$
548
$
533
$
2,122
Net interest income (GAAP)
(d)
$
662
$
683
$
624
$
2,627
Fully taxable-equivalent adjustments
(e)
11
11
11
46
Taxable-equivalent net interest income (non-GAAP)
(f)=(d+e)
673
694
635
2,673
Customer-related noninterest income (non-GAAP)
(g)
172
177
158
662
Net credit valuation adjustment (CVA) 1
(h)
(2)
2
—
(9)
Adjusted customer-related noninterest income (non-GAAP)
(i)=(g-h)
174
175
158
671
Noncustomer-related noninterest income (GAAP)
(j)
15
31
13
96
Securities gains (losses), net
(k)
3
21
6
52
Adjusted noncustomer-related noninterest income (non-GAAP)
(l)=(j-k)
12
10
7
44
Combined income (non-GAAP)
(m)= (f+g+j)
$
860
$
902
$
806
$
3,431
Adjusted taxable-equivalent revenue (non-GAAP)
(n)= (f+i+l)
859
879
800
3,388
Pre-provision net revenue (non-GAAP)
(m)-(a)
$
298
$
356
$
268
$
1,293
Adjusted PPNR (non-GAAP)
(n)-(c)
301
331
267
1,266
Efficiency ratio (non-GAAP)
(c/n)
65.0
%
62.3
%
66.6
%
62.6
%
1 Effective in the first quarter of 2025, capital markets fees and income includes the net CVA, which was previously disclosed under noncustomer-related noninterest income as fair value and nonhedge derivative income.
ZIONS BANCORPORATION, NATIONAL ASSOCIATION AND SUBSIDIARIES
ITEM 1. FINANCIAL STATEMENTS (Unaudited)
CONSOLIDATED BALANCE SHEETS
(In millions, shares in thousands)
March 31, 2026
December 31, 2025
(Unaudited)
(Unaudited)
ASSETS
Cash and due from banks
$
661
$
683
Money market investments:
Interest-bearing deposits
1,741
2,202
Federal funds sold and securities purchased under agreements to resell
1,007
1,420
Trading securities, at fair value
104
64
Investment securities:
Available-for-sale, at fair value
9,184
9,207
Held-to-maturity, at amortized cost (fair value: $8,696 and $8,940)
8,688
8,867
Total investment securities
17,872
18,074
Loans held for sale (includes $57 and $71 of loans carried at fair value)
140
201
Loans and leases, net of unearned income and fees *
61,312
60,900
Allowance for loan and lease losses
667
678
Loans held for investment, net of allowance
60,645
60,222
Other noninterest-bearing investments
994
1,076
Premises, equipment and software, net
1,356
1,363
Goodwill and intangibles
1,089
1,091
Other real estate owned
14
5
Other assets *
2,334
2,289
Total assets
$
87,957
$
88,690
LIABILITIES AND SHAREHOLDERS’ EQUITY
Deposits:
Noninterest-bearing demand
$
27,081
$
25,823
Interest-bearing:
Savings and money market
40,165
39,914
Time
9,661
9,907
Total deposits
76,907
75,644
Federal funds and other short-term borrowings *
382
2,872
Long-term debt
1,963
1,472
Reserve for unfunded lending commitments
46
46
Other liabilities *
1,363
1,476
Total liabilities
80,661
81,510
Shareholders’ equity:
Preferred stock, without par value; authorized 4,400 shares
66
66
Common stock ($0.001 par value; authorized 350,000 shares; issued and outstanding 147,077 and 147,653 shares) and additional paid-in capital
1,669
1,726
Retained earnings
7,496
7,329
Accumulated other comprehensive income (loss)
(1,935)
(1,941)
Total shareholders’ equity
7,296
7,180
Total liabilities and shareholders’ equity
$
87,957
$
88,690
See accompanying notes to consolidated financial statements.
* Effective in the first quarter of 2026, we changed our accounting policy to present qualifying derivative assets and liabilities, along with the associated rights to reclaim or obligations to return cash collateral, on a net basis for all eligible arrangements rather than on a gross basis. Prior period results have been recast to conform to this presentation.
ZIONS BANCORPORATION, NATIONAL ASSOCIATION AND SUBSIDIARIES
NOTES TO CONSOLIDATED FINANCIAL STATEMENTS
(Unaudited)
March 31, 2026
1. BASIS OF PRESENTATION
Zions Bancorporation, National Association (“Zions Bancorporation, N.A.,” “the Bank,” “we,” “our,” “us”) is a bank headquartered in Salt Lake City, Utah. We provide a wide range of banking products and related services, primarily in 11 Western states through seven separately managed affiliates: Zions Bank; California Bank & Trust (“CB&T”); Amegy Bank (“Amegy”); National Bank of Arizona (“NBAZ”); Nevada State Bank (“NSB”); Vectra Bank Colorado (“Vectra”); and The Commerce Bank of Washington (“TCBW”), which also operates as The Commerce Bank of Oregon in Oregon.
The consolidated financial statements include our accounts as well as those of our majority-owned subsidiaries that are consolidated. This includes wholly owned subsidiaries such as ZMFU II, Inc., which supports our municipal lending operations, and Zions Direct, Inc., a registered broker-dealer under the Exchange Act, among other subsidiaries.
Investments where we possess significant influence over the investee's operating and financial policies are accounted for using the equity method. All intercompany accounts and transactions have been eliminated during consolidation. Assets held in an agency or fiduciary capacity are excluded from the consolidated financial statements.
These financial statements have been prepared in accordance with accounting principles generally accepted (“GAAP”) in the United States (“U.S.”) and prevailing practices within the financial services industry for interim financial information, and in conformity with the instructions to Form 10-Q and Article 10 of Regulation S-X. Accordingly, they do not include all of the information and footnotes required by GAAP for complete financial statements. In the opinion of management, all normal and recurring adjustments considered necessary for a fair presentation of the interim financial statements have been included. References to GAAP, including standards issued by the Financial Accounting Standards Board, are cited based on the applicable accounting guidance.
The results of operations for the three months ended March 31, 2026 and 2025 are not necessarily indicative of the results that may be expected for future periods. The preparation of these financial statements requires management to make estimates and assumptions that affect the reported amounts and related disclosures in the accompanying notes. Actual results could differ from those estimates. For further information, refer to the consolidated financial statements and accompanying Notes included in our 2025 Form 10-K.
Subsequent Events
We evaluated events occurring between March 31, 2026 and the date of issuance of the accompanying financial statements. Based on this evaluation, we concluded that no material events occurred that would require adjustments to the consolidated financial statements.
In 2007, we received 460,153 Class B-1 shares of Visa, Inc. in connection with a restructuring and public offering by Visa U.S.A. These shares were carried at no cost on the consolidated balance sheet. As disclosed in our Form 8-K filed on May 4, 2026, we sold all of these shares subsequent to the balance sheet date and expect to recognize a pre-tax gain of approximately $215 million in the second quarter of 2026 as a result of the sale.
Change in Accounting Policy
We enter into International Swaps and Derivatives Association, Inc. master netting arrangements, or similar agreements, with certain derivative counterparties. Where legally enforceable, these arrangements provide the right to liquidate collateral and offset amounts due with the same counterparty in the event of default. Under applicable accounting guidance, derivative fair values and the related rights to reclaim cash collateral (receivables) or
ZIONS BANCORPORATION, NATIONAL ASSOCIATION AND SUBSIDIARIES
obligations to return cash collateral (payables) may be presented on a net basis when subject to such master netting arrangements.
Historically, derivative assets and liabilities, as well as related cash collateral, were presented on a gross basis. Effective in the first quarter of 2026, we elected to change our accounting policy to present derivative assets, derivative liabilities, and related cash collateral on a net basis on the consolidated balance sheet when supported by a legally enforceable master netting arrangement. This change is considered a preferable method of accounting because it more appropriately reflects how we manage counterparty credit exposure and aligns with industry practice.
We retrospectively adopted this change in accounting policy, and the consolidated balance sheet has been recast for all prior periods presented. As a result, amounts previously reported at December 31, 2025 for loans and leases and other assets decreased by $17 million and $283 million, respectively. Short-term borrowings and other liabilities decreased by $232 million and $68 million, respectively. This change had no impact on shareholders’ equity, net income, earnings per share, or cash flows for any period presented. For additional information, see Note 4.
2. RECENT ACCOUNTING PRONOUNCEMENTS
Standard
Description
Effective date
Effect on the financial statements or other significant matters
Standards not yet adopted by the Bank as of March 31, 2026
ASU 2024-03,
Income Statement—Reporting Comprehensive Income—Expense Disaggregation Disclosures (Subtopic 220-40)
This accounting standards update (“ASU”) requires additional disclosures of certain costs and expenses in both interim and annual reporting periods, including:
•Amounts of employee compensation, depreciation, and intangible asset amortization included in certain expense lines presented on the face of the income statement within continuing operations.
•A qualitative description of the amounts remaining in relevant expense captions that are not separately disaggregated quantitatively.
Annual periods beginning January 1, 2027; Interim periods beginning January 1, 2028.
The overall effect of this standard is not expected to have a material impact on our consolidated financial statements.
ASU 2025-06, Intangibles—Goodwill and Other—Internal-Use Software
(Subtopic 350-40)
This ASU modernizes the accounting treatment for internal-use software to better reflect current development practices, including agile and iterative approaches. Key provisions include:
•Elimination of Prescriptive Project Stages: The guidance no longer requires classification of costs by development phase, thereby removing rigid stage-based criteria.
•Capitalization Criteria: Capitalization of eligible software development costs commences once management has both authorized and committed to funding the project, and it is probable that the project will be completed, and requires consideration of development uncertainties.
Annual and interim periods beginning after December 15, 2027.
The overall effect of this standard is not expected to have a material impact on our consolidated financial statements.
This ASU broadens the population of financial assets subject to the gross-up method under Topic 326 to include all purchased seasoned loans (excluding credit cards), which are defined as:
•Non-purchase credit deteriorated (“PCD”) loans acquired in a business combination.
•Non-PCD loans acquired in an asset acquisition more than 90 days after their origination date.
Annual and interim periods beginning after December 15, 2026.
The overall effect of this standard is not expected to have a material impact on our consolidated financial statements.
ASU 2025-09, Derivatives and Hedging (Topic 815)—Hedge Accounting Improvements
This ASU introduces targeted improvements to accounting standards codification (“ASC”) Topic 815 to better align hedge accounting with common risk management strategies. The updates address multiple items, including the following:
•Similar risk assessment for cash flow hedges.
•Hedging interest payments on choose-your-rate debt.
•Net written options as hedging instruments.
Annual and interim periods beginning after December 15, 2026.
The overall effect of this standard is not expected to have a material impact on our consolidated financial statements.
ZIONS BANCORPORATION, NATIONAL ASSOCIATION AND SUBSIDIARIES
Standards adopted by the Bank during the first quarter of 2026
There were no accounting standards adopted during the three months ended March 31, 2026 that had a material effect on our consolidated financial statements.
3. FAIR VALUE
We measure certain assets and liabilities at fair value. Fair value represents the price that would be received to sell an asset or paid to transfer a liability (i.e., an exit price) in the principal market or most advantageous market available to us, in an orderly transaction between market participants as of the measurement date. For more information about our valuation methodologies for assets and liabilities measured at fair value, as well as the fair value hierarchy, see Note 3 of our 2025 Form 10-K.
Fair Value Hierarchy
The following schedule presents assets and liabilities measured at fair value on a recurring basis:
ZIONS BANCORPORATION, NATIONAL ASSOCIATION AND SUBSIDIARIES
(In millions)
December 31, 2025
Level 1
Level 2
Level 3
Netting
Total
ASSETS
Trading securities
$
—
$
64
$
—
$
—
$
64
Available-for-sale securities:
U.S. Treasury, agencies, and corporations
1,411
6,862
—
—
8,273
Municipal securities
—
909
—
—
909
Other debt securities
—
25
—
—
25
Total available-for-sale
1,411
7,796
—
—
9,207
Loans held for sale
—
71
—
—
71
Other noninterest-bearing investments:
Bank-owned life insurance
—
573
—
—
573
Private equity investments 1
6
—
157
—
163
Other assets:
Agriculture loan servicing
—
—
18
—
18
Deferred compensation plan assets
154
—
—
—
154
Derivatives
—
360
—
(283)
77
Total assets
$
1,571
$
8,864
$
175
$
(283)
$
10,327
LIABILITIES
Fed funds and other short-term borrowings:
Securities sold, not yet purchased
$
135
$
—
$
—
$
—
$
135
Other liabilities:
Derivatives
—
260
—
(68)
192
Total liabilities
$
135
$
260
$
—
$
(68)
$
327
1 The Level 1 private equity investments (“PEIs”) generally relate to the portion of our Small Business Investment Company (“SBIC”) investments and other similar investments that are publicly traded.
Fair Value Option for Certain Loans Held for Sale
We apply the fair value option to certain commercial real estate (“CRE”) loans designated for sale to third-party conduits for securitization and hedged with derivative instruments. This election reduces accounting volatility that would otherwise result from the mismatch between measuring loans held for sale at the lower of cost or fair value and derivatives at fair value, without requiring the application of hedge accounting. These loans are included in “Loans held for sale” on the consolidated balance sheet. Related fair value gains and losses are included in “Capital markets fees and income” on the consolidated statement of income, and accrued interest is included in “Interest and fees on loans.”
At March 31, 2026 and December 31, 2025, we had $57 million and $71 million, respectively, of loans measured at fair value, with a corresponding unpaid principal balance of $58 million and $72 million. During the first three months of 2026 and 2025, we recognized approximately $1 million and $2 million, respectively, in net gains from loan sales and valuation adjustments related to loans measured at fair value and the associated derivatives.
Level 3 Valuations
Our Level 3 financial instruments include PEIs and agriculture loan servicing. For additional information regarding our Level 3 financial instruments, including the methods and significant assumptions used to estimate their fair value, see Note 3 of our 2025 Form 10-K.
ZIONS BANCORPORATION, NATIONAL ASSOCIATION AND SUBSIDIARIES
Roll-forward of Level 3 Fair Value Measurements
The following schedule presents a roll-forward of assets and liabilities that are measured at fair value on a recurring basis using Level 3 inputs:
Level 3 Instruments
Three Months Ended March 31, 2026
Three Months Ended March 31, 2025
(In millions)
Private equity investments
Ag loan servicing
Private equity investments
Ag loan servicing
Balance at beginning of period
$
157
$
18
$
105
$
20
Unrealized securities gains, net
—
—
4
—
Other noninterest income
—
2
—
(1)
Purchases
2
—
1
—
Cost of investments sold
—
—
(1)
—
Transfers out
—
—
—
—
Balance at end of period
$
159
$
20
$
109
$
19
There were no realized gains or losses related to Level 3 instruments recognized in “Securities gains (losses), net” on the consolidated statement of income for the periods presented.
Nonrecurring Fair Value Measurements
Certain assets and liabilities are measured at fair value on a nonrecurring basis. These include impaired loans measured at the fair value of the underlying collateral, other real estate owned (“OREO”), and equity investments without readily determinable fair values. Nonrecurring fair value adjustments generally arise from observable price changes for such equity investments, write-downs of individual assets, or the application of lower of cost or fair value accounting.
At March 31, 2026, we had no collateral-dependent loans measured at fair value. During the first quarter of 2026, we recognized no losses related to changes in fair value for these loans. For more information on assets and liabilities measured at fair value on a nonrecurring basis, see Note 3 of our 2025 Form 10-K.
Fair Value of Certain Financial Instruments
The following schedule presents the carrying values and estimated fair values of certain financial instruments:
March 31, 2026
December 31, 2025
(In millions)
Carrying value
Fair value
Level
Carrying value
Fair value
Level
Financial assets:
Held-to-maturity investment securities
$
8,688
$
8,696
2
$
8,867
$
8,940
2
Loans and leases (including loans held for sale), net of allowance
60,785
59,775
3
60,423
59,383
3
Financial liabilities:
Time deposits
9,661
9,571
2
9,907
9,839
2
Long-term debt
1,963
1,974
2
1,472
1,506
2
The preceding schedule excludes financial instruments that are recorded at fair value on a recurring basis, as well as certain financial assets and liabilities for which carrying value approximates fair value. For additional information regarding the financial instruments included within the scope of this disclosure, along with the valuation methodologies and significant assumptions used in estimating their fair values, see Note 3 of our 2025 Form 10-K.
ZIONS BANCORPORATION, NATIONAL ASSOCIATION AND SUBSIDIARIES
4. DERIVATIVE INSTRUMENTS AND HEDGING ACTIVITIES
Objectives and Accounting
We utilize derivative instruments—including interest rate swaps, futures, options, foreign exchange and commodity contracts, credit derivatives, and various customer-facing products—to manage exposure to interest rate, foreign exchange, commodity, credit, and other market risks. Our objective is to reduce volatility in interest income, interest expense, earnings, and capital. These instruments allow us to adjust the sensitivity of our assets and liabilities to changes in market rates and other market conditions.
In addition, we offer derivative products to customers to support their risk management needs. The resulting exposures are generally mitigated through offsetting transactions with dealer counterparties or central clearing houses. We do not use derivatives for speculative purposes. For more information regarding our use of derivative instruments and related accounting policies, see Note 7 of our 2025 Form 10-K.
Collateral and Credit Risk
Credit risk associated with derivative instruments arises from the potential nonperformance of counterparties. No significant derivative-related losses attributable to counterparty default occurred during the first three months of 2026. For a discussion of how counterparty credit risk is incorporated into derivative valuations, see Note 3 of our 2025 Form 10-K. For additional information regarding collateral arrangements and related credit risk for derivative contracts, see Note 7 of our 2025 Form 10-K.
Certain derivative contracts contain credit risk-related contingent features, such as minimum credit rating requirements. If these features were triggered, we may be required to post additional collateral; however, counterparties have not historically exercised their rights to demand additional collateral in all instances when permitted. If our credit rating had been downgraded by one notch by Standard and Poor’s (“S&P”) or Moody’s at March 31, 2026, we do not believe that additional collateral would have been required to be pledged. Centrally cleared derivatives do not include credit risk-related contingent features that would require additional collateral in the event of a credit rating downgrade.
At March 31, 2026, the fair value of our derivative liabilities was $392 million. To satisfy variation margin requirements, we pledged $158 million in cash collateral in the ordinary course of business. Additionally, we pledged U.S. Treasuries with an aggregate face value of $200 million to satisfy initial margin requirements with certain dealer counterparties and central clearing houses.
Derivative Notional Amounts and Fair Values
The following schedule presents derivative notional amounts and recorded fair values at March 31, 2026 and December 31, 2025:
ZIONS BANCORPORATION, NATIONAL ASSOCIATION AND SUBSIDIARIES
March 31, 2026
December 31, 2025
Notional amount
Fair value
Notional amount
Fair value
(In millions)
Other assets
Other liabilities
Other assets
Other liabilities
Derivatives designated as accounting hedges:
Cash flow hedges:
Hedges of floating-rate assets 1
$
16,150
$
3
$
5
$
2,750
$
7
$
1
Fair value hedges:
Hedges of fixed-rate assets 1
7,953
79
—
7,653
79
—
Hedges of fixed-rate liabilities
1,500
—
—
1,000
—
—
Total derivatives designated as accounting hedges
25,603
82
5
11,403
86
1
Derivatives not designated as accounting hedges2:
Customer interest rate derivatives
25,103
236
226
22,428
251
241
Customer commodity derivatives
2,255
161
159
853
18
17
Other interest rate derivatives
1,695
3
1
5,571
2
—
Foreign exchange derivatives 3
368
2
1
308
3
1
Purchased credit derivatives
43
—
—
64
—
—
Total derivatives not designated as accounting hedges
29,464
402
387
29,224
274
259
Total gross derivatives
$
55,067
$
484
$
392
$
40,627
360
260
Less: Offsetting derivative instruments
(70)
(70)
(51)
(51)
Less: Cash collateral pledged/received
(228)
(124)
(232)
(17)
Total net derivatives presented on balance sheet 4
$
186
$
198
$
77
$
192
1 Includes forward-starting swaps that are not yet effective.
2 Notional amounts and fair values for derivatives that are not designated as accounting hedges include both the customer-facing derivatives the Bank executes to assist customers in managing their risks and the dealer-facing derivatives that economically offset the customer transactions to mitigate the Bank's exposure.
3 Includes both spot and forward FX trades.
4 See Note 1 for a discussion of the change in derivative presentation effective in the first quarter of 2026.
Hedge Accounting Gains/Losses Recognized in Earnings and Deferred in AOCI
The following schedule present the gains and losses from derivative instruments designated as cash flow and fair value hedges, either deferred in accumulated other comprehensive income (“AOCI”) or recognized in earnings for the three months ended March 31, 2026 and 2025:
ZIONS BANCORPORATION, NATIONAL ASSOCIATION AND SUBSIDIARIES
Three Months Ended March 31, 2026
Three Months Ended March 31, 2025
(In millions)
Effective portion of derivative gain/(loss) deferred in AOCI
Amount of gain/(loss) reclassified from AOCI into income
Interest on fair value hedges
Effective portion of derivative gain/(loss) deferred in AOCI
Amount of gain/(loss) reclassified from AOCI into income
Interest on fair value hedges
Cash flow hedges1:
Hedges of floating-rate assets
$
(29)
$
(11)
$
—
$
6
$
(20)
$
—
Hedges of floating-rate liabilities
—
—
—
—
1
—
Fair value hedges2:
Hedges of fixed-rate assets
—
—
5
—
—
13
Hedges of fixed-rate liabilities
—
—
(2)
—
—
(2)
Total derivatives designated as accounting hedges
$
(29)
$
(11)
$
3
$
6
$
(19)
$
11
1 For the 12-month period following March 31, 2026, we estimate that approximately $42 million of net losses from both active and terminated cash flow hedges will be reclassified from AOCI into interest income, compared with an estimate of $54 million at March 31, 2025. At March 31, 2026, approximately $27 million of losses related to terminated cash flow hedges remained deferred in AOCI, which are expected to be fully reclassified into earnings by October 2027.
2 We recorded cumulative unamortized basis adjustments from terminated fair value hedges of debt totaling $30 million and $38 million at March 31, 2026 and 2025, respectively. Additionally, we had $2 million and $3 millionof cumulative unamortized basis adjustments from terminated fair value hedges of assets at March 31, 2026 and 2025, respectively. Interest on fair value hedges presented above includes the amortization of the remaining unamortized basis adjustments.
Gains/Losses Recognized in Earnings from Derivatives Not Designated as Accounting Hedges
The following schedule presents the amount of gains (losses) recognized in “Capital markets fees and income” under noninterest income from derivatives not designated as accounting hedges:
Other Noninterest Income/(Expense)
(In millions)
Three Months Ended March 31, 2026
Three Months Ended March 31, 2025
Derivatives not designated as accounting hedges:
Customer-facing interest rate derivatives
$
8
$
7
Customer-facing commodity derivatives
1
—
Other interest rate derivatives 1
1
—
Foreign exchange derivatives
7
6
Purchased credit derivatives
—
—
Total derivatives not designated as accounting hedges
$
17
$
13
1 Includes gains and losses from mortgage derivative instruments, which were recognized in “Loan-related fees and income” within noninterest income.
Fair Value Hedges and Hedged Items Gains/Losses
The following schedule presents derivatives used in fair value hedge accounting relationships, including the pre-tax gains and losses recognized on both the derivatives and the corresponding hedged items for the periods presented:
Gains (losses) recorded in income
Three Months Ended March 31, 2026
Three Months Ended March 31, 2025
(In millions)
Derivatives
Hedged items
Total income statement impact
Derivatives
Hedged items
Total income statement impact
Hedges of fixed-rate assets 1, 2
$
32
$
(32)
$
—
$
(80)
$
80
$
—
Hedges of fixed-rate liabilities 1, 2
(8)
8
—
12
(12)
—
1 Includes hedges of benchmark interest rate risk related to fixed-rate long-term debt, AFS securities, and commercial loans. Gains and losses were recognized in interest income or interest expense, consistent with the accounting treatment of the respective hedged items.
2 Income (expense) from derivative instruments excludes interest income and interest expense associated with periodic accruals and settlements in order to align with the presentation of gains and losses on the related hedged items.
ZIONS BANCORPORATION, NATIONAL ASSOCIATION AND SUBSIDIARIES
Fair Value Hedges and Basis Adjustments
The following schedule presents information regarding basis adjustments for hedged items in fair value hedging relationships:
Par value of hedged items
Carrying amount of the hedged items
Cumulative amount of fair value hedging adjustment included in the carrying amount of the hedged items
(In millions)
March 31, 2026
December 31, 2025
March 31, 2026
December 31, 2025
March 31, 2026
December 31, 2025
Hedges of fixed-rate assets 1, 2
$
11,510
$
11,566
$
11,296
$
11,383
$
(214)
$
(183)
Hedges of fixed-rate liabilities 1
(1,500)
(1,000)
(1,501)
(1,009)
(1)
(9)
1 Carrying amounts exclude (i) issuance and purchase discounts or premiums, (ii) unamortized issuance and acquisition costs, and (iii) amounts related to terminated fair value hedging relationships.
2 Hedged items include defined portfolios of AFS securities and commercial loans, as well as specifically identified AFS securities. Related basis adjustments were recorded in the same balance-sheet line items as the corresponding hedged assets. At March 31, 2026, the amortized cost basis of assets designated under the portfolio layer method was $9.2 billion, the cumulative basis adjustment associated with these hedging relationships was $3 million, and the notional amount of the designated accounting hedges was $5.7 billion.
5. INVESTMENT SECURITIES
Investment Securities
We classify our investment securities as either available-for-sale (“AFS”) or held-to-maturity (“HTM”). AFS securities, which primarily consist of debt instruments used to manage liquidity and interest rate risk and to generate interest income, are measured at fair value. Unrealized gains and losses from AFS securities, net of applicable taxes, are recognized in other comprehensive income.
HTM securities represent investments that management has both the intent and ability to hold until maturity. These securities are carried at amortized cost, which reflects the original purchase price, adjusted for the amortization or accretion of any premiums or discounts, as well as any impairment losses, including those related to credit. Gains or losses resulting from the sale of investment securities are recognized in noninterest income and are measured using the specific identification method.
The carrying values of our investment securities exclude accrued interest receivables of $57 million and $64 million at March 31, 2026 and December 31, 2025, respectively. These amounts are included in “Other assets” on the consolidated balance sheet.
Investment securities with a carrying value of $17.2 billion and $17.5 billion were pledged as collateral for potential borrowings at March 31, 2026 and December 31, 2025, respectively.
When a security is transferred from AFS to HTM, the difference between its amortized cost basis and its fair value on the transfer date is amortized as a yield adjustment through interest income. The fair value at the transfer date establishes either a premium or discount relative to the amortized cost basis of the HTM securities. The amortization of unrealized gains or losses reported in AOCI offsets the impact of amortizing the resulting premium or discount through interest income created by the transfer.
The discount associated with securities previously transferred from AFS to HTM was $1.5 billion ($1.2 billion after tax) at March 31, 2026, compared with $1.6 billion ($1.2 billion after tax) at December 31, 2025.
For additional information regarding our fair value estimation process and the accounting treatment of our investment securities, see Notes 3 and 5, respectively, of our 2025 Form 10-K.
ZIONS BANCORPORATION, NATIONAL ASSOCIATION AND SUBSIDIARIES
The following schedule presents gross unrealized losses for AFS securities and the estimated fair value, categorized by the length of time the securities have been in an unrealized loss position:
March 31, 2026
Less than 12 months
12 months or more
Total
(In millions)
Gross unrealized losses
Estimated fair value
Gross unrealized losses
Estimated fair value
Gross unrealized losses
Estimated fair value
Available-for-sale
U.S. Treasury securities
$
7
$
795
$
109
$
292
$
116
$
1,087
U.S. Government agencies and corporations:
Agency securities
—
5
16
263
16
268
Agency guaranteed mortgage-backed securities
2
200
1,010
5,551
1,012
5,751
Small Business Administration loan-backed securities
—
8
14
283
14
291
Municipal securities
1
104
51
716
52
820
Other
1
14
—
—
1
14
Total available-for-sale investment securities
$
11
$
1,126
$
1,200
$
7,105
$
1,211
$
8,231
December 31, 2025
Less than 12 months
12 months or more
Total
(In millions)
Gross unrealized losses
Estimated fair value
Gross unrealized losses
Estimated fair value
Gross unrealized losses
Estimated fair value
Available-for-sale
U.S. Treasury securities
$
—
$
99
$
106
$
296
$
106
$
395
U.S. Government agencies and corporations:
Agency securities
—
7
15
288
15
295
Agency guaranteed mortgage-backed securities
2
86
987
5,735
989
5,821
Small Business Administration loan-backed securities
—
24
14
309
14
333
Municipal securities
—
68
44
797
44
865
Other
—
15
—
—
—
15
Total available-for-sale investment securities
$
2
$
299
$
1,166
$
7,425
$
1,168
$
7,724
At March 31, 2026 and December 31, 2025, the number of AFS investment securities in an unrealized loss position totaled 2,005 and 2,037, respectively.
There were no gross realized gains or losses from sales of AFS investment securities for the three months ended March 31, 2026 and 2025.
The following schedule presents interest income categorized by investment security type:
Three Months Ended March 31,
2026
2025
(In millions)
Taxable
Nontaxable
Total
Taxable
Nontaxable
Total
Available-for-sale
$
61
$
6
$
67
$
65
$
7
$
72
Held-to-maturity
47
1
48
52
1
53
Total investment securities
$
108
$
7
$
115
$
117
$
8
$
125
Maturities
The following schedule presents the amortized cost and weighted average yields of debt securities, categorized by the remaining contractual maturity of principal payments at March 31, 2026. The schedule does not reflect the effects of interest rate resets or fair value hedges. Additionally, the remaining contractual principal maturities shown do not represent the portfolio's duration, as they exclude expected prepayments or amortization, which typically result in measured durations that are significantly shorter than contractual maturities.
ZIONS BANCORPORATION, NATIONAL ASSOCIATION AND SUBSIDIARIES
March 31, 2026
Total debt securities
Due in one year or less
Due after one year through five years
Due after five years through ten years
Due after ten years
(Dollar amounts in millions)
Amortized cost
Average yield
Amortized cost
Average yield
Amortized cost
Average yield
Amortized cost
Average yield
Amortized cost
Average yield
Available-for-sale
U.S. Treasury securities
$
1,799
3.76
%
$
100
4.04
%
$
201
3.99
%
$
1,097
4.20
%
$
401
2.35
%
U.S. Government agencies and corporations:
Agency securities
294
3.33
—
—
60
4.04
144
2.99
90
3.39
Agency guaranteed mortgage-backed securities
7,017
2.08
12
1.62
253
2.72
1,877
1.76
4,875
2.18
Small Business Administration loan-backed securities
327
4.00
—
—
14
4.98
98
3.55
215
4.14
Municipal securities 1
921
2.03
89
3.13
325
1.86
493
1.93
14
2.35
Other debt securities
25
7.78
—
—
10
9.51
—
—
15
6.62
Total available-for-sale securities
10,383
2.48
201
3.49
863
2.90
3,709
2.60
5,610
2.30
Held-to-maturity
U.S. Government agencies and corporations:
Agency securities
134
4.17
—
—
—
—
82
3.54
52
5.16
Agency guaranteed mortgage-backed securities
8,296
1.83
—
—
33
1.79
4
1.80
8,259
1.83
Municipal securities 1
258
3.28
30
2.88
131
2.83
90
3.88
7
5.69
Total held-to-maturity securities
8,688
1.91
30
2.88
164
2.62
176
3.68
8,318
1.86
Total investment securities
$
19,071
2.22
$
231
3.41
$
1,027
2.85
$
3,885
2.65
$
13,928
2.03
1 The yields on tax-exempt securities are calculated on a tax-equivalent basis.
Impairment
AFS Impairment
We review our AFS securities portfolio for potential impairment on a quarterly basis, assessing each security individually. For additional information regarding our impairment assessment methodology and the related accounting policies applicable to investment securities, see Note 5 of our 2025 Form 10-K.
No impairment losses were recognized on our AFS investment securities portfolio during the first three months of 2026 or 2025. The unrealized losses primarily reflect the impact of higher interest rates subsequent to the purchase of the securities and are not attributable to credit-related factors. Accordingly, absent any future sales, we expect to recover the full principal value of these securities upon maturity. At March 31, 2026, we did not intend to sell any securities in an unrealized loss position, nor do we believe it is more likely than not that we would be required to sell such securities prior to recovering their amortized cost basis.
HTM Impairment
For HTM securities, the allowance for credit losses (“ACL”) is evaluated using the same methodology applied to loans and leases measured at amortized cost, as described in Note 6. At March 31, 2026, the ACL for HTM securities was less than $1 million. All HTM securities were assigned a credit quality rating of “Pass,” with none classified as past due.
ZIONS BANCORPORATION, NATIONAL ASSOCIATION AND SUBSIDIARIES
6. LOANS, LEASES, AND ALLOWANCE FOR CREDIT LOSSES
Loans, Leases, and Loans Held for Sale
The following schedule presents our loan and lease portfolio according to major portfolio segment and specific class:
(In millions)
March 31, 2026
December 31, 2025
Loans held for sale
$
140
$
201
Commercial:
Commercial and industrial 1
$
18,263
$
18,111
Owner-occupied
9,323
9,274
Municipal
4,272
4,294
Total commercial
31,858
31,679
Commercial real estate:
Term
11,387
11,234
Construction and land development
2,271
2,162
Total commercial real estate
13,658
13,396
Consumer:
1-4 family residential
10,406
10,462
Home equity credit line
3,976
3,950
Construction and other consumer real estate
786
782
Bankcard and other revolving plans
515
515
Other
113
116
Total consumer
15,796
15,825
Total loans and leases
$
61,312
$
60,900
1 Effective March 31, 2026, balances previously reported as “Leasing” are now included in the “Commercial and industrial” loan segment. Prior period amounts have been reclassified to conform to the current presentation. At March 31, 2026 and December 31, 2025, the leasing portfolio totaled $374 million and $367 million, respectively.
Loans and leases classified as held for investment are measured and presented at their amortized cost basis, which includes net unamortized purchase premiums, discounts, and deferred loan fees and costs totaling $56 million and $61 million at March 31, 2026 and December 31, 2025, respectively. The amortized cost basis of the loans does not include accrued interest receivables of $267 million and $276 million at March 31, 2026 and December 31, 2025, respectively. These receivables are included in “Other assets” on the consolidated balance sheet.
Municipal loans generally include loans to state and local governments (“municipalities”), with the debt service being repaid from general funds or pledged revenues of the municipal entity, or to private commercial entities or 501(c)(3) not-for-profit entities utilizing a pass-through municipal entity to achieve favorable tax treatment.
Land acquisition and development loans included in the construction and land development loan portfolio were $247 million at March 31, 2026 and $257 million at December 31, 2025.
Loans with a carrying value of $43.4 billion at March 31, 2026 and $43.2 billion at December 31, 2025 have been pledged at the Federal Reserve (“FRB”) and the Federal Home Loan Bank (“FHLB”) of Des Moines as collateral for current and potential borrowings.
Loans held for sale are measured individually at fair value or the lower of cost or fair value and primarily consist of CRE loans sold into securitization entities, and conforming residential mortgages generally sold to U.S. government agencies. The following schedule presents loans added to, or sold from, the held for sale category during the periods presented:
ZIONS BANCORPORATION, NATIONAL ASSOCIATION AND SUBSIDIARIES
Three Months Ended March 31,
(In millions)
2026
2025
Loans added to held for sale
$
562
$
175
Loans sold from held for sale
563
139
From time to time, we retain continuing involvement in loans sold through servicing rights or guarantees. At March 31, 2026, the principal balance of loans sold for which servicing was retained was approximately $771 million, compared with $679 million at December 31, 2025. Income generated from sold loans, excluding servicing income, totaled $7 million for the three months ended March 31, 2026, and $2 million for the corresponding period in 2025.
Allowance for Credit Losses
The allowance for credit losses (“ACL”), which consists of the allowance for loan and lease losses (“ALLL”) and the reserve for unfunded lending commitments (“RULC”), represents our estimate of current expected credit losses related to the loan and lease portfolio and unfunded lending commitments as of the balance sheet date. For additional information regarding our policies and methodologies used to estimate the ACL, see Note 6 of our 2025 Form 10-K.
The ACL on AFS and HTM debt securities is estimated separately from the ACL on loans. For HTM debt securities, the ACL is evaluated using the same methodology applied to loans and leases measured at amortized cost. For more information regarding our methodology used to estimate the ACL on AFS and HTM debt securities, see Note 5 of our 2025 Form 10-K.
Changes in the ACL are summarized as follows:
Three Months Ended March 31, 2026
(In millions)
Commercial
Commercial real estate
Consumer
Total
Allowance for loan losses
Balance at beginning of period
$
391
$
185
$
102
$
678
Provision for loan losses
5
(25)
13
(7)
Gross loan and lease charge-offs
7
—
4
11
Recoveries
5
1
1
7
Net loan and lease charge-offs (recoveries)
2
(1)
3
4
Balance at end of period
$
394
$
161
$
112
$
667
Reserve for unfunded lending commitments
Balance at beginning of period
$
19
$
19
$
8
$
46
Provision for unfunded lending commitments
(1)
1
—
—
Balance at end of period
$
18
$
20
$
8
$
46
Total allowance for credit losses at end of period
ZIONS BANCORPORATION, NATIONAL ASSOCIATION AND SUBSIDIARIES
Three Months Ended March 31, 2025
(In millions)
Commercial
Commercial real estate
Consumer
Total
Allowance for loan losses
Balance at beginning of period
$
308
$
300
$
88
$
696
Provision for loan losses
41
(29)
5
17
Gross loan and lease charge-offs
19
—
5
24
Recoveries
7
—
1
8
Net loan and lease charge-offs (recoveries)
12
—
4
16
Balance at end of period
$
337
$
271
$
89
$
697
Reserve for unfunded lending commitments
Balance at beginning of period
$
26
$
11
$
8
$
45
Provision for unfunded lending commitments
2
(1)
—
1
Balance at end of period
$
28
$
10
$
8
$
46
Total allowance for credit losses at end of period
Allowance for loan losses
$
337
$
271
$
89
$
697
Reserve for unfunded lending commitments
28
10
8
46
Total allowance for credit losses
$
365
$
281
$
97
$
743
Nonaccrual Loans
Loans are generally placed on nonaccrual when the full collection of principal and interest is not expected, or when the loan is 90 days or more past due on principal or interest, unless the loan is both well secured and in the process of collection. The decision to place a loan on nonaccrual considers factors such as delinquency status, collateral valuation, the financial condition of the borrower or guarantor, bankruptcy proceedings, pending litigation, and any other indicators that create uncertainty regarding the full and timely collection of principal and interest.
A nonaccrual loan may be restored to accrual status when the following conditions are met: (1) all delinquent principal and interest are brought current in accordance with the loan agreement; (2) the loan, if secured, is well secured; (3) the borrower has made payments according to the contractual terms for a minimum of six months; and (4) an analysis of the borrower indicates a reasonable assurance of their ability and willingness to continue making payments.
The following schedule presents the amortized cost basis of loans on nonaccrual:
ZIONS BANCORPORATION, NATIONAL ASSOCIATION AND SUBSIDIARIES
December 31, 2025
Amortized cost basis
Total amortized cost basis
(In millions)
with no allowance 1
with allowance
Related allowance
Commercial:
Commercial and industrial
$
44
$
49
$
93
$
19
Owner-occupied
33
18
51
1
Municipal
—
2
2
—
Leasing
—
—
—
—
Total commercial
77
69
146
20
Commercial real estate:
Term
4
68
72
2
Construction and land development
—
1
1
—
Total commercial real estate
4
69
73
2
Consumer:
1-4 family residential
14
51
65
5
Home equity credit line
—
30
30
8
Bankcard and other revolving plans
—
1
1
1
Total consumer
14
82
96
14
Total
$
95
$
220
$
315
$
36
1 Nonaccrual loans with no allowance primarily consist of loans for which a specific reserve is estimated based on the fair value of the collateral. As a result, we generally charge off the portion of the loan balance that exceeds that fair value, and no reserve or related allowance is established for these loans.
For accruing loans, interest is accrued, and interest payments are recognized as interest income in accordance with the contractual terms of the loan agreement. For nonaccrual loans, the accrual of interest is discontinued, and any previously accrued but uncollected interest is promptly reversed from interest income, generally within one month. Payments received on nonaccrual loans are applied to reduce the outstanding principal balance and are not recognized as interest income. However, when the collectability of the amortized cost basis of a nonaccrual loan is no longer in doubt, interest payments may be recognized as interest income on a cash basis. For the three months ended March 31, 2026 and 2025, no interest income was recognized on a cash basis for nonaccrual loans.
The following schedule presents the amount of accrued interest receivables reversed from interest income, categorized by loan portfolio segment during the periods presented:
Three Months Ended March 31,
(In millions)
2026
2025
Commercial
$
3
$
4
Commercial real estate
1
1
Consumer
1
1
Total
$
5
$
6
Past Due Loans
Closed-end loans with monthly scheduled payments are reported as past due when the borrower is delinquent for two or more monthly payments. Similarly, open-end credit arrangements, including bankcard and other revolving credit plans, are reported as past due when the minimum required payment has not been received for two or more billing cycles. Other multi-payment obligations (e.g., quarterly or semi-annual), as well as single payment and demand notes, are reported as past due when either principal or interest remains due and unpaid 30 days or more.
ZIONS BANCORPORATION, NATIONAL ASSOCIATION AND SUBSIDIARIES
Credit Quality Indicators
In addition to nonaccrual and past due criteria, we evaluate loans using internal risk-grading systems that vary based on the size and type of credit risk exposure. Loans are assigned internal risk grades of Pass, Special Mention, Substandard, and Doubtful, which are aligned with published regulatory risk classifications.
The definitions of these risk grades are summarized as follows:
•Pass — Pass-rated assets are considered higher quality and do not meet the criteria for any of the other risk categories. The likelihood of loss is considered low.
•Special Mention — Special Mention assets have potential weaknesses that warrant management’s close attention. If left uncorrected, these weaknesses may result in deterioration of the borrower's repayment capacity or our credit position at a future date.
•Substandard — Substandard assets are inadequately protected by the borrower's current net worth and repayment capacity or by the collateral pledged, if any. These assets have well-defined weaknesses and are characterized by the distinct possibility that a loss may be sustained if the deficiencies are not corrected.
•Doubtful — Doubtful assets exhibit all of the weaknesses inherent in Substandard assets, with the added characteristic that collection or liquidation in full is highly questionable and improbable.
There were no loans classified as Doubtful at March 31, 2026 or December 31, 2025.
For commercial and CRE loans with commitments greater than $1 million, we assign either one of several grades within the Pass classification or one of the previously described regulatory risk classifications. Internal risk grades for these loans are reviewed at least quarterly, or more frequently when information becomes available that may affect the credit risk of the loan.
For consumer loans and for commercial and CRE loans with commitments of $1 million or less, internal risk grades generally consistent with the classifications described above are assigned using automated processes that incorporate refreshed credit scores, payment performance, and other relevant risk indicators. These loans are typically assigned a Pass, Special Mention, or Substandard grade and are reviewed as information is identified that might warrant a change in risk grade.
The following schedules present the amortized cost of loans and leases by vintage year, defined as the year of origination or, when applicable, the year of the most recent renewal, extension, or significant modification that resets the loan’s vintage. As a result, certain loans presented in the current‑year vintage were originated in prior periods and do not represent new credit originations. The schedules also present balances by the credit quality classifications used by management in monitoring portfolio risk.
ZIONS BANCORPORATION, NATIONAL ASSOCIATION AND SUBSIDIARIES
The following schedules present gross charge-offs categorized by year of loan origination for the periods presented:
Three Months Ended March 31, 2026
Term loans
Revolving loans gross charge-offs
Revolving loans converted to term loans gross charge-offs
Gross charge-offs by year of loan origination
(In millions)
2026
2025
2024
2023
2022
Prior
Total
Commercial:
Commercial and industrial
$
—
$
4
$
—
$
—
$
—
$
1
$
2
$
—
$
7
Consumer:
Bankcard and other revolving plans
—
—
—
—
—
—
3
—
3
Other
—
—
—
—
—
1
—
—
1
Total consumer
—
—
—
—
—
1
3
—
4
Total gross charge-offs
$
—
$
4
$
—
$
—
$
—
$
2
$
5
$
—
$
11
Three Months Ended March 31, 2025
Term loans
Revolving loans gross charge-offs
Revolving loans converted to term loans gross charge-offs
Gross charge-offs by year of loan origination
(In millions)
2025
2024
2023
2022
2021
Prior
Total
Commercial:
Commercial and industrial
$
—
$
—
$
1
$
—
$
1
$
10
$
7
$
—
$
19
Consumer:
1-4 family residential
—
—
—
—
1
1
—
—
2
Bankcard and other revolving plans
—
—
—
—
—
—
2
—
2
Other
—
—
—
—
—
—
1
—
1
Total consumer
—
—
—
—
1
1
3
—
5
Total gross charge-offs
$
—
$
—
$
1
$
—
$
2
$
11
$
10
$
—
$
24
Loan Modifications
Loans may be modified in the normal course of business for competitive reasons or to strengthen our collateral position. Modifications may also occur when the borrower experiences financial difficulty and requires temporary or permanent relief from the original contractual terms. For loans modified due to a borrower experiencing financial difficulty, we apply the same credit loss estimation methods used for the rest of the loan portfolio. These methods incorporate the post-modification loan terms, as well as defaults and charge-offs associated with historically modified loans. All nonaccruing loans greater than $1 million are evaluated individually, regardless of the type of modification.
We generally consider a borrower to be experiencing financial difficulty when available information indicates the borrower is unlikely to meet its contractual obligations without a modification of the loan terms. Indicators include actual or probable payment default; bankruptcy or the likelihood thereof; substantial doubt about the borrower’s ability to continue as a going concern; insufficient expected cash flows to service debt; or an inability to obtain financing at market terms. A borrower is also considered to be experiencing financial difficulty when repayment is dependent on support from a sponsor or guarantor. Additional indicators may include liquidity constraints, declining collateral values, failure to meet loan covenants, adverse industry changes, and sustained deterioration in financial performance.
A modified loan on nonaccrual will generally remain on nonaccrual until the borrower has demonstrated the ability to perform under the modified terms for a minimum of six months, and there is evidence that such payments can and are likely to continue as agreed. Performance prior to the modification, or significant events that coincide with the modification, are considered in assessing whether the borrower can meet the new terms and may result in the
ZIONS BANCORPORATION, NATIONAL ASSOCIATION AND SUBSIDIARIES
loan being returned to accrual at the time of modification or after a shorter performance period. If the borrower’s ability to meet the revised payment schedule is uncertain, the loan remains on nonaccrual.
We monitor the performance of all modified loans on an ongoing basis in accordance with their modified terms. Modified loans are considered to be in default if they become past due after modification. Commercial loans are considered to be in default when they are 90 days or more past due, while consumer loans are considered to be in default when they are 60 days or more past due. For the three months ended March 31, 2026 and March 31, 2025, there were no modified loans to borrowers experiencing financial difficulty that defaulted during the period and were modified within the previous 12 months preceding the default.
The amortized cost of loans to borrowers experiencing financial difficulty that were modified during the period, by loan class and modification type, is summarized in the following schedule:
Three Months Ended March 31, 2026
Amortized cost associated with the following modification types:
(Dollar amounts in millions)
Interest rate reduction
Maturity or term extension
Principal forgiveness
Payment deferral
Multiple modification types 1
Total 2
Percentage of total loans 3
Commercial:
Commercial and industrial
$
—
$
62
$
—
$
—
$
3
$
65
0.4
%
Owner-occupied
—
19
—
—
—
19
0.2
Total commercial
—
81
—
—
3
84
0.3
Commercial real estate:
Term
—
139
—
—
—
139
1.2
Consumer:
1-4 family residential
—
—
—
—
2
2
—
Total
$
—
$
220
$
—
$
—
$
5
$
225
0.4
Three Months Ended March 31, 2025
Amortized cost associated with the following modification types:
(Dollar amounts in millions)
Interest rate reduction
Maturity or term extension
Principal forgiveness
Payment deferral
Multiple modification types 1
Total 2
Percentage of total loans 3
Commercial:
Commercial and industrial
$
—
$
35
$
—
$
—
$
—
$
35
0.2
%
Owner-occupied
—
5
—
—
—
5
0.1
Total commercial
—
40
—
—
—
40
0.1
Commercial real estate:
Term
—
211
—
8
—
219
2.0
Construction and land development
—
31
—
—
—
31
1.1
Total commercial real estate
—
242
—
8
—
250
1.8
Consumer:
1-4 family residential
—
—
—
—
10
10
0.1
Total consumer
—
—
—
—
10
10
0.1
Total
$
—
$
282
$
—
$
8
$
10
$
300
0.5
1 Includes modifications that resulted from a combination of interest rate reduction, maturity or term extension, principal forgiveness, and payment deferral modifications.
2 Unfunded lending commitments related to loans modified to borrowers experiencing financial difficulty totaled $18 million and $8 millionat March 31, 2026 and March 31, 2025, respectively.
ZIONS BANCORPORATION, NATIONAL ASSOCIATION AND SUBSIDIARIES
The following schedule presents the financial impact of loan modifications to borrowers experiencing financial difficulty:
Three Months Ended March 31, 2026
Weighted-average interest rate reduction (in percentage points)
Weighted-average term extension (in months)
Commercial:
Commercial and industrial
1.9
%
18
Owner-occupied
—
6
Total commercial
1.9
16
Commercial real estate:
Term
—
7
Consumer:1
1-4 family residential
3.1
34
Total weighted average financial impact
2.7
11
Three Months Ended March 31, 2025
Weighted-average interest rate reduction (in percentage points)
Weighted-average term extension (in months)
Commercial:
Commercial and industrial
0.5
%
8
Owner-occupied
—
83
Total commercial
0.5
18
Commercial real estate:
Term
—
6
Construction and land development
—
12
Total commercial real estate
—
7
Consumer:
1-4 family residential
—
3
Total weighted average financial impact
0.5
8
Loan modifications to borrowers experiencing financial difficulty during the three months ended March 31, 2026, resulted in no principal forgiveness across the total loan portfolio, compared with principal forgiveness of less than $1 million during the corresponding period in 2025.
ZIONS BANCORPORATION, NATIONAL ASSOCIATION AND SUBSIDIARIES
The following schedule presents the aging of loans to borrowers experiencing financial difficulty that were modified on or after April 1, 2025 through March 31, 2026, categorized by portfolio segment and loan class:
March 31, 2026
(In millions)
Current
30-89 days past due
90+ days past due
Total past due
Total amortized cost of loans
Commercial:
Commercial and industrial
$
177
$
15
$
3
$
18
$
195
Owner-occupied
22
—
6
6
28
Total commercial
199
15
9
24
223
Commercial real estate:
Term
374
—
—
—
374
Construction and land development
5
—
—
—
5
Total commercial real estate
379
—
—
—
379
Consumer:
1-4 family residential
5
—
—
—
5
Home equity credit line
1
—
—
—
1
Total consumer
6
—
—
—
6
Total
$
584
$
15
$
9
$
24
$
608
The following schedule presents the aging of loans to borrowers experiencing financial difficulty that were modified on or after April 1, 2024 through March 31, 2025, categorized by portfolio segment and loan class:
March 31, 2025
(In millions)
Current
30-89 days past due
90+ days past due
Total past due
Total amortized cost of loans
Commercial:
Commercial and industrial
$
84
$
2
$
—
$
2
$
86
Owner-occupied
17
—
—
—
17
Municipal
—
—
8
8
8
Total commercial
101
2
8
10
111
Commercial real estate:
Term
339
8
—
8
347
Construction and land development
36
12
—
12
48
Total commercial real estate
375
20
—
20
395
Consumer:
1-4 family residential
14
—
—
—
14
Home equity credit line
1
—
—
—
1
Bankcard and other revolving plans
1
—
—
—
1
Total consumer
16
—
—
—
16
Total
$
492
$
22
$
8
$
30
$
522
Collateral-Dependent Loans
When a loan is individually evaluated for expected credit losses, we estimate a specific reserve for the loan based on (1) the projected present value of the loan’s future cash flows discounted at the loan’s effective interest rate, (2) the observable market price of the loan, or (3) the fair value of the loan’s underlying collateral.
Select information on loans for which the borrower is experiencing financial difficulty and repayment is expected to be provided substantially through the operation or sale of the underlying collateral, including the type of collateral and the extent to which the collateral secures the loans, is summarized as follows:
ZIONS BANCORPORATION, NATIONAL ASSOCIATION AND SUBSIDIARIES
March 31, 2026
(Dollar amounts in millions)
Amortized cost
Major types of collateral
Weighted average LTV 1
Commercial:
Commercial and industrial
$
2
Semi-trailers and semi-tractors
82%
Owner-occupied
16
Agriculture production and industrial buildings
68%
Municipal
2
Multifamily apartments
81%
Commercial real estate:
Term
41
Office building
57%
Consumer:
1-4 family residential
3
Single family residential
53%
Total
$
64
December 31, 2025
(Dollar amounts in millions)
Amortized cost
Major types of collateral
Weighted average LTV 1
Commercial:
Commercial and industrial
$
3
Single family residential
71%
Owner occupied
23
Agriculture production and industrial buildings
67%
Municipal
2
Multifamily apartments
93%
Commercial real estate:
Term
37
Office building
98%
Consumer:
1-4 family residential
5
Single family residential
62%
Total
$
70
1 The fair value is based on the most recent appraisal or other collateral evaluation.
Foreclosed Residential Real Estate
The balance of foreclosed residential real estate property totaled approximately $1 million at both March 31, 2026 and December 31, 2025. The amortized cost basis of consumer mortgage loans collateralized by residential real estate property that were in the process of foreclosure was $17 million and $20 million at both March 31, 2026 and December 31, 2025, respectively.
7. LEASES
We have operating and finance leases for branches, data centers, and corporate offices, including our headquarters in Salt Lake City, Utah. At March 31, 2026, we had407 branches, with 279 owned and 128 leased. The remaining maturities of our lease commitments range from the year 2026 to 2062, with some lease arrangements including options to extend or terminate the leases.
Leases with terms longer than twelve months are reported as a lease liability with a corresponding right-of-use (“ROU”) asset. ROU assets for operating leases and finance leases are included in “Other assets” and “Premises, equipment and software, net” on the consolidated balance sheet, respectively. The corresponding liabilities for those leases are included in “Other liabilities” and “Long-term debt,” respectively. For more information about our lease policies, see Note 8 of our 2025 Form 10-K.
ZIONS BANCORPORATION, NATIONAL ASSOCIATION AND SUBSIDIARIES
The following schedule presents ROU assets and lease liabilities with the associated weighted average remaining life and discount rate:
(In millions)
March 31, 2026
December 31, 2025
Operating leases
ROU assets, net of amortization
$
209
$
207
Lease liabilities
259
257
Finance leases
ROU assets, net of amortization
3
3
Lease liabilities
3
4
Weighted average remaining lease term (years)
Operating leases
9.3
9.4
Finance leases
14.4
14.7
Weighted average discount rate
Operating leases
4.0
%
4.0
%
Finance leases
3.2
%
3.2
%
The following schedule presents additional information related to lease expense:
Three Months Ended March 31,
(In millions)
2026
2025
Lease expense:
Operating lease expense
$
10
$
10
Other expenses associated with operating leases 1
15
16
Total lease expense
$
25
$
26
Related cash disbursements for operating leases
$
11
$
11
1Other expenses primarily include property taxes and building and property maintenance.
The following schedule presents the total contractual undiscounted lease payments for operating lease liabilities by expected due date for each of the next five years:
(In millions)
Total undiscounted lease payments
2026 1
$
33
2027
36
2028
37
2029
33
2030
30
Thereafter
147
Total lease payments
316
Less imputed interest
57
Total
$
259
1 Represents contractual maturities remaining in 2026.
We enter into certain lease agreements as a lessor of certain real estate properties, including bank-owned and subleased properties, to generate cash flows. These activities include leasing vacant suites within buildings that we partially occupy. Operating lease income totaled $4 million for each of the first quarters of 2026 and 2025.
At March 31, 2026 and December 31, 2025, we had originated equipment leases classified as sales-type or direct-financing leases with carrying amounts of $374 million and $367 million, respectively. Income recognized from these leases totaled $5 million for each of the first quarters of 2026 and 2025.
ZIONS BANCORPORATION, NATIONAL ASSOCIATION AND SUBSIDIARIES
8. LONG-TERM DEBT AND SHAREHOLDERS’ EQUITY
Long-Term Debt
Long-term debt carrying values include the par value of the debt, adjusted for unamortized premiums or discounts, unamortized debt issuance costs, and fair value hedge basis adjustments.
The following schedule presents the components of our long-term debt:
LONG-TERM DEBT
(In millions)
March 31, 2026
December 31, 2025
Subordinated notes 1
$
968
$
969
Senior notes
992
499
Finance lease obligations
3
4
Total
$
1,963
$
1,472
1 The change in the subordinated notes balance is primarily due to fair value hedge basis adjustments. See also Note 4.
During the first quarter of 2026, we issued $500 million of 4.48% Fixed-to-Floating Senior Notes, maturing on February 9, 2029. For more information about our long-term debt, see Note 13 of our 2025 Form 10-K.
Shareholders' Equity
Our preferred stock is listed on the National Association of Securities Dealers Automated Quotations (“NASDAQ”) Global Select Market under the ticker symbol “ZIONP.” We have 4.4 million authorized shares of preferred stock, without par value, each carrying a liquidation preference of $1,000 per share. At March 31, 2026, 66,139 shares of Series A preferred stock were outstanding.
Our common stock is listed on the NASDAQ Global Select Market under the ticker symbol “ZION.” At March 31, 2026, there were 147.1 million shares of common stock outstanding, each with a par value of $0.001. The aggregate balance of common stock and additional paid-in-capital was $1.7 billion at both March 31, 2026 and December 31, 2025.
In January 2026, we publicly announced a plan to repurchase up to $75 million of our common shares outstanding during the first quarter of 2026. During the first quarter of 2026, we repurchased approximately 1.3 million common shares outstanding for $77 million, at an average price of $60.79 per share. This amount included $2 million of shares acquired in connection with our stock compensation plan. In May 2026, we publicly announced a plan to repurchase up to $225 million of our common shares outstanding for the remainder of 2026.
At March 31, 2026, the AOCI balance reflected a net loss of $1.9 billion, primarily attributable to a decline in the fair value of fixed-rate AFS securities driven by changes in interest rates. This amount includes $1.5 billion ($1.2 billion after tax) of unrealized losses associated with securities previously transferred from AFS to HTM.
The following schedule presents the changes in AOCI:
ZIONS BANCORPORATION, NATIONAL ASSOCIATION AND SUBSIDIARIES
(In millions)
Net unrealized gains (losses) on investment securities
Net unrealized gains (losses) on derivatives and other
Pension and post-retirement
Total
Three Months Ended March 31, 2026
Balance at December 31, 2025
$
(1,917)
$
(23)
$
(1)
$
(1,941)
Other comprehensive income before reclassifications, net of tax
(21)
(22)
—
(43)
Amounts reclassified from AOCI, net of tax
40
9
—
49
Other comprehensive income
19
(13)
—
6
Balance at March 31, 2026
$
(1,898)
$
(36)
$
(1)
$
(1,935)
Income tax expense included in other comprehensive income
$
6
$
(4)
$
—
$
2
Three Months Ended March 31, 2025
Balance at December 31, 2024
$
(2,301)
$
(78)
$
(1)
$
(2,380)
Other comprehensive income before reclassifications, net of tax
68
5
—
73
Amounts reclassified from AOCI, net of tax
43
14
—
57
Other comprehensive income
111
19
—
130
Balance at March 31, 2025
$
(2,190)
$
(59)
$
(1)
$
(2,250)
Income tax expense included in other comprehensive income
$
36
$
6
$
—
$
42
Amounts reclassified from AOCI
(In millions)
Three Months Ended March 31,
AOCI components
2026
2025
Affected line item on statement of income
Net unrealized gains (losses) on investment securities
$
(53)
$
(57)
Securities gains (losses), net
Less: Income tax expense (benefit)
(13)
(14)
Total
$
(40)
$
(43)
Net unrealized gains (losses) on derivative instruments and other
$
(12)
$
(19)
Interest and fees on loans; Interest on short- and long-term borrowings
Less: Income tax expense (benefit)
(3)
(5)
Total
$
(9)
$
(14)
9. COMMITMENTS, GUARANTEES, AND CONTINGENT LIABILITIES
Commitments and Guarantees
We utilize various financial instruments, including loan commitments, commercial letters of credit, and standby letters of credit, to support our customers’ financing needs. These instruments expose us to varying degrees of credit, liquidity, and interest rate risk that are not fully reflected on the consolidated balance sheet. The associated credit risk is evaluated and recorded as a reserve for unfunded lending commitments, which is presented separately on the consolidated balance sheet.
The following schedule presents the contractual amounts related to off-balance sheet financial instruments used to support our customers’ financing needs:
(In millions)
March 31, 2026
December 31, 2025
Unfunded lending commitments 1
$
29,471
$
29,286
Standby letters of credit:
Financial
669
643
Performance
311
288
Commercial letters of credit
41
27
Total unfunded commitments
$
30,492
$
30,244
1Net of participations.
For more information about these commitments and guarantees including their terms and collateral requirements, see Note 16 of our 2025 Form 10-K.
ZIONS BANCORPORATION, NATIONAL ASSOCIATION AND SUBSIDIARIES
Legal Matters
We are involved in various legal proceedings or governmental inquiries, which may include litigation in court, arbitration, investigations, examinations, and other actions initiated or considered by governmental and self-regulatory agencies. These matters may relate to lending, deposit, and other customer relationships; supplier and contractual issues; employee matters; intellectual property disputes; personal injury and other tort claims; and regulatory or legal compliance issues. While many of these matters involve individual claims, we are also subject to putative class action claims and other broader claims.
Governmental and self-regulatory proceedings, investigations, examinations, and related actions may concern our banking, investment advisory, trust, securities, and other products and services; our customers’ involvement in money laundering, fraud, securities violations, and other illicit activities; or our policies and practices regarding such customer activities. They may also involve our compliance with the wide range of applicable banking, securities, and other laws and regulations. At any given time, we may be responding to subpoenas and requests for documents, data, or testimony and engaging in discussions to address or resolve these matters.
At March 31, 2026, we were subject to the following significant litigation:
•Two civil cases—Lifescan, Inc. and Johnson & Johnson Health Care Services v. Jeffrey C. Smith, et al., filed in December 2017, and Roche Diagnostics and Roche Diabetes Care Inc. v. Jeffrey C. Smith, et al., filed in March 2019—were brought against us in the United States District Court for the District of New Jersey. In these cases, certain manufacturers and distributors of medical products allege that we are liable for purportedly fraudulent conduct by a borrower of the Bank that sought bankruptcy protection in 2017. Discovery is substantially complete as to most parties. However, final rulings on certain dispositive motions remain pending, and additional dispositive motions have not yet been filed or resolved. Both cases are currently scheduled for trial in April 2027.
Based on our current knowledge, we believe that the estimated liabilities for litigation and other legal actions and claims, as reflected in our accruals and determined in accordance with applicable accounting guidance, are adequate. We also currently believe that any liabilities in excess of the amounts accrued, if any, arising from litigation and other legal actions and claims for which a loss is estimable, would not have a significant impact on our financial condition, results of operations, or cash flows. However, given the substantial uncertainties inherent in these matters—and the potentially significant or indeterminate damages sought in some cases—an unfavorable outcome could affect our financial condition, results of operations, or cash flows in a particular reporting period.
The process of estimating and assessing potential outcomes associated with litigation, arbitration, governmental or self-regulatory examinations, investigations, or similar matters is inherently uncertain and requires significant judgment. This uncertainty is especially pronounced in the early stages of a legal matter, when legal issues and relevant facts have not yet been fully developed, analyzed, or tested through discovery, trial or hearing preparation, substantive mediation or settlement discussions, or other procedural milestones. It is also especially relevant for class actions or other multi-party claims; matters involving complex procedural or substantive issues or novel legal theories; and examinations, investigations, or other actions initiated by governmental and self-regulatory agencies, where traditional adjudicative processes may not apply.
As a result, we are often unable to determine whether the likelihood of a favorable or unfavorable outcome is remote, reasonably likely, or probable—or to estimate the amount or range of a probable or reasonably likely loss—until relatively late in the life cycle of a legal matter, and in some cases not until several years have passed. Our assessments relating to these currently inestimable claims will evolve as developments occur, and actual outcomes may significantly differ from our estimates over time.
For more information regarding our accounting for legal matters, see Note 16 of our 2025 Form 10-K.
ZIONS BANCORPORATION, NATIONAL ASSOCIATION AND SUBSIDIARIES
10. REVENUE FROM CONTRACTS WITH CUSTOMERS
Revenue from contracts with customers, including noninterest income within the scope of the applicable accounting guidance, is recognized when control of the promised goods or services is transferred to the customer. Revenue is measured at an amount that reflects the consideration we expect to be entitled in exchange for those goods or services. Incremental costs of obtaining a contract are expensed as incurred when the related amortization period is one year or less. For more information regarding revenue from contracts with customers, see Note 17 of our 2025 Form 10-K.
Disaggregation of Revenue
The following schedule presents revenue from contracts with customers disaggregated by operating segment and reconciles those amounts to total noninterest income for the three months ended March 31, 2026 and 2025. Customer-related noninterest income from other sources represents revenue earned from customers that falls outside the scope of the applicable accounting guidance for revenue from contracts with customers.
Zions Bank
CB&T
Amegy
(In millions)
2026
2025
2026
2025
2026
2025
Commercial account fees
$
16
$
15
$
8
$
7
$
16
$
15
Card fees 1
12
12
4
4
7
7
Retail and business banking fees
6
5
4
3
4
4
Capital markets fees and income 2
—
—
—
1
1
8
Wealth management fees
4
4
2
1
5
5
Other customer-related fees
2
2
3
2
1
1
Total noninterest income from contracts with customers
40
38
21
18
34
40
Customer-related noninterest income from other sources
9
4
14
8
11
6
Total customer-related noninterest income
49
42
35
26
45
46
Noncustomer-related noninterest income
3
—
3
2
2
2
Total noninterest income
$
52
$
42
$
38
$
28
$
47
$
48
NBAZ
NSB
Vectra
(In millions)
2026
2025
2026
2025
2026
2025
Commercial account fees
$
3
$
2
$
3
$
3
$
2
$
2
Card fees 1
4
4
4
4
2
2
Retail and business banking fees
2
2
3
2
1
1
Capital markets fees and income 2
—
—
—
—
—
—
Wealth management fees
1
1
2
2
1
—
Other customer-related fees
—
1
—
—
1
1
Total noninterest income from contracts with customers
10
10
12
11
7
6
Customer-related noninterest income from other sources
ZIONS BANCORPORATION, NATIONAL ASSOCIATION AND SUBSIDIARIES
TCBW
Other
Consolidated Bank
(In millions)
2026
2025
2026
2025
2026
2025
Commercial account fees
$
1
$
1
$
(1)
$
—
$
48
$
45
Card fees 1
—
1
1
—
34
34
Retail and business banking fees
—
—
—
—
20
17
Capital markets fees and income 2
—
—
1
1
2
10
Wealth management fees
—
—
—
1
15
14
Other customer-related fees
—
—
8
6
15
13
Total noninterest income from contracts with customers
1
2
9
8
134
133
Customer-related noninterest income from other sources
1
—
(2)
4
38
25
Total customer-related noninterest income
2
2
7
12
172
158
Noncustomer-related noninterest income
—
—
7
9
15
13
Total noninterest income
$
2
$
2
$
14
$
21
$
187
$
171
1 Card fees exclude costs associated with reward programs that are netted against interchange fees, as these costs fall outside the scope of the applicable accounting guidance for revenue from contracts with customers.
2 Capital markets fees and income exclude revenue related to real estate capital markets, swaps, loan syndications, foreign exchange activities, and net credit valuation adjustment (“CVA”), as these items are not within the scope of the applicable accounting guidance for revenue from contracts with customers.
Revenue from contracts with customers did not result in significant contract assets or contract liabilities. Contract receivables are included in “Other assets” on the consolidated balance sheet. Although payment terms vary based on the nature of the services provided, the interval between satisfying performance obligations and receiving payment is generally short and not considered significant.
11. INCOME TAXES
The effective income tax rate was 20.7% for the first quarter of 2026, compared with 28.9% for the first quarter of 2025. The tax rates during these periods were primarily increased by the nondeductibility of certain Federal Deposit Insurance Corporation (“FDIC”) premiums, disallowed interest expense, and other adjustments. While FDIC insurance premiums are not deductible for tax purposes, FDIC special assessments are tax deductible. Conversely, the effective tax rates were primarily reduced by nontaxable municipal interest income and various tax credits.
The tax rate for the three months ended March 31, 2025 was further impacted by the enactment of new state tax legislation during the first quarter of 2025. This legislative change required a revaluation of our net deferred tax asset (“DTA”), which primarily arises from unrealized losses in AOCI on certain securities.
At March 31, 2026 and December 31, 2025, our net DTA totaled $684 million and $714 million, respectively. The net DTA or deferred tax liability (“DTL”) is included in either “Other assets” or “Other liabilities,” respectively, on the consolidated balance sheet.
We regularly evaluate our DTAs to determine whether a valuation allowance is required, applying the “more-likely-than-not” criterion that such assets will be realized and considering all available positive and negative evidence. Based on this evaluation, we concluded that no valuation allowance was required at March 31, 2026 or December 31, 2025.
For more information about the factors affecting our effective tax rate, the significant components of our DTAs and DTLs, and unrecognized tax benefits related to uncertain tax positions, see Note 20 of our 2025 Form 10-K.
ZIONS BANCORPORATION, NATIONAL ASSOCIATION AND SUBSIDIARIES
12. NET EARNINGS PER COMMON SHARE
The following schedule presents the basic and diluted net earnings per common share, calculated using the weighted-average number of shares outstanding:
Three Months Ended March 31,
(In millions, except shares and per share amounts)
2026
2025
Basic:
Net income
$
233
$
170
Less common and preferred dividends
68
66
Undistributed earnings
165
104
Less undistributed earnings applicable to nonvested shares
2
1
Undistributed earnings applicable to common shares
163
103
Distributed earnings applicable to common shares
66
64
Total earnings applicable to common shares
$
229
$
167
Weighted average common shares outstanding (in thousands)
146,946
147,321
Net earnings per common share
$
1.56
$
1.13
Diluted:
Total earnings applicable to common shares
$
229
$
167
Weighted average common shares outstanding (in thousands)
146,946
147,321
Dilutive effect of stock options (in thousands)
92
66
Weighted average diluted common shares outstanding (in thousands)
147,038
147,387
Net earnings per common share
$
1.56
$
1.13
The following schedule presents the weighted-average stock awards that were antidilutive and therefore excluded from the calculation of diluted earnings per share:
Three Months Ended March 31,
(In thousands)
2026
2025
Restricted stock and restricted stock units
1,965
1,750
Stock options
187
311
13. OPERATING SEGMENT INFORMATION
We provide a wide range of banking products and related services, primarily in 11 western states: Arizona, California, Colorado, Idaho, Nevada, New Mexico, Oregon, Texas, Utah, Washington, and Wyoming. Our operations are organized principally through seven separately managed affiliate banks, each operating under its own local brand and management team: Zions Bank, CB&T, Amegy, NBAZ, NSB, Vectra, and TCBW. These affiliate banks constitute our primary operating segments.
Our affiliate model emphasizes local authority and accountability, including locally informed pricing and product customization, to maximize customer satisfaction, strengthen community relationships, and improve profitability and shareholder returns.
At March 31, 2026, Zions Bank operated 92 branches in Utah, 25 branches in Idaho, and one branch in Wyoming. CB&T operated 77 branches in California. Amegy operated 76 branches in Texas. NBAZ operated 56 branches in Arizona. NSB operated 43 branches in Nevada. Vectra operated 33 branches in Colorado and one branch in New Mexico. TCBW operated two branches in Washington and one branch in Oregon. During the first three months of 2026, all of the Bank's assets and revenues were located in or derived from operations within the United States.
We focus on serving customers in the communities in which we operate. Each operating segment offers a wide range of banking products and related services, delivered digitally or through other traditional channels. These
ZIONS BANCORPORATION, NATIONAL ASSOCIATION AND SUBSIDIARIES
include commercial and small business banking, capital markets and investment banking, commercial real estate lending, retail banking, and wealth management.
The affiliate banks are supported by an enterprise-level segment—referred to as the “Other” segment—which provides governance and risk oversight, capital allocation, and strategic objectives, and includes centralized technology infrastructure, back-office operations, and certain business lines that are not managed through the affiliate structure.
Centrally provided services are allocated to the operating segments based on estimated or actual usage of those services. Capital is allocated according to the risk-weighted assets held by each segment. We utilize an internal funds transfer pricing (“FTP”) process to measure segment performance. This methodology is subject to ongoing refinement. Transactions between segments are generally conducted at fair value, with intercompany profits eliminated in consolidation. Total average loans and deposits for the segments include minor intercompany amounts and certain deposits with the “Other” segment.
We evaluate segment performance and allocate resources primarily based on income or loss from operations before income taxes. The accounting policies applied to the operating segments are consistent with those described in the Notes to Consolidated Financial Statements.
The chief operating decision maker (“CODM”) is our Chairman and Chief Executive Officer. The CODM regularly receives certain segment-level information, including net interest income, noninterest income, significant noninterest expenses, and income or loss from operations before income taxes. This information is used to evaluate performance and inform resource allocation decisions for each segment.
The following schedule presents selected operating segment information that is regularly provided to the CODM to evaluate performance and allocate resources for the three months ended March 31, 2026 and 2025:
Zions Bank
CB&T
Amegy
(In millions)
2026
2025
2026
2025
2026
2025
SELECTED INCOME STATEMENT DATA
Net interest income 1
$
182
$
176
$
163
$
152
$
144
$
132
Provision for credit losses
(12)
6
—
10
(1)
3
Net interest income after provision for credit losses
ZIONS BANCORPORATION, NATIONAL ASSOCIATION AND SUBSIDIARIES
NBAZ
NSB
Vectra
(In millions)
2026
2025
2026
2025
2026
2025
SELECTED INCOME STATEMENT DATA
Net interest income 1
$
67
$
64
$
54
$
53
$
34
$
35
Provision for credit losses
8
(8)
4
—
(3)
8
Net interest income after provision for credit losses
59
72
50
53
37
27
Noninterest income
12
10
13
12
9
8
Noninterest expense:
Salaries and employee benefits
14
14
12
12
11
10
Technology, telecom, and information processing
1
1
1
1
1
1
Occupancy and equipment, net
3
3
3
3
3
3
Other direct expenses 2
4
9
4
5
3
3
Indirect/allocated expenses
26
25
24
23
16
16
Total noninterest expense
48
52
44
44
34
33
Income (loss) before taxes
$
23
$
30
$
19
$
21
$
12
$
2
SELECTED AVERAGE BALANCE SHEET DATA
Total average loans
$
5,610
$
5,701
$
3,745
$
3,657
$
3,706
$
3,921
Total average deposits
6,964
6,947
7,358
7,166
3,449
3,440
TCBW
Other
Consolidated Bank
(In millions)
2026
2025
2026
2025
2026
2025
SELECTED INCOME STATEMENT DATA
Net interest income 1
$
20
$
17
$
(2)
$
(5)
$
662
$
624
Provision for credit losses
(4)
(3)
1
2
(7)
18
Net interest income after provision for credit losses
24
20
(3)
(7)
669
606
Noninterest income
2
2
14
21
187
171
Noninterest expense:
Salaries and employee benefits
3
3
219
203
361
342
Technology, telecom, and information processing
1
1
63
59
74
70
Occupancy and equipment, net
1
1
7
7
41
41
Other direct expenses 2
1
1
38
26
86
85
Indirect/allocated expenses
4
3
(276)
(261)
—
—
Total noninterest expense
10
9
51
34
562
538
Income (loss) before taxes
$
16
$
13
$
(40)
$
(20)
$
294
$
239
SELECTED AVERAGE BALANCE SHEET DATA
Total average loans
$
2,088
$
1,964
$
876
$
930
$
61,141
$
59,635
Total average deposits
1,115
1,134
4,497
5,588
75,459
74,919
1 Interest income is shown net of interest expense consistent with the information regularly provided to the CODM and used to evaluate segment performance.
2 Other direct expenses include professional and legal services, marketing and business development, deposit insurance and regulatory expense, credit-related expense, other real estate expense, and other noninterest expenses.
ITEM 3. QUANTITATIVE AND QUALITATIVE DISCLOSURES ABOUT MARKET RISK
Our most significant risks include interest rate and market risk, which are actively monitored by management, as previously discussed. For more information regarding interest rate and market risk, see the “Interest Rate and Market Risk Management” section of this Form 10-Q.
ZIONS BANCORPORATION, NATIONAL ASSOCIATION AND SUBSIDIARIES
ITEM 4. CONTROLS AND PROCEDURES
Management, with the participation of our Chief Executive Officer and Chief Financial Officer, evaluated the effectiveness of our disclosure controls and procedures as of March 31, 2026. Based on this evaluation, our Chief Executive Officer and Chief Financial Officer concluded that our disclosure controls and procedures were effective as of March 31, 2026.
There were no changes in our internal control over financial reporting that occurred during the first quarter of 2026 that have materially affected, or are reasonably likely to materially affect, our internal control over financial reporting.
PART II. OTHER INFORMATION
ITEM 1. LEGAL PROCEEDINGS
The information contained in Note 9 of the Notes to Consolidated Financial Statements is incorporated by reference herein.
ITEM 1A. RISK FACTORS
There have been no material changes to the risk factors as previously disclosed in Part I, Item 1A. Risk Factors in our 2025 Form 10-K.
ITEM 2. UNREGISTERED SALES OF EQUITY SECURITIES AND USE OF PROCEEDS
Period
Total number
of shares
purchased 1
Average price paid per share
Total number of shares purchased as part of publicly announced plans or programs
January
4,888
$
59.35
—
February
1,267,507
$
60.80
1,235,089
March
—
$
—
—
First quarter 2026
1,272,395
$
60.79
1,235,089
1 Includes amounts related to common shares acquired in connection with our stock compensation plan. These shares were acquired from employees to cover their payroll taxes and stock option exercise costs upon the exercise of stock options.
ITEM 5. OTHER INFORMATION
No director or officer adopted, modified, or terminated a Rule 10b5-1(c) trading arrangement during the three months ended March 31, 2026. Our directors and officers participate in certain benefit plans, including our Omnibus Incentive Plan and Payshelter 401(k) and Employee Stock Ownership Plan. From time to time, they may elect to have shares withheld to satisfy tax-withholding obligations or to pay the exercise price of options granted under these plans. Such elections may be intended to satisfy the affirmative defense conditions of Rule 10b5-1 under the Exchange Act or may constitute non-Rule 10b5-1 trading arrangements as defined in Item 408(c) of Regulation S-K.
Second Amended and Restated Articles of Association of Zions Bancorporation, National Association, incorporated by reference to Exhibit 3.1 of Form 8-K filed on October 2, 2018.
Second Amended and Restated Bylaws of Zions Bancorporation, National Association, incorporated by reference to Exhibit 3.2 of Form 8-K filed on April 4, 2019.
Certification by Chief Executive Officer and Chief Financial Officer required by Sections 13(a) or 15(d), as applicable, of the Securities Exchange Act of 1934 (15 U.S.C. 78m) and 18 U.S.C. Section 1350 (furnished herewith).
101
Pursuant to Rules 405 and 406 of Regulation S-T, the following information is formatted in Inline XBRL (i) the Consolidated Balance Sheets as of March 31, 2026 and December 31, 2025, (ii) the Consolidated Statements of Income for the three months ended March 31, 2026 and March 31, 2025, (iii) the Consolidated Statements of Comprehensive Income for the three months ended March 31, 2026 and March 31, 2025, (iv) the Consolidated Statements of Changes in Shareholders’ Equity for the three months ended March 31, 2026 and March 31, 2025, (v) the Consolidated Statements of Cash Flows for the three months ended March 31, 2026 and March 31, 2025, and (vi) the Notes to Consolidated Financial Statements (filed herewith).
104
The cover page from this Quarterly Report on Form 10-Q, formatted as Inline XBRL.
* Incorporated by reference
Pursuant to Item 601(b)(4)(iii)(A) of Regulation S-K, copies of certain instruments defining the rights of holders of long-term debt are not filed. We agree to furnish a copy thereof to the Securities and Exchange Commission and the Office of the Comptroller of the Currency upon request.
ZIONS BANCORPORATION, NATIONAL ASSOCIATION AND SUBSIDIARIES
SIGNATURES
Pursuant to the requirements of the Securities Exchange Act of 1934, the registrant has duly caused this report to be signed on its behalf by the undersigned thereunto duly authorized.
ZIONS BANCORPORATION, NATIONAL ASSOCIATION
/s/ Harris H. Simmons
Harris H. Simmons, Chairman and Chief Executive Officer
/s/ R. Ryan Richards
R. Ryan Richards, Executive Vice President and Chief Financial Officer