|
The information in this preliminary pricing supplement is not complete and may be changed. A registration statement relating to these securities has been filed with the Securities and Exchange Commission. This preliminary pricing supplement and the accompanying product supplement, index supplement, prospectus supplement and prospectus are not an offer to sell these securities, nor are they soliciting an offer to buy these securities, in any state where the offer or sale is not permitted. SUBJECT TO COMPLETION, DATED OCTOBER 31, 2025 |
| Citigroup Global Markets Holdings Inc. |
November , 2025 Medium-Term Senior Notes, Series N Pricing Supplement No. 2025-USNCH[ ] Filed Pursuant to Rule 424(b)(2) Registration Statement Nos. 333-270327 and 333-270327-01 |
Autocallable Securities Linked to the S&P 500 Futures 40% Intraday Edge Volatility TCA 6% Decrement Index (USD) ER Due November 26, 2030
| ▪ | The securities offered by this pricing supplement are unsecured debt securities issued by Citigroup Global Markets Holdings Inc. and guaranteed by Citigroup Inc. Unlike conventional debt securities, the securities do not pay interest, do not guarantee the repayment of principal at maturity and are subject to potential automatic early redemption on a periodic basis on the terms described below. Your return on the securities will depend on the performance of the underlying specified below. |
| ▪ | The securities offer the potential for automatic early redemption at a premium following the first valuation date (other than the final valuation date) on which the closing value of the underlying is greater than or equal to the initial underlying value. If the securities are not automatically redeemed prior to maturity, the securities will provide for (i) repayment of the stated principal amount plus a premium at maturity if the final underlying value is greater than or equal to the initial underlying value or (ii) repayment of the stated principal amount at maturity, with no premium, if the final underlying value is less than the initial underlying value but greater than or equal to the final barrier value specified below. However, if the securities are not automatically redeemed prior to maturity and the final underlying value is less than the final barrier value, you will lose 1% of the stated principal amount of your securities for every 1% by which the final underlying value is less than the initial underlying value. Although you will have downside exposure to the underlying, you will not receive dividends with respect to the underlying or participate in any appreciation of the underlying. |
| ▪ | The underlying tracks exposure to the S&P 500 Futures Excess Return Index on a volatility-targeted, trend-adjusted basis, less certain notional costs and less a decrement of 6% per annum. The underlying is highly risky because it may reflect highly leveraged exposure to any decline in the S&P 500 Futures Excess Return Index. The S&P 500 Futures Excess Return Index tracks futures contracts on the S&P 500® Index and is likely to underperform the S&P 500® Index because of an implicit financing cost. In addition, notional costs and a decrement of 6% per annum will be a significant drag on the underlying’s performance. You should carefully review the section “Summary Risk Factors—Risks relating to the S&P 500 Futures 40% Intraday Edge Volatility TCA 6% Decrement Index (USD) ER” in this pricing supplement. |
| ▪ | Investors in the securities must be willing to accept (i) an investment that may have limited or no liquidity and (ii) the risk of not receiving any payments due under the securities if we and Citigroup Inc. default on our obligations. All payments on the securities are subject to the credit risk of Citigroup Global Markets Holdings Inc. and Citigroup Inc. |
| KEY TERMS | |
| Issuer: | Citigroup Global Markets Holdings Inc., a wholly owned subsidiary of Citigroup Inc. |
| Guarantee: | All payments due on the securities are fully and unconditionally guaranteed by Citigroup Inc. |
| Underlying: | The S&P 500 Futures 40% Intraday Edge Volatility TCA 6% Decrement Index (USD) ER |
| Stated principal amount: | $1,000 per security |
| Pricing date: | November 21, 2025 |
| Issue date: | November 26, 2025 |
| Maturity date: | Unless earlier redeemed, November 26, 2030 |
| Automatic early redemption: | If, on any valuation date prior to the final valuation date, the closing value of the underlying is greater than or equal to the initial underlying value, the securities will be automatically redeemed on the third business day immediately following that valuation date for an amount in cash per security equal to $1,000 plus the premium applicable to that valuation date. If the securities are automatically redeemed following any valuation date prior to the final valuation date, they will cease to be outstanding and you will not receive the premium applicable to any later valuation date. |
| Payment at maturity: |
If the securities are not automatically redeemed prior to maturity, you will receive at maturity for each security you then hold: § If the final underlying value is greater than or equal to the initial underlying value: $1,000 + the premium applicable to the final valuation date § If the final underlying value is less than the initial underlying value but greater than or equal to the final barrier value: $1,000 § If the final underlying value is less than the final barrier value: $1,000 + ($1,000 × the underlying return) If the securities are not automatically redeemed prior to maturity and the final underlying value is less than the final barrier value, you will receive significantly less than the stated principal amount of your securities, and possibly nothing, at maturity. |
| Initial underlying value: | , the closing value of the underlying on the pricing date |
| Final underlying value: | The closing value of the underlying on the final valuation date |
| Final barrier value: | , 60.00% of the initial underlying value |
| Listing: | The securities will not be listed on any securities exchange |
| Underwriter: | Citigroup Global Markets Inc. (“CGMI”), an affiliate of the issuer, acting as principal |
| Underwriting fee and issue price: | Issue price(1) | Underwriting fee(2) | Proceeds to issuer(3) |
| Per security: | $1,000.00 | $45.00 | $955.00 |
| Total: | $ | $ | $ |
(Key Terms continued on next page)
(1) Citigroup Global Markets Holdings Inc. currently expects that the estimated value of the securities on the pricing date will be at least $850.00 per security, which will be less than the issue price. The estimated value of the securities is based on CGMI’s proprietary pricing models and our internal funding rate. It is not an indication of actual profit to CGMI or other of our affiliates, nor is it an indication of the price, if any, at which CGMI or any other person may be willing to buy the securities from you at any time after issuance. See “Valuation of the Securities” in this pricing supplement.
(2) CGMI will receive an underwriting fee of up to $45.00 for each security sold in this offering. The total underwriting fee and proceeds to issuer in the table above give effect to the actual total underwriting fee. For more information on the distribution of the securities, see “Supplemental Plan of Distribution” in this pricing supplement. In addition to the underwriting fee, CGMI and its affiliates may profit from expected hedging activity related to this offering, even if the value of the securities declines. See “Use of Proceeds and Hedging” in the accompanying prospectus.
(3) The per security proceeds to issuer indicated above represent the minimum per security proceeds to issuer for any security, assuming the maximum per security underwriting fee. As noted above, the underwriting fee is variable.
Investing in the securities involves risks not associated with an investment in conventional debt securities. See “Summary Risk Factors” beginning on page PS-9.
Neither the Securities and Exchange Commission (the “SEC”) nor any state securities commission has approved or disapproved of the securities or determined that this pricing supplement and the accompanying product supplement, index supplement, prospectus supplement and prospectus are truthful or complete. Any representation to the contrary is a criminal offense.
You should read this pricing supplement together with the accompanying product supplement, index supplement, prospectus supplement and prospectus, which can be accessed via the hyperlinks below:
| Product Supplement No. EA-02-10 dated March 7, 2023 | Index Supplement No. IS-17-01 dated September 29, 2025 |
Prospectus Supplement and Prospectus each dated March 7, 2023
The securities are not bank deposits and are not insured or guaranteed by the Federal Deposit Insurance Corporation or any other governmental agency, nor are they obligations of, or guaranteed by, a bank.
| Citigroup Global Markets Holdings Inc. |
| KEY TERMS (continued) | |
| Valuation dates and premiums: |
The premium applicable to each valuation date is set forth below. The premium may be significantly less than the appreciation of the underlying from the pricing date to the applicable valuation date. |
| Valuation date* | Premium | |
| November 23, 2026 | 22.0000% of the stated principal amount | |
| December 21, 2026 | 23.8333% of the stated principal amount | |
| January 21, 2027 | 25.6667% of the stated principal amount | |
| February 22, 2027 | 27.5000% of the stated principal amount | |
| March 22, 2027 | 29.3333% of the stated principal amount | |
| April 21, 2027 | 31.1667% of the stated principal amount | |
| May 21, 2027 | 33.0000% of the stated principal amount | |
| June 21, 2027 | 34.8333% of the stated principal amount | |
| July 21, 2027 | 36.6667% of the stated principal amount | |
| August 23, 2027 | 38.5000% of the stated principal amount | |
| September 21, 2027 | 40.3333% of the stated principal amount | |
| October 21, 2027 | 42.1667% of the stated principal amount | |
| November 22, 2027 | 44.0000% of the stated principal amount | |
| December 21, 2027 | 45.8333% of the stated principal amount | |
| January 21, 2028 | 47.6667% of the stated principal amount | |
| February 22, 2028 | 49.5000% of the stated principal amount | |
| March 21, 2028 | 51.3333% of the stated principal amount | |
| April 21, 2028 | 53.1667% of the stated principal amount | |
| May 22, 2028 | 55.0000% of the stated principal amount | |
| June 21, 2028 | 56.8333% of the stated principal amount | |
| July 21, 2028 | 58.6667% of the stated principal amount | |
| August 21, 2028 | 60.5000% of the stated principal amount | |
| September 21, 2028 | 62.3333% of the stated principal amount | |
| October 23, 2028 | 64.1667% of the stated principal amount | |
| November 21, 2028 | 66.0000% of the stated principal amount | |
| December 21, 2028 | 67.8333% of the stated principal amount | |
| January 22, 2029 | 69.6667% of the stated principal amount | |
| February 21, 2029 | 71.5000% of the stated principal amount | |
| March 21, 2029 | 73.3333% of the stated principal amount | |
| April 23, 2029 | 75.1667% of the stated principal amount | |
| May 21, 2029 | 77.0000% of the stated principal amount | |
| June 21, 2029 | 78.8333% of the stated principal amount | |
| July 23, 2029 | 80.6667% of the stated principal amount | |
| August 21, 2029 | 82.5000% of the stated principal amount | |
| September 21, 2029 | 84.3333% of the stated principal amount | |
| October 22, 2029 | 86.1667% of the stated principal amount | |
| November 21, 2029 | 88.0000% of the stated principal amount | |
| December 21, 2029 | 89.8333% of the stated principal amount | |
| January 22, 2030 | 91.6667% of the stated principal amount | |
| February 21, 2030 | 93.5000% of the stated principal amount | |
| March 21, 2030 | 95.3333% of the stated principal amount | |
| April 22, 2030 | 97.1667% of the stated principal amount | |
| May 21, 2030 | 99.0000% of the stated principal amount | |
| June 21, 2030 | 100.8333% of the stated principal amount | |
| July 22, 2030 | 102.6667% of the stated principal amount | |
| August 21, 2030 | 104.5000% of the stated principal amount | |
| September 23, 2030 | 106.3333% of the stated principal amount | |
| October 21, 2030 | 108.1667% of the stated principal amount | |
| November 21, 2030 (the “final valuation date”) | 110.0000% of the stated principal amount | |
| *Each valuation date is subject to postponement if such date is not a scheduled trading day or certain market disruption events occur | ||
| Underlying return: | (i) The final underlying value minus the initial underlying value, divided by (ii) the initial underlying value |
| CUSIP / ISIN: | 17331BXU8 / US17331BXU87 |
| PS-2 |
| Citigroup Global Markets Holdings Inc. |
Additional Information
The terms of the securities are set forth in the accompanying product supplement, prospectus supplement and prospectus, as supplemented by this pricing supplement. The accompanying product supplement, prospectus supplement and prospectus contain important disclosures that are not repeated in this pricing supplement. For example, the accompanying product supplement contains important information about how the closing value of the underlying will be determined and about adjustments that may be made to the terms of the securities upon the occurrence of market disruption events and other specified events with respect to the underlying. The accompanying index supplement contains important information about the underlying that is not repeated in this pricing supplement. It is important that you read the accompanying product supplement, index supplement, prospectus supplement and prospectus together with this pricing supplement in deciding whether to invest in the securities. Certain terms used but not defined in this pricing supplement are defined in the accompanying product supplement or the accompanying index supplement.
| PS-3 |
| Citigroup Global Markets Holdings Inc. |
Summary Index Description
All information contained in this pricing supplement regarding the S&P 500 Futures 40% Intraday Edge Volatility TCA 6% Decrement Index (USD) ER (the “underlying” or the “Index”) has been derived from information provided by S&P Dow Jones Indices LLC, the Index sponsor, without independent verification. This information reflects the policies of, and is subject to change by, the Index sponsor. The Index sponsor has no obligation to continue to publish the Index and may discontinue publication of the Index at any time. The Index launched on August 14, 2025 and, therefore, has a limited performance history.
The Index tracks exposure to the S&P 500 Futures Excess Return Index (which we refer to as the “Underlying Futures Index”) on a volatility-targeted, trend-adjusted basis, less certain notional costs and less a decrement of 6% per annum. The Index has a volatility target of 40%, which it attempts to achieve by applying leverage to its exposure to the Underlying Futures Index (up to a maximum of 500%) when the underlying volatility is less than the volatility target, and by reducing its exposure to the Underlying Futures Index below 100% when the underlying volatility is greater than the volatility target. The Index may reset its exposure to the Underlying Futures Index at each of four intraday windows during each index business day based on a measure of the underlying volatility at the related intraday fixing time, subject to scaling up or down depending on a measure of the intraday trend of the Underlying Futures Index at that time (and, for the fourth intraday window only, subject to adjustment up or down based on the overnight mean-reversion trend), and may reset its exposure again at the closing of trading, all as described in more detail in the accompanying Index Supplement.
The Underlying Futures Index tracks the performance of a hypothetical investment, rolled quarterly, in futures contracts on the S&P 500® Index, and accordingly is expected to reflect the performance of the S&P 500® Index less an implicit financing cost. The S&P 500® Index consists of the common stocks of 500 issuers selected to provide a performance benchmark for the large capitalization segment of the U.S. equity market.
The methodology of the Index is premised on the following key assumptions: (1) that there will be an inverse relationship between performance and volatility, so that the Underlying Futures Index will tend to increase in times of lower volatility and decline in times of higher volatility; (2) that short-term intraday trends in the value of the Underlying Futures Index will tend to continue; (3) that the Index rules can effectively identify when conditions are favorable for an overnight mean-reversion in the Underlying Futures Index and effectively adjust its exposure to the Underlying Futures Index up or down in response; (4) that the applicable measures of underlying volatility used by the Index will be effective predictors of future volatility of the Underlying Futures Index from one intraday window to the next; and (5) that the volatility target for the Index will be an effective level of volatility at which to draw the line between leveraged exposure and deleveraged exposure to the Underlying Futures Index. If these assumptions prove to be consistently correct, then the Index has the potential to outperform the Underlying Futures Index by participating in increases on a leveraged basis and declines on a deleveraged basis. There is no guarantee, however, that these assumptions will be proven correct over any given time period. If any of these assumptions does not prove to be consistently correct, then the Index may perform poorly as a result of having highly leveraged exposure to the Underlying Futures Index at a time of declines and/or having reduced exposure to the Underlying Futures Index at a time of increases.
If the Index is not consistently successful in increasing exposure to the Underlying Futures Index in advance of increases in the Underlying Futures Index and reducing exposure to the Underlying Futures Index in advance of declines, then the Index is also expected to be subject to a “decay” effect, which will exacerbate the decline in the Index that results from having highly leveraged exposure to declines in the Underlying Futures Index. The decay effect would result from the fact that the Index resets its exposure to the Underlying Futures Index multiple times each index business day, and would manifest any time the Underlying Futures Index moves in one direction from one intraday window to the next and another direction from that subsequent intraday window to the next after that. The decay effect would result because resetting exposure after an increase but in advance of a decline would cause the Index to have increased exposure to that decline, and resetting exposure following a decline but in advance of an increase would cause the Index to have decreased exposure to that increase. The more this fact pattern repeats, the lower the performance of the Index would be relative to the performance of the Underlying Futures Index.
It is important to understand that the Index provides exposure to the S&P 500® Index that:
| 1. | may be leveraged up to 500%, or alternatively may reflect less than 100% participation; |
| 2. | is reduced by an implicit financing cost; |
| 3. | may be subject to a decay effect; |
| 4. | is reduced by notional costs that will be greater with more frequent and larger adjustments of the exposure of the Index to the Underlying Futures Index; and |
| 5. | is reduced by a decrement of 6% per annum. |
As a result of these features, the Index may significantly underperform the S&P 500® Index. The Index is likely to significantly underperform the S&P 500® Index if it is not consistently successful in increasing exposure to the Underlying Futures Index in advance of increases in the Underlying Futures Index and reducing exposure to the Underlying Futures Index in advance of declines in the Underlying Futures Index. The Index may significantly underperform the S&P 500® Index even if it is consistently successful in these respects because of the implicit financing cost, the notional costs and the decrement, or because the reduced exposure of the Index to the Underlying Futures Index at a time of a decline may nevertheless reflect significantly greater than 100% participation in the decline of the Underlying Futures Index.
Certain features of the Index – including the fact that it references the Underlying Futures Index, and not the S&P 500® Index directly, the deduction of notional costs and the decrement of 6% per annum – are designed to reduce and/or offset the cost to us and our affiliates of hedging transactions that we intend to enter into in connection with the securities as compared to an otherwise comparable index without these features. These features will reduce the performance of the Index as compared to an otherwise comparable index without these features. The reduced and/or offset cost of hedging may make it possible for certain terms of the securities to be more favorable to you than would otherwise be the case. However, there can be no assurance that these more favorable terms will offset the negative effects of these features on the performance of
| PS-4 |
| Citigroup Global Markets Holdings Inc. |
the Index, and your return on the securities may ultimately be less favorable than it would have been without these more favorable terms but with an index that does not contain these features.
This section contains only a summary description of the Index and does not describe all of its important features in detail. Before investing in the securities, you should carefully review the more detailed description of the Index in the accompanying Index Supplement.
| PS-5 |
| Citigroup Global Markets Holdings Inc. |
Hypothetical Payment Upon Automatic Early Redemption
The following table illustrates how the amount payable per security upon automatic early redemption will be calculated if the closing value of the underlying on any valuation date prior to the final valuation date is greater than or equal to the initial underlying value.
| If the first valuation date on which the closing value of the underlying is greater than or equal to the initial underlying value is... | ...then you will receive the following payment per security upon automatic early redemption: |
| November 23, 2026 | $1,000 + applicable premium = $1,000 + $220.000 = $1,220.000 |
| December 21, 2026 | $1,000 + applicable premium = $1,000 + $238.333 = $1,238.333 |
| January 21, 2027 | $1,000 + applicable premium = $1,000 + $256.667 = $1,256.667 |
| February 22, 2027 | $1,000 + applicable premium = $1,000 + $275.000 = $1,275.000 |
| March 22, 2027 | $1,000 + applicable premium = $1,000 + $293.333 = $1,293.333 |
| April 21, 2027 | $1,000 + applicable premium = $1,000 + $311.667 = $1,311.667 |
| May 21, 2027 | $1,000 + applicable premium = $1,000 + $330.000 = $1,330.000 |
| June 21, 2027 | $1,000 + applicable premium = $1,000 + $348.333 = $1,348.333 |
| July 21, 2027 | $1,000 + applicable premium = $1,000 + $366.667 = $1,366.667 |
| August 23, 2027 | $1,000 + applicable premium = $1,000 + $385.000 = $1,385.000 |
| September 21, 2027 | $1,000 + applicable premium = $1,000 + $403.333 = $1,403.333 |
| October 21, 2027 | $1,000 + applicable premium = $1,000 + $421.667 = $1,421.667 |
| November 22, 2027 | $1,000 + applicable premium = $1,000 + $440.000 = $1,440.000 |
| December 21, 2027 | $1,000 + applicable premium = $1,000 + $458.333 = $1,458.333 |
| January 21, 2028 | $1,000 + applicable premium = $1,000 + $476.667 = $1,476.667 |
| February 22, 2028 | $1,000 + applicable premium = $1,000 + $495.000 = $1,495.000 |
| March 21, 2028 | $1,000 + applicable premium = $1,000 + $513.333 = $1,513.333 |
| April 21, 2028 | $1,000 + applicable premium = $1,000 + $531.667 = $1,531.667 |
| May 22, 2028 | $1,000 + applicable premium = $1,000 + $550.000 = $1,550.000 |
| June 21, 2028 | $1,000 + applicable premium = $1,000 + $568.333 = $1,568.333 |
| July 21, 2028 | $1,000 + applicable premium = $1,000 + $586.667 = $1,586.667 |
| August 21, 2028 | $1,000 + applicable premium = $1,000 + $605.000 = $1,605.000 |
| September 21, 2028 | $1,000 + applicable premium = $1,000 + $623.333 = $1,623.333 |
| October 23, 2028 | $1,000 + applicable premium = $1,000 + $641.667 = $1,641.667 |
| November 21, 2028 | $1,000 + applicable premium = $1,000 + $660.000 = $1,660.000 |
| December 21, 2028 | $1,000 + applicable premium = $1,000 + $678.333 = $1,678.333 |
| January 22, 2029 | $1,000 + applicable premium = $1,000 + $696.667 = $1,696.667 |
| February 21, 2029 | $1,000 + applicable premium = $1,000 + $715.000 = $1,715.000 |
| March 21, 2029 | $1,000 + applicable premium = $1,000 + $733.333 = $1,733.333 |
| April 23, 2029 | $1,000 + applicable premium = $1,000 + $751.667 = $1,751.667 |
| May 21, 2029 | $1,000 + applicable premium = $1,000 + $770.000 = $1,770.000 |
| June 21, 2029 | $1,000 + applicable premium = $1,000 + $788.333 = $1,788.333 |
| July 23, 2029 | $1,000 + applicable premium = $1,000 + $806.667 = $1,806.667 |
| August 21, 2029 | $1,000 + applicable premium = $1,000 + $825.000 = $1,825.000 |
| September 21, 2029 | $1,000 + applicable premium = $1,000 + $843.333 = $1,843.333 |
| October 22, 2029 | $1,000 + applicable premium = $1,000 + $861.667 = $1,861.667 |
| November 21, 2029 | $1,000 + applicable premium = $1,000 + $880.000 = $1,880.000 |
| December 21, 2029 | $1,000 + applicable premium = $1,000 + $898.333 = $1,898.333 |
| January 22, 2030 | $1,000 + applicable premium = $1,000 + $916.667 = $1,916.667 |
| February 21, 2030 | $1,000 + applicable premium = $1,000 + $935.000 = $1,935.000 |
| March 21, 2030 | $1,000 + applicable premium = $1,000 + $953.333 = $1,953.333 |
| April 22, 2030 | $1,000 + applicable premium = $1,000 + $971.667 = $1,971.667 |
| May 21, 2030 | $1,000 + applicable premium = $1,000 + $990.000 = $1,990.000 |
| June 21, 2030 | $1,000 + applicable premium = $1,000 + $1,008.333 = $2,008.333 |
| July 22, 2030 | $1,000 + applicable premium = $1,000 + $1,026.667 = $2,026.667 |
| August 21, 2030 | $1,000 + applicable premium = $1,000 + $1,045.000 = $2,045.000 |
| September 23, 2030 | $1,000 + applicable premium = $1,000 + $1,063.333 = $2,063.333 |
| October 21, 2030 | $1,000 + applicable premium = $1,000 + $1,081.667 = $2,081.667 |
| PS-6 |
| Citigroup Global Markets Holdings Inc. |
If, on any valuation date prior to the final valuation date, the closing value of the underlying is less than the initial underlying value, you will not receive the premium indicated above following that valuation date. In order to receive the premium indicated above, the closing value of the underlying on the applicable valuation date must be greater than or equal to the initial underlying value.
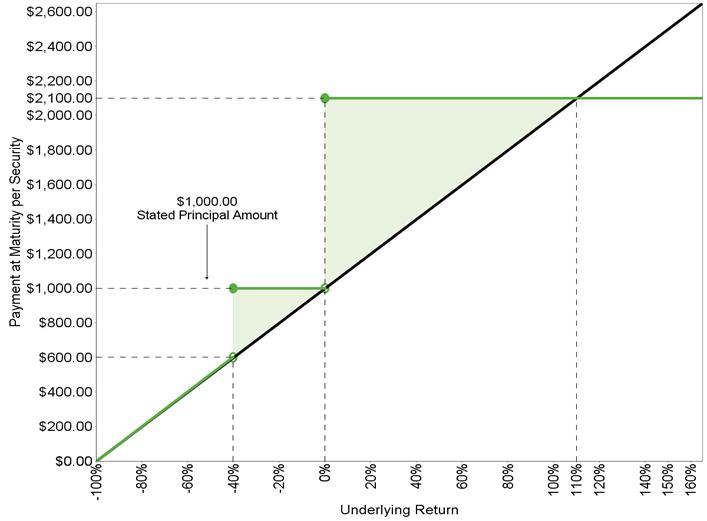
Payment at Maturity Diagram
The diagram below illustrates your payment at maturity of the securities, assuming the securities have not previously been automatically redeemed, for a range of hypothetical underlying returns.
Investors in the securities will not receive any dividends with respect to the underlying. The diagram and examples below do not show any effect of lost dividend yield over the term of the securities. See “Summary Risk Factors—You will not receive dividends or have any other rights with respect to the underlying” below.
| Payment at Maturity Diagram | |
| |
| n The Securities | n The Underlying |
| PS-7 |
| Citigroup Global Markets Holdings Inc. |
Hypothetical Examples of the Payment at Maturity
The examples below are intended to illustrate how, if the securities are not automatically redeemed prior to maturity, your payment at maturity will depend on the final underlying value. Your actual payment at maturity per security, if the securities are not automatically redeemed prior to maturity, will depend on the actual final underlying value. The examples are solely for illustrative purposes, do not show all possible outcomes and are not a prediction of any payment that may be made on the securities.
The examples below are based on the following hypothetical values and do not reflect the actual initial underlying value or final barrier value. For the actual initial underlying value and final barrier value, see the cover page of this pricing supplement. We have used these hypothetical values, rather than the actual values, to simplify the calculations and aid understanding of how the securities work. However, you should understand that the actual payment at maturity on the securities will be calculated based on the actual initial underlying value and final barrier value, and not the hypothetical values indicated below. For ease of analysis, figures below have been rounded.
| Hypothetical initial underlying value: | 100.00 |
| Hypothetical final barrier value: | 60.00 (60.00% of the hypothetical initial underlying value) |
Example 1—Upside Scenario. The final underlying value is 110.00, resulting in a 10.00% underlying return. In this example, the final underlying value is greater than the initial underlying value.
Payment at maturity per security = $1,000 + the premium applicable to the final valuation date
= $1,000 + $1,100.00
= $2,100.00
In this scenario, because the final underlying value is greater than the initial underlying value, you would be repaid the stated principal amount of your securities at maturity plus the premium applicable to the final valuation date.
Example 2—Par Scenario. The final underlying value is 85.00, resulting in a -15.00% underlying return. In this example, the final underlying value is less than the initial underlying value but greater than the final barrier value.
Payment at maturity per security = $1,000.00
In this scenario, the underlying has depreciated from the initial underlying value to the final underlying value so that the final underlying value is less than the initial underlying value but not below the final barrier value. As a result, you would be repaid the stated principal amount of your securities at maturity but would not receive any positive return on your investment.
Example 3—Downside Scenario. The final underlying value is 30.00, resulting in a -70.00% underlying return. In this example, the final underlying value is less than the final barrier value.
Payment at maturity per security = $1,000 + ($1,000 × the underlying return)
= $1,000 + ($1,000 × -70.00%)
= $1,000 + -$700.00
= $300.00
In this scenario, the underlying has depreciated from the initial underlying value to the final underlying value and the final underlying value is less than the final barrier value. As a result, your total return at maturity in this scenario would be negative and would reflect 1-to-1 exposure to the negative performance of the underlying.
| PS-8 |
| Citigroup Global Markets Holdings Inc. |
Summary Risk Factors
An investment in the securities is significantly riskier than an investment in conventional debt securities. The securities are subject to all of the risks associated with an investment in our conventional debt securities (guaranteed by Citigroup Inc.), including the risk that we and Citigroup Inc. may default on our obligations under the securities, and are also subject to risks associated with the underlying. Accordingly, the securities are suitable only for investors who are capable of understanding the complexities and risks of the securities. You should consult your own financial, tax and legal advisors as to the risks of an investment in the securities and the suitability of the securities in light of your particular circumstances.
The following is a summary of certain key risk factors for investors in the securities. You should read this summary together with the more detailed description of risks relating to an investment in the securities contained in the section “Risk Factors Relating to the Securities” beginning on page EA-7 in the accompanying product supplement. You should also carefully read the risk factors included in the accompanying prospectus supplement and in the documents incorporated by reference in the accompanying prospectus, including Citigroup Inc.’s most recent Annual Report on Form 10-K and any subsequent Quarterly Reports on Form 10-Q, which describe risks relating to the business of Citigroup Inc. more generally.
Risks relating to the securities
| § | You may lose a significant portion or all of your investment. Unlike conventional debt securities, the securities do not provide for the repayment of the stated principal amount at maturity in all circumstances. If the securities are not automatically redeemed prior to maturity, your payment at maturity will depend on the final underlying value. If the final underlying value is less than the final barrier value, you will lose 1% of the stated principal amount of your securities for every 1% by which the underlying has declined from the initial underlying value. There is no minimum payment at maturity on the securities, and you may lose up to all of your investment. |
| § | Your potential return on the securities is limited. Your potential return on the securities is limited to the applicable premium payable upon automatic early redemption or at maturity, as described on the cover page of this pricing supplement. If the closing value of the underlying on one of the valuation dates is greater than or equal to the initial underlying value, you will be repaid the stated principal amount of your securities and will receive the fixed premium applicable to that valuation date, regardless of how significantly the closing value of the underlying on that valuation date may exceed the initial underlying value. Accordingly, any premium may result in a return on the securities that is significantly less than the return you could have achieved on a direct investment in the underlying. |
| § | The securities do not pay interest. Unlike conventional debt securities, the securities do not pay interest prior to maturity. You should not invest in the securities if you seek current income during the term of the securities. |
| § | The securities may be automatically redeemed prior to maturity, limiting the term of the securities. If the closing value of the underlying on any valuation date (other than the final valuation date) is greater than or equal to the initial underlying value, the securities will be automatically redeemed. If the securities are automatically redeemed following any valuation date prior to the final valuation date, they will cease to be outstanding and you will not receive the premium applicable to any later valuation date. Moreover, you may not be able to reinvest your funds in another investment that provides a similar yield with a similar level of risk. |
| § | The securities offer downside exposure to the underlying, but no upside exposure to the underlying. You will not participate in any appreciation in the value of the underlying over the term of the securities. Consequently, your return on the securities will be limited to the applicable premium payable upon an automatic early redemption or at maturity and may be significantly less than the return on the underlying over the term of the securities. |
| § | The performance of the securities will depend on the closing values of the underlying solely on the valuation dates, which makes the securities particularly sensitive to volatility in the closing values of the underlying on or near the valuation dates. Whether the securities will be automatically redeemed prior to maturity will depend on the closing values of the underlying solely on the valuation dates (other than the final valuation date), regardless of the closing values of the underlying on other days during the term of the securities. If the securities are not automatically redeemed prior to maturity, what you receive at maturity will depend solely on the closing value of the underlying on the final valuation date, and not on any other day during the term of the securities. Because the performance of the securities depends on the closing values of the underlying on a limited number of dates, the securities will be particularly sensitive to volatility in the closing values of the underlying on or near the valuation dates. You should understand that the closing value of the underlying has historically been highly volatile. |
| § | The securities are subject to the credit risk of Citigroup Global Markets Holdings Inc. and Citigroup Inc. If we default on our obligations under the securities and Citigroup Inc. defaults on its guarantee obligations, you may not receive anything owed to you under the securities. |
| § | The securities will not be listed on any securities exchange and you may not be able to sell them prior to maturity. The securities will not be listed on any securities exchange. Therefore, there may be little or no secondary market for the securities. CGMI currently intends to make a secondary market in relation to the securities and to provide an indicative bid price for the securities on a daily basis. Any indicative bid price for the securities provided by CGMI will be determined in CGMI’s sole discretion, taking into account prevailing market conditions and other relevant factors, and will not be a representation by CGMI that the securities can be sold at that price, or at all. CGMI may suspend or terminate making a market and providing indicative bid prices without notice, at any time and for any reason. If CGMI suspends or terminates making a market, there may be no secondary market at all for the securities because it is likely that CGMI will be the only broker-dealer that is willing to buy your securities prior to maturity. Accordingly, an investor must be prepared to hold the securities until maturity. |
| § | The estimated value of the securities on the pricing date, based on CGMI’s proprietary pricing models and our internal funding rate, is less than the issue price. The difference is attributable to certain costs associated with selling, structuring and hedging the securities that are included in the issue price. These costs include (i) any selling concessions or other fees paid in connection with the |
| PS-9 |
| Citigroup Global Markets Holdings Inc. |
offering of the securities, (ii) hedging and other costs incurred by us and our affiliates in connection with the offering of the securities and (iii) the expected profit (which may be more or less than actual profit) to CGMI or other of our affiliates in connection with hedging our obligations under the securities. These costs adversely affect the economic terms of the securities because, if they were lower, the economic terms of the securities would be more favorable to you. The economic terms of the securities are also likely to be adversely affected by the use of our internal funding rate, rather than our secondary market rate, to price the securities. See “The estimated value of the securities would be lower if it were calculated based on our secondary market rate” below.
| § | The estimated value of the securities was determined for us by our affiliate using proprietary pricing models. CGMI derived the estimated value disclosed on the cover page of this pricing supplement from its proprietary pricing models. In doing so, it may have made discretionary judgments about the inputs to its models, such as the volatility of the closing value of the underlying, the dividend yield on the underlying and interest rates. CGMI’s views on these inputs may differ from your or others’ views, and as an underwriter in this offering, CGMI’s interests may conflict with yours. Both the models and the inputs to the models may prove to be wrong and therefore not an accurate reflection of the value of the securities. Moreover, the estimated value of the securities set forth on the cover page of this pricing supplement may differ from the value that we or our affiliates may determine for the securities for other purposes, including for accounting purposes. You should not invest in the securities because of the estimated value of the securities. Instead, you should be willing to hold the securities to maturity irrespective of the initial estimated value. |
| § | The estimated value of the securities would be lower if it were calculated based on our secondary market rate. The estimated value of the securities included in this pricing supplement is calculated based on our internal funding rate, which is the rate at which we are willing to borrow funds through the issuance of the securities. Our internal funding rate is generally lower than our secondary market rate, which is the rate that CGMI will use in determining the value of the securities for purposes of any purchases of the securities from you in the secondary market. If the estimated value included in this pricing supplement were based on our secondary market rate, rather than our internal funding rate, it would likely be lower. We determine our internal funding rate based on factors such as the costs associated with the securities, which are generally higher than the costs associated with conventional debt securities, and our liquidity needs and preferences. Our internal funding rate is not an interest rate that is payable on the securities. |
Because there is not an active market for traded instruments referencing our outstanding debt obligations, CGMI determines our secondary market rate based on the market price of traded instruments referencing the debt obligations of Citigroup Inc., our parent company and the guarantor of all payments due on the securities, but subject to adjustments that CGMI makes in its sole discretion. As a result, our secondary market rate is not a market-determined measure of our creditworthiness, but rather reflects the market’s perception of our parent company’s creditworthiness as adjusted for discretionary factors such as CGMI’s preferences with respect to purchasing the securities prior to maturity.
| § | The estimated value of the securities is not an indication of the price, if any, at which CGMI or any other person may be willing to buy the securities from you in the secondary market. Any such secondary market price will fluctuate over the term of the securities based on the market and other factors described in the next risk factor. Moreover, unlike the estimated value included in this pricing supplement, any value of the securities determined for purposes of a secondary market transaction will be based on our secondary market rate, which will likely result in a lower value for the securities than if our internal funding rate were used. In addition, any secondary market price for the securities will be reduced by a bid-ask spread, which may vary depending on the aggregate stated principal amount of the securities to be purchased in the secondary market transaction, and the expected cost of unwinding related hedging transactions. As a result, it is likely that any secondary market price for the securities will be less than the issue price. |
| § | The value of the securities prior to maturity will fluctuate based on many unpredictable factors. The value of your securities prior to maturity will fluctuate based on the closing value of the underlying, the volatility of the closing value of the underlying, the dividend yield on the underlying, interest rates generally, the time remaining to maturity and our and Citigroup Inc.’s creditworthiness, as reflected in our secondary market rate, among other factors described under “Risk Factors Relating to the Securities—Risk Factors Relating to All Securities—The value of your securities prior to maturity will fluctuate based on many unpredictable factors” in the accompanying product supplement. Changes in the closing value of the underlying may not result in a comparable change in the value of your securities. You should understand that the value of your securities at any time prior to maturity may be significantly less than the issue price. |
| § | Immediately following issuance, any secondary market bid price provided by CGMI, and the value that will be indicated on any brokerage account statements prepared by CGMI or its affiliates, will reflect a temporary upward adjustment. The amount of this temporary upward adjustment will steadily decline to zero over the temporary adjustment period. See “Valuation of the Securities” in this pricing supplement. |
| § | Our offering of the securities is not a recommendation of the underlying. The fact that we are offering the securities does not mean that we believe that investing in an instrument linked to the underlying is likely to achieve favorable returns. In fact, as we are part of a global financial institution, our affiliates may have positions (including short positions) in the underlying or in instruments related to the underlying, and may publish research or express opinions, that in each case are inconsistent with an investment linked to the underlying. These and other activities of our affiliates may affect the closing value of the underlying in a way that negatively affects the value of and your return on the securities. |
| § | The closing value of the underlying may be adversely affected by our or our affiliates’ hedging and other trading activities. We expect to hedge our obligations under the securities through CGMI or other of our affiliates, who may take positions in the underlying or in financial instruments related to the underlying and may adjust such positions during the term of the securities. Our affiliates also take positions in the underlying or in financial instruments related to the underlying on a regular basis (taking long or short positions or both), for their accounts, for other accounts under their management or to facilitate transactions on behalf of customers. These activities could affect the closing value of the underlying in a way that negatively affects the value of and your return on the securities. They could also result in substantial returns for us or our affiliates while the value of the securities declines. |
| PS-10 |
| Citigroup Global Markets Holdings Inc. |
| § | We and our affiliates may have economic interests that are adverse to yours as a result of our affiliates’ business activities. Our affiliates engage in business activities with a wide range of companies. These activities include extending loans, making and facilitating investments, underwriting securities offerings and providing advisory services. These activities could involve or affect the underlying in a way that negatively affects the value of and your return on the securities. They could also result in substantial returns for us or our affiliates while the value of the securities declines. In addition, in the course of this business, we or our affiliates may acquire non-public information, which will not be disclosed to you. |
| § | The calculation agent, which is an affiliate of ours, will make important determinations with respect to the securities. If certain events occur during the term of the securities, such as market disruption events and other events with respect to the underlying, CGMI, as calculation agent, will be required to make discretionary judgments that could significantly affect your return on the securities. In making these judgments, the calculation agent’s interests as an affiliate of ours could be adverse to your interests as a holder of the securities. See “Risk Factors Relating to the Securities—Risk Factors Relating to All Securities—The calculation agent, which is an affiliate of ours, will make important determinations with respect to the securities” in the accompanying product supplement. |
| § | If a material modification event occurs during the term of the securities, we may redeem the securities early for an amount that may result in a significant loss on your investment. See “Additional Terms of the Securities—Material Modification of the S&P 500 Futures 40% Intraday Edge Volatility TCA 6% Decrement Index (USD) ER” in this pricing supplement for information about the events that may constitute a material modification event. If a material modification event occurs, we may redeem the securities prior to the maturity date for an amount equal to the early redemption amount determined as of the early redemption notice date. The early redemption amount will be determined in a manner based upon (but not necessarily identical to) CGMI’s then contemporaneous practices for determining secondary market bid prices for the securities and similar instruments, subject to the exceptions and more detailed provisions set forth under “Additional Terms of the Securities—Material Modification of the S&P 500 Futures 40% Intraday Edge Volatility TCA 6% Decrement Index (USD) ER” below. As discussed above, any secondary market bid price is likely to be less than the issue price and, absent favorable changes in market conditions and other relevant factors, is also likely to be less than the estimated value of the securities set forth on the cover page of this pricing supplement. Accordingly, if a material modification event occurs, there is a significant likelihood that the early redemption amount you receive will result in a loss on your investment in the securities. The early redemption amount may be significantly less than the amount you would have received had we not elected to redeem the securities and had you been able instead to hold them to maturity. You may lose up to all of your investment. |
| § | The calculation agent may make determinations in connection with a material modification event and the early redemption amount that could adversely affect your return upon early redemption. The calculation agent will be required to determine whether a material modification event has occurred. If the calculation agent determines that a material modification event has occurred and as a result we elect to redeem the securities upon the occurrence of a material modification event, you may incur a significant loss on your investment in the securities. In addition, the calculation agent has broad discretion to determine the early redemption amount, including the ability to make adjustments to proprietary pricing models and inputs to those models in good faith and in a commercially reasonable manner. The fact that the calculation agent is our affiliate may cause it to have interests that are adverse to yours as a holder of the securities. Under the terms of the securities, the calculation agent has the authority to make determinations that may protect our economic interests while resulting in a significant loss to you on your investment in the securities. |
| § | The U.S. federal tax consequences of an investment in the securities are unclear. There is no direct legal authority regarding the proper U.S. federal tax treatment of the securities, and we do not plan to request a ruling from the Internal Revenue Service (the “IRS”). Consequently, significant aspects of the tax treatment of the securities are uncertain, and the IRS or a court might not agree with the treatment of the securities as prepaid forward contracts. If the IRS were successful in asserting an alternative treatment of the securities, the tax consequences of the ownership and disposition of the securities might be materially and adversely affected. Moreover, future legislation, Treasury regulations or IRS guidance could adversely affect the U.S. federal tax treatment of the securities, possibly retroactively. |
If you are a non-U.S. investor, you should review the discussion of withholding tax issues in “United States Federal Tax Considerations—Non-U.S. Holders” below.
You should read carefully the discussion under “United States Federal Tax Considerations” and “Risk Factors Relating to the Securities” in the accompanying product supplement and “United States Federal Tax Considerations” in this pricing supplement. You should also consult your tax adviser regarding the U.S. federal tax consequences of an investment in the securities, as well as tax consequences arising under the laws of any state, local or non-U.S. taxing jurisdiction.
Risks relating to the S&P 500 Futures 40% Intraday Edge Volatility TCA 6% Decrement Index (USD) ER
The following is a description of risks relating to the S&P 500 Futures 40% Intraday Edge Volatility TCA 6% Decrement Index (USD) ER, which we refer to in this section as the “Index”. The following discussion of risks should be read together with the section “Description of the S&P 500 Futures Intraday Edge Volatility Indices” in the accompanying index supplement, which defines and further describes a number of the terms and concepts referred to below.
| § | The Index is highly risky because it may reflect highly leveraged exposure to the Underlying Futures Index and may therefore experience a decline that is many multiples of any decline in the Underlying Futures Index. The Index tracks exposure to the S&P 500 Futures Excess Return Index (which we refer to as the “Underlying Futures Index”) on a volatility-targeted, trend-adjusted basis, less certain notional costs and less a decrement of 6% per annum. The Index has a volatility target of 40%, which it attempts to achieve by applying leverage to its exposure to the Underlying Futures Index (up to a maximum of 500%) when the underlying volatility is less than the volatility target, and by reducing its exposure to the Underlying Futures Index below 100% when the underlying volatility is greater than the volatility target. It is expected that the underlying volatility will frequently be less than the volatility target, and therefore it is expected that the Index will frequently have leveraged (more than 100%) exposure to the Underlying Futures Index. If the Underlying Futures Index declines at a time |
| PS-11 |
| Citigroup Global Markets Holdings Inc. |
when the Index has leveraged exposure to it, the decline in the Index will be equal to the decline in the Underlying Futures Index multiplied by the leveraged exposure (subject to further reduction as a result of the notional costs and the decrement). For example, if the Underlying Futures Index declines by 5% at a time when the Index has 500% leveraged exposure to the Underlying Futures Index, the Index will decline by 25% over that time (subject to further reduction as a result of the notional costs and the decrement). This potential for losses on a highly leveraged basis makes the Index highly risky.
| § | The Index may realize significant losses if it is not consistently successful in increasing exposure to the Underlying Futures Index in advance of increases in the Underlying Futures Index and reducing exposure to the Underlying Futures Index in advance of declines. The Index methodology is premised on the following key assumptions: (1) that there will be an inverse relationship between performance and volatility, so that the Underlying Futures Index will tend to increase in times of lower volatility and decline in times of higher volatility; (2) that short-term intraday trends in the value of the Underlying Futures Index will tend to continue; (3) that the Index rules can effectively identify when conditions are favorable for an overnight mean-reversion in the Underlying Futures Index and effectively adjust its exposure to the Underlying Futures Index up or down in response; (4) that the measures of underlying volatility used by the Index will be effective predictors of future volatility of the Underlying Futures Index from one intraday window to the next; and (5) that 40% will be an effective level of volatility at which to draw the line between leveraged exposure and deleveraged exposure to the Underlying Futures Index. There is no guarantee that these assumptions will be proven correct over any given time period. If any of these assumptions does not prove to be consistently correct, then the Index may perform poorly as a result of having highly leveraged exposure to the Underlying Futures Index at a time of declines and/or having reduced exposure to the Underlying Futures Index at a time of increases. |
| § | A significant portion of the Index may be hypothetically uninvested, dampening returns. If at any time the realized volatility of the Interim Index over the preceding 40 index business days exceeds the Index’s volatility target, the Index will have less than 100% exposure to the Interim Index, and the difference will be hypothetically uninvested. As a result, even at a time when the Interim Index reflects significantly more than 100% exposure to the Underlying Futures Index, the Index may reflect significantly less than 100% exposure to the Interim Index, lessening the impact on the Index of the leveraged exposure of the Interim Index to the Underlying Futures Index. Moreover, at any time when the underlying volatility is greater than the volatility target, the volatility-targeted exposure of the Interim Index to the Underlying Futures Index will be less than 100%. Even at a time when the volatility-targeted exposure of the Interim Index to the Underlying Futures Index would be greater than 100%, the actual exposure of the Interim Index to the Underlying Futures Index may be reduced below 100% by the intraday trend and/or overnight mean-reversion trend adjustments. Taken together, these mechanisms may result in the Index participating in less than 100% of the performance of the Underlying Futures Index, with the difference deemed to be hypothetically uninvested. No interest or other return will accrue on any portion of the Index (including the Interim Index) that is hypothetically uninvested, which will dampen Index returns, but the decrement will be deducted in an amount calculated on the full Index value. If at any time the Index has less than 100% effective exposure to the Underlying Futures Index, the Index will not fully participate in any appreciation of the Underlying Futures Index. For example, if the Index has 50% exposure to the Underlying Futures Index at a time when the Underlying Futures Index appreciates by 5%, the Index would appreciate by only 2.5% (before giving effect to the notional costs and the decrement). |
| § | The Index may significantly underperform the S&P 500® Index. It is important to understand that the Index provides exposure to the S&P 500® Index that: (1) may be leveraged up to 500%, or alternatively may reflect less than 100% participation; (2) is reduced by an implicit financing cost; (3) may be subject to a decay effect; (4) is reduced by notional costs; and (5) is reduced by a decrement of 6% per annum. As a result of these features, the Index may significantly underperform the S&P 500® Index. The Index is likely to significantly underperform the S&P 500® Index if it is not consistently successful in increasing exposure to the Underlying Futures Index in advance of increases in the Underlying Futures Index and reducing exposure to the Underlying Futures Index in advance of declines in the Underlying Futures Index. The Index may significantly underperform the S&P 500® Index even if it is consistently successful in these respects because of the implicit financing cost, the notional costs and the decrement, or because the reduced exposure the Index has to the Underlying Futures Index at a time of a decline may nevertheless reflect significantly greater than 100% participation in the decline of the Underlying Futures Index. |
| § | The Index may experience significantly greater volatility than its volatility target. The Index seeks to implement its volatility target in two steps. First, the Interim Index determines a volatility-targeted exposure to the Underlying Futures Index for each intraday window in a manner that seeks to align the volatility of the Interim Index with the volatility target. Second, the Index adjusts its exposure to the Interim Index daily pursuant to an end-of-day volatility target adjustment. Despite these steps, the Index may experience significantly greater volatility than its volatility target for a number of reasons. The Interim Index determines its exposure to the Underlying Futures Index based not only on the volatility-targeted exposure, but also on intraday trend and overnight mean-reversion trend inputs. Those inputs may result in the exposure of the Interim Index to the Underlying Futures Index being increased to a level that is significantly higher than the volatility-targeted exposure, and the Interim Index may experience significantly more volatility than the volatility target as a result. Moreover, although the end-of-day volatility target adjustment is intended to reduce the exposure of the Index to the Interim Index to counteract this, the end-of-day volatility target adjustment is based on the realized volatility of the Interim Index over a look-back period of 40 index business days. If there is a significant increase in the volatility of the Interim Index, it may be a significant period of time before that increased volatility is meaningfully reflected in the 40-day lookback period. If the Index experiences significantly great volatility than its volatility target, it may be riskier than expected and may experience a significantly greater decline than it would have if it had maintained its volatility target. |
| § | The Index’s intraday trend-following mechanism may not be effective. The Index incorporates a trend-following mechanism, in which it will scale the volatility-targeted exposure of the Interim Index to the Underlying Futures Index up or down depending on a measure of the intraday trend of the Underlying Futures Index. Trend-following methodologies such as the one followed by the Index are premised on the notion that equity markets exhibit momentum, whereby recent performance is predictive of future performance. Trend-following methodologies perform poorly, however, when this turns out not to be the case. There can be no guarantee that recent performance will be predictive of future performance. Trend-following methodologies perform particularly poorly in choppy markets, where they can be subject to whipsaws – increasing exposure following a recent increase and just in time to participate on a higher-exposure basis in a decline that follows the increase, at which point they decrease exposure following the decline and just when the underlying market begins to increase again. |
| PS-12 |
| Citigroup Global Markets Holdings Inc. |
Moreover, even if the Underlying Futures Index does exhibit trend-following behavior, there can be no assurance that the particular methodology followed by the Index will effectively identify the trend or capitalize on it. If the Underlying Futures Index does not exhibit momentum, or if the Index’s intraday trend-following methodology is not effective in identifying trends and capitalizing on them, the Index’s trend-following mechanism may result in scaling up the exposure to the Underlying Futures Index ahead of declines, and scaling down exposure ahead of increases, which would result in poor performance.
| § | The Index’s overnight mean-reversion mechanism may not be effective. The Index incorporates an overnight mean-reversion mechanism, in which it will adjust the trend-adjusted, volatility-targeted exposure to the Underlying Futures Index upward at the fourth intraday window at any time when it determines that conditions are favorable for a positive overnight mean-reversion, and will adjust that exposure downward at any time when it determines that conditions are favorable for a negative overnight mean-reversion. The Index’s overnight mean-reversion mechanism is premised on the assumption that equity markets may at times exhibit a tendency to revert to a longer term mean (on an overnight basis) after a short-term dip, and the Index seeks to capitalize on that tendency by identifying a time when a short-term dip has occurred and when the equity markets are due for a positive mean-reversion and increasing exposure to the Underlying Futures Index accordingly at the fourth intraday window. There can be no assurance, however, that the Underlying Futures Index will exhibit mean-reversion behavior when the Index expects it to do so, or at all. Even if the Underlying Futures Index does exhibit mean-reversion behavior, the particular methodology of the Index may fail to accurately identify when it will do so or may fail to capitalize on that. If the Underlying Futures Index does not exhibit mean-reversion behavior when the Index expects it to do so, the Index may increase its exposure to the Underlying Futures Index in a falling market that may continue to fall long after the Index has increased exposure, worsening Index returns as a result. Conversely, if the Underlying Futures Index does exhibit mean-reversion behavior when the Index does not expect it to, the Index will have reduced its exposure to the Underlying Futures Index at a time when the Underlying Futures Index has rebounded from the short-term dip, which will cause Index performance to be less favorable than it would have been if it had not tried to time the mean-reversion. |
| § | The Index may perform poorly in temporary market downturns. There is a time lag inherent in the Index’s volatility targeting mechanisms. Unless the VIX signal is 1, the Interim Index will determine its volatility-targeted exposure to the Underlying Futures Index based on a backward-looking measure of realized volatility of the Underlying Futures Index. Similarly, the Index will apply its end-of-day volatility target adjustment to its exposure to the Interim Index based on a backward-looking measure of realized volatility of the Interim Index. If there is a sudden spike in volatility and a corresponding sharp decline in the Underlying Futures Index, the Index may have a relatively high degree of exposure to the Underlying Futures Index at the time of the decline and may therefore have a high degree of exposure to that decline. The Index may subsequently reduce its exposure to the Underlying Futures Index once the increased volatility has been sufficiently reflected in the Index’s realized volatility measures, but by then the Underlying Futures Index may have already stopped its decline and started to recover. Given the time lag, the Index may not increase its exposure to the Underlying Futures Index until well after the recovery has already taken place. Taken together, these factors may cause the Index to perform particularly poorly in a temporary market downturn – a sudden significant decline that is quickly reversed. In that scenario, the Index would participate on a highly leveraged basis in the decline and then fail to participate fully in the recovery. |
| § | The Index may be adversely affected by a “decay” effect. If the Index is not consistently successful in increasing exposure to the Underlying Futures Index in advance of increases in the Underlying Futures Index and reducing exposure to the Underlying Futures Index in advance of declines in the Underlying Futures Index, then the Index is also expected to be subject to a “decay” effect, which will exacerbate the decline that results from having highly leveraged exposure to declines in the Underlying Futures Index. The decay effect would result from the fact that the Index resets its exposure to the Underlying Futures Index multiple times each index business day, and would manifest any time the Underlying Futures Index moves in one direction from one intraday window to the next and another direction from that subsequent intraday window to the next after that. The decay effect would result because resetting exposure after an increase but in advance of a decline would cause the Index to have increased exposure to that decline, and resetting exposure following a decline but in advance of an increase would cause the Index to have decreased exposure to that increase. The more this fact pattern repeats, the lower the performance of the Index would be relative to the performance of the Underlying Futures Index. |
| § | The Underlying Futures Index is expected to underperform the S&P 500® Index because of an implicit financing cost. The Underlying Futures Index is a futures-based index. As a futures-based index, it is expected to reflect not only the performance of its reference index (the S&P 500® Index), but also the implicit cost of a financed position in that reference index. The cost of this financed position will adversely affect the value of the Underlying Futures Index. Any increase in market interest rates will be expected to further increase this implicit financing cost and will increase the negative effect on the performance of the Underlying Futures Index. Because of this implicit financing cost, the Underlying Futures Index is expected to underperform the total return performance of the S&P 500® Index. |
| § | The performance of the Index will be reduced by notional costs and by a decrement of 6% per annum. Two types of notional costs are deducted from the performance of the Index. Notional transaction costs are deducted each time there is a change in the exposure of the Interim Index to the Underlying Futures Index or in the exposure of the Index to the Interim Index. Changes in the exposure may occur as often as five times a day – during each of the four intraday windows, and again pursuant to the end-of-day volatility target adjustment. The more frequent the changes in exposure and the larger the changes are in size, the greater the amount of the notional transaction costs. In addition to the notional transaction costs, notional replication costs are deducted on a daily basis from the level of the Interim Index. The greater the exposure of the Interim Index to the Underlying Futures Index, the greater the size of the notional replication costs. Moreover, the performance of the Index will be reduced by a decrement of 6% per annum, which will be calculated on the full value of the Index, including any portion that is hypothetically uninvested. The notional costs and the decrement will be a significant drag on the performance of the Index, potentially offsetting positive returns that would otherwise result from the Index methodology, exacerbating negative returns of the Index methodology and causing the level of the Index to decline steadily if the return of the Index methodology would otherwise be relatively flat. The Index will not appreciate unless the return of the Index methodology is sufficient to offset the negative effects of the notional costs and the decrement, and then only to the extent that the return of the Index methodology is greater than the notional costs and the decrement. As a |
| PS-13 |
| Citigroup Global Markets Holdings Inc. |
result of the notional costs and the decrement, the level of the Index may decline even if the return of the Index methodology would otherwise have been positive.
| § | The decrement of 6% per annum may reduce the annual return of the Index by more (and possibly significantly more) than 6%. The decrement is deducted from the level of the Index on each index business day at a rate of 6% per annum. Higher levels of the Index over any given period will therefore result in larger deductions. Moreover, while the decrement will reduce the level of the Index at a rate equal to 6% per annum, the effect of the decrement on the return of the Index over an annual period is likely to be greater, and may be significantly greater, than 6% if the level of the Index has appreciated over that annual period. For example, if the level of the Index before giving effect to the decrement were to increase from 100 to 150 over an annual period, the level of the Index after giving effect to the decrement might be 141, which is 6% less than 150. In this scenario, the return of the Index before giving effect to the decrement would have been 50%, while the return of the Index after giving effect to the decrement would have been 41% -- resulting in a return of the Index over this annual period that is 9% lower than it would have been before giving effect to the decrement. This example is not intended to be a prediction of the performance of the Index over any given period – it is solely intended to illustrate how the impact of the decrement on the return of the Index may be significantly greater than 6% per annum. These effects will be even greater over periods longer than one year. |
| § | The negative impact of notional costs on the annual return of the Index may be greater than the absolute amount by which notional costs reduce the level of the Index. Notional costs will negatively affect the annual return of the Index in the same way that the decrement does, as described in the preceding risk factor. Notional costs are deducted from the level of the Index or the Interim Index and, as a result, higher levels of the Index or the Interim Index will result in larger deductions. Moreover, as with the decrement and in the same manner described in the preceding risk factor, if the Index or the Interim Index appreciates over any annual period, notional costs will negatively impact the annual return of the Index over that period by more than the percentage that is deducted from the level of the Index or the Interim Index. The hypothetical back-tested and historical information regarding the impact of notional costs on the performance of the Index that is included in this pricing supplement reflects the impact of notional costs on the level of the Index – if these costs were expressed in terms of the impact on the annual return over any period over which the Index has appreciated, they would be greater. |
| § | The manner in which the Index measures underlying volatility may not be effective. The Index will measure the underlying volatility on a given index business day based on implied volatility if the VIX signal on the preceding index business day was 1, and based on realized volatility if the VIX signal on the preceding index business day was 0. The VIX signal will be 1 when the level of the Cboe Volatility Index (the “VIX”) has exceeded its 200-day moving average for more than 6 consecutive index business days, and will be 0 when the level of the VIX has been less than or equal to its 200-day moving average for more than 3 consecutive index business days (and otherwise will be the same as on the preceding index business day). The VIX is a measure of implied volatility of large-cap U.S. stocks over the next 30 days, calculated based on the prices of certain put and call options on the S&P 500® Index. As a result, the Index is designed to use the forward-looking implied volatility measurement at a time when implied volatility (as reflected in the VIX) is relatively elevated, and to use the backward-looking realized volatility measurement at a time of relatively lower implied volatility. |
| § | This approach to determining the underlying volatility is premised on the notion that forward-looking implied volatility tends to be higher than backward-looking realized volatility because of a risk premium embedded in the options used to calculate forward-looking implied volatility. Therefore, the use of forward-looking implied volatility at a time of relatively elevated implied volatility (as reflected in the VIX) is intended to use the volatility measure that is expected to be the higher of the two, with the result that the exposure to the Underlying Futures Index will be lower than if the other measure were used at a time of relatively elevated implied volatility. This is premised on the assumption that there is an inverse relationship between performance and volatility, so that the Index will benefit from reduced exposure to the Underlying Futures Index at a time of higher volatility. As described elsewhere, however, there can be no assurance that this relationship will hold over any particular time period, and the Index might have performed better if it did not adjust its measure of underlying volatility in this manner. |
| § | The Index has limited actual performance information. The Index launched on August 14, 2025. Accordingly, the Index has limited actual performance data. Because the Index is of recent origin with limited performance history, an investment linked to the Index may involve a greater risk than an investment linked to one or more indices with an established record of performance. A longer history of actual performance may have provided more reliable information on which to assess the validity of the Index’s methodology. However, any historical performance of the Index is not an indication of how the Index will perform in the future. |
| § | Hypothetical back-tested Index performance information is subject to significant limitations. All information regarding the performance of the Index prior to August 14, 2025 is hypothetical and back-tested, as the Index did not exist prior to that time. It is important to understand that hypothetical back-tested Index performance information is subject to significant limitations, in addition to the fact that past performance is never a guarantee of future performance. In particular: |
| o | The sponsor of the Index developed the rules of the Index with the benefit of hindsight—that is, with the benefit of being able to evaluate how the Index rules would have caused the Index to perform had it existed during the hypothetical back-tested period. The fact that the Index generally appreciated over any portion of the hypothetical back-tested period may not therefore be an accurate or reliable indication of any fundamental aspect of the Index methodology. |
| o | The hypothetical back-tested performance of the Index might look different if it covered a different historical period. The market conditions that existed during the historical period covered by the hypothetical back-tested Index performance information are not necessarily representative of the market conditions that will exist in the future. |
| o | SPXW options were not published as frequently prior to May 11, 2022 as they are now, and as a result the calculation of the hypothetical back-tested values of the Index prior to that date differs from the calculation of the Index today. The hypothetical back-tested |
| PS-14 |
| Citigroup Global Markets Holdings Inc. |
performance of the Index prior to May 11, 2022 may therefore differ from how the Index would have performed if SPXW options had been available with expirations on every weekday, as they are now.
It is impossible to predict whether the Index will rise or fall. The actual future performance of the Index may bear no relation to the historical or hypothetical back-tested levels of the Index.
| § | An affiliate of ours participated in the development of the Index. CGMI worked with the sponsor of the Index in developing the guidelines and policies governing the composition and calculation of the Index, and in that role made judgments and determinations about the Index methodology. Although CGMI no longer has a role in making any judgments and determinations relating to the Index, the judgments and determinations previously made by CGMI could continue to have an impact, positive or negative, on the level of the Index and the value of your securities. CGMI was under no obligation to consider your interests as an investor in the securities in its role in developing the guidelines and policies governing the Index. |
| § | Changes that affect the Index may affect the value of your securities. The sponsor of the Index may at any time make methodological changes or other changes in the manner in which it operates that could affect the value of the Index. We are not affiliated with the Index sponsor and, accordingly, we have no control over any changes such sponsor may make. Such changes could adversely affect the performance of the Index and the value of and your return on the securities. |
| PS-15 |
| Citigroup Global Markets Holdings Inc. |
Additional Terms of the Securities
Market disruption events. For purposes of determining whether a market disruption event occurs with respect to the S&P 500 Futures 40% Intraday Edge Volatility TCA 6% Decrement Index (USD) ER, each reference to the “Underlying Index” in the section “Description of the Securities—Certain Additional Terms for Securities Linked to an Underlying Index—Definitions of Market Disruption Event and Scheduled Trading Day and Related Definitions” in the accompanying product supplement in the definition of Market Disruption Event (and defined terms used in the definition of Market Disruption Event) shall be deemed replaced with a reference to the “Underlying Index, the S&P 500 Futures Excess Return Index or the S&P 500® Index”. References in the section “Description of the Securities—Certain Additional Terms for Securities Linked to an Underlying Index—Definitions of Market Disruption Event and Scheduled Trading Day and Related Definitions” in the accompanying product supplement to the securities comprising an Underlying Index (or any other index) shall be deemed to include futures contracts comprising an Underlying Index (or any other index), and each reference to “at any time during the one-hour period that ends at the Closing Time” shall be deemed to be replaced by a reference to “at any time during the trading day”.
Material modification of the S&P 500 Futures 40% Intraday Edge Volatility TCA 6% Decrement Index (USD) ER. If the sponsor of the S&P 500 Futures 40% Intraday Edge Volatility TCA 6% Decrement Index (USD) ER announces that it will make, or that it will undertake a consultation with respect to, a material change in the formula for or the method of calculating the S&P 500 Futures 40% Intraday Edge Volatility TCA 6% Decrement Index (USD) ER or any other material modification of the S&P 500 Futures 40% Intraday Edge Volatility TCA 6% Decrement Index (USD) ER (other than a modification prescribed in that formula or method to maintain the index in the event of changes in constituent stock and capitalization and other routine events) (any such announcement, a “material modification event”), then the issuer may, at its option, direct the calculation agent to calculate the closing level of the S&P 500 Futures 40% Intraday Edge Volatility TCA 6% Decrement Index (USD) ER on each date of determination after the effective date of such change in accordance with the formula for and method of calculating the S&P 500 Futures 40% Intraday Edge Volatility TCA 6% Decrement Index (USD) ER last in effect prior to the change. Such level, as calculated by the calculation agent, will be the closing value of the S&P 500 Futures 40% Intraday Edge Volatility TCA 6% Decrement Index (USD) ER for all purposes. The terms set forth in this paragraph supersede the terms set forth in the accompanying product supplement with respect to the S&P 500 Futures 40% Intraday Edge Volatility TCA 6% Decrement Index (USD) ER to the extent they are inconsistent with such terms. For purposes of determining whether there has been a material modification to the S&P 500 Futures 40% Intraday Edge Volatility TCA 6% Decrement Index (USD) ER, a material modification to the S&P 500 Futures Excess Return Index or the S&P 500® Index shall be treated as though it were a material modification to the S&P 500 Futures 40% Intraday Edge Volatility TCA 6% Decrement Index (USD) ER. Furthermore, any modification to the S&P 500 Futures 40% Intraday Edge Volatility TCA 6% Decrement Index (USD) ER will be treated as a material modification unless made under the following circumstances: (i) to exercise routine judgment in the administration of the rules, provided that such routine judgment will not include deviations or alterations to the rules designed to improve the financial performance of the index; (ii) to correct errors in implementation of the rules or calculations made pursuant to the rules; or (iii) to make an adjustment to respond to an unanticipated event outside of the control of the sponsor of the S&P 500 Futures 40% Intraday Edge Volatility TCA 6% Decrement Index (USD) ER, such as a stock split, merger, listing or delisting, nationalization, or insolvency of a component of the index, a disruption in the financial markets for specific assets or in a particular jurisdiction, regulatory compliance requirement, force majeure or any other unanticipated event of similar magnitude and significance.
If, on any day during the term of the securities, the calculation agent determines that a material modification event has occurred, we will have the right, but not the obligation, to redeem the securities, in whole and not in part, by providing written notice of our election to exercise that right to the trustee (the date of such notice, the “early redemption notice date”) on a redemption date of our election that is no later than the 30th business day immediately following the early redemption notice date or earlier than the fifth business day following the early redemption notice date. A material modification event need not be continuing on the early redemption notice date or on the redemption date. The amount due and payable on the securities upon such redemption will be equal to the early redemption amount determined as of the early redemption notice date.
The “early redemption amount” will be the fair value of the securities determined by the calculation agent as of the early redemption notice date in good faith and in a manner based upon (but not necessarily identical to) CGMI’s then contemporaneous practices for determining a secondary market bid price for the securities and similar instruments. In determining the early redemption amount, the calculation agent may take into account proprietary pricing models and may make adjustments to those models or inputs to those models in good faith and in a commercially reasonable manner. The calculation agent may also take into account other facts, whether or not unique to us or our affiliates, in determining the early redemption amount so long as it is in good faith and commercially reasonable. The early redemption amount may result in a significant loss on your securities. See “Summary Risk Factors—If a material modification event occurs during the term of the securities, we may redeem the securities early for an amount that may result in a significant loss on your investment” in this pricing supplement.
| PS-16 |
| Citigroup Global Markets Holdings Inc. |
Hypothetical Back-Tested and Historical Performance Information
This section contains hypothetical back-tested performance information for the S&P 500 Futures 40% Intraday Edge Volatility TCA 6% Decrement Index (USD) ER calculated by S&P Dow Jones Indices LLC. All S&P 500 Futures 40% Intraday Edge Volatility TCA 6% Decrement Index (USD) ER performance information prior to August 14, 2025 is hypothetical and back-tested, as the S&P 500 Futures 40% Intraday Edge Volatility TCA 6% Decrement Index (USD) ER did not exist prior to that date. Hypothetical back-tested performance information is subject to significant limitations. The sponsor of the S&P 500 Futures 40% Intraday Edge Volatility TCA 6% Decrement Index (USD) ER developed the rules of the index with the benefit of hindsight—that is, with the benefit of being able to evaluate how the rules would have caused the S&P 500 Futures 40% Intraday Edge Volatility TCA 6% Decrement Index (USD) ER to perform had it existed during the hypothetical back-tested period. The fact that the S&P 500 Futures 40% Intraday Edge Volatility TCA 6% Decrement Index (USD) ER appreciated at any time during the hypothetical back-tested period may not therefore be an accurate or reliable indication of any fundamental aspect of the index methodology. Furthermore, the hypothetical back-tested performance of the S&P 500 Futures 40% Intraday Edge Volatility TCA 6% Decrement Index (USD) ER might look different if it covered a different historical period. The market conditions that existed during the hypothetical back-tested period may not be representative of market conditions that will exist in the future.
In addition, the SPXW options used by the S&P 500 Futures 40% Intraday Edge Volatility TCA 6% Decrement Index (USD) ER to determine the implied volatility of the S&P 500® Index have traded with expirations on every weekday only since May 11, 2022. When SPXW options were first launched in 2005, only Friday expirations were available. Wednesday expirations were added on February 23, 2016; Monday expirations were added on August 15, 2016; Tuesday expirations were added on April 18, 2022; and Thursday expirations were added on May 11, 2022. For purposes of calculating the hypothetical back-tested performance of the Index, the implied volatility for the one-week period ending on a weekday for which no SPXW option was then traded was calculated by interpolating between the SPXW options expiring immediately before and immediately after that weekday. For these reasons, the hypothetical back-tested performance of the S&P 500 Futures 40% Intraday Edge Volatility TCA 6% Decrement Index (USD) ER prior to May 11, 2022 may differ from how the S&P 500 Futures 40% Intraday Edge Volatility TCA 6% Decrement Index (USD) ER would have performed if SPXW options had been available with expirations on every weekday, as they are now.
It is impossible to predict whether the S&P 500 Futures 40% Intraday Edge Volatility TCA 6% Decrement Index (USD) ER will rise or fall. By providing the hypothetical back-tested and historical performance information below, we are not representing that the S&P 500 Futures 40% Intraday Edge Volatility TCA 6% Decrement Index (USD) ER is likely to achieve gains or losses similar to those shown. In fact, there are frequently sharp differences between hypothetical performance results and the actual results subsequently achieved by any particular investment. One of the limitations of hypothetical performance information is that it did not involve financial risk and cannot account for all factors that would affect actual performance. The actual future performance of the S&P 500 Futures 40% Intraday Edge Volatility TCA 6% Decrement Index (USD) ER may bear no relation to its hypothetical back-tested or historical performance.
Historical Information
The closing value of the S&P 500 Futures 40% Intraday Edge Volatility TCA 6% Decrement Index (USD) ER on October 28, 2025 was 10,644.39. The graph below shows the hypothetical back-tested closing values of the S&P 500 Futures 40% Intraday Edge Volatility TCA 6% Decrement Index (USD) ER for the period from January 2, 2015 to August 13, 2025, and historical closing values of the S&P 500 Futures 40% Intraday Edge Volatility TCA 6% Decrement Index (USD) ER for the period from August 14, 2025 to October 28, 2025. All data to the left of the vertical red line in the graph below are hypothetical and back-tested. We obtained the closing values from Bloomberg L.P., without independent verification. You should not take the hypothetical back-tested and historical values of the S&P 500 Futures 40% Intraday Edge Volatility TCA 6% Decrement Index (USD) ER as an indication of future performance.
| S&P 500 Futures 40% Intraday Edge Volatility TCA 6% Decrement Index (USD) ER – Hypothetical Back-Tested and Historical Closing Values January 2, 2015 to October 28, 2025 |
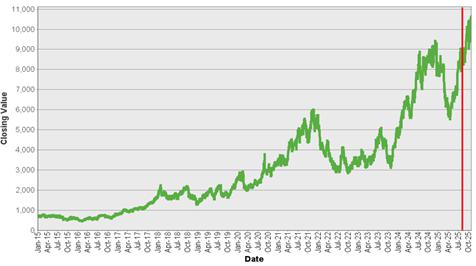 |
| PS-17 |
| Citigroup Global Markets Holdings Inc. |
Comparison of Hypothetical Back-Tested and Historical S&P 500 Futures 40% Intraday Edge Volatility TCA 6% Decrement Index (USD) ER Performance Against Historical S&P 500® Index Performance
The following graphs set forth a comparison of the hypothetical back-tested and historical performance of the S&P 500 Futures 40% Intraday Edge Volatility TCA 6% Decrement Index (USD) ER against the historical performance of the S&P 500® Index. The first graph shows comparative performance data for the period from January 2, 2015 through October 28, 2025, each normalized to have a closing value of 100.00 on January 2, 2015 to facilitate a comparison. The second graph shows comparative performance data for the period from January 3, 2022 through October 28, 2025, each normalized to have a closing value of 100.00 on January 3, 2022 to facilitate a comparison. The performance of the S&P 500® Index shown below is its price return performance – i.e., its performance without reflecting dividends. The total return performance of the S&P 500® Index (i.e., its performance reflecting dividends) would be greater than the price return performance shown below.
All S&P 500 Futures 40% Intraday Edge Volatility TCA 6% Decrement Index (USD) ER performance information prior to August 14, 2025 is hypothetical and back-tested, as the S&P 500 Futures 40% Intraday Edge Volatility TCA 6% Decrement Index (USD) ER did not exist prior to that date. Hypothetical back-tested performance information is subject to the significant limitations described above under “Information About the S&P 500 Futures 40% Intraday Edge Volatility TCA 6% Decrement Index (USD) ER”.
In the graphs below, references to “SPXI4EV6” are to the S&P 500 Futures 40% Intraday Edge Volatility TCA 6% Decrement Index (USD) ER and references to “SPX” are to the S&P 500® Index.
January 2, 2015 to October 28, 2025
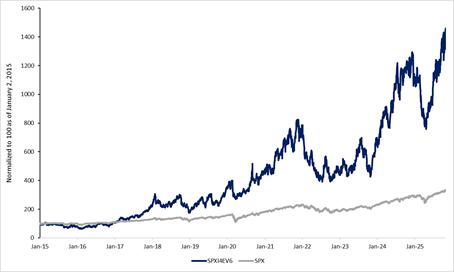
January 3, 2022 to October 28, 2025
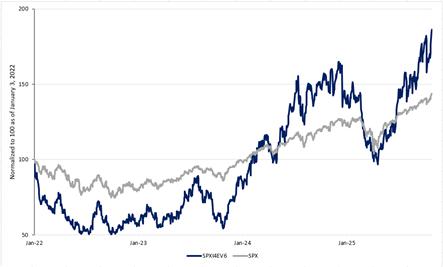
PAST PERFORMANCE OF THE S&P 500 FUTURES 40% INTRADAY EDGE VOLATILITY TCA 6% DECREMENT INDEX (USD) ER AND RELATIVE PERFORMANCE BETWEEN THE S&P 500 FUTURES 40% INTRADAY EDGE VOLATILITY TCA 6% DECREMENT INDEX (USD) ER AND THE S&P 500® INDEX ARE NOT INDICATIVE OF FUTURE PERFORMANCE
| PS-18 |
| Citigroup Global Markets Holdings Inc. |
Using the hypothetical back-tested and historical performance information from the graphs above, the table below shows the annualized (annually compounded) performance of the S&P 500 Futures 40% Intraday Edge Volatility TCA 6% Decrement Index (USD) ER as compared to the S&P 500® Index for the last year, the last three years and the last five years, each as of October 28, 2025.
S&P 500 Futures 40% Intraday Edge Volatility TCA 6% Decrement Index (USD) ER |
S&P 500® Index | |
| Last 1 Year | 23.50% | 18.33% |
| Last 3 Years | 48.67% | 20.86% |
| Last 5 Years | 31.47% | 16.06% |
The table below indicates the negative impact of the notional costs on the performance of the S&P 500 Futures 40% Intraday Edge Volatility TCA 6% Decrement Index (USD) ER based on the hypothetical back-tested and historical information from the graphs above. In the future, the negative impact of these notional costs may be greater, and perhaps significantly greater, than the values set forth below.
| Average per annum | Maximum amount over any annual period | |
| Notional costs | 2.00% | 2.71% |
Comparison of Historical S&P 500 Futures Excess Return Index Performance Against Historical S&P 500® Index Performance
To illustrate the historical impact of the implicit financing cost on the performance of the S&P 500 Futures Excess Return Index, the following graph sets forth a comparison of the historical performance of the S&P 500 Futures Excess Return Index against the historical performance of the S&P 500® Index from January 2, 2015 through October 28, 2025, each normalized to have a closing value of 100.00 on January 2, 2015 to facilitate a comparison. The performance of the S&P 500® Index shown below is its price return performance – i.e., its performance without reflecting dividends. The total return performance of the S&P 500® Index (i.e., its performance reflecting dividends) would be greater than the price return performance shown below.
In the graph below, references to “SPXFP” are to the S&P 500 Futures Excess Return Index and references to “SPX” are to the S&P 500® Index.
January 2, 2015 to October 28, 2025
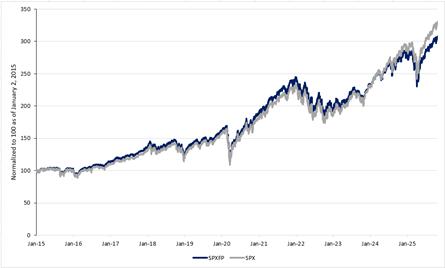
PAST PERFORMANCE OF THE S&P 500 FUTURES EXCESS RETURN INDEX AND RELATIVE PERFORMANCE BETWEEN THE S&P 500
FUTURES EXCESS RETURN INDEX AND THE S&P 500® INDEX ARE NOT INDICATIVE OF FUTURE PERFORMANCE
Using the historical performance information from the graph above, the table below shows the annualized (annually compounded) performance of the S&P 500 Futures Excess Return Index as compared to the S&P 500® Index for the last year, the last three years and the last five years, each as of October 28, 2025.
| S&P 500 Futures Excess Return Index | S&P 500® Index | |
| Last 1 Year | 13.73% | 18.33% |
| Last 3 Years | 16.11% | 20.86% |
| Last 5 Years | 13.59% | 16.06% |
| PS-19 |
| Citigroup Global Markets Holdings Inc. |
United States Federal Tax Considerations
You should read carefully the discussion under “United States Federal Tax Considerations” and “Risk Factors Relating to the Securities” in the accompanying product supplement and “Summary Risk Factors” in this pricing supplement.
In the opinion of our counsel, Davis Polk & Wardwell LLP, a security should be treated as a prepaid forward contract for U.S. federal income tax purposes. By purchasing a security, you agree (in the absence of an administrative determination or judicial ruling to the contrary) to this treatment. There is uncertainty regarding this treatment, and the IRS or a court might not agree with it. Moreover, our counsel’s opinion is based on market conditions as of the date of this preliminary pricing supplement and is subject to confirmation on the pricing date.
Assuming this treatment of the securities is respected and subject to the discussion in “United States Federal Tax Considerations” in the accompanying product supplement, the following U.S. federal income tax consequences should result under current law:
| · | You should not recognize taxable income over the term of the securities prior to maturity, other than pursuant to a sale or exchange. |
| · | Upon a sale or exchange of a security (including retirement at maturity), you should recognize capital gain or loss equal to the difference between the amount realized and your tax basis in the security. Such gain or loss should be long-term capital gain or loss if you held the security for more than one year. |
We do not plan to request a ruling from the IRS regarding the treatment of the securities. An alternative characterization of the securities could materially and adversely affect the tax consequences of ownership and disposition of the securities, including the timing and character of income recognized. In addition, the U.S. Treasury Department and the IRS have requested comments on various issues regarding the U.S. federal income tax treatment of “prepaid forward contracts” and similar financial instruments and have indicated that such transactions may be the subject of future regulations or other guidance. Furthermore, members of Congress have proposed legislative changes to the tax treatment of derivative contracts. Any legislation, Treasury regulations or other guidance promulgated after consideration of these issues could materially and adversely affect the tax consequences of an investment in the securities, possibly with retroactive effect. You should consult your tax adviser regarding possible alternative tax treatments of the securities and potential changes in applicable law.
Non-U.S. Holders. Subject to the discussions below and in “United States Federal Tax Considerations” in the accompanying product supplement, if you are a Non-U.S. Holder (as defined in the accompanying product supplement) of the securities, you generally should not be subject to U.S. federal withholding or income tax in respect of any amount paid to you with respect to the securities, provided that (i) income in respect of the securities is not effectively connected with your conduct of a trade or business in the United States, and (ii) you comply with the applicable certification requirements.
As discussed under “United States Federal Tax Considerations—Tax Consequences to Non-U.S. Holders” in the accompanying product supplement, Section 871(m) of the Code and Treasury regulations promulgated thereunder (“Section 871(m)”) generally impose a 30% withholding tax on dividend equivalents paid or deemed paid to Non-U.S. Holders with respect to certain financial instruments linked to U.S. equities (“U.S. Underlying Equities”) or indices that include U.S. Underlying Equities. Section 871(m) generally applies to instruments that substantially replicate the economic performance of one or more U.S. Underlying Equities, as determined based on tests set forth in the applicable Treasury regulations. However, the regulations, as modified by an IRS notice, exempt financial instruments issued prior to January 1, 2027 that do not have a “delta” of one. Based on the terms of the securities and representations provided by us as of the date of this preliminary pricing supplement, our counsel is of the opinion that the securities should not be treated as transactions that have a “delta” of one within the meaning of the regulations with respect to any U.S. Underlying Equity and, therefore, should not be subject to withholding tax under Section 871(m). However, the final determination regarding the treatment of the securities under Section 871(m) will be made as of the pricing date for the securities, and it is possible that the securities will be subject to withholding tax under Section 871(m) based on the circumstances as of that date.
A determination that the securities are not subject to Section 871(m) is not binding on the IRS, and the IRS may disagree with this treatment. Moreover, Section 871(m) is complex and its application may depend on your particular circumstances, including your other transactions. You should consult your tax adviser regarding the potential application of Section 871(m) to the securities.
If withholding tax applies to the securities, we will not be required to pay any additional amounts with respect to amounts withheld.
You should read the section entitled “United States Federal Tax Considerations” in the accompanying product supplement. The preceding discussion, when read in combination with that section, constitutes the full opinion of Davis Polk & Wardwell LLP regarding the material U.S. federal tax consequences of owning and disposing of the securities.
You should also consult your tax adviser regarding all aspects of the U.S. federal income and estate tax consequences of an investment in the securities and any tax consequences arising under the laws of any state, local or non-U.S. taxing jurisdiction.
| PS-20 |
| Citigroup Global Markets Holdings Inc. |
Supplemental Plan of Distribution
CGMI, an affiliate of Citigroup Global Markets Holdings Inc. and the underwriter of the sale of the securities, is acting as principal and will receive an underwriting fee of up to $45.00 for each security sold in this offering. The actual underwriting fee will be equal to the selling concession provided to selected dealers, as described in this paragraph. From this underwriting fee, CGMI will pay selected dealers not affiliated with CGMI a variable selling concession of up to $45.00 for each security they sell. For the avoidance of doubt, any fees or selling concessions described in this pricing supplement will not be rebated if the securities are automatically redeemed prior to maturity.
See “Plan of Distribution; Conflicts of Interest” in the accompanying product supplement and “Plan of Distribution” in each of the accompanying prospectus supplement and prospectus for additional information.
Valuation of the Securities
CGMI calculated the estimated value of the securities set forth on the cover page of this pricing supplement based on proprietary pricing models. CGMI’s proprietary pricing models generated an estimated value for the securities by estimating the value of a hypothetical package of financial instruments that would replicate the payout on the securities, which consists of a fixed-income bond (the “bond component”) and one or more derivative instruments underlying the economic terms of the securities (the “derivative component”). CGMI calculated the estimated value of the bond component using a discount rate based on our internal funding rate. CGMI calculated the estimated value of the derivative component based on a proprietary derivative-pricing model, which generated a theoretical price for the instruments that constitute the derivative component based on various inputs, including the factors described under “Summary Risk Factors—The value of the securities prior to maturity will fluctuate based on many unpredictable factors” in this pricing supplement, but not including our or Citigroup Inc.’s creditworthiness. These inputs may be market-observable or may be based on assumptions made by CGMI in its discretionary judgment.
The estimated value of the securities is a function of the terms of the securities and the inputs to CGMI’s proprietary pricing models. As of the date of this preliminary pricing supplement, it is uncertain what the estimated value of the securities will be on the pricing date because it is uncertain what the values of the inputs to CGMI’s proprietary pricing models will be on the pricing date.
For a period of approximately four months following issuance of the securities, the price, if any, at which CGMI would be willing to buy the securities from investors, and the value that will be indicated for the securities on any brokerage account statements prepared by CGMI or its affiliates (which value CGMI may also publish through one or more financial information vendors), will reflect a temporary upward adjustment from the price or value that would otherwise be determined. This temporary upward adjustment represents a portion of the hedging profit expected to be realized by CGMI or its affiliates over the term of the securities. The amount of this temporary upward adjustment will decline to zero on a straight-line basis over the four-month temporary adjustment period. However, CGMI is not obligated to buy the securities from investors at any time. See “Summary Risk Factors—The securities will not be listed on any securities exchange and you may not be able to sell them prior to maturity.”
Contact
Clients may contact their local brokerage representative. Third-party distributors may contact Citi Structured Investment Sales at (212) 723-7005.
© 2025 Citigroup Global Markets Inc. All rights reserved. Citi and Citi and Arc Design are trademarks and service marks of Citigroup Inc. or its affiliates and are used and registered throughout the world.
| PS-21 |