ANNUAL REPORT PURSUANT TO SECTION 13 OR 15(d) OF THE SECURITIES EXCHANGE ACT OF 1934
For the fiscal year ended December 31, 2025
OR
☐
TRANSITION REPORT PURSUANT TO SECTION 13 OR 15(d) OF THE SECURITIES EXCHANGE ACT OF 1934
For the Transition period from_____ to _____
Commission File No. 001-05672
ITT INC.
Indiana
81-1197930
(State or Other Jurisdiction of Incorporation or Organization)
(I.R.S. Employer Identification No.)
100 Washington Boulevard
06902
6th Floor, Stamford, CT
(Zip Code)
(Address of Principal Executive Offices)
(914)641-2000
(Registrant's telephone number, including area code)
Securities registered pursuant to Section 12(b) of the Act:
Title of each class
Trading Symbol(s)
Name of each exchange on which registered
Common Stock, par value $1.00 per share
ITT
New York Stock Exchange
Securities registered pursuant to Section 12(g) of the Act: None.
Indicate by check mark if the registrant is a well-known seasoned issuer, as defined in Rule 405 of the Securities Act. Yesþ No ¨
Indicate by check mark if the registrant is not required to file reports pursuant to Section 13 or Section 15(d) of the Act. Yes ¨Noþ
Indicate by check mark whether the registrant (1) has filed all reports required to be filed by Section 13 or 15(d) of the Securities Exchange Act of 1934 during the preceding 12 months (or for such shorter period that the registrant was required to file such reports), and (2) has been subject to such filing requirements for the past 90 days. Yesþ No ¨
Indicate by check mark whether the registrant has submitted electronically every Interactive Data File required to be submitted pursuant to Rule 405 of Regulation S-T (§232.405 of this chapter) during the preceding 12 months (or for such shorter period that the registrant was required to submit such files). Yesþ No ¨
Indicate by check mark whether the registrant is a large accelerated filer, an accelerated filer, a non-accelerated filer, a smaller reporting company, or an emerging growth company. See the definitions of "large accelerated filer," "accelerated filer," "smaller reporting company," and "emerging growth company" in Rule 12b-2 of the Exchange Act.
☑
Large accelerated filer
☐
Accelerated filer
☐
Non-accelerated filer
☐
Smaller reporting company
☐
Emerging growth company
If an emerging growth company, indicate by check mark if the registrant has elected not to use the extended transition period for complying with any new or revised financial accounting standards provided pursuant to Section 13(a) of the Exchange Act. ¨
Indicate by check mark whether the registrant has filed a report on and attestation to its management's assessment of the effectiveness of its internal control over financial reporting under Section 404(b) of the Sarbanes-Oxley Act (15 U.S.C. 7262(b)) by the registered public accounting firm that prepared or issued its audit report. Yesþ No ¨
If securities are registered pursuant to Section 12(b) of the Act, indicate by check mark whether the financial statements of the registrant included in the filing reflect the correction of an error to previously issued financial statements. ☐
Indicate by check mark whether any of those error corrections are restatements that required a recovery analysis of incentive-based compensation received by any of the registrant’s executive officers during the relevant recovery period pursuant to § 240.10D-1(b). ☐
Indicate by check mark whether the registrant is a shell company (as defined in Rule 12b-2 of the Act). Yes ☐ No þ
The aggregate market value of common stock of the registrant held by non-affiliates of the registrant on June 30, 2025 was approximately $12.2 billion. As of February 6, 2026, there were 86.0 million shares of the registrant's common stock outstanding.
DOCUMENTS INCORPORATED BY REFERENCE
Portions of the registrant’s Definitive Proxy Statement to be filed with the Securities and Exchange Commission pursuant to Regulation 14A for its 2026 Annual Meeting of Shareholders are incorporated by reference in Part III of this Form 10-K.
Included pursuant to the General Instruction to Item 401 of Regulation S-K.
WHERE YOU CAN FIND MORE INFORMATION
We file annual, quarterly and current reports, proxy statements and other information with the U.S. Securities and Exchange Commission (the "SEC"). The SEC maintains a website at www.sec.gov on which you may access our SEC filings. In addition, we make available free of charge at investors.itt.com copies of materials we file with, or furnish to, the SEC as soon as reasonably practical after we electronically file or furnish these reports, as well as other important information that we disclose from time to time. In addition, in certain sections of this Annual Report on Form 10-K we refer readers to additional information that is contained on our website, or that can be accessed through our website. The information on our website, including the materials we are specifically referencing, do not constitute a part of this Annual Report on Form 10-K. We have included our website address only as an inactive textual reference and do not intend it to be an active link to our website.
Our corporate headquarters is located at 100 Washington Boulevard, 6th Floor, Stamford, Connecticut 06902 and the telephone number of this location is (914) 641-2000.
FORWARD-LOOKING AND CAUTIONARY STATEMENTS
Some of the information included herein includes forward-looking statements within the meaning of the Securities Exchange Act of 1933, and the Securities Exchange Act of 1934, as amended. We intend such forward-looking statements to qualify for the safe harbor from liability established by the Private Securities Litigation Reform Act of 1995. These forward-looking statements are not historical facts, but rather represent only a belief regarding future events based on current expectations, estimates, assumptions and projections about our business, future financial results, the industry in which we operate, and other legal, regulatory and economic developments. These forward-looking statements include, but are not limited to, future strategic plans, statements regarding closing of the acquisition of SPX FLOW, Inc. ("SPX FLOW") and the payment of the purchase price, the debt financing, the impact of the acquisition on ITT, expected cost synergies of the acquisition, and other statements that describe the company’s business strategy, outlook, objectives, plans, intentions or goals, and any discussion of future events and future operating or financial performance.
We use words such as “anticipate,” “believe,” “continue,” “could,” “estimate,” “expect,” “future,” “guidance,” “intend,” “may,” “plan,” “potential,” “project,” “should,” “target,” “will,” “would,” and other similar expressions to identify such forward-looking statements. Forward-looking statements are uncertain and, by their nature, many are inherently unpredictable and outside of ITT’s control, and involve known and unknown risks, uncertainties and other important factors that could cause actual results to differ materially from those expressed or implied in, or reasonably inferred from, such forward-looking statements.
Where in any forward-looking statement we express an expectation or belief as to future results or events, such expectation or belief is based on current plans and expectations of our management, expressed in good faith and believed to have a reasonable basis. However, we cannot provide any assurance that the expectation or belief will occur or that anticipated results will be achieved or accomplished.
Among the factors that could cause our results to differ materially from those indicated by forward-looking statements are risks and uncertainties inherent in our business including, without limitation:
•potential delays in consummating the pending acquisition of SPX FLOW;
•our ability to integrate the operations of SPX FLOW in a successful manner and in the expected time period;
•the possibility that any of the anticipated benefits and projected synergies of the pending acquisition of SPX FLOW will not be realized or will not be realized on the anticipated terms within the expected time period;
•the occurrence of any event, change, or other circumstance that could give rise to the termination of the purchase agreement for the pending acquisition of SPX FLOW;
•the effect of the pendency or completion of the pending acquisition of SPX FLOW on the parties' business relationships and business generally;
•uncertain global economic and capital markets conditions, which have been influenced by heightened geopolitical tensions, inflation, changes in monetary policies, the threat of a possible regional or global economic recession, trade disputes between the U.S. and its trading partners, political and social unrest, and the availability and fluctuations in prices of energy and commodities, including steel, oil, copper and tin;
•the imposition of new or increased tariffs by the U.S. government, particularly those targeting imports from specific countries, and the potential for retaliatory trade measures by affected countries, which could disrupt global supply chains, increase costs and reduce customer demand;
•fluctuations in interest rates and the impact of such fluctuations on customer behavior and on our cost of debt;
•fluctuations in foreign currency exchange rates and the impact of such fluctuations on our revenues, customer demand for our products and on our hedging arrangements;
•volatility in raw material prices and our suppliers’ ability to meet quality and delivery requirements;
•impacts and risk of liabilities from recent mergers, acquisitions, or venture investments, including the pending acquisition of SPX FLOW, and past divestitures and spin-offs;
•our inability to hire or retain key personnel;
•failure to compete successfully and innovate in our markets;
•failure to manage the distribution of products and services effectively;
•failure to protect our intellectual property rights or violations of the intellectual property rights of others;
•the extent to which there are quality problems with respect to manufacturing processes or finished goods;
•the risk of cybersecurity breaches or failure of any information systems used by the Company, including any flaws in the implementation of any enterprise resource planning systems;
•loss of or decrease in sales from our most significant customers;
•risks due to our operations and sales outside the U.S. and in emerging markets, including the imposition of tariffs and trade sanctions;
•fluctuations in demand or customers’ levels of capital investment, maintenance expenditures, production, and market cyclicality;
•the risk of material business interruptions, particularly at our manufacturing facilities;
•risks related to government contracting, including changes in levels of government spending and regulatory and contractual requirements applicable to sales to the U.S. government;
•fluctuations in our effective tax rate, including as a result of changing tax laws and other possible tax reform legislation in the U.S. and other jurisdictions;
•changes in environmental laws or regulations, discovery of previously unknown or more extensive contamination, or the failure of a potentially responsible party to perform;
•failure to comply with the U.S. Foreign Corrupt Practices Act or other applicable anti-corruption legislation, export controls and trade sanctions; and
•risk of product liability claims and litigation.
Refer to Item 1A, Risk Factors for more information on factors that could cause actual results or events to differ materially from those anticipated and disclosed within this Annual Report on Form 10-K, our Quarterly Reports on Form 10-Q and in other documents we file from time to time with the SEC.
The forward-looking statements included in this Annual Report on Form 10-K speak only as of the date of this report. We undertake no obligation (and expressly disclaim any obligation) to update any forward-looking statements, whether written or oral or as a result of new information, future events or otherwise.
PART I
ITEM 1.
DESCRIPTION OF BUSINESS
(Amounts reported in this Annual Report on Form 10-K, except per share amounts, are stated in millions unless otherwise specified. References herein to "ITT," the "Company," and such words as "we," "us," and "our" include ITT Inc. and its subsidiaries on a consolidated basis, unless the context otherwise indicates.)
COMPANY OVERVIEW
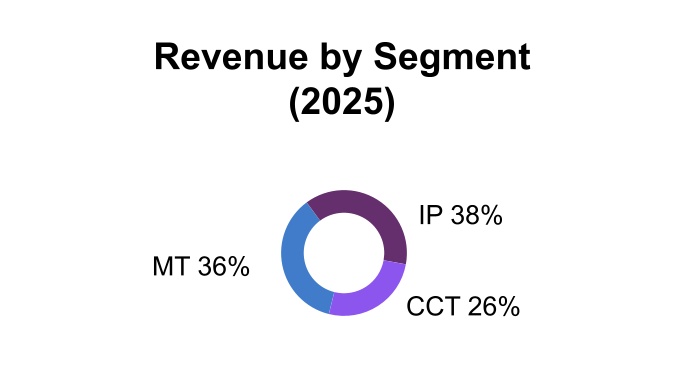
ITT is a diversified manufacturer of highly engineered critical components and customized technology solutions primarily for the transportation, industrial and energy markets. We manufacture components that are integral to the operation of equipment, systems and manufacturing processes in these key markets. Our products enable functionality for applications where reliability and performance are critically important to our customers and the users of their products. We operate through three primary segments: Motion Technologies (MT), Industrial Process (IP), and Connect & Control Technologies (CCT).
2025 COMPANY SNAPSHOT
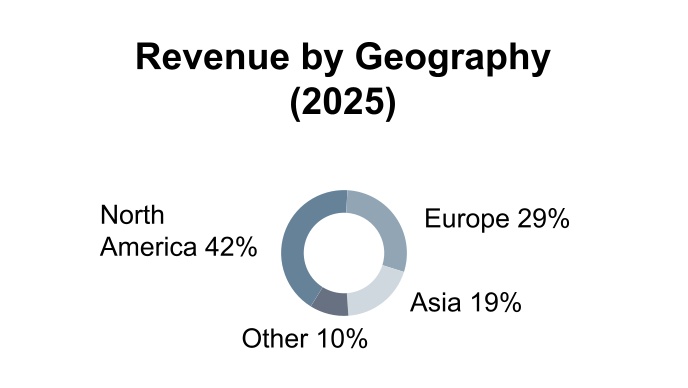
• $3.9 billion of sales across approx. 125 countries
• Approx. 11,600 employees in 38 countries
• Global presence with 65% of revenue outside the U.S.
• Balanced and diversified portfolio
MT is a global manufacturer of highly engineered brake pads, shock absorbers and damping technologies for the automotive and rail markets. IP is a global manufacturer of industrial pumps, valves, and monitoring and control systems, and provides aftermarket services for the energy, chemical and petrochemical, pharmaceutical, general industrial, marine, mining, pulp and paper, food and beverage, power generation and biopharmaceutical markets. CCT is a global designer and manufacturer of harsh-environment interconnect solutions and critical energy absorption and flow control components, primarily for the aerospace, defense and industrial markets. For additional segment information, see Segment Information section.
Business Model and Strategy
Our businesses share a common, repeatable operating model centered on our engineering capabilities. Each business applies its technology and engineering expertise to solve our customers' most pressing challenges. Our technological applications foster an ongoing business relationship with our customers which provides us with unique insight into our customers' requirements thus enabling us to develop solutions to better assist our customers achieve their business goals. Our technology and customer intimacy together provide opportunities to capture recurring revenue streams, aftermarket opportunities and content on long-lived platforms from original equipment manufacturers (OEMs).
We create long-term stakeholder value through our four strategic priorities of customer centricity, operational excellence, effective capital deployment, and sustainability and innovation. Our strategy is designed to achieve premier financial performance by combining profitable growth with operational improvements, while keeping our customers at the center of everything we do.
Our operational focus centers on safety, quality, delivery and cost. This is the foundation of the improvements we make in each of our businesses. We are establishing a higher performance culture that goes beyond the factory floor to improve the efficiency and effectiveness of all critical processes in the value chain. These initiatives encompass not only continuous improvement principles, but also leadership, talent and cultural aspects. For additional information, refer to Human Capital Management below.
1
When value-generating opportunities arise, we seek to expand into new markets and invest in new products that leverage our deep engineering capabilities. We continue to evaluate investments that will enable us to strategically and efficiently deploy capital, including close-to-core acquisitions that have unique and differentiated products, services and technologies. Effective capital deployment, including resource optimization and a disciplined focus on cash flow management, are a major part of how we execute our strategy and continue to deliver strong shareholder returns.
Primary Businesses and Brands
Our brands have a strong international presence across many emerging markets, including China, India, Mexico, Brazil and Saudi Arabia. Below is a list of the key brands in each segment.
OUR KEY BRANDS
MT
• ITT Friction TechnologiesTM
• KONI®
• NovitekTM
• Axtone®
IP
• Goulds PumpsTM
• Bornemann®
• Svanehøj®
• PRO Services®
• Rheinhütte Pumpen®
• Engineered Valves®
• HabonimTM
CCT
• Cannon®
• VEAM®
• BIW Connector Systems®
• Aerospace Controls
• Enidine®
• Compact AutomationTM
• kSARIA®
• Micro-ModeTM
Sustainability
Sustainable practices play an essential role in our business and are firmly rooted in how we conduct our operations and in our daily business decisions. Our products, manufacturing processes and innovations reflect our drive to help make our operations and the communities we serve more sustainable. We believe ingraining these priorities into our strategy will drive long-term growth and shareholder value, help our customers meet their sustainability goals and, furthermore, is simply the right thing to do. Our environmental initiatives fall into three categories:
▪Development of innovative products that help enable customers to operate more efficiently, reduce total cost of ownership and produce environmentally friendly technologies and processes;
▪Investment in technologies and processes to reduce CO2 emissions, waste sent to landfills, water usage and increase our energy supply security through solar installations; and
▪Decrease harmful emissions through our Reduce–Avoid–Offset framework, in which we seek to reduce our carbon footprint and commit to using renewable energy sources.
We are proud of the strides we have made with respect to our sustainability efforts to date and will continue looking for ways to improve upon these efforts to help bring additional value to our employees, customers, communities and businesses. ITT's sustainability results, strategy and initiatives are discussed further in our 2025 SustainabilITTy Update, which can be found on our website at www.itt.com/sustainability. This report is not incorporated by reference and should not be considered part of this Annual Report on Form 10-K.
Environmental Regulations
We are subject to stringent federal, state, local, and foreign environmental laws and regulations concerning air emissions, water discharges and waste disposal. In the U.S., these include, but are not limited to, the Federal Clean Air Act, the Clean Water Act, the Resource, Conservation and Recovery Act, and the Comprehensive Environmental Response, Compensation and Liability Act. We closely monitor our environmental responsibilities, together with trends in environmental laws. As a result of ITT's ongoing compliance and diligence efforts, ITT's environmental liabilities are, for the most part, not associated with current operating facilities (only two of ITT's 26 locations with current environmental obligations are associated with active operating sites). Additionally, ITT continues to reduce the number of ongoing matters.
Separate from our Reduce–Avoid–Offset framework, we have established an internal program to assess compliance with applicable environmental requirements at our facilities. The program is designed to identify problems in a timely manner, correct potential deficiencies and maintain continued regulatory compliance. We also conduct environmental due diligence during mergers and acquisitions.
Environmental laws and regulations are subject to change, and the nature and timing of such changes, if any, is difficult to predict. To minimize our exposure, we have purchased insurance protection against certain environmental
2
risks arising from our business activities. As actual costs incurred at identified sites in future periods may vary from our current estimates given the inherent uncertainties in evaluation of environmental exposures, it is not possible to reasonably predict the outcome of these uncertainties or any resulting impact on our financial statements.
We believe that sustainable performance and growth are made possible only through the efforts of our dynamic team of employees. In order to continue innovating in the industries and key end markets we serve, ITT remains committed to attracting and retaining top talent globally. We strive to make ITT an engaging and safe workplace for all, and to create a higher performance culture with opportunities and training for all employees to develop and grow professionally and personally. In addition, we offer competitive compensation, benefits, and health and wellness programs.
As of December 31, 2025, we had approximately 11,600 employees located in 38 countries, including approximately 3,300 employees in the U.S. As of December 31, 2025, approximately 5% of our U.S. employees are represented by unions. No one unionized facility in the U.S. accounted for more than 10% of ITT's total revenues. In addition, many of our employees outside the U.S. are covered by collective agreements or represented by works councils or other groups. We continually focus on building strong relationships with our employees, and we have not experienced any material strikes or work stoppages in the past several years.
Health, Safety and Well-being
At ITT, the health, safety, and well-being of our employees is our number one priority. Our Environmental, Safety, Health and Security Council drives the systemic control of workplace risks and continual improvement of environmental and occupational safety and health protocols at all of our sites. We challenge ourselves to continually reduce injury frequency and severity by engaging employees in our “Accept Only Zero” safety accountability system and fostering an environment where employees take responsibility for their actions and have access to tools and training to work safely together. Despite these comprehensive measures, accidents still occur. In such cases, we report the accident, its root cause and any corrective measures taken in ITT’s company-wide accident reporting and tracking tool. Accident reporting and analysis helps ITT gauge the effectiveness of our safety initiatives and procedures across all sites, and it helps us find creative solutions to mitigate risks to our employees at our sites.
At ITT, fostering a high-performance culture and inclusive meritocracy is core to our values and critical to our success as a company. We are committed to cultivating an environment where varied ideas and perspectives drive engagement, innovation, and better business outcomes. By creating a culture that supports our employees and recognizes merit, we positively impact the performance of our people and the global communities in which we operate. We align our efforts to our strategic workplace goals by building an environment where all ITTers feel empowered to fully engage, achieve their potential, and share ideas freely. We believe our success is fueled by variety of thought, collaboration, and continuous learning from each other’s ideas and experiences. By fostering an inclusive meritocracy, we position ourselves for sustained success in the global marketplace and the creation of long-term value for all stakeholders. Our most recent Employment Information Report (EEO-1 report) is available at www.itt.com/our-people/eeo-1-report, where we will also post our 2025 EEO-1 report when it becomes available. This report is not incorporated by reference and should not be considered part of this Annual Report on Form 10-K.
Talent Development
In order to foster a higher-performance culture, we are committed to maintaining effective strategies to support recruiting and hiring, onboarding and training, compensation planning, performance management and professional development. We invest significant resources to develop our talent to remain a global leader in the manufacturing of highly engineered customized products and solutions. We focus on providing meaningful, equitable career development pathways and support to help ITTers realize their career aspirations. Our development philosophy is built around a “know-do” framework which includes both formal training and experiential learning. Tailored learning programs, coaching and mentoring elevate both technical and other skills (the “know”) while challenging, well-planned work experiences and global assignments prepare ITTers for current and future roles (the “do”). Successful employee development is also supported by thoughtful plans built in partnership between employees and their
3
managers. Our development planning tools and processes ensure targeted, concrete action planning, and we promote continuous feedback and regular check-ins.
Compensation and Benefits
We provide flexible compensation and benefits programs to help meet the needs of our employees and their families. In addition to base salaries, we offer numerous benefits for eligible employees, including annual bonuses, stock awards, an employee stock purchase plan for employees in the U.S., a 401(k) Plan, healthcare and insurance benefits, health savings and flexible spending accounts, paid time off, family leave, flexible work schedules, retirement benefits, employee assistance programs and tuition reimbursement. ITT’s pay and recognition practices leverage data to ensure our employees receive competitive, equitable salaries supported by evaluations of roles, experience, performance and union or works council agreements in select areas. Our variable incentive plans reinforce pay for performance and our strong belief in meritocracy. The majority of our employees are eligible for either a performance-based bonus or a statutory profit-sharing payment. The bonus plans align employee compensation with financial or operational results and individual performance. With respect to stock awards, we have used discretionary equity-based grants with time-based vesting conditions to facilitate the retention of key personnel, particularly executives and those identified as high-performing talent.
SEGMENT INFORMATION
See Note 3, Segment Information, to the Consolidated Financial Statements for financial information about each of our segments.
Motion Technologies (MT)
The Motion Technologies segment is a manufacturer of brake pads, shock absorbers, energy absorption components and damping technologies primarily for the transportation industry, including passenger cars and trucks, light- and heavy-duty commercial and military vehicles, buses and trains. MT consists of the following primary business units: ITT Friction Technologies, KONI, and Axtone.
ITT Friction Technologies (Friction)
Friction manufactures a range of brake pads installed as original equipment (OE) on passenger cars (both internal combustion engine vehicles, hybrids and electric vehicles) and light commercial vehicles for a variety of end customers and automotive platforms around the world. OE brake pads are sold directly to OEMs or to Tier-1 brake manufacturers. Our OE brake pads are designed to meet customer specifications and environmental regulations, and to satisfy an array of performance standards across multiple geographies. Most automotive OEM platforms (car models) require specific brake pad formulations and have demanding quality, delivery and volume schedules. Friction is a recognized industry leader in the paradigm shift towards new brake pad formulations that are designed, developed and tested specifically for electric vehicles (EVs). Success in developing brake pads for EVs has led Friction to win multiple hybrid and EV platform awards with established and new OEMs.
Friction also manufactures aftermarket brake pads designed for the automotive service and repairs market. This market consists of both OE dealers, also referred to as original equipment service (OES) networks, and independent aftermarket networks. Brake pads sold within the OES network generally match the specifications of an original auto platform OE brake pad and are sold either directly to OEMs or to Tier-1 brake manufacturers, such as Aumovio SE, or indirectly through independent distributor channels. Our catalog of pads sold in independent aftermarket networks features technology designed to provide a range of braking performance levels.
KONI
The KONI business services four main end markets: railway rolling stock for freight and passenger trains; car and racing; bus, truck and trailer; and defense.
Railway supplies a wide range of equipment for passenger rail, locomotives, freight cars, high speed trains and light rail. Offerings include customized energy absorption solutions, hydraulic shock absorbers (primary, lateral, and inter-car), yaw dampers, springs, visco-elastic and hydraulic buffers, coupler components and crash mitigation equipment. Revenue from our rail damping systems is balanced between OE and aftermarket customers. Sales are made either directly to train manufacturers and train operators carrying out scheduled train maintenance programs or indirectly through distributors.
4
Car and Racing features performance shock absorbers often using our Frequency Selective Damping (FSD) technology. FSD products generally are used by car and racing enthusiasts who desire to modify their cars for increased handling performance and comfort. KONI aftermarket car shock absorbers are sold around the world, directly to customers and through a distribution network that markets KONI products into specific geographies or customer groups. KONI shock absorbers are also incorporated into new OEM platform designs and sold to Tier-1 shock absorber manufacturers.
Bus, Truck and Trailer, and Defense manufactures hydraulic and hydro-pneumatic shock absorbers for sale to both OEM and aftermarket customers.
Axtone
The Axtone business specializes in impact energy absorption technology and push-pull components for passenger and freight rolling stock in rail, metro and trams and the production of springs applicable across multiple industries such as rail, industrial and defense applications. Axtone develops, manufactures and distributes components designed to meet the rigorous demands of rail transportation of the most demanding customers worldwide. With a commitment to serving a global customer base, the Axtone solutions adhere to international standards with the highest level of quality, performance and durability.
KONI and Axtone are lifetime partners of rail customers, also offering repair and overhauling capabilities for their products.
Other Information
MT has a global manufacturing footprint with advanced automation capabilities, with production facilities in Europe, China, and North America. MT competes in markets primarily served by large and well-established national and global companies. Key competitive drivers within the brake pad business include technical expertise, formulation development capabilities, scale production, product performance, high-quality standards, cost, customer intimacy, reputation and the ability to meet demanding delivery and volume schedules in a limited amount of time. We have well-established, long-term relationships with our OE and OES brake pad customers based on mutual trust, local proximity and a wide range of cooperative activities, ranging from design, to sampling, prototyping and testing phases of brake pads.
ITT's long-time customer, Continental AG, completed the spin-off of its automotive group sector in September 2025, resulting in the establishment of Aumovio SE ("Aumovio") as an independent, publicly traded company listed on the Frankfurt Stock Exchange. Following the spin-off, Aumovio is ITT's largest customer. Combined sales to Aumovio and Continental AG during 2025 represented 17% of MT's revenue, and approximately 6% of ITT's total revenue. Automaker requests to use ITT brake pads in their Aumovio-produced braking systems (calipers) typically represents approximately 50% of MT's OE revenue from Aumovio. These automaker requests are generally formalized through supply agreements signed directly between MT and the automakers. The remainder of MT's sales to Aumovio is through a long-term agreement to supply Aumovio with aftermarket parts.
MT is a global leader in rail suspension components, freight coupling devices currently used in Europe and crash absorption systems. Competitive drivers in MT's rail business include customer intimacy, price, technical expertise and product performance. MT's rail products are considered critical components because of safety requirements and thus they are designed specifically for different train applications and must satisfy strict compliance requirements.
In July 2024, we sold our Wolverine Advanced Materials (Wolverine) business. Wolverine will continue to act as a third-party supplier of high-performance shims and seals for ITT. The results of the Wolverine business are included in the consolidated statements of operations and cash flows until the date of divestiture.
Industrial Process (IP)
The Industrial Process segment is an OEM and an aftermarket parts and service provider of industrial pumps, valves, plant optimization and remote monitoring systems and services. IP's products serve an extensive base of customers ranging from large multi-national companies and engineering, procurement and construction (EPC) firms to regional distributors and various other end-users. IP's customers operate in global infrastructure and natural resource markets such as energy, chemical and petrochemical, pharmaceutical, general industrial, marine, mining, pulp and paper, food and beverage, power generation and biopharmaceutical. IP's marketplace-recognized brands include Goulds PumpsTM, Bornemann®, Rheinhütte Pumpen®, Engineered Valves®, PRO Services®, HabonimTM,and Svanehøj®.
5
Industrial Pumps
Industrial pumps are used by a wide array of customers and applications primarily in the chemical, energy, marine, mining, general industrial, pharmaceutical and power generation markets. IP designs and manufactures configured-to-order and standards-based industrial pumps that are highly engineered and customized to customer needs. These products include a broad portfolio of centrifugal and twin-screw positive displacement pumps that meet the following industry-recognized standards: American Petroleum Institute (API), American National Standards Institute (ANSI), ATmosphere EXplosible, European Directive 2014/34/EC (ATEX), IEC standards (IECEx) and International Organization for Standardization (ISO). Our project pumps are generally part of larger and more complex capital projects, have longer lead times than baseline pumps and are generally managed by EPC firms.
Valves
Valves are manufactured to handle a wide variety of process conditions and solve unique challenges in the biopharmaceutical, chemical, mining, power generation, pulp and paper, and general industrial markets. Our portfolio of valve products includes knife-gate valves, ball valves, hygienic and industrial diaphragm valves, and valve actuators, marketed under the brand names EnviZion®, Cam-LineTM, Cam-Tite®, Dia-Flo®, Fabri-Valve®, Pure-Flo®, Skotch®, and HabonimTM. Also included within our portfolio is the Integrated Sensing Platform (ISP), which is a next-generation linear position sensing technology for EnviZion® and Pure-Flo® hygienic diaphragm valves, developed specifically for the toughest applications in the biopharmaceutical and sanitary industries.
Aftermarket
Our aftermarket solutions, which represented approximately 40% of IP's revenue in 2025, provide customers with replacement parts, services and plant optimization solutions that reduce total cost of ownership of pumps and rotating equipment, and cryogenic applications for the marine sector.
Svanehøj
In January 2024, we acquired Svanehøj Group A/S (Svanehøj) incorporating the Svanehøj® and Hamworthy Pumps® brand pumps into IP's portfolio. Svanehøj is a supplier of pumps and related aftermarket services with leading positions in cryogenic applications for the marine sector. Svanehøj Tank Control Systems develops and produces technologies that enhance the safety of liquified natural gas (LNG), cryogenic and refrigerated storage – both onshore and offshore.
Other Information
IP has a global manufacturing footprint with significant operations in the United States, South Korea, Saudi Arabia, Mexico, Germany, Denmark, and Singapore. IP markets its products via a global and diversified sales channel structure. Sales to independent distributors, who service end-users, account for approximately one-third of IP's revenue. We also sell directly to end-users through our customer-focused direct sales and service organization. In addition, we have focused channels dedicated to supporting EPC firms as their needs are often distinct from those of distribution and end-user customers.
The pump and valve markets we serve are highly competitive and fragmented. For most of our products, there are many regional competitors and a limited number of larger global peers. Primary customer purchase decision drivers include price, lead time and on-time performance, brand recognition, quality, breadth of product and service offerings, commercial terms, technical support and localization. Pricing can be very competitive for large projects because completed projects generate ongoing profitable aftermarket opportunities for the OE provider.
Connect & Control Technologies (CCT)
The Connect & Control Technologies segment designs and manufactures a range of highly-engineered connectors, cable assemblies, and specialized products for critical applications supporting various markets including aerospace and defense, industrial, transportation (including EVs), medical and energy. CCT’s products are often components on long-lived platforms that generate recurring aftermarket and replacement opportunities. CCT has organized its business around product offerings and end-user markets, with dedicated teams specializing in solutions for their specific markets, providing focused customer support and expertise.
Connector Products
The connector product portfolio includes high-performance connectors of the following types: Circular, Rectangular, Radio Frequency, Fiber Optic, D-sub Miniature and Micro-Miniature. Brands include Cannon®, VEAM®, Micro-ModeTM, and BIW Connector Systems®, which deliver solutions to enable the transfer of data, signals and power for various end-user markets including aerospace, defense, industrial, transportation, medical and energy.
6
These brands are known for high-performance, high-reliability solutions which withstand high temperatures and pressure and are resistant to corrosive environments. In certain harsh environment markets, our connector products are considered market leaders because of our technological capabilities, cost performance and global footprint.
Products for the commercial aerospace and defense markets include industry standards-based connectors and late-stage customized solutions. These products are designed to withstand the extreme conditions in harsh environments that are typical in aviation and military applications where reliability and safety are critical factors.
Products for the industrial markets include connectors for industrial production and transportation equipment, industrial electronics and instruments, and other industrial and medical applications. Products for the transportation markets include connectors for electric vehicle charging station applications, passenger rail and heavy-duty vehicles.
Products for the energy markets include connectors that provide power for electric submersible pumps in oil wells and reservoir monitoring instruments. Specific product applications include electrical power penetrators for wellheads, packers and pods that are able to accommodate various sizes and provide for multiple sealing strategies and ratings.
Cable Assembly Products
In September 2024, ITT acquired kSARIA Parent, Inc. (kSARIA), a leading producer and supplier of mission-critical connectivity solutions for the defense and aerospace end markets. kSARIA produces highly engineered cable assemblies for avionics, sensors, communications and networking applications that are highly complementary to ITT’s existing connector portfolio. Brands include kSARIA, Compulink, The Charles E. Gillman Company, TopFlite Components, and Co-Operative Industries Aerospace and Defense (CIA&D).
Control Products
The control product portfolio consists of highly engineered actuation, flow control, energy absorption, environmental control, and composite component solutions for the aerospace, defense and industrial markets.
Control products for the aerospace and defense markets include actuators, valves, pumps and switches for flow control applications, rate controls, seat recline locks and elastomer isolators for aircraft interiors, elastomeric bearings for rotorcraft vibration isolation, heaters, hoses, and composite ducting for environmental control systems. Brands include Aerospace Controls® and Enidine®.
Control products for the industrial markets include shock absorbers, wire ropes and actuators for factory and warehouse automation, regulators and switches for process control applications, seismic isolators and large bore shocks for protection of critical infrastructure, and regulators for natural gas vehicles. Brands include Enidine®, Compact AutomationTM, Turn-Act®, Neo-Dyn® and Conoflow®.
Other Information
CCT has a global production footprint, including facilities in the United States, Mexico, Germany, Italy, China and Japan, which provide close geographic proximity to key customers. CCT competes with a large number of companies in highly fragmented industries, ranging from large public multi-national corporations to small privately-held local firms, depending on the product line and region. CCT's ability to compete successfully depends upon numerous factors including quality, price, lead time, performance, brand recognition, customer service, innovation, application expertise and previous installation history. In addition, collaboration with customers to deliver a wide range of product offerings has allowed CCT to compete effectively, to cultivate and maintain strong customer relationships and to expand into new markets. CCT products are sold directly and indirectly through numerous channels, including distributors. CCT has long-lasting relationships with distributors, as many have been selling certain CCT products for decades. Sales to distributors represented approximately 20% of CCT's 2025 revenue.
7
OTHER COMPANY INFORMATION
Key Components and Raw Materials
All of our businesses require various manufactured components and raw materials, the availability and prices of which may fluctuate.
MANUFACTURED COMPONENTS ASSEMBLED INTO OUR PRODUCTS
• Motors
• Castings
• Mechanical Seals
• Machined Castings
• Metal Fabrications
• Miscellaneous Metal, Plastic, and Electronic Components
PRIMARY RAW MATERIALS
• Steel
• Gold
• Copper
• Nickel
• Iron
• Aluminum
• Tin
• Rubber
• Specialty Alloys, including Titanium
Raw materials are purchased in various forms, such as sheet, bar, rod and wire stock, pellets and metal powders. We also use various specialty resins and adhesives. Raw materials, supplies and product subassemblies are purchased from third-party suppliers, contract manufacturers and commodity dealers. For most of our products, we have alternate sources of supply or such materials are readily available. However, in some instances we depend on a single source of supply, manufacturing or assembly or participate in commodity markets that may be subject to a limited number of suppliers.
Our operating results are generally exposed to fluctuations in the prices and supply constraints of raw materials and commodities due to inflation, supply chain disruptions, foreign currency fluctuations, geopolitical changes, and tariffs imposed by the U.S. and other countries. We continually monitor the business conditions of our supply chain to maintain our market position and to avoid potential supply disruptions. In 2025, while fluctuations occurred due to the factors previously referenced, we are mitigating to avoid customer disruptions with a region-for-region approach, where possible. Because of the rising demand for raw materials globally, we have experienced increases in prices and delays in supply, particularly in the first half of the year, which impacted our financial results. We have been able to mitigate the impact of this inflation via fixed-price supply contracts with suppliers, price increases to customers and productivity savings. We typically acquire materials and components through a combination of blanket and scheduled purchase orders to support our materials requirements for an average of four to eight weeks, except for some specialty materials. In limited circumstances, we may have to obtain scarce components for higher prices on the spot market, which may have a negative impact on our results. We also acquire certain inventory in anticipation of supply constraints or enter into longer-term pricing commitments with vendors to improve the priority, price and availability of supply. We evaluate hedging opportunities to mitigate or minimize the risk of margin erosion resulting from the volatility of commodity prices. The challenges associated with supply chain disruptions, geopolitical disruptions, and inflation are expected to continue in 2026, and we are unable to reasonably predict when they will be resolved. As a result, we cannot provide assurance that we will not be adversely affected by materials price volatility or the availability of supplies to meet customer demand in the future.
Manufacturing Methods
Our businesses utilize two primary methods to fulfill demand for products: build-to-order and engineer-to-order.
•Build-to-order consists of assembling a group of products with the same pre-defined specifications, generally for our OEM customers. We employ build-to-order capabilities to maximize manufacturing and logistics efficiencies by producing high volumes of basic product configurations.
•Engineer-to-order consists of assembling a customized system according to a customer’s individual order specifications. Engineer-to-order permits the configuration of units to meet the customized requirements of our customers.
In both cases, we offer design, integration, test and other production value-added services. Our inventory management and distribution practices in both build-to-order and engineer-to-order seek to improve customer delivery performance and minimize inventory holding periods.
8
Intellectual Property
Where appropriate, we seek patent protection for inventions and improvements that are likely to be incorporated into our products or where proprietary rights are expected to improve our competitive position. The highly customized application engineering embedded within our products, our proprietary rights, our knowledge capabilities and our brand recognition all contribute to enhancing our competitive position.
Although we own and control a significant number of patents, trade secrets, confidential information, trademarks, trade names, copyrights and other intellectual property rights which, in the aggregate, are of material importance to our business, management believes that our Company, as a whole, as well as each of our core segments, is not materially dependent on any one intellectual property right or related group of such rights. Patents, patent applications and license agreements will expire or terminate over time by operation of law, in accordance with their terms or otherwise. As the portfolio of our patents, patent applications and license agreements has evolved over a long period of time, we do not expect the expiration of any specific patent or other intellectual property right to have a material adverse effect on our financial statements.
Research and Development
Research and Development (R&D) is key to our strategy and is generally focused on the design of highly engineered critical components that operate in harsh environments. Our R&D teams develop competitive products to address our customers' needs in the markets we serve. In addition, we work closely with our customers to engineer solutions to fit their particular applications, thus enabling our customers to achieve their goals. For example, during 2025, we continued to invest in VIDAR®, a state-of-the-art variable speed motor that eliminates the need for mechanical controls, reduces energy consumption and CO₂ output and ensures that flow controls are more precise. Additionally, our Friction brake pad business, a global leader in braking technologies, continues to develop new brake pad formulations for electric and hybrid vehicles, as well as ground-breaking innovations for low-emission braking technology. This includes the Geo-Pad, a greener brake pad using a proprietary inorganic green binder that delivers superior performance and reduces environmental impact. In Connect & Control Technologies, we advanced several connector and cable‑assembly development programs, including new high‑reliability and fiber‑optic solutions supporting recent aerospace and defense awards. These innovations enhance signal integrity, withstand extreme environmental conditions, and address growing demand for higher‑speed data transmission in mission‑critical systems. We believe R&D is a source of competitive advantage and we continue to invest approximately 3% of revenue annually, in new product innovation and other R&D efforts.
Cyclicality and Seasonality
Many of the businesses in which we operate are subject to specific industry and general economic cycles. We consider our connector products in our CCT segment to be an early-cycle business, meaning it generally is impacted in the early portion of an economic cycle. Our automotive and aerospace components businesses tend to be impacted in the middle portion of the cycle, and our industrial pump business typically is impacted late in the economic cycle.
Our businesses experience limited seasonal variations. Revenue impacts from the limited seasonal variations are typically mitigated by our backlog of orders that allows us to adjust levels of production across different periods.
9
General Developments of the Business
Acquisitions and Divestitures
Date of Transaction
Type
Segment
Business Acquired
Description
September 12, 2024
Acquisition
CCT
kSARIA Parent, Inc.
Leading producer and supplier of mission-critical connectivity solutions for the defense and aerospace end markets.
July 22, 2024
Divestiture
MT
Wolverine Advanced Materials
Manufacturer of automotive braking components and sealing solutions.
January 19, 2024
Acquisition
IP
Svanehøj Group A/S
Supplier of pumps and related aftermarket services with leading positions in cryogenic applications for the marine sector.
December 29, 2023
Divestiture
CCT
Matrix Composites, Inc.("Matrix")
Manufacturer of precision composite components in the aerospace and defense market.
May 2, 2023
Acquisition
CCT
Micro-Mode Products, Inc.
Specialty designer and manufacturer of high-bandwidth radio frequency (RF) connectors for harsh environment defense and space applications.
We continue to grow our core businesses and enhance the ITT portfolio further through mergers and acquisitions, reshaping the portfolio towards attractive pump applications and defense and aerospace interconnect markets, while reducing our automotive exposure.
In December 2025, we entered into a Membership Interest Purchase Agreement (the "Purchase Agreement") with LSF11 Redwood Parent, L.P. (the "Seller"), LSF11 Redwood TopCo LLC (the "Target") and ITT Industries Holdings, Inc., our wholly owned subsidiary, to acquire SPX FLOW, (the "Acquisition"), a subsidiary of the Target and a leading provider of pumps, valves, mixers, aftermarket services, and other flow and process solutions, for an aggregate purchase price of approximately $4,775 payable at closing of the Acquisition, comprised of $4,075 in cash and 3,839,824 shares of our common stock, subject to customary closing conditions, including regulatory approvals. We expect the Acquisition to add critical equipment and adjacent flow and process technologies that extend our capabilities to address complex customer challenges across a wide variety of key growth markets, including food & beverage, personal care, industrial, chemical, energy and mining. As part of the Acquisition, we will add approximately 3,800 employees to our workforce. Upon closing of the Acquisition, we expect SPX FLOW will form part of our Industrial Process segment.
Other than as described herein, there have been no significant developments since our previous Form 10-K filing. See Note 22, Acquisitions, Investments, and Divestitures, to the Consolidated Financial Statements for additional information.
10
ITEM 1A.
RISK FACTORS
We are subject to a wide range of factors that could materially affect future developments and performance. Because of these factors, past performance may not be a reliable indicator of future results. You should carefully consider, together with the other information contained in this Annual Report on Form 10-K, the risks and uncertainties described below. These risks may have a material adverse effect on our reputation, business, results of operations, financial condition, or cash flows. In addition to these risks, there may be additional risks and uncertainties that adversely affect our business, performance or financial condition in the future that are not presently known, are not currently believed to be significant or are not identified below because they are common to most or all companies.
Business and Operating Risks
Our operating results have been, and may continue to be, adversely affected by unfavorable or uncertain global macroeconomic and capital market conditions.
Adverse global macroeconomic conditions, including due to heightened geopolitical tensions, inflation, slowing growth or a recession, currency fluctuations, new or increased tariffs or barriers to trade, tighter credit, higher interest rates, union strikes, and higher unemployment rates can negatively impact customer confidence, spending, and demand for our products and services. In addition, these conditions can negatively impact our customers and suppliers. A downturn in the economic environment can also lead to increased credit and collectability risk or slower collection on the Company's trade receivables, increased bankruptcy risk amongst our suppliers, the failure of derivative counterparties or other financial institutions, limitations on the ability of the Company to issue new debt, reduced liquidity, declines in the fair value of the Company's financial instruments, and increased impairment risk for the Company's goodwill and intangible assets. We have experienced and, in the future, may continue to experience volatility in revenues, operating results and profitability primarily as a result of these uncertain global macroeconomic conditions.
Our business has been, and may continue to be, adversely affected by raw material price volatility, a limited number of suppliers and the inability of suppliers to meet quality and delivery requirements.
Our business relies on third-party suppliers for raw materials, components and contract manufacturing services to produce our products. Commodity prices and the prices for other raw materials necessary for production have fluctuated, and may continue to fluctuate, which represent a potential risk for our financial results.We are not always able to pass along raw material and component price increases to our customers which has impacted, and may continue to impact, our sales growth and profitability.
In addition, the supply of raw materials to ITT and to its component parts suppliers has been, and may continue to be, interrupted for a variety of reasons affecting our suppliers, including congested shipping ports around the world, production interruptions, heightened geopolitical tensions, including related to the Russia-Ukraine and the Middle East conflicts, global pandemics, the impaired financial condition of a particular supplier, capacity constraints, labor disputes or shortages, the ability to meet regulatory requirements and commitments to other purchasers. For most of our products, we have existing alternate sources of supply, or the required materials have historically been readily available. In limited instances, we depend on a single source of supply, manufacturing or assembly, or participate in commodity markets that may be subject to a limited number of suppliers. Although we believe we could obtain and qualify alternative sources for most sole and limited source supplier materials if necessary, the transition to an alternative source could be complex, costly, and protracted, especially if the change requires us to redesign our systems or re-qualify our products. Any further delay in our suppliers’ abilities to provide us with sufficient quality or flow of materials or any supplier price increases, or any decreased availability of raw materials or commodities, could further impair our ability to deliver products to our customers and may impact our profitability.
11
Recent mergers, acquisitions or venture investments could present operational challenges and past divestitures and spin-offs may expose us to potential liabilities, all of which could adversely affect our results of operations and financial position.
We regularly review our portfolio of businesses and pursue growth through the acquisition of other companies, assets and product lines that either complement or expand our existing businesses. For example, on December 4, 2025, we entered into the Purchase Agreement for the acquisition of SPX FLOW, which remains subject to the satisfaction or waiver of customary closing conditions, including regulatory approvals. Refer to Note 22, Acquisitions, Investments, and Divestitures, for further information regarding acquisitions and investments made during the year and the pending acquisition of SPX FLOW. In addition, from time to time, we make minority investments in other early-stage companies, and we risk losing part or all of our capital in any such investment. Although we conduct what we believe to be a prudent level of investigation regarding the operating and financial condition of the businesses we acquire, a level of risk remains regarding the actual operating condition of these businesses. Until we actually assume operating control of these businesses and their operations, we may not be able to ascertain the actual value or understand the potential liabilities of, or challenges facing, the acquired businesses and their operations. Acquisitions, including the pending acquisition of SPX FLOW, involve a number of risks and present financial, managerial and operational challenges that could have a material adverse effect on our reputation, financial results and business. These include the possibility that:
•an acquired business could under-perform relative to our expectations;
•we could fail to realize the expected synergies of an acquisition;
•we could experience difficulties in the integration of technology, operations, personnel and financial and other systems;
•we could have acquired substantial undisclosed liabilities;
•there could be insufficient internal controls over financial activities or financial reporting at an acquired company that could impact us on a consolidated basis;
•management attention could be diverted from other businesses;
•an acquired business may have been impacted by a previous security breach where system/data integrity was compromised, or data was stolen without the seller's awareness;
•we could lose key employees of the acquired businesses;
•we could experience increased capital requirements; and
•the acquisition could result in customer dissatisfaction.
We have divested a number of businesses, including as part of spin-offs in 1995, 2011, our sale of InTelCo Management LLC (InTelCo), the entity holding asbestos-related assets and liabilities in 2021, and Wolverine in 2024. With respect to some of these former businesses, we have contractually agreed to indemnify the counterparties against, or otherwise retain, certain liabilities including certain product liability claims and environmental matters. Even without ongoing contractual indemnification obligations, we could be exposed to liabilities arising out of such divestitures. Although the counterparties to those divestitures may have agreed to indemnify us or assume certain liabilities relating to those divestitures, there can be no assurance that the indemnity or assumption of liability by the counterparties will be sufficient to protect us against the full amount of these liabilities or that a counterparty will be able to fully satisfy its obligations. Third parties also could seek to hold us responsible for any of the liabilities that a counterparty agreed to assume. Even if we ultimately succeed in recovering any amounts for which we were initially held liable, we may be temporarily required to bear these losses ourselves.
The industries in which we operate are experiencing a skilled labor shortage and if we are unable to hire and retain key personnel, including engineering talent and senior management talent, our ability to operate or grow our business could be negatively impacted.
The manufacturing industry is currently experiencing a skilled labor shortage. This shortage has created difficulties for the Company in attracting and retaining factory employees, in meeting customer demand and in controlling labor costs. We currently have a significant number of open positions, and we expect this to remain so in 2026. A failure to attract or retain engineering and other highly skilled personnel could adversely affect our operating results, our ability to deliver products and services to our customers and our ability to grow our business. Our future success will continue to depend, to a significant extent, on our ability to attract or retain engineers, senior management, our skilled labor source and other key personnel, which will depend on our ability to offer competitive compensation, training, flexibility and other benefits that our current and prospective employees desire.
12
Failure to provide high quality and reliable products, innovate or respond to competitors in our markets or protect our intellectual property rights could adversely impact our business and financial results.
We believe product performance, reliability and innovation, application expertise, enforcement of intellectual property rights, brand reputation, and price are principal points of competition in our markets.
We manufacture key components that are integral to the operation of systems and manufacturing processes in the markets we serve. The reliability and performance of our products are critically important to our customers and the users of their products. Accordingly, quality is extremely important to us and our customers due to the potentially costly consequences of product failure. Our quality certifications, including products manufactured to military specifications, are critical to the marketing success of our goods and services. Our success in part depends on our ability to attract and retain skilled engineers and to manufacture to exact tolerances precision-engineered components, subassemblies and finished devices from multiple materials. If our components fail to meet these standards or fail to adapt to evolving standards, it could damage our reputation as a manufacturer of high-quality components, which could hurt our ability to remain competitive and result in a loss of customers, market share or product sales.
Maintaining and improving our competitive position will require our continued investment in manufacturing, research and development, engineering, marketing, customer service and support, and our distribution networks. Insufficient investment in these areas may result in a failure to maintain our competitive position. In addition, our existing competitors, or potential new competitors, may develop products that are cheaper and/or superior to our products, develop more efficient or effective methods of providing products and services, or adapt more quickly than we do to new technologies or evolving customer requirements. These pressures may result in us having to take actions, such as adjusting the prices of certain products, in order to stay competitive.
Obtaining, maintaining and enforcing our proprietary rights is another factor that is critical to the success of our business and our ability to remain competitive. For certain products and manufacturing processes, we rely on patents, trademarks, trade secrets, non-disclosure agreements and other contracts to protect these rights. These contracts may be breached or may not prevent competitors from independently developing or selling similar products. In addition, during the normal course of business, we could unintentionally infringe or violate the proprietary rights of others. Intellectual property litigation could be time consuming for management and could result in significant legal expenses to either pursue claims against others, or to defend ourselves. If we are unable to protect our patents, trademarks, or other proprietary rights, or if we infringe or violate the rights of others, our ability to remain competitive could be adversely impacted.
If we are unable to maintain our competitive position, our business, results of operations or financial condition could be materially adversely affected.
Our operations could be disrupted, and our business could be materially and adversely affected by our inability to prevent, detect or adequately respond to cybersecurity breaches.
The efficient operation of our business is dependent on information technology (IT) systems, some of which are owned or managed by third parties. In the ordinary course of business, we collect and store confidential information, including proprietary business information belonging to us, our customers, suppliers, business partners and other third parties, as well as personally identifiable information of our employees and others.
Our information technology systems and those of our third-party service providers may be susceptible to damage, disruptions or shutdowns due to power outages, hardware failures, telecommunication failures, cybersecurity incidents and user errors that may affect our operations. Although we actively manage the risks to our information technology systems that are within our control, we can provide no assurance that our actions or those of our third-party service providers will always be successful in eliminating or mitigating risks to our systems, networks or data. Even the most well-protected information technology systems could be vulnerable to internal and external cybersecurity incidents including, but not limited to, those by employees and by computer hackers and other threat actors utilizing techniques such as phishing, ransomware or denial of service attacks. We have experienced cybersecurity incidents in the past which have not had a material impact on our operations or financial results. If we experience a future disruption in our information technology systems, it could result in the loss of sales and customers and significant incremental costs, which could materially adversely affect our business. In addition, as a provider of products and services to government and commercial customers, and particularly as a government contractor, we are subject to a heightened risk of cybersecurity incidents caused by computer viruses, illegal break-ins or hacking, sabotage, or acts of vandalism, including by foreign governments, hackers and cyber terrorists. Furthermore, information technology security threats are increasing in sophistication, intensity and frequency. A cybersecurity incident may occur, including breaches that we may be unable to detect in a timely manner.
13
The integration of artificial intelligence ("AI") into our engineering and manufacturing processes could amplify cybersecurity risks, including unauthorized access to proprietary data and disruption of production systems. AI usage can expand our attack surface and increase the sensitivity and volume of data processed. Threat actors may exploit AI systems (including generative models) to enable more sophisticated phishing, deepfake social engineering, and automated vulnerability discovery. In addition, we depend on third-party AI tools, cloud platforms, and model providers; deficiencies in those vendors’ security, privacy, or model governance could create risks we cannot fully control. The unavailability of our information technology systems, the failure of these systems to perform as anticipated for any reason, or any significant breach of security could cause significant disruption to our business or could result in decreased performance and increased costs.
We continue to monitor data security regulations in the jurisdictions in which we operate. The processing and storage of certain information is increasingly subject to privacy and data security regulations, and many such regulations are country specific. The interpretation and application of data protection laws in the U.S., Europe, China, and elsewhere are uncertain, evolving and may be inconsistent across jurisdictions. Compliance with these various laws may be onerous and require us to incur substantial costs or to change our business practices in a manner that adversely affects our business, while failure to comply with such laws may subject us to substantial penalties.
If we are unable to protect sensitive information, our customers or governmental authorities could question the adequacy of our security processes and procedures and our compliance with evolving privacy and data security regulations and government cybersecurity requirements for government contractors, potentially causing us to lose business. A breach could also result in the loss of our intellectual property, potentially impacting our long-term capability to compete for sales of affected products. In addition, a breach of security of our information technology systems could result in litigation, regulatory action and potential liability, as well as increased costs to implement further information security measures. If we are unable to prevent, detect or adequately respond to cybersecurity incidents, our operations could be disrupted, our reputation could be harmed, and our business and financial condition could be materially and adversely affected.
We may face risks related to the use of Artificial Intelligence and Generative AI technologies
We may leverage machine learning (“ML”) and artificial intelligence (“AI”), including generative AI (“GenAI”), in our business to improve efficiency and innovation within our operations. This may introduce risks related to cybersecurity, data integrity, and inadvertent misuse, as well as ethical and social concerns. While we have implemented governance measures, including a GenAI Governance Committee and restrictions limiting usage to approved enterprise-level tools, these controls may not fully address risks associated with rapidly evolving technologies, provider practices, and competitive adoption. Controls related to AI lifecycle management—covering data stewardship, bias detection, reliability testing, human oversight, incident response, and decommissioning are evolving and may not mitigate all risks. Failure to implement effective AI observability, traceability, and post-deployment monitoring could impair our ability to detect and remedy issues promptly.
AI algorithms may be flawed or biased, and datasets used to train AI systems may be insufficient, unlawfully obtained, or contain personal or protected information without proper rights. These issues could lead to inaccurate or discriminatory outputs, infringement of intellectual property or data privacy rights, and other legal or regulatory violations, as well as adversely affect our business, financial condition, and results of operations. Furthermore, our competitors or other third parties may incorporate AI into their operational processes more quickly or more successfully than us, which could have a material adverse effect on our competitive position, reputation, and operations.
Agentic AI systems are tools capable of autonomously initiating tasks, making decisions, or executing multi-step actions without direct human prompting, which may introduce additional operational, security, and compliance risks. These systems could take actions outside intended business parameters, propagate errors at scale, or interact with internal and external systems in unanticipated ways, increasing the likelihood of operational disruptions or regulatory exposure. Agentic AI may also heighten risks related to model alignment, permissions design, and dependency on third party control mechanisms, any of which may fail to function as expected. If agentic AI systems behave unpredictably, are misconfigured, or are exploited by malicious actors, they could result in unauthorized transactions, data leakage, safety incidents, or other adverse impacts. If we are unable to effectively govern or oversee these autonomous capabilities, we could experience material and negative affects to our business, reputation, financial condition, and results of operations.
The legal, regulatory, and compliance environments surrounding the design and use of AI technology at the federal, state, and international levels are evolving and complex. For example, the European Union’s Artificial Intelligence Act establishes obligations based on risk classifications, and U.S. federal and state agencies continue
14
to introduce new frameworks governing AI. Compliance with these evolving regulations could entail significant costs and negatively affect our business. Additionally, AI-related changes may disrupt our industry, lower barriers to entry, and increase competition from larger or better-funded companies with more advanced AI capabilities. If our AI initiatives fail to deliver anticipated benefits or if we cannot adapt to evolving customer expectations, regulatory requirements, or competitive pressures, our business, reputation, financial condition, and results of operations could be materially and adversely affected.
The Company’s ability to manage its business and monitor results is highly dependent upon information and communication systems, and a failure of these systems, including flaws in the implementation of any business system, could adversely impact our business or financial results.
The Company is dependent upon a variety of information technology IT systems, including business systems and communication systems, to operate its business. Over the past several years, we have been implementing new business systems at many of our sites, including within our shared services subsidiary, and we expect these implementations to continue for the next several years. These implementations have required and will continue to require significant investment in capital and deployment of human resources. Potential flaws in implementing business systems or in the failure of any portion or module of the business system(s) may pose risks to our ability to operate successfully and efficiently. In addition, failure to implement the appropriate internal controls with respect to new business systems may result in the business systems producing inaccurate or unreliable information. Any disruptions, delays or deficiencies in the design or implementation of the new business systems or related internal controls, or in the performance of legacy IT systems, could adversely affect the Company’s ability to effectively manage its business, which could adversely affect the Company’s reputation, competitive position and financial results.
A significant portion of our revenue is derived from a single customer. Loss of this customer, a loss of business with this customer, or a reduction in this customer's market share, could adversely impact our financial results.
Sales to Aumovio SE, a supplier to the automotive industry and ITT's largest customer, were approximately 6% of our total revenue in 2025. Requests by automakers to use ITT brake pads in their Aumovio produced braking systems (calipers) typically account for approximately half of MT's revenue from Aumovio. These automaker requests are generally formalized through supply agreements signed directly between MT and the automakers. The remainder of MT's sales to Aumovio in 2025 was generated from a 10-year agreement to supply Aumovio with aftermarket parts, which is effective through December 31, 2033, although there can be no assurance that we are able to retain this customer's business in the future. The loss of this customer, or a reduction in this customer's market share could have a material adverse effect on our business, results of operations or financial condition.
Due to our operations and sales outside of the U.S., we are subject to inherent business risks, including the imposition of tariffs, which may adversely affect our financial results.
Our international operations, including U.S. exports, comprise a growing portion of our operations and are a strategic focus for continued future growth. We have sales in emerging markets such as Mexico, South America, China, and the Middle East. In 2025, approximately 65% of our total sales were to customers operating outside of the United States. Our sales from international operations and export sales are subject to varying degrees of risks inherent in doing business outside of the United States. These risks include the following:
•war or geopolitical instability in regions where we operate;
•fluctuations in foreign exchange rates;
•possibility of unfavorable circumstances arising from host country laws or regulations;
•restrictions, regulations, or tax liabilities on currency repatriation;
•potential negative consequences from changes to taxation policies;
•the disruption of operations from labor and political disturbances; and
•our ability to hire and maintain qualified staff in these regions.
Our operations in emerging markets could involve additional uncertainties such as challenges in our ability to protect our intellectual property, pressure on the pricing of our products, and risks of political instability. Governments of emerging market countries may also impose limitations or prohibitions on our ability to repatriate funds, impose or increase withholding or other taxes on remittances and other payments to us, seek to nationalize our assets, or impose or increase investment barriers or other restrictions that may adversely affect our business.
15
Because a significant portion of our sales are to customers operating outside the U.S., our financial results have been, and may continue to be, adversely impacted by foreign currency fluctuations, which are influenced by changes in global macroeconomic conditions. The primary foreign currencies to which we have exposure are the Euro, Chinese renminbi, Czech koruna, Danish krone, Singapore dollar, Polish zloty, South Korean won, Saudi riyal, Mexican peso, and Israeli new shekel. Any significant change in the value of currencies of the countries in which we do business relative to the value of the U.S. dollar could reduce our revenue, impact our ability to sell products and control costs, thus our financial results have been, and may continue to be, adversely affected upon translation. In addition, our international subsidiaries report their results of operations and financial position in their respective local currencies (i.e., functional currencies), which are then translated into U.S. dollars for financial reporting purposes. From time to time, we enter into derivative contracts to hedge some of our foreign currency exposures. However, our hedging strategy may fail to reduce our exposure and could even result in an unfavorable impact on our financial results. Refer to Note 21, Derivative Financial Instruments, for further information.
The cost of compliance with increasingly complex and often conflicting regulations worldwide can also impair our flexibility in modifying product, marketing, pricing or other strategies for growing our businesses, as well as our ability to improve productivity and maintain acceptable profit margins.
Tariffs remain uncertain and may continue to have a negative impact to our business.
Over the last several years the U.S. government has undertaken a series of actions to increase tariffs on certain goods imported into the U.S., particularly from China and other key trading partners. In early 2025, the U.S. government announced or extended tariffs on a range of imported goods, including certain industrial components and raw materials, as part of ongoing trade actions. In response, several countries, including China, announced or implemented retaliatory tariffs on goods exported from the United States. These reciprocal trade measures have contributed to increased uncertainty in global trade policy and supply chain dynamics. Prior tariffs have negatively impacted demand for our products as well as the cost of certain parts and materials that we purchase from vendors located overseas, particularly in China. Although we have been mitigating, and will continue attempting to mitigate, the impact of tariffs by supplier and customer negotiations, diversification strategies and pricing actions, there can be no assurance that our mitigation actions will be effective. At this time, it remains unclear what further measures will be implemented, including changes to existing trade agreements or the imposition of additional tariffs. Any new or continued trade disputes or increased tensions between the U.S. and other countries, and any governmental actions, including further increases of existing tariffs or the imposition of new tariffs, or changes to trade agreements applicable to our operations, may continue to adversely impact demand for our products, increase our costs, and disrupt our supply chain. These risks, in turn, could have a material adverse effect on our business results of operations and financial condition.
Our business is impacted by our customers' levels of capital investment, maintenance expenditures, production, and market cyclicality.
Demand for certain of our products and services depends on the levels of capital investment, planned maintenance expenditures, and/or production of our customers which, in turn, depend on general economic conditions, availability of credit, economic conditions within their respective industries, supply and demand shocks, workforce strikes or employee absenteeism, volatility in commodity prices, expectations of future market behavior and their liquidity and financial position. The ability of our customers to finance capital investment, maintenance, and/or production may also be affected by factors independent of the conditions in their industries, such as the condition of global credit and capital markets. Accordingly, some of our customers have chosen to postpone capital investment, maintenance, and/or production, and may continue doing so in the future, potentially even during favorable conditions in their industries or markets, which has led, and may continue leading, to a delay or cancellation of orders.
Our customers' businesses, particularly those in the energy, chemical and mining industries, which represented approximately 16%, 9%, and 3%, respectively, of our 2025 revenue, are to varying degrees cyclical and have experienced, and may in the future experience, periodic downturns of varying severity. For example, the volatility of the energy market has generally been dependent upon the prevailing view of future gas and oil prices, which are influenced by numerous supply and demand factors, including availability and cost of capital, global and domestic economic conditions, environmental regulations, policies of the Organization of the Petroleum Exporting Countries (OPEC) countries and Russia and other factors. Our customers in these industries, particularly those whose demand for our products and services is primarily profit-driven, have tended to delay large capital projects, including expensive maintenance and upgrades, during economic downturns. Additionally, fluctuating energy demand forecasts and commodity pricing and other macroeconomic factors may cause our customers to be more conservative in their capital planning, which could reduce demand for our products and services, result in the delay
16
or cancellation of existing orders, or lead to excess manufacturing capacity, which unfavorably impacts our absorption of fixed manufacturing costs. This reduced demand may also erode average selling prices in our industry. These factors could have a material adverse effect on our business, results of operations and financial condition.
A material business interruption, particularly at one of our manufacturing facilities, could negatively impact our ability to generate sales and meet customer demand.
If operations at one or more of our manufacturing facilities were to be disrupted or damaged as a result of war (including related to Russia-Ukraine, the Middle East, and China-Taiwan), an epidemic or pandemic, changing weather or climate conditions (including increases in storm intensity, sea-level rise, melting of permafrost and temperature extremes on facilities or operations; and changes in the availability or quality of water, or other natural resources on which our business depends), IT system failure, cyber-attack, equipment failure, labor dispute, natural disaster, power outage, flood, fire, explosion, act of terrorism, relocation of production location or any other catastrophic event or reason, our ability to meet customer demand for our products may be impacted. We have business continuity plans in place to mitigate the effects of such interruptions, but these plans may not be sufficient to resolve the issues in a timely manner. A significant interruption in production capability could also require us to make substantial payments due to non-performance. In addition, although we have insurance for certain covered losses, there can be no assurance that such insurance will be sufficient. In addition, any recovery under our insurance policies would be subject to deductibles and, depending on the coverage, may not offset the lost revenues or increased expenses that may be experienced during the disruption of operations.
Increased scrutiny from investors, lenders and other market participants regarding our environmental, social and governance or sustainability responsibilities could expose us to additional costs and adversely impact our reputation, business, financial performance and growth.
There is an increasing focus from certain investors, customers and other key stakeholders on corporate responsibility, specifically related to environmental, social, and governance ("ESG") matters, including companies' contribution to climate change and loss of biodiversity. Some investors have used, and may continue to use, ESG criteria to guide their investment strategies and, in some cases, have chosen, and may continue to choose, not to invest in ITT, or to divest their holdings of ITT if they believe our policies relating to corporate responsibility are inadequate. New U.S. and European Union climate-related disclosure requirements may require additional systems, internal controls, and assurance processes that could increase compliance costs.
The ESG factors by which companies’ corporate responsibility practices are assessed have been evolving and may continue to evolve. Additionally, requirements on U.S. public companies and companies with European operations with regards to ESG compliance have been increasing and may continue to increase, including, but not limited to California's Climate Accountability Laws and the European Union's Corporate Sustainability Reporting Directive (CSRD), which will require third-party assurance disclosures. These evolving standards and regulations have caused us, and may continue causing us, to undertake costly initiatives to satisfy such new criteria. If we are unable to satisfy new corporate responsibility criteria, investors may conclude our policies are inadequate and choose not to invest in our securities or to divest all or a portion of their current holdings, which in either case may adversely affect the price of our securities.
In addition, as we identify sustainability topics for voluntary disclosure and work to align with the recommendations of the Financial Stability Board’s Task Force on Climate-Related Financial Disclosures (TCFD) and Sustainability Accounting Standards Board (SASB) standards and our own assessment of priority of sustainability issues, we have expanded and, in the future, may continue to expand our disclosures in these areas. Statements about our sustainability initiatives and goals, and progress against those goals, may be based on standards for measuring progress that are still developing, internal controls and processes that continue to evolve, and assumptions that are subject to change in the future. If our sustainability-related data, processing and reporting are incomplete or inaccurate, if we fail to achieve progress on our metrics on a timely basis or at all, or if we fail to satisfy the expectations of investors and other key stakeholders, our reputation, business, and financial performance could be adversely affected.
17
Legal and Regulatory Risks
We are subject to risks related to government contracting, including changes in levels of government spending and regulatory and contractual requirements applicable to sales to the U.S. government.
Our CCT and MT segments derive a portion of their revenue from sales to U.S. government customers and higher tier contractors who sell to the U.S. government. The government's expenditures are subject to political and budgetary fluctuations and constraints, which may result in significant unexpected changes in levels of demand for our products. In addition, the award, administration and performance of government contracts are subject to regulatory and contractual requirements that differ significantly from the terms and conditions that apply to contracts with our non-governmental customers. We have in the past and may in the future be subject to audits and investigations to evaluate our compliance with these requirements. If we are found to have failed to comply with requirements applicable to government contractors, we may be subject to various actions, including but not limited to fines or penalties, reductions in the value of our government contracts, restrictions on the sale of certain products to the government, or suspension or debarment from government contracting. Failure to comply with applicable requirements also could harm our reputation and our ability to compete for future government contracts or sell equivalent commercial products.
If we are not able to meet the requirements for government contractors, we may lose orders, which could have a material adverse effect on our business, financial condition and results of operations.
Changes in our effective tax rates as a result of changes in the realizability of our deferred tax assets, the geographic mix of earnings, tax examinations or disputes, tax authority rulings or changes in the tax laws may adversely affect our financial results.
The Company is subject to taxes in the U.S. and in various foreign jurisdictions. We exercise significant judgment in calculating our provision for income taxes and other tax liabilities. In the ordinary course of our business, there are many transactions and calculations where the ultimate tax determination is uncertain. Changes in domestic or foreign tax laws and regulations, or their interpretation, could result in higher or lower tax rates assessed or changes in the taxability of certain income or the deductibility of certain expenses, thereby affecting our tax expense and profitability. Any significant increase in our future effective tax rates could reduce net income in future periods. Given the global nature of our business, a number of factors may increase our future effective tax rates, including changes in the geographic mix of our profits among jurisdictions with differing statutory income tax rates; sustainability of historical income tax rates in the jurisdictions in which we conduct business; changes in tax laws applicable to us; expiration, renewal or application of tax holidays; the resolution of issues arising from tax audits with various tax authorities; or changes in the valuation of our deferred tax assets, deferred tax liabilities and deferred tax asset valuation allowances.
The amount of income taxes and other taxes we have paid are subject to ongoing audits by U.S. federal, state, and local tax authorities and by non-U.S. authorities. If these audits result in assessments different from amounts paid or reserved, future financial results may include unfavorable tax adjustments. We are currently under routine examination by the U.S. Internal Revenue Service and other U.S. and non-U.S. tax authorities, and we may be subject to additional examinations in the future. The tax authorities may disagree with our tax treatment of certain material items and thereby increase our tax liability. Failure to sustain our position in these matters could result in a material adverse effect on our financial statements.
We are closely monitoring the potential passage of new U.S. and foreign tax legislation, which could result in substantial changes to the current U.S. or foreign tax systems. In October 2021, the Organisation for Economic Cooperation and Development (OECD) and G20 Finance Ministers reached an agreement, known as Base Erosion and Profit Shifting (BEPS) Pillar Two, which is a multi-jurisdictional plan of action to address base erosion and profit shifting. On December 20, 2021, the OECD released the Model GloBE Rules for Pillar Two defining a 15% global minimum tax rate for large multinational corporations. Countries are implementing legislation with widespread adoption of the Model GloBE Rules for Pillar Two. We continue to evaluate the Model GloBE Rules for Pillar Two and related legislation, and their potential impacts. Continuing enactment of these regulations could increase the amount of global corporate income tax paid by the Company.These increases could have a material adverse effect on our effective tax rate. As the effects of a change in U.S. or foreign tax law must be recognized in the period in which the new legislation is enacted, should new legislation be signed into law, our financial results could be materially impacted.
On August 16, 2022, the U.S. government enacted the Inflation Reduction Act of 2022 (the Inflation Reduction Act) into law. The Inflation Reduction Act includes a new corporate alternative minimum tax (the Corporate AMT) of 15% on the adjusted financial statement income (the "AFSI") of corporations with an average AFSI exceeding $1.0
18
billion over a three-year period. The Corporate AMT was effective for the Company beginning in 2023. Given the AFSI threshold, the Corporate AMT was not applicable to the Company in 2025, but the Corporate AMT may have potential impacts on our future U.S. tax expense, cash taxes and effective tax rate. Additionally, the Inflation Reduction Act imposes a 1% excise tax on the fair market value of net stock repurchases made after December 31, 2022. Although the impact of this provision was not material in prior years, we incurred $5.0 of excise tax on stock repurchases in 2025, and future impacts will depend on the extent of share repurchases in subsequent periods.
Changes in environmental laws or regulations, the discovery of previously unknown or more extensive contamination or the failure of a potentially responsible party to perform may adversely affect our financial results.
We are subject to a variety of federal, state, local and foreign laws, rules and regulations related to the use, storage, handling, discharge or disposal of certain chemicals used in manufacturing our products, as well as laws related to greenhouse gas emissions (including cap-and-trade laws). These laws could require us to incur substantial expenses. Environmental laws and regulations allow for the assessment of substantial fines and criminal sanctions as well as facility shutdowns to address violations and may require the installation of costly pollution control equipment or operational changes to limit emissions or discharges. The discovery of previously unknown or more extensive contamination at a site which the Company previously operated or currently operates could suddenly subject the Company to costly remediation efforts. We could be affected directly or indirectly through impacts on our customers and suppliers by changes in environmental laws or regulations, including, for example, those imposed in response to vapor intrusion or climate change concerns and violations by us of such laws and regulations. We may also be impacted by the adequacy of insurance policies, our inability to recover costs associated with any such developments, or financial insolvency of other potentially responsible parties which could have a material adverse effect on our business, financial condition and results of operations. In addition, new laws and regulations that might reduce demand for oil and gas production or power generation may result in lower spending by some of our IP customers.
Failure to comply with the U.S. Foreign Corrupt Practices Act or other applicable anti-corruption legislation, as well as export controls and trade sanctions, could result in fines or criminal penalties.
We operate in a number of countries throughout the world, including countries known to have a reputation for corruption. We are committed to doing business in accordance with applicable anti-corruption laws. However, we cannot provide assurance that our internal controls will always protect us from reckless or criminal acts committed by our employees, agents or business partners that would violate U.S. and/or applicable non-U.S. laws, including anti-bribery, competition, trade sanctions and regulation, and other laws including but not limited to, the U.S. Foreign Corrupt Practices Act of 1977 and the U.K. Bribery Act of 2010, as well as trade sanctions administered by the Office of Foreign Assets Control, the U.S. Department of State and the U.S. Department of Commerce. Any such violation could result in substantial fines, sanctions, civil and/or criminal penalties, suspension or debarment from government contracts or curtailment of operations in certain jurisdictions, and might adversely affect our business, financial condition or results of operations or financial position. Furthermore, detecting, investigating, and resolving actual or alleged violations is expensive and can consume significant time and attention of our senior management. Even the allegation or appearance of our employees, agents or business partners acting improperly or illegally could damage our reputation and result in significant expenditures in investigating and responding to such actions.
We are subject to laws, regulations and potential claims relating to product liability.
Our business exposes us to potential product liability risks that are inherent in the design, manufacture, and marketing of products for the markets we serve. In addition, many of the devices we manufacture and sell are critical components designed to be used in harsh environments for long periods of time where the cost of failure is high. Component failures, manufacturing defects, design flaws, or inadequate disclosure of product-related risks or product-related information could result in an unsafe condition or injury to, or death of, an end-user of our products. The occurrence of such a problem could result in product liability claims or a recall of, or safety alert relating to, one or more of our products which could ultimately result, in certain cases, in the removal of such products from the marketplace and claims regarding costs associated therewith. Product liability claims or product recalls in the future, regardless of their ultimate outcome, could have an adverse effect on our reputation and on our ability to attract and retain customers for our products.
19
Anti-takeover provisions in our organizational documents and Indiana law could delay or prevent a change in control.
Certain provisions of our articles of incorporation and by-laws may delay or prevent a merger or acquisition that a shareholder may consider favorable. For example, the articles of incorporation authorize our Board of Directors to issue one or more series of preferred stock. Such provisions may also discourage acquisition proposals or delay or prevent a change in control, which could harm our stock price. Indiana law also imposes some restrictions on mergers and other business combinations between any holder of 10% or more of our outstanding common stock and us as well as certain restrictions on the voting rights of "control shares" of an "issuing public corporation."
Pending SPX FLOW Acquisition Risks
The acquisition of SPX FLOW (the "Acquisition") may not be completed within the expected timeframe, or at all, and the failure to complete the Acquisition could adversely impact our stock price and our future business and financial results.
There can be no assurance that the Acquisition will be completed in the expected timeframe, or at all. The Purchase Agreement contains a number of conditions that must be satisfied or waived prior to the completion of the Acquisition, including regulatory approvals. We can provide no assurance that all closing conditions will be satisfied (or waived, if applicable). Many of the conditions to completion of the Acquisition are not within our control, and we cannot predict when or if these conditions will be satisfied (or waived, as applicable). Whether or not the Acquisition is completed:
•we are responsible for certain transaction costs relating to the Acquisition;
•while the Purchase Agreement is in force, we are subject to certain restrictions on the conduct of our business, including taking any action that would reasonably be expected to have a material negative impact on or materially delay the satisfaction of the conditions in the Purchase Agreement required to consummate the Acquisition, which restrictions may adversely affect our ability to execute certain of our business strategies; and
•matters relating to the Acquisition (including integration planning) may require substantial commitments of time and resources by our management, which could otherwise have been devoted to other opportunities that may have been beneficial to us.
If the Acquisition is not completed, our ongoing business and financial results may be adversely affected and we will be subject to a number of risks, including the following:
•depending on the reasons for the failure to complete the Acquisition, we could be liable to Seller for monetary or other damages in connection with the termination or breach of the Purchase Agreement; and
•we have dedicated significant time and resources, financial and otherwise, in planning for the Acquisition and the associated integration, of which we would lose the benefit if the Acquisition were not completed.
In addition, if the Acquisition is not completed, we may experience negative reactions from the financial markets and from our customers and employees. We also may be subject to litigation related to any failure to complete the Acquisition or to enforcement proceedings commenced against us to perform our obligations under the Purchase Agreement. If the Acquisition is not completed, these risks may materialize and may adversely affect our business, financial results and financial condition, as well as the price of our common stock.
Moreover, we intend to finance the cash portion of the purchase price of the Acquisition with proceeds from the offering of our common stock that closed on December 10, 2025 (the "Equity Offering"), together with proceeds to be drawn from the Term Loan Facility (as defined below) and cash on hand. If the Acquisition is not completed, the proceeds from the equity offering will remain available to us. In such event, we may retain the proceeds for general corporate purposes or deploy them in other ways, which may not generate a return commensurate with investors’ expectations or enhance shareholder value.
We may be unable to integrate SPX FLOW successfully and realize the anticipated benefits of the Acquisition.
If the Acquisition is completed, the successful integration of SPX FLOW and its operations into those of our own and our ability to realize the expected synergies and benefits of the transaction are subject to a number of risks and uncertainties, many of which are outside of our control. We will also be required to devote significant management attention and resources to integrating business practices, cultures and operations of each business. The risks and uncertainties relating to integrating the two businesses include, among other things:
20
•the risk that SPX FLOW’s business does not perform to our expectations;
•the challenge of integrating complex organizations, systems, operating procedures, compliance programs, technology, networks and other assets of SPX FLOW;
•the difficulties harmonizing differences in the business cultures of our company and SPX FLOW;
•the inability to successfully integrate our respective businesses in a manner that permits us to achieve the expected growth opportunities, cost savings, synergies and other anticipated benefits from the Acquisition;
•the inability to minimize the diversion of management attention from ongoing business concerns during the process of integrating SPX FLOW into our business;
•the inability to resolve potential conflicts that may arise relating to customer, supplier and other important relationships of our business and the business of SPX FLOW;
•difficulties in retaining key management and other key employees; and
•the challenge of managing the expanded operations of a significantly larger and more complex company and coordinating geographically separate organizations.
We will incur substantial expenses to consummate the proposed Acquisition but may not realize the anticipated cost synergies and other benefits. In addition, even if we are able to integrate SPX FLOW successfully, the anticipated benefits of the pending Acquisition may not be realized fully, or at all, or may take longer to realize than expected. Given the size and significance of the Acquisition, we may encounter difficulties in the integration of the operations of SPX FLOW and may fail to realize the full benefits and synergies that we anticipate for the Acquisition, which could adversely impact our business, results of operation and financial condition.
Any anticipated benefits from the Acquisition may vary from expectations.
If the Acquisition is completed, the combined company may fail to realize the anticipated benefits and synergies expected from the Acquisition, which could adversely affect the combined company’s business, financial condition and results of operations. The success of the Acquisition will depend, in significant part, on the combined company’s ability to successfully integrate the acquired business, grow the revenue of the combined company and realize the anticipated strategic benefits and synergies from the combination. We expect double-digit adjusted EPS accretion in the first full year after the Acquisition is consummated, excluding non-cash amortization of intangible assets. Further, we believe that the combination of the companies will provide an annualized run-rate of approximately $80 million of cost synergies by the end of the third year after the Acquisition is consummated (exclusive of an estimated $96 million in associated one-time costs). However, the anticipated benefits of the transaction may not be realized fully or at all, or may take longer to realize than expected. Actual operating, technological, strategic and revenue opportunities, if achieved at all, may be less significant than expected or may take longer to achieve than anticipated. If the combined company is not able to achieve these objectives and realize the anticipated benefits and synergies expected from the Acquisition within the anticipated timing or at all, the combined company’s business, financial condition and results of operations may be adversely affected.
SPX FLOW may have liabilities that are not known to us.
SPX FLOW may have liabilities that we failed, or were unable, to discover in the course of performing our due diligence investigations of SPX FLOW. We cannot assure you that the indemnification available to us under the Purchase Agreement in respect of the Acquisition in connection with such agreement will be sufficient in amount, scope or duration to fully offset the possible liabilities associated with the business of SPX FLOW or property that we will assume upon consummation of the Acquisition. We may learn additional information about SPX FLOW that materially adversely affects us, such as unknown or contingent liabilities and liabilities related to compliance with applicable laws. Any such liabilities, individually or in the aggregate, could have a material adverse effect on our business, financial condition and results of operations.
Acquisition accounting adjustments could adversely affect our financial results.
If completed, we will account for the completion of the Acquisition by allocating the purchase price of the Acquisition to the tangible and intangible assets acquired, liabilities assumed and non-controlling interests in SPX FLOW based on their estimated fair value at the Acquisition date. The excess of the purchase price over those estimated fair values will be recorded as goodwill. Changes to acquisition date fair values prior to the expiration of the measurement period, a period not to exceed 12 months from the closing date of the Acquisition, are recorded as an adjustment to the associated goodwill in the reporting period in which the adjustment amounts are determined. Changes to acquisition date fair values after expiration of the measurement period are recorded in earnings.
21
Differences between preliminary estimates and the final accounting for the Acquisition may occur, and these differences could have a material impact on our future consolidated financial statements and the combined company’s future results of operations and financial position.
While the Acquisition is pending, we and SPX FLOW will be subject to business uncertainties that could adversely affect our respective businesses.
Our success following the Acquisition will depend in part upon the ability of us and SPX FLOW to maintain our respective business relationships. Uncertainty about the effect of the Acquisition on customers, suppliers, employees and other constituencies may have a material adverse effect on us and SPX FLOW. Customers, suppliers and others who deal with us or SPX FLOW may delay or defer business decisions, decide to terminate, modify or renegotiate their relationships or take other actions as a result of the Acquisition that could negatively affect the revenues, earnings and cash flows of our company or SPX FLOW. If we are unable to maintain these business and operational relationships, our financial position, results of operations or cash flows could be materially affected.
Financing the Acquisition will result in an increase in our indebtedness, which could adversely affect us, including by decreasing our business flexibility and increasing our interest expense.
We have secured commitments for a $2,875 million term loan facility (the “Term Loan Facility”) and expect to enter into a related credit agreement prior to the closing of the Acquisition. We intend to finance the cash portion of the purchase price of the Acquisition with proceeds from the Equity Offering, together with proceeds to be drawn from the Term Loan Facility and cash on hand. As of December 31, 2025 our total debt was $782.8 and our total debt as of that date on a pro forma basis after giving effect to the incurrence of indebtedness under the Term Loan Facility in full (without giving effect to $10 million of unamortized debt issuance costs) would have been approximately $3,660. These increases in our indebtedness may, among other things, reduce our flexibility to respond to changing business and economic conditions or to fund capital expenditures or working capital needs, and cause ratings agencies to downgrade our credit ratings or place us on negative watch. In addition, the amount of cash required to pay interest on our indebtedness following, subject to market conditions and other factors, completion of the debt financing and the Acquisition, and thus the demands on our cash resources, will materially increase as a result of the Term Loan Facility and the Acquisition.
ITEM 1B.
UNRESOLVED STAFF COMMENTS
None.
ITEM 1C.
CYBERSECURITY
Cybersecurity Risk Management and Strategy
We have developed and implemented a cybersecurity risk management program intended to protect the confidentiality, integrity, and availability of our critical systems and information. Our cybersecurity risk management program includes a cybersecurity incident response plan.
We design and assess our program based on the National Institute of Standards and Technology Cybersecurity Framework (NIST CSF). This does not imply that we meet any particular technical standards, specifications, or requirements, only that we use the NIST CSF as a guide to help us identify, assess, and manage the cybersecurity risks that are relevant to our business.
Our cybersecurity risk management program is integrated into, and forms an integral part of, our overall enterprise risk management program, and shares common methodologies, reporting channels and governance processes that apply across the enterprise risk management program to other legal, compliance, strategic, operational, and financial risk areas.
We have established a proactive approach to identify and manage material cybersecurity threats which includes, but is not limited to, the following:
•A 24/7/365 managed security operations center that continuously monitors the ITT environment for any anomalous and potentially malicious activity and proactively takes steps to contain the spread of any cybersecurity incident. This managed service includes agentic-AI capabilities to more quickly identify and respond to threats;
22
•Incident Response and Forensic experts on retainer for rapid deployment in the event of a cybersecurity breach or other critical incident;
•An end-user cybersecurity awareness program that requires annual training completion, monthly simulated phishing emails to assess user susceptibility and provide training on emerging threats, and ongoing awareness communications throughout the year to reinforce learnings and raise awareness of specific, actively exploited threat vectors;
•Security policies and practices aligned with both the NIST Cybersecurity Framework (CSF) and NIST Special Publication 800-171, Revision 2 (NIST 800-171 Rev 2) and the organization’s enterprise risk management requirements;
•Annual cybersecurity reporting and strategic update to ITT's Board of Directors;
•Enterprise-wide centralized Security Information and Event Management (SIEM);
•Regular red-team attack simulations led by industry-leading third-party cybersecurity firms;
•Continuous internal and external facing vulnerability management scanning;
•Threat intelligence feeds from various external sources (fee and non-fee based);
•Threat hunting by both managed service provider and internal team;
•Engagement of forensic cybersecurity and data analysis firms (as needed) to conduct independent validation assessments if a breach is suspected and/or validated; escalation of an incident and engagement of these firms would be performed in coordination with the CSIRT and Legal teams;
•Engagements with third party consultants to build, design, and improve cyber risk management tools and processes;
•Third-party technology and service provider risk evaluation process that looks at existing controls, validation via standard reporting (including SOC2 Type II report analysis), and heightened monitoring for higher impact partners; and
•Cybersecurity insurance coverage.
During 2025, there were no cybersecurity incidents that had a material effect on the Company. Furthermore, we have not identified risks from known cybersecurity threats, including as a result of any prior cybersecurity incidents, that have materially affected us to date, including our business, business strategy, results of operations, or financial condition. In the event of a material cybersecurity incident, ITT would follow required reporting to the SEC and all other agencies in accordance with the various required reporting protocols.For a discussion of prospective risks related to potential cybersecurity incidents, please refer to Item 1A, Risk Factors.
Cybersecurity Governance
Our Board considers cybersecurity risk as part of its risk oversight function and has delegated to the Audit Committee oversight of cybersecurity and other information technology risks. The Audit Committee oversees management’s implementation of our cybersecurity risk management program and discusses with management the Company's cybersecurity and other information technology risks, controls, and procedures.
The Board receives annual reports from management on our cybersecurity risks and strategic updates. These reports are designed to provide the Board a view into the progress of previous efforts, an update on existing and new material risks, and an overview of proposed or planned cybersecurity-related projects, and foster a discussion of cyber threats trending within the industry and their applicability to the organization. If a new material risk is identified, or if the Company is impacted by a material security incident, the Audit Committee and the full Board of Directors are notified and apprised of developments.
ITT employs a team of certified cybersecurity professionals responsible for assessing and managing cybersecurity risks, led by the Chief Information Security Officer (CISO), who altogether make up ITT’s Cyber Security Operations Center (CSOC). The qualifications of our cybersecurity team include the following industry-recognized certifications: ISC2 Certified Information Systems Security Professional (CISSP), Certified Cloud Security Professional (CCSP), Certified Ethical Hacker (C|EH), Security+, and IAPP Certified Information Privacy Professional (CIPP/US). Additionally, our cybersecurity team possesses several certifications from the SANS
23
Institute’s Global Information Assurance Certification (GIAC) program, the top cybersecurity accreditation body in the world. These include GIAC Incident Handler Certification (GCIH), GIAC Certified Systems and Network Auditor (GSNA), GIAC Foundational Cybersecurity Technologies (GFACT) and others. The CSOC monitors the global ITT landscape for cyber threats, provides prevention strategies, initiates incident response for detected intrusions, and prescribes proactive and reactive mitigation strategies. The CSOC serves as the cornerstone for protecting, assessing, and managing cybersecurity risks for the enterprise, which includes, but is not limited to, back-office processes, critical manufacturing processes, intellectual property, and sensitive data. The CISO reports to the Chief Information Officer (CIO), who in turn reports to the Chief Financial Officer (CFO).The CIO has over 21 years of experience in information technology, including 14 years at ITT, while the CISO brings over 28 years of experience in information technology, with the last 22 years focused on information security and cybersecurity across various industries. The combined expertise and qualifications of our cybersecurity team enable us to effectively monitor, assess, and respond to cybersecurity threats.
Management is actively informed about, and monitors, cybersecurity incidents, including their prevention, detection, mitigation, and remediation, through defined processes and reporting mechanisms. This proactive approach includes the alignment of security policies and practices with NIST 800-171 Rev 2 and the organization's enterprise risk management requirements. Twice annually, the CFO and CEO are briefed by the CISO and CIO regarding ongoing projects, investments and changes to the threat landscape that have impacted, or may impact, the organization, ensuring that the highest levels of management are kept abreast of the Company's cybersecurity posture. Overall, this comprehensive approach ensures that management is well-informed and actively involved in safeguarding the Company from cybersecurity threats.
The use of generative AI (GenAI) by adversaries, as well as misuse by well-meaning ITT employees, presents a potential risk to operations and data integrity. ITT has established a GenAI Governance committee to review GenAI use-cases to enable the business while ensuring that security, privacy, bias, legal and ethical concerns are reviewed and addressed before widespread implementation. Enterprise level AI tools are available for use and the use of public versions of common AI tools is prohibited for use with sensitive information. GenAI providers, usages, and control options are an evolving area and ITT is continuously monitoring for changes in frameworks, detect/prevent tooling, and the release of regulations that may impact or guide our usage of such solutions.
ITEM 2.
PROPERTIES
We own or lease approximately 180 manufacturing plants, warehouses, service centers, and sales and administrative offices to support our operations. These properties are located in various regions around the world, including North America, Europe, Asia, South America and the Middle East. We consider these properties to be in good condition with sufficient capacity to accommodate the Company’s needs.
The following table summarizes the number of our material properties (other than our corporate headquarters) by business segment as of December 31, 2025. We consider our properties containing 25,000 square feet or more, which primarily consist of manufacturing locations, to be material. Our material properties account for over 95% of the total square feet of our properties.
Motion Technologies
Industrial Process
Connect & Control Technologies
Total
Number of Owned Locations
11
15
5
31
Number of Leased Locations
6
23
11
40
Total Locations
17
38
16
71
ITEM 3.
LEGAL PROCEEDINGS
From time to time, we are involved in legal proceedings that are incidental to the operation of our businesses. Some of these proceedings allege damages relating to environmental exposure, intellectual property matters, copyright infringement, personal injury claims, product liabilities, employment and employee benefit matters, government contract issues and commercial or contractual disputes and acquisitions or divestitures. Descriptions of certain legal proceedings to which the Company is a party are contained in Note 19, Commitments and Contingencies, to the Consolidated Financial Statements.
24
INFORMATION ABOUT OUR EXECUTIVE OFFICERS
The executive officers of the Company as of February 3, 2026, are listed below.
Name
Age
Current Title
Luca Savi
60
President and Chief Executive Officer
Davide Barbon
56
Senior Vice President and President, Motion Technologies and ITT Asia Pacific
Emmanuel Caprais
51
Senior Vice President and Chief Financial Officer
Cheryl de Mesa Graziano
53
Vice President and Chief Accounting Officer
Michael Guhde
56
Senior Vice President and President, Connect & Control Technologies
Bartek Makowiecki
47
Senior Vice President, Chief Strategy Officer & President, Industrial Process
Senior Vice President and Chief Human Resources Officer
Luca Savi has served as our Chief Executive Officer, President and a director of the Company since January 2019. He previously served as President and Chief Operating Officer of the Company from August 2018 to December 2018 and as Executive Vice President and Chief Operating Officer from January 2017 to August 2018. Prior to that, he served as Executive Vice President, Motion Technologies from February 2016 to January 2017 and as Senior Vice President and President, Motion Technologies from November 2011 to February 2016. Prior to joining ITT, Mr. Savi served as Chief Operating Officer, Comau Body Welding at Comau, a subsidiary of the Fiat Group responsible for producing and serving advanced manufacturing systems, and from 2009 to 2011 as Chief Executive Officer, Comau North America from 2007 to 2009. Mr. Savi previously held leadership roles at Honeywell International, Royal Dutch Shell and technical roles at Ferruzzi-Montedison Group. Mr. Savi is currently a director of MSA Safety Inc. and serves as the chair of its compensation committee.
Davide Barbon has served as our Senior Vice President and President, Motion Technologies and ITT Asia Pacific Region since October 2023. He previously served as our Senior Vice President and President, ITT Asia Pacific Region since October 2020. Prior to that, he served as General Manager of the KONI and Axtone businesses within Motion Technologies from January 2017. Mr. Barbon joined the Company in 2010, initially serving in the Brazil, Russia, India and China business of Motion Technologies, and then led its China business for five years. Prior to joining ITT, he spent 14 years with JLG Industries, where he had a number of roles of increasing responsibility across the United States, Europe, and Latin America.
Emmanuel Caprais has served as our Senior Vice President and Chief Financial Officer since October 2020. He previously served as Vice President of Finance and Group Chief Financial Officer, in charge of the Company’s business unit finance teams, Financial Planning & Analysis and Investor Relations for the company.Mr. Caprais joined ITT in 2012, at which time he served as segment Chief Financial Officer of Motion Technologies and later Industrial Process. Prior to joining ITT, Mr. Caprais held leadership roles in finance at Marelli, and earlier held positions of increasing responsibility in finance at Valeo across North America and Europe.
Cheryl de Mesa Graziano has served as our Vice President and Chief Accounting Officer since November 2022. Prior to joining ITT, she was Chief Accounting Officer of Party City Holdco Inc. where she held positions of increasing responsibility from November 2019 through October 2022. She previously held positions of increasing responsibility at Stanley Black & Decker, Inc. from May 2013 to October 2019, including Assistant Corporate Controller and Global Leader, Corporate Technical Accounting and Compliance. Before 2013, Ms. de Mesa Graziano held finance leadership roles at other companies including IBM and Financial Executives International.
Michael Guhde has served as our Senior Vice President and President, Connect & Control Technologies since February 2024. Prior to joining ITT Mr. Guhde served as Vice President and General Manager at Illinois Tool Works (ITW) from June 2018 to February 2024. Prior to ITW, he spent more than twenty years at Parker Hannifin in general manager, global sales and operations roles.
Bartek Makowiecki has served as our Senior Vice President, Chief Strategy Officer & President, Industrial Process since September 2024. Mr. Makowiecki previously served as our Senior Vice President, Strategy and Business Development since September 2021. Prior to joining ITT, he served as Global Head of Strategy, M&A and Venturing of Ingredion Incorporated from October 2017 to September 2021. Immediately prior, he served as
25
Director, Corporate Strategy & Head of M&A at Owens Corning from November 2015 to October 2017. Prior to that, Mr. Makowiecki held roles of increasing responsibility in global strategy and M&A at Parker-Hannifin Corporation from August 2003 to October 2015.
Lori B. Marino has served as our Senior Vice President and Chief Legal Officer since January 2023. She was appointed as Secretary and Chief Compliance Officer in October 2023. Ms. Marino previously served as Vice President, Deputy General Counsel and Secretary of ITT from May 2016 to April 2019 and as Vice President, Chief Corporate Counsel and Corporate Secretary from September 2013 to May 2016. Prior to rejoining ITT, Ms. Marino served as Executive Vice President, General Counsel, Secretary and Chief Human Resources Officer at New Senior Investment Group Inc. from April 2019 to September 2021.
Emrana Sheikh joined ITT as our Senior Vice President and Chief Human Resources Officer in February 2025. Prior to joining ITT, Ms. Sheikh served as Chief Talent & Diversity Officer at Kenvue Inc. since July 2024. Prior to that, Ms. Sheikh was Vice President – People Experience, Strategy and Innovation at Kenvue from May 2023 through July 2024. Ms. Sheikh also served in various roles of increasing responsibility in human resources at Johnson & Johnson from August 2018 to May 2023. In addition, Ms. Sheikh held various leadership roles at Asian Paints, Mahindra & Mahindra and Federal Express Corporation.
ITEM 4.
MINE SAFETY DISCLOSURES
Not applicable.
26
PART II
ITEM 5.
MARKET FOR REGISTRANT'S COMMON EQUITY, RELATED STOCKHOLDER MATTERS AND ISSUER PURCHASES OF EQUITY SECURITIES
COMMON STOCK AND DIVIDENDS
Our common stock is reported in the consolidated transaction reporting system of the New York Stock Exchange (NYSE), the principal market in which this security is traded (under the trading symbol "ITT"). There were 5,062 holders of record of our common stock on February 6, 2026.
The amount and timing of dividends payable on our common stock are within the sole discretion of our Board of Directors and will be based on, and affected by, a number of factors, including our financial position and results of operations, available cash, expected capital spending plans, prevailing business conditions, and other factors the Board deems relevant. Therefore, we cannot provide any assurance as to what level of dividends, if any, will be paid in the future.
During the fiscal year ended December 31, 2025, we did not offer or sell any equity securities that were not registered under the Securities Act.
ISSUER PURCHASES OF EQUITY SECURITIES
On October 4, 2023, the Board of Directors approved an indefinite term $1,000 open-market share repurchase program (the 2023 Plan). There was $455 of remaining capacity left under the 2023 Plan as of December 31, 2025. We will utilize the 2023 Plan in a manner that is consistent with our capital allocation strategy, which has centered on those investments necessary to grow our businesses organically and through acquisitions, while also providing cash returns to shareholders. The following table summarizes our purchases of our common stock for the quarter ended December 31, 2025.
(IN MILLIONS, EXCEPT PER SHARE AMOUNTS) PERIOD
TOTAL
NUMBER
OF SHARES
PURCHASED(1)(3)
AVERAGE
PRICE
PAID
PER SHARE(2)
TOTAL NUMBER OF SHARES PURCHASED AS PART OF PUBLICLY ANNOUNCED PLANS OR PROGRAMS(3)
APPROXIMATE DOLLAR VALUE OF SHARES THAT MAY YET BE PURCHASED UNDER THE PLANS OR PROGRAMS
9/28/2025 - 10/26/2025
—
$
—
—
$
475.0
10/27/2025 - 11/23/2025
0.1
$
193.64
0.1
$
455.0
11/24/2025 - 12/31/2025
—
$
—
—
$
455.0
(1)Excludes shares withheld in settlement of employee tax withholding obligations due upon the vesting of restricted stock unit and performance stock unit awards.
(2)Average price paid per share is calculated on a settlement basis and excludes commissions.
(3)Amounts are in whole numbers.
27
COMPANY STOCK PERFORMANCE
The following graph shows a comparison of the cumulative total shareholder return for ITT, the S&P 400 Mid Cap Index, and the S&P 400 Capital Goods Index over the five years ended December 31, 2025. It shows the share price appreciation of a $100 investment made on December 31, 2020, assuming any dividends paid are reinvested.
COMPARISON OF CUMULATIVE FIVE-YEAR TOTAL RETURN
12/31/2020
12/31/2021
12/31/2022
12/31/2023
12/31/2024
12/31/2025
ITT Inc.
$
100.00
$
133.97
$
107.84
$
160.58
$
194.10
$
237.82
S&P 400 Mid-Cap
$
100.00
$
124.73
$
108.37
$
126.13
$
143.65
$
154.40
S&P 400 Capital Goods
$
100.00
$
127.67
$
114.87
$
158.30
$
182.15
$
219.46
This graph is not, and is not intended to be, indicative of future performance of our common stock. This graph shall not be deemed "filed" with the SEC or subject to the liabilities of Section 18 of the Securities Exchange Act of 1934, as amended (the “Exchange Act”), and should not be deemed to be incorporated by reference into any of our prior or subsequent filings under the Securities Act.
ITEM 6.
[RESERVED]
Not applicable.
28
ITEM 7.
MANAGEMENT'S DISCUSSION & ANALYSIS OF FINANCIAL CONDITION AND RESULTS OF OPERATIONS
All comparisons included within this Part II, Item 7, Management’s Discussion and Analysis of Financial Condition and Results of Operations, refer to results for the year ended December 31, 2025 compared to the year ended December 31, 2024, unless stated otherwise. Additionally, all financial results and share repurchases other than per share amounts are reported in millions, unless stated otherwise. Per share amounts are reported in ones. Please refer to our Annual Report on Form 10-K (2024 Annual Report) for a discussion of the year ended December 31, 2024 compared to the year ended December 31, 2023.
OVERVIEW
ITT Inc., through its worldwide subsidiaries, is a diversified manufacturer of highly engineered critical components and customized technology solutions for the transportation, industrial and energy markets. Our product and service offerings are organized into three segments: Motion Technologies (MT), Industrial Process (IP), and Connect & Control Technologies (CCT). Refer to Part I, Item 1, Description of Business, for a further overview of our company, segments, products and service offerings, and other information about the business.
Effective January 1, 2025, the Company changed its method of determining the cost for certain inventories from a last-in, first-out (LIFO) to first-in, first out (FIFO) for all inventories previously accounted for under LIFO. For additional information on the change in accounting principle, refer to Note 1, Description of Business and Basis of Presentation. Management’s discussion and analysis of financial condition and results of operations have been adjusted to reflect the change in accounting principle.
EXECUTIVE SUMMARY
During 2025, we delivered strong financial results, which included revenue and operating income growth, operating margin expansion, EPS growth and effective deployment of capital. The following table provides a summary of key performance indicators for 2025 in comparison to 2024.
Revenue
Operating Income
Operating Margin
EPS
$3,939
$685
17.4%
$6.11
8.5% Increase
0.9% Increase
(130)bp Decrease
(3.3)% Decrease
Organic Revenue
Adjusted Operating Income
Adjusted Operating Margin
Adjusted EPS
$3,712
$717
18.2%
$6.72
4.8% Increase
11.2% Increase
40bp Increase
14.3% Increase
See the section titled "Key Performance Indicators and Non-GAAP Measures" for a definition and reconciliation of organic revenue, adjusted operating income, adjusted operating margin, and adjusted EPS.
29
Our 2025 results include:
•Revenue of $3,938.5 increased $307.8, or 8.5%, due to growth in each of our three business segments. IP drove significant growth with pump projects, CCT saw strength across connectors and components within the aerospace and defense markets, and MT continued to outperform with share gains in automotive and strength in rail, resulting in total ITT organic revenue growth of 4.8% for the year. In addition, the 2025 results included incremental revenue of $161.5, primarily from our 2024 acquisition of kSARIA, and benefitted from favorable foreign currency translation of $64.6. The 2024 Wolverine divestiture reduced our total revenue growth by $89.2.
•Operating income of $684.5 increased $6.4, as benefits from higher volume, productivity and pricing, and contributions from acquisitions more than offset the prior year gain on sale of the Wolverine business of $47.8, cost inflation, increased restructuring, acquisition-related expenses, and unfavorable sales mix. Adjusted operating income increased 11.2%.
•Income from continuing operations was $6.11 per diluted share, a decrease of 3.3%, which primarily reflects the prior year gain on sale of Wolverine, a higher effective tax rate, and increased interest expense, partially offset by a lower weighted average share count. Adjusted EPS was $6.72, an increase of 14.3%, reflecting the strength in core operations throughout the year.
Throughout 2025, we remained committed to creating value through effective capital deployment, which included the following:
•Capital expenditures over $120 for the second year in a row, reflecting our continued commitment to fund future growth through capacity expansion, productivity and innovation.
•Executed repurchases of 3.8 shares of common stock on the open market for $521.0.
•$111.0 in dividend payments to our shareholders. Our dividends declared in 2025 of $1.40 per share represented a 10% increase over the dividends per share declared of $1.28 in 2024.
•Enter into a definitive agreement to acquire SPX FLOW for $4,775 to be funded through a combination of cash and equity.
Global Macroeconomic Conditions
Throughout 2025, global macroeconomic conditions evolved against a backdrop of geopolitical uncertainty and shifting market demands. While these dynamics created areas of variability, the Company continued to apply disciplined execution and strategic investment across its businesses. In 2026 we expect demand to remain firm, but with variation between industrial end markets. In addition, changes in tariffs and trade policies, geopolitical and energy market risk, workforce availability and cost, technology transformation and cost inflation are factors that we are watching that may impact our performance going forward.
Tariffs and Trade Policies: Ongoing tariff regimes and changes in global trade frameworks may influence input costs and sourcing patterns. At the same time, these dynamics reinforce the value of our multi‑sourcing, localization, and regional manufacturing strategies. We also continue to monitor developments associated with the United States‑Mexico‑Canada Agreement (USMCA) and ensure that our operations, supply‑chain partners, and cross‑border flows remain compliant with its requirements. Adhering to USMCA rules of origin, documentation standards, and regional content thresholds helps support stable access to North American markets, reduces potential trade-related disruptions, mitigates trade duties, and lowers costs.
Geopolitical and Energy Market Risk: Geopolitical developments may impact supply chains, energy pricing trends, and defense-related procurement. For example, while such factors can shift project timing in certain Industrial Process markets, our growing presence in critical flow technologies and resilient aftermarket channels helps balance exposure. Moreover, select programs in Connect & Control Technologies may benefit from sustained investments in defense and security. Overall, our portfolio evolution aims to strengthen durability across macro cycles.
Workforce Availability and Cost: Tight labor markets and specialized skill requirements remain industry‑wide considerations. We continue to address these trends through talent development and selective automation, which help maintain high levels of quality and delivery performance. These efforts strengthen our long‑term operational capabilities and support sustainable growth.
Technology Transformation: Accelerating advancements in automation, data analytics, and artificial intelligence continue to reshape manufacturing and industrial solutions. We view this shift as an opportunity to further enhance efficiency, reliability, and customer value but it also exposes us to additional cyber related risks and the possibility
30
that our competitors are able to adapt and utilize this technology at a faster pace and with greater success than we do, We are expanding digital investments across operations and product lines, including technologies that improve energy efficiency and reduce operating costs for customers.
Supply Chain and Cost Inflation: We continue to experience variability in material availability, logistics conditions, and input costs caused by supply chain disruptions, geopolitical developments and tariff pressures. We are using dual‑sourcing strategies, long‑term agreements, strengthened supplier partnerships, and targeted inventory buffers to support consistent delivery performance and help mitigate potential impacts.
Sustainability and Energy Transition: Evolving environmental expectations and customer decarbonization initiatives are influencing product design and purchasing priorities. These trends create meaningful opportunities across our portfolio, particularly in energy efficient solutions, advanced flow technologies, and cryogenic/compressor systems supporting liquid natural gas, ammonia, hydrogen, and CO₂ applications. We are continuing to invest in product innovation and operational sustainability, which enhances our ability to support customers in meeting their current and future requirements.
Agreement to Acquire SPX FLOW
We continue to grow our core businesses and enhance the ITT portfolio further through mergers and acquisitions, reshaping the portfolio towards attractive pump applications and defense and aerospace interconnect markets, while reducing our automotive exposure. On December 4, 2025, we entered into a Membership Interest Purchase Agreement (the "Purchase Agreement") with LSF11 Redwood Parent, L.P., LSF11 Redwood TopCo LLC (the "Target") and ITT Industries Holdings, Inc., our wholly owned subsidiary, to acquire SPX FLOW, Inc. ("SPX FLOW"), a subsidiary of the Target and a leading provider of pumps, valves, mixers, aftermarket services, and other flow and process solutions (the "Acquisition"), for an aggregate purchase price of approximately $4,775 payable at closing of the Acquisition, comprised of $4,075 in cash and 3,839,824 shares of our common stock, subject to customary closing conditions, including regulatory approvals. We expect the acquisition of SPX FLOW to add critical equipment and adjacent flow and process technologies that will extend ITT’s capabilities to address complex customer challenges across a wide variety of key growth markets, including food & beverage, personal care, industrial, chemical, energy, and mining.
DISCUSSION OF FINANCIAL RESULTS
2025 VERSUS 2024
For the Year Ended December 31
2025
2024
Change
Revenue
$
3,938.5
$
3,630.7
8.5
%
Gross profit
1,392.4
1,249.4
11.4
%
Operating expenses
707.9
571.3
23.9
%
Operating income
684.5
678.1
0.9
%
Interest and other non-operating expense, net
33.0
28.4
16.2
%
Income tax expense
160.1
126.3
26.8
%
Income from continuing operations attributable to ITT Inc.
488.1
520.0
(6.1)
%
Net income attributable to ITT Inc.
$
488.0
$
519.9
(6.1)
%
Gross margin
35.4
%
34.4
%
100
bps
Operating expense to revenue ratio
18.0
%
15.7
%
230
bps
Operating margin
17.4
%
18.7
%
(130)
bps
Effective tax rate
24.6
%
19.4
%
520
bps
All comparisons included within the Discussion of Financial Results for 2025 versus 2024 refer to results for the year ended December 31, 2025 compared to the year ended December 31, 2024, unless stated otherwise.
31
REVENUE
The following table summarizes the revenue derived from each of our segments.
MT revenue for the year ended December 31, 2025 decreased $19.6 primarily driven by the prior year divestiture of the Wolverine business which generated $89.1 of revenue during 2024. This decline was partially offset by strength in Friction original equipment reflecting our market outperformance and growth across our KONI business. The current year also benefited from favorable foreign currency translation $44.0. Excluding the impact from the divestiture and foreign currency translation, organic revenue increased $25.5, or 1.9%.
Industrial Process
IP revenue for the year ended December 31, 2025 increased $135.2, driven primarily by growth in pump projects, reflecting strength across markets and geographies. The current year also included growth from acquisitions of $26.1 and benefited from favorable foreign currency translation of $15.7. Excluding the impacts from acquisitions and foreign currency translation, organic revenue increased $93.4, or 6.9%.
Connect & Control Technologies
CCT revenue for the year ended December 31, 2025 increased $191.9, including growth from acquisitions of $135.4 and favorable foreign currency translation of $5.0. Excluding the impacts from acquisitions and foreign currency translation, organic revenue increased $51.5, or 6.2%, reflecting growth in connectors of 5% and components of 7%, primarily within the aerospace and defense markets. Revenue growth was partially offset by slower demand for electric vehicle charging applications.
GROSS PROFIT
Gross profit for 2025 was $1,392.4, reflecting a gross margin of 35.4%. Gross profit for 2024 was $1,249.4, reflecting a gross margin of 34.4%. The increases in gross profit and gross margin were primarily driven by benefits from pricing actions and volume growth, net savings from productivity and sourcing initiatives and favorable foreign currency translation, partially offset by unfavorable sales mix.
32
OPERATING EXPENSES
The following table provides a disaggregation of our operating expenses by expense type, as well as by segment.
For the Year Ended December 31
2025
2024
Change
General and administrative expenses
$
368.4
$
297.1
24.0
%
Sales and marketing expenses
228.7
205.7
11.2
%
Research and development expenses
110.8
116.3
(4.7)
%
(Gain) loss on sale of businesses
—
(47.8)
**
Total operating expenses
$
707.9
$
571.3
23.9
%
By Segment:
Motion Technologies
$
160.4
$
116.6
37.6
%
Industrial Process
282.2
240.4
17.4
%
Connect & Control Technologies
180.5
152.9
18.1
%
Corporate & Other
84.8
61.4
38.1
%
** Percentage not deemed meaningful.
General and administrative (G&A) expenses increased $71.3 for the year ended December 31, 2025, primarily driven by higher incentive-based compensation, restructuring expenses, acquisition-related expenses, and unfavorable foreign currency translation.
Sales and marketing expenses increased $23.0 for the year ended December 31, 2025, primarily driven by higher personnel, commissions, and other selling and marketing-related costs to support higher sales activity, as well as increased intangible amortization expenses.
Research and development (R&D) expenses decreased $5.5 for the year ended December 31, 2025, primarily driven by the divestiture of Wolverine in the prior year and by the completion of certain R&D projects during 2025.
Gain on sale of businesses includes $47.8 related to our July 2024 sale of the Wolverine business which was previously held within our MT segment.
OPERATING INCOME
The following table summarizes our operating income and operating margin by segment.
For the Year Ended December 31
2025
2024
Change
Motion Technologies
$
275.9
$
314.6
(12.3)
%
Industrial Process
315.1
278.4
13.2
%
Connect & Control Technologies
178.2
146.1
22.0
%
Corporate & Other
(84.7)
(61.0)
38.9
%
Total operating income
$
684.5
$
678.1
0.9
%
Operating Margin:
Motion Technologies
19.3
%
21.7
%
(240)
bps
Industrial Process
21.1
%
20.5
%
60
bps
Connect & Control Technologies
17.5
%
17.7
%
(20)
bps
Consolidated ITT
17.4
%
18.7
%
(130)
bps
MT operating income for the year ended December 31, 2025 decreased $38.7, driven by the $47.8 gain on sale of the Wolverine business recognized in 2024, as well as the loss of income following the divestiture, and unfavorable foreign currency, pricing and sales mix impacts, and higher restructuring costs. The decrease was partially offset by productivity and supply chain savings and benefits from sales volume growth.
IP operating income for the year ended December 31, 2025 increased $36.7, driven by benefits from pricing actions, higher sales volume, net savings from supply chain, restructuring, and productivity initiatives, lower
33
acquisition-related expenses, and favorable foreign currency impacts. The increase was partially offset by unfavorable sales mix and higher incentive-based compensation costs.
CCT operating income for the year ended December 31, 2025 increased $32.1, driven by benefits from pricing actions, net savings from productivity, sourcing, and restructuring initiatives, higher sales volume, and contributions from kSARIA. The increase was partially offset by higher strategic investment costs, and temporary acquisition related amortization associated with kSARIA.
Corporate & Other costs increased $23.7 for the year ended December 31, 2025, primarily due to higher incentive-based compensation costs, M&A-related professional service costs, and charitable contributions. The increase was partially offset by favorable foreign currency impacts.
INTEREST AND OTHER NON-OPERATING EXPENSE (INCOME), NET
The following table summarizes our interest and other non-operating expense (income), net.
For the Year Ended December 31
2025
2024
Change
Interest expense
$
48.1
$
36.6
31.4
%
Interest income
(10.7)
(6.6)
62.1
%
Non-operating postretirement cost (benefit), net
(1.1)
0.2
650.0
%
Other non-operating income, net
(3.3)
(1.8)
83.3
%
Total interest and other non-operating expense, net
$
33.0
$
28.4
16.2
%
Interest expense increased $11.5 due to higher average outstanding debt during 2025, unfavorable interest on uncertain tax positions, and financing costs associated with a bridge loan facility related to the financing of the pending SPX FLOW acquisition. These drivers were partially offset by lower average interest rates on commercial paper borrowings. Interest income increased $4.1 due to a higher cash on deposit following receipt of $1.3 billion in proceeds from our December 2025 common stock public offering. Other non-operating income net increased $1.5 due to a gain on sale of an equity method investment.
INCOME TAX EXPENSE
The following table summarizes our income tax expense and effective tax rate.
For the Year Ended December 31
2025
2024
Change
Income tax expense
$
160.1
$
126.3
26.8
%
Effective tax rate
24.6
%
19.4
%
520
bps
The higher effective tax rate in 2025 compared to 2024 primarily resulted from the jurisdictional mix of earnings and was driven, in part, by losses generated in entities subject to a valuation allowance. In addition, the company recorded a $4.9 tax expense of U.S. tax on foreign earnings in 2025. The lower rate in 2024 was also due to the company recording a benefit of $6.7 from valuation allowance reversals on U.S. state deferred tax assets and a $5.7 tax benefit of U.S. tax on foreign earnings in 2024.
Recent Income Tax Legislation
In October 2021, more than 135 countries and jurisdictions agreed to participate in a “two-pillar” international tax approach developed by the Organisation for Economic Co-operation and Development (the "OECD"), which includes establishing a global minimum corporate tax rate of 15 percent. The OECD published Tax Challenges Arising from the Digitalisation of the Economy — Global Anti-Base Erosion Model Rules (Pillar Two) in December 2021 and subsequently issued additional commentary and administrative guidance clarifying several aspects of the model rules. Since the model rules have been released, many countries have enacted Pillar Two-related laws, many of which became effective on January 1, 2024 with additional laws effective on January 1, 2025. As of December 31, 2025, Pillar Two did not have a significant impact on our 2025 financial statements.
On January 5, 2026, the OECD released a Pillar Two Administrative Guidance package containing the Side-by-Side Safe Harbor (the "SbS"). Under the SbS, Multinational Enterprises headquartered in a jurisdiction that has a Qualified SbS Regime are eligible for the SbS election. The United States is listed as a jurisdiction with a Qualified SbS Regime. By making the SbS election, top-up taxes under the Income Inclusion Rule (the "IIR") and Undertaxed Profits Rule (the "UTPR") are set to zero. Note, however, that the SbS does not have an impact on the application of Pillar 2 Qualified Domestic Minimum Top-up Taxes (the "QDMTT"). Jurisdictions are required to implement the SbS
34
effective for fiscal years beginning on or after January 1, 2026 (or at the earliest practicable date where there are constitutional or other superior law constraints preventing retroactive adoption). ITT will monitor the adoption of SbS in each jurisdiction and intends to elect the SbS where available.
On August 16, 2022, the U.S. government enacted the Inflation Reduction Act of 2022 (the Inflation Reduction Act) into law. The Inflation Reduction Act includes a new corporate alternative minimum tax (the Corporate AMT) of 15% on the adjusted financial statement income (the "AFSI") of corporations with an average AFSI exceeding $1.0 billion over a three-year period. The Corporate AMT was effective for the Company beginning in 2023. Given the AFSI threshold, the Corporate AMT was not applicable to the Company in 2025, but the Corporate AMT may have potential impacts on our future U.S. tax expense, cash taxes and effective tax rate. Additionally, the Inflation Reduction Act imposes a 1% excise tax on the fair market value of net stock repurchases made after December 31, 2022. The excise tax on stock repurchases has been appropriately recognized and disclosed in the accompanying consolidated financial statements in this Form 10-K.
On July 4, 2025, President Trump signed the One Big Beautiful Bill Act, which includes a broad range of tax reform provisions affecting businesses, including extending and modifying certain key Tax Cuts & Jobs Act provisions (both domestic and international) and expanding certain Inflation Reduction Act incentives while accelerating the phase-out of others. We have applied the capitalization and amortization requirements under Section 174, as amended by the One Big Beautiful Bill Act (the "OBBBA"), in the current year. The application of these provisions did not have a material impact on the effective tax rate for the year. We will continue to assess their effect on the effective tax rate in future periods.
See Note 6, Income Taxes, to the Consolidated Financial Statements for further information on tax-related matters.
35
LIQUIDITY AND CAPITAL RESOURCES
Funding and Liquidity Strategy
We monitor our funding needs and execute strategies to meet overall liquidity requirements, including the management of our capital structure, on both a short- and long-term basis. Significant factors that affect our overall management of liquidity include our cash flow from operations, credit ratings, the availability of commercial paper, access to bank lines of credit, term loans, and the ability to attract long-term capital on satisfactory terms. We assess these factors along with current market conditions on a continuous basis, and as a result, may alter the mix of our short- and long-term financing when it is advantageous to do so. We expect to have enough liquidity to fund operations for at least the next 12 months and beyond.
We manage our worldwide cash requirements considering available funds among the many subsidiaries through which we conduct business and the cost effectiveness with which those funds can be accessed. We support our growth and expansion in markets outside of the U.S. through the enhancement of existing products and development of new products, increased capital spending, and potential foreign acquisitions. We look for opportunities to access cash balances in excess of local operating requirements to meet our global liquidity needs in a cost-efficient manner. We transfer cash between certain international subsidiaries and the U.S. when it is cost effective to do so. Net cash distributions from foreign countries to the U.S. during the years ended December 31, 2025 and 2024 were $577.5 and $230.4, respectively. The timing and amount of any additional future distributions remains under evaluation based on our jurisdictional cash needs.
Capital Resources
As of December 31, 2025, we have access to short- and long-term funding sources. These include access to the capital markets through a commercial paper program, as well as $1,100 of available borrowing capacity under our 2025 Revolving Credit Agreement (defined below), which may potentially be expanded to $1,650 under the agreement. In addition, we have market access to secure longer-term funding, if needed. Our commercial paper program is supported by our 2025 Revolving Credit Agreement and our policy is to maintain unused committed bank lines of credit in an amount greater than outstanding commercial paper balances. These sources of capital are described further below and within Note 15, Debt.
Commercial Paper
When available and economically feasible, we have accessed the commercial paper market through programs in place in the U.S. and Europe to supplement cash flows generated internally and to provide additional short-term funding. The following table presents our outstanding commercial paper borrowings.
As of December 31
2025
2024
Commercial Paper Outstanding - U.S. Program
$
—
$
424.4
Commercial Paper Outstanding - Euro Program
258.0
—
In the year ended December 31, 2025, we borrowed under the European commercial paper program to partially refinance the Company’s U.S. commercial paper. The proceeds of the 2025 Term Loan Credit Agreement (defined below) were used to refresh the U.S. commercial paper capacity and for other general corporate purposes. All outstanding commercial paper for both periods had maturity terms of less than three months from the date of issuance. Our average daily outstanding commercial paper balance for the years ended 2025 and 2024 was $525.5 and $338.5, respectively, and the maximum outstanding commercial paper during each of those respective years was $1,113.5 and $455.0.
Revolving Credit Agreement
On July 30, 2025, we entered into a revolving credit facility agreement with a syndicate of third-party lenders including U.S. Bank National Association ("US Bank"), as administrative agent (the "2025 Revolving Credit Agreement"). Upon its effectiveness, the 2025 Revolving Credit Agreement replaced the revolving credit facility agreement that we entered into on August 5, 2021, with a syndicate of third-party lenders including Bank of America, N.A., as administrative agent (the 2021 Revolving Credit Agreement). The 2021 Revolving Credit Agreement was terminated on July 30, 2025 with no outstanding balances remaining. The 2025 Revolving Credit Agreement matures in July 2030 and provides for an aggregate principal amount of up to $1,100. The 2025 Revolving Credit Agreement provides for a potential increase of commitment of up to $550 for a possible maximum of $1,650 in aggregate commitments at the request of the Company and with the consent of the institutions providing such increase of commitments.
36
The 2025 Revolving Credit Agreement contains customary affirmative and negative covenants that, among other things, will limit or restrict our ability to: incur additional debt or issue guarantees; create certain liens; merge or consolidate with another person; sell, transfer, lease or otherwise dispose of all or substantially all of our assets and liquidate or dissolve. Additionally, the 2025 Revolving Credit Agreement requires us not to permit the ratio of consolidated total indebtedness net of unrestricted cash in excess of $100 to consolidated earnings before interest, taxes, depreciation, amortization and other special, extraordinary, unusual, or non-recurring items (adjusted consolidated EBITDA) (leverage ratio) to exceed 3.50 to 1.00, with a qualified acquisition step up immediately following such qualified acquisition of 4.00 to 1.00 for four quarters, 3.75 to 1.00 for two quarters thereafter, and returning to 3.50 to 1.00 thereafter.
Borrowings under the 2025 Revolving Credit Agreement bear interest at an annual rate equal to, at the Company’s option, either (i) term secured overnight financing rate ("Term SOFR") plus a margin ranging from 0.785% to 1.150%, or (ii) an alternate base rate plus a margin ranging from 0% to 0.150%, with the applicable margin determined by reference to the Company’s debt ratings set forth in the 2025 Revolving Credit Agreement. There is a commitment fee under the 2025 Revolving Credit Agreement ranging from 0.090% to 0.225% of commitments under the 2025 Revolving Credit Agreement. As of December 31, 2025, we had no outstanding borrowings under the 2025 Revolving Credit Agreement and all financial covenants (e.g., leverage ratio) were within the prescribed thresholds.
Long-term Debt
Long-term debt is generally defined as any debt with an original maturity greater than 12 months. Our long-term debt is primarily related to the outstanding U.S. term loan maturing in September 2027. The table below provides our long-term debt outstanding as of December 31, 2025 and 2024.
As of December 31
2025
2024
Current portion of long-term debt
$
2.8
$
2.6
Non-current portion of long-term debt
521.5
232.6
Total long-term debt
$
524.3
$
235.2
2025 Term Loan Credit Agreement
On April 30, 2025, the Company entered into a credit agreement (as amended, the "2025 Term Loan Credit Agreement") among the Company, as borrower, certain of our subsidiaries, as guarantors, each lender from time to time party thereto, and U.S. Bank National Association, as the administrative agent. The 2025 Term Loan Credit Agreement has a maturity of two years and provides for a term loan of $750. Proceeds of the term loan were applied to pay down the Company’s U.S. commercial paper capacity and for other general corporate purposes, including working capital needs. In connection with the entry into the 2025 Revolving Credit Agreement, on July 30, 2025, the Company and lenders entered into an amendment to the 2025 Term Loan Credit Agreement to modify certain covenant baskets and other terms (including amendments to the leverage ratio definition) to conform to the 2025 Revolving Credit Agreement.
Total outstanding borrowings under the Amended 2025 Term Loan Credit Agreement were $520.0 as of December 31, 2025. Borrowings under the 2025 Term Loan Credit Agreement bear interest at an annual rate equal to, at the Company’s option, either (i) Term SOFR plus a margin ranging from 0.875% to 1.375%, or (ii) an alternate base rate plus a margin ranging from 0.0% to 0.375%, with the applicable margin determined by reference to the Company’s debt ratings set forth in the 2025 Term Loan Credit Agreement. The loans under the 2025 Term Loan Credit Agreement may be prepaid by the Company at any time, in whole or in part, without penalty or premium, subject to certain conditions. During 2025, the Company made repayments of $230.0. The 2025 Term Loan Credit Agreement contains customary affirmative and negative covenants.
U.S. Term Loan
On September 12, 2024, the Company entered into a credit agreement (the kSARIA Credit Agreement) among the Company, as borrower, each lender from time to time party thereto, and U.S. Bank National Association, as the administrative agent, sole lead arranger and sole bookrunner. The kSARIA Credit Agreement had a maturity of three years and provided for a term loan of $464, which had been borrowed and was used to finance the Company’s acquisition of kSARIA on September 12, 2024. During 2025, the Company made loan repayments of $229.0 representing the remaining outstanding balance on the kSARIA Credit Agreement, and the kSARIA Credit Agreement was terminated.
37
Credit Ratings
The Company's ability to access the global capital markets and the related cost of financing is dependent upon, among other factors, the Company's credit ratings. Our credit ratings as of December 31, 2025 were as follows:
Rating Agency
Short-Term Ratings
Long-Term Ratings
Standard & Poor’s
A-2
BBB
Moody’s Investors Service
P-2
Baa1
Fitch Ratings
F1
BBB+
In November 2024, Moody's upgraded ITT's senior unsecured rating, from Baa2 to Baa1. The upgraded ratings reflect ITT's conservative capital structure, product and geographic diversification, installed base, sizable aftermarket revenue, solid EBITDA margins, and good financial flexibility. In December 2025, the rating agencies, Standard and Poor's, Moody’s Investors Service, and Fitch Ratings reaffirmed ITT’s investment‑grade credit ratings with a stable outlook. Please refer to the rating agency websites and press releases for more information.
Sources and Uses of Liquidity
In addition to the capital resources discussed above, our principal source of liquidity is our cash flow generated from operating activities, which provides us with the ability to meet the majority of our short-term funding requirements. The following table summarizes net cash derived from operating, investing, and financing activities for the years ended December 31, 2025 and 2024.
For the Year Ended December 31
2025
2024
Operating activities
$
668.8
$
562.6
Investing activities
(119.8)
(817.9)
Financing activities
728.9
234.9
Foreign exchange
26.3
(29.0)
Total net cash used in continuing operations
$
1,304.2
$
(49.4)
Net cash from discontinued operations
(0.5)
(0.5)
Net change in cash and cash equivalents
$
1,303.7
$
(49.9)
Operating Activities
The increase in net cash from operating activities of $106.2 was primarily due to higher customer advance payments, favorable timing of accounts receivable collections, and lower compensation payments in the current year.
Investing Activities
The decrease in net cash used in investing activities of $698.1 was primarily driven by the prior M&A activity related to the acquisitions of kSARIA and Svanehøj, partially offset by the divestiture of the Wolverine business, which resulted in a net outflow of $686.9. Refer to Note 22, Acquisitions, Investments, and Divestitures, for further information. Capital expenditures, while exceeding $120 for the second year in a row, decreased $2.6 during 2025 and we received government incentives of $7.9 for our capital investment projects in Italy.
Financing Activities
The increase in net cash from financing activities of $494.0 was primarily driven by proceeds of $1,314.1 from the issuance of common stock to finance the pending acquisition of SPX FLOW. These proceeds were partially offset by a year-over-year change in commercial paper activity of $451.8 and increased repurchases of ITT common stock of $416.5 in the current year.
Dividends
The amount and timing of dividends payable on our common stock are within the sole discretion of our Board of Directors and will be based on, and affected by, a number of factors, including our financial position and results of operations, available cash, expected capital spending plans, prevailing business conditions, and other factors the Board of Directors deems relevant. Therefore, we cannot provide any assurance as to what level of dividends, if any, will be paid in the future. Aggregate dividends declared in 2025 were $111.0, compared to $104.8 in 2024, reflecting annual per share amounts of $1.404 and $1.276, respectively. In the first quarter of 2026, we declared a quarterly dividend of $0.386 per share for shareholders of record on March 6, 2026, which will be paid on April 6, 2026.
38
Open-market Share Repurchases
On October 4, 2023, the Board of Directors approved an indefinite term $1,000 open-market share repurchase program (the 2023 Plan). There is $455.0 of remaining capacity left under the 2023 Plan as of December 31, 2025. During the years ended December 31, 2025 and 2024, we spent $525.0 and $104.0, respectively, on open-market share repurchases under the 2023 plan. See Note 18, Capital Stock for more information.
Funding of Postretirement Plans
The following table provides a summary of the funded status of our postretirement benefit plans.
2025
2024
As of December 31
U.S. Pension
Non-U.S. Pension
Other Benefits
Total
U.S. Pension
Non-U.S. Pension
Other Benefits
Total
Fair value of plan assets
$
—
$
0.3
$
—
$
0.3
$
—
$
0.3
$
—
$
0.3
Projected benefit obligation
10.5
60.9
58.6
130.0
10.4
61.2
58.0
129.6
Funded status
$
(10.5)
$
(60.6)
$
(58.6)
$
(129.7)
$
(10.4)
$
(60.9)
$
(58.0)
$
(129.3)
Our non-U.S. pension plans, which are typically not funded due to local regulations, had a decrease in projected benefit obligation of $0.3 during 2025, primarily due to an actuarial gain of $6.8 and benefits paid of $3.7, offset by foreign currency translation of $7.8. Our other employee-related benefit plans are generally unfunded plans as well. The projected benefit obligation of these plans increased by $0.6 during 2025 due to interest costs of $2.6 and an actuarial loss of $1.7, offset by benefits paid of $3.9.
Contributions to our U.S. and non-U.S. pension and other postretirement plans were $9.0 and $10.5 during 2025 and 2024, respectively, which were used to fund participant benefits. We currently estimate 2026 contributions to our pension and other postretirement benefits plans of approximately $10.
See Note 16, Postretirement Benefit Plans, for additional financial information related to our postretirement obligations.
ContractualObligations
The following table summarizes ITT’s commitment to make future payments under long-term contractual obligations as of December 31, 2025.
Payments Due By Period
Total
2026
2027 to 2028
2029 to 2030
Beyond 2031
Long-term debt
$
783.6
$
261.4
$
521.9
$
0.3
$
—
Operating leases
95.2
27.3
34.5
14.8
18.6
Purchase obligations(a)
91.7
90.9
0.8
—
—
Postretirement benefit payments(b)
129.7
10.2
19.6
19.5
80.4
Other long-term obligations(c)
77.3
16.5
14.2
3.5
43.1
Total
$
1,177.5
$
406.3
$
591.0
$
38.1
$
142.1
In addition to the amounts presented in the table above, we have recorded liabilities for uncertain tax positions of $9.5 in our Consolidated Balance Sheet as of December 31, 2025. This amount has been excluded from the contractual obligations table due to an inability to reasonably estimate the timing of payments in individual years.
(a)Represents unconditional purchase agreements that are enforceable and legally binding and that specify all significant terms to purchase goods or services, including fixed or minimum quantities to be purchased; fixed, minimum or variable price provisions; and the approximate timing of the transaction. Purchase agreements that are cancellable without penalty have been excluded.
(b)Represents the projected timing of payments for benefits earned to date and the expectation that certain future service will be earned by current active employees for our pension and other employee-related benefit plans. See Note 16, Postretirement Benefit Plans, to the Consolidated Financial Statements for additional financial information related to our postretirement obligations.
(c)Other long-term obligations include amounts recorded in our Consolidated Balance Sheet as of December 31, 2025, including estimated environmental payments and employee compensation agreements. We estimate based on historical experience that we will spend, on average, approximately $4 to 8 per year on
39
environmental investigation and remediation. A portion of our environmental investigation and remediation costs are legally mandated through various orders and agreements with state and federal oversight agencies. As of December 31, 2025, our recorded environmental liability was $56.1. See Note 19, Commitments and Contingencies, to the Consolidated Financial Statements for further information.
Off-Balance Sheet Arrangements
Off-balance sheet arrangements represent transactions, agreements or other contractual arrangements with unconsolidated entities, where an obligation or contingent interest exists. Our off-balance sheet arrangements as of December 31, 2025 consist of indemnities related to acquisition and disposition agreements and certain third-party guarantees.
Indemnities
Since our founding in 1920 (pre-spin-offs), we have acquired and disposed of numerous businesses. The related acquisition and disposition agreements allocate certain assets and liabilities among the parties and contain various representation and warranty clauses and may provide indemnities for a misrepresentation or breach of the representations and warranties by either party or for assumed or excluded liabilities. These provisions address a variety of subjects. The term and monetary amounts of each such provision are defined in the specific agreements and may be affected by various conditions and external factors. Many of the provisions have expired either by operation of law or as a result of the terms of the agreement. We do not have a liability recorded for these expired provisions and are not aware of any claims or other information that would give rise to material payments under such provisions.
Guarantees
We had $219.1 of guarantees, letters of credit and similar arrangements outstanding as of December 31, 2025, primarily pertaining to commercial or performance guarantees and insurance matters. We have not recorded any material loss contingencies under these guarantees, letters of credit and similar arrangements as of December 31, 2025 as the likelihood of nonperformance by the underlying obligors is considered remote. From time to time, we may provide certain third-party guarantees that may be affected by various conditions and external factors, some of which could require that payments be made under such guarantees. We do not consider the maximum exposure or current recorded liabilities under our third-party guarantees to be material either individually or in the aggregate. We do not believe such payments would have a material adverse impact on our financial statements.
KEY PERFORMANCE INDICATORS AND NON-GAAP MEASURES
Management reviews a variety of key performance indicators including revenue, segment operating income and margins, and earnings per share, some of which are calculated other than in accordance with accounting principles generally accepted in the United State of America (GAAP). In addition, we consider certain measures to be useful to management and investors when evaluating our operating performance for the periods presented. These measures provide a tool for evaluating our ongoing operations and management of assets from period to period. This information can assist investors in assessing our financial performance and measures our ability to generate capital for deployment among competing strategic alternatives and initiatives, including, but not limited to, acquisitions, dividends, and share repurchases. Some of these metrics, however, are not measures of financial performance under GAAP and should not be considered a substitute for measures determined in accordance with GAAP. We consider the non-GAAP measures disclosed in this Annual Report on Form 10-K to be key performance indicators. These measures, which may not be comparable to similarly titled measures reported by other companies, consist of the following:
•“Organic Revenue” is defined as revenue, excluding the impacts of foreign currency fluctuations, acquisitions, and divestitures that may or may not qualify as discontinued operations. Current year activity from acquisitions is excluded for twelve months following the closing date of acquisition. The period-over-period change resulting from foreign currency fluctuations is estimated using a fixed exchange rate for both the current and prior periods. Prior year revenue is adjusted to exclude activity during the comparable period for twelve months post-closing date for divestitures that do not qualify as discontinued operations. We believe that reporting organic revenue provides useful information to investors by helping identify underlying trends in our business and facilitating comparisons of our revenue performance with prior and future periods and to our peers.
40
A reconciliation of revenue to organic revenue for the year ended December 31, 2025 is provided below.
Motion Technologies
Industrial Process
Connect & Control Technologies
Eliminations
Total ITT
2025 Revenue
$
1,428.2
$
1,496.2
$
1,017.0
$
(2.9)
$
3,938.5
Less: Acquisitions
—
26.1
135.4
—
161.5
Less: Foreign currency translation
44.0
15.7
5.0
(0.1)
64.6
2025 Organic revenue
1,384.2
1,454.4
876.6
(2.8)
3,712.4
2024 Revenue
1,447.8
1,361.0
825.1
(3.2)
3,630.7
Less: Divestitures
89.1
—
—
0.1
89.2
2024 Organic revenue
1,358.7
1,361.0
825.1
(3.3)
3,541.5
Organic revenue growth
$
25.5
$
93.4
$
51.5
$
170.9
Percentage change
1.9
%
6.9
%
6.2
%
4.8
%
•“Adjusted Operating Income” is defined as operating income adjusted to exclude special items that include, but are not limited to, restructuring, certain asset impairment charges, certain acquisition- and divestiture-related impacts, and unusual or infrequent operating items. Special items represent charges or credits that impact current results, which management views as unrelated to the Company’s ongoing operations and performance.
•“Adjusted Operating Margin” is defined as adjusted operating income divided by revenue. We believe these financial measures are useful to investors and other users of our financial statements in evaluating ongoing operating profitability, as well as in evaluating operating performance in relation to our competitors.
Reconciliations of operating income to adjusted operating income for the years ended December 31, 2025 and 2024 are provided below.
Year Ended December 31, 2025
Motion Technologies
Industrial Process
Connect & Control Technologies
Corporate
ITT Inc.
Operating income
$
275.9
$
315.1
$
178.2
$
(84.7)
$
684.5
Restructuring costs
9.4
8.2
3.7
—
21.3
Acquisition-related costs
—
0.8
0.9
9.5
11.2
Other special items
(0.1)
0.9
(1.0)
0.3
0.1
Adjusted operating income
$
285.2
$
325.0
$
181.8
$
(74.9)
$
717.1
Operating margin
19.3
%
21.1
%
17.5
%
17.4
%
Adjusted operating margin
20.0
%
21.7
%
17.9
%
18.2
%
Year Ended December 31, 2024
Motion Technologies
Industrial Process
Connect & Control Technologies
Corporate
ITT Inc.
Operating income
$
314.6
$
278.4
$
146.1
$
(61.0)
$
678.1
Gain on sale of Wolverine business
(47.8)
—
—
—
(47.8)
Restructuring costs
2.7
3.0
2.4
—
8.1
Acquisition-related costs
—
4.2
2.8
—
7.0
Other special items
(0.6)
—
—
—
(0.6)
Adjusted operating income
$
268.9
$
285.6
$
151.3
$
(61.0)
$
644.8
Operating margin
21.7
%
20.5
%
17.7
%
18.7
%
Adjusted operating margin
18.6
%
21.0
%
18.3
%
17.8
%
41
•“Adjusted Income from Continuing Operations” is defined as income from continuing operations attributable to ITT Inc. adjusted to exclude special items that include, but are not limited to, restructuring, certain asset impairment charges, certain acquisition- and divestiture-related impacts, income tax settlements or adjustments, and unusual or infrequent items. Special items represent charges or credits, on an after-tax basis, that impact current results, which management views as unrelated to the Company’s ongoing operations and performance. The after-tax basis of each special item is determined using the jurisdictional tax rate of where the expense or benefit occurred and the tax deductibility under local tax rules. “Adjusted Income from Continuing Operations per Diluted Share” (Adjusted EPS) is defined as adjusted income from continuing operations divided by diluted weighted average common shares outstanding. We believe that adjusted income from continuing operations and adjusted EPS are useful to investors and other users of our financial statements in evaluating ongoing operating profitability, as well as in evaluating operating performance in relation to our competitors.
Reconciliations of adjusted income from continuing operations attributable to ITT to income from continuing operations attributable to ITT and adjusted income from continuing operations attributable to ITT per diluted share to income from continuing operations attributable to ITT per diluted share (EPS) for the years ended December 31, 2025 and 2024 are provided below. Per share amounts are reported in ones and may not calculate due to rounding.
2025
2024
Income from Continuing Operations
EPS
Income from Continuing Operations
EPS
Reported
$
488.1
$
6.11
$
520.0
$
6.32
Restructuring costs
21.3
0.27
8.1
0.09
Acquisition-related costs(a)
13.3
0.17
7.0
0.08
Gain on sale of Wolverine business
—
—
(47.8)
(0.58)
Other pre-tax special items(b)
2.1
0.02
(0.6)
(0.01)
Net tax benefit of pre-tax special items
(8.0)
(0.10)
(3.3)
(0.04)
Other tax-related special items(c)(d)
20.1
0.25
0.5
0.02
Adjusted
$
536.9
$
6.72
$
483.9
$
5.88
(a)Acquisition-related costs for 2025 primarily relate to fees incurred to effectuate the agreement to acquire SPX FLOW, including $2.1 of interest-related costs.
(b)Other pre-tax special items for the full year 2025 include interest expense associated with uncertain tax positions.
(c)2025 includes tax expense on distributions of non-U.S. income of $12.6, tax expense on undistributed foreign earnings of $4.9, tax expense from tax rate change impacts of $1.8, and other tax expense special items of $0.8.
(d)2024 includes tax expense on distributions of $12.5, tax benefit from valuation allowance impacts of ($6.7), tax benefit on undistributed foreign earnings of ($5.7), tax benefit related to the Micro-Mode acquisition of ($2.2), tax expense from tax rate change impacts of $1.6, and other tax expense items totaling $1.0.
42
CRITICAL ACCOUNTING ESTIMATES
The preparation of financial statements and related disclosures in accordance with GAAP requires us to make judgments, estimates and assumptions that affect the amounts reported in the financial statements and accompanying notes. Significant accounting policies used in the preparation of the financial statements are discussed in Note 1, Description of Business, Basis of Presentation and Summary of Significant Accounting Policies, to the Consolidated Financial Statements. An accounting policy is deemed critical if it requires an accounting estimate to be made based on assumptions about matters that are highly uncertain at the time the estimate is made, if different estimates reasonably could have been used, or if changes to the estimate that are reasonably possible could materially affect the financial statements. Senior management has discussed the development, selection and disclosure of these estimates with the Audit Committee of ITT’s Board of Directors.
The accounting estimates and assumptions discussed below are those that we consider most critical to fully understanding our financial statements and evaluating our results as they are inherently uncertain, involve the most subjective or complex judgments, include areas where different estimates reasonably could have been used, and the use of an alternative estimate that is reasonably possible could materially affect the financial statements. We base our estimates on historical experience and other data and assumptions believed to be reasonable under the circumstances, the results of which form the basis for making judgments about the carrying values of assets and liabilities that are not readily apparent from other sources. Management believes the accounting estimates employed and the resulting balances reported in the Consolidated Financial Statements are reasonable; however, actual results could differ materially from our estimates and assumptions.
Revenue Recognition
Revenue is derived from the sale of products and services to customers. We recognize revenue to depict the transfer of promised goods or services to customers in an amount that reflects the consideration to which we expect to be entitled in exchange for those goods or services. For product sales, other than certain long-term construction and production type contracts where we have no alternative use for the product and have an enforceable right to payment, we recognize revenue at the time control of our promised goods or services passes to the customer, generally when products are shipped and the contractual terms have been fulfilled.
We recognize revenue for certain highly customized long-term design and build projects using the cost-to-cost method, based upon the percentage of costs incurred to total projected costs. Revenue and profit recognized under the cost-to-cost method are based on management’s estimates of measures such as total contract revenues, contract costs and the extent of progress toward completion. Due to the long-term nature of the contracts, these estimates are subject to uncertainties and require significant judgment. Estimates of contract costs include labor hours and rates, and material costs. These estimates consider historical performance, the complexity of the work to be performed, the estimated time to complete the project, and other economic factors such as inflation and market rates. We update our estimates on a periodic basis and any revisions to such estimates are recorded in earnings in the period in which they are determined. Provisions for estimated losses, if any, on uncompleted long-term contracts, are made in the period in which such losses are determined.
For contracts recognized at a point in time, provisions for estimated losses, if any, on uncompleted arrangements are recognized in the period in which such losses are determined. These estimates are subject to uncertainties and require significant judgment. They may consider historical performance, the complexity of the work to be performed, the estimated time to complete the project, and other economic factors such as inflation.
Additionally, accruals for estimated expenses related to sales returns and warranties are made at the time products are sold. Reserves for sales returns, rebates and other allowances are established using historical information on the frequency of returns for a particular product and period over which products can be returned. For distributors and resellers, our typical return period is less than 180 days. Future market conditions and product transitions may require us to take actions to increase customer incentive offerings, possibly resulting in a reduction in revenue at the time the incentive is offered.
Warranty accruals are established using historical information on the nature, frequency, and average cost of warranty claims and estimates of future costs. Our standard product warranty terms generally include post-sales support and repairs or replacement of a product at no additional charge for a specified period of time. Although we engage in extensive product quality programs and processes, we base our estimated warranty obligation on product warranty terms offered to customers, ongoing product failure rates, materials usage, service delivery costs incurred in correcting a product failure, and specific product class failures outside of our baseline experience and associated overhead costs. If actual product failure rates, repair rates, or any other post-sales support costs differ from these estimates, revisions to the estimated warranty liability would be required.
43
For certain highly complex contracts, design, engineering, and other preproduction costs may be capitalized if the costs relate directly to a contract or anticipated contract that the entity can specifically identify, the costs generate or enhance resources of the entity that will be used in satisfying performance obligations in the future and the costs are expected to be recovered. In addition to direct labor and materials to fulfill a contract or anticipated contract, we exercise judgment in determining which costs are allocated, including allocations of contract management and depreciation of tooling used to fulfill the contract. Additionally, overall contract profitability is estimated in determining cost recoverability.
Income Taxes
Deferred income tax assets and liabilities are determined based on the estimated future tax effects of differences between the financial reporting and tax bases of assets and liabilities, applying currently enacted tax rates in effect for the year in which we expect the differences will reverse. We periodically assess the likelihood that we will be able to recover our deferred tax assets, and we reflect any changes to our estimate of the amount we are more likely than not to realize as a valuation allowance, with a corresponding adjustment to earnings or other comprehensive income (loss), as appropriate. The ultimate realization of deferred tax assets depends on the generation of future taxable income (including the reversals of deferred tax liabilities) during the periods in which those deferred tax assets will become deductible.
The Company assesses all available positive and negative evidence regarding the realizability of its deferred tax assets. Significant judgment is required in assessing the need for any valuation allowance recorded against deferred tax assets. In assessing the need for a valuation allowance, we consider all available evidence, both positive and negative, including the future reversal of existing taxable temporary differences, taxable income in carryback periods, prudent and feasible tax planning strategies, estimated future taxable income, and whether we have a recent history of losses. The valuation allowance can be affected by changes to tax regulations, interpretations and rulings, changes to enacted statutory tax rates, and changes to future taxable income estimates.
Our effective tax rate reflects the impact of foreign and U.S. taxes on the undistributed earnings of all foreign subsidiaries because these earnings are considered not indefinitely reinvested outside of the U.S. ITT uses U.S. earnings and profits to estimate the undistributed local statutory foreign earnings. ITT is indefinitely reinvested in the excess of financial reporting over tax basis in its foreign subsidiaries that exceeds undistributed U.S. earnings and profits.
The calculation of our deferred and other tax balances involves significant management judgment when dealing with uncertainties in the application of complex tax regulations and rulings in a multitude of taxing jurisdictions across our global operations. The Company is routinely audited by U.S. federal, state and foreign tax authorities, the results of which could cause proposed assessments against the Company. We recognize potential liabilities and record tax liabilities for anticipated tax audit issues based on our estimate of whether, and to the extent to which, additional taxes will be due. Furthermore, we recognize the tax benefit from an uncertain tax position only if it is more likely than not that the tax position will be sustained on examination by the taxing authorities, based on the technical merits of the position in consideration of applicable tax statutes and related interpretations and precedents and the expected outcome of the proceedings (or negotiations) with the taxing authorities. Tax benefits recognized in the financial statements from such a position are measured based on the largest benefit that has a greater than 50% likelihood of being realized on ultimate settlement.
We adjust our liability for uncertain tax positions in light of changing facts and circumstances; however, the ultimate resolution of a tax examination may differ from the amounts recorded in the financial statements for a number of reasons, including the Company’s decision to settle rather than litigate a matter, relevant legal precedent related to similar matters, and the Company’s success in supporting its filing positions with the tax authorities. If our estimate of tax liabilities proves different than the ultimate outcome, such differences will affect the provision for income taxes in the period in which such determination is made. Over the next 12 months, the net amount of the tax liability for unrecognized tax benefits in foreign and domestic jurisdictions is not expected to change by a significant amount.
44
Acquisitions, Goodwill and Other Intangible Assets
Our business acquisitions typically result in the creation of goodwill and other intangible asset balances, and these balances affect the amount and timing of future period amortization expense, as well as expense we could possibly incur as a result of an impairment charge. The cost of acquired companies is allocated to identifiable tangible and intangible assets based on estimated fair value, with the excess allocated to goodwill. Accordingly, we have a significant balance of acquisition date intangible assets, including customer relationships, trademarks, proprietary technology and goodwill. We engage third-party valuation specialists to assist us in determining the acquisition date fair values as necessary.
The allocation of purchase price requires management to make significant estimates and assumptions. Critical estimates include, but are not limited to, future revenue and profit margins, royalty rates, discount rates, customer retention rates, technology migration curves and useful lives assigned to acquired intangible assets. While we believe our assumptions and estimates are reasonable, they are inherently uncertain and based in part on experience, market conditions, projections of future performance and information obtained from management of the acquired companies.
We review goodwill and indefinite-lived intangible assets for impairment annually and whenever events or changes in circumstances indicate the carrying value of an asset may not be recoverable. We also review the carrying value of our finite-lived intangible assets for potential impairment when impairment indicators arise. We conduct our annual impairment tests as of the first day of the fourth quarter. When reviewing for impairment, we may opt to make an initial qualitative evaluation, which considers present events and circumstances, to determine the likelihood of impairment. Our decision to perform a qualitative impairment assessment for an individual reporting unit in a given year is influenced by a number of factors, including the significance of the excess of the reporting unit's estimated fair value over carrying value at the last quantitative assessment date, changes in macroeconomic, industry and reporting-unit specific conditions and the amount of time in between quantitative fair value measurements. If the likelihood of impairment is not considered to be more likely than not, then no further testing is performed.
In cases when we opt not to perform a qualitative evaluation, or the qualitative evaluation indicates that the likelihood of impairment is more likely than not, we then perform a quantitative impairment test for goodwill. We test each reporting unit for goodwill impairment quantitatively at a minimum of once every three years. We compare the estimated fair value of each reporting unit to its carrying value. If the estimated fair value of the reporting unit exceeds the carrying value of the net assets assigned to that reporting unit, goodwill is not impaired. If the carrying value of the net assets assigned to the reporting unit exceeds its fair value, then we record an impairment loss equal to the difference. In our annual impairment test for indefinite-lived intangible assets, we compare the fair value of those assets to their carrying value. We recognize an impairment loss when the estimated fair value of the indefinite-lived intangible asset is less than its carrying value.
We estimate the fair value of our reporting units using an income approach. Under the income approach, we calculate fair value based on the present value of estimated future cash flows. We estimate the fair value of our indefinite-lived intangible assets using the relief from royalty method. The relief from royalty method estimates the portion of a company’s earnings attributable to an intellectual property asset based on an assumed royalty rate that the company would have paid had the asset not been owned.
Determining the fair value of a reporting unit or an indefinite-lived intangible asset is judgmental in nature and involves the use of significant estimates and assumptions, particularly related to future operating results and cash flows. These estimates and assumptions include, but are not limited to, revenue growth rates and operating margins used to calculate projected future cash flows, risk-adjusted discount rates, assumed royalty rates, future economic and market conditions, and the identification of appropriate market comparable data. In addition, the identification of reporting units and the allocation of assets and liabilities to the reporting units when determining the carrying value of each reporting unit also requires judgment. Goodwill is tested for impairment at the reporting unit level, which, based on the applicable accounting guidance, is either the operating segment or one level below (e.g., the divisions of our CCT segment). The fair value of our reporting units and indefinite-lived intangible assets are based on estimates and assumptions that are believed to be reasonable. Significant changes to these estimates and assumptions could adversely impact our conclusions. Actual future results may differ from those estimates. During the fourth quarter of 2025, we performed our annual impairment assessment and determined that the estimated fair values of our goodwill reporting units were substantially in excess of each of their carrying values. Had different reporting units been identified or had different valuation techniques or assumptions been utilized, the results of our impairment tests could have resulted in an impairment loss, which could have been material.
We are subject to various federal, state, local, and foreign environmental laws and regulations that require environmental assessment or remediation efforts. Accruals for environmental exposures are recorded on a site-by-site basis when it is probable that a liability has been incurred and the amount of the liability can be reasonably estimated, based on current law and existing technologies. Significant judgment is required to determine both the likelihood of a loss and the estimated amount of loss. Engineering studies, probability techniques, historical experience, and other factors are used to identify and evaluate remediation alternatives and their related costs in estimating our reserve for environmental liabilities. Our environmental reserve of $56.1 at December 31, 2025, represents management’s estimate of undiscounted costs expected to be incurred related to environmental assessment or remediation efforts, including related legal fees, without regard to potential recoveries from insurance companies or other third parties. Our estimated liability is reduced to reflect the participation of other potentially responsible parties in those instances where it is probable that such parties are legally responsible and financially capable of paying their respective share of the relevant costs and that share can be reasonably estimated. Our environmental accruals are reviewed quarterly and adjusted if needed based on progress of investigation and remediation efforts and as additional technical or legal information become available, such as the impact of negotiations with regulators and other potentially responsible parties, settlements, rulings, advice of legal counsel, and other current information.
We closely monitor our environmental responsibilities, together with trends in the environmental laws. Environmental remediation reserves are subject to numerous inherent uncertainties that affect our ability to estimate our share of the costs. Such uncertainties involve incomplete information regarding particular sites, incomplete information regarding other potentially responsible parties, uncertainty regarding the nature and extent of contamination at each site, uncertainties concerning the extent of remediation required under existing regulations, uncertainties concerning our share of any remediation liability, if any, widely varying cost estimates associated with potential alternative remedial approaches, uncertainty with regard to the length of time required to remediate a particular site, uncertainties concerning the potential effects of continuing improvements in remediation technology, and unpredictable nature and timing of changes in environmental standards and regulatory requirements. The effect of legislative or regulatory changes on environmental standards could be material to the Company’s financial statements. Additionally, violations by us of such laws and regulations, discovery of previously unknown or more extensive contamination, litigation involving environmental impacts, our inability to recover costs associated with any such developments, or financial insolvency of other potentially responsible parties could have a material adverse effect on our financial statements.
Although it is not possible to predict with certainty the ultimate costs of environmental remediation, the reasonably possible high-end of our estimated environmental liability range at December 31, 2025 was $97.3. See Note 19, Commitments and Contingencies, to the Consolidated Financial Statements for more information.
Recent Accounting Pronouncements
See Note 2, Recent Accounting Pronouncements, to the Consolidated Financial Statements for a complete discussion of recent accounting pronouncements.
ITEM 7A.
QUANTITATIVE AND QUALITATIVE DISCLOSURES ABOUT MARKET RISK
As a result of our global operating and financing activities, we are exposed to various market risks, including from changes in foreign currency exchange rates, interest rates and commodity prices, which may adversely affect our operating results and financial position. The impact from changes in market conditions is generally minimized through our normal operating and financing activities. However, we may use derivative instruments, primarily foreign currency options and forward contracts, interest rate swaps and futures contracts, to manage some of these risks. We do not use derivative financial instruments for trading or other speculative purposes. To minimize the risk of counterparty non-performance, derivative instruments are entered into with major financial institutions and there is no significant concentration with any one counterparty.
Foreign Currency Risk
Foreign currency risk is the possibility that our financial results could be adversely impacted because of changes in currency exchange rates.Our foreign currency exchange rate risk relates to receipts from customers, payments to suppliers and intercompany transactions denominated in foreign currencies. Our principal currency exposures relate to the Euro, Chinese renminbi, Czech koruna, South Korean won, Saudi riyal, Danish krone, Polish zloty, and Mexican peso.
46
Based on a sensitivity analysis, a hypothetical 10% change in the foreign currency exchange rates for the year ended December 31, 2025 would have impacted our pre-tax earnings by approximately $48. This calculation assumes that all currencies change in the same direction and proportion relative to the U.S. dollar and that there are no indirect effects, such as changes in non-U.S. dollar sales volumes or prices. To mitigate this risk, from time to time, we enter into derivative financial instruments (e.g., forward contracts) with creditworthy counterparties. The aforementioned sensitivity analysis does not take into account the impact of any derivative financial instruments entered into.
Interest Rate Risk
Interest rate risk is the possibility that our financial results could be adversely impacted because of changes in interest rates. The Company’s exposure to changes in interest rates relates primarily to the Company’s outstanding floating rate, which consists primarily of commercial paper and the 2025 Term Loan. While the Company is exposed to global interest rate fluctuations, it is most affected by fluctuations in U.S. interest rates. Changes in interest rates affect the interest earned on the Company’s cash and cash equivalents, derivative financial instruments and the fair value of those instruments, as well as costs associated with hedging and interest paid on the Company’s outstanding debt.
During 2023, central banks around the world raised interest rates to counter inflation. Despite the rate cuts in 2024 and 2025, high interest rates continue to impact our cost of debt and may adversely impact customer behavior, including demand for our products. These conditions have contributed to a strengthening of the U.S. dollar relative to foreign currencies, which has resulted in unfavorable foreign currency translation impacts.
As of December 31, 2025, our outstanding commercial paper was $258.0, with a weighted average interest rate of 2.42% and our outstanding long-term debt was $520.0, with a variable annual interest of 4.72%. We estimate that a hypothetical increase in interest rates of 100 basis points would result in approximately $7.8 of additional annual interest expense based on current borrowing levels. Our sensitivity to interest rate fluctuations will increase following the completion of the pending SPX FLOW acquisition due to the expected $2.8 billion in long-term debt financing of the transaction.
Commodity Price Risk
Commodity price risk is the possibility that our financial results could be adversely impacted because of changes in the prices of commodities used in production. Portions of our business are exposed to volatility in the prices of certain commodities, such as steel, gold, copper, nickel, iron, aluminum, tin, and rubber as well as specialty alloys, including titanium that we purchase in the raw form, or that are used in purchased component parts. The prices of these and other commodities may also be impacted by tariffs. When practical, we attempt to control such costs through fixed-price contracts with suppliers; however, we are prone to exposure as these contracts expire. We evaluate hedging opportunities to mitigate or minimize the risk of operating margin erosion resulting from the volatility of commodity prices.
The cost of raw materials, including commodities such as steel, that we use in our production processes typically increases each year. The impact of higher commodity prices on our financial results during 2025 was partially mitigated by fixed-price supply contracts with suppliers as well as by pricing actions.
Assuming all other variables remain constant, we estimate that a hypothetical 10% change in steel prices, excluding any impact of purchased component parts, would impact pre-tax earnings by approximately $5 to $7. We estimate that a hypothetical 10% change in prices for any other commodity would not be material to our financial statements.
ITEM 8.
FINANCIAL STATEMENTS AND SUPPLEMENTARY DATA
See Index to Consolidated Financial Statements herein.
ITEM 9.
CHANGES IN AND DISAGREEMENTS WITH ACCOUNTANTS ON ACCOUNTING AND FINANCIAL DISCLOSURE
None.
47
ITEM 9A.
CONTROLS AND PROCEDURES
Attached as exhibits to this Annual Report on Form 10-K are certifications of the Company’s Chief Executive Officer (CEO) and Chief Financial Officer (CFO), which are required in accordance with Rule 13a-14 under the Exchange Act, as amended.
(a) Evaluation of Disclosure Controls and Procedures
The Company, with the participation of various levels of management, including the CEO and CFO, conducted an evaluation of effectiveness of the design and operation of our disclosure controls and procedures (as defined in Rules 13a-15(e) and 15d-15(e) of the Exchange Act) as of December 31, 2025. Based on such evaluation, such officers have concluded that, as of the end of the period covered by this Annual Report on Form 10-K, the Company’s disclosure controls and procedures are effective.
The Company's Disclosure Committee has the responsibility of considering and evaluating the materiality of information and reviewing disclosure obligations on a timely basis. The Disclosure Committee meets regularly and assists the CEO and the CFO in designing, establishing, reviewing, and evaluating the Company’s disclosure controls and procedures.
(b) Management’s Report on Internal Control Over Financial Reporting
The Company’s management is responsible for establishing and maintaining adequate internal control over financial reporting as defined in Rules 13a-15(f) and 15d-15(f) under the Exchange Act. The Company’s internal control over financial reporting is a process designed to provide reasonable assurance regarding the reliability of financial reporting and the preparation of financial statements for external purposes in accordance with accounting principles generally accepted in the United States of America.
Internal control over financial reporting includes those policies and procedures that (i) pertain to the maintenance of records that, in reasonable detail, completely, accurately and fairly reflect the transactions and dispositions of the Company’s assets; (ii) provide reasonable assurance that transactions are recorded as necessary to permit preparation of the financial statements in accordance with accounting principles generally accepted in the United States of America; (iii) provide reasonable assurance that Company receipts and expenditures are made only in accordance with the authorization of management and the directors of the Company, and (iv) provide reasonable assurance regarding prevention or timely detection of unauthorized acquisition, use, or disposition of assets that could have a material effect on the Consolidated Financial Statements. Internal control over financial reporting includes the controls themselves, monitoring and internal auditing practices, and actions taken to correct any identified deficiencies.
Management assessed the effectiveness of the Company’s internal control over financial reporting as of December 31, 2025. Management based this assessment on criteria for effective internal control over financial reporting described in the 2013 "Internal Control — Integrated Framework" released by the Committee of Sponsoring Organizations (COSO) of the Treadway Commission. Management's assessment included an evaluation of the design of the Company’s internal control over financial reporting and testing of the operational effectiveness of its internal control over financial reporting. Management reviewed the results of its assessment with the Audit Committee of our Board of Directors.
Based on this assessment, management determined that, as of December 31, 2025, the Company maintained effective internal control over financial reporting.
The Company’s management, including the CEO and the CFO, does not expect that our internal control over financial reporting, because of inherent limitations, will prevent or detect all errors and all fraud. Also, projections of any evaluation of effectiveness to future periods are subject to the risk that controls may be inadequate because of changes in conditions, or that the degree of compliance with the policies or procedures may deteriorate.
Management’s assessment, included herein, should be read in conjunction with the certifications and the attestation report on the registrant's internal control over financial reporting issued by Deloitte & Touche LLP, an independent registered public accounting firm, as stated in their report, which appears subsequent to Item 9B in this Annual Report on Form 10-K.
(c) Changes in Internal Control over Financial Reporting
During the three months ended December 31, 2025, no change occurred in our internal control over financial reporting that materially affected, or is reasonably likely to materially affect, our internal control over financial reporting.
48
ITEM 9B.
OTHER INFORMATION
Disclosure pursuant to Section 219 of the Iran Threat Reduction & Syria Human Rights Act (ITRA)
This disclosure is made pursuant to Section 219 of the Iran Threat Reduction and Syria Human Rights Act of 2012 which added subsection (r) to Section 13 of the Exchange Act (Section 13(r)). Section 13(r) requires an issuer to disclose in its annual or quarterly reports whether it or any of its affiliates have knowingly engaged in certain activities, transactions or dealings relating to Iran. Disclosure of such activities, transactions or dealings is required even when conducted outside the United States by non-U.S. persons in compliance with applicable law, and whether or not such activities are sanctionable under U.S. law.
In its 2012 Annual Report, ITT described its acquisition of all the shares of Joh. Heinr. Bornemann GmbH (Bornemann) in November 2012, as well as certain activities of Bornemann in Iran and the wind down of those activities in accordance with a General License issued on December 26, 2012 (the General License) by the Office of Foreign Assets Control. As permitted by the General License, on or before March 8, 2013, Bornemann completed the wind-down activities and ceased all activities in Iran. As required to be disclosed by Section 13(r), the gross revenues and operating income to Bornemann from its Iranian activities subsequent to its acquisition by ITT were €2.2 million and €1.5 million, respectively. Prior to its acquisition by ITT, Bornemann issued a performance bond to its Iranian customer in the amount of €1.3 million (the Bond). Bornemann requested that the Bond be canceled prior to March 8, 2013; however, the former customer refused this request and as a result the Bond remains outstanding. Bornemann did not receive gross revenues or operating income, or pay interest, with respect to the Bond in any subsequent periods through December 31, 2025, however, Bornemann did pay annual fees of approximately €7 thousand during each of the past three years, to the German financial institution which is maintaining the Bond.
Rule 10b5-1 Trading Plans
During the three months ended December 31, 2025, no director or executive officer of the Company adopted, modified, or terminated a trading arrangement intended to satisfy the affirmative defenses of Rule 10b5-1(c) under the Exchange Act or a “non-Rule 10b5-1 trading arrangement,” as defined in Item 408(a) of Regulation S-K.
ITEM 9C.
DISCLOSURES REGARDING FOREIGN JURISDICTIONS THAT PREVENT INSPECTIONS
Not applicable.
49
REPORT OF INDEPENDENT REGISTERED PUBLIC ACCOUNTING FIRM
To the shareholders and the Board of Directors of ITT Inc.
Opinion on Internal Control over Financial Reporting
We have audited the internal control over financial reporting of ITT Inc.and subsidiaries (the "Company") as of December 31, 2025, based on criteria established in Internal Control — Integrated Framework (2013) issued by the Committee of Sponsoring Organizations of the Treadway Commission (COSO). In our opinion, the Company maintained, in all material respects, effective internal control over financial reporting as of December 31, 2025, based on criteria established in Internal Control — Integrated Framework (2013) issued by COSO.
We have also audited, in accordance with the standards of the Public Company Accounting Oversight Board (United States) (PCAOB), the consolidated financial statements as of and for the year ended December 31, 2025, of the Company and our report dated February 9, 2026, expressed an unqualified opinion on those financial statements.
Basis for Opinion
The Company’s management is responsible for maintaining effective internal control over financial reporting and for its assessment of the effectiveness of internal control over financial reporting, included in the accompanying Management’s Report on Internal Control Over Financial Reporting. Our responsibility is to express an opinion on the Company’s internal control over financial reporting based on our audit. We are a public accounting firm registered with the PCAOB and are required to be independent with respect to the Company in accordance with the U.S. federal securities laws and the applicable rules and regulations of the Securities and Exchange Commission and the PCAOB.
We conducted our audit in accordance with the standards of the PCAOB. Those standards require that we plan and perform the audit to obtain reasonable assurance about whether effective internal control over financial reporting was maintained in all material respects. Our audit included obtaining an understanding of internal control over financial reporting, assessing the risk that a material weakness exists, testing and evaluating the design and operating effectiveness of internal control based on the assessed risk, and performing such other procedures as we considered necessary in the circumstances. We believe that our audit provides a reasonable basis for our opinion.
Definition and Limitations of Internal Control over Financial Reporting
A company’s internal control over financial reporting is a process designed to provide reasonable assurance regarding the reliability of financial reporting and the preparation of financial statements for external purposes in accordance with generally accepted accounting principles. A company’s internal control over financial reporting includes those policies and procedures that (1) pertain to the maintenance of records that, in reasonable detail, accurately and fairly reflect the transactions and dispositions of the assets of the company; (2) provide reasonable assurance that transactions are recorded as necessary to permit preparation of financial statements in accordance with generally accepted accounting principles, and that receipts and expenditures of the company are being made only in accordance with authorizations of management and directors of the company; and (3) provide reasonable assurance regarding prevention or timely detection of unauthorized acquisition, use, or disposition of the company’s assets that could have a material effect on the financial statements.
Because of its inherent limitations, internal control over financial reporting may not prevent or detect misstatements. Also, projections of any evaluation of effectiveness to future periods are subject to the risk that controls may become inadequate because of changes in conditions, or that the degree of compliance with the policies or procedures may deteriorate.
/s/ Deloitte & Touche LLP
Stamford, Connecticut
February 9, 2026
50
PART III
ITEM 10.
DIRECTORS, EXECUTIVE OFFICERS AND CORPORATE GOVERNANCE
Information required by this Item 10 is incorporated by reference from the information provided under the sections entitled "Voting Items," "How to Vote," "Election of Directors (Proxy Item No. 1)," "Corporate Governance and Related Matters-Board and Committee Structure-Overview of Committees-Audit Committee" and "Audit Committee Report" in our Proxy Statement for the 2026 Annual Meeting of Shareholders (2026 Proxy Statement).
Information required by this Item 10 with respect to executive officers of the Company is contained under the heading "Information About Our Executive Officers" in Part I of this Annual Report on Form 10-K.
ITT has adopted corporate governance principles and charters for each of its standing committees. The principles address director qualification standards and responsibilities, access to management and independent advisors, compensation, orientation and continuing education, management succession principles and board and committee self-evaluation. The corporate governance principles and charters are available on the Company’s website at investors.itt.com/governance. A copy of the corporate governance principles and charters is also available to any shareholder who requests a copy from the Company’s secretary.
ITT has also adopted a written code of ethics, the "Code of Conduct," which is applicable to all directors, employees and officers (including the Company’s principal executive officer, principal financial officer, principal accounting officer or controller, or person performing similar functions). The Company’s Code of Conduct is available on our website at investors.itt.com/governance. We intend to satisfy the disclosure requirement under Item 5.05 of Form 8-K regarding an amendment to, or waiver from, a provision of our Code of Conduct by posting such information on our website at www.itt.com.
Pursuant to New York Stock Exchange (NYSE) Listing Company Manual Section 303A.12(a), the Company submitted a Section 12(a) CEO Certification to the NYSE in 2025. The Company also filed with the SEC, as exhibits to the Company’s current Annual Report on Form 10-K, the certifications required under Section 302 of the Sarbanes-Oxley Act for its Chief Executive Officer and Chief Financial Officer.
ITEM 11.
EXECUTIVE COMPENSATION
Information required by this Item 11 is incorporated by reference to the discussion under the headings "2025 Non-Management Director Compensation," "Compensation Tables," "Compensation Discussion and Analysis," "Compensation and Human Capital Committee Report" and "Compensation Committee Interlocks and Insider Participation" in our 2026 Proxy Statement.
ITEM 12.
SECURITY OWNERSHIP OF CERTAIN BENEFICIAL OWNERS AND MANAGEMENT AND RELATED STOCKHOLDER MATTERS
Information required by this Item 12 is incorporated by reference to the discussion under the caption "Other Matters - Stock Ownership of Directors, Executive Officers, and Certain Shareholders," and "Equity Compensation Plan Information" in our 2026 Proxy Statement.
ITEM 13.
CERTAIN RELATIONSHIPS AND RELATED TRANSACTIONS AND DIRECTOR INDEPENDENCE
Information required by this item is incorporated by reference to the discussions under the captions "Corporate Governance and Related Matters-Board and Governance Policies-Policies for Approving Related Party Transactions" and "Directors’ Qualification and Selection Process-Director Independence" in our 2026 Proxy Statement.
ITEM 14.
PRINCIPAL ACCOUNTING FEES AND SERVICES
Information about the fees for 2025 and 2024 for professional services rendered by our independent registered public accounting firm is incorporated by reference to the discussion under the heading "Ratification of Appointment of the Independent Registered Public Accounting Firm (Proxy Item No. 2)" of our 2026 Proxy Statement. Our Audit Committee’s policy on pre-approval of audit and permissible non-audit services of our independent registered public accounting firm is also incorporated by reference to the discussion under the heading "Ratification of Appointment of the Independent Registered Public Accounting Firm (Proxy Item No. 2)" of our 2026 Proxy Statement.
51
PART IV
ITEM 15.
EXHIBITS AND FINANCIAL STATEMENT SCHEDULES
(a)Documents filed as a part of this report:
1.See Index to Consolidated Financial Statements appearing on page 53 for a list of the financial statements filed as a part of this report.
2.See Exhibit Index on page II-1 for a list of the exhibits filed or incorporated herein as a part of this report.
(b)Financial Statement Schedules are omitted because of the absence of the conditions under which they are required or because the required information is included in the Consolidated Financial Statements filed as part of this report.
REPORT OF INDEPENDENT REGISTERED PUBLIC ACCOUNTING FIRM
To the shareholders and the Board of Directors of ITT Inc.
Opinion on the Financial Statements
We have audited the accompanying consolidated balance sheets of ITT Inc.and subsidiaries (the "Company") as of December 31, 2025 and 2024, the related consolidated statements of operations, comprehensive income, shareholders’ equity, and cash flows, for each of the three years in the period ended December 31, 2025, and the related notes (collectively referred to as the “financial statements”). In our opinion, the financial statements present fairly, in all material respects, the financial position of the Company as of December 31, 2025 and 2024, and the results of its operations and its cash flows for each of the three years in the period ended December 31, 2025, in conformity with accounting principles generally accepted in the United States of America.
We have also audited, in accordance with the standards of the Public Company Accounting Oversight Board (United States) (PCAOB), the Company's internal control over financial reporting as of December 31, 2025, based on criteria established in Internal Control — Integrated Framework (2013) issued by the Committee of Sponsoring Organizations of the Treadway Commission and our report dated February 9, 2026, expressed an unqualified opinion on the Company's internal control over financial reporting.
Change in Accounting Principle
As discussed in Note 1 to the financial statements, effective January 1, 2025, the Company has elected to change its method of accounting for determining the cost for certain inventories from a last-in, first-out (LIFO) basis to a first-in, first-out (FIFO) basis for all inventories previously accounted for under LIFO.
Basis for Opinion
These financial statements are the responsibility of the Company’s management. Our responsibility is to express an opinion on the Company’s financial statements based on our audits. We are a public accounting firm registered with the PCAOB and are required to be independent with respect to the Company in accordance with the U.S. federal securities laws and the applicable rules and regulations of the Securities and Exchange Commission and the PCAOB.
We conducted our audits in accordance with the standards of the PCAOB. Those standards require that we plan and perform the audit to obtain reasonable assurance about whether the financial statements are free of material misstatement, whether due to error or fraud. Our audits included performing procedures to assess the risks of material misstatement of the financial statements, whether due to error or fraud, and performing procedures that respond to those risks. Such procedures included examining, on a test basis, evidence regarding the amounts and disclosures in the financial statements. Our audits also included evaluating the accounting principles used and significant estimates made by management, as well as evaluating the overall presentation of the financial statements. We believe that our audits provide a reasonable basis for our opinion.
Critical Audit Matter
The critical audit matter communicated below is a matter arising from the current-period audit of the financial statements that was communicated or required to be communicated to the audit committee and that (1) relates to accounts or disclosures that are material to the financial statements and (2) involved our especially challenging, subjective, or complex judgments. The communication of critical audit matters does not alter in any way our opinion on the financial statements, taken as a whole, and we are not, by communicating the critical audit matter below, providing a separate opinion on the critical audit matter or on the accounts or disclosures to which it relates.
Revenue Recognition – Refer to Note 1 and Note 4 to the Consolidated Financial Statements
Critical Audit Matter Description
The Company recognizes revenue to depict the transfer of promised goods or services to customers in an amount that reflects the consideration to which the Company expects to be entitled in exchange for those goods or services.
Given the Company’s decentralized structure and geographic dispersion of the Company’s business units, auditing revenue recognized at a point in time required significant audit effort for us to identify, test, and evaluate the Company’s revenue recognition.
54
How the Critical Audit Matter Was Addressed in the Audit
To address this critical audit matter, we performed the following procedures to test revenue recognized at a point in time, among others:
•Obtained an understanding of the Company’s geographic composition of revenue and used judgment to determine which business units to perform revenue recognition procedures on.
•Obtained an understanding, evaluated the design, and tested the operating effectiveness of the Company’s relevant controls at certain business units to determine the appropriate revenue recognition.
•Performed site visits of certain business units across various geographies to perform revenue recognition testing and observe the Company's process, products, and arrangements.
•Performed detail transaction testing of revenue recognition at certain business units by (1) evaluating the terms of revenue contracts and the appropriateness of management’s determination of revenue recognition; (2) agreeing amounts recorded to source documents to determine the revenue was properly recognized.
•Performed substantive analytical procedures at certain business units by developing independent expectations for point in time revenue and comparing the expectations to the point in time revenue recorded by the Company.
•Evaluated the overall sufficiency of audit evidence obtained by assessing the results of procedures performed over revenue recognition.
/s/
Deloitte & Touche LLP
Stamford, Connecticut
February 9, 2026
We have served as the Company's auditor since 2002.
55
CONSOLIDATED STATEMENTS OF OPERATIONS
(IN MILLIONS, EXCEPT PER SHARE AMOUNTS) YEARS ENDED DECEMBER 31
2025
2024
2023
Revenue
$
3,938.5
$
3,630.7
$
3,283.0
Costs of revenue
2,546.1
2,381.3
2,173.4
Gross profit
1,392.4
1,249.4
1,109.6
General and administrative expenses
368.4
297.1
294.4
Sales and marketing expenses
228.7
205.7
174.0
Research and development expenses
110.8
116.3
102.6
(Gain) loss on sale of businesses
—
(47.8)
8.1
Operating income
684.5
678.1
530.5
Interest expense
48.1
36.6
19.2
Interest income
(10.7)
(6.6)
(8.8)
Other non-operating income, net
(4.4)
(1.6)
(1.7)
Income from continuing operations before income tax
651.5
649.7
521.8
Income tax expense
160.1
126.3
105.4
Income from continuing operations
491.4
523.4
416.4
Loss from discontinued operations, net of tax benefit of $0.0, $0.0, and $0.3, respectively
(0.1)
(0.1)
(0.9)
Net income
491.3
523.3
415.5
Less: Income attributable to noncontrolling interests
3.3
3.4
3.3
Net income attributable to ITT Inc.
$
488.0
$
519.9
$
412.2
Amounts attributable to ITT Inc.:
Income from continuing operations, net of tax
$
488.1
$
520.0
$
413.1
Loss from discontinued operations, net of tax
(0.1)
(0.1)
(0.9)
Net income
$
488.0
$
519.9
$
412.2
Earnings (loss) per share attributable to ITT Inc.:
Basic:
Continuing operations
$
6.15
$
6.36
$
5.02
Discontinued operations
—
—
(0.01)
Net income
$
6.15
$
6.36
$
5.01
Diluted:
Continuing operations
$
6.11
$
6.32
$
5.00
Discontinued operations
—
—
(0.02)
Net income
$
6.11
$
6.32
$
4.98
Weighted average common shares – basic
79.4
81.8
82.3
Weighted average common shares – diluted
79.9
82.3
82.7
The accompanying Notes to the Consolidated Financial Statements are an integral part of the above Consolidated Statements of Operations.
56
CONSOLIDATED STATEMENTS OF COMPREHENSIVE INCOME
(IN MILLIONS) YEARS ENDED DECEMBER 31
2025
2024
2023
Net income
$
491.3
$
523.3
$
415.5
Other comprehensive income (loss):
Net foreign currency translation adjustment
119.0
(91.2)
17.6
Net change in postretirement benefit plans, net of tax impacts of $(1.2), $(1.5), and $1.7, respectively
(3.2)
4.8
(5.2)
Other comprehensive (loss) income
115.8
(86.4)
12.4
Comprehensive income
607.1
436.9
427.9
Less: Comprehensive income attributable to noncontrolling interests
3.3
3.4
3.3
Comprehensive income attributable to ITT Inc.
$
603.8
$
433.5
$
424.6
Disclosure of reclassification adjustments and other adjustments to postretirement benefit plans (See Note 15)
Reclassification adjustments:
Amortization of prior service benefit, net of tax expense of $1.4, $1.3, and $1.4, respectively
$
(4.3)
$
(4.4)
$
(4.6)
Amortization of net actuarial loss, net of tax benefit of $(0.2), $0.1, and $0.0, respectively
(0.4)
0.4
0.1
Loss on plan settlement, net of tax benefit of $0.0, $0.2, and $0.0, respectively
(0.1)
(0.7)
—
Other adjustments:
Prior service (cost) benefit, net of tax benefit (expense) of $0.0, $0.2, and $0.0, respectively
—
(0.3)
—
Net actuarial gain (loss), net of tax (expense) benefit of $(2.8), $(3.1), and $0.3, respectively
1.8
9.4
(0.5)
Unrealized change from foreign currency translation
(0.2)
0.4
(0.2)
Net change in postretirement benefit plans, net of tax
$
(3.2)
$
4.8
$
(5.2)
Disclosure of reclassification adjustments to cumulative translation adjustment
Cumulative translation adjustment loss recognized on divestiture of businesses
$
—
$
3.6
$
—
The accompanying Notes to the Consolidated Financial Statements are an integral part of the above Consolidated Statements of Comprehensive Income.
57
CONSOLIDATED BALANCE SHEETS
(IN MILLIONS, EXCEPT PER SHARE AMOUNTS) DECEMBER 31
2025
2024
Assets
Current assets:
Cash and cash equivalents
$
1,742.9
$
439.3
Receivables, net
756.1
703.0
Inventories
671.9
612.3
Other current assets
183.4
131.2
Total current assets
3,354.3
1,885.8
Non-current assets:
Plant, property and equipment, net
627.0
577.2
Goodwill
1,511.2
1,430.1
Other intangible assets, net
432.6
454.1
Other non-current assets
385.3
384.1
Total non-current assets
2,956.1
2,845.5
Total assets
$
6,310.4
$
4,731.3
Liabilities and Shareholders’ Equity
Current liabilities:
Short-term borrowings
$
261.3
$
427.6
Accounts payable
465.0
458.4
Accrued and other current liabilities
572.0
447.2
Total current liabilities
1,298.3
1,333.2
Non-current liabilities:
Non-current portion of long-term debt
521.5
232.6
Postretirement benefits
120.0
119.0
Other non-current liabilities
279.3
260.7
Total non-current liabilities
920.8
612.3
Total liabilities
2,219.1
1,945.5
Shareholders’ equity:
Common stock:
Authorized – 250.0 shares, $1 par value per share
Issued and Outstanding – 85.9 and 81.5 shares, respectively
85.9
81.5
Capital in excess of par value
1,313.9
—
Retained earnings
2,987.1
3,115.6
Accumulated other comprehensive loss:
Postretirement benefits
—
3.2
Cumulative translation adjustments
(302.5)
(421.5)
Total accumulated other comprehensive loss
(302.5)
(418.3)
Total ITT Inc. shareholders' equity
4,084.4
2,778.8
Noncontrolling interests
6.9
7.0
Total shareholders’ equity
4,091.3
2,785.8
Total liabilities and shareholders’ equity
$
6,310.4
$
4,731.3
The accompanying Notes to the Consolidated Financial Statements are an integral part of the above Consolidated Balance Sheets.
58
CONSOLIDATED STATEMENTS OF CASH FLOWS
(IN MILLIONS) YEARS ENDED DECEMBER 31
2025
2024
2023
Operating Activities
Income from continuing operations attributable to ITT Inc.
$
488.1
$
520.0
$
413.1
Adjustments to income from continuing operations:
Depreciation and amortization
143.2
137.3
109.2
Equity-based compensation
36.2
25.9
20.2
Deferred income tax expense (benefit)
4.6
(20.6)
(27.6)
(Gain) loss on sale of businesses
—
(47.8)
8.1
Other non-cash charges, net
34.1
30.9
28.9
Changes in assets and liabilities:
Change in receivables
(10.3)
(43.2)
(39.2)
Change in inventories
(24.6)
—
(36.7)
Change in contract assets
(15.7)
(7.9)
(0.3)
Change in contract liabilities
41.9
(0.9)
23.1
Change in accounts payable
(18.8)
1.8
26.3
Change in accrued expenses
56.1
(10.8)
47.6
Change in income taxes
(15.9)
(1.6)
6.0
Other, net
(50.1)
(20.5)
(40.7)
Net Cash – Operating activities
668.8
562.6
538.0
Investing Activities
Capital expenditures
(121.3)
(123.9)
(107.6)
Proceeds from government incentives
7.9
—
—
Proceeds from sale of business
—
177.9
11.5
Acquisitions, net of cash acquired
(6.8)
(864.8)
(79.3)
Payments to acquire interest in unconsolidated subsidiaries
(1.6)
(2.6)
(2.5)
Other, net
2.0
(4.5)
(3.1)
Net Cash – Investing activities
(119.8)
(817.9)
(181.0)
Financing Activities
Commercial paper, net borrowings
(212.3)
239.5
(266.0)
Long-term debt issued, net of debt issuance costs
749.0
763.9
—
Long-term debt repayments
(462.0)
(537.4)
(2.2)
Share repurchases under repurchase plan
(521.0)
(104.5)
(60.0)
Payments for taxes related to net share settlement of stock incentive plans
(13.7)
(14.2)
(7.2)
Dividends paid
(111.0)
(104.7)
(95.8)
Proceeds from issuance of common stock
1,314.1
—
—
Other, net
(14.2)
(7.7)
(1.1)
Net Cash – Financing activities
728.9
234.9
(432.3)
Exchange rate effects on cash and cash equivalents
26.3
(29.0)
3.6
Net cash from discontinued operations – operating activities
(0.5)
(0.5)
(0.3)
Net change in cash and cash equivalents
1,303.7
(49.9)
(72.0)
Cash and cash equivalents – beginning of year (includes restricted cash of $0.7, $0.7, and $0.7, respectively)
440.0
489.9
561.9
Cash and cash equivalents – end of year (includes restricted cash of $0.8, $0.7, and $0.7, respectively)
$
1,743.7
$
440.0
$
489.9
Supplemental Disclosures of Cash Flow and Non-Cash Information:
Cash paid for Interest
$
41.7
$
33.4
$
15.7
Cash paid for Income taxes, net of refunds received
$
151.6
$
128.6
$
113.1
Capital expenditures included in accounts payable
$
17.1
$
31.2
$
25.3
The accompanying Notes to the Consolidated Financial Statements are an integral part of the above Consolidated Statements of Cash Flows.
59
CONSOLIDATED STATEMENTS OF CHANGES IN SHAREHOLDERS’ EQUITY
(IN MILLIONS, EXCEPT SHARE AMOUNTS)
Common Stock
Capital in excess of par value
Retained Earnings
Accumulated Other Comprehensive Loss
Noncontrolling Interest
Total Shareholders' Equity
(Shares)
(Dollars)
December 31, 2022, As previously reported
82.7
$
82.7
$
—
$
2,509.7
$
(344.3)
$
9.3
$
2,257.4
Inventory accounting method change
—
—
—
12.9
—
—
12.9
December 31, 2022 ( As adjusted)
82.7
$
82.7
—
$
2,522.6
$
(344.3)
$
9.3
$
2,270.3
Net income
—
—
—
412.2
—
3.3
415.5
Activity from stock incentive plans
0.2
0.2
—
20.6
—
—
20.8
Share repurchases
(0.7)
(0.7)
—
(59.8)
—
—
(60.5)
Shares withheld related to net share settlement of stock incentive plans
(0.1)
(0.1)
—
(7.1)
—
—
(7.2)
Dividends declared ($1.160 per share)
—
—
—
(95.9)
—
—
(95.9)
Dividend to noncontrolling interest
—
—
—
—
—
(1.7)
(1.7)
Net change in postretirement benefit plans, net of tax
—
—
—
—
(5.2)
—
(5.2)
Net foreign currency translation adjustment
—
—
—
—
17.6
—
17.6
December 31, 2023
82.1
82.1
—
2,792.6
(331.9)
10.9
2,553.7
Net income
—
—
—
519.9
—
3.4
523.3
Activity from stock incentive plans
0.3
0.3
—
26.1
—
—
26.4
Share repurchases
(0.8)
(0.8)
—
(104.0)
—
—
(104.8)
Shares withheld related to net share settlement of stock incentive plans
(0.1)
(0.1)
—
(14.1)
—
—
(14.2)
Dividends declared ($1.276 per share)
—
—
—
(104.8)
—
—
(104.8)
Dividend to noncontrolling interest
—
—
—
—
—
(2.3)
(2.3)
Acquisition of noncontrolling interest
—
—
—
(0.1)
—
(4.9)
(5.0)
Net change in postretirement benefit plans, net of tax
—
—
—
—
4.8
—
4.8
Net foreign currency translation adjustment
—
—
—
—
(91.2)
—
(91.2)
Other
—
—
—
—
—
(0.1)
(0.1)
December 31, 2024
81.5
81.5
—
3,115.6
(418.3)
7.0
2,785.8
Net income
—
—
—
488.0
—
3.3
491.3
Shares issued
8.1
8.1
1,305.5
1.3
—
—
1,314.9
Activity from stock incentive plans
0.2
0.2
8.4
28.1
—
—
36.7
Share repurchases
(3.8)
(3.8)
(521.2)
—
—
(525.0)
Shares withheld related to net share settlement of stock incentive plans
(0.1)
(0.1)
—
(13.7)
—
—
(13.8)
Dividends declared ($1.404 per share)
—
—
—
(111.0)
—
—
(111.0)
Dividend to noncontrolling interest
—
—
—
—
—
(3.3)
(3.3)
Net change in postretirement benefit plans, net of tax
—
—
—
—
(3.2)
—
(3.2)
Net foreign currency translation adjustment
—
—
—
—
119.0
—
119.0
Other
—
—
—
—
—
(0.1)
(0.1)
December 31, 2025
85.9
85.9
1,313.9
2,987.1
(302.5)
6.9
4,091.3
The accompanying Notes to the Consolidated Financial Statements are an integral part of the above Consolidated Statements of Changes in Shareholders’ Equity.
60
NOTES TO THE CONSOLIDATED FINANCIAL STATEMENTS
(DOLLARS AND SHARES (EXCEPT PER SHARE AMOUNTS) IN MILLIONS, UNLESS OTHERWISE STATED)
NOTE 1
DESCRIPTION OF BUSINESS, BASIS OF PRESENTATION AND SUMMARY OF SIGNIFICANT ACCOUNTING POLICIES
Description of Business
ITT Inc. is a diversified manufacturer of highly engineered critical components and customized technology solutions for the transportation, industrial, and energy markets. Unless the context otherwise indicates, references herein to "ITT," "the Company," and such words as "we," "us," and "our" include ITT Inc. and its subsidiaries. ITT operates in three segments: Motion Technologies, consisting of friction materials, and shock and vibration equipment; Industrial Process, consisting of industrial flow equipment and services; and Connect & Control Technologies, consisting of electronic connectors, fluid handling, motion control, composite materials, and noise and energy absorption products. Financial information for our segments is presented in Note 3, Segment Information.
Business Combinations and Divestitures
On January 19, 2024, the Company completed the acquisition of Svanehøj Group A/S (Svanehøj) for a purchase price of $407.6, net of cash acquired. Subsequent to the acquisition, Svanehøj’s results are reported within our IP segment.
On September 12, 2024, the Company completed the acquisition of kSARIA Parent, Inc. (kSARIA) for a purchase price of $460.1, net of cash acquired. Subsequent to the acquisition, kSARIA’s results are reported within our CCT segment.
On July 22, 2024, the Company completed the sale of its Wolverine Advanced Materials (Wolverine) business, part of the MT segment prior to the divestiture, to an unrelated third party for a price of $186.2 (or $177.9, net of cash divested). The Company evaluates all disposal transactions to determine whether such disposal qualifies as discontinued operations in accordance with Accounting Standards Codification (ASC) 205-20, Discontinued Operations. We concluded that the divestiture does not qualify as a discontinued operation.
On December 29, 2023, the Company completed the sale of our Matrix business, an aerospace and defense components manufacturer within our CCT segment, to a third party for total cash proceeds of $1.0.
On May 2, 2023, the Company completed the acquisition of Micro-Mode Products, Inc. (Micro-Mode) for a purchase price of $79.0, net of cash acquired. Subsequent to the acquisition, Micro-Mode’s results are reported within our CCT segment.
The Consolidated Financial Statements and Notes thereto were prepared in conformity with accounting principles generally accepted in the United States of America (GAAP).
The preparation of financial statements in conformity with GAAP requires management to make estimates and assumptions that affect the reported amounts of assets and liabilities, the disclosure of contingent assets and liabilities at the date of the financial statements, and the reported amounts of revenue and expenses during the reporting period. Estimates are revised as additional information becomes available. Estimates and assumptions are used for, but not limited to, revenue recognition, unrecognized tax benefits, deferred tax valuation allowances, projected benefit obligations for postretirement plans, accounting for business combinations, goodwill and other intangible asset impairment testing, environmental liabilities, allowance for credit losses and inventory valuation. Actual results could differ from these estimates.
Certain prior year amounts have been reclassified to conform to the current year presentation.
Change in Accounting Principle - Inventory
Effective January 1, 2025, we changed our method of determining the cost for certain inventories from a last-in, first-out (LIFO) basis to a first-in, first-out (FIFO) basis for all inventories previously accounted for under LIFO. We concluded the FIFO basis of accounting is the preferable method for determining inventory cost for our businesses because it improves comparability with our peers, more accurately reflects the current value and physical flow of
61
inventory, improves consistency across all locations, and aligns operationally with how management views the performance of the business.
We retrospectively applied this change in accounting principle to all prior periods and recorded a cumulative effect adjustment to increase the January 1, 2025 and January 1, 2024 inventory balance by $21.1 and $19.1, respectively, with an increase to retained earnings of $16.2 and $14.6, respectively, net of tax. The Consolidated Statement of Operations, Consolidated Statement of Comprehensive Income, Consolidated Statement of Cash Flows and Consolidated Statement of Changes in Shareholders’ Equity and the Consolidated Balance Sheet as of December 31, 2024 and December 31, 2023, and the related Notes to the Consolidated Financial Statements have been adjusted to reflect the change in accounting principle.
The impact of the change in accounting method on our previously issued financial statements is presented in the following tables:
Year ended December 31, 2024
Year Ended December 31, 2023
Consolidated Statements of Operations
As Computed LIFO
As Computed FIFO
Effect of change
As Computed LIFO
As Computed FIFO
Effect of change
Cost of revenue
$
2,383.4
$
2,381.3
$
(2.1)
$
2,175.7
$
2,173.4
$
(2.3)
Gross profit
1,247.3
1,249.4
2.1
1,107.3
1,109.6
2.3
Operating income
676.0
678.1
2.1
528.2
530.5
2.3
Income from continuing operations before income taxes
647.6
649.7
2.1
519.5
521.8
2.3
Income tax expense
125.8
126.3
0.5
104.8
105.4
0.6
Income from continuing operations
521.8
523.4
1.6
414.7
416.4
1.7
Net Income
521.7
523.3
1.6
413.8
415.5
1.7
Net income attributable to ITT Inc.
518.3
519.9
1.6
410.5
412.2
1.7
Income from continuing operations, net of tax
$
518.4
$
520.0
$
1.6
$
411.4
$
413.1
$
1.7
Earnings per share attributable to ITT Inc.:
Basic:
Continuing Operations
$
6.34
$
6.36
$
0.02
$
5.00
$
5.02
$
0.02
Net Income
$
6.34
$
6.36
$
0.02
$
4.99
$
5.01
$
0.02
Diluted:
Continuing operations
$
6.30
$
6.32
$
0.02
$
4.97
$
5.00
$
0.03
Net income
$
6.30
$
6.32
$
0.02
$
4.96
$
4.98
$
0.02
Consolidated Statements of Comprehensive Income
Net income
$
521.7
$
523.3
$
1.6
$
413.8
$
415.5
$
1.7
Comprehensive income
435.3
436.9
1.6
426.2
427.9
1.7
Comprehensive income attributable to ITT Inc.
$
431.9
$
433.5
$
1.6
$
422.9
$
424.6
$
1.7
Consolidated Statements of Cash Flows
Income from continuing operations
$
518.4
$
520.0
$
1.6
$
411.4
$
413.1
$
1.7
Change in inventories
$
2.0
$
—
$
(2.0)
$
(34.4)
$
(36.7)
$
(2.3)
Change in income taxes
$
(2.1)
$
(1.6)
$
0.5
$
5.4
$
6.0
$
0.6
62
As of December 31, 2024
Consolidated Balance Sheet
As Computed LIFO
As Computed FIFO
Effect of change
Inventories, net
$
591.2
$
612.3
$
21.1
Total current assets
1,864.7
1,885.8
21.1
Other non-current assets
384.6
384.1
(0.5)
Total non-current assets
2,846.0
2,845.5
(0.5)
Total assets
4,710.7
4,731.3
20.6
Other non-current liabilities
256.3
260.7
4.4
Total non-current liabilities
607.9
612.3
4.4
Total liabilities
1,941.1
1,945.5
4.4
Retained Earnings
3,099.4
3,115.6
16.2
Total ITT Inc. shareholders' equity
2,762.6
2,778.8
16.2
Total shareholders' equity
2,769.6
2,785.8
16.2
Total liabilities and equity
$
4,710.7
$
4,731.3
$
20.6
Significant Accounting Policies
Principles of Consolidation
Our consolidated financial statements include the accounts of all majority-owned subsidiaries. ITT consolidates companies in which it has a controlling financial interest or when ITT is considered the primary beneficiary of a variable interest entity. The results of companies acquired or disposed of during the fiscal year are included in the Consolidated Financial Statements from the effective date of acquisition or up to the date of disposal. All intercompany transactions have been eliminated.
Revenue Recognition
Revenue is derived from the sale of products and services to customers. We recognize revenue to depict the transfer of promised goods or services to customers in an amount that reflects the consideration to which we expect to be entitled in exchange for those goods or services.
For product sales, we consider practical and contractual limitations in determining whether there is an alternative use for the product. For example, long-term design and build contracts are typically highly customized to a customer’s specifications. For contracts with no alternative use and an enforceable right to payment for work performed to date, including a reasonable profit if the contract were to be terminated at the customer’s convenience for reason other than nonperformance, we recognize revenue over time. All other product sales are recognized at a point in time.
For contracts recognized over time, we use the cost-to-cost method or the units-of-delivery method, depending on the nature of the contract, including length of production time.
For contracts recognized at a point in time, we recognize revenue when control passes to the customer, which is generally based on shipping terms that address when title and risk and rewards pass to the customer. However, we also consider certain customer acceptance provisions as certain contracts with customers include installation, testing, certification or other acceptance provisions. In instances where contractual terms include a provision for customer acceptance, we consider whether we have previously demonstrated that the product meets objective criteria specified by either the seller or customer in assessing whether control has passed to the customer.
For service contracts, we recognize revenue as the services are rendered if the customer is benefiting from the service as it is performed, or otherwise upon completion of the service. Separately priced extended warranties are recognized as a separate performance obligation over the warranty period.
The transaction price in our contracts consists of fixed consideration and the impact of variable consideration including returns, rebates and allowances, and penalties. Variable consideration is generally estimated using a probability-weighted approach based on historical experience, known trends, and current factors including market conditions and status of negotiations.
63
When there is more than one performance obligation, the transaction price is allocated to the performance obligations based on the relative estimated standalone selling prices. If not sold separately, estimated standalone selling prices are determined considering various factors including market and pricing trends, geography, product customization, and profit objectives. Revenue is recognized when the appropriate revenue recognition criteria for the individual performance obligations have been satisfied.
Revenue is reported net of any required taxes collected from customers and remitted to government authorities, with the collected taxes recorded as current liabilities until remitted to the relevant government authority.
Shipping and handling activities are accounted for as activities to fulfill a promise to transfer a product to a customer. As such, shipping and handling activities are not evaluated as a separate performance obligation.
For most contracts, payment is due from the customer within 30 to 90 days after the product is delivered or the service has been performed. For design and build contracts, we generally collect progress payments from the customer throughout the term of the contract, resulting in contract assets or liabilities depending on the timing of the payments. Contract assets consist of unbilled amounts when revenue recognized exceeds customer billings. Contract liabilities consist of advance payments and billings in excess of revenue recognized.
Design and engineering costs for highly complex products to be sold under a long-term production-type contract are capitalized and amortized in a manner consistent with revenue recognition of the related contract or anticipated contract. Other design and development costs are capitalized only if there is a contractual guarantee for reimbursement. Costs to obtain a contract (e.g., commissions) for contracts greater than one year are capitalized and amortized in a manner consistent with revenue recognition of the related contract.
Product Warranties
Our standard product warranty terms generally include post-sales support and repairs or replacement of a product at no additional charge for a specified period of time. Accruals for estimated expenses related to product warranties are made at the time revenue is recognized and are recorded as a component of costs of revenue. We estimate the liability for warranty claims based on our standard warranties, the historical frequency of claims and the cost to replace or repair our products under warranty. Factors that influence our warranty liability include the number of units sold, the length of warranty term, historical and anticipated rates of warranty claims and the cost per claim.
Postretirement Benefit Plans
ITT sponsors numerous pension and other employee-related defined benefit plans (collectively, postretirement benefit plans). Substantially all of our U.S. postretirement benefit plans are closed to new participants. Postretirement benefit obligations are generally determined, where applicable, based on participant years of service, future compensation, age at retirement or termination, and the assumed rate of future healthcare cost increases. The determination of projected benefit obligations and the recognition of expenses related to postretirement benefit plans are dependent on various assumptions that are judgmental. The assumptions involved in the measurement of our postretirement benefit plan obligations and net periodic postretirement costs primarily relate to discount rates, mortality and termination rates, and other factors. Management develops each assumption using relevant Company experience in conjunction with market-related data for each individual country in which such plans exist. Actual results that differ from our assumptions are accumulated and are amortized over the estimated future working life, or remaining lifetime, of the plan participants depending on the nature of the retirement plan.
The funded status of all plans is recorded on our balance sheet. Actuarial gains and losses and prior service costs or credits that have not yet been recognized through net income are recorded in accumulated other comprehensive income within shareholders’ equity, net of taxes, until they are amortized as a component of net periodic postretirement cost.
Research & Development
Research and development activities are charged to expense as incurred. R&D as a percentage of sales was 2.8%, 3.2%, and 3.1% during 2025, 2024 and 2023, respectively.
Income Taxes
We determine the provision for income taxes using the asset and liability approach. Under this approach, deferred income tax assets and liabilities are determined based on the estimated future tax effects of differences between the financial reporting and tax bases of assets and liabilities, applying currently enacted tax rates in effect for the year in which we expect the differences will reverse. The ultimate realization of deferred tax assets is dependent on the generation of future taxable income (including the reversals of deferred tax liabilities) during the periods in which those deferred tax assets will become deductible.
64
We record a valuation allowance against our deferred tax assets when it is more likely than not that all or a portion of the deferred tax assets will not be realized. In assessing the need for a valuation allowance, the Company considers all available positive and negative evidence regarding the realizability of its deferred tax assets, including the future reversal of existing taxable temporary differences, taxable income in carryback periods, prudent and feasible tax planning strategies, estimated future taxable income, and whether we have a recent history of losses. The valuation allowance can be affected by changes to tax regulations, interpretations and rulings, changes to enacted statutory tax rates, and changes to future taxable income estimates.
We have not provided deferred tax liabilities for the impact of U.S. income taxes on book over tax basis which we consider indefinitely reinvested outside the U.S. We plan foreign earnings remittance amounts based on projected cash flow needs, as well as the working capital and long-term investment requirements of foreign subsidiaries and our domestic operations.
Furthermore, we recognize the tax benefit from an uncertain tax position only if it is more likely than not that the tax position will be sustained on examination by the taxing authorities, based on the technical merits of the position in consideration of applicable tax statutes and related interpretations and precedents and the expected outcome of the proceedings (or negotiations) with the taxing authorities. Tax benefits recognized in the financial statements from such a position are measured based on the largest benefit that has a greater than 50% likelihood of being realized on ultimate settlement.
The Company has elected to account for Global Intangible Low Taxed Income as a current period expense when incurred. See Note 6, Income Taxes, for additional information.
Earnings Per Share
Basic earnings per common share considers the weighted average number of common shares outstanding. Diluted earnings per share considers the outstanding shares utilized in the basic earnings per share calculation as well as the dilutive effect of outstanding stock options and restricted stock that do not contain rights to nonforfeitable dividends. Diluted shares outstanding include the dilutive effect of in-the-money options, unvested restricted stock units and unvested performance stock units. The dilutive effect of such equity awards is calculated based on the average share price for each reporting period using the treasury stock method. Common stock equivalents are excluded from the computation of earnings per share if they have an anti-dilutive effect. See Note 7, Earnings Per Share Data, for additional information.
Cash and Cash Equivalents
ITT considers all highly liquid investments purchased with an original maturity or remaining maturity at the time of purchase of three months or less to be cash equivalents. Cash equivalents primarily include fixed-maturity time deposits and money market investments. Restricted cash was $0.8 as of December 31, 2025 and $0.7 December 31, 2024. Restricted cash is presented within Other current assets and Other non-current assets in our Consolidated Balance Sheets.
Concentrations of Credit Risk
Financial instruments that potentially subject ITT to significant concentrations of credit risk consist principally of cash and cash equivalents, accounts and notes receivables from trade customers, investments, and derivative financial instruments. We maintain cash and cash equivalents with various financial institutions located in different geographical regions, and our policy is designed to limit exposure to any individual counterparty. Derivative financial instruments are transacted with multiple highly reputable financial institutions. As part of our risk management processes, we perform periodic evaluations of the relative credit standing of the financial institutions with which we transact. We have not sustained any material credit losses during the previous three years with respect to financial instruments held at financial institutions.
Credit risk with respect to accounts receivable is generally diversified due to the large number of entities comprising ITT’s customer base and their dispersion across many different industries and geographic regions. However, our largest customer represented approximately 8% and 7% of the total outstanding trade accounts receivable balance as of December 31, 2025 and December 31, 2024, respectively. Occasionally, we enter into notes receivables with certain of our customers. These notes receivables have maturities of six to 12 months and are guaranteed by reputable banks. ITT performs ongoing credit evaluations of the financial condition of its third-party distributors, resellers and other customers and requires collateral, such as letters of credit and bank guarantees, in certain circumstances.
Allowance for Credit Losses
We determine our allowance for credit losses using a combination of factors to reduce our trade receivables and contract asset balances to the net amount expected to be collected. The allowance is based on a variety of factors
65
including the length of time receivables are past due, macroeconomic trends and conditions, significant one-time events, historical experience, and expectations of future economic conditions. We also record an allowance for individual accounts when we become aware of specific customer circumstances, such as in the case of bankruptcy filings or deterioration in the customer’s operating results or financial position. The past due or delinquency status of a receivable is based on the contractual payment terms of the receivable. If circumstances related to the specific customer change, we adjust estimates of the recoverability of receivables as appropriate.
Inventories
Inventories, which include the costs of material, labor and overhead, are stated at the lower of cost or net realizable value. Cost is generally computed using the standard cost method, which approximates actual cost on a first-in, first-out (FIFO) basis. Variances between standard and actual costs are charged to cost of sales or capitalized to inventory. Estimated losses from obsolete and slow-moving inventories are recorded to reduce inventory values to their estimated net realizable value and are charged to cost of sales. At the point of loss recognition, a new cost basis for that inventory is established and subsequent changes in facts and circumstances do not result in a recovery in carrying value.
Plant, Property and Equipment
Plant, property and equipment, including capitalized interest applicable to major project expenditures, are recorded at cost. Depreciation is computed on a straight-line basis over the estimated useful lives of the assets. Leasehold improvements are depreciated over the life of the lease or the asset, whichever is shorter. Fully depreciated assets are retained in property and accumulated depreciation accounts until disposal. Repairs and maintenance costs are expensed as incurred. See Note 11, Plant, Property and Equipment, Net, for additional information.
Leases
The Company enters into leases for the use of premises and equipment, primarily classified as operating leases. Operating lease costs are recognized as an operating expense over the lease term on a straight-line basis. For leases with terms greater than 12 months, we record a right-of-use asset and lease liability equal to the present value of the lease payments. In determining the discount rate used to measure the right-of-use asset and lease liability, we utilize the Company’s incremental borrowing rate and consider the term of the lease, as well as the geographic location of the leased asset.
Where options to renew a lease are available, they are included in the lease term and capitalized on the balance sheet to the extent there would be a significant economic penalty not to elect the option. Certain real estate leases are subject to periodic changes in an index or market rate. Although lease liabilities are not remeasured as a result of changes to an index or rate, these changes are treated as variable lease payments and recognized in the period in which the obligation for those payments is incurred. Variable lease expense also includes property tax and property insurance costs. See Note 14, Leases, for additional information.
Capitalized Internal Use Software
Costs incurred in the preliminary project stage of developing or acquiring internal use software are expensed as incurred. After the preliminary project stage is completed, management has approved the project and it is probable that the project will be completed and the software will be used for its intended purpose, ITT capitalizes certain internal and external costs incurred to acquire or create internal use software, principally related to software coding, designing system interfaces and installation and testing of the software. ITT amortizes capitalized internal use software costs using the straight-line method over the estimated useful life of the software, generally from 3 to 7 years.
Investments
Investments in fixed-maturity time deposits having an original maturity exceeding three months at the time of purchase, referred to as short-term time deposits, are classified as held-to-maturity and are recorded at amortized cost, which approximates fair value. There were no short-term time deposits held as of December 31, 2025 and December 31, 2024.
Investments in entities where we have the ability to exercise significant influence, but do not control, are accounted for under the equity method of accounting and are included in Other noncurrent assets in our Consolidated Balance Sheets. Significant influence typically exists if we have a 20% to 50% ownership interest in the investee. Under this method of accounting, our share of the net earnings or losses of the investee is included in non-operating profit in Other non-operating income, net in our Consolidated Statements of Operations. We evaluate our equity method investments for impairment whenever events or changes in circumstances indicate that the
66
carrying amounts of such investments may be impaired. If a decline in the value of an equity method investment is determined to be other than temporary, a loss is recorded in earnings in the current period.
Investments in entities for which we do not have significant operating influence (we generally hold a less than 20% ownership stake in these entities) are initially recorded at the purchase price. For investments in entities with readily determinable fair values (e.g., publicly traded), the investment is measured at fair value each subsequent reporting period. For investments in entities without a readily determinable fair value, we have made an accounting policy election to measure the investment at cost, adjusted for any impairments and/or observable price changes. In both cases, these investments are included in Other noncurrent assets in our Consolidated Balance Sheets, with any gains or losses and dividends received recognized in Other non-operating income, net in our Consolidated Statements of Operations.
Investments in corporate-owned life insurance (COLI) policies are recorded at their cash surrender values as of the balance sheet date. The Company’s investments in COLI policies are included in other non-current assets in our Consolidated Balance Sheets and were $142.0 and $135.1 at December 31, 2025 and 2024, respectively. Changes in the cash surrender value during the period generally reflect gains or losses in the fair value of assets, premium payments, and policy redemptions. Gains from COLI investments of $6.1, $4.6, and $4.2 were recorded within General and administrative expenses in our Consolidated Statements of Operations during years ended December 31, 2025, 2024 and 2023, respectively. Cash receipts from COLI policies were $0.0, $0.3, and $0.0 during 2025, 2024, and 2023, respectively, and are recognized in investing activities in our Consolidated Statements of Cash Flows.
Long-Lived Asset Impairment
Long-lived assets, including intangible assets with finite lives and capitalized internal use software, are tested for impairment whenever events or changes in circumstances indicate their carrying value may not be recoverable. We assess the recoverability of long-lived assets based on the undiscounted future cash flow the assets are expected to generate and recognize an impairment loss when estimated undiscounted future cash flows expected to result from the use of the asset plus net proceeds expected from disposition of the asset, if any, are less than the carrying value of the asset. When an impairment is identified, we reduce the carrying amount of the asset to its estimated fair value based on a discounted cash flow approach or, when available and appropriate, to comparable market values.
Goodwill and Intangible Assets
Goodwill represents purchase consideration paid in a business combination that exceeds the values assigned to the net assets of the acquired business. Intangible assets include customer relationships, proprietary technology, trademarks, patents and other intangible assets. Intangible assets with a finite life are generally amortized on a straight-line basis over an estimated economic useful life, which generally ranges from 7-20 years, and are tested for impairment if indicators of impairment are identified. Certain of our intangible assets have an indefinite life, namely certain brands and trademarks.
Goodwill and indefinite-lived intangible assets are not amortized, but rather are tested for impairment annually (or more frequently if impairment indicators arise, such as changes to the reporting unit structure, significant adverse changes in the business climate or an adverse action or assessment by a regulator). We conduct our annual impairment testing on the first day of the fourth fiscal quarter. We may perform an initial qualitative evaluation which considers present events and circumstances, to determine the likelihood of impairment. If the likelihood of impairment is not considered to be more likely than not, then no further testing is performed. If it is considered to be more likely than not that the asset is impaired based on the qualitative evaluation or we elect not to perform a qualitative evaluation, then a quantitative impairment test is performed. In the quantitative impairment test, the fair value of each reporting unit is compared to its carrying amount. If the fair value of a reporting unit exceeds its carrying value, there is no impairment. If the carrying value of the reporting unit exceeds its estimated fair value, then we record an impairment loss equal to the difference. For indefinite-lived intangibles, if it is considered to be more likely than not that the asset is impaired, we compare the fair value of those assets to their carrying value. We recognize an impairment loss when the estimated fair value of the indefinite-lived intangible asset is less than its carrying value.
We estimate the fair value of our reporting units using an income approach. Under the income approach, we estimate fair value based on the present value of estimated future cash flows. We estimate the fair value of our indefinite-lived intangible assets using the relief from royalty method. The relief from royalty method estimates the portion of a company’s earnings attributable to an intellectual property asset based on an assumed royalty rate that the company would have paid had the asset not been owned. See Note 12, Goodwill and Other Intangible Assets, Net, for additional information.
67
Business Combinations
We allocate the purchase price of acquisitions to the tangible and intangible assets acquired, liabilities assumed, and non-controlling interests in the acquiree based on their estimated fair value at the acquisition date. Changes to acquisition date fair values prior to the expiration of the measurement period, a period not to exceed 12 months from date of acquisition, are recorded as an adjustment to the associated goodwill in the reporting period in which the adjustment amounts are determined. Changes to acquisition date fair values after expiration of the measurement period are recorded in earnings. The excess of the acquisition price over those estimated fair values is recorded as goodwill. Acquisition-related expenses are expensed as incurred and the costs associated with restructuring actions initiated after the acquisition are recognized separately from the business combination. See Note 22, Acquisitions, Investments, and Divestitures, for additional information.
Commitments and Contingencies
We record accruals for commitments and loss contingencies when it is probable that a liability has been incurred and the amount of loss can be reasonably estimated. Significant judgment is required to determine both probability and the estimated amount of loss, and these assessments can involve a series of complex judgments about future events and may rely on estimates and assumptions that have been deemed reasonable by management. We review these accruals quarterly and adjust the accruals to reflect the impact of negotiations, settlements, rulings, advice of legal counsel, and other current information. See Note 19, Commitments and Contingencies, for additional information.
Environmental-Related Liabilities and Assets
Accruals for environmental matters are recorded on a site-by-site basis when it is probable that a liability has been incurred and the amount of the liability can be reasonably estimated, based on current law and existing technologies. Our estimated liability is reduced to reflect the participation of other potentially responsible parties in those instances where it is probable that such parties are legally responsible and financially capable of paying their respective shares of the relevant costs, and that share can be reasonably estimated. Environmental liabilities are primarily included in other non-current liabilities at undiscounted amounts.
The Company records an asset related to its environmental insurance and other expected third party recoveries. The environmental-related asset represents our best estimate of probable recoveries from third parties for costs incurred in past periods, as well as costs estimated to be incurred in future periods.
Environmental costs and related recoveries are recorded within General and administrative expenses in our Consolidated Statements of Operations, other than those related to discontinued operations. See Note 19, Commitments and Contingencies, for additional information.
Government Incentives
The Company operates manufacturing, engineering, and distribution facilities in multiple jurisdictions and may receive government incentives from federal, state, local, and foreign authorities. These government incentives support capital investment, manufacturing, research and development, employment, and environmental initiatives. In the absence of specific U.S. GAAP guidance, the Company applies a policy by analogy to International Accounting Standard 20, Accounting for Government Grants and Disclosure of Government Assistance (IAS 20) and recognizes government incentives when there is reasonable assurance that we will comply with all the conditions of the government incentive and the government incentive will be received.
Government incentives may favorably impact the Company’s results of operations, cash flows, and financial position depending on the nature and timing of the programs. Government incentives related to capital expenditures are recorded as a reduction of the related Plant, Property and Equipment, Net of the Consolidated Balance Sheets and recognized as a reduction of depreciation expense over the asset’s useful life, while government incentives related to research and development activities are recognized as a reduction of research and development expense within the Consolidated Statements of Operations. Cash receipts are classified based on the nature of the government incentives, with government incentives related to capital investments presented as investing activities and government incentives related to research and development costs presented as operating activities within the Consolidated Statement of Cash Flows.
Foreign Currency
The national currencies of our foreign subsidiaries are generally the functional currencies. Balance Sheet accounts are translated at the exchange rate in effect at the end of each period, except for equity which is translated at historical rates; Statement of Operations accounts are translated at the average rates of exchange prevailing during the period. Gains and losses resulting from foreign currency translation are reflected in the cumulative translation adjustments component of shareholders’ equity.
68
For foreign subsidiaries that do not use the local currency as their functional currency, foreign currency assets and liabilities are remeasured to the foreign subsidiary’s functional currency using end of period exchange rates, except for nonmonetary balance sheet accounts, which are remeasured at historical exchange rates.
For transactions denominated in other than the functional currency, revenue and expenses are remeasured at average exchange rates in effect during the reporting period in which the transactions occurred, except for expenses related to nonmonetary assets and liabilities. Transaction gains or losses from foreign currency remeasurement are reported in General and administrative expenses in our Consolidated Statements of Operations. During the years ended December 31, 2025, 2024, and 2023, we recognized transaction losses of $9.7, $2.8 and $7.0, respectively.
Derivative Financial Instruments
From time to time, the Company may use derivative financial instruments, primarily foreign currency forward and option contracts, to mitigate exposure from foreign currency exchange rate fluctuations as it pertains to receipts from customers, payments to suppliers and intercompany transactions; as well as from commodity price fluctuations. We record derivatives at their fair value as either an asset or liability. For derivatives not designated as hedges, adjustments to reflect changes in the fair value of our derivatives are included in earnings. For cash flow hedges that qualify and are designated for hedge accounting, the effective portion of the change in fair value of the derivative is recorded in accumulated other comprehensive loss and subsequently recognized in earnings when the hedged transaction affects earnings. Any ineffective portion is recognized immediately in earnings. As of December 31, 2025 and 2024, no derivatives were designated as hedges. The differentials paid or received on interest rate swap agreements are recognized as adjustments to interest expense. Derivative contracts involve the risk of non-performance by the counterparty. The fair value of our foreign currency contracts is determined using the net position of the contracts and the applicable spot rates and forward rates as of the reporting date. See Note 21, Derivative Financial Instruments, for additional information.
Related Parties
Under Accounting Standards Codification (ASC) Topic 850, Related Party Disclosures, related party transactions include those between: (a) a parent entity and its subsidiaries; (b) subsidiaries of a common parent; (c) an entity and trusts for the benefit of employees, such as pension and profit-sharing trusts that are managed by or under the trusteeship of the entity’s management; (d) an entity and its principal owners, management, or members of their immediate families; and (e) affiliates. There were no material related party transactions during 2025, 2024 or 2023.
NOTE 2
RECENT ACCOUNTING PRONOUNCEMENTS
From time to time, the Financial Accounting Standards Board (“FASB”) or other standards setting bodies issue new accounting pronouncements. Updates to the FASB's accounting standards are communicated through issuance of an Accounting Standards Update (“ASU”). The Company considers the applicability and impact of all ASUs on our business and financial results.
Recently adopted accounting pronouncements
In December 2023, the FASB issued ASU No. 2023-09, Income Taxes (Topic 740): Improvements to Income Tax Disclosures. This ASU requires disclosure of specific categories in the rate reconciliation and additional information for reconciling items that meet a quantitative threshold. The amendment also includes other changes to improve the effectiveness of income tax disclosures, including further disaggregation of income taxes paid for individually significant jurisdictions. We adopted this guidance prospectively for the year ending December 31, 2025. See Note 6, Income Taxes, for more information.
Recently issued accounting pronouncements not yet adopted
In December 2025, the FASB issued ASU 2025‑10, Government Grants (Topic 832): Accounting for Government Grants Received by Business Entities. This ASU establishes comprehensive guidance on the recognition, measurement, and presentation of monetary and tangible nonmonetary government grants received by business entities. The standard excludes certain arrangements from its scope, such as income tax credits, government guarantees, below‑market loans, and transfers of intangible assets or services. This new guidance requires entities to apply a recognition and measurement model largely aligned with principles in IAS 20, while incorporating targeted improvements specific to U.S. GAAP. The standard also introduces expanded disclosure requirements, including information about the nature of government grants, significant terms and conditions, and the financial statement line items affected. ASU 2025-10 is effective for public business entities for annual periods
69
beginning after December 15, 2028, and for all other entities for annual periods beginning after December 15, 2029, with early adoption permitted. We are currently evaluating the impact of this guidance on our consolidated financial statements, however based on preliminary review, we do not expect the adoption to have a material impact on our financial position, results of operations, or cash flows. We also note that we maintain an existing accounting policy for government grants, which is included in Note 1, Description of Business and Basis of Presentation.
In November 2024, the FASB issued ASU No. 2024-03, Income Statement - Reporting Comprehensive Income-Expense disaggregation disclosures (Subtopic 220-40) Disaggregation of Income Statement Expenses. This ASU requires disclosure of specified information about certain costs and expenses in the notes to financial statements. This ASU is effective for annual periods beginning after December 15, 2026, and interim periods within fiscal years beginning after December 15, 2027. Adoption of this ASU should be applied on a prospective basis. Early adoption is permitted. We are currently evaluating the impact that this guidance will have on the disclosures within our financial statements, and expect to adopt this ASU for the year ending December 31, 2027.
During 2025, there were no other new accounting standards issued, or that are pending issuance, that are expected to have a material impact on our consolidated financial statements upon adoption.
NOTE 3
SEGMENT INFORMATION
The Company’s segments are reported on the same basis used by our chief operating decision maker (CODM) for evaluating performance and for allocating resources. The Company’s CODM is the President and Chief Executive Officer. The CODM allocates resources based on revenue and operating income primarily through the annual budget and periodic forecasting process. The CODM considers budget-to-actual variances when making decisions about allocating capital and personnel to the segments. Our three reportable segments are referred to as: Motion Technologies, Industrial Process, and Connect & Control Technologies.
Motion Technologies manufactures brake components, shock absorbers and damping technologies primarily for the global automotive and rail transportation markets.
Industrial Process manufactures engineered fluid process equipment serving a diversified mix of customers in global industries such as chemical, energy, marine, mining, and other industrial process markets and is a provider of pumps, valves, and aftermarket services and parts.
Connect & Control Technologies manufactures harsh-environment connector solutions, cable assemblies, critical energy absorption, flow control components, and composite materials for the aerospace and defense, general industrial, medical, and energy markets.
Assets of our reportable segments exclude general corporate assets, which principally consist of cash, investments, deferred taxes, and certain property, plant and equipment. These assets are included within Corporate and Other, which is described further below.
Corporate and Other consists of corporate office expenses including compensation, benefits, occupancy, depreciation, and other administrative costs, as well as charges related to certain matters, such as environmental liabilities, that are managed at a corporate level and are not included in segment results when evaluating performance or allocating resources. In addition, Corporate and Other includes the operating results associated with a subsidiary that does not constitute a reportable segment.
70
The following table presents our segment revenue and operating income for each segment and reconciles to total consolidated revenue, total segment operating income and income from continuing operations before income tax.
For the Year Ended December 31, 2025
Motion Technologies
Industrial Process
Connect & Control Technologies
Total
Revenue
$
1,428.2
$
1,496.2
$
1,017.0
$
3,941.4
Other / Eliminations
(2.9)
Consolidated revenue
$
3,938.5
Costs of revenue(a)
991.9
898.9
658.3
Selling, general and administrative expenses(a)
115.0
257.4
142.9
Research and development expenses(a)
45.4
24.8
37.6
Segment operating income
275.9
315.1
178.2
769.2
Other corporate costs
(84.7)
Interest expense
(48.1)
Interest income
10.7
Other non-operating income, net
4.4
Income from continuing operations before income tax
$
651.5
For the Year Ended December 31, 2024
Motion Technologies
Industrial Process
Connect & Control Technologies
Total
Revenue
$
1,447.8
$
1,361.0
$
825.1
$
3,633.9
Other / Eliminations
(3.2)
Consolidated revenue
$
3,630.7
Costs of revenue(a)
1,016.7
842.1
526.1
Selling, general and administrative expenses(a)
110.7
215.7
117.7
Research and development expenses(a)
54.0
24.6
34.5
Other segment expenses(b)
(48.2)
0.2
0.7
Segment operating income
314.6
278.4
146.1
739.1
Other corporate costs
(61.0)
Interest expense
(36.6)
Interest income
6.6
Other non-operating income, net
1.6
Income from continuing operations before income tax
$
649.7
71
For the Year Ended December 31, 2023
Motion Technologies
Industrial Process
Connect & Control Technologies
Total
Revenue
$
1,457.8
$
1,129.6
$
699.4
$
3,286.8
Other / Eliminations
(3.8)
Consolidated revenue
$
3,283.0
Costs of revenue(a)
1,053.3
676.1
447.8
Selling, general and administrative expenses(a)
122.4
192.5
103.2
Research and development expenses(a)
51.8
15.0
32.7
Other segment expenses(b)
(0.5)
0.1
8.2
Segment operating income
230.8
245.9
107.5
584.2
Other corporate costs
(53.7)
Interest expense
(19.2)
Interest income
8.8
Other non-operating income, net
1.7
Income from continuing operations before income tax
$
521.8
(a)The significant expense categories and amounts align with segment-level information that is regularly provided to the CODM.
(b)Other segment items for each reportable segment includes (gain) loss on sale of fixed assets and (gain) loss on sale of businesses.
The following table presents our operating margin for each segment. Segment operating margin is calculated as segment operating income divided by segment revenue.
For the Year Ended December 31
2025
2024
2023
Motion Technologies
19.3
%
21.7
%
15.8
%
Industrial Process
21.1
%
20.5
%
21.8
%
Connect & Control Technologies
17.5
%
17.7
%
15.4
%
The following table presents our assets as of December 31, 2025 and 2024, as well as our capital expenditures and depreciation and amortization expense for the years ended December 31, 2025, 2024, and 2023, by segment.
Assets
Capital Expenditures
Depreciation and Amortization
2025
2024
2025
2024
2023
2025
2024
2023
Motion Technologies
$
1,257.3
$
1,186.6
$
75.0
$
75.3
$
72.0
$
59.8
$
61.5
$
64.4
Industrial Process
1,993.2
1,819.8
24.5
34.2
17.7
37.0
45.9
21.9
Connect & Control Technologies
1,332.5
1,326.8
19.9
13.1
16.1
43.3
27.5
20.3
Corporate and Other(a)
1,727.4
398.1
1.9
1.3
1.8
3.1
2.4
2.6
Total
$
6,310.4
$
4,731.3
$
121.3
$
123.9
$
107.6
$
143.2
$
137.3
$
109.2
(a) Total assets for Corporate and Other as of December 31, 2025 reflect an increase in cash and equivalents of approximately $1.3 billion resulting from the issuance of common stock intended to be utilized to finance a portion of the pending SPX FLOW acquisition. See Note 18, Capital Stock, for additional information.
72
The following table displays consolidated revenue by geographic region. Revenue is attributed to individual regions based on the destination of the product or service delivery.
For the Year Ended December 31, 2025
Motion Technologies
Industrial Process
Connect & Control Technologies
Eliminations
Total
North America(a)
$
232.3
$
720.8
$
716.9
$
(2.3)
$
1,667.7
Europe(b)
769.4
224.6
153.0
(0.5)
1,146.5
Asia(c)
407.0
217.1
107.4
(0.1)
731.4
Middle East and Africa
2.3
214.7
29.3
—
246.3
South America
17.2
119.0
10.4
—
146.6
Total
$
1,428.2
$
1,496.2
$
1,017.0
$
(2.9)
$
3,938.5
For the Year Ended December 31, 2024
North America(a)
$
256.5
$
714.6
$
539.0
$
(2.8)
$
1,507.3
Europe(b)
787.4
176.2
144.6
(0.3)
1,107.9
Asia(c)
384.7
190.6
95.2
(0.1)
670.4
Middle East and Africa
1.2
165.9
32.6
—
199.7
South America
18.0
113.7
13.7
—
145.4
Total
$
1,447.8
$
1,361.0
$
825.1
$
(3.2)
$
3,630.7
For the Year Ended December 31, 2023
North America(a)
$
265.2
$
660.9
$
441.1
$
(3.7)
$
1,363.5
Europe(b)
802.7
109.1
134.8
—
1,046.6
Asia(c)
370.1
118.5
84.1
(0.1)
572.6
Middle East and Africa
1.5
139.6
28.4
—
169.5
South America
18.3
101.5
11.0
—
130.8
Total
$
1,457.8
$
1,129.6
$
699.4
$
(3.8)
$
3,283.0
(a)Includes revenue of $1,365.3, $1,197.6, and $1,075.8 from the United States for 2025, 2024, and 2023, respectively.
(b)Includes revenue of $365.2, $385.9, and $387.8 from Germany for 2025, 2024, and 2023, respectively.
(c)Includes revenue of $465.4, $445.3, and $351.8 from China for 2025, 2024, and 2023, respectively.
The following table displays Plant, Property and Equipment (PPE), net by geographic region.
As of December 31
2025
2024
North America(a)
$
166.7
$
160.4
Europe(b)
328.7
300.6
Asia(c)
100.9
91.7
Middle East and Africa
26.7
22.4
South America
4.0
2.1
Total
$
627.0
$
577.2
(a)Includes PPE, net of $135.6 and $113.0 in the United States as of December 31, 2025 and 2024, respectively.
(b)Includes PPE, net of $171.5 and $154.8 in Italy as of December 31, 2025 and 2024, respectively.
(c)Includes PPE, net of $70.5 and $62.3 in China as of December 31, 2025 and 2024, respectively.
73
NOTE 4
REVENUE
The following table represents our revenue disaggregated by end market.
For the Year Ended December 31, 2025
Motion Technologies
Industrial Process
Connect & Control Technologies
Eliminations
Total
Auto and rail
$
1,414.0
$
—
$
—
$
—
$
1,414.0
Chemical and industrial pumps
—
955.7
—
—
955.7
Aerospace and defense
10.6
—
712.0
—
722.6
General industrial
3.6
—
251.9
(2.9)
252.6
Energy
—
540.5
53.1
—
593.6
Total
$
1,428.2
$
1,496.2
$
1,017.0
$
(2.9)
$
3,938.5
For the Year Ended December 31, 2024
Auto and rail
$
1,423.6
$
—
$
—
$
—
$
1,423.6
Chemical and industrial pumps
—
905.3
—
—
905.3
Aerospace and defense
7.9
—
511.6
—
519.5
General industrial
16.3
—
259.0
(3.2)
272.1
Energy
—
455.7
54.5
—
510.2
Total
$
1,447.8
$
1,361.0
$
825.1
$
(3.2)
$
3,630.7
For the Year Ended December 31, 2023
Auto and rail
$
1,423.7
$
—
$
—
$
(0.1)
$
1,423.6
Chemical and industrial pumps
—
893.0
—
(0.1)
892.9
Aerospace and defense
8.4
—
377.3
—
385.7
General industrial
25.7
—
270.7
(3.6)
292.8
Energy
—
236.6
51.4
—
288.0
Total
$
1,457.8
$
1,129.6
$
699.4
$
(3.8)
$
3,283.0
Revenue recognized related to our Industrial Process segment primarily consists of pumps, valves and plant optimization systems and related services which serve the general industrial, energy, chemical and petrochemical, pharmaceutical, mining, pulp and paper, food and beverage, and power generation markets. Many of Industrial Process’s products are highly engineered and customized to our customer needs and therefore do not have an alternative use. For these longer term design and build projects, if the contract states that we also have an enforceable right to payment, we recognize revenue over time using the cost-to-cost method as we satisfy the performance obligations identified in the contract. If no right to payment exists, revenue is recognized at a point in time, generally based on shipping terms. A majority of our design and build project contracts currently do not have a right to payment. For pumps that do have an alternative use to us, revenue is recognized at a point in time. Revenue on service and repair contracts represents less than 4% of consolidated ITT revenue in 2025 and less than 5% in both 2024 and 2023 and is recognized after the services have been rendered or over the service contract period.
Our Motion Technologies segment manufactures brake pads, shock absorbers, and energy absorption components primarily for the transportation industry. Our Connect & Control Technologies segment designs and manufactures a range of highly engineered connectors, cable assemblies and specialized control components for critical applications supporting various markets including aerospace and defense, industrial, transportation, medical, and energy. In both of these segments, most products have an alternative use. Therefore, revenue for those products is recognized at a point in time when control passes to the customer.
74
Contract Assets and Liabilities
Contract assets consist of unbilled amounts where revenue recognized exceeds customer billings. Contract liabilities consist of advance payments and billings in excess of revenue recognized. The following table represents our net contract assets and liabilities.
As of December 31
2025
2024
Current contract assets
$
50.9
$
34.4
Noncurrent contract assets
2.6
1.9
Current contract liabilities
(175.7)
(119.3)
Noncurrent contract liabilities
(4.7)
(4.4)
Our net contract liability increased $39.5 during 2025, primarily due to timing of cash receipts relative to project performance within our IP segment. During 2025, we recognized revenue of $84.2 related to contract liabilities at December 31, 2024.
The aggregate amount of the transaction price allocated to unsatisfied or partially satisfied performance obligations, or backlog, was $1,876.4 as of December 31, 2025. Of this amount, we expect to recognize approximately 80% to 85% of revenue during 2026 and the remainder thereafter. Our backlog generally represents firm orders that have been received, acknowledged, and entered into our production systems. However, within certain businesses in MT, our customers include automotive OEMs and we may win an award on an automotive platform several years in advance based on estimated levels of future automotive production. These awards allow for the customer to adjust their production levels at any time and therefore are not considered firm orders. Within these businesses we believe orders are firm upon receipt of the customer purchase order, which may require us to fulfill the order in as little as one week. As such, our backlog at any point in time for these businesses is not believed to be significant and therefore has been excluded from the total backlog amount.
As of December 31, 2025 and 2024, deferred contract costs, net were $3.0 and $3.2, respectively, primarily related to pre-contract costs.
NOTE 5
RESTRUCTURING ACTIONS
From time to time, we initiate restructuring actions to optimize our cost structure, improve operational efficiencies, align our workforce with strategic business initiatives, or integrate acquired businesses. For the years ended December 31, 2025, 2024, and 2023, none of our restructuring activities were considered individually significant. Restructuring costs are recorded within General and administrative expenses in our Consolidated Statements of Operations.
The following table summarizes our restructuring costs by component and by segment.
For the Year Ended December 31
2025
2024
2023
By component:
Severance and other employee-related costs
$
21.2
$
8.1
$
8.0
Asset write-offs
0.1
—
1.8
Other
—
—
0.1
Total restructuring costs
$
21.3
$
8.1
$
9.9
By segment:
Motion Technologies
$
9.4
$
2.7
$
4.0
Industrial Process
8.2
3.0
4.6
Connect & Control Technologies
3.7
2.4
1.3
Total restructuring costs
$
21.3
$
8.1
$
9.9
75
The following table displays a rollforward of our total restructuring liability, which is included within Accrued and other current liabilities in our Consolidated Balance Sheets.
2025
2024
Restructuring liability as of January 1
$
2.9
$
4.8
Restructuring costs
21.3
8.1
Cash payments
(20.6)
(10.0)
Asset write-offs
(0.1)
—
Foreign exchange translation and other
0.2
—
Restructuring liability as of December 31
$
3.7
$
2.9
By accrual type:
Severance and other employee-related
$
3.7
$
2.9
NOTE 6
INCOME TAXES
The following table displays information regarding income tax expense (benefit) from continuing operations.
For the Year Ended December 31
2025
2024
2023
Income (loss) components:
United States
$
276.2
$
266.3
$
166.9
International
375.3
383.4
354.9
Income from continuing operations before income tax
651.5
649.7
521.8
Income tax expense (benefit) components:
Current income tax expense (benefit):
United States – federal
40.7
46.2
41.9
United States – state and local
2.4
6.0
5.5
International
112.4
94.7
85.6
Total current income tax expense
155.5
146.9
133.0
Deferred income tax expense (benefit) components:
United States – federal
4.1
(6.4)
(14.1)
United States – state and local
1.5
(4.5)
(2.7)
International
(1.0)
(9.7)
(10.8)
Total deferred income tax expense (benefit)
4.6
(20.6)
(27.6)
Income tax expense
$
160.1
$
126.3
$
105.4
Effective income tax rate
24.6
%
19.4
%
20.2
%
76
The following table includes a reconciliation of the U.S. statutory tax rate to our effective income tax rate related to income from continuing operations. The disclosures below reflect the requirements of ASU 2023-09 and are presented prospectively. Prior-year disclosures are presented under previous guidance and are not comparable.
For the Year Ended December 31, 2025
Amount
Percentage
U.S federal statutory tax rate
$
136.8
21.0
%
State and local income taxes, net of federal income tax effect
3.8
0.6
%
Foreign tax effects
Luxembourg
7.7
1.2
%
Italy
6.4
1.0
%
China
5.6
0.9
%
Netherlands
3.6
0.5
%
Chile
3.0
0.5
%
Mexico
3.0
0.4
%
Other foreign jurisdictions
8.8
1.4
%
Effect of cross-border tax laws
Global intangible low taxed income (“GILTI”)
36.8
5.6
%
Foreign derived intangible income (“FDII”)
(8.7)
(1.3)
%
Loss from disregarded entity
(7.1)
(1.1)
%
Foreign exchange gain/(loss) on foreign remittances
(6.0)
(0.9)
%
Subpart F
4.4
0.7
%
Other
5.0
0.8
%
Tax credits
Foreign tax credit - GILTI basket
(26.1)
(4.0)
%
Foreign tax credit - general basket
(13.4)
(2.1)
%
Foreign tax credit - foreign branch basket
(7.2)
(1.1)
%
Research and development credit
(2.0)
(0.3)
%
Foreign tax credit - passive basket
(0.3)
—
%
Changes in valuation allowances
(0.4)
(0.1)
%
Nontaxable or nondeductible items
(0.5)
(0.1)
%
Changes in unrecognized tax benefits
3.6
0.5
%
Other adjustments
Other
3.3
0.5
%
Effective tax rate
$
160.1
24.6
%
77
The following table includes a reconciliation of the U.S. statutory tax rate to our effective income tax rate related
to income from continuing operations.
For the Year Ended December 31
2024
2023
Tax provision at U.S. statutory rate
21.0
%
21.0
%
State and local income tax
1.1
%
0.9
%
U.S. tax on foreign earnings
0.9
%
1.3
%
Italy patent box
(0.8)
%
(1.1)
%
Foreign-Derived Intangible Income ("FDII")
(1.3)
%
(1.2)
%
Excess tax benefits on stock-based compensation
(0.3)
%
(0.2)
%
Audit settlements and unrecognized tax benefits
0.2
%
2.7
%
Valuation allowance on deferred tax assets
(1.0)
%
(3.1)
%
Tax on undistributed foreign earnings
(0.9)
%
0.3
%
Wolverine divestiture
(1.6)
%
—
%
Foreign tax rate differential
2.1
%
1.6
%
Amended tax return
—
%
(1.0)
%
Other adjustments
—
%
(1.0)
%
Effective income tax rate
19.4
%
20.2
%
The higher effective tax rate in 2025 compared to 2024 primarily resulted from the jurisdictional mix of earnings. The year over year increase in the effective rate was driven in part by losses generated in entities subject to a valuation allowance. In addition, the company recorded a $4.9 tax expense of U.S. tax on foreign earnings in 2025. The lower rate in 2024 was also due to the company recording a benefit of $6.7 from valuation allowance reversals on U.S. state deferred tax assets and a $5.7 tax benefit of U.S. tax on foreign earnings in 2024.
The Company provides for deferred taxes on the undistributed earnings and profits of all foreign subsidiaries, determined under U.S. tax law. At December 31, 2025, the amount of undistributed earnings and profits of all foreign subsidiaries was $1,091.0. The Company anticipates that these foreign earnings and future earnings of its foreign subsidiaries that are not indefinitely reinvested will be sufficient to meet its U.S. cash needs. The Company is indefinitely reinvested in any excess of financial reporting over tax basis in its foreign subsidiaries that exceeds undistributed earnings and profits. At December 31, 2025, the indefinitely reinvested excess of financial reporting over tax basis was $226.6.
The following table includes the items comprising our deferred tax assets and liabilities.
As of December 31
2025
2024
Deferred Tax Assets:
Loss carryforwards
$
119.1
$
114.4
Inventory
27.4
23.7
Accruals
37.3
30.5
Employee benefits
34.1
30.9
Research and expenditures capitalization
11.0
22.4
Credit carryforwards
18.9
13.7
Other
34.2
32.3
Gross deferred tax assets
282.0
267.9
Less: Valuation allowance
96.9
90.3
Net deferred tax assets
$
185.1
$
177.6
Deferred Tax Liabilities:
Intangibles
$
(94.6)
$
(96.9)
Undistributed earnings
(51.7)
(32.4)
Accelerated depreciation
(25.4)
(26.3)
Total deferred tax liabilities
$
(171.7)
$
(155.6)
Net deferred tax assets
$
13.4
$
22.0
78
Deferred taxes included in our Consolidated Balance Sheets were as follows:
As of December 31
2025
2024
Other non-current assets
$
82.4
$
74.4
Other non-current liabilities
(69.0)
(52.4)
Net deferred tax assets
$
13.4
$
22.0
The table below provides a rollforward of our valuation allowance on net deferred tax assets (DTA).
Federal
State
Foreign
Total
DTA valuation allowance as of December 31, 2022
$
—
$
39.5
$
62.9
$
102.4
Change in assessment
—
(23.1)
(16.4)
(39.5)
Current year operations
—
(0.8)
11.2
10.4
DTA valuation allowance as of December 31, 2023
$
—
$
15.6
$
57.7
$
73.3
Change in assessment
—
(8.3)
—
(8.3)
Current year operations
29.1
(0.2)
(3.6)
25.3
DTA valuation allowance as of December 31, 2024
$
29.1
$
7.1
$
54.1
$
90.3
Change in assessment
—
—
0.1
0.1
Current year operations
(0.6)
(1.3)
8.4
6.5
DTA valuation allowance as of December 31, 2025
$
28.5
$
5.8
$
62.6
$
96.9
The Company continues to maintain a valuation allowance against certain deferred tax assets attributable to a U.S. federal capital loss carryforward, U.S. state net operating losses and tax credits, and certain foreign net deferred tax assets primarily in Luxembourg, Germany, and the U.K. which are not expected to be realized. Management assesses the available positive and negative evidence to estimate whether sufficient future taxable income will be generated to permit the use of deferred tax assets. The cumulative loss incurred over the three-year period ending December 31, 2025 constitutes significant objective negative evidence, resulting in the recognition of a valuation allowance against the net deferred tax assets for these jurisdictions. Such objective negative evidence limits our ability to consider subjective positive evidence, such as our projections of future taxable income. The amount of the deferred tax asset considered realizable, however, could be adjusted if estimates of future taxable income change or if objective negative evidence in the form of cumulative losses is no longer present and additional weight can be given to subjective evidence.
We have the following tax attributes available for utilization at December 31, 2025:
Attribute
Amount
First Year of Expiration
U.S. federal capital losses
$
135.9
12/31/2029
U.S. federal net operating losses
34.6
12/31/2026
U.S. state net operating losses
232.1
12/31/2026
U.S. federal tax credits
18.4
12/31/2030
U.S. state tax credits
0.5
12/31/2028
Foreign net operating losses(a)
287.4
12/31/2026
(a)Includes approximately $234.4 of net operating loss carryforwards in Luxembourg as of December 31, 2025.
The excess tax benefits related to stock-based compensation of $1.9, $1.8 and $0.9 for 2025, 2024 and 2023, respectively, were recorded as an income tax benefit in the statement of operations and have been reflected in the caption “Excess tax benefits on stock-based compensation” within the effective tax rate reconciliation table.
79
Uncertain Tax Positions
We recognize income tax benefits from uncertain tax positions only if, based on the technical merits of the position, it is more likely than not that the tax position will be sustained on examination by the taxing authorities. The tax benefits recognized in the Consolidated Financial Statements from such positions are measured based on the largest benefit that has a greater than 50% likelihood of being realized upon ultimate settlement.
The following table displays a rollforward of our unrecognized tax benefits.
For the Year Ended December 31
2025
2024
2023
Unrecognized tax benefits – January 1
$
6.4
$
5.7
$
6.7
Additions for:
Current year tax positions
1.9
1.8
1.4
Prior year tax positions
2.7
0.1
0.5
Reductions for:
Prior year tax positions
—
(0.6)
Expiration of statute of limitations
(1.5)
(1.2)
(2.3)
Settlements
—
—
—
Unrecognized tax benefits – December 31
$
9.5
$
6.4
$
5.7
As of December 31, 2025, $9.5 of the unrecognized tax benefits would impact the effective tax rate for continuing operations, if realized. The Company operates in various tax jurisdictions and is subject to examination by tax authorities in these jurisdictions. The Company is currently under examination in several jurisdictions including Czechia, Germany, India, Italy, Mexico, and the U.S.
The calculation of our tax liability for unrecognized tax benefits includes dealing with uncertainties in the application of complex tax laws and regulations in various tax jurisdictions. Due to the complexity of some uncertainties, the ultimate resolution may result in a payment that is materially different from our current estimate of the unrecognized tax benefit. Over the next 12 months, the net amount of the tax liability for unrecognized tax benefits in foreign and domestic jurisdictions is not expected to change by a significant amount.
The following table summarizes the earliest open tax years by major jurisdiction as of December 31, 2025:
Jurisdiction
Earliest Open Year
China
2020
Czechia
2015
Denmark
2020
Germany
2018
Hong Kong
2020
India
2014
Italy
2017
Japan
2022
Korea
2023
Luxembourg
2018
Mexico
2017
Singapore
2020
United States
2022
We classify interest relating to tax matters as a component of interest expense and tax penalties as a component of income tax expense in our Consolidated Statements of Operations. During 2025, 2024, and 2023 we recognized a net interest expense of $2.1, $0.2, and $0.1, respectively, related to tax matters.
80
The following table displays the cash paid for income taxes, net of refunds by jurisdiction for the year ended December 31, 2025:
For the year ended December 31
2025
United States - Federal
$
33.7
United States - State and local
7.8
Foreign:
Italy
22.2
China
14.4
Denmark
9.4
Korea
8.6
Germany
7.0
Saudi Arabia
6.6
Czechia
6.2
Other foreign jurisdiction
$
35.7
Total cash paid for income taxes, net of refunds received
$
151.6
Cash paid for income taxes, net of refunds, totaled $128.6 and $113.1 for the years ended December 31, 2024 and 2023, respectively. Disclosure of cash paid for income taxes by jurisdiction is not required for 2024 and 2023.
NOTE 7
EARNINGS PER SHARE DATA
The following table provides a reconciliation of basic to diluted common shares outstanding, used in the computation of basic and diluted earnings per share presented in our Consolidated Statements of Operations.
For the Year Ended December 31
2025
2024
2023
Basic weighted average common shares outstanding
79.4
81.8
82.3
Add: Dilutive impact of outstanding equity awards
0.5
0.5
0.4
Diluted weighted average common shares outstanding
79.9
82.3
82.7
There were no anti-dilutive shares as of December 31, 2025, 2024, and 2023 to exclude from the computation of diluted earnings per share.
NOTE 8
RECEIVABLES, NET
The following table summarizes our receivables and associated allowance for credit losses.
As of December 31
2025
2024
Trade accounts receivable
$
737.7
$
672.1
Notes receivable
7.8
14.6
Other
29.1
30.5
Receivables, gross
774.6
717.2
Less: allowance for credit losses - receivables
(18.5)
(14.2)
Receivables, net
$
756.1
$
703.0
The following table displays our allowance for credit losses for receivables and contract assets.
As of December 31
2025
2024
Allowance for credit losses - receivables
$
18.5
$
14.2
Allowance for credit losses - contract assets
—
—
Total allowance for credit losses
$
18.5
$
14.2
81
The following table displays a rollforward of our total allowance for credit losses.
2025
2024
2023
Total allowance for credit losses as of January 1
$
14.2
$
14.2
$
12.2
Charges to income, net of recoveries
5.2
3.8
2.2
Write-offs
(2.2)
(3.1)
(0.9)
Foreign currency and other
1.3
(0.7)
0.7
Total allowance for credit losses as of December 31
$
18.5
$
14.2
$
14.2
NOTE 9
INVENTORIES
The following table summarizes our inventories.
As of December 31
2025
2024
Raw materials
$
411.8
$
386.9
Work in process
125.2
102.1
Finished goods
134.9
123.3
Inventories
$
671.9
$
612.3
Government Assistance (ASU 2021-10)
For the year ended December 31, 2023, we recognized a benefit of $6.3 within Costs of Revenue in our Consolidated Statements of Operations related to subsidies received to offset high energy prices at a manufacturing facility.
NOTE 10
OTHER CURRENT AND NON-CURRENT ASSETS
The following table summarizes our other current and non-current assets.
As of December 31
2025
2024
Advance payments and other prepaid expenses
$
71.5
$
53.4
Current contract assets, net
50.9
34.4
Prepaid income taxes
37.8
21.9
Other
23.2
21.5
Other current assets
$
183.4
$
131.2
Other employee benefit-related assets
$
142.3
$
135.2
Deferred income taxes
82.4
74.0
Operating lease right-of-use assets
80.4
92.2
Equity method and other investments
41.0
48.5
Environmental-related assets
9.8
7.6
Capitalized software costs
4.6
5.5
Other
24.8
21.1
Other non-current assets
$
385.3
$
384.1
82
NOTE 11
PLANT, PROPERTY AND EQUIPMENT, NET
The following table summarizes our property, plant, and equipment, net of accumulated depreciation.
As of December 31
Useful life (in years)
2025
2024
Machinery and equipment
2 - 10
$
1,433.9
$
1,263.4
Buildings and improvements
5 - 40
343.8
293.4
Furniture, fixtures and office equipment
3 - 7
86.2
73.6
Construction in progress
80.1
103.0
Land and improvements
26.7
25.1
Other
2.6
2.0
Plant, property and equipment, gross
1,973.3
1,760.5
Less: accumulated depreciation
(1,346.3)
(1,183.3)
Plant, property and equipment, net
$
627.0
$
577.2
Depreciation expense of $92.2, $88.2, and $84.2 was recognized in 2025, 2024 and 2023, respectively.
Government Assistance - Capital Grant
In 2023, a subsidiary in our MT segment entered into an incentive grant agreement with the Italian government related to the expansion of a production facility in Termoli, Italy and an upgrade of research and development capabilities in Barge, Italy. The total grant of 18.3 euros is expected to be received over the next three years beginning in 2025 and is primarily related to capital expenditures and, to a lesser extent, certain research and development activities. During the year ended December 31, 2025, we received a capital-related grant of $7.9, which was recorded as a reduction of property, plant and equipment and will be recognized as a reduction to depreciation expense over the life of the related assets.
NOTE 12
GOODWILL AND OTHER INTANGIBLE ASSETS, NET
Goodwill
The following table provides a rollforward of the carrying amount of our goodwill by segment.
Motion Technologies
Industrial Process
Connect & Control Technologies
Total
Goodwill as of December 31, 2023
$
292.3
$
403.0
$
321.0
$
1,016.3
Goodwill acquired(a)
—
215.6
244.3
459.9
Adjustments to purchase price allocations
—
—
0.6
0.6
Allocated to divestiture of business(b)
(16.0)
—
—
(16.0)
Foreign currency translation
(3.9)
(25.3)
(1.5)
(30.7)
Goodwill as of December 31, 2024
$
272.4
$
593.3
$
564.4
$
1,430.1
Goodwill acquired
—
11.1
—
11.1
Adjustments to purchase price allocations
—
—
(0.8)
(0.8)
Foreign currency translation
9.1
59.3
2.4
70.8
Goodwill as of December 31, 2025
$
281.5
$
663.7
$
566.0
$
1,511.2
(a)Goodwill acquired for our IP and CCT segments is related to our acquisitions of Svanehøj and kSARIA, respectively, representing the calculation of the excess purchase price over the net assets acquired.
(b)During 2024, we completed the sale of our Wolverine business, which was previously included within our MT segment.
Goodwill acquired represents the calculation of the excess purchase price over the net assets acquired. During the year ended December 31, 2025, the valuation of kSARIA was finalized. Refer to Note 22, Acquisitions, Investments, and Divestitures, for further information.
Other Intangible Assets, Net
The following table summarizes our other intangible assets, net of accumulated amortization.
2025
2024
As of December 31
Gross Carrying Amount
Accumulated Amortization
Net Intangibles
Gross Carrying Amount
Accumulated Amortization
Net Intangibles
Customer relationships
$
400.6
$
(117.6)
$
283.0
$
383.8
$
(92.6)
$
291.2
Proprietary technology
114.6
(32.3)
82.3
105.3
(23.8)
81.5
Trademarks and other
58.9
(54.9)
4.0
56.7
(35.1)
21.6
Total finite-lived intangibles
574.1
(204.8)
369.3
545.8
(151.5)
394.3
Indefinite-lived intangibles
63.3
—
63.3
59.8
—
59.8
Other intangible assets
$
637.4
$
(204.8)
$
432.6
$
605.6
$
(151.5)
$
454.1
The fair values of intangible assets acquired in connection with the purchase of Svanehøj and kSARIA consist of the following:
Customer relationships, proprietary technology and trademarks and other intangible assets are amortized over weighted average lives of approximately 16.4 years, 16.7 years and 2.6 years, respectively. Indefinite-lived intangibles primarily consist of brands and trademarks.
Amortization expense related to intangible assets for 2025, 2024 and 2023 was $47.3, $42.1, and $19.1, respectively. Estimated amortization expense for each of the five succeeding years and thereafter is as follows:
2026
$
29.5
2027
28.0
2028
27.2
2029
26.7
2030
26.7
Thereafter
231.2
84
NOTE 13
ACCOUNTS PAYABLE, ACCRUED LIABILITIES AND OTHER NON-CURRENT LIABILITIES
The following table summarizes our accrued liabilities and other non-current liabilities.
As of December 31
2025
2024
Compensation and other employee-related benefits
$
178.3
$
155.9
Contract liabilities and other customer-related liabilities
220.8
153.5
Accrued income taxes and other tax-related liabilities
46.4
38.5
Operating lease liabilities
24.4
22.6
Accrued warranty costs
23.5
16.7
Environmental and other legal matters
14.4
7.3
Accrued restructuring costs
3.7
2.9
Other
60.5
49.8
Accrued and other current liabilities
$
572.0
$
447.2
Deferred income taxes and other tax-related liabilities
$
82.5
$
64.8
Operating lease liabilities
60.0
73.7
Environmental liabilities
45.0
51.1
Compensation and other employee-related benefits
40.7
37.0
Other
51.1
34.1
Other non-current liabilities
$
279.3
$
260.7
Supply Chain Financing
The Company has supply chain financing ("SCF") programs in place under which participating suppliers may elect to obtain payment from an intermediary. The Company confirms the validity of invoices from participating suppliers and agrees to pay the intermediary an amount based on invoice totals. The majority of amounts payable under these programs are due within 90 to 180 days and are considered commercially reasonable. There are no assets pledged as security or other forms of guarantees provided for the committed payments.
The following table displays a rollforward of our supply chain financing obligations which is included within Accounts payable in our Consolidated Balance Sheets.
2025
2024
Confirmed obligations outstanding at the beginning of the year
$
11.3
$
19.7
Invoices confirmed in the year
78.8
67.3
Payments applied towards invoices
(78.9)
(75.7)
Foreign currency translation
0.5
—
Confirmed obligations outstanding at the end of the year
$
11.7
$
11.3
85
NOTE 14
LEASES
The Company’s lease portfolio primarily relates to real estate, which may be used for manufacturing or non-manufacturing purposes (e.g., office space), and contains lease terms generally ranging between one and 23 years. Our lease portfolio also includes vehicles and equipment. Substantially all of our leases are classified as operating leases.
Lease costs associated with fixed payments related to the Company's operating leases were $35.3, $31.4, and $30.2 for the years ended December 31, 2025, 2024 and 2023, respectively. Short-term lease costs, variable lease costs, and sublease income related to our operating leases, as well as total lease costs related to our finance leases, were not material for the years ended December 31, 2025, 2024 and 2023.
The following table displays our future lease obligations related to non-cancellable operating leases with an initial term in excess of 12 months as of December 31, 2025.
2026
$
27.3
2027
20.4
2028
14.1
2029
9.4
2030
5.4
Thereafter
18.6
Total undiscounted future operating lease obligations
95.2
Less: imputed interest
10.8
Present value of future operating lease obligations(a)
$
84.4
(a)Includes $24.4 of current operating lease liabilities recorded within Accrued and other current liabilities and $60.0 of non-current operating lease liabilities recorded within Other non-current liabilities in our Consolidated Balance Sheets.
The following table includes other supplemental information regarding our operating leases.
As of or for the Year Ended December 31
2025
2024
Operating cash outflows from operating leases(a)
$
28.6
$
26.8
Right-of-use assets obtained in exchange for new operating lease liabilities
$
10.4
$
33.9
Weighted average remaining lease term (in years)
5.7
6.1
Weighted average discount rate(b)
3.7
%
3.4
%
(a)Included within Other, net in our Consolidated Statements of Cash Flows.
(b)We use a discount rate for each lease based on an estimated incremental borrowing rate over a similar term as the lease, as the discount rate implicit in each lease cannot be readily determined.
86
NOTE 15
DEBT
The following table summarizes our outstanding debt obligations.
As of December 31
2025
2024
Commercial paper
$
258.0
$
424.5
Short-term loans
0.5
0.5
Current maturities of long-term debt
2.8
2.6
Total short-term borrowings
261.3
427.6
Non-current maturities of long-term debt
521.5
232.6
Total debt
$
782.8
$
660.2
Commercial Paper
The following table presents our outstanding commercial paper borrowings and associated weighted average interest rates.
As of or for the Year Ended December 31
2025
2024
Commercial Paper Outstanding - U.S. Program
$
—
$
424.4
Commercial Paper Outstanding - Euro Program
258.0
—
Total Commercial Paper Outstanding
$
258.0
424.4
Weighted Average Interest Rate - U.S. Program
N/A
4.80
%
Weighted Average Interest Rate - Euro Program
2.42
%
N/A
Outstanding commercial paper for both periods had maturity terms less than three months from the date of issuance.
2025 Term Loan Credit Agreement
On April 30, 2025, the Company entered into a credit agreement (as amended, the 2025 Term Loan Credit Agreement) among the Company, as borrower, certain of our subsidiaries, as guarantors, each lender from time to time party thereto, and U.S. Bank National Association, as the administrative agent. In connection with the entry into the 2025 Revolving Credit Agreement (as defined below), on July 30, 2025, the Company and lenders entered into an amendment to the 2025 Term Loan Credit Agreement to modify certain covenant baskets and other terms (including amendments to the leverage ratio definition) to conform to the 2025 Revolving Credit Agreement.
The 2025 Term Loan Credit Agreement has a maturity of two years and provides for a term loan of $750. Proceeds of the term loan were applied to pay down the Company’s U.S. commercial paper capacity and for other general corporate purposes, including working capital needs. During 2025, the Company made loan repayments of $230.0. Total outstanding borrowings under the 2025 Term Loan Credit Agreement were 520.0 as of December, 2025.
Borrowings under the 2025 Term Loan Credit Agreement, as amended, bear interest at an annual rate equal to, at the Company’s option, either (i) term secured overnight financing rate ("Term SOFR") plus a margin ranging from 0.875% to 1.375%, or (ii) an alternate base rate plus a margin ranging from 0% to 0.375%, with the applicable margin determined by reference to the Company’s debt ratings set forth in the 2025 Term Loan Credit Agreement. The loans under the 2025 Term Loan Credit Agreement may be prepaid by the Company at any time, in whole or in part, without penalty or premium, subject to certain conditions. The annual interest rate as of December 31, 2025 was 4.72%.
The 2025 Term Loan Credit Agreement contains customary affirmative and negative covenants that, among other things, will limit or restrict our ability to: incur additional debt or issue guarantees; create certain liens; merge or consolidate with another person; sell, transfer, lease or otherwise dispose of assets; and liquidate or dissolve. Additionally, the 2025 Term Loan Credit Agreement requires us not to permit the ratio of consolidated total indebtedness to consolidated earnings before interest, taxes, depreciation, amortization and other special, extraordinary, unusual, or non-recurring items (adjusted consolidated EBITDA) (leverage ratio) to exceed 3.50 to 1.00, with a qualified acquisition step up immediately following such qualified acquisition of 4.00 to 1.00 for four quarters, 3.75 to 1.00 for two quarters thereafter, and returning to 3.50 to 1.00 thereafter.
87
Total outstanding borrowings under the 2025 Term Loan Credit Agreement were 520.0, as of December 31, 2025. The following table provides the future maturities related to the outstanding balance as of December 31, 2025.
2026
$
—
April 2027
520.0
Total maturities
$
520.0
kSARIA Credit Agreement
On September 12, 2024, the Company entered into a credit agreement (the kSARIA Credit Agreement) among the Company, as borrower, each lender from time to time party thereto, and U.S. Bank National Association, as the administrative agent, sole lead arranger and sole bookrunner. The kSARIA Credit Agreement had a maturity of three years and provided for a term loan of $464.0, which had been borrowed and was used to finance the Company’s acquisition of kSARIA on September 12, 2024. The outstanding loan balance as of December 31, 2024 of $229.0 was fully repaid during 2025 and the kSARIA Credit Agreement was terminated. The interest rate was equal to, at the Company’s option, either (i) Term SOFR (subject to a 0.10% “credit spread adjustment”) plus a margin ranging from 0.875% to 1.500%, or (ii) an alternate base rate plus a margin ranging from 0.0% to 0.5%, with the applicable margin determined by reference to the Company’s debt ratings set forth in the kSARIA Credit Agreement. The annual interest rate as of December 31, 2024 was 5.41%.
Other Long-term Debt
Our other long-term debt is primarily related to outstanding Italian government loans maturing in June 2027 and September 2029, which carries a weighted average fixed interest rate of 0.85% and requires annual principal and interest payments of approximately $1.0 on average, through maturity.
Revolving Credit Agreements
On July 30, 2025, we entered into a revolving credit facility agreement with a syndicate of third-party lenders including U.S. Bank National Association, as administrative agent (the "2025 Revolving Credit Agreement"). Upon its effectiveness, the 2025 Revolving Credit Agreement replaced the revolving credit facility agreement that we entered into on August 5, 2021, with a syndicate of third-party lenders including Bank of America, N.A., as administrative agent (the "2021 Revolving Credit Agreement"). The 2021 Revolving Credit Agreement was terminated on July 30, 2025 with no outstanding balances remaining. The 2025 Revolving Credit Agreement matures in July 2030 and provides for an aggregate principal amount of up to $1,100. The 2025 Revolving Credit Agreement provides for a potential increase of commitment of up to $550 for a possible maximum of $1,650 in aggregate commitments at the request of the Company and with the consent of the institutions providing such increase of commitments.
The 2025 Revolving Credit Agreement contains customary affirmative and negative covenants that, among other things, will limit or restrict our ability to: incur additional debt or issue guarantees; create certain liens; merge or consolidate with another person; sell, transfer, lease or otherwise dispose of all or substantially all of our assets and liquidate or dissolve. Additionally, the 2025 Revolving Credit Agreement requires us not to permit the ratio of consolidated total indebtedness net of unrestricted cash in excess of $100 to consolidated earnings before interest, taxes, depreciation, amortization and other special, extraordinary, unusual, or non-recurring items (adjusted consolidated EBITDA) (leverage ratio) to exceed 3.50 to 1.00, with a qualified acquisition step up immediately following such qualified acquisition of 4.00 to 1.00 for four quarters, 3.75 to 1.00 for two quarters thereafter, and returning to 3.50 to 1.00 thereafter.
Borrowings under the 2025 Revolving Credit Agreement bear interest at an annual rate equal to, at the Company’s option, either (i) Term SOFR plus a margin ranging from 0.785% to 1.150%, or (ii) an alternate base rate plus a margin ranging from 0% to 0.150%, with the applicable margin determined by reference to the Company’s debt ratings set forth in the 2025 Revolving Credit Agreement. There is a commitment fee under the 2025 Revolving Credit Agreement ranging from 0.090% to 0.225% of commitments under the 2025 Revolving Credit Agreement. As of December 31, 2025, all financial covenants (e.g., leverage ratio) associated with the 2025 Revolving Credit Agreement were within the prescribed thresholds.
88
The 2021 Revolving Credit Agreement, prior to its replacement and termination in July 2025, had provided for an aggregate principal amount of up to $700 with a potential to increase up to $350 for a possible maximum of $1,050 with the consent of the institutions providing such increase of commitments. The interest rate per annum on the 2021 Revolving Credit Agreement was based on the Term SOFR rate of the currency we borrow in, plus a margin of 1.00%, and a 0.125% fee per annum applicable to the commitments. We had no outstanding obligations under the 2021 Revolving Credit Agreements as of December 31, 2025.
Pending SPX FLOW Debt Financing
On December 4, 2025, ITT entered into (i) a commitment letter with U.S. Bank, National Association (“US Bank”) for a term loan facility (the “Term Facility Commitment Letter”) in an aggregate principal amount of $2,875 (the “Term Loan Facility”) and (ii) a commitment letter with US Bank for a bridge loan facility (the “Bridge Facility Commitment Letter” and, together with the Term Facility Commitment Letter, the “Commitment Letters”) in an aggregate principal amount of $1,200 (the “Bridge Loan Facility”) (collectively, the “Debt Financing”). The availability of the facilities contemplated by the Commitment Letters is subject to customary conditions precedent for financings transactions of this type, including consummation of the Acquisition, negotiation of definitive financing documents, payment of certain fees and expenses and repayment of certain existing indebtedness of SPX FLOW. No borrowings occurred during 2025 under either loan facility and no amounts were outstanding as of December 31, 2025. The Bridge Loan Facility was terminated following the issuance of shares from ITT's common stock public offering. Issuance fees of $2.1 were recognized during 2025 in connection with the Bridge Loan Facility.
NOTE 16
POSTRETIREMENT BENEFIT PLANS
Defined Contribution Plans
Substantially all of ITT’s U.S. and certain international employees are eligible to participate in a defined contribution plan. ITT sponsors numerous defined contribution savings plans, which allow employees to contribute a portion of their pre-tax and/or after-tax income in accordance with specified guidelines. Certain plans require us to match a portion of the employee contributions. Company contributions charged to expense amounted to $19.1, $19.4 and $17.3 for 2025, 2024 and 2023, respectively.
The ITT Stock Fund, an investment option in our U.S. based defined contribution plan, is considered an employee stock ownership plan and, as a result, participants in the ITT Stock Fund may receive dividends in cash or may reinvest such dividends into the ITT Stock Fund. The ITT Stock Fund held approximately 0.1 shares of ITT common stock at December 31, 2025.
Defined Benefit Plans
ITT currently sponsors a number of defined benefit pension plans, primarily outside of the U.S., which have approximately 880 active participants. As of December 31, 2025, international pension plans represented 85% of our total projected pension benefit obligation. There is one remaining U.S. pension plan, which is frozen to new participants. International plan benefits are primarily determined based on participant years of service, future compensation, and age at retirement or termination.
ITT also provides health care and life insurance benefits for certain unionized employees in the U.S. upon retirement. Nearly all of these plans are closed to new participants. The majority of the liability pertains to retirees with postretirement medical insurance.
89
Balance Sheet Information
The following table provides a summary of the funded status of our postretirement benefit plans and the presentation of the funded status within our Consolidated Balance Sheets.
2025
2024
As of December 31
Pension
Other Benefits
Total
Pension
Other Benefits
Total
Fair value of plan assets
$
0.3
$
—
$
0.3
$
0.3
$
—
$
0.3
Projected benefit obligation
71.4
58.6
130.0
71.6
58.0
129.6
Funded status
$
(71.1)
$
(58.6)
$
(129.7)
$
(71.3)
$
(58.0)
$
(129.3)
Amounts reported within:
Non-current assets
$
0.2
$
—
$
0.2
$
0.1
$
—
$
0.1
Accrued liabilities
(4.8)
(5.0)
(9.8)
(5.0)
(5.4)
(10.4)
Non-current liabilities
(66.4)
(53.6)
(120.0)
(66.4)
(52.6)
(119.0)
A portion of our projected benefit obligation includes amounts that have not yet been recognized as expense in our results of operations. Such amounts are recorded within accumulated other comprehensive loss until they are amortized as a component of net periodic postretirement cost.
The following table provides a summary of amounts recorded within accumulated other comprehensive loss.
2025
2024
As of December 31
Pension
Other Benefits
Total
Pension
Other Benefits
Total
Net actuarial loss
$
(2.7)
$
(3.7)
$
(6.4)
$
3.4
$
(6.0)
$
(2.6)
Prior service cost (benefit)
0.8
(7.0)
(6.2)
0.8
(12.8)
(12.0)
Total
$
(1.9)
$
(10.7)
$
(12.6)
$
4.2
$
(18.8)
$
(14.6)
The following tables provide a rollforward of the benefit obligation, plan assets and funded status for our U.S. and international pension plans and our other employee-related defined benefit plans.
2025
2024
For the Year Ended December 31
U.S. Pension
Int’l Pension
Other Benefits
Total
U.S. Pension
Int’l Pension
Other Benefits
Total
Change in benefit obligation
Benefit obligation as of January 1
$
10.4
$
61.2
$
58.0
$
129.6
$
11.2
$
73.2
$
66.2
$
150.6
Service cost
—
0.7
0.3
1.0
—
0.8
0.3
1.1
Interest cost
0.6
2.2
2.5
5.3
0.5
2.2
2.9
5.6
Amendments
—
—
—
—
—
0.5
—
0.5
Actuarial loss (gain)(a)
0.4
(6.8)
1.7
(4.7)
(0.4)
(5.2)
(7.0)
(12.6)
Benefits paid
(0.9)
(3.7)
(3.9)
(8.5)
(0.9)
(3.3)
(4.0)
(8.2)
Divestitures/Settlement
—
(0.5)
—
(0.5)
—
(2.3)
(0.4)
(2.7)
Foreign currency translation
—
7.8
—
7.8
—
(4.7)
—
(4.7)
Benefit obligation as of December 31
$
10.5
$
60.9
$
58.6
$
130.0
$
10.4
$
61.2
$
58.0
$
129.6
(a)The actuarial gain in 2024 is primarily due to an increase in discount rates during the year.
90
2025
2024
U.S. Pension
Int’l Pension
Other Benefits
Total
U.S. Pension
Int’l Pension
Other Benefits
Total
Change in plan assets
Plan assets as of January 1
$
—
$
0.3
$
—
$
0.3
$
—
$
0.4
$
—
$
0.4
Employer contributions
0.9
4.2
3.9
9.0
0.9
5.6
4.0
10.5
Benefits and expenses paid
(0.9)
(3.7)
(3.9)
(8.5)
(0.9)
(3.3)
(4.0)
(8.2)
Settlement
—
(0.5)
—
(0.5)
—
(2.3)
—
(2.3)
Foreign currency translation
—
—
—
—
—
(0.1)
—
(0.1)
Plan assets as of December 31
$
—
$
0.3
$
—
$
0.3
$
—
$
0.3
$
—
$
0.3
Funded status at end of year
$
(10.5)
$
(60.6)
$
(58.6)
$
(129.7)
$
(10.4)
$
(60.9)
$
(58.0)
$
(129.3)
The accumulated benefit obligation for all defined benefit pension plans was $70.2 and $70.0 as of December 31, 2025 and 2024, respectively. Information for pension plans with an accumulated benefit obligation in excess of plan assets is included in the following table.
As of December 31
2025
2024
Projected benefit obligation
$
71.2
$
71.4
Accumulated benefit obligation
70.1
70.0
Fair value of plan assets
—
—
Statements of Operations Information
The following table provides the components of net periodic postretirement cost and other amounts recognized in other comprehensive loss as they pertain to our defined benefit pension plans.
2025
2024
2023
For the Year Ended December 31
U.S. Pension
Int’l Pension
Total
U.S. Pension
Int’l Pension
Total
U.S. Pension
Int’l Pension
Total
Net periodic postretirement cost - pension
Service cost
$
—
$
0.7
$
0.7
$
—
$
0.8
$
0.8
$
—
$
0.8
$
0.8
Interest cost
0.6
2.2
2.8
0.5
2.2
2.7
0.6
2.4
3.0
Amortization of net actuarial loss
0.1
—
0.1
0.1
0.2
0.3
—
—
—
Amortization of prior service cost
—
0.1
0.1
—
—
—
—
—
—
Net periodic postretirement cost
0.7
3.0
3.7
0.6
3.2
3.8
0.6
3.2
3.8
Settlement charge and other
—
(0.1)
(0.1)
—
(0.2)
(0.2)
—
0.1
0.1
Cost for special termination benefit
—
—
—
—
0.1
0.1
—
—
—
Total net periodic postretirement cost
0.7
2.9
3.6
0.6
3.1
3.7
0.6
3.3
3.9
Other changes in plan assets and benefit obligations recognized in other comprehensive income
Net actuarial (gain) loss
0.4
(6.8)
(6.4)
(0.4)
(5.2)
(5.6)
0.3
3.4
3.7
Prior service cost
—
—
—
—
0.5
0.5
—
—
—
Amortization of net actuarial loss
(0.1)
0.1
—
(0.1)
(0.1)
(0.2)
—
—
—
Amortization of prior service cost
—
(0.1)
(0.1)
—
—
—
—
—
—
Foreign currency translation and other
—
0.3
0.3
—
(0.4)
(0.4)
—
0.1
0.1
Total change recognized in other comprehensive income
0.3
(6.5)
(6.2)
(0.5)
(5.2)
(5.7)
0.3
3.5
3.8
Total impact from net periodic postretirement cost and changes in other comprehensive income
$
1.0
$
(3.6)
$
(2.6)
$
0.1
$
(2.1)
$
(2.0)
$
0.9
$
6.8
$
7.7
91
The following table provides the components of net periodic postretirement cost and other amounts recognized in other comprehensive loss as they pertain to other employee-related defined benefit plans.
For the Year Ended December 31
2025
2024
2023
Net periodic postretirement cost - other postretirement
Service cost
$
0.3
$
0.3
$
0.3
Interest cost
2.5
2.9
3.1
Amortization of net actuarial loss
(0.7)
0.2
—
Amortization of prior service benefit
(5.7)
(5.8)
(6.0)
Net periodic postretirement cost (benefit)
(3.6)
(2.4)
(2.6)
Gain due to settlement/divestiture
—
(1.2)
—
Total net periodic postretirement cost
(3.6)
(3.6)
(2.6)
Other changes in plan assets and benefit obligations recognized in other comprehensive income
Net actuarial (gain) loss
1.7
(7.0)
(2.9)
Amortization of net actuarial loss
0.7
(0.2)
—
Amortization of prior service credit
5.7
5.8
6.0
Recognized actuarial gain (loss) due to divestiture
—
0.7
—
Total changes recognized in other comprehensive income
8.1
(0.7)
3.1
Total impact from net periodic postretirement cost and changes in other comprehensive income
$
4.5
$
(4.3)
$
0.5
Postretirement Plan Assumptions
The determination of projected benefit obligations and the recognition of expenses related to postretirement benefit plans are dependent on various assumptions that are judgmental and developed in consultation with external advisors. Management develops each assumption using relevant Company experience in conjunction with market-related data for each individual country in which such plans exist. Periodically, the Company performs experience studies to validate certain actuarial assumptions such as age of retirement, rates of turnover, utilization of optional forms of payments. The actuarial assumptions are based on the provisions of the applicable accounting pronouncements, review of various market data and discussion with our external advisors. Assumptions are reviewed annually and adjusted as necessary. Changes in these assumptions could materially affect our financial statements.
The following table provides the weighted-average assumptions used to determine projected benefit obligations and net periodic postretirement cost as they pertain to our U.S. and non-U.S. defined benefit pension plans and other employee-related defined benefit plans.
2025
2024
U.S. Pension
Int’l Pension
Other Benefits
U.S. Pension
Int’l Pension
Other Benefits
Obligation Assumptions:
Discount rate
5.1
%
4.0
%
5.2
%
5.5
%
3.3
%
5.6
%
Rate of future compensation increase
N/A
3.4
%
N/A
N/A
3.4
%
N/A
Cost Assumptions:
Discount rate
5.5
%
3.3
%
5.6
%
5.0
%
3.1
%
5.0
%
Expected return on plan assets
N/A
1.0
%
N/A
N/A
1.0
%
N/A
The discount rate is used to calculate the present value of expected future benefit payments at the measurement date. The discount rate assumption is based on current investment yields of high-quality fixed income investments during the retirement benefits maturity period. The pension discount rate is determined by considering an interest rate yield curve comprising AAA/AA bonds, with maturities that are generally between zero and 30 years, developed by the plan's actuaries. Annual benefit payments are then discounted to present value using this yield curve to develop a single discount rate matching the plan's characteristics.
We estimate the service and interest components of net periodic benefit cost of the U.S. defined benefit plans by discounting the individual expected cash flows underlying the service cost and interest cost using the applicable spot rates from the yield curve used to discount the cash flows in measuring the benefit obligation.
92
The rate of future compensation increase assumption for foreign plans reflects our long-term actual experience and future and near-term outlook. The rate of future compensation increase assumption is not applicable for the U.S. plan because the plan is frozen.
The Company has updated the mortality assumption to reflect the most recent projection update.
The assumed rate of future increases in the per capita cost of health care (the health care trend rate) is 8.5% for pre-age 65 retirees and 8.8% for post-age 65 retirees for 2026, decreasing ratably to 4.5% in 2037. To the extent that actual experience differs from these assumptions, the effect will be amortized over the average future working life or life expectancy of the plan participants.
Fair Value of Plan Assets
As of December 31, 2025 and 2024, our plan assets were not material.
Contributions
Our postretirement plans are largely unfunded, and therefore plan contributions generally reflect required benefit payments. We fund certain of our international pension plans in countries where funding is allowable and tax-efficient. During 2025 and 2024, we contributed $5.1 and $6.5, respectively, to our global pension plans and we anticipate making contributions of approximately $5 during 2026.
We contributed $3.9 and $4.0 to our other employee-related defined benefit plans during 2025 and 2024, respectively. We estimate that the 2026 contributions to our other employee-related defined benefit plans will be approximately $5.
Estimated Future Benefit Payments
The following table provides the projected timing of payments for benefits earned to date and the expectation that certain future service will be earned by current active employees for our pension and other employee-related benefit plans.
U.S. Pension
Int’l Pension
Other Benefits
2026
$
0.9
$
3.9
$
5.4
2027
0.9
3.7
5.2
2028
0.9
3.8
5.1
2029
0.9
3.8
5.0
2030
0.9
4.2
4.7
2031 - 2035
4.3
18.8
21.4
NOTE 17
LONG-TERM INCENTIVE EMPLOYEE COMPENSATION
The 2011 Omnibus Incentive Plan (2011 Incentive Plan) was approved by shareholders and established in May 2011 to provide for the awarding of options on common shares and full value restricted common shares or units to employees and non-employee directors. As of December 31, 2025, 35.9 shares were available for future grants under the 2011 Incentive Plan. The Company can make shares available for the exercise of stock options or vesting of restricted shares or units by purchasing shares in the open market.
Our long-term incentive plan (LTIP) awards are comprised of two components: restricted stock units (RSUs) and performance stock units (PSUs). The majority of RSUs and PSUs settle in shares; however RSUs and PSUs granted to certain international employees are settled in cash. We account for equity-settled RSUs and PSUs as equity-based compensation awards. We account for cash-settled RSUs and PSUs as liability-based awards. PSUs contain equally weighted performance conditions for total shareholder return (TSR) and return on invested capital (ROIC). PSUs vest based on predetermined performance metrics that align with the Company's stock price and financial performance generally following a three-year performance period and are subject to a payout factor which includes a maximum and minimum payout. PSUs are accounted for as two distinct awards, a TSR award and a ROIC award.
93
LTIP costs are primarily recorded within General and administrative expenses in our Consolidated Statements of Operations, at their grant date fair value over the requisite service period (typically three years) on a straight-line basis and are reduced by forfeitures as they occur.
The following table summarizes our share-based compensation expense associated with our LTIP awards.
For the Year Ended December 31
2025
2024
2023
Equity-based awards
$
36.2
$
25.9
$
20.2
Liability-based awards
3.5
2.6
1.7
Total share-based compensation expense
$
39.7
$
28.5
$
21.9
The income tax benefit realized during 2025, 2024 and 2023 associated with exercised stock options and vested restricted stock was $7.7, $7.6 and $4.5, respectively. The excess tax benefits realized during 2025, 2024 and 2023 associated with stock options and vested restricted stock was $1.9, $1.8 and $0.9, respectively.
As of December 31, 2025, there was $45.4 of total unrecognized compensation cost related to non-vested equity awards. This cost is expected to be recognized ratably over a weighted-average period of 1.9 years. Additionally, unrecognized compensation cost related to liability-based awards was $4.3, which is expected to be recognized ratably over a weighted-average period of 1.8 years.
The fair value of equity-settled RSUs is determined using the closing price of the Company’s common stock on the date of grant. The fair value of cash-settled RSUs is remeasured using the closing price of ITT's common stock at the end of each reporting period. Recipients do not have voting rights and do not receive cash dividends during the restriction period. Dividend equivalents on RSUs, which are subject to forfeiture, are accrued and paid in cash upon vesting of the RSU. If a recipient retires or is terminated other than for cause, a pro rata portion of the RSU may vest.
For PSUs, the fair value of the ROIC award is based on the closing price of ITT common stock on the date of grant less the present value of expected dividend payments during the vesting period. For ROIC awards granted in 2025, a dividend yield of 1.05% was assumed based on ITT's annualized dividend payment of $1.404 per share and the March 4, 2025 closing stock price of $134.24. The fair value of the ROIC award is fixed on the grant date; however, a probability assessment is performed each reporting period to estimate the likelihood of achieving the ROIC targets and the amount of compensation to be recognized.
The fair value of the TSR award is measured using a Monte Carlo simulation on the date of grant, measuring potential total shareholder return for ITT relative to the other companies in the S&P 400 Capital Goods Index (the TSR Performance Group). The expected volatility of ITT's stock price is based on the historical volatility of a peer group while expected volatility for the other companies in the TSR Performance Group is based on their own stock price history. For TSR awards granted in 2025, all volatility and correlation measures were based on three years of daily historical price data through March 4, 2025, corresponding to the three-year performance period of the award. As the grant date occurs after the beginning of the performance period, actual TSR performance between the beginning of the performance period (December average closing stock price) and the grant date was reflected in the valuation. For TSR awards granted in 2025, a dividend yield of 1.05% was assumed based on ITT's annualized dividend payment of $1.404 per share and the March 4, 2025 closing stock price of $134.24.
The table below provides a rollforward of our outstanding RSUs and PSUs.
2025
2024
2023
Restricted Stock and Performance Units
Shares
Weighted Average Grant Date Fair Value
Shares
Weighted Average Grant Date Fair Value
Shares
Weighted Average Grant Date Fair Value
Outstanding as of January 1
0.8
$
109.06
0.7
$
88.40
0.7
$
76.36
Granted
0.3
136.07
0.4
135.01
0.3
99.33
Performance adjustment
—
—
0.1
98.67
—
—
Vested and issued
(0.3)
88.23
(0.3)
91.13
(0.2)
69.91
Forfeited
—
—
(0.1)
108.62
(0.1)
77.20
Outstanding as of December 31
0.8
$
123.49
0.8
$
109.06
0.7
$
88.40
Vested pending issuance
0.1
$
116.48
0.1
$
76.51
0.1
$
98.67
94
The table below provides the number of our outstanding shares by award type. Cash-settled RSUs and PSUs outstanding were not material.
As of December 31
2025
2024
2023
Equity-settled RSUs
0.4
0.4
0.4
Equity-settled PSUs
0.4
0.3
0.3
As of December 31, 2025, substantially all RSUs outstanding are expected to vest. As of December 31, 2025, the total number of PSUs expected to vest based on current performance estimates, including those vested but pending issuance, was 0.6.
Non-Qualified Stock Options
Prior to 2017, our LTIP award grants also included non-qualified stock options (NQOs). As of December 31, 2025, there were no NQOs outstanding. NQOs outstanding and exercisable were nominal as of December 31, 2024, and 0.1 as December 31, 2023. A nominal amount of NQOs were exercised during the years ended December 31, 2025 and 2024, and 0.1 during the year ended December 31, 2023, resulting in cash proceeds of $1.0, $0.5 and $0.6, respectively.
CEO Retention Plan
On October 30, 2024, the Company adopted a Chief Executive Officer Retention Plan (the "CEO Retention Plan") to provide for the grant of additional RSUs to ITT's CEO, Mr. Savi. The initial RSU grant under the CEO Retention Plan was awarded on October 30, 2024 with a grant date fair value of $7.0. Mr. Savi is also eligible to receive a performance-earned annual retention grant (PEAR Grant) in the first quarter of each of calendar year 2025 through 2029. Each PEAR Grant will consist of RSUs with a fair market value determined based on the final PSU payout (expressed as a percentage), each as determined under Mr. Savi’s performance unit award agreement for the most recently completed performance period. Performance unit award payouts start above 105% at $4.0 and can range up to $7.0. In March 2025, a RSU PEAR grant was awarded with a grant date fair value of $5.0.
LTIP costs for the initial grant of RSUs will be recognized on a straight-line basis beginning on the grant date, October 30, 2024, through the vest date, December 31, 2028. LTIP costs for future RSU grants, if any, will be recognized on a straight-line basis over the requisite service period beginning on the date each PEAR Grant is approved by the Company’s Board of Directors, through the vest date of the later of December 31, 2028 or one year from the date of grant. During 2025, the Company recognized costs of $2.8 in connection with the CEO Retention Plan.
Employee Stock Purchase Plan
We sponsor the ITT Inc. 2023 Employee Stock Purchase Plan (the "ESPP"), pursuant to which eligible employees may elect to contribute from 1% to 10% of their eligible compensation, which includes after-tax base salary and annual bonus, subject to certain income limits, to purchase shares of ITT's common stock. The adoption of the ESPP was approved by our shareholders at our 2023 Annual Shareholders Meeting. The aggregate number of shares of ITT’s stock authorized for issuance under the ESPP was 0.5.
Pursuant to the terms of the ESPP, employees may purchase stock under the ESPP at a price equal to 95% of ITT’s closing stock price on the purchase date. For the year ended December 31, 2025, no stock-based compensation expense was recorded in connection with the ESPP because the criteria of a non-compensatory plan in accordance with ASC 718, Compensation - Stock Compensation, were met. During 2025, employees contributed $1.0 to the ESPP.
95
NOTE 18
CAPITAL STOCK
ITT has authority to issue an aggregate of 300 shares of capital stock, of which 250 shares have been designated as common stock having a par value of $1 per share and 50 shares have been designated as preferred stock not having any par or stated value. There was no preferred stock outstanding as of December 31, 2025 and 2024.
On December 10, 2025, the Company issued 8.05 shares of common stock at a public offering price of $167.00 per share, generating net proceeds of $1,314.1 after underwriting discounts and expenses. The shares were issued under the Company’s shelf registration statement on Form S-3ASR. The Company intends to use the net proceeds to fund a portion of the cash purchase price for the previously announced acquisition of SPX FLOW, Inc., ("SPX FLOW") expected to close by the end of the first quarter of 2026. If the acquisition is not consummated, the Company intends to use the net proceeds for general corporate purposes.
The holders of ITT common stock are entitled to receive dividends when and as declared by ITT’s Board of Directors. Dividends are paid quarterly. Dividends declared were $1.404, $1.276 and $1.160 per common share totaling $111.0, $104.8, and $95.9 in 2025, 2024, and 2023, respectively.
On October 4, 2023, the Board of Directors approved an indefinite term $1,000 open-market share repurchase program (the 2023 Plan). There was $455 of remaining capacity left under the 2023 Plan as of December 31, 2025. The following table summarizes our share repurchase activity.
As of December 31
2025
2024
2023
Shares repurchased and retired
3.8
0.8
0.7
Cost of share repurchases
$
525.0
$
104.8
$
60.5
Separate from our open-market share repurchase programs, the Company withholds shares of common stock in settlement of employee tax withholding obligations due upon the vesting of equity-based compensation awards. The following table summarizes Company share withholdings related to net shares settlement of stock incentive plans.
As of December 31
2025
2024
2023
Shares withheld for taxes related to net share settlement of stock incentive plans
0.1
0.1
0.1
Payments for taxes related to net share settlement of stock incentive plans
$
13.8
$
14.2
$
7.2
NOTE 19
COMMITMENTS AND CONTINGENCIES
From time to time, we are involved in litigation, claims, government inquiries, investigations and proceedings, including but not limited to those relating to environmental exposures, intellectual property matters, personal injury claims, product liabilities, regulatory matters, commercial and government contract issues, employment and employee benefit matters, commercial or contractual disputes, and securities matters.
Although the ultimate outcome of any legal matter cannot be predicted with certainty, based on present information including our assessment of the merits of the particular claim, as well as our current reserves and insurance coverage, we do not expect that such legal proceedings will have any material adverse impact on our financial statements, unless otherwise noted below. However, there can be no assurance that an adverse outcome in any of the proceedings described below will not result in material fines, penalties or damages, changes to the Company's business practices, loss of (or litigation with) customers or a material adverse effect on our financial statements.
Environmental Matters
In the ordinary course of business, we are subject to federal, state, local, and foreign environmental laws and regulations. We are responsible, or are alleged to be responsible, for ongoing environmental investigation and site remediation primarily related to former ITT businesses and former operating locations. These sites are in various stages of investigation and/or remediation under oversight of the U.S. Environmental Protection Agency and similar state environmental agencies with one non-U.S. matter under oversight of Italian environmental authorities.
96
Accruals for environmental matters are recorded on a site-by-site basis when it is probable that a liability has been incurred and the amount of the liability can be reasonably estimated. The following table provides a summary of the estimated aggregated environmental liability based on currently available and known information.
2025
2024
Balance as of January 1
$
54.9
$
56.0
Changes in estimates for pre-existing accruals:
Continuing operations
2.3
2.2
Discontinued operations
2.5
0.4
Accruals added during the period for new matters
0.5
—
Cash payments
(4.4)
(3.6)
Foreign currency
0.3
(0.1)
Balance as of December 31
$
56.1
$
54.9
Environmental-related assets, including estimated recoveries from insurance providers and other third parties, were $10.3 and $8.1 as of December 31, 2025 and 2024, respectively.
The following table illustrates the reasonably possible high range of estimated liability and number of active sites for environmental matters.
As of December 31
2025
2024
High-end estimate of environmental liability
$
97.3
$
95.9
Number of open environmental sites
26
26
As actual costs incurred at identified sites in future periods may vary from our current estimates given the inherent uncertainties in evaluating environmental exposures, management believes it is possible that the outcome of these uncertainties may have a material adverse effect on our financial statements.
NOTE 20
GUARANTEES, INDEMNITIES AND WARRANTIES
Indemnities
Since our founding in 1920 (pre-spin-offs), we have acquired and disposed of numerous businesses. The related acquisition and disposition agreements allocate certain assets and liabilities among the parties and contain various representation and warranty clauses and may provide indemnities for a misrepresentation or breach of the representations and warranties by either party or for assumed or excluded liabilities. These provisions address a variety of subjects. The term and monetary amounts of each such provision are defined in the specific agreements and may be affected by various conditions and external factors. Many of the provisions have expired either by operation of law or as a result of the terms of the agreement. We do not have a liability recorded for these expired provisions and are not aware of any claims or other information that would give rise to material payments under such provisions.
Guarantees
We have $219.1 of guarantees, letters of credit and similar arrangements outstanding at December 31, 2025, primarily pertaining to commercial or performance guarantees and insurance matters. We have not recorded any material loss contingencies under these guarantees, letters of credit and similar arrangements as of December 31, 2025 as the likelihood of nonperformance by ITT is considered remote. From time to time, we may provide certain third-party guarantees that may be affected by various conditions and external factors, some of which could require that payments be made under such guarantees. We do not consider the maximum exposure or current recorded liabilities under our third-party guarantees to be material either individually or in the aggregate. We do not believe such payments would have a material adverse impact on our Consolidated Financial Statements.
97
Warranties
ITT warrants numerous products, the terms of which vary widely. In general, ITT warrants its products against defect and specific non-performance. In certain markets, such as automotive, aerospace and rail, liability for product defects could extend beyond the selling price of the product and could be significant if the defect interrupts production or results in a recall.
The table below presents a rollforward of our total warranty liability, which is recorded within Accrued liabilities and Other non-current liabilities in our Consolidated Balance Sheets.
2025
2024
Warranty liability as of January 1
$
19.4
$
16.5
Warranty expense
14.3
8.6
Warranty liability acquired
0.7
0.9
Payments
(7.9)
(6.3)
Foreign currency and other
0.6
(0.3)
Warranty liability as of December 31
$
27.1
$
19.4
NOTE 21
DERIVATIVE FINANCIAL INSTRUMENTS
The Company is exposed to various market risks relating to its ongoing business operations. From time to time, we use derivative financial instruments to mitigate our exposure to certain of these risks, including foreign exchange rate and commodity price fluctuations. By using derivatives, the Company is further exposed to credit risk. Our exposure to credit risk includes the counterparty’s failure to fulfill its financial obligations under the terms of the derivative contract. The Company attempts to minimize its exposure by avoiding concentration risk among its counterparties and by entering into transactions with creditworthy counterparties.
Foreign Currency Derivative Contracts
The Company enters into foreign currency forward or option contracts to mitigate foreign currency risk associated with transacting with international customers, suppliers, and subsidiaries. The notional amounts and fair values of our outstanding foreign currency derivative contracts, which are recorded within other current assets in our Consolidated Balance Sheets, were as follows:
As of December 31
2025
2024
Notional amount (U.S. dollar equivalent)
$
201.5
$
155.8
Fair value of foreign currency derivative contracts(a)
$
0.5
$
2.9
(a) Our foreign currency derivative contracts are classified within Level 2 of the fair value hierarchy because these contracts are not actively traded and the valuation inputs are based on market observable data of similar instruments.
Gains or losses arising from changes in fair value of our foreign currency derivative contracts are recorded within General and administrative expenses in our Consolidated Statements of Operations. The cash flow impact upon settlement of our foreign currency derivative contracts is included in operating activities in our Consolidated Statements of Cash Flows. The table below presents the financial statement impact from foreign currency derivative contracts for the years ended December 31, 2025, 2024 and 2023.
For the Year Ended December 31
2025
2024
2023
(Loss) on foreign currency derivative contracts(a)
$
(1.1)
$
(6.7)
$
(2.5)
Cash inflow (outflow) from foreign currency derivative contracts
$
2.7
$
(8.3)
$
1.5
(a) None of our derivative contracts were designated as hedging instruments under ASC 815, Derivatives & Hedging.
98
NOTE 22
ACQUISITIONS, INVESTMENTS, AND DIVESTITURES
Acquisition of kSARIA
On September 12, 2024, we completed the acquisition of 100% of the privately held stock of kSARIA for a purchase price of $460.1, net of cash acquired and including deferred consideration of $4.5 which was paid in 2025. kSARIA is a leading manufacturer of mission-critical cable assembly and networking application solutions primarily for the aerospace and defense market. kSARIA is headquartered in New Hampshire, with approximately 1,000 employees across five manufacturing sites in the U.S. and one in Mexico. Subsequent to the acquisition, kSARIA’s financial results are reported within our CCT segment.
The assets acquired and liabilities assumed for the kSARIA acquisition were recorded at fair value and are shown in the table below, including final adjustments to the purchase price during 2025. The impact to the current period income statement resulting from the adjustments was not material.
kSARIA - Allocation of Purchase Price
Preliminary 12/31/2024
2025 Adjustments
Final 12/31/2025
Receivables
$
26.7
$
(0.3)
$
26.4
Inventory
48.0
(9.6)
38.4
Plant, property and equipment
9.4
(0.3)
9.1
Goodwill(a)
244.3
(0.8)
243.5
Other intangible assets
185.1
—
185.1
Other assets
10.3
(0.3)
10.0
Accounts payable and accrued liabilities
(28.5)
(2.0)
(30.5)
Other liabilities
(30.5)
11.6
(18.9)
Contract liabilities
(3.0)
—
(3.0)
Net assets acquired
$
461.8
$
(1.7)
$
460.1
(a) Goodwill acquired with kSARIA is primarily attributable to the complementary nature of its product portfolio to ITT’s existing connectors portfolio. Goodwill arising from the acquisition is not expected to be deductible for income tax purposes.
Acquisition of Svanehøj
On January 19, 2024, the Company completed the acquisition of 100% of the privately held stock of Svanehøj for a purchase price of $407.6, net of cash acquired of $28.0. Svanehøj is a Denmark-based supplier of pumps and related aftermarket services with leading positions in cryogenic applications for the marine sector. Svanehøj employs approximately 400 employees and has operations in Denmark, Singapore and France. Subsequent to the acquisition, Svanehøj’s financial results are reported within our IP segment. As of December 31, 2024, the allocation of the purchase price to the assets acquired and liabilities assumed was finalized related to our acquisition of Svanehøj.
Acquisition of Micro-Mode
On May 2, 2023, the Company completed the acquisition of 100% of the privately held stock of Micro-Mode for a purchase price of $79.0, net of cash acquired. Micro-Mode is a specialty designer and manufacturer of high-bandwidth radio frequency (RF) connectors for harsh environment defense and space applications. Micro-Mode has a single manufacturing site near San Diego, California. Subsequent to the acquisition, Micro-Mode’s financial results are reported within our CCT segment.
Investments in CRP Technology and CRP USA (CRP)
During the second quarter of 2022, we purchased a minority investment of 46% in CRP Technology Srl and 33% in CRP USA LLC (collectively "CRP") for $23.0. CRP is a manufacturer of reinforced composite materials for 3D printing for the aerospace, defense, premium automotive, and motorsports industries. CRP's Windform® high-performance materials enable engineers to develop complex, customized designs while providing lightweight and exceptionally durable products. In both May 2023 and May 2024, ITT purchased an additional 9% of CRP USA LLC for $1.4. These additional investments brought ITT’s direct share ownership in CRP USA LLC to 51%. The investment in CRP USA LLC is accounted for as an equity method investment as we do not have control of the entity due to a supermajority board voting requirement.
99
Divestiture of Wolverine
On July 22, 2024, the Company sold its Wolverine business, formerly part of the MT segment, for a price of $186.2 (or $177.9, net of cash divested), resulting in a pre-tax gain of $47.8. In connection with the divestiture, cumulative translation losses of $3.6 were reclassified out of Accumulated Other Comprehensive Loss and included in the gain on sale. Subsequent to the sale, Wolverine will act as a third-party supplier to the Company’s MT segment.
Divestiture of Matrix Composites, Inc. (Matrix)
On December 29, 2023, the Company sold its Matrix business, an aerospace and defense components manufacturer within our CCT segment, to a third party for total cash proceeds of $1.0. In connection with this transaction, we recorded a pre-tax loss of $15.3.
Divestiture of Product Line
During the second quarter of 2023, we completed the sale of a product line within our CCT segment to a third party for $10.5. The Company determined that the product line met the definition of a business per ASC 805, Business Combinations. As a result of the transaction, we recognized a pre-tax gain on sale of $7.2.
Acquisition of SPX FLOW
On December 4, 2025, the Company entered into a Membership Interest Purchase Agreement (the “Purchase Agreement”) with LSF11 Redwood Parent, L.P., LSF11 Redwood TopCo LLC (the “Target”) and ITT Industries Holdings, Inc., a wholly owned subsidiary of the Company to acquire SPX FLOW (the “Acquisition”), a subsidiary of the Target and a leading provider of pumps, valves, mixers, aftermarket services, and other flow and process solutions, for an aggregate purchase price of approximately $4,775 payable at closing of the Acquisition, comprised of $4,075 in cash and 3.8 shares of Company common stock subject to customary closing conditions, including regulatory approvals. The Acquisition is expected to close by the end of the first quarter of 2026.
Incorporated by reference to Exhibit 97.1 of ITT Inc.’s Form 10-K for the year ended December 31, 2023
101
The following materials from ITT Inc.’s Annual Report on Form 10-K for the year ended December 31, 2025, formatted in iXBRL (inline Extensible Business Reporting Language): (i) Consolidated Statements of Operations, (ii) Consolidated Statements of Comprehensive Income, (iii) Consolidated Balance Sheets, (iv) Consolidated Statements of Cash Flows, (v) Consolidated Statements of Changes in Shareholders’ Equity and (vi) Notes to the Consolidated Financial Statements
104
Cover Page Interactive Data File (embedded within the Inline XBRL document).
* Management compensatory plan
II-2
SIGNATURES
Pursuant to the requirements of Section 13 or 15(d) of the Securities Exchange Act of 1934, the registrant has duly caused this report to be signed on its behalf by the undersigned, thereunto duly authorized.
ITT Inc. (Registrant)
By:
/S/ CHERYL DE MESA GRAZIANO
Cheryl de Mesa Graziano Vice President and Chief Accounting Officer (Principal Accounting Officer)
February 9, 2026
II-3
Pursuant to the requirements of the Securities Exchange Act of 1934, this report has been signed below by the following persons on behalf of the registrant and in the capacities and on the dates indicated.
SIGNATURE
TITLE
DATE
/S/ LUCA SAVI
Chief Executive Officer, President and Director
February 9, 2026
Luca Savi (Principal Executive Officer)
/S/ EMMANUEL CAPRAIS
Senior Vice President and Chief Financial Officer
February 9, 2026
Emmanuel Caprais (Principal Financial Officer)
/S/ CHERYL DE MESA GRAZIANO
Vice President and Chief Accounting Officer
February 9, 2026
Cheryl de Mesa Graziano (Principal Accounting Officer)