.3
.3 Accelerating Our 2030 Vision 1
.3
.3 Accelerating Our 2030 Vision 1
Safe Harbor and Non-GAAP Disclosures The information in this presentation includes “forward-looking statements” within the meaning of the Securities Act of 1933, as amended, and the Securities Exchange Act of 1934, as amended. Examples of forward-looking statements in this presentation include, but are not limited to, statements regarding our potential acquisition of LSF11 Redwood TopCo LLC (“SPX FLOW”), such as the expected funding and time period to consummate the potential acquisition and the anticipated benefits (including synergies) of the potential acquisition; future strategic plans and other statements that describe our business strategy, outlook, objectives, plans, intentions or goals; the impact of the acquisition on us; the estimated total addressable market; and any discussion of future events and future operating or financial performance. All statements other than statements of historical fact are, or may be deemed to be, forward-looking statements. In some cases, forward-looking statements can be identified by the use of forward-looking terms such as “anticipate, ” “estimate,” “believe,” “continue,” “could,” “intend,” “may,” “plan,” “predict,” “should,” “will,” “expect,” “project,” “forecast,” “goal,” “outlook,” “target,” or the negative of these terms or other comparable terms. However, the absence of these words does not mean that the statements are not forward-looking. These forward-looking statements are based on certain assumptions and analyses made by us in light of our experience and our perception of historical trends, current conditions and expected future developments, as well as other factors we believe are appropriate in the circumstances. These forward-looking statements are subject to known and unknown risks, uncertainties and assumptions that may cause actual results, levels of activity, performance, or achievements to be materially different from any future results, levels of activity, performance or achievements expressed or implied by such forward-looking statements. Factors that might cause or contribute to a material difference include the risks discussed in our filings with the Securities and Exchange Commission (“SEC”) and the following: potential delays in consummating the potential acquisition; our ability to integrate the operations of SPX FLOW in a successful manner and in the expected time period; the possibility that any of the anticipated benefits and projected synergies of the potential acquisition will not be realized or will not be realized on the anticipated terms and within the expected time period; the occurrence of any event, change or other circumstance that could give rise to the termination of the membership interest purchase agreement; unforeseen or unknown liabilities; customer, regulatory and other stakeholder approvals and support; unexpected future capital expenditures; potential litigation relating to the potential acquisition that could be instituted against us or our directors; the possibility that the potential acquisition may be more expensive to complete than anticipated, including as a result of unexpected factors or events; the effect of the announcement, pendency or completion of the potential acquisition on our and SPX FLOW’s business relationships and business generally; and the risks described in Part I, Item 1A “Risk Factors” of our Annual Report on Form 10-K for the year ended December 31, 2024 and in subsequent filings with the SEC. All forward-looking statements set forth in this presentation are qualified by these cautionary statements and there can be no assurance that the actual results or developments anticipated by us will be realized or, even if substantially realized, that they will have the expected consequences to or effects on us or our business or operations. Forward-looking statements set forth in this presentation speak only as of the date hereof, and we do not undertake any obligation to update forward-looking statements to reflect subsequent events or circumstances, changes in expectations or the occurrence of unanticipated events, except to the extent required by law. This presentation contains references to “non-GAAP financial measures”, consisting of organic revenue, adjusted EBITDA, adjusted EBITDA margin, adjusted income from continuing operations per diluted share (adjusted EPS), net leverage, and free cash flow margin. See the Appendix to this presentation for a description of such information and a reconciliation of such items to GAAP information. The information contained in this presentation about SPX FLOW is based on information furnished to us by SPX FLOW’s management. Targeted synergies and expected performance post-acquisition are not a guarantee of future performance and involve significant assumptions, risks and uncertainties that may not materialize or may differ materially from those projected. Targeted synergies include anticipated cost savings as SPX FLOW is combined with our business. These estimates assume that the combination can be achieved without disrupting the operations, quality or service levels of either our business or SPX FLOW’s business and that there are no unforeseen difficulties or delays in implementing the combination plan. The targeted synergies are expected to be reflected in our combined results by the end of year three post-close, but there can be no assurance that this timeframe will be met or that the estimated synergies will be realized in full or at all. Investors should not place undue significance on the targeted synergies as a measure of the value or profitability of the combined company or as an indication of the actual results that may be achieved by the combined company. 2
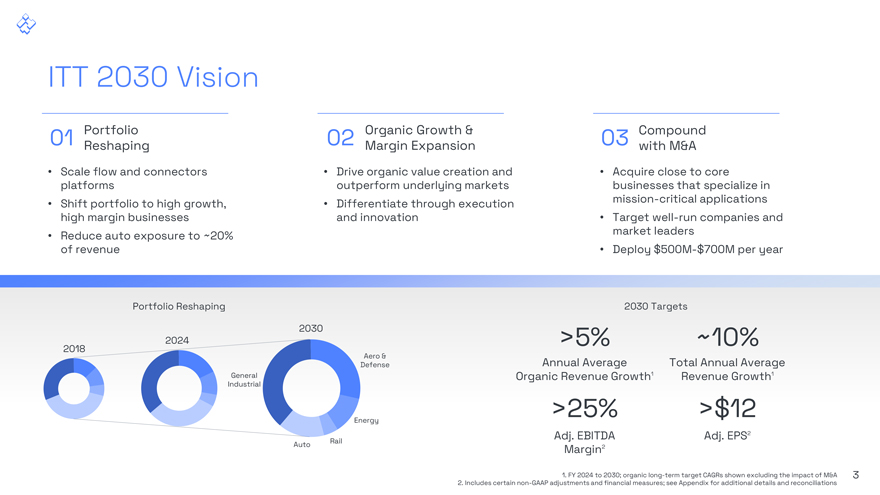
ITT 2030 Vision Portfolio Reshaping Organic Growth & Margin Expansion Compound with M&A Scale flow and connectors platforms Shift portfolio to high growth, high margin businesses Reduce auto exposure to ~20% of revenue Drive organic value creation and outperform underlying markets Differentiate through execution and innovation Acquire close to core businesses that specialize in mission-critical applications Target well-run companies and market leaders Deploy $500M-$700M per year 2018 Portfolio Reshaping 2030 2024 >5% 2030 Targets ~10% General Industrial Auto Rail Aero & Defense Energy Annual Average Organic Revenue Growth1 >25% Adj. EBITDA Margin2 Total Annual Average Revenue Growth1 >$12 Adj. EPS2 1. FY 2024 to 2030; organic long-term target CAGRs shown excluding the impact of M&A 3 2. Includes certain non-GAAP adjustments and financial measures; see Appendix for additional details and reconciliations
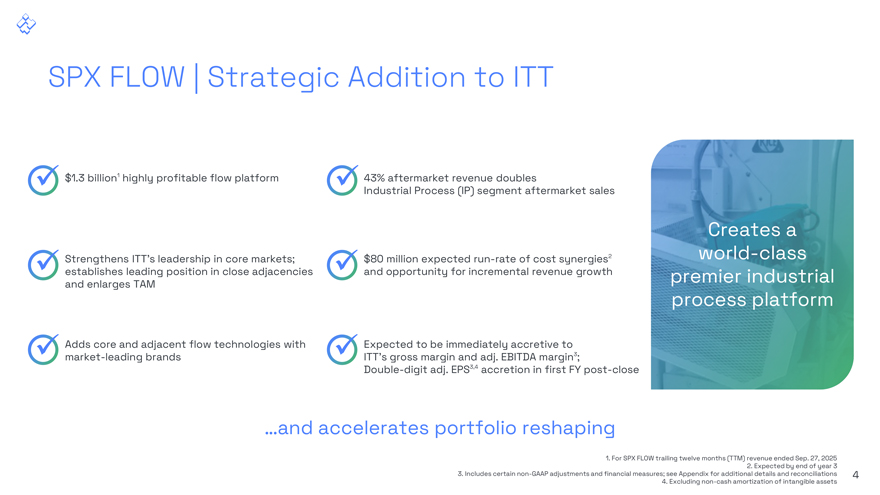
SPX FLOW | Strategic Addition to ITT $1.3 billion1 highly profitable flow platform 43% aftermarket revenue doubles Industrial Process (IP) segment aftermarket sales Strengthens ITT’s leadership in core markets; establishes leading position in close adjacencies and enlarges TAM $80 million expected run-rate of cost synergies2 and opportunity for incremental revenue growth Adds core and adjacent flow technologies with market-leading brands Expected to be immediately accretive to ITT’s gross margin and adj. EBITDA margin3; Double-digit adj. EPS3,4 accretion in first FY post-close …and accelerates portfolio reshaping 1. For SPX FLOW trailing twelve months (TTM) revenue ended Sep. 27, 2025 2. Expected by end of year 3 3. Includes certain non-GAAP adjustments and financial measures; see Appendix for additional details and reconciliations 4
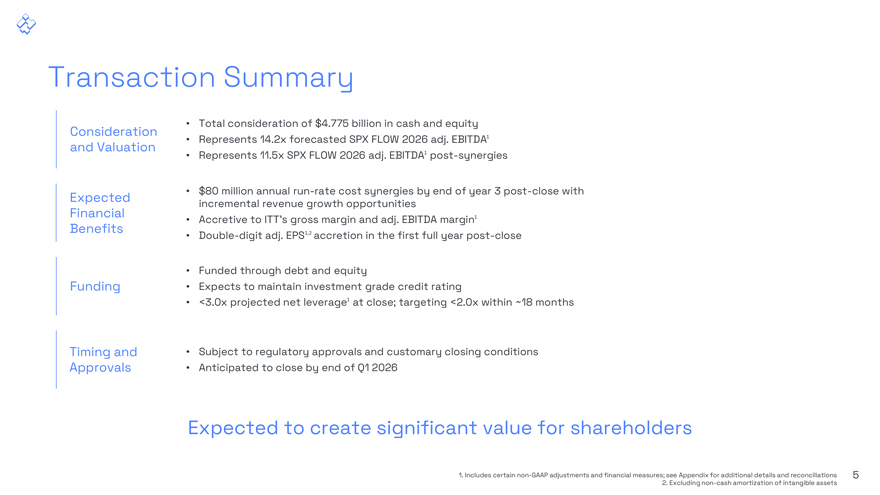
Transaction Summary Consideration and Valuation Total consideration of $4.775 billion in cash and equity Represents 14.2x forecasted SPX FLOW 2026 adj. EBITDA1 Represents 11.5x SPX FLOW 2026 adj. EBITDA1 post-synergies Expected Financial Benefits $80 million annual run-rate cost synergies by end of year 3 post-close with incremental revenue growth opportunities Accretive to ITT’s gross margin and adj. EBITDA margin1 Double-digit adj. EPS1,2 accretion in the first full year post-close Funding Funded through debt and equity Expects to maintain investment grade credit rating <3.0x projected net leverage1 at close; targeting <2.0x within ~18 months Timing and Approvals Subject to regulatory approvals and customary closing conditions Anticipated to close by end of Q1 2026 Expected to create significant value for shareholders 1. Includes certain non-GAAP adjustments and financial measures; see Appendix for additional details and reconciliations 5
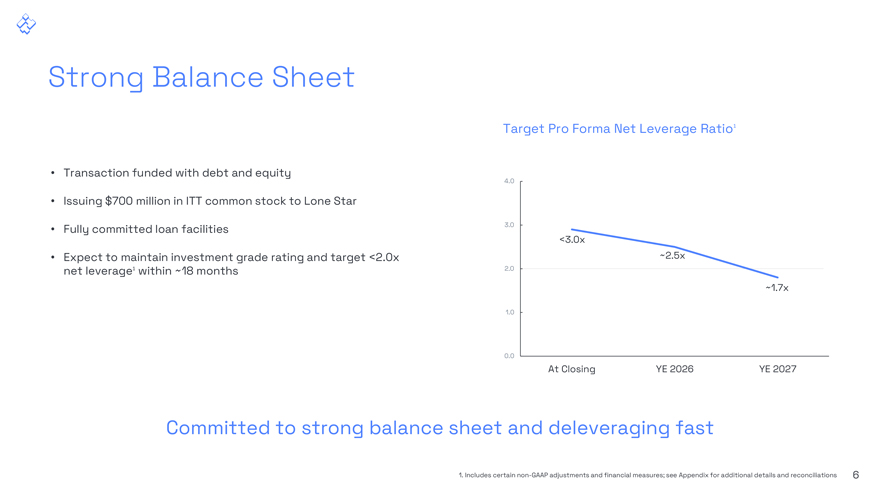
Strong Balance Sheet Target Pro Forma Net Leverage Ratio1 Transaction funded with debt and equity Issuing $700 million in ITT common stock to Lone Star Fully committed loan facilities Expect to maintain investment grade rating and target <2.0x net leverage1 within ~18 months 4.0 3.0 2.0 1.0 0.0 At Closing YE 2026 YE 2027 Committed to strong balance sheet and deleveraging fast 1. Includes certain non-GAAP adjustments and financial measures; see Appendix for additional details and reconciliations 6
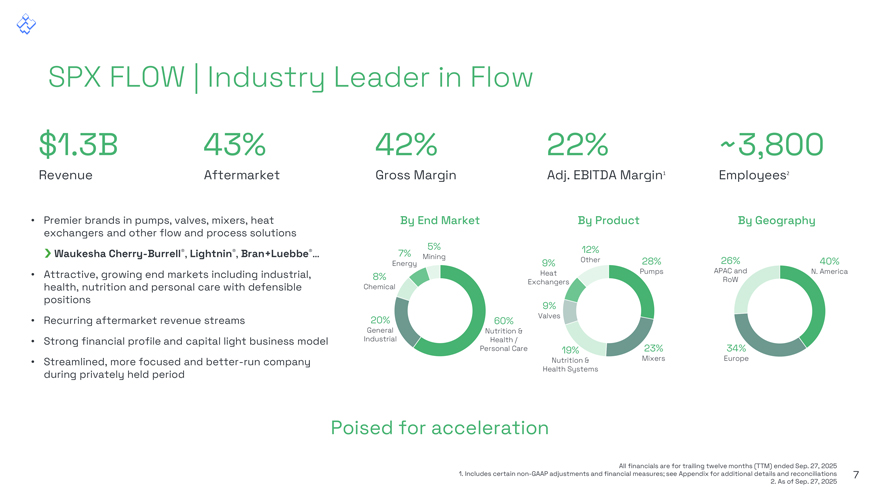
SPX FLOW | Industry Leader in Flow $1.3B Revenue 43% Aftermarket 42% Gross Margin 22% Adj. EBITDA Margin1 ~3,800 Employees2 Premier brands in pumps, valves, mixers, heat exchangers and other flow and process solutions By End Market By Product By Geography Waukesha Cherry-Burrell®, Lightnin®, Bran+Luebbe®… Attractive, growing end markets including industrial, 7% Energy 8% 5% Mining 9% Heat 12% Other 28% Pumps 26% APAC and 40% N. America health, nutrition and personal care with defensible positions Recurring aftermarket revenue streams Strong financial profile and capital light business model Streamlined, more focused and better-run company during privately held period Chemical 20% General Industrial 60% Nutrition & Health / Personal Care Exchangers 9% Valves 19% Nutrition & Health Systems 23% Mixers RoW 34% Europe Poised for acceleration All financials are for trailing twelve months (TTM) ended Sep. 27, 2025 1. Includes certain non-GAAP adjustments and financial measures; see Appendix for additional details and reconciliations 7 2. As of Sep. 27, 2025
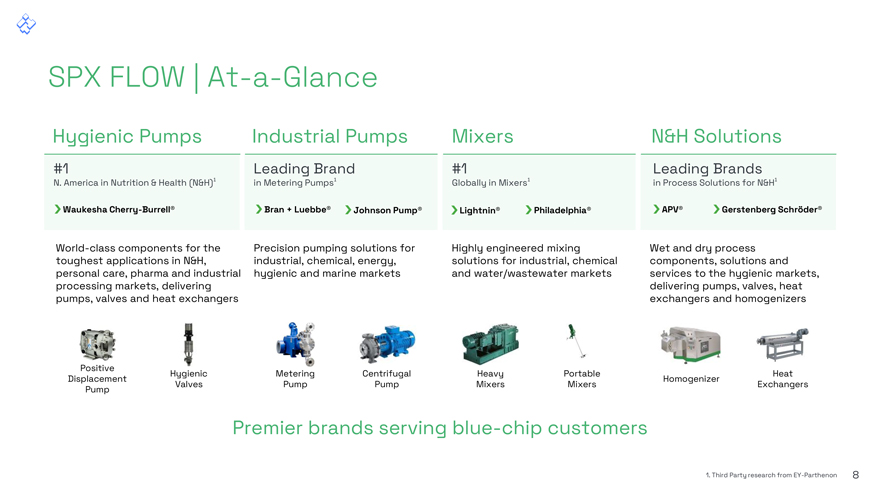
SPX FLOW | At-a-Glance Positive Displacement Pump Hygienic Valves Metering Pump Centrifugal Pump Heavy Mixers Portable Mixers Homogenizer Heat Exchangers Premier brands serving blue-chip customers
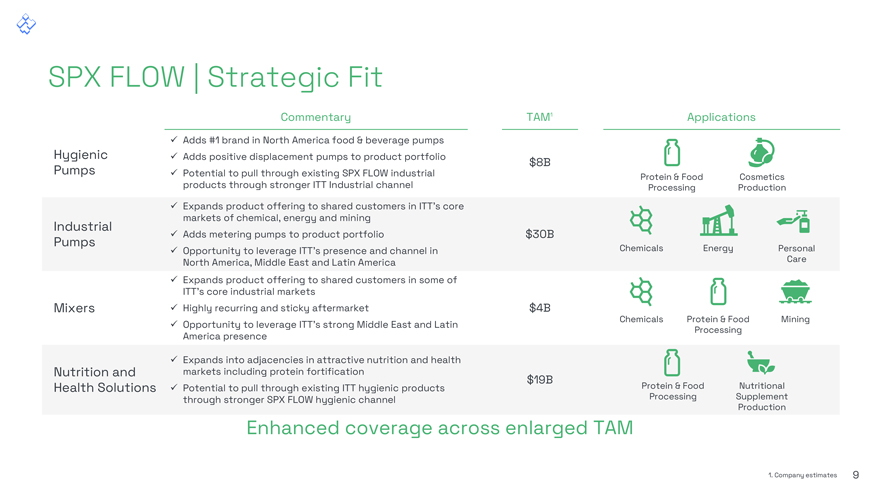
SPX FLOW | Strategic Fit Commentar TAM1 Applications Hygienic Pumps Adds #1 brand in North America food & beverage pumps Adds positive displacement pumps to product portfolio Potential to pull through existing SPX FLOW industrial products through stronger ITT Industrial channel $8B Protein & FoodCosmetics ProcessingProduction Industrial Pumps Expands product offering to shared customers in ITT’s core markets of chemical, energy and mining Adds metering pumps to product portfolio Opportunity to leverage ITT’s presence and channel in North America, Middle East and Latin America $30B ChemicalsEnergyPersonal Care Mixers Expands product offering to shared customers in some of ITT’s core industrial markets Highly recurring and sticky aftermarket Opportunity to leverage ITT’s strong Middle East and Latin America presence $4B ChemicalsProtein & FoodMining Processing Nutrition and Health Solutions Expands into adjacencies in attractive nutrition and health markets including protein fortification Potential to pull through existing ITT hygienic products through stronger SPX FLOW hygienic channel $19BProtein & FoodNutritional ProcessingSupplement Production Enhanced coverage across enlarged TAM
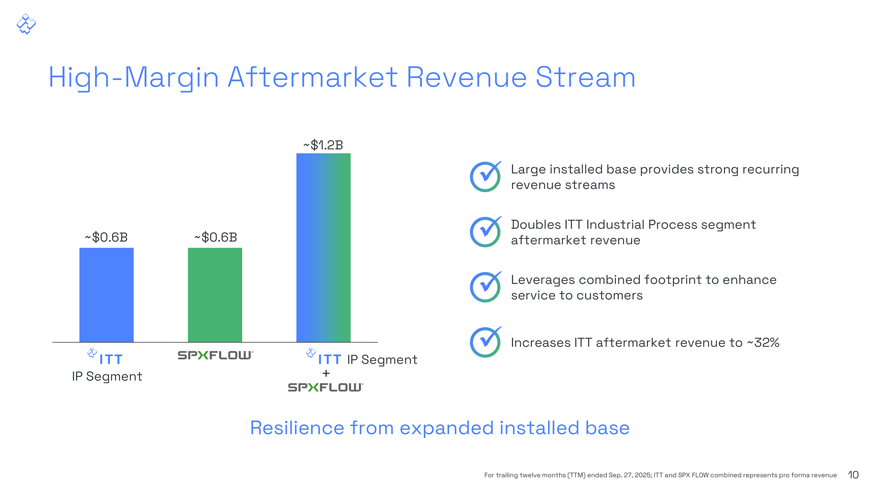
High-Margin Aftermarket Revenue Stream IP Segment ~$1.2B + IP Segment Large installed base provides strong recurring revenue streams Doubles ITT Industrial Process segment aftermarket revenue Leverages combined footprint to enhance service to customers Increases ITT aftermarket revenue to ~32% Resilience from expanded installed base
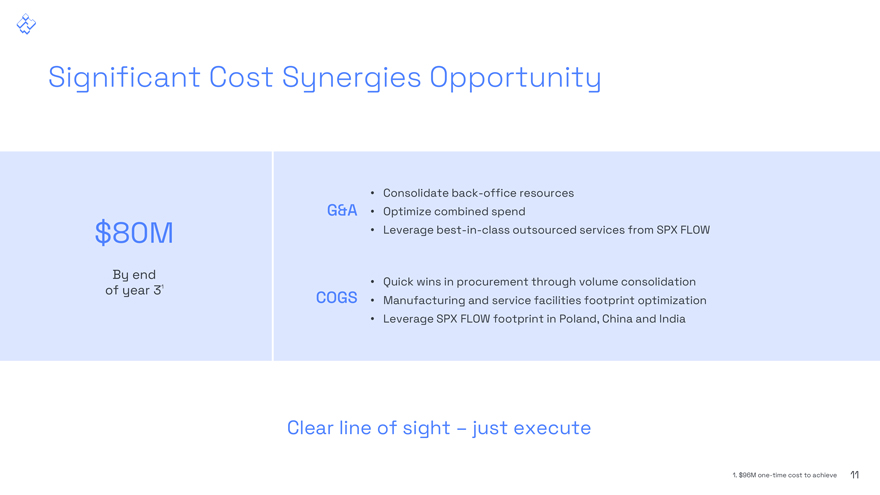
Significant Cost Synergies Opportunity Clear line of sight – just execute

Outstanding Cultural Fit Leader in highly engineered, critical components for harsh environment applications Global perspective Relentless granularity, depth of understanding Continuous improvement over and over and over Focus on the fundamentals through SQDC Decentralized structure with unprecedented accountability Entrepreneurial mindset Putting the customer at the center of everything we do Leader in highly engineered, critical components with blue-chip customers Global perspective Real-time, data-driven insights for decision making Continuous improvement mindset 80/20 operating system Shifted from functional to fully accountable business unit model Empowered team Aligned, customer-centric cultures 12
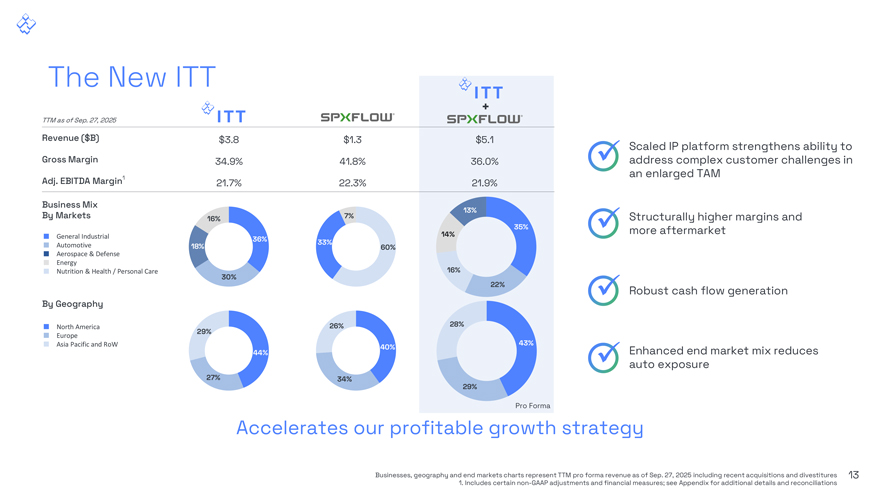
The New ITT Scaled IP platform strengthens ability to address complex customer challenges in an enlarged TAM Structurally higher margins and more aftermarket Robust cash flow generation Enhanced end market mix reduces auto exposure Accelerates our profitable growth strategy
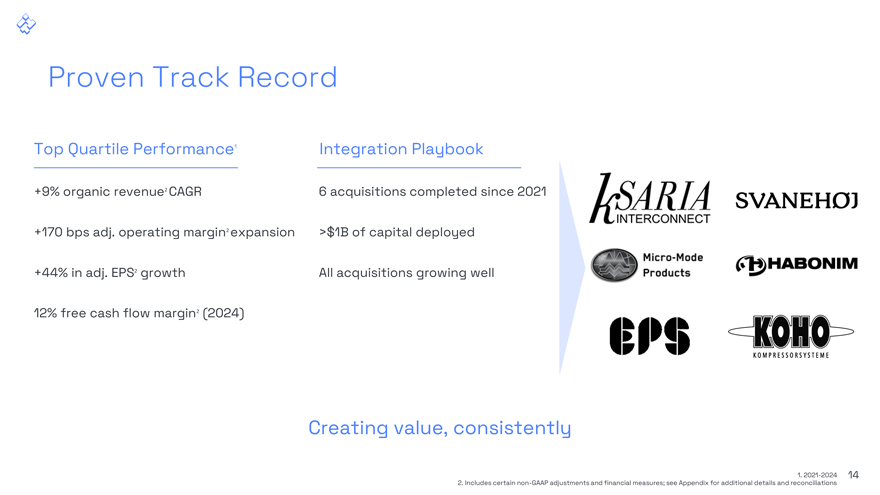
Proven Track Record Top Quartile Performance1 +9% organic revenue2 CAGR +170 bps adj. operating margin2 expansion +44% in adj. EPS2 growth 12% free cash flow margin2 (2024) Integration Playbook 6 acquisitions completed since 2021 >$1B of capital deployed All acquisitions growing well Creating value, consistently
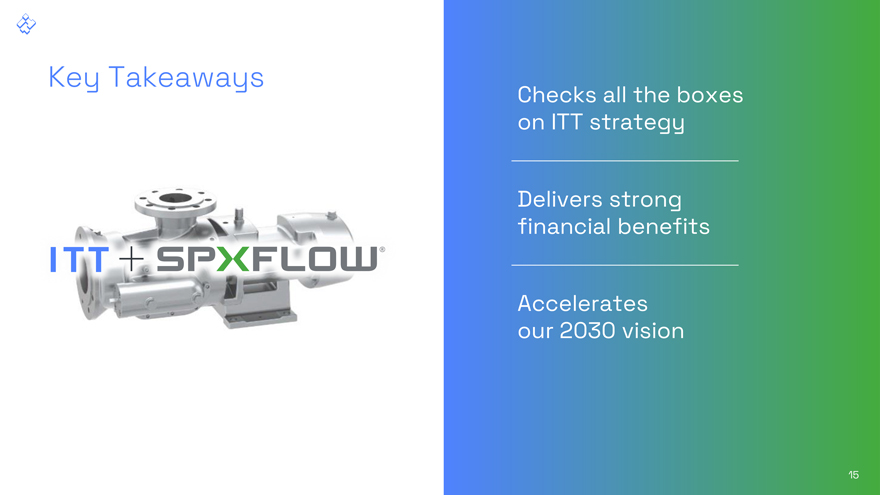
Key Takeaways

Appendix
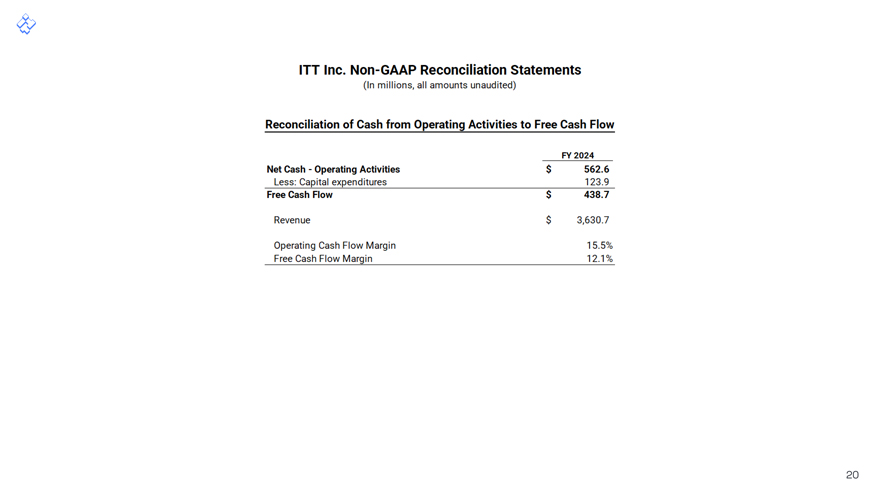
Key Performance Indicators & Non-GAAP Measures ITT reviews a variety of key performance indicators that we consider to be useful to management and investors when evaluating our operating performance for the periods presented. These measures provide a tool for evaluating our ongoing operations and management of assets from period to period. This information can assist investors in assessing our financial performance and measures our ability to generate capital for deployment among competing strategic alternatives and initiatives, including, but not limited to, acquisitions, dividends, and share repurchases. Some of these metrics, however, are not measures of financial performance under accounting principles generally accepted in the United States of America (GAAP) and should not be considered a substitute for measures determined in accordance with GAAP. We consider the following non-GAAP measures, which may not be comparable to similarly titled measures reported by other companies, to be key performance indicators for purposes of our reconciliation tables. Organic Revenue is defined as revenue excluding the impacts of foreign currency fluctuations, acquisitions, and divestitures that may or may not qualify as discontinued operations. Current year activity from acquisitions is excluded for twelve months following the closing date of acquisition. The period-over-period change resulting from foreign currency fluctuations is estimated using a fixed exchange rate for both the current and prior periods. Prior year revenue is adjusted to exclude activity during the comparabl e period for twelve months post-closing date for divestitures that do not qualify as discontinued operations. We believe that reporting organic revenue provides useful information to investors by hel ping identify underlying trends in our business and facilitating comparisons of our revenue performance with prior and future periods and to our peers. EBITDA is defined as earnings before net interest expense, taxes, depreciation and amortization. Adjusted EBITDA is defined as EBITDA adjusted to exclude acquisition- and divestiture-related costs and special items that include, but are not limited to, restructuring, certain asset impairment charges, and unusual or infrequent items. Adjusted EBITDA margin is defined as adjusted EBITDA divided by revenue. We believe that adjusted EBITDA and adjusted EBITDA margin are useful to investors and other users of our financial statements in evaluating ongoing operating profitability, as well as in evaluating operating performance in relation to our competitors. Adjusted Income from Continuing Operations is defined as income from continuing operations attributable to ITT Inc. adjusted to exclude special items that include, but are not limited to, restructuring, certain asset impairment charges, certain acquisition- and divestiture-related impacts, income tax settlements or adjustments, and unusual or infrequent items. Special items represent charges or credits, on an after-tax basis, that impact current results, which management views as unrelated to the Company’s ongoing operations and performance. The after-tax basis of each special item is determined using the jurisdictional tax rate of where the expense or benefit occurred and the tax deductibility under local tax rules. Adjusted Income from Continuing Operations per Diluted Share (adjusted EPS) is defined as adjusted income from continuing operations divided by diluted weighted average common shares outstanding. We believe that adjusted income from continuing operations and adjusted EPS are useful to investors and other users of our financial statements in evaluating ongoing operating profitability, as well as in evaluating operating performance in relation to our competitors. Free Cash Flow is defined as net cash provided by operating activities less capital expenditures net of capital-related government incentives. Free Cash Flow Margin is defined as free cash flow divided by revenue. We believe that free cash flow and free cash flow margin provide useful information to investors as it provides insight into a primary cash flow metric used by management to monitor and evaluate cash flows generated by our operations. Net leverage is defined as net debt divided by adjusted EBITDA. It is not possible, without unreasonable efforts, to estimate the impacts of foreign currency fluctuations, acquisitions and certain other special items that may occur in the future as these items are inherently uncertain and difficult to predict. As a result, we are unable to quantify certain amounts that would be included in a reconciliation of SPX FLOW’s forecasted 2026 adjusted EBITDA and ITT’s projected and target net leverage ratio, 2030 target adjusted EPS and adjusted EBITDA margin to the most directly comparable GAAP financial measures without unreasonable efforts and accordingly we have not provided reconciliations for these forward-looking non-GAAP financial measures.


ITT Inc., SPX FLOW and Pro Forma Combined Non-GAAP Reconciliation Statements (In millions; all amounts unaudited) Reconciliation of Income from Continuing Operations to Adjusted EBITDA Trailing Twelve Months ended September 27, 2025 Proforma ITTSPX FLOW Combined Reported Income from continuing operations $481.7 $45.5 Depreciation and amortization 144.5 126.1 Interest, net 37.9 123.6 Income taxes 143.7 (14.2) Reported EBITDA $807.8 $281.0 $1,088.8 Gain(loss) on sale of business — (1.0) Restructuring costs 15.0 8.4 Acquisition-related costs 3.2 6.5 Other special items 2.1 1.5 Adjusted EBITDA $828.1 $296.4 $1,124.5 Reported EBITDA Margin 21.2% 21.1% 21.2% Impact of special item adjustments 50 bps 120 bps 70 bps Adjusted EBITDA Margin 21.7% 22.3% 21.9%