

Managed Distribution Policy
Adams Natural Resources Fund, Inc. (the “Fund”) employs a Managed Distribution Policy (“MDP”) to enhance long-term shareholder value by paying level quarterly distributions at a committed rate of 8% of average net asset value (“NAV”) per year. The Fund pays distributions four times a year. Distributions under the MDP can be derived from net investment income, realized capital gains, or possibly, returns of capital, and are payable in newly issued shares of common stock unless a shareholder specifically elects to receive cash. The Fund has committed to distribute 2% of average NAV for each quarterly distribution, with the fourth quarter distribution to be the greater of 2% of average NAV or the amount needed to satisfy minimum distribution requirements of the Internal Revenue Code for regulated investment companies. Average NAV is based on the average of the previous four quarter-end NAVs per share prior to each declaration date.
With each distribution, the Fund will issue a notice to shareholders that will provide detailed information regarding the amount and composition of the distribution and other related information. The amounts and sources of distributions reported in the notice to shareholders are only estimates and are not being provided for tax reporting purposes. The actual amounts and sources of the distributions for tax reporting purposes will depend upon the Fund’s investment experience during its fiscal year and may be subject to changes based on tax regulations. Shareholders will receive a Form 1099-DIV in January for the previous calendar year that will indicate how to report these distributions for federal income tax purposes.
Disclaimers
The primary purpose of the MDP is to provide shareholders with a constant, but not guaranteed, rate of distribution each quarter. You should not draw any conclusions about the Fund’s investment performance from the amount of the current distribution or from the terms of the Fund’s MDP. The Board may amend or terminate the MDP at any time without prior notice to shareholders. However, at this time, there are no reasonably foreseeable circumstances that might cause the termination of the MDP.
Letter to Shareholders
Dear Fellow Shareholders,
U.S. equities posted a double-digit advance in the first half of 2026 despite persistent concerns about geopolitics, stubborn inflation, and elevated interest rates. Continued strength in semiconductor stocks and those exposed to artificial intelligence (AI), strong corporate earnings, and resilient economic activity propelled the S&P 500 Index to a second quarter return of 15.2% and a 10.2% year-to-date advance. While these dynamics led to volatile day-to-day fluctuations, markets proved resilient and the broader uptrend remained intact. In  the end, the market rewarded fundamentals more than the flood of news stories, and companies delivering strong earnings and cash flow growth led the way.
“First-half returns in the Energy sector were strong across the board, with all five industry groups advancing sharply.”
Market leadership evolved over the period. Cyclical and value-oriented sectors showed periods of relative strength, supported by higher commodity prices and rising interest rates. Value stocks outperformed growth across the period, while small- and mid-capitalization names broadly outpaced their larger-cap peers.
Investors navigated an evolving macro backdrop, including a recalibration of the interest rate outlook fueled by new leadership at the Federal Reserve (Fed), resilient economic data, and uneven inflation signals. At the start of the year, the Fed and market participants broadly expected interest rate cuts. Those forecasts were gradually scaled back and replaced with the possibility of a more prolonged or restrictive policy stance.
The Energy sector was one of the strongest sectors in the S&P 500, generating a 19.7% return in the first half of 2026. Energy’s gains were fueled in large part by the spike in oil prices in response to the war in Iran. West Texas Intermediate (WTI) crude oil prices began the year below $60 per barrel. As the war began in late February, WTI prices rose immediately as Iran retaliated and closed the Strait of Hormuz, a critical transit route for global energy flows. Oil surged more than 50% in March and more than 70% in the first quarter overall, briefly pushing above $110 per barrel for the first time since 2022. Prices remained elevated—and exceedingly volatile—in April and May, before falling below $70 per barrel at the end of June as market fears of sustained disruptions eased.
The rapid rise and subsequent retracement in oil prices underscored the extent to which oil markets re-priced quickly in response to news—pricing in disruptions immediately and adjusting just as quickly as those risks appeared to diminish. Energy stocks pre-empted the move in crude oil prices, peaking at the end of March and then declining 13.5% in the second quarter.
Letter to Shareholders (continued)
U.S. natural gas prices rose sharply early in the year, but declined for the first half, reflecting strong domestic supply and a market that is largely insulated from global disruptions. In contrast, global liquefied natural gas (LNG) prices remained elevated amid expectations that supply disruptions in the Middle East will be longer-lasting due to impaired LNG infrastructure. While short-term price movements were mixed, the outlook for U.S. natural gas remains constructive in our view, supported by expanding LNG export capacity and growing electricity demand, much of which comes from data center development and AI-related infrastructure.
First-half returns in the Energy sector were strong across the board, with all five industry groups advancing sharply. Refining & Marketing was by far the best performing group, posting a 50.8% gain. Refined product prices expanded in response to disruptions caused by the war, which supported rising earnings and cash flow expectations. Storage & Transportation and Equipment & Services stocks also outpaced the benchmark. Surprisingly, the two groups most directly exposed to changes in the commodity prices (Integrated Oil & Gas and Exploration & Production) underperformed the sector.
The Materials sector also outperformed the S&P 500, advancing 12.0%. The closing of the Strait of Hormuz, where meaningful global supply of many foundational chemicals is sourced, led to strong performance from chemicals and agricultural stocks. Inversely, those companies that rely on some of these key inputs, like Construction Materials and Containers & Packaging stocks, underperformed the sector in the first half of 2026.
Our Fund posted an 18.4% return on net asset value, outperforming the Fund’s benchmark return of 18.1% for the six-month period. Both Energy and Materials contributed to our Fund’s outperformance during the period. Our Energy holdings generated a 20.0% return, slightly outpacing the Index’s 19.7%. On the Materials side, we posted a 13.0% gain, compared to 12.0% for the benchmark.
Within Energy, the Storage & Transportation group was the largest contributor to relative performance, with the Fund’s holdings rising 29.1% compared with 26.8% for the benchmark. Targa Resources was the key driver of this performance. The company maintains one of the largest oil and natural gas infrastructure networks in the Permian Basin, providing it with above average growth opportunities and making it one of the biggest beneficiaries from U.S. production growth. It also benefits from the maturity of U.S. oil production, which requires higher levels of processing over time.
Integrated Oil & Gas was also a meaningful contributor to performance, led by strength from our holding in Canada-based oil sands producer Cenovus Energy. Shares surged alongside the sharp rise in oil prices during the first quarter, with the company’s extensive oil sands resource providing a key advantage during a period of elevated crude prices. We sold the position in the second quarter after Cenovus outperformed the Energy sector by over 45%.
In Materials, the Chemicals group was the leading contributor to performance. Sherwin-Williams is the largest global provider of paints and coatings for residential and industrial customers. After underperforming the sector by 14%
2
Letter to Shareholders (continued)
through the first four months of the year due to concerns about rising input costs, we moved to an overweight position in the middle of May. As tensions eased in the Middle East, the stock recovered some of its recent weakness, adding to the Fund’s performance.
The Metals & Mining group was also a source of strength, driven by our position in Nucor Corporation. As the largest U.S.-based steel company, the stock benefited from resilient steel demand and favorable steel pricing trends. The company also reported strong earnings supported by robust shipments, higher utilization, and an improving backlog.
For the six months ended June 30, 2026, the total return on the Fund’s net asset value (“NAV”) per share (with dividends and capital gains reinvested) was 18.4%. This compared to the 18.1% total return for the Fund’s benchmark, comprised of the S&P 500 Energy Sector (80% weight) and the S&P 500 Materials Sector (20% weight). The total return on the market price of the Fund’s shares for the period was 18.2%.
For the twelve months ended June 30, 2026, the Fund’s total return on NAV was 26.5%. Comparable return for the Fund’s benchmark was 26.5%. The Fund’s total return on market price was 25.9%.
During the first half of this year, the Fund paid distributions to shareholders in the amount of $27.9 million, or $1.01 per share. On July 16, 2026, an additional distribution of $.54 per share was declared for payment on August 26, 2026.
As we look ahead to the rest of 2026 and beyond, our approach remains unchanged. Amid ongoing uncertainty and shifting market conditions, we remain focused on underlying fundamentals, maintaining a disciplined investment process, and—perhaps most importantly—managing risk. We continue to be mindful of the range of macroeconomic and geopolitical considerations facing markets. However, we also recognize that near-term developments can drive bouts of volatility without necessarily altering the market’s broader trajectory.
We saw this in the first half of this year, which reinforced the importance of consistency and selectivity. Whatever the future holds, we will continue to “stick to our knitting,” emphasizing companies with strong execution, durable earnings growth, and identifiable sources of long-term value creation, while remaining measured in how we take risk and position portfolios in an evolving environment.
By order of the Board of Directors,
| |
James P. Haynie, CFA
Chief Executive Officer |
| |
Gregory W. Buckley
President |
|
July 16, 2026
3
Portfolio Highlights
June 30, 2026
(unaudited)
(unaudited)
Ten Largest Equity Portfolio Holdings
| | | |
Market Value
|
| |
Percent of
Net Assets |
| ||||||
| Exxon Mobil Corporation | | | | $ | 184,073,656 | | | | | | 23.9% | | |
| Chevron Corporation | | | | | 97,238,794 | | | | | | 12.6 | | |
| ConocoPhillips | | | | | 46,189,740 | | | | | | 6.0 | | |
| Williams Companies, Inc. | | | | | 31,613,085 | | | | | | 4.1 | | |
| Valero Energy Corporation | | | | | 29,612,028 | | | | | | 3.8 | | |
| Linde plc | | | | | 27,867,078 | | | | | | 3.6 | | |
| SLB Ltd. | | | | | 25,459,458 | | | | | | 3.3 | | |
| Targa Resources Corp. | | | | | 24,561,624 | | | | | | 3.2 | | |
| Phillips 66 | | | | | 23,916,349 | | | | | | 3.1 | | |
| Marathon Petroleum Corporation | | | | | 20,431,101 | | | | | | 2.7 | | |
| | | | | $ | 510,962,913 | | | | | | 66.3% | | |
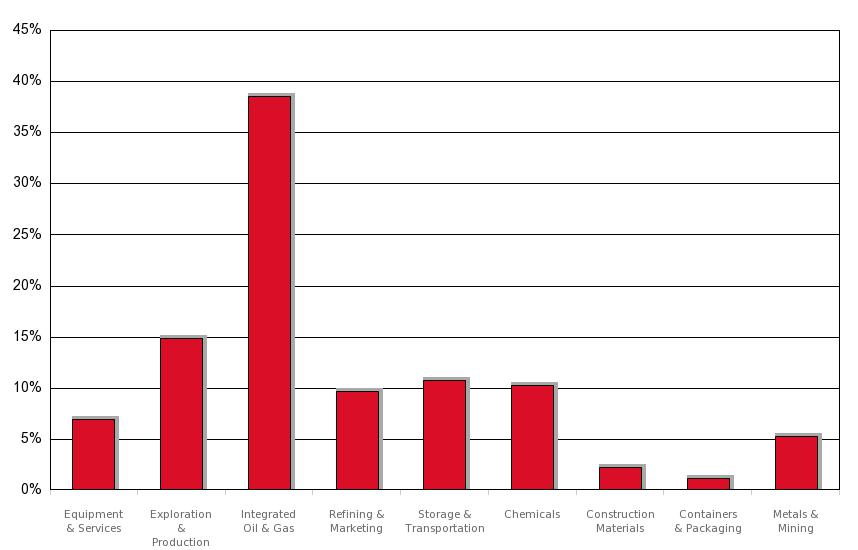
Industry Weightings as a Percent of Net Assets
4
Statement of Assets and Liabilities
June 30, 2026
(unaudited)
(unaudited)
| |
Assets
|
| | | | | | | | | | | | |
| | Investments at value*: | | | | | | | | | | | | | |
| |
Common stocks (cost $536,131,131)
|
| | | $ | 762,932,855 | | | | | | | | |
| |
Short-term investments (cost $6,410,603)
|
| | | | 6,409,252 | | | | | $ | 769,342,107 | | |
| | Cash | | | | | | | | | | | 150,208 | | |
| | Dividends receivable | | | | | | | | | | | 328,466 | | |
| | Prepaid expenses and other assets | | | | | | | | | | | 2,185,480 | | |
| |
Total Assets
|
| | | | | | | | | | 772,006,261 | | |
| | | | | | | | | | | | | | | |
| | Liabilities | | | | | | | | | | | | | |
| | Due to officers and directors (note 8) | | | | | | | | | | | 636,300 | | |
| | Accrued expenses and other liabilities | | | | | | | | | | | 2,222,347 | | |
| |
Total Liabilities
|
| | | | | | | | | | 2,858,647 | | |
| |
Net Assets
|
| | | | | | | | | $ | 769,147,614 | | |
| | | | | | | | | | | | | | | |
| | Net Assets | | | | | | | | | | | | | |
| |
Common Stock at par value $0.001 per share, authorized
50,000,000 shares; issued and outstanding 28,034,839 shares (includes 6,565 deferred stock units) (note 7) |
| | | | | | | | | $ | 28,035 | | |
| | Additional capital surplus | | | | | | | | | | | 525,562,543 | | |
| | Total distributable earnings (loss) | | | | | | | | | | | 243,557,036 | | |
| |
Net Assets Applicable to Common Stock
|
| | | | | | | | | $ | 769,147,614 | | |
| |
Net Asset Value Per Share of Common Stock
|
| | | | | | | | | $ | 27.44 | | |
*
See Schedule of Investments beginning on page 15.
The accompanying notes are an integral part of the financial statements.
5
Statement of Operations
Six Months Ended June 30, 2026
(unaudited)
(unaudited)
| | Investment Income | | | | | | ||
| |
Income:
|
| | | | | ||
| |
Dividends (net of $4,103 in foreign taxes)
|
| | | $ | 10,176,879 | ||
| |
Other income
|
| | | | 144,684 | ||
| |
Total Income
|
| | | | 10,321,563 | ||
| |
Expenses:
|
| | | | | ||
| |
Investment research compensation and benefits
|
| | | | 961,432 | ||
| |
Administration and operations compensation and benefits
|
| | | | 454,641 | ||
| |
Occupancy and other office expenses
|
| | | | 134,631 | ||
| |
Investment data services
|
| | | | 106,004 | ||
| |
Directors’ compensation
|
| | | | 201,375 | ||
| |
Shareholder reports and communications
|
| | | | 85,624 | ||
| |
Transfer agent, custody, and listing fees
|
| | | | 81,401 | ||
| |
Accounting, recordkeeping and other professional fees
|
| | | | 59,763 | ||
| |
Insurance
|
| | | | 30,247 | ||
| |
Audit and tax services
|
| | | | 70,254 | ||
| |
Legal services
|
| | | | 10,124 | ||
| |
Total Expenses
|
| | | | 2,195,496 | ||
| |
Net Investment Income
|
| | | | 8,126,067 | ||
| | | | | | | | ||
| | Realized Gain (Loss) and Change in Unrealized Appreciation | | | | | | ||
| |
Net realized gain (loss) on investments
|
| | | | 30,780,961 | ||
| |
Net realized gain (loss) on total return swap agreements
|
| | | | 1,173,689 | ||
| |
Change in unrealized appreciation on investments
|
| | | | 81,049,996 | ||
| |
Change in unrealized appreciation on total return swap agreements
|
| | | | (369,112) | | |
| |
Net Gain (Loss)
|
| | |
|
112,635,534
|
||
| | Change in Net Assets from Operations | | | |
$
|
120,761,601
|
||
The accompanying notes are an integral part of the financial statements.
6
Statements of Changes in Net Assets
| | | |
(unaudited)
Six Months Ended June 30, 2026 |
| |
Year Ended
December 31, 2025 |
| ||||||
| From Operations: | | | | | | | | | | | | | |
|
Net investment income
|
| | | $ | 8,126,067 | | | | | $ | 16,270,848 | | |
|
Net realized gain (loss)
|
| | | | 31,954,650 | | | | | | 41,858,264 | | |
|
Change in unrealized appreciation
|
| | | | 80,680,884 | | | | | | (3,367,544) | | |
|
Change in Net Assets from Operations
|
| | | | 120,761,601 | | | | | | 54,761,568 | | |
| | | | | | | | | | | | | | |
| Distributions to Shareholders from: | | | | | | | | | | | | | |
|
Total distributable earnings
|
| | | | (27,911,900) | | | | | | (54,794,247) | | |
| | | | | | | | | | | | | | |
| From Capital Share Transactions: | | | | | | | | | | | | | |
|
Value of shares issued in payment of distribution (note 5)
|
| | | | 13,879,294 | | | | | | 26,116,900 | | |
|
Total Change in Net Assets
|
| | | | 106,728,995 | | | | | | 26,084,221 | | |
| | | | | | | | | | | | | | |
| Net Assets: | | | | | | | | | | | | | |
|
Beginning of period
|
| | | | 662,418,619 | | | | | | 636,334,398 | | |
|
End of period
|
| | | $ | 769,147,614 | | | | | $ | 662,418,619 | | |
The accompanying notes are an integral part of the financial statements.
7
Notes to Financial Statements (unaudited)
Adams Natural Resources Fund, Inc. (the “Fund”) is registered under the Investment Company Act of 1940 (“1940 Act”) as a non-diversified investment company. The Fund is an internally managed closed-end fund specializing in energy and other natural resources stocks. The investment objectives of the Fund are preservation of capital, the attainment of reasonable income from investments, and an opportunity for capital appreciation.
1. SIGNIFICANT ACCOUNTING POLICIES
Basis of Presentation — The Fund is an investment company and applies the accounting and reporting guidance of the Financial Accounting Standards Board (“FASB”) Accounting Standards Codification Topic 946 Financial Services - Investment Companies. The accompanying financial statements were prepared in accordance with accounting principles generally accepted in the United States of America (“GAAP”), which require the use of estimates by Fund management. Management believes that estimates and valuations are appropriate; however, actual results may differ from those estimates and the valuations reflected in the financial statements may differ from the value the Fund ultimately realizes. Additionally, unpredictable events such as natural disasters, war, terrorism, global pandemics, and similar public health threats may significantly affect the economy, markets, and companies in which the Fund invests. The Fund could be negatively impacted if the value of portfolio holdings are harmed by such events.
Affiliates — Adams Diversified Equity Fund, Inc. (“ADX”), a diversified, closed-end investment company, owns 9.5% of the Fund’s outstanding shares and is, therefore, an “affiliated company” as defined by the 1940 Act. During the six months ended June 30, 2026, the Fund paid distributions of $2,624,007 to ADX. Directors of the Fund are also directors of ADX. The Fund, ADX, and Adams Funds Advisers, LLC (“AFA”), an ADX-affiliated investment adviser to external parties, have a shared management team.
Distributions — Distributions to shareholders are recorded on the ex-dividend date. The Fund employs a Managed Distribution Policy (“MDP”) that pays level quarterly distributions at a committed rate of 8% of average net asset value per year. Average net asset value is based on the average of the previous four quarter-end net asset values per share prior to the declaration date. Distributions are generated from portfolio income and capital gains derived from managing the portfolio and are initially recorded as a distribution from total distributable earnings and reclassified to distributions from income and capital gains at the end of the tax year, based on the Fund’s total taxable income and realized capital gains for the full year. If such earnings do not meet the distribution commitment, or it’s deemed in the best interest of shareholders, the Fund may return capital. A return of capital is not taxable to shareholders and does not necessarily reflect the Fund’s investment performance.
Expenses — The Fund shares personnel, systems, and other infrastructure items with ADX and AFA and is charged a portion of the shared expenses. To protect the Fund from potential conflicts of interest, policies and procedures are in place covering the sharing of expenses among the entities. Expenses solely attributable to an entity are charged to that entity. Expenses that are not solely attributable to one entity are allocated in accordance with the Fund’s expense sharing policy. The Fund’s policy dictates that expenses, other than those related to personnel, are attributed to AFA based on the average estimated amount of time spent by all personnel on AFA-related activities relative to overall job functions; the remaining portion is attributed to the Fund and ADX based on relative net
8
Notes to Financial Statements (continued)
assets excluding affiliated holdings. Personnel-related expenses are attributed to AFA based on the individual’s time spent on AFA-related activities; the remaining portion is attributed to the Fund and ADX based on relative market values of portfolio securities covered for research staff and relative net assets excluding affiliated holdings for all others. Expense allocations are updated quarterly. Because AFA has no assets under management, only those expenses directly attributable to AFA are charged to AFA.
For the six months ended June 30, 2026, shared expenses totaled $9,502,339, of which $7,305,990 and $853 were charged to ADX and AFA, respectively, in accordance with the Fund’s expense sharing policy. There were no amounts due to, or due from, affiliated companies at June 30, 2026.
Investment Transactions and Income — The Fund’s investment decisions are made by the portfolio management team with recommendations from research analysts. Policies and procedures are in place covering the allocation of investment opportunities among the Fund and its affiliates to protect the Fund from potential conflicts of interest. Investment transactions are accounted for on trade date. Realized gains and losses on sales of investments are recorded on the basis of specific identification. Dividend income is recognized on the ex-dividend date.
Segment Reporting — The Fund’s primary business is to invest assets to generate returns from investment income and capital appreciation and is operated as a single segment in carrying out its investment objectives. The Fund’s management committee, comprised of the Fund’s chief executive officer, chief financial officer, and general counsel, serves as the chief operating decision maker in determining key operating decisions that include capital allocation and expense structure for the Fund and executing significant contracts on behalf of the Fund. All significant expense categories are presented on the Statement of Operations and are used for budgeting purposes. The management committee uses change in net assets from operations, as presented on the Statement of Operations, and total investment return based on net asset value and ratio of expenses to average net assets, as presented on the Financial Highlights, to assess fund performance and allocate resources.
Valuation — The Fund’s financial instruments are reported at fair value, which is defined as the price that would be received from selling an asset or paid to transfer a liability in an orderly transaction between market participants at the measurement date. The Fund has a Valuation Committee (“Committee”) so that financial instruments are appropriately priced at fair value in accordance with GAAP and the 1940 Act. Subject to oversight and approval by the Board of Directors, the Committee establishes methodologies and procedures to value securities for which market quotations are not readily available.
GAAP establishes the following hierarchy that categorizes the inputs used to measure fair value:
•
Level 1 — fair value is determined based on market data obtained from independent sources; for example, quoted prices in active markets for identical investments;
•
Level 2 — fair value is determined using other assumptions obtained from independent sources; for example, quoted prices for similar investments;
•
Level 3 — fair value is determined using the Fund’s own assumptions, developed based on the best information available under the circumstances.
Investments in securities traded on national exchanges are valued at the last reported sale price as of the close of regular trading on the relevant exchange on the day of
9
Notes to Financial Statements (continued)
valuation. Over-the-counter and listed equity securities for which a sale price is not available are valued at the last quoted bid price. Money market funds are valued at net asset value. These securities are generally categorized as Level 1 in the hierarchy.
Total return swap agreements are valued using independent, observable inputs, including underlying security prices, dividends, and interest rates. These securities are generally categorized as Level 2 in the hierarchy.
At June 30, 2026, the Fund’s financial instruments were classified as follows:
| | | |
Level 1
|
| |
Level 2
|
| |
Level 3
|
| |
Total
|
| ||||||||||||
| Assets: | | | | | | | | | | | | | | | | | | | | | | | | ||
| Common stocks | | | | $ | 762,932,855 | | | | | $ | — | | | | | $ | — | | | | | $ | 762,932,855 | ||
| Short-term investments | | | | | 6,409,252 | | | | | | — | | | | | | — | | | | | | 6,409,252 | ||
| Total investments | | | | $ | 769,342,107 | | | | | $ | — | | | | | $ | — | | | | | $ | 769,342,107 | ||
2. FEDERAL INCOME TAXES
No federal income tax provision is required since the Fund’s policy is to qualify as a regulated investment company under the Internal Revenue Code and to distribute substantially all of its taxable income and gains to its shareholders. Additionally, management has analyzed the tax positions included in federal income tax returns from the previous three years that remain subject to examination, and concluded no provision was required. Any income tax-related interest or penalties would be recognized as income tax expense. At June 30, 2026, the identified cost of securities for federal income tax purposes was $543,453,777 and net unrealized appreciation aggregated $225,888,331, consisting of gross unrealized appreciation of $256,352,838 and gross unrealized depreciation of $30,464,507.
Distributions are determined in accordance with the Fund’s MDP and income tax regulations, which may differ from GAAP. Such differences are primarily related to the Fund’s retirement plan, equity-based compensation, wash sales, and tax straddles for total return swaps. Differences that are permanent are reclassified in the capital accounts of the Fund’s annual financial statements and have no impact on net assets.
3. INVESTMENT TRANSACTIONS
Purchases and sales of portfolio investments, other than short-term investments, securities lending collateral, and derivative transactions, during the six months ended June 30, 2026 were $78,189,602 and $86,434,547, respectively.
4. DERIVATIVES
The Fund may invest in derivative instruments. The Fund uses derivatives for a variety of purposes, including, but not limited to, the ability to gain or limit exposure to particular market sectors or securities, to provide additional capital gains, to limit equity price risk in the normal course of pursuing its investment objectives, and/or to obtain leverage.
Total Return Swap Agreements — The Fund utilizes total return swap agreements in carrying out a paired trade strategy, where it enters into a long contract for a single stock and a short contract for a sector exchange-traded fund in comparable notional amounts. Total return swap agreements involve commitments based on a notional amount to pay interest in exchange for a market-linked return of a reference security. Upon closing a long contract, the Fund will receive a payment to the extent the total return of the reference security is positive for the contract period and exceeds the offsetting interest
10
Notes to Financial Statements (continued)
rate obligation or will make a payment if the total return is negative for the contract period. Upon closing a short contract, the Fund will receive a payment to the extent the total return of the reference security is negative for the contract period and exceeds the offsetting interest rate obligation or will make a payment if the total return is positive for the contract period. The fair value of each total return swap agreement is determined daily and the change in value is recorded as a change in unrealized appreciation on total return swap agreements in the Statement of Operations. Payments received or made upon termination during the period are recorded as a realized gain or loss on total return swap agreements in the Statement of Operations.
Total return swap agreements entail risks associated with counterparty credit, liquidity, and equity price risk. Such risks include that the Fund or the counterparty may default on its obligation, that there is no liquid market for these agreements, and that there may be unfavorable changes in the price of the reference security. To mitigate the Fund’s counterparty credit risk, the Fund enters into master netting and collateral arrangements with the counterparty. A master netting agreement allows either party to terminate the agreement prior to termination date and provides the ability to offset amounts the Fund owes the counterparty against the amounts the counterparty owes the Fund for a single net settlement. The Fund’s policy is to net all derivative instruments subject to a netting agreement and offset the value of derivative liabilities against the value of derivative assets. The net cumulative unrealized gain (asset) on open total return swap agreements or the net cumulative unrealized loss (liability) on open total return swap agreements is presented in the Statement of Assets and Liabilities. At June 30, 2026, there were no open total return swap agreements. During the six months ended June 30, 2026, the average daily notional amounts of open long and short total return swap agreements, an indicator of the volume of activity, were $2,835,901 and $(3,048,798), respectively.
A collateral arrangement requires each party to provide collateral with a value, adjusted daily and subject to a minimum transfer amount, equal to the net amount owed to the other party under the agreement. The counterparty provides cash collateral to the Fund and the Fund provides collateral by segregating portfolio securities, subject to a valuation allowance, into a tri-party account at its custodian. At June 30, 2026, there were no securities pledged as collateral and no cash collateral was held by the Fund.
5. CAPITAL STOCK
The Fund has 5,000,000 authorized and unissued preferred shares, $0.001 par value.
The Fund pays distributions four times a year under the MDP in newly issued shares of its Common Stock, unless a shareholder elects to receive cash. Shares are issued at the lower of the net asset value per share or the closing market price on the date of valuation. Additionally, the Fund issues shares as dividend equivalents to holders of deferred stock units under the 2005 Equity Incentive Compensation Plan.
The Fund may purchase shares of its Common Stock from time to time, in accordance with parameters set by the Board of Directors, at such prices and amounts as the portfolio management team deems appropriate. Additionally, the Fund will repurchase shares under the Fund’s enhanced discount management and liquidity program, subject to certain restrictions, when the discount exceeds 15% of net asset value for at least 30 consecutive trading days. The enhanced program also provides that the Fund will engage in a proportional tender offer to repurchase shares when the discount exceeds 19% of net asset value for 30 consecutive trading days, not to exceed one such offer in any twelve-month period.
11
Notes to Financial Statements (continued)
Transactions in its Common Stock for 2026 and 2025 were as follows:
| | | |
Shares
|
| |
Amount
|
| ||||||||||||||||||
| | | |
Six months
ended June 30, 2026 |
| |
Year ended
December 31, 2025 |
| |
Six months
ended June 30, 2026 |
| |
Year ended
December 31, 2025 |
| ||||||||||||
|
Shares issued in payment of distributions (at a weighted average discount from net asset value of 5.2% and 9.7%, respectively)
|
| | | | 532,985 | | | | | | 1,217,304 | | | | | $ | 13,879,294 | | | | | $ | 26,116,900 | | |
| Net change | | | | | 532,985 | | | | | | 1,217,304 | | | | | $ | 13,879,294 | | | | | $ | 26,116,900 | | |
6. RETIREMENT PLANS
The Fund sponsors a qualified defined contribution plan for all employees with at least six months of service and a nonqualified defined contribution plan for eligible employees to supplement the qualified plan. The Fund matches employee contributions made to the plans and, subject to Board approval, may also make a discretionary contribution to the plans. During the six months ended June 30, 2026, the Fund recorded matching contributions of $95,203 and a liability, representing the 2026 discretionary contribution, of $39,057.
7. EQUITY-BASED COMPENSATION
The Fund’s 2005 Equity Incentive Compensation Plan, adopted at the 2005 Annual Meeting and reapproved at the 2010 Annual Meeting, expired on April 27, 2015. Restricted stock units granted to non-employee directors that are 100% vested, but payment of which has been deferred by the election of the director, remain outstanding at June 30, 2026.
Outstanding awards were granted at fair market value on grant date (determined by the average of the high and low price on that date) and earn an amount equal to the Fund’s per share distribution, payable in reinvested shares, which are paid concurrently with the payment of the original share grant.
A summary of the activity during the six months ended June 30, 2026 is as follows:
|
Awards
|
| |
Units
|
| |
Weighted Average
Grant-Date Fair Value |
| ||||||
| Balance at December 31, 2025 | | | | | 6,378 | | | | | $ | 29.76 | | |
| Reinvested dividend equivalents | | | | | 187 | | | | | | 26.04 | | |
| Balance at June 30, 2026 | | | | | 6,565 | | | | | $ | 29.65 | | |
At June 30, 2026, the Fund had no unrecognized compensation cost. The total fair value of awards issued during the six months ended June 30, 2026 was $0.
8. OFFICER AND DIRECTOR COMPENSATION
The aggregate remuneration paid by the Fund during the six months ended June 30, 2026 to officers and directors amounted to $1,658,010, of which $201,375 was paid to non-employee directors. These amounts represent the taxable income to the Fund’s officers and directors and, therefore, may differ from the amounts reported in the accompanying Statement of Operations that are recorded and expensed in accordance with GAAP. At June 30, 2026, $636,300 was due to officers and directors, representing
12
Notes to Financial Statements (continued)
amounts related to estimated cash compensation and estimated retirement plan discretionary contributions payable to officers and reinvested dividend payments on deferred stock awards payable to directors.
9. PORTFOLIO SECURITIES LOANED
The Fund makes loans of securities to approved brokers to earn additional income. The loans are collateralized by cash and/or U.S. Treasury and government agency obligations valued at 102% of the value of the securities on loan. The market value of the loaned securities is calculated based upon the most recent closing prices and any additional required collateral is delivered to the Fund on the next business day. On loans collateralized by cash, the cash collateral is invested in a registered money market fund. The Fund accounts for securities lending transactions as secured financing and retains a portion of the income from lending fees and interest on the investment of cash collateral. The Fund also continues to receive dividends on the securities loaned. Gain or loss in the fair value of securities loaned that may occur during the term of the loan will be for the account of the Fund. At June 30, 2026, the Fund had no securities on loan. The Fund is indemnified by the custodian, serving as lending agent, for the loss of loaned securities and has the right under the lending agreement to recover the securities from the borrower on demand.
10. LEASES
The Fund and its affiliates lease office space and equipment under non-cancelable lease agreements expiring at various dates through 2033. Payments are made in aggregate pursuant to these agreements but are deemed variable for each entity, as the allocable portion to each entity fluctuates when applying the expense sharing policy among all affiliates at each payment date. Variable payments of this nature do not require recognition of an asset or an offsetting liability in the Statement of Assets and Liabilities and are recognized as rental expense on a straight-line basis over the lease term within occupancy and other office expenses in the Statement of Operations. During the six months ended June 30, 2026, the Fund recognized rental expense of $54,161.
11. COMMITMENTS AND CONTINGENCIES
In the normal course of business, the Fund enters into agreements that can expose the Fund to some risk of loss. The risk of future loss arising from any such agreements, while not quantifiable, is expected to be remote. As such, and as of the end of the reporting period, the Fund did not have any unfunded commitments. From time to time, the Fund may be a party to certain legal proceedings in the ordinary course of business, including proceedings relating to the enforcement of the Fund’s rights under contracts or within bylaws. As of the end of the reporting period, management has determined that any legal proceedings the Fund is subject to are unlikely to have a material impact to the Fund’s financial statements.
13
Financial Highlights
| | | |
(unaudited)
Six Months Ended |
| | | | | | | | | | | | | | | | ||||||||||||||||||||||||
| | | |
June 30,
2026 |
| |
June 30,
2025 |
| |
Year Ended December 31,
|
| |||||||||||||||||||||||||||||||||
| | | |
2025
|
| |
2024
|
| |
2023
|
| |
2022
|
| |
2021
|
| |||||||||||||||||||||||||||
|
Per Share Operating Performance
|
| | | | | | | | | | | | | | | | | | | | | | | | | | | | | | | | | | | | | | | | | | |
|
Net asset value, beginning of period
|
| | | | $24.09 | | | | | | $24.21 | | | | | | $24.21 | | | | | | $24.83 | | | | | | $25.85 | | | | | | $19.22 | | | | | | $13.76 | | |
|
Net investment income
|
| | | | 0.29 | | | | | | 0.29 | | | | | | 0.61 | | | | | | 0.63 | | | | | | 0.68 | | | | | | 0.80 | | | | | | 0.55 | | |
|
Net realized gain (loss) and change in unrealized appreciation
|
| | | | 4.10 | | | | | | 0.21 | | | | | | 1.42 | | | | | | 0.64 | | | | | | (0.28) | | | | | | 7.57 | | | | | | 5.86 | | |
| Total from operations | | | | | 4.39 | | | | | | 0.50 | | | | | | 2.03 | | | | | | 1.27 | | | | | | 0.40 | | | | | | 8.37 | | | | | | 6.41 | | |
| Less distributions from: | | | | | | | | | | | | | | | | | | | | | | | | | | | | | | | | | | | | | | | | | | | |
|
Net investment income
|
| | | | | | | | | | | | | | | | (0.56) | | | | | | (0.65) | | | | | | (0.65) | | | | | | (0.79) | | | | | | (0.56) | | |
|
Net realized gain
|
| | | | | | | | | | | | | | | | (1.49) | | | | | | (1.12) | | | | | | (0.70) | | | | | | (0.84) | | | | | | (0.35) | | |
| Total distributions | | | | | (1.01) (a) | | | | | | (1.05) (a) | | | | | | (2.05) | | | | | | (1.77) | | | | | | (1.35) | | | | | | (1.63) | | | | | | (0.91) | | |
|
Capital share repurchases (note 5)
|
| | | | — | | | | | | — | | | | | | — | | | | | | 0.01 | | | | | | 0.03 | | | | | | — | | | | | | — | | |
|
Reinvestment of distributions (note 5)
|
| | | | (0.03) | | | | | | (0.05) | | | | | | (0.10) | | | | | | (0.13) | | | | | | (0.10) | | | | | | (0.11) | | | | | | (0.04) | | |
| Total capital share transactions | | | | | (0.03) | | | | | | (0.05) | | | | | | (0.10) | | | | | | (0.12) | | | | | | (0.07) | | | | | | (0.11) | | | | | | (0.04) | | |
|
Net asset value, end of period
|
| | | | $27.44 | | | | | | $23.61 | | | | | | $24.09 | | | | | | $24.21 | | | | | | $24.83 | | | | | | $25.85 | | | | | | $19.22 | | |
| Market price, end of period | | | | | $24.72 | | | | | | $21.37 | | | | | | $21.74 | | | | | | $21.74 | | | | | | $20.63 | | | | | | $21.80 | | | | | | $16.52 | | |
| | | | | | | | | | | | | | | | | | | | | | | | | | | | | | | | | | | | | | | | | | | | |
| Total Investment Return (b) | | | | | | | | | | | | | | | | | | | | | | | | | | | | | | | | | | | | | | | | | | | |
|
Based on market price
|
| | | | 18.2% | | | | | | 3.1% | | | | | | 9.9% | | | | | | 13.8% | | | | | | 1.0% | | | | | | 42.2% | | | | | | 53.6% | | |
|
Based on net asset value
|
| | | | 18.4% | | | | | | 2.3% | | | | | | 9.4% | | | | | | 5.3% | | | | | | 2.5% | | | | | | 44.9% | | | | | | 47.7% | | |
| | | | | | | | | | | | | | | | | | | | | | | | | | | | | | | | | | | | | | | | | | | | |
| Ratios/Supplemental Data (c) | | | | | | | | | | | | | | | | | | | | | | | | | | | | | | | | | | | | | | | | | | | |
|
Net assets, end of period (in millions)
|
| | | | $769 | | | | | | $635 | | | | | | $662 | | | | | | $636 | | | | | | $633 | | | | | | $651 | | | | | | $471 | | |
|
Ratio of expenses to average net
assets |
| | | | 0.55% | | | | | | 0.64% | | | | | | 0.62% | | | | | | 0.61% | | | | | | 0.64% | | | | | | 0.56% | | | | | | 0.88% | | |
|
Ratio of net investment income to
average net assets |
| | | | 2.08% | | | | | | 2.47% | | | | | | 2.51% | | | | | | 2.38% | | | | | | 2.66% | | | | | | 3.31% | | | | | | 3.15% | | |
|
Portfolio turnover
|
| | | | 20.0% | | | | | | 16.6% | | | | | | 20.9% | | | | | | 20.4% | | | | | | 19.8% | | | | | | 24.3% | | | | | | 20.7% | | |
|
Number of shares outstanding at
end of period (in 000’s) |
| | | | 28,035 | | | | | | 26,889 | | | | | | 27,502 | | | | | | 26,285 | | | | | | 25,514 | | | | | | 25,194 | | | | | | 24,485 | | |
(a)
The character of distributions is determined at the end of the year based on the Fund’s investment performance for the full calendar year.
(b)
Total investment return is calculated assuming a purchase of a Fund share at the beginning of the period and a sale on the last day of the period reported either at net asset value or market price per share, excluding any brokerage commissions. Distributions are assumed to be reinvested at the lower of the net asset value per share or the closing NYSE market price on the distribution’s valuation date.
(c)
Ratios and portfolio turnover presented on an annualized basis.
The accompanying notes are an integral part of the financial statements.
14
Schedule of Investments
June 30, 2026
(unaudited)
(unaudited)
| | | |
Shares
|
| |
Value (a)
|
| ||||||
| Common Stocks — 99.2% | | ||||||||||||
|
Energy — 80.5%
|
| ||||||||||||
|
Energy Related — 0.0%
|
| ||||||||||||
|
Eos Energy Enterprises, Inc. (b)
|
| | | | 62,600 | | | | | $ | 368,088 | | |
| | | | | | | | | | | | | | |
|
Equipment & Services — 6.9%
|
| ||||||||||||
|
Baker Hughes Company
|
| | | | 223,800 | | | | | | 12,420,900 | | |
|
Halliburton Company
|
| | | | 353,053 | | | | | | 11,986,149 | | |
|
SLB Ltd.
|
| | | | 547,633 | | | | | | 25,459,458 | | |
|
TechnipFMC plc
|
| | | | 48,600 | | | | | | 3,222,180 | | |
| | | | | | 53,088,687 | | | ||||||
|
Exploration & Production — 14.8%
|
| ||||||||||||
|
APA Corporation
|
| | | | 56,000 | | | | | | 1,823,920 | | |
|
Chord Energy Corporation
|
| | | | 225 | | | | | | 25,718 | | |
|
ConocoPhillips
|
| | | | 444,303 | | | | | | 46,189,740 | | |
|
Devon Energy Corporation
|
| | | | 261,760 | | | | | | 10,815,923 | | |
|
Diamondback Energy, Inc.
|
| | | | 83,800 | | | | | | 14,730,364 | | |
|
EOG Resources, Inc.
|
| | | | 140,067 | | | | | | 18,170,892 | | |
|
EQT Corporation
|
| | | | 153,000 | | | | | | 8,135,010 | | |
|
Expand Energy Corporation
|
| | | | 88,500 | | | | | | 8,070,315 | | |
|
Texas Pacific Land Corporation
|
| | | | 13,350 | | | | | | 5,842,494 | | |
| | | | | 113,804,376 | | | |||||||
|
Integrated Oil & Gas — 38.5%
|
| ||||||||||||
|
Chevron Corporation
|
| | | | 586,624 | | | | | | 97,238,794 | | |
|
Exxon Mobil Corporation
|
| | | | 1,346,355 | | | | | | 184,073,656 | | |
|
Occidental Petroleum Corporation
|
| | | | 306,551 | | | | | | 14,889,182 | | |
| | | | | 296,201,632 | | | |||||||
|
Refining & Marketing — 9.6%
|
| ||||||||||||
|
Marathon Petroleum Corporation
|
| | | | 79,912 | | | | | | 20,431,101 | | |
|
Phillips 66
|
| | | | 141,475 | | | | | | 23,916,349 | | |
|
Valero Energy Corporation
|
| | | | 113,700 | | | | | | 29,612,028 | | |
| | | | | 73,959,478 | | | |||||||
|
Storage & Transportation — 10.7%
|
| ||||||||||||
|
Kinder Morgan, Inc.
|
| | | | 429,392 | | | | | | 13,727,662 | | |
|
ONEOK, Inc.
|
| | | | 140,500 | | | | | | 12,215,070 | | |
|
Targa Resources Corp.
|
| | | | 91,600 | | | | | | 24,561,624 | | |
|
Williams Companies, Inc.
|
| | | | 425,250 | | | | | | 31,613,085 | | |
| | | | | | 82,117,441 | | | ||||||
15
Schedule of Investments (continued)
June 30, 2026
(unaudited)
(unaudited)
| | | |
Shares
|
| |
Value (a)
|
| ||||||
|
Materials — 18.7%
|
| ||||||||||||
|
Chemicals — 10.2%
|
| ||||||||||||
|
Air Products and Chemicals, Inc.
|
| | | | 18,100 | | | | | $ | 5,306,558 | | |
|
Albemarle Corporation
|
| | | | 7,200 | | | | | | 972,216 | | |
|
CF Industries Holdings, Inc.
|
| | | | 42,669 | | | | | | 4,619,346 | | |
|
Corteva Inc.
|
| | | | 57,945 | | | | | | 4,907,362 | | |
|
Dow, Inc.
|
| | | | 52,945 | | | | | | 1,448,575 | | |
|
DuPont de Nemours, Inc.
|
| | | | 31,642 | | | | | | 4,291,921 | | |
|
Ecolab Inc.
|
| | | | 31,400 | | | | | | 8,748,354 | | |
|
International Flavors & Fragrances Inc.
|
| | | | 66,506 | | | | | | 5,268,605 | | |
|
Linde plc
|
| | | | 53,700 | | | | | | 27,867,078 | | |
|
LyondellBasell Industries N.V.
|
| | | | 15,600 | | | | | | 821,340 | | |
|
Mosaic Company
|
| | | | 21,201 | | | | | | 449,249 | | |
|
PPG Industries, Inc.
|
| | | | 18,100 | | | | | | 2,195,349 | | |
|
Sherwin-Williams Company
|
| | | | 33,700 | | | | | | 11,603,584 | | |
| | | | | | 78,499,537 | | | ||||||
|
Construction Materials — 2.2%
|
| ||||||||||||
|
CRH public limited company
|
| | | | 57,400 | | | | | | 6,141,800 | | |
|
Martin Marietta Materials, Inc.
|
| | | | 4,500 | | | | | | 2,595,150 | | |
|
Vulcan Materials Company
|
| | | | 27,700 | | | | | | 8,171,777 | | |
| | | | | | 16,908,727 | | | ||||||
|
Containers & Packaging — 1.1%
|
| ||||||||||||
|
Amcor plc
|
| | | | 34,880 | | | | | | 1,512,048 | | |
|
Avery Dennison Corporation
|
| | | | 5,400 | | | | | | 876,690 | | |
|
Ball Corporation
|
| | | | 16,300 | | | | | | 1,017,120 | | |
|
International Paper Company
|
| | | | 40,900 | | | | | | 1,558,290 | | |
|
Packaging Corporation of America
|
| | | | 5,300 | | | | | | 1,262,884 | | |
|
Smurfit Westrock plc
|
| | | | 41,300 | | | | | | 1,910,538 | | |
| | | | | 8,137,570 | | | |||||||
|
Metals & Mining — 5.2%
|
| ||||||||||||
|
Cameco Corporation
|
| | | | 18,000 | | | | | | 1,833,480 | | |
|
Freeport-McMoRan, Inc.
|
| | | | 233,200 | | | | | | 14,665,948 | | |
|
Newmont Corporation
|
| | | | 120,100 | | | | | | 11,217,340 | | |
|
Nucor Corporation
|
| | | | 43,100 | | | | | | 9,600,525 | | |
|
Steel Dynamics, Inc.
|
| | | | 11,026 | | | | | | 2,530,026 | | |
| | | | | | 39,847,319 | | | ||||||
| Total Common Stocks | | ||||||||||||
|
(Cost $536,131,131)
|
| | | | | | | | | $ | 762,932,855 | | |
| | |||||||||||||
16
Schedule of Investments (continued)
June 30, 2026
(unaudited)
(unaudited)
| | | |
Shares
|
| |
Value (a)
|
| ||||||
| Short-Term Investments — 0.8% | | ||||||||||||
|
Money Market Funds — 0.8%
|
| ||||||||||||
|
Morgan Stanley Institutional Liquidity Funds Prime Portfolio, Institutional Class, 3.69% (c)
|
| | | | 5,901,129 | | | | | $ | 5,900,539 | ||
|
Northern Institutional Funds Treasury Portfolio, Premier Class, 3.51% (c)
|
| | | | 508,713 | | | | | | 508,713 | ||
| Total Short-Term Investments | | ||||||||||||
|
(Cost $6,410,603)
|
| | | | | | | | | | 6,409,252 | ||
| Total — 100.0% of Net Assets | | ||||||||||||
|
(Cost $542,541,734)
|
| | | | | | | | | | 769,342,107 | ||
| Other Assets Less Liabilities — 0.0% | | | | | | | | | | | (194,493) | | |
| Net Assets — 100.0% | | | | | | | | | |
$
|
769,147,614
|
||
| | |||||||||||||
| | | | | | | | | | | | |
(a)
Common stocks are listed on the New York Stock Exchange or NASDAQ and are valued at the last reported sale price on the day of valuation. See note 1 to financial statements.
(b)
Presently non-dividend paying.
(c)
Rate presented is as of period-end and represents the annualized yield earned over the previous seven days.
17
Principal Changes in Portfolio Securities
During the Six Months Ended June 30, 2026
(unaudited)
(unaudited)
| | | |
Dollar Amount
Traded in the Period |
| |
Percent of
Net Assets Held at Period-End |
| ||||||
| Additions | | | | | | | | | | | | | |
|
SLB Ltd.
|
| | | $ | 9,507,880 | | | | | | 3.3% | | |
|
ConocoPhillips
|
| | | | 7,971,746 | | | | | | 6.0 | | |
|
Occidental Petroleum Corporation
|
| | | | 6,983,068 | | | | | | 1.9 | | |
|
Valero Energy Corporation
|
| | | | 6,326,981 | | | | | | 3.8 | | |
|
Exxon Mobil Corporation
|
| | | | 4,410,452 | | | | | | 23.9 | | |
|
Expand Energy Corporation
|
| | | | 4,092,650 | | | | | | 1.0 | | |
|
Targa Resources Corp.
|
| | | | 4,067,008 | | | | | | 3.2 | | |
|
International Flavors & Fragrances Inc.
|
| | | | 3,529,963 | | | | | | 0.7 | | |
|
Sherwin-Williams Company
|
| | | | 2,967,254 | | | | | | 1.5 | | |
|
Halliburton Company
|
| | | | 2,817,159 | | | | | | 1.6 | | |
|
Diamondback Energy, Inc.
|
| | | | 1,064,857 | | | | | | 1.9 | | |
|
DuPont de Nemours, Inc.
|
| | | | 778,640 | | | | | | 0.6 | | |
|
Nutrien Ltd.
|
| | | | 614,684 | | | | | | — | | |
| | | | | | | | | | | | | | |
| Reductions | | | | | | | | | | | | | |
|
Baker Hughes Company
|
| | | | 8,659,075 | | | | | | 1.6 | | |
|
Kinder Morgan, Inc.
|
| | | | 7,316,746 | | | | | | 1.8 | | |
|
Chevron Corporation
|
| | | | 6,722,880 | | | | | | 12.6 | | |
|
Cenovus Energy Inc.
|
| | | | 6,639,155 | | | | | | — | | |
|
EQT Corporation
|
| | | | 6,613,525 | | | | | | 1.1 | | |
|
Devon Energy Corporation
|
| | | | 5,447,492 | | | | | | 1.4 | | |
|
Ecolab Inc.
|
| | | | 3,045,202 | | | | | | 1.1 | | |
|
Crown Holdings, Inc.
|
| | | | 2,920,078 | | | | | | — | | |
|
Marathon Petroleum Corporation
|
| | | | 2,912,490 | | | | | | 2.7 | | |
|
Phillips 66
|
| | | | 2,506,084 | | | | | | 3.1 | | |
|
Nucor Corporation
|
| | | | 2,077,289 | | | | | | 1.2 | | |
|
ONEOK, Inc.
|
| | | | 1,948,880 | | | | | | 1.6 | | |
|
Canadian Natural Resources Limited
|
| | | | 1,611,095 | | | | | | — | | |
|
Williams Companies, Inc.
|
| | | | 947,698 | | | | | | 4.1 | | |
|
Newmont Corporation
|
| | | | 774,211 | | | | | | 1.5 | | |
The transactions presented above represent all new and fully-eliminated positions and up to the fifteen largest net additions and reductions to existing portfolio securities during the period, and exclude those in sector exchange-traded funds.
18
Historical Financial Statistics
(unaudited)
|
Year
|
| |
(000’s)
Value Of Net Assets |
| |
(000’s)
Shares Outstanding |
| |
Net Asset
Value Per Share |
| |
Market
Value Per Share |
| |
Income
Dividends Per Share |
| |
Capital
Gains Distributions Per Share |
| |
Return of
Capital Distributions Per Share |
| |
Total
Dividends and Distributions Per Share |
| |
Annual
Distribution Rate* |
| |||||||||||||||||||||||||||
| 2016 | | | | $ | 685,882 | | | | | | 28,555 | | | | | $ | 24.02 | | | | | $ | 20.17 | | | | | $ | .41 | | | | | $ | .73 | | | | | $ | — | | | | | $ | 1.14 | | | | | | 6.1% | | |
| 2017 | | | | | 674,388 | | | | | | 28,999 | | | | | | 23.26 | | | | | | 19.84 | | | | | | .46 | | | | | | .72 | | | | | | — | | | | | | 1.18 | | | | | | 6.1 | | |
| 2018 | | | | | 522,997 | | | | | | 29,534 | | | | | | 17.71 | | | | | | 14.57 | | | | | | .45 | | | | | | .40 | | | | | | .32 | | | | | | 1.17 | | | | | | 6.0 | | |
| 2019 | | | | | 561,469 | | | | | | 29,875 | | | | | | 18.79 | | | | | | 16.46 | | | | | | .78 | | | | | | .32 | | | | | | — | | | | | | 1.10 | | | | | | 6.9 | | |
| 2020 | | | | | 331,942 | | | | | | 24,122 | | | | | | 13.76 | | | | | | 11.37 | | | | | | .47 | | | | | | .26 | | | | | | — | | | | | | .73 | | | | | | 6.1 | | |
| 2021 | | | | | 470,589 | | | | | | 24,485 | | | | | | 19.22 | | | | | | 16.52 | | | | | | .56 | | | | | | .35 | | | | | | — | | | | | | .91 | | | | | | 6.3 | | |
| 2022 | | | | | 651,336 | | | | | | 25,194 | | | | | | 25.85 | | | | | | 21.80 | | | | | | .79 | | | | | | .84 | | | | | | — | | | | | | 1.63 | | | | | | 8.1 | | |
| 2023 | | | | | 633,447 | | | | | | 25,514 | | | | | | 24.83 | | | | | | 20.63 | | | | | | .65 | | | | | | .70 | | | | | | — | | | | | | 1.35 | | | | | | 6.2 | | |
| 2024 | | | | | 636,334 | | | | | | 26,285 | | | | | | 24.21 | | | | | | 21.74 | | | | | | .65 | | | | | | 1.12 | | | | | | — | | | | | | 1.77 | | | | | | 6.7 | | |
| 2025 | | | | | 662,419 | | | | | | 27,502 | | | | | | 24.09 | | | | | | 21.74 | | | | | | .56 | | | | | | 1.49 | | | | | | — | | | | | | 2.05 | | | | | | 8.4 | | |
|
June 30, 2026
|
| | | | 769,148 | | | | | | 28,035 | | | | | | 27.44 | | | | | | 24.72 | | | | | | — | | | | | | — | | | | | | — | | | | | | 1.01** | | | | | | — | | |
*
Beginning in 2024, the annual distribution rate is calculated as the total dividends and distributions per share for the year divided by the average of the Fund’s net asset value per share for the four quarter-end periods ending September 30, in accordance with the Managed Distribution Policy adopted in May 2024. Prior to that, the calculation was based on the Fund’s average month-end stock price for the twelve months ended October 31, in accordance with the annual 6% minimum distribution rate commitment then in effect.
**
The character of distributions will be determined at the end of the year based on the Fund’s investment performance for the full calendar year.
| | | | | | | | | |
Annual Meeting of Stockholders
(unaudited)
The Annual Meeting of Stockholders was held on April 16, 2026. On the proposal to elect two Class II directors to serve until the annual meeting of stockholders in 2029 and until their successors are duly elected and qualify, the following votes were cast:
| | | |
Votes For
|
| |
Votes Withheld
|
| ||||||
| Kenneth J. Dale | | | | | 15,914,413 | | | | | | 6,112,359 | | |
| Mary Chris Jammet | | | | | 15,959,272 | | | | | | 6,067,501 | | |
A proposal to ratify the selection of PricewaterhouseCoopers LLP as the independent registered public accounting firm for the Fund for 2026 was approved with 21,292,881 votes for, 315,782 votes against, and 418,109 shares abstaining.
19
Other Information
(unaudited)
Electronic Delivery of Shareholder Reports
The Fund offers shareholders the benefits and convenience of viewing Quarterly and Annual Reports and other shareholder materials online. With your consent, paper copies of these documents will cease with the next mailing and will be provided via e-mail. Reduce paper mailed to your home and help lower the Fund’s printing and mailing costs. To enroll, registered shareholders with the Fund’s transfer agent, Computershare, should call 866-723-8330, or log in to their account to update e-delivery preferences.
Shareholders using brokerage accounts should contact their broker.
Proxy Voting Policies and Record
A description of the policies and procedures that the Fund uses to determine how to vote proxies relating to portfolio securities owned by the Fund and the Fund’s proxy voting record for the 12-month period ended June 30, 2026 are available (i) without charge, upon request, by calling the Fund’s toll free number at (800) 638-2479; (ii) on the Fund’s website: www.adamsfunds.com; and (iii) on the Securities and Exchange Commission’s website: www.sec.gov.
Statement on Quarterly Filing of Complete Portfolio Schedule
In addition to publishing its complete schedule of portfolio holdings in the First and Third Quarter Reports to Shareholders, the Fund also files its complete schedule of portfolio holdings for the first and third quarters of each fiscal year with the Securities and Exchange Commission on Form N-PORT. The form is available on the Commission’s website: www.sec.gov. The Fund also posts a link to its filings on its website: www.adamsfunds.com.
Disclaimers
This report contains “forward-looking statements” within the meaning of the Securities Act of 1933 and the Securities Exchange Act of 1934. By their nature, all forward-looking statements involve risks and uncertainties, and actual results could differ materially from those contemplated by the forward-looking statements. Several factors that could materially affect the Fund’s actual results are the performance of the portfolio of stocks held by the Fund, the conditions in the U.S. and international financial markets, the price at which shares of the Fund will trade in the public markets, and other factors discussed in the Fund’s periodic filings with the Securities and Exchange Commission.
This report is transmitted to the shareholders of the Fund for their information. It is not a prospectus, circular or representation intended for use in the purchase or sale of shares of the Fund or of any securities mentioned in the report. The rates of return will vary and the principal value of an investment will fluctuate. Shares, if sold, may be worth more or less than their original cost. Past performance is no guarantee of future investment results.
20
Adams Natural Resources Fund, Inc.
Board of Directors
| | Steven G. Chambers (2) (3) (4) | | |
James P. Haynie (1)
|
| |
Jane Musser Nelson (1) (2) (3) (4)
|
|
| | Kenneth J. Dale (1) (5) | | | Mary Chris Jammet (1) (2) (3) (4) | | | | |
| |
Frederic A. Escherich (2) (3) (4)
|
| | Lauriann C. Kloppenburg (1) (2) (3) (4) | | | | |
(1)
Member of Executive Committee
(2)
Member of Audit Committee
(3)
Member of Compensation Committee
(4)
Member of Nominating and Governance Committee
(5)
Chair of the Board
Officers
| | James P. Haynie, CFA | | |
Chief Executive Officer
|
|
| | Gregory W. Buckley | | |
President
|
|
| |
Brian S. Hook, CFA, CPA
|
| | Vice President and Chief Financial Officer | |
| |
Janis F. Kerns
|
| |
Vice President, General Counsel, Secretary, and Chief Compliance Officer
|
|
| |
Michael E. Rega, CFA
|
| | Vice President—Research | |
| | William H. Reinhardt, CFA | | |
Vice President—Research
|
|
| | Jeffrey R. Schollaert, CFA | | |
Vice President—Research
|
|
| | Christine M. Sloan, CPA | | |
Treasurer and Director of Human Resources
|
|
500 East Pratt Street, Suite 1300, Baltimore, MD 21202
410.752.5900 800.638.2479
Website: www.adamsfunds.com
Tickers: PEO (NYSE), XPEOX (NASDAQ)
Independent Registered Public Accounting Firm: PricewaterhouseCoopers LLP
Custodian of Securities: The Northern Trust Company
Transfer Agent & Registrar: Computershare Trust Company, N.A.
P.O. Box 43078
Providence, RI 02940-3078
(866) 723-8330
Website: www.computershare.com/us
Email: info@computershare.com
Providence, RI 02940-3078
(866) 723-8330
Website: www.computershare.com/us
Email: info@computershare.com