Please wait

.2

 Sensient Technologies Corporation  Fourth Quarter 2025 Earnings Call  February 13, 2026 
 

 2  Non-GAAP Financial Measures  Within this document, the Company reports certain non-GAAP financial measures, including: (1) adjusted operating income, adjusted net earnings, and adjusted diluted earnings per share, which exclude restructuring and other costs, including the Portfolio Optimization Plan costs, (2) percentage changes in revenue, operating income, and diluted earnings per share on an adjusted local currency basis, which eliminate the effects that result from translating its international operations into U.S. dollars and restructuring and other costs, including the Portfolio Optimization Plan costs, and (3) adjusted EBITDA and adjusted EBITDA Margin (which exclude Portfolio Optimization Plan costs and non-cash share based compensation expense). The Company has included each of these non-GAAP measures in order to provide additional information regarding our underlying operating results and comparable year-over-year performance. Such information is supplemental to information presented in accordance with GAAP and is not intended to represent a presentation in accordance with GAAP. These non-GAAP measures should not be considered in isolation. Rather, they should be considered together with GAAP measures and the rest of the information included in this report. Management internally reviews each of these non-GAAP measures to evaluate performance on a comparative period-to-period basis and to gain additional insight into underlying operating and performance trends, and the Company believes the information can be beneficial to investors for the same purposes. These non-GAAP measures may not be comparable to similarly titled measures used by other companies. 
 

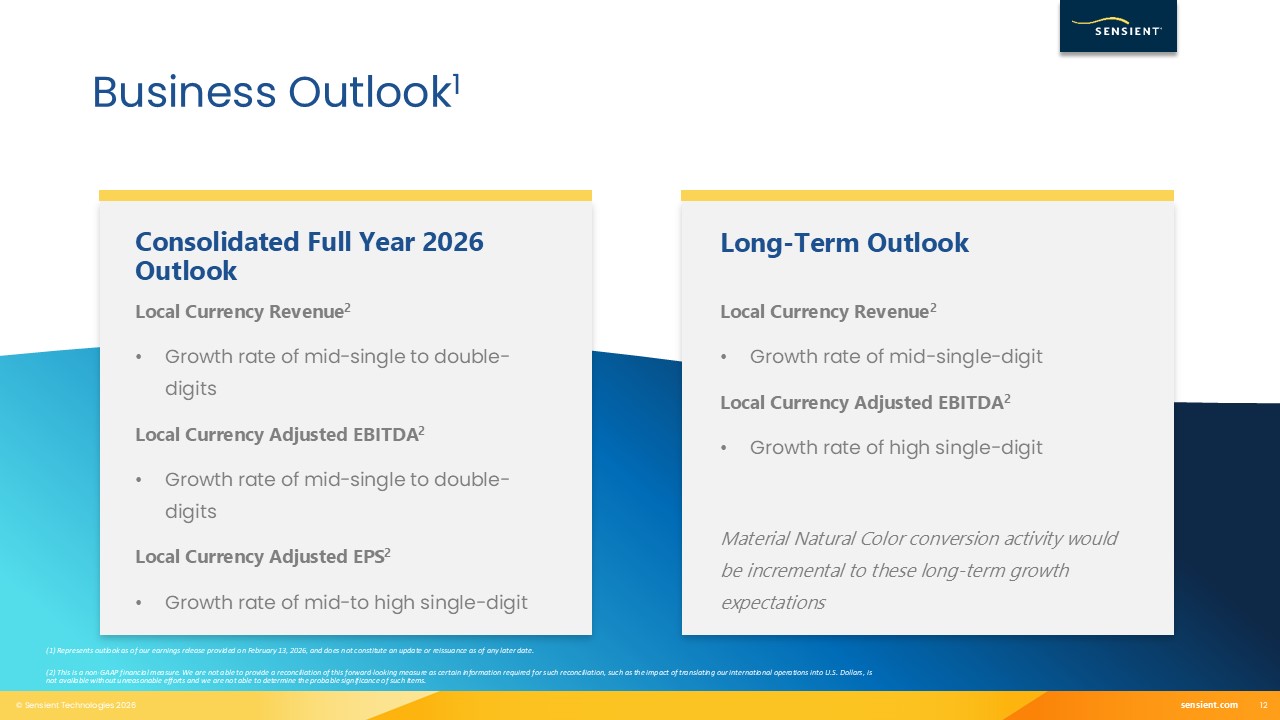
 3  Forward Looking Statements  This presentation contains statements that may constitute “forward-looking statements” within the meaning of Federal securities laws including under “2026 Financial Outlook”, “Long-Term Outlook”, and “Consolidated Full Year 2026 Outlook”. Such forward-looking statements are not guarantees of future performance and involve known and unknown risks, uncertainties, and other factors concerning the Company’s operations and business environment. Important factors that could cause actual results to differ materially from those suggested by these forward-looking statements and that could adversely affect the Company’s future financial performance include the following: the Company’s ability to manage general business, economic, and capital market conditions, including actions taken by customers in response to such market conditions, and the impact of recessions and economic downturns; the impact of macroeconomic and geopolitical volatility, including inflation and shortages impacting the availability and cost of raw materials, energy, and other supplies, disruptions and delays in the Company’s supply chain, and the conflicts between Russia and Ukraine and in the Middle East; industry, regulatory, legal, and economic factors related to the Company’s domestic and international business; the effects of tariffs, trade barriers, and disputes; the availability and cost of labor, logistics, and transportation; the pace and nature of new product introductions by the Company and the Company’s customers; the Company’s ability to anticipate and respond to changing consumer preferences, changing technologies, and changing regulations; the Company’s ability to successfully implement its growth strategies; the outcome of the Company’s various productivity-improvement and cost-reduction efforts, acquisition and divestiture activities, and Portfolio Optimization Plan; growth in markets for products in which the Company competes; industry and customer acceptance of price increases; actions by competitors; the Company’s ability to enhance its innovation efforts and drive cost efficiencies; currency exchange rate fluctuations; and other factors included in “Risk Factors” in the Company's Annual Report on Form 10-K for the year ended December 31, 2025, and in other documents that the Company files with the SEC. The risks and uncertainties identified above are not the only risks the Company faces. Additional risks and uncertainties not presently known to the Company or that it currently believes to be immaterial also may adversely affect the Company. Should any known or unknown risks and uncertainties develop into actual events, these developments could have material adverse effects on our business, financial condition, and results of operations. This presentation contains time-sensitive information that reflects management’s best analysis only as of the date of this presentation. Except to the extent required by applicable laws, the Company does not undertake to publicly update or revise its forward-looking statements even if experience or future changes make it clear that any projected results expressed or implied herein will not be realized. 
 

 Quarterly Results & Business Update  4 
 

 5  Q4 2025 Consolidated Results  (1) See appendix for our GAAP to Non-GAAP reconciliations. 
 

 6  Local Currency1 Results Commentary  Color Group Performance  Revenue  Strong growth in the quarter driven by new sales wins and favorable pricing across the Group  Operating Results  Strong operating leverage in the quarter primarily due to favorable pricing and volume growth in the food and pharmaceutical product lines  Adjusted EBITDA Margin1 for the Group was 20.7% in Q4 2025, up 10 bps from Q4 2024  (1) See appendix for our GAAP to Non-GAAP reconciliations.  Local Currency1 Full Year Results  vs. Prior Year  Revenue  +7.4%  Operating Income  +16.9%  2024  2025  Adjusted EBITDA Margin1  22.1%  23.7% 
 

 7  Color Group Performance  (1) See appendix for our GAAP to Non-GAAP reconciliations. 
 

 8  Flavors & Extracts Group Performance  Revenue  Lower volumes, particularly in agricultural ingredients product line, partially offset by favorable pricing within flavors, extracts, and flavor ingredients  Operating Results  Lower volumes in agricultural ingredients product line and a one-time inventory charge resulting from the impact of severe rains from atmospheric river events in California late in the year  Adjusted EBITDA Margin1 for the Group was 14.3% in Q4 2025, down 110 bps from Q4 2024  (1) See appendix for our GAAP to Non-GAAP reconciliations.  Local Currency1 Results Commentary  Local Currency1 Full Year Results  vs. Prior Year  Revenue  -1.3%  Operating Income  +3.4%  2024  2025  Adjusted EBITDA Margin1  16.1%  16.7% 
 

 9  Flavors & Extracts Group Performance  (1) See appendix for our GAAP to Non-GAAP reconciliations. 
 

 10  Asia Pacific Group Performance  Revenue  Driven by lower volumes within certain regions across the Group  Operating Results  YOY operating income was flat  Adjusted EBITDA Margin1 for the Group was 22.6% in Q4 2025, up 90 bps from Q4 2024  (1) See appendix for our GAAP to Non-GAAP reconciliations.  Local Currency1 Full Year Results  vs. Prior Year  Revenue  +2.4%  Operating Income  +3.8%  2024  2025  Adjusted EBITDA Margin1  22.7%  23.2%  Local Currency1 Results Commentary 
 

 11  Asia Pacific Group Performance  (1) See appendix for our GAAP to Non-GAAP reconciliations. 
 

 (1) Represents outlook as of our earnings release provided on February 13, 2026, and does not constitute an update or reissuance as of any later date.  (2) This is a non-GAAP financial measure. We are not able to provide a reconciliation of this forward-looking measure as certain information required for such reconciliation, such as the impact of translating our international operations into U.S. Dollars, is not available without unreasonable efforts and we are not able to determine the probable significance of such items.  12  Business Outlook1  Consolidated Full Year 2026 Outlook  Local Currency Revenue2  Growth rate of mid-single to double-digits  Local Currency Adjusted EBITDA2  Growth rate of mid-single to double-digits  Local Currency Adjusted EPS2  Growth rate of mid-to high single-digit  Local Currency Revenue2   Growth rate of mid-single-digit   Local Currency Adjusted EBITDA2   Growth rate of high single-digit   Material Natural Color conversion activity would be incremental to these long-term growth expectations  Long-Term Outlook 
 

 Natural Color Highlights  13  A suite of high-performance, concentrated beet juice coloring solutions   Ideal for:  Bakery Goods  Confections  Dairy  Dry Grocery  Pet Food  Red 40 alternative   Excellent stability in high heat processing  Low usage rates   Kosher, Halal, and Non-GMO  Color systems with advanced stability in water/oil matrices   Ideal for:  Bakery Goods   Beverage  Confections  Dairy  Dry Grocery Sauces and Dressings  Superior color performance and stable, homogenous result  Mitigates ringing and staining   Clear and Cloudy Options  Kosher, Halal, and Preservative-Free Options 
 

 Financial Update & Outlook  14 
 

 15  (1) See appendix for our GAAP to Non-GAAP reconciliations.  Q4 2025 Financial Review  Local currency revenue1 increased 2.0%  Q4 2025 results included $6.3 million of Portfolio Optimization Plan costs (approximately 12 cents per share)  Adjusted EBITDA Margin1 decreased 20 bps in the quarter due to the one-time inventory charge at Agricultural Ingredients resulting from the severe rains in California late in the year  Consolidated Commentary  (dollars in thousands)  Q4 2024  Q4 2025  Local Currency Growth1  Revenue   $ 376,420  $393,447   +2.0%  Operating Income (GAAP)   Operating Margin  $ 41,996  11.2%  $ 38,186  9.7%  Adjusted Operating Income1   Adjusted Operating Margin1  $ 42,852  11.4%  $ 44,466  11.3%  (0.4%)  Diluted EPS (GAAP)  $ 0.71  $ 0.60  Adjusted Diluted EPS1  $ 0.65  $ 0.72  +6.2%  Adjusted EBITDA1   Adjusted EBITDA Margin1  $ 61,100  16.2%  $ 63,036  16.0%  (0.2%) 
 

 16  2025 Cash Flow and Debt Metrics  Q4 2024  YTD  Q4 2025  YTD  Cash Flow from Operations  $ 157.2 million  $ 127.8 million  Capital Expenditures  $ 59.2 million  $ 89.4 million  Total Debt  $ 633.4 million  $ 709.6 million  Net debt to credit adjusted EBITDA1  2.3x  2.3x  Cash flow from operating activities was $127.8 million in 2025 compared to $157.2 million in 2024 primarily due to higher use of cash for working capital  Net debt to credit adjusted EBITDA1 was 2.3x in 2025, same as in 2024  Commentary  (1) See appendix for our GAAP to Non-GAAP reconciliations. 
 

 17  2026 Financial Outlook1  (1) Represents outlook as of our earnings release provided on February 13, 2026, and does not constitute an update or reissuance as of any later date.  (2) This is a non-GAAP financial measure. We are not able to provide a reconciliation of this forward-looking measure as certain information required for such reconciliation, such as the impact of translating our international operations into U.S. Dollars, is not available without unreasonable efforts and we are not able to determine the probable significance of such items.  (3) The impact of foreign exchange rates is expected to be immaterial for 2026.  (4) Interest expense assumes no USD borrowing rate reductions for 2026.  Metric  Current Guidance  Local Currency Revenue2  Mid-single to double-digit growth  Local Currency Adjusted EBITDA2  Mid-single to double-digit growth  Diluted EPS (GAAP)  $3.60 - $3.803  Local Currency Adjusted Diluted EPS2  Mid-to high single-digit growth  Capital Expenditures   $150 to $170 million  Adjusted Effective Tax Rate  ~ 25%  Interest Expense4  ~ $36 million 
 

 18 
 

 19  Appendix1  (1) Amounts in thousands, except percentages and per share amounts. 
 

 20  Non-GAAP Financial Measures 
 

 21  Non-GAAP Financial Measures 
 

 22  Non-GAAP Financial Measures 
 

 23  Non-GAAP Financial Measures 
 

 24  Non-GAAP Financial Measures 
 

 25  Non-GAAP Financial Measures 
 

 26  Non-GAAP Financial Measures 
 

 27  Non-GAAP Financial Measures 
 

 28  Non-GAAP Financial Measures 
 

 29  Non-GAAP Financial Measures 
 

 30  Non-GAAP Financial Measures 
 

 31  Non-GAAP Financial Measures 
 

 32  Non-GAAP Financial Measures