
Sensient Technologies Corporation First Quarter 2026 Earnings Call April 24,
2026
2 Non-GAAP Financial Measures Within this document, the Company reports certain
non-GAAP financial measures, including: (1) adjusted operating income, adjusted net earnings, and adjusted diluted earnings per share, which exclude restructuring and other costs, including the Portfolio Optimization Plan costs, (2) percentage
changes in revenue, operating income, and diluted earnings per share on an adjusted local currency basis, which eliminate the effects that result from translating its international operations into U.S. dollars and restructuring and other costs,
including the Portfolio Optimization Plan costs, and (3) adjusted EBITDA and adjusted EBITDA Margin (which exclude Portfolio Optimization Plan costs and non-cash share based compensation expense). The Company has included each of these non-GAAP
measures in order to provide additional information regarding our underlying operating results and comparable year-over-year performance. Such information is supplemental to information presented in accordance with GAAP and is not intended to
represent a presentation in accordance with GAAP. These non-GAAP measures should not be considered in isolation. Rather, they should be considered together with GAAP measures and the rest of the information included in this report. Management
internally reviews each of these non-GAAP measures to evaluate performance on a comparative period-to-period basis and to gain additional insight into underlying operating and performance trends, and the Company believes the information can be
beneficial to investors for the same purposes. These non-GAAP measures may not be comparable to similarly titled measures used by other companies.

3 Forward Looking Statements This presentation contains statements that may
constitute “forward-looking statements” within the meaning of Federal securities laws including under “2026 Financial Outlook” and “Consolidated Full Year 2026 Outlook”. Such forward-looking statements are not guarantees of future performance
and involve known and unknown risks, uncertainties, and other factors concerning the Company’s operations and business environment. Important factors that could cause actual results to differ materially from those suggested by these
forward-looking statements and that could adversely affect the Company’s future financial performance include the following: the Company’s ability to manage general business, economic, and capital market conditions, including actions taken by
customers in response to such market conditions, and the impact of recessions and economic downturns; the impact of macroeconomic and geopolitical volatility, including inflation and shortages impacting the availability and cost of raw
materials, energy, and other supplies, disruptions and delays in the Company’s supply chain, and the conflicts between Russia and Ukraine and in the Middle East; industry, regulatory, legal, and economic factors related to the Company’s
domestic and international business; the effects of tariffs, trade barriers, and disputes; the availability and cost of labor, logistics, and transportation; the pace and nature of new product introductions by the Company and the Company’s
customers; the Company’s ability to anticipate and respond to changing consumer preferences, changing technologies, and changing regulations; the Company’s ability to successfully implement its growth strategies; the outcome of the Company’s
various productivity-improvement and cost-reduction efforts, acquisition and divestiture activities, and Portfolio Optimization Plan; growth in markets for products in which the Company competes; industry and customer acceptance of price
increases; actions by competitors; the Company’s ability to enhance its innovation efforts and drive cost efficiencies; currency exchange rate fluctuations; and other factors included in “Risk Factors” in the Company's Annual Report on Form
10-K for the year ended December 31, 2025, and in other documents that the Company files with the SEC. The risks and uncertainties identified above are not the only risks the Company faces. Additional risks and uncertainties not presently known
to the Company or that it currently believes to be immaterial also may adversely affect the Company. Should any known or unknown risks and uncertainties develop into actual events, these developments could have material adverse effects on our
business, financial condition, and results of operations. This presentation contains time-sensitive information that reflects management’s best analysis only as of the date of this presentation. Except to the extent required by applicable laws,
the Company does not undertake to publicly update or revise its forward-looking statements even if experience or future changes make it clear that any projected results expressed or implied herein will not be realized.

Quarterly Results & Business Update 4
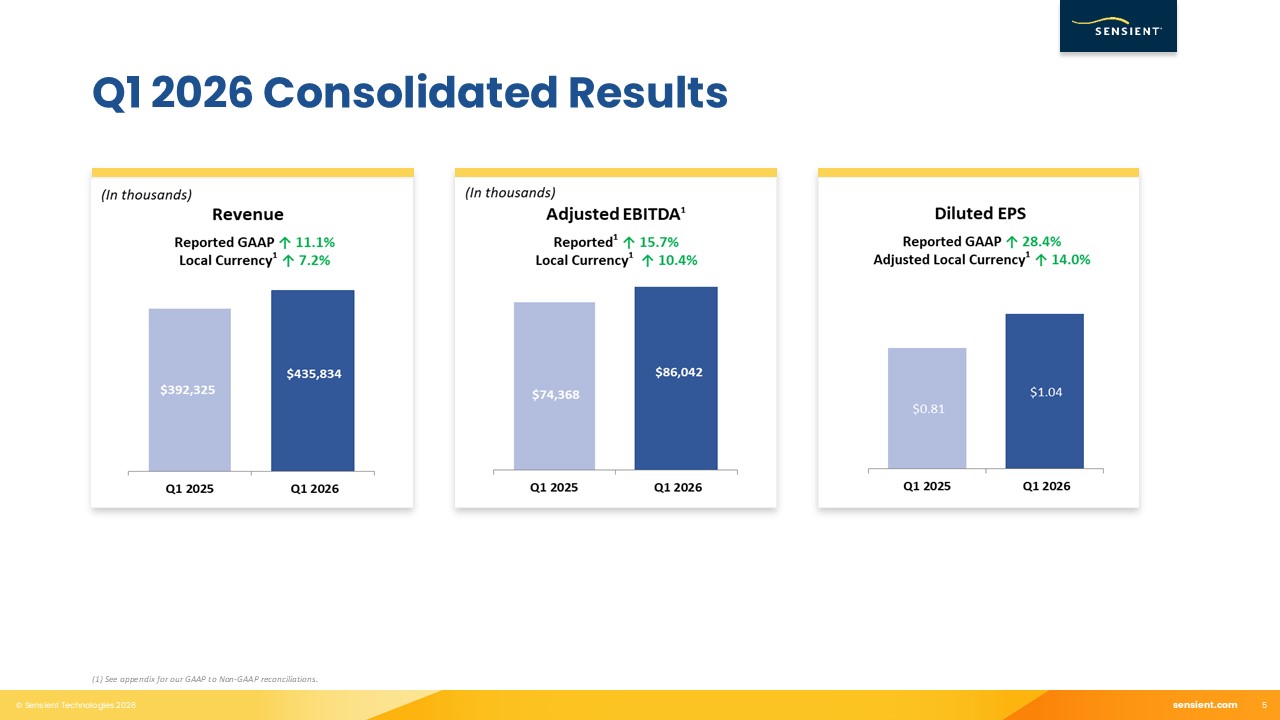
5 Q1 2026 Consolidated Results (1) See appendix for our GAAP to Non-GAAP
reconciliations.
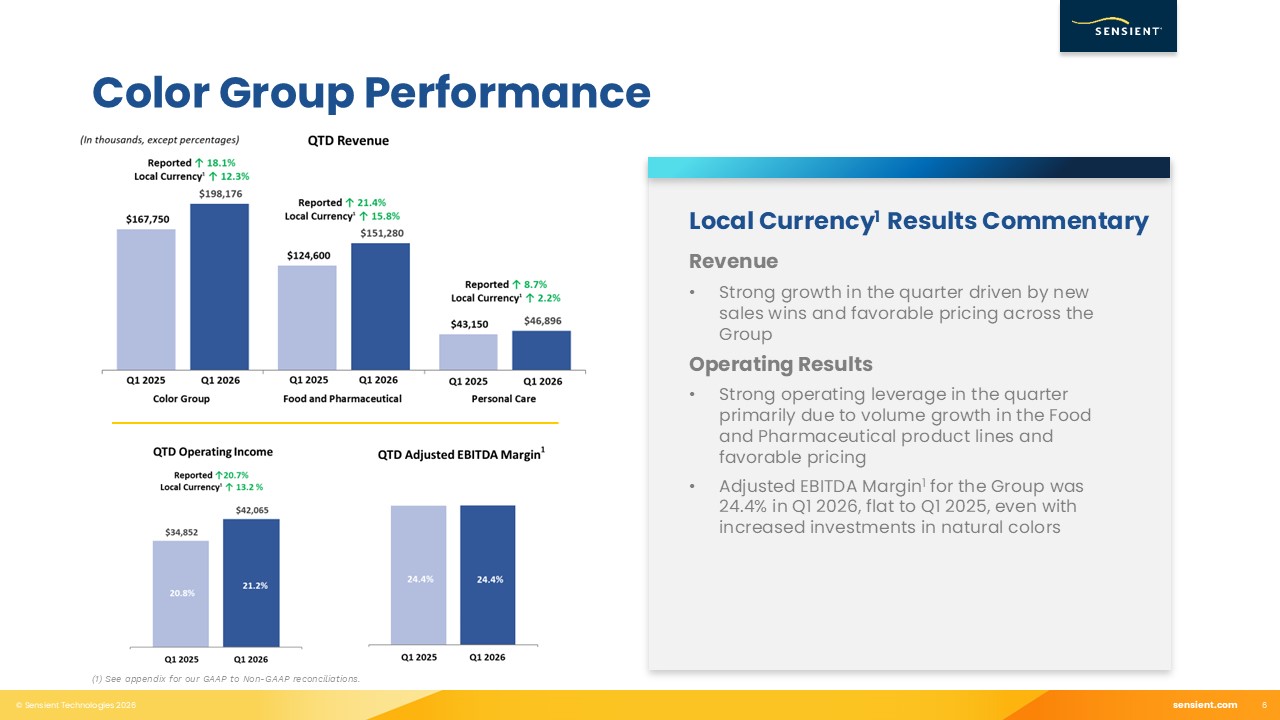
6 Local Currency1 Results Commentary Color Group Performance Revenue Strong
growth in the quarter driven by new sales wins and favorable pricing across the Group Operating Results Strong operating leverage in the quarter primarily due to volume growth in the Food and Pharmaceutical product lines and favorable
pricing Adjusted EBITDA Margin1 for the Group was 24.4% in Q1 2026, flat to Q1 2025, even with increased investments in natural colors (1) See appendix for our GAAP to Non-GAAP reconciliations.
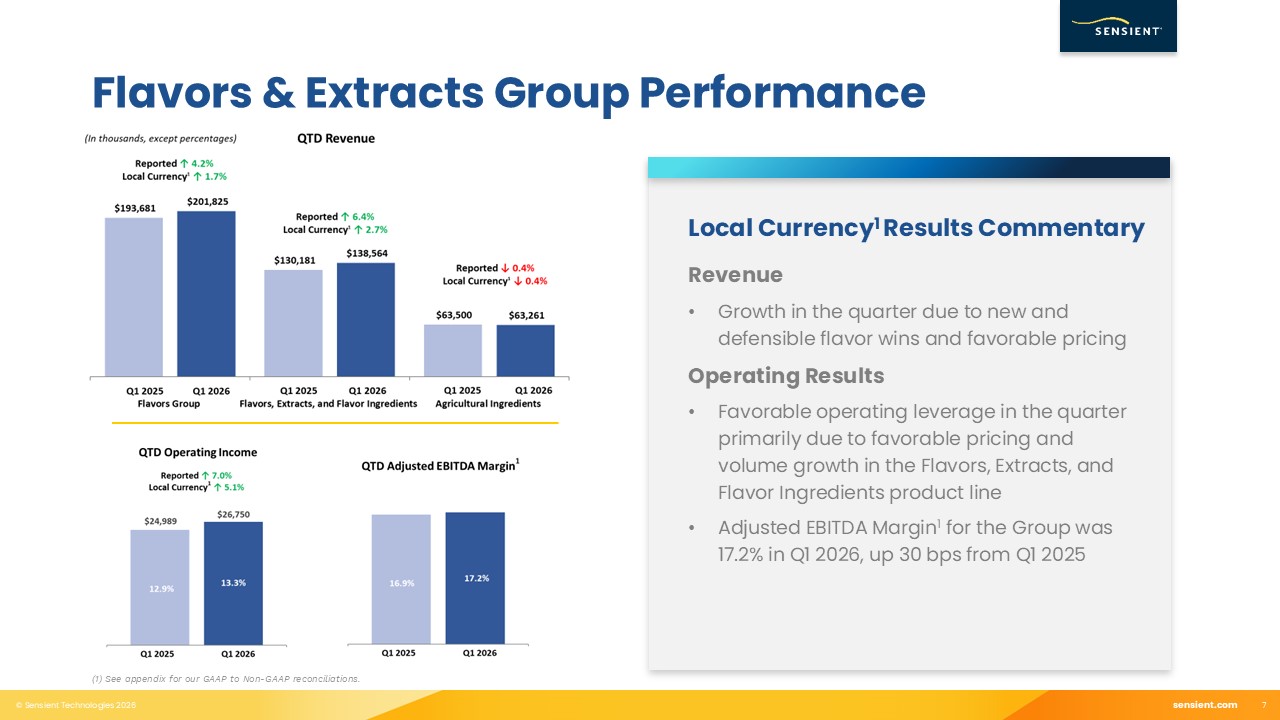
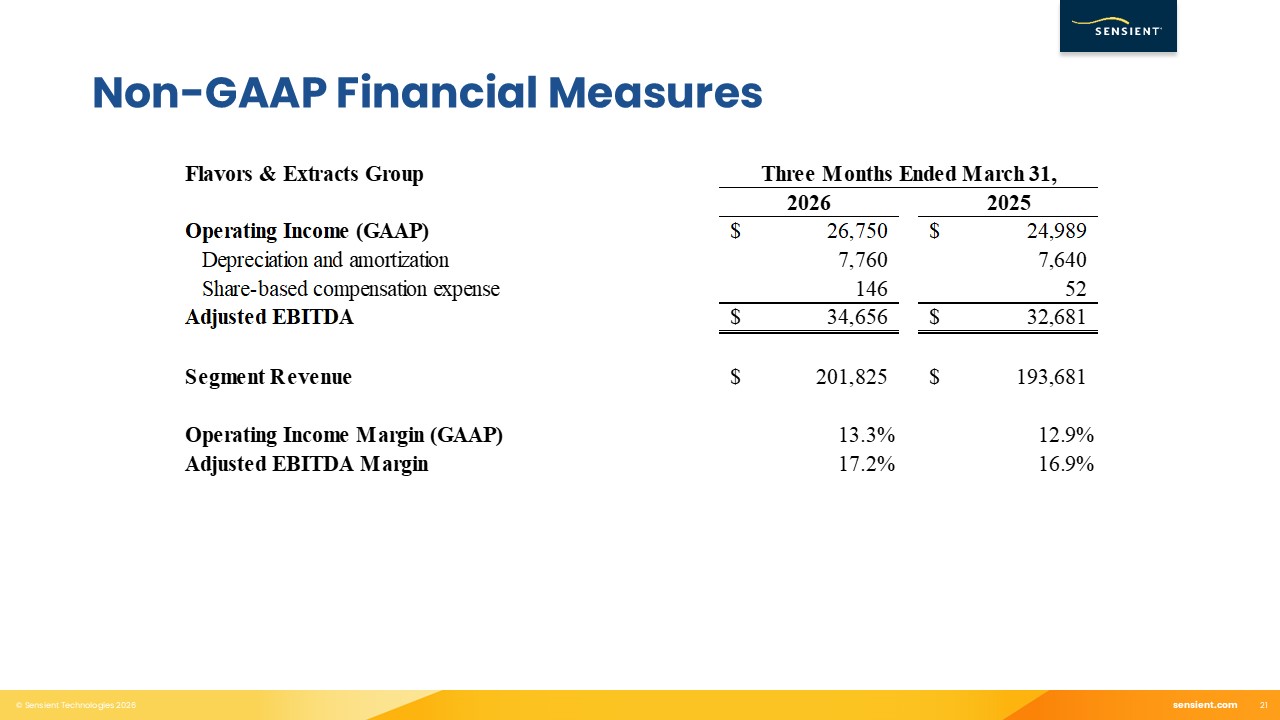
7 Flavors & Extracts Group Performance Revenue Growth in the quarter due to
new and defensible flavor wins and favorable pricing Operating Results Favorable operating leverage in the quarter primarily due to favorable pricing and volume growth in the Flavors, Extracts, and Flavor Ingredients product line Adjusted
EBITDA Margin1 for the Group was 17.2% in Q1 2026, up 30 bps from Q1 2025 (1) See appendix for our GAAP to Non-GAAP reconciliations. Local Currency1 Results Commentary
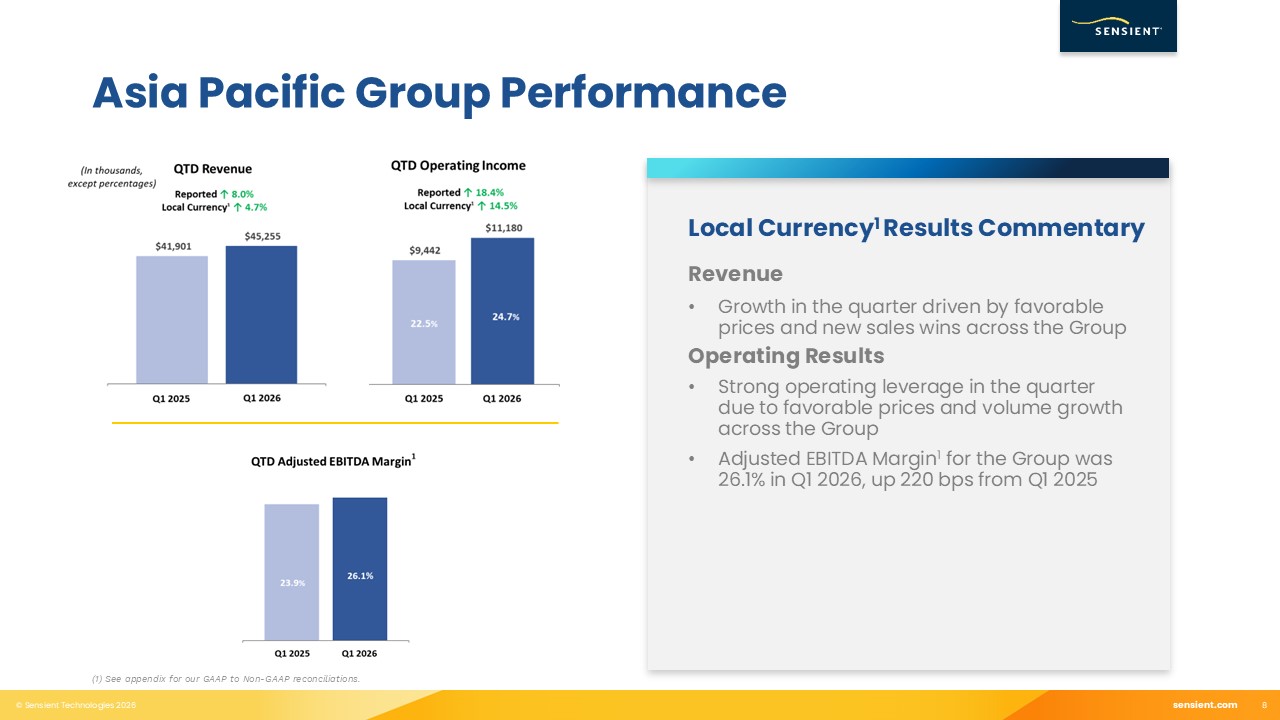
8 Asia Pacific Group Performance Revenue Growth in the quarter driven by
favorable prices and new sales wins across the Group Operating Results Strong operating leverage in the quarter due to favorable prices and volume growth across the Group Adjusted EBITDA Margin1 for the Group was 26.1% in Q1 2026, up 220
bps from Q1 2025 (1) See appendix for our GAAP to Non-GAAP reconciliations. Local Currency1 Results Commentary
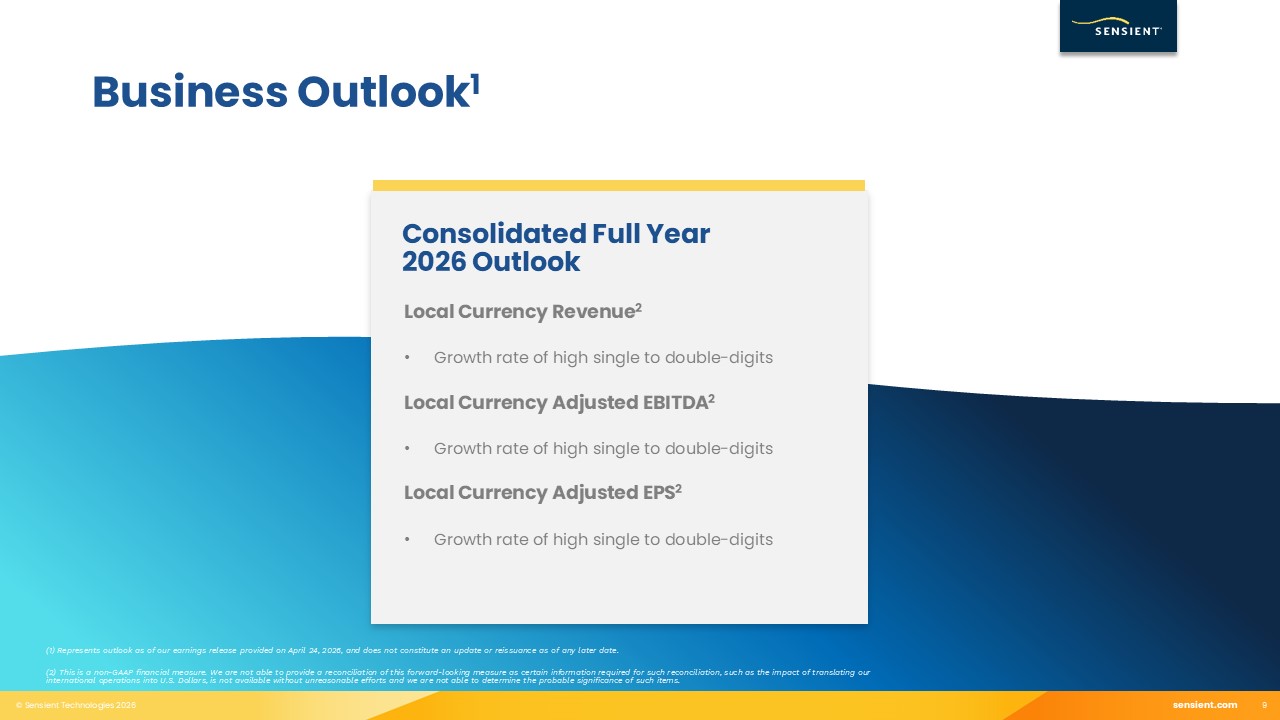
(1) Represents outlook as of our earnings release provided on April 24, 2026, and
does not constitute an update or reissuance as of any later date. (2) This is a non-GAAP financial measure. We are not able to provide a reconciliation of this forward-looking measure as certain information required for such reconciliation,
such as the impact of translating our international operations into U.S. Dollars, is not available without unreasonable efforts and we are not able to determine the probable significance of such items. 9 Business Outlook1 Consolidated Full
Year 2026 Outlook Local Currency Revenue2 Growth rate of high single to double-digits Local Currency Adjusted EBITDA2 Growth rate of high single to double-digits Local Currency Adjusted EPS2 Growth rate of high single to double-digits

2026 Natural Color Highlights 10 The industry’s only global suite of simple
ingredient alternatives to titanium dioxide Ideal for: Bakery Goods Confections Dairy Dry Grocery Pet Food Beverages Label-friendly alternatives to titanium dioxide Designed to effectively match titanium dioxide
performance Stability across a wide range of product applications Kosher and Halal Vibrant, heat-stable natural colors for harsh heat extrusion Ideal for: Cereal Pet Food Confections Snacks Superior color performance and stability in
extreme high heat and pressure in extrusion Concentrated solutions to mitigate impact to texture and flavor Available in every color Kosher, Halal, and Non-GMO

Financial Update & Outlook 11
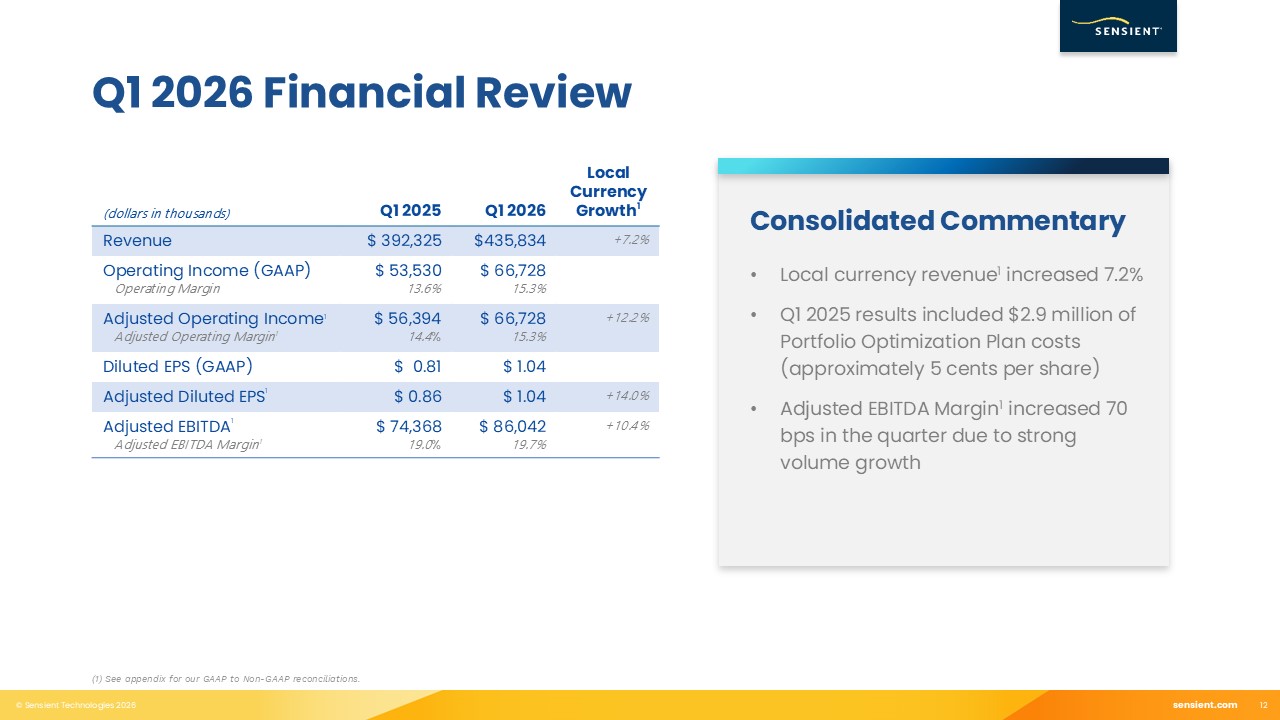
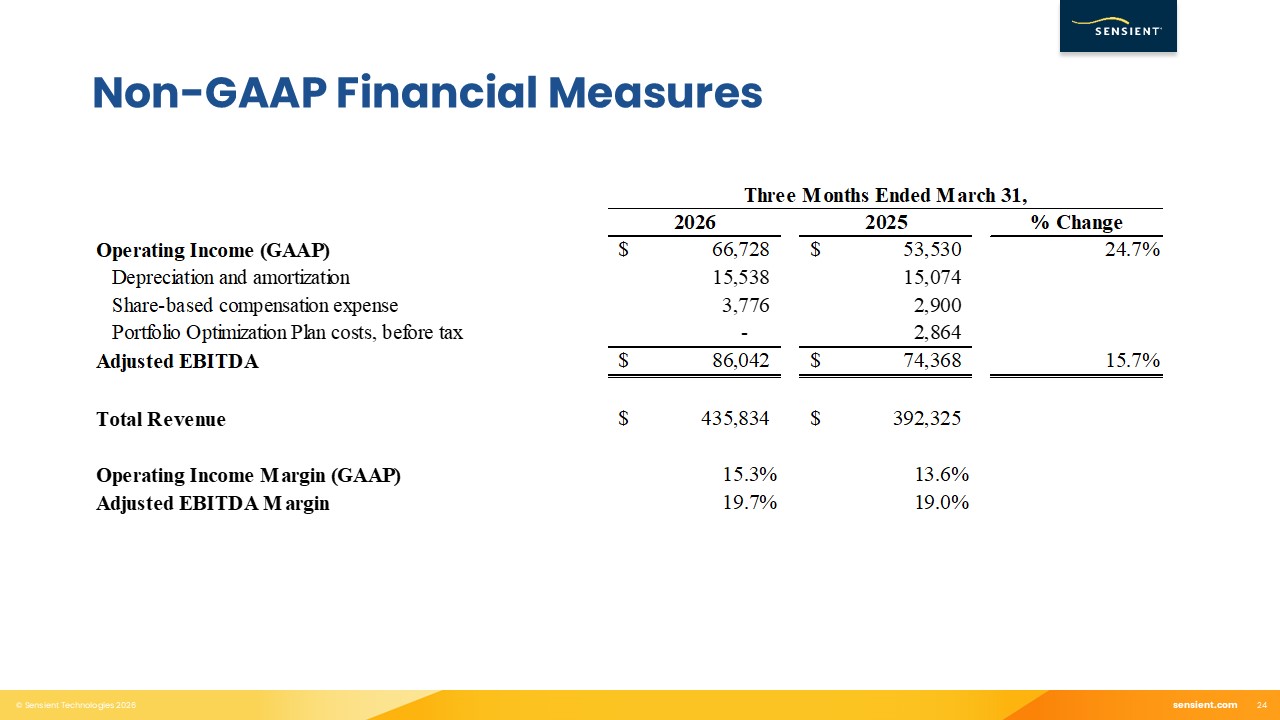
12 (1) See appendix for our GAAP to Non-GAAP reconciliations. Q1 2026 Financial
Review Local currency revenue1 increased 7.2% Q1 2025 results included $2.9 million of Portfolio Optimization Plan costs (approximately 5 cents per share) Adjusted EBITDA Margin1 increased 70 bps in the quarter due to strong volume
growth Consolidated Commentary (dollars in thousands) Q1 2025 Q1 2026 Local Currency Growth1 Revenue $ 392,325 $435,834 +7.2% Operating Income (GAAP) Operating Margin $ 53,530 13.6% $ 66,728 15.3% Adjusted Operating Income1
Adjusted Operating Margin1 $ 56,394 14.4% $ 66,728 15.3% +12.2% Diluted EPS (GAAP) $ 0.81 $ 1.04 Adjusted Diluted EPS1 $ 0.86 $ 1.04 +14.0% Adjusted EBITDA1 Adjusted EBITDA Margin1 $ 74,368 19.0% $ 86,042 19.7% +10.4%
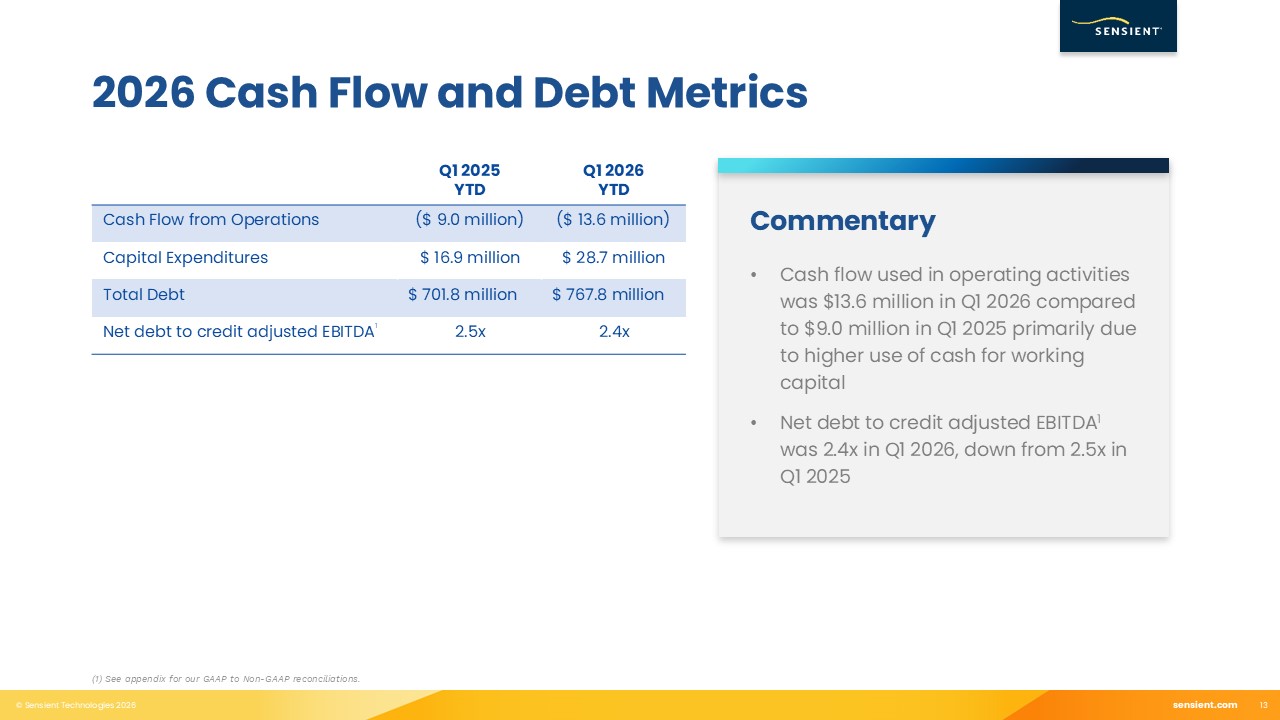
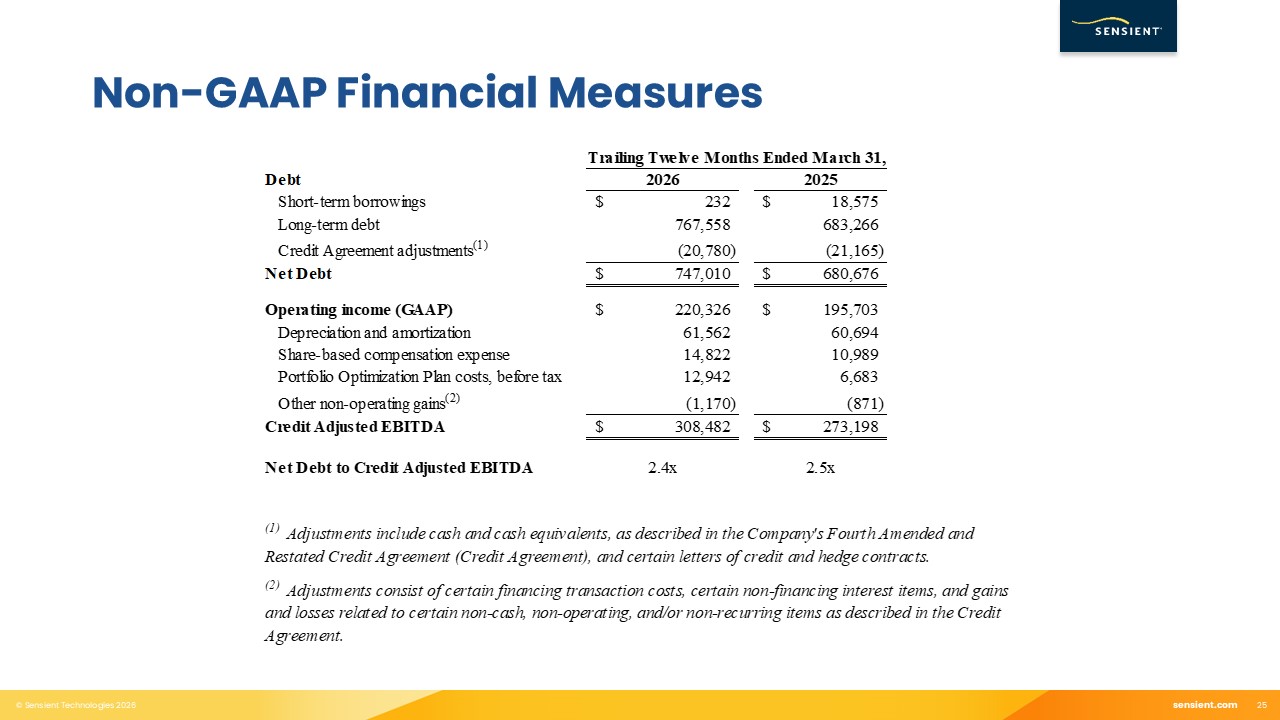
13 2026 Cash Flow and Debt Metrics Q1 2025 YTD Q1 2026 YTD Cash Flow from
Operations ($ 9.0 million) ($ 13.6 million) Capital Expenditures $ 16.9 million $ 28.7 million Total Debt $ 701.8 million $ 767.8 million Net debt to credit adjusted EBITDA1 2.5x 2.4x Cash flow used in operating activities was $13.6
million in Q1 2026 compared to $9.0 million in Q1 2025 primarily due to higher use of cash for working capital Net debt to credit adjusted EBITDA1 was 2.4x in Q1 2026, down from 2.5x in Q1 2025 Commentary (1) See appendix for our GAAP to
Non-GAAP reconciliations.
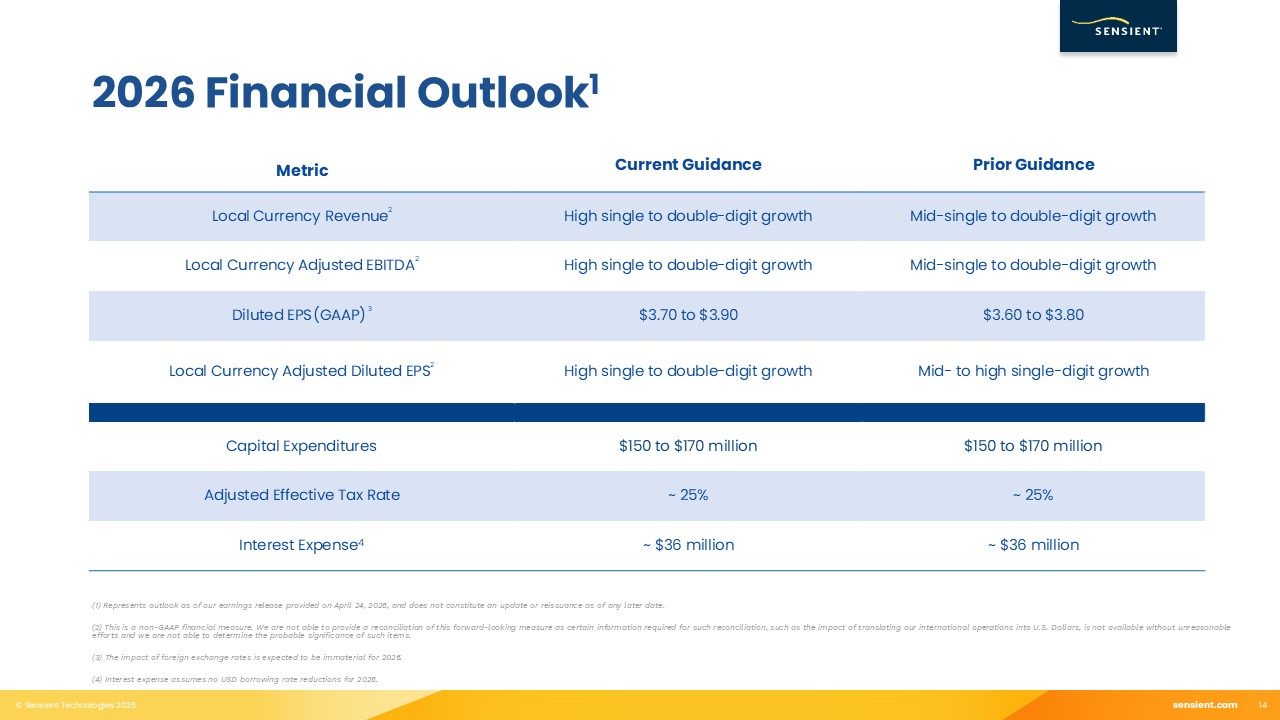
14 2026 Financial Outlook1 (1) Represents outlook as of our earnings release
provided on April 24, 2026, and does not constitute an update or reissuance as of any later date. (2) This is a non-GAAP financial measure. We are not able to provide a reconciliation of this forward-looking measure as certain information
required for such reconciliation, such as the impact of translating our international operations into U.S. Dollars, is not available without unreasonable efforts and we are not able to determine the probable significance of such items. (3) The
impact of foreign exchange rates is expected to be immaterial for 2026. (4) Interest expense assumes no USD borrowing rate reductions for 2026. Metric Current Guidance Prior Guidance Local Currency Revenue2 High single to double-digit
growth Mid-single to double-digit growth Local Currency Adjusted EBITDA2 High single to double-digit growth Mid-single to double-digit growth Diluted EPS (GAAP) 3 $3.70 to $3.90 $3.60 to $3.80 Local Currency Adjusted Diluted EPS2 High
single to double-digit growth Mid- to high single-digit growth Capital Expenditures $150 to $170 million $150 to $170 million Adjusted Effective Tax Rate ~ 25% ~ 25% Interest Expense4 ~ $36 million ~ $36 million

15

16 Appendix1 (1) Amounts in thousands, except percentages and per share
amounts.
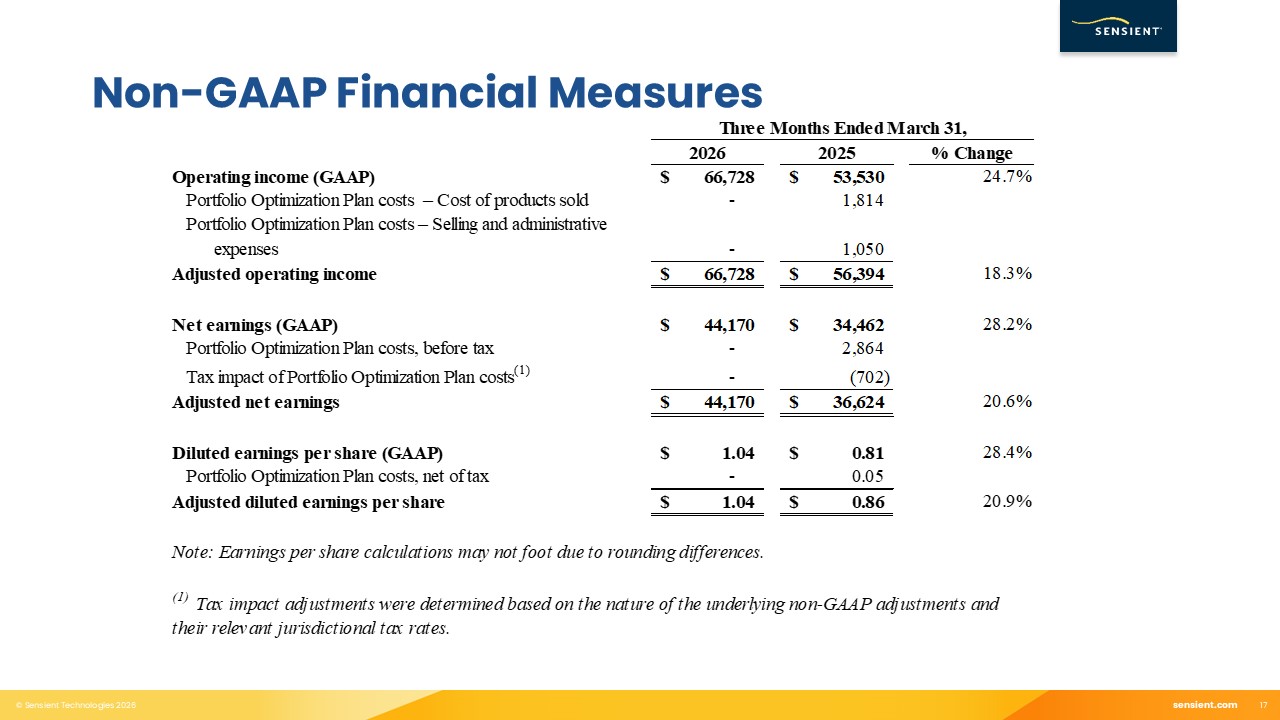
17 Non-GAAP Financial Measures
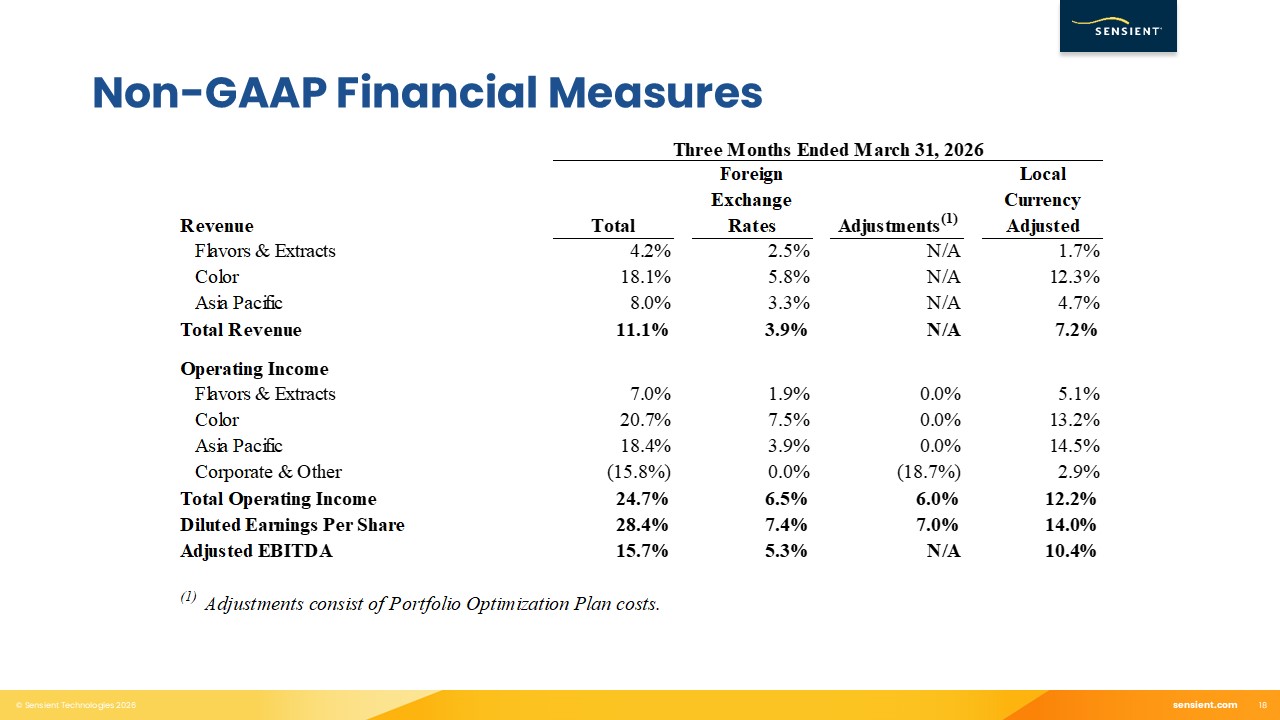
18 Non-GAAP Financial Measures
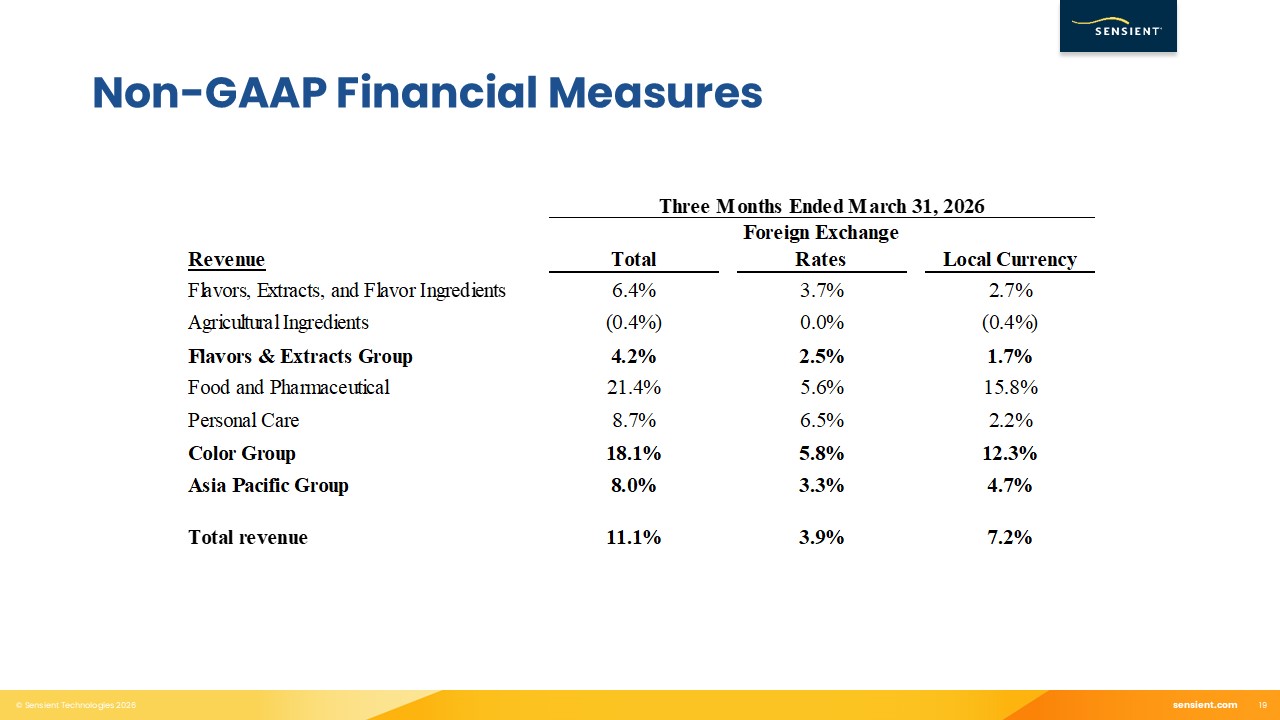
19 Non-GAAP Financial Measures
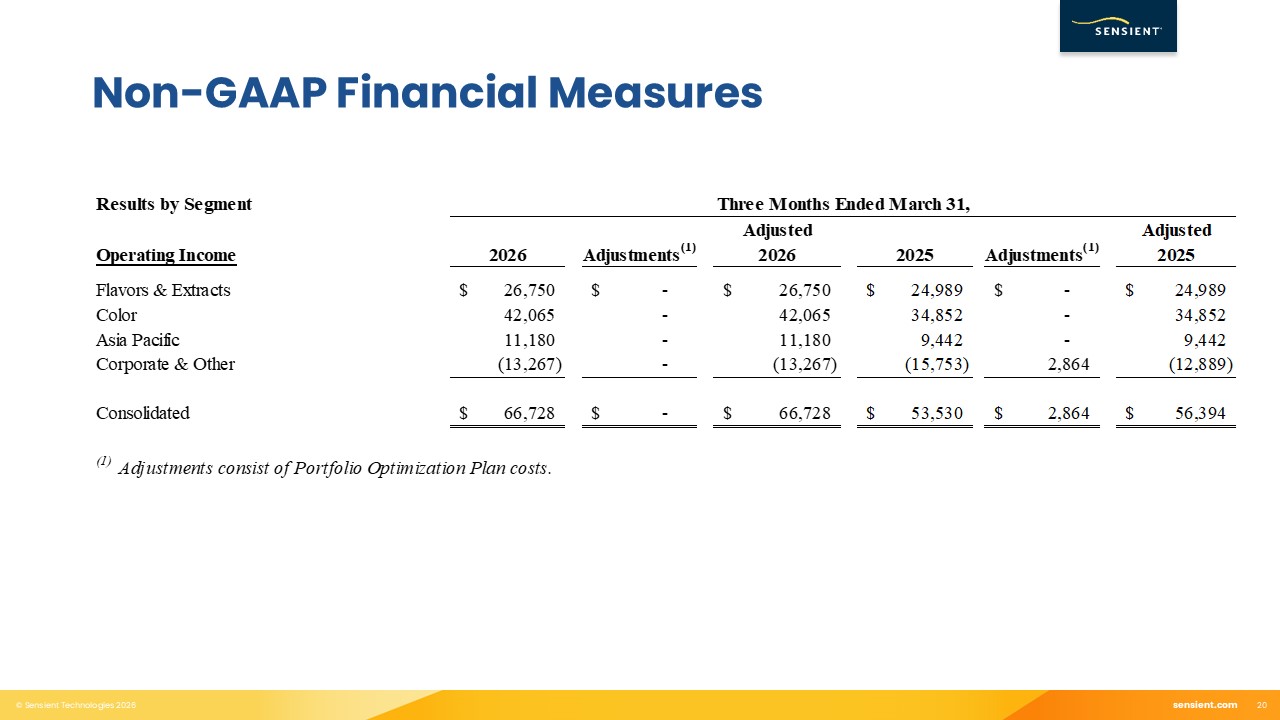
20 Non-GAAP Financial Measures
21 Non-GAAP Financial Measures

22 Non-GAAP Financial Measures

23 Non-GAAP Financial Measures
24 Non-GAAP Financial Measures
25 Non-GAAP Financial Measures
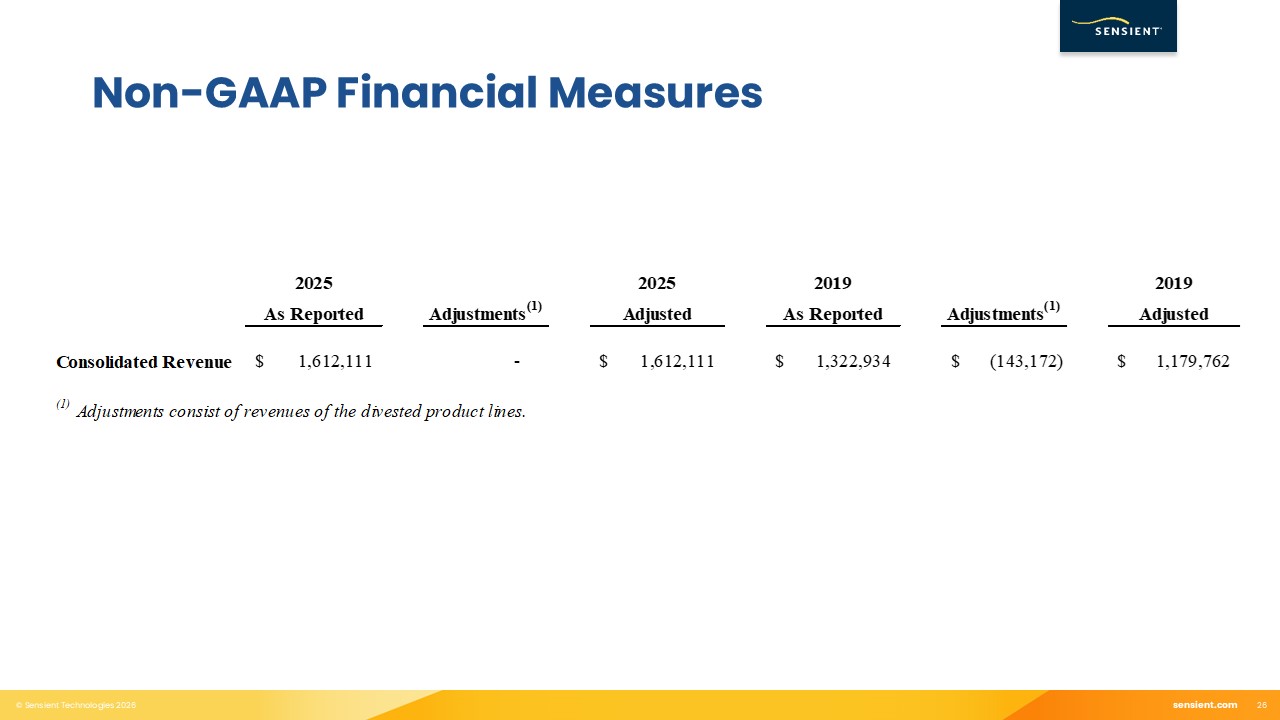
26 Non-GAAP Financial Measures
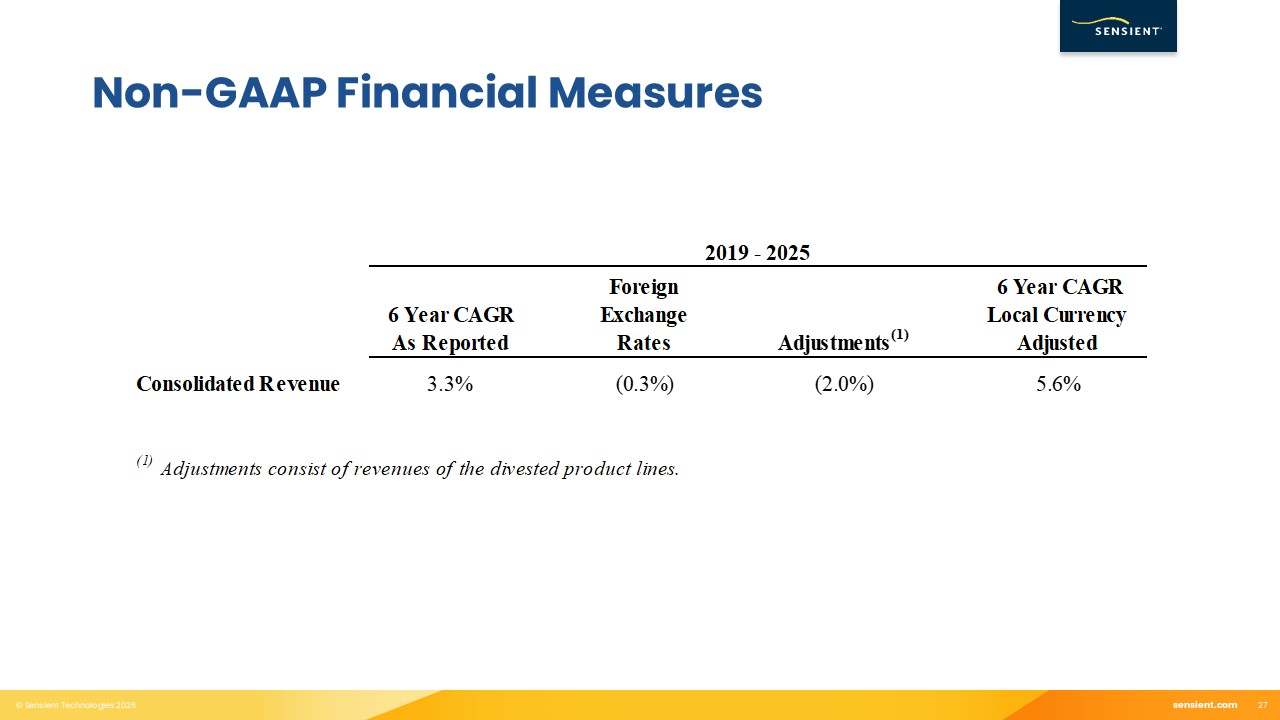
27 Non-GAAP Financial Measures