| UNITED STATES SECURITIES AND EXCHANGE COMMISSION Washington, D.C. 20549
FORM
| ||||
| | ||||
| OF the Securities Exchange Act of 1934 |
| For the fiscal year ended | Commission File Number | |||
| STANDEX INTERNATIONAL CORPORATION | ||||
| (Exact name of registrant as specified in its Charter) |
| | | |
| (State of incorporation) | (I.R.S. Employer Identification No.) | |
| | | |
| (Address of principal executive offices) | (Zip Code) | |
| ( | ||||
| (Registrant’s telephone number, including area code) |
| SECURITIES REGISTERED PURSUANT TO SECTION 12(b) OF THE SECURITIES EXCHANGE ACT OF 1934: |
| Title of Each Class | Trading Symbol(s) | Name of Each Exchange on Which Registered | ||
| | | |||
Indicate by check mark if the Registrant is a well-known seasoned issuer, as defined in Rule 405 of the Securities Act.
Indicate by check mark if the Registrant is not required to file reports pursuant to Section 13 or Section 15(d) of the Act. Yes ☐
Indicate by check mark whether the Registrant (1) has filed all reports required to be filed by Section 13 or 15(d) of the Securities Exchange Act of 1934 during the preceding 12 months (or for such shorter period that the Registrant was required to file such reports), and (2) has been subject to such filing requirements for the past 90 days.
Indicate by check mark whether the registrant has submitted electronically every Interactive Data File required to be submitted pursuant to Rule 405 of Regulation S-T (§ 232.405 of this chapter) during the preceding 12 months (or for such shorter period that the registrant was required to submit such files).
Indicate by check mark if disclosure of delinquent filers pursuant to Item 405 of Regulation S-K is not contained herein and will not be contained, to the best of Registrant's knowledge, in definitive proxy or information statements incorporated by reference in Part III of this Form 10-K or any amendment to this Form 10-K. ☒
Indicate by check mark whether the registrant is a large accelerated filer, an accelerated filer, a non-accelerated filer, smaller reporting company, or an emerging growth company. See the definitions of “large accelerated filer,” “accelerated filer,” “smaller reporting company,” and “emerging growth company” in Rule 12b-2 of the Exchange Act.
| Accelerated filer ☐ | Non-accelerated filer ☐ | Smaller Reporting Company | |
| Emerging growth company |
If an emerging growth company, indicate by check mark if the registrant has elected not to use the extended transition period for complying with any new or revised financial accounting standards provided pursuant to Section 13(a) of the Exchange Act. ☐
Indicate by check mark whether the registrant has filed a report on and attestation to its management’s assessment of the effectiveness of its internal control over financial reporting under Section 404(b) of the Sarbanes-Oxley Act (15 USC. 7262(b)) by the registered public accounting firm that prepared or issued its audit report. YES
Indicate by check mark whether the Registrant is a shell company (as defined in Rule 12b-2 of the Exchange Act). YES
If securities are registered pursuant to Section 12(b) of the Act, indicate by check mark whether the financial statements of the registrant included in the filing reflect the correction of an error to previously issued financial statements.
Indicate by check mark whether any of those error corrections are restatements that required a recovery analysis of incentive-based compensation received by any of the registrant’s executive officers during the relevant recovery period pursuant to § 240.10D-1(b). ☐
The aggregate market value of the voting and non-voting common equity held by non-affiliates of the Registrant at the close of business on December 31, 2024 was approximately $
The number of shares of Registrant's Common Stock outstanding on July 31, 2025 was
Documents incorporated by reference
Portions of the Proxy Statement for the Registrant’s 2025 Annual Meeting of Stockholders (the “Proxy Statement”) are incorporated by reference into Part III of this report.
| Item 1. |
||
| Item 1A. |
||
| Item 1B. |
||
| Item 1C. |
||
| Item 2. |
||
| Item 3. |
||
| Item 4. |
||
| Item 5. |
||
| Item 6. |
||
| Item 7. |
Management’s Discussion and Analysis of Financial Condition and Results of Operations |
|
| Item 7A. |
||
| Item 8. |
||
| Item 9. |
Changes in and Disagreements with Accountants on Accounting and Financial Disclosure |
|
| Item 9A. |
||
| Item 9B. |
||
| Item 10. |
||
| Item 11. |
||
| Item 12. |
Security Ownership of Certain Beneficial Owners and Management and Related Stockholder Matters |
|
| Item 13. |
Certain Relationships, Related Transactions and Director Independence |
|
| Item 14. |
||
| Item 15. |
||
Forward Looking Statement
Statements contained in this Annual Report on Form 10-K that are not based on historical facts are “forward-looking statements” within the meaning of the Private Securities Litigation Reform Act of 1995. Forward-looking statements may be identified by the use of forward-looking terminology such as “should,” “could,” “may,” “will,” “expect,” “believe,” “estimate,” “anticipate,” “intend,” “continue,” or similar terms or variations of those terms or the negative of those terms. There are many factors that affect the Company’s business and the results of its operations and that may cause the actual results of operations in future periods to differ materially from those currently expected or anticipated. These factors include, but are not limited to: the impact of pandemics and other global crises or catastrophic events on employees, our supply chain, and the demand for our products and services around the world; materially adverse or unanticipated legal judgments, fines, penalties or settlements; conditions in the financial and banking markets, including fluctuations in exchange rates and the inability to repatriate foreign cash; domestic and international economic conditions, including the impact, length and degree of economic downturns on the customers and markets we serve and more specifically conditions in the automotive, construction, aerospace, defense, transportation, electrification, food service equipment, consumer appliance, energy, oil and gas and general industrial markets; lower-cost competition; the relative mix of products which impact margins and operating efficiencies in certain of our businesses; the impact of higher raw material and component costs, particularly steel, certain materials used in electronics parts, petroleum based products, and refrigeration components; the impact of higher transportation and logistics costs, especially with respect to transportation of goods from Asia; an inability to realize the expected cost savings from restructuring activities including effective completion of plant consolidations, cost reduction efforts including procurement savings and productivity enhancements, capital management improvements, strategic capital expenditures, and the implementation of lean enterprise manufacturing techniques; the potential for losses associated with the exit from or divestiture of businesses that are no longer strategic or no longer meet our growth and return expectations; the inability to achieve the savings expected from global sourcing of raw materials and diversification efforts in emerging markets; the impact on cost structure and on economic conditions as a result of actual and threatened increases in trade tariffs; the inability to attain expected benefits from acquisitions and the inability to effectively consummate and integrate such acquisitions and achieve synergies envisioned by the Company; market acceptance of our products; our ability to design, introduce and sell new products and related product components; the ability to redesign certain of our products to continue meeting evolving regulatory requirements; the impact of delays initiated by our customers; and our ability to increase manufacturing production to meet demand; the impact on our operations of any successful cybersecurity attacks; and potential changes to future pension funding requirements. In addition, any forward-looking statements represent management's estimates only as of the day made and should not be relied upon as representing management's estimates as of any subsequent date. While the Company may elect to update forward-looking statements at some point in the future, the Company and management specifically disclaim any obligation to do so, even if management's estimates change.
Standex International Corporation and subsidiaries ("we," "us," "our," the "Company" and "Standex" is a diversified industrial manufacturer with leading positions in a variety of products and services that are used in diverse commercial and industrial markets. Headquartered in Salem, New Hampshire, we have six operating segments aggregated into five reportable segments: Electronics, Engineering Technologies, Scientific, Engraving and Specialty Solutions. Two operating segments are aggregated into Specialty Solutions. Our businesses work in close partnership with our customers to deliver custom solutions or engineered components that solve their unique and specific needs, an approach we call "Customer Intimacy."
Standex was incorporated in 1975 and is the successor of a corporation organized in 1955. We have paid dividends each quarter since Standex became a public corporation in November 1964. Overall management, strategic development and financial control are led by the executive staff at our corporate headquarters. Our growth strategy is focused on four key areas: (1) Increasing our presence in rapidly growing markets and applications (2) executing new product development in both core and adjacent market applications; (3) expanding geographically where meaningful business opportunities exist; and (4) undertaking strategically aligned acquisitions that strengthen and/or expand our core businesses. We direct our investments towards markets with long term, secular growth prospects such as renewable energy, electric vehicles, smart power grid, military and defense and life sciences.
Unless otherwise noted, references to years are to fiscal years. Currently our fiscal year end is June 30. Our fiscal year 2025 includes the twelve-month period from July 1, 2024 to June 30, 2025.
Our long-term business strategy is to create, improve, and enhance shareholder value by building more profitable, focused industrial platforms through our Standex Value Creation System. This methodology employs four components: Balanced Performance Plan, Growth Disciplines, Operational Excellence, and Talent Management and provides both a company-wide framework and tools used to achieve our goals. We intend to continue investing organically and inorganically in high margin and growth businesses using this balanced and proven approach.
It is our objective to grow larger and more profitable business units through both organic and inorganic initiatives. We have a particular focus on identifying and investing in opportunities that complement our products and will increase the overall scale, global presence and capabilities of our businesses. We continue to execute on acquisitions where strategically aligned with our businesses and where the opportunity meets our investment metrics. We have divested, and likely will continue to divest, businesses that we feel are not strategic or do not meet our growth and return expectations.
The Company’s strong historical cash flow has been a cornerstone for funding our capital allocation strategy. We use cash flow generated from operations to fund investments in capital assets to upgrade our facilities, improve productivity and lower costs, invest in the strategic growth programs described above, including organic and inorganic growth, and to return cash to our shareholders through payment of dividends and stock buybacks. Where appropriate, we use a disciplined approach to leverage, in the form of our unsecured revolving credit facility, to fund important inorganic strategic initiatives.
Please visit our website at www.standex.com to learn more about us or to review our most recent SEC filings. The information on our website is for informational purposes only and is not incorporated into this Annual Report on Form 10-K.
Description of Segments
Electronics
Our Electronics group is a global component and value-added solutions provider of sensing and switching technologies, high precision instruments transformers, and high reliability magnetic power conversion and measurement components and assemblies. Electronics competes on the basis of Customer Intimacy by designing, engineering, and manufacturing innovative solutions, components and assemblies to solve our customers’ application needs through our Partner/Solve/Deliver® approach. Our approach allows us to expand the business through organic growth with current customers as well as developing new products, driving geographic expansion, and pursuing inorganic growth through strategic acquisitions.
Components are manufactured in plants located in the U.S., Mexico, the U.K., Germany, Japan, China and India.
Markets and Applications
Our highly engineered products and vertically integrated manufacturing capabilities provide solutions to an array of markets and provide safe and efficient power transformation, current monitoring, and isolation, as well as switch, sensor and relay solutions to monitor systems for function and safety. The end-user of our engineered solution is typically an original equipment manufacturer (“OEM”) or industrial equipment manufacturer. End-user markets include, but are not limited to, appliances, electrification (electric vehicles, solar, smart-grid, alternative energy), military, medical, aerospace, test and measurement, power distribution, security, general industrial applications, and transportation.
Brands
Business unit names are Standex Electronics, Standex-Meder Electronics, Renco Electronics, Northlake Engineering, Agile Magnetics, Sensor Solutions, Standex Electronics Japan, Minntronix, Nascentechnology, Sanyu, Amran Instruments and Narayan Powertech. Other associated brand names include the MEDER, KENT, and KOFU reed switch brands.
Products and Services
Our sensing products employ reed switch, Hall effect, inductive, conductive and other technologies. Sensing based solutions include reed relays, fluid level, proximity, motion, flow, HVAC condensate as well as custom electronic sensors containing our core technologies. Our grid technologies products include instrument transformers, current sensors and bushings. The magnetics or power conversion products include custom wound transformers and inductors for low and high frequency applications, current sense technology, advanced planar transformer technology, value added assemblies, and mechanical packaging.
Customers
The business sells globally to a wide variety of mainly OEM customers focused in the end markets noted previously through a direct sales force, regional sales managers, field applications engineers, commissioned agents, representative groups, and distribution channels.
Engineering Technologies
Our Engineering Technologies Group (ETG) is a provider of innovative, metal-formed solutions for OEM and Tier 1 manufacturers for use in their advanced engineering designs.
Our solutions seek to address unique customer design challenges such as reduction of input weight, material cost, part count, and complexity involving all formable materials with particular focus on challenge geometries, large thickness to thin-wall construction, and/or single-piece construction requirements. Engineering Technologies devises and manufactures these cost-effective components and assemblies by combining a portfolio of best-in-class forming technologies and technical experience, vertically integrated manufacturing processes, and group wide technical and design expertise.
We intend to grow sales and product offerings by investing in advancements in our current and new technologies and identifying new cutting-edge solutions for these capabilities in existing and adjacent markets via customer and research collaboration.
Our segment is comprised of our Spincraft businesses with locations in Billerica, MA, New Berlin, WI, and Newcastle upon Tyne in the U.K., and our McStarlite business located in Harbor City, CA.
Markets and Applications
Engineering Technologies products serve applications within the space, aviation, defense, energy, medical, and general industrial markets.
| ● |
The space market we serve is comprised of components and assemblies for space launch vehicles, engines, crewed and uncrewed spacecraft and other space infrastructure. |
| ● |
The aviation market offerings include a large portfolio of components for commercial and regional aircraft nacelles, engines, and fuel systems. |
| ● |
The defense market we serve covers a wide spectrum of applications including components and sub-assemblies for missiles, naval propulsion, and military aircraft nacelle and engine solutions. |
| ● |
Applications within the energy market include components and assemblies for new and MRO gas turbines, as well as solutions for oil & gas exploration operations. |
Brands
Our products are sold under the brands - Spincraft and McStarlite.
Products and Services
| ● |
Space: Fuel tanks and fuel tank domes, rocket engine components, crew vehicle and unmanned spacecraft structures and bulkheads |
|
| ● |
Aviation: Nacelle inlet lipskins & ducts, engine components and fuel tank elements |
| ● |
Defense: Missile nose cones & sub-assemblies, naval propulsion components, exhaust assemblies, and military aircraft engine nacelle & exhaust components |
| ● |
Energy: Power generation turbine & other assemblies, oil & gas exploration connection components |
Customers
Engineering Technologies components are sold directly to large space, aviation, defense, energy and medical companies, or suppliers to those companies.
Scientific
Our Scientific business specializes in providing specialty temperature-controlled equipment for the medical, scientific, pharmaceutical, biotech, and industrial markets. We design and produce these products in Summerville, SC and Bruce Township, MI, ensuring high quality and reliability.
We offer a range of products in our portfolio that control the temperatures of critical healthcare products, medications, vaccines, and laboratory samples. Our focus is on solving customer problems for these critical applications, delivering innovative products and solutions that meet stringent regulatory requirements and the unique needs of our customers.
Markets and Applications
The scientific and healthcare equipment that we design, assemble and manufacture is used in hospitals, pharmacies, clinical laboratories, reference laboratories, physicians’ offices, life science laboratories, government and academic facilities, and industrial testing laboratories. Our product offerings include:
| ● |
Laboratory and medical grade refrigerators, freezers and accessories, |
| ● |
Cryogenic storage tanks and accessories, |
|
| ● |
Blood bank refrigerators and plasma freezers, |
|
| ● |
Benchtop and high-capacity controller rate freezers, |
| ● |
Ultra low temperature freezers, and |
|
| ● |
Environmental stability chambers and incubators. |
Brands
Our products are sold under various brands including American BioTech Supply (ABS), Lab Research Products (LRP), Corepoint, Cryosafe and CryoGuard, and Custom Biogenic Systems.
Products and Services
We manufacture and provide specialty-controlled temperature equipment purpose-built for the medical, scientific, pharmaceutical, biotech and industrial markets. Our comprehensive portfolio includes a range of innovative storage solutions for medications, vaccines, blood products, patient samples, biologics and laboratory samples.
Customers
Scientific products are sold to medical and laboratory distributors, healthcare facilities, research universities, pharmaceutical and biotech companies, pharmacies and industrial facilities.
Engraving
Our Engraving group is a global creator and provider of custom textures and surface finishes on tooling that enhance the beauty and function of a wide range of consumer good and automotive products as well as production of specialized, differentiated parts requiring our unique capabilities. We focus on continuing to meet the needs of a changing marketplace by offering experienced craftsmanship while investing in new technologies such as laser engraving and soft surface skin texturized tooling. Our growth strategy is to continue to develop and/or acquire technologies to enhance surface textures that also allow our customers to introduce more sustainable manufacturing processes and reduce their own energy consumption. We are operating as one company with global reach, using a consistent approach to guarantee harmony on global programs to serve of our customers.
Markets and Applications
Standex Engraving Mold Tech has become the global leader in its industry by offering a full range of services to OEM’s, Tier 1 suppliers, mold makers and product designers. From start to finish, these services include the design of bespoke textures, the verification of the texture on a prototype, engraving a mold, enhancing and polishing it, and then offering on-site try-out support with ongoing tool maintenance and texture repair capabilities. In addition to these services, we also produce soft trim tooling such as in mold graining (IMG) and nickel shells as well as production of specialized parts requiring deep knowledge of the soft trim manufacturing process.
Brands
In addition to the Mold Tech brand, Engraving companies and brands also include:
| ● |
Piazza Rosa and World Client Services (WCS), which both offer laser engraving and tool finishing in Europe and Mexico. |
|
| ● | Tenibac-Graphion, which provides additional texturizing and prototyping capabilities in North America and China. |
| ● |
GS Engineering, which employs advanced processes and technology to rapidly produce molds for the creation of soft-touch surfaces. |
| ● |
Innovent, which is a specialized supplier of tools and machines used to produce diapers and products that contain absorbent materials between layers of non-woven fabric. |
Products and Services
Texturing is achieved with either a laser or a chemical etching technique.
| ● |
Laser Engraving offers superior features, such as multiple gloss levels, the elimination of paint and optimized scratch performance, and sharp definition for precise geometric patterns. |
| ● |
Chemical Engraving produces carefully designed textures and finishes without seams or distortion. Our Digital Transfer Technology offers an exclusive service which guarantees consistency, pattern integrity and texture harmony around the world. |
Architexture Design Studio uses proprietary technology called Model-Tech® which utilizes proven expertise to create and test custom textures. During the Model-Tech process, an original texture is first designed to offer beauty and function, which ultimately is used to create a large-format skin that can be wrapped on a model for testing.
Tooling Performance services include the enhancement, finishing and repair of a tool to improve its use during manufacturing.
Soft Trim Tooling and nickel shell molds are used to produce soft surfaces that emulate the feel of natural materials. The IMG process we support consumes significantly less energy in our customers' operations than the traditional slush molding process. Our deep knowledge of this process positions us to manufacture certain demanding parts.
Customers
The Engraving business has become the global leader providing these products and services by offering a full range of services to automotive OEM’s, product designers, Tier 1 suppliers, and toolmakers all around the world.
Specialty Solutions
Specialty Solutions is comprised of two businesses: Federal Industries and Custom Hoists. These businesses differentiate themselves in their respective markets by collaborating with customers to develop and deliver custom solutions.
Federal Industries provides merchandising solutions to retail and food service customers whose revenue stream is enhanced through food presentation. Federal Industries focuses on the challenges of enabling retail and food service establishments to provide food and beverages that are fresh and appealing while at the same time providing for food safety, and energy efficiency. Our key differentiator is the ability to customize products to meet customers' needs within industry standard lead-times. This differentiator is used to target the convenience store, school cafeterias and quick-service restaurant segments.
Custom Hoists is a supplier of engineered hydraulic cylinders that meet customer specific requirements for demanding applications. Our engineering expertise coupled with broad manufacturing capabilities and responsiveness to customer needs drives our top line growth opportunities. We leverage our full line of products for the construction markets in dump truck and trailer applications and deep expertise in the refuse market to expand into new adjacent markets, targeting the most challenging custom applications. Flexible design capability, a global supply chain and speed to market enable us to be successful in growing our business. Our team is dedicated to superior customer service through our technical engineering support and on-time delivery.
Specialty Solutions products are designed and/or manufactured in Hayesville, OH; Belleville, WI; and Tianjin, China.
Markets and Applications
Federal Industries custom designs and manufactures refrigerated, heated and dry merchandising display cases for bakery, deli, confectionary and packaged food products utilized in restaurants, convenience stores, quick-service restaurants, supermarkets, drug stores and institutions such as hotels, hospitals, and school cafeterias.
Custom Hoist products are utilized by OEMs on vehicles such as dump trucks, dump trailers, bottom dumps, garbage trucks (both recycling and rear loader), container roll off vehicles, hook lift trucks, liquid waste handlers, vacuum trucks, compactors, balers, airport catering vehicles, container handling equipment for airlines, lift trucks, yard tractors, and underground mining vehicles.
Brands
Federal Industries products are sold under the Federal brand.
Custom Hoists products are sold under the Custom Hoist brand.
Products and Services
Federal Industries offers a selection of display cases, including innovative customization, for fresh food merchandising requirements.
Custom Hoists designs and manufactures single and double acting telescopic and piston rod hydraulic cylinders for original and aftermarket use in construction equipment, refuse, airline support, mining, oil and gas, and other material handling applications.
Customers
Specialty Solutions products are sold to OEMs, distributors, service organizations, aftermarket repair outlets, end-users, dealers, buying groups, consultants, government agencies and manufacturers.
The following provides a description of key areas impacting our Company.
Working Capital
Our primary source of working capital is the cash generated from continuing operations. No segments require any special working capital needs outside of the normal course of business.
Competition
Standex manufactures and markets products many of which have achieved a unique or leadership position in their market, however, we encounter competition in varying degrees in all product groups and for each product line. Competitors include domestic and foreign producers of the same and similar products. The principal methods of competition are industry and design expertise, product performance and technology, price, delivery schedule, quality of services, and other terms and conditions. Standex competes on the basis of Customer Intimacy in which our teams work as extensions of our customers organizations to apply our expertise and technology to address needs with customer solutions.
International Operations
International operations are conducted at 41 locations, including Europe, Canada, China, Japan, India, Southeast Asia and Mexico. See the Notes to Consolidated Financial Statements for international operations financial data. The percentage of our overall net sales from continuing international operations increased from 38% in fiscal year 2024 to 41% in fiscal year 2025. International operations are subject to certain inherent risks in connection with the conduct of business in foreign countries including, exchange controls, price controls, limitations on participation in local enterprises, nationalizations, expropriation and other governmental action, restrictions of repatriation of earnings, and changes in currency exchange rates.
Research and Development
We develop and design new products to meet customer needs in order to offer enhanced products or to provide customized solutions for customers. Developing new and improved products, broadening the application of established products, and continuing efforts to improve our methods, processes, and equipment continue to drive our success. Research and development costs are quantified in the Notes to Consolidated Financial Statements.
Environmental Matters
Based on our knowledge and current known facts, we believe that we are presently in substantial compliance with all existing applicable environmental laws and regulations and do not anticipate (i) any instances of non-compliance that will have a material effect on our future capital expenditures, earnings or competitive position or (ii) any material capital expenditures for environmental control facilities.
Financial Information about Geographic Areas
Information regarding revenues from external customers attributed to the United States, all foreign countries and any individual foreign country, if material, is contained in the Notes to Consolidated Financial Statements, “Revenue from Contracts with Customers.”
Human Capital Resources
Standex International understands that its rich history of success and future opportunities are directly linked to its dedicated, engaged, and diverse workforce. As of June 30, 2025, we employ approximately 4,100 employees of which approximately 1,300 are in the United States. About 225 of our U.S. employees are represented by unions. Our competitive wages and benefits align with those of other manufacturers in our geographic locations. We prioritize open, two-way communication and foster strong relationships with both our non-union employees and the various unions and works councils within our business segments. Regular training programs tailored to employees’ roles and optional development opportunities are available for those seeking personal and professional growth. Our global Standex Safety Council, which includes representatives from all Standex sites, meets regularly to enhance our safety culture and monitor our Total Recordable Incident Rate.
The Chief Human Resources Officer frequently collaborates with the Chief Executive Officer and the Executive Leadership Team to align Human Capital strategies and initiatives with our business goals. We aim to provide a rewarding employee experience across the company by continuously reviewing our Human Capital Resources metrics, such as safety metrics, turnover rates, and culture survey responses. These reviews help us promote a safe, inclusive, and engaging work environment. Our annual Organization and Talent Review is a structured process that supports succession planning and provides visibility into our diverse leadership pipeline. It enables us to assess and develop key talent across the organization to ensure strong, future-ready leaders. Our LEAP performance management and development process emphasizes both manager engagement and employee ownership. We conduct regular employee engagement and satisfaction surveys, including our annual Culture Survey. Insights from these surveys drive senior management’s efforts to continually improve our company culture and operations. Action plans are developed and reviewed quarterly, and progress is a key performance indicator for every business annually.
In fiscal year 2025, we implemented a global Human Capital Management System to further support our commitment to our workforce. This system enhances our ability to attract, manage and develop our talent, streamline operations, and improve overall employee satisfaction, providing a platform of standard work, tools, processes and analytics that better enable us to provide a rewarding and supportive environment for all employees.
Standex hosts an annual meeting event in the first quarter of the fiscal year with the extended global leadership team, representative of all our business segments and corporate functions, in which participants join together to align on business and culture goals, participate in leadership development training, share best practices and build unity across the company.
The Inclusion Advisory Council (IAC) serves as a collaborative platform for employee voices, informing and aligning the company’s commitment to inclusivity. The IAC provides operational input to the Executive Leadership Team in three key areas: setting global inclusivity and diversity goals, collaborating with Corporate Communications to highlight the IAC’s work, and championing the implementation of IAC initiatives. Additionally, we launched the Women and Leadership Employee Resource Group in fiscal year 2023, aiming to increase the representation of women at all levels, enhancing the company’s success through relationships and partnerships. We continue to explore additional ERGs in partnership with the IAC.
Standex Cares is our community engagement program that supports local initiatives and charitable activities in the areas where we operate. It reflects our commitment to social responsibility and strengthens employee pride and connection through volunteerism and service. Together with our focus on safety, talent development, and culture, Standex Cares underscores our broader commitment to investing in our people and the communities we serve.
Executive Officers of Standex
The executive officers of the Company as of June 30, 2025 are as follows:
| Name |
Age |
Principal Occupation During the Past Five Years |
| David Dunbar |
63 |
President and Chief Executive Officer of the Company since January 2014. |
| Ademir Sarcevic |
50 |
Vice President and Chief Financial Officer of the Company since September 2019. Various positions over the years at Pentair plc from 2012 to September 2019 with increasing responsibility ending as Senior Vice President and Chief Accounting Officer. |
| Alan J. Glass |
61 |
Vice President, Chief Legal Officer and Secretary of the Company since April 2016. |
| Annemarie Bell | 61 |
Vice President, Chief Human Resources Officer since July 2021, Vice President of Human Resources from June 2019 to July 2021, Interim Vice President of Human Resources from October 2018 through June 2019; Vice President of Human Resources for four of Standex business units from October 2015 through October 2018. |
| Max Arets | 52 | Vice President, Chief Information Officer since April 2024. Various positions of increasing responsibility in IT Audit, finance systems, project management and information systems and with Tyco International and Pentair from 2005 to March 2024 ending as Vice President, Digital Enterprise. |
| Danielle Rangel | 43 | Vice President, Chief Accounting Officer of the Company since May 2025. Vice President of Internal Audit and Investigations from May 2023 to May 2025. Various positions of increasing responsibility at Pentair, Emerson, and Binks ending as Global Controller until joining the Company in May 2023. |
The executive officers are elected each year at the first meeting of the Board of Directors subsequent to the annual meeting of stockholders, to serve for one-year terms of office. There are no family relationships among any of the directors or executive officers of the Company.
Long-Lived Assets
Long-lived assets are described and discussed in the Notes to Consolidated Financial Statements under the caption “Long-Lived Assets.”
Available Information
Standex’s corporate headquarters are at 23 Keewaydin Drive, Salem, New Hampshire 03079, and our telephone number at that location is (603) 893-9701.
The U.S. Securities and Exchange Commission (the “SEC”) maintains an internet website at www.sec.gov that contains our annual reports on Form 10-K, quarterly reports on Form 10-Q, current reports on Form 8-K and proxy statements, and all amendments thereto. Standex’s internet website address is www.standex.com. Our annual reports on Form 10-K, quarterly reports on Form 10-Q, current reports on Form 8-K and proxy statements, and all amendments thereto, are available free of charge on our website as soon as reasonably practicable after such reports are electronically filed with or furnished to the SEC. In addition, our code of business conduct, our code of ethics for senior financial management, our corporate governance guidelines, and the charters of each of the committees of our Board of Directors (which are not deemed filed by this reference), are available on our website and are available in print to any Standex shareholder, without charge, upon request in writing to “Chief Legal Officer, Standex International Corporation, 23 Keewaydin Drive, Salem, New Hampshire, 03079.”
An investment in the Company involves various risks, including those mentioned below and those that are discussed from time to time in our other periodic filings with the Securities and Exchange Commission. Investors should carefully consider these risks, along with the other information filed in this report, before making an investment decision regarding the Company. Any of these risks could have a material adverse effect on our financial condition, results of operations and/or value of an investment in the Company.
A pandemic or other global health crisis could adversely affect our revenues, operating results, cash flow and financial condition.
Our business and operations, and the operations of our suppliers, business partners and customers, were adversely affected by the Coronavirus (or COVID-19) pandemic which is impacted worldwide economic activity including in many countries or localities in which we operate, sell, or purchase goods and services. Any future pandemics or other global health crises could similarly have an adverse effect on our revenues, operating results, cash flow and financial condition. The ultimate extent to which any such circumstance impacts our business will depend on the severity, location and duration of the issue, the actions undertaken in response by local and world governments and health officials, and the success of medical efforts to address and mitigate the threat.
A deterioration in the domestic and international economic environment, whether by way of inflationary conditions or recessionary conditions, could adversely affect our operating results, cash flow and financial condition.
We are subject to inflationary impacts across the world which could materially increase our costs of materials, labor and transportation. We attempt to maintain our profit margins by anticipating such inflationary pressures and increasing our prices where possible in accordance with contractual requirements and competitive conditions. While we thus far have been largely successful in mitigating the impact of such inflationary conditions, we may be unable to continue to increase our own prices sufficiently to offset cost increases, and, to the extent that we are able to do so, we may not be able to maintain existing operating margins and profitability. Additionally, competitors operating in regions with less inflationary pressure may be able to compete more effectively which could further impact our ability to increases prices and/or result in lost sales.
Recessionary economic conditions, with or without a tightening of credit, could adversely impact major markets served by our businesses, including cyclical markets such as automotive, aviation, energy and power, heavy construction vehicle, general industrial, consumer appliances and food service. An economic recession could adversely affect our business by:
| • |
reducing demand for our products and services, particularly in markets where demand for our products and services is cyclical; |
| • |
causing delays or cancellations of orders for our products or services; |
| • |
reducing capital spending by our customers; |
| • |
increasing price competition in our markets; |
| • |
increasing difficulty in collecting accounts receivable; |
| • |
increasing the risk of excess or obsolete inventories; |
| • |
increasing the risk of impairment to long-lived assets due to reduced use of manufacturing facilities; |
| • |
increasing the risk of supply interruptions that would be disruptive to our manufacturing processes; and |
| • |
reducing the availability of credit and spending power for our customers. |
We rely on our credit facility to provide us with sufficient capital to operate our businesses and to fund acquisitions.
We rely on our revolving credit facility, in part along with operating cash flow, to provide us with sufficient capital to operate our businesses and to fund acquisitions. The availability of borrowings under our revolving credit facility is dependent upon our compliance with the covenants set forth in the facility, including the maintenance of certain financial ratios. Our ability to comply with these covenants is dependent upon our future performance, which is subject to economic conditions in our markets along with factors that are beyond our control. Violation of those covenants could result in our lenders restricting or terminating our borrowing ability under our credit facility, cause us to be liable for covenant waiver fees or other obligations, or trigger an event of default under the terms of our credit facility, which could result in acceleration of the debt under the facility and require prepayment of the debt before its due date. Even if new financing is available, in the event of a default under our current credit facility, the interest rate charged on any new borrowing could be substantially higher than under the current credit facility, thus adversely affecting our overall financial condition. If our lenders reduce or terminate our access to amounts under our credit facility, we may not have sufficient capital to fund our working capital needs and/or acquisitions or we may need to secure additional capital or financing to fund our working capital requirements or to repay outstanding debt under our credit facility or to fund acquisitions.
Our credit facility contains covenants that restrict our activities.
Our revolving credit facility contains covenants that restrict our activities, including our ability to:
| • |
incur additional indebtedness; |
| • |
make investments, including acquisitions; |
| • |
create liens; |
| • |
pay cash dividends to shareholders unless we are compliant with the financial covenants set forth in the credit facility; and |
| • |
sell material assets. |
Our global operations subject us to international business risks.
We operate in 41 locations outside of the United States in Europe, Canada, China, Japan, India, Singapore, Mexico, Turkey and Malaysia. If we are unable to successfully manage the risks inherent to the operation and expansion of our global businesses, those risks could have a material adverse effect on our results of operations, cash flow or financial condition. These international business risks include:
| • |
fluctuations in currency exchange rates; |
| • |
changes in government regulations; |
| • |
restrictions on repatriation of earnings; |
| • |
import and export controls; |
| • |
political, social and economic instability; |
| • |
potential adverse tax consequences; |
| • |
difficulties in staffing and managing multi-national operations; |
| • |
unexpected changes in zoning or other land-use requirements; |
| • |
difficulties in our ability to enforce legal rights and remedies; and |
| • |
changes in regulatory requirements. |
Failure to achieve expected savings and synergies could adversely impact our operating profits and cash flows.
We focus on improving profitability through LEAN enterprise, low-cost sourcing and manufacturing initiatives, improving working capital management, developing new and enhanced products, consolidating factories where appropriate, automating manufacturing processes, diversification efforts and completing acquisitions which deliver synergies to stimulate sales and growth. If we are unable to successfully execute these programs, such failure could adversely affect our operating profits and cash flows. In addition, actions we may take to consolidate manufacturing operations to achieve cost savings or adjust to market developments may result in restructuring charges that adversely affect our profits.
Violation of anti-bribery or similar laws by our employees, business partners or agents could result in fines, penalties, damage to our reputation or other adverse consequences.
We cannot assure that our internal controls, code of conduct and training of our employees will provide complete protection from reckless or criminal acts of our employees, business partners or agents that might violate United States or international laws relating to anti-bribery or similar topics. A violation of these laws could subject us to civil or criminal investigations that could result in substantial civil or criminal fines and penalties, and which could damage our reputation.
We face significant competition in our markets and, if we are not able to respond to competition in our markets, our net sales, profits and cash flows could decline.
Our businesses operate in highly competitive markets. To compete effectively, we must retain long standing relationships with significant customers, offer attractive pricing, maintain product quality, meet customer delivery requirements, develop enhancements to products that offer performance features that are superior to our competitors and which maintain our brand recognition, continue to automate our manufacturing capabilities, continue to grow our business by establishing relationships with new customers, diversify into emerging markets and penetrate new markets. In addition, many of our businesses experience sales churn as customers seek lower cost suppliers. We attempt to offset this churn through our continual pursuit of new business opportunities. However, if we are unable to compete effectively or succeed in our pursuit of new business opportunities, our net sales, profitability and cash flows could decline. Pricing pressures resulting from competition may adversely affect our net sales and profitability.
If we are unable to successfully introduce new products and product enhancements, our future growth could be impaired.
Our ability to develop new products and innovations to satisfy customer needs or demands in the markets we serve can affect our competitive position and often requires significant investment of resources. Difficulties or delays in research, development or production of new products and services or failure to gain market acceptance of new products and technologies may significantly reduce future net sales and adversely affect our competitive position.
Increased prices or significant shortages of the commodities that we use in our businesses could result in lower net sales, profits and cash flows.
We purchase large quantities of steel, aluminum, refrigeration components, freight services, and other metal commodities for the manufacture of our products. We also purchase significant quantities of relatively rare elements used in the manufacture of certain of our electronics products. Historically, prices for commodities and rare elements have fluctuated, and we are unable to enter into long-term contracts or other arrangements to hedge the risk of price increases in many of these commodities. Significant price increases for these commodities and rare elements could adversely affect our operating profits if we cannot timely mitigate the price increases by successfully sourcing lower cost commodities or rare elements or by passing the increased costs on to customers. Shortages or other disruptions in the supply of these commodities or rare elements could delay sales or increase costs.
Current and threatened tariffs on components and finished goods from China and other countries could result in lower net sales, profits and cash flows and could impair the value of our investments in our Chinese operations.
As part of our low-cost country sourcing strategy, we (i) maintain manufacturing facilities in China and (ii) import certain components and finished goods from our own facilities and third-party suppliers in China. Many of the components and finished goods we import from China are subject to tariffs enacted by the United States government. While we attempt to pass on these additional costs to our customers, competitive factors (including competitors who import from other countries subject to lower tariffs) may limit our ability to sustain price increases and, as a result, may adversely impact our net sales, profits and cash flows. The maintenance of such tariffs over the long-term also could impair the value of our investments in our Chinese operations. In addition, the imposition of tariffs may influence the sourcing habits of certain end users of our products and services which, in turn, could have a direct impact on the requirements of our direct customers for our products and services. Such an impact could adversely affect our net sales, profits and cash flows.
An inability to identify or complete future acquisitions could adversely affect our future growth.
As part of our growth strategy, we intend to pursue acquisitions that provide opportunities for profitable growth for our businesses and enable us to leverage our competitive strengths. While we continue to evaluate potential acquisitions, we may not be able to identify and successfully negotiate suitable acquisitions, obtain financing for future acquisitions on satisfactory terms, obtain regulatory approval for certain acquisitions or otherwise complete acquisitions in the future. An inability to identify or complete future acquisitions could limit our future growth.
We may experience difficulties in integrating acquisitions.
Integration of acquired companies involves several risks, including:
| • |
inability to operate acquired businesses profitably; |
| • |
failure to accomplish strategic objectives for those acquisitions; |
| • |
unanticipated costs relating to acquisitions or to the integration of the acquired businesses; |
| • |
difficulties in achieving planned cost savings synergies and growth opportunities; and |
| • |
possible future impairment charges for goodwill and non-amortizable intangible assets that are recorded as a function of acquisitions. |
Additionally, our level of indebtedness may increase in the future if we finance acquisitions with debt, which would cause us to incur additional interest expense and could increase our vulnerability to general adverse economic and industry conditions and limit our ability to service our debt or obtain additional financing. We cannot assure that future acquisitions will not have a material adverse effect on our financial condition, results of operations and cash flows.
Impairment charges could reduce our profitability.
We test goodwill and our other intangible assets with indefinite useful lives for impairment on an annual basis or on an interim basis if a potential impairment factor arises that indicates the fair value of the reporting unit may fall below its carrying value. Various uncertainties, including adverse conditions in the capital markets or changes in general economic conditions, could impact the future operating performance at one or more of our businesses which could significantly affect our valuations and could result in additional future impairments. The recognition of an impairment of a significant portion of goodwill would negatively affect our results of operations.
Materially adverse or unforeseen legal judgments, fines, penalties or settlements could have an adverse impact on our profits and cash flows.
We are and may, from time to time, become a party to legal proceedings incidental to our businesses, including, but not limited to, alleged claims relating to product liability, environmental compliance, patent infringement, commercial disputes and employment and regulatory matters. In accordance with United States generally accepted accounting principles, we establish reserves based on our assessment of contingent liabilities. Subsequent developments in legal proceedings may affect our assessment and estimates of loss contingencies, recorded as reserves, which could require us to record additional reserves or make material payments which could adversely affect our profits and cash flows. Even the successful defense of legal proceedings may cause us to incur substantial legal costs and may divert management's time and resources away from our businesses.
The costs of complying with existing or future environmental regulations, and of correcting any violations of these regulations, could impact adversely our profitability.
We are subject to a variety of environmental laws relating to the storage, discharge, handling, emission, generation, use and disposal of chemicals, hazardous waste and other toxic and hazardous materials used to manufacture, or resulting from the process of manufacturing, our products and providing our services. We cannot predict the nature, scope or effect of regulatory requirements to which our operations might be subject or the manner in which existing or future laws will be administered or interpreted. We are also exposed to potential legacy environmental risks relating to businesses we no longer own or operate. Future regulations could be applied to materials, products or activities that have not been subject to regulation previously. The costs of complying with new or more stringent regulations, or with more vigorous enforcement of these or existing regulations, could be significant.
In addition, properly permitted waste disposal facilities used by us as a legal and legitimate repository for hazardous waste may in the future become mismanaged or abandoned without our knowledge or involvement. In such event, legacy landfill liability could attach to or be imposed upon us in proportion to the waste deposited at any disposal facility.
Environmental laws require us to maintain and comply with a number of permits, authorizations and approvals and to maintain and update training programs and safety data regarding materials used in our processes. Violations of these requirements could result in financial penalties and other enforcement actions. We could be required to halt one or more portions of our operations until a violation is cured. Although we attempt to operate in compliance with these environmental laws, we may not succeed in this effort at all times. The costs of curing violations or resolving enforcement actions that might be initiated by government authorities could be substantial.
The costs of complying with existing or future regulations applicable to our products, and of correcting any violations of such regulations, could adversely impact our profitability.
Certain of our products are subject to regulations promulgated by administrative agencies such as the Department of Energy, Occupational Health and Safety Administration and the Food and Drug Administration. Such regulations, among other matters, specify requirements regarding energy efficiency and product safety. Regulatory violations could result in financial penalties and other enforcement actions. We could be required to halt production of one or more products until a violation is cured. Although we attempt to produce our products in compliance with these requirements, the costs of curing violations or resolving enforcement actions that might be initiated by administrative agencies could be substantial.
Our results could be adversely affected by natural disasters, political crises, labor unrest or other catastrophic events.
Natural disasters, such as hurricanes, tornadoes, floods, earthquakes, and other adverse weather and climate conditions; political crises, such as terrorist attacks, war, labor unrest, and other political instability; or other catastrophic events, such as disasters occurring at our suppliers' manufacturing facilities, whether occurring in the United States or internationally, could disrupt our operations or the operations of one or more of our suppliers. Certain of our key manufacturing facilities are located in geographic areas with a higher than nominal risk of earthquake and flood (such as Japan and Southern California) and hurricane (such as South Carolina). The effects of global warming have elevated the possibility of natural catastrophes which could impact these and other locations as well as the locations of certain of our customers and suppliers. Certain of our key facilities are in areas of higher than nominal political risk (such as China). The labor workforces in four of our U.S. facilities belong to unions and a strike, slowdown or other concerted effort could adversely impact production at the affected facility. To the extent any of these events occur, our operations and financial results could be adversely affected.
An expansion of the war in Ukraine could adversely affect our results of operations and financial condition.
To date, we have experienced minimal adverse impacts on our businesses related to the ongoing war in Ukraine, beyond the general impact on global energy prices and other economic conditions. However, customer demand for our products and services as well as raw material and components from our suppliers may be impacted in the future if the war was to extend beyond Ukrainian borders, especially into Europe. Any of these impacts could have an adverse effect on our results of operations and financial condition.
We depend on our key personnel and the development of high potential employees; the loss of their services may adversely affect our business.
We believe that our success depends on our ability to hire new talent, develop existing talent and the continued employment of our senior management team and other key personnel. While we engage in ongoing succession planning, if one or more members of our senior management team or other key personnel were unable or unwilling to continue in their present positions, our business could be seriously harmed. In addition, if any of our key personnel joins a competitor or forms a competing company, some of our customers might choose to use the services of that competitor or those of a new company instead of our own. Other companies seeking to develop capabilities and products or services similar to ours may hire away some of our key personnel. If we are unable to maintain and develop our key personnel and attract new employees, the execution of our business strategy may be hindered and our growth limited.
Strategic divestitures and contingent liabilities from businesses that we sell could adversely affect our results of operations and financial condition.
From time to time, we have sold and may continue to sell business that we consider to be either underperforming or no longer part of our strategic vision. The sale of any such business could result in a financial loss and/or write-down of goodwill which could have a material adverse effect on our results for the financial reporting period during which such sale occurs. In addition, in connection with such divestitures, we have retained and may in the future retain responsibility for some of the known and unknown contingent liabilities related to certain divestitures such as lawsuits, tax liabilities, product liability claims, and environmental matters.
The trading price of our common stock has been volatile, and investors in our common stock may experience substantial losses.
The trading price of our common stock has been volatile and may become volatile again in the future. The trading price of our common stock could decline or fluctuate in response to a variety of factors, including:
| • |
our failure to meet the performance estimates of securities analysts; |
| • |
changes in financial estimates of our net sales and operating results or buy/sell recommendations by securities analysts; |
| • |
fluctuations in our quarterly operating results; |
| • |
substantial sales of our common stock; |
| • |
changes in the amount or frequency of our payment of dividends or repurchases of our common stock; |
| • |
general stock market conditions; or |
| • |
other economic or external factors. |
Decreases in discount rates and actual rates of return could require an increase in future pension contributions to our pension plans which could limit our flexibility in managing our Company.
The discount rate and the expected rate of return on plan assets represent key assumptions inherent in our actuarially calculated pension plan obligations and pension plan expense. If discount rates and actual rates of return on invested plan assets were to decrease significantly, our pension plan obligations could increase materially. Although our pension plans have been frozen, the size of future required pension contributions could require us to dedicate a greater portion of our cash flow from operations to making contributions, which could negatively impact our financial flexibility.
Our business could be negatively impacted by cybersecurity threats, information systems and network interruptions, and other security threats or disruptions.
Our information technology networks and related systems are critical to the operation of our business and essential to our ability to successfully perform day-to-day operations. Cybersecurity threats are persistent, evolve quickly, and include, but are not limited to, computer viruses, ransomware, attempts to access information, denial of service and other electronic security breaches. These events could disrupt our operations or customers and other third-party IT systems in which we are involved and could negatively impact our reputation among our customers and the public which could have a negative impact on our financial conditions, results of operations, or liquidity.
We are subject to increasing regulation associated with data privacy and processing, the violation of which could result in significant penalties and harm our reputation.
Regulatory scrutiny of privacy, data protection, collection, use and sharing of data is increasing on a global basis. Like all global companies, we are subject to a number of laws, rules and directives (“privacy laws”) relating to the collection, use, retention, security, processing and transfer (“processing”) of personally identifiable information about our employees, customers and suppliers (“personal data”) in the countries where we operate. The most notable of these privacy laws is the EU’s General Data Protection Regulation (“GDPR”), which came into effect in 2018. GDPR extends the scope of the EU data protection law to all foreign companies processing data of EU residents and imposes a strict data protection compliance regime with severe penalties for non-compliance of up to the greater of 4% of worldwide turnover and €20 million. While we continue to strengthen our data privacy and protection policies and to train our personnel accordingly, a determination that there have been violations of GDPR or other privacy or data protection laws could expose us to significant damage awards, fines and other penalties that could, individually or in the aggregate, materially harm our results of operations and reputation.
Various restrictions in our charter documents, Delaware law and our credit agreement could prevent or delay a change in control that is not supported by our board of directors.
We are subject to several provisions in our charter documents, Delaware law and our credit facility that may discourage, delay or prevent a merger, acquisition or change of control that a stockholder may consider favorable. These anti-takeover provisions include:
| • |
maintaining a classified board and imposing advance notice procedures for nominations of candidates for election as directors and for stockholder proposals to be considered at stockholders' meetings; |
| • |
a provision in our certificate of incorporation that requires the approval of the holders of 80% of the outstanding shares of our common stock to adopt any agreement of merger, the sale of substantially all of the assets of the Company to a third party or the issuance or transfer by the Company of voting securities having a fair market value of $1 million or more to a third party, if in any such case such third party is the beneficial owner of 10% or more of the outstanding shares of our common stock, unless the transaction has been approved prior to its consummation by all of our directors; |
| • |
requiring the affirmative vote of the holders of at least 80% of the outstanding shares of our common stock for stockholders to amend our amended and restated by-laws; |
| • |
covenants in our credit facility restricting mergers, asset sales and similar transactions; and |
| • |
the Delaware anti-takeover statute contained in Section 203 of the Delaware General Corporation Law. |
Section 203 of the Delaware General Corporation Law prohibits a merger, consolidation, asset sale or other similar business combination between the Company and any stockholder of 15% or more of our voting stock for a period of three years after the stockholder acquires 15% or more of our voting stock, unless (1) the transaction is approved by our board of directors before the stockholder acquires 15% or more of our voting stock, (2) upon completing the transaction the stockholder owns at least 85% of our voting stock outstanding at the commencement of the transaction, or (3) the transaction is approved by our board of directors and the holders of 66 2/3% of our voting stock, excluding shares of our voting stock owned by the stockholder.
Item 1B. Unresolved Staff Comments
None.
Cybersecurity Risk Management and Strategy
| ● | An annual cybersecurity risk assessment as part of our Enterprise Risk Management (ERM) program, which reviews and evaluates the potential impact and likelihood of various cyber risks and defines a framework for mitigating measures and residual risk. |
| ● | A cybersecurity roadmap that is built from the risk assessment and feeds into our annual IT expenditure plan and which outlines the actions and investments we intend to take to enhance our cybersecurity posture and capabilities. |
| ● | A continuous cybersecurity risk monitoring and response process, which involves daily review and real-time alerts of security incidents, a multi-disciplinary escalation and review process, and a reporting and filing protocol for material incidents within four business days of materiality determination. |
| ● | A periodic cyber risk assessment conducted by independent experts, which provides an external validation and benchmarking of our cybersecurity practices and performance. |
As part of our cybersecurity program, we have and will continue to engage parties, such as consultants, network security firms, auditors, and forensics providers, to assist us in assessing, managing, or investigating cyber risks or incidents. For example, we have engaged industry recognized parties to monitor and conduct penetration and vulnerability testing on our networks and to assist us in the conduct of tabletop exercises.
In order to oversee and identify risks from cybersecurity threats associated with our use of third-party service providers, we perform third-party risk assessments designed to help protect against the misuse of IT by third parties and business partners and generally request that third-party service providers provide us information about their security policies and procedures.
Cybersecurity Governance and Oversight
We have a cybersecurity governance structure that involves the oversight and involvement of our board of directors and senior management.
In an effort to deter and detect cyber threats, we have a required cybersecurity training program that is provided to all new employees during on-boarding and semi-annually to employees with access to our IT resources, which aims to raise awareness and foster a culture of cybersecurity awareness among our workforce. We also have an ongoing process of sending simulated phishing emails to employees. The results of these simulated attempts are monitored and reported to each employee’s manager. Training includes such cybersecurity topics as social engineering, phishing, password protection, confidential data protection, asset use and mobile security. The training also emphasizes the importance of reporting all incidents immediately.
We operate a total of 64 facilities including manufacturing plants, service centers, and warehouses located throughout the United States, Europe, Canada, Southeast Asia, Japan, China, India, Brazil, and Mexico. The Company owns 19 of the facilities and the others are leased. For the year ended June 30, 2025, the approximate building space utilized by each segment is as follows:
| Area in Square Feet (in thousands) |
||||||||||||||||
| Segment |
Number of Locations |
Leased |
Owned |
Total |
||||||||||||
| Asia Pacific |
10 | 138 | 177 | 315 | ||||||||||||
| EMEA(1) |
3 | - | 125 | 125 | ||||||||||||
| Other Americas |
1 | - | 56 | 56 | ||||||||||||
| United States |
7 | 148 | 74 | 222 | ||||||||||||
| Electronics |
21 | 286 | 432 | 718 | ||||||||||||
| EMEA(1) |
1 | 83 | - | 83 | ||||||||||||
| United States |
2 | 107 | 171 | 278 | ||||||||||||
| Engineering Technologies |
3 | 190 | 171 | 361 | ||||||||||||
| United States |
1 | 164 | - | 164 | ||||||||||||
| Scientific |
1 | 164 | - | 164 | ||||||||||||
| Asia Pacific |
11 | 508 | - | 508 | ||||||||||||
| EMEA(1) |
12 | 176 | 70 | 246 | ||||||||||||
| Other Americas |
3 | 90 | - | 90 | ||||||||||||
| United States |
6 | 88 | 79 | 167 | ||||||||||||
| Engraving |
32 | 862 | 149 | 1,011 | ||||||||||||
| Asia Pacific |
1 | 76 | - | 76 | ||||||||||||
| United States |
2 | 33 | 198 | 231 | ||||||||||||
| Specialty Solutions |
3 | 109 | 198 | 307 | ||||||||||||
| United States |
2 | 19 | - | 19 | ||||||||||||
| Corporate & Other |
2 | 19 | - | 19 | ||||||||||||
| Total |
62 | 1,630 | 950 | 2,580 | ||||||||||||
(1) EMEA consists of Europe, Middle East and S. Africa.
In general, the buildings are in sound operating condition and are considered to be adequate for their intended purposes and current uses.
We own substantially all of the machinery and equipment utilized in our businesses.
Discussion of legal matters is incorporated by reference to Part II, Item 8, Note 12, “CONTINGENCIES,” in the Notes to the Consolidated Financial Statements.
Item 4. Mine Safety Disclosures
Not Applicable
Item 5. Market for the Registrant's Common Equity, Related Stockholder Matters and Issuer Purchases of Equity Securities
The principal market in which the Common Stock of Standex is traded is the New York Stock Exchange under the ticker symbol “SXI”. The approximate number of stockholders of record on July 31, 2025 was 1,045.
Additional information regarding our equity compensation plans is presented in the Notes to Consolidated Financial Statements under the caption “Stock-Based Compensation and Purchase Plans” and Item 12 “Security Ownership of Certain Beneficial Owners and Management and Related Stockholder Matters.”
| Issuer Purchases of Equity Securities (1) |
||||||||||||||||
| Quarter Ended June 30, 2025 |
||||||||||||||||
| Period |
(a) Total Number of Shares (or units) Purchased |
(b) Average Price Paid per Share (or unit) |
(c) Total Number of Shares (or units) Purchased as Part of Publicly Announced Plans or Programs |
(d) Maximum Number (or Appropriate Dollar Value) of Shares (or units) that May Yet Be Purchased Under the Plans or Programs |
||||||||||||
| April 1 - April 30, 2025 |
2,032 | $ | 158.94 | - | $ | 27,812 | ||||||||||
| May 1 - May 31, 2025 |
- | - | - | 27,812 | ||||||||||||
| June 1 - June 30, 2025 |
- | - | - | 27,812 | ||||||||||||
| TOTAL |
2,032 | 159 | - | |||||||||||||
(1) The Company has a Stock Buyback Program (the “Program”) which was originally announced on January 30, 1985 and most recently amended on April 28, 2022. Under the Program, the Company is authorized to repurchase up to an aggregate of $200 million of its shares. Under the program, purchases may be made from time to time on the open market, including through 10b5-1 trading plans, or through privately negotiated transactions, block transactions, or other techniques in accordance with prevailing market conditions and the requirements of the Securities and Exchange Commission. The Board’s authorization is open-ended and does not establish a timeframe for the purchases. The Company is not obligated to acquire a particular number of shares, and the program may be discontinued at any time at the Company’s discretion.
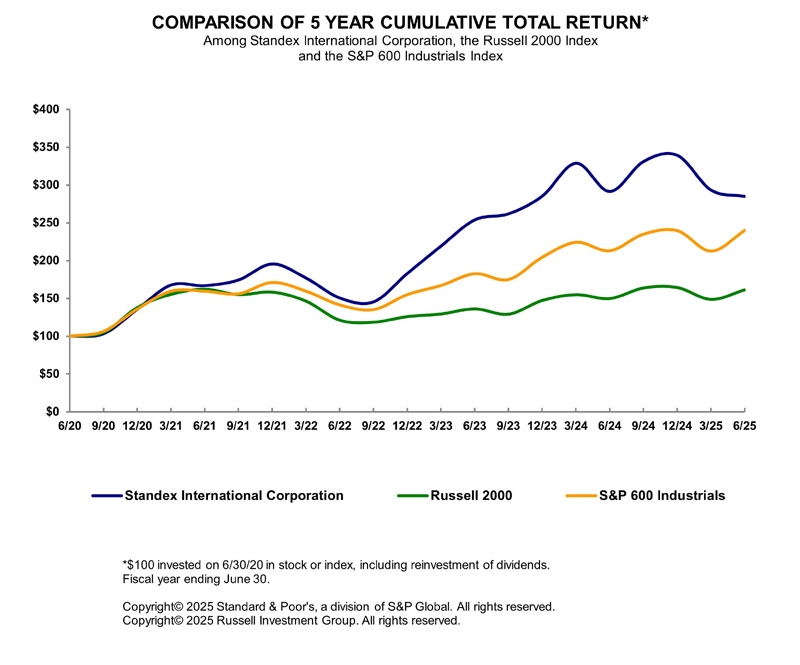
The graph below matches Standex International Corporation's cumulative 5-Year total shareholder return on common stock with the cumulative total returns of the Russell 2000 index and the S&P 600 Industrials index. The graph tracks the performance of a $100 investment in our common stock and in each index (with the reinvestment of all dividends) from 6/30/2020 to 6/30/2025.
Not Applicable
Item 7. Management's Discussion and Analysis of Financial Condition and Results of Operations
Overview
We are a diversified industrial manufacturer with leading positions in a variety of products and services that are used in diverse commercial and industrial markets. We have six operating segments that aggregate to five reportable segments. Please refer to Item 1. Business, above, for additional information regarding our segment structure and management strategy.
As part of our ongoing strategy:
| o | On February 4, 2025, we acquired McStarlite Co. ("McStarlite"), a leading provider of complex sheet metal aerospace components, financed from our existing Credit Facility. Its results are reported in the Engineering Technologies segment beginning in the third quarter of fiscal year 2025. | |
| o | On November 18, 2024, we acquired Nascent Technology Manufacturing, which designs and produces high-reliability magnetics components for critical defense and industrial applications. Its results are reported in the Electronics segment beginning in the second quarter of fiscal year 2025. | |
| o | On November 14, 2024, we acquired Custom Biogenic Systems, it specializes in the development and manufacturing of advanced cryogenic equipment, including unique isothermal freezers with dry liquid nitrogen technology, to the pharmaceutical and biobank end markets within life sciences. Its results are reported in the Scientific segment beginning in the second quarter of fiscal year 2025. | |
| o | On October 28, 2024, we acquired the Amran/Narayan Group in cash and stock transactions. These transactions represent a combined enterprise value of approximately $467.5 million, comprised of 85% cash and 15% in Standex common stock for Amran Instrument Transformers and 90% cash and 10% in Standex common stock for Narayan Powertech Pvt. Ltd. The 10% share exchange related to Narayan Powertech Pvt. Ltd. is subject to India regulatory approval, which is still pending. The cash consideration of the transactions was financed using cash-on-hand, existing credit facilities, and a $250 million 364-day term loan with existing lenders. We converted the 364-day term loan into an exercise of the accordion feature under our existing credit facilities. This acquisition significantly expands our sales in the fast-growing, high-margin electrical grid end market and our presence in India. Its results are reported in the Electronics segment beginning in the second quarter of fiscal year 2025. | |
| o | On May 3, 2024, we acquired Sanyu Electric Pte Ltd, or SEPL, a privately held distributor of reed relays. Its results are reported in the Electronics segment. |
|
|
| o |
On February 19, 2024, we acquired, through our subsidiary Standex Electronics Japan Corporation, privately-held, Japanese-based Sanyu Switch Co., Ltd (Sanyu). Sanyu designs and manufactures reed relays, test sockets, testing systems for semiconductor and other electronics manufacturing, and other switching applications. Its results are reported in the Electronics segment. |
| o |
On July 31, 2023, we acquired Minntronix, a privately held company. Minntronix designs and manufactures customized as well as standard magnetics components and products including transformers, inductors, current sensors, coils, chokes, and filters. The products are used in applications across cable fiber, smart meters, industrial control and lighting, electric vehicles, and home security markets. Its results will be reported in the Electronics segment. |
| o |
In the third quarter of fiscal year 2023, we divested our Procon business for $75.0 million. This transaction reflected the continued simplification of our portfolio and enabled greater focus on managing our larger platforms and pursuing growth opportunities. Proceeds were deployed towards organic and inorganic initiatives and returning capital to shareholders. Its results were reported within our Specialty Solutions segment. In fiscal year 2023, we received $67.0 million cash consideration and recorded a pre-tax gain on the sale of $62.1 million in the Consolidated Financial Statements. Cash consideration received at closing excludes amounts held in escrow and was net of closing cash. |
As a result of these portfolio moves, we have transformed Standex to a company with a more focused group of businesses selling customized solutions to high value end markets via a compelling customer value proposition. The narrowing of the portfolio allows for greater management focus on driving operational disciplines and positions us well to use our cash flow from operations to invest selectively in our ongoing pipeline of organic and inorganic opportunities.
The Company’s strong historical cash flow has been a cornerstone for funding our capital allocation strategy. We use cash flow generated from operations to fund investments in capital assets to upgrade our facilities, improve productivity and lower costs, invest in the strategic growth programs described above, including organic growth and acquisitions, and to return cash to our shareholders through payment of dividends and stock buybacks.
Restructuring expenses reflect costs associated with our efforts of continuously improving operational efficiency and expanding globally in order to remain competitive in our end-user markets. We incur costs for actions to size our businesses to a level appropriate for current economic conditions, improve our cost structure, enhance our competitive position and increase operating margins. Such expenses include costs for moving facilities to locations that allow for lower fixed and variable costs, external consultants who provide additional expertise starting up plants after relocation, downsizing operations because of changing economic conditions, and other costs resulting from asset redeployment decisions. Shutdown costs include severance, benefits, stay bonuses, lease and contract terminations, asset write-downs, costs of moving fixed assets, and moving and relocation costs. Vacant facility costs include maintenance, utilities, property taxes and other costs.
Because of the diversity of the Company’s businesses, end user markets and geographic locations, management does not use specific external indices to predict the future performance of the Company, other than general information about broad macroeconomic trends. Each of our individual business units serves niche markets and attempts to identify trends other than general business and economic conditions which are specific to its business and which could impact their performance. Those units report pertinent information to senior management, which uses it to the extent relevant to assess the future performance of the Company. A description of any such material trends is described below in the applicable segment analysis.
We monitor a number of key performance indicators (“KPIs”) including net sales, income from operations, backlog, effective income tax rate, gross profit margin, and operating cash flow. A discussion of these KPIs is included below. We may also supplement the discussion of these KPIs by identifying the impact of foreign exchange rates, acquisitions, and other significant items when they have a material impact on a specific KPI.
We believe the discussion of these items provides enhanced information to investors by disclosing their impact on the overall trend which provides a clearer comparative view of the KPI, as applicable. For discussion of the impact of foreign exchange rates on KPIs, the Company calculates the impact as the difference between the current period KPI calculated at the current period exchange rate as compared to the KPI calculated at the historical exchange rate for the prior period. For discussion of the impact of acquisitions, we isolate the effect on the KPI amount that would have existed regardless of our acquisition. Sales resulting from synergies between the acquisition and existing operations of the Company are considered organic growth for the purposes of our discussion.
Unless otherwise noted, references to years are to fiscal years.
Consolidated Results from Continuing Operations (in thousands):
| 2025 |
2024 |
2023 |
|||||||||
| Net sales |
$ | 790,107 | $ | 720,635 | $ | 741,048 | |||||
| Gross profit margin |
39.9 | % | 39.1 | % | 38.5% | ||||||
| Restructuring costs |
6,903 | 8,206 | 3,831 | ||||||||
| Acquisition related expenses |
21,434 | 2,622 | 557 | ||||||||
| Other operating (income) expense, net |
- | 110 | (611) | ||||||||
| (Gain) loss on sale of business |
- | (274 | ) | (62,105) | |||||||
| Income from operations |
93,549 | 101,738 | 171,089 | ||||||||
| Backlog (realizable within 1 year) |
$ | 245,596 | $ | 185,296 | $ | 274,902 | |||||
| 2025 |
2024 |
2023 |
|||||||||
| Net sales |
$ | 790,107 | $ | 720,635 | $ | 741,048 | |||||
| Components of change in sales: |
|||||||||||
| Effect of acquisitions |
123,636 | 40,427 | 1,919 | ||||||||
| Effect of exchange rates |
(343 | ) | (1,842 | ) | (23,902) | ||||||
| Effect of business divestitures |
- | (21,259 | ) | (11,947) | |||||||
| Organic sales change |
(53,821 | ) | (37,739 | ) | 39,639 | ||||||
Net sales increased for fiscal year 2025 by $69.5 million, or 9.6% when compared to the prior year period. Acquisitions accounted for increased sales of $123.6 million, or 17.2%. Organic sales decreased by $53.8 million, or 7.5%, due to general economic softness in Europe and North America in the Electronics segment, the impact of National Institutes of Health (NIH) funding cuts in the Scientific segment and continued softness in North America from delays in new platform rollout in the Engraving segment. Sales included $184.2 million in the period attributed to fast growth markets. New products accounted for 2.5% of sales growth.
Net sales decreased for fiscal year 2024 by $20.4 million, or 2.8%, when compared to the prior year period. Organic sales decreased by $37.7 million, or 5.1%, due to transitory headwinds in several of our end markets, primarily due to lower demand in our Electronics, Scientific and Specialty segments, partially offset by project timing in our Engineering Technologies group. Organic sales included $94.0 million in the period attributed to fast growth markets. Acquisitions had a $40.4 million, or 5.5%, positive impact on sales, offset by negative impacts on sales for divestitures of $21.3 million, or 2.9%, and foreign currency of $1.8 million, or 0.3%.
We discuss our results and outlook for each segment below.
Gross Profit
Gross profit in fiscal year 2025 increased to $315.2 million, or a gross margin of 39.9%, as compared to $282.0 million, or a gross margin of 39.1%, for the prior year period. This increase was a result of higher volume, productivity initiatives and impact of acquisitions partially offset by material inflation.
Gross profit in fiscal year 2024 decreased to $282.0 million, or a gross margin of 39.1%, as compared to $285.1 million, or a gross margin of 38.5%, for the prior year period. This decrease was a result of organic sales decreases of $37.6 million, approximately $2.8 million of net inflationary impacts in the areas of labor and raw material and by the divestiture of the Procon business. The decreases were partially offset by contributions from the Minntronix acquisition, pricing actions and productivity initiatives.
Selling, General, and Administrative Expenses
Selling, general, and administrative expenses, (“SG&A”) for the fiscal year 2025 were $193.4 million, or 24.5% of sales, compared to $169.9 million, or 23.5% of sales, during the prior year period. SG&A expenses during the period were primarily impacted by increased expenses due to the recent acquisitions and increased research and development and selling expenses.
Selling, general, and administrative expenses, (“SG&A”) for the fiscal year 2024 were $169.6 million, or 23.5% of sales, compared to $172.3 million, or 23.3% of sales, during the prior year period. SG&A expenses during the period were impacted by a reduction in general and administrative expenses partially offset by increased research and development spending.
Restructuring Costs
During fiscal year 2025, we incurred restructuring expenses of $6.9 million, primarily related to facility rationalization activities, and global headcount reductions mostly within our Engraving segment.
During fiscal year 2024, we incurred restructuring expenses of $8.2 million, primarily related to facility rationalization activities, and global headcount reductions primarily within our Electronics, Engineering Technologies and Engraving segments and as well as the Corporate headquarters.
Acquisition Related Costs
We incurred acquisition related expenses of $21.4 million and $2.6 million in fiscal year 2025 and 2024, respectively. Acquisition related costs typically consist of due diligence, integration, and valuation expenses incurred in connection with recent or pending acquisitions.
Other Operating (Income) Expense, Net
We recorded a charge of $0.1 million for settlement of an environmental remediation claim in the third quarter of fiscal year 2024.
Income from Operations
Income from operations for the fiscal year 2025 was $93.5 million, compared to $101.7 million during the prior year. The decrease of $8.2 million, or 8.0%, is primarily due to increase of acquisition costs and administrative expenses which more than offset the income from the increase in sales from recent acquisitions.
Income from operations for the fiscal year 2024 was $101.7 million, compared to $171.1 million during the prior year. The decrease of $69.4 million, or 40.5%, is primarily due to the gain on the divestiture of Procon in the third quarter of the fiscal year 2023, organic sales decreases and increased investment in research and development spending, restructuring and acquisition related costs. The decreases are partially offset by cost reduction activities and productivity improvement initiatives.
Discussion of the performance of each of our reportable segments is fully explained in the segment analysis that follows.
Interest Expense
Interest expense for fiscal year 2025 was $23.9 million, an increase of $19.3 million as compared to the prior year. The increase in interest expense in fiscal 2025was due to increased debt to fund fiscal 2025 acquisitions. Our effective interest rate in fiscal 2025 was 6.38%. Interest expense for fiscal year 2024 was $4.5 million, a decrease of $0.9 million as compared to the prior year.
Income Taxes
The income tax provision from continuing operations for the fiscal year ended June 30, 2025 was $11.1 million, or an effective rate of 16.11%, compared to $21.5 million, or an effective rate of 22.6%, for the year ended June 30, 2024, and $24.8 million, or an effective rate of 15.1%, for the year ended June 30, 2023. Changes in the effective tax rates from period to period may be significant as they depend on many factors including, but not limited to, the amount of our income or loss, the mix of income earned in the U.S. versus outside the U.S., the effective tax rate in each of the countries in which we earn income, and any one-time tax issues which occur during the period.
The income tax provision from continuing operations for the fiscal year ended June 30, 2025 was impacted by the following items: (i) a tax provision of $5.8 million due to the mix of income in various jurisdictions, (ii) tax benefits of $4.7 million related to foreign tax credits of $2.1 million, as well as Federal R&D tax credits of $2.5 million, (iii) a tax provision of $1.8 million related to officers’ compensation, (iv) a tax provision of $3.0 million related to cash repatriation, and (v) a tax benefit of $9.1 million (inclusive of $1.2 million of interest) related to the release of a Sec. 965 toll tax uncertain tax position due to the lapse of statute of limitations.
The income tax provision from continuing operations for the fiscal year ended June 30, 2024 was impacted by the following items: (i) a tax provision of $3.1 million due to the mix of income in various jurisdictions, (ii) tax benefits of $2.8 million related to foreign tax credits of $0.7 million, as well as Federal R&D tax credits of $2.1 million, (iii) a tax provision of $3.8 million related to officers’ compensation, and (iv) a tax benefit of $3.8 million relating to share-based compensation.
The income tax provision from continuing operations for the fiscal year ended June 30, 2023 was impacted by the following items: (i) a tax benefit of $4.3 million due to the mix of income in various jurisdictions, (ii) tax benefits of $14.3 million primarily related to foreign tax credits of $11.6 million, as well as Federal R&D tax credits of $2.7 million, (iii) a tax provision of $11.3 million related to the U.S. tax effects of international operations, and (iv) a tax benefit of $5.0 million relating to the partial release of the valuation allowance on capital loss carryforwards, which were utilized against the capital gain recognized on the divestiture of the Procon business.
On July 4, 2025, the U.S. government enacted The One Big Beautiful Bill Act of 2025 which includes, among other provisions, changes to the U.S. corporate income tax system including the allowance of immediate expensing of qualifying research and development expenses and permanent extensions of certain provisions within the Tax Cuts and Jobs Act. Certain provisions are effective beginning fiscal 2026. We are evaluating the future impact of these tax law changes on our financial statements
The Organization for Economic Co-operation and Development (OECD) and the G20 Inclusive Framework on Base Erosion and Profit Shifting (the "Inclusive Framework") have put forth Pillar Two proposals that ensure a minimal level of taxation. Several countries in which the Company operates, including several European Union member states, have adopted domestic legislation to implement the Inclusive Framework's global corporate minimum tax rate of fifteen percent. This legislation became effective for the Company beginning July 1, 2024. Based on the Company's analysis of Pillar Two provisions, these tax law changes did not have a material impact on the Company's financial statements for fiscal 2025.
Capital Expenditures
Our capital spending is focused on growth initiatives, cost reduction activities, and upgrades to extend the capabilities of our capital assets. In general, we anticipate our capital expenditures over the long-term will be approximately 3% to 5% of net sales.
During fiscal year 2025, capital expenditures were $28.8 million or 3.6% of net sales, as compared to $20.3 million, or 2.8%, of net sales in the prior year. We expect 2026 capital spending to be between $33 million and $38 million.
Backlog
Backlog includes all active or open orders for goods and services. Backlog also includes any future deliveries based on executed customer contracts, so long as such deliveries are based on agreed upon delivery schedules. Backlog orders are not necessarily an indicator of future sales levels because of variations in lead times and customer production demand pull systems, with the exception of Engineering Technologies. Customers may delay delivery of products or cancel orders prior to shipment, subject to possible cancellation penalties. Due to the nature of long-term agreements in the Engineering Technologies segment, the timing of orders and delivery dates can vary considerably resulting in significant backlog changes from one period to another.
Backlog orders are as follows (in thousands):
| As of June 30, 2025 |
As of June 30, 2024 |
||||||||||||||
| Total |
Backlog under |
Total |
Backlog under |
||||||||||||
| Backlog |
1 year |
Backlog |
1 year |
||||||||||||
| Electronics |
$ | 144,971 | $ | 121,276 | $ | 107,006 | $ | 94,982 | |||||||
| Engineering Technologies |
91,025 | 82,273 | 64,592 | 50,122 | |||||||||||
| Scientific |
3,974 | 3,974 | 2,646 | 2,646 | |||||||||||
| Engraving |
22,460 | 22,123 | 22,483 | 20,874 | |||||||||||
| Specialty Solutions |
16,045 | 15,950 | 16,691 | 16,672 | |||||||||||
| Total |
$ | 278,475 | $ | 245,596 | $ | 213,418 | $ | 185,296 | |||||||
Total backlog realizable within one year increased $60.3 million, or 32.5% to $245.6 million at June 30, 2025 from $185.2 million at June 30, 2024. Changes in backlog under 1 year are as follows (in thousands):
| As of June 30, 2025 |
|||
| Backlog under 1 year, prior year period |
$ | 185,296 | |
| Components of change in backlog: |
|||
| Organic change |
(10,165) | ||
| Effect of acquisitions |
70,465 | ||
| Backlog under 1 year, current period |
$ | 245,596 | |
Segment Analysis (in thousands)
Overall Outlook
Looking forward to fiscal year 2026, barring any unforeseen economic, global trade, or tariff related disruptions, we expect revenue to grow by over $100 million, primarily driven by mid-to-high-single-digit organic growth in Electronics, double-digit organic growth in Engineering Technologies, and the contribution from recent acquisitions. We plan to release over fifteen new products which are projected to contribute approximately 300 bps of incremental growth. Sales from fast growth markets are expected to grow approximately 45% year-on-year and exceed $265 million. In fiscal year 2026, the Company is on track to further reduce its net debt to EBITDA ratio, positioning the Company well to fund future organic and inorganic opportunities.
In general, for fiscal year 2026, we expect:
| ● | increased exposure to the high growth, high margin electrical grid end market as a result of the Amran/Narayan Group acquisition; |
|
| ● | growth of new product sales to continue to accelerate as recently released products continue to ramp and new products slated for release in 2026 enter the market |
|
| ● | commercial aviation and defense end markets demand to increase based on current program expectations and new product development; |
| ● | space markets to remain attractive, with volume to slightly increase from fiscal year 2025 due to new product development for existing customer; |
|
| ● | continued stability in hybrid and electric vehicle programs despite softness in general automotive end markets and planned new platform launches; |
| ● |
scientific cold storage demand to decline due to anticipated effects of NIH funding cuts; |
| ● |
refuse and dump end markets to remain stable; |
|
| ● | stable demand levels in food service equipment markets. |
Electronics
| 2025 compared to 2024 |
2024 compared to 2023 |
||||||||||||||||
| (in thousands except |
% |
% |
|||||||||||||||
| percentages) |
2025 |
2024 |
Change |
2024 |
2023 |
Change |
|||||||||||
| Net sales |
$400,130 | $321,956 | 24.3% |
$321,956 | $305,872 | 5.3% |
|||||||||||
| Income from operations |
87,927 | 64,030 | 37.3% |
64,030 | 68,979 | (7.2%) |
|||||||||||
| Operating income margin |
22.0% |
19.9% |
19.9% |
22.6% |
|||||||||||||
Net sales in fiscal year 2025 increased $78.2 million, or 24.3%, when compared to the prior year. Acquisitions added $104.4 million, or 32.4% to net sales in 2025. Organic sales decreased by $26.8 million, or 8.3%, due to general market softness in Europe and North America. Declines occurred across most markets, particularly industrial applications, transportation and utilities. The foreign currency impact increased sales by $0.6 million, or 0.2%. The Amran Narayan acquisition took place in 2025 while the 2024 acquisitions included Minntronix, Sanyu and SEPL.
Income from operations in the fiscal year 2025 increased $23.9 million, or 37.3%, when compared to the prior year. Acquisitions contributed $25.8 million income from operations. Pricing, and productivity initiatives, and favorable product mix were partially offset by lower core volume.
Net sales in fiscal year 2024 increased 16.1 million, or 5.3%, when compared to the prior year. Organic sales decreased by $22.7 million, or 7.4%, reflecting softening within the industrial application, appliance, transportation and utility markets, along with destocking in magnetics. Such declines were offset some by growth in the military and aerospace markets, along with overall new business opportunities. The acquisition of Sanyu in the third quarter of fiscal year 2024 and Sanyu Electronics Private Limited (SEPL), the related distribution business located in Singapore, in the fourth quarter added $6.6 million, or 2.2%, in fiscal year 2024. The acquisition of Minntronix in the first quarter of fiscal year 2024 added $33.8 million, or 11.1% in fiscal year 2024. The foreign currency impact decreased sales by $1.6 million, or 0.5%.
Income from operations in the fiscal year 2024 decreased $4.9 million, or 7.2% when compared to the prior year. The operating income decrease was the result of $1.8 million purchase accounting adjustments on both Minntronix and Sanyu along with the operating margin impact on the lower organic sales, mix, among other cost variances offset partially by the acquisition operating margin and various cost saving initiatives.
Engineering Technologies
| 2025 compared to 2024 |
2024 compared to 2023 |
|||||||||||||||||||||||
| (in thousands except |
|
% |
|
% | ||||||||||||||||||||
| percentages) |
|
2025 |
|
2024 |
|
Change |
|
2024 |
|
2023 |
|
Change | ||||||||||||
| Net sales |
$102,595 | $83,476 | 22.9% | $83,476 | $81,079 | 3.0% | ||||||||||||||||||
| Income from operations |
15,428 | 15,216 | 1.4% | 15,216 | 11,050 | 37.7% | ||||||||||||||||||
| Operating income margin |
15.0% | 18.2% | 18.2% | 13.6% | ||||||||||||||||||||
Net sales in fiscal year 2025 increased $19.1 million, or 22.9%, when compared to the prior year. Sales increase was attributable to the acquisition of McStarlite which added $11.6 million to revenue and an organic sales increase of $5.8 million, or 8.6% driven by growth in the space and aviation end markets.
Income from operations in fiscal year 2025 increased by $0.2 million, or 1.4% primarily related to the McStarlite acquisition. This growth is attributed to increased sales volume across the aviation markets and space markets combined with the McStarlite acquisition, and productivity initiatives.
Net sales in fiscal year 2024 increased $2.4 million, or 3.0%, when compared to the prior year. The organic sales increase was
driven by improvement in the aviation and space end markets, more favorable project timing, and growth in new applications.
Income from operations in fiscal year 2024 increased $4.2 million, or 37.7%, when compared to the prior year. The increase was primarily due to the impact of pricing and productivity initiatives, partially offset by research and development.
Scientific
| 2025 compared to 2024 |
2024 compared to 2023 |
|||||||||||||||||||||||
| (in thousands except |
|
% |
|
% | ||||||||||||||||||||
| percentages) |
|
2025 |
|
2024 |
|
Change |
|
2024 |
|
2023 |
|
Change | ||||||||||||
| Net sales |
$72,380 | $68,931 | 5.0% | $68,931 | $74,924 | (8.0%) | ||||||||||||||||||
| Income from operations |
17,470 | 19,000 | (8.1%) | 19,000 | 17,109 | 11.1% | ||||||||||||||||||
| Operating income margin |
24.1% | 27.6% | 27.6% | 22.8% | ||||||||||||||||||||
Net sales in fiscal year 2025 increased by $3.4 million, or 5.0% when compared to the prior year, due to benefit from the Custom Biogenic Systems acquisition, mostly offset by an organic decline from lower demand at academic and research institutions that were impacted by NIH funding cuts.
Income from operations in fiscal year 2025 decreased by $1.5 million, or 8.1%, when compared to the prior year due to organic decline partially offset by contribution from the acquisition and price and productivity initiatives.
Net sales in fiscal year 2024 decreased by $6.0 million, or 8.0% when compared to the prior year. Net sales decreased reflecting general market softness, including purchases by retail pharmacies.
Income from operations in fiscal year 2024 increased $1.9 million or 11.1%, when compared to the prior year. Operating income increase reflects productivity initiatives and lower freight costs, partially offset by lower volume.
Engraving
| 2025 compared to 2024 |
2024 compared to 2023 |
||||||||||||||||
| (in thousands except |
% |
% |
|||||||||||||||
| percentages) |
2025 |
2024 |
Change |
2024 |
2023 |
Change |
|||||||||||
| Net sales |
$128,360 | $150,685 | (14.8%) |
$150,685 | $152,067 | (0.9%) |
|||||||||||
| Income from operations |
17,647 | 26,708 | (33.9%) |
26,708 | 25,462 | 4.9% |
|||||||||||
| Operating income margin |
13.7% |
17.7% |
17.7% |
16.7% |
|||||||||||||
Net sales in fiscal year 2025 decreased by $22.3 million, or 14.8%, compared to the prior year. Organic sales decreased by $20.9 million, or 13.9%, primarily as a result of delays in new platform rollouts in North America. Foreign exchange impacts reduced sales by $1.4 million, or 0.9%.
Income from operations in fiscal year 2025 decreased by $9.1 million, or 33.9%, when compared to the prior year primarily as a result of lower demand in North America, partially offset by productivity actions.
Net sales in fiscal year 2024 decreased by $1.4 million or 0.9% compared to the prior year. Net sales in fiscal year 2024 decreased by $1.4 million or 0.9% compared to the prior year. Organic sales decreased by $1.0 million, or 0.7%, as a result of delays in new platform rollouts in North America. Foreign exchange impacts were $0.4 million, or 0.2%.
Income from operations in fiscal year 2024 increased by $1.2 million, or 4.9%, when compared to the prior year. Operating income increased during the period reflecting productivity actions, offsetting slower demand in North America sales.
Specialty Solutions
| 2025 compared to 2024 |
2024 compared to 2023 |
||||||||||||||||
| (in thousands except |
% |
% |
|||||||||||||||
| percentages) |
2025 |
2024 |
Change |
2024 |
2023 |
Change |
|||||||||||
| Net sales |
$86,642 | $95,587 | (9.4%) |
$95,587 | $127,106 | (24.8%) |
|||||||||||
| Income from operations |
14,841 | 19,631 | (24.4%) |
19,631 | 25,368 | (22.6%) |
|||||||||||
| Operating income margin |
17.1% |
20.5% |
20.5% |
20.0% |
|||||||||||||
Net sales for fiscal year 2025 decreased $8.9 million, or 9.4% when compared to the prior year reflecting general market softness in the Display Merchandising business and in the Hydraulics business.
Income from operations for fiscal year 2025 decreased $4.8 million, or 24.4%, when compared to the prior year due to lower volumes.
Net sales for fiscal year 2024 decreased $31.5 million, or 24.8% when compared to the prior year. Organic sales for the group decreased $10.3 million, or 8.1%, as compared to the prior year period, reflecting organic growth decreases in the Display Merchandising business and the Hydraulics business, due to an ongoing industry-wide chassis shortage. The divestiture of Procon in the third quarter of fiscal year 2023 negatively impacted the group by $21.3 million, or 16.7%.
Income from operations for fiscal year 2024 decreased $5.7 million, or 22.6%, when compared to the prior year. The decrease is due to the Procon divestiture and lower volume in the Display Merchandising and Hydraulics business, partially offset by improved operating performance in the Display Merchandising business.
Corporate, Restructuring and Other
| 2025 compared to 2024 |
2024 compared to 2023 |
||||||||||||||||
| (in thousands except |
% |
% |
|||||||||||||||
| percentages) |
2025 |
2024 |
Change |
2024 |
2023 |
Change |
|||||||||||
| Corporate - Income from operations |
$ (31,427) |
$ (32,183) |
(2.3%) |
$ (32,183) |
$ (35,207) |
(8.6%) |
|||||||||||
| Gain (loss) on sale of business |
- |
$ 274 |
(100.0%) |
274 |
62,105 |
(99.6%) |
|||||||||||
| Restructuring costs |
(6,903) |
$ (8,206) |
(15.9%) |
(8,206) |
(3,831) |
114.2% |
|||||||||||
| Acquisition related costs |
(21,434) |
$ (2,622) |
717.5% |
(2,622) |
(557) |
370.7% |
|||||||||||
| Other operating income (expense), net |
- |
$ (110) |
(100.0%) |
(110) |
611 |
(118.0%) |
|||||||||||
Corporate expenses in fiscal year 2025 decreased $0.8 million, or 2.3%, when compared to the prior year, primarily due to reduction in incentive compensation.
Corporate expenses in fiscal year 2024 decreased $3.0 million, or 8.6%, when compared to the prior year. Corporate expenses in fiscal year 2024 reflect reductions in incentive compensation.
The gain on sale of business, restructuring costs, acquisition-related costs and other operating income (expense), net have been discussed above in the Company Overview.
Discontinued Operations
In pursuing our business strategy, the Company may divest certain businesses. Future divestitures may be classified as discontinued operations based on their strategic significance to the Company. Activity related to discontinued operations is as follows (in thousands):
| Year Ended June 30, |
|||||||||||
| 2025 |
2024 |
2023 |
|||||||||
| (Loss) before taxes |
$ | (53 | ) | $ | (654 | ) | $ | (204) | |||
| Benefit for taxes |
11 | 137 | 43 | ||||||||
| Net (loss) from discontinued operations |
$ | (42 | ) | $ | (517 | ) | $ | (161) | |||
Liquidity and Capital Resources
At June 30, 2025, our total cash balance was $104.5 million, of which $78.7 million was held outside of the United States. The amount and timing of cash repatriation is dependent upon foreign exchange rates and each business unit’s operational needs including requirements to fund working capital, capital expenditure, and jurisdictional tax payments. The repatriation of cash balances from certain of our subsidiaries could have adverse tax consequences or be subject to capital controls; however, those balances are generally available without legal restrictions to fund ordinary business operations.
Cash Flow
Net cash provided by continuing operating activities for the year ended June 30, 2025 was $69.6 million compared to net cash provided by continuing operating activities of $93.3 million in the prior year. We generated $102.0 million from income statement activities and used $12.9 million of cash to fund working capital and other balance sheet account increases. Cash flow used in investing activities for the year ended June 30, 2025 totaled $503.4 million. We used $478.9 million for the purchase of acquisitions in the fiscal year, $28.3 million was used for capital expenditures. We generated $3.5 million in the fiscal year proceeds from life insurance policies. Cash provided by financing activities for the year ended June 30, 2025 was $380.5 million and included proceeds from borrowings of $792.3 million, payment of debt of $389 million, stock repurchases of $9.9 million and cash paid for dividends of $15.0 million.
Net cash provided by continuing operating activities for the year ended June 30, 2024 was $93.3 million compared to net cash provided by continuing operating activities of $90.8 million in the prior year. We generated $111.4 million from income statement activities and used $5.1 million of cash to fund working capital and other balance sheet account increases. Cash flow used in investing activities for the year ended June 30, 2024 totaled $61.6 million. We used $48.8 million for the purchase of acquisitions in the fiscal year and $20.3 million was used for capital expenditures. We generated $7.8 million in the fiscal year of proceeds from the divestiture of the Procon business. Cash used by financing activities for the year ended June 30, 2024 was $69.2 million and included stock repurchases of $31.8 million, repayments of debt of $25.0 million and cash paid for dividends of $13.9 million.
We sponsor a number of defined benefit and defined contribution retirement plans. The U.S. pension plan is frozen for all participants. We have evaluated the current and long-term cash requirements of these plans, and our existing sources of liquidity are expected to be sufficient to cover required contributions under ERISA and other governing regulations.
The fair value of the Company's U.S. defined benefit pension plan assets was $146.4 million at June 30, 2025, as compared to $142.3 million as of June 30, 2024. We participate in two multi-employer pension plans and sponsor six defined benefit plans including two in the U.S. and Japan and one each in the U.K. and Germany. The Company’s pension plan is frozen for U.S. employees and participants in the plan ceased accruing future benefits. Our primary U.S. defined benefit plan is not 100% funded under ERISA rules at June 30, 2025.
U.S. defined benefit plan contributions of $7.6 million were made during fiscal year 2025 compared to $10.0 million during fiscal year 2024. There are required contributions of $6.5 million to the United States funded pension plan for fiscal year 2026. The Company expects to make contributions during fiscal year 2026 of $0.1 million and $0.3 million to its unfunded defined benefit plans in the U.S. and Germany, respectively. Any subsequent plan contributions will depend on the results of future actuarial valuations.
We have evaluated the current and long-term cash requirements of our defined benefit and defined contribution plans as of June 30, 2025 and determined our operating cash flows from continuing operations and available liquidity are expected to be sufficient to cover the required contributions under ERISA and other governing regulations.
We have an insurance program in place to fund supplemental retirement income benefits for three retired executives. Current executives and new hires are not eligible for this program. At June 30, 2025, the underlying policies had a cash surrender value of $6.7 million and are reported net of loans of $2.7 million for which we have the legal right of offset. These amounts are reported net on our balance sheet.
Capital Structure
During the third quarter of fiscal year 2023, the Company entered into a Third Amended & Restated Credit Agreement which renewed the existing Credit Agreement for an additional five-year period (“credit agreement”, or “facility”) with a borrowing limit of $500 million. Under the terms of the Credit Facility, we pay a variable rate of interest and a fee on borrowed amounts as well as a commitment fee on unused amounts under the facility. The amount of the commitment fee depends upon both the undrawn amount remaining available under the facility and the Company’s funded debt to EBITDA (as defined in the agreement) ratio at the last day of each quarter.
Funds borrowed under the facility may be used for the repayment of debt, working capital, capital expenditures, acquisitions (so long as certain conditions, including a specified funded debt to EBITDA leverage ratio is maintained), and other general corporate purposes.
During the second quarter of fiscal year 2025, we entered into a $250 million 364-day term loan with existing lenders. Also, during the period, we converted the 364-day term loan into an exercise of the accordion feature under our existing credit facilities. In connection with the conversion of the loan, the Company entered into a Second Amendment to Third Amended and Restated Credit Agreement. This amendment expanded the total available credit under the Revolving Credit Agreement from $500 million to $825 million.
As of June 30, 2025, the Company has used $1.9 million against the letter of credit sub-facility and had the ability to borrow $207.7 million under the facility based on our current trailing twelve-month EBITDA. The facility contains customary representations, warranties and restrictive covenants, as well as specific financial covenants. The Company’s current financial covenants under the facility are as follows:
Interest Coverage Ratio - The Company is required to maintain a ratio of Earnings Before Interest and Taxes, as Adjusted (“Adjusted EBIT per the Credit Facility”), to interest expense for the trailing twelve months of at least 2.75:1. Adjusted EBIT per the Credit Facility specifically excludes extraordinary and certain other defined items such as cash restructuring and acquisition related charges up to the lower of $20.0 million or 10% of EBITDA. The facility allows for unlimited non-cash charges including purchase accounting and goodwill adjustments. At June 30, 2025, the Company’s Interest Coverage Ratio was 6.42:1.
Leverage Ratio- The Company’s ratio of funded debt to trailing twelve month Adjusted EBITDA per the Credit Facility, calculated as Adjusted EBIT per the Credit Facility plus depreciation and amortization, may not exceed 3.5:1. Under certain circumstances in connection with a Material Acquisition (as defined in the Facility), the Facility allows for the leverage ratio to go as high as 4.0:1 for a four-fiscal quarter period. At June 30, 2025, the Company’s Leverage Ratio was 2.60:1.
As of June 30, 2025, we had borrowings under our facility of $553.2 million. The effective rate of interest for our outstanding borrowings is 6.38%. Our primary cash requirements in addition to day-to-day operating needs include interest payments, capital expenditures, acquisitions, share repurchases, and dividends.
Our primary sources of cash are cash flows from continuing operations and borrowings under the facility. We expect that fiscal year 2026 depreciation and amortization expense will be between $24.0 million and $26.0 million and $15.5 million and $17.5 million, respectively.
The following table sets forth our capitalization at June 30:
| 2025 |
2024 |
||||||
| Long-term debt |
$ | 552,515 | $ | 148,876 | |||
| Less cash and cash equivalents |
104,542 | 154,203 | |||||
| Net (cash) debt |
447,973 | (5,327) | |||||
| Stockholders' equity |
711,677 | 621,503 | |||||
| Total capitalization |
$ | 1,159,650 | $ | 616,176 | |||
Stockholders’ equity increased year over year by $90.2 million, primarily as a result of current year net income of $55.7 million and stock issued for acquisitions of $26 million. The Company's net (cash) debt to capital percentage changed to (38.6)% as of June 30, 2025 from (0.9)% in the prior year.
At June 30, 2025, we expect to pay estimated interest payments of $176 million within the next five years. This estimate is based upon the loan balance, interest rate, and credit spread as of June 30, 2025. If we take into consideration the change in credit spread that will take effect in August 2025 and the interest rate at June 30, 2025, then the amount of estimated interest payments for the next five years would be $169 million. See Item 7A for further discussions surrounding interest rate exposure on our variable rate borrowings.
Post-retirement benefits and pension plan contribution payments represent future pension payments to comply with local funding requirements. Our policy is to fund domestic pension liabilities in accordance with the minimum and maximum limits imposed by the Employee Retirement Income Security Act of 1974 ("ERISA"), federal income tax laws and the funding requirements of the Pension Protection Act of 2006. At June 30, 2025, we expect to pay estimated post-retirement benefit payments of $6.9 million during fiscal year 2026. See "Item 8. Financial Statements and Supplementary Data, Note 16. Employee Benefit Plans" for additional information regarding these obligations.
At June 30, 2025, we had $51.2 million of operating lease obligations. See "Item 8. Financial Statements and Supplementary Data, Note 20. Leases" for additional information regarding these obligations.
At June 30, 2025, we had $2.9 million of non-current liabilities for uncertain tax positions. We are not able to provide a reasonable estimate of the timing of future payments related to these obligations.
Other Matters
Tariff – Several of our segments may be impacted by recent tariff announcements. While we cannot predict the impact of potential new tariffs on global trade and economic growth, our regional presence, strong customer relationships, and our disciplined approach to pricing and productivity actions position us well to manage through these challenges. We monitor the regulatory environment and continue to make adjustments whenever it is deemed necessary. Most of our supply chain is strategically located to service regional demand. We plan to continue to invest in our key strategic growth priorities while closely managing our cost structure and driving productivity and pricing actions and seeking alternate sources of supply to further reduce the impact of tariffs as appropriate.
Inflation – Certain of our expenses, such as wages and benefits, occupancy costs, freight and equipment repair and replacement, are subject to normal inflationary pressures. Inflation for medical costs can impact both our employee benefit costs as well as our reserves for workers' compensation claims. We monitor the inflationary rate and make adjustments to reserves whenever it is deemed necessary. Our ability to control worker compensation insurance medical cost inflation is dependent upon our ability to manage claims and purchase insurance coverage to limit the maximum exposure for us. Each of our segments is subject to the effects of changing raw material costs caused by the underlying commodity price movements. We have experienced price fluctuations for a number of materials including rhodium, steel, and other metal commodities. These materials are some of the key elements in the products manufactured in these segments. Wherever possible, we will implement price increases to offset the impact of changing prices. The ultimate acceptance of these price increases will be impacted by our affected divisions’ respective competitors and the timing of their price increases. In general, we do not enter into purchase contracts that extend beyond one operating cycle. While Standex considers our relationship with our suppliers to be good, there can be no assurances that we will not experience any supply shortage.
Foreign Currency Translation – Our primary functional currencies used by our non-U.S. subsidiaries are the Euro, British Pound Sterling (Pound), Japanese (Yen), Mexican Peso, Chinese (Yuan), and Indian (Rupee).
Defined Benefit Pension Plans – We record expenses related to these plans based upon various actuarial assumptions such as discount rates and assumed rates of returns. The Company’s pension plan is frozen for all eligible U.S. employees and participants in the plan ceased accruing future benefits.
Environmental Matters – To the best of our knowledge, we believe that we are presently in substantial compliance with all existing applicable environmental laws and regulations and do not anticipate any instances of non-compliance that will have a material effect on our future capital expenditures, earnings or competitive position.
Seasonality – We are a diversified business with generally low levels of seasonality.
Employee Relations – The Company has labor agreements with four union locals in the United States and various European employees belong to European trade unions.
Critical Accounting Policies
The Consolidated Financial Statements include accounts of the Company and all of our subsidiaries. The preparation of financial statements in conformity with accounting principles generally accepted in the United States of America requires us to make estimates and assumptions in certain circumstances that affect amounts reported in the accompanying Consolidated Financial Statements. Although, we believe that materially different amounts would not be reported due to the accounting policies described below, the application of these accounting policies involves the exercise of judgment and use of assumptions as to future uncertainties and, as a result, actual results could differ from these estimates. We have listed a number of accounting policies which we believe to be the most critical.
Revenue Recognition – Most of the Company’s contracts have a single performance obligation which represents, the product or service being sold to the customer. Some contracts include multiple performance obligations such as a product and the related installation and/or extended warranty. Additionally, most of the Company’s contracts offer assurance type warranties in connection with the sale of a product to customers. Assurance type warranties provide a customer with assurance that the product complies with agreed-upon specifications. Assurance type warranties do not represent a separate performance obligation.
In general, the Company recognizes revenue at the point in time control transfers to their customer based on predetermined shipping terms. Revenue is recognized over time under certain long-term contracts within the Engineering Technologies and Engraving groups for highly customized customer products that have no alternative use and in which the contract specifies the Company has a right to payment for its costs, plus a reasonable margin. For products recognized over time, the transfer of control is measured pro rata, based upon current estimates of costs to complete such contracts. Losses on contracts are fully recognized in the period in which the losses become determinable. Revisions in profit estimates are reflected on a cumulative basis in the period in which the basis for such revision becomes known.
Collectability of Accounts Receivable – Accounts Receivable are reduced by an allowance for amounts that represent management's best estimate of estimated losses over the life of the underlying asset. Our estimate for the allowance for credit loss accounts related to trade receivables includes evaluation of specific accounts where we have information that the customer may have an inability to meet its financial obligation together with a detailed review of the collectability of pooled assets based on a combination of qualitative and quantitative factors.
Realizability of Inventories – Inventories are valued at the lower of cost or market. The Company regularly reviews inventory values on hand using specific aging categories and records a write down for obsolete and excess inventory based on historical usage and estimated future usage. As actual future demand or market conditions may vary from those projected by management, adjustments to inventory valuations may be required.
Realization of Goodwill – Goodwill and certain indefinite-lived intangible assets are not amortized, but instead are tested for impairment at least annually and more frequently whenever events or changes in circumstances indicate that the fair value of the asset may be less than its carrying amount of the asset. The Company’s annual test for impairment is performed using a May 31st measurement date. We have identified six reporting units for impairment testing: Electronics, Engineering Technologies, Scientific, Engraving, Federal, and Hydraulics.
As quoted market prices are not available for the Company’s reporting units, the fair value of the reporting units is determined using a discounted cash flow model (income approach). This method uses various assumptions that are specific to each individual reporting unit in order to determine the fair value. In addition, the Company compares the estimated aggregate fair value of its reporting units to its overall market capitalization.
Our annual impairment testing at each reporting unit relied on assumptions surrounding general market conditions, short-term growth rates, a terminal growth rate of 2.5%, and detailed management forecasts of future cash flows prepared by the relevant reporting unit. Fair values were determined primarily by discounting estimated future cash flows at a weighted average cost of capital of 9.84%. During our annual impairment testing, we evaluated the sensitivity of our most critical assumption, the discount rate, and determined that a 100-basis point change in the discount rate selected would not have impacted the test results. Additionally, the Company could reduce the terminal growth rate from its current 2.5% to 1.0% and the fair value of all reporting units would still exceed their carrying value.
While we believe that our estimates of future cash flows are reasonable, changes in assumptions could significantly affect our valuations and result in impairments in the future. The most significant assumption involved in the Company’s determination of fair value is the cash flow projections of each reporting unit.
As a result of our annual assessment in the fourth quarter of fiscal year 2025, the Company determined that the fair value of the six reporting units substantially exceeded their respective carrying values. Therefore, no impairment charges were recorded in connection with our annual assessment during the fourth quarter of fiscal year 2025.
Cost of Employee Benefit Plans – We provide a range of benefits to certain retirees, including pensions and some postretirement benefits. We record expenses relating to these plans based upon various actuarial assumptions such as discount rates, assumed rates of return, compensation increases and turnover rates. The expected return on plan assets assumption of 6.35% in the U.S. is based on our expectation of the long-term average rate of return on assets in the pension funds and is reflective of the current and projected asset mix of the funds and considers the historical returns earned on the funds. We have analyzed the rates of return on assets used and determined that these rates are reasonable based on the plans’ historical performance relative to the overall markets as well as our current expectations for long-term rates of returns for our pension assets. The U.S. discount rate of 5.6% reflects the current rate at which pension liabilities could be effectively settled at the end of the year. The discount rate is determined by matching our expected benefit payments from a stream of AA- or higher bonds available in the marketplace, adjusted to eliminate the effects of call provisions. We review our actuarial assumptions, including discount rate and expected long-term rate of return on plan assets, on at least an annual basis and make modifications to the assumptions based on current rates and trends when appropriate. Based on information provided by our actuaries and other relevant sources, we believe that our assumptions are reasonable.
The cost of employee benefit plans includes the selection of assumptions noted above. A twenty-five-basis point change in the U.S. expected return on plan assets assumptions, holding our discount rate and other assumptions constant, would increase or decrease pension expense by approximately $0.4 million per year. A twenty-five-basis point change in our discount rate, holding all other assumptions constant, would have no impact on 2025 pension expense as changes to amortization of net losses would be offset by changes to interest cost. In future years, the impact of discount rate changes could yield different sensitivities. See the Notes to the Consolidated Financial Statements for further information regarding pension plans.
Business Combinations - The accounting for business combinations requires estimates and judgments as to expectations for future cash flows of the acquired business and the allocation of those cash flows to identifiable intangible assets in determining the estimated fair values for assets acquired and liabilities assumed. The fair values assigned to tangible and intangible assets acquired and liabilities assumed, are based on management’s estimates and assumptions, as well as other information compiled by management, including valuations that utilize customary valuation procedures and techniques. If the actual results differ from the estimates and judgments used in these fair values, the amounts recorded in the consolidated financial statements could result in a possible impairment of the intangible assets and goodwill or require acceleration of the amortization expense of finite-lived intangible assets.
Allocations of the purchase price for acquisitions are based on estimates of the fair value of the net assets acquired and are subject to adjustment upon finalization of the purchase price allocation. During this measurement period, the Company will adjust assets or liabilities if new information is obtained about facts and circumstances that existed as of the acquisition date that, if known, would have resulted in the recognition of those assets and liabilities as of that date. All changes that do not qualify as measurement period adjustments are included in current period earnings.
Recently Issued Accounting Pronouncements
See "Item 8. Financial Statements and Supplementary Data, Note 1. Summary of Accounting Policies” for information regarding the effect of recently issued accounting pronouncements on our consolidated statements of operations, comprehensive income, stockholders’ equity, cash flows, and notes for the year ended June 30, 2025 .
Item 7A. Quantitative and Qualitative Disclosures About Market Risk
Risk Management
We are exposed to market risks from changes in interest rates, commodity prices and changes in foreign currency exchange. To reduce these risks, we selectively use, from time to time, financial instruments and other proactive management techniques. We have internal policies and procedures that place financial instruments under the direction of the Treasurer and restrict all derivative transactions to those intended for hedging purposes only. The use of financial instruments for trading purposes (except for certain investments in connection with the non-qualified defined contribution plan) or speculation is strictly prohibited. The Company has no majority-owned subsidiaries that are excluded from the consolidated financial statements. Further, we have no interests in or relationships with any special purpose entities.
Exchange Risk
We are exposed to both transactional risk and translation risk associated with exchange rates. The transactional risk is mitigated, in large part, by natural hedges developed with locally denominated debt service on intercompany accounts and the fact that most of our foreign currency sales are transacted in their functional currency. We also mitigate certain of our foreign currency exchange rate risks by entering into forward foreign currency contracts from time to time. The contracts are used as a hedge against anticipated foreign cash flows, such as loan payments, customer remittances, and materials purchases, and are not used for trading or speculative purposes. The fair values of the forward foreign currency exchange contracts are sensitive to changes in foreign currency exchange rates, as an adverse change in foreign currency exchange rates from market rates would decrease the fair value of the contracts. However, any such losses or gains would generally be offset by corresponding gains and losses, respectively, on the related hedged asset or liability. At June 30, 2025 and 2024, the fair value, in the aggregate, of the Company’s open foreign exchange contracts was a liability of less than $0.1million and liability of $0.1 million respectively.
Our primary translation risk is with the Euro, British Pound Sterling, Peso, Japanese Yen, Chinese Yuan, and Indian Rupee. A hypothetical 10% appreciation or depreciation of the value of any these foreign currencies to the U.S. Dollar at June 30, 2025, would not result in a material change in our operations, financial position, or cash flows. We hedge our most significant foreign currency translation risks primarily through cross-currency swaps and other instruments, as appropriate.
Interest Rate
The Company’s effective interest rate on borrowings was 6.38% and 2.46% at June 30, 2025 and 2024, respectively. Our interest rate exposure is limited primarily to interest rate changes on our variable rate borrowings. From time to time, we use interest rate swap agreements to modify our exposure to interest rate movements. At June 30, 2025, we did not have any outstanding interest rate swaps. At June 30, 2024, the fair value, in the aggregate, of the Company’s interest rate swaps were assets of $4.7 million. A 25-basis point increase in interest rates would increase our annual interest expense by approximately $1.4 million based on the balance and rate at June 30, 2025.
Concentration of Credit Risk
We have a diversified customer base. As such, the risk associated with concentration of credit risk is inherently minimized. As of June 30, 2025, no one customer accounted for more than 5% of our consolidated outstanding receivables or of our sales.
Commodity Prices
The Company is exposed to fluctuating market prices for all commodities used in its manufacturing processes. Each of our segments is subject to the effects of changing raw material costs caused by the underlying commodity price movements. In general, we do not enter into purchase contracts that extend beyond one operating cycle. While Standex considers our relationship with our suppliers to be good, there can be no assurances that we will not experience any supply shortage.
The Electronics, Engineering Technologies and Specialty Solutions segments are all sensitive to price increases for steel and aluminum products, other metal commodities such as rhodium and copper, and petroleum-based products. We continue to experience price fluctuations for a number of materials including rhodium, steel, and other metal commodities. These materials are some of the key elements in the products manufactured in these segments. Wherever possible, we will implement price increases to offset the impact of changing prices. The ultimate acceptance of these price increases, if implemented, will be impacted by our affected divisions’ respective competitors and the timing of their price increases.
Item 8. Financial Statements and Supplementary Data
Standex International Corporation and Subsidiaries
Consolidated Balance Sheets
| As of June 30 (in thousands, except share data) | 2025 | 2024 | ||||||
| ASSETS | ||||||||
| Current assets: | ||||||||
| Cash and cash equivalents | $ | $ | ||||||
| Accounts receivable, net | ||||||||
| Inventories | ||||||||
| Prepaid expenses and other current assets | ||||||||
| Contract assets | ||||||||
| Total current assets | ||||||||
| Property, plant and equipment, net | ||||||||
| Intangible assets, net | ||||||||
| Goodwill | ||||||||
| Deferred tax asset | ||||||||
| Operating lease right-of-use asset | ||||||||
| Other non-current assets | ||||||||
| Total non-current assets | ||||||||
| Total assets | $ | $ | ||||||
| LIABILITIES AND STOCKHOLDERS' EQUITY | ||||||||
| Current liabilities: | ||||||||
| Accounts payable | $ | $ | ||||||
| Accrued liabilities | ||||||||
| Income taxes payable | ||||||||
| Total current liabilities | ||||||||
| Long-term debt | ||||||||
| Operating lease long-term liabilities | ||||||||
| Accrued pension and other non-current liabilities | ||||||||
| Total non-current liabilities | ||||||||
| Contingencies (Note 12) | ||||||||
| Redeemable noncontrolling interest | ||||||||
| Stockholders' equity: | ||||||||
| Common stock, par value $ per share - shares authorized, issued, and shares outstanding in 2025 and 2024 | ||||||||
| Additional paid-in capital | ||||||||
| Retained earnings | ||||||||
| Accumulated other comprehensive loss | ( | ) | ( | ) | ||||
| Treasury shares ( shares in 2025 and shares in 2024) | ( | ) | ( | ) | ||||
| Total stockholders' equity | ||||||||
| Total liabilities and stockholders' equity | $ | $ | ||||||
| See notes to consolidated financial statements. |
| Standex International Corporation and Subsidiaries |
|
|
| Consolidated Statements of Operations |
| For the Years Ended June 30 | ||||||||||||
| (in thousands, except per share data) | 2025 | 2024 | 2023 | |||||||||
| Net sales | $ | $ | $ | |||||||||
| Cost of sales | ( | ) | ( | ) | ( | ) | ||||||
| Gross profit | ||||||||||||
| Selling, general and administrative expenses | ||||||||||||
| Restructuring costs | ||||||||||||
| (Gain) loss on sale of business | ( | ) | ( | ) | ||||||||
| Acquisition related costs | ||||||||||||
| Other operating (income) expense, net | ( | ) | ||||||||||
| Income from operations | ||||||||||||
| Interest expense | ||||||||||||
| Other non-operating (income) expense, net | ||||||||||||
| Income from continuing operations before income taxes | ||||||||||||
| Provision for income taxes | ( | ) | ( | ) | ( | ) | ||||||
| Income from continuing operations | ||||||||||||
| Income (loss) from discontinued operations, net of tax | ( | ) | ( | ) | ( | ) | ||||||
| Net income | ||||||||||||
| Less: net income attributable to redeemable noncontrolling interest | ||||||||||||
| Net income attributable to Standex International Corporation | $ | $ | $ | |||||||||
| Basic earnings per share attributable to Standex International Corporation shareholders: | ||||||||||||
| Income (loss) from continuing operations | $ | $ | $ | |||||||||
| Income (loss) from discontinued operations | ( | ) | ( | ) | ||||||||
| Total | $ | $ | $ | |||||||||
| Diluted earnings per share attributable to Standex International Corporation shareholders: | ||||||||||||
| Income (loss) from continuing operations | $ | $ | $ | |||||||||
| Income (loss) from discontinued operations | ( | ) | ( | ) | ||||||||
| Total | $ | $ | $ | |||||||||
| See notes to consolidated financial statements. |
| Standex International Corporation and Subsidiaries |
| Consolidated Statements of Comprehensive Income |
| For the Years Ended June 30 (in thousands) | 2025 | 2024 | 2023 | |||||||||
| Net income | $ | $ | $ | |||||||||
| Other comprehensive income (loss): | ||||||||||||
| Defined benefit pension plans: | ||||||||||||
| Actuarial (losses) and other changes in unrecognized costs, net of tax | ( | ) | ( | ) | ||||||||
| Amortization of unrecognized pension costs, net of tax | ||||||||||||
| Derivative instruments: | ||||||||||||
| Change in unrealized gains, net of tax | ( | ) | ||||||||||
| Amortization of unrealized gains and (losses) into interest expense, net of tax | ( | ) | ( | ) | ( | ) | ||||||
| Foreign currency translation income (losses), net of tax | ( | ) | ( | ) | ||||||||
| Other comprehensive (loss), net of tax | ( | ) | ( | ) | ||||||||
| Less: comprehensive income attributable to redeemable noncontrolling interest | ||||||||||||
| Comprehensive income | $ | $ | $ | |||||||||
| See notes to consolidated financial statements. |
Standex International Corporation and Subsidiaries
Consolidated Statements of Stockholders' Equity
| Accumulated | ||||||||||||||||||||||||||||||||
| Other | ||||||||||||||||||||||||||||||||
| Redeemable | Additional | Comprehensive | Total | |||||||||||||||||||||||||||||
| For the Years Ended June 30 | Noncontrolling | Common | Paid-in | Retained | Income | Treasury Stock | Stockholders’ | |||||||||||||||||||||||||
| (in thousands, except as specified) | Interest | Stock | Capital | Earnings | (Loss) | Shares | Amount | Equity | ||||||||||||||||||||||||
| Balance, June 30, 2022 | $ | $ | $ | $ | $ | ( | ) | $ | ( | ) | $ | |||||||||||||||||||||
| Stock issued under incentive compensation plans and employee purchase plans | ( | ) | - | ( | ) | |||||||||||||||||||||||||||
| Stock-based compensation | - | - | - | |||||||||||||||||||||||||||||
| Treasury stock acquired | - | ( | ) | ( | ) | |||||||||||||||||||||||||||
| Comprehensive income: | ||||||||||||||||||||||||||||||||
| Net income | - | - | - | |||||||||||||||||||||||||||||
| Foreign currency translation adjustment | ( | ) | - | - | ( | ) | ||||||||||||||||||||||||||
| Pension, net of tax of $ million | ( | ) | - | - | ( | ) | ||||||||||||||||||||||||||
| Change in fair value of derivatives, net of tax of $ million | - | - | ||||||||||||||||||||||||||||||
| Dividends declared ($ per share) | ( | ) | - | - | ( | ) | ||||||||||||||||||||||||||
| Balance, June 30, 2023 | ( | ) | ( | ) | ||||||||||||||||||||||||||||
| Stock issued under incentive compensation plans and employee purchase plans | ( | ) | - | ( | ) | |||||||||||||||||||||||||||
| Stock-based compensation | - | - | - | |||||||||||||||||||||||||||||
| Treasury stock acquired | - | ( | ) | ( | ) | |||||||||||||||||||||||||||
| Comprehensive income: | ||||||||||||||||||||||||||||||||
| Net income | - | - | - | |||||||||||||||||||||||||||||
| Foreign currency translation adjustment | ( | ) | - | - | ( | ) | ||||||||||||||||||||||||||
| Pension, net of tax of $ million | ( | ) | - | - | ( | ) | ||||||||||||||||||||||||||
| Change in fair value of derivatives, net of tax of $ million | ( | ) | - | - | ( | ) | ||||||||||||||||||||||||||
| Dividends declared ($ per share) | ( | ) | - | - | ( | ) | ||||||||||||||||||||||||||
| Balance, June 30, 2024 | ( | ) | ( | ) | ||||||||||||||||||||||||||||
| Stock issued under incentive compensation plans and employee purchase plans | ( | ) | - | ( | ) | |||||||||||||||||||||||||||
| Fair value of noncontrolling interest at acquisition | - | - | - | |||||||||||||||||||||||||||||
| Stock issued for business acquisition | - | ( | ) | |||||||||||||||||||||||||||||
| Stock-based compensation | - | - | - | |||||||||||||||||||||||||||||
| Treasury stock acquired | - | ( | ) | ( | ) | |||||||||||||||||||||||||||
| Comprehensive income: | - | |||||||||||||||||||||||||||||||
| Net income | - | - | - | |||||||||||||||||||||||||||||
| Foreign currency translation adjustment | ( | ) | - | - | ||||||||||||||||||||||||||||
| Pension, net of tax of $ million | - | - | ||||||||||||||||||||||||||||||
| Change in fair value of derivatives, net of tax of $ million | ( | ) | - | - | ( | ) | ||||||||||||||||||||||||||
| Dividends declared ($ per share) | ( | ) | - | - | ( | ) | ||||||||||||||||||||||||||
| Balance, June 30, 2025 | $ | $ | $ | $ | $ | ( | ) | $ | ( | ) | $ | |||||||||||||||||||||
See notes to consolidated financial statements.
Standex International Corporation and Subsidiaries
Consolidated Statements of Cash Flows
| For the Years Ended June 30 (in thousands) | 2025 | 2024 | 2023 | |||||||||
| Cash Flows from Operating Activities | ||||||||||||
| Net income | $ | $ | $ | |||||||||
| Income (loss) from discontinued operations | ( | ) | ( | ) | ( | ) | ||||||
| Income from continuing operations | ||||||||||||
| Adjustments to reconcile net income (loss) to net cash provided by operating activities: | ||||||||||||
| Depreciation and amortization | ||||||||||||
| Stock-based compensation | ||||||||||||
| Gain on sale of real estate and equipment | ( | ) | ||||||||||
| Non-cash portion of restructuring charge | ( | ) | ||||||||||
| (Gain) loss on sale of business | ( | ) | ( | ) | ||||||||
| Deferred income taxes | ( | ) | ( | ) | ( | ) | ||||||
| Life insurance benefit | ( | ) | ||||||||||
| Contributions to defined benefit plans | ( | ) | ( | ) | ( | ) | ||||||
| Increase/(decrease) in cash from changes in assets and liabilities, net of effects from discontinued operations and business acquisitions: | ||||||||||||
| Accounts receivables, net | ( | ) | ( | ) | ||||||||
| Inventories | ( | ) | ( | ) | ||||||||
| Prepaid expenses and other assets | ( | ) | ||||||||||
| Accounts payable | ( | ) | ( | ) | ||||||||
| Accrued liabilities, pension and other liabilities | ( | ) | ( | ) | ( | ) | ||||||
| Income taxes payable | ( | ) | ||||||||||
| Net cash provided by operating activities from continuing operations | ||||||||||||
| Net cash provided by (used for) operating activities from discontinued operations | ( | ) | ( | ) | ||||||||
| Net cash provided by operating activities | ||||||||||||
| Cash Flows from Investing Activities | ||||||||||||
| Expenditures for property, plant and equipment | ( | ) | ( | ) | ( | ) | ||||||
| Expenditures for acquisitions, net of cash acquired | ( | ) | ( | ) | ||||||||
| Expenditures for executive life insurance policies | ( | ) | ( | ) | ( | ) | ||||||
| Proceeds from sale of business | ||||||||||||
| Proceeds from sale of real estate and equipment | ||||||||||||
| Proceeds withdrawn from life insurance policies | ||||||||||||
| Other investing activity | ( | ) | ||||||||||
| Net cash provided by (used for) investing activities from continuing operations | ( | ) | ( | ) | ||||||||
| Net cash provided by investing activities from discontinued operations | ||||||||||||
| Net cash (used for) investing activities | ( | ) | ( | ) | ||||||||
| Cash Flows from Financing Activities | ||||||||||||
| Proceeds from borrowings | ||||||||||||
| Payments of debt | ( | ) | ( | ) | ( | ) | ||||||
| Contingent consideration payment | ( | ) | ||||||||||
| Activity under share-based payment plans | ||||||||||||
| Purchase of treasury stock and other | ( | ) | ( | ) | ( | ) | ||||||
| Cash dividends paid | ( | ) | ( | ) | ( | ) | ||||||
| Net cash provided by (used for) financing activities | ( | ) | ( | ) | ||||||||
| Effect of exchange rate changes on cash | ( | ) | ( | ) | ||||||||
| Net change in cash and cash equivalents | ( | ) | ( | ) | ||||||||
| Cash and cash equivalents at beginning of year | ||||||||||||
| Cash and cash equivalents at end of year | $ | $ | $ | |||||||||
| Supplemental Disclosure of Cash Flow Information: | ||||||||||||
| Cash paid during the year for: | ||||||||||||
| Interest | $ | $ | $ | |||||||||
| Income taxes, net of refunds | $ | $ | $ | |||||||||
|
See notes to consolidated financial statements. |
Standex International Corporation and Subsidiaries
NOTES TO CONSOLIDATED FINANCIAL STATEMENTS
1. Summary of Accounting Policies
Basis of Presentation and Consolidation
Standex International Corporation (“Standex” or the “Company”) is a diversified industrial manufacturer in five broad business segments: Electronics, Engineering Technologies, Scientific, Engraving and Specialty Solutions with operations in the United States, Europe, Canada, Japan, Singapore, Mexico, Turkey, India, and China. The accompanying consolidated financial statements include the accounts of Standex International Corporation and its subsidiaries and are prepared in accordance with accounting principles generally accepted in the United States of America (“GAAP”). All intercompany accounts and transactions have been eliminated in consolidation. Noncontrolling interests in subsidiaries related to Standex’ ownership interests of less than 100% are reported as Noncontrolling interests in the consolidated balance sheets. The results of noncontrolling ownership interests held by Standex are reported as Net income attributable to redeemable noncontrolling interests in the consolidated statements of operations (refer to Note 2).
The Company considers events or transactions that occur after the balance sheet date, but before the financial statements are issued to provide additional evidence relative to certain estimates or to identify matters that require additional disclosure. We evaluated subsequent events through the date and time our consolidated financial statements were issued.
Accounting Estimates
The preparation of consolidated financial statements in conformity with GAAP requires the use of estimates, judgments and assumptions that affect the reported amounts of assets, liabilities, revenues and expenses, and related disclosure of contingent assets and liabilities at the date of the financial statements and for the period then ended. Estimates are based on historical experience, actuarial estimates, current conditions and various other assumptions that are believed to be reasonable under the circumstances. These estimates form the basis for making judgments about the carrying values of assets and liabilities when they are not readily apparent from other sources. These estimates assist in the identification and assessment of the accounting treatment necessary with respect to commitments and contingencies. Actual results may differ from these estimates under different assumptions or conditions. The estimates and assumptions used in the preparation of the consolidated financial statements have considered the implications on the Company as a result of ongoing global events and related economic impacts. As a result, there is heightened volatility and uncertainty around supply chain performance, labor availability, and customer demand. However, the magnitude of such impact on the Company’s business and its duration is uncertain. The Company is not aware of any specific event or circumstance that would require an update to its estimates or adjustments to the carrying value of its assets and liabilities as of June 30, 2025 and the issuance date of this Annual Report on Form 10-K.
Cash and Cash Equivalents
Cash and cash equivalents include highly liquid investments purchased with a maturity of three months or less. These investments are carried at cost, which approximates fair value. At June 30, 2025 and 2024, the Company’s cash was comprised solely of cash on deposit.
Trading Securities
The Company purchases investments for its non-qualified defined contribution plan for employees who exceed certain thresholds under our traditional 401(k) plan. These investments are classified as trading and reported at fair value. The investments, generally consisting of mutual funds, are included in other non-current assets and amounted to $
Accounts Receivable Allowances
The Company has provided an allowance for credit losses. All trade account receivables are reported net of allowances for expected credit losses. The allowances for expected credit losses represent management’s best estimate of the credit losses expected from our trade account receivables over the life of the underlying assets. Assets with similar risk characteristics are pooled together for determination of their current expected credit losses. The Company regularly performs detailed reviews of its pooled assets to evaluate the collectability of receivables based on a combination of past, current, and future financial and qualitative factors that may affect customers’ ability to pay. In circumstances where the Company is aware of a specific customer’s inability to meet its financial obligations, a specific reserve is recorded against amounts due to reduce the recognized receivable to the amount reasonably expected to be collected.
The changes in the allowances for credit losses accounts during 2025, 2024, and 2023 were as follows (in thousands):
| 2025 | 2024 | 2023 | ||||||||||
| Balance at beginning of year | $ | $ | $ | |||||||||
| Acquisitions and other | ( | ) | ||||||||||
| Provision charged to expense | ||||||||||||
| Write-offs, net of recoveries | ( | ) | ( | ) | ( | ) | ||||||
| Balance at end of year | $ | $ | $ | |||||||||
Inventories
Inventories are stated at the lower of (first-in, first-out) cost or market. Inventory quantities on hand are reviewed regularly, and write downs are made for obsolete, slow moving, and non-saleable inventory, based primarily on management’s forecast of customer demand for those products in inventory.
Long-Lived Assets
Long-lived assets that are used in operations, excluding goodwill and identifiable intangible assets, are tested for recoverability whenever events or changes in circumstances indicate that its carrying amount may not be recoverable. Recognition and measurement of a potential impairment loss is performed on assets grouped with other assets and liabilities at the lowest level where identifiable cash flows are largely independent of the cash flows of other assets and liabilities. An impairment loss is the amount by which the carrying amount of a long-lived asset (asset group) exceeds its estimated fair value. Fair value is determined based on discounted cash flows or appraised values, depending upon the nature of the assets.
Property, Plant and Equipment
Property, plant and equipment are reported at cost less accumulated depreciation. Depreciation is recorded on assets over their estimated useful lives, generally using the straight-line method. Lives for property, plant and equipment are as follows:
| Buildings (years) | to | ||||
| Leasehold improvements | Lesser of useful life or term, unless renewals are deemed to be reasonably assured | ||||
| Machinery and equipment (years) | to | ||||
| Furniture and fixtures (years) | to | ||||
| Computer hardware and software (years) | to | ||||
Routine maintenance costs are expensed as incurred. Major improvements, including those made to leased facilities, are capitalized.
Leases
At the inception of an arrangement, we determine whether the arrangement is or contains a lease based on the unique facts and circumstances present in the arrangement. Leases with a term greater than one year are recognized on the balance sheet as right-of-use assets and short-term and long-term lease liabilities, as applicable. We do not have material financing leases.
Operating lease liabilities and their corresponding right-of-use assets are initially recorded based on the present value of lease payments over the expected remaining lease term. The interest rate implicit in lease contracts is typically not readily determinable. As a result, we utilize our incremental borrowing rate to discount lease payments, which reflects the fixed rate at which we could borrow on a collateralized basis the amount of the lease payments in the same currency, for a similar term, in a similar economic environment. To estimate our incremental borrowing rate, a credit rating applicable to the Company is estimated using a synthetic credit rating analysis since we do not currently have a rating agency-based credit rating.
We have elected not to recognize leases with an original term of one year or less on the balance sheet. We typically only include an initial lease term in our assessment of a lease arrangement. Options to renew a lease are not included in the Company’s assessment unless there is reasonable certainty that the Company will renew.
Goodwill and Identifiable Intangible Assets
All business combinations are accounted for using the acquisition method. Goodwill and identifiable intangible assets with indefinite lives are not amortized, but are reviewed annually for impairment or more frequently if impairment indicators arise. Definite lived identifiable intangible assets are amortized over the following useful lives:
| Customer relationships (years) | to | ||||
| Patents (years) | to | ||||
| Non-compete agreements (years) | |||||
| Other (years) | |||||
| Developed technology (years) | to |
Trade names are considered to have an indefinite life and are not amortized.
See discussion of the Company’s assessment of impairment in Note 6 – Goodwill and Note 7 – Intangible Assets.
Fair Value of Financial Instruments
The financial instruments, shown below, are presented at fair value. Fair value is defined as the price that would be received to sell an asset or paid to transfer a liability in an orderly transaction between market participants at the measurement date. Where available, fair value is based on observable market prices or parameters or derived from such prices or parameters. When observable prices or inputs are not available, valuation models may be applied.
Assets and liabilities recorded at fair value in the consolidated balance sheet are categorized based upon the level of judgment associated with the inputs used to measure their fair values. Hierarchical levels directly related to the amount of subjectivity associated with the inputs to fair valuation of these assets and liabilities and the methodologies used in valuation are as follows:
Level 1 – Quoted prices (unadjusted) in active markets for identical assets and liabilities. The Company’s deferred compensation plan assets consist of shares in various mutual funds (for the deferred compensation plan, investments are participant-directed) which invest in a broad portfolio of debt and equity securities. These assets are valued based on publicly quoted market prices for the funds’ shares as of the balance sheet dates. For pension assets (see Note 16 – Employee Benefit Plans), securities are valued based on quoted market prices for securities held directly by the trust.
Level 2 – Inputs, other than quoted prices in an active market, that are observable either directly or indirectly through correlation with market data. For foreign exchange forward contracts and interest rate swaps, the Company values the instruments based on the market price of instruments with similar terms, which are based on spot and forward rates as of the balance sheet dates. For pension assets held in commingled funds (see Note 16 – Employee Benefit Plans), the Company values investments based on the net asset value of the funds, which are derived from the quoted market prices of the underlying fund holdings. The Company has considered the creditworthiness of counterparties in valuing all assets and liabilities.
Level 3 – Unobservable inputs based upon the Company’s best estimate of what market participants would use in pricing the asset or liability.
The Company did not have any transfers of assets and liabilities among levels of the fair value measurement hierarchy during the years ended June 30, 2025 or 2024. The Company’s policy is to recognize transfers between levels as of the date they occur.
Cash and cash equivalents, accounts receivable, accounts payable and debt are carried at cost, which approximates fair value.
The fair values of our financial instruments at June 30, 2025 and 2024 were (in thousands):
| 2025 | ||||||||||||||||
| Total | Level 1 | Level 2 | Level 3 | |||||||||||||
| Financial Assets | ||||||||||||||||
| Marketable securities - deferred compensation plan | $ | $ | $ | $ | ||||||||||||
| Debt securities | ||||||||||||||||
| Equity securities | ||||||||||||||||
| Financial Liabilities | ||||||||||||||||
| Foreign exchange contracts | $ | |||||||||||||||
| Contingent consideration(a) | ||||||||||||||||
| 2024 | ||||||||||||||||
| Total | Level 1 | Level 2 | Level 3 | |||||||||||||
| Financial Assets | ||||||||||||||||
| Marketable securities - deferred compensation plan | $ | $ | $ | $ | ||||||||||||
| Interest rate swaps | ||||||||||||||||
| Debt securities | ||||||||||||||||
| Equity securities | ||||||||||||||||
| Financial Liabilities | ||||||||||||||||
| Contingent consideration(a) | $ | |||||||||||||||
(a) The Company’s financial liabilities based upon Level 3 inputs comprise of contingent consideration arrangement relating to its acquisition of SEPL in the event that certain financial targets are achieved during the two years following its acquisition in the fourth quarter of fiscal year 2024. The maximum liability under this arrangement is $
Additionally, the Company has financial assets based upon Level 3 inputs, which represent investments in a privately held company.
The Company invested $
In the third quarter of fiscal year 2023, the Company purchased $
The Company will update its assumptions each reporting period based on new developments and record such amounts at fair value based on the revised assumptions until the agreements expire.
Concentration of Credit Risk
The Company is subject to credit risk through trade receivables. Concentration of risk with respect to trade receivables is minimized because of the diversification of our operations, as well as our large customer base and our geographical dispersion. No individual customer accounts for more than
Revenue Recognition
In general, the Company recognizes revenue at the point in time control transfers to its customer based on predetermined shipping terms. Revenue is recognized over time under certain long-term contracts within the Engineering Technologies and Engraving groups for highly customized customer products that have no alternative use and in which the contract specifies the Company has a right to payment for its costs, plus a reasonable margin. For products manufactured over time, the transfer of control is measured pro rata, based upon current estimates of costs to complete such contracts. Losses on contracts are fully recognized in the period in which the losses become determinable. Revisions in profit estimates are reflected on a cumulative basis in the period in which the basis for such revision becomes known.
Cost of Goods Sold and Selling, General and Administrative Expenses
The Company includes expenses in either cost of goods sold or selling, general and administrative categories based upon the natural classification of the expenses. Cost of goods sold includes expenses associated with the acquisition, inspection, manufacturing and receiving of materials for use in the manufacturing process. These costs include inbound freight charges, purchasing and receiving costs, inspection costs, internal transfer costs as well as depreciation, amortization, wages, benefits and other costs that are incurred directly or indirectly to support the manufacturing process. Selling, general and administrative includes expenses associated with the distribution of our products, sales effort, administration costs and other costs that are not incurred to support the manufacturing process. The Company records distribution costs associated with the sale of inventory as a component of selling, general and administrative expenses in the Consolidated Statements of Operations. These expenses include warehousing costs, outbound freight charges and costs associated with salaried distribution personnel. Our gross profit margins may not be comparable to those of other entities due to different classifications of costs and expenses.
Our total advertising expenses, which are classified under selling, general, and administrative expenses are primarily related to trade shows, and totaled $
Research and Development
Research and development expenditures are expensed as incurred. Total research and development costs, which are classified under selling, general, and administrative expenses, were $
Warranties
The expected cost associated with warranty obligations on our products is recorded when the revenue is recognized. The Company’s estimate of warranty cost is based on contract terms and historical warranty loss experience that is periodically adjusted for recent actual experience. Since warranty estimates are forecasts based on the best available information, claims costs may differ from amounts provided. Adjustments to initial obligations for warranties are made as changes in the obligations become reasonably estimable.
The changes in the continuing operations warranty reserve, which are recorded as accrued liabilities, during 2025, 2024, and 2023 were as follows (in thousands):
| 2025 | 2024 | 2023 | ||||||||||
| Balance at beginning of year | $ | $ | $ | |||||||||
| Acquisitions and other charges | ||||||||||||
| Warranty expense | ||||||||||||
| Warranty claims | ( | ) | ( | ) | ( | ) | ||||||
| Balance at end of year | $ | $ | $ | |||||||||
Stock-Based Compensation Plans
Restricted stock awards, including performance-based awards, generally vest over terms from one to three years. Compensation expense associated with these awards is recorded based on their grant-date fair value and is generally recognized on a straight-line basis over the vesting period. Compensation cost for an award with a performance condition is based on the probable outcome of that performance condition. The stated vesting period is considered non-substantive for retirement eligible participants. Accordingly, the Company recognizes any remaining unrecognized compensation expense upon participant reaching retirement eligibility.
Stockholders' Equity
Foreign Currency Translation
The functional currency of our non-U.S. operations is the local currency. Assets and liabilities of non-U.S. operations are translated into U.S. Dollars on a monthly basis using period-end exchange rates. Revenues and expenses of these operations are translated using monthly average exchange rates. The resulting translation adjustment is reported as a component of comprehensive income (loss) in the consolidated statements of stockholders’ equity and comprehensive income. Gains and losses from foreign currency transactions are included in results of operations and were not material for any period presented.
Derivative Instruments and Hedging Activities
The Company recognizes all derivatives on its balance sheet at fair value.
Forward foreign currency exchange contracts are periodically used to limit the impact of currency fluctuations on certain anticipated foreign cash flows, such as foreign purchases of materials and loan payments from subsidiaries. The Company enters into such contracts for hedging purposes only. The Company has designated certain of these currency contracts as hedges, and changes in the fair value of these contracts are recognized in other comprehensive income until the hedged items are recognized in earnings. Hedge ineffectiveness, if any, associated with these contracts will be reported in net income.
The Company also uses interest rate swaps to manage exposure to interest rates on the Company’s variable rate indebtedness. The Company values the swaps based on contract prices in the derivatives market for similar instruments. The Company has designated its interest rate swap agreements, including any that may be forward-dated, as cash flow hedges, and changes in the fair value of the swaps are recognized in other comprehensive income until the hedged items are recognized in earnings. Hedge ineffectiveness, if any, associated with the swaps will be reported by the Company in interest expense.
The Company does not hold or issue derivative instruments for trading purposes.
Income Taxes
The income tax provision from continuing operations for the fiscal year ended June 30, 2025 was $
The income tax provision from continuing operations for the fiscal year ended June 30, 2025 was impacted by the following items: (i) a tax provision of $
The income tax provision from continuing operations for the fiscal year ended June 30, 2024 was impacted by the following items: (i) a tax provision of $
The income tax provision from continuing operations for the fiscal year ended June 30, 2023 was impacted by the following items: (i) a tax benefit of $
Earnings Per Share
| (share amounts in thousands) | 2025 | 2024 | 2023 | |||||||||
| Basic – Average Shares Outstanding | ||||||||||||
| Effect of Dilutive Securities – Stock Options and Restricted Stock Awards | ||||||||||||
| Diluted – Average Shares Outstanding | ||||||||||||
Both basic and diluted income is the same for computing earnings per share. There were
Recently Issued Accounting Pronouncements
From time to time, new accounting pronouncements are issued by the FASB or other standard setting bodies that we adopt as of the specified effective date. Unless otherwise discussed below, the Company does not believe that the adoption of recently issued standards had or may have a material impact on its condensed consolidated financial statements or disclosures. The Company adopted ASC 2023-07 in fiscal 2025. See Note 17. Industry Segment Information.
In November 2023, the FASB issued ASU 2023-07, Segment Reporting (Topic 280) ("ASU 2023-07"). This update provides, among other things, enhanced segment disclosure requirements including disclosures about significant segment expenses. .
In December 2023, the FASB issued ASU 2023- 09, Income Taxes (Topic 740) - Improvements to Income Tax Disclosures. This ASU is expected to enhance the transparency and decision usefulness of income tax disclosures by requiring public business entities on an annual basis to disclose specific categories in the rate reconciliation, additional information for reconciling items that meet a quantitative threshold, and certain information about income taxes paid. This ASU is effective for fiscal years beginning after December 15, 2024. The amendments in this ASU are required to be applied on a prospective basis and retrospective adoption is permitted. The Company is currently evaluating the effect of adopting this new accounting guidance, which would be applicable to fiscal year 2026.
In November 2024, the FASB issued ASU 2024-03, Income Statement - Reporting Comprehensive Income (Topic 220): Expense Disaggregation Disclosures. Additionally, in January 2025, the FASB issued ASU 2025-01 to clarify the effective date of ASU 2024-03. This ASU provides guidance to expand disclosures related to the disaggregation of income statement expenses. This ASU also requires, in the notes to the financial statements, disclosure of specified information about certain costs and expenses which includes purchases of inventory, employee compensation, depreciation, and intangible asset amortization included in each relevant expense caption. ASU 2025-01 is effective for fiscal years beginning after December 15, 2026, and interim periods within annual reporting periods beginning after December 15, 2027, on a retrospective or prospective basis, with early adoption permitted. This ASU will be effective for the Company’s Form 10-K for fiscal 2028 and Form 10-Q filed thereafter. The Company is currently evaluating the impact this ASU may have on our financial statement disclosures.
McStarlite
On February 5, 2025, the Company acquired
The purchase price was allocated to the net tangible and identifiable intangible assets acquired and liabilities assumed based on a valuation of their fair values on the closing date. Goodwill recorded from this transaction is attributable to McStarlite's technical and applications expertise, which is highly complementary to the Company's existing business.
Identifiable intangible assets of $
| Preliminary Allocation as of March 31, 2025 | Adjustments | Preliminary Allocation as of June 30, 2025 | ||||||||||
| Total purchase consideration: | ||||||||||||
| Cash payments | $ | $ | $ | |||||||||
| Less: cash acquired | ( | ) | ( | ) | ||||||||
| Total | $ | $ | $ | |||||||||
| Identifiable assets acquired and liabilities assumed: | ||||||||||||
| Other acquired assets | $ | $ | $ | |||||||||
| Inventories | ||||||||||||
| Customer backlog | ( | ) | ||||||||||
| Property, plant, and equipment | ||||||||||||
| Identifiable intangible assets | ( | ) | ||||||||||
| Goodwill | ( | ) | ||||||||||
| Liabilities assumed | ( | ) | ( | ) | ||||||||
| Total | $ | $ | $ | |||||||||
Amran/Narayan Group
On October 28, 2024 (“Closing Date”), the Company acquired, in separate transactions,
Total consideration for Amran aggregated $
In accounting for the subsequent measurement of the redeemable noncontrolling interest measurement adjustments pursuant to ASC 480, Distinguishing Liabilities from Equity, the Company has made accounting policy elections to record any such applicable changes on the immediate recognition of the full adjustment required to report the redeemable noncontrolling interest at its redemption value, while also electing to record such adjustments under the income method, with a corresponding offset recorded to the Net income attributable to noncontrolling interests in consolidated subsidiaries within the consolidated statement of operations for the period in which such measurement adjustment becomes required. Given the pending approval of the RBI for the second closing and share swap, the noncontrolling interest is not probable of redemption as of June 30, 2025, and accordingly no measurement adjustments have been recorded for the year ended June 30, 2025.
Additionally, on October 28, 2024, as contemplated by the Narayan Purchase Agreement, the Company, Mold-Tech Singapore and the owners of the remaining ownership interest in Narayan, which was not acquired by the Company, entered into a Shareholders’ Agreement. The Shareholders’ Agreement provides the noncontrolling interest holders with certain put rights upon the expiration of the Share Swap Provision. The noncontrolling interest holders will have the right (but not an obligation) to transfer up to their remaining interest in Narayan for a period of years ("Put Option Period") to Mold-Tech Singapore. Subsequent to the expiration of the Put Option Period, Mold-Tech Singapore will have the right (but not an obligation) to acquire the remaining interest in Narayan for an additional year consecutive period.
The purchase price was allocated to the net tangible and identifiable intangible assets acquired and liabilities assumed and noncontrolling interest based on a valuation of their fair values on the Closing Date. Goodwill recorded from this transaction is attributable to Amran/Narayan Group’s technical and applications expertise, which is highly complementary to the Company's existing business.
Identifiable intangible assets of $
The following table summarizes the allocation of the aggregate total consideration for the Amran/Narayan Group to the estimated fair values of the tangible and identifiable intangible assets acquired and liabilities and noncontrolling interest assumed (in thousands):
| Preliminary Allocation as of December 31, 2024 | Adjustments | Preliminary Allocation as of June 30, 2025 | ||||||||||
| Fair value of business combination: | ||||||||||||
| Total cash consideration | $ | $ | $ | |||||||||
| Less: cash acquired | ) | ) | ||||||||||
| Stock consideration | - | |||||||||||
| Total | $ | $ | $ | |||||||||
| Identifiable assets acquired and liabilities assumed: | ||||||||||||
| Other acquired assets | $ | $ | $ | |||||||||
| Accounts receivable | ) | |||||||||||
| Inventories | ) | |||||||||||
| Customer backlog | ||||||||||||
| Property, plant, and equipment | ||||||||||||
| Identifiable intangible assets | ||||||||||||
| Goodwill | ) | |||||||||||
| Deferred tax liabilities, net | ) | ) | ) | |||||||||
| Other liabilities assumed | ) | ) | ||||||||||
| Total identifiable assets acquired and liabilities assumed | ||||||||||||
| Redeemable noncontrolling interest (see Note 18) | ) | - | ) | |||||||||
| Total identifiable assets, liabilities and redeemable noncontrolling interest | $ | $ | $ | |||||||||
The initial allocation of the purchase price is based upon a preliminary valuation, and accordingly, our estimates and assumptions are subject to change as we obtain additional information during the measurement period. The Company anticipates finalizing the purchase price allocation within 12 months from the acquisition date.
The following table reflects the unaudited pro forma operating results of the Company for the year ended June 30, 2025 and 2024, respectively, which give effect to the acquisition of the Amran/Narayan Group as if it had occurred effective July 1, 2023. The pro forma results are not necessarily indicative of the operating results that would have occurred had the acquisition been effective as of the date indicated, nor are they intended to be indicative of results that may occur in the future. The pro forma information does not include the effects of any synergies related to the Amran/Narayan Group acquisition, transactions between the entities prior to acquisition, or the pre-acquisition impact of other businesses acquired by the Company during this period as they were not material to the Company’s historical results of operations. Pro forma earnings during the periods presented were adjusted to include the following adjustments:
| Unaudited | ||||||||
| Year Ended June 30, | ||||||||
| (in thousands) | 2025 | 2024 | ||||||
| Net sales | $ | $ | ||||||
| Net income | ||||||||
| ● | Amortization of inventory step-up to fair value assuming inventory turns within a two-month period; |
| ● | Amortization of definite-lived intangible assets recognized at fair value that exceed one year as if acquired July 1, 2023; |
| ● | Non-recurring acquisition-related costs have been excluded from net income; |
| ● | Interest expense (including amortization of loan discount) on the Term Loan Credit Agreement entered into in connection with the acquisition as if the loan was obtained July 1, 2023. The interest rate assumed for purposes of the pro forma financial information was |
| ● | Income tax expense (benefit) was adjusted related to the above pro forma adjustments using an estimated tax rate of |
With respect to each of the McStarlite and Amran/Narayan Group acquisitions, the estimated fair values of the indefinite lived tradenames were determined based on an income approach using the relief from royalty method, which assumes that, in lieu of ownership, a third party would be willing to pay a royalty in order to exploit the related benefits of the tradenames assets. The cash flow projections the Company uses to estimate the fair value of the tradenames intangible assets involves several assumptions, including projected revenue growth, an estimated royalty rate, after-tax royalty savings expected from ownership of the tradenames, and a discount rate used to derive the estimated fair value of the tradenames. The estimated fair value of the customer relationships intangible assets were determined based on the income approach using the multi-period excess earnings method, which measures the economic benefit indirectly by calculating the income attributable to an asset after appropriate returns are paid to complementary assets used in conjunction with the subject asset to produce the earnings associated with the subject asset, commonly referred to as contributory asset charges. The fair value determination of the customer relationships intangible asset required us to make significant estimates and assumptions related to future cash flows and the selection of an appropriate discount rate to apply to future cash flows.
The Company incurred acquisition-related costs of $
From the date of acquisition, the Amran/Narayan Group has contributed $
Transactions with Related Parties of Amran/Narayan Group
The Amran/Narayan Group, acquired in the second quarter of fiscal year 2025, has certain transactions with parties affiliated with current and former shareholders of the Amran/Narayan Group, including the current President of the Amran/Narayan Group entities in India. The transactions with these parties continue and are summarized as follows:
| Names of related parties | Relationship with the Amran / Narayan Group |
| Narayan Epoxy Components Private Limited | Entity controlled by minority shareholders of Narayan |
| Gujarat Plug In Devices Private Limited | Narayan minority shareholders have significant ownership interest |
| Narayanshree Infrastructure LLP | Partners are former and current minority shareholders of Narayan |
| Relative of Narayan Minority Shareholders | Lessors of certain real property |
At June 30, 2025, $
Several of the Amran/Narayan Group leases in India are with Narayanshree Infrastructure LLP and directly with relatives of Narayan minority shareholders. Undiscounted cash flows expected to be paid for operating leases with related parties are as follows as of June 30, 2025:
| Fiscal year | Amount ($) |
| 2026 | |
| 2027 | |
| 2028 | |
| 2029 | |
| 2030 | |
| Thereafter | |
Nascent Technology
On November 18, 2024, the Company purchased all of the issued and outstanding equity interests of Nascent Technology Manufacturing, LLC ("Nascent") for $
Custom Biogenic Systems
On November 13, 2024, the Company purchases all of the issued and outstanding equity interests of Custom Biogenic Systems for $
SEPL
On May 3, 2024, the Company purchased all of the issued and outstanding equity interests of Sanyu Electric Pte Ltd, or SEPL, a privately held company for $
Minntronix
On July 31, 2023, the Company paid $
The purchase price was allocated to the net tangible and identifiable intangible assets acquired and liabilities assumed based on a valuation of their fair values on the closing date. Goodwill recorded from this transaction is attributable to Minntronix's technical and applications expertise, which is highly complementary to the Company's existing business.
Identifiable intangible assets of $
The components of the fair value of the Minntronix acquisition, including the final allocation of the purchase price are as follows (in thousands):
| Final Allocation as of September 30, 2024 | |||
| Fair value of business combination: | |||
| Cash payments | |||
| Less, cash acquired | |||
| Total | $ | ||
| Identifiable assets acquired and liabilities assumed: | |||
| Other acquired assets | $ | ||
| Customer backlog | |||
| Inventories | |||
| Property, plant, & equipment | |||
| Identifiable intangible assets | |||
| Goodwill | |||
| Liabilities assumed | |||
| Total | $ | ||
Sanyu
On February 19, 2024, the Company completed the purchase of all the issued and outstanding equity interests of Sanyu Switch Co., Ltd (Sanyu), a privately held company for $
The purchase price was allocated to the net tangible and identifiable intangible assets acquired and liabilities assumed based on a valuation of their fair values on the closing date. Goodwill recorded from this transaction is attributable to Sanyu's technical and applications expertise, which is highly complementary to the Company's existing business.
Identifiable intangible assets of $
The components of the fair value of the Sanyu acquisition, including the final allocation of the purchase price are as follows (in thousands):
| Final Allocation as of March 31, 2025 | |||
| Total purchase consideration: | |||
| Cash payments | $ | ||
| Holdbacks | |||
| Less cash acquired | |||
| Total | $ | ||
| Identifiable assets acquired and liabilities assumed: | |||
| Other acquired assets | $ | ||
| Inventories | |||
| Property, plant, and equipment | |||
| Identifiable intangible assets | |||
| Goodwill | |||
| Liabilities assumed | |||
| Total | $ | ||
Acquisition Related Expenses
Acquisition related expenses include costs related to acquired businesses and other pending acquisitions. These costs consist of (i) deferred compensation arrangements and (ii) acquisition related professional service fees and expenses, including financial advisory, legal, accounting, and other outside services incurred in connection with acquisition activities, and regulatory matters related to acquired entities. These costs do not include purchase accounting expenses, which the Company defines as acquired backlog and the step-up of inventory to fair value, or the amortization of the acquired intangible assets.
Acquisition related expenses were $
3. REVENUE FROM CONTRACTS WITH CUSTOMERS
Most of the Company’s contracts have a single performance obligation which represents the product or service being sold to the customer. Some contracts include multiple performance obligations such as a product and the related installation and/or extended warranty. Additionally, most of the Company’s contracts offer assurance type warranties in connection with the sale of a product to customers. Assurance type warranties provide a customer with assurance that the product complies with agreed-upon specifications. Assurance type warranties do not represent a separate performance obligation.
In general, the Company recognizes revenue at the point in time control transfers to its customer based on predetermined shipping terms. Revenue is recognized over time under certain long-term contracts within the Engineering Technologies and Engraving groups for highly customized customer products that have no alternative use and in which the contract specifies the Company has a right to payment for its costs, plus a reasonable margin. For products manufactured over time, the transfer of control is measured pro rata, based upon current estimates of costs to complete such contracts. Losses on contracts are fully recognized in the period in which the losses become determinable. Revisions in profit estimates are reflected on a cumulative basis in the period in which the basis for such revision becomes known.
Disaggregation of Revenue from Contracts with Customers
The following table presents revenue disaggregated by product line and segment (in thousands):
| Year Ended | ||||||||||||
| June 30, 2025 | June 30, 2024 | June 30, 2023 | ||||||||||
| Electronics | ||||||||||||
| Engineering Technologies | ||||||||||||
| Scientific | ||||||||||||
| Engraving Services | ||||||||||||
| Engraving Products | ||||||||||||
| Total Engraving | ||||||||||||
| Hydraulics Cylinders and System | ||||||||||||
| Merchandising & Display | ||||||||||||
| Pumps | ||||||||||||
| Total Specialty Solutions | ||||||||||||
| Total revenue by product line | $ | $ | $ | |||||||||
The following table presents revenue from continuing operations disaggregated by geography based on company’s locations (in thousands):
| Year Ended | ||||||||||||
| Net sales | June 30, 2025 | June 30, 2024 | June 30, 2023 | |||||||||
| United States | $ | $ | $ | |||||||||
| Asia Pacific | ||||||||||||
| EMEA (1) | ||||||||||||
| Other Americas | ||||||||||||
| Total | $ | $ | $ | |||||||||
(1) EMEA consists primarily of Europe, Middle East and S. Africa.
The following table presents revenue from continuing operations disaggregated by timing of recognition (in thousands):
| Year Ended | ||||||||||||
| Timing of Revenue Recognition | June 30, 2025 | June 30, 2024 | June 30, 2023 | |||||||||
| Products and services transferred at a point in time | $ | $ | $ | |||||||||
| Products transferred over time | ||||||||||||
| Net sales | $ | $ | $ | |||||||||
Contract Balances
Contract assets represent sales recognized in excess of billings related to work completed but not yet shipped for which revenue is recognized over time. Contract assets are recorded as prepaid expenses and other current assets. Contract liabilities are customer deposits for which revenue has not been recognized. Current contract liabilities are recorded as accrued liabilities.
The timing of revenue recognition, invoicing and cash collections results in billed receivables, contract assets and contract liabilities on the consolidated balance sheets.
When consideration is received from a customer prior to transferring goods or services to the customer under the terms of a contract, a contract liability is recorded. Contract liabilities are recognized as revenue after control of the goods and services are transferred to the customer and all revenue recognition criteria have been met.
The following table provides information about contract assets and liability balances (in thousands):
| Year ended June 30, 2025 | Balance at Beginning of Period | Additions | Deductions | Balance at End of Period | ||||||||||||
| Contract assets: | ||||||||||||||||
| Contract assets | $ | $ | ||||||||||||||
| Contract liabilities: | ||||||||||||||||
| Customer deposits | $ | $ |
| Year ended June 30, 2024 | Balance at Beginning of Period | Additions | Deductions | Balance at End of Period | ||||||||||||
| Contract assets: | ||||||||||||||||
| Prepaid expenses and other current assets | $ | $ | ||||||||||||||
| Contract liabilities: | ||||||||||||||||
| Customer deposits | $ | $ |
We recognized the following revenue which was included in the contract liability beginning balances (in thousands):
| Year ended | ||||
| Revenue recognized in the period from: | June 30, 2025 | |||
| Amounts included in the contract liability balance at the beginning of the year | $ | |||
| Year ended | ||||
| Revenue recognized in the period from: | June 30, 2024 | |||
| Amounts included in the contract liability balance at the beginning of the year | $ | |||
| Year ended | ||||
| Revenue recognized in the period from: | June 30, 2023 | |||
| Amounts included in the contract liability balance at the beginning of the year | $ | |||
4. Inventories
Inventories are comprised of (in thousands):
| June 30 | 2025 | 2024 | ||||||
| Raw materials | $ | $ | ||||||
| Work in process | ||||||||
| Finished goods | ||||||||
| Total | $ | $ | ||||||
Distribution costs associated with the sale of inventory are recorded as a component of selling, general and administrative expenses and were $
5. Property, plant and equipment
Property, plant and equipment consist of the following (in thousands):
| June 30 | 2025 | 2024 | ||||||
| Land, buildings and leasehold improvements | $ | $ | ||||||
| Machinery, equipment and other | ||||||||
| Total | ||||||||
| Less accumulated depreciation | ( | ) | ( | ) | ||||
| Property, plant and equipment, net | $ | $ | ||||||
Depreciation expense totaled $
6. Goodwill
Goodwill and certain indefinite-lived intangible assets are not amortized, but instead are tested for impairment at least annually and more frequently whenever events or changes in circumstances indicate that the fair value of the asset may be less than its carrying amount. The Company’s annual test for impairment is performed using a May 31st measurement date.
The Company has identified
As quoted market prices are not available for the Company’s reporting units, the fair value of the reporting units is determined using a discounted cash flow model (income approach). This method uses various assumptions that are specific to each individual reporting unit in order to determine the fair value. In addition, the Company compares the estimated aggregate fair value of its reporting units to its overall market capitalization.
While the Company believes that estimates of future cash flows are reasonable, changes in assumptions could significantly affect valuations and result in impairments in the future. The most significant assumption involved in the Company’s determination of fair value is the cash flow projections of each reporting unit. If the estimates of future cash flows for each reporting unit may be insufficient to support the carrying value of the reporting units, the Company will reassess its conclusions related to fair value and the recoverability of goodwill.
The Company completed its annual impairment testing as of May 31, in each of the last three fiscal years and determined that the fair value of each of its reporting units substantially exceeded each unit’s respective carrying value, therefore, no impairment charges were recorded in connection with the testing and assessment.
Changes to goodwill by segment associated with continuing operations during the fiscal year is as follows (in thousands):
| June 30, 2024 | Acquisitions | Impairments | Translation Adjustment | June 30, 2025 | ||||||||||||||||
| Electronics | $ | $ | $ | $ | $ | |||||||||||||||
| Engineering Technologies | ||||||||||||||||||||
| Scientific | ||||||||||||||||||||
| Engraving | ||||||||||||||||||||
| Specialty Solutions | ||||||||||||||||||||
| Total | $ | $ | $ | $ | $ | |||||||||||||||
7. Intangible Assets
Intangible assets consist of the following (in thousands):
| Tradenames | ||||||||||||||||||||
| Customer | (Indefinite- | Developed | ||||||||||||||||||
| Relationships | lived) | Technology | Other | Total | ||||||||||||||||
| June 30, 2025 | ||||||||||||||||||||
| Cost | $ | $ | $ | $ | $ | |||||||||||||||
| Accumulated amortization | ( | ) | ( | ) | ( | ) | ( | ) | ||||||||||||
| Balance, June 30, 2025 | $ | $ | $ | $ | $ | |||||||||||||||
| June 30, 2024 | ||||||||||||||||||||
| Cost | $ | $ | $ | $ | $ | |||||||||||||||
| Accumulated amortization | ( | ) | ( | ) | ( | ) | ( | ) | ||||||||||||
| Balance, June 30, 2024 | $ | $ | $ | $ | $ | |||||||||||||||
Amortization expense from continuing operations totaled $
At June 30, 2025, aggregate amortization expense is estimated to be (in thousands):
| 2026 | $ | |||
| 2027 | ||||
| 2028 | ||||
| 2029 | ||||
| 2030 | ||||
| Thereafter | ||||
| Total | $ |
8. Debt
Long-term debt is comprised of the following at June 30 (in thousands):
| 2025 | 2024 | |||||||
| Bank credit agreements | $ | $ | ||||||
| Total funded debt | ||||||||
| Issuance cost | ( | ) | ( | ) | ||||
| Total long-term debt | $ | $ | ||||||
The Company's long-term debt matures in February 2028.
During the third quarter of fiscal year 2023, the Company entered into a Third Amended & Restated Credit Agreement which renewed the existing Credit Agreement for an additional -year period (“Credit Facility”, or “facility”). The facility had a borrowing limit of $
During the second quarter of fiscal year 2025, the Company entered into a $
Funds borrowed under the facility may be used for the repayment of debt, working capital, capital expenditures, acquisitions (so long as certain conditions, including a specified funded debt to EBITDA leverage ratio is maintained), and other general corporate purposes. As of June 30, 2025, the Company had standby letters of credit outstanding, primarily for insurance purposes, of $
Interest Coverage Ratio - The Company is required to maintain a ratio of Earnings Before Interest and Taxes, as Adjusted (“Adjusted EBIT per the Credit Facility”), to interest expense for the trailing twelve months of at least Adjusted EBIT per the Credit Facility specifically excludes extraordinary and certain other defined items such as cash restructuring and acquisition related charges up to the lower of $
Leverage Ratio- The Company’s ratio of funded debt to trailing twelve month Adjusted EBITDA per the Credit Facility, calculated as Adjusted EBIT per the Credit Facility plus depreciation and amortization, may not exceed Under certain circumstances in connection with a Material Acquisition (as defined in the Facility), the Facility allows for the leverage ratio to go as high as for a four-fiscal quarter period. At June 30, 2025, the Company’s Leverage Ratio was Our primary sources of cash for these requirements are cash flows from continuing operations and borrowings under the facility.
At June 30, 2025, the effective rate of interest on the outstanding borrowings was
9. Accrued LIABILITIES
Accrued liabilities recorded in our consolidated balance sheets at June 30, 2025 and 2024 consist of the following (in thousands):
| 2025 | 2024 | |||||||
| Payroll and employee benefits | $ | $ | ||||||
| Operating lease current | ||||||||
| Accrued interest | ||||||||
| Accrued taxes payable | ||||||||
| Warranty reserves | ||||||||
| Professional fees | ||||||||
| Restructuring costs | ||||||||
| Workers' compensation | ||||||||
| Contingent consideration | ||||||||
| Other | ||||||||
| Total | $ | $ | ||||||
10. Derivative Financial Instruments
Interest Rate Swaps
The fair value of the swaps recognized in accrued liabilities and in other comprehensive income (loss) is as follows (in thousands):
| Effective Date | Notional | Fixed | Maturity | Fair Value at June 30, | ||||||||||||
| Amount | Interest Rate | 2025 | 2024 | |||||||||||||
| February 23, 2023 | |
| $ | $ | ||||||||||||
| May 25, 2023 | |
| ||||||||||||||
| February 24, 2023 | |
| ||||||||||||||
| $ | - | $ | ||||||||||||||
The Company reported losses for the years ended June 30, 2025, 2024, and 2023, as a result of hedge ineffectiveness. Future changes in these swap arrangements, including termination of the agreements, may result in a reclassification of any gain or loss reported in accumulated other comprehensive income (loss) into earnings as an adjustment to interest expense. Accumulated other comprehensive income (loss) related to these instruments is being amortized into interest expense concurrent with the hedged exposure.
Foreign Exchange Contracts
Forward foreign currency exchange contracts are used to limit the impact of currency fluctuations on certain anticipated foreign cash flows, such as sales to foreign customers and loan payments between subsidiaries. The Company enters into such contracts for hedging purposes only. The Company has designated certain of these currency contracts as hedges, and changes in the fair value of these contracts are recognized in other comprehensive income until the hedged items are recognized in earnings. Hedge ineffectiveness, if any, associated with these contracts will be reported in net income. At June 30, 2025 and 2024, the Company had outstanding forward contracts related to hedges of intercompany loans that had an immaterial amount of net unrealized loss. The contracts have maturity dates in fiscal year 2025, which correspond to the related intercompany loans. The notional amounts of these instruments, by currency in thousands, are as follows:
| Currency | 2025 | 2024 | ||||||
| USD | ||||||||
| CAD | ||||||||
| JPY | ||||||||
The table below presents the fair value of derivative financial instruments as well as their classification on the balance sheet at June 30, (in thousands):
| Asset Derivatives | ||||||||||
| 2025 | 2024 | |||||||||
| Derivative designated as hedging instruments | Balance Sheet Line Item | Fair Value | Balance Sheet Line Item | Fair Value | ||||||
| Interest rate swaps | Prepaid expenses and other current assets | $ | Prepaid expenses and other current assets | $ | ||||||
| $ | - | $ | ||||||||
The table below presents the amount of gain (loss) recognized in comprehensive income on our derivative financial instruments (effective portion) designated as hedging instruments and their classification within comprehensive income for the periods ended (in thousands):
| 2025 | 2024 | 2023 | ||||||||||
| Interest rate swaps | $ | $ | $ | |||||||||
| Foreign exchange contracts | ( | ) | ||||||||||
| $ | $ | $ | ||||||||||
The table below presents the amount reclassified from accumulated other comprehensive income (loss) to net income for the periods ended (in thousands):
| Details about Accumulated Other Comprehensive Income (Loss) Components | 2025 | 2024 | 2023 | Affected line item in the Statements of Operations | |||||||||
| Interest rate swaps | ( | ) | ( | ) | ( | ) | Interest expense | ||||||
| Foreign exchange contracts | ( | ) | Other non-operating income | ||||||||||
| $ | ( | ) | $ | ( | ) | $ | ( | ) | |||||
11. Income Taxes
The components of income from continuing operations before income taxes are as follows (in thousands):
| 2025 | 2024 | 2023 | ||||||||||
| U.S. Operations | ( | ) | $ | $ | ||||||||
| Non-U.S. Operations | ||||||||||||
| Total | $ | $ | $ | |||||||||
The Company utilizes the asset and liability method of accounting for income taxes. Deferred income taxes are determined based on the estimated future tax effects of differences between the financial and tax bases of assets and liabilities given the provisions of the enacted tax laws. The components of the provision for income taxes on continuing operations (in thousands) were as shown below:
| 2025 | 2024 | 2023 | ||||||||||
| Current: | ||||||||||||
| Federal | $ | ( | ) | $ | $ | |||||||
| State | ||||||||||||
| Non-U.S. | ||||||||||||
| Total Current | $ | $ | $ | |||||||||
| Deferred: | ||||||||||||
| Federal | $ | ( | ) | $ | ( | ) | $ | ( | ) | |||
| State | ( | ) | ( | ) | ( | ) | ||||||
| Non-U.S. | ( | ) | ( | ) | ||||||||
| Total Deferred | ( | ) | ( | ) | ( | ) | ||||||
| Total | $ | $ | $ | |||||||||
A reconciliation from the U.S. Federal income tax rate on continuing operations to the total tax provision is as follows:
| 2025 | 2024 | 2023 | ||||||||||
| Provision at statutory tax rate | % | % | % | |||||||||
| State taxes | % | % | % | |||||||||
| Impact of foreign operations | % | % | ( | %) | ||||||||
| Federal tax credits | % | ( | %) | ( | %) | |||||||
| Cash repatriation | % | % | % | |||||||||
| SubF/GILTI | % | % | % | |||||||||
| Uncertain Tax Positions | % | % | ( | )% | ||||||||
| Officers compensation | % | % | % | |||||||||
| Share-based compensation | % | ( | %) | ( | %) | |||||||
| Return to provision | % | % | ( | %) | ||||||||
| Valuation allowance release | % | % | ( | %) | ||||||||
| Tax expense on Procon Pumps disposal | % | % | % | |||||||||
| Other | % | ( | %) | ( | %) | |||||||
| Effective income tax provision | % | % | % | |||||||||
Changes in the effective tax rates from period to period may be significant as they depend on many factors including, but not limited to, size of the Company’s income or loss and any one-time activities occurring during the period.
The income tax provision from continuing operations for the fiscal year ended June 30, 2025 was impacted by the following items: (i) a tax provision of $
The income tax provision from continuing operations for the fiscal year ended June 30, 2024 was impacted by the following items: (i) a tax provision of $
The income tax provision from continuing operations for the fiscal year ended June 30, 2023 was impacted by the following items: (i) a tax benefit of $
Significant components of the Company’s deferred income taxes are as follows (in thousands):
| 2025 | 2024 | |||||||
| Deferred tax liabilities: | ||||||||
| Depreciation and amortization | $ | ( | ) | $ | ( | ) | ||
| Withholding taxes | ( | ) | ( | ) | ||||
| Other | ( | ) | ||||||
| Operating lease right-of-use-asset | ( | ) | ( | ) | ||||
| Total deferred tax liability | $ | ( | ) | $ | ( | ) | ||
| Deferred tax assets: | ||||||||
| Accrued compensation | $ | $ | ||||||
| Accrued expenses and reserves | ( | ) | ||||||
| Pension | ||||||||
| Inventory | ||||||||
| Lease liabilities | ||||||||
| Section 174 Capitalization | ||||||||
| Other | ||||||||
| Net operating loss and credit carry forwards | ||||||||
| Total deferred tax asset | $ | $ | ||||||
| Less: Valuation allowance | ( | ) | ( | ) | ||||
| Net deferred tax asset (liability) | $ | ( | ) | $ | ||||
The Company estimates the degree to which deferred tax assets, including net operating loss and credit carry forwards will result in a benefit based on expected profitability by tax jurisdiction and provides a valuation allowance for tax assets and loss carry forwards that it believes will more likely than not go unrealized. The valuation allowance at June 30, 2025 applies to federal capital loss, state loss, foreign loss, and state R&D credit carryforwards, which management has concluded that it is more likely than not that these tax benefits will not be realized. The increase (decrease) in the valuation allowance from the prior year was due to the current year activity in those same federal, state and foreign jurisdictions.
As of June 30, 2025, the Company had gross state net operating loss ("NOL") and credit carry forwards of approximately $
Under ASU 2016-09, Improvements to Employee Share-Based Payment Accounting, all excess tax benefits and tax deficiencies are recognized as income tax expense or benefit in the statement of operations. Accordingly, we recorded an income tax benefit in the consolidated statement of operation of $
U.S. tax law allows a 100% dividend received deduction for foreign dividends and the Company has begun to bring back cash from foreign subsidiaries. However, the permanent reinvestment assertion must still be assessed and made regarding potential liabilities for foreign withholding taxes. As of June 30, 2025, the Company maintained the assessment that previously undistributed earnings of certain foreign subsidiaries no longer meet the requirements for indefinite reinvestment under applicable accounting guidance. Therefore, the Company recognized deferred tax liabilities of approximately $
The total provision (benefit) for income taxes included in the consolidated financial statements was as follows (in thousands):
| 2025 | 2024 | 2023 | ||||||||||
| Continuing operations | $ | $ | $ | |||||||||
| Discontinued operations | ( | ) | ( | ) | ( | ) | ||||||
| Total provision (benefit) | $ | $ | $ | |||||||||
The changes in the amount of gross unrecognized tax benefits were as follows (in thousands):
| 2025 | 2024 | 2023 | ||||||||||
| Beginning Balance | $ | $ | $ | |||||||||
| Additions based on tax positions related to the current year | ||||||||||||
| Additions for tax positions of prior years | ||||||||||||
| Reductions for tax positions of prior years | ( | ) | ||||||||||
| Statute lapses | ( | ) | ( | ) | ||||||||
| Ending Balance | $ | $ | $ | |||||||||
At June 30, 2025, we had $
If the unrecognized tax benefits in the table above were recognized in a future period, $
Within the next twelve months, the statute of limitations will close in various U.S., state and non-U.S. jurisdictions. The following tax years, in the major tax jurisdictions noted, are open for assessment or refund:
| Country | Years Ending June 30, | |||
| United States | to | |||
| Canada | to | |||
| Germany | to | |||
| Ireland | 2024 to 2025 | |||
| Portugal | to | |||
| United Kingdom | to | |||
On July 4, 2025, the U.S. government enacted The One Big Beautiful Bill Act of 2025 which includes, among other provisions, changes to the U.S. corporate income tax system including the allowance of immediate expensing of qualifying research and development expenses and permanent extensions of certain provisions within the Tax Cuts and Jobs Act. Certain provisions are effective for the company beginning fiscal 2026. We are evaluating the future impact of these tax law changes on our financial statements.
The Organization for Economic Co-operation and Development (OECD) and the G20 Inclusive Framework on Base Erosion and Profit Shifting (the "Inclusive Framework") have put forth Pillar Two proposals that ensure a minimal level of taxation. Several countries in which the Company operates, including several European Union member states, have adopted domestic legislation to implement the Inclusive Framework's global corporate minimum tax rate of fifteen percent. This legislation became effective for the Company beginning July 1, 2024. Based on the Company's analysis of Pillar Two provisions, these tax law changes did not have a material impact on the Company's financial statements for fiscal 2025.
12. CONTINGENCIES
From time to time, the Company is subject to various claims and legal proceedings, including claims related to environmental remediation, either asserted or unasserted, that arise in the ordinary course of business. While the outcome of these proceedings and claims cannot be predicted with certainty, the Company’s management does not believe that the outcome of any of the currently existing legal matters will have a material impact on the Company’s consolidated financial position, results of operations or cash flow. The Company accrues for losses related to a claim or litigation when the Company’s management considers a potential loss probable and can reasonably estimate such potential loss.
13. stock-based compensation and purchase plans
Stock-Based Compensation Plans
Under incentive compensation plans, the Company is authorized to make grants of stock options, restricted stock and performance share units to provide equity incentive compensation to key employees and directors. The stock award program offers employees and directors the opportunity to earn shares of our stock over time, rather than options that give the employees and directors the right to purchase stock at a set price. The Company has stock plans for directors, officers and certain key employees. The Company uses shares acquired through treasury stock repurchases for the issuance of shares of common stock for the settlement of awards under its stock-based compensation plans.
Total compensation cost recognized in the consolidated statement of operations for equity based compensation awards was $
There were
Restricted Stock Awards
The Company may award shares of restricted stock to eligible employees and non-employee directors of the Company at no cost, giving them, in most instances, all of the rights of stockholders, except that they may not sell, assign, pledge or otherwise encumber such shares and rights during the restriction period. Such shares and rights are subject to forfeiture if certain employment conditions are not met. During the restriction period, recipients of the shares are entitled to dividend equivalents on such shares, providing that such shares are not forfeited. Dividends are accumulated and paid out at the end of the restriction period. Restrictions on non-vested stock awards generally lapse between fiscal year 2025 and fiscal year 2027. Compensation expense related to stock awards recognized was $
A summary of restricted stock awards activity is as follows:
| Restricted Stock Awards | ||||||||
| Weighted | ||||||||
| Number | Average | |||||||
| of | Grant Date | |||||||
| Shares | Fair Value | |||||||
| Outstanding, June 30, 2024 | $ | |||||||
| Granted | ||||||||
| Vested | ( | ) | ||||||
| Canceled | ( | ) | ||||||
| Outstanding, June 30, 2025 | $ | |||||||
Restricted stock awards granted during fiscal years 2024 and 2023 had a weighted average grant date fair value of $
As of June 30, 2025, there was $
Executive Compensation Program
The Company operates a compensation program for key employees. The plan contains both an annual component as well as a long-term component. Under the annual component, participants may elect to defer up to
Dividend equivalents are accumulated and paid out at the end of the restriction period. The restrictions on the units expire after years. Restrictions on non-vested annual component awards generally lapse between fiscal year 2025 and fiscal year 2027. The compensation expense associated with this incentive program is charged to income over the restriction period. The Company recorded compensation expense related to this program of $
As of June 30, 2025, there was $
The fair value of the awards under the annual component of this incentive program is measured using the Black-Scholes option-pricing model. Key assumptions used to apply this pricing model are as follows:
| 2025 | 2024 | 2023 | ||||||||||
| Risk-free interest rates | % | % | % | |||||||||
| Expected life of option grants (in years) | ||||||||||||
| Expected volatility of underlying stock | % | % | % | |||||||||
| Expected quarterly dividends (per share) | $ | $ | $ | |||||||||
Under the long-term component, grants of performance share units (“PSUs”) are made annually to key employees and the share units are earned based on the achievement of certain overall corporate financial performance targets over the performance period. At the end of the performance period, the number of shares of common stock issued will be determined by adjusting upward or downward from the target in a range between
A participant’s right to any shares that are earned will cliff vest in three years. An executive whose employment terminates prior to the vesting of any award for a reason other than death, disability, retirement, or following a change in control, will forfeit the shares represented by that award. In certain circumstances, such as death, disability, or retirement, PSUs are paid on a pro-rata basis. In the event of a change in control, vesting of the awards granted is accelerated.
A summary of the awards activity under the executive compensation program is as follows:
| Annual Component | Performance Stock Units | |||||||||||||||||||
| Weighted | Weighted | |||||||||||||||||||
| Number | Average | Aggregate | Number | Average | ||||||||||||||||
| of | Exercise | Intrinsic | of | Grant Date | ||||||||||||||||
| Shares | Price | Value | Shares | Fair Value | ||||||||||||||||
| Non-vested, June 30, 2024 | $ | $ | $ | |||||||||||||||||
| Granted | ||||||||||||||||||||
| Exercised / vested | ( | ) | $ | ( | ) | |||||||||||||||
| Forfeited | ( | ) | ( | ) | ||||||||||||||||
| Non-vested, June 30, 2025 | $ | $ | $ | |||||||||||||||||
Restricted stock awards granted under the annual component of this program in fiscal years 2025, 2024, and 2023 had a weighted average grant date fair value of $
The Company recognized compensation expense related to the PSUs of $
Employee Stock Purchase Plan
The Company has an Employee Stock Purchase Plan that allows employees to purchase shares of common stock of the Company at a discount from the market each quarter. The ESPP plan, which was effective as of July 1, 2005, provided employees the option to purchase Standex stock at a discount of
14. Accumulated Other Comprehensive Income (LosS)
The components of the Company’s accumulated other comprehensive income (loss) are as follows (in thousands):
| 2025 | 2024 | 2023 | ||||||||||
| Foreign currency translation adjustment | $ | ( | ) | $ | ( | ) | $ | ( | ) | |||
| Unrealized pension (losses), net of tax | ( | ) | ( | ) | ( | ) | ||||||
| Unrealized (losses) gains on derivative instruments, net of tax | ||||||||||||
| Total accumulated other comprehensive income | $ | ( | ) | $ | ( | ) | $ | ( | ) | |||
15. restructuring
The Company has undertaken a number of initiatives that have resulted in severance, restructuring, and related charges. Restructuring liabilities are included in accrued liabilities on the consolidated balance sheet. A summary of charges by initiative is as follows (in thousands):
| Involuntary Employee | ||||||||||||
| Severance and | ||||||||||||
| Year Ended June 30, | Benefit Costs | Other | Total | |||||||||
| 2025 Restructuring Initiatives | $ | $ | $ | |||||||||
| Prior Year Initiatives | ||||||||||||
| Total expense | $ | $ | $ | |||||||||
| 2024 Restructuring Initiatives | $ | $ | $ | |||||||||
| Prior Year Initiatives | ||||||||||||
| Total expense | $ | $ | $ | |||||||||
| 2023 Restructuring Initiatives | $ | $ | $ | |||||||||
| Prior Year Initiatives | ||||||||||||
| Total expense | $ | $ | $ | |||||||||
2025 Restructuring Initiatives
The Company continues to focus our efforts to reduce cost and improve productivity across our businesses, particularly through headcount reductions, facility closures, and consolidations. Restructuring expenses primarily related to headcount reductions and other cost saving initiatives. During fiscal year 2025, we also incurred restructuring expenses related to third party assistance with analysis and implementation of these activities.
| Involuntary Employee | ||||||||||||
| Severance and | ||||||||||||
| Current Year Initiatives | Benefit Costs | Other | Total | |||||||||
| Restructuring liabilities at June 30, 2024 | $ | $ | $ | |||||||||
| Additions and adjustments | ||||||||||||
| Payments | ( | ) | ( | ) | ( | ) | ||||||
| Restructuring liabilities at June 30, 2025 | $ | $ | $ | |||||||||
Prior Year Restructuring Initiatives
The Company continues to focus our efforts to reduce cost and improve productivity across our businesses, particularly through headcount reductions, facility closures, and consolidations. During fiscal years 2024 and 2023, the Company also incurred restructuring expenses related to headcount reductions, facility rationalization and third party assistance with analysis and implementation of these activities.
The Company expects to incur additional restructuring costs of approximately $
Activity in the reserves related to prior year restructuring initiatives is as follows (in thousands):
| Involuntary Employee | ||||||||||||
| Severance and | ||||||||||||
| Prior Year Initiatives | Benefit Costs | Other | Total | |||||||||
| Restructuring liabilities at June 30, 2024 | $ | $ | $ | |||||||||
| Additions and adjustments | ||||||||||||
| Payments | ( | ) | ( | ) | ( | ) | ||||||
| Restructuring liabilities at June 30, 2025 | $ | $ | $ | |||||||||
Activity in the reserves in fiscal year 2024 (in thousands):
| Involuntary Employee | ||||||||||||
| Severance and | ||||||||||||
| Benefit Costs | Other | Total | ||||||||||
| Restructuring liabilities at June 30, 2023 | $ | $ | $ | |||||||||
| Additions and adjustments | ||||||||||||
| Payments | ( | ) | ( | ) | ( | ) | ||||||
| Restructuring liabilities at June 30, 2024 | $ | $ | $ | |||||||||
The Company’s total restructuring expenses by segment are as follows (in thousands):
| Involuntary Employee | ||||||||||||
| Severance and | ||||||||||||
| Benefit Costs | Other | Total | ||||||||||
| Fiscal Year 2025 | ||||||||||||
| Electronics | $ | $ | $ | |||||||||
| Engraving | ||||||||||||
| Corporate and Other | ||||||||||||
| Total expense | $ | $ | $ | |||||||||
| Fiscal Year 2024 | ||||||||||||
| Electronics | $ | $ | $ | |||||||||
| Engineering Technologies | ||||||||||||
| Engraving | ||||||||||||
| Corporate and Other | ||||||||||||
| Total expense | $ | $ | $ | |||||||||
| Fiscal Year 2023 | ||||||||||||
| Electronics | $ | $ | $ | |||||||||
| Scientific | ||||||||||||
| Engraving | ||||||||||||
| Specialty Solutions | ||||||||||||
| Corporate and Other | ||||||||||||
| Total expense | $ | $ | $ | |||||||||
16. Employee Benefit Plans
Retirement Plans
The Company has defined benefit pension plans covering certain current and former employees both inside and outside of the U.S. The Company’s pension plan for U.S. employees is frozen for substantially all employees and participants in the plan have ceased accruing future benefits. Obligations under the Company's defined benefit plan operated in Ireland have been transferred to the buyer of the Procon business as part of the divestiture in fiscal year 2023. Obligations under the unfunded defined benefit plan operated by the Sanyu business in Japan were transferred to the Company as of the date of acquisition in the third quarter of fiscal year 2024.
Net periodic benefit cost for U.S. and non-U.S. plans included the following components (in thousands):
| U.S. Plans | Foreign Plans | |||||||||||||||||||||||
| Year Ended June 30, | Year Ended June 30, | |||||||||||||||||||||||
| 2025 | 2024 | 2023 | 2025 | 2024 | 2023 | |||||||||||||||||||
| Service Cost | $ | $ | $ | $ | $ | $ | ||||||||||||||||||
| Interest Cost | ||||||||||||||||||||||||
| Expected return on plan assets | ( | ) | ( | ) | ( | ) | ( | ) | ( | ) | ( | ) | ||||||||||||
| Recognized net actuarial loss | ( | ) | ( | ) | ||||||||||||||||||||
| Amortization of prior service cost (benefit) | ( | ) | ( | ) | ( | ) | ||||||||||||||||||
| Net periodic benefit cost (benefit) | $ | $ | $ | $ | $ | ( | ) | $ | ||||||||||||||||
The following table sets forth the funded status and amounts recognized as of June 30, 2025 and 2024 for our U.S. and foreign defined benefit pension plans (in thousands):
| U.S. Plans | Foreign Plans | |||||||||||||||
| Year Ended June 30, | Year Ended June 30, | |||||||||||||||
| 2025 | 2024 | 2025 | 2024 | |||||||||||||
| Change in benefit obligation | ||||||||||||||||
| Benefit obligation at beginning of year | $ | $ | $ | $ | ||||||||||||
| Service cost | ||||||||||||||||
| Interest cost | ||||||||||||||||
| Plan settlements | ( | ) | ||||||||||||||
| Actuarial gain | ( | ) | ( | ) | ||||||||||||
| Benefits paid | ( | ) | ( | ) | ( | ) | ( | ) | ||||||||
| Foreign currency exchange rate & other changes | ||||||||||||||||
| Projected benefit obligation at end of year | $ | $ | $ | $ | ||||||||||||
| Change in plan assets | ||||||||||||||||
| Fair value of plan assets at beginning of year | $ | $ | $ | $ | ||||||||||||
| Actual return on plan assets | ||||||||||||||||
| Employer contribution | ||||||||||||||||
| Benefits paid | ( | ) | ( | ) | ( | ) | ( | ) | ||||||||
| Foreign currency exchange rate & other changes | ( | ) | ||||||||||||||
| Fair value of plan assets at end of year | $ | $ | $ | $ | ||||||||||||
| Funded Status | $ | ( | ) | $ | ( | ) | $ | ( | ) | $ | ( | ) | ||||
| Amounts recognized in the consolidated balance sheets consist of: | ||||||||||||||||
| Prepaid benefit cost | $ | $ | $ | $ | ||||||||||||
| Current liabilities | ( | ) | ( | ) | ( | ) | ( | ) | ||||||||
| Non-current liabilities | ( | ) | ( | ) | ( | ) | ( | ) | ||||||||
| Net amount recognized | $ | ( | ) | $ | ( | ) | $ | ( | ) | $ | ( | ) | ||||
| Unrecognized net actuarial loss | $ | $ | $ | $ | ||||||||||||
| Unrecognized prior service cost | ( | ) | ( | ) | ||||||||||||
| Accumulated other comprehensive income, pre-tax | $ | $ | $ | $ | ||||||||||||
The accumulated benefit obligation for all defined benefit pension plans was $
The estimated actuarial net loss for the defined benefit pension plans that will be amortized from accumulated other comprehensive income into net periodic benefit cost over the next fiscal year is $
Plan Assets and Assumptions
The fair values of the Company’s pension plan assets at June 30, 2025 and 2024 by asset category, as classified in the three levels of inputs described in Note 1 under the caption Fair Value of Financial Instruments, are as follows (in thousands):
| June 30, 2025 | ||||||||||||||||
| Total | Level 1 | Level 2 | Level 3 | |||||||||||||
| Cash and cash equivalents | $ | $ | $ | $ | ||||||||||||
| Common and preferred stocks | ||||||||||||||||
| Corporate bonds and other fixed income securities | ||||||||||||||||
| Other | ||||||||||||||||
| $ | $ | $ | ||||||||||||||
| June 30, 2024 | ||||||||||||||||
| Total | Level 1 | Level 2 | Level 3 | |||||||||||||
| Cash and cash equivalents | $ | $ | $ | $ | ||||||||||||
| Common and preferred stocks | ||||||||||||||||
| Corporate bonds and other fixed income securities | ||||||||||||||||
| Other | ||||||||||||||||
| $ | $ | $ | ||||||||||||||
Asset allocation and target asset allocations are as follows:
| U.S. Plans | Foreign Plans | |||||||||||||||
| Year Ended June 30, | Year Ended June 30, | |||||||||||||||
| Asset Category | 2025 | 2024 | 2025 | 2024 | ||||||||||||
| Equity securities | | | | | ||||||||||||
| Debt securities | | | | | ||||||||||||
| Global balanced securities | | | | | ||||||||||||
| Other | | | | | ||||||||||||
| Total | | | | | ||||||||||||
| 2025 | ||||||||
| Asset Category – Target | U.S. | U.K. | ||||||
| Equity securities | | | ||||||
| Debt and market neutral securities | | | ||||||
| Global balanced securities | | | ||||||
| Other | | | ||||||
| Total | | | ||||||
Our investment policy for the U.S. pension plans targets a range of exposure to the various asset classes. Standex rebalances the portfolio periodically when the allocation is not within the desired range of exposure. The plan seeks to provide returns in excess of the various benchmarks. The benchmarks include the following indices: S&P 500; Citigroup PMI EPAC; Citigroup World Government Bond and Barclays Aggregate Bond. A third-party investment consultant tracks the plan’s portfolio relative to the benchmarks and provides quarterly investment reviews which consist of a performance and risk assessment on all investment managers and on the portfolio.
Certain managers within the plan use, or have authorization to use, derivative financial instruments for hedging purposes, the creation of market exposures and management of country and asset allocation exposure. Currency speculation derivatives are strictly prohibited.
| Year Ended June 30 | 2025 | 2024 | 2023 | ||||
| Plan assumptions - obligations | |||||||
| Discount rate | |||||||
| Rate of compensation increase | |||||||
| Plan assumption - cost | |||||||
| Discount rate | |||||||
| Expected return on assets | |||||||
| Rate of compensation increase | |||||||
Included in the above are the following assumptions relating to the obligations for defined benefit pension plans in the United States at June 30, 2025; a discount rate of
Expected benefit payments for all plans during the next five fiscal years are as follows: 2026, $
The Company operates defined benefit plans in Germany and Japan which are unfunded.
Multi-Employer Pension Plans
We contribute to two multiemployer defined benefit plans under the terms of collective bargaining agreements that cover our union-represented employees. These plans generally provide for retirement, death and/or termination benefits for eligible employees within the applicable collective bargaining units, based on specific eligibility/participation requirements, vesting periods and benefit formulas. The risks of participating in these multiemployer plans are different from single-employer plans in the following aspects:
| ● | Assets contributed to the multiemployer plan by one employer may be used to provide benefits to employees of other participating employers. |
| ● | If a participating employer stops contributing to the multiemployer plan, the unfunded obligations of the plan may be borne by the remaining participating employers. |
| ● | If we choose to stop participating in some of our multiemployer plans, we may be required to pay those plans an amount based on the underfunded status of the plan, referred to as a withdrawal liability. However, cessation of participation in a multiemployer plan and subsequent payment of any withdrawal liability is subject to the collective bargaining process. |
The following table outlines the Company’s participation in multiemployer pension plans for the periods ended June 30, 2025, 2024, and 2023, and sets forth the yearly contributions into each plan. The “EIN/Pension Plan Number” column provides the Employer Identification Number (“EIN”) and the three-digit plan number. The most recent Pension Protection Act zone status available in 2025 and 2024 relates to the plans’ two most recent fiscal year-ends. The zone status is based on information that we received from the plans’ administrators and is certified by each plan’s actuary. Among other factors, plans certified in the red zone are generally less than 65% funded, plans certified in the orange zone are both less than 80% funded and have an accumulated funding deficiency or are expected to have a deficiency in any of the next six plan years, plans certified in the yellow zone are less than 80% funded, and plans certified in the green zone are at least 80% funded. The “FIP/RP Status Pending/Implemented” column indicates whether a financial improvement plan (“FIP”) for yellow/orange zone plans, or a rehabilitation plan (“RP”) for red zone plans, is either pending or has been implemented. For all plans, the Company’s contributions do not exceed 5% of the total contributions to the plan in the most recent year.
| Pension Protection Act | Expiration | ||||||||||||||||||||
| Zone Status | Contributions | Date of | |||||||||||||||||||
| Collective | |||||||||||||||||||||
| EIN/Plan | FIP/RP | Surcharge | Bargaining | ||||||||||||||||||
| Pension Fund | Number | 2025 | 2024 | Status | 2025 | 2024 | 2023 | Imposed? | Agreement | ||||||||||||
| New England Teamsters and Trucking Industry Pension Fund | 04-6372430-001 | Red | Red | Yes/ Implemented | $1,061 | $ | $ | No | Mar-27 | ||||||||||||
| IAM National Pension Fund, National Pension Plan | 51-6031295-002 | Red | Red | Yes/Implemented | 658 | Yes | Aug-29 | ||||||||||||||
| $ | 1,719 | $ | $ | ||||||||||||||||||
Retirement Savings Plans
The Company has
17. Industry Segment Information
The company operates in the following reportable segments organized around the types of products sold. The Company has aggregated its operating segments into its reportable segments where they contained similar products and economic characteristics, and shared similar types of customers, and production and distribution methods. The Company has determined that its CEO is its Chief Operating Decision Maker (CODM) who is responsible for assessing performance and allocating resources. The CODM primarily evaluates segment performance based on net revenue and does not regularly review specific expense categories at the segment level. Instead, expenses are managed and assessed on a consolidated basis rather than by individual segment. While certain operating expenses may be incurred at the segment level, these are not regularly reviewed by the CODM when evaluating performance or allocating resources. As a result, the Company does not allocate or disclose certain expense details by segment. The CODM primarily reviews these profit measures in comparison to forecasts, trends, key performance targets, and results of industry peers to assess profitability, identify areas for improvement, and make strategic decisions regarding investments and resource allocation within each segment.
• Electronics – manufacturing and selling of electronic components for applications throughout the end-user market spectrum;
• Engineering Technologies – provides net and near net formed single-source customized solutions in the manufacture of engineered components for the aviation, aerospace, defense, energy, industrial, medical, marine, oil and gas, and manned and unmanned space markets;
• Scientific – specialty temperature-controlled equipment for the medical, scientific, pharmaceutical, biotech and industrial markets;
• Engraving – provides mold texturizing, slush molding tools, project management and design services, roll engraving, hygiene product tooling, low observation vents for stealth aircraft, and process machinery for a number of industries;
• Specialty Solutions – an aggregation of two operating segments that manufacture and sell refrigerated, heated and dry merchandizing display cases, and single and double acting telescopic and piston rod hydraulic cylinders.
The Procon business was included in the Specialty Solutions Segment through the date of divestiture in the third quarter of fiscal year 2023.
Given the nature of our corporate expenses, management concluded that it would not presently be appropriate to allocate the expenses associated with corporate activities to our operating segments. These corporate expenses include the costs for the corporate headquarters, salaries and wages for the personnel in corporate, professional fees related to corporate matters and compliance efforts, stock-based compensation and post-retirement benefits related to our corporate executives, officers and directors, and other compliance related costs. The Company has a process to allocate and recharge certain direct costs to the operating segments when such direct costs are administered and paid at corporate. Such direct expenses that are recharged on an intercompany basis each month include such costs as insurance, workers’ compensation programs, and audit fees. The accounting policies applied by the reportable segments are the same as those described in the Summary of Accounting Policies footnote to the consolidated financial statements. There are no differences in accounting policies which would be necessary for an understanding of the reported segment information.
| 2025 | ||||||||||||||||||||||||
| (in thousands) | Electronics | Engineering Technologies | Scientific | Engraving | Specialty Solutions | Total | ||||||||||||||||||
| Net Sales | $ | $ | $ | $ | $ | $ | ||||||||||||||||||
| Segment Expenses | ( | ) | ( | ) | ( | ) | ( | ) | ( | ) | ( | ) | ||||||||||||
| Segment operating income | ||||||||||||||||||||||||
| Corporate | ( | ) | ||||||||||||||||||||||
| Restructuring costs | ( | ) | ||||||||||||||||||||||
| Acquisition related costs | ( | ) | ||||||||||||||||||||||
| Income (Loss) From Operations | ||||||||||||||||||||||||
| Interest expense | ( | ) | ||||||||||||||||||||||
| Other non-operating (expense) income, net | ( | ) | ||||||||||||||||||||||
| Income from continuing operations before income taxes | $ | |||||||||||||||||||||||
| 2024 | ||||||||||||||||||||||||
| (in thousands) | Electronics | Engineering Technologies | Scientific | Engraving | Specialty Solutions | Total | ||||||||||||||||||
| Net Sales | $ | $ | $ | $ | $ | $ | ||||||||||||||||||
| Segment Expenses | ( | ) | ( | ) | ( | ) | ( | ) | ( | ) | ( | ) | ||||||||||||
| Segment operating income | ||||||||||||||||||||||||
| Corporate | ) | |||||||||||||||||||||||
| Restructuring costs | ) | |||||||||||||||||||||||
| (Gain) loss on sale of business | ||||||||||||||||||||||||
| Acquisition related costs | ) | |||||||||||||||||||||||
| Other operating (income) expense, net | ) | |||||||||||||||||||||||
| Income (Loss) From Operations | ||||||||||||||||||||||||
| Interest expense | ) | |||||||||||||||||||||||
| Other non-operating (expense) income, net | ) | |||||||||||||||||||||||
| Income from continuing operations before income taxes | $ | |||||||||||||||||||||||
| 2023 | ||||||||||||||||||||||||
| (in thousands) | Electronics | Engineering Technologies | Scientific | Engraving | Specialty Solutions | Total | ||||||||||||||||||
| Net Sales | $ | $ | $ | $ | $ | $ | ||||||||||||||||||
| Segment Expenses | ( | ) | ( | ) | ( | ) | ( | ) | ( | ) | ( | ) | ||||||||||||
| Segment operating income | ||||||||||||||||||||||||
| Corporate | ) | |||||||||||||||||||||||
| Restructuring costs | ) | |||||||||||||||||||||||
| (Gain) loss on sale of business | ||||||||||||||||||||||||
| Acquisition related costs | ) | |||||||||||||||||||||||
| Other operating (income) expense, net | ||||||||||||||||||||||||
| Income (Loss) From Operations | ||||||||||||||||||||||||
| Interest expense | ) | |||||||||||||||||||||||
| Other non-operating (expense) income, net | ) | |||||||||||||||||||||||
| Income from continuing operations before income taxes | $ | |||||||||||||||||||||||
| (in thousands) | Capital Expenditures (1) | Depreciation and Amortization | ||||||||||||||||||||||
| 2025 | 2024 | 2023 | 2025 | 2024 | 2023 | |||||||||||||||||||
| Electronics | $ | $ | $ | $ | $ | $ | ||||||||||||||||||
| Engineering Technologies | ||||||||||||||||||||||||
| Scientific | ||||||||||||||||||||||||
| Engraving | ||||||||||||||||||||||||
| Specialty Solutions | ||||||||||||||||||||||||
| Corporate and Other | ||||||||||||||||||||||||
| Total | $ | $ | $ | $ | $ | $ | ||||||||||||||||||
| (1) | Includes capital expenditures in accounts payable of $ |
| Goodwill | Identifiable Assets | |||||||||||||||
| 2025 | 2024 | 2025 | 2024 | |||||||||||||
| Electronics | $ | $ | $ | $ | ||||||||||||
| Engineering Technologies | ||||||||||||||||
| Scientific | ||||||||||||||||
| Engraving | ||||||||||||||||
| Specialty Solutions | ||||||||||||||||
| Corporate & Other | ||||||||||||||||
| Total | $ | $ | $ | $ | ||||||||||||
| Tangible Long-lived assets | 2025 | 2024 | ||||||
| United States | $ | $ | ||||||
| Asia Pacific | ||||||||
| EMEA (2) | ||||||||
| Other Americas | ||||||||
| Total | $ | $ | ||||||
| (2) | EMEA consists primarily of Europe, Middle East and S. Africa. |
18. Divestitures
On February 28, 2023, the Company divested its Procon pumps business (“Procon”) to Investindustrial, a leading European investment and advisory group. Procon generated approximately $
During the first quarter of fiscal year 2024, the Company recorded an additional $
19. DISCONTINUED OPERATIONS
In pursuing our business strategy, the Company continues to divest certain businesses and record activities of these businesses as discontinued operations.
Activity related to discontinued operations for the most recent three fiscal years is as follows (in thousands):
| Year Ended June 30, | ||||||||||||
| 2025 | 2024 | 2023 | ||||||||||
| (Loss) before taxes | $ | ( | ) | $ | ( | ) | $ | ( | ) | |||
| Benefit for taxes | ||||||||||||
| Net (loss) from discontinued operations | $ | ( | ) | $ | ( | ) | $ | ( | ) | |||
20. LEASES
In the normal course of its business, the Company enters into various leases as the lessee, primarily related to certain transportation vehicles, facilities, office space, and machinery and equipment. These leases have remaining lease terms between and years, some of which may include options to extend the leases or options to terminate the leases. Some lease arrangements require variable payments that are dependent on usage, output, or index-based adjustments.
Amounts recorded in the Company's Consolidated Balance Sheet and Statement of Operations related to leases are as follows (in thousands):
| June 30, 2025 | June 30, 2024 | |||||||
| Assets | ||||||||
| Operating lease right-of-use-asset | $ | $ | ||||||
| Liabilities | ||||||||
| Current accrued liabilities | $ | $ | ||||||
| Operating lease long-term liabilities | ||||||||
| Total lease liability | $ | $ | ||||||
Lease cost
The components of lease costs are as follows (in thousands):
| Year Ended | Year Ended | |||||||
| June 30, 2025 | June 30, 2024 | |||||||
| Operating lease cost | $ | $ | ||||||
| Variable lease cost | ||||||||
| Net lease cost | $ | $ | ||||||
Maturity of lease liability
The maturity of the Company's lease liabilities included in continuing operations at June 30, 2025 were as follows (in thousands):
| Operating Leases | ||||
| 2026 | $ | |||
| 2027 | ||||
| 2028 | ||||
| 2029 | ||||
| 2030 | ||||
| After 2030 | ||||
| Less: interest | ( | ) | ||
| Present value of lease liabilities | $ | |||
The weighted average remaining lease term and discount rates are as follows:
| Lease Term and Discount Rate | June 30, 2025 | |||
| Weighted average remaining lease term (years) | ||||
| Weighted average discount rate (percentage) | % | |||
Other Information
Supplemental cash flow information related to leases is as follows:
| Year Ended | Year Ended | |||||||
| June 30, 2025 | June 30, 2024 | |||||||
| Operating cash outflows from operating leases | $ | $ | ||||||
REPORT OF INDEPENDENT REGISTERED PUBLIC ACCOUNTING FIRM
To the stockholders and the Board of Directors of Standex International Corporation
Opinion on the Financial Statements
We have audited the accompanying consolidated balance sheets of Standex International Corporation and subsidiaries (the "Company") as of June 30, 2025 and 2024, the related consolidated statements of operations, comprehensive income, stockholders' equity, and cash flows, for the each of the three years in the period ended June 30, 2025, and the related notes (collectively referred to as the "financial statements"). In our opinion, the financial statements present fairly, in all material respects, the financial position of the Company as of June 30, 2025 and 2024, and the results of its operations and its cash flows for each of the three years in the period ended June 30, 2025, in conformity with accounting principles generally accepted in the United States of America.
We have also audited, in accordance with the standards of the Public Company Accounting Oversight Board (United States) (PCAOB), the Company's internal control over financial reporting as of June 30, 2025, based on criteria established in Internal Control — Integrated Framework (2013) issued by the Committee of Sponsoring Organizations of the Treadway Commission and our report dated August 1, 2025, expressed an unqualified opinion on the Company's internal control over financial reporting.
Basis for Opinion
These financial statements are the responsibility of the Company's management. Our responsibility is to express an opinion on the Company's financial statements based on our audits. We are a public accounting firm registered with the PCAOB and are required to be independent with respect to the Company in accordance with the U.S. federal securities laws and the applicable rules and regulations of the Securities and Exchange Commission and the PCAOB.
We conducted our audits in accordance with the standards of the PCAOB. Those standards require that we plan and perform the audit to obtain reasonable assurance about whether the financial statements are free of material misstatement, whether due to error or fraud. Our audits included performing procedures to assess the risks of material misstatement of the financial statements, whether due to error or fraud, and performing procedures that respond to those risks. Such procedures included examining, on a test basis, evidence regarding the amounts and disclosures in the financial statements. Our audits also included evaluating the accounting principles used and significant estimates made by management, as well as evaluating the overall presentation of the financial statements. We believe that our audits provide a reasonable basis for our opinion.
Critical Audit Matters
The critical audit matters communicated below are matters arising from the current-period audit of the financial statements that were communicated or required to be communicated to the audit committee and that (1) relates to accounts or disclosures that are material to the financial statements and (2) involved our especially challenging, subjective, or complex judgments. The communication of critical audit matters does not alter in any way our opinion on the financial statements, taken as a whole, and we are not, by communicating the critical audit matters below, providing a separate opinion on the critical audit matters or on the accounts or disclosures to which it relates.
Revenue recognition – Revenue recognized over time – Refer to note 3 to the financial statements
Critical Audit Matter Description
Revenue is recognized over time under certain long-term contracts within the Engineering Technologies and Engraving groups for highly customized customer products that have no alternative use and in which the contract specifies the Company has a right to payment for its costs, plus a reasonable margin. For products manufactured over time, the transfer of control is measured pro rata, based upon current estimates of costs to complete such contracts. Losses on contracts are fully recognized in the period in which the losses become determinable. Revisions in profit estimates are reflected on a cumulative basis in the period in which the basis for such revision becomes known.
We identified revenue recognized over time as a critical audit matter because of the judgments and subjectivity involved in the determination of estimated costs to complete contracts. This required extensive audit effort and a high degree of auditor judgment when performing audit procedures to audit costs incurred to date and management’s estimates of margin at completion used to recognize revenue over time and evaluating the results of those procedures.
How the Critical Audit Matter Was Addressed in the Audit
Our audit procedures related to management’s estimates of total costs and profit for the performance obligations used to recognize revenue for certain performance obligations accounted for over time included the following, among others:
| ● | We selected a sample of long-term contracts with customers for which the revenue is recognized over time and we performed the following: |
| o | evaluated management’s ability to achieve the estimates of total costs and profit at completion by comparing the estimates to management’s work plans, engineering specifications, and supplier contracts, and performing corroborating inquiries with the Company’s operational management; |
| o | tested the accuracy and completeness of the costs incurred to date for the performance obligation to supporting documentation; and |
| o | tested the mathematical accuracy of management’s calculation of revenue for the contract. |
| ● | We evaluated management’s ability to estimate total costs and profits accurately by comparing actual costs and profits to management’s historical estimates for performance obligations that have been fulfilled. |
| ● | We tested the effectiveness of controls for revenue recognized over time, including management’s controls over the estimates of total costs and profit for performance obligations. |
Acquisitions – Amran/Narayan Group Customer Relationships Intangible Asset – Refer to note 2 to the financial statements
Critical Audit Matter Description
The Company completed the acquisition of Amran LLC and Narayan Powertech Private Limited collectively the “Amran/Narayan Group”. The Company accounted for the acquisition under the acquisition method of accounting for business combinations. Accordingly, the purchase price was allocated to the assets acquired and liabilities assumed based on their respective fair values, including a customer relationships intangible asset of $107 million. Management estimated the fair value of the customer relationships intangible asset using the multi-period excess earnings method, which is a specific discounted cash flow method. The fair value determination of the customer relationships intangible asset required management to make significant estimates and assumptions related to future cash flows and the selection of the discount rate.
We identified the customer relationships intangible asset for the Amran/Narayan Group as a critical audit matter because of the significant estimates and assumptions management made to determine the fair value of the asset. This required a high degree of auditor judgment and an increased extent of effort, including the need to involve our fair value specialists, when performing audit procedures to evaluate the reasonableness of management’s forecasts of future cash flows and the selection of the discount rate for the customer relationship intangible asset.
How the Critical Audit Matter Was Addressed in the Audit
Our audit procedures related to the forecasts of future cash flows and the selection of the discount rate for the customer relationships intangible asset included the following, among others:
| ● | We assessed the reasonableness of management’s forecasts of future cash flows by comparing the projections to historical results and certain external market information. |
| ● | With the assistance of our fair value specialists, we evaluated the reasonableness of the (1) valuation methodology and (2) discount rate by: |
| o | Testing the source information underlying the determination of the discount rate and testing the mathematical accuracy of the calculation. |
| o | Developing a range of independent estimates and comparing those to the discount rate selected by management. |
| o | Comparing the weighted average cost of capital utilized to the internal rate of return applied to determine the enterprise value for the business acquired. |
| ● | We evaluated whether the estimated future cash flows were consistent with evidence obtained in other areas of the audit. |
| ● | We tested the effectiveness of controls over the valuation of the customer relationships intangible asset, including management’s controls over forecasts of future cash flows and selection of the discount rate. |
/s/
August 1, 2025
We have served as the Company’s auditor since 2020.
Item 9. Changes In and Disagreements with Accountants on Accounting and Financial Disclosure
Not Applicable
Item 9A. Controls and Procedures
The management of the Company including its Chief Executive Officer, and Chief Financial Officer, have conducted an evaluation of the effectiveness of the Company’s disclosure controls and procedures (as such term is defined in Rules 13a-15(e) and 15(d)-15(e) under the Securities Exchange Act of 1934, as amended, (the “Exchange Act”) as of the end of the period covered by this report. Based on that evaluation, the Chief Executive Officer and Chief Financial Officer concluded as of June 30, 2025, that the disclosure controls and procedures are effective in ensuring that the information required to be disclosed by the Company in reports that it files or submits under the Exchange Act is (i) recorded, processed, summarized and reported within the time periods specified in the Commission's rules and forms and (ii) that such information is accumulated and communicated to the Company’s management, including its Chief Executive Officer and Chief Financial Officer as appropriate to allow timely decisions regarding required disclosure.
SEC guidance permits the exclusion of an evaluation of the effectiveness of a registrant's disclosure controls and procedures as they relate to the internal control over financial reporting for an acquired business during the first year following such acquisition. As discussed in Note 2 to the consolidated financial statements contained in this Report, the Company acquired Amran/Narayan Group and McStarlite Co. during fiscal year 2025. These acquisitions represent approximately 12% of the Company's consolidated continuing operations revenue for the year ended June 30, 2025 and approximately 36% of the Company's net and consolidated assets at June 30, 2025. Management's evaluation and conclusion as to the effectiveness of the design and operation of the Company’s disclosure controls and procedures as of June 30, 2025 excludes any evaluation of the internal control over financial reporting of Amran/Narayan Group and McStarlite Co.
There were no changes in the Company’s internal control over financial reporting identified in connection with management’s evaluation that occurred during the fourth quarter of our fiscal year ended June 30, 2025 that has materially affected, or is reasonably likely to materially affect our internal control over financial reporting.
Management's Report on Internal Control over Financial Reporting
The management of Standex is responsible for establishing and maintaining adequate internal control over financial reporting (as defined in Section 240.13a-15(f) of the Exchange Act). The Company’s internal control over financial reporting is designed to provide reasonable assurance as to the reliability of the Company’s financial reporting and the preparation of financial statements for external purposes in accordance with generally accepted accounting principles. Management, including the Chief Executive Officer and the Chief Financial Officer, assessed the effectiveness of our internal control over financial reporting as of the end of the fiscal year covered by this report on Form 10-K. In making this assessment, management used the criteria established by the Committee of Sponsoring Organizations of the Treadway Commission in “Internal Control-Integrated Framework (2013).” These criteria are in the areas of control environment, risk assessment, control activities, information and communication and monitoring. Management’s assessment included documenting, evaluating and testing the design and operating effectiveness of our internal control over financial reporting.
Based on the Company’s processes, as described above, management, including the Chief Executive Officer and the Chief Financial Officer, has concluded that our internal control over financial reporting was effective as of June 30, 2025 to provide reasonable assurance of achieving its objectives. These results were reviewed with the Audit Committee of the Board of Directors. Deloitte & Touche, LLP, the independent registered public accounting firm that audited our consolidated financial statements included in this Annual Report on Form 10-K, has issued an unqualified attestation report on the Company’s internal control over financial reporting, which is included below.
Inherent Limitation on Effectiveness of Controls
No matter how well designed, internal control over financial reporting has inherent limitations. Internal control over financial reporting determined to be effective can provide only reasonable, not absolute, assurance with respect to financial statement preparation and may not prevent or detect all misstatements that might be due to error or fraud. In addition, a design of a control system must reflect the fact that there are resource constraints, and the benefits of controls must be considered relative to their costs. Because of the inherent limitations in all control systems, no evaluation of controls can provide absolute assurance that all control issues and instances of fraud, if any, within the Company have been detected.
REPORT OF INDEPENDENT REGISTERED PUBLIC ACCOUNTING FIRM
To the stockholders and the Board of Directors of Standex International Corporation
Opinion on Internal Control over Financial Reporting
We have audited the internal control over financial reporting of Standex International Corporation and subsidiaries (the “Company”) as of June 30, 2025, based on criteria established in Internal Control — Integrated Framework (2013) issued by the Committee of Sponsoring Organizations of the Treadway Commission (COSO). In our opinion, the Company maintained, in all material respects, effective internal control over financial reporting as of June 30, 2025, based on criteria established in Internal Control — Integrated Framework (2013) issued by COSO.
We have also audited, in accordance with the standards of the Public Company Accounting Oversight Board (United States) (PCAOB), the consolidated financial statements as of and for the year ended June 30, 2025, of the Company and our report dated August 1, 2025, expressed an unqualified opinion on those financial statements.
As described in Management's Report on Internal Control over Financial Reporting, management excluded from its assessment the internal control over financial reporting at Amran LLC and Narayan Powertech Private Limited collectively the “Amran/Narayan Group”, and McStarlite Co., which were acquired during fiscal year 2025. These acquisitions represent approximately 12% of the Company's consolidated continuing operations revenue for the year ended June 30, 2025 and approximately 36% of the Company's net and consolidated assets at June 30, 2025. Accordingly, our audit did not include the internal control over the financial reporting at the Amran/Narayan Group and McStarlite Co.
Basis for Opinion
The Company’s management is responsible for maintaining effective internal control over financial reporting and for its assessment of the effectiveness of internal control over financial reporting, included in the accompanying Management’s Report on Internal Control over financial reporting. Our responsibility is to express an opinion on the Company’s internal control over financial reporting based on our audit. We are a public accounting firm registered with the PCAOB and are required to be independent with respect to the Company in accordance with the U.S. federal securities laws and the applicable rules and regulations of the Securities and Exchange Commission and the PCAOB.
We conducted our audit in accordance with the standards of the PCAOB. Those standards require that we plan and perform the audit to obtain reasonable assurance about whether effective internal control over financial reporting was maintained in all material respects. Our audit included obtaining an understanding of internal control over financial reporting, assessing the risk that a material weakness exists, testing and evaluating the design and operating effectiveness of internal control based on the assessed risk, and performing such other procedures as we considered necessary in the circumstances. We believe that our audit provides a reasonable basis for our opinion.
Definition and Limitations of Internal Control over Financial Reporting
A company’s internal control over financial reporting is a process designed to provide reasonable assurance regarding the reliability of financial reporting and the preparation of financial statements for external purposes in accordance with generally accepted accounting principles. A company’s internal control over financial reporting includes those policies and procedures that (1) pertain to the maintenance of records that, in reasonable detail, accurately and fairly reflect the transactions and dispositions of the assets of the company; (2) provide reasonable assurance that transactions are recorded as necessary to permit preparation of financial statements in accordance with generally accepted accounting principles, and that receipts and expenditures of the company are being made only in accordance with authorizations of management and directors of the company; and (3) provide reasonable assurance regarding prevention or timely detection of unauthorized acquisition, use, or disposition of the company’s assets that could have a material effect on the financial statements.
Because of its inherent limitations, internal control over financial reporting may not prevent or detect misstatements. Also, projections of any evaluation of effectiveness to future periods are subject to the risk that controls may become inadequate because of changes in conditions, or that the degree of compliance with the policies or procedures may deteriorate.
/s/ Deloitte & Touche LLP
Boston, Massachusetts
August 1, 2025
of our directors or executive officers adopted or terminated a Rule 10b5-1 trading arrangement or adopted or terminated a non-Rule 10b5-1 trading arrangement (as defined in Item 408(c) of Regulation S-K) during the quarter ended June 30, 2025.
Item 10. Directors, Executive Officers and Corporate Governance
The Company will file with the Securities and Exchange Commission (“SEC”) a definitive Proxy Statement later than 120 days after the close of the fiscal year ended June 30, 2025 (the “Proxy Statement”). The information required by this item and not provided in Part 1 of this report under Item 1 “Executive Officers of Standex” is incorporated by reference from the Proxy Statement under the captions “Election of Directors,” “Stock Ownership in the Company,” “Other Information Concerning the Company, Board of Directors and its Committees” and “Section 16(a) Beneficial Ownership Reporting Compliance.”
There have been no material changes to the procedures by which security holders may recommend nominees to our Board of Directors. Information regarding the process for identifying and evaluating candidates for director are set forth and incorporated in reference to the information in the Proxy Statement under the caption “Corporate Governance/Nominating Committee Report.”
Information regarding the Audit Committee Financial Expert and the identification of the Audit Committee is incorporated by reference to the information in the Proxy Statement under the caption “Other Information Concerning the Company, Board of Directors and its Committees, Audit Committee.” The Audit Committee is established in accordance with Section 3(a)(58)(A) of the Securities Exchange Act.
We maintain a corporate governance section on our website, which includes our code of ethics for senior financial management that applies to our chief executive officer, principal financial officer, principal accounting officer, controller or persons performing similar functions. Our corporate governance section also includes our code of business conduct and ethics for all employees. In addition, we will promptly post any amendments to or waivers of the code of ethics for senior financial management on our website. You can find this and other corporate governance information at www.standex.com.
Item 11. Executive Compensation
Information regarding executive compensation is incorporated by reference from the Proxy Statement under the captions and sub-captions: “Executive Compensation,” “Compensation Discussion and Analysis,” “Compensation Committee Report,” “2025 Summary Compensation Table,” “Other Information Concerning the Company, Board of Directors and Its Committees,” and “Directors Compensation.”
Item 12. Security Ownership of Certain Beneficial Owners and Management and Related Stockholder Matters
The stock ownership of each person known to Standex to be the beneficial owner of more than 5% of its Common Stock is incorporated by reference in the Proxy Statement under the caption “Stock Ownership of Certain Beneficial Owners.” The beneficial ownership of Standex Common Stock of all directors and executive officers of the Company is incorporated by reference in the Proxy Statement under the caption and sub-caption “Stock Ownership in the Company” and “Stock Ownership by Directors, Nominees for Director and Executive Officers,” respectively.
The Equity Compensation Plan table below represents information regarding the Company’s equity-based compensation plan at June 30, 2025.
| (A) |
(B) |
(C) |
||||||||||
| Number of Securities To |
Weighted-Average |
Number of Securities Remaining |
||||||||||
| Be Issued Upon Exercise |
Exercise Price Of |
Available for Future Issuance Under |
||||||||||
| Of Outstanding Options, |
Outstanding Options, |
Equity Compensation Plans (Excluding |
||||||||||
| Plan Category |
Warrants and Rights |
Warrants and Rights |
Securities reflected in Column (A)) |
|||||||||
| 2018 Omnibus Equity compensation plan approved by stockholders |
349,571 | $ | 1.86 | 168,537 | ||||||||
| Total |
349,571 | $ | 1.86 | 168,537 | ||||||||
The Company has one equity compensation plan, approved by stockholders, under which equity securities of the Company have been authorized for issuance to employees and non-employee directors. During fiscal year 2022, shareholders approved an amendment to and restatement of the 2018 Omnibus Equity compensation plan. The change increased the number of shares authorized for grants under the 2018 Omnibus Equity compensation plan by 400,000 to 900,000 shares of our common stock.
This plan is further described in the “Notes to Consolidated Financial Statements” under the heading “Stock-Based Compensation and Purchase Plans.”
Item 13. Certain Relationships and Related Transactions and Director Independence
Information regarding certain relationships and related transactions is incorporated by reference in the Proxy Statement under the caption and sub-caption “Certain Relationships and Related Transactions” And “Stock Ownership by Directors, Nominees for Director and Executive Officers,” respectively.
Information regarding director independence is incorporated by reference in the Proxy Statement under the caption “Election of Directors - Determination of Independence.”
Item 14. Principal Accountant Fees and Services
This Information in addition to information regarding aggregate fees billed for each of the last two fiscal years for professional services rendered by the professional accountant for audit of the Company’s annual financial statements and review of financial statements included in the Company’s Form 10-K as well as others are incorporated by reference in the Proxy Statement under the caption “Independent Auditors’ Fees.”
Item 15. Exhibits and Financial Statement Schedules
| (a) | 1. | Financial Statements | |
| Financial Statements covered by the Reports of Independent Registered Public Accounting Firm (PCAOB ID No. |
|||
| (A) |
Consolidated Statements of Operations for the fiscal years ended June 30, 2025, 2024 and 2023 |
||
| (B) |
Consolidated Balance Sheets as of June 30, 2025 and 2024 |
||
| (C) |
Comprehensive Income for the fiscal years ended June 30, 2025, 2024 and 2023 |
||
| (D) |
Consolidated Statements of Stockholders’ Equity for the fiscal years ended June 30, 2025, 2024 and 2023 |
||
| (E) |
Consolidated Statements of Cash Flows for the fiscal years ended June 30, 2025, 2024 and 2023 |
||
| (F) |
Notes to Consolidated Financial Statements |
||
| 2. |
Financial Statements Schedule |
||
| The following financial statement schedule is included as required by Item 8 to this report on Form 10-K |
|||
| Schedule II – Valuation and Qualifying Accounts is included in the Notes to Consolidated Financial Statements |
|||
| All other schedules are not required and have been omitted |
|||
| 3. |
Exhibits |
|
* Management contract or compensatory plan or arrangement.
SIGNATURES
Pursuant to the requirements of Section 13 or 15(d) of the Securities Exchange Act of 1934, Standex International Corporation has duly caused this Annual Report on Form 10-K to be signed on its behalf by the undersigned, thereunto duly authorized, on August 1, 2025.
|
|
STANDEX INTERNATIONAL CORPORATION (Registrant) |
|
|
|
|
|
|
|
|
|
|
|
/s/ DAVID DUNBAR |
|
|
|
David Dunbar |
|
|
|
President/Chief Executive Officer |
|
Pursuant to the requirements of the Securities Exchange Act of 1934, this report has been signed below by the following persons on behalf of Standex International Corporation and in the capacities indicated on August 2, 2024:
| Signature |
|
Title |
|
|
|
|
| /s/ DAVID DUNBAR |
|
President/Chief Executive Officer |
| David Dunbar |
|
|
|
|
|
|
| /s/ ADEMIR SARCEVIC | Vice President/Chief Financial Officer and Treasurer | |
| Ademir Sarcevic | ||
| /s/ DANIELLE RANGEL | Vice President/Chief Accounting Officer | |
| Danielle Rangel |
| Charles H. Cannon |
Jeffrey S. Edwards |
| Thomas E. Chorman |
Thomas J. Hansen |
| Robin J. Davenport |
Michael A. Hickey |
| B. Joanne Edwards | Andy L. Nemeth |
| /s/ DAVID DUNBAR | |
| David Dunbar |
Supplemental Information to be furnished with reports filed pursuant to Section 15(d) of the Act by Registrants which have not registered securities pursuant to Section 12 of the Act.
The Company will furnish its 2025 Proxy Statement and proxy materials to security holders subsequent to the filing of the annual report on this Form. Copies of such material shall be furnished to the Commission when they are sent to security holders.
INDEX TO EXHIBITS
| 21 |
| 23 |
Consent of Independent Registered Public Accounting Firm Deloitte & Touche LLP |
| 24 |
| 31.1 |
Rule 13a-14(a) Certification of President and Chief Executive Officer |
| 31.2 |
Rule 13a-14(a) Certification of Vice President and Chief Financial Officer |
| 32 |
END OF FORM 10-K
SUPPLEMENTAL INFORMATION FOLLOWS
| Board of Directors |
Title |
| Charles H. Cannon, Jr., 1, 3 |
Retired Executive Chairman and CEO, JBT Corporation |
| Thomas E. Chorman 1, 3, 4 |
CEO, Solar LED Innovations, LLC |
|
|
|
| Robin J. Davenport 1, 2 | Retired Vice President-Corporate Finance, Parker-Hannifin Corporation |
| David Dunbar |
President and Chief Executive Officer; Chairman of the Board |
| Jeffrey S Edwards 2, 3 |
Chairman and Chief Executive Officer, Cooper Standard Holdings, Inc. |
| B. Joanne Edwards 2, 3 |
Retired Senior Vice President & General Manager, Residential & Wiring Device Business, Eaton Corporation |
| Thomas J. Hansen 1 |
Former Executive Vice Chairman of Illinois Tool Works, Inc. |
| Michael A. Hickey 2, 4 |
Retired Executive Vice President and President of the Global Institutional Business, Ecolab Inc. |
| Andy L. Nemeth | Chairman, President & Chief Executive Officer of Patrick Industries, Inc. |
________________________
1 Member of Audit Committee
2 Member of Compensation Committee
3 Member of Corporate Governance/Nominating Committee
4 Member of Innovation & Technology Committee
| Corporate Officers |
|
| David Dunbar |
President and Chief Executive Officer |
| Ademir Sarcevic |
Vice President, Chief Financial Officer and Treasurer |
| Alan J. Glass |
Vice President, Chief Legal Officer and Secretary |
| Danielle Rangel |
Vice President, Chief Accounting Officer |
| Timo Goodloe |
Vice President, Global Tax |
| Annemarie Bell | Vice President, Chief Human Resources Officer |
| Max Arets | Vice President, Chief Information Officer |
| Vineet Kshirsagar | Vice President, Growth and Business Development |
| Esther Zolotova | Corporate Governance Officer & Assistant Secretary |
| Shareholder Information |
|
| Corporate Headquarters |
Standex International Corporation |
| 23 Keewaydin Drive, Suite 300 |
|
| Salem, NH 03079 |
|
| (603) 893-9701 |
|
| Facsimile: (603) 893-7324 |
|
| www.standex.com |
|
| Common Stock |
Listed on the New York Stock Exchange |
| (Ticker symbol: SXI) |
|
| Transfer Agent and Registrar |
Computershare |
| 150 Royall Street |
|
| Canton, MA 02021 |
|
| (800) 368-5948 |
|
| www.Computershare.com |
|
| Independent Auditors |
Deloitte & Touche LLP |
| 200 Berkeley St, 10th Floor |
|
| Boston, MA 02116 |
|
| Shareholder Services |
Stockholders should contact Standex’s Transfer Agent (Computershare, 150 Royall Street, Canton, MA 02021) regarding changes in name, address or ownership of stock; lost certificates of dividends; and consolidation of accounts. |
| Stockholders’ Meeting |
The Annual Meeting of Stockholders will be held at 9:00 a.m. on Tuesday, October 21, 2025 at Standex International Corporation’s Corporate Headquarters, 23 Keewaydin Drive 3rd Floor, Salem, NH 03079 |