Management's Discussion and Analysis for the fiscal year ended December 31, 2018,
dated February 28, 2019
MANAGEMENT'S DISCUSSION AND ANALYSIS February 28, 2019 |
|
This Management's Discussion and Analysis (this MD&A) should be read in conjunction with Suncor's December 31, 2018 audited Consolidated Financial Statements and the accompanying notes. Additional information about Suncor filed with Canadian securities regulatory authorities and the United States Securities and Exchange Commission (SEC), including quarterly and annual reports and Suncor's Annual Information Form dated February 28, 2019 (the 2018 AIF), which is also filed with the SEC under cover of Form 40-F, is available online at www.sedar.com, www.sec.gov and our website www.suncor.com. Information on or connected to our website, even if referred to in this MD&A, does not constitute part of this MD&A.
References to "we", "our", "Suncor", or "the company" mean Suncor Energy Inc. and the company's subsidiaries and interests in associates and jointly controlled entities, unless the context requires otherwise. For a list of abbreviations that may be used in this MD&A, refer to the Advisories – Common Abbreviations section of this MD&A.
2018 ANNUAL REPORT Suncor Energy Inc. 17
|
|
| MD&A – Table of Contents | ||
| 19 | Financial and Operating Summary | |
| 21 | Suncor Overview | |
| 23 | Financial Information | |
| 27 | Segment Results and Analysis | |
| 40 | Fourth Quarter 2018 Analysis | |
| 42 | Quarterly Financial Data | |
| 45 | Capital Investment Update | |
| 47 | Financial Condition and Liquidity | |
| 52 | Accounting Policies and Critical Accounting Estimates | |
| 56 | Risk Factors | |
| 67 | Other Items | |
| 68 | Advisories | |
Basis of Presentation
Unless otherwise noted, all financial information has been prepared in accordance with International Financial Reporting Standards (IFRS) as issued by the International Accounting Standards Board (IASB) and Canadian generally accepted accounting principles (GAAP) as contained within Part 1 of the Canadian Institute of Chartered Professional Accountants Handbook.
All financial information is reported in Canadian dollars, unless otherwise noted. Production volumes, apart from Libya, are presented on a working-interest basis, before royalties, unless otherwise noted. Libyan volumes are presented on an entitlement basis.
Non-GAAP Financial Measures
Certain financial measures in this MD&A – namely operating earnings (loss), funds from (used in) operations, return on capital employed (ROCE), Oil Sands operations cash operating costs, In Situ cash operating costs, Fort Hills cash operating costs, Syncrude cash operating costs, refining margin, refining operating expense, discretionary free funds flow, and last-in, first-out (LIFO) inventory valuation methodology – are not prescribed by GAAP. Operating earnings (loss), Oil Sands operations cash operating costs, Fort Hills cash operating costs, Syncrude cash operating costs and LIFO inventory valuation methodology are defined in the Advisories – Non-GAAP Financial Measures section of this MD&A and reconciled to the most directly comparable GAAP measures in the Financial Information and Segment Results and Analysis sections of this MD&A. ROCE, Funds from (used in) operations, discretionary free funds flow, refining margin, refining operating expense and In Situ cash operating costs are defined and reconciled to the most directly comparable GAAP measures in the Advisories – Non-GAAP Financial Measures section of this MD&A.
Measurement Conversions
Crude oil and natural gas liquids volumes have been converted to mcfe on the basis of one bbl to six mcf in this MD&A. Also, certain natural gas volumes have been converted to boe or mboe on the same basis. Refer to the Advisories – Measurement Conversions section of this MD&A.
Common Abbreviations
For a list of abbreviations that may be used in this MD&A, refer to the Advisories – Common Abbreviations section of this MD&A.
Risks and Forward-Looking Information
The company's business, reserves, financial condition and results of operations may be affected by a number of factors, including, but not limited to, the factors described in the Risk Factors section of this MD&A.
This MD&A contains forward-looking information based on Suncor's current expectations, estimates, projections and assumptions. This information is subject to a number of risks and uncertainties, including those discussed in this MD&A and Suncor's other disclosure documents filed with Canadian securities regulatory authorities and the SEC, many of which are beyond the company's control. Users of this information are cautioned that actual results may differ materially. Refer to the Advisories – Forward-Looking Information section of this MD&A for information on the material risk factors and assumptions underlying our forward-looking information.
18 2018 ANNUAL REPORT Suncor Energy Inc.
1. FINANCIAL AND OPERATING SUMMARY
| Year ended December 31 ($ millions, except per share amounts) | 2018 | 2017 | 2016 | ||||||
| Gross revenues | 39 592 | 32 885 | 26 863 | ||||||
|
|
|||||||||
| Royalties | (1 050 | ) | (931 | ) | (265 | ) | |||
| Operating revenues, net of royalties | 38 542 | 31 954 | 26 598 | ||||||
| Net earnings (loss) | 3 293 | 4 458 | 445 | ||||||
|
|
|||||||||
| per common share – basic | 2.03 | 2.68 | 0.28 | ||||||
|
|
|||||||||
| per common share – diluted | 2.02 | 2.68 | 0.28 | ||||||
| Operating earnings (loss)(1) | 4 312 | 3 188 | (83 | ) | |||||
|
|
|||||||||
| per common share – basic | 2.65 | 1.92 | (0.05 | ) | |||||
| Funds from operations(1) | 10 172 | 9 139 | 5 988 | ||||||
|
|
|||||||||
| per common share – basic | 6.27 | 5.50 | 3.72 | ||||||
| Cash flow provided by operating activities | 10 580 | 8 966 | 5 680 | ||||||
|
|
|||||||||
| per common share – basic | 6.54 | 5.40 | 3.53 | ||||||
| Dividends paid on common shares | 2 333 | 2 124 | 1 877 | ||||||
|
|
|||||||||
| per common share – basic | 1.44 | 1.28 | 1.16 | ||||||
| Weighted average number of common shares in millions – basic | 1 623 | 1 661 | 1 610 | ||||||
|
|
|||||||||
| Weighted average number of common shares in millions – diluted | 1 629 | 1 665 | 1 612 | ||||||
| ROCE(1) (%) | 8.0 | 6.7 | 0.4 | ||||||
|
|
|||||||||
| ROCE(1)(2) (%), excluding major projects in progress | 8.2 | 8.6 | 0.5 | ||||||
| Capital Expenditures(3) | 5 250 | 5 822 | 5 986 | ||||||
|
|
|||||||||
| Sustaining | 3 926 | 2 916 | 2 275 | ||||||
|
|
|||||||||
| Growth | 1 324 | 2 906 | 3 711 | ||||||
| Discretionary free funds flow(1) | 3 862 | 4 056 | 1 797 | ||||||
| Balance Sheet (at December 31) | |||||||||
|
|
|||||||||
| Total assets | 89 579 | 89 494 | 88 702 | ||||||
|
|
|||||||||
| Total debt(4) | 17 350 | 15 579 | 17 430 | ||||||
|
|
|||||||||
| Net debt(5) | 15 129 | 12 907 | 14 414 | ||||||
|
|
|||||||||
| Total liabilities | 45 574 | 44 111 | 44 072 | ||||||
2018 ANNUAL REPORT Suncor Energy Inc. 19
Operating Summary
| Year ended December 31 | 2018 | 2017 | 2016 | |||||
| Production Volumes (mboe/d) | ||||||||
|
|
||||||||
| Oil Sands | 628.6 | 563.7 | 504.9 | |||||
|
|
||||||||
| Exploration and Production | 103.4 | 121.6 | 117.9 | |||||
| Total | 732.0 | 685.3 | 622.8 | |||||
| Production Mix | ||||||||
|
|
||||||||
| Crude oil and liquids / natural gas (%) | 100/0 | 100/0 | 99/1 | |||||
| Average Price Realizations(1) ($/boe) | ||||||||
|
|
||||||||
| Oil Sands operations | 54.91 | 54.24 | 39.97 | |||||
|
|
||||||||
| Syncrude | 70.19 | 66.05 | 56.38 | |||||
|
|
||||||||
| Fort Hills | 38.46 | — | — | |||||
|
|
||||||||
| Exploration and Production | 86.96 | 66.20 | 53.34 | |||||
| Refinery crude oil processed (mbbls/d) | 430.8 | 441.2 | 428.6 | |||||
|
|
||||||||
| Refinery Utilization(2) (%) | ||||||||
|
|
||||||||
| Eastern North America | 94 | 93 | 92 | |||||
|
|
||||||||
| Western North America | 93 | 98 | 94 | |||||
| 93 | 96 | 93 | ||||||
Segment Summary
| Year ended December 31 ($ millions) | 2018 | 2017 | 2016 | ||||||
| Net earnings (loss) | |||||||||
|
|
|||||||||
| Oil Sands | 853 | 1 009 | (1 149 | ) | |||||
|
|
|||||||||
| Exploration and Production | 808 | 732 | 190 | ||||||
|
|
|||||||||
| Refining and Marketing | 3 153 | 2 658 | 1 890 | ||||||
|
|
|||||||||
| Corporate, Energy Trading and Eliminations | (1 521 | ) | 59 | (486 | ) | ||||
| Total | 3 293 | 4 458 | 445 | ||||||
| Operating earnings (loss)(1) | |||||||||
|
|
|||||||||
| Oil Sands | 793 | 954 | (1 109 | ) | |||||
|
|
|||||||||
| Exploration and Production | 898 | 746 | 10 | ||||||
|
|
|||||||||
| Refining and Marketing | 3 153 | 2 164 | 1 890 | ||||||
|
|
|||||||||
| Corporate, Energy Trading and Eliminations | (532 | ) | (676 | ) | (874 | ) | |||
| Total | 4 312 | 3 188 | (83 | ) | |||||
| Funds from (used in) operations(1) | |||||||||
|
|
|||||||||
| Oil Sands | 4 870 | 4 738 | 2 669 | ||||||
|
|
|||||||||
| Exploration and Production | 1 869 | 1 725 | 1 313 | ||||||
|
|
|||||||||
| Refining and Marketing | 3 794 | 2 841 | 2 606 | ||||||
|
|
|||||||||
| Corporate, Energy Trading and Eliminations | (361 | ) | (165 | ) | (600 | ) | |||
| Total Funds from operations | 10 172 | 9 139 | 5 988 | ||||||
|
|
|||||||||
| Change in non-cash working capital | 408 | (173 | ) | (308 | ) | ||||
| Cash flow provided by operating activities | 10 580 | 8 966 | 5 680 | ||||||
20 2018 ANNUAL REPORT Suncor Energy Inc.
Suncor is an integrated energy company headquartered in Calgary, Alberta, Canada. We are strategically focused on developing one of the world's largest petroleum resource basins – Canada's Athabasca oil sands. In addition, we explore for, acquire, develop, produce and market crude oil and natural gas in Canada and internationally; we transport and refine crude oil, and we market petroleum and petrochemical products primarily in Canada. We also conduct energy trading activities focused principally on the marketing and trading of crude oil, natural gas and byproducts. We also operate a renewable energy business as part of our overall portfolio of assets.
For a description of Suncor's business segments, refer to the Segment Results and Analysis section of this MD&A.
Suncor's Strategy
Delivering competitive and sustainable returns to shareholders is a top priority of the company and we aim to consistently grow these returns by focusing on our operational excellence initiatives; capital discipline with asset reliability and optimization; long-term profitable growth, and our commitment to environmental stewardship and sustainability. In an industry that has experienced volatility in recent years, Suncor is well positioned to succeed due to its competitive advantages: an industry-leading long-life, low-decline oil sands reserves base, a highly efficient, tightly integrated downstream business, an offshore business that provides geographically diversified cash flow, financial strength and industry expertise.
Key components of Suncor's strategy are to:
2018 Highlights
Financial results summary
2018 ANNUAL REPORT Suncor Energy Inc. 21
Successful ramp up of operations at both Fort Hills and Hebron.
Oil Sands production increased to 628,600 bbls/d in 2018, compared to 563,700 bbls/d in 2017.
Refining and Marketing (R&M) attained several new records in 2018 and achieved 93% average refinery utilization, despite the completion of the most intensive planned maintenance program in the company's history.
Exploration and Production (E&P) delivered diversified Brent crude-based cash flow in 2018 and continued to pursue development opportunities.
Suncor continued to return value to shareholders in 2018 through increased dividends and additional share repurchases.
22 2018 ANNUAL REPORT Suncor Energy Inc.
Net Earnings
Suncor's net earnings in 2018 were $3.293 billion, compared to $4.458 billion in 2017. Net earnings were impacted by the same factors that influenced operating earnings, which are described below. Other items affecting net earnings in 2018 and 2017 included:
Operating Earnings
Consolidated Operating Earnings (Loss) Reconciliation(1)
| Year ended December 31 ($ millions) | 2018 | 2017 | 2016 | |||||
| Net earnings as reported | 3 293 | 4 458 | 445 | |||||
|
|
||||||||
| Unrealized foreign exchange loss (gain) on U.S. dollar denominated debt | 989 | (702 | ) | (524 | ) | |||
|
|
||||||||
| (Gain) on significant disposals and loss on equity investment | 30 | (437 | ) | — | ||||
|
|
||||||||
| Loss (gain) on interest rate swaps(2) | — | 20 | (6 | ) | ||||
|
|
||||||||
| Impact of income tax adjustments on deferred income taxes(3) | — | (124 | ) | (180 | ) | |||
|
|
||||||||
| Non-cash loss on early payment of long-term debt(4) | — | 28 | 73 | |||||
|
|
||||||||
| Recognition of property damage insurance proceeds | — | (55 | ) | — | ||||
|
|
||||||||
| Derecognition and impairments(5) | — | — | 71 | |||||
|
|
||||||||
| Canadian Oil Sands Limited (COS) acquisition and integration costs(6) | — | — | 38 | |||||
| Operating earnings (loss)(1) | 4 312 | 3 188 | (83 | ) | ||||
2018 ANNUAL REPORT Suncor Energy Inc. 23
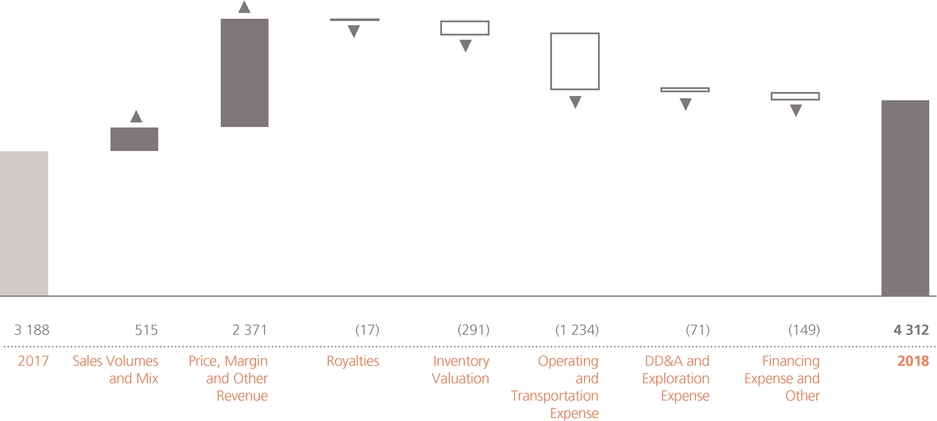
Bridge Analysis of Consolidated Operating Earnings ($ millions)(1)
Suncor's consolidated operating earnings in 2018 were $4.312 billion, compared to $3.188 billion in the prior year. The increase was primarily due to improved overall benchmark crude pricing, increased refining margins, higher overall upstream production, primarily attributed to the ramp up of Fort Hills and Hebron and the increased working interest in Syncrude acquired in early 2018, as well as improved energy trading earnings. These factors were partially offset by an increase in expenses associated with the expansion of the company's production in 2018, an increase in maintenance expenditures at Syncrude and Oil Sands operations resulting from an increase in planned and unplanned maintenance, a decrease in the capitalization of borrowing costs with the commissioning of the company's major growth projects, as well as a net unfavourable inventory valuation change on declining crude feedstock costs at the end of 2018.
Cash Flow Provided by Operating Activities and Funds from Operations
Consolidated funds from operations for 2018 were $10.172 billion, compared to $9.139 billion in 2017, and were impacted by the same factors as operating earnings described above.
Cash flow provided by operating activities, which includes changes in non-cash working capital, was $10.580 billion in 2018, compared to $8.966 billion in 2017, and reflected a source of cash from the company's working capital balances in 2018, compared to a use of cash in 2017, as a result of lower year end benchmark prices.
Results for 2017 Compared with 2016
Net earnings in 2017 were $4.458 million, compared to $445 million in 2016. The increase in net earnings was mainly due to the same factors impacting operating earnings described below, as well as the net earnings adjustments impacting 2017 and 2016, which are described in detail above.
Operating earnings were $3.188 billion in 2017, compared to an operating loss of $83 million in 2016. The increase was primarily due to improved benchmark crude pricing, favourable crack spreads, higher upstream production, lower DD&A, a decrease in exploration expense and higher sales volumes at R&M. These factors were partially offset by the impact of a stronger Canadian dollar, an increase in operating expenses, which was primarily due to the acquisition of additional working interests in Syncrude in 2016, increased maintenance costs at Syncrude, an increase in royalties associated with higher production and the impact of the sale of the lubricants business. Operating earnings in 2016 were significantly impacted by the shut in of production associated with the forest fires in the Fort McMurray area in the second quarter of that year.
Consolidated funds from operations for 2017 were $9.139 billion, compared to $5.988 billion in 2016. Funds from operations were impacted by the same factors as operating earnings, after removing the impact of non-cash expenses primarily related to DD&A.
Cash flow provided by operating activities, which includes changes in non-cash working capital, was $8.966 billion in 2017, compared to $5.680 billion in 2016.
24 2018 ANNUAL REPORT Suncor Energy Inc.
Business Environment
Commodity prices, refining crack spreads and foreign exchange rates are important factors that affect the results of Suncor's operations.
| Average for the year ended December 31 | 2018 | 2017 | 2016 | ||||
| WTI crude oil at Cushing (US$/bbl) | 64.80 | 50.95 | 43.35 | ||||
|
|
|||||||
| Dated Brent Crude (US$/bbl) | 71.05 | 54.25 | 43.75 | ||||
|
|
|||||||
| Dated Brent/Maya FOB price differential (US$/bbl) | 9.10 | 7.70 | 7.50 | ||||
|
|
|||||||
| MSW at Edmonton (Cdn$/bbl) | 69.30 | 63.20 | 51.90 | ||||
|
|
|||||||
| WCS at Hardisty (US$/bbl) | 38.50 | 38.95 | 29.55 | ||||
|
|
|||||||
| Light/heavy differential for WTI at Cushing less WCS at Hardisty (US$/bbl) | 26.30 | 11.95 | 13.85 | ||||
|
|
|||||||
| Condensate at Edmonton (US$/bbl) | 61.05 | 51.55 | 42.50 | ||||
|
|
|||||||
| Natural gas (Alberta spot) at AECO (Cdn$/mcf) | 1.50 | 2.15 | 2.15 | ||||
|
|
|||||||
| Alberta Power Pool Price (Cdn$/MWh) | 50.20 | 22.15 | 18.20 | ||||
|
|
|||||||
| New York Harbor 3-2-1 crack(1) (US$/bbl) | 18.00 | 17.70 | 14.05 | ||||
|
|
|||||||
| Chicago 3-2-1 crack(1) (US$/bbl) | 15.90 | 16.30 | 12.60 | ||||
|
|
|||||||
| Portland 3-2-1 crack(1) (US$/bbl) | 22.80 | 22.15 | 16.50 | ||||
|
|
|||||||
| Gulf Coast 3-2-1 crack(1) (US$/bbl) | 17.45 | 17.65 | 13.40 | ||||
|
|
|||||||
| Exchange rate (US$/Cdn$) | 0.77 | 0.77 | 0.75 | ||||
|
|
|||||||
| Exchange rate (end of period) (US$/Cdn$) | 0.73 | 0.80 | 0.74 | ||||
Suncor's sweet SCO price realizations are influenced primarily by the price of WTI at Cushing and by the supply and demand of sweet SCO from Western Canada, which influences SCO differentials. Price realizations for sweet SCO were favourably impacted by the improvement in the WTI crude benchmark, which increased to US$64.80/bbl in 2018, from US$50.95/bbl in 2017, partially offset by wider SCO differentials impacting the latter portion of the year resulting from oversupply and takeaway constraints impacting the Alberta crude market.
Suncor also produces a specific grade of sour SCO, the price realizations for which are influenced by various crude benchmarks including, but not limited to, MSW at Edmonton and WCS at Hardisty, and which can also be affected by prices negotiated for spot sales. Prices for MSW at Edmonton increased in 2018 compared to 2017, to $69.30/bbl from $63.20/bbl, while WCS at Hardisty decreased slightly to US$38.50 in 2018 compared to US$38.95 in 2017, reflecting the impact of wider western Canadian heavy crude differentials.
Bitumen production that Suncor does not upgrade is blended with diluent to facilitate delivery on pipeline systems. Net bitumen price realizations are therefore influenced by both prices for Canadian heavy crude oil (WCS at Hardisty is a common reference) and prices for diluent (Condensate at Edmonton and SCO), and pipeline tolls. Bitumen price realizations can also be affected by bitumen quality and spot sales and, in the second half of 2018, were also impacted by a substantial widening of heavy crude differentials.
Subsequent to the end of the year, crude differentials for SCO and heavy crude improved from the significant discounts experienced in the fourth quarter of 2018, primarily as a result of the Alberta government's mandatory production curtailments.
Suncor's price realizations for production from East Coast Canada and E&P International assets are influenced primarily by the price for Brent crude, which averaged US$71.05/bbl in 2018, compared to US$54.25/bbl in 2017. Due to the nature of cargo shipments at the company's offshore assets, the timing associated with bulk cargo sales can result in price realizations that deviate from the average benchmark price over the period.
Natural gas used in Suncor's Oil Sands and Refining operations is primarily referenced to Alberta spot prices at AECO. The average AECO benchmark decreased to $1.50/mcf in 2018, from $2.15/mcf in the prior year.
Suncor's refining margins are primarily influenced by 3-2-1 benchmark crack spreads, which are industry indicators approximating the gross margin on a barrel of crude oil that is refined to produce gasoline and distillates, and crude differentials. More complex refineries can earn greater
2018 ANNUAL REPORT Suncor Energy Inc. 25
refining margins by processing less expensive, heavier crudes, or lighter crudes discounted relative to the WTI benchmark. Crude differentials in Alberta widened considerably during the second half of 2018, resulting in lower refinery feedstock costs for the majority of the company's refineries and improved refining margins. Crack spreads do not necessarily reflect the margins of a specific refinery. Crack spreads quoted in the market are based on current crude feedstock prices whereas actual earnings are based on first-in, first-out (FIFO) inventory accounting, where a delay exists between the time that feedstock is purchased and when it is processed and sold to a third party. A FIFO loss normally reflects a declining price environment for crude oil and finished products, whereas FIFO gains reflect an increasing price environment for crude oil and finished products. Specific refinery margins are further impacted by actual crude purchase costs, refinery configuration, production mix and realized prices for refined products sales in markets unique to each refinery.
Excess electricity produced in Suncor's Oil Sands operations business is sold to the Alberta Electric System Operator, with the proceeds netted against the Oil Sands operations cash operating costs per barrel metric. The Alberta power pool price increased to an average of $50.20/MWh in 2018 from $22.15/MWh in the prior year.
The majority of Suncor's revenues from the sale of oil and natural gas commodities are based on prices that are determined by or referenced to U.S. dollar benchmark prices. The majority of Suncor's expenditures are realized in Canadian dollars. A decrease in the value of the Canadian dollar relative to the U.S. dollar will increase the revenues received from the sale of commodities. An increase in the value of the Canadian dollar relative to the U.S. dollar will decrease revenue received from the sale of commodities. In both 2018 and 2017, the average exchange rate was US$0.77 per one Canadian dollar.
Conversely, some of Suncor's assets and liabilities, notably 75% of the company's debt, are denominated in U.S. dollars and translated to Suncor's reporting currency (Canadian dollars) at each balance sheet date. A decrease in the value of the Canadian dollar relative to the U.S. dollar from the previous balance sheet date increases the amount of Canadian dollars required to settle U.S. dollar denominated obligations.
Economic Sensitivities(1)(2)
The following table illustrates the estimated effects that changes in certain factors would have had on 2018 net earnings and funds from operations(3) if the listed changes had occurred.
| (Estimated change, in $ millions) |
Net Earnings |
Funds From Operations(3) |
||||
| Crude oil +US$1.00/bbl | 220 | 220 | ||||
|
|
||||||
| Natural gas +Cdn$0.10/mcf | (24 | ) | (24 | ) | ||
|
|
||||||
| WTI – narrowing light/heavy differential +US$1.00/bbl | 31 | 31 | ||||
|
|
||||||
| 3-2-1 crack spreads +US$1.00/bbl | 144 | 144 | ||||
|
|
||||||
| Foreign exchange +$0.01 US$/Cdn$ related to operating activities(4) | (193 | ) | (193 | ) | ||
|
|
||||||
| Foreign exchange on U.S. dollar denominated debt +$0.01 US$/Cdn$ | 167 | — | ||||
26 2018 ANNUAL REPORT Suncor Energy Inc.
4. SEGMENT RESULTS AND ANALYSIS
Suncor has classified its operations into the following segments:
OIL SANDS
Suncor's Oil Sands segment, with assets located in the Athabasca oil sands of northeast Alberta, recovers bitumen from mining and in situ operations and either upgrades this production into SCO for refinery feedstock and diesel fuel, or blends the bitumen with diluent for direct sale to market. The Oil Sands segment includes:
EXPLORATION AND PRODUCTION
Suncor's E&P segment consists of offshore operations off the east coast of Canada and in the North Sea, and onshore assets in Libya and Syria.
REFINING AND MARKETING
Suncor's R&M segment consists of two primary operations:
2018 ANNUAL REPORT Suncor Energy Inc. 27
combination of company-owned, Petro-Canada® and Sunoco® branded-dealers in Canada and other non-branded retail stations in the U.S., a nationwide commercial road transportation network in Canada, and a bulk sales channel in Canada.
CORPORATE, ENERGY TRADING AND ELIMINATIONS
The grouping Corporate, Energy Trading and Eliminations includes the company's investments in renewable energy projects, results related to energy marketing, supply and trading activities, and other activities not directly attributable to any other operating segment.
OIL SANDS
2018 Highlights
Strategy and Investment Update
Oil Sands has developed a significant asset base within the Athabasca oil sands and has established a regional advantage given the close proximity of the company's assets to one another. This collection of high-quality assets, combined with long-life, low-decline reserves and industry-leading expertise, provides the opportunity to create structural cash flow growth improvements through asset optimization initiatives, such as debottlenecks and further integration with Syncrude to improve operational flexibility.
Reliability at Firebag and MacKay River improved in 2018, with both facilities setting new annual production records of 204,000 bbls/d and 36,000 bbls/d, respectively. Oil Sands upgrading reliability was 80% for the year, and reflected the impact of an increase in major planned maintenance with the successful completion of the first turnaround at Upgrader 1 since moving to a five year cycle.
Oil Sands remains focused on safe, reliable and sustainable operations. The company's operational excellence initiatives are aimed at improving facility utilization and workforce productivity, and are expected to achieve steady production growth while reducing operating costs. In 2018, Suncor completed the implementation of Autonomous Haulage Systems (AHS) at our North Steepbank Extension Mine. The program is expected to include the deployment of more than 150 autonomous haul trucks across our business over approximately six years.
Following the commissioning of the Fort Hills project in 2018 and the successful ramp up to 94% of nameplate capacity in the fourth quarter of 2018, Suncor will now focus on asset optimization, including AHS and low cost debottleneck opportunities, and continue its execution of safe and reliable operations in 2019.
Suncor remains committed to profitable growth, as was demonstrated by the company's acquisition of an additional 5% working interest in Syncrude in the first quarter of 2018. In an effort to improve reliability at Syncrude, Suncor and its joint venture partners reached an agreement in 2018 to build bi-directional interconnecting pipelines, which will connect Syncrude's Mildred Lake site with Suncor's Oil Sands Base plant. The lines will provide increased operational flexibility through the ability to transfer bitumen and gas oils between the two plants, enabling higher reliability and utilization and profit optimization. The pipelines are expected to be operational by the end of 2020, subject to finalized commercial terms and regulatory approval.
28 2018 ANNUAL REPORT Suncor Energy Inc.
Cost management and capital discipline at Oil Sands will continue to be top priorities in 2019 as the company expects to sustainably reduce controllable operating costs through initiatives that include coordinated maintenance strategies, equipment standardization, adoption of digital technologies and inventory management improvements. Capital discipline continues to focus on managing investment opportunities, including asset synergies and sustainability priorities, such as the replacement of the coke-fired boilers at Oil Sands operations with lower carbon-intensive natural gas and accelerating tailings remediation, through a robust asset development process focused on value creation.
Financial Highlights
| Year ended December 31 ($ millions) | 2018 | 2017 | 2016 | ||||||
| Gross revenues | 15 743 | 13 274 | 9 538 | ||||||
|
|
|||||||||
| Less: Royalties | (398 | ) | (355 | ) | (52 | ) | |||
| Operating revenues, net of royalties | 15 345 | 12 919 | 9 486 | ||||||
| Net earnings (loss) | 853 | 1 009 | (1 149 | ) | |||||
| Adjusted for: | |||||||||
|
|
|||||||||
| Gain on significant disposal | (60 | ) | — | — | |||||
|
|
|||||||||
| Insurance proceeds | — | (55 | ) | — | |||||
|
|
|||||||||
| Derecognition and impairments | — | — | 40 | ||||||
| Operating earnings (loss)(1) | 793 | 954 | (1 109 | ) | |||||
| Funds from operations(1) | 4 870 | 4 738 | 2 669 | ||||||
Bridge Analysis of Operating Earnings ($ millions)(1)
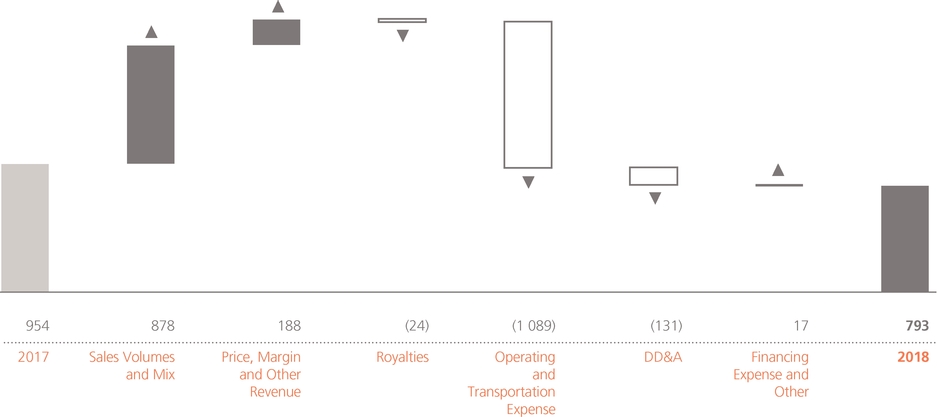
Operating earnings in Oil Sands operations were $793 million in 2018, compared to $954 million in 2017. The ramp up of Fort Hills in early 2018 increased both the company's sales volumes as well as operating and transportation expenses. The decrease in operating earnings was due to an unfavourable sales mix associated with a decrease in SCO production as a result of significant planned upgrader maintenance, lower bitumen price realizations and higher maintenance costs related to turnarounds, partially offset by the acquisition of an additional 5% working interest in Syncrude and record production at In Situ, combined with an increase in SCO price realizations.
Net earnings for Oil Sands were $853 million in 2018, compared to $1.009 billion in 2017 and were impacted by the same factors as operating earnings described above. In addition, 2018 net earnings included a $60 million gain on the sale of the company's interest in the Joslyn oil sands mining project. 2017 net earnings included $55 million of
2018 ANNUAL REPORT Suncor Energy Inc. 29
property damage insurance proceeds related to a facility incident that occurred at Syncrude earlier that year.
Funds from operations for the Oil Sands segment were $4.870 billion in 2018, compared to $4.738 billion in 2017. The increase was primarily due to the acquisition of an additional 5% working interest in Syncrude, and was also impacted by the same factors that impacted operating earnings, adjusted for the impact of non-cash DD&A.
Production Volumes(1)
|
Year ended December 31 (mbbls/d) |
2018 | 2017 | 2016 | ||||
| Upgraded product (SCO and diesel) | 280.3 | 317.7 | 258.9 | ||||
|
|
|||||||
| In Situ non-upgraded bitumen | 138.0 | 111.7 | 115.9 | ||||
| Total Oil Sands operations production | 418.3 | 429.4 | 374.8 | ||||
|
|
|||||||
| Fort Hills bitumen | 66.1 | — | — | ||||
|
|
|||||||
| Syncrude (sweet SCO and diesel) | 144.2 | 134.3 | 130.1 | ||||
| Total | 628.6 | 563.7 | 504.9 | ||||
Oil Sands operations production decreased to 418,300 bbls/d in 2018 from 429,400 bbls/d in 2017, due to an increase in planned and unplanned upgrader maintenance in 2018, offset by an increase in non-upgraded bitumen production, with record volumes achieved at the company's In Situ facilities. Upgrader utilization was 80% in 2018, compared to 91% in 2017.
Fort Hills bitumen production averaged 66,100 bbls/d in 2018 and reflects the ramp up of operations to 94% plant utilization for the fourth quarter of 2018.
Sales Volumes and Mix
|
Year ended December 31 (mbbls/d) |
2018 | 2017 | 2016 | |||||
| Oil Sands operations sales volumes | ||||||||
|
|
||||||||
| Sweet SCO | 96.1 | 107.9 | 87.3 | |||||
| Diesel | 28.8 | 27.5 | 21.2 | |||||
| Sour SCO | 162.6 | 183.6 | 153.4 | |||||
| Upgraded product (SCO) | 287.5 | 319.0 | 261.9 | |||||
| Non-upgraded bitumen | 134.0 | 110.6 | 117.4 | |||||
| Oil Sands operations | 421.5 | 429.6 | 379.3 | |||||
| Fort Hills bitumen | 57.3 | — | — | |||||
| Syncrude sweet SCO | 144.2 | 134.3 | 130.1 | |||||
| Total | 623.0 | 563.9 | 509.4 | |||||
Sales volumes for Oil Sands operations decreased to 421,500 bbls/d in 2018, compared to 429,600 bbls/d in 2017, reflecting the same factors impacting production volumes.
Fort Hills bitumen sales averaged 57,300 bbls/d in 2018 and reflect a build of inventory due to an increase in production volumes at the end of the year and the associated transit time to market.
Suncor's share of Syncrude production and sales volumes averaged 144,200 bbls/d in 2018, compared to 134,300 bbls/d in 2017. The increase is due to the additional 5% working interest in Syncrude acquired in 2018, combined with strong reliability during the fourth quarter of 2018, partially offset by the decrease in production associated with a power outage that occurred in the second quarter of 2018. Syncrude production in 2017 was also negatively impacted by a facility event.
30 2018 ANNUAL REPORT Suncor Energy Inc.
Bitumen Production from Operations
| Year ended December 31 | 2018 | 2017 | 2016 | |||||
| Oil Sands Base | ||||||||
|
|
||||||||
| Bitumen production (mbbls/d) | 258.8 | 305.4 | 238.0 | |||||
|
|
||||||||
| Bitumen ore mined (thousands of tonnes/day) | 378.0 | 464.4 | 351.1 | |||||
|
|
||||||||
| Bitumen ore grade quality (bbls/tonne) | 0.68 | 0.66 | 0.68 | |||||
| In Situ | ||||||||
|
|
||||||||
| Bitumen production – Firebag (mbbls/d) | 204.0 | 181.5 | 180.8 | |||||
|
|
||||||||
| Steam-to-oil ratio – Firebag | 2.7 | 2.7 | 2.6 | |||||
|
|
||||||||
| Bitumen production – MacKay River (mbbls/d) | 36.0 | 31.1 | 27.6 | |||||
|
|
||||||||
| Steam-to-oil ratio – MacKay River | 2.9 | 3.1 | 3.2 | |||||
| Total In Situ bitumen production (mbbls/d) | 240.0 | 212.6 | 208.4 | |||||
| Total Oil Sands operations bitumen production (mbbls/d) | 498.8 | 518.0 | 446.4 | |||||
| Fort Hills | ||||||||
|
|
||||||||
| Bitumen production (mbbls/d) | 66.1 | — | — | |||||
|
|
||||||||
| Bitumen from froth | 1.3 | — | — | |||||
|
|
||||||||
| Bitumen ore mined (thousands of tonnes/day) | 106.2 | — | — | |||||
|
|
||||||||
| Bitumen ore grade quality (bbls/tonne) | 0.63 | — | — | |||||
| Syncrude | ||||||||
|
|
||||||||
| Bitumen production (mbbls/d) | 172.0 | 163.6 | 151.1 | |||||
|
|
||||||||
| Bitumen ore mined (thousands of tonnes/day) | 277.5 | 252.7 | 245.8 | |||||
|
|
||||||||
| Bitumen ore grade quality (bbls/tonne) | 0.62 | 0.63 | 0.61 | |||||
| Total Oil Sands bitumen production | 738.2 | 681.6 | 597.5 | |||||
Oil Sands operations bitumen production decreased to 498,800 bbls/d in 2018, compared to 518,000 bbls/d in 2017. The decrease was primarily attributed to lower Oil Sands Base mined bitumen production due to lower upgrader availability associated with both planned and unplanned maintenance activities in 2018, partially offset by record production volumes from Firebag and MacKay River as a result of improved reliability.
Syncrude bitumen production increased to 172,000 bbls/d in 2018 from 163,600 bbls/d in 2017, and was impacted by the same factors as production and sales described above.
Price Realizations(1)
|
Year ended December 31 Net of transportation costs, but before royalties ($/bbl) |
2018 | 2017 | 2016 | ||||||
| Oil Sands operations | |||||||||
|
|
|||||||||
| SCO and diesel | 68.97 | 61.47 | 49.75 | ||||||
|
|
|||||||||
| Bitumen | 24.70 | 33.47 | 18.48 | ||||||
|
|
|||||||||
| Crude sales basket (all products) | 54.91 | 54.26 | 40.07 | ||||||
|
|
|||||||||
| Crude sales basket, relative to WTI | (29.24 | ) | (11.91 | ) | (17.73 | ) | |||
| Fort Hills bitumen | 38.46 | — | — | ||||||
| Syncrude – sweet SCO | 70.19 | 66.05 | 56.38 | ||||||
|
|
|||||||||
| Syncrude, relative to WTI | (13.97 | ) | (0.12 | ) | (1.42 | ) | |||
Price realizations for SCO and diesel were positively impacted by the increase in WTI benchmark prices, partially offset by unfavourable SCO and heavy crude differentials in the latter half of 2018 as a result of takeaway constraints in the Alberta market. Average price realizations for Oil Sands operations were $54.91/bbl in 2018, compared to $54.26/bbl in 2017.
Average price realizations for Fort Hills bitumen were $38.46/bbl in 2018 and were higher than In Situ bitumen realizations due to a higher proportion of sales being made in the U.S. mid-continent and the U.S. Gulf Coast, where Suncor is able to utilize its logistics network to access favourable pricing in the U.S. market, combined with the improved quality associated with paraffinic froth-treated bitumen produced at Fort Hills.
Suncor's average price realization for Syncrude sales increased in 2018 to $70.19/bbl, compared to $66.05/bbl in 2017, due to improved WTI benchmark pricing, partially offset by wider SCO differentials, as mentioned above.
Royalties
Royalties were higher in 2018 relative to 2017, primarily due to higher production volumes, partially offset by lower bitumen pricing.
2018 ANNUAL REPORT Suncor Energy Inc. 31
Expenses and Other Factors
Operating expenses for 2018 were higher relative to 2017, primarily due to increased operating and maintenance costs from the addition of Fort Hills, the company's increased working interest in Syncrude acquired early in 2018, and higher planned and unplanned maintenance expenses at Syncrude and Oil Sands operations. See the Cash Operating Costs section below for further details.
Transportation expense was higher in 2018, when compared to 2017, primarily due to the increased sales volumes associated with Fort Hills and the acquisition of the additional ownership interest in Syncrude in 2018.
DD&A expense for 2018 increased when compared to 2017 due to the addition of DD&A at Fort Hills and an increased share of Syncrude DD&A as a result of the additional working interest acquired in 2018.
Cash Operating Costs
| Year ended December 31 | 2018 | 2017 | 2016 | ||||||
| Oil Sands operating, selling and general expense (OS&G) | 7 570 | 6 257 | 5 777 | ||||||
| Oil Sands operations cash operating costs(1) reconciliation | |||||||||
|
|
|||||||||
| Oil Sands operations OS&G | 4 214 | 4 062 | 4 028 | ||||||
|
|
|||||||||
| Non-production costs(2) | (93 | ) | (102 | ) | (136 | ) | |||
|
|
|||||||||
| Excess power capacity and other(3) | (237 | ) | (232 | ) | (197 | ) | |||
|
|
|||||||||
| Inventory changes | (14 | ) | 1 | (63 | ) | ||||
| Oil Sands operations cash operating costs(1) ($ millions) | 3 870 | 3 729 | 3 632 | ||||||
|
|
|||||||||
| Oil Sands operations cash operating costs(1) ($/bbl) | 25.25 | 23.80 | 26.50 | ||||||
| Fort Hills cash operating costs(1) reconciliation | |||||||||
|
|
|||||||||
| Fort Hills OS&G | 832 | — | — | ||||||
|
|
|||||||||
| Non-production costs(2) | (120 | ) | — | — | |||||
|
|
|||||||||
| Inventory changes | 55 | — | — | ||||||
| Fort Hills cash operating costs(1) ($ millions) | 767 | — | — | ||||||
|
|
|||||||||
| Fort Hills cash operating costs(1) ($/bbl) | 31.20 | — | — | ||||||
| Syncrude cash operating costs(1) reconciliation | |||||||||
|
|
|||||||||
| Syncrude OS&G | 2 523 | 2 195 | 1 749 | ||||||
|
|
|||||||||
| Non-production costs(2) | (33 | ) | (37 | ) | (31 | ) | |||
| Syncrude cash operating costs(1) ($ millions) | 2 490 | 2 158 | 1 718 | ||||||
|
|
|||||||||
| Syncrude cash operating costs(1) ($/bbl) | 47.25 | 44.05 | 35.95 | ||||||
Oil Sands operations cash operating costs per barrel(1) averaged $25.25 in 2018, compared to $23.80 in 2017. The increase was due to higher maintenance costs associated with a planned Upgrader 1 turnaround in the spring and major maintenance at Upgrader 2 in the fall, as well as
32 2018 ANNUAL REPORT Suncor Energy Inc.
unplanned upgrader maintenance, partially offset by lower natural gas prices. Total Oil Sands operations cash operating costs increased to $3.870 billion from $3.729 billion in the prior year as a result of the factors described above, as well as the operating costs associated with a draw of inventory in 2018, compared to a build of inventory in the prior year.
In 2018, non-production costs, which are excluded from Oil Sands operations cash operating costs, were lower than the prior year, primarily due to a decrease in share-based compensation expense attributed to a decrease in the company's share price in the current year, as opposed to a share price increase in 2017.
Fort Hills cash operating costs per barrel(1) averaged $31.20 in 2018, reflecting the impact of the production ramp up throughout the year. Non-production costs at Fort Hills were $120 million and included commissioning and start-up costs, in addition to excess power capacity.
Syncrude cash operating costs per barrel(1) increased to $47.25 in 2018, compared to $44.05 in the previous year, primarily as a result of the increase in operating costs associated with planned and unplanned maintenance. Suncor's share of total Syncrude cash operating costs increased to $2.490 billion from $2.158 billion in 2017, with the increase primarily attributed to the increased working interest in the project acquired early in 2018, in addition to higher maintenance costs.
Planned Maintenance
Planned Upgrader 1 maintenance at Oil Sands Base and turnaround events at Firebag and Fort Hills are scheduled for the second quarter of 2019. Coker maintenance at Syncrude and maintenance events at Upgrader 2 are scheduled for the third quarter of 2019, extending into the fourth quarter of 2019, and Fort Hills expects to complete planned maintenance in the fourth quarter of 2019. The anticipated impact of these maintenance events has been reflected in the company's 2019 guidance.
EXPLORATION AND PRODUCTION
2018 Highlights
Strategy and Investment Update
The Exploration and Production segment delivers geographically diversified cash flows and focuses primarily on low-cost projects that deliver significant returns, cash flow and long-term value.
The company has ongoing development activities offshore the east coast of Canada and in the U.K. North Sea, intended to leverage existing facilities and infrastructure to provide incremental production and extend the productive life of existing fields. These activities are planned to continue in 2019, along with development drilling at Hebron as part of the continued ramp up phase, in addition to development work on the West White Rose Project, Buzzard Phase 2, the Oda project and the Fenja project. First oil from the Oda project is expected in the second quarter of 2019.
Subsequent to the end of 2018, the company received $300 million in risk mitigation proceeds for its Libyan assets (approximately $260 million after-tax). The proceeds may be subject to a provisional repayment which is dependent on the future performance and cash flows from Suncor's Libyan assets.
2018 ANNUAL REPORT Suncor Energy Inc. 33
Financial Highlights
| Year ended December 31 ($ millions) | 2018 | 2017 | 2016 | ||||||
| Gross revenues(1) | 3 474 | 3 177 | 2 432 | ||||||
|
|
|||||||||
| Less: Royalties | (257 | ) | (266 | ) | (201 | ) | |||
| Operating revenues, net of royalties | 3 217 | 2 911 | 2 231 | ||||||
| Net earnings | 808 | 732 | 190 | ||||||
| Adjusted for: | |||||||||
|
|
|||||||||
| Non-cash loss on equity investment(2) | 90 | — | — | ||||||
|
|
|||||||||
| Impact of income tax rate adjustments on deferred income taxes | — | 14 | (180 | ) | |||||
|
|
|||||||||
| Operating earnings(3) | 898 | 746 | 10 | ||||||
|
|
|||||||||
| Funds from operations(3) | 1 869 | 1 725 | 1 313 | ||||||
Bridge Analysis of Operating Earnings ($ millions)(1)
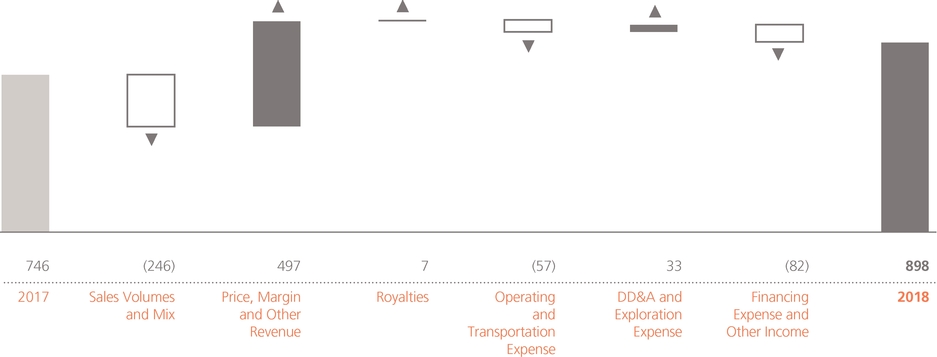
Operating earnings were $898 million for E&P in 2018, compared to $746 million in the prior year. The improvement is primarily due to increased price realizations, consistent with higher Brent crude benchmarks, lower DD&A and exploration charges, partially offset by a decrease in sales volumes and increased operating expenses.
Net earnings were $808 million for E&P in 2018, compared to $732 million in 2017, and were impacted by the same factors as operating earnings described above. In addition, 2018 net earnings included a $90 million non-cash loss on an asset exchange with Canbriam, while 2017 net earnings were impacted by a $14 million charge associated with a change in the U.S. corporate tax rate.
Funds from operations were $1.869 billion in 2018, compared to $1.725 billion in 2017. The increase was largely due to the same factors that impacted operating earnings above, adjusted for the impact of non-cash DD&A.
34 2018 ANNUAL REPORT Suncor Energy Inc.
Production Volumes
| Year ended December 31 | 2018 | 2017 | 2016 | |||||
| E&P Canada | ||||||||
|
|
||||||||
| Terra Nova (mbbls/d) | 11.7 | 11.5 | 12.4 | |||||
|
|
||||||||
| Hibernia (mbbls/d) | 22.1 | 28.5 | 26.8 | |||||
|
|
||||||||
| White Rose (mbbls/d) | 6.6 | 11.4 | 10.9 | |||||
|
|
||||||||
| Hebron (mbbls/d) | 13.0 | 0.4 | — | |||||
|
|
||||||||
| North America Onshore (mboe/d) | 0.5 | 1.9 | 2.8 | |||||
| 53.9 | 53.7 | 52.9 | ||||||
|
|
||||||||
| E&P International | ||||||||
|
|
||||||||
| Buzzard (mboe/d) | 34.2 | 43.8 | 46.0 | |||||
|
|
||||||||
| Golden Eagle (mboe/d) | 12.4 | 19.6 | 18.6 | |||||
| United Kingdom (mboe/d) | 46.6 | 63.4 | 64.6 | |||||
|
|
||||||||
| Libya (mbbls/d)(1) | 2.9 | 4.5 | 0.4 | |||||
|
|
||||||||
| 49.5 | 67.9 | 65.0 | ||||||
| Total Production (mboe/d) | 103.4 | 121.6 | 117.9 | |||||
|
|
||||||||
| Production Mix (liquids/gas) (%) | 99/1 | 97/3 | 96/4 | |||||
| Total Sales Volumes (mboe/d) | 102.8 | 120.8 | 119.3 | |||||
E&P Canada production volumes averaged 53,900 boe/d in 2018, compared to 53,700 boe/d in 2017, with production from Hebron and development drilling at existing facilities offsetting the impact of a major storm system at the end of 2018, natural declines, and planned and unplanned maintenance events throughout 2018. Production at the White Rose field was shut in from mid-November to late January 2019 due to unplanned maintenance. The return to normal production rates is expected to occur in a phased approach.
Production volumes in the U.K. decreased to 46,600 boe/d from 63,400 boe/d as a result of natural declines at both Golden Eagle and Buzzard, in addition to an increase in planned and unplanned maintenance at Buzzard in 2018.
Price Realizations
|
Year ended December 31 Net of transportation costs, but before royalties |
2018 | 2017 | 2016 | |||||
| Exploration and Production | ||||||||
|
|
||||||||
| E&P Canada – Crude oil and natural gas liquids ($/bbl) | 87.82 | 69.14 | 57.37 | |||||
|
|
||||||||
| E&P Canada – Natural gas ($/mcf) | 1.94 | 1.77 | 1.71 | |||||
|
|
||||||||
| E&P International ($/boe) | 86.77 | 65.46 | 52.07 | |||||
| E&P average price ($/boe) | 86.96 | 66.20 | 53.34 | |||||
Average price realizations from E&P Canada and E&P International in 2018 were higher than 2017, consistent with the increase in benchmark prices for Brent crude in 2018.
Expenses and Other Factors
Operating expenses were higher in 2018, compared to 2017, primarily due to the addition of Hebron operating costs and an increase in maintenance expense.
DD&A and exploration expenses decreased in 2018, compared to the prior year, with decreased production in the U.K., White Rose and Hibernia more than offsetting additional DD&A from Hebron.
Planned Maintenance of Operated Assets
A planned two-week maintenance event at Terra Nova is scheduled to commence in the second quarter of 2019. The anticipated impact of this maintenance has been reflected in the company's 2019 guidance.
2018 ANNUAL REPORT Suncor Energy Inc. 35
REFINING AND MARKETING
2018 Highlights
Strategy and Investment Update
The Refining and Marketing network serves to maximize Suncor's integrated returns by extending the value chain from oil sands production to the end customer and is a key component of the integrated business model. The company aims to operate its refineries at optimal levels of utilization to provide reliable offtake and secure pricing for a portion of the production from the Oil Sands segment.
Suncor continued to grow retail market share in Canada through its Petro-Canada® branded-network. In 2018, Suncor leveraged its strong Petro-Canada® brand through a nationwide campaign to increase sales volumes and non-petroleum revenues through the company's network of convenience stores and car washes, and will continue these efforts in 2019.
Financial Highlights
| Year ended December 31 ($ millions) | 2018 | 2017 | 2016 | |||||
| Operating revenues | 23 724 | 19 704 | 17 260 | |||||
| Net earnings | 3 153 | 2 658 | 1 890 | |||||
| Adjusted for: | ||||||||
|
|
||||||||
| Impact of income tax rate adjustments on deferred taxes | — | (140 | ) | — | ||||
|
|
||||||||
| Gain on significant disposal | — | (354 | ) | — | ||||
| Operating earnings(1) | 3 153 | 2 164 | 1 890 | |||||
|
|
||||||||
| Funds from operations(1) | 3 794 | 2 841 | 2 606 | |||||
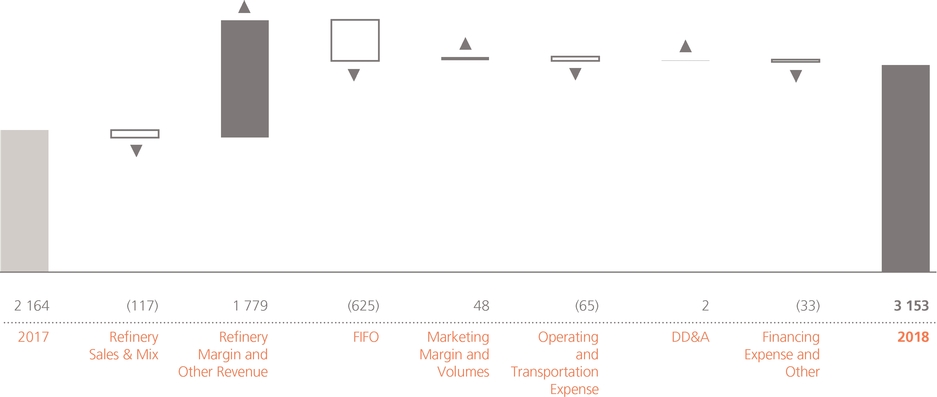
Bridge Analysis of Operating Earnings ($ millions)(1)
36 2018 ANNUAL REPORT Suncor Energy Inc.
R&M contributed record annual operating earnings of $3.153 billion in 2018, compared with $2.164 billion in 2017. The increase was due to improved refining margins resulting from wider crude differentials, favourable product location differentials, and improved benchmark crack spreads, partially offset by a FIFO loss and lower crude throughput due to an increase in planned maintenance.
Net earnings in 2018 were $3.153 billion, compared to net earnings of $2.658 billion in 2017, and were impacted by the same factors as operating earnings described above. 2017 net earnings also included a $354 million gain related to the sale of the company's lubricants business, and a $140 million deferred tax recovery related to changes in the U.S. corporate tax rate from 35% to 21%.
The FIFO loss was a result of the significant decline in crude oil and refined product benchmarks near the end of 2018 and was partially offset by a realization of intersegment profit associated with the consumption of internal crude feedstock from the company's Oil Sands assets, for a net inventory valuation loss of $216 million in the year. In addition, the favourable impact of wider crude differentials on refining margins partially offset the decrease in Oil Sands bitumen price realizations.
Funds from operations were also an annual record of $3.794 billion in 2018, compared to $2.841 billion in 2017, due primarily to the same factors that impacted operating earnings described above.
Volumes
| Year ended December 31 | 2018 | 2017 | 2016 | |||||
| Crude oil processed (mbbls/d) | ||||||||
|
|
||||||||
| Eastern North America | 208.1 | 206.4 | 203.1 | |||||
|
|
||||||||
| Western North America | 222.7 | 234.8 | 225.5 | |||||
| Total | 430.8 | 441.2 | 428.6 | |||||
| Refinery utilization(1) (%) | ||||||||
|
|
||||||||
| Eastern North America | 94 | 93 | 92 | |||||
|
|
||||||||
| Western North America | 93 | 98 | 94 | |||||
| Total | 93 | 96 | 93 | |||||
| Refined Product Sales (mbbls/d) | ||||||||
|
|
||||||||
| Gasoline | 245.6 | 242.9 | 244.3 | |||||
|
|
||||||||
| Distillate | 203.4 | 199.3 | 186.1 | |||||
|
|
||||||||
| Other | 78.4 | 88.3 | 91.0 | |||||
| Total | 527.4 | 530.5 | 521.4 | |||||
| Refining margin(2) ($/bbl) | 34.50 | 24.20 | 20.45 | |||||
|
|
||||||||
| Refining operating expense(2) ($/bbl) | 5.35 | 5.05 | 5.10 | |||||
Refinery utilization averaged 93% in 2018, compared with 96% in 2017. The decrease in utilization was primarily due to an increase in planned maintenance in 2018 compared to 2017, with the Edmonton refinery undergoing its first full plant turnaround in its history, in addition to planned maintenance events at Montreal, Sarnia and Commerce City. The company was able to partially mitigate the impact of the planned maintenance that occurred during the second quarter of 2018 with the sale of inventory that had been strategically built up earlier in the year.
Total refined products sales in 2018 were comparable to 2017, reflecting continued strong product demand and record wholesale volumes in Canada.
Prices and Margins
Refining and Product Supply prices and margins were higher in 2018 compared to 2017, and were impacted primarily by the following factors:
Marketing gross margins in 2018 were higher than in the prior year, primarily due to an increase in wholesale sales as well as stronger wholesale unit margins.
Expenses and Other Factors
Operating and transportation expenses were higher in 2018 compared to 2017, primarily due to an increase in refinery maintenance costs, partially offset by lower natural gas input prices.
Planned Maintenance
A less intensive maintenance program is planned in 2019 following the completion of significant turnaround events in 2018. Planned maintenance events in 2019 are focused only on certain units within each of the refineries and include a two-week turnaround at the Commerce City refinery scheduled in the first quarter, an eight-week turnaround at the Sarnia refinery and a six-week turnaround at the Montreal refinery, both scheduled to begin in the second quarter of 2019. The Edmonton refinery has a planned six-week turnaround scheduled to begin in the third quarter and extend into the fourth quarter of 2019. The estimated impact of these maintenance events has been reflected in the company's 2019 guidance.
2018 ANNUAL REPORT Suncor Energy Inc. 37
CORPORATE, ENERGY TRADING AND ELIMINATIONS
2018 Highlights
Strategy and Investment Update
The Energy Trading business supports the company by securing market access, optimizing price realizations, managing inventory levels and limiting the impacts of external market factors, such as pipeline disruptions, lack of egress or outages at refining customers, while generating trading earnings through established strategies. The Energy Trading business continues to evaluate additional transportation and storage agreements to maximize crude price realizations and is developing an asset backed trading program to realize incremental value from market dislocations and arbitrage opportunities impacting Suncor's producing assets.
Returning value to shareholders continues to be a top priority for Suncor, as demonstrated by the company's history of dividend increases and commitment to its share repurchase program. Since reinstating the share repurchase program in 2017, the company has completed $4.818 billion in share repurchases as of February 25, 2019 and the Board of Directors has approved up to a further $2.0 billion in share repurchases, reinforcing the company's belief in its ongoing ability to generate cash flow and its commitment to return cash to shareholders.
Financial Highlights
| Year ended December 31 ($ millions) | 2018 | 2017 | 2016 | ||||||
| Net (loss) earnings | (1 521 | ) | 59 | (486 | ) | ||||
| Adjusted for: | |||||||||
|
|
|||||||||
| Unrealized foreign exchange loss (gain) on U.S. dollar denominated debt | 989 | (702 | ) | (524 | ) | ||||
|
|
|||||||||
| Loss (gain) on interest rate swaps | — | 20 | (6 | ) | |||||
|
|
|||||||||
| Non-cash loss on early payment of long-term debt | — | 28 | 73 | ||||||
|
|
|||||||||
| Gain on significant disposal | — | (83 | ) | — | |||||
|
|
|||||||||
| Impact of income tax rate adjustments on deferred income taxes | — | 2 | — | ||||||
|
|
|||||||||
| Derecognition and impairments | — | — | 31 | ||||||
|
|
|||||||||
| COS acquisition and related costs | — | — | 38 | ||||||
| Operating (loss) earnings(1) | (532 | ) | (676 | ) | (874 | ) | |||
|
|
|||||||||
| Renewable Energy | — | (4 | ) | 38 | |||||
|
|
|||||||||
| Energy Trading | 92 | (62 | ) | 4 | |||||
|
|
|||||||||
| Corporate | (876 | ) | (528 | ) | (864 | ) | |||
|
|
|||||||||
| Eliminations – Intersegment profit realized (eliminated) | 252 | (82 | ) | (52 | ) | ||||
| Funds used in operations(1) | (361 | ) | (165 | ) | (600 | ) | |||
38 2018 ANNUAL REPORT Suncor Energy Inc.
Renewable Energy
| Year ended December 31 | 2018 | 2017 | 2016 | ||||
| Power generation marketed (gigawatt hours)(1) | 183 | 255 | 478 | ||||
Suncor's Renewable Energy assets realized nil operating earnings during the year, compared to an operating loss of $4 million in 2017. The improvement was primarily due to higher power prices.
Energy Trading
Energy Trading activities reported operating earnings of $92 million in 2018, compared to an operating loss of $62 million in 2017. The increase was primarily due to improved crude location spreads in the current year.
Corporate
Corporate incurred an operating loss of $876 million in 2018, compared with an operating loss of $528 million in 2017. The increased loss was primarily due to a decrease in the amount of capitalized interest, partially offset by a decrease in share-based compensation expense, a larger operational foreign exchange gain compared to 2017 and lower interest expense as a result of a lower amount of outstanding debt. Suncor capitalized $156 million of its borrowing costs in 2018 as part of the cost of major development assets and construction projects in progress, compared to $729 million in the prior year. The decrease was driven by the commissioning of Fort Hills in early 2018 and the completion of the Hebron project in late 2017.
Eliminations – Intersegment profit realized (eliminated)
Eliminations reflect the deferral or realization of profit on crude oil sales from Oil Sands and East Coast Canada to Refining and Marketing. Consolidated profits are only realized when the company sells the products produced from intersegment purchases of crude feedstock to third parties. In 2018, the company realized $252 million of after-tax intersegment profit, compared to an elimination of profit of $82 million in the prior year. This combined with the FIFO loss in the R&M segment resulted in a net $216 million after-tax inventory valuation loss in 2018. The change year-over-year was primarily due to the decrease in Oil Sands crude margins towards the end of 2018, as higher margin crude feedstock inventory sourced internally from Oil Sands was sold and replaced by lower margin crude feedstock inventory, resulting in a net release of profit at the enterprise level.
2018 ANNUAL REPORT Suncor Energy Inc. 39
5. FOURTH QUARTER 2018 ANALYSIS
Financial and Operational Highlights
|
Year ended December 31 ($ millions, except as noted) |
2018 | 2017 | |||||
| Net (loss) earnings | |||||||
|
|
|||||||
| Oil Sands | (393 | ) | 670 | ||||
|
|
|||||||
| Exploration and Production | (115 | ) | 217 | ||||
|
|
|||||||
| Refining and Marketing | 723 | 886 | |||||
|
|
|||||||
| Corporate, Energy Trading and Eliminations | (495 | ) | (391 | ) | |||
| Total | (280 | ) | 1 382 | ||||
| Operating earnings (loss)(1) | |||||||
|
|
|||||||
| Oil Sands | (393 | ) | 615 | ||||
|
|
|||||||
| Exploration and Production | 108 | 231 | |||||
|
|
|||||||
| Refining and Marketing | 723 | 746 | |||||
|
|
|||||||
| Corporate, Energy Trading and Eliminations | 142 | (282 | ) | ||||
| Total | 580 | 1 310 | |||||
| Funds from (used in) operations(1) | |||||||
|
|
|||||||
| Oil Sands | 601 | 1 780 | |||||
|
|
|||||||
| Exploration and Production | 367 | 431 | |||||
|
|
|||||||
| Refining and Marketing | 826 | 935 | |||||
|
|
|||||||
| Corporate, Energy Trading and Eliminations | 213 | (130 | ) | ||||
| Total funds from operations | 2 007 | 3 016 | |||||
|
|
|||||||
| Changes in non-cash working capital | 1 033 | (261 | ) | ||||
| Cash flow provided by operating activities | 3 040 | 2 755 | |||||
| Production volumes (mboe/d) | |||||||
|
|
|||||||
| Oil Sands | 740.8 | 621.2 | |||||
|
|
|||||||
| Exploration and Production | 90.2 | 115.2 | |||||
| Total | 831.0 | 736.4 | |||||
Net Earnings (Loss)
Suncor had a consolidated net loss for the fourth quarter of 2018 of $280 million, compared to net earnings of $1.382 billion for the prior year quarter. Net earnings were primarily affected by the same factors that influenced operating earnings described subsequently in this section of this document. Other items affecting net earnings (loss) over these periods included:
Cash Flow provided by Operating Activities and Funds from Operations
Funds from operations were $2.007 billion in the fourth quarter of 2018, compared to $3.016 billion in the fourth quarter of 2017, and were influenced by the same factors impacting operating earnings described in the Segmented Analysis below, excluding the recovery of non-cash share-based compensation, as well as unrealized gains on crude optimization activities.
Cash flow provided by operating activities, which includes changes in non-cash working capital, was $3.040 billion in the fourth quarter of 2018, compared to $2.755 billion in the fourth quarter of 2017, and was influenced by the same factors impacting operating earnings noted below, excluding the recovery of non-cash share-based compensation, as well as unrealized gains on crude optimization activities.
Segmented Analysis
Oil Sands
The Oil Sands segment had an operating loss of $393 million in the fourth quarter of 2018, compared to operating earnings of $615 million in the prior year quarter. The decrease was due to lower crude price realizations across all product lines, higher operating costs with the addition of Fort Hills production, as well as lower sales of SCO from Oil Sands operations due to planned and unplanned
40 2018 ANNUAL REPORT Suncor Energy Inc.
maintenance at Upgrader 2. These factors were partially offset by an increase in overall sales volumes.
Oil Sands operations production was 432,700 bbls/d in the fourth quarter of 2018, compared to 446,800 bbls/d in the prior year quarter. The decrease was primarily due to the completion of planned maintenance at Upgrader 2 early in the fourth quarter of 2018 and unplanned maintenance at Upgrader 2, which occurred late in the fourth quarter of 2018 and was resolved prior to the end of the quarter, partially offset by an associated increase in non-upgraded bitumen production. Upgrader utilization was 79% in the fourth quarter of 2018, compared to 93% in the prior year period.
Fort Hills exceeded target production rates with a utilization rate of 94% for the fourth quarter of 2018 and production of 98,500 bbls/d of bitumen net to Suncor.
Sales volumes for Oil Sands operations were 460,500 bbls/d in the fourth quarter of 2018, compared to 461,700 bbls/d in the prior year quarter, with an inventory draw in both non-upgraded bitumen and SCO offsetting the decline in overall production.
Bitumen sales at Fort Hills averaged 94,600 bbls/d, net to Suncor, in the fourth quarter of 2018, reflecting a small build of inventory as increased sales were transported to customers extending to the U.S. Gulf Coast.
Suncor's share of Syncrude production and sales was 209,600 bbls/d in the fourth quarter of 2018, compared to 174,400 bbls/d in the prior year quarter. The increase was primarily due to stronger reliability at Syncrude, with 101% utilization achieved in the period, in addition to the acquisition of an additional 5% working interest in Syncrude in the first quarter of 2018.
Exploration and Production
Operating earnings for the E&P segment in the fourth quarter of 2018 decreased to $108 million, from $231 million in the prior year quarter, as a result of lower overall production and an increase in operating expenses, primarily associated with the ramp up of Hebron, partially offset by lower royalties.
Production volumes for E&P Canada were 47,900 boe/d in the fourth quarter of 2018, compared to 55,500 boe/d in the prior year quarter. The decrease in production was due to a temporary production interruption at the company's East Coast Canada assets as a result of a major storm system during the quarter, in addition to natural declines, partially offset by the addition of production from Hebron, which averaged 15,700 bbls/d, net to the company. Production at the White Rose field was shut in from mid-November 2018 to late January 2019 due to operational complications, with partial production restarting at the end of January 2019.
E&P International production decreased to 42,300 boe/d in the fourth quarter of 2018, from 59,700 boe/d in the prior year quarter, primarily due to natural declines in the U.K. and an unplanned outage at Buzzard, which was resolved by the end of the fourth quarter.
E&P sales volumes decreased to 83,100 boe/d in the fourth quarter of 2018, compared to 104,800 boe/d in the prior year quarter, due to the decrease in production, as well as a larger inventory build at East Coast Canada associated with the timing of cargo sales.
Refining and Marketing
R&M operating earnings in the fourth quarter of 2018 were $723 million, compared to $746 million in the prior year quarter. The decrease was due to a FIFO loss associated with the significant decline in crude and refined product benchmarks during the quarter, partially offset by improved refining margins, primarily attributed to wider crude differentials, as well as record crude throughput.
At the company level, the FIFO loss was partially offset by a realization of intersegment profit associated with the consumption of internal crude feedstock from the company's Oil Sands assets. The favourable impact of wider crude differentials partially offset the decrease in Oil Sands price realizations.
Refinery crude throughput of 467,900 bbls/d in the fourth quarter of 2018 represents a new quarterly record, compared to 432,400 bbls/d in the prior year quarter, in which the Montreal refinery was impacted by a third-party power outage. Reliability at all of the company's refineries was strong in the fourth quarter of 2018, resulting in a utilization rate of 101%, compared to 94% in the prior year quarter.
Total refined products sales of 530,600 bbls/d in the fourth quarter of 2018 were comparable to 526,800 bbls/d in the prior year quarter, reflecting higher refinery crude throughput and strong product demand.
Corporate, Energy Trading and Eliminations
Corporate, Energy Trading and Eliminations had operating earnings of $142 million in the fourth quarter of 2018, compared to an operating loss of $282 million in the fourth quarter of 2017. The increase was due primarily to higher intersegment profit realizations, lower share-based compensation expense for the quarter, favourable trading results in the Energy Trading business, due to stronger crude location spreads, interest savings as a result of early debt repayment and higher Renewable Energy earnings as a result of higher power prices, partially offset by a significant decrease in capitalized interest during the quarter. Suncor capitalized $28 million of its borrowing costs in the fourth quarter of 2018 as part of the cost of major development assets and construction projects in progress, compared to $177 million in the prior year quarter, mainly as a result of the commissioning of the Fort Hills project early in 2018.
2018 ANNUAL REPORT Suncor Energy Inc. 41
Financial Summary
|
Three months ended ($ millions, unless otherwise noted) |
Dec 31 2018 |
Sept 30 2018 |
June 30 2018 |
Mar 31 2018 |
Dec 31 2017 |
Sept 30 2017 |
June 30 2017 |
Mar 31 2017 |
|||||||||||
| Total production (mboe/d) | |||||||||||||||||||
|
|
|||||||||||||||||||
| Oil Sands | 740.8 | 651.7 | 547.6 | 571.7 | 621.2 | 628.4 | 413.6 | 590.6 | |||||||||||
|
|
|||||||||||||||||||
| Exploration and Production | 90.2 | 92.1 | 114.1 | 117.7 | 115.2 | 111.5 | 125.5 | 134.5 | |||||||||||
| 831.0 | 743.8 | 661.7 | 689.4 | 736.4 | 739.9 | 539.1 | 725.1 | ||||||||||||
| Revenues and other income | |||||||||||||||||||
|
|
|||||||||||||||||||
| Operating revenues, net of royalties | 8 561 | 10 847 | 10 327 | 8 807 | 8 973 | 7 963 | 7 231 | 7 787 | |||||||||||
|
|
|||||||||||||||||||
| Other income | 384 | 16 | 101 | (57 | ) | 41 | 43 | 16 | 25 | ||||||||||
| 8 945 | 10 863 | 10 428 | 8 750 | 9 014 | 8 006 | 7 247 | 7 812 | ||||||||||||
| Net (loss) earnings | (280 | ) | 1 812 | 972 | 789 | 1 382 | 1 289 | 435 | 1 352 | ||||||||||
|
|
|||||||||||||||||||
| per common share – basic (dollars) | (0.18 | ) | 1.12 | 0.60 | 0.48 | 0.84 | 0.78 | 0.26 | 0.81 | ||||||||||
|
|
|||||||||||||||||||
| per common share – diluted (dollars) | (0.18 | ) | 1.11 | 0.59 | 0.48 | 0.84 | 0.78 | 0.26 | 0.81 | ||||||||||
| Operating earnings(1) | 580 | 1 557 | 1 190 | 985 | 1 310 | 867 | 199 | 812 | |||||||||||
|
|
|||||||||||||||||||
| per common share – basic(1) (dollars) | 0.36 | 0.96 | 0.73 | 0.60 | 0.79 | 0.52 | 0.12 | 0.49 | |||||||||||
| Funds from operations(1) | 2 007 | 3 139 | 2 862 | 2 164 | 3 016 | 2 472 | 1 627 | 2 024 | |||||||||||
|
|
|||||||||||||||||||
| per common share – basic(1) (dollars) | 1.26 | 1.94 | 1.75 | 1.32 | 1.83 | 1.49 | 0.98 | 1.21 | |||||||||||
| Cash flow provided by operating activities | 3 040 | 4 370 | 2 446 | 724 | 2 755 | 2 912 | 1 671 | 1 628 | |||||||||||
|
|
|||||||||||||||||||
| per common share – basic (dollars) | 1.90 | 2.70 | 1.50 | 0.44 | 1.67 | 1.75 | 1.00 | 0.98 | |||||||||||
| ROCE(1) (%) for the twelve months ended | 8.0 | 9.7 | 8.3 | 6.5 | 6.7 | 5.5 | 4.9 | 3.5 | |||||||||||
| ROCE(1) (%) excluding major projects in progress for the twelve months ended | 8.2 | 10.4 | 9.5 | 7.8 | 8.6 | 7.0 | 6.2 | 4.4 | |||||||||||
| After-tax unrealized foreign exchange (loss) gain on U.S. dollar denominated debt | (637 | ) | 195 | (218 | ) | (329 | ) | (91 | ) | 412 | 278 | 103 | |||||||
| Common share information (dollars) | |||||||||||||||||||
|
|
|||||||||||||||||||
| Dividend per common share | 0.36 | 0.36 | 0.36 | 0.36 | 0.32 | 0.32 | 0.32 | 0.32 | |||||||||||
|
|
|||||||||||||||||||
| Share price at the end of trading | |||||||||||||||||||
|
|
|||||||||||||||||||
| Toronto Stock Exchange (Cdn$) | 38.13 | 49.98 | 53.50 | 44.49 | 46.15 | 43.73 | 37.89 | 40.83 | |||||||||||
|
|
|||||||||||||||||||
| New York Stock Exchange (US$) | 27.97 | 38.69 | 40.68 | 34.54 | 36.72 | 35.05 | 29.20 | 30.75 | |||||||||||
42 2018 ANNUAL REPORT Suncor Energy Inc.
Business Environment
|
Three months ended (average for the period ended, except as noted) |
Dec 31 2018 |
Sept 30 2018 |
June 30 2018 |
Mar 31 2018 |
Dec 31 2017 |
Sept 30 2017 |
June 30 2017 |
Mar 31 2017 |
|||||||||||
| WTI crude oil at Cushing | US$/bbl | 58.85 | 69.50 | 67.90 | 62.90 | 55.40 | 48.20 | 48.30 | 51.85 | ||||||||||
|
|
|||||||||||||||||||
| Dated Brent crude | US$/bbl | 67.80 | 75.25 | 74.40 | 66.80 | 61.40 | 52.50 | 49.85 | 53.75 | ||||||||||
|
|
|||||||||||||||||||
| Dated Brent/Maya FOB price differential | US$/bbl | 4.35 | 10.20 | 12.40 | 7.70 | 9.60 | 6.30 | 5.80 | 9.05 | ||||||||||
|
|
|||||||||||||||||||
| MSW at Edmonton | Cdn$/bbl | 42.70 | 82.10 | 80.95 | 72.45 | 69.30 | 57.05 | 62.30 | 64.25 | ||||||||||
|
|
|||||||||||||||||||
| WCS at Hardisty | US$/bbl | 19.50 | 47.35 | 48.65 | 38.60 | 43.10 | 38.25 | 37.20 | 37.30 | ||||||||||
|
|
|||||||||||||||||||
| Light/heavy crude oil differential for WTI at Cushing less WCS at Hardisty | US$/bbl | 39.35 | 22.15 | 19.25 | 24.30 | 12.30 | 9.95 | 11.10 | 14.55 | ||||||||||
|
|
|||||||||||||||||||
| Condensate at Edmonton | US$/bbl | 45.30 | 66.82 | 68.50 | 63.15 | 57.95 | 47.60 | 48.45 | 52.20 | ||||||||||
|
|
|||||||||||||||||||
| Natural gas (Alberta spot) at AECO | Cdn$/mcf | 1.60 | 1.19 | 1.20 | 1.77 | 1.70 | 1.45 | 2.80 | 2.70 | ||||||||||
|
|
|||||||||||||||||||
| Alberta Power Pool Price | Cdn$/MWh | 55.55 | 54.45 | 56.00 | 34.95 | 22.35 | 24.55 | 19.30 | 22.40 | ||||||||||
|
|
|||||||||||||||||||
| New York Harbor 3-2-1 crack(1) | US$/bbl | 16.20 | 19.65 | 20.65 | 15.50 | 19.40 | 22.35 | 16.35 | 12.55 | ||||||||||
|
|
|||||||||||||||||||
| Chicago 3-2-1 crack(1) | US$/bbl | 13.35 | 19.05 | 18.30 | 12.85 | 20.20 | 19.25 | 14.40 | 11.15 | ||||||||||
|
|
|||||||||||||||||||
| Portland 3-2-1 crack(1) | US$/bbl | 21.60 | 21.40 | 27.90 | 20.35 | 22.10 | 26.80 | 21.25 | 18.45 | ||||||||||
|
|
|||||||||||||||||||
| Gulf Coast 3-2-1 crack(1) | US$/bbl | 15.10 | 18.85 | 20.25 | 15.55 | 18.25 | 21.45 | 16.80 | 14.00 | ||||||||||
|
|
|||||||||||||||||||
| Exchange rate | US$/Cdn$ | 0.76 | 0.77 | 0.77 | 0.79 | 0.79 | 0.80 | 0.74 | 0.76 | ||||||||||
|
|
|||||||||||||||||||
| Exchange rate (end of period) | US$/Cdn$ | 0.73 | 0.77 | 0.76 | 0.78 | 0.80 | 0.80 | 0.77 | 0.75 | ||||||||||
2018 ANNUAL REPORT Suncor Energy Inc. 43
Significant or Unusual Items Impacting Net Earnings
Trends in Suncor's quarterly net earnings and cash flow provided by operating activities are driven primarily by production volumes, which can be significantly impacted by major maintenance events, such as the planned upgrader maintenance and the turnaround at the Edmonton refinery that occurred in the second quarter of 2018, and unplanned outages such as the major storm system on the east coast of Canada in the fourth quarter of 2018.
Trends in Suncor's quarterly net earnings and cash flow provided by operating activities are also affected by changes in commodity prices, price differentials, refining crack spreads and foreign exchange rates, as described in the Financial Information section of this MD&A. In addition to the impacts of changes in production volumes and business environment, net earnings over the last eight quarters were affected by the following events or significant adjustments:
44 2018 ANNUAL REPORT Suncor Energy Inc.
Capital and Exploration Expenditures by Segment
| Year ended December 31 ($ millions) | 2018 | 2017 | 2016 | |||||
| Oil Sands | 3 546 | 5 059 | 4 724 | |||||
|
|
||||||||
| Exploration and Production | 946 | 824 | 1 139 | |||||
|
|
||||||||
| Refining and Marketing | 856 | 634 | 685 | |||||
|
|
||||||||
| Corporate, Energy Trading and Eliminations | 58 | 34 | 34 | |||||
| Total | 5 406 | 6 551 | 6 582 | |||||
|
|
||||||||
| Less: capitalized interest on debt | (156 | ) | (729 | ) | (596 | ) | ||
| 5 250 | 5 822 | 5 986 | ||||||
Capital and Exploration Expenditures by Type(1)(2)(3)
| Year ended December 31, 2018 ($ millions) | Sustaining | Growth | Total | |||||
| Oil Sands | ||||||||
|
|
||||||||
| Oil Sands Base | 1 820 | 32 | 1 852 | |||||
|
|
||||||||
| In Situ | 351 | 26 | 377 | |||||
|
|
||||||||
| Fort Hills | 250 | 365 | 615 | |||||
|
|
||||||||
| Syncrude | 583 | 3 | 586 | |||||
|
|
||||||||
| Exploration and Production | 11 | 898 | 909 | |||||
|
|
||||||||
| Refining and Marketing | 853 | — | 853 | |||||
|
|
||||||||
| Corporate, Energy Trading and Eliminations | 58 | — | 58 | |||||
| 3 926 | 1 324 | 5 250 | ||||||
In 2018, Suncor's capital expenditures on property, plant and equipment and exploration activities totalled $5.250 billion, excluding capitalized borrowing costs of $156 million. Activity in 2018 included the following:
Oil Sands Base
Oil Sands Base sustaining capital expenditures were $1.820 billion in 2018 and were primarily focused on ensuring continued safe, reliable and efficient operations, as well as environmental compliance such as the continued development of tailings infrastructure. The company's planned maintenance program in 2018 included a planned turnaround at Upgrader 1 in the spring and major maintenance at Upgrader 2 in the fall, in addition to other maintenance initiatives.
Oil Sands Base growth capital of $32 million in 2018 was focused on projects expected to improve productive capacity, including development of the coke-fired boiler replacement project.
In Situ
In Situ capital expenditures were $377 million, of which $351 million was directed towards sustaining capital expenditures, which focused on the ongoing design and construction of well pads that are expected to maintain existing production levels at Firebag and MacKay River in future years as production from existing well pads declines.
Growth capital of $26 million in 2018 was related to development of emerging properties and new technologies.
Fort Hills
Fort Hills capital expenditures were $615 million in 2018, with $365 million directed toward growth spending and completion of the project within the year.
Sustaining capital of $250 million in 2018 included activities supporting the execution of the mine and tailings plan following the achievement of first oil.
2018 ANNUAL REPORT Suncor Energy Inc. 45
Syncrude
Syncrude capital and exploration expenditures were $586 million in 2018, the majority of which was for sustaining capital expenditures focused on maintaining assets, including capital related to turnarounds and maintenance.
Exploration and Production
Exploration and Production capital and exploration expenditures were $909 million in 2018, which was primarily directed to development drilling at all offshore assets, as well as development work on the West White Rose Project, the Norwegian Oda and Fenja projects, and pre-sanction design work on the Rosebank project in the U.K.
Refining and Marketing
Refining and Marketing capital expenditures were $853 million in 2018, all of which was directed to sustaining activities focused on planned maintenance events at the company's refineries, enhancements to retail operations and technology upgrades. In 2018, the company undertook the most significant maintenance program in its history, performing a full plant shutdown of the Edmonton refinery for the first time.
Capital Projects Update
Suncor anticipates 2019 capital expenditures to be directed to the following projects and initiatives:
Oil Sands Operations
For 2019, plans for sustaining capital will primarily be focused on tailings management, planned maintenance, which includes major maintenance on coker drums, and the naphtha and gasoil hydrotreaters. Other investments to maintain production capacity at existing facilities include continued development of new well pads at In Situ to offset natural production declines, development of an autonomous haul truck program to further improve the efficiency of mining operations and replacement of the coke-fired boilers at Oil Sands Base.
Fort Hills
Sustaining capital expenditures in 2019 for Fort Hills will be focused on tailings management and projects to preserve production capacity and maintain reliability, including mining equipment.
Syncrude
Sustaining capital expenditures in 2019 for Syncrude are expected to focus on reliability programs, planned maintenance and maintaining production capacity.
Exploration and Production
Capital expenditures in 2019 for E&P will be focused on future growth projects, including the West White Rose Project off the east coast of Canada. The West White Rose Project was sanctioned in the second quarter of 2017. Suncor is a non-operating partner with a blended working interest of approximately 26% and the company's share of peak oil is expected to be 20,000 bbls/d. The operator originally estimated first oil would be achieved in 2022; however, due to a recent delay in the tow-out schedule, achieving this first-oil date is uncertain. An update from the project operator is expected in the first half of 2019.
Additional growth capital in 2019 will include development drilling at Hibernia, White Rose, Terra Nova and Buzzard, development of the Buzzard Phase 2 project, which was sanctioned in 2018, and the Norwegian Oda and Fenja projects, as well as pre-sanction design work on the Rosebank future development project.
Refining and Marketing
The company expects that sustaining capital will focus on planned maintenance events, technological investments and routine asset replacement.
46 2018 ANNUAL REPORT Suncor Energy Inc.
8. FINANCIAL CONDITION AND LIQUIDITY
Liquidity and Capital Resources
| At December 31 ($ millions, except as noted) | 2018 | 2017 | 2016 | ||||||
| Net cash from (used in) | |||||||||
|
|
|||||||||
| Operating activities | 10 580 | 8 966 | 5 680 | ||||||
|
|
|||||||||
| Investing activities | (6 697 | ) | (5 019 | ) | (7 507 | ) | |||
|
|
|||||||||
| Financing activities | (4 426 | ) | (4 223 | ) | 869 | ||||
|
|
|||||||||
| Foreign exchange gain (on cash and cash equivalents) | 92 | (68 | ) | (75 | ) | ||||
| (Decrease) increase in cash and cash equivalents | (451 | ) | (344 | ) | (1 033 | ) | |||
| Cash and cash equivalents, end of year | 2 221 | 2 672 | 3 016 | ||||||
| Return on Capital Employed (%)(1) | |||||||||
|
|
|||||||||
| Excluding major projects in progress | 8.2 | 8.6 | 0.5 | ||||||
|
|
|||||||||
| Including major projects in progress | 8.0 | 6.7 | 0.4 | ||||||
| Net debt to funds from operations(1) (times) | 1.5 | 1.4 | 2.4 | ||||||
| Interest coverage on long-term debt (times) | |||||||||
|
|
|||||||||
| Earnings basis(2) | 6.4 | 6.5 | 0.5 | ||||||
|
|
|||||||||
| Funds from operations basis(1)(3) | 14.1 | 11.2 | 6.5 | ||||||
Cash Flow provided by Operating Activities
Cash flow provided by operating activities was $10.580 billion in 2018 compared to $8.966 billion in 2017. The increase was primarily due to improved overall benchmark crude pricing, increased refining margins and higher overall upstream production, primarily attributed to the ramp up of Fort Hills and Hebron and the increased working interest in Syncrude. These factors were partially offset by an increase in expenses associated with the expansion of the company's production in 2018, an increase in maintenance expenditures at Syncrude and Oil Sands operations, and a decrease in the capitalization of borrowing costs.
Cash Flow used in Investment Activities
Cash flow used in investing activities was $6.697 billion in 2018 compared to $5.019 billion in 2017. The increase was primarily due to the purchase of an additional 5% interest in the Syncrude project and a decrease in proceeds from disposals, with the previous year including the sale of the company's lubricants business and its interest in two wind facilities, partially offset by a decrease in capital and exploration expenditures following the completion of the company's major growth projects in 2018.
Cash Flow used in Financing Activities
Cash flow used in financing activities was $4.426 billion in 2018, compared to $4.223 billion in 2017. The increase was primarily due to an increase in the purchase of the company's own shares under its normal course issuer bid (NCIB), an increase in dividends paid and a smaller increase in short-term debt. In addition, 2017 included a significant net reduction of long-term debt, partially offset by proceeds relating to the sale of a 49% interest in the ETFD, which was treated as a financing activity due to the existence of non-discretionary distributions within the arrangement.
Management of debt levels continues to be a priority for Suncor given the company's long-term growth plans and future expected volatility in the pricing environment. Suncor believes a phased and flexible approach to existing and future growth projects should assist the company in maintaining its ability to manage project costs and debt levels.
Capital Resources
Suncor's capital resources consist primarily of cash flow provided by operating activities, cash and cash equivalents and available credit facilities, including commercial paper. Suncor's management believes the company will have the capital resources to fund its planned 2019 capital spending program of $4.9 to $5.6 billion and to meet current and future working capital requirements through cash and cash equivalents balances, cash flow provided by operating activities, available committed credit facilities, issuing commercial paper and accessing capital markets. The company's cash flow provided by operating activities depends on a number of factors, including commodity prices, production and sales volumes, refining and marketing
2018 ANNUAL REPORT Suncor Energy Inc. 47
margins, operating expenses, taxes, royalties and foreign exchange rates.
The company has invested excess cash in short-term financial instruments that are presented as cash and cash equivalents. The objectives of the company's short-term investment portfolio are to ensure the preservation of capital, maintain adequate liquidity to meet Suncor's cash flow requirements and deliver competitive returns derived from the quality and diversification of investments within acceptable risk parameters. The maximum weighted average term to maturity of the short-term investment portfolio is not expected to exceed six months, and all investments will be with counterparties with investment grade debt ratings.
Available Sources of Liquidity
Cash and Cash Equivalents
Included in cash and cash equivalents of $2.221 billion at December 31, 2018 are short-term investments with weighted average terms to maturity of approximately 14 days. In 2018, the company earned approximately $32 million of interest income on this portfolio.
Financing Activities
Suncor's interest on debt (before capitalized interest) in 2018 was $897 million, a decrease from $945 million in 2017, due to the net reduction in long-term debt that occurred over the course of 2017, including the exchange of higher interest rate debt for debt issued at a lower interest rate, partially offset by an increase in short-term debt in 2018 combined with higher short-term interest rates and the unfavourable impact of the weaker Canadian dollar on U.S. dollar denominated debt.
Available lines of credit at December 31, 2018 decreased to $3.608 billion, compared to $4.489 billion at December 31, 2017, due to an increase in short-term indebtedness.
A summary of total and unutilized credit facilities at December 31, 2018 is as follows:
| ($ millions) | 2018 | |||
| Fully revolving and expires in 2022 | 4 000 | |||
|
|
||||
| Fully revolving and expires in 2021 | 2 729 | |||
|
|
||||
| Fully revolving and expires within the next two years | 1 537 | |||
|
|
||||
| Can be terminated at any time at the option of the lenders | 132 | |||
| Total credit facilities | 8 398 | |||
|
|
||||
| Credit facilities supporting outstanding commercial paper | (3 231 | ) | ||
|
|
||||
| Credit facilities supporting standby letters of credit | (1 269 | ) | ||
| Total unutilized credit facilities(1) | 3 898 | |||
Total Debt to Total Debt Plus Shareholders' Equity
Suncor is subject to financial and operating covenants related to its bank debt and public market debt. Failure to meet the terms of one or more of these covenants may constitute an Event of Default as defined in the respective debt agreements, potentially resulting in accelerated repayment of one or more of the debt obligations. The company is in compliance with its financial covenant that requires total debt to not exceed 65% of its total debt plus shareholders' equity. At December 31, 2018, total debt to total debt plus shareholders' equity was 28.3% (December 31, 2017 – 25.6%). The company is currently in compliance with all operating covenants as at December 31, 2018.
|
At December 31 ($ millions, except as noted) |
2018 | 2017 | ||||
| Short-term debt | 3 231 | 2 136 | ||||
|
|
||||||
| Current portion of long-term debt | 229 | 71 | ||||
|
|
||||||
| Long-term debt | 13 890 | 13 372 | ||||
| Total debt | 17 350 | 15 579 | ||||
|
|
||||||
| Less: Cash and cash equivalents | 2 221 | 2 672 | ||||
| Net debt | 15 129 | 12 907 | ||||
| Shareholders' equity | 44 005 | 45 383 | ||||
| Total debt plus shareholders' equity | 61 355 | 60 962 | ||||
| Total debt to total debt plus shareholders' equity (%) | 28.3 | 25.6 | ||||
48 2018 ANNUAL REPORT Suncor Energy Inc.
Change in Net Debt
| ($ millions) | ||||
| Total debt – December 31, 2017 | 15 579 | |||
|
|
||||
| Decrease in long-term debt | (186 | ) | ||
|
|
||||
| Increase in short-term debt | 866 | |||
|
|
||||
| Foreign exchange on debt, and other | 1 091 | |||
| Total Debt – December 31, 2018 | 17 350 | |||
| Less: Cash and cash equivalents – December 31, 2018 | 2 221 | |||
| Net Debt – December 31, 2018 | 15 129 | |||
At December 31, 2018, Suncor's net debt was $15.129 billion, compared to $12.907 billion at December 31, 2017. During 2018, total debt increased by $1.771 billion, primarily due to unrealized foreign exchange losses on U.S. dollar denominated debt and an increase in short-term indebtedness due to acquisitions, partially offset by a decrease in long-term debt.
For the year ended December 31, 2018, the company's net debt to funds from operations measure was 1.5 times, which is lower than management's maximum target of less than 3.0 times.
Credit Ratings
The company's credit ratings impact its cost of funds and liquidity. In particular, the company's ability to access unsecured funding markets and to engage in certain activities on a cost-effective basis is primarily dependent upon maintaining a strong credit rating. A lowering of the company's credit rating may also have potentially adverse consequences for the company's funding capacity or access to the capital markets, may affect the company's ability, and the cost, to enter into normal course derivative or hedging transactions, and may require the company to post additional collateral under certain contracts.
As at February 28, 2019, the company's long-term senior debt ratings are:
| Long-Term Senior Debt | Rating |
Long-Term Outlook |
|||
| Standard & Poor's | A- | Stable | |||
|
|
|||||
| Dominion Bond Rating Service | A (low | ) | Stable | ||
|
|
|||||
| Moody's Investors Service | Baa1 | Stable | |||
The company's commercial paper ratings are:
| Commercial Paper |
Cdn Program Rating |
U.S. Program Rating |
||
| Standard & Poor's | A-1 (low | ) | A-2 | |
|
|
||||
| Dominion Bond Rating Service | R-1 (low | ) | Not rated | |
|
|
||||
| Moody's Investors Service | Not rated | P2 | ||
Refer to the Description of Capital Structure – Credit Ratings section of Suncor's 2018 AIF for a description of credit ratings listed above.
Common Shares
Outstanding Shares
| December 31, 2018 (thousands) | |||
| Common shares | 1 584 484 | ||
|
|
|||
| Common share options – non-exercisable | 15 374 | ||
|
|
|||
| Common share options – exercisable | 13 561 | ||
As at February 25, 2019, the total number of common shares outstanding was 1,577,725,157 and the total number of exercisable and non-exercisable common share options outstanding was 35,618,386. Once exercisable, each outstanding common share option may be exercised for one common share.
Share Repurchases
In May 2018, Suncor renewed its NCIB to continue to repurchase its common shares through the facilities of the Toronto Stock Exchange (TSX), New York Stock Exchange and/or alternative trading platforms between May 4, 2018 and May 3, 2019. In November 2018, following the approval by the Board of Directors to increase the company's share repurchase program to $3.0 billion, the Toronto Stock Exchange TSX accepted a notice filed by Suncor of its intention to amend its NCIB effective as of November 19, 2018. The notice provided that Suncor may increase the maximum number of common shares that may be purchased for cancellation between May 4, 2018 and May 3, 2019 from 52,285,330 common shares, or approximately 3% of Suncor's issued and outstanding common shares as at April 30, 2018, to 81,695,830 common shares, or approximately 5% of Suncor's issued and outstanding common shares as at April 30, 2018. Suncor security holders may obtain a copy of the notice, without charge, by contacting the company.
Since commencing its share buyback program in 2011, Suncor has purchased 262,664,000 common shares as of February 25, 2018 for a total return to shareholders of 10.2 billion under this program, with close to half of these share repurchases occurring in the last 2 years. Subsequent to the end of the year, Suncor's Board of Directors approved a further share repurchase program of up to $2.0 billion.
2018 ANNUAL REPORT Suncor Energy Inc. 49
|
At December 31 ($ millions, except as noted) |
2018 | 2017 | 2016 | 2015 | ||||||
| Share repurchase activities (thousands of common shares) | ||||||||||
|
|
||||||||||
| Shares repurchased | 64 426 | 33 153 | — | 1 230 | ||||||
| Share repurchase cost ($ millions) | 3 053 | 1 413 | — | 43 | ||||||
| Weighted average repurchase price per share (dollars per share) | 47.38 | 42.61 | — | 34.93 | ||||||
Contractual Obligations, Commitments, Guarantees, and Off-Balance Sheet Arrangements
In addition to the enforceable and legally binding obligations in the table below, Suncor has other obligations for goods and services that were entered into in the normal course of business, which may terminate on short notice, including commitments for the purchase of commodities for which an active, highly liquid market exists, and which are expected to be re-sold shortly after purchase.
The company does not believe it has any guarantees or off-balance sheet arrangements that have, or are reasonably likely to have, a current or future material effect on the company's financial condition or financial performance, including liquidity and capital resources.
In the normal course of business, the company is obligated to make future payments, including contractual obligations and non-cancellable commitments.
| Payment due by period | |||||||||||||||
| ($ millions) | 2019 | 2020 | 2021 | 2022 | 2023 |
2024 and beyond |
Total | ||||||||
| Fixed and revolving term debt(1) | 4 161 | 733 | 2 172 | 883 | 632 | 18 648 | 27 229 | ||||||||
|
|
|||||||||||||||
| Finance lease obligations | 37 | 39 | 42 | 46 | 53 | 1 043 | 1 260 | ||||||||
|
|
|||||||||||||||
| Decommissioning and restoration costs(2) | 542 | 462 | 413 | 348 | 211 | 11 074 | 13 050 | ||||||||
|
|
|||||||||||||||
| Operating lease agreements, pipeline capacity and energy services commitments(3) | 1 896 | 1 671 | 1 632 | 1 575 | 1 492 | 14 771 | 23 037 | ||||||||
|
|
|||||||||||||||
| Exploration work commitments | 33 | — | 44 | — | — | 490 | 567 | ||||||||
|
|
|||||||||||||||
| Other long-term obligations(4) | 2 | 21 | 21 | 21 | 21 | — | 86 | ||||||||
| Total | 6 671 | 2 926 | 4 324 | 2 873 | 2 409 | 46 026 | 65 229 | ||||||||
Transactions with Related Parties
The company enters into transactions with related parties in the normal course of business. These transactions primarily include sales to associated entities in the company's Refining and Marketing segment and service provisions to Fort Hills. For more information on these transactions and for a summary of Compensation of Key Management Personnel, refer to note 29 to the 2018 audited Consolidated Financial Statements.
Financial Instruments
Suncor periodically enters into derivative contracts for risk management purposes. The derivative contracts hedge risks related to purchases and sales of commodities, to manage exposure to interest rates and to hedge risks specific to individual transactions, such as currency risk associated with repayment of U.S. dollar denominated debt. For the year ended December 31, 2018, the pre-tax earnings impact of risk management activities was $126 million (2017 – pre-tax loss of $19 million).
The company's Energy Trading business uses crude oil, natural gas, refined products futures contracts and other derivative financial instruments to optimize related trading and risk management strategies. For the year ended December 31, 2018, the pre-tax earnings impact for Energy Trading activities was $129 million (2017 – pre-tax loss of $37 million).
Gains or losses related to derivatives are recorded as Other Income in the Consolidated Statements of Comprehensive Income.
50 2018 ANNUAL REPORT Suncor Energy Inc.
| ($ millions) |
Energy Trading |
Risk Management |
Total | |||||
| Fair value of contracts outstanding – December 31, 2016 | (36 | ) | (18 | ) | (54 | ) | ||
|
|
||||||||
| Cash settlements – (received) paid during the year | (12 | ) | 17 | 5 | ||||
|
|
||||||||
| Unrealized losses recognized in earnings during the year | (37 | ) | (19 | ) | (56 | ) | ||
| Fair value outstanding – December 31, 2017 | (85 | ) | (20 | ) | (105 | ) | ||
| Cash settlements – (received) during the year | (43 | ) | (47 | ) | (90 | ) | ||
|
|
||||||||
| Unrealized gains recognized in earnings during the year | 129 | 126 | 255 | |||||
| Fair value outstanding – December 31, 2018 | 1 | 59 | 60 | |||||
The fair value of derivative financial instruments is recorded on the Consolidated Balance Sheets.
|
Fair value of derivative contracts at December 31 ($ millions) |
2018 | 2017 | ||||
| Accounts receivable | 215 | 74 | ||||
|
|
||||||
| Accounts payable | (155 | ) | (179 | ) | ||
| 60 | (105 | ) | ||||
Risks Associated with Derivative Financial Instruments
Suncor may be exposed to certain losses in the event that counterparties to derivative financial instruments are unable to fulfil their obligations under these contracts. The company minimizes this risk by entering into agreements with investment grade counterparties. Risk is also minimized through regular management review of the potential exposure to and credit ratings of such counterparties. Suncor's exposure is limited to those counterparties holding derivative contracts with net positive fair values at a reporting date.
Suncor's risk management activities are subject to periodic reviews by management to determine appropriate hedging requirements based on the company's tolerance for exposure to market volatility, as well as the need for stable cash flow to finance future growth. Energy Trading activities are governed by a separate risk management group that reviews and monitors practices and policies and provides independent verification and valuation of these activities.
For further details on our derivative financial instruments, including assumptions made in the calculation of fair value, a sensitivity analysis of the effect of changes in commodity prices on our derivative financial instruments, and additional discussion of exposure to risks and mitigation activities, see the Financial Instruments and Risk Management note in the company's 2018 audited Consolidated Financial Statements.
2018 ANNUAL REPORT Suncor Energy Inc. 51
9. ACCOUNTING POLICIES AND CRITICAL ACCOUNTING ESTIMATES
Suncor's significant accounting policies are described in note 3 to the audited Consolidated Financial Statements for the year ended December 31, 2018.
(a) Recently Implemented Accounting Pronouncements
Impact of the application of IFRS 9
Effective January 1, 2018, the company adopted IFRS 9 Financial Instruments (IFRS 9) which replaces the multiple classification and measurement models for financial assets under IAS 39 Financial Instruments (IAS 39) with a new model that has two measurement categories: amortized cost and fair value, either through profit/loss (FVTPL) or through other comprehensive income. This determination is made at initial recognition. For financial liabilities, the new standard retains most of the IAS 39 requirements; however, the main change arises in cases where the company chooses to designate a financial liability as FVTPL. In these situations, the portion of the fair value change related to the company's own credit risk is recognized in other comprehensive income rather than net earnings. As a result of adopting IFRS 9, the company's financial assets classified as loans and receivables at December 31, 2017 have been reclassified to financial assets at amortized cost; however, there is no impact to the measurement of these financial assets. There were no changes to the classifications of the company's financial liabilities. The classification and measurement guidance was adopted retrospectively in accordance with the transitional provisions of IFRS 9.
The company also adopted the new hedge accounting guidance in IFRS 9. The new hedge accounting guidance replaces strict quantitative tests of effectiveness with less restrictive assessments of how well the hedging instrument accomplishes the company's risk management objectives for financial and non-financial risk exposures. IFRS 9 also allows the company to hedge risk components of non-financial items which meet certain measurability or identifiable characteristics. The company did not apply hedge accounting to any of its derivative instruments during 2018.
After adoption of IFRS 9, the company's accounting policies are substantially the same as at December 31, 2017 and there were no impacts to the company's financial statements, except for the change in financial asset categories as discussed above.
Impact of the application of IFRS 15
On January 1, 2018, the company adopted IFRS 15 Revenue from Contracts with Customers (IFRS 15) using the retrospective method, which sets out guidelines for the recognition of revenue.
IFRS 15 replaces IAS 18 Revenue and presents a new single model for recognition of revenue from contracts with customers. The model features a contract-based five-step analysis of transactions to determine the nature of an entity's obligation to perform and whether, how much, and when revenue is recognized.
Under IFRS 15, the revenue from the sale of commodities and other operating revenue the company earns represent contractual arrangements with customers. The company recognizes revenue when title of the product is transferred to the buyer and collection is reasonably assured in accordance with specified contract terms. All operating revenue is generally earned at a point in time and is based on the consideration that the company expects to receive for the transfer of the goods to the customers.
The company has reviewed its sources of revenue and major contracts with customers using the guidance found in IFRS 15 and determined there are no material changes to the timing and measurement of the company's revenue in the reporting period, as compared to the provisions of the previous standard. In accordance with the new standard, the company assessed its principal versus agent requirements and the impact was a decrease in revenue, with a corresponding decrease to Operating, Selling and General expense and Transportation expense, resulting in no impact on the company's consolidated net earnings.
Adjustments to Consolidated Statements of Comprehensive Income
| ($ millions, decrease) |
For the twelve months ended December 31, 2017 IFRS 15 |
||||
| Revenues and Other Income | |||||
|
|
|||||
| Operating revenues, net of royalties | (97 | ) | |||
|
|
|||||
| Expenses | |||||
|
|
|||||
| Operating, selling and general | (57 | ) | |||
|
|
|||||
| Transportation | (40 | ) | |||
| Net Earnings | — | ||||
| Total Comprehensive Income | — | ||||
(b) Recently Announced Accounting Pronouncements
The standards, amendments and interpretations that are issued, but not yet effective up to the date of authorization of the company's audited Consolidated Financial Statements, and that may have an impact on the disclosures and financial position of the company, are disclosed below. The company intends to adopt these standards, amendments and interpretations when they become effective.
Leases
In January 2016, the IASB issued IFRS 16 Leases (IFRS 16) which replaces the existing leasing standard IAS 17 Leases
52 2018 ANNUAL REPORT Suncor Energy Inc.
(IAS 17) and requires the recognition of leases on the balance sheet, with optional exemptions for short-term leases where the term is twelve months or less and for leases of low-value items. IFRS 16 effectively removes the classification of leases as either finance or operating leases and treats all leases as finance leases for lessees. The accounting treatment for lessors remains essentially unchanged, with the requirement to classify leases as either finance or operating.
The company will adopt the standard on the effective date of January 1, 2019 and has selected the modified retrospective transition approach. The company has also elected to apply the optional exemptions for short-term leases. IFRS 16 will have an impact on the following components of the audited Consolidated Financial Statements of the company. The company has completed the implementation of an information technology solution, including uploading of data for identified leases into its leasing system. All contracts have been reviewed, new business processes are developed and internal controls have been implemented.
Consolidated Balance Sheets: IFRS 16 requires the recognition of lease liabilities and right-of-use (ROU) assets for all leases except for the optional exemptions for low-value assets and short-term leases. The company will recognize the lease liability at the present value of the remaining lease payments discounted using the company's incremental borrowing rate upon adoption of the new standard. Upon transition, the company will measure the ROU assets equal to the lease liability, adjusted by the amount of any prepaid payments or onerous contracts recognized in the December 31, 2018 audited Consolidated Financial Statements.
The company will recognize additional ROU assets and lease liabilities of $1.8 billion, subject to finalization of reviews, as of January 1, 2019.
Consolidated Statements of Comprehensive Income: Adoption of IFRS 16 will result in an increase to DD&A expense due to the recognition of ROU assets, an increase to Financing expense from the unwinding of the discounted value of the lease liabilities and a decrease to Operating, Selling and General expense, Purchases of Crude Oil and Products and Transportation expense. Based on the company's leases at January 1, 2019, this standard will not have a material impact on consolidated net earnings.
Consolidated Statements of Cash Flows: Due to the change in presentation of former operating lease expenses, Cash flow provided by operating activities will increase due to the decrease in Operating, Selling and General expense, Purchases of Crude Oil and Products and Transportation expense, partially offset by increased Financing expense, which represents an operating activity for the company. Cash flow from financing activities will decrease due to the addition of principal payments for former operating leases. The overall impact to cash flow for the company will be unchanged.
Uncertainty over Income Tax Treatments
In June 2017, the IASB issued IFRIC 23 Uncertainty over Income Tax Treatments. The interpretation clarifies the accounting for current and deferred tax liabilities and assets in circumstances in which there is uncertainty over income tax treatments. The interpretation requires an entity to consider whether it is probable that a taxation authority will accept an uncertain tax treatment. If the entity considers it to be not probable that a taxation authority will accept an uncertain tax provision, the interpretation requires the entity to use the most likely amount or the expected value. The amendments are to be applied retrospectively and are effective for annual periods beginning on or after January 1, 2019, with earlier application permitted. The adoption of this amendment will not have any impact on the company's audited Consolidated Financial Statements.
Significant Accounting Estimates and Judgments
The preparation of financial statements in accordance with IFRS requires management to make estimates and judgments that affect reported assets, liabilities, revenues, expenses, gains, losses, and disclosures of contingencies. These estimates and judgments are subject to change based on experience and new information. The financial statement areas that require significant estimates and judgments are as follows:
Oil and Gas Reserves
Measurements of depletion, depreciation, impairment and decommissioning and restoration obligations are determined in part based on the company's estimate of oil and gas reserves. The estimation of reserves is an inherently complex process and involves the exercise of professional judgment. All reserves have been evaluated at December 31, 2018 by independent qualified reserves evaluators. Oil and gas reserves estimates are based on a range of geological, technical and economic factors, including projected future rates of production, projected future commodity prices, engineering data, and the timing and amount of future expenditures, all of which are subject to uncertainty. Estimates reflect market and regulatory conditions existing at December 31, 2018, which could differ significantly from other points in time throughout the year, or future periods. Changes in market and regulatory conditions and assumptions can materially impact the estimation of net reserves.
Oil and Gas Activities
The company is required to apply judgment when designating the nature of oil and gas activities as exploration, evaluation, development or production, and
2018 ANNUAL REPORT Suncor Energy Inc. 53
when determining whether the costs of these activities shall be expensed or capitalized.
Exploration and Evaluation Costs
Certain exploration and evaluation costs are initially capitalized with the intent to establish commercially viable reserves. The company is required to make judgments about future events and circumstances and applies estimates to assess the economic viability of extracting the underlying resources. The costs are subject to technical, commercial and management review to confirm the continued intent to develop the project. Level of drilling success or changes to project economics, resource quantities, expected production techniques, production costs and required capital expenditures are important judgments when making this determination. Management uses judgment to determine when these costs are reclassified to Property, Plant and Equipment based on several factors including the existence of reserves, appropriate approvals from regulatory bodies and the company's internal project approval process.
Determination of Cash Generating Units (CGUs)
A CGU is the lowest grouping of integrated assets that generate identifiable cash inflows that are largely independent of the cash inflows of other assets or groups of assets. The allocation of assets into CGUs requires significant judgment and interpretations with respect to the integration between assets, the existence of active markets, similar exposure to market risks, shared infrastructure, and the way in which management monitors the operations.
Asset Impairment and Reversals
Management applies judgment in assessing the existence of impairment and impairment reversal indicators based on various internal and external factors.
The recoverable amount of CGUs and individual assets is determined based on the higher of fair value less costs of disposal or value-in-use calculations. The key estimates the company applies in determining the recoverable amount normally include estimated future commodity prices, expected production volumes, future operating and development costs, discount rates, tax rates, and refining margins. In determining the recoverable amount, management may also be required to make judgments regarding the likelihood of occurrence of a future event. Changes to these estimates and judgments will affect the recoverable amounts of CGUs and individual assets and may then require a material adjustment to their related carrying value.
Decommissioning and Restoration Costs
The company recognizes liabilities for the future decommissioning and restoration of Exploration and Evaluation assets and Property, Plant and Equipment based on estimated future decommissioning and restoration costs. Management applies judgment in assessing the existence and extent as well as the expected method of reclamation of the company's decommissioning and restoration obligations at the end of each reporting period. Management also uses judgment to determine whether the nature of the activities performed is related to decommissioning and restoration activities or normal operating activities.
Actual costs are uncertain and estimates may vary as a result of changes to relevant laws and regulations related to the use of certain technologies, the emergence of new technology, operating experience, prices and closure plans. The estimated timing of future decommissioning and restoration may change due to certain factors, including reserves life. Changes to estimates related to future expected costs, discount rates, inflation assumptions, and timing may have a material impact on the amounts presented.
Employee Future Benefits
The company provides benefits to employees, including pensions and other post-retirement benefits. The cost of defined benefit pension plans and other post-retirement benefits received by employees is estimated based on actuarial valuation methods that require professional judgment. Estimates typically used in determining these amounts include, as applicable, rates of employee turnover, future claim costs, discount rates, future salary and benefit levels, the return on plan assets, mortality rates and future medical costs. Changes to these estimates may have a material impact on the amounts presented.
Other Provisions
The determination of other provisions, including, but not limited to, provisions for royalty disputes, onerous contracts, litigation and constructive obligations, is a complex process that involves judgments about the outcomes of future events, the interpretation of laws and regulations, and estimates on the timing and amount of expected future cash flows and discount rates.
Income Taxes
Management evaluates tax positions, annually or when circumstances require, which involves judgment and could be subject to differing interpretations of applicable tax legislation. The company recognizes a tax provision when a payment to tax authorities is considered probable. However, the results of audits and reassessments and changes in the interpretations of standards may result in changes to those positions and, potentially, a material increase or decrease in the company's assets, liabilities and net earnings.
Deferred Income Taxes
Deferred tax assets are recognized when it is considered probable that deductible temporary differences will be recovered in the foreseeable future. To the extent that future taxable income and the application of existing tax laws in each jurisdiction differ significantly from the
54 2018 ANNUAL REPORT Suncor Energy Inc.
company's estimate, the ability of the company to realize the deferred tax assets could be impacted.
Deferred tax liabilities are recognized when there are taxable temporary differences that will reverse and result in a future outflow of funds to a taxation authority. The company records a provision for the amount that is expected to be settled, which requires judgment as to the ultimate outcome. Deferred tax liabilities could be impacted by changes in the company's judgment of the likelihood of a future outflow and estimates of the expected settlement amount, timing of reversals, and the tax laws in the jurisdictions in which the company operates.
Fair Value of Financial Instruments
The fair value of a financial instrument is determined, whenever possible, based on observable market data. If not available, the company uses third-party models and valuation methodologies that utilize observable market data that includes forward commodity prices, foreign exchange rates and interest rates to estimate the fair value of financial instruments, including derivatives. In addition to market information, the company incorporates transaction-specific details that market participants would utilize in a fair value measurement, including the impact of non-performance risk.
Functional Currency
The designation of the functional currency of the company and each of its subsidiaries is a management judgment based on the composition of revenue and costs in the locations in which it operates.
Fair Value of Share-Based Compensation
The fair values of equity-settled and cash-settled share-based payment awards are estimated using the Black-Scholes options pricing model. These estimates depend on certain assumptions, including share price, volatility, risk-free interest rate, the term of the awards, the forfeiture rate and the annual dividend yield, which, by their nature, are subject to measurement uncertainty.
2018 ANNUAL REPORT Suncor Energy Inc. 55
Suncor is committed to a proactive program of enterprise risk management intended to enable decision-making through consistent identification and assessment of risks inherent to its assets, activities and operations. Some of these risks are common to operations in the oil and gas industry as a whole, while some are unique to Suncor. The realization of any of the following risks could have a material adverse effect on Suncor's business, financial condition, reserves or results of operations.
Volatility of Commodity Prices
Suncor's financial performance is closely linked to prices for crude oil in the company's upstream business and prices for refined petroleum products in the company's downstream business and, to a lesser extent, to natural gas prices in the company's upstream business where natural gas is both an input and output of production processes. The prices for all of these commodities can be influenced by global and regional supply and demand factors, which are factors that are beyond the company's control and can result in a high degree of price volatility.
Crude oil prices are also affected by, among other things, global economic health and global economic growth (particularly in emerging markets), market access constraints, regional and international supply and demand imbalances, political developments and government action (including the mandatory production curtailments recently imposed by the Government of Alberta), decisions by the Organization of Petroleum Exporting Countries (OPEC) to not impose quotas on its members, compliance or non-compliance with quotas agreed upon by OPEC members and other countries, and weather. These factors impact the various types of crude oil and refined products differently and can impact differentials between light and heavy grades of crude oil (including blended bitumen), and between conventional oil and SCO.
Refined petroleum product prices and refining margins are also affected by, among other things, crude oil prices, the availability of crude oil and other feedstock, levels of refined product inventories, regional refinery availability, market access, marketplace competitiveness, and other local market factors. Natural gas prices in North America are affected by, among other things, supply and demand, and by prices for alternative energy sources. Decreases in product margins or increases in natural gas prices could have a material adverse effect on Suncor's business, financial condition, reserves and results of operations.
In addition, oil and natural gas producers in North America, and particularly in Canada, may receive discounted prices for their production relative to certain international prices, due in part to constraints on the ability to transport and sell such products to international markets. A failure to resolve such constraints may result in continued discounted or reduced commodity prices realized by oil and natural gas producers such as Suncor. Suncor's production from Oil Sands includes significant quantities of bitumen and SCO that may trade at a discount to light and medium crude oil. Bitumen and SCO are typically more expensive to produce and process. In addition, the market prices for these products may differ from the established market indices for light and medium grades of crude oil. As a result, the price received for bitumen and SCO may differ from the benchmark they are priced against. Future quality differentials are uncertain and unfavourable differentials could have a material adverse effect on Suncor's business, financial condition, reserves and results of operations.
In the fourth quarter of 2018, there was insufficient market access capacity to remove production from the Western Canada Sedimentary Basin causing the differential between WTI and WCS to widen significantly. The situation triggered a response from the Government of Alberta in the form of a mandatory production curtailment, which commenced in early 2019. Such circumstances may result in worsening and/or prolonged price volatility and/or further negative impacts on market dynamics that cannot currently be fully anticipated. Wide differentials, such as those experienced in the fourth quarter of 2018 or a prolonged period of low and/or volatile commodity prices, particularly for crude oil, could have a material adverse effect on Suncor's business, financial condition, reserves and results of operations, and may also lead to the impairment of assets, or to the cancellation or deferral of Suncor's growth projects.
Market Access
Suncor's production of bitumen is expected to grow. The markets for bitumen blends or heavy crude oil are more limited than those for light crude oil, making them more susceptible to supply and demand changes and imbalances (whether as a result of the availability, proximity, and capacity of pipeline facilities, railcars, or otherwise). Heavy crude oil generally receives lower market prices than light crude, due principally to the lower quality and value of the refined product yield and the higher cost to transport the more viscous product on pipelines, and this price differential can be amplified due to supply and demand imbalances.
Market access for Suncor's oil sands production may be constrained by insufficient pipeline takeaway capacity, including the lack of new pipelines due to an inability to secure required approvals and negative public perception. There is a risk that constrained market access for oil sands production, growing inland production and refinery outages could create widening differentials that could impact the profitability of product sales. Market access for refined products may also be constrained by insufficient takeaway capacity, which could create a supply/demand imbalance. The occurrence of any of the foregoing could have a material
56 2018 ANNUAL REPORT Suncor Energy Inc.
adverse effect on the company's business, financial condition, reserves and results of operations.
Major Operational Incidents (Safety, Environmental and Reliability)
Each of Suncor's primary operating businesses – Oil Sands, E&P, and Refining and Marketing – requires significant levels of investment in the design, operation and maintenance and decommissioning of facilities, and carries the additional economic risk associated with operating reliably or enduring a protracted operational outage. The breadth and level of integration of Suncor's operations adds complexity.
The company's businesses also carry the risks associated with environmental and safety performance, which is closely scrutinized by governments, the public and the media, and could result in a suspension of or inability to obtain regulatory approvals and permits, or, in the case of a major environmental or safety incident, delays in resuming normal operations, fines, civil suits or criminal charges against the company.
In general, Suncor's operations are subject to operational hazards and risks such as, among others, fires (including forest fires), explosions, blow-outs, power outages, severe winter climate conditions, prolonged periods of extreme cold or extreme heat, flooding, droughts and other extreme weather conditions, railcar incidents or derailments, the migration of harmful substances such as oil spills, gaseous leaks or a release of tailings into water systems, pollution and other environmental risks, and accidents, any of which can interrupt operations or cause personal injury or death, or damage to property, equipment, the environment, and information technology systems and related data and control systems.
The reliable operation of production and processing facilities at planned levels and Suncor's ability to produce higher value products can also be impacted by, among other things, failure to follow the company's policies, standards and operating procedures or operate within established operating parameters, equipment failure through inadequate maintenance, unanticipated erosion or corrosion of facilities, manufacturing and engineering flaws, and labour shortage or interruption. The company is also subject to operational risks such as sabotage, terrorism, trespass, theft and malicious software, network or cyber attacks.
In addition to the foregoing factors that affect Suncor's business generally, each business unit is susceptible to additional risks due to the nature of its business, including, among others, the following:
Although the company maintains a risk management program, which includes an insurance component, such insurance may not provide comprehensive coverage in all circumstances, nor are all such risks insurable. The company self-insures some risks, and the company's insurance coverage does not cover all the costs arising out of the allocation of liabilities and risk of loss arising from Suncor operations.
The occurrence of any of the foregoing could have a material adverse effect on Suncor's business, financial condition, reserves and results of operations.
Government/Regulatory and Policy Effectiveness
Suncor's businesses operate under federal, provincial, territorial, state and municipal laws in numerous countries. The company is also subject to regulation and intervention by governments in oil and gas industry matters, such as, among others, land tenure, royalties, taxes (including income taxes), government fees, production rates (including restrictions on production), environmental protection, wildlife, fish, safety performance, the reduction of greenhouse gas (GHG) and other emissions, the export of crude oil, natural gas and other products, interactions with
2018 ANNUAL REPORT Suncor Energy Inc. 57
foreign governments, the awarding or acquisition of exploration and production rights, oil sands leases or other interests, the imposition of specific drilling obligations, control over the development, reclamation and abandonment of fields and mine sites, mine financial security requirements, approval of logistics infrastructure, and, possibly, expropriation or cancellation of contract rights. As part of ongoing operations, the company is also required to comply with a large number of Environment, Health and Safety (EH&S) regulations under a variety of Canadian, U.S., U.K., Norwegian and other foreign, federal, provincial, territorial, state and municipal laws and regulations. Failure to comply with applicable laws and regulations may result in, among other things, the imposition of fines and penalties, production constraints, a compulsory shutdown of facilities or suspension of operations, reputational damage, delays, increased costs, denial of operating and growth permit applications, censure, liability for cleanup costs and damages, and the loss of important licences and permits.
Before proceeding with most major projects, including significant changes to existing operations, Suncor must obtain various federal, provincial, territorial, state and municipal permits and regulatory approvals, and must also obtain licences to operate certain assets. These processes can involve, among other things, Aboriginal and stakeholder consultation, environmental impact assessments and public hearings, government intervention and may be subject to conditions, including security deposit obligations and other commitments. Suncor's businesses can also be indirectly impacted by a third party's inability to obtain regulatory approval for a shared infrastructure project or a third-party infrastructure project on which a portion of Suncor's business depends. Compliance can also be affected by the loss of skilled staff, inadequate internal processes and compliance auditing.
Failure to obtain, comply with, satisfy the conditions of or maintain regulatory permits, licences and approvals, or failure to obtain them on a timely basis or on satisfactory terms, could result in delays, abandonment or restructuring of projects and increased costs, all of which could have a material adverse effect on Suncor's business, financial condition, reserves and results of operations.
Changes in government policy, regulation or other laws, or the interpretation thereof, or opposition to Suncor's projects or third-party pipeline and infrastructure projects that delays or prevents necessary permits or regulatory approvals, or which makes current operations or growth projects less profitable or uneconomic could materially impact Suncor's operations, existing and planned projects, financial condition, reserves and results of operations. Obtaining necessary approvals or permits has become more difficult due to increased public opposition and consultation, including Aboriginal consultation requirements as well as increased political involvement. The federal government also issued Bill C-69, An Act to enact the Impact Assessment Act and the Canadian Energy Regulator Act, to amend the Navigation Protection Act and to make consequential amendments to other Acts (Bill C-69) in February 2018. If enacted, it will impact the manner in which large energy projects are approved. The result of these developments could also lead to significant delays and additional compliance costs and staffing and resource levels, and also increase exposure to other risks to Suncor's business, including environmental or safety non-compliance, permit approvals and project development and execution, all of which could have a material adverse effect on Suncor's business, financial condition, reserves and results of operations.
Suncor is subject to the mandatory production curtailments imposed by the Government of Alberta that commenced in early 2019. The duration, extent and consequences of the curtailments to Suncor's business are not fully known; however, prolonged production curtailment or changes to the curtailment levels could have a material adverse effect on Suncor's business, financial condition, reserves and results of operations.
Competition
The global petroleum industry is highly competitive in many aspects, including the exploration for and the development of new sources of supply, the acquisition of crude oil and natural gas interests, and the refining, distribution and marketing of refined petroleum products. Suncor competes in virtually every aspect of its business with other energy companies. The petroleum industry also competes with other industries in supplying energy, fuel and related products to consumers. The increasing volatility of the political and social landscape at provincial, federal, territorial, state, municipal and international levels adds complexity.
For Suncor's Oil Sands business, a number of other companies have entered, or may enter, the oil sands business and begin producing bitumen and SCO, or expand their existing operations. It is difficult to assess the number, level of production and ultimate timing of all potential new projects or when existing production levels may increase. During recent years, a global focus on the oil sands through increasing industry consolidation that has created competitors with financial capacity has significantly increased the supply of bitumen, SCO and heavy crude oil in the marketplace. Although current commodity pricing and increased regulatory requirements have slowed certain larger projects in the short term, the impact of this level of activity on regional infrastructure, including pipelines, has placed stress on the availability and cost of all resources required to build and run new and existing oil sands operations.
For Suncor's Refining and Marketing business, management expects that fluctuations in demand for refined products, margin volatility and overall marketplace competitiveness
58 2018 ANNUAL REPORT Suncor Energy Inc.
will continue. In addition, to the extent that the company's downstream business unit participates in new product markets, it could be exposed to margin risk and volatility from either cost and/or selling price fluctuations.
There is a risk that increased competition could cause costs to increase, put further strain on existing infrastructure and cause margins for refined and unrefined products to be volatile, and impact demand for Suncor's products, which could have a material adverse effect on Suncor's business, financial condition and results of operations.
Carbon Risk
Public support for climate change action and receptivity to alternative/renewable energy technologies has grown in recent years. Governments in Canada and around the world have responded to these shifting societal attitudes by adopting ambitious emissions reduction targets and supporting legislation, including measures relating to carbon pricing, clean energy and fuel standards, and alternative energy incentives and mandates. There has also been increased activism and public opposition to fossil fuels, and oil sands in particular.
Existing and future laws and regulations may impose significant liabilities on a failure to comply with their requirements. Concerns over climate change, fossil fuel extraction, GHG emissions, and water and land-use practices could lead governments to enact additional or more stringent laws and regulations applicable to Suncor and other companies in the energy industry in general, and in the oil sands industry in particular.
Changes to environmental regulations, including regulation relating to climate change, could impact the demand for, formulation or quality of the company's products, or could require increased capital expenditures, operating expenses, abandonment and reclamation obligations and distribution costs, which may not be recoverable in the marketplace and which may result in current operations or growth projects becoming less profitable or uneconomic. In addition, such regulatory changes could necessitate that Suncor develop new technologies. Such technology development could require a significant investment of capital and resources, and any delay in or failure to identify and develop such technologies could prevent Suncor from obtaining regulatory approvals for projects or being able to successfully compete with other companies. Increasing environmental regulation in the jurisdictions in which Suncor operates may also make it difficult for Suncor to compete with companies operating in other jurisdictions with fewer or less costly regulations. In addition, legislation or policies that limit the purchase of production from the oil sands may be adopted in domestic and/or foreign jurisdictions, which, in turn, may limit the world market for Suncor's upstream production and reduce the prices the company receives for its products, and could result in delayed development, stranded assets or the company being unable to further develop its resources. The complexity and breadth of changes in environmental regulation make it extremely difficult to predict the potential impact to Suncor.
Suncor continues to monitor the international and domestic efforts to address climate change. While it currently appears that GHG regulations and targets will continue to become more stringent, and while Suncor continues its efforts to reduce the intensity of its GHG emissions, the absolute GHG emissions of the company are expected to rise as it pursues a growth strategy. Increases in GHG emissions may impact the profitability of the company's projects, as Suncor will be subject to incremental levies and taxes. There is also a risk that Suncor could face litigation initiated by third parties relating to climate change, including litigation pertaining to GHG emissions, the production, sale, or promotion of fossil fuels and petroleum products, and/or disclosure. For example, the Board of County Commissioners of Boulder County, the Board of County Commissioners of San Miguel County and the City of Boulder, all of Colorado, have brought an action against Suncor and certain of its subsidiaries seeking, among other things, compensation for impacts they allege with respect to climate change. In addition, the mechanics of implementation and enforcement of the Oil Sands Emissions Limit Act (OSELA) are currently under review and it is not yet possible to predict the impact on Suncor. However, such impact could be material.
These developments and future developments could adversely impact the demand for Suncor's products, the ability of Suncor to maintain and grow its production and reserves, and Suncor's reputation, and could have a material adverse effect on Suncor's business, financial condition, reserves and results of operations.
Environmental Compliance
Water and Tailings Management
There are risks associated with Suncor's water and tailings management plans. Each mine is required under the Alberta Energy Regulator's Directive 085 – Fluid Tailings Management for Oil Sands Mining Projects to update its mine fluid tailings management plans. If those plans are not approved in the timelines anticipated or at all, or if any conditions to the approval for the plans are not satisfied, the operators' ability to implement additional fluid tailings treatment facilities could be adversely impacted, which could result in reductions in production and lower volumes of treated tailings. If the mine exceeds certain compliance levels specified in the Tailings Management Framework (TMF), the applicable company could be subject to enforcement actions, including being required to curtail production, and financial consequences, including being subject to a compliance levy or being required to post additional security under the Mine Financial Security Program. The full impact of the TMF, including the financial consequences of exceeding
2018 ANNUAL REPORT Suncor Energy Inc. 59
compliance levels, is not yet fully known, as certain associated policies and regulations are still under development. Such policies and regulations could also restrict the technologies that the company may employ for tailings management, which could adversely impact the company's business plans. There could also be risks if the company's tailings management operations fail to operate as anticipated. The occurrence of any of the foregoing could have a material adverse effect on Suncor's business, financial condition, reserves and results of operations.
In addition, an integrated water management approach to support operations and successful reclamation and closure requires the release of water to the environment. An Alberta water return policy is currently being developed by the government using a multi-stakeholder approach and the federal government has started working to develop an oil sands effluent regulation. The timing and content of these policies and regulations is not yet known; however, the absence of effective government policies and regulations in this area could impact the success and timing of closure and reclamation plans, which could have a material adverse effect on Suncor's business, financial condition, reserves and results of operations.
Alberta's Land-Use Framework (LARP)
The implementation of, and compliance with, the terms of the Lower Athabasca Regional Plan (LARP) may adversely impact Suncor's current properties and projects in northern Alberta due to, among other things, environmental limits and thresholds. The impact of the LARP on Suncor's operations may be outside of the control of the company, as Suncor's operations could be impacted as a result of restrictions imposed due to the cumulative impact of development by the other operators in the area and not solely in relation to Suncor's direct impact. The uncertainty of changes in Suncor's future development and existing operations required as a result of the LARP could have a material adverse effect on Suncor's business, financial condition, reserves and results of operations.
Alberta Environment and Parks (AEP) Water Licences
Suncor currently relies on water obtained under licences from AEP to provide domestic and utility water for the company's Oil Sands business. Water licences, like all regulatory approvals, contain conditions to be met in order to maintain compliance with the licence. There can be no assurance that the licences to withdraw water will not be rescinded or that additional conditions will not be added. It is also possible that regional water management approaches may require water sharing agreements between stakeholders. In addition, the expansion of the company's projects may rely on securing licences for additional water withdrawal, and there can be no assurance that these licences will be granted in a timely manner or that they will be granted on terms favourable to Suncor. There is also a risk that future laws or changes to existing laws or regulations relating to water access could cause capital expenditures and operating expenses relating to water licence compliance to increase. The occurrence of any of the foregoing could have a material adverse effect on Suncor's business, financial condition, reserves and results of operations.
Species at Risk Act
Woodland caribou have been identified as "threatened" under the Species at Risk Act (Canada). In response to the Government of Canada's Recovery Strategy for Woodland Caribou, provincial caribou range plans are being developed. Suncor has existing, planned and potential future projects within caribou ranges in Alberta. The development and implementation of range plans in these areas may have an impact on the pace and amount of development in these areas and could potentially increase costs for restoration or offsetting requirements, which could have a material adverse effect on Suncor's business, financial condition, reserves and results of operations.
Air Quality Management
A number of Canadian federal and provincial air quality regulations and frameworks are currently being developed, changed and/or implemented, which could have an impact on the company's existing and planned projects by requiring the company to invest additional capital or incur additional operating and compliance expenses, including, among other things, potentially requiring the company to retrofit equipment to meet new requirements and increase monitoring and mitigation plans. The full impact of these regulations and frameworks is not yet known; however, they could have a material adverse effect on Suncor's business, financial condition, reserves and results of operations.
Alberta Wetland Policy
Pursuant to the Alberta Wetland Policy, development in wetland areas may be obligated to avoid wetlands or mitigate the development's effects on wetlands. Although the full impact of the policy on Suncor is not yet fully known, certain of Suncor's operations and growth projects will be affected by aspects of the policy where avoidance is not possible and wetland reclamation or replacement may be required, which could have a material adverse effect on Suncor's business, financial condition, reserves and results of operations.
Information Security
The efficient operation of Suncor's business is dependent on computer hardware, software and networked systems, including the systems of cloud providers and third parties with which Suncor conducts business. In the ordinary course of Suncor's business, Suncor collects and stores sensitive data, including intellectual property, proprietary business information and personal information of the company's
60 2018 ANNUAL REPORT Suncor Energy Inc.
employees and retail customers. Suncor's operations are also dependent upon a large and complex information framework. Suncor relies on industry accepted security measures, controls and technology to protect Suncor's information systems and securely maintain confidential and proprietary information stored on the company's information systems, and has adopted a continuous process to identify, assess and manage threats to the company's information systems. Suncor's information security risk oversight is conducted by the Audit Committee of the Board of Directors. However, the measures, controls and technology on which the company relies may not be adequate due to the increasing volume, sophistication and rapidly evolving nature of cyber threats. Suncor's information technology and infrastructure, including process control systems, may be vulnerable to attacks by malicious persons or entities motivated by, among others, geopolitical, financial or activist reasons, or breached due to employee error, malfeasance or other disruptions, including natural disasters and acts of war. Any such attack or breach could compromise Suncor's networks, and the information Suncor stores could be accessed, publicly disclosed, lost, stolen or compromised. Any such attack, breach, access, disclosure or loss of information could result in legal claims or proceedings, liability under laws that protect the privacy of personal information, regulatory penalties, disruptions to Suncor's operations, decreased performance and production, increased costs, and damage to Suncor's reputation, physical harm to people or the environment or other negative consequences to Suncor or third parties, which could have a material adverse effect on Suncor's business, financial condition and results of operations. Although the company maintains a risk management program, which includes an insurance component that may provide coverage for the operational impacts from an attack to, or breach of, Suncor's information technology and infrastructure, including process control systems, the company does not maintain stand-alone cyber insurance. Furthermore, not all cyber risks are insurable. As a result, Suncor's existing insurance may not provide adequate coverage for losses stemming from a cyber attack to, or breach of, its information technology and infrastructure.
Security and Terrorist Threats
Security threats and terrorist or activist activities may impact Suncor's personnel, which could result in injury, death, extortion, hostage situations and/or kidnapping, including unlawful confinement. A security threat, terrorist attack or activist incident targeted at a facility or office owned or operated by Suncor could result in the interruption or cessation of key elements of Suncor's operations. Outcomes of such incidents could have a material adverse effect on Suncor's business, financial condition, reserves and results of operations.
Project Development and Execution
There are certain risks associated with the development and execution of Suncor's major projects and the commissioning and integration of new facilities within its existing asset base.
Project development and execution risk consists of four related primary risks:
Project development and execution can also be impacted by, among other things:
2018 ANNUAL REPORT Suncor Energy Inc. 61
The occurrence of any of the foregoing could have a material adverse effect on Suncor's business, financial condition, reserves and results of operations.
Technology Risk
There are risks associated with growth and other capital projects that rely largely or partly on new technologies and the incorporation of such technologies into new or existing operations, including that the results of the application of new technologies may differ from simulated, test or pilot environments; or that third party intellectual property protections may impede the development and implementation of new technology. The success of projects incorporating new technologies cannot be assured. Advantages accrue to companies that can develop and adopt emerging technologies in advance of competitors. The inability to develop, implement and monitor new technologies may impact the company's ability to develop its new or existing operations in a profitable manner or comply with regulatory requirements, which could have a material adverse effect on Suncor's business, financial condition, reserves and results of operations.
Cumulative Impact and Pace of Change
In order to achieve Suncor's business objectives, the company must operate efficiently, reliably and safely, and, at the same time, deliver growth and sustaining projects safely, on budget and on schedule. The ability to achieve these two sets of objectives is critically important for Suncor to deliver value to shareholders and stakeholders. These ambitious business objectives compete for resources, and may negatively impact the company should there be inadequate consideration of the cumulative impacts of prior and parallel initiatives on people, processes and systems. There is also a risk that these objectives may exceed Suncor's capacity to adopt and implement change. The occurrence of any of the foregoing could have a material adverse effect on Suncor's business, financial condition, reserves and results of operations.
Joint Arrangement Risk
Suncor has entered into joint arrangements and other contractual arrangements with third parties, including arrangements where other entities operate assets in which Suncor has ownership or other interests. These joint arrangements include, among others, those with respect to Syncrude, Fort Hills, In Situ assets, and operations in Suncor's E&P Canada and E&P International businesses. The success and timing of activities relating to assets and projects operated by others, or developed jointly with others, depend upon a number of factors that are outside of Suncor's control, including, among others, the timing and amount of capital expenditures, the timing and amount of operational and maintenance expenditures, the operator's expertise, financial resources and risk management practices, the approval of other participants, and the selection of technology.
These co-owners may have objectives and interests that do not coincide with and may conflict with Suncor's interests. Major capital decisions affecting joint arrangements may require agreement among the co-owners, while certain operational decisions may be made solely at the discretion of the operator of the applicable assets. While joint venture counterparties may generally seek consensus with respect to major decisions concerning the direction and operation of the assets and the development of projects, no assurance can be provided that the future demands or expectations of the parties relating to such assets and projects will be met satisfactorily or in a timely manner. Failure to satisfactorily meet demands or expectations by all of the parties may affect the company's participation in the operation of such assets or in the development of such projects, the company's ability to obtain or maintain necessary licences or approvals, or the timing for undertaking various activities. In addition, disputes may arise pertaining to the timing, funding and/or capital commitments with respect to projects that are being jointly developed, which could materially adversely affect the development of such projects and Suncor's business and operations.
The occurrence of any of the foregoing could have a material adverse effect on Suncor's business, financial condition, reserves and results of operations.
Financial Risks
Energy Trading and Risk Management Activities and the Exposure to Counterparties
The nature of Suncor's energy trading and risk management activities, which may make use of derivative financial instruments to manage its exposure to commodity price and other market risks, creates exposure to financial risks, which include, but are not limited to, the following:
62 2018 ANNUAL REPORT Suncor Energy Inc.
The occurrence of any of the foregoing could have a material adverse effect on Suncor's business, financial condition and results of operations.
Exchange Rate Fluctuations
The company's 2018 audited Consolidated Financial Statements are presented in Canadian dollars. The majority of Suncor's revenues from the sale of oil, natural gas and petroleum products are based on prices that are determined by, or referenced to, U.S. dollar benchmark prices, while the majority of Suncor's expenditures are realized in Canadian dollars. The company also owes a portion of its debt in U.S. dollars. Suncor's financial results, therefore, can be affected significantly by the exchange rates between the Canadian dollar and the U.S. dollar. The company also undertakes operations administered through international subsidiaries, and therefore, to a lesser extent, Suncor's results can be affected by the exchange rates between the Canadian dollar and the euro, the British pound and the Norwegian krone. These exchange rates may vary substantially and may give rise to favourable or unfavourable foreign currency exposure. A decrease in the value of the Canadian dollar relative to the U.S. dollar will increase the revenues received from the sale of commodities. An increase in the value of the Canadian dollar relative to the U.S. dollar will decrease revenue received from the sale of commodities. A decrease in the value of the Canadian dollar relative to the U.S. dollar from the previous balance sheet date increases the amount of Canadian dollars required to settle U.S. dollar denominated obligations. As at December 31, 2018, the Canadian dollar weakened in relation to the U.S. dollar to $0.73 from $0.80 at the start of 2018. Exchange rate fluctuations could have a material adverse effect on Suncor's business, financial condition, reserves and results of operations.
Interest Rate Risk
The company is exposed to fluctuations in short-term Canadian and U.S. interest rates as Suncor maintains a portion of its debt capacity in revolving and floating rate credit facilities and commercial paper, and invests surplus cash in short-term debt instruments and money market instruments. Suncor is also exposed to interest rate risk when debt instruments are maturing and require refinancing, or when new debt capital needs to be raised. The company is also exposed to changes in interest rates on derivative instruments used to manage the debt portfolio, including hedges of prospective new debt issuances. Unfavourable changes in interest rates could have a material adverse effect on Suncor's business, financial condition and results of operations.
Issuance of Debt and Debt Covenants
Suncor expects that future capital expenditures will be financed out of cash and cash equivalents balances, cash flow provided by operating activities, available committed credit facilities, issuing commercial paper and accessing capital markets. This ability is dependent on, among other factors, commodity prices, the overall state of the capital markets, and financial institutions and investor appetite for investments in the energy industry generally, and the company's securities in particular. To the extent that external sources of capital become limited or unavailable or available on unfavourable terms, the ability to make capital investments and maintain existing properties may be constrained.
If the company finances capital expenditures in whole or in part with debt, that may increase its debt levels above industry standards for oil and gas companies of similar size. Depending on future development and growth plans, additional debt financing may be required that may not be available or, if available, may not be available on favourable terms, including higher interest rates and fees. Neither the articles of Suncor (the Articles) nor its by-laws limit the amount of indebtedness that may be incurred; however, Suncor is subject to covenants in its existing credit facilities and seeks to avoid an unfavourable cost of debt. The level of the company's indebtedness, from time to time, could impair its ability to obtain additional financing on a timely basis to take advantage of business opportunities that may arise and could negatively affect its credit ratings.
Suncor is required to comply with financial and operating covenants under existing credit facilities and debt securities. Covenants are reviewed based on actual and forecast results and the company has the ability to make changes to its development plans, capital structure and/or dividend policy to comply with covenants under the credit facilities. If Suncor does not comply with the covenants under its credit facilities and debt securities, there is a risk that repayment could be accelerated and/or the company's access to capital could be restricted or only be available on unfavourable terms.
Rating agencies regularly evaluate the company, including its subsidiaries. Their ratings of Suncor's long-term and short-term debt are based on a number of factors, including the company's financial strength, as well as factors not entirely within its control, including conditions affecting the oil and gas industry generally, and the wider state of the economy. Credit ratings may be important to customers or counterparties when Suncor competes in certain markets and when it seeks to engage in certain transactions, including
2018 ANNUAL REPORT Suncor Energy Inc. 63
transactions involving over-the-counter derivatives. There is a risk that one or more of Suncor's credit ratings could be downgraded, which could potentially limit its access to private and public credit markets and increase the company's cost of borrowing.
The occurrence of any of the foregoing could have a material adverse effect on Suncor's business, financial condition, reserves and results of operations.
Royalties and Taxes
Suncor is subject to royalties and taxes imposed by governments in numerous jurisdictions.
Royalties can be impacted by changes in crude oil and natural gas pricing, production volumes, and capital and operating costs, by changes to existing legislation or PSCs, and by results of regulatory audits of prior year filings and other such events. The final determination of these events may have a material impact on the company's royalties expense.
An increase in Suncor's royalties expense, income taxes, property taxes, carbon taxes, levies, tariffs, duties, quotas, border taxes, and other taxes and government-imposed compliance costs, could have a material adverse effect on Suncor's business, financial condition, reserves and results of operations.
Dividends and Share Repurchases
Suncor's payment of future dividends on its common shares and future share repurchases by Suncor of its common shares will be dependent on, among other things, legislative and stock exchange requirements, the company's financial condition, results of operations, cash flow, the need for funds to finance ongoing operations and growth projects, debt covenants and other business considerations as the company's Board of Directors considers relevant. There can be no assurance that Suncor will continue to pay dividends or repurchase shares in the future.
E&P Reserves Replacement
Suncor's future offshore production, and therefore its cash flows and results of operations from E&P, are highly dependent upon success in exploiting its current reserves base and acquiring or discovering additional reserves. Without additions to its E&P reserves through exploration, acquisition or development activities, Suncor's production from its offshore assets will decline over time as reserves are depleted. The business of exploring for, developing or acquiring reserves is capital intensive. To the extent Suncor's cash flow is insufficient to fund capital expenditures and external sources of capital become limited or unavailable, Suncor's ability to make the necessary capital investments to maintain and expand its reserves will be impaired. In addition, Suncor may be unable to develop or acquire additional reserves to replace its crude oil and natural gas production at acceptable costs.
Uncertainties Affecting Reserves Estimates
There are numerous uncertainties inherent in estimating quantities of reserves, including many factors beyond the company's control. Suncor's actual production, revenues, royalties, taxes, and development and operating expenditures with respect to the company's reserves will vary from its estimates, and such variances could be material. Refer to the Statement of Reserves Data and Other Oil and Gas Information – Significant Risk Factors and Uncertainties Affecting Reserves in the 2018 AIF.
Third-Party Service Providers
Suncor's businesses are reliant on the operational integrity of a large number of third-party service providers, including input and output commodity transport (pipelines, rail, trucking, marine) and utilities associated with various Suncor and jointly owned facilities, including electricity. A disruption in service or limited availability by one of these third parties can also have a dramatic impact on Suncor's operations and growth plans. Pipeline constraints that affect takeaway capacity or supply of inputs, such as hydrogen and power for example, could impact the company's ability to produce at capacity levels. Disruptions in pipeline service could adversely affect commodity prices, Suncor's price realizations, refining operations and sales volumes, or limit the company's ability to produce and deliver production. These interruptions may be caused by the inability of the pipeline to operate or by the oversupply of feedstock into the system that exceeds pipeline capacity. Short-term operational constraints on pipeline systems arising from pipeline interruption and/or increased supply of crude oil have occurred in the past and could occur in the future. There is a risk that third-party outages could impact Suncor's production or price realizations, which could have a material adverse effect on Suncor's business, financial condition and results of operations.
Foreign Operations
The company has operations in a number of countries with different political, economic and social systems. As a result, the company's operations and related assets are subject to a number of risks and other uncertainties arising from foreign government sovereignty over the company's international operations, which may include, among other things:
64 2018 ANNUAL REPORT Suncor Energy Inc.
If a dispute arises in the company's foreign operations, the company may be subject to the exclusive jurisdiction of foreign courts or may not be able to subject foreign persons to the jurisdiction of a court in Canada or the U.S. In addition, as a result of activities in these areas and a continuing evolution of an international framework for corporate responsibility and accountability for international crimes, there is a risk the company could also be exposed to potential claims for alleged breaches of international or local law.
The impact that future potential terrorist attacks, regional hostilities or political violence, such as that experienced in Libya and Syria, may have on the oil and gas industry, and on our operations in particular, is not known at this time. This uncertainty may affect operations in unpredictable ways, including disruptions of fuel supplies and markets, particularly crude oil, and the possibility that infrastructure facilities, including pipelines, production facilities, processing plants and refineries, could be direct targets of, or collateral damage of, an act of terror, political violence or war. Suncor may be required to incur significant costs in the future to safeguard our assets against terrorist activities or to remediate potential damage to our facilities. There can be no assurance that Suncor will be successful in protecting itself against these risks and the related safety and financial consequences.
Despite Suncor's training and policies around bribery and other forms of corruption, there is a risk that Suncor, or some of its employees or contractors, could be charged with bribery or corruption. Any of these violations could result in onerous penalties. Even allegations of such behaviour could impair Suncor's ability to work with governments or non-government organizations and could result in the formal exclusion of Suncor from a country or area, sanctions, fines, project cancellations or delays, the inability to raise or borrow capital, reputational impacts and increased investor concern.
The occurrence of any of the foregoing could have a material adverse effect on Suncor's business, financial condition, reserves and results of operations.
Skills, Resource Shortage and Reliance on Key Personnel
The successful operation of Suncor's businesses and the company's ability to expand operations will depend upon the availability of, and competition for, skilled labour and materials supply. There is a risk that the company may have difficulty sourcing the required labour for current and future operations. The risk could manifest itself primarily through an inability to recruit new staff without a dilution of talent, to train, develop and retain high-quality and experienced staff without unacceptably high attrition, and to satisfy an employee's work/life balance and desire for competitive compensation. The labour market in Alberta has been historically tight, and, while the current economic situation has partially moderated this effect, it remains a risk to be managed. The increasing age of the company's existing workforce adds further pressure. The availability of competent and skilled contractors for current and future operations is also a risk depending on market conditions. Materials may also be in short supply due to smaller labour forces in many manufacturing operations. Suncor's ability to operate safely and effectively and complete all projects on time and on budget has the potential to be significantly impacted by these risks and this impact could be material.
The company's success also depends in large measure on certain key personnel. The loss of the services of such key personnel could have a material adverse effect on the company. The contributions of the existing management team to the immediate and near-term operations of the company are likely to continue to be of central importance for the foreseeable future.
Labour Relations
Hourly employees at Suncor's Oil Sands operations facilities (excluding MacKay River), all of the company's refineries, and the majority of the company's terminal and distribution operations are represented by labour unions or employee associations. Approximately 32% of the company's employees were covered by collective agreements at the end of 2018. Negotiations for new collective agreements are in progress for 12 facilities across the company. Any work interruptions involving the company's employees (including as a result of a strike or lockout), contract trades utilized in the company's projects or operations, or any jointly owned facilities operated by another entity present a significant risk to the company and could have a material adverse effect on Suncor's business, financial condition and results of operations.
Land Claims and Aboriginal Consultation
Aboriginal Peoples have claimed Aboriginal title and rights to portions of Western Canada. In addition, Aboriginal Peoples have filed claims against industry participants relating in part to land claims, which may affect the company's business.
The requirement to consult with Aboriginal Peoples in respect of oil and gas projects and related infrastructure has also increased in recent years. In addition, the Canadian federal government and the provincial government in Alberta have made a commitment to renew their relationships with the Aboriginal Peoples of Canada. The
2018 ANNUAL REPORT Suncor Energy Inc. 65
federal government has stated it now fully supports the United Nations Declaration on the Rights of Indigenous Peoples (the Declaration) without qualification and that Canada intends "nothing less than to adopt and implement the Declaration in accordance with the Canadian Constitution". Recently, the federal government announced its support of a private member's bill, Bill C-262, An Act to ensure that the laws of Canada are in harmony with the United Nations Declaration on the Rights of Indigenous Peoples, promoting the full adoption of the Declaration into Canadian law. It is anticipated that the Bill will be passed by the Senate and become law in the second quarter of 2019. The Alberta government is also currently exploring how best to implement the principles and objectives of the Declaration in a way that is consistent with the Constitution and Alberta law. At this time, it is unclear how the Declaration will be adopted into Canadian law and the impact of the Declaration on the Crown's duty to consult with Aboriginal Peoples.
Suncor is unable to assess the effect, if any, that any such land claims, consultation requirements with Aboriginal Peoples or adoption of the Declaration into Canadian law may have on Suncor's business; however, the impact may be material.
Litigation Risk
There is a risk that Suncor or entities in which it has an interest may be subject to litigation, and claims under such litigation may be material. Various types of claims may be raised in these proceedings, including, but not limited to, environmental damage, climate change and the impacts thereof, breach of contract, product liability, antitrust, bribery and other forms of corruption, tax, patent infringement, disclosure, employment matters and in relation to an attack, breach or unauthorized access to Suncor's information technology and infrastructure. Litigation is subject to uncertainty and it is possible that there could be material adverse developments in pending or future cases. Unfavourable outcomes or settlements of litigation could encourage the commencement of additional litigation. Suncor may also be subject to adverse publicity and reputational impacts associated with such matters, regardless of whether Suncor is ultimately found liable. There is a risk that the outcome of such litigation may be materially adverse to the company and/or the company may be required to incur significant expenses or devote significant resources in defence against such litigation, the success of which cannot be guaranteed.
Trade Risk Relating to CUSMA
If the Canada-United States-Mexico Agreement (CUSMA) is ratified, Canada will no longer be subject to the proportionality provisions in the North American Free Trade Agreement's (NAFTA) energy chapter. Ratification should thus permit the expansion of oil and gas exports beyond the U.S., and a change to the oil and gas rules of origin, which will allow Canadian exporters to more easily qualify for duty-free treatment for shipments to the U.S. Canada must, however, notify the U.S. of its intention to enter into free trade talks with any "non-market economies" under CUSMA, which may include China or any other importers of Canadian oil and gas exports. Although CUSMA has been signed, legislators from each of the three countries have yet to ratify CUSMA according to their own legislative processes before it goes into effect and replaces NAFTA. The outcome of the ratification process in each of these countries is not complete and is therefore uncertain. If CUSMA is not ratified and adopted by all three countries, this may alter the terms of trade for energy resources in a manner adverse to the company. This could have a material adverse effect on the sale and transportation of Suncor's products within North America, which could have a significant negative impact on Suncor's business, financial condition and results from operations.
Control Environment
Based on their inherent limitations, disclosure controls and procedures and internal controls over financial reporting may not prevent or detect misstatements, and even those controls determined to be effective can provide only reasonable assurance with respect to financial statement preparation and presentation. Failure to adequately prevent, detect and correct misstatements could have a material adverse effect on Suncor's business, financial condition and results of operations.
66 2018 ANNUAL REPORT Suncor Energy Inc.
11. OTHER ITEMS
Control Environment
Based on their evaluation as of December 31, 2018, Suncor's Chief Executive Officer and Chief Financial Officer concluded that the company's disclosure controls and procedures (as defined in Rules 13a-15(e) and 15d-15(e) under the United States Securities Exchange Act of 1934, as amended (the Exchange Act)), are effective to ensure that information required to be disclosed by the company in reports that are filed or submitted to Canadian and U.S. securities authorities is recorded, processed, summarized and reported within the time periods specified in Canadian and U.S. securities laws. In addition, as of December 31, 2018, there were no changes in the internal control over financial reporting (as defined in Exchange Act Rules 13a-15(f) and 15d-15(f)) that occurred during the year ended December 31, 2018 that have materially affected, or are reasonably likely to materially affect, the company's internal control over financial reporting. Management will continue to periodically evaluate the company's disclosure controls and procedures and internal control over financial reporting and will make any modifications from time to time as deemed necessary.
The effectiveness of our internal control over financial reporting as at December 31, 2018 was audited by PricewaterhouseCoopers LLP, an independent registered public accounting firm, as stated in their report, which is included in our audited Consolidated Financial Statements for the year ended December 31, 2018.
Based on their inherent limitations, disclosure controls and procedures and internal control over financial reporting may not prevent or detect misstatements, and even those controls determined to be effective can provide only reasonable assurance with respect to financial statement preparation and presentation.
Corporate Guidance
There have been no changes to the corporate guidance ranges previously issued on December 14, 2018. For further details and advisories regarding Suncor's 2019 corporate guidance, see www.suncor.com/guidance.
2018 ANNUAL REPORT Suncor Energy Inc. 67
Non-GAAP Financial Measures
Certain financial measures in this MD&A – namely operating earnings (loss), ROCE, funds from (used in) operations, discretionary free funds flow, Oil Sands operations cash operating costs, In Situ cash operating costs, Fort Hills cash operating costs, Syncrude cash operating costs, refining margin, refining operating expense and LIFO inventory valuation methodology – are not prescribed by GAAP. These non-GAAP financial measures are included because management uses the information to analyze business performance, leverage and liquidity, and it may be useful to investors on the same basis. These non-GAAP financial measures do not have any standardized meaning and, therefore, are unlikely to be comparable to similar measures presented by other companies. Therefore, these non-GAAP financial measures should not be considered in isolation or as a substitute for measures of performance prepared in accordance with GAAP. Except as otherwise indicated, these non-GAAP measures are calculated and disclosed on a consistent basis from period to period. Specific adjusting items may only be relevant in certain periods.
(a) Operating Earnings (Loss)
Operating earnings (loss) is a non-GAAP financial measure that adjusts net earnings (loss) for significant items that are not indicative of operating performance. Management uses operating earnings (loss) to evaluate operating performance, because management believes it provides better comparability between periods. For the years ended December 31, 2018, December 31, 2017 and December 31, 2016, consolidated operating earnings (loss) are reconciled to net earnings (loss) in the Financial Information section of this MD&A and operating earnings (loss) for each segment are reconciled to net earnings (loss) in the Segment Results and Analysis section of the MD&A. Operating earnings (loss) for the three months ended December 31, 2018 and December 31, 2017 are reconciled to net earnings (loss) below.
(b) Bridge Analyses of Operating Earnings
Throughout this MD&A, the company presents charts that illustrate the change in operating earnings from the comparative period through key variance factors. These factors are analyzed in the Operating Earnings narratives following the bridge analyses in that particular section of the MD&A. These bridge analyses are presented because management uses this presentation to analyze performance.
(c) Return on Capital Employed (ROCE)
ROCE is a non-GAAP financial measure that management uses to analyze operating performance and the efficiency of Suncor's capital allocation process. Average capital employed is calculated as a twelve-month average of the capital employed balance at the beginning of the twelve-month period and the month-end capital employed balances throughout the remainder of the twelve-month period. Figures for capital employed at the beginning and end of the twelve-month period are presented to show the changes in the components of the calculation over the twelve-month period.
68 2018 ANNUAL REPORT Suncor Energy Inc.
The company presents two ROCE calculations – one including and one excluding the impacts on capital employed of major projects in progress. Major projects in progress includes accumulated capital expenditures and capitalized interest for significant projects still under construction or in the process of being commissioned, and acquired assets that are still being evaluated. Management uses ROCE excluding the impacts of major projects in progress on capital employed to assess performance of operating assets.
|
Year ended December 31 ($ millions, except as noted) |
2018 | 2017 | 2016 | |||||||||
| Adjustments to net earnings | ||||||||||||
|
|
||||||||||||
| Net earnings attributed to common shareholders | 3 293 | 4 458 | 434 | |||||||||
|
|
||||||||||||
| Add after-tax amounts for: | ||||||||||||
|
|
||||||||||||
| Unrealized foreign exchange loss (gain) on U.S. dollar denominated debt | 989 | (702 | ) | (524 | ) | |||||||
|
|
||||||||||||
| Net interest expense | 541 | 158 | 304 | |||||||||
| A | 4 823 | 3 914 | 214 | |||||||||
| Capital employed – beginning of twelve-month period | ||||||||||||
|
|
||||||||||||
| Net debt | 12 907 | 14 414 | 11 254 | |||||||||
|
|
||||||||||||
| Shareholders' equity | 45 383 | 44 630 | 39 039 | |||||||||
| 58 290 | 59 044 | 50 293 | ||||||||||
| Capital employed – end of twelve-month period | ||||||||||||
|
|
||||||||||||
| Net debt | 15 129 | 12 907 | 14 414 | |||||||||
|
|
||||||||||||
| Shareholders' equity | 44 005 | 45 383 | 44 630 | |||||||||
| 59 134 | 58 290 | 59 044 | ||||||||||
| Average capital employed | B | 60 347 | 58 667 | 57 999 | ||||||||
| ROCE – including major projects in progress (%) | A/B | 8.0 | 6.7 | 0.4 | ||||||||
| Average capitalized costs related to major projects in progress | C | 1 412 | 12 901 | 10 147 | ||||||||
| ROCE – excluding major projects in progress (%) | A/(B-C) | 8.2 | 8.6 | 0.5 | ||||||||
2018 ANNUAL REPORT Suncor Energy Inc. 69
(d) Funds from (used in) Operations and Discretionary Free Funds Flow
Funds from (used in) operations is a non-GAAP financial measure that adjusts a GAAP measure – cash flow provided by (used in) operating activities – for changes in non-cash working capital, which management uses to analyze operating performance and liquidity. Changes to non-cash working capital can include, among other factors, the timing of offshore feedstock purchases and payments for fuel and income taxes, and the timing of cash flows related to accounts receivable and accounts payable, which management believes reduces comparability between periods.
| Oil Sands |
Exploration and Production |
Refining and Marketing | |||||||||||||||||||
| Year ended December 31 ($ millions) | 2018 | 2017 | 2016 | 2018 | 2017 | 2016 | 2018 | 2017 | 2016 | ||||||||||||
| Net (loss) earnings | 853 | 1 009 | (1 149 | ) | 808 | 732 | 190 | 3 153 | 2 658 | 1 890 | |||||||||||
|
|
|||||||||||||||||||||
| Adjustments for: | |||||||||||||||||||||
|
|
|||||||||||||||||||||
| Depreciation, depletion, amortization and impairment | 4 024 | 3 782 | 3 864 | 967 | 1 028 | 1 381 | 683 | 685 | 702 | ||||||||||||
|
|
|||||||||||||||||||||
| Deferred income taxes | 351 | 170 | (78 | ) | (112 | ) | (113 | ) | (506 | ) | 39 | (138 | ) | 12 | |||||||
|
|
|||||||||||||||||||||
| Accretion | 209 | 195 | 208 | 48 | 45 | 53 | 7 | 7 | 7 | ||||||||||||
|
|
|||||||||||||||||||||
| Unrealized foreign exchange (gain) loss on U.S. dollar denominated debt | — | — | — | — | — | — | — | — | — | ||||||||||||
|
|
|||||||||||||||||||||
| Change in fair value of financial instruments and trading inventory | (61 | ) | 2 | 19 | — | — | — | (20 | ) | 9 | 27 | ||||||||||
|
|
|||||||||||||||||||||
| Loss on debt extinguishment | — | — | — | — | — | — | — | — | — | ||||||||||||
|
|
|||||||||||||||||||||
| (Gain) loss on disposal of assets | (108 | ) | (50 | ) | (33 | ) | 91 | — | — | (7 | ) | (354 | ) | (35 | ) | ||||||
|
|
|||||||||||||||||||||
| Share-based compensation | (28 | ) | (3 | ) | 41 | (5 | ) | 6 | 12 | (19 | ) | 4 | 21 | ||||||||
|
|
|||||||||||||||||||||
| Exploration expenses | — | — | — | 11 | 41 | 204 | — | — | — | ||||||||||||
|
|
|||||||||||||||||||||
| Settlement of decommissioning and restoration liabilities | (428 | ) | (305 | ) | (248 | ) | (23 | ) | (31 | ) | (1 | ) | (17 | ) | (17 | ) | (20 | ) | |||
|
|
|||||||||||||||||||||
| Other | 58 | (62 | ) | 45 | 84 | 17 | (20 | ) | (25 | ) | (13 | ) | 2 | ||||||||
| Funds from (used in) operations | 4 870 | 4 738 | 2 669 | 1 869 | 1 725 | 1 313 | 3 794 | 2 841 | 2 606 | ||||||||||||
|
|
|||||||||||||||||||||
| (Increase) decrease in non-cash working capital | |||||||||||||||||||||
| Cash flow provided by operating activities | |||||||||||||||||||||
70 2018 ANNUAL REPORT Suncor Energy Inc.
|
Corporate, Energy Trading and Eliminations |
Total | ||||||||||||||
| Year ended December 31 ($ millions) | 2018 | 2017 | 2016 | 2018 | 2017 | 2016 | |||||||||
| Net (loss) earnings | (1 521 | ) | 59 | (486 | ) | 3 293 | 4 458 | 445 | |||||||
|
|
|||||||||||||||
| Adjustments for: | |||||||||||||||
|
|
|||||||||||||||
| Depreciation, depletion, amortization and impairment | 64 | 106 | 170 | 5 738 | 5 601 | 6 117 | |||||||||
|
|
|||||||||||||||
| Deferred income taxes | 162 | 330 | 60 | 440 | 249 | (512 | ) | ||||||||
|
|
|||||||||||||||
| Accretion of liabilities | 2 | — | 1 | 266 | 247 | 269 | |||||||||
|
|
|||||||||||||||
| Unrealized foreign exchange (gain) loss on U.S. dollar denominated debt | 1 090 | (771 | ) | (458 | ) | 1 090 | (771 | ) | (458 | ) | |||||
|
|
|||||||||||||||
| Change in fair value of financial instruments and trading inventory | (98 | ) | 117 | (53 | ) | (179 | ) | 128 | (7 | ) | |||||
|
|
|||||||||||||||
| Loss on debt extinguishment | 3 | 51 | 99 | 3 | 51 | 99 | |||||||||
|
|
|||||||||||||||
| Gain on disposal of assets | — | (70 | ) | — | (24 | ) | (474 | ) | (68 | ) | |||||
|
|
|||||||||||||||
| Share-based compensation | (65 | ) | 24 | 68 | (117 | ) | 31 | 142 | |||||||
|
|
|||||||||||||||
| Exploration expenses | — | — | — | 11 | 41 | 204 | |||||||||
|
|
|||||||||||||||
| Settlement of decommissioning and restoration liabilities | (1 | ) | — | — | (469 | ) | (353 | ) | (269 | ) | |||||
|
|
|||||||||||||||
| Other | 3 | (11 | ) | (1 | ) | 120 | (69 | ) | 26 | ||||||
| Funds (used in) from operations | (361 | ) | (165 | ) | (600 | ) | 10 172 | 9 139 | 5 988 | ||||||
|
|
|||||||||||||||
| (Increase) decrease in non-cash working capital | 408 | (173 | ) | (308 | ) | ||||||||||
| Cash flow provided by operating activities | 10 580 | 8 966 | 5 680 | ||||||||||||
Discretionary free funds flow is a non-GAAP financial measure that is calculated by taking funds from operations and subtracting sustaining capital, inclusive of associated capitalized interest, and dividends. Discretionary free funds flow reflects cash available for increasing distributions to shareholders and to fund growth investments. Management uses discretionary free funds flow to measure the capacity of the company to increase returns to shareholders and grow the business. The following is a reconciliation of discretionary free funds flow for Suncor's last three years of operations.
| ($ millions) | 2018 | 2017 | 2016 | |||||
| Funds from operations | 10 172 | 9 139 | 5 988 | |||||
|
|
||||||||
| Sustaining capital and dividends | (6 310 | ) | (5 083 | ) | (4 191 | ) | ||
| Discretionary free funds flow | 3 862 | 4 056 | 1 797 | |||||
(e) Oil Sands Operations, In Situ, Fort Hills and Syncrude Cash Operating Costs
Oil Sands operations, In Situ, Fort Hills and Syncrude cash operating costs are non-GAAP financial measures. Oil Sands operations cash operating costs are calculated by adjusting Oil Sands segment OS&G expense (a GAAP measure based on sales volumes) for i) costs pertaining to Fort Hills and Syncrude operations; ii) non production costs that management believes do not relate to the production performance of Oil Sands operations, including, but not limited to, share-based compensation adjustments, research and the expense recorded as part of a non-monetary arrangement involving a third party processor; iii) revenues associated with excess capacity, including excess power generated and sold that is recorded in operating revenue; iv) project start-up costs; and v) the impacts of changes in inventory levels, such that the company is able to present cost information based on production volumes. To determine In Situ cash operating costs, Oil Sands operations cash operating costs are further adjusted to remove costs pertaining to Oil Sands operations mining and upgrading. Syncrude and Fort Hills cash operating costs are calculated by adjusting Syncrude OS&G expense and Fort Hills OS&G expense, respectively, for non-production costs that management believes do not relate to the production performance of Syncrude operations or Fort Hills operations, respectively, including, but not limited to, share-based compensation, research and project start-up costs, if applicable. Oil Sands operations, Fort Hills and Syncrude cash operating costs are reconciled in the Segment Results and Analysis – Oil Sands section of this document. Management uses cash operating costs to measure operating performance. Oil Sands operations cash operating costs in 2018 were $3.870 billion and included $740 million related to In Situ production for In Situ cash operating costs per barrel of $8.45, based on total In Situ production of 240,000 bbls/d.
2018 ANNUAL REPORT Suncor Energy Inc. 71
(f) Refining Margin and Refining Operating Expense
Refining margin and refining operating expense are non-GAAP financial measures. Refining margin is calculated by adjusting R&M segment operating revenues, other income and purchases of crude oil and products (GAAP measures) for non-refining margin pertaining to the company's supply, marketing and ethanol businesses, and the company's former lubricants business, which was disposed of in early 2017. Refinery operating expense is calculated by adjusting R&M segment OS&G for i) non-refining costs pertaining to the company's supply, marketing and ethanol businesses and the company's former lubricants business; and ii) non-refining costs that management believes do not relate to the production of refined products, including, but not limited to, share-based compensation and enterprise shared service allocations. Management uses refining margin and refining operating expense to measure operating performance on a production barrel basis.
|
Year ended December 31 ($ millions, except as noted) |
2018 | 2017 | 2016 | ||||||
| Refining margin reconciliation | |||||||||
|
|
|||||||||
| Gross margin, operating revenues less purchases of crude oil and products(1) | 7 068 | 5 692 | 5 506 | ||||||
|
|
|||||||||
| Other income | 21 | 73 | 16 | ||||||
|
|
|||||||||
| Non-refining margin | (1 250 | ) | (1 546 | ) | (2 074 | ) | |||
| Refining margin | 5 839 | 4 219 | 3 448 | ||||||
|
|
|||||||||
| Refinery production(2) (mbbls) | 169 138 | 174 461 | 168 798 | ||||||
| Refining margin ($/bbl) | 34.50 | 24.20 | 20.45 | ||||||
| Refining operating expense reconciliation | |||||||||
| Operating, selling and general expense(1) | 1 979 | 1 950 | 2 147 | ||||||
|
|
|||||||||
| Non-refining costs | (1 078 | ) | (1 068 | ) | (1 287 | ) | |||
| Refining operating expense | 901 | 882 | 860 | ||||||
|
|
|||||||||
| Refinery production(2) | 169 138 | 174 461 | 168 798 | ||||||
| Refining operating expense ($/bbl) | 5.35 | 5.05 | 5.10 | ||||||
(g) Impact of First-in, First-out Inventory Valuation on Refining and Marketing Net Earnings
GAAP requires the use of a FIFO valuation methodology. For Suncor, this results in a lag between the sales prices for refined products, which reflects current market conditions, and the amount recorded as the cost of sale for the related refinery feedstock, which reflects market conditions at the time when the feedstock was purchased.
Suncor prepares and presents an estimate of the impact of using a FIFO inventory valuation methodology compared to a LIFO methodology, because management uses the information to analyze operating performance and compare itself against refining peers that are permitted to use LIFO inventory valuation under United States GAAP (U.S. GAAP).
The company's estimate is not derived from a standardized calculation and, therefore, may not be directly comparable to similar measures presented by other companies, and should not be considered in isolation or as a substitute for measures of performance prepared in accordance with GAAP or U.S. GAAP.
72 2018 ANNUAL REPORT Suncor Energy Inc.
(h) Operating Earnings Reconciliations – Fourth Quarter 2018 and 2017
| Three months ended December 31 | Oil Sands |
Exploration and Production |
Refining and Marketing |
Corporate, Energy Trading and Eliminations |
Total | |||||||||||||||||
| ($ millions) | 2018 | 2017 | 2018 | 2017 | 2018 | 2017 | 2018 | 2017 | 2018 | 2017 | ||||||||||||
| Net earnings (loss) as reported | (393 | ) | 670 | (115 | ) | 217 | 723 | 886 | (495 | ) | (391 | ) | (280 | ) | 1 382 | |||||||
|
|
||||||||||||||||||||||
| Unrealized foreign exchange loss on U.S. dollar denominated debt | — | — | — | — | — | — | 637 | 91 | 637 | 91 | ||||||||||||
|
|
||||||||||||||||||||||
| Non-cash loss on equity investment | — | — | 223 | — | — | — | — | — | 223 | — | ||||||||||||
|
|
||||||||||||||||||||||
| Impact of income tax rate adjustment on deferred taxes | — | — | — | 14 | — | (140 | ) | — | 2 | — | (124 | ) | ||||||||||
|
|
||||||||||||||||||||||
| Insurance Proceeds | — | (55 | ) | — | — | — | — | — | — | — | (55 | ) | ||||||||||
|
|
||||||||||||||||||||||
| Loss on early repayment of long term debt | — | — | — | — | — | — | — | 18 | — | 18 | ||||||||||||
|
|
||||||||||||||||||||||
| Non-cash mark to market gain on interest rate swaps | — | — | — | — | — | — | — | (2 | ) | — | (2 | ) | ||||||||||
| Operating earnings (loss) | (393 | ) | 615 | 108 | 231 | 723 | 746 | 142 | (282 | ) | 580 | 1 310 | ||||||||||
(i) Funds from Operations Reconciliations – Fourth Quarter 2018 and 2017
| Three months ended December 31 | Oil Sands |
Exploration and Production |
Refining and Marketing |
Corporate, Energy Trading and Eliminations |
Total | ||||||||||||||||||
| ($ millions) | 2018 | 2017 | 2018 | 2017 | 2018 | 2017 | 2018 | 2017 | 2018 | 2017 | |||||||||||||
| Net earnings (loss) | (393 | ) | 670 | (115 | ) | 217 | 723 | 886 | (495 | ) | (391 | ) | (280 | ) | 1 382 | ||||||||
|
|
|||||||||||||||||||||||
| Adjustments for: | — | — | — | — | |||||||||||||||||||
|
|
|||||||||||||||||||||||
| Depreciation, depletion, amortization and impairment | 1 019 | 1 055 | 199 | 219 | 184 | 196 | 17 | 18 | 1 419 | 1 488 | |||||||||||||
|
|
|||||||||||||||||||||||
| Deferred income taxes | 89 | 181 | 3 | 5 | (51 | ) | (161 | ) | 119 | 78 | 160 | 103 | |||||||||||
|
|
|||||||||||||||||||||||
| Accretion of liabilities | 53 | 49 | 12 | 12 | 2 | 2 | — | — | 67 | 63 | |||||||||||||
|
|
|||||||||||||||||||||||
| Unrealized foreign exchange loss on U.S. dollar denominated debt | — | — | — | — | — | — | 688 | 74 | 688 | 74 | |||||||||||||
|
|
|||||||||||||||||||||||
| Change in fair value of financial instruments and trading inventory | (74 | ) | 2 | — | — | (15 | ) | 9 | (59 | ) | 5 | (148 | ) | 16 | |||||||||
|
|
|||||||||||||||||||||||
| Gain on disposal of assets | (1 | ) | (46 | ) | 253 | — | (2 | ) | (2 | ) | — | — | 250 | (48 | ) | ||||||||
|
|
|||||||||||||||||||||||
| Loss on debt extinguishment | — | — | — | — | — | — | 3 | 26 | 3 | 26 | |||||||||||||
|
|
|||||||||||||||||||||||
| Share-based compensation | (22 | ) | 34 | (3 | ) | 4 | (10 | ) | 17 | (53 | ) | 61 | (88 | ) | 116 | ||||||||
|
|
|||||||||||||||||||||||
| Exploration expenses | — | — | 11 | — | — | — | — | — | 11 | — | |||||||||||||
|
|
|||||||||||||||||||||||
| Settlement of decommissioning and restoration liabilities | (91 | ) | (76 | ) | (8 | ) | (15 | ) | (5 | ) | (7 | ) | — | — | (104 | ) | (98 | ) | |||||
|
|
|||||||||||||||||||||||
| Other | 21 | (89 | ) | 15 | (11 | ) | — | (5 | ) | (7 | ) | (1 | ) | 29 | (106 | ) | |||||||
|
|
|||||||||||||||||||||||
| Funds from (used in) operations | 601 | 1 780 | 367 | 431 | 826 | 935 | 213 | (130 | ) | 2 007 | 3 016 | ||||||||||||
| Increase (decrease) in non-cash working capital | 1 033 | (261 | ) | ||||||||||||||||||||
| Cash flow provided by (used in) operating activities | 3 040 | 2 755 | |||||||||||||||||||||
2018 ANNUAL REPORT Suncor Energy Inc. 73
Certain crude oil and natural gas liquids volumes have been converted to mcfe or mmcfe on the basis of one bbl to six mcf. Also, certain natural gas volumes have been converted to boe or mboe on the same basis. Any figure presented in mcfe, mmcfe, boe or mboe may be misleading, particularly if used in isolation. A conversion ratio of one bbl of crude oil or natural gas liquids to six mcf of natural gas is based on an energy equivalency conversion method primarily applicable at the burner tip and does not necessarily represent value equivalency at the wellhead. Given that the value ratio based on the current price of crude oil as compared to natural gas is significantly different from the energy equivalency of 6:1, conversion on a 6:1 basis may be misleading as an indication of value.
Common Abbreviations
The following is a list of abbreviations that may be used in this MD&A:
| Measurement | ||
| bbl | barrel | |
| bbls/d | barrels per day | |
| mbbls/d | thousands of barrels per day | |
| boe | barrels of oil equivalent | |
| boe/d | barrels of oil equivalent per day | |
| mboe | thousands of barrels of oil equivalent | |
| mboe/d | thousands of barrels of oil equivalent per day | |
| mcf | thousands of cubic feet of natural gas | |
| mcfe | thousands of cubic feet of natural gas equivalent | |
| mmcf | millions of cubic feet of natural gas | |
| mmcf/d | millions of cubic feet of natural gas per day | |
| mmcfe | millions of cubic feet of natural gas equivalent | |
| mmcfe/d | millions of cubic feet of natural gas equivalent per day | |
| m3 | cubic metres | |
| MW | Megawatts | |
| MWh | Megawatt hour | |
Places and Currencies |
||
| U.S. | United States | |
| U.K. | United Kingdom | |
| B.C. | British Columbia | |
| $ or Cdn$ | Canadian dollars | |
| US$ | United States dollars | |
| £ | Pounds sterling | |
| € | Euros | |
Financial and Business Environment |
||
| DD&A | Depreciation, depletion and amortization | |
| WTI | West Texas Intermediate | |
| WCS | Western Canadian Select | |
| SCO | Synthetic crude oil | |
| MSW | Mixed Sweet Blend | |
| NYMEX | New York Mercantile Exchange | |
Forward-Looking Information
This MD&A contains certain forward-looking statements and forward-looking information (collectively, forward-looking statements) within the meaning of applicable Canadian and U.S. securities laws and other information based on Suncor's current expectations, estimates, projections and assumptions that were made by the company in light of information available at the time the statement was made and consider Suncor's experience and its perception of historical trends, including expectations and assumptions concerning: the accuracy of reserves and resources estimates; commodity prices and interest and foreign exchange rates; the performance of assets and equipment; capital efficiencies and cost savings; applicable laws and government policies; future production rates; the sufficiency of budgeted capital expenditures in carrying out planned activities; the availability and cost of labour, services and infrastructure; the satisfaction by third parties of their obligations to Suncor; the development and execution of projects; and the receipt, in a timely manner, of regulatory and third-party approvals. All statements and information that address expectations or projections about the future, and statements and information about Suncor's strategy for growth, expected and future expenditures or investment decisions, commodity prices, costs, schedules, production volumes, operating and financial results, future financing and capital activities, and the expected impact of future commitments are forward-looking statements. Some of the forward-looking statements may be identified by words like "expects", "anticipates", "will", "estimates", "plans", "scheduled", "intends", "believes", "projects", "indicates", "could", "focus", "vision", "goal", "outlook", "proposed", "target", "objective", "continue", "should", "may", "potential", "future", "opportunity", "would", "priority", "strategy", "aim" and similar expressions.
Forward-looking statements in this MD&A include references to:
Suncor's strategy, business plans and expectations about projects, the performance of assets, production volumes and capital expenditures, including:
74 2018 ANNUAL REPORT Suncor Energy Inc.
company's reserves, optimizing value through integration and secured market access, achieving industry-leading unit costs in each business segment, and being an industry leader in sustainable development;
2018 ANNUAL REPORT Suncor Energy Inc. 75
and the expected impact of those projects and initiatives; and
The expected timing, duration and impact of planned maintenance events, including:
Also:
Forward-looking statements are not guarantees of future performance and involve a number of risks and uncertainties, some that are similar to other oil and gas companies and some that are unique to Suncor. Suncor's actual results may differ materially from those expressed or implied by its forward-looking statements, so readers are cautioned not to place undue reliance on them.
The financial and operating performance of the company's reportable operating segments, specifically Oil Sands, E&P, and R&M, may be affected by a number of factors.
Factors that affect Suncor's Oil Sands segment include, but are not limited to, volatility in the prices for crude oil and other production, and the related impacts of fluctuating light/heavy and sweet/sour crude oil differentials; changes in the demand for refinery feedstock and diesel fuel, including the possibility that refiners that process the company's proprietary production will be closed, experience equipment failure or other accidents; Suncor's ability to operate its Oil Sands facilities reliably in order to meet production targets; the output of newly commissioned facilities, the performance of which may be difficult to predict during initial operations; Suncor's dependence on pipeline capacity and other logistical constraints, which may affect the company's ability to distribute products to market and which may cause the company to delay or cancel planned growth projects in the event of insufficient takeaway capacity; Suncor's ability to finance Oil Sands economic investment and asset sustainment and maintenance capital expenditures; the availability of bitumen feedstock for upgrading operations, which can be negatively affected by poor ore grade quality, unplanned mine equipment and extraction plant maintenance, tailings storage, and in situ reservoir and equipment performance, or the unavailability of third-party bitumen; changes in operating costs, including the cost of labour, natural gas and other energy sources used in oil sands processes; and the company's ability to complete projects, including planned maintenance events, both on time and on budget, which could be impacted by competition from other projects
76 2018 ANNUAL REPORT Suncor Energy Inc.
(including other oil sands projects) for goods and services and demands on infrastructure in Alberta's Wood Buffalo region and the surrounding area (including housing, roads and schools).
Factors that affect Suncor's E&P segment include, but are not limited to, volatility in crude oil and natural gas prices; operational risks and uncertainties associated with oil and gas activities, including unexpected formations or pressures, premature declines of reservoirs, fires, blow outs, equipment failures and other accidents, uncontrollable flows of crude oil, natural gas or well fluids, and pollution and other environmental risks; adverse weather conditions, which could disrupt output from producing assets or impact drilling programs, resulting in increased costs and/or delays in bringing on new production; political, economic and socio-economic risks associated with Suncor's foreign operations, including the unpredictability of operating in Libya due to ongoing political unrest; and market demand for mineral rights and producing properties, potentially leading to losses on disposition or increased property acquisition costs.
Factors that affect Suncor's R&M segment include, but are not limited to, fluctuations in demand and supply for refined products that impact the company's margins; market competition, including potential new market entrants; the company's ability to reliably operate refining and marketing facilities in order to meet production or sales targets; and risks and uncertainties affecting construction or planned maintenance schedules, including the availability of labour and other impacts of competing projects drawing on the same resources during the same time period.
Additional risks, uncertainties and other factors that could influence the financial and operating performance of all of Suncor's operating segments and activities include, but are not limited to, changes in general economic, market and business conditions, such as commodity prices, interest rates and currency exchange rates; fluctuations in supply and demand for Suncor's products; the successful and timely implementation of capital projects, including growth projects and regulatory projects; risks associated with the development and execution of Suncor's projects and the commissioning and integration of new facilities; the possibility that completed maintenance activities may not improve operational performance or the output of related facilities; the risk that projects and initiatives intended to achieve cash flow growth and/or reductions in operating costs may not achieve the expected results in the time anticipated or at all; competitive actions of other companies, including increased competition from other oil and gas companies or from companies that provide alternative sources of energy; labour and material shortages; actions by government authorities, including the imposition or reassessment of, or changes to, taxes, fees, royalties, duties, tariffs, quotas and other government-imposed compliance costs, and mandatory production curtailment orders and changes thereto; changes to laws and government policies that could impact the company's business, including environmental (including climate change), royalty and tax laws and policies; the ability and willingness of parties with whom Suncor has material relationships to perform their obligations to the company; the unavailability of, or outages to third-party infrastructure that could cause disruptions to production or prevent the company from being able to transport its products; the occurrence of a protracted operational outage, a major safety or environmental incident, or unexpected events such as fires (including forest fires), equipment failures and other similar events affecting Suncor or other parties whose operations or assets directly or indirectly affect Suncor; the potential for security breaches of Suncor's information technology and infrastructure by malicious persons or entities, and the unavailability or failure of such systems to perform as anticipated as a result of such breaches; security threats and terrorist or activist activities; the risk that competing business objectives may exceed Suncor's capacity to adopt and implement change; risks and uncertainties associated with obtaining regulatory, third-party and stakeholder approvals outside of Suncor's control for the company's operations, projects, initiatives, and exploration and development activities and the satisfaction of any conditions to approvals; the potential for disruptions to operations and construction projects as a result of Suncor's relationships with labour unions that represent employees at the company's facilities; the company's ability to find new oil and gas reserves that can be developed economically; the accuracy of Suncor's reserves, resources and future production estimates; market instability affecting Suncor's ability to borrow in the capital debt markets at acceptable rates or to issue other securities at acceptable prices; maintaining an optimal debt to cash flow ratio; the success of the company's risk management activities using derivatives and other financial instruments; the cost of compliance with current and future environmental laws, including climate change laws; risks relating to increased activism and public opposition to fossil fuels and oil sands; risks and uncertainties associated with closing a transaction for the purchase or sale of a business, asset or oil and gas property, including estimates of the final consideration to be paid or received; the ability of counterparties to comply with their obligations in a timely manner; risks associated with joint arrangements in which the company has an interest; risks associated with land claims and Aboriginal consultation requirements; the risk that the company may be subject to litigation; the impact of technology and risks associated with developing and implementing new technologies; and the accuracy of cost estimates, some of which are provided at the conceptual or other preliminary stage of projects and prior to commencement or conception of the detailed engineering that is needed to reduce the margin of error and increase the level of accuracy. The foregoing important factors are not exhaustive.
2018 ANNUAL REPORT Suncor Energy Inc. 77
Many of these risk factors and other assumptions related to Suncor's forward-looking statements are discussed in further detail throughout this MD&A, including under the heading Risk Factors, and the company's 2018 AIF and Form 40-F on file with Canadian securities commissions at www.sedar.com and the United States Securities and Exchange Commission at www.sec.gov. Readers are also referred to the risk factors and assumptions described in other documents that Suncor files from time to time with securities regulatory authorities. Copies of these documents are available without charge from the company.
The forward-looking statements contained in this MD&A are made as of the date of this MD&A. Except as required by applicable securities laws, we assume no obligation to update publicly or otherwise revise any forward-looking statements or the foregoing risks and assumptions affecting such forward-looking statements, whether as a result of new information, future events or otherwise.
78 2018 ANNUAL REPORT Suncor Energy Inc.