Please wait

Table of Contents

-3

Management’s Discussion and Analysis

February 26, 2025

-ever

MD&A – Table of Contents

2


Consolidated Financial and Operating Summary

5

Suncor Overview

7

Financial Information

12

Segment Results and Analysis

25

Income Tax

26

Fourth Quarter 2024 Analysis

29

Quarterly Financial Data

31

Capital Investment Update

34

Financial Condition and Liquidity

40

Material Accounting Policies and Critical Accounting Estimates

43

Risk Factors

54

Other Items

55

Advisories

This Management’s Discussion and Analysis (MD&A) should be read in conjunction with Suncor’s December 31, 2024 audited Consolidated Financial Statements and the accompanying notes. Additional information about Suncor filed with Canadian securities regulatory authorities and the United States Securities and Exchange Commission (SEC), including quarterly and annual reports and Suncor’s Annual Information Form dated February 26, 2025 (the 2024 AIF), which is also filed with the SEC under cover of Form 40-F, is available online at www.sedarplus.ca, www.sec.gov and on our website at www.suncor.com. Information contained in or otherwise accessible through our website, even if referred to in this MD&A, does not constitute part of this MD&A and is not incorporated by reference into this MD&A.

References to “we”, “our”, “Suncor” or “the company” means Suncor Energy Inc., its subsidiaries, partnerships and joint arrangements, unless otherwise specified or the context otherwise requires. For a list of abbreviations that may be used in this MD&A, refer to the Advisories – Common Abbreviations section of this MD&A.

Basis of Presentation

Unless otherwise noted, all financial information contained herein has been prepared in accordance with International Financial Reporting Standards (IFRS) as issued by the International Accounting Standards Board (IASB).

All financial information is reported in Canadian dollars, unless otherwise noted. Production volumes are presented on a working-interest basis, before royalties, except for production volumes from the company’s Libya operations, which are presented on an economic basis.

References to Oil Sands operations exclude Suncor’s interests in Fort Hills and Syncrude.

ANNUAL REPORT 2024 SUNCOR ENERGY INC. 1


Table of Contents

1. Consolidated Financial and Operating Summary

Financial Summary

Year ended December 31 ($ millions, except per share amounts)


2024


2023


2022


Gross revenues


54 881


52 206


62 907

Royalties

(4 192)

(3 114)

(4 571)

Operating revenues, net of royalties

50 689

49 092

58 336

Net earnings


6 016


8 295


9 077

Per common share – basic (dollars)


4.72


6.34


6.54

Per common share – diluted (dollars)

4.72

6.33

6.53

Adjusted operating earnings(1)


6 884


6 677


11 566

Per common share(1)(2)


5.40


5.10


8.34

Adjusted funds from operations(1)


13 846


13 325


18 101

Per common share(1)(2)


10.87


10.19


13.05

Cash flow provided by operating activities


15 960


12 344


15 680

Per common share(2)


12.53


9.44


11.30

Dividends paid on common shares


2 803


2 749


2 596

Per common share(2)


2.22


2.11


1.88

Share repurchases


2 908

2 233

5 135

Per common share(2)


2.28

1.71

3.70

Weighted average number of common shares in millions – basic


1 274


1 308


1 387

Weighted average number of common shares in millions – diluted


1 276


1 310


1 390

Capital expenditures(3)(4)


6 166


5 573


4 819

Asset sustainment and maintenance


3 185


3 543


3 315

Economic investment


2 981


2 030


1 504

Free funds flow(1)


7 363


7 497


13 114

Returns to shareholders(5)

5 711

4 982

7 731

Balance sheet (at December 31)


Total assets


89 784


88 539


84 618

Net debt(1)(6)


6 861


9 852


10 627

Total long-term liabilities(7)


34 523


35 663


32 382

(1)Non-GAAP financial measures or contains non-GAAP financial measures. See the Advisories – Non-GAAP and Other Financial Measures section of this MD&A.
(2)Presented on a basic per share basis.
(3)Excludes capitalized interest of $317 million in 2024, $255 million in 2023 and $168 million in 2022.
(4)Excludes capital expenditures related to assets previously held for sale of nil in 2024, $108 million in 2023 and $133 million in 2022.
(5)Includes dividends paid on common shares and repurchases of common shares.
(6)Beginning in 2024, the company revised the definition of net debt to exclude lease liabilities to better align with how management and industry monitor capital structure. Prior period comparatives have been restated to reflect this change
(7)Includes long-term debt, long-term lease liabilities, other long-term liabilities, provisions and deferred income taxes.

2 ANNUAL REPORT 2024 SUNCOR ENERGY INC. 


Table of Contents

Operating Summary

Year ended December 31


2024


2023


2022


Production volumes


Oil Sands – Upgraded – net SCO and diesel (mbbls/d)


516.1


487.0


480.0

Oil Sands – Non-upgraded bitumen (mbbls/d)

257.7

202.6

185.2

Total Oil Sands production volumes (mbbls/d)

773.8

689.6

665.2

Exploration and Production (mboe/d)


53.8


56.1


78.0

Total upstream production (mboe/d)


827.6


745.7


743.2

Average price realizations(1)(2) ($/boe)


Upgraded – net SCO and diesel


97.91

99.40

118.88

Non-upgraded bitumen

72.65

67.97

84.63

Weighted average crude


89.41

90.27

109.57

Exploration and Production Canada

107.38

107.62

128.07

Exploration and Production International(3)

109.00

126.61

Refinery crude oil processed (mbbls/d)


465.0


420.7


433.2

Refinery utilization(4) (%)


Eastern North America


96


96


93

Western North America


103


85


93

Average


100


90


93

Refining and marketing gross margin - FIFO(1) ($/bbl)


36.40


45.00


55.85

Refining and marketing gross margin - LIFO(1) ($/bbl)


37.00


47.00


54.45

(1)Contains non-GAAP financial measures. See the Advisories – Non-GAAP and Other Financial Measures section of this MD&A.
(2)Net of transportation costs, but before royalties.
(3)Exploration and Production (E&P) International price realizations exclude Libya for all periods presented.
(4)Refinery utilization is the amount of crude oil and natural gas liquids processed by crude distillation units, expressed as a percentage of the nameplate capacity of these units.

ANNUAL REPORT 2024 SUNCOR ENERGY INC. 3


Table of Contents

Segment Summary

Year ended December 31 ($ millions)


2024


2023


2022


Earnings (loss) before income taxes


Oil Sands


6 607


6 811


5 633

Exploration and Production


867


1 691


3 221

Refining and Marketing


2 596


3 383


5 694

Corporate and Eliminations


(1 883)


(1 296)


(2 232)

Income tax expense

(2 171)

(2 294)

(3 239)

Net earnings


6 016


8 295


9 077

Adjusted operating earnings (loss)(1)


Oil Sands


6 505


5 967


9 042

Exploration and Production


867


1 084


2 494

Refining and Marketing


2 600


3 367


5 687

Corporate and Eliminations


(813)


(1 349)


(1 503)

Income tax expense included in adjusted operating earnings

(2 275)

(2 392)

(4 154)

Total


6 884


6 677


11 566

Adjusted funds from (used in) operations(1)


Oil Sands


11 842


10 725


13 831

Exploration and Production


1 610


1 612


3 178

Refining and Marketing


3 538


4 268


6 561

Corporate and Eliminations


(679)


(1 546)


(1 240)

Current income tax expense

(2 465)

(1 734)

(4 229)

Total


13 846


13 325


18 101

Change in non-cash working capital

2 114

(981)

(2 421)

Cash flow provided by operating activities


15 960


12 344


15 680

(1)Non-GAAP financial measures. See the Advisories – Non-GAAP and Other Financial Measures section of this MD&A.

4 ANNUAL REPORT 2024 SUNCOR ENERGY INC. 


Table of Contents

2. Suncor Overview

Suncor Energy is Canada's leading integrated energy company. Suncor's operations include oil sands development, production and upgrading; offshore oil production; petroleum refining in Canada and the U.S.; and the company’s Petro-CanadaTM retail and wholesale distribution networks (including Canada’s Electric HighwayTM, a coast-to-coast network of fast-charging EV stations). Suncor is developing petroleum resources while advancing the transition to a lower-emissions future through investments in lower emissions intensity power, renewable feedstock fuels and projects targeting emissions intensity. Suncor also conducts energy trading activities focused primarily on the marketing and trading of crude oil, natural gas, byproducts, refined products and power. Suncor’s common shares (symbol: SU) are listed on the Toronto Stock Exchange (TSX) and the New York Stock Exchange (NYSE).

For a description of Suncor’s business segments, refer to the Segment Results and Analysis section of this MD&A.

Suncor’s Strategy

Suncor aims to be Canada’s leading energy provider, respected for its people, performance, sustainability and relationships that together create value-added contributions to society, communities, customers and shareholders. Suncor is well positioned to execute on its strategy through the company’s competitive advantages that include its unparalleled, integrated upstream and downstream asset base and business model, underpinned by its large-scale, long-life oil sands resources.

Key components of Suncor’s strategy include the following:

Deliver industry-leading performance in safety, operational excellence and reliability: Suncor is focused on driving industry-leading safe and reliable performance through operational excellence and aligning its asset base with its competencies and competitive advantages to maximize value.
Achieve a cost structure that provides financial resiliency in a less than $45 US WTI business environment: Suncor is focused on driving down costs, increasing product margins and growing production while maintaining its commitment to capital discipline.
Leverage integration to maximize value from upstream production to downstream customers: From the ground to the gas station, Suncor seeks to maximize profit along each step of the value chain through its unparalleled asset integration. This includes Suncor’s unique, regionally integrated industrial asset complex of Oil Sands assets and structurally advantaged downstream assets.
Decarbonize base business and capture new opportunities to reduce greenhouse gas (GHG) emissions: The company is taking tangible actions to decarbonize its existing hydrocarbon business, while investing in other areas aligned with its core competencies, including investments in lower-carbon intensity power production through cogeneration and renewable fuels.
Grow free cash flow per share and deliver industry-leading financial returns to investors: The execution of Suncor’s strategy and key priorities is expected to continue to grow free funds flow per share and enable the company to deliver industry-leading shareholder returns.

2024 Highlights

Strong overall employee and contractor safety performance.

Delivered strong safety performance, with recordable events down by 16% and lost-time events down 30% compared to 2023.
Achieved best-ever process safety, ranking within the top quartile in the industry in North America.

Generated adjusted funds from operations(1) of $13.8 billion, the second highest in the company’s history.

Generated $13.846 billion in adjusted funds from operations,(1) or $10.87 per common share, compared to $13.325 billion, or $10.19 per common share, in the prior year. Cash flow provided by operating activities, which includes changes in non-cash working capital, was $15.960 billion, or $12.53 per common share, in 2024, compared to $12.344 billion, or $9.44 per common share, in the prior year.

ANNUAL REPORT 2024 SUNCOR ENERGY INC. 5


Table of Contents

Generated annual adjusted operating earnings(1) of $6.884 billion in 2024, or $5.40 per common share, compared to $6.677 billion, or $5.10 per common share, in the prior year. Net earnings were $6.016 billion in 2024, or $4.72 per common share, compared to $8.295 billion, or $6.34 per common share in the prior year.

Returned $5.7 billion to shareholders in 2024, which included a quarterly dividend increase of approximately 5% in the fourth quarter.

Returned $5.7 billion of value to shareholders in 2024, through $2.9 billion in share repurchases and $2.8 billion of dividends paid. In 2024, the company repurchased 55.6 million common shares at an average price of $52.33 per common share, or 4.3% of its outstanding shares as at December 31, 2023.
Suncor increased its dividend per share by approximately 5% to $0.57 per common share in the fourth quarter of 2024.

The company moved to 100% return of excess funds to shareholders via share repurchases.

Suncor achieved its net debt(1) target of $8 billion in the third quarter of 2024, nine months ahead of the initial projection made in its May 21, 2024, investor day.

Record production achieved in the upstream, where the company leveraged regional physical integration to maximize value.

Delivered record upstream production of 827,600 bbls/d in 2024, compared to 745,700 bbls/d in 2023.
The company leveraged its regional physical integration and strong reliability to maximize upgrader throughput, resulting in record synthetic crude oil (SCO) production of 516,100 bbls/d and upgrader utilization(2) of 98% in 2024, compared to 487,000 bbls/d and 92% in 2023.
Achieved record non-upgraded bitumen production of 257,700 bbls/d compared to 202,600 bbls/d in 2023, driven by record production at Firebag and Fort Hills.

Record production in refining and marketing, with the company delivering improved reliability while continuing to optimize its product sales network.

Delivered record refinery crude throughput of 465,000 bbls/d and refinery utilization of 100% in 2024, compared to 420,700 bbls/d and 90% in 2023.
Record refined product sales of 600,400 bbls/d, including four consecutive quarters of record sales in 2024.
Completed the re-branding of 19 Canadian Tire Corporation retail fuel sites to the Petro-CanadaTM brand.

Began operating a new cogeneration facility.

The company began operating an 800 MW cogeneration facility to replace the coke-fired boilers at Oil Sands Base Plant, which provides the steam generation required for extraction and upgrading activities at a lower cost. The cogeneration facility also generates lower-carbon-intensive power for Alberta’s power grid.

(1)Contains non-GAAP financial measures. See the Advisories – Non-GAAP and Other Financial Measures section of this MD&A.
(2)Upgrader utilization is calculated using gross upgraded production, inclusive of internally consumed products and inter-asset transfers, and gross upgrader nameplate capacities, on an average basis of Oil Sands Base and Syncrude.

6 ANNUAL REPORT 2024 SUNCOR ENERGY INC. 


Table of Contents

3. Financial Information

Net Earnings and Adjusted Operating Earnings

Consolidated Adjusted Operating Earnings Reconciliation(1)

Year ended December 31 ($ millions)


2024


2023


2022


Net earnings


6 016


8 295


9 077

Unrealized foreign exchange loss (gain) on U.S. dollar denominated debt


714


(184)


729

Unrealized (gain) loss on risk management activities

(98)

12

5

Loss on early repayment of long-term debt

144

Asset impairment and derecognition(2)

212

411

2 752

(Gain) loss on significant disposals and acquisitions(3)

(2 034)

65

Restructuring charge

275

Recognition of insurance proceeds(4)

(147)

Income tax recovery on adjusted operating earnings adjustments


(104)


(98)


(915)

Adjusted operating earnings(1)


6 884


6 677


11 566

(1)Non-GAAP financial measure. All reconciling items are presented on a before-tax basis and adjusted for income taxes in the income tax (recovery) expense on adjusted operating earnings adjustments line. See the Advisories – Non-GAAP and Other Financial Measures section of this MD&A.
(2)In 2022, a non-cash impairment of $3.397 billion against Suncor’s share of the Fort Hills assets in the Oil Sands segment. Also in 2022, a non-cash impairment reversal of $715 million on its share of the White Rose assets in the Exploration and Production (E&P) segment and a non-cash impairment of $70 million against its share of assets in Norway in the E&P segment.
(3)In 2022, a $65 million foreign exchange loss related to the sale of the company’s share of its assets in Norway in the E&P segment.
(4)In 2022, the company recognized $147 million of property damage insurance proceeds in other income related to the company’s assets in Libya in the E&P segment.

Suncor’s net earnings in 2024 were $6.016 billion, compared to $8.295 billion in 2023. Net earnings were impacted by the same factors that influenced adjusted operating earnings discussed below. Other items affecting net earnings in 2024 and 2023 included:

An unrealized foreign exchange loss on the revaluation of U.S. dollar denominated debt of $714 million recorded in financing expenses in the Corporate and Eliminations segment in 2024, compared to a gain of $184 million in 2023.
An unrealized gain on risk management activities of $98 million recorded in other income in 2024, compared to a loss of $12 million in 2023.
In 2024, the company recorded a loss on extinguishment of long-term debt of $144 million in the Corporate and Eliminations segment as a result of the early repayment of a series of its outstanding notes.
Suncor impaired equity investments in the Corporate and Eliminations segment of $212 million in 2024 and $158 million in 2023.
In 2023, the company recorded derecognition charges of $253 million on its Meadow Creek development properties in the Oil Sands segment.
In 2023, Suncor recorded a gain of $607 million on the sale of its U.K. E&P portfolio and a gain of $302 million on the sale of its wind and solar assets in the Corporate and Eliminations segment. Also in 2023, the company recorded a non-cash gain of $1.125 billion in the Oil Sands segment as a result of acquiring the remaining working interest in Fort Hills, via the purchase of TotalEnergies EP Canada Ltd. (TotalEnergies Canada).
In 2023, the company recorded a restructuring charge of $275 million in operating, selling and general (OS&G) expenses in the Corporate and Eliminations segment related to the company’s workforce reductions.
An income tax recovery related to the items noted above of $104 million in 2024, compared to a recovery of $98 million in 2023.

ANNUAL REPORT 2024 SUNCOR ENERGY INC. 7


Table of Contents

Graphic

(1)For an explanation of this bridge analysis, see the Advisories – Non-GAAP and Other Financial Measures section of this MD&A.

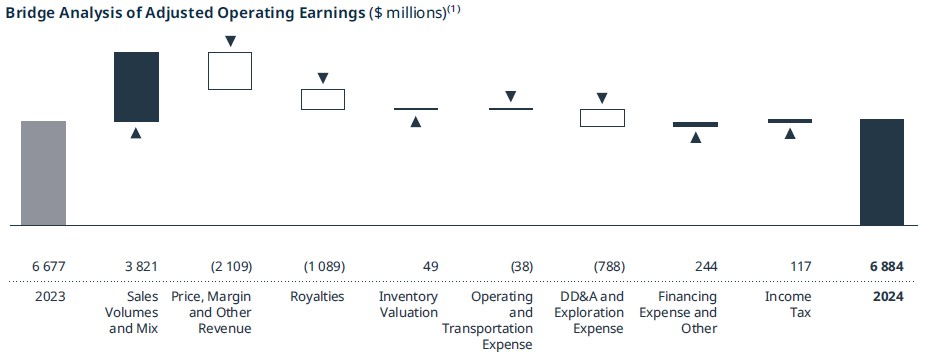
Suncor’s consolidated adjusted operating earnings were $6.884 billion in 2024, compared to $6.677 billion in the prior year. The increase in adjusted operating earnings in 2024 was primarily due to increased sales volumes in Oil Sands and E&P and increased production in Refining and Marketing (R&M), partially offset by lower benchmark crack spreads and lower SCO realizations, increased royalties due to higher heavy crude price realizations and increased depreciation, depletion and amortization (DD&A) expense.

Adjusted Funds from Operations and Cash Flow Provided by Operating Activities

Adjusted funds from operations increased to $13.846 billion in 2024, compared to $13.325 billion in 2023, and were primarily influenced by the same factors impacting adjusted operating earnings in 2024 compared to 2023, excluding DD&A expenses. The increase was partially offset by a larger tax benefit relating to the acquisition of TotalEnergies Canada in the prior year compared to the current year.

Cash flow provided by operating activities, which includes changes in non-cash working capital, was $15.960 billion in 2024, compared to $12.344 billion in 2023. In addition to the factors discussed above, cash flow provided by operating activities was impacted by a source of cash associated with the company’s working capital balances in 2024, compared to a use of cash in 2023. Working capital is subject to fluctuations based on commodity prices, the timing of transactions and seasonal factors. The source of cash in 2024 was primarily due to an increase in accounts payable and accrued liabilities, which includes the timing impact of commodity tax payable, a decrease in accounts receivable balances, in line with the decrease in benchmark commodity prices in 2024, and a draw on inventory due to increased sales volumes.

Results for 2023 Compared with 2022

Suncor’s consolidated adjusted operating earnings were $6.677 billion in 2023, compared to $11.566 billion in the prior year. The decrease in adjusted operating earnings in 2023 was primarily due to decreased crude oil and refined product price realizations compared to the prior year, reflecting a weaker business environment in 2023, and decreased sales volumes in E&P in 2023 due to international asset divestments, partially offset by lower incomes taxes and royalties, and increased sales volumes in Oil Sands. Adjusted operating earnings were also unfavourably impacted by a weakening in benchmark pricing in 2023 compared to a strengthening in 2022, resulting in a first-in, first-out (FIFO) inventory valuation loss, partially offset by a realization of intersegment profit in 2023, compared to a FIFO inventory valuation gain, partially offset by a deferral of intersegment profit in 2022.

Adjusted funds from operations were $13.325 billion in 2023, compared to $18.101 billion in 2022, and were primarily influenced by the same factors impacting adjusted operating earnings.

Cash flow provided by operating activities, which includes changes in non-cash working capital, was $12.344 billion in 2023, compared to $15.680 billion in 2022. In addition to the factors discussed above, cash flow provided by operating activities was impacted by a significant decrease in the use of working capital in the current year compared to the prior year. The use of cash in 2023 was primarily due to significantly lower net income taxes payable, and a decrease in accounts payable and accrued liabilities, partially offset by a decrease in accounts receivable balances related to the decrease in commodity prices in 2023.

8 ANNUAL REPORT 2024 SUNCOR ENERGY INC. 


Table of Contents

Business Environment

Commodity prices, refining crack spreads and foreign exchange rates are important factors that affect the results of Suncor’s operations.

Average for the year ended December 31


2024


2023


2022


WTI crude oil at Cushing (US$/bbl)


75.70

77.60

94.25


Dated Brent Crude (US$/bbl)


80.75

82.60

101.20


Dated Brent/Maya crude oil FOB price differential (US$/bbl)


12.95

14.19

15.50


MSW at Edmonton (Cdn$/bbl)


97.60

100.45

120.10


WCS at Hardisty (US$/bbl)


61.00

59.00

75.95


WCS-WTI light/heavy differential (US$/bbl)


(14.70)

(18.60)

(18.30)


SYN-WTI (differential) premium (US$/bbl)

(0.60)

2.00

4.45

Condensate at Edmonton (US$/bbl)


72.95

76.60

93.75


Natural gas (Alberta spot) at AECO (Cdn$/GJ)


1.35

2.50

5.10


Alberta Power Pool Price (Cdn$/MWh)


62.80

133.65

162.45


New York Harbor 2-1-1 crack(1) (US$/bbl)


22.90

34.40

47.00


Chicago 2-1-1 crack(1) (US$/bbl)


17.95

26.15

38.10


Portland 2-1-1 crack(1) (US$/bbl)


24.35

40.00

51.35


Gulf Coast 2-1-1 crack(1) (US$/bbl)


21.45

32.20

40.40


U.S. Renewable Volume Obligation (US$/bbl)

3.75

7.00

7.75

Suncor custom 5-2-2-1 index(2) (US$/bbl)

28.20

36.60

45.30

Exchange rate (average) (US$/Cdn$)


0.73

0.74

0.77


Exchange rate (end of period) (US$/Cdn$)


0.69

0.76

0.74


(1)2-1-1 crack spreads are indicators of the refining margin generated by converting two barrels of WTI into one barrel of gasoline and one barrel of diesel. The crack spreads presented here generally approximate the regions into which the company sells refined products through retail and wholesale channels.
(2)Suncor has developed an indicative 5-2-2-1 index based on publicly available pricing data to more accurately reflect the company’s realized refining and marketing gross margin.

Suncor’s sweet SCO price realizations are influenced primarily by the price of WTI at Cushing and by the supply and demand for sweet SCO from Western Canada. Sweet SCO price realizations in 2024 reflected a decrease in WTI at Cushing, which averaged US$75.70/bbl, compared to US$77.60/bbl in the prior year, and also reflected declining SYN-WTI premiums.

Suncor also produces sour SCO, the price of which is influenced by various crude benchmarks, including, but not limited to, MSW at Edmonton and WCS at Hardisty. Prices for MSW at Edmonton decreased to $97.60/bbl in 2024 compared to $100.45/bbl in 2023, and prices for WCS at Hardisty increased to US$61.00/bbl in 2024, from US$59.00/bbl in 2023.

Saleable bitumen is blended with diluent or SCO to facilitate delivery through pipeline systems. Net bitumen price realizations are therefore influenced by both prices for Canadian heavy crude oil (WCS at Hardisty is a common reference), prices for diluent (condensate at Edmonton) and SCO.

Suncor’s price realizations for production from E&P Canada and E&P International assets are influenced primarily by the price for Brent crude, which decreased to US$80.75/bbl in 2024, compared to US$82.60/bbl in 2023.

Suncor’s margins are primarily influenced by 2-1-1 benchmark crack spreads, which are industry indicators approximating the gross margin on a barrel of crude oil that is refined to produce gasoline and distillates at a specific location. Market crack spreads are based on quoted near-month contracts for WTI and spot prices for gasoline and diesel, and do not necessarily reflect the margins at a specific refinery. Suncor’s realized refining and marketing gross margins are influenced by crude mix, actual crude oil feedstock costs, refinery configuration, product mix and realized market prices unique to Suncor’s refining and marketing business. In addition, U.S. regulatory renewable blending obligations influence the benchmark cracks, which may increase their volatility. The cost of regulatory compliance is not deducted in calculating the benchmark cracks.

Suncor has developed an indicative 5-2-2-1 index based on publicly available pricing data to reflect the company’s refining and marketing gross margin more accurately. This custom index is a single value representing a notional five barrels of crude oil of varying grades refined to produce two barrels each of gasoline and distillate and one barrel of secondary product to approximate Suncor’s unique set of refinery configurations, overall crude slate and product mix, location, quality and grade differentials, and the benefits of its marketing margins. The custom index is calculated by taking the product value of refined products less the crude value of refinery feedstock excluding the impact of FIFO inventory accounting methodology. The product value incorporates the New York Harbor 2-1-1 crack, Chicago 2-1-1 crack, WTI benchmarks and a seasonal factor. The seasonal factor applies an incremental US$6.50/bbl in the first and fourth quarters and US$5.00/bbl in the second and third quarters. The crude value incorporates the SYN, WCS and WTI benchmarks.

ANNUAL REPORT 2024 SUNCOR ENERGY INC. 9


Table of Contents

Crack spreads are based on current crude feedstock prices, whereas actual earnings are accounted for on a FIFO basis in accordance with IFRS where a delay exists between the time that feedstock is purchased to when it is processed and when products are sold to a third party. A FIFO loss normally reflects a declining price environment for crude oil and finished products, whereas FIFO gains reflect an increasing price environment for crude oil and finished products. The company’s realized refining and marketing gross margins are also presented on a last-in, first-out (LIFO) basis, which is consistent with how industry benchmarks and the Suncor 5-2-2-1 index are calculated and with how management evaluates performance.

In 2024, 2-1-1 benchmark crack spreads decreased compared to 2023 and the Suncor 5-2-2-1 index was US$28.20/bbl in 2024 compared to US$36.60/bbl in 2023, reflecting the decrease in benchmark crack spreads.

The cost of natural gas used in Suncor’s Oil Sands and Refining operations is primarily referenced to Alberta spot prices at AECO. The average AECO benchmark decreased to $1.35/GJ in 2024, from $2.50/GJ in the prior year.

Excess electricity produced at Suncor’s Oil Sands assets is sold to the Alberta Electric System Operator, with the proceeds netted against the applicable cash operating cost per barrel metric. The Alberta power pool price decreased to an average of $62.80/MWh in 2024 from $133.65/MWh in the prior year.

The majority of Suncor’s revenues from the sale of commodities are based on prices that are determined by or referenced to U.S. dollar benchmark prices, while the majority of Suncor’s expenditures are realized in Canadian dollars, therefore a decrease in the value of the Canadian dollar relative to the U.S. dollar will increase revenues. In 2024, the Canadian dollar weakened in relation to the U.S. dollar as the average exchange rate decreased to US$0.73 per one Canadian dollar from US$0.74 per one Canadian dollar in 2023. Suncor also has assets and liabilities, including approximately 55% of the company’s debt, that are denominated in U.S. dollars and translated to Suncor’s reporting currency (Canadian dollars) at each balance sheet date.

10 ANNUAL REPORT 2024 SUNCOR ENERGY INC. 


Table of Contents

Economic Sensitivities(1)(2)

The following table illustrates the estimated effects that changes in certain factors would have had on 2024 net earnings and adjusted funds from operations(3) if the listed changes had occurred.


Impact on 2024

Impact on 2024


(Estimated change, in $ millions)

Net Earnings

Adjusted Funds from Operations(3)


Crude oil +US$1.00/bbl


200

200

Natural gas +Cdn$1.00/GJ(4)


(240)

(240)

2-1-1 crack spreads +US$1.00/bbl


150

150

Foreign exchange +$0.01 US$/Cdn$ related to operating activities(5)


(230)

(230)

Foreign exchange on U.S. dollar denominated debt +$0.01 US$/Cdn$


105

(1)Each line item in this table shows the effects of a change in that variable only, with other variables being held consistent.
(2)Changes for a variable imply that all such similar variables are impacted, such that Suncor’s average price realizations increase uniformly. For instance, “Crude oil +US$1.00/bbl” implies that price realizations influenced by WTI, Brent, SCO, WCS, par crude at Edmonton and condensate all increase by US$1.00/bbl.
(3)Non-GAAP financial measure. See the Advisories – Non-GAAP and Other Financial Measures section of this MD&A.
(4)The company’s exposure to natural gas costs is partially mitigated by revenue from power sales, which is not included in the above sensitivity.
(5)Excludes the foreign exchange impact on U.S. dollar denominated debt.

ANNUAL REPORT 2024 SUNCOR ENERGY INC. 11


Table of Contents

4. Segment Results and Analysis

Oil Sands

Suncor’s Oil Sands segment produces bitumen from mining and in situ operations in northern Alberta. Bitumen is either upgraded into SCO or blended with diluent for refinery feedstock or direct sale to market. The segment includes the marketing, supply, transportation and risk management of crude oil, power and byproducts.

The Oil Sands segment includes:

Oil Sands operations refer to Suncor’s owned and operated mining, extraction, upgrading, in situ and related logistics, blending and storage assets. Oil Sands operations consist of: Oil Sands Base operations, which include the Millennium and North Steepbank mines, integrated upgrading facilities Upgrader 1 and Upgrader 2, and the associated infrastructure for these assets, as well as interests in future mining development opportunities; and In Situ operations, which include oil sands bitumen production from Firebag and MacKay River and supporting infrastructure, as well as development opportunities that may support future in situ production.
Fort Hills includes Suncor’s wholly owned and operated Fort Hills mining and extraction operation, and the East Tank Farm Development, which Suncor operates and holds a 51% interest. In 2023, Suncor completed two separate acquisitions of additional working interests in the Fort Hills mining and extraction operation, increasing its ownership from 54.11% to 100%.
Syncrude refers to Suncor’s 58.74% operated working interest in Syncrude’s two producing oil sands mines, Mildred Lake and Aurora North, and integrated upgrading facilities. Syncrude also includes development opportunities that may support future production.

Exploration and Production

Suncor’s E&P segment consists of offshore operations off the East Coast of Canada, and onshore assets in Libya and Syria. This segment also includes the marketing and risk management of crude oil.

E&P Canada operations include Suncor’s 48% working interest in Terra Nova, which Suncor operates, and non-operated interests in the White Rose assets (40% in the base project and 38.6% in the extensions), Hibernia (20% in the base project and 19.485% in the Hibernia Southern Extension Unit) and Hebron (21.034%). In addition, the company holds interests in several exploration licences and significant discovery licences offshore Newfoundland and Labrador.
E&P International operations include Suncor’s working interests in the exploration and development of oilfields in the Sirte Basin in Libya, pursuant to exploration and production sharing agreements. Suncor also owns, pursuant to a production sharing contract, an interest in the Ebla gas development in Syria, which has been suspended indefinitely since 2011 due to political unrest in the country. E&P International previously included Suncor’s U.K. portfolio and Norway assets, which were divested in 2023 and 2022, respectively.

Refining and Marketing

Suncor’s R&M segment consists of two primary operations, discussed below. This segment also includes the trading of crude oil, refined products, natural gas and power.

Refining and Supply operations refine crude oil and intermediate feedstock into a wide range of petroleum and petrochemical products. Refining and Supply consists of: Eastern North America operations, which include a 137 mbbls/d refinery located in Montreal, Quebec, and an 85 mbbls/d refinery located in Sarnia, Ontario; and Western North America operations, which include a 146 mbbls/d refinery located in Edmonton, Alberta, and a 98 mbbls/d refinery in Commerce City, Colorado. Other Refining and Supply assets include product pipelines and terminals throughout Canada and the U.S., and the St. Clair ethanol plant in Ontario.
Marketing operations sell refined petroleum products to retail customers primarily through a combination of company-owned Petro-Canada™ locations, branded dealers in Canada and company-owned locations in the U.S. marketed under other international brands. This includes Canada’s Electric Highway™, a coast-to-coast network of

12 ANNUAL REPORT 2024 SUNCOR ENERGY INC. 


Table of Contents

fast-charging electric vehicle stations. The company’s marketing operations also sells refined petroleum products through a nationwide commercial road transportation network in Canada, and to other commercial and industrial customers, including other retail sellers, in Canada and the U.S.

Corporate and Eliminations

The Corporate and Eliminations segment includes activities not directly attributable to any other operating segment. This segment previously included Suncor’s renewable energy assets, which were sold in the first quarter of 2023.

Corporate activities include Suncor’s debt and borrowing costs, expenses not allocated to the company’s businesses, and investments in certain clean technologies.
Intersegment revenues and expenses are removed from consolidated results in Eliminations. Intersegment activity includes the sale of product between the company’s segments, primarily relating to crude refining feedstock sold from Oil Sands to R&M.

Oil Sands

Strategy and Investment Updates

Suncor remains focused on reducing its cost structure, while increasing production, reliability and efficiency.
oThe company plans to continue deploying new 400 tonne ultra-class, Autonomous Haulage System (AHS) capable haul trucks that will displace smaller, less efficient and more expensive third-party trucks.
oSuncor continues to progress the phased implementation of AHS at its mines to lower costs, and improve productivity and safety performance. AHS has been deployed at Oil Sands Base mine for ore delivery, with plans to deploy in overburden next, and is expected to be deployed at Syncrude in 2026 and Fort Hills in 2028.
oSuncor expects to continue to improve fleet productivity through use of the Mine Connect Digital Tool which was implemented in 2024 and provides access to real-time equipment performance data. The tool allows teams to rapidly identify and execute performance opportunities and leverage learnings between locations.
oThe company will continue to leverage is integrated regional asset complex, which was further expanded in 2024 to allow increased transfers of Fort Hills bitumen to Oil Sands Base, maximizing upgrader utilization and generating incremental value.
oSuncor plans to continue its company-wide initiative to further improve turnarounds through the optimization of work scope and sequence and efficient execution, which is expected to reduce overall turnaround costs and durations while increasing reliability.
The company is progressing the Upgrader 1 coke drum replacement project, which is expected to be in service in late 2025, and is anticipated to extend the life of Upgrader 1 by approximately 30 years in addition to reducing future operating and capital cost requirements.
Syncrude is progressing the Mildred Lake West Extension (MLX-W) project, which is expected to sustain bitumen production levels at the Mildred Lake site after resource depletion at the Mildred North Mine using existing mining and extraction facilities. First oil from MLX-W is expected in 2025.
In 2025, the company will be in the third year of its three-year mine improvement plan at Fort Hills, and work continues on opening two sections in the North Pit, which are expected to begin delivering ore in 2026.

ANNUAL REPORT 2024 SUNCOR ENERGY INC. 13


Table of Contents

Financial Highlights

Year ended December 31 ($ millions)


2024


2023


2022


Operating revenues


29 260


26 035


30 431

Less: Royalties


(3 645)


(2 623)


(3 963)

Operating revenues, net of royalties


25 615


23 412


26 468

Earnings before income taxes


6 607


6 811


5 633

Adjusted for:


Unrealized (gain) loss on risk management activities

(102)

28

12

Gain on significant acquisition(1)

(1 125)

Derecognition and asset impairment(2)(3)

253

3 397

Adjusted operating earnings(4)


6 505


5 967


9 042

Adjusted funds from operations(4)


11 842


10 725


13 831

Free funds flow(4)

7 502

6 629

10 291

(1)In 2023, a non-cash gain of $1.125 billion as a result of the acquisition of the remaining working interest in Fort Hills, via the purchase of TotalEnergies Canada.
(2)In 2023, derecognition charges of $253 million on the company’s Meadow Creek development properties.
(3)In 2022, a non-cash impairment of $3.397 billion against the company’s share of the Fort Hills assets.
(4)Non GAAP financial measures. See the Advisories – Non GAAP and Other Financial Measures section of this MD&A.

Graphic

(1)For an explanation of this bridge analysis, see the Advisories – Non-GAAP and Other Financial Measures section of this MD&A.

The Oil Sands segment had adjusted operating earnings of $6.505 billion in 2024, compared to $5.967 billion in 2023. The increase was primarily due to increased sales volumes, partially offset by increased royalties due to higher heavy crude price realizations, lower SCO price realizations and increased DD&A expense.

Oil Sands earnings before income taxes were $6.607 billion in 2024, compared to $6.811 billion in 2023. In addition to the factors impacting adjusted operating earnings, earnings before income taxes in 2023 included a non-cash gain of $1.125 billion as a result of the acquisition of TotalEnergies Canada, and non-cash derecognition charges of $253 million on the company’s Meadow Creek development properties. Additionally, 2024 was impacted by an unrealized gain on risk management activities, compared to a loss in the 2023.

Adjusted funds from operations for the Oil Sands segment were $11.842 billion in 2024, compared to $10.725 billion in 2023, and were influenced by the same factors that impacted adjusted operating earnings, excluding DD&A expenses.

14 ANNUAL REPORT 2024 SUNCOR ENERGY INC. 


Table of Contents

Production Volumes(1)

Year ended December 31


(mbbls/d)

2024

2023

2022


Oil Sands bitumen

Upgrader bitumen throughput

649.3

617.2

605.3

Non-upgraded bitumen production


257.7

202.6

185.2

Total Oil Sands bitumen production

907.0

819.8

790.5

Upgraded – net SCO and diesel

Oil Sands operations(1)

345.8

314.9

314.6

Syncrude(1)

198.4

190.9

179.1

Inter-asset transfers and consumption(2)(3)

(28.1)

(18.8)

(13.7)

Upgraded – net SCO and diesel production

516.1

487.0

480.0

Non-upgraded bitumen

Oil Sands operations

141.8

123.4

101.1

Fort Hills

168.0

106.4

85.1

Syncrude

1.1

1.7

5.7

Inter-asset transfers(4)

(53.2)

(28.9)

(6.7)

Non-upgraded bitumen production

257.7

202.6

185.2

Oil Sands production volumes to market

Upgraded – net SCO and diesel

516.1

487.0

480.0

Non-upgraded bitumen

257.7

202.6

185.2

Total Oil Sands production volumes


773.8

689.6

665.2

(1)Oil Sands Base upgrader yields are approximately 80% of bitumen throughput and Syncrude upgrader yield is approximately 85% of bitumen throughput. Upgrader utilization rates are calculated using total upgraded production, inclusive of internally consumed products and inter-asset transfers.
(2)Both Oil Sands operations and Syncrude produce diesel and other products, which are internally consumed in operations. In 2024, Oil Sands operations production volumes included 14,200 bbls/d of internally consumed products, of which 8,300 bbls/d was consumed at Oil Sands operations, 5,100 bbls/d was consumed at Fort Hills and 800 bbls/d was consumed at Syncrude. Syncrude production volumes included 2,800 bbls/d of internally consumed products.
(3)In 2024, upgraded inter-asset transfers consist of 11,100 bbls/d of sour SCO that was transferred from Oil Sands operations to Syncrude.
(4)In 2024, non-upgraded inter-asset transfers consist of 41,600 bbls/d of bitumen that was transferred from Fort Hills to Oil Sands Base, 10,500 bbls/d of bitumen that was transferred from Firebag to Syncrude and 1,100 bbls/d of bitumen that was transferred from Syncrude to Oil Sands operations.

Total Oil Sands bitumen production increased in 2024 compared to 2023, primarily due to the company’s increased working interest in Fort Hills, strong mining performance and record Firebag bitumen production.

The company’s net SCO production was a record 516,100 bbls/d in 2024, compared to 487,000 bbls/d in 2023. During 2024, the company achieved record upgrader utilization at both Oil Sands Base of 99% and Syncrude of 97%, compared to 90% and 93%, respectively in 2023. Record SCO production and upgrader utilization was primarily due to high reliability, fewer planned maintenance activities in 2024 compared to 2023 and the company leveraging its regional physical integration to maximize SCO production through record internal transfers.

Non-upgraded bitumen production increased to 257,700 bbls/d in 2024, compared to 202,600 bbls/d in 2023. The increase was primarily due to the acquisition of additional Fort Hills working interest and record production at Firebag, partially offset by increased internal transfers due to higher upgrader availability in 2024 compared to 2023.

Sales Volumes

Year ended December 31


(mbbls/d)

2024

2023

2022


Upgraded – net SCO and diesel

513.2

486.6

482.6

Non-upgraded bitumen

260.8

199.4

180.7

Total

774.0

686.0

663.3

SCO and diesel sales volumes increased to 513,200 bbls/d in 2024, compared to 486,600 bbls/d in 2023, consistent with the increase in production, partially offset by a larger build of inventory in 2024 compared to 2023.

Non-upgraded bitumen sales volumes increased to 260,800 bbls/d in 2024, from 199,400 bbls/d in 2023, primarily due to the increase in production and a draw of inventory in 2024 compared to a build in 2023.

ANNUAL REPORT 2024 SUNCOR ENERGY INC. 15


Table of Contents

Price Realizations(1)

Year ended December 31


Net of transportation costs, but before royalties ($/bbl)

2024

2023

2022


Upgraded – net SCO and diesel


97.91


99.40


118.88

Non-upgraded bitumen

72.65

67.97

84.63

Weighted average

89.41

90.27

109.57

Weighted average crude, relative to WTI

(14.28)

(14.44)

(13.02)

(1)Contains non-GAAP financial measures. See the Advisories – Non-GAAP and Other Financial Measures section of this MD&A.

Oil Sands price realizations decreased slightly in 2024 compared to 2023, primarily due to lower benchmark WTI pricing and weaker synthetic premiums, partially offset by the narrowing of heavy crude oil differentials, an increase in heavy crude oil benchmark pricing and the benefits of a weaker Canadian dollar relative to the U.S. dollar.

Royalties

Royalties for the Oil Sands segment increased in 2024 compared to 2023, primarily due to increased bitumen production volumes and increased heavy crude benchmark pricing.

Expenses and Other Factors

Adjusting for the impacts of the Fort Hills working interest acquisitions in 2023, total Oil Sands operating expenses were lower in 2024 relative to 2023. The decrease is consistent with the company’s focus on asset level cost reduction and included lower costs related to workforce optimizations and the deployment of new ultra class haul trucks, as well as lower commodity costs. See the Cash Operating Costs section below for additional details regarding cash operating costs and a breakdown of non-production costs by asset.

In 2024, DD&A expense was higher than 2023, primarily due to increased depreciation related to the company’s asset retirement obligation asset, the company’s increased working interest in Fort Hills and new leases entered into during 2024, partially offset by lower derecognition charges of property, plant and equipment in the current year.

Financing expense increased in 2024 compared to 2023, primarily due to increased accretion expense resulting from asset retirement obligations and increased interest on leases, as a result of net leases assumed with the Fort Hills acquisitions in 2023, and entered into during 2024. Other income decreased in 2024 compared to 2023, due to the impact of a provision reversal in 2023.

16 ANNUAL REPORT 2024 SUNCOR ENERGY INC. 


Table of Contents

Cash Operating Costs

Year ended December 31


2024


2023


2022


Oil Sands OS&G(1)

9 428

9 329

9 152

Oil Sands operations cash operating costs reconciliation


Oil Sands operations OS&G


4 797

5 174

5 429

Non-production costs(3)


246

(35)

(302)

Excess power capacity and other(4)


(245)

(388)

(586)

Oil Sands operations cash operating costs(2) ($ millions)


4 798

4 751

4 541

Oil Sands operations production volumes (mbbls/d)

487.6

438.3

415.7

Oil Sands operations cash operating costs(2) ($/bbl)


26.90

29.70

29.95

Fort Hills cash operating costs reconciliation


Fort Hills OS&G


2 315

1 607

1 146

Non-production costs(3)


(267)

(220)

(161)

Excess power capacity(4)

(32)

(52)

(53)

Fort Hills cash operating costs(2) ($ millions)


2 016

1 335

932

Fort Hills production volumes (mbbls/d)

168.0

106.4

85.1

Fort Hills cash operating costs(2) ($/bbl)


32.80

34.40

30.00

Syncrude cash operating costs reconciliation


Syncrude OS&G


2 604

2 837

2 840

Non-production costs(3)


(22)

(202)

(337)

Excess power capacity(4)

(17)

(24)

(31)

Syncrude cash operating costs(2) ($ millions)


2 565

2 611

2 472

Syncrude production volumes (mbbls/d)

199.5

192.6

184.8

Syncrude cash operating costs(2) ($/bbl)


35.15

37.15

36.65

(1)Oil Sands inventory changes and internal transfers are presented on an aggregate basis and reflect: i) the impacts of changes in inventory levels and valuations, such that the company is able to present cost information based on production volumes; and ii) adjustments for internal diesel sales between assets. In 2024, Oil Sands OS&G included ($288) million of inventory changes and internal transfers. In 2023, Oil Sands OS&G included ($289) million of inventory changes and internal transfers. In 2022, Oil Sands OS&G included ($263) million of inventory changes and internal transfers.
(2)Non-GAAP financial measures. Related per barrel amounts contain non-GAAP financial measures. See the Advisories – Non-GAAP and Other Financial Measures section of this MD&A
(3)Non-production costs include, but are not limited to, share-based compensation adjustments, research costs, project startup costs and adjustments to reflect the cost of internal transfers in the receiving asset at the cost of production versus the cost of purchase. Non-production costs at Fort Hills and Syncrude also include, but are not limited to, an adjustment to reflect internally produced diesel from Oil Sands operations at the cost of production.
(4)Represents excess power revenue from cogeneration units that is recorded in operating revenues. Oil Sands operations excess power capacity and other also includes, but is not limited to, the natural gas expense recorded as part of a non-monetary arrangement involving a third-party processor.

Oil Sands operations cash operating costs per barrel(1) in 2024 decreased to $26.90 compared to $29.70 in 2023, primarily due to increased production, lower costs due to workforce optimizations and displacement of contractor tonnage through the deployment of new ultra class haul trucks, and lower natural gas prices, partially offset by a higher proportion of Fort Hills bitumen being directed to upgrading at Oil Sands Base and a decrease in excess power revenues resulting from lower power prices.

Fort Hills cash operating costs per barrel(1) in 2024 decreased to $32.80 compared to $34.40 in 2023, primarily due to increased absolute production volumes, partially offset by increased mining activity pursuant to the Fort Hills mine plan and a decrease in excess power revenues resulting from lower power prices.

Syncrude cash operating costs per barrel(1) in 2024 decreased to $35.15 compared to $37.15 in 2023, primarily due to increased production volumes, lower costs due to workforce optimizations and displacement of contractor tonnage through deployment of new ultra class haul trucks.

(1)Contains non-GAAP financial measures. See the Advisories – Non-GAAP and Other Financial Measures section of this MD&A.

ANNUAL REPORT 2024 SUNCOR ENERGY INC. 17


Table of Contents

Asset Transactions

On February 2, 2023, the company completed the acquisition of an additional 14.65% working interest in Fort Hills from Teck Resources Limited for $712 million, bringing the company’s working interest to 68.76%.

On November 20, 2023, Suncor completed the acquisition of TotalEnergies Canada, which held the remaining 31.23% working interest in Fort Hills, for $1.468 billion before closing adjustments and other closing costs, making Suncor the sole owner of Fort Hills. The effective date of the transaction was April 1, 2023, and the acquisition resulted in a non-cash gain of $1.125 billion.

Planned Maintenance

Planned turnarounds and maintenance are scheduled in 2025 as follows:

Maintenance at Oil Sands Base Upgrader 1 relating to the coke drum replacement project is commencing in the second quarter with completion in the third quarter.
Turnaround at Oil Sands Base Upgrader 2 commencing in the third quarter with completion in the fourth quarter.
Turnaround at Syncrude commencing in the third quarter with completion in the fourth quarter.
Turnaround at Firebag commencing in the second quarter with completion in the third quarter.
Maintenance at Fort Hills in the second quarter and fourth quarter.

The anticipated impact of these maintenance events has been reflected in the company’s 2025 guidance.

Exploration and Production

Strategy and Investment Updates

Terra Nova returned to normal operations following the completion of its asset life extension project.
Suncor intends to continue investment in development drilling and other activities expected to extend the productive life of the existing fields at Hebron and Hibernia.
Following reconnection of the SeaRose Floating, Production, Storage and Offloading (FPSO) in the fourth quarter of 2024, investment will continue in the West White Rose Extension Project which is expected to extend the production life of the field. Production at White Rose is expected to restart in 2025. Production from the West White Rose Project is expected to commence in 2026.

18 ANNUAL REPORT 2024 SUNCOR ENERGY INC. 


Table of Contents

Financial Highlights

Year ended December 31 ($ millions)


2024


2023


2022


Operating revenues(1)


2 798


2 689


4 331

Less: Royalties(1)


(547)


(491)


(608)

Operating revenues, net of royalties


2 251


2 198


3 723

Earnings before income taxes


867


1 691


3 221

Adjusted for:


(Gain) loss on significant disposals(2)(3)


(607)


65

Asset impairment reversal(4)


(645)

Recognition of insurance proceeds(5)


(147)

Adjusted operating earnings(6)


867


1 084


2 494

Adjusted funds from operations(6)


1 610


1 612


3 178

Free funds flow(6)

703

944

2 735

(1)Production from the company’s Libya operations has been presented on an economic basis. In the Financial Statements, revenue and royalties from the company’s Libya operations are presented on a working-interest basis, which is required for presentation purposes. In 2024, revenue included a gross-up amount of $510 million, with an offsetting amount of $271 million in royalties in the E&P segment and $239 million in income tax expense recorded at the consolidated level. In 2023, revenue included a gross-up amount of $528 million (2022 - $486 million), with an offsetting amount of $282 million (2022 - $266 million) in royalties and $246 million (2022 - $220 million) in income tax expense recorded at the consolidated level.
(2)In 2023, a gain of $607 million on the sale of the company’s U.K. E&P portfolio.
(3)In 2022, a $65 million foreign exchange loss related to the sale of the company’s assets in Norway.
(4)In 2022, a non-cash impairment reversal of $715 million on the company’s share of the White Rose assets in the E&P segment and a non-cash impairment of $70 million against its assets in Norway.
(5)In 2022, the company recognized $147 million of property damage insurance proceeds in other income related to the company’s assets in Libya.
(6)Non-GAAP financial measures. See the Advisories – Non-GAAP and Other Financial Measures section of this MD&A.

Graphic

(1)For an explanation of this bridge analysis, see the Advisories – Non-GAAP and Other Financial Measures section of this MD&A.

Adjusted operating earnings were $867 million for E&P in 2024, compared to $1.084 billion in the prior year, with the decrease due to lower sales volumes at E&P international as a result of the divestment of the company’s U.K. portfolio in 2023, increased DD&A and lower realized crude prices, partially offset by increased sales volumes at E&P Canada.

Earnings before income taxes for E&P were $867 million in 2024, compared to $1.691 billion in 2023. In addition to the factors impacting adjusted operating earnings, earnings before income taxes in 2023 included a gain of $607 million on the sale of the company’s U.K. portfolio, which was completed in the second quarter of 2023.

Adjusted funds from operations were $1.610 billion in 2024, compared to $1.612 billion in 2023, and were influenced by the same factors that impacted adjusted operating earnings, excluding DD&A expenses.

ANNUAL REPORT 2024 SUNCOR ENERGY INC. 19


Table of Contents

Volumes

Year ended December 31


2024


2023


2022


E&P Canada (mbbls/d)


49.7

44.4

50.2

E&P International (mboe/d)


4.1

11.7

27.8

Total production (mboe/d)


53.8

56.1

78.0

Total sales volumes (mboe/d)


56.2

52.9

80.6

E&P Canada production volumes averaged 49,700 bbls/d in 2024, compared to 44,400 bbls/d the prior year, with the increase primarily due to the addition of production from Terra Nova, partially offset by the absence of production from White Rose due to the asset life extension project.

E&P International production volumes averaged 4,100 boe/d in 2024, compared to 11,700 boe/d in 2023, with the decrease primarily due to the divestment of the company’s U.K. portfolio in the second quarter of 2023.

E&P sales volumes averaged 56,200 boe/d in 2024, compared to 52,900 boe/d in the prior year, with the increase primarily due to a draw of inventory in 2024, compared to a build in the prior year.

Price Realizations(1)

Year ended December 31


Net of transportation costs, but before royalties

2024

2023

2022


E&P Canada ($/bbl)


107.38


107.62


128.07

E&P International(2) ($/boe)


109.00


126.61

(1)Contains non-GAAP financial measures. See the Advisories – Non-GAAP and Other Financial Measures section of this MD&A.
(2)E&P International price realizations exclude Libya for all periods presented.

E&P price realizations were comparable in 2024 compared to 2023, reflecting the benchmark prices for Brent crude.

Royalties

E&P royalties, excluding the impact of Libya, were higher in 2024 than the prior year primarily due to increased sales volumes.

Expenses and Other Factors

Operating and transportation expenses for 2024 were higher compared to the prior year primarily due to the restart of production at Terra Nova.

DD&A and exploration expenses for 2024 were higher compared to the prior year primarily due to the restart of production at Terra Nova.

Asset Transactions

During the second quarter of 2023, the company completed the sale of its U.K. E&P portfolio for gross proceeds of $1.1 billion before closing adjustments and other closing costs, resulting in a gain on sale of $607 million ($607 million after-tax).

Planned Maintenance of Operated Assets

There are no planned maintenance activities scheduled for Suncor’s operated E&P assets in 2025.

20 ANNUAL REPORT 2024 SUNCOR ENERGY INC. 


Table of Contents

Refining and Marketing

Strategy and Investment Updates

In 2025, the company plans to continue the enhancement of its Petro-Canada™ retail business, with the goal of maintaining its industry-leading brand position and growing margin. Economic investment in 2025 will continue to high-grade company-owned and controlled sites in the most profitable locations and markets, while targeting non-company-controlled sites in less densely populated areas using alternative ownership structures and partnerships to grow the brand’s scale and presence.
Expansion of the Canadian Tire Corporation partnership will continue through 2025 and beyond, eventually re-branding more than 200 retail sites to the Petro-CanadaTM brand.
Suncor will continue its company-wide initiative to further improve turnarounds through the optimization of work scope and sequence and efficient execution, which is expected to reduce overall turnaround costs and durations while increasing reliability.

Financial Highlights

Year ended December 31 ($ millions)


2024


2023


2022


Operating revenues


31 341


31 068


36 728

Earnings before income taxes


2 596


3 383


5 694

Adjusted for:


Unrealized loss (gain) on risk management activities

4

(16)

(7)

Adjusted operating earnings(1)


2 600


3 367


5 687

Adjusted funds from operations(1)


3 538


4 268


6 561

Free funds flow(1)


2 348

3 266

5 745

(1)Non-GAAP financial measures. See the Advisories – Non-GAAP and Other Financial Measures section of this MD&A.

Graphic

(1)For an explanation of this bridge analysis, see the Advisories – Non-GAAP and Other Financial Measures section of this MD&A.

R&M adjusted operating earnings were $2.600 billion in 2024, compared with $3.367 billion in 2023. The decrease in adjusted operating earnings was primarily due to a decrease in refining and marketing benchmark crack spreads, partially offset by increased refinery production volumes and a smaller FIFO inventory valuation loss in 2024 compared to 2023.

R&M earnings before income taxes in 2024 were $2.596 billion compared to $3.383 billion in 2023. In addition to the factors impacting adjusted operating earnings, earnings before income taxes in 2024 were impacted by an unrealized loss on risk management activities, compared to a gain in 2023.

ANNUAL REPORT 2024 SUNCOR ENERGY INC. 21


Table of Contents

R&M achieved annual adjusted funds from operations of $3.538 billion in 2024, compared to $4.268 billion in 2023, with the decrease due primarily to the same factors that impacted adjusted operating earnings.

Volumes

Year ended December 31


2024


2023


2022


Crude oil processed (mbbls/d)


Eastern North America


213.6


212.4


206.2

Western North America


251.4


208.3


227.0

Total


465.0


420.7


433.2

Refinery utilization(1) (%)


Eastern North America


96


96


93

Western North America


103


85


93

Average


100


90


93

Refined product sales (mbbls/d)


Gasoline


253.3


228.0


227.6

Distillate


261.9


243.9


244.6

Other


85.2


81.2


81.4

Total


600.4


553.1


553.6

Refinery production(2) (mbbls)

180 356

163 895

168 149

Refining and marketing gross margin – First-in, first-out (FIFO)(3) ($/bbl)


36.40


45.00


55.85

Refining and marketing gross margin – Last-in, first-out (LIFO)(3) ($/bbl)

37.00

47.00

54.45

Refining operating expense(3) ($/bbl)


6.60


7.45


7.00

(1)Refinery utilization is the amount of crude oil and natural gas liquids processed by crude distillation units, expressed as a percentage of the nameplate capacity of these units.
(2)Refinery production is the output of the refining process and differs from crude oil processed as a result of volumetric adjustments for non-crude feedstock, volumetric gain associated with the refining process and changes in unfinished product inventories.
(3)Contains non-GAAP financial measures. See the Advisories – Non-GAAP and Other Financial Measures section of this MD&A.

Refinery crude throughput was a record 465,000 bbls/d and refinery utilization averaged 100% in 2024, compared to refinery crude throughput of 420,700 bbls/d and refinery utilization of 90% in 2023. The increase was primarily due to strong, reliable operating performance in 2024, and 2023 being impacted by unplanned maintenance at the Commerce City refinery.

Total refined product sales were a record 600,400 bbls/d in 2024, compared to 553,100 bbls/d in 2023, with the increase primarily due to higher refinery throughput and the benefit of the company’s continued investment in its extensive retail and broad sales network.

22 ANNUAL REPORT 2024 SUNCOR ENERGY INC. 


Table of Contents

Refining and Marketing Gross Margins(1)

Refining and marketing gross margins were influenced by the following:

On a LIFO(2) basis, Suncor’s refining and marketing gross margin decreased to $37.00/bbl in 2024 from $47.00/bbl in 2023. The decrease was primarily due to lower benchmark crack spreads compared to the prior year. Suncor’s refining and marketing gross margin also reflects the company’s feedstock advantage, which enables Suncor to process heavier crude oil, marketing and logistics capabilities and strong sales channels within its integrated retail and wholesale networks. On a LIFO basis, Suncor’s refining and marketing gross margin represents a margin capture of 96% of Suncor’s 5-2-2-1 index in 2024, compared to 95% in 2023.
On a FIFO basis, Suncor’s refining and marketing gross margin decreased to $36.40/bbl in 2024, from $45.00/bbl in 2023 due to the same factors discussed above, in addition to FIFO inventory valuation impacts. In 2024, the impact of the FIFO method of inventory valuation, relative to an estimated LIFO(2) method, resulted in a loss of $107 million. In 2023, the FIFO method resulted in a loss of $330 million, for an overall favourable year-over-year impact of $223 million.

Expenses and Other Factors

R&M operating expenses decreased compared to the prior year due to lower maintenance costs and lower natural gas and other commodity input costs.

R&M transportation expenses increased compared to the prior year due to higher sales volumes and exports.

Refining operating expense per barrel(1) decreased to $6.60 in 2024, compared to $7.45 in the prior year, primarily due to increased production and lower natural gas and other commodity input costs.

Planned Maintenance

Planned turnarounds and maintenance are scheduled in 2025 as follows:

Turnaround at the Sarnia refinery commencing in the first quarter with completion in the second quarter.
Turnaround at the Edmonton refinery in the second quarter.
Maintenance at the Montreal refinery in the second quarter.
Maintenance at the Edmonton refinery commencing in the third quarter with completion in the fourth quarter.

The anticipated impact of these maintenance activities has been reflected in the company’s 2025 guidance.

(1)Contains non-GAAP financial measures. See the Advisories – Non-GAAP and Other Financial Measures section of this MD&A.
(2)The estimated impact of the LIFO method is a non-GAAP financial measure. The impact of the FIFO method of inventory valuation, relative to an estimated LIFO accounting method, also includes the impact of the realized portion of commodity risk management activities. See the Advisories – Non-GAAP and Other Financial Measures section of this MD&A.

ANNUAL REPORT 2024 SUNCOR ENERGY INC. 23


Table of Contents

Corporate and Eliminations

Strategy and Investment Updates

The company remains committed to its capital allocation framework, managing its balance sheet at current debt levels and returning 100% of excess funds to shareholders.
The company remains focused on continuing to execute organizational efficiency improvements and generating structural cost savings.

Financial Highlights

Year ended December 31 ($ millions)


2024


2023


2022


Loss before income taxes


(1 883)


(1 296)


(2 232)

Adjusted for:


Unrealized foreign exchange loss (gain) on U.S. dollar denominated debt


714


(184)


729

Asset impairment(1)

212

158

Loss on early repayment of long-term debt(2)

144

Restructuring charge(3)

275

Gain on significant disposal(4)

(302)

Adjusted operating loss(5)


(813)


(1 349)


(1 503)

Corporate and Renewables


(695)


(1 405)


(1 456)

Eliminations - Intersegment profit (eliminated) realized


(118)


56


(47)

Adjusted funds used in operations(5)


(679)


(1 546)


(1 240)

Free funds deficit(5)

(725)

(1 608)

(1 428)

(1)An impairment against an equity investment of $212 million in 2024 and $158 million in 2023.
(2)In 2024, a loss on extinguishment of long-term debt of $144 million as a result of the early repayment of certain series of the company’s outstanding notes.
(3)In 2023, a restructuring charge of $275 million in OS&G expenses related to the company’s workforce reductions.
(4)In 2023, a gain of $302 million on the sale of the company’s wind and solar assets.
(5)Non GAAP financial measures. See the Advisories – Non GAAP and Other Financial Measures section of this MD&A.

Corporate

The adjusted operating loss for Corporate was $695 million in 2024, compared to $1.405 billion in 2023. The decrease in adjusted operating loss was primarily due to an operational foreign exchange gain in 2024, versus a loss in 2023, an increase in interest revenue on the company’s cash balances, and decreased spend in digital technologies, partially offset by an increase in share-based compensation expense.

Suncor capitalized $317 million of its borrowing costs in 2024, compared to $255 million in 2023, as part of the cost of major development assets and construction projects in progress.

Eliminations – Intersegment Profit Eliminated

Eliminations reflect the deferral or realization of profit or loss on crude oil sales from Oil Sands to Suncor’s refineries. Consolidated profits and losses are only realized when the refined products produced from internal purchases of crude feedstock have been sold to third parties. In 2024, the company deferred $118 million of intersegment profit, compared to a realization of profit of $56 million in the prior year. The deferral of profit in 2024 was primarily driven by an increase in intersegment inventory volumes and the favourable impact of foreign exchange rates on crude inventory pricing in 2024.

Adjusted funds used in operations for the Corporate and Eliminations segment were $679 million in 2024, compared to $1.546 billion in 2023, and were influenced by the same factors that impacted adjusted operating loss, excluding the impact of the non-cash component of share-based compensation expense. Adjusted funds from operations in 2023 were impacted by a restructuring charge related to the company’s workforce reductions in 2023.

Asset Transactions

During the first quarter of 2023, the company completed the sale of its wind and solar assets for gross proceeds of $730 million, before closing adjustments and other closing costs, resulting in a gain on sale of $302 million ($260 million after-tax).

24 ANNUAL REPORT 2024 SUNCOR ENERGY INC. 


Table of Contents

5. Income Tax

Year ended December 31 ($ millions)


2024


2023


2022


Current income tax expense


2 465


1 734


4 229

Deferred income tax (recovery) expense


(294)


560


(990)

Income tax expense included in net earnings


2 171


2 294


3 239

Less: Income tax (recovery) on adjusted operating earnings adjustments

(104)

(98)

(915)

Income tax expense included in adjusted operating earnings

2 275

2 392

4 154

Effective tax rate

26.5%

21.7%

26.3%

The provision for income taxes in 2024 decreased to $2.171 billion, compared to $2.294 billion in 2023, primarily due to higher taxable earnings in Canada more than offset by lower taxable earnings in other foreign jurisdictions subject to tax at higher rates. In 2024, the company's effective tax rate on net earnings increased compared to 2023, due to the impact of a non-taxable gain on the acquisition of TotalEnergies Canada in 2023, a non-taxable gain on the disposition of Suncor’s U.K. assets in 2023, non-taxable foreign exchange losses on the revaluation of U.S. dollar denominated debt, and other permanent items impacting total tax expense in 2024.

ANNUAL REPORT 2024 SUNCOR ENERGY INC. 25


Table of Contents

6. Fourth Quarter 2024 Analysis

Financial and Operational Highlights

Three months ended December 31


($ millions, except as noted)

2024

2023


Earnings (loss) before income taxes


Oil Sands


1 625


2 660

Exploration and Production


125


133

Refining and Marketing


410


598

Corporate and Eliminations


(1 070)


(1)

Income tax expense

(272)

(570)

Net earnings


818


2 820

Adjusted operating earnings (loss)(1)


Oil Sands


1 609


1 526

Exploration and Production


125


133

Refining and Marketing


410


598

Corporate and Eliminations


(200)


(42)

Income tax expense included in adjusted operating earnings

(378)

(580)

Total


1 566


1 635

Adjusted funds from (used in) operations(1)


Oil Sands


3 126


2 651

Exploration and Production


274


228

Refining and Marketing


638


811

Corporate and Eliminations


(131)


10

Current income tax recovery (expense)

(414)

334

Total adjusted funds from operations


3 493


4 034

Changes in non-cash working capital

1 590

284

Cash flow provided by operating activities

5 083

4 318

Free funds flow(1)

1 923

2 482

Production volumes


Oil Sands – Upgraded – net SCO and diesel (mbbls/d)


543.6


475.7

Oil Sands – Non-upgraded bitumen (mbbls/d)

273.9

281.7

Total Oil Sands production volumes (mbbls/d)

817.5

757.4

Exploration and Production (mboe/d)


57.5


50.7

Total upstream production (mboe/d)


875.0


808.1

(1)Non-GAAP financial measures. See the Advisories – Non-GAAP and Other Financial Measures section of this MD&A.

Net Earnings

Suncor’s consolidated net earnings for the fourth quarter of 2024 were $818 million, compared to $2.820 billion in the prior year quarter. Net earnings were primarily influenced by the same factors that impacted adjusted operating earnings discussed below.

Other items affecting net earnings over these periods include:

An unrealized foreign exchange loss on the revaluation of U.S. dollar denominated debt of $514 million recorded in financing expenses in the Corporate and Eliminations segment in the fourth quarter of 2024, compared to a gain of $199 million in the fourth quarter of 2023.
An unrealized gain on risk management activities of $16 million recorded in other income (loss) in the fourth quarter of 2024, compared to an unrealized gain of $9 million in the fourth quarter of 2023.
During the fourth quarter of 2024, the company recorded a loss on extinguishment of long-term debt of $144 million in the Corporate and Eliminations segment as a result of the early repayment of certain series of its outstanding notes.

26 ANNUAL REPORT 2024 SUNCOR ENERGY INC. 


Table of Contents

During the fourth quarter of 2024, Suncor recorded an impairment of $212 million against an equity investment in the Corporate and Eliminations segment.
During the fourth quarter of 2023, Suncor recorded an impairment of $158 million against an equity investment in the Corporate and Eliminations segment.
During the fourth quarter of 2023, the company recorded a non-cash gain of $1.125 billion in the Oil Sands segment as a result of the acquisition of TotalEnergies Canada.
An income tax recovery related to the items noted above of $106 million in the fourth quarter of 2024, compared to a recovery of $10 million in the fourth quarter of 2023.

Adjusted Operating Earnings

Suncor’s adjusted operating earnings were $1.566 billion ($1.25 per common share) in the fourth quarter of 2024, compared to $1.635 billion ($1.26 per common share) in the prior year quarter, with the decrease primarily due to lower refined product realizations, increased royalties due to higher heavy crude price realizations, and increased DD&A expense, partially offset by higher sales volumes.

Adjusted Funds from Operations and Cash Flow Provided by Operating Activities

Adjusted funds from operations were $3.493 billion ($2.78 per common share) in the fourth quarter of 2024, compared to $4.034 billion ($3.12 per common share) in the prior year quarter, and were primarily influenced by the same factors impacting adjusted operating earnings, as well as a larger tax benefit relating to the acquisition of TotalEnergies Canada in the prior year quarter compared to the current quarter.

Cash flow provided by operating activities, which includes changes in non-cash working capital, was $5.083 billion ($4.05 per common share) in the fourth quarter of 2024, compared to $4.318 billion ($3.34 per common share) in the prior year quarter. In addition to the factors impacting adjusted funds from operations, cash flow provided by operating activities was impacted by a larger source of cash associated with the company’s working capital balances in the fourth quarter of 2024 compared to the prior year quarter. Working capital is subject to fluctuations based on commodity prices, the timing of transactions and seasonal factors. The source of cash in the fourth quarter of 2024 was due to decreased accounts receivable balances, primarily due to a decrease in benchmark commodity prices during the quarter and the timing of cargo settlements, an increase in accounts payable and accrued liabilities, which includes the timing impact of commodity taxes payable, and a draw of inventory related to increased sales volumes.

Segmented Analysis

Oil Sands

Oil Sands segment adjusted operating earnings increased to $1.609 billion in the fourth quarter of 2024, compared to $1.526 billion in the prior year quarter, primarily due to increased sales volumes, partially offset by higher royalties and increased DD&A expense.

Total Oil Sands bitumen production increased to a record 951,500 bbls/d in the fourth quarter of 2024, compared to 866,200 bbls/d in the prior year quarter, primarily due to record production at Firebag, the company’s increased working interest at Fort Hills and strong mining performance.

The company’s SCO production increased to a fourth quarter record of 543,600 bbls/d, compared to 475,700 bbls/d in the prior year quarter as the company leveraged its unparalleled regional integration and high reliability, and included record quarterly upgrader utilization of 105% at Syncrude and fourth quarter record upgrader utilization of 102% at Oil Sands Base, compared to 101% and 83%, respectively, in the prior year quarter. The increase was also due to fewer planned maintenance activities at Oil Sands Base in the current quarter compared to the prior year quarter.

Non-upgraded bitumen production decreased to 273,900 bbls/d in the fourth quarter of 2024, compared to 281,700 bbls/d in the prior year quarter, due to higher upgrader availability more than offsetting increased bitumen production.

ANNUAL REPORT 2024 SUNCOR ENERGY INC. 27


Table of Contents

Exploration and Production

Adjusted operating earnings for the E&P segment in the fourth quarter of 2024 were $125 million, compared to $133 million in the prior year quarter, with the decrease primarily due to lower realized crude prices, increased DD&A expense and higher royalties, partially offset by higher sales volumes.

E&P production increased to 57,500 bbls/d in the fourth quarter of 2024, compared to 50,700 bbls/d in the prior year quarter, primarily due to the addition of production from Terra Nova, and increased production at Hibernia, partially offset by the absence of production from White Rose due to the asset life extension project.

Total E&P sales volumes increased to 44,800 bbls/d in the fourth quarter of 2024, compared to 29,200 bbls/d in the prior year quarter, primarily due to the same factors that impacted production volumes and the timing of cargo sales in E&P Canada.

Refining and Marketing

R&M adjusted operating earnings in the fourth quarter of 2024 were $410 million, compared to $598 million in the prior year quarter. The decrease in adjusted operating earnings was primarily due to lower benchmark crack spreads, partially offset by increased refinery production and a smaller FIFO inventory valuation loss in the fourth quarter of 2024 compared to the prior year quarter.

Strong operating performance resulted in utilization rates above 100% at all refineries for the second consecutive quarter. Overall utilization was 104% and throughput was 486,200 bbls/d, compared to 98% and 455,900 bbls/d, respectively, in the prior year quarter.

R&M achieved record refined product sales of 613,300 bbls/d in the fourth quarter of 2024, compared to 575,500 bbls/d in the prior year quarter, with the increase primarily due to higher refinery throughput and the benefit of the company’s continued investment in its extensive retail and broad sales network.

Corporate and Eliminations

Corporate incurred an adjusted operating loss of $92 million in the fourth quarter of 2024, compared to $341 million in the prior year quarter, primarily attributable to an increased operational foreign exchange gain in the fourth quarter of 2024 compared to the prior year quarter, partially offset by an increase in share-based compensation expense in the fourth quarter of 2024 compared to the prior year quarter. Suncor capitalized $72 million of its borrowing costs in the fourth quarter of 2024 as part of the cost of major development assets and construction projects in progress, compared to $70 million in the prior year quarter.

Eliminations reflect the deferral or realization of profit or loss on crude oil sales from Oil Sands to Suncor’s refineries. Consolidated profits and losses are only realized when the refined products from internal purchases have been sold to third parties. During the fourth quarter of 2024, the company deferred $108 million of intersegment profit, compared to a realization of $299 million in the prior year quarter. The deferral of intersegment profit in the current quarter was primarily driven by an increase in intersegment inventory volumes.

28 ANNUAL REPORT 2024 SUNCOR ENERGY INC. 


Table of Contents

7. Quarterly Financial Data

Financial Summary

Three months ended


Dec 31


Sept 30


June 30


Mar 31


Dec 31


Sept 30


June 30


Mar 31


($ millions, unless otherwise noted)

2024

2024

2024

2024

2023

2023

2023

2023


Total production (mboe/d)


Oil Sands


817.5

776.0

716.0

785.0

757.4

646.1

679.1

675.1

Exploration and Production


57.5

52.6

54.6

50.3

50.7

44.4

62.8

67.0

Total upstream production


875.0


828.6


770.6


835.3


808.1


690.5


741.9


742.1

Revenues and other income


Operating revenues, net of royalties


12 531

12 888

12 889

12 381

12 810

12 649

11 719

11 914

Other (loss) income


(28)

174

151

148

1 328

(13)

(3)

342


12 503


13 062


13 040


12 529


14 138


12 636


11 716


12 256

Net earnings (loss)


818

2 020

1 568

1 610

2 820

1 544

1 879

2 052

Per common share – basic (dollars)

0.65

1.59

1.22

1.25

2.18

1.19

1.44

1.54

Adjusted operating earnings(1)


1 566

1 875

1 626

1 817

1 635

1 980

1 253

1 809

Per common share(2)(3) (dollars)


1.25

1.48

1.27

1.41

1.26

1.52

0.96

1.36

Adjusted funds from operations(1)


3 493

3 787

3 397

3 169

4 034

3 634

2 655

3 002

Per common share(2)(3) (dollars)


2.78

2.98

2.65

2.46

3.12

2.80

2.03

2.26

Cash flow provided by operating activities


5 083

4 261

3 829

2 787

4 318

4 184

2 803

1 039

Per common share(3) (dollars)


4.05

3.36

2.98

2.16

3.34

3.22

2.14

0.78

Free funds flow(6)

1 923

2 232

1 350

1 858

2 482

2 057

1 042

1 916

Per common share(2)(3) (dollars)

1.53

1.76

1.05

1.44

1.92

1.58

0.80

1.44

Return on Capital Employed (ROCE)(2)(4) (%) for the twelve months ended


13.0

15.6

15.6

15.7

16.3

16.5

13.2

18.5

ROCE excluding impairments and impairment reversals(2)(4) (%) for the twelve months ended


13.0

15.6

15.6

15.7

16.3

16.5

16.7

22.1

Net debt(5)(6)

6 861

7 968

9 054

9 552

9 852

9 837

11 170

12 439

Common share information (dollars)

Dividend per common share(3)


0.57

0.55

0.55

0.55

0.55

0.52

0.52

0.52

Share price at the end of trading

Toronto Stock Exchange (Cdn$)


51.31

49.92

52.15

49.99

42.45

46.71

38.86

41.96

New York Stock Exchange (US$)


35.68

36.92

38.10

36.91

32.04

34.38

29.32

31.05

(1)Non GAAP financial measures. See the Non GAAP and Other Financial Measures Advisory section of this document. Adjusted operating earnings and adjusted funds from operations are defined in the Non-GAAP and Other Financial Measures Advisory section and reconciled to GAAP measures in the Consolidated Financial Information and the Segment Results and Analysis section in the respective Managements Discussion & Analysis for such quarter or year end (Applicable MD&A), which information is incorporated by reference herein and available on SEDAR+ at www.sedarplus.ca.
(2)Contains non-GAAP financial measures. See the Non-GAAP and Other Financial Measures Advisory section of this document. Non-GAAP measures included in ROCE and ROCE excluding impairments and impairment reversals are defined and reconciled to GAAP measures in the Non-GAAP and Other Financial Measures Advisory section in the Applicable MD&A, which information is incorporated by reference herein and available on SEDAR+ at www.sedarplus.ca.
(3)Presented on a basic per share basis.
(4)Beginning in the second quarter of 2024, the company revised the definition of ROCE to exclude lease liabilities from the calculation of average capital employed and interest on lease liabilities from net interest expense to better align with how management and industry monitor capital structure. Prior period comparatives have been restated to reflect this change.
(5)Beginning in the second quarter of 2024, the company revised the definition of net debt to exclude lease liabilities to better align with how management and industry monitor capital structure. Prior period comparatives have been restated to reflect this change.
(6)Contains non-GAAP financial measures. See the Non-GAAP and Other Financial Measures Advisory section of this document. Non-GAAP measures included in net debt and free funds flow are defined in the Non-GAAP and Other Financial Measures Advisory section and reconciled to GAAP measures in the Consolidated Financial Information and Segment Results and Analysis in the Applicable MD&A, which information is incorporated by refence herein and available on SEDAR+ at www.sedarplus.ca.

ANNUAL REPORT 2024 SUNCOR ENERGY INC. 29


Table of Contents

Business Environment

Three months ended


Dec 31


Sept 30


June 30


Mar 31


Dec 31


Sept 30


June 30


Mar 31

(average for the period ended, except as noted)

2024

2024

2024

2024

2023

2023

2023

2023


WTI crude oil at Cushing


US$/bbl


70.30

75.15

80.55

76.95

78.35

82.20

73.75

76.10

Dated Brent crude


US$/bbl


74.70

80.25

84.90

83.25

84.05

86.70

78.35

81.25

Dated Brent/Maya FOB price differential


US$/bbl


11.85

13.90

12.05

14.10

12.55

11.15

14.75

18.40

MSW at Edmonton


Cdn$/bbl


94.95

98.00

105.25

92.20

99.70

107.80

95.10

99.05

WCS at Hardisty


US$/bbl


57.75

61.65

67.00

57.60

56.45

69.30

58.70

51.35

WCS-WTI light/heavy differential


US$/bbl


(12.55)

(13.50)

(13.55)

(19.35)

(21.90)

(12.90)

(15.05)

(24.75)

SYN-WTI premium (differential)

US$/bbl

0.85

1.30

2.80

(7.40)

0.30

2.80

2.90

2.10

Condensate at Edmonton


US$/bbl


70.65

71.30

77.15

72.80

76.25

77.90

72.35

79.85

Natural gas (Alberta spot) at AECO


Cdn$/GJ


1.45

0.65

1.10

2.20

2.15

2.50

2.35

3.05

Alberta Power Pool Price


Cdn$/MWh


51.50

55.35

45.15

99.30

81.60

151.60

159.80

142.00

New York Harbor 2-1-1 crack(1)


US$/bbl


18.80

21.05

24.75

27.05

28.60

39.95

32.30

36.70

Chicago 2-1-1 crack(1)


US$/bbl


13.85

19.35

18.85

19.80

17.10

27.45

28.60

31.55

Portland 2-1-1 crack(1)


US$/bbl


20.95

20.35

29.30

26.85

29.35

55.90

37.30

37.40

Gulf Coast 2-1-1 crack(1)


US$/bbl


17.00

18.90

22.10

27.95

23.00

39.10

29.15

37.65

U.S. Renewable Volume Obligation

US$/bbl

4.05

3.90

3.40

3.70

4.75

7.45

7.70

8.20

Suncor custom 5-2-2-1 index(2)

US$/bbl

24.25

26.05

26.70

35.95

33.45

36.00

34.20

42.80

Exchange rate (average)


US$/Cdn$


0.71

0.73

0.73

0.74

0.73

0.75

0.74

0.74

Exchange rate (end of period)


US$/Cdn$


0.69

0.74

0.73

0.74

0.76

0.74

0.76

0.74

(1)2-1-1 crack spreads are indicators of the refining margin generated by converting two barrels of WTI into one barrel of gasoline and one barrel of diesel. The crack spreads presented here generally approximate the regions into which the company sells refined products through retail and wholesale channels.
(2)Suncor has developed an indicative 5-2-2-1 index based on publicly available pricing data to more accurately reflect the company’s realized refining and marketing gross margin.

Significant or Unusual Items Impacting Net Earnings (Loss)

Trends in Suncor’s quarterly revenue, net earnings (loss) and adjusted funds from operations are driven primarily by production volumes, which can be impacted by major maintenance events, changes in commodity prices and crude differentials, refining crack spreads and foreign exchange rates. Trends in Suncor’s quarterly net earnings (loss) and adjusted funds from operations are also affected by other significant events impacting operations, such as operational incidents.

In addition to the impacts of changes in production volumes and business environment, net earnings (loss) over the last eight quarters were affected by the following events or significant adjustments:

During the fourth quarter of 2024, the company recorded a loss on extinguishment of long-term debt of $144 million in the Corporate and Eliminations segment as a result of the early repayment of certain series of its outstanding notes.
During the fourth quarter of 2024, Suncor recorded an impairment of $212 million against an equity investment in the Corporate and Eliminations segment.
During the fourth quarter of 2023, the company recorded a non-cash gain of $1.125 billion in the Oil Sands segment as a result of the acquisition of TotalEnergies Canada.
During the fourth quarter of 2023, Suncor recorded an impairment of $158 million against an equity investment in the Corporate and Eliminations segment.
During the third quarter of 2023, the company recorded derecognition charges of $253 million on its Meadow Creek development properties in the Oil Sands segment.
During the second quarter of 2023, Suncor recorded a gain of $607 million on the sale of its U.K. E&P portfolio.
During the second quarter of 2023, the company recorded a restructuring charge of $275 million in OS&G expenses in the Corporate and Eliminations segment, related to the company’s workforce reductions.
During the first quarter of 2023, the company recorded a gain of $302 million on the sale of its wind and solar assets in the Corporate and Eliminations segment.

30 ANNUAL REPORT 2024 SUNCOR ENERGY INC. 


Table of Contents

8. Capital Investment Update

Capital and Exploration Expenditures by Type, Excluding Capitalized Interest

Year ended

December 31, 2024

December 31, 2023

($ millions)


Asset Sustainment and Maintenance(1)


Economic Investment(2)


Total


Total

Oil Sands


Oil Sands Base


916

936


1 852

1 972

In Situ


138

360


498

517

Fort Hills


354

406


760

397

Syncrude

742

220


962

990

E&P(3)


862


862

635

R&M


1 006

180


1 186

1 000

Corporate and Eliminations


29

17


46

62


3 185


2 981


6 166

5 573

Capitalized interest on debt


317

255

Total capital and exploration expenditures


6 483

5 828

(1)Asset sustainment and maintenance capital expenditures include capital investments that deliver on existing value by ensuring compliance or maintaining relations with regulators and other stakeholders and maintaining current processing capacity.
(2)Economic investment capital expenditures include capital investments that result in an increase in value by adding reserves or improving processing capacity, utilization, cost or margin, including associated infrastructure.
(3)Excludes capital expenditures related to assets previously held for sale of nil in 2024, compared to $108 million in 2023.

In 2024, Suncor’s capital expenditures excluding capitalized borrowing costs, were $6.166 billion, compared to $5.573 billion in 2023. The increase was due to increased economic expenditures at Oil Sands Base, related to the Upgrader 1 coke drum replacement and the new cogeneration facility; at Fort Hills, related to the company’s increased working interest and second North Pit mine opening; at E&P, related to the West White Rose Project and SeaRose FPSO Asset Life Extension Project; at Syncrude, related to the MLX-W mining project; and at R&M related to enhancing the company’s sales and marketing business. The increase was partially offset by decreased asset sustainment and maintenance capital expenditures at Oil Sands Base, In Situ, Fort Hills and Corporate.

Capital activity in 2024:

Oil Sands Base

Oil Sands Base capital expenditures were $1.852 billion in 2024. Economic investment expenditures were related to replacing the coke-fired boilers with a new cogeneration facility, the Upgrader 1 coke drum replacement, and the purchase of haul trucks equipped with AHS.

Asset sustainment and maintenance expenditures were primarily related to ensuring continued safe, reliable and efficient operations. The company’s planned maintenance program in 2024 included mine and tailings development, planned annual coker maintenance at Upgrader 1 and Upgrader 2, and other planned maintenance activities.

In Situ

In Situ capital expenditures were $498 million in 2024, and were primarily directed towards economic investment activities, which focused on the ongoing design, construction and execution of well pads to develop additional reserves expected to maintain existing production levels.

Asset sustainment and maintenance capital expenditures were primarily directed towards planned maintenance activities.

Fort Hills

Fort Hills capital expenditures were $760 million in 2024, the majority of which were directed towards economic investment expenditures related to the second North Pit mine opening and haul truck purchases.

ANNUAL REPORT 2024 SUNCOR ENERGY INC. 31


Table of Contents

Asset sustainment and maintenance expenditures were related to the development, progression and execution of mining and tailings management projects, and other planned maintenance activities.

Syncrude

Syncrude capital expenditures were $962 million in 2024, the majority of which were directed toward asset sustainment and maintenance capital expenditures that focused on its planned turnaround, mine equipment replacements, tailings development, and other planned maintenance activities.

Economic investment activities were primarily directed towards progressing the MLX-W mining project.

Exploration and Production

E&P capital and exploration expenditures were $862 million in 2024, and were focused on economic investment projects, primarily relating to the West White Rose Project and the SeaRose Asset Life Extension Project.

Refining and Marketing

R&M capital expenditures were $1.186 billion in 2024 and were primarily directed toward asset sustainment and maintenance activities focused on the sustainment of refinery, retail and logistics assets. This included planned turnaround and maintenance activities at the company’s Sarnia, Montreal and Commerce City refineries during the year.

Economic investment activities in 2024 were primarily directed towards expanding and strengthening the company’s sales and marketing business, including investment into the enhancement of its retail operations.

Corporate

Corporate capital expenditures were $46 million in 2024, primarily directed towards investment in digital technologies.

Planned activity in 2025:

Oil Sands Base

Oil Sands Base plans for economic investment in 2025 are primarily related to the Upgrader 1 coke drum replacement.

Asset sustainment and maintenance capital expenditures for 2025 include expenditures relating to planned annual coker maintenance at Upgrader 2, mining and tailings management projects, mine equipment replacements, and other planned maintenance activities.

In Situ

Economic investment expenditures for 2025 are primarily focused on ongoing design and construction of well pads to develop additional reserves that are expected to maintain existing production levels at Firebag and MacKay River in future years.

Asset sustainment and maintenance capital expenditures for 2025 include planned turnaround activities at Firebag, and other planned maintenance activities.

Fort Hills

Asset sustainment and maintenance capital expenditures for 2025 focus on ongoing development of mining and tailings management projects to preserve production capacity and execute on the mine improvement plan, as well as planned maintenance activities.

Plans for economic investment in 2025 include mine equipment purchases and the development of the second opening of the North Pit mine.

32 ANNUAL REPORT 2024 SUNCOR ENERGY INC. 


Table of Contents

Syncrude

Asset sustainment and maintenance capital expenditures for 2025 include expenditures relating to Syncrude’s planned maintenance program, tailings development and mine equipment replacements.

For 2025, plans for economic investment are primarily focused on progressing the MLX-W mining project.

Exploration and Production

Economic investment for 2025 is expected to be primarily focused on work at the West White Rose Project, as well as development activities to extend the productive life of existing fields, including development drilling at Hebron and Hibernia.

Refining and Marketing

Sustaining capital expenditures for 2025 are expected to focus on ongoing sustainment of refinery, logistics and retail operations, including planned refinery turnaround maintenance.

Economic investment projects in 2025 are expected to be primarily directed towards expanding and strengthening the company’s sales and marketing business, including investment into the enhancement of its retail and wholesale operations.

ANNUAL REPORT 2024 SUNCOR ENERGY INC. 33


Table of Contents

9. Financial Condition and Liquidity

Liquidity and Capital Resources

At December 31 ($ millions, except as noted)


2024


2023


2022


Cash flow provided by (used in)


Operating activities


15 960


12 344


15 680

Investing activities


(6 472)


(6 511)


(4 789)

Financing activities


(7 882)


(5 990)


(11 228)

Foreign exchange loss (gain) on cash and cash equivalents


149


(94)


112

Increase (decrease) in cash and cash equivalents


1 755


(251)


(225)

Cash and cash equivalents, end of year


3 484


1 729


1 980

ROCE(1)(2)(3) (%)


13.0


16.3


20.2

Net debt to adjusted funds from operations(1)(4) (times)


0.5


0.7


0.6

Total debt to total debt plus shareholders’ equity(1)(4) (%)


18.9


21.1

24.3

Net debt to net debt plus shareholders’ equity(1)(4) (%)


13.4


18.5

21.3

(1)Non-GAAP financial measures or contains non-GAAP financial measures. See the Advisories – Non-GAAP and Other Financial Measures section of this MD&A.
(2)For the twelve months ended December 31, 2024, there were no impairments or impairment reversals. As a result, ROCE excluding impairments was equal to ROCE. ROCE was impacted by the $1.125 billion non-cash gain on acquisition of TotalEnergies Canada for the twelve months ended December 31, 2023, and for the first nine months of 2024. For the twelve months ended December 31, 2022, ROCE was impacted by the impairment reversal of $715 million ($542 million after-tax) and impairment of $70 million ($47 million after-tax) in the second quarter of 2022, and the impact of the impairment of $3.397 billion ($2.586 billion after-tax) in the third quarter of 2022.
(3)Beginning in 2024, the company revised the definition of ROCE to exclude lease liabilities from the calculation of average capital employed and interest on lease liabilities from net interest expense to better align with how management and industry monitor capital structure. Prior period comparatives have been restated to reflect this change.
(4)Beginning in 2024, the company revised the definition of net debt and total debt to exclude lease liabilities to better align with how management and industry monitor capital structure. Prior period comparatives have been restated to reflect this change.

Cash Flow Provided by Operating Activities

Cash flow provided by operating activities was $15.960 billion in 2024, compared to $12.344 billion in 2023. The increase was primarily due to increased sales volumes in Oil Sands and E&P and increased production in R&M, partially offset by lower benchmark crack spreads and lower SCO realizations and increased royalties due to higher heavy crude price realizations.

The current period cash flow provided by operating activities reflects a source of cash in working capital, primarily due to an increase in accounts payable and accrued liabilities, which includes the timing impact of commodity tax payable, a decrease in accounts receivable balances, in line with the decrease in benchmark commodity prices in 2024, and a draw on inventory due to increased sales volumes. The prior period cash flow provided by operating activities reflects a use of cash in working capital, primarily due to significantly lower net income taxes payable, and a decrease in accounts payable and accrued liabilities, partially offset by a decrease in accounts receivable balances related to the decrease in commodity prices in 2023.

Cash Flow Used in Investing Activities

Cash flow used in investing activities was $6.472 billion in 2024, compared to $6.511 billion in 2023. The decrease was primarily due to the impacts of the Fort Hills acquisition is 2023, partially offset by the proceeds from the sale of the company’s U.K. E&P portfolio and wind and solar assets in 2023 and increased capital expenditures in 2024.

Cash Flow Used in Financing Activities

Cash flow used in financing activities was $7.882 billion in 2024, compared to $5.990 billion in 2023. The increase was primarily due to the repayment of long-term debt in 2024 compared to an issuance of long-term debt in 2023, an increase in share repurchases and an increase in dividends paid on common shares, partially offset by a smaller net decrease in short-term debt in 2024 compared to 2023.

Capital Resources

Suncor’s capital resources consist primarily of cash flow provided by operating activities, cash and cash equivalents, and available credit facilities, including commercial paper. Suncor’s management believes the company will have the capital resources required to fund its planned 2025 capital spending program of $6.1 billion to $6.3 billion, and to meet current and

34 ANNUAL REPORT 2024 SUNCOR ENERGY INC. 


Table of Contents

future working capital requirements through cash and cash equivalents balances, cash flow provided by operating activities, available committed credit facilities, issuing commercial paper and, if needed, accessing capital markets. The company’s cash flow provided by operating activities depends on several factors, including commodity prices, production, sales volumes, refining and marketing margins, operating expenses, taxes, royalties and foreign exchange rates.

The company has invested cash in short-term financial instruments that are presented as cash and cash equivalents. The objectives of the company’s short-term investment portfolio are to ensure the preservation of capital, maintain adequate liquidity to meet Suncor’s cash flow requirements and deliver competitive returns derived from the quality and diversification of investments within acceptable risk parameters. The maximum weighted average term to maturity of the short-term investment portfolio is not expected to exceed six months, and all investments are with counterparties with investment grade debt ratings.

Available Sources of Liquidity

Cash and Cash Equivalents

Included in cash and cash equivalents of $3.484 billion at December 31, 2024, are short-term investments with weighted average days to maturity of approximately 16 days. In 2024, the company earned approximately $4.7 million of interest income on these investments.

Financing Activities

Suncor’s interest on debt and lease liabilities (before capitalized interest) in 2024 was $940 million, compared to $981 million in 2023, with interest expense on debt decreasing as a result of debt repayments made in 2024, offset by an increase in interest on leases.

Available lines of credit at December 31, 2024, increased to $5.475 billion compared to $4.957 billion as at December 31, 2023. The increase in available credit facilities was primarily due to a decrease in short-term indebtedness. In the fourth quarter of 2024, the company extended the maturity of its syndicated credit facilities from June 2026 to October 2027 and October 2028.

A summary of total and unutilized credit facilities at December 31, 2024, is as follows:

($ millions)


2024


Fully revolving and expiring in 2028


2 810

Fully revolving and expiring in 2027


2 665

Can be terminated at any time at the option of the lenders


1 120

Total credit facilities


6 595

Credit facilities supporting standby letters of credit


(811)

Total unutilized credit facilities(1)


5 784

(1)Available credit facilities for liquidity purposes were $5.475 billion at December 31, 2024 (December 31, 2023 – $4.957 billion).

ANNUAL REPORT 2024 SUNCOR ENERGY INC. 35


Table of Contents

Total Debt to Total Debt Plus Shareholders’ Equity

Suncor is subject to financial and operating covenants related to its bank debt and public market debt. Failure to meet the terms of one or more of these covenants may constitute an “event of default” as defined in the respective debt agreements, potentially resulting in accelerated repayment of one or more of the debt obligations. The company is in compliance with its financial covenant that requires total debt and lease liabilities to not exceed 65% of its total debt and lease liabilities plus shareholders’ equity. At December 31, 2024, total debt and lease liabilities to total debt and lease liabilities plus shareholders’ equity was 24.8% (December 31, 2023 – 26.3%), a decrease from the prior year primarily due to higher shareholders’ equity and a decrease in long-term debt. The company is currently in compliance with all operating covenants as at December 31, 2024.

Change in Debt

($ millions)


2024


Total debt(1)(2) – December 31, 2023


11 581

Decrease in long-term debt


(1 396)

Decrease in short-term debt


(503)

Foreign exchange on debt, and other

663

Total debt(1)(2) – December 31, 2024


10 345

Less: Cash and cash equivalents – December 31, 2024


3 484

Net debt(1)(2) – December 31, 2024


6 861

(1)Non-GAAP financial measures. See the Advisories – Non-GAAP and Other Financial Measures section of this MD&A.
(2)Beginning in 2024, the company revised the definition of net debt and total debt to exclude lease liabilities to better align with how management and industry monitor capital structure. Prior period comparatives have been restated to reflect this change.

The company’s total debt decreased in the twelve months ended December 31, 2024, primarily due to the repayment of long-term debt and a decrease in short-term indebtedness, partially offset by unfavourable foreign exchange rates on U.S. dollar denominated debt compared to December 31, 2023.

During the fourth quarter of 2024, the company repurchased and cancelled approximately $1.1 billion of the company’s outstanding notes, primarily focused on its 6.50% notes due 2038 and 6.80% notes due 2038.

During the third quarter of 2024, the company completed two partial redemptions, for approximately $295 million of its outstanding notes, primarily focused on its 6.50% notes due 2038, and 6.80% notes due 2038.

As at December 31, 2024, Suncor’s net debt was $6.861 billion, compared to $9.852 billion at December 31, 2023. The change in net debt was primarily due to the factors discussed above, and an increase in cash and cash equivalents.

For the year ended December 31, 2024, the company’s net debt to adjusted funds from operations measure was 0.5 times, which is lower than management’s maximum target of less than 3.0 times.

Credit Ratings

The company’s credit ratings affect its cost of funds and liquidity. In particular, the company’s ability to access unsecured funding markets and to engage in certain activities on a cost-effective basis is primarily dependent upon maintaining a strong credit rating. A lowering of the company’s credit rating may also have potentially adverse consequences for the company’s funding capacity or access to the capital markets, may affect the company’s ability, and the cost, to enter into normal course derivative or hedging transactions, and may require the company to post additional collateral under certain contracts.

For a description of Suncor’s current credit ratings refer to the Description of Capital Structure – Credit Ratings section of Suncor’s 2024 AIF.

36 ANNUAL REPORT 2024 SUNCOR ENERGY INC. 


Table of Contents

Common Shares

Outstanding Shares

(thousands)


December 31, 2024


Common shares


1 244 332

Common share options – exercisable


5 966

Common share options – non-exercisable


2 169

As at February 25, 2025, the total number of common shares outstanding was 1,237,135,660 and the total number of exercisable and non-exercisable common share options outstanding was 6,372,695. Once vested, each outstanding common share option is exercisable for one common share.

Share Repurchases

(thousands of common shares)

Commencement Date

Expiry

Maximum Shares for Repurchase

Maximum Shares for Repurchase (%)

Number of Shares Repurchased

2022 NCIB

February 8, 2022

February 7, 2023

71 650

5

26 232

Amended 2022 NCIB

May 11, 2022

February 7, 2023

143 500

10

91 912

2023 NCIB

February 17, 2023

February 16, 2024

132 900

10

47 107

2024 NCIB

February 26, 2024

February 25, 2025

128 700

10

61 066

2025 NCIB

March 3, 2025

March 2, 2026

123 800

10

-

Subsequent to the fourth quarter of 2024, the TSX accepted a notice filed by Suncor to renew its NCIB to purchase the company's common shares through the facilities of the TSX, NYSE and/or alternative trading systems. The notice provides that, beginning March 3, 2025, and ending March 2, 2026, Suncor may purchase for cancellation up to 123,800,000 common shares, which is equal to approximately 10% of Suncor's public float as of February 18, 2025.

Between February 26, 2024, and February 25, 2025, pursuant to Suncor’s previous NCIB, Suncor repurchased 61,065,792 common shares on the open market, representing the equivalent of 4.7% of its common shares as at February 12, 2024, for $3.258 billion, at a weighted average price of $53.35 per share.

The actual number of common shares that may be repurchased under the NCIB and the timing of any such purchases will be determined by Suncor. The company believes that, depending on the trading price of its common shares and other relevant factors, repurchasing its common shares represents an attractive investment opportunity and is in the best interests of the company and its shareholders. The company does not expect that the decision to allocate cash to repurchase its common shares will affect its long-term strategy.

At December 31


($ millions, except as noted)

2024

2023

2022

Share repurchase activities (thousands of common shares)


55 564


51 982


116 908

Weighted average repurchase price per share (dollars per share)


52.33


42.96


43.92

Share repurchase cost


2 908


2 233


5 135

Contractual Obligations, Commitments, Guarantees and Off-Balance Sheet Arrangements

In addition to the enforceable and legally binding obligations in the table below, Suncor has other obligations for goods and services that were entered into in the normal course of business, which may terminate on short notice, including commitments for the purchase of commodities for which an active, highly liquid market exists, and which are expected to be resold shortly after purchase.

The company does not believe it has any guarantees or off-balance sheet arrangements that have, or are reasonably likely to have, a current or future material effect on the company’s financial condition or financial performance, including liquidity and capital resources.

ANNUAL REPORT 2024 SUNCOR ENERGY INC. 37


Table of Contents

In the normal course of business, the company is obligated to make future payments, including contractual obligations and non-cancellable commitments.

Payment due by period


($ millions)

2025

2026

2027

2028

2029

Thereafter

Total


Long-term debt(1)


1 587


1 507

530


826


504


12 425


17 379

Decommissioning and restoration costs(2)


436


566


567


578


505


18 875


21 527

Long-term contracts, pipeline capacity and energy services commitments


2 154


1 842


1 692


1 518


1 396


11 188


19 790

Exploration work commitments


53


1


517


571

Lease obligations(3)

852

769

635

527

416

3 674

6 873

Total


5 082


4 685


3 424


3 449


2 821


46 679


66 140

(1)Includes long-term debt and interest payments on long-term debt. Refer to note 21 and note 27 of Suncor’s 2024 audited Consolidated Financial Statements.
(2)Represents the undiscounted and uninflated amount of decommissioning and restoration costs. Refer to note 24 of Suncor’s 2024 audited Consolidated Financial Statements.
(3)Includes interest payments on lease liabilities.

38 ANNUAL REPORT 2024 SUNCOR ENERGY INC. 


Table of Contents

Transactions with Related Parties

Suncor enters into transactions with related parties in the normal course of business, which includes purchases of feedstock, distribution of refined products and the sale of refined products and byproducts. These transactions are with joint ventures and associated entities in the company’s R&M operations, including pipeline, refined product and petrochemical companies. For more information on these transactions and for a summary of Compensation of Key Management Personnel, refer to note 31 of the 2024 audited Consolidated Financial Statements.

Financial Instruments

The company uses derivative financial instruments, such as physical and financial contracts, to manage certain exposures to fluctuations in interest rates, commodity prices and foreign currency exchange rates as part of its overall risk management program, as well as for trading purposes. For the year ended December 31, 2024, the pre-tax earnings impact of risk management and trading activities was $114 million (2023 – pre-tax earnings of $25 million).

Gains or losses related to derivatives are recorded as Other Income in the Consolidated Statements of Comprehensive Income.


($ millions)

2024

2023


Fair value outstanding, beginning of year


(20)


(65)

Changes in fair value recognized in earnings during the year


114

25

Cash settlements - (received) paid during the year


(12)

20

Fair value outstanding, end of year


82


(20)

The fair value of derivative financial instruments is recorded on the Consolidated Balance Sheets.

Fair value of derivative contracts at


December 31 ($ millions)

2024

2023


Accounts receivable


153


65

Accounts payable


(71)


(85)


82


(20)

Risks Associated with Derivative Financial Instruments

Suncor may be exposed to certain losses in the event that counterparties to derivative financial instruments are unable to fulfil their obligations under these contracts. The company minimizes this risk by entering into agreements with investment grade counterparties. Risk is also minimized through regular management review of the potential exposure to and credit ratings of such counterparties. Suncor’s exposure is limited to those counterparties holding derivative contracts with net positive fair values at a reporting date.

Suncor’s risk management activities are subject to periodic reviews by management to determine appropriate hedging requirements based on the company’s tolerance for exposure to market volatility, as well as the need for stable cash flow to finance future growth. Commodity risk management and trading activities are governed by a separate risk management group that reviews and monitors practices and policies and provides independent verification and valuation of these activities.

For further details on our derivative financial instruments, including assumptions made in the calculation of fair value, a sensitivity analysis of the effect of changes in commodity prices on our derivative financial instruments, and additional discussion of exposure to risks and mitigation activities, refer to note 27 of the company’s 2024 audited Consolidated Financial Statements.

ANNUAL REPORT 2024 SUNCOR ENERGY INC. 39


Table of Contents

10. Material Accounting Policies and Critical Accounting Estimates

Suncor’s material accounting policies are described in note 3 of the audited Consolidated Financial Statements for the year ended December 31, 2024.

Adoption of New IFRS Standards

The standards, amendments and interpretations that are adopted up to the date of authorization of the company’s consolidated financial statements, and that may have an impact on the disclosures and financial position of the company, are disclosed below.

The company adopted the IASB‘s Non-current Liabilities with Covenants (Amendments to IAS 1) on January 1, 2024. The amendments improved the information an entity provides when its right to defer settlement of a liability for at least twelve months is subject to compliance with covenants. There was no material impact to the consolidated financial statements as a result of the initial application.

The company adopted the IASB’s Lease Liability in a Sale and Leaseback (Amendments to IFRS 16) on January 1, 2024. The amendments add subsequent measurement requirements for sale and leaseback transactions. There was no impact to the consolidated financial statements as a result of the initial application.

Recently Announced Accounting Pronouncements

The standards, amendments and interpretations that are issued, but not yet effective up to the date of authorization of the company’s consolidated financial statements, and that may have an impact on the disclosures and financial position of the company, are disclosed below. The company intends to adopt these standards, amendments and interpretations when they become effective.

In April 2024, the IASB issued IFRS 18 Presentation and Disclosure in Financial Statements which will replace IAS 1 Presentation of Financial Statements. The new standard will establish a revised structure for the consolidated statements of comprehensive income and improve comparability across entities and reporting periods. IFRS 18 is effective for annual periods beginning on or after January 1, 2027. The standard will be applied retrospectively, with certain transition provisions. The company is currently evaluating the impact of adopting IFRS 18 on the consolidated financial statements.

In May 2024, the IASB issued amendments to IFRS 9 Financial Instruments and IFRS 7 Financial Instruments: Disclosures to clarify the date of recognition and derecognition of some financial assets and liabilities, with a new exception for some financial liabilities settled using an electronic payment system. The amendments are effective January 1, 2026, with early adoption permitted. The company is currently evaluating the impact of these amendments on the consolidated financial statements.

Significant and Other Accounting Estimates and Judgments

The preparation of financial statements in accordance with IFRS requires management to make estimates and judgments that affect reported assets, liabilities, revenues, expenses, gains, losses and disclosures of contingencies. These estimates and judgments are subject to change based on experience and new information.

Tariffs

In 2025, the government of the United States of America announced tariffs on certain goods effective March 4, 2025 and has indicated their intention to add further tariffs including a 10% tariff on Canadian energy imports. The Canadian government announced that it would respond with tariffs on certain goods imported from the U.S., in addition to other measures. The company will continue to assess the impacts of such tariffs and measures as the situation develops. The impact of potential tariffs on the company’s financial results cannot be quantified at this time.

40 ANNUAL REPORT 2024 SUNCOR ENERGY INC. 


Table of Contents

Climate Change

Climate change, global energy demand, and the transition to a low-emissions economy were considered in preparing these consolidated financial statements, primarily in estimating commodity prices used in asset valuation and reserves analysis. These estimates may have significant impacts on the company’s assets and liabilities discussed below and on similar assets and liabilities that may be recognized in the future. As part of its ongoing business planning, Suncor estimates future costs associated with GHG emissions in its operations and in the evaluation of future projects. Changes in market and regulatory conditions and assumptions, as well as climate change, and the evolving worldwide demand for energy and global advancement of alternative sources of energy that are not sourced from fossil fuels, can materially impact the estimation of net reserves, asset valuation and reclamation timing and requirements. The timing and pace at which global energy markets transition from carbon-based sources to alternative energy is highly uncertain.

Oil and Gas Reserves

The company’s estimate of oil and gas reserves is considered in the measurement of depletion, depreciation, impairment, decommissioning and restoration obligations and business combinations. The estimation of reserves is an inherently complex process and involves professional judgment. All reserves have been evaluated at December 31, 2024, by independent qualified reserves evaluators. Oil and gas reserves estimates are based on a range of geological, technical and economic factors, including projected future rates of production, projected future commodity prices, engineering data, and the timing and amount of future expenditures, all of which are subject to uncertainty. Estimates reflect market and regulatory conditions existing at December 31, 2024, which could differ significantly from other points in time throughout the year, or future periods.

Exploration and Evaluation Costs

Certain exploration and evaluation costs are initially capitalized with the intent to establish commercially viable reserves. The company is required to make judgments about future events and circumstances and applies estimates to assess the economic viability of extracting the underlying resources. The costs are subject to technical, commercial and management review to confirm the continued intent to develop the project. The level of drilling success or changes to project economics, resource quantities, expected production techniques, production costs and required capital expenditures are important judgments when making this determination. Management uses judgment to determine when these costs are reclassified to Property, Plant and Equipment based on several factors, including the existence of reserves, appropriate approvals from regulatory bodies, joint arrangement partners and the company’s internal project approval process.

Determination of Cash Generating Units (CGUs)

A CGU is the lowest grouping of integrated assets that generates identifiable cash inflows that are largely independent of the cash inflows of other assets or groups of assets. The allocation of assets into CGUs requires significant judgment and interpretations with respect to the integration between assets, the existence of active markets, similar exposure to market risks, shared infrastructure and the way in which management monitors the operations.

Asset Impairment and Reversals

Management applies judgment in assessing the existence of impairment and impairment reversal indicators based on various internal and external factors, such as significant increases or decreases in forecasted production volumes, commodity prices, capital expenditures and operating costs.

The recoverable amount of CGUs and individual assets is determined based on the higher of fair value less costs of disposal or value-in-use calculations. The key estimates the company applies to determine the recoverable amount normally include estimated future commodity prices, discount rates, expected production volumes, future operating and development costs, income taxes and refining margins. In determining the recoverable amount, management may also be required to make judgments regarding the likelihood of occurrence of a future event. Changes to these estimates and judgments will affect the recoverable amounts of CGUs and individual assets and may then require a material adjustment to their related carrying value.

ANNUAL REPORT 2024 SUNCOR ENERGY INC. 41


Table of Contents

Decommissioning and Restoration Costs

The company recognizes liabilities for the future decommissioning and restoration of Exploration and Evaluation assets and Property, Plant and Equipment based on estimated future decommissioning and restoration costs. Management applies judgment in assessing the future regulatory requirements, the existence and extent as well as the expected method of reclamation of the company’s decommissioning and restoration obligations at the end of each reporting period. Management also uses judgment to determine whether the nature of the activities performed is related to decommissioning and restoration activities or normal operating activities.

Actual costs are uncertain, and estimates may vary as a result of changes to relevant laws and regulations related to the use of certain technologies, the emergence of new technology, operating experience, prices and closure plans. The estimated timing of future decommissioning and restoration may change due to certain factors, including reserves life. Changes to estimates related to future expected costs, discount rates, inflation assumptions and timing may have a material impact on the amounts presented.

Employee Future Benefits

The company provides benefits to employees, including pensions and other post retirement benefits. The cost of defined benefit pension plans and other post retirement benefits received by employees is estimated based on actuarial valuation methods that require professional judgment. Estimates typically used in determining these amounts include, as applicable, rates of employee turnover, future claim costs, discount rates, future salary and benefit levels, the return on plan assets, mortality rates and future medical costs. Changes to these estimates may have a material impact on the amounts presented.

Income Taxes

Management evaluates tax positions, annually or when circumstances require, which involves judgment and could be subject to differing interpretations of applicable tax legislation. The company recognizes a tax provision when a payment to tax authorities is considered probable. However, the results of audits and reassessments and changes in the interpretations of standards may result in changes to those positions and, potentially, a material increase or decrease in the company’s assets, liabilities and net earnings.

42 ANNUAL REPORT 2024 SUNCOR ENERGY INC. 


Table of Contents

11. Risk Factors

Suncor is committed to a proactive program of enterprise risk management intended to enable decision making through consistent identification and assessment of risks inherent to its assets, activities and operations. Some of these risks are common to operations in the oil and gas industry as a whole, while some are unique to Suncor. The realization of any of the following risks could have a material adverse effect on Suncor’s business, financial condition, reserves and results of operations.

Business Environment

Suncor’s financial performance is closely linked to prices for crude oil, refined petroleum products and, to a lesser extent, natural gas and electricity prices. The prices for these commodities can be influenced by global and regional supply and demand factors, which are beyond the company’s control and can result in a high degree of price volatility. A prolonged period of decreased demand for, and prices of, these commodities, and any applicable storage constraints, could also result in voluntary curtailment or shutting in production and a decrease in Suncor’s product volumes and refinery utilization rates.

Crude oil prices are also affected by, among other things, global economic health (particularly in emerging markets), market access constraints, regional and international supply and demand imbalances, political developments and government action, geopolitical conflict, decisions by OPEC+ regarding quotas on its members, compliance or non-compliance with quotas agreed upon by OPEC+ members and other countries, the impact of changes to US government economic policy (including the imposition of additional tariffs) and weather. These factors impact the various types of crude oil and refined products differently and can impact differentials between light and heavy grades of crude oil (including blended bitumen), and between conventional oil and SCO.

Refined petroleum product prices and refining margins are also affected by, among other things, crude oil prices, the availability of crude oil and other feedstock, levels of refined product inventories, regional refinery availability, market access, marketplace competitiveness, regulatory compliance costs and other local market factors. Natural gas prices in North America are affected by, among other things, supply and demand, inventory levels, weather and prices for alternative energy sources.

In addition, oil producers in North America, and particularly in Canada, may receive discounted prices for their production relative to certain international prices, due in part to constraints on the ability to transport and sell such products to international markets. A failure to resolve such constraints may result in continued discounted or reduced commodity prices realized by oil producers. Suncor’s production from Oil Sands includes significant quantities of bitumen and SCO that may trade at a discount to light and medium crude oil. Bitumen and SCO are typically more expensive to produce and process. In addition, the market prices for these products may differ from the established market indices for light and medium grades of crude oil. As a result, the price received for bitumen and SCO may differ from the benchmark they are priced against.

Wide differentials or a prolonged period of low and/or volatile commodity prices, particularly for crude oil, or prolonged constraints on the ability to transport products to international markets, may lead to the impairment of assets, or to the cancellation or deferral of growth projects.

All commodity prices discussed above could also be adversely affected by a prolonged period of decreased demand caused by the outbreak of epidemics, pandemics and other public health crises in geographic areas in which Suncor has operations, suppliers, customers or employees.

Carbon Risk

Existing and future laws and regulations in support of a transition to lower carbon intensity energy and climate change action may impose significant constraints on fossil fuel development. Concerns over climate change, fossil fuel extraction, GHG emissions, and water and land-use practices could lead governments to enact additional or more stringent laws and regulations applicable to Suncor and other companies in the energy industry in general, and in the oil sands industry in particular.

Changes to environmental regulations, including regulations relating to climate change and uncertainty relating to the ability of the company to report on climate-related matters, could impact the demand for the company’s products or could require increased capital expenditures, operating expenses, abandonment and reclamation obligations, and distribution costs. These potential added costs may not be recoverable in the marketplace and may result in some current operations or growth projects becoming less profitable or uneconomic. Such regulatory changes could require significant Suncor investment into

ANNUAL REPORT 2024 SUNCOR ENERGY INC. 43


Table of Contents

the development of technologies or other energy products. Suncor continues to monitor international and domestic efforts to address climate change.

These developments and future developments could adversely impact the demand for Suncor’s products, the ability of Suncor to maintain and grow its production and reserves, and Suncor’s reputation.

In addition, decarbonizing base business could require significant capital expenditures and resources, with the potential that the costs required to lower Suncor’s carbon intensity may differ from our original estimates and expectations, and these differences may be material. While the intent is to improve efficiency and increase the offering of lower intensity carbon energy, the shift in resources and focus towards reducing carbon intensity could have a negative impact on our operating results.

Greenhouse Gas Emissions and Targets

One of Suncor’s strategic objectives is to decarbonize its base business and capture new opportunities to reduce GHG emissions. The company’s ability to meet this objective is subject to numerous risks and uncertainties, and actions taken to implement these objectives may also expose Suncor to certain additional and/or heightened financial and operational risks.

Reduction in GHG intensity relies on, among other things, Suncor’s ability to implement and improve energy efficiency at all of its facilities, future development and growth opportunities, development and deployment of new technologies, ability to sequester and capture carbon and investment in lower carbon intensity power, as well as a transition to lower carbon intensity fuels. In the event that Suncor is unable to implement these strategies and technologies as planned without negatively impacting our expected operations or business plans, or in the event that such strategies or technologies do not perform as expected, Suncor may be unable to decarbonize its base business.

As GHG regulations and targets become more stringent, the absolute operational GHG emissions of the company may rise as a result of growth, mergers and acquisition activities, and changes in the operation of assets by Suncor or affiliates. Increases in GHG emissions may impact the profitability of the company’s projects, as Suncor will be subject to incremental levies and taxes. There is also a risk that Suncor could face litigation initiated by third parties relating to climate change, including litigation pertaining to GHG emissions, the production, sale, or promotion of fossil fuels and petroleum products, and/or climate related disclosure.

Environmental Compliance

Tailings Management and Water Release

Each oil sands mine is required to seek approval for its fluid tailings management plan under the Alberta Energy Regulator’s Directive 085 – Fluid Tailings Management for Oil Sands Mining Projects (the Tailings Directive). If a Suncor mine fails to meet a condition of its approved plan, the company could be subject to enforcement actions, including production curtailment, and other financial consequences, such as compliance levies or being required to post additional security under the Mine Financial Security Program. Consequences of not meeting approval conditions are not yet fully known, as certain associated policy and regulation reviews and updates are still under development. Such updates could impact the technologies that the company plans to employ for tailings management and reclamation, which could adversely impact the company’s business plans. There could also be risks if the company’s tailings management operations fail to operate as anticipated.

Suncor uses an integrated mine water, tailings and closure management approach for effective operations, successful reclamation and closure, and positive environmental outcomes. The inability to release treated mine water to the environment and the lack of an approval mechanism for pit lakes with tailings continues to result in an increase to both water quality concerns and water containment concerns at Suncor mine sites. This impacts current operations, and reclamation and closure plans. The absence of an effective regulatory framework in this area could adversely impact operations and the success and timing of closure and reclamation plans.

Alberta’s Land-Use Framework

The implementation of, and compliance with, the terms of Alberta’s Land-Use Framework through the Lower Athabasca Regional Plan (LARP) may adversely impact Suncor’s current properties and projects in northern Alberta due to, among other things, environmental limits and thresholds. The impact of the LARP on Suncor’s operations may be outside of the control of the company, as Suncor’s operations could be impacted as a result of restrictions imposed due to the cumulative impact of development by the other operators in the area and not solely in relation to Suncor’s direct impact.

44 ANNUAL REPORT 2024 SUNCOR ENERGY INC. 


Table of Contents

Water Management Regulations

Suncor currently relies on water obtained under licences and permits from government and regulators in its operating areas. Water licences and permits contain conditions to be met in order to maintain compliance with the licences. There can be no assurance that the licences to withdraw and use water will not be rescinded or restricted, or that additional conditions will not be added. It is also possible that regional water management approaches may require water-sharing agreements between stakeholders. In addition, any changes or expansions of the company’s projects may rely on securing licences and permits for additional water withdrawal and use, and there can be no assurance that these licences will be granted in a timely manner or that they will be granted on terms favourable to Suncor. There is also a risk that future laws or changes to existing laws or regulations relating to water access or water management could cause capital expenditures and operating expenses relating to water licence compliance to increase.

Biodiversity

Species at risk exist in the areas where Suncor conducts its operations. For example, existing, planned and potential future projects in Alberta are located within the range of woodland caribou, which have been identified as “threatened” under the Species at Risk Act (Canada). In response to the Government of Canada’s Recovery Strategy for the Woodland Caribou, provincial caribou range plans are being developed through sub-regional planning. The development and implementation of sub-regional plans may have an impact on the pace and amount of development in these areas and could potentially increase costs due to restoration or offsetting requirements.

Pursuant to the Alberta Wetland Policy, future development that removes wetlands may be obligated to pay in lieu fees based on the hectares of wetlands removed; fees could total in the tens to hundreds of millions per site. Suncor operations and growth projects without established regulatory boundaries (e.g., Water Act) prior to 2016 will be affected. Wetland replacement costs are based on wetland value and may be especially high for future oil sands projects and expansions due to the limited opportunity to avoid or minimize impacts to wetlands.

Air and Water Quality Management

A number of Canadian federal, and provincial, and U.S. federal and state, air and water quality regulations and frameworks are in place currently and being developed, changed and/or implemented, which could have an impact on the company’s existing operations and planned projects. As a result the company could be required to invest additional capital or incur additional operating and compliance expenses, including, among other things, potentially retrofitting equipment to meet new requirements and increasing monitoring and mitigation plans. The full impact of these regulations and frameworks is not yet known.

Operational Execution (Safety, Environmental and Reliability)

Each of Suncor’s primary operating businesses carries economic risk associated with operating safety and reliably or enduring a protracted operational outage. The breadth and level of integration of Suncor’s operations adds complexity.

The company’s businesses also carry the risks associated with poor or substandard environmental and safety performance, which is closely scrutinized by governments, the public and the media, and could result in a suspension of or inability to obtain regulatory approvals and permits. A major environmental or safety incident could result in delays in resuming normal operations, fines, civil suits or criminal charges against the company.

In general, Suncor’s operations are subject to operational hazards and risks such as, among others, fires (including forest fires), explosions, blow-outs, power outages, prolonged periods of extreme cold or extreme heat, severe winter climate conditions, flooding, droughts and other extreme weather conditions, railcar incidents or derailments, the migration of harmful substances such as, among others, oil spills, gaseous leaks or a release of deleterious substances, loss of tailings dam integrity, pollution and other environmental risks, and accidents, any of which can interrupt operations or cause personal injury or death, or damage to property, equipment (including information technology and related data and controls systems), and the environment.

The reliable operation of production and processing facilities at planned levels and Suncor’s ability to produce higher-value products can also be impacted by, among other things, failure to follow the company’s policies, standards and operating procedures or operate within established operating parameters, equipment failure through inadequate maintenance, unanticipated erosion or corrosion of facilities, manufacturing and engineering flaws, and labour shortage or interruption. The

ANNUAL REPORT 2024 SUNCOR ENERGY INC. 45


Table of Contents

company is also subject to operational risks such as sabotage, terrorism, trespass, theft and malicious software, network or cyberattacks.

In addition to the foregoing factors that affect Suncor’s business generally, each business unit is susceptible to additional risks due to the nature of its business, including, among others, the following:

Suncor’s Oil Sands business is susceptible to loss of production, slowdowns, shutdowns or restrictions on its ability to produce higher-value products, due to the failure of any one or more interdependent component systems, potential penalties, litigation or reputation damage related to an unintended release or a failure to contain tailings produced in operations, and other risks inherent to oil sands operations;
Suncor’s E&P businesses, face risks and uncertainties associated with drilling for oil and natural gas, the operation and development of such properties and wells (including encountering unexpected formations, pressures or the presence of hydrogen sulphide), premature declines of reservoirs, sour gas releases, uncontrollable flows of crude oil, natural gas or well fluids. Additionally, offshore operations occur in the areas subject to extreme weather conditions, such as hurricanes, winter storms, pack ice, icebergs and fog. The occurrence of any of these events could result in production shut-ins, the suspension of drilling operations and damage to or destruction of the equipment involved. Harsh weather conditions, particularly in the winter season, may also impact the successful execution of maintenance and startup of operations. Offshore operations could be indirectly affected by catastrophic events occurring at other third-party offshore operations, including off-loading terminals, which could give rise to liability, damage to the company’s equipment, harm to individuals, force a shutdown of facilities or operations, a curtailment of production, or result in a shortage of appropriate equipment or specialists required to perform planned operations; and
Suncor’s R&M operations are subject to all of the risks normally inherent in the operation of refineries, terminals, pipelines and other distribution facilities and service stations, including, among others, loss of production, slowdowns or shutdowns due to equipment failures, unavailability of feedstock, price and quality of feedstock, or other incidents.

Suncor is also subject to risks relating to the health and safety of its people, and the potential for a slowdown or temporary suspension of its operations in locations impacted by an outbreak of an epidemic, pandemic or other public health crisis. This could negatively impact Suncor’s production or refined product volumes and refinery utilization rates for a sustained period of time.

Government/Regulatory Policy

Suncor’s businesses operate under federal, provincial, territorial, state and municipal laws in numerous countries. The company is subject to regulation and intervention by governments in oil and gas industry matters, such as, among others, land tenure; royalties; taxes (including income taxes); government fees; production rates; environmental protection; water; wildlife; fish; air quality; safety performance; the reduction of GHG and other emissions; the export of crude oil, natural gas and other products; cybersecurity; interactions with foreign governments; the awarding or acquisition of exploration and production rights, oil sands leases or other interests; the imposition of specific drilling obligations; control over the development, reclamation and abandonment of fields and mine sites; mine financial security requirements; approval of logistics infrastructure; and possibly expropriation or cancellation of contract rights. As part of ongoing operations, the company is also required to comply with a significant number of environmental, health and safety regulations under a variety of Canadian, U.S. and other foreign, federal, provincial, territorial, state and municipal laws and regulations. Failure to comply with applicable laws and regulations may result in, among other things, the imposition of fines and penalties, production constraints, a compulsory shutdown of facilities or suspension of operations (temporarily or permanently), reputational damage, delays, increased costs, denial of operation and growth permit applications, censure, liability for cleanup costs and damages, and the loss of important licenses and permits.

Before proceeding with certain projects, including changes to existing operations, Suncor must obtain permits, regulatory approvals, and licences to operate certain assets. These processes can involve, among other things, Indigenous and stakeholder consultation, government intervention, environmental impact assessments and public hearings and may be subject to conditions, including security deposit obligations and other commitments. In some cases, abandonment and reclamation obligations may remain with the company even after disposition of an asset to a third party. Compliance can be affected by the loss of skilled staff, inadequate internal processes and compliance auditing.

Failure to obtain, comply with, satisfy the conditions of or maintain regulatory permits, licences and approvals, or failure to obtain them on a timely basis or on satisfactory terms, could result in prosecution, fines and penalties, delays, abandonment or restructuring of projects, impacts to production, reputational damage and increased costs, denial of operating and growth

46 ANNUAL REPORT 2024 SUNCOR ENERGY INC. 


Table of Contents

permit applications and public censure. Suncor’s businesses can also be indirectly impacted by a third-party’s inability to obtain regulatory approval for a shared infrastructure project or a third-party infrastructure project on which a portion of Suncor’s business depends.

Changes in government policy, regulation or other laws, or the interpretation thereof, or the revocation of existing approvals or permits by the government or opposition to Suncor’s projects or third-party pipeline and infrastructure projects that delay or prevent necessary permits or regulatory approvals, or that make current operations or growth projects less profitable or uneconomic could materially impact Suncor’s operations, existing and planned projects.

Digital and Cybersecurity

The efficient operation of Suncor’s business is dependent on computer hardware, software and a large and complex information framework, including the systems of cloud providers and third parties with which Suncor conducts business. Digital transformation continues to increase the number of, and complexity of, such systems. In the ordinary course of Suncor’s business, Suncor collects and stores sensitive data, including intellectual property, proprietary business information and personal information of the company’s employees and retail customers. Suncor relies on industry-accepted security measures, controls and technology to protect Suncor’s information systems and securely maintain confidential and proprietary information stored on the company’s information systems, and has adopted a continuous process to identify, assess and manage threats to the company’s information systems.

As a result of the critical nature of the energy supply chain and Suncor’s use of information systems and other digital technologies to control its assets, Suncor faces a heightened risk of cyber-attacks. Additionally, the increasing adoption and use of artificial intelligence (AI) systems by Suncor and/or by third parties may increase the prevalence and efficacy of cyberattacks. Suncor has an information and cybersecurity program in place, however, the measures, controls and technology on which the company relies are constantly evolving, and therefore they may not be adequate due to the increasing volume, sophistication and rapidly evolving nature of cyber threats. Suncor’s information technology and infrastructure, including process control systems, has and will likely continue to face attacks by malicious persons or entities motivated by, among other things, geopolitical, financial or activist reasons, or may be breached due to employee error or malfeasance, or otherwise vulnerable due to other disruptions. The company maintains a risk management program, which includes an insurance component that may provide coverage for the operational impacts from an attack to, or breach of, Suncor’s information technology and infrastructure, including process control systems, however, the company does not maintain standalone cyber insurance. Furthermore, not all cyber risks are insurable. As a result, Suncor’s existing insurance may not provide adequate coverage for losses stemming from a cyberattack to, or breach of, its information technology and infrastructure.

A cyber attack or breach could compromise Suncor’s networks, and the information Suncor stores could be accessed, publicly disclosed, lost, stolen or compromised. Any such attack, breach, access, disclosure or loss of information could result in legal claims or proceedings, liability under laws that protect the privacy of personal information, regulatory penalties, disruptions to Suncor’s operations, decreased performance and production, increased costs, damage to Suncor’s reputation, physical harm to people or the environment or other negative consequences to Suncor or third parties.

Competition

The global petroleum industry is highly competitive in many aspects, including the exploration for and the development of new sources of supply, the acquisition of crude oil and natural gas interests, and the refining, distribution and marketing of refined petroleum products. Suncor competes in virtually every aspect of its business with other energy companies. The petroleum industry also competes with other industries in supplying energy, fuel and related products to consumers. The increasing volatility of the political and social landscape adds complexity.

For Suncor’s Oil Sands and E&P businesses, it is difficult to assess the number, level of production and ultimate timing of all potential new projects or when existing production levels of competitors may increase. Although increased regulatory requirements have slowed certain larger projects in the short term, an increase in the level of activity may have an impact on regional infrastructure, including pipelines, and could place stress on the availability and cost of all resources required to build and run new and existing oil sands operations.

For Suncor’s R&M business, management expects that fluctuations in demand for refined products, margin volatility and overall marketplace competitiveness will continue.

ANNUAL REPORT 2024 SUNCOR ENERGY INC. 47


Table of Contents

There is a risk that increased competition could cause costs to increase, put further strain on existing infrastructure and cause margins for refined and unrefined products to be volatile, and impact demand for Suncor’s products.

Technology Risk

There are risks associated with sustainability, growth and capital projects that rely largely or partly on new technologies and the incorporation of such technologies into new or existing operations, including that the results of the application of new technologies may differ from simulated, test or pilot environments, or that third-party intellectual property protections may impede the development and implementation of new technology. The success of projects incorporating new technologies cannot be assured and advantages accrue to companies that can develop and adopt emerging technologies in advance of competitors. The inability to develop, implement and monitor new technologies may impact the company’s ability to develop its new or existing operations in a profitable manner or comply with regulatory requirements.

The increasing use of AI systems both by Suncor and third parties presents a number of risks associated with the company’s adoption, development and incorporation of AI systems. AI systems provided with incorrect or incomplete data may generate erroneous insights leading to flawed decisions that potentially compromise safety, productivity and profitability. The amount of data used and the speed of AI systems can create privacy, governance and accountability risks with respect to the use of AI and protection of confidential information. Successful use of AI systems can provide the company with competitive advantages but cannot be assured, and the inability to successfully adopt, develop and/or incorporate AI systems may impact the company’s profitability, and ability to compete with peers.

Skills, Resource Shortage and Reliance on Key Personnel

The successful operation of Suncor’s businesses depends on the availability of, and competition for skilled labour and materials supply. There is a risk that the company may have difficulty sourcing and retaining the skilled labour in certain talent segments for current and future operations. The availability of competent and skilled contractors for current and future operations is also a risk depending on market conditions and continued cost reduction initiatives. Suncor’s ability to operate safely and effectively and complete all projects on time and on budget has the potential to be adversely impacted by a shortage of skilled labour and material supply risks. The company’s success also depends in large measure on certain key personnel. The contributions of the existing management team to the immediate and near-term operations of the company are likely to continue to be of central importance for the foreseeable future.

Labour Relations

Hourly employees at Suncor’s oil sands facilities (excluding MacKay River, Fort Hills and Syncrude), all of the company’s refineries and the majority of the company’s terminal and distribution operations and certain of the company’s E&P operations are represented by labour unions or employee associations. Any work interruptions involving the company’s employees, contract trades utilized in the company’s projects or operations, or any jointly owned facilities operated by another entity present a risk to the continued operations of the areas of the company that are affected but such interruptions.

Joint Arrangement Risk

Suncor has entered into joint arrangements and other contractual arrangements with third parties, including arrangements where other entities operate assets in which Suncor has ownership or other interests and arrangements where Suncor operates assets in which other entities have ownership or other interests. The success and timing of activities relating to assets and projects operated by others, or developed jointly with others, depend upon a number of factors that are outside of Suncor’s control, including, among others, the timing and amount of capital expenditures, operational and maintenance expenditures, misalignment of partner interests, the operator’s expertise, financial resources and risk management practices, the approval of other participants, and the selection of technology.

Financial Risks

Access to Capital

Suncor expects that future capital expenditures will be financed out of cash and cash equivalents balances, cash flow provided by operating activities, available committed credit facilities, issuing commercial paper and, if needed, accessing capital markets. This ability is dependent on, among other factors, commodity prices, the overall state of the capital markets, financial institutions and investor appetite for investments in the energy industry generally, and the company’s securities in particular. The company’s ability to access capital may also be adversely affected in the event that financial institutions,

48 ANNUAL REPORT 2024 SUNCOR ENERGY INC. 


Table of Contents

investors, rating agencies and/or lenders adopt more restrictive decarbonization policies. To the extent that external sources of capital become limited, unavailable or available on unfavourable terms, the ability to make capital investments and maintain existing properties may be constrained.

If the company finances capital expenditures in whole or in part with debt, that may increase its debt levels above industry standards for oil and gas companies of similar size. Depending on future development and growth plans, additional debt financing may be required, which may not be available or, if available, may not be available on favourable terms. Neither the Articles of Suncor nor its bylaws limit the amount of indebtedness that may be incurred; however, Suncor is subject to covenants in its existing credit facilities and seeks to avoid an unfavourable cost of debt. The level of the company’s indebtedness, and the level of indebtedness relative to the company’s ability to generate cash flow, from time to time, could impair its ability to obtain additional financing on a timely basis to take advantage of business opportunities that may arise and could negatively affect its credit ratings.

Suncor is required to comply with financial and operating covenants under existing credit facilities and debt securities. Covenants are reviewed based on actual and forecast results and the company has the ability to make changes to its development plans, capital structure and/or dividend policy to comply with covenants under the credit facilities. If Suncor does not comply with the applicable covenants under its credit facilities and debt securities, there is a risk that repayment could be accelerated and/or the company’s access to capital could be restricted or only be available on unfavourable terms.

Rating agencies regularly evaluate the company, including its subsidiaries. Their ratings of Suncor’s long-term and short-term debt are based on a number of factors, including the company’s financial strength, as well as factors not entirely within its control, including conditions affecting the oil and gas industry generally, and the wider state of the economy. Credit ratings may be important to customers or counterparties when Suncor competes in certain markets and when it seeks to engage in certain transactions, including some commodity sales or purchase transactions or those involving over-the-counter derivatives. There is a risk that one or more of Suncor’s credit ratings could be downgraded, which could potentially limit its access to private and public credit markets and increase the company’s cost of borrowing.

Inflation

The company purchases materials and commodities for use in its business and uses contractors to supplement its workforce in many areas of the organization. While many central banks have subsequently lowered interest rates, which were initially raised in an attempt to reduce inflation, there is no certainty that attempts to control inflation will be successful in continuing the pace at which inflation has subsided.

Even a short period of higher-than-average inflation can lead to structural cost increases in Suncor’s business, which may impact its business plans going forward. Furthermore, governmental actions, such as the imposition of higher interest rates, an increase or imposition of tariffs on goods imported from or exported to the U.S., or wage or price controls may also negatively impact the company’s costs and magnify the impacts of other risks identified in this Risk Factors section of the MD&A, including those set out below under Financial Risks – Interest Rate Risks.

Energy Trading and Risk Management Activities and the Exposure to Counterparties

The nature of Suncor’s energy trading and risk management activities, which may make use of derivative financial instruments or other physical positions to create incremental value to Suncor and to manage its exposure to commodity price and other market risks, creates exposure to financial risks, which include, but are not limited to, unfavourable movements in commodity prices, interest rates or foreign exchange that could result in a financial or opportunity loss to the company; a lack of counterparties, due to market conditions or other circumstances that could leave the company unable to liquidate or offset a position, or unable to do so at or near the previous market price; and counterparty default risk.

Exchange Rate Fluctuations

The majority of Suncor’s revenues from the sale of oil and natural gas commodities are based on prices that are determined by, or referenced to, U.S. dollar benchmark prices, while the majority of Suncor’s expenditures are realized in Canadian dollars. Suncor also has assets and liabilities, including approximately 60% of the company’s debt, that are denominated in U.S. dollars and translated to Suncor’s reporting currency (Canadian dollars) at each balance sheet date. Suncor’s financial results, therefore, can be affected significantly by the exchange rates between the Canadian dollar and the U.S. dollar. These exchange rates may vary substantially and may give rise to favourable or unfavourable foreign currency exposure. A decrease in the value of the Canadian dollar relative to the U.S. dollar will increase the revenues received from the sale of commodities. An increase in the value of the Canadian dollar relative to the U.S. dollar will decrease revenues received from

ANNUAL REPORT 2024 SUNCOR ENERGY INC. 49


Table of Contents

the sale of commodities. A decrease in the value of the Canadian dollar relative to the U.S. dollar from the previous balance sheet date increases the amount of Canadian dollars required to settle U.S. dollar denominated obligations.

Interest Rate Risk

The company is exposed to fluctuations in short-term Canadian and U.S. interest rates as Suncor maintains a portion of its debt capacity in revolving and floating rate credit facilities and commercial paper, and invests surplus cash in short-term debt instruments and money market instruments, which are off-setting exposures to some degree. Suncor may also be exposed to higher interest rates when debt instruments are maturing and require refinancing, or when new debt capital needs to be raised. The company is also exposed to changes in interest rates if derivative instruments are used to manage the debt portfolio.

Royalties, Taxes and Tariffs

Suncor is subject to royalties and taxes imposed by governments in numerous jurisdictions and the potential for increased tariffs. Royalties can be impacted by changes in crude oil and natural gas pricing, production volumes, sales volumes, and capital and operating costs; by changes to existing legislation or production sharing contracts; and by results of regulatory audits of prior year filings and other such events. The final determination of these events may have a material impact on the company’s royalties expense. A failure to fully realize anticipated tax benefits, including the expected tax benefit relating to the acquisition of TotalEnergies Canada, or an increase in Suncor’s royalties expense, income taxes, property taxes, carbon taxes, levies, tariffs, duties, quotas, border taxes, other taxes and government-imposed compliance costs may increase our cost of tax compliance, and may have an impact on the company's business, financial condition, results of operations and cash flows from operations.

In February 2025, the U.S. government announced plans for new tariffs on, among other things, Canadian imports to the United States. In response to the U.S. tariffs, the Canadian government subsequently announced it would implement retaliatory tariffs on certain goods imported from the U.S. A portion of the company’s crude oil is exported to the U.S. and tariffs could have a negative impact on commodity prices, including increasing the volatility thereof, which could, in turn, have an adverse effect on the company's business, financial condition, results of operations and cash flows from operations. Additionally, certain goods used by the company in its operations are procured from the U.S. and the tariffs proposed by the Canadian government could increase certain costs of the company, which could, in turn, have an adverse effect on the company's business, financial condition and cash flows from operations.

The details and timing of the implementation of the U.S. and Canadian tariffs remain subject to significant uncertainty at this time and, as such, the impacts thereof on the company’s and business and financial results cannot be accurately quantified at this time. Suncor intends to continue to monitor the impact of such tariffs on the company.

Dividends and Share Repurchases

Suncor’s payment of future dividends on its common shares and future share repurchases by Suncor of its common shares depends on, among other things, legislative and stock exchange requirements, the prevailing business environment, the company’s financial condition, results of operations, cash flow, the need for funds to finance ongoing operations and growth projects, debt covenants and other business considerations that the Board considers relevant. There can be no assurance that Suncor will continue to pay dividends or repurchase shares in the future.

E&P Reserves Replacement

Suncor’s future E&P production, and therefore its cash flows and results of operations from E&P, are highly dependent upon success in exploiting its current reserves base and acquiring or discovering additional reserves. Without additions to its E&P reserves through exploration, acquisition or development activities, Suncor’s production from its E&P assets will decline over time as reserves are depleted. The business of exploring for, developing or acquiring reserves is capital intensive. To the extent Suncor’s cash flows are insufficient to fund capital expenditures and external sources of capital become limited or unavailable, Suncor’s ability to make the necessary capital investments to maintain and expand its reserves will be impaired. In addition, Suncor may be unable to develop or acquire additional reserves to replace its crude oil production at acceptable costs.

50 ANNUAL REPORT 2024 SUNCOR ENERGY INC. 


Table of Contents

Uncertainties Affecting Reserves Estimates

There are numerous uncertainties inherent in estimating quantities of reserves, including many factors beyond the company’s control. Suncor’s actual production, revenues, royalties, taxes and development and operating expenditures with respect to the company’s reserves will vary from its estimates, and such variances could be material.

The evaluation of reserves is a continuous process, one that can be significantly impacted by a variety of internal and external influences. Revisions are often required as a result of newly acquired technical data, technology improvements or changes in performance, pricing, economic conditions, market availability or regulatory requirements. Additional technical information regarding geology, hydrogeology, reservoir properties and reservoir fluid properties is obtained through seismic programs, drilling programs, updated reservoir performance studies and analysis and production history, and may result in revisions to reserves. Pricing, market availability and economic conditions affect the profitability of reserves development. Royalty regimes and environmental regulations and other regulatory changes cannot be predicted but may have positive or negative effects on reserves. Future technology improvements would be expected to have a favourable impact on the economics of reserves development and exploitation, and therefore may result in an increase to reserves. Political unrest, such as is occurring in Syria and Libya, has resulted in volumes that would otherwise be classified as reserves no longer being classified as such.

There are numerous uncertainties inherent in estimating the quantities and quality of these reserves, including many factors beyond the company’s control. In general, estimates of reserves and the future net cash flows from these reserves are based upon a number of factors and assumptions – such as production forecasts, regulations, pricing, the timing and amount of capital expenditures, future royalties, future operating costs, yield rates for upgraded production of SCO from bitumen, and future abandonment and reclamation costs – all of which may vary considerably from actual results. The accuracy of any reserves estimate is a matter of interpretation and judgment and is a function of the quality and quantity of available data, which may have been gathered over time. For these reasons, estimates of reserves and categorization of such reserves based on the certainty of recovery, prepared by different engineers or by the same engineers at different times, may vary.

Reserves estimates are based upon geological assessment, including drilling and laboratory tests. Mining reserves estimates also consider production capacity and upgrading yields, mine plans, operating life and regulatory constraints. In Situ reserves estimates are also based upon the testing of core samples and seismic operations and demonstrated commercial success of in situ processes. Suncor’s actual production, revenues, royalties, taxes, and development and operating expenditures with respect to the company’s reserves will vary from such estimates, and such variances could be material. Production performance subsequent to the date of the estimate may justify future revision, either upward or downward, if material.

Reserves evaluations are based in part on the assumed success of activities the company intends to undertake in future years. Estimated reserves and associated cash flows may be increased or reduced to the extent that such activities do or do not achieve the level of success assumed in the reserves evaluations.

Third-Party Service Providers

Suncor’s businesses are reliant on the operational integrity of a large number of third-party service providers, including input and output commodity transport (pipelines, rail, trucking, marine) and utilities associated with various Suncor and jointly owned facilities. A disruption in service or limited availability by one of these third parties can have a dramatic impact on Suncor’s operations and growth plans. Pipeline constraints that affect takeaway capacity or supply of inputs, such as hydrogen and power, could impact the company’s ability to produce at capacity levels. Disruptions in pipeline service could adversely affect commodity prices, Suncor’s price realizations, refining operations and sales volumes, or limit the company’s ability to produce and deliver production. These interruptions may be caused by the inability of the pipeline to operate or by the oversupply of feedstock into the system that exceeds pipeline capacity. Short-term operational constraints on pipeline systems arising from pipeline interruption and/or increased supply of crude oil have occurred in the past and could occur in the future. There is a risk that third-party outages could impact Suncor’s production or price realizations.

Foreign Operations

The company has operations in countries with different political, economic and social systems. As a result, the company’s operations and related assets are subject to a number of risks and other uncertainties arising from foreign government sovereignty over the company’s international operations, which may include, among other things, currency restrictions and restrictions on repatriation of funds; loss of revenue, property and equipment as a result of expropriation, nationalization, terrorism, war, insurrection, and geopolitical and other political risks; increases in taxes, tariffs and government royalties; compliance with existing and emerging anti-corruption laws, including the Corruption of Foreign Public Officials Act (Canada) and the Foreign Corrupt Practices Act (United States); renegotiation of contracts with government entities and quasi-

ANNUAL REPORT 2024 SUNCOR ENERGY INC. 51


Table of Contents

government agencies; changes in laws and policies governing operations of foreign-based companies; and economic and legal sanctions (such as restrictions against countries experiencing political violence, or countries that other governments may deem to sponsor terrorism).

If a dispute arises in the company’s foreign operations, the company may be subject to the exclusive jurisdiction of foreign courts or may not be able to subject foreign persons to the jurisdiction of a court in Canada or the U.S. In addition, as a result of activities in these areas and a continuing evolution of an international framework for corporate responsibility and accountability for international crimes, there is a risk the company could be exposed to potential claims for alleged breaches of international or local law. The inability of Suncor to fulfil its exploration commitments and other contractual obligations in Libya due to ongoing political instability, civil unrest and security concerns could result in significant expenses and/or the payment of penalties, and the quantum of such could have an adverse effect on the company’s financial condition.

The impact that future potential terrorist attacks, regional hostilities or political violence, such as that experienced in Libya and Syria, may have on the oil and gas industry, and on Suncor’s operations in particular, is not known at this time. Suncor may be required to incur significant costs in the future to safeguard its assets against terrorist activities or to remediate potential damage to its facilities. There can be no assurance that Suncor will be successful in protecting itself against these risks and the related safety and financial consequences.

Despite Suncor’s training and policies around bribery and other forms of corruption, there is a risk that Suncor, or some of its employees or contractors, could be charged with bribery or corruption. Any of these violations could result in onerous penalties. Even allegations of such behaviour could impair Suncor’s ability to work with governments or non-government organizations and could result in the formal exclusion of Suncor from a country or area, sanctions, fines, project cancellations or delays, the inability to raise or borrow capital, reputational impacts and increased investor concern.

Security and Terrorist Threats

Security threats and terrorist or activist activities may impact Suncor’s personnel, which could result in injury, death, extortion, hostage situations and/or kidnapping, including unlawful confinement. A security threat, terrorist attack or activist incident targeted at a facility or office owned or operated by Suncor could also result in the interruption or cessation of key elements of Suncor's operations and may result in property damage.

Land Claims and Indigenous Consultation

Indigenous Peoples have claimed Indigenous title and rights to portions of Western Canada. In addition, Indigenous Peoples have filed claims against industry participants relating in part to land claims, which may affect the company’s business.

Consulting requirements with Indigenous Peoples in respect of oil and gas projects and related infrastructure have increased in recent years, and the Canadian federal government and the provincial government in Alberta have committed to renew their relationships with the Indigenous Peoples of Canada. In particular, on June 21, 2021, Canada’s United Nations Declaration on the Rights of Indigenous Peoples Act (the UNDRIP Act) received Royal Assent and came into force. It is unknown how the UNDRIP Act will ultimately be implemented and interpreted as a part of Canadian law, and it therefore also remains unclear what its corresponding impact will be on the Crown’s duty to consult with and accommodate Indigenous Peoples.

At this point Suncor is unable to assess the effect, if any, that any such land claims, consultation requirements with Indigenous Peoples or the implementation of the UNDRIP Act may have on Suncor’s business.

Litigation Risk

There is a risk that Suncor or entities in which it has an interest may be subject to litigation and claims under such litigation may be material. Various types of claims may be raised in these proceedings, including, but not limited to, environmental damage, climate change and the impacts thereof, breach of contract, common law duties, product liability, antitrust, bribery and other forms of corruption, tax, regulatory enforcement actions, Competition Act enforcement actions, patent infringement, disclosure, employment matters and in relation to an attack, breach or unauthorized access to Suncor’s information technology and infrastructure. Litigation is subject to uncertainty, and it is possible that there could be adverse developments in pending or future cases. Unfavourable outcomes or settlements of litigation could encourage the commencement of additional litigation. Suncor may also be subject to adverse publicity and reputational impacts associated with such matters, regardless of whether Suncor is ultimately found liable or at fault. There is a risk that the outcome of such litigation may be

52 ANNUAL REPORT 2024 SUNCOR ENERGY INC. 


Table of Contents

adverse to the company and/or the company may be required to incur significant expenses or devote significant resources in defence against such litigation, the success of which cannot be guaranteed.

Control Environment

Based on their inherent limitations, disclosure controls and procedures and internal controls over financial reporting may not prevent or detect misstatements, and even those controls determined to be effective can provide only reasonable assurance with respect to financial statement preparation and presentation. Failure to adequately prevent, detect and correct misstatements could have an impact on how Suncor’s business, financial condition and results of operations are reported.

Insurance Coverage

Suncor maintains insurance coverage as part of its risk management program. However, such insurance may not provide comprehensive coverage in all circumstances, nor are all such risks insurable. The company self-insures some risks, and the company’s insurance coverage does not cover all the costs arising out of the allocation of liabilities and risk of loss arising from Suncor operations.

In some instances, certain insurance may become unavailable or available only for reduced amounts of coverage. Significantly increased costs could lead the company to decide to reduce, or possibly eliminate, coverage. In addition, insurance is purchased from a number of third-party insurers, often in layered insurance arrangements, some of whom may discontinue providing insurance coverage for their own policy or strategic reasons. Should any of these insurers refuse to continue to provide insurance coverage, the company’s overall risk exposure could be increased.

ANNUAL REPORT 2024 SUNCOR ENERGY INC. 53


Table of Contents

12. Other Items

Control Environment

Based on their evaluation as of December 31, 2024, Suncor’s Chief Executive Officer and Chief Financial Officer concluded that the company’s disclosure controls and procedures (as defined in Rules 13a-15(e) and 15d-15(e) under the United States Securities Exchange Act of 1934, as amended (the Exchange Act)), are effective to ensure that information required to be disclosed by the company in reports that are filed or submitted to Canadian and U.S. securities authorities is recorded, processed, summarized and reported within the time periods specified in Canadian and U.S. securities laws. There were no other changes in the internal control over financial reporting (as defined in Exchange Act Rules 13a-15(f) and 15d-15(f)) that occurred during the period ended December 31, 2024, that have materially affected, or are reasonably likely to materially affect, the company’s internal control over financial reporting. Management will continue to periodically evaluate the company’s disclosure controls and procedures and internal control over financial reporting and will make any modifications from time to time as deemed necessary.

The effectiveness of our internal control over financial reporting as at December 31, 2024, was audited by KPMG LLP, an independent registered public accounting firm, as stated in their report, which is included in our audited Consolidated Financial Statements for the year ended December 31, 2024.

Based on their inherent limitations, disclosure controls and procedures and internal control over financial reporting may not prevent or detect misstatements, and even those controls determined to be effective can provide only reasonable assurance with respect to financial statement preparation and presentation.

Corporate Guidance

There have been no changes to the corporate guidance ranges previously issued on December 12, 2024. For further details and advisories regarding Suncor’s 2025 corporate guidance, see www.suncor.com/guidance.

54 ANNUAL REPORT 2024 SUNCOR ENERGY INC. 


Table of Contents

13. Advisories

Non-GAAP and Other Financial Measures

Certain financial measures in this MD&A – namely adjusted operating earnings (loss), adjusted funds from (used in) operations, measures contained in ROCE and ROCE excluding impairments and impairment reversals, price realizations, free funds flow, Oil Sands operations cash operating costs, Fort Hills cash operating costs, Syncrude cash operating costs, refining and marketing margin, refining operating expense, net debt, total debt, LIFO inventory valuation methodology and related per share or per barrel amounts or metrics that contain such measures – are not prescribed by GAAP. These non-GAAP financial measures are included because management uses the information to analyze business performance, leverage and liquidity, and it may be useful to investors on the same basis. These non-GAAP financial measures do not have any standardized meaning and, therefore, are unlikely to be comparable to similar measures presented by other companies. Therefore, these non-GAAP financial measures should not be considered in isolation or as a substitute for measures of performance prepared in accordance with GAAP. Except as otherwise indicated, these non-GAAP financial measures are calculated and disclosed on a consistent basis from period to period. Specific adjusting items may only be relevant in certain periods.

(a)Adjusted Operating Earnings (Loss)

Adjusted operating earnings (loss) is a non-GAAP financial measure that adjusts net earnings (loss) for significant items that are not indicative of operating performance. Management uses adjusted operating earnings (loss) to evaluate operating performance because management believes it provides better comparability between periods. For the years ended December 31, 2024, December 31, 2023, and December 31, 2022, consolidated adjusted operating earnings (loss) are reconciled to net earnings (loss) in the Financial Information section of this MD&A and adjusted operating earnings (loss) for each segment are reconciled to net earnings (loss) in the Segment Results and Analysis section of this MD&A. Adjusted operating earnings (loss) for the three months ended December 31, 2024, and December 31, 2023, are reconciled to net earnings (loss) below.

(b)Bridge Analyses of Adjusted Operating Earnings (Loss)

Throughout this MD&A, the company presents charts that illustrate the change in adjusted operating earnings (loss) from the comparative period through key variance factors. These factors are analyzed in the Adjusted Operating Earnings (Loss) narratives following the bridge analyses in specific sections of this MD&A. These bridge analyses are presented because management uses this presentation to evaluate performance. All reconciling items are presented on a before-tax basis and adjusted for income taxes in the Income Tax bridge factor.

The factor for Sales Volumes and Mix is calculated based on sales volumes and mix for the Oil Sands and E&P segments and refinery production volumes for the R&M segment.
The factor for Price, Margin and Other Revenue includes upstream price realizations before royalties, except for Libya, which is net of royalties, and upstream marketing and logistics. Also included are refining and marketing margins, other operating revenue, and the net impacts of sales and purchases of third-party crude, including product purchased for use as diluent in the company’s Oil Sands operations and subsequently sold as part of diluted bitumen.
The factor for Royalties excludes the impact of Libya, as royalties in Libya are taken into account in Price, Margin and Other Revenue as described above.
The factor for Inventory Valuation is comprised of changes in the FIFO inventory valuation and the realized portion of commodity risk management activities reported in the R&M segment, as well as the impact of the deferral or realization of profit or loss on crude oil sales from the Oil Sands segment to Suncor’s refineries reported in the Corporate and Eliminations segment.
The factor for Operating and Transportation Expense includes project startup costs, OS&G expense and transportation expense.
The factor for Financing Expense and Other includes financing expenses, other income, operational foreign exchange gains and losses, and changes in gains and losses on disposal of assets that are not adjusted operating earnings (loss) adjustments.

ANNUAL REPORT 2024 SUNCOR ENERGY INC. 55


Table of Contents

The factor for DD&A and Exploration Expense includes depreciation, depletion and amortization expense, and exploration expense.
The factor for Income Tax includes the company’s current and deferred income tax expense on adjusted operating earnings, changes in statutory income tax rates and other income tax adjustments.
(c)Return on Capital Employed (ROCE) and ROCE Excluding Impairments and Impairment Reversals

ROCE is a non-GAAP ratio that management uses to analyze operating performance and the efficiency of Suncor’s capital allocation process. ROCE is calculated using the non-GAAP financial measures adjusted net earnings and average capital employed. Adjusted net earnings is calculated by taking net earnings (loss) and adjusting after-tax amounts for unrealized foreign exchange on U.S. dollar denominated debt and net interest expense. Average capital employed is calculated as a twelve-month average of the capital employed balance at the beginning of the twelve-month period and the month-end capital employed balances throughout the remainder of the twelve-month period. Figures for capital employed at the beginning and end of the twelve-month period are presented to show the changes in the components of the calculation over the twelve-month period.

Year ended December 31


($ millions, except as noted)

2024

2023

2022


Adjustments to net earnings


Net earnings


6 016


8 295


9 077


Add (deduct) add after-tax amounts for:


Unrealized foreign exchange loss (gain) on U.S. dollar denominated debt


615


(179)


679


Net interest expense


279


401


491


Adjusted net earnings(1)


A


6 910


8 517


10 247


Capital employed – beginning of twelve-month period


Net debt(2)(4)


9 852


10 627


13 299


Shareholders’ equity


43 279


39 367


36 614


53 131


49 994


49 913


Capital employed – end of twelve-month period


Net debt(2)(4)


6 861


9 852


10 627


Shareholders’ equity


44 514


43 279


39 367


51 375


53 131


49 994


Average capital employed


B


52 972


52 119


50 745


ROCE (%)(3)(5)


A/B


13.0


16.3


20.2


(1)Total before-tax impact of adjustments is $1.042 billion for the year ended December 31, 2024, $344 million for the year ended December 31, 2023, and $1.575 billion for the year ended December 31, 2022.
(2)Net debt is a non-GAAP financial measure.
(3)For the twelve months ended December 31, 2024, there were no impairments or impairment reversals. As a result, ROCE excluding impairments was equal to ROCE. ROCE was impacted by the $1.125 billion non-cash gain on acquisition of TotalEnergies Canada for the twelve months ended December 31, 2023, and for the first nine months of 2024. For the twelve months ended December 31, 2022, ROCE was impacted by the impairment reversal of $715 million ($542 million after-tax) and impairment of $70 million ($47 million after-tax) in the second quarter of 2022, and the impact of the impairment of $3.397 billion ($2.586 billion after-tax) in the third quarter of 2022.
(4)Beginning in 2024, the company revised the definition of net debt to exclude lease liabilities to better align with how management and industry monitor capital structure. Prior period comparatives have been restated to reflect this change.
(5)Beginning in 2024, the company revised the definition of ROCE to exclude lease liabilities from the calculation of average capital employed and interest on lease liabilities from net interest expense to better align with how management and industry monitor capital structure. Prior period comparatives have been restated to reflect this change.

56 ANNUAL REPORT 2024 SUNCOR ENERGY INC. 


Table of Contents

(d)Adjusted Funds from (Used in) Operations

Adjusted funds from (used in) operations is a non-GAAP financial measure that adjusts a GAAP measure – cash flow provided by operating activities – for changes in non-cash working capital, which management uses to analyze operating performance and liquidity. Changes to non-cash working capital can be impacted by, among other factors, the timing of offshore feedstock purchases and payments for commodity and income taxes, the timing of cash flows related to accounts receivable and accounts payable, and changes in inventory that management believe reduces comparability between periods.

Exploration and


Oil Sands

Production

Refining and Marketing


Year ended December 31 ($ millions)


2024


2023


2022


2024


2023


2022


2024


2023


2022


Earnings (loss) before income taxes


6 607


6 811


5 633


867


1 691


3 221


2 596


3 383


5 694

Adjustments for:


Depreciation, depletion, amortization and impairment


5 134


4 902


7 927


707


483


(105)


996


934


844

Accretion


514


460


249


67


64


60


11


8


8

Unrealized foreign exchange loss (gain) on U.S. dollar denominated debt


Change in fair value of financial instruments and trading inventory


(117)


27


18


3


(3)


(6)


(8)


(29)


(50)

Bargain purchase gain and revaluations

(1 125)

(Gain) loss on disposal of assets


(15)


(39)


(7)


(600)


66


(8)


(28)


(11)

Loss on extinguishment of long-term debt

Share-based compensation


(47)


71


139


12


12


6


(20)


25


50

Settlement of decommissioning and restoration liabilities


(385)


(326)


(264)


(47)


(29)


(21)


(56)


(35)


(23)

Other


151


(56)


136


1


(6)


(43)


27


10


49

Current income tax expense

Adjusted funds from (used in) operations


11 842


10 725


13 831


1 610


1 612


3 178


3 538


4 268


6 561

Change in non-cash working capital

Cash flow provided by operating activities

ANNUAL REPORT 2024 SUNCOR ENERGY INC. 57


Table of Contents

Corporate


and Eliminations

Income Taxes

Total


Year ended December 31 ($ millions)


2024


2023


2022


2024


2023


2022


2024


2023


2022


Earnings (loss) before income taxes


(1 883)


(1 296)


(2 232)


8 187


10 589


12 316

Adjustments for:


Depreciation, depletion, amortization and impairment


117


116


120


6 954


6 435


8 786

Accretion


(1)


592


532


316

Unrealized foreign exchange loss (gain) on U.S. dollar denominated debt


714


(184)


729


714


(184)


729

Change in fair value of financial instruments and trading inventory


(122)


(5)


(38)

Bargain purchase gain and revaluations

(1 125)

(Gain) loss on disposal of assets


(2)


(325)


(3)


(25)


(992)


45

Loss on extinguishment of long-term debt

170

32

170

32

Share-based compensation


(2)


133


(57)


108


328

Settlement of decommissioning and restoration liabilities


(6)


(488)


(390)


(314)

Other


207


143


(12)


386


91


130

Current income tax expense

(2 465)

(1 734)

(4 229)

(2 465)

(1 734)

(4 229)

Adjusted funds from (used in) operations


(679)


(1 546)


(1 240)


(2 465)


(1 734)


(4 229)


13 846


13 325


18 101

Change in in non-cash working capital


2 114


(981)


(2 421)

Cash flow provided by operating activities


15 960


12 344


15 680

58 ANNUAL REPORT 2024 SUNCOR ENERGY INC. 


Table of Contents

(e)Free Funds Flow

Free funds flow is a non-GAAP financial measure that is calculated by taking adjusted funds from operations and subtracting capital expenditures, including capitalized interest. Free funds flow reflects cash available for increasing distributions to shareholders and reducing debt. Management uses free funds flow to measure the capacity of the company to increase returns to shareholders and to grow Suncor’s business.

Exploration and


Oil Sands

Production

Refining and Marketing


Year ended December 31 ($ millions)


2024


2023


2022


2024


2023


2022


2024


2023


2022


Adjusted funds from (used in) operations


11 842


10 725


13 831


1 610


1 612


3 178


3 538


4 268


6 561

Capital expenditures including capitalized interest(1)

(4 340)

(4 096)

(3 540)

(907)

(668)

(443)

(1 190)

(1 002)

(816)

Free funds flow (deficit)

7 502

6 629

10 291

703

944

2 735

2 348

3 266

5 745

Corporate


and Eliminations

Income Taxes

Total


Year ended December 31 ($ millions)


2024


2023


2022


2024


2023


2022


2024


2023


2022


Adjusted funds from (used in) operations


(679)


(1 546)


(1 240)


(2 465)


(1 734)


(4 229)


13 846


13 325


18 101

Capital expenditures including capitalized interest(1)

(46)

(62)

(188)

(6 483)

(5 828)

(4 987)

Free funds flow (deficit)

(725)

(1 608)

(1 428)

(2 465)

(1 734)

(4 229)

7 363

7 497

13 114

(1)Excludes capital expenditures related to assets previously held for sale of nil in 2024, $108 million in 2023 and $133 million in 2022.

(f)Oil Sands Operations, Fort Hills and Syncrude Cash Operating Costs

Cash operating costs are calculated by adjusting Oil Sands segment OS&G expense for non-production costs and excess power capacity. Significant non-production costs include, but are not limited to, share based compensation adjustments, research costs, project startup costs and adjustments to reflect the cost of internal transfers in the receiving asset at the cost of production versus the cost of purchase. Non-production costs at Fort Hills and Syncrude also include, but are not limited to, an adjustment to reflect internally produced diesel from Oil Sands operations at the cost of production. Excess power capacity represents excess power revenue from cogeneration units that is recorded in operating revenues. Oil Sands operations excess power capacity and other also includes, but is not limited to, the natural gas expense recorded as part of a non-monetary arrangement involving a third-party processor. Oil Sands operations, Fort Hills and Syncrude production volumes are gross of internally consumed diesel and feedstock transfers between assets. Oil Sands operations, Fort Hills and Syncrude cash operating costs are reconciled in the Segment Results and Analysis – Oil Sands – Cash Operating Costs section of this MD&A. Management uses cash operating costs to measure operating performance.

ANNUAL REPORT 2024 SUNCOR ENERGY INC. 59


Table of Contents

(g)Refining and Marketing Gross Margin and Refining Operating Expense

Refining and marketing gross margins and refining operating expense are non-GAAP financial measures. Refining and marketing gross margin, on a FIFO basis, is calculated by adjusting R&M segment operating revenue, other income and purchases of crude oil and products (all of which are GAAP measures) for intersegment marketing fees recorded in intersegment revenues and the impact of inventory write-downs recorded in purchases of crude oil and products. Refining and marketing gross margin, on a LIFO basis, is further adjusted for the impacts of FIFO inventory valuation recorded in purchases of crude oil and products and short-term risk management activities recorded in other income (loss). Refinery operating expense is calculated by adjusting R&M segment OS&G for i) non-refining costs pertaining to the company’s supply, marketing and ethanol businesses; and ii) non-refining costs that management believes do not relate to the production of refined products, including, but not limited to, share-based compensation and enterprise shared service allocations. Management uses refining and marketing gross margin and refining operating expense to measure operating performance on a production barrel basis.

Year ended December 31


($ millions, except as noted)

2024

2023

2022


Refining and marketing gross margin reconciliation


Operating revenues


31 341


31 068


36 728

Purchases of crude oil and products

(24 915)

(23 867)

(27 261)

6 426

7 201

9 467

Other income (loss)


255


224


(60)

Non-refining and marketing margin


(112)


(50)


(20)

Refining and marketing gross margin – FIFO


6 569


7 375


9 387

Refinery production(1) (mbbls)


180 356


163 895


168 149

Refining and marketing gross margin – FIFO ($/bbl)


36.40


45.00


55.85

FIFO and risk management activities adjustment

107

330

(230)

Refining and marketing gross margin – LIFO

6 676

7 705

9 157

Refining and marketing gross margin – LIFO ($/bbl)

37.00

47.00

54.45

Refining operating expense reconciliation


Operating, selling and general expense


2 466


2 558


2 427

Non-refining costs


(1 277)


(1 340)


(1 246)

Refining operating expense


1 189


1 218


1 181

Refinery production(1)


180 356


163 895


168 149

Refining operating expense ($/bbl)


6.60


7.45


7.00

(1)Refinery production is the output of the refining process and differs from crude oil processed as a result of volumetric adjustments for non-crude feedstock, volumetric gain associated with the refining process and changes in unfinished product inventories.
(h)Impact of FIFO Inventory Valuation on Refining and Marketing Net Earnings

GAAP requires the use of a FIFO inventory valuation methodology. For Suncor, this results in a disconnect between the sales prices for refined products, which reflect current market conditions, and the amount recorded as the cost of sale for the related refinery feedstock, which reflects market conditions at the time when the feedstock was purchased. This lag between purchase and sale can be anywhere from several weeks to several months and is influenced by the time to receive crude after purchase, regional crude inventory levels, the completion of refining processes, transportation time to distribution channels and regional refined product inventory levels.

Suncor prepares and presents an estimate of the impact of using a FIFO inventory valuation methodology compared to a LIFO methodology, because management uses the information to analyze operating performance and compare itself against refining peers that are permitted to use LIFO inventory valuation under U.S. GAAP.

The company’s estimate is not derived from a standardized calculation and, therefore, may not be directly comparable to similar measures presented by other companies, and should not be considered in isolation or as a substitute for measures of performance prepared in accordance with GAAP or U.S. GAAP.

60 ANNUAL REPORT 2024 SUNCOR ENERGY INC. 


Table of Contents

(i)Net Debt and Total Debt

Net debt and total debt are non-GAAP financial measures that management uses to analyze the financial condition of the company. Total debt includes short-term debt, current portion of long-term debt and long-term debt (all of which are GAAP measures). Net debt is equal to total debt less cash and cash equivalents (a GAAP measure).

At December 31


($ millions, except as noted)

2024

2023


2022


Short-term debt


494


2 807

Current portion of long-term debt


997


Long-term debt

9 348


11 087


9 800

Total debt(1)


10 345


11 581

12 607

Less: Cash and cash equivalents


3 484


1 729


1 980

Net debt(1)


6 861


9 852


10 627

Shareholders’ equity


44 514


43 279


39 367

Total debt plus shareholders’ equity(1)


54 859


54 860


51 974

Total debt to total debt plus shareholders’ equity (%)(1)


18.9


21.1


24.3

Net debt to net debt plus shareholders’ equity (%)(1)


13.4


18.5

21.3

(1)Beginning in 2024, the company revised the definition of net debt and total debt to exclude lease liabilities to better align with how management and industry monitor capital structure. Prior period comparatives have been restated to reflect this change.

ANNUAL REPORT 2024 SUNCOR ENERGY INC. 61


Table of Contents

(j)Price Realizations

Price realizations are a non-GAAP measure used by management to measure profitability. Oil Sands price realizations are presented on a crude product basis and are derived from the Oil Sands segmented statement of net earnings (loss), after adjusting for items not directly attributable to the revenues associated with production. E&P price realizations are presented on an asset location basis and are derived from the E&P segmented statement of net earnings (loss), after adjusting for other E&P assets, such as Libya, for which price realizations are not provided.

Oil Sands Price Realizations

For the year ended

December 31, 2024

December 31, 2023

($ millions, except as noted)

Non-Upgraded Bitumen

Upgraded – Net SCO and Diesel

Average Crude

Oil Sands Segment

Non-Upgraded Bitumen

Upgraded – Net SCO and Diesel

Average Crude

Oil Sands Segment

Operating revenues

9 924

19 336

29 260

29 260

7 218

18 817

26 035

26 035

Other income (loss)

142

34

176

176

1 519

(50)

1 469

1 469

Purchases of crude oil and products

(2 371)

(188)

(2 559)

(2 559)

(1 758)

(177)

(1 935)

(1 935)

Gross realization adjustment(1)

(130)

(199)

(329)

(1 463)

(294)

(1 757)

Gross realizations

7 565

18 983

26 548

5 516

18 296

23 812

Transportation and distribution

(636)

(589)

(1 225)

(1 225)

(567)

(646)

(1 213)

(1 213)

Price realization

6 929

18 394

25 323

4 949

17 650

22 599

Sales volumes (mbbls)

95 447

187 844

283 291

72 795

177 601

250 396

Price realization per barrel

72.65

97.91

89.41

67.97

99.40

90.27

For the year ended

December 31, 2022

($ millions, except as noted)

Non-Upgraded Bitumen

Upgraded – Net SCO and Diesel

Average Crude

Oil Sands Segment

Operating revenues

7 892

22 539

30 431

30 431

Other (loss) income

(80)

27

(53)

(53)

Purchases of crude oil and products

(1 673)

(377)

(2 050)

(2 050)

Gross realization adjustment(1)

(119)

(420)

(539)

Gross realizations

6 020

21 769

27 789

Transportation and distribution

(438)

(772)

(1 210)

(1 210)

Price realization

5 582

20 997

26 579

Sales volumes (mbbls)

65 960

176 632

242 592

Price realization per barrel

84.63

118.88

109.57

(1)Reflects the items not directly attributed to revenues received from the sale of proprietary crude and net non-proprietary activity at its deemed point of sale.

62 ANNUAL REPORT 2024 SUNCOR ENERGY INC. 


Table of Contents

E&P Price Realizations

For the year ended

December 31, 2024

December 31, 2023

($ millions, except as noted)

E&P International

E&P Canada

Other(1)(2)

E&P Segment

E&P International

E&P Canada

Other(1)(2)

E&P Segment

Operating revenues

2 127

671

2 798

306

1 689

694

2 689

Transportation and distribution

(81)

(8)

(89)

(9)

(58)

(9)

(76)

Price realization

2 046

663

297

1 631

685

Sales volumes (mbbls)

19 095

2 729

15 149

Price realization per barrel

107.38

109.00

107.62

For the year ended

December 31, 2022

($ millions, except as noted)

E&P International

E&P Canada

Other(1)(2)

E&P Segment

Operating revenues

1 222

2 464

645

4 331

Transportation and distribution

(24)

(61)

(16)

(101)

Price realization

1 198

2 403

629

Sales volumes (mbbls)

9 453

18 753

Price realization per barrel

126.61

128.07

(1)Reflects other E&P assets, such as Libya, for which price realizations are not provided.
(2)Production from the company’s Libya operations has been presented on an economic basis. In the Financial Statements, revenue and royalties from the company’s Libya operations are presented on a working-interest basis, which is required for presentation purposes. In 2024, revenue included a gross-up amount of $510 million, with an offsetting amount of $271 million in royalties in the E&P segment and $239 million in income tax expense recorded at the consolidated level. In 2023, revenue included a gross-up amount of $528 million (2022 - $486 million), with an offsetting amount of $282 million (2022 - $266 million) in royalties and $246 million (2022 - $220 million) in income tax expense recorded at the consolidated level.

(k)Adjusted Operating Earnings (Loss) Reconciliations – Fourth Quarter 2024 and 2023


Exploration and

Refining and

Corporate


For the quarter ended December 31

Oil Sands

Production

Marketing

and Eliminations

Income Taxes

Total


($ millions)


2024


2023


2024


2023


2024


2023


2024


2023

2024


2023


2024


2023


Net earnings (loss)


1 625


2 660


125


133


410


598


(1 070)


(1)

(272)

(570)


818


2 820

Unrealized foreign exchange loss (gain) on U.S. dollar denominated debt


514


(199)


514


(199)

Unrealized gain on risk management activities

(16)

(9)


(16)

(9)

Gain on significant acquisition

(1 125)

(1 125)

Asset impairment

212

158

212

158

Loss on repayment of long-term debt

144

144

Income tax recovery on adjusted operating earnings adjustments

(106)


(10)

(106)

(10)

Adjusted operating earnings (loss)


1 609


1 526


125


133


410


598


(200)


(42)

(378)


(580)


1 566


1 635

ANNUAL REPORT 2024 SUNCOR ENERGY INC. 63


Table of Contents

(l)Adjusted Funds from (Used in) Operations Reconciliations – Fourth Quarter 2024 and 2023


Exploration and

Refining and

Corporate


For the quarter ended December 31

Oil Sands

Production

Marketing

and Eliminations

Income Taxes

Total


($ millions)


2024


2023


2024


2023


2024


2023


2024


2023

2024


2023


2024


2023


Earnings (loss) before income taxes


1 625


2 660


125


133


410


598


(1 070)


(1)


1 090


3 390

Adjustments for:


Depreciation, depletion, amortization and impairment


1 390


1 214


162


99


269


256


30


29


1 851


1 598

Accretion


128


116


17


15


3


2


148


133

Unrealized foreign exchange loss (gain) on U.S. dollar denominated debt


514


(199)


514


(199)

Change in fair value of financial instruments and trading inventory


1


(65)


(7)


(1)


(53)


(30)


(59)


(96)

Bargain purchase gain and revaluations

(1 125)

(1 125)

(Gain) loss on disposal of assets


(6)


8


(5)


(2)


(1)


(3)


(12)


3

Loss on extinguishment of long-term debt

144

144

Share-based compensation


55


30


4


4


26


10


69


24


154


68

Settlement of decommissioning and restoration liabilities


(95)


(70)


(24)


(24)


(20)


(16)


(139)


(110)

Other


28


(109)


(3)


(6)


8


(7)


183


160


216


38

Current income tax (expense) recovery

(414)

334

(414)

334

Adjusted funds from (used in) operations


3 126


2 651


274


228


638


811


(131)


10

(414)

334


3 493


4 034

Change in non-cash working capital


1 590


284

Cash flow provided by operating activities


5 083


4 318

64 ANNUAL REPORT 2024 SUNCOR ENERGY INC. 


Table of Contents

Measurement Conversions

Certain crude oil and natural gas liquids volumes have been converted to mcfe or mmcfe on the basis of one bbl to six mcf. Also, certain natural gas volumes have been converted to boe or mboe on the same basis. Any figure presented in mcfe, mmcfe, boe or mboe may be misleading, particularly if used in isolation. A conversion ratio of one bbl of crude oil or natural gas liquids to six mcf of natural gas is based on an energy-equivalency conversion method primarily applicable at the burner tip and does not necessarily represent value equivalency at the wellhead. Given that the value ratio based on the current price of crude oil as compared to natural gas is significantly different from the energy equivalency of 6:1, conversion on a 6:1 basis may be misleading as an indication of value.

Common Abbreviations

The following is a list of abbreviations that may be used in this MD&A:

Measurement

bbl

barrel

bbls/d

barrels per day

mbbls/d

thousands of barrels per day

boe

barrels of oil equivalent

boe/d

barrels of oil equivalent per day

mboe

thousands of barrels of oil equivalent

mboe/d

thousands of barrels of oil equivalent per day

mcf

thousands of cubic feet of natural gas

mcfe

thousands of cubic feet of natural gas equivalent

mmcf

millions of cubic feet of natural gas

mmcf/d

millions of cubic feet of natural gas per day

mmcfe

millions of cubic feet of natural gas equivalent

mmcfe/d

millions of cubic feet of natural gas equivalent per day

m3

cubic metres

MW

megawatts

MWh

megawatt hour

Places and Currencies

U.S.

United States

U.K.

United Kingdom

B.C.

British Columbia

$ or Cdn$

Canadian dollars

US$

United States dollars

£

Pounds sterling

Euros

Financial and Business Environment

DD&A

Depreciation, depletion and amortization

WTI

West Texas Intermediate

WCS

Western Canadian Select

SCO

Synthetic crude oil

SYN

MSW

Synthetic crude oil benchmark

Mixed Sweet Blend

NYMEX

New York Mercantile Exchange

ANNUAL REPORT 2024 SUNCOR ENERGY INC. 65


Table of Contents

Forward-Looking Statements

This MD&A contains certain forward-looking statements and forward-looking information (collectively, forward-looking statements) within the meaning of applicable Canadian and U.S. securities laws and other information based on Suncor’s current expectations, estimates, projections and assumptions that were made by the company in light of information available at the time the statement was made and consider Suncor’s experience and its perception of historical trends, including expectations and assumptions concerning: the accuracy of reserves estimates; commodity prices and interest and foreign exchange rates; the performance of assets and equipment; capital efficiencies and cost savings; applicable laws and government policies; future production rates; the sufficiency of budgeted capital expenditures in carrying out planned activities; the availability and cost of labour, services and infrastructure; the satisfaction by third parties of their obligations to Suncor; the development and execution of projects; and the receipt, in a timely manner, of regulatory and third-party approvals. All statements and information that address expectations or projections about the future, and statements and information about Suncor’s strategy for growth, expected and future expenditures or investment decisions, commodity prices, costs, schedules, production volumes, operating and financial results, future financing and capital activities, and the expected impact of future commitments are forward-looking statements. Some of the forward-looking statements may be identified by words like “expects”, “anticipates”, “will”, “estimates”, “plans”, “scheduled”, “intends”, “believes”, “projects”, “indicates”, “could”, “focus”, “vision”, “goal”, “outlook”, “proposed”, “target”, “objective”, “continue”, “should”, “may”, “potential”, “future”, “opportunity”, “would”, “priority” and similar expressions.

Forward-looking statements in this MD&A include references to:

Suncor's strategy, including its aim to deliver competitive and sustainable returns to shareholders, its plans on how to achieve this strategy, and its expectation that execution of the company’s strategy and key priorities will grow free funds flow per share and enable the delivery of industry-leading shareholder returns;
Suncor’s oil sands strategy and investments in 2025, including the strategy to continue to reduce cost structure and increase production, reliability and efficiency through the deployment of new AHS capable haul trucks, plans to continue the deployment of AHS at Base Mine, Syncrude and Fort Hills, the expectation of improved fleet productivity as a result of the use of the Mine Digital Connect Tool, the intention to leverage its integrated regional asset complex, and to continue its company-wide initiative to further improve turnarounds;
The expectation that the Upgrader 1 coke drum replacement will be in service in late 2025 and is expected to extend the life of the upgrader by approximately 30 years;
The expectation that MLX-W will sustain bitumen production levels after resource depletion at the North Mine using existing facilities and that first oil is expected from MLX-W in 2025;
The expectation that two new sections in the North Pit at Fort Hills will begin delivering ore in 2026;
Suncor’s E&P investments in 2025, including the expectation of continued investment in development drilling and other activities at Hebron and Hibernia and the expectation that such activities will extend the production life of the existing fields, continued investment in the West White Rose Extension Project and that such investment will extend the production of the field, and the expectations that production at White Rose will restart in 2025 and will commence from the West White Rose Extension Project in 2026;
Suncor’s R&M strategy and investments in 2025 including, the continued enhancement of its retail business, the expansion of the Canadian Tire Partnership continuing through 2025 and beyond to eventually re-brand over 200 retail sites and the intention to continue the company wide initiative to further improve turnarounds and the expectation that this will reduce overall turnaround costs and durations and increase reliability;
The commitment to execute its capital allocation framework, manage its balance sheet at current debt levels and return 100% of excess funds to shareholders; and
The expectation that fluctuations in demand for refined products, margin volatility and overall marketplace competitiveness will continue for the company’s R&M business.

The anticipated timing, duration and impact of planned maintenance events, including:

planned turnaround activities at Syncrude, Upgrader 2, Firebag, the Edmonton refinery, the Sarnia refinery; and

66 ANNUAL REPORT 2024 SUNCOR ENERGY INC. 


Table of Contents

planned maintenance at Upgrader 1, Fort Hills, the Edmonton refinery, and the Montreal refinery.

Also:

economic sensitivities;
Suncor’s belief that its indicative 5-2-2-1 index will continue to be an appropriate measure against Suncor’s actual results;
statements about Suncor's share repurchase program, including its belief that, depending on the trading price of its common shares and other relevant factors, purchasing its own shares represents an attractive investment opportunity and is in the best interests of the company and its shareholders, and Suncor's expectation that the decision to allocate cash to repurchase shares will not affect its long-term strategy;
the company’s belief that it does not have any guarantees or off-balance sheet arrangements that have, or are reasonably likely to have, a current or future material effect on the company’s financial condition or financial performance, including liquidity and capital resources;
Suncor’s planned 2025 capital spending program of $6.1 billion to $6.3 billion and the belief that the company will have the capital resources to fund its planned 2025 capital spending program and to meet current and future working capital requirements through cash and cash equivalents balances, cash flow provided by operating activities, available committed credit facilities, issuing commercial paper and accessing capital markets;
Suncor's expectations as to how its 2025 capital expenditures will be directed and the expected benefits therefrom;
the objectives of the company’s short-term investment portfolio and the expectation that the maximum weighted average term to maturity of the company’s short-term investment portfolio will not exceed six months, and all investments will be with counterparties with investment grade debt ratings;
Suncor's intention to adopt certain accounting standards, amendments and interpretations when they become effective; and
expectations with respect to changes to law and government policy.

Forward-looking statements are not guarantees of future performance and involve a number of risks and uncertainties, some that are similar to other oil and gas companies and some that are unique to Suncor. Suncor’s actual results may differ materially from those expressed or implied by its forward-looking statements, so readers are cautioned not to place undue reliance on them.

The financial and operating performance of the company’s reportable operating segments, specifically Oil Sands, E&P and R&M, may be affected by a number of factors.

Factors that affect Suncor’s Oil Sands segment include, but are not limited to, volatility in the prices for crude oil and other production, and the related impacts of fluctuating light/heavy and sweet/sour crude oil differentials; changes in the demand for refinery feedstock and diesel fuel, including the possibility that refiners that process the company’s proprietary production will be closed, experience equipment failure or other accidents; Suncor’s ability to operate its Oil Sands facilities reliably in order to meet production targets; the output of newly commissioned facilities, the performance of which may be difficult to predict during initial operations; Suncor’s dependence on pipeline capacity and other logistical constraints, which may affect the company’s ability to distribute products to market and which may cause the company to delay or cancel planned growth projects in the event of insufficient takeaway capacity; Suncor’s ability to finance Oil Sands economic investment and asset sustainment and maintenance capital expenditures; the availability of bitumen feedstock for upgrading operations, which can be negatively affected by poor ore grade quality, unplanned mine equipment and extraction plant maintenance, tailings storage, and in situ reservoir and equipment performance, or the unavailability of third-party bitumen; changes in operating costs, including the cost of labour, natural gas and other energy sources used in oil sands processes; and the company’s ability to complete projects, including planned maintenance events, both on time and on budget, which could be impacted by competition from other projects (including other oil sands projects) for goods and services and demands on infrastructure in Alberta’s Wood Buffalo region and the surrounding area (including housing, roads and schools).

ANNUAL REPORT 2024 SUNCOR ENERGY INC. 67


Table of Contents

Factors that affect Suncor’s E&P segment include, but are not limited to, volatility in crude oil and natural gas prices; operational risks and uncertainties associated with oil and gas activities, including unexpected formations or pressures, premature declines of reservoirs, fires, blow-outs, equipment failures and other accidents, uncontrollable flows of crude oil, natural gas or well fluids, and pollution and other environmental risks; adverse weather conditions, which could disrupt output from producing assets or impact drilling programs, resulting in increased costs and/or delays in bringing on new production; political, economic and socio-economic risks associated with Suncor’s foreign operations, including the unpredictability of operating in Libya due to ongoing political unrest; and market demand for mineral rights and producing properties, potentially leading to losses on disposition or increased property acquisition costs.

Factors that affect Suncor’s R&M segment include, but are not limited to, fluctuations in demand and supply for refined products that impact the company’s margins; market competition, including potential new market entrants; the company’s ability to reliably operate refining and marketing facilities in order to meet production or sales targets; and risks and uncertainties affecting construction or planned maintenance schedules, including the availability of labour and other impacts of competing projects drawing on the same resources during the same time period.

Additional risks, uncertainties and other factors that could influence the financial and operating performance of all of Suncor’s operating segments and activities include, but are not limited to, changes in general economic, market and business conditions, such as commodity prices, interest rates and currency exchange rates (including as a result of demand and supply effects resulting from the actions of OPEC+ or the impact of changes to U.S. government economic policy); fluctuations in supply and demand for Suncor’s products; the successful and timely implementation of capital projects, including growth projects and regulatory projects; risks associated with the development and execution of Suncor’s projects and the commissioning and integration of new facilities; the possibility that completed maintenance activities may not improve operational performance or the output of related facilities; the risk that projects and initiatives intended to achieve cash flow growth and/or reductions in operating costs may not achieve the expected results in the time anticipated or at all; competitive actions of other companies, including increased competition from other oil and gas companies or from companies that provide alternative sources of energy; labour and material shortages; actions by government authorities, including the imposition or reassessment of, or changes to, taxes, fees, royalties, duties, tariffs, quotas and other government-imposed compliance costs, and mandatory production curtailment orders and changes thereto; changes to laws and government policies that could impact the company’s business, including environmental (including climate change), royalty, tariff and tax laws and policies; the ability and willingness of parties with whom Suncor has material relationships to perform their obligations to the company; the unavailability of, or outages to, third-party infrastructure that could cause disruptions to production or prevent the company from being able to transport its products; the occurrence of a protracted operational outage, a major safety or environmental incident, or unexpected events such as fires (including forest fires), equipment failures and other similar events affecting Suncor or other parties whose operations or assets directly or indirectly affect Suncor; the potential for security breaches of Suncor’s information technology and infrastructure by malicious persons or entities, and the unavailability or failure of such systems to perform as anticipated as a result of such breaches; security threats and terrorist or activist activities; the risk that competing business objectives may exceed Suncor’s capacity to adopt and implement change; risks and uncertainties associated with obtaining regulatory, third-party and stakeholder approvals outside of Suncor’s control for the company’s operations, projects, initiatives, and exploration and development activities and the satisfaction of any conditions to approvals; the potential for disruptions to operations and construction projects as a result of Suncor’s relationships with labour unions that represent employees at the company’s facilities; the company’s ability to find new reserves that can be developed economically; the accuracy of Suncor’s reserves and future production estimates; Suncor’s ability to access capital markets at acceptable rates or to issue other securities at acceptable prices; maintaining an optimal debt to cash flow ratio; the success of the company’s risk management activities using derivatives and other financial instruments; the cost of compliance with current and future environmental laws, including climate change laws; risks relating to increased activism and public opposition to fossil fuels and oil sands; risks and uncertainties associated with closing a transaction for the purchase or sale of a business, asset or oil and gas property, including estimates of the final consideration to be paid or received; the ability of counterparties to comply with their obligations in a timely manner; risks associated with joint arrangements in which the company has an interest; risks associated with land claims and Indigenous consultation requirements; the risk that the company may be subject to litigation; the impact of technology and risks associated with developing and implementing new technologies; and the accuracy of cost estimates, some of which are provided at the conceptual or other preliminary stage of projects and prior to commencement or conception of the detailed engineering that is needed to reduce the margin of error and increase the level of accuracy. The foregoing important factors are not exhaustive.

68 ANNUAL REPORT 2024 SUNCOR ENERGY INC. 


Table of Contents

Many of these risk factors and other assumptions related to Suncor’s forward-looking statements are discussed in further detail throughout this MD&A, including under the heading Risk Factors, and the company’s 2024 AIF and Form 40-F on file with Canadian securities commissions at www.sedarplus.ca and the United States Securities and Exchange Commission at www.sec.gov. Readers are also referred to the risk factors and assumptions described in other documents that Suncor files from time to time with securities regulatory authorities. Copies of these documents are available without charge from the company.

The forward-looking statements contained in this MD&A are made as of the date of this MD&A. Except as required by applicable securities laws, we assume no obligation to update publicly or otherwise revise any forward-looking statements or the foregoing risks and assumptions affecting such forward-looking statements, whether as a result of new information, future events or otherwise.

ANNUAL REPORT 2024 SUNCOR ENERGY INC. 69