(Name, Telephone, E-mail and/or Facsimile number and Address of Company Contact Person)
Securities registered or to be registered pursuant to Section 12(b) of the Act:
Title of each class
Trading symbol(s)
Name of each exchange on which registered
25p ordinary shares*
Not applicable*
New York Stock Exchange*
American Depositary Shares, each representing four 25p ordinary shares
BCS
New York Stock Exchange
3.65% Fixed Rate Senior Notes due 2025
BCS25
New York Stock Exchange
5.25% Fixed Rate Senior Notes due 2045
BCS45
New York Stock Exchange
4.375% Fixed Rate Senior Notes due 2026
BCS26
New York Stock Exchange
5.20% Fixed Rate Subordinated Notes due 2026
BCS26A
New York Stock Exchange
4.337% Fixed Rate Senior Notes due 2028
BCS28
New York Stock Exchange
4.950% Fixed Rate Senior Notes due 2047
BCS47
New York Stock Exchange
4.836% Fixed Rate Subordinated Callable Notes due 2028
BCS28A
New York Stock Exchange
3.250% Fixed Rate Senior Notes due 2033
BCS33
New York Stock Exchange
4.972% Fixed-to-Floating Rate Senior Notes due 2029
BCS29
New York Stock Exchange
5.088% Fixed-to-Floating Rate Subordinated Notes due 2030
BCS30
New York Stock Exchange
2.852% Fixed-to-Floating Rate Senior Notes due 2026
BCS26B
New York Stock Exchange
2.645% Fixed Rate Resetting Senior Callable Notes due 2031
BCS31
New York Stock Exchange
3.564% Fixed Rate Resetting Subordinated Callable Notes due 2035
BCS35
New York Stock Exchange
2.667% Fixed Rate Resetting Senior Callable Notes due 2032
BCS32
New York Stock Exchange
3.811% Fixed Rate Resetting Subordinated Callable Notes due 2042
BCS42
New York Stock Exchange
2.279% Fixed Rate Resetting Senior Callable Notes due 2027
BCS27
New York Stock Exchange
2.894% Fixed Rate Resetting Senior Callable Notes due 2032
BCS32A
New York Stock Exchange
3.330% Fixed Rate Resetting Senior Callable Notes due 2042
BCS42A
New York Stock Exchange
5.304% Fixed Rate Resetting Senior Callable Notes due 2026
BCS26C
New York Stock Exchange
5.501% Fixed Rate Resetting Senior Callable Notes due 2028
BCS28B
New York Stock Exchange
5.746% Fixed Rate Resetting Senior Callable Notes due 2033
BCS33A
New York Stock Exchange
7.325% Fixed Rate Resetting Senior Callable Notes due 2026
BCS26D
New York Stock Exchange
7.385% Fixed Rate Resetting Senior Callable Notes due 2028
BCS28C
New York Stock Exchange
7.437% Fixed Rate Resetting Senior Callable Notes due 2033
BCS33B
New York Stock Exchange
5.829% Fixed-to-Floating Rate Resetting Senior Callable Notes due 2027
BCS27A
New York Stock Exchange
6.224% Fixed-to-Floating Rate Resetting Senior Callable Notes due 2034
BCS34
New York Stock Exchange
7.119% Fixed-to-Floating Rate Subordinated Callable Notes due 2034
BCS34A
New York Stock Exchange
6.496% Fixed-to-Floating Rate Senior Callable Notes due 2027
BCS27B
New York Stock Exchange
6.490% Fixed-to-Floating Rate Senior Callable Notes due 2029
BCS29A
New York Stock Exchange
6.692% Fixed-to-Floating Rate Senior Callable Notes due 2034
BCS34B
New York Stock Exchange
Floating Rate Senior Callable Notes due 2027
BCS27C
New York Stock Exchange
5.674% Fixed-to-Floating Rate Senior Callable Notes due 2028
BCS28D
New York Stock Exchange
5.690% Fixed-to-Floating Rate Senior Callable Notes due 2030
BCS30A
New York Stock Exchange
6.036% Fixed-to-Floating Rate Senior Callable Notes due 2055
BCS55
New York Stock Exchange
Floating Rate Senior Callable Notes due 2028
BCS28E
New York Stock Exchange
4.837% Fixed-to-Floating Rate Senior Callable Notes due 2028
BCS28F
New York Stock Exchange
4.942% Fixed-to-Floating Rate Senior Callable Notes due 2030
BCS30B
New York Stock Exchange
5.335% Fixed-to-Floating Rate Senior Callable Notes due 2035
BCS35A
New York Stock Exchange
* Not for trading, but in connection with the registration of American Depository Shares, pursuant to the requirements to the Securities and Exchange Commission.
Securities registered or to be registered pursuant to Section 12(g) of the Act: None
Securities for which there is a reporting obligation pursuant to Section 15(d) of the Act: None
Indicate the number of outstanding shares of each of the issuer’s classes of capital or common stock as of the close of the period covered by the annual report.
25p ordinary shares
14,419,599,565
Indicate by check mark if the registrant is a well-known seasoned issuer, as defined in Rule 405 of the Securities Act. Yesþ No¨
If this report is an annual or transition report, indicate by check mark if the registrant is not required to file reports pursuant to Section 13 or 15(d) of the Securities Exchange Act of 1934.
Yes¨Noþ
Note – Checking the box above will not relieve any registrant required to file reports pursuant to Section 13 or 15(d) of the Securities Exchange Act of 1934 from their obligations under those Sections.
Indicate by check mark whether the registrant (1) has filed all reports required to be filed by Section 13 or 15(d) of the Securities Exchange Act of 1934 during the preceding 12 months (or for such shorter period that the registrant was required to file such reports), and (2) has been subject to such filing requirements for the past 90 days. Yesþ No¨
Indicate by check mark whether the registrant has submitted electronically every Interactive Data File required to be submitted pursuant to Rule 405 of Regulation S-T (§ 232.405 of this chapter) during the preceding 12 months (or for such shorter period that the registrant was required to submit such files).YesþNo¨
Indicate by check mark whether the registrant is a large accelerated filer, an accelerated filer, a non-accelerated filer, or an emerging growth company. See definition of “large accelerated filer”, “accelerated filer” and “emerging growth company” in Rule 12b-2 of the Exchange Act:
Large Accelerated Filer
þ
Accelerated Filer
¨
Non-Accelerated Filer
¨
Emerging growth company
¨
If an emerging growth company that prepares its financial statements in accordance with U.S. GAAP, indicate by check mark if the registrant has elected not to use the extended transition period for complying with any new or revised financial accounting standards† provided pursuant to Section 13(a) of the Exchange Act. ¨
†The term “new or revised financial accounting standard” refers to any update issued by the Financial Accounting Standards Board to its Accounting Standards Codification after April 5, 2012.
Indicate by check mark whether the registrant has filed a report on and attestation to its management’s assessment of the effectiveness of its internal control over financial reporting under Section 404(b) of the Sarbanes-Oxley Act (15 U.S.C. 7262(b)) by the registered public accounting firm that prepared or issued its audit report. þ
If securities are registered pursuant to Section 12(b) of the Act, indicate by check mark whether the financial statements of the registrant included in the filing reflect the correction of an error to previously issued financial statements.¨
Indicate by check mark whether any of those error corrections are restatements that required a recovery analysis of incentive- based compensation received by any of the registrant's executive officers during the relevant recovery period pursuant to §240.10D-1(b). ¨
*Indicate by check mark which basis of accounting the registrant has used to prepare the financial statements included in this filing:
U.S. GAAP ¨International Financial Reporting Standards as issued by the International Accounting Standards Board þ
Other ¨
*If “Other” has been checked in response to the previous question, indicate by check mark which financial statement item the registrant has elected to follow:
Item 17 ¨
Item 18 ¨
If this is an annual report, indicate by check mark whether the registrant is a shell company (as defined in Rule 12b-2 of the Exchange Act).
Yes¨Noþ
(APPLICABLE ONLY TO ISSUERS INVOLVED IN BANKRUPTCY PROCEEDINGS DURING THE PAST FIVE YEARS)
Indicate by check mark whether the registrant has filed all documents and reports required to be filed by Sections12, 13 or 15(d) of the Securities Exchange Act of 1934 subsequent to the distribution of securities under a plan confirmed by a court.
Yes¨No¨
SEC Form 20-F Cross reference information
Form 20-F item number
Page and caption references in this document*
1
Identity of Directors, Senior Management and Advisers
Not applicable
2
Offer Statistics and Expected Timetable
Not applicable
3
Key Information
A. [Reserved]
B. Capitalization and indebtedness
Not applicable
C. Reason for the offer and use of proceeds
Not applicable
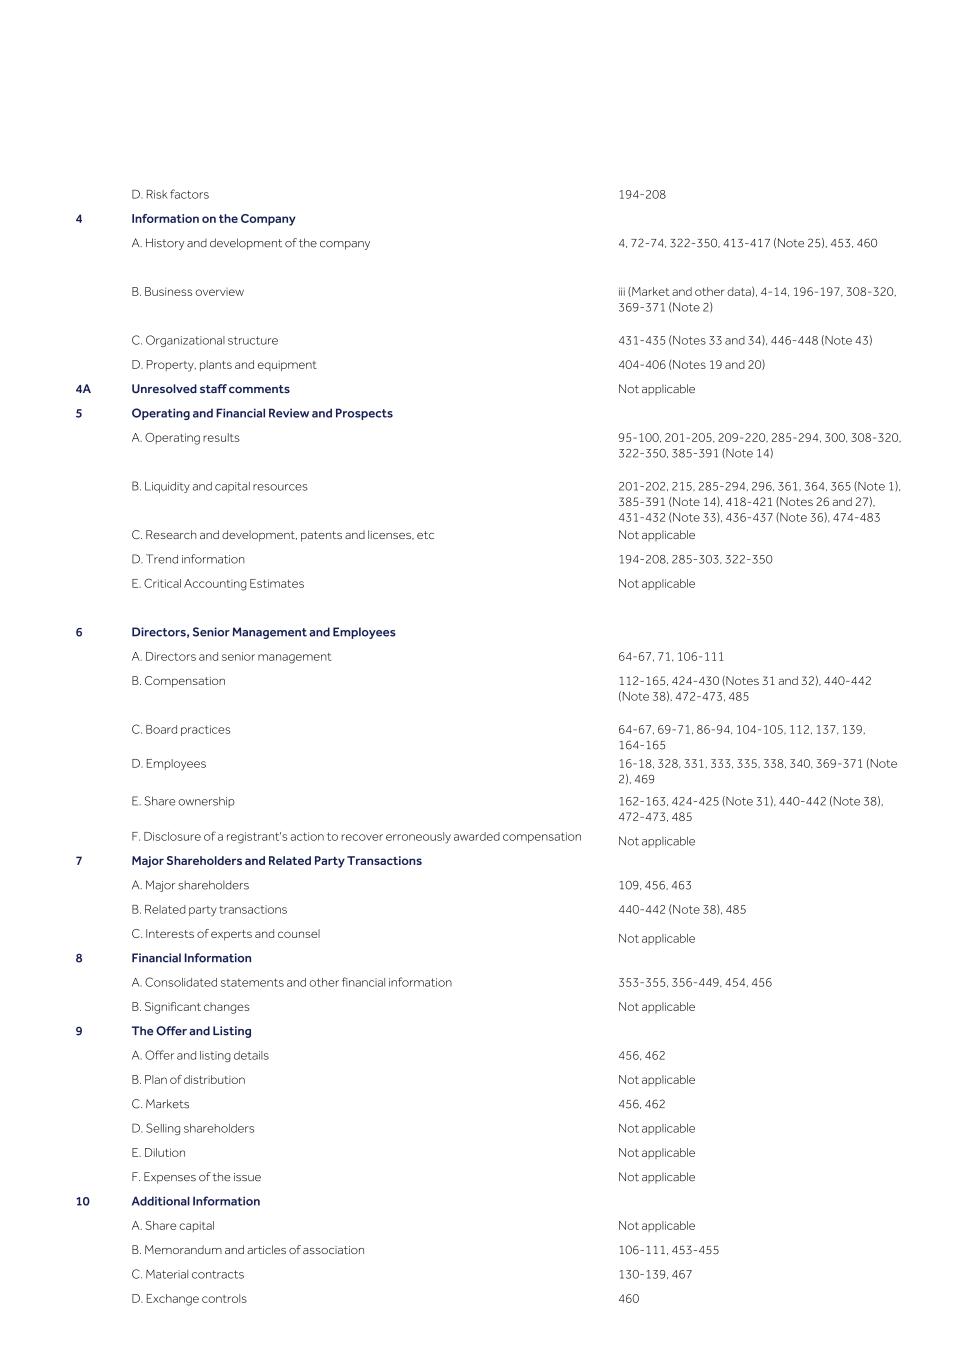
D. Risk factors
194-208
4
Information on the Company
A. History and development of the company
4, 72-74, 322-350, 413-417 (Note 25), 453, 460
B. Business overview
iii (Market and other data), 4-14, 196-197, 308-320, 369-371 (Note 2)
F. Disclosure of a registrant's action to recover erroneously awarded compensation
Not applicable
7
Major Shareholders and Related Party Transactions
A. Major shareholders
109, 456, 463
B. Related party transactions
440-442 (Note 38), 485
C. Interests of experts and counsel
Not applicable
8
Financial Information
A. Consolidated statements and other financial information
353-355, 356-449, 454, 456
B. Significant changes
Not applicable
9
The Offer and Listing
A. Offer and listing details
456, 462
B. Plan of distribution
Not applicable
C. Markets
456, 462
D. Selling shareholders
Not applicable
E. Dilution
Not applicable
F. Expenses of the issue
Not applicable
10
Additional Information
A. Share capital
Not applicable
B. Memorandum and articles of association
106-111, 453-455
C. Material contracts
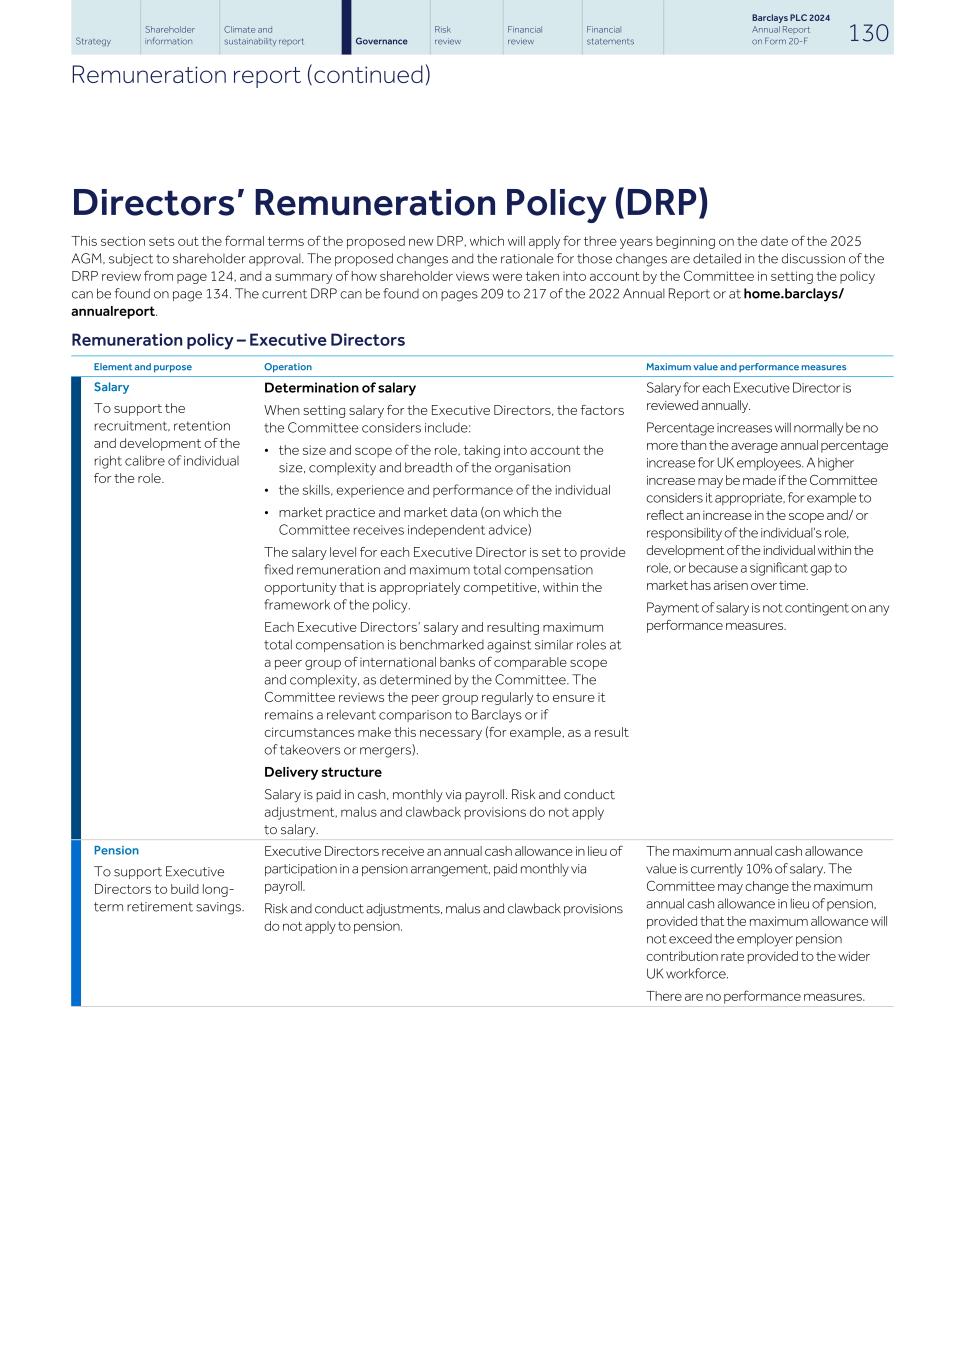
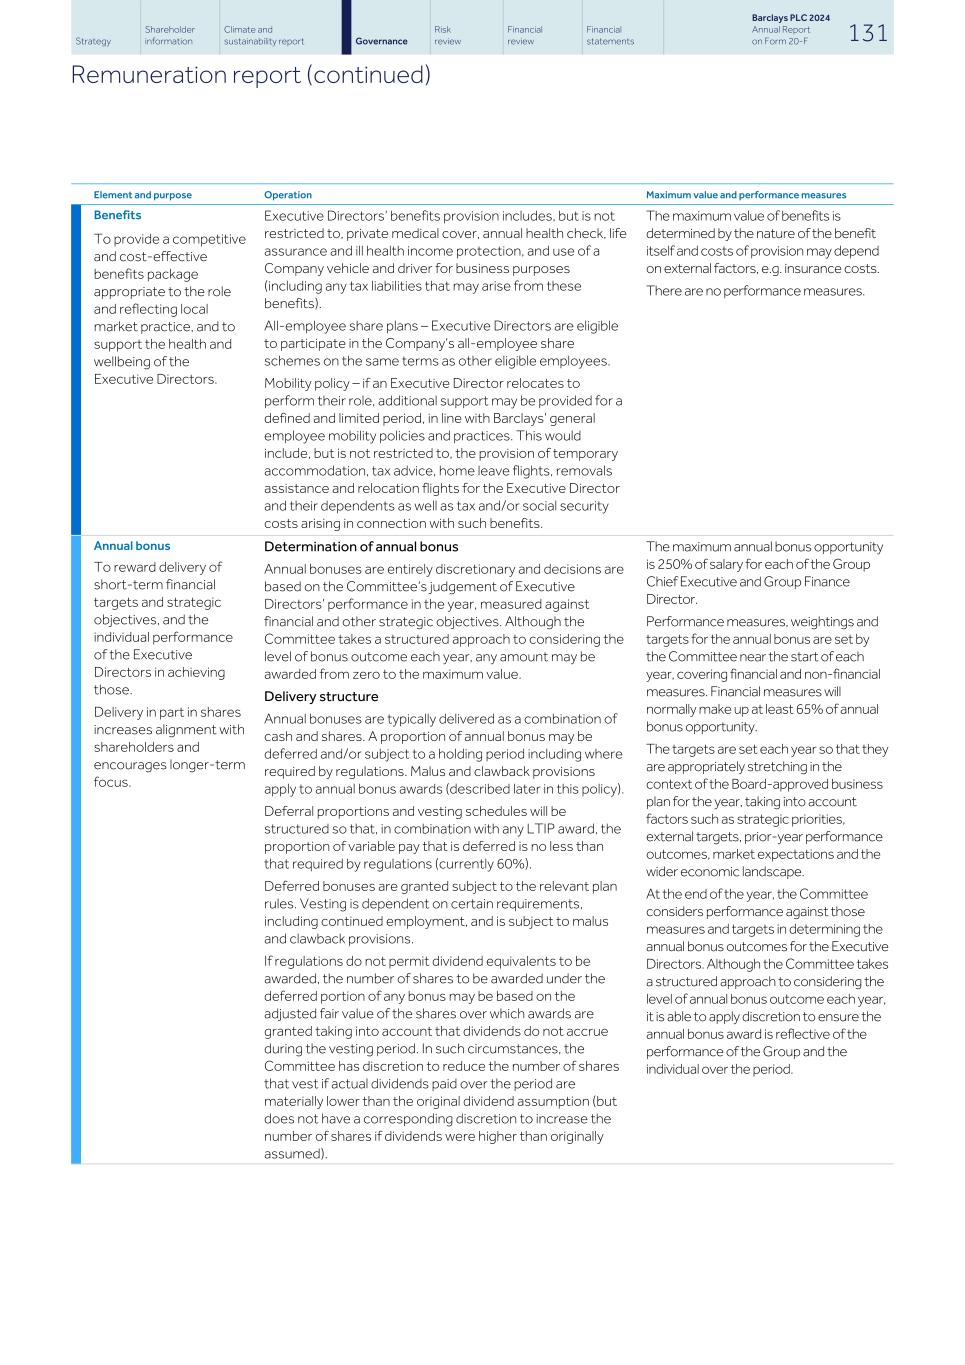
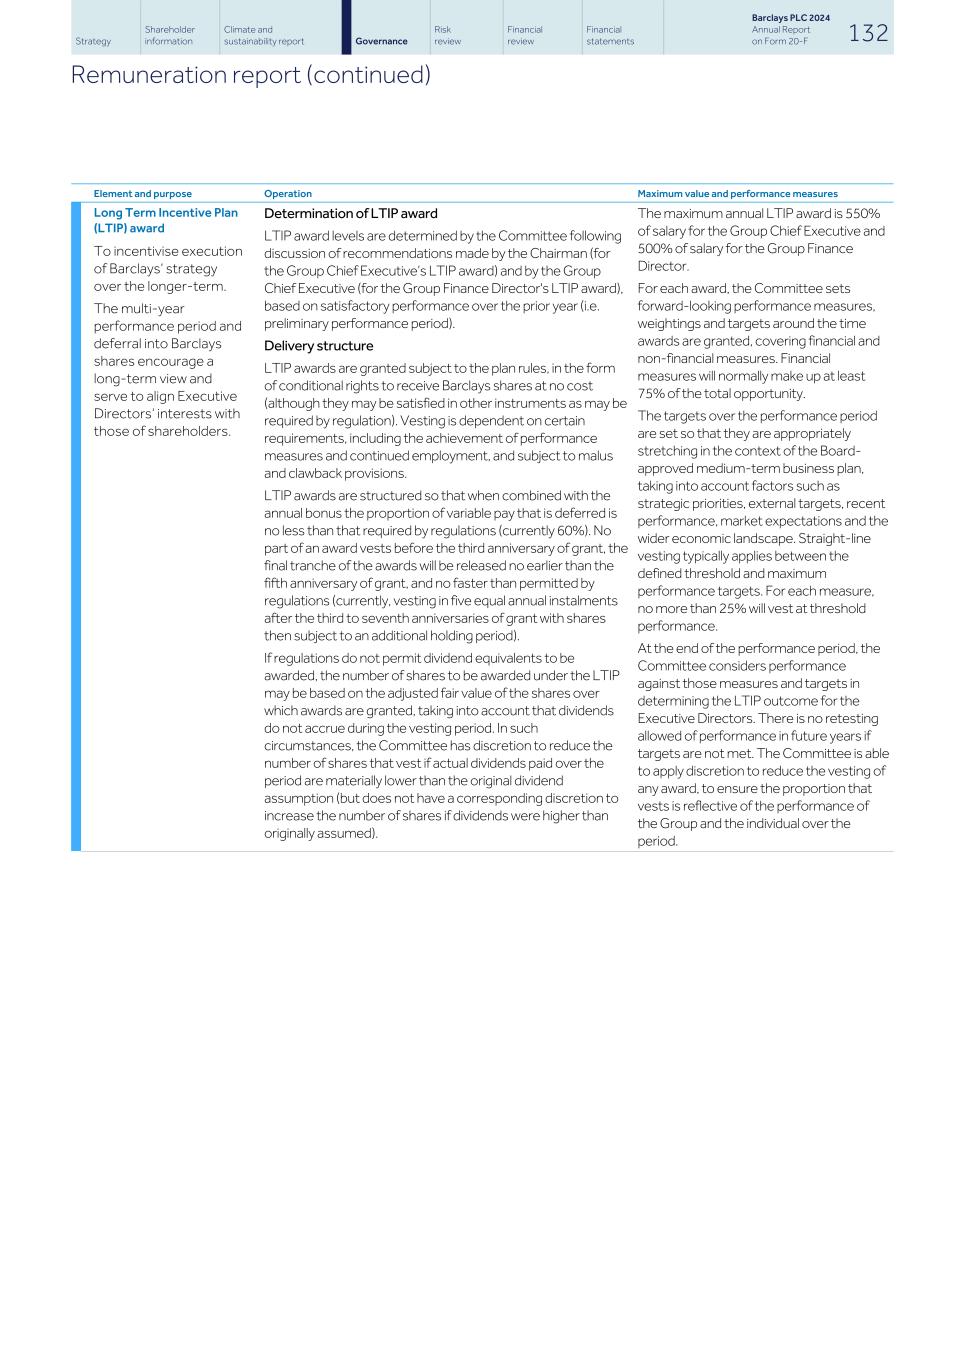
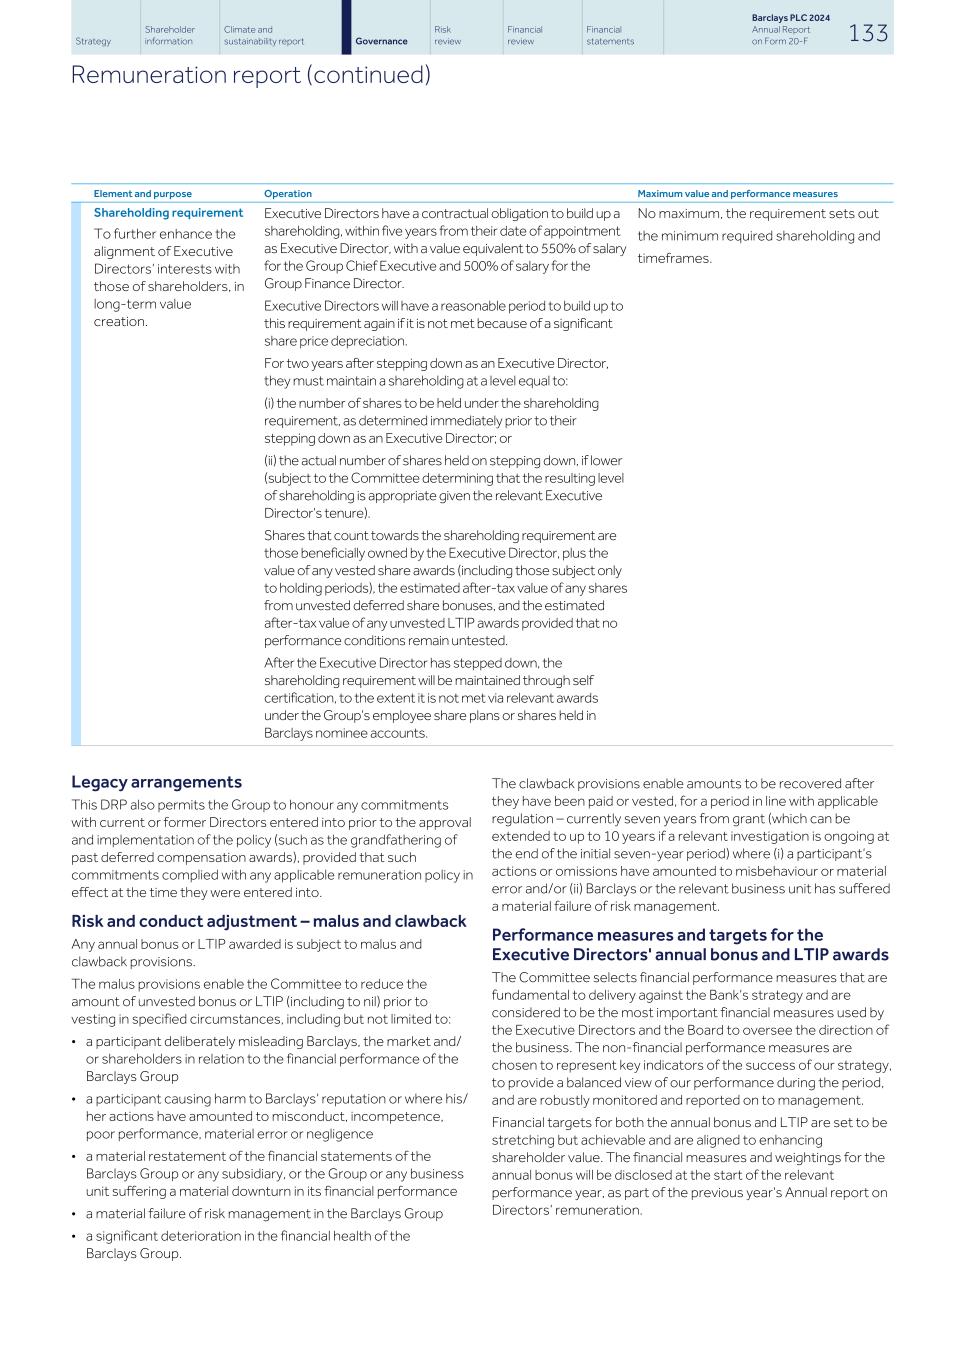
130-139, 467
D. Exchange controls
460
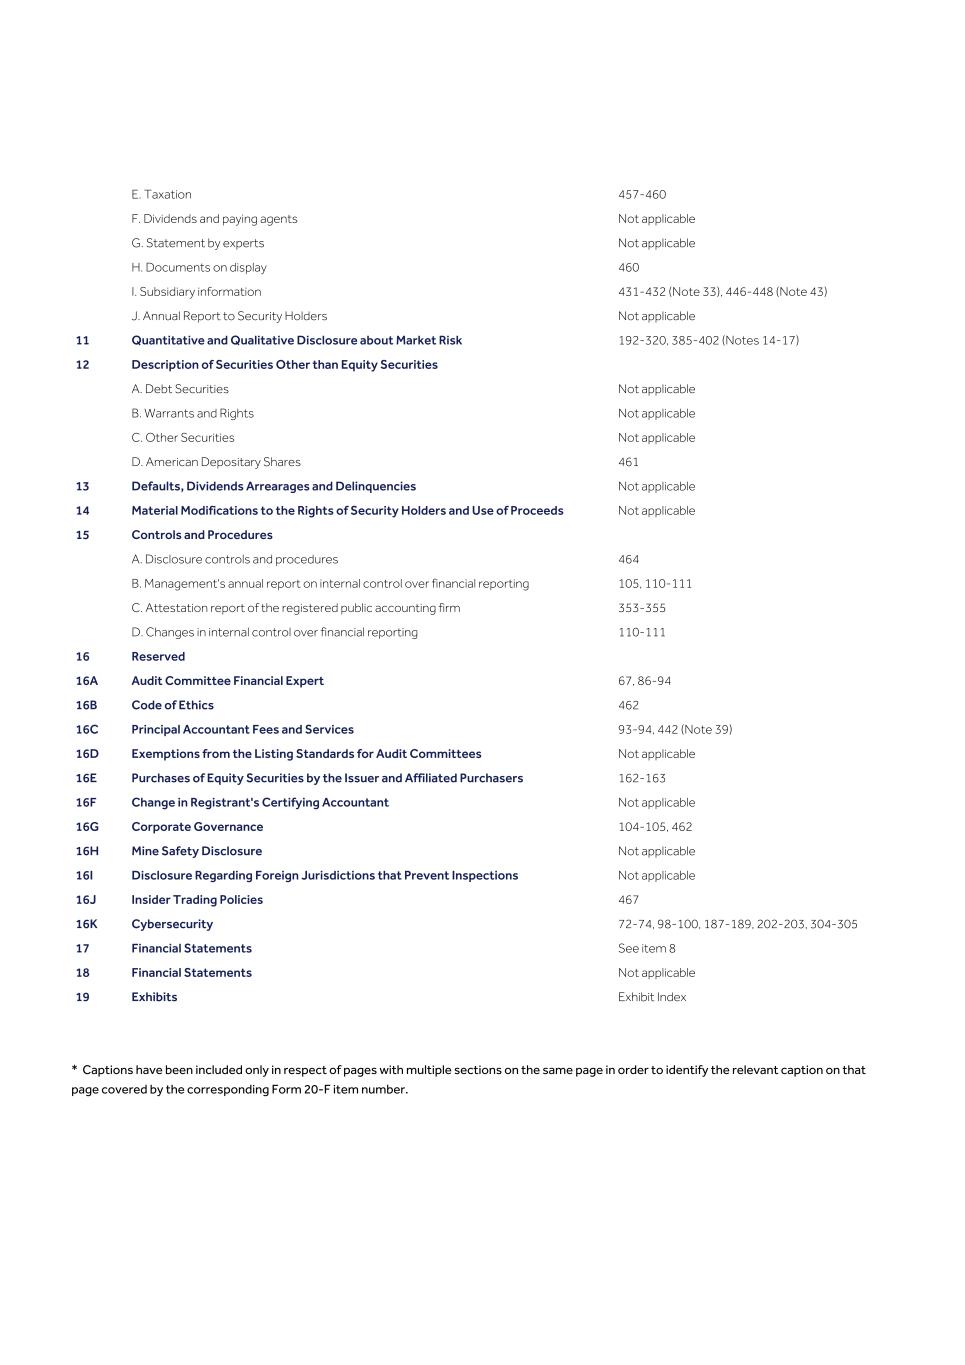
E. Taxation
457-460
F. Dividends and paying agents
Not applicable
G. Statement by experts
Not applicable
H. Documents on display
460
I. Subsidiary information
431-432 (Note 33), 446-448 (Note 43)
J. Annual Report to Security Holders
Not applicable
11
Quantitative and Qualitative Disclosure about Market Risk
192-320, 385-402 (Notes 14-17)
12
Description of Securities Other than Equity Securities
A. Debt Securities
Not applicable
B. Warrants and Rights
Not applicable
C. Other Securities
Not applicable
D. American Depositary Shares
461
13
Defaults, Dividends Arrearages and Delinquencies
Not applicable
14
Material Modifications to the Rights of Security Holders and Use of Proceeds
Not applicable
15
Controls and Procedures
A. Disclosure controls and procedures
464
B. Management's annual report on internal control over financial reporting
105, 110-111
C. Attestation report of the registered public accounting firm
353-355
D. Changes in internal control over financial reporting
110-111
16
Reserved
16A
Audit Committee Financial Expert
67, 86-94
16B
Code of Ethics
462
16C
Principal Accountant Fees and Services
93-94, 442 (Note 39)
16D
Exemptions from the Listing Standards for Audit Committees
Not applicable
16E
Purchases of Equity Securities by the Issuer and Affiliated Purchasers
162-163
16F
Change in Registrant's Certifying Accountant
Not applicable
16G
Corporate Governance
104-105, 462
16H
Mine Safety Disclosure
Not applicable
16I
Disclosure Regarding Foreign Jurisdictions that Prevent Inspections
Not applicable
16J
Insider Trading Policies
467
16K
Cybersecurity
72-74, 98-100, 187-189, 202-203, 304-305
17
Financial Statements
See item 8
18
Financial Statements
Not applicable
19
Exhibits
Exhibit Index
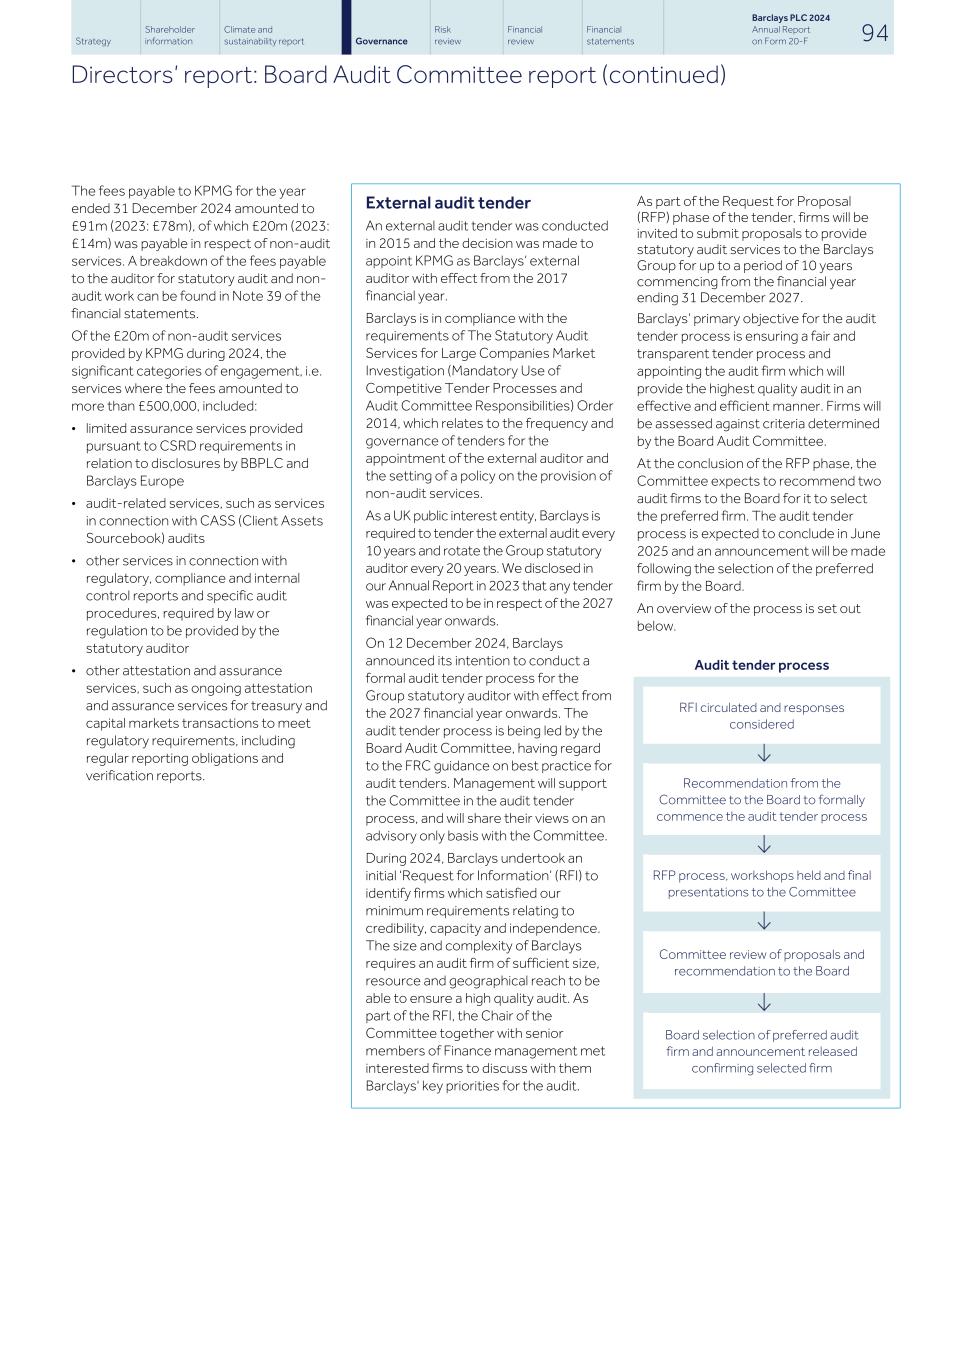
* Captions have been included only in respect of pages with multiple sections on the same page in order to identify the relevant caption on that page covered by the corresponding Form 20-F item number.
2024 Annual Report on Form 20-F
Notes
The terms Barclays or Group refer to Barclays PLC together with its subsidiaries. Unless otherwise stated, the income statement analysis compares the year ended 31 December 2024 to the corresponding twelve months of 2023 and balance sheet analysis as at 31 December 2024 with comparatives relating to 31 December 2023. The abbreviations ‘£m’ and ‘£bn’ represent millions and thousands of millions of Pounds Sterling respectively; the abbreviations ‘$m’ and ‘$bn’ represent millions and thousands of millions of US Dollars respectively; and the abbreviations ‘€m’ and ‘€bn’ represent millions and thousands of millions of Euros respectively.
There are a number of key judgement areas, for example impairment calculations, which are based on models and which are subject to ongoing adjustment and modifications. Reported numbers reflect best estimates and judgements at the given point in time.
Relevant terms that are used in this document but are not defined under applicable regulatory guidance or International Financial Reporting Standards (IFRS) are explained in the results glossary that can be accessed at home.barclays/investor-relations/reports-and-events/latest-financial-results.
Barclays is a frequent issuer in the debt capital markets and regularly meets with investors via formal road-shows and other ad hoc meetings. Consistent with its usual practice, Barclays expects that from time to time over the coming quarter it will meet with investors globally to discuss these results and other matters relating to the Group.
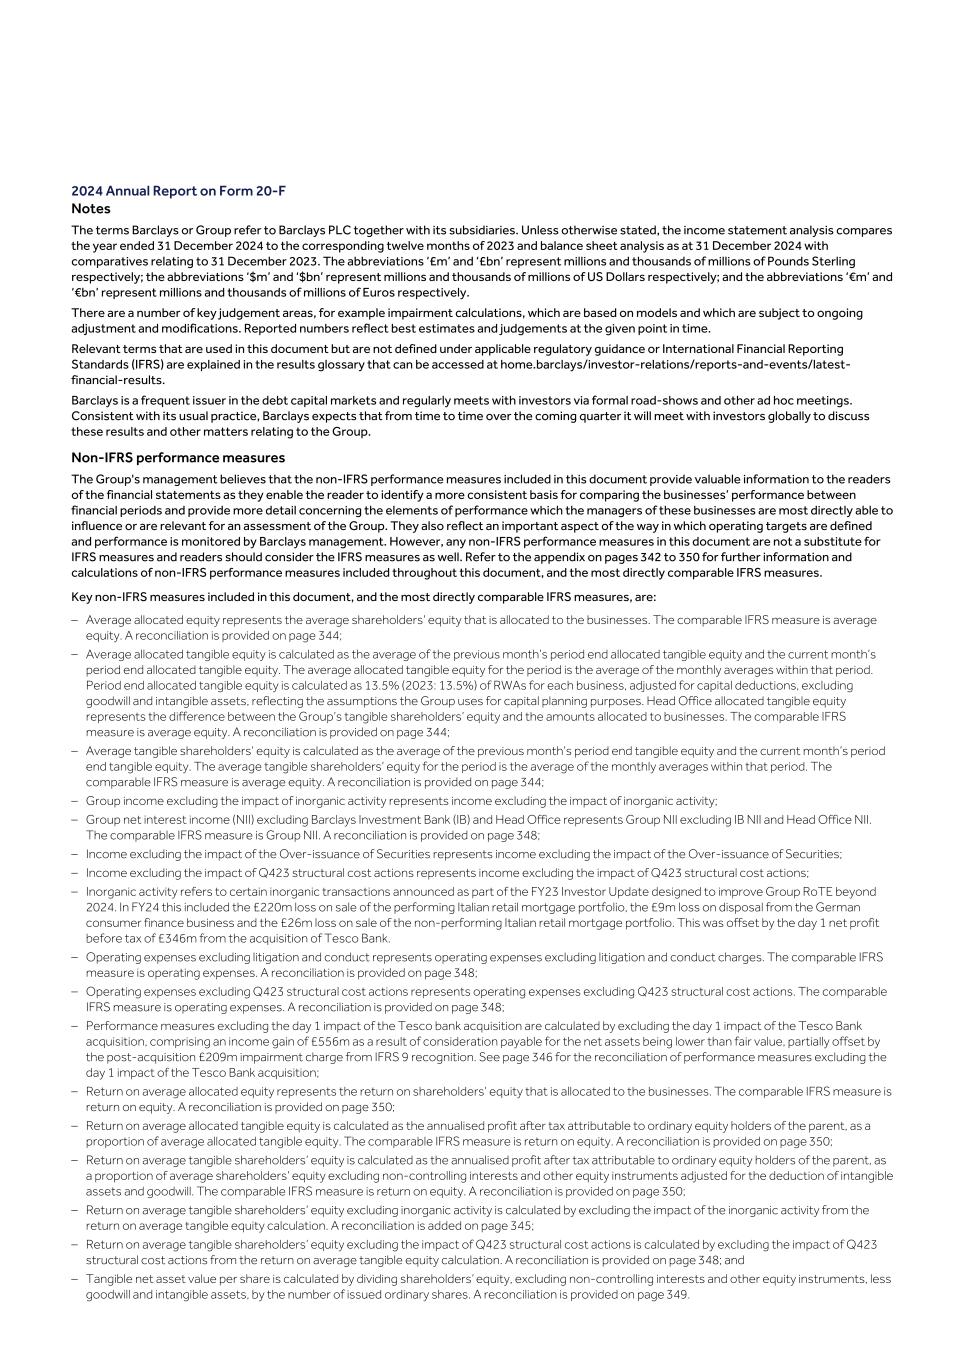
Non-IFRS performance measures
The Group's management believes that the non-IFRS performance measures included in this document provide valuable information to the readers of the financial statements as they enable the reader to identify a more consistent basis for comparing the businesses’ performance between financial periods and provide more detail concerning the elements of performance which the managers of these businesses are most directly able to influence or are relevant for an assessment of the Group. They also reflect an important aspect of the way in which operating targets are defined and performance is monitored by Barclays management. However, any non-IFRS performance measures in this document are not a substitute for IFRS measures and readers should consider the IFRS measures as well. Refer to the appendix on pages 342 to 350 for further information and calculations of non-IFRS performance measures included throughout this document, and the most directly comparable IFRS measures.
Key non-IFRS measures included in this document, and the most directly comparable IFRS measures, are:
–Average allocated equity represents the average shareholders’ equity that is allocated to the businesses. The comparable IFRS measure is average equity. A reconciliation is provided on page 344;
–Average allocated tangible equity is calculated as the average of the previous month’s period end allocated tangible equity and the current month’s period end allocated tangible equity. The average allocated tangible equity for the period is the average of the monthly averages within that period. Period end allocated tangible equity is calculated as 13.5% (2023: 13.5%) of RWAs for each business, adjusted for capital deductions, excluding goodwill and intangible assets, reflecting the assumptions the Group uses for capital planning purposes. Head Office allocated tangible equity represents the difference between the Group’s tangible shareholders’ equity and the amounts allocated to businesses. The comparable IFRS measure is average equity. A reconciliation is provided on page 344;
–Average tangible shareholders’ equity is calculated as the average of the previous month’s period end tangible equity and the current month’s period end tangible equity. The average tangible shareholders’ equity for the period is the average of the monthly averages within that period. The comparable IFRS measure is average equity. A reconciliation is provided on page 344;
–Group income excluding the impact of inorganic activity represents income excluding the impact of inorganic activity;
–Group net interest income (NII) excluding Barclays Investment Bank (IB) and Head Office represents Group NII excluding IB NII and Head Office NII. The comparable IFRS measure is Group NII. A reconciliation is provided on page 348;
–Income excluding the impact of the Over-issuance of Securities represents income excluding the impact of the Over-issuance of Securities;
–Income excluding the impact of Q423 structural cost actions represents income excluding the impact of Q423 structural cost actions;
–Inorganic activity refers to certain inorganic transactions announced as part of the FY23 Investor Update designed to improve Group RoTE beyond 2024. In FY24 this included the £220m loss on sale of the performing Italian retail mortgage portfolio, the £9m loss on disposal from the German consumer finance business and the £26m loss on sale of the non-performing Italian retail mortgage portfolio. This was offset by the day 1 net profit before tax of £346m from the acquisition of Tesco Bank.
–Operating expenses excluding litigation and conduct represents operating expenses excluding litigation and conduct charges. The comparable IFRS measure is operating expenses. A reconciliation is provided on page 348;
–Operating expenses excluding Q423 structural cost actions represents operating expenses excluding Q423 structural cost actions. The comparable IFRS measure is operating expenses. A reconciliation is provided on page 348;
–Performance measures excluding the day 1 impact of the Tesco bank acquisition are calculated by excluding the day 1 impact of the Tesco Bank acquisition, comprising an income gain of £556m as a result of consideration payable for the net assets being lower than fair value, partially offset by the post-acquisition £209m impairment charge from IFRS 9 recognition. See page 345 for the reconciliation of performance measures excluding the day 1 impact of the Tesco Bank acquisition;
–Return on average allocated equity represents the return on shareholders’ equity that is allocated to the businesses. The comparable IFRS measure is return on equity. A reconciliation is provided on page 350;
–Return on average allocated tangible equity is calculated as the annualised profit after tax attributable to ordinary equity holders of the parent, as a proportion of average allocated tangible equity. The comparable IFRS measure is return on equity. A reconciliation is provided on page 350;
–Return on average tangible shareholders’ equity is calculated as the annualised profit after tax attributable to ordinary equity holders of the parent, as a proportion of average shareholders’ equity excluding non-controlling interests and other equity instruments adjusted for the deduction of intangible assets and goodwill. The comparable IFRS measure is return on equity. A reconciliation is provided on page 350;
–Return on average tangible shareholders’ equity excluding inorganic activity is calculated by excluding the impact of the inorganic activity from the return on average tangible equity calculation. A reconciliation is added on page 345;
–Return on average tangible shareholders’ equity excluding the impact of Q423 structural cost actions is calculated by excluding the impact of Q423 structural cost actions from the return on average tangible equity calculation. A reconciliation is provided on page 348; and
–Tangible net asset value per share is calculated by dividing shareholders’ equity, excluding non-controlling interests and other equity instruments, less goodwill and intangible assets, by the number of issued ordinary shares. A reconciliation is provided on page 349.
Forward-looking statements
This document contains certain forward-looking statements within the meaning of Section 21E of the US Securities Exchange Act of 1934, as amended, and Section 27A of the US Securities Act of 1933, as amended, with respect to the Group. Barclays cautions readers that no forward-looking statement is a guarantee of future performance and that actual results or other financial condition or performance measures could differ materially from those contained in the forward-looking statements. Forward-looking statements can be identified by the fact that they do not relate only to historical or current facts. Forward-looking statements sometimes use words such as ‘may’, ‘will’, ‘seek’, ‘continue’, ‘aim’, ‘anticipate’, ‘target’, ‘projected’, ‘expect’, ‘estimate’, ‘intend’, ‘plan’, ‘goal’, ‘believe’, ‘achieve’ or other words of similar meaning. Forward-looking statements can be made in writing but also may be made verbally by directors, officers and employees of the Group (including during management presentations) in connection with this document. Examples of forward-looking statements include, among others, statements or guidance regarding or relating to the Group’s future financial position, business strategy, income levels, costs, assets and liabilities, impairment charges, provisions, capital leverage and other regulatory ratios, capital distributions (including policy on dividends and share buybacks), return on tangible equity, projected levels of growth in banking and financial markets, industry trends, any commitments and targets (including environmental, social and governance (ESG) commitments and targets), plans and objectives for future operations, International Financial Reporting Standards (“IFRS”) and other statements that are not historical or current facts. By their nature, forward-looking statements involve risk and uncertainty because they relate to future events and circumstances. Forward-looking statements speak only as at the date on which they are made. Forward-looking statements may be affected by a number of factors, including, without limitation: changes in legislation, regulations, governmental and regulatory policies, expectations and actions, voluntary codes of practices and the interpretation thereof, changes in IFRS and other accounting standards, including practices with regard to the interpretation and application thereof and emerging and developing ESG reporting standards; the outcome of current and future legal proceedings and regulatory investigations; the Group’s ability along with governments and other stakeholders to measure, manage and mitigate the impacts of climate change effectively or navigate inconsistencies and conflicts in the manner in which climate policy is implemented in the regions where the Group operates, including as a result of the adoption of anti-ESG rules; environmental, social and geopolitical risks and incidents and similar events beyond the Group’s control; financial crime; the impact of competition in the banking and financial services industry; capital, liquidity, leverage and other regulatory rules and requirements applicable to past, current and future periods; UK, US, Eurozone and global macroeconomic and business conditions, including inflation; volatility in credit and capital markets; market related risks such as changes in interest rates and foreign exchange rates; reforms to benchmark interest rates and indices; higher or lower asset valuations; changes in credit ratings of any entity within the Group or any securities issued by it; changes in counterparty risk; changes in consumer behaviour; the direct and indirect consequences of the conflicts in Ukraine and the Middle East on European and global macroeconomic conditions, political stability and financial markets; political elections, including the impact of the UK, European and US elections in 2024; developments in the UK’s relationship with the European Union (EU); the risk of cyberattacks, information or security breaches, technology failures or operational disruptions and any subsequent impact on the Group’s reputation, business or operations; the Group’s ability to access funding; and the success of acquisitions (including the acquisition of Tesco Bank completed in November 2024), disposals and other strategic transactions. A number of these factors are beyond the Group’s control. As a result, the Group’s actual financial position, results, financial and non-financial metrics or performance measures or its ability to meet commitments and targets may differ materially from the statements or guidance set forth in the Group’s forward-looking statements. In setting its targets and outlook for the period 2024-2026, Barclays has made certain assumptions about the macroeconomic environment, including, without limitation, inflation, interest and unemployment rates, the different markets and competitive conditions in which Barclays operates, and its ability to grow certain businesses and achieve costs savings and other structural actions. Additional risks and factors which may impact the Group’s future financial condition and performance are identified in Barclays PLC’s filings with the SEC (including, without limitation, this Barclays PLC Annual Report on Form 20-F for the financial year ended 31 December 2024), which are available on the SEC’s website at www.sec.gov.
Subject to Barclays PLC’s obligations under the applicable laws and regulations of any relevant jurisdiction (including, without limitation, the UK and the US) in relation to disclosure and ongoing information, we undertake no obligation to update publicly or revise any forward-looking statements, whether as a result of new information, future events or otherwise.
Market and other data
This document contains information, including statistical data, about certain Barclays markets and its competitive position. Except as otherwise indicated, this information is taken or derived from Datastream and other external sources. Barclays cannot guarantee the accuracy of information taken from external sources, or that, in respect of internal estimates, a third party using different methods would obtain the same estimates as Barclays.
Uses of Internet addresses
This document contains inactive textual addresses to internet websites operated by us and third parties. Reference to such websites is made for information purposes only, and information found at such websites is not incorporated by reference into this document.
References to Strategic Report and Pillar 3 Report
This document contains references throughout to the Barclays PLC Strategic Report and Pillar 3 Report. References to the aforementioned reports are made for information purposes only, and information found in said reports is not incorporated by reference into this document.
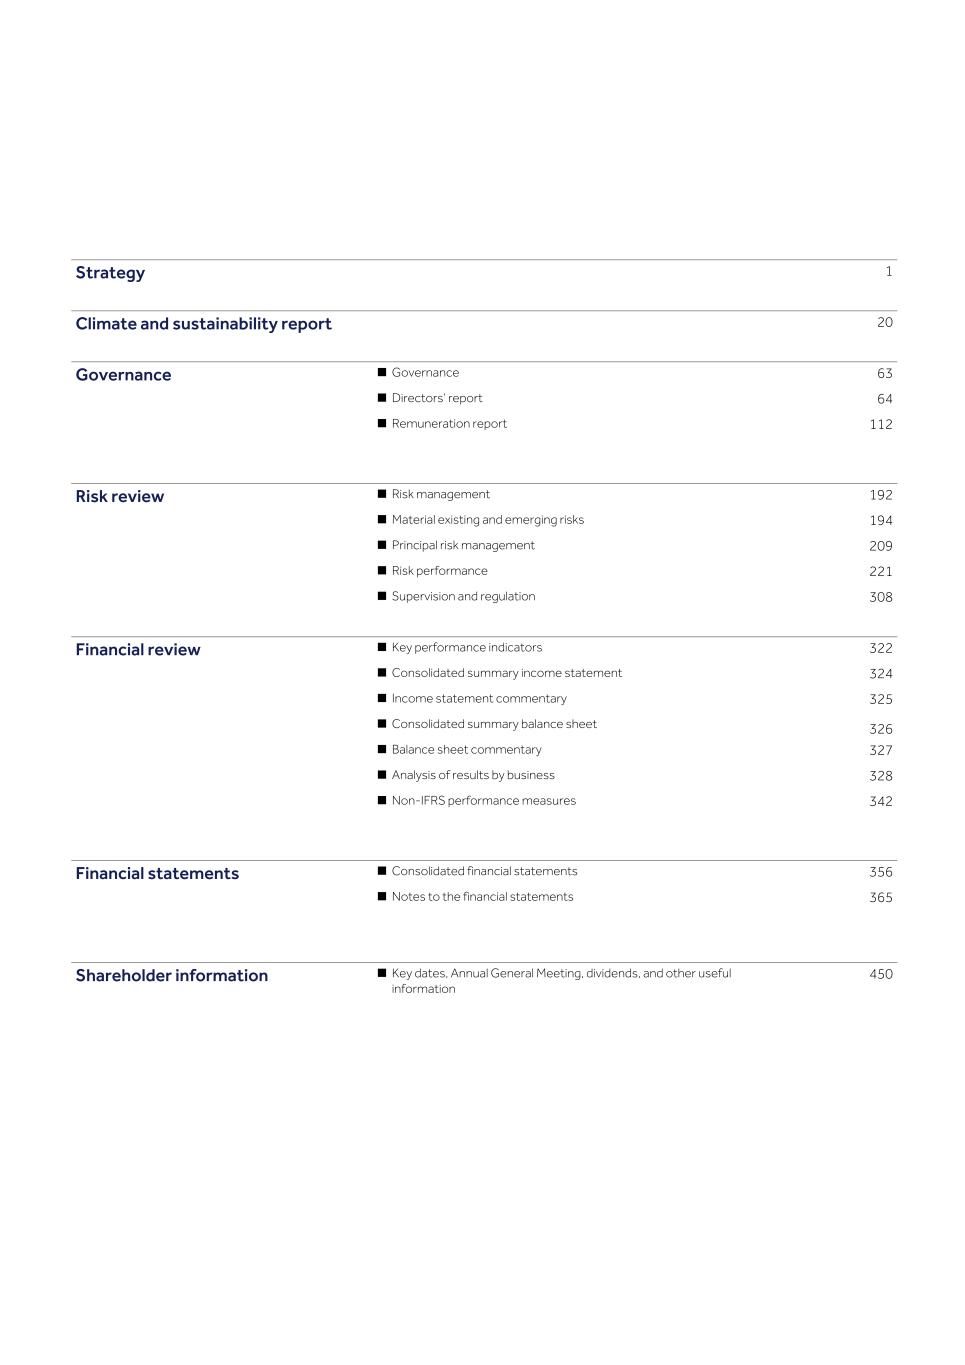
Strategy
1
Climate & Sustainability
20
Governance
■Governance
63
■Directors’ report
64
■Remuneration report
112
Risk review
■Risk review
192
■Material existing and emerging risks
194
■Principal risk management
209
■Risk performance
221
■Supervision and regulation
308
Financial review
■Key performance indicators
322
■Consolidated summary income statement
324
■Income statement commentary
325
■Consolidated summary balance sheet
326
■Balance sheet commentary
327
■Analysis of results by business
328
■Non-IFRS performance measures
342
Financial statements
■Consolidated financial statements
356
■Notes to the financial statements
365
Shareholder information
■Key dates, Annual General Meeting, dividends, and other useful information
450
SECURITIES AND EXCHANGE COMMISSION WASHINGTON, DC 20549 FORM 20-F (Mark One) ¨ REGISTRATION STATEMENT PURSUANT TO SECTION 12(b) OR 12(g) OF THE SECURITIES EXCHANGE ACT OF 1934 OR þ ANNUAL REPORT PURSUANT TO SECTION 13 OR 15(d) OF THE SECURITIES EXCHANGE ACT OF 1934 For the fiscal year ended 31 December 2024 OR ¨ TRANSITION REPORT PURSUANT TO SECTION 13 OR 15(d) OF THE SECURITIES EXCHANGE ACT OF 1934 For the transition period from _______________to _______________ ¨ SHELL COMPANY REPORT PURSUANT TO SECTION 13 OR 15(d) OF THE SECURITIES EXCHANGE ACT OF 1934 Date of event requiring this shell company report _______________ Commission file number Barclays PLC 1-09246 BARCLAYS PLC (Exact Name of Registrant as Specified in its Charter) England (Jurisdiction of Incorporation or Organization) 1 CHURCHILL PLACE, LONDON E14 5HP, England (Address of Principal Executive Offices) KATHRYN ROBERTS, +44 (0)20 7116 3170, KATHRYN.ROBERTS@BARCLAYS.COM 1 CHURCHILL PLACE, LONDON E14 5HP, England (Name, Telephone, E-mail and/or Facsimile number and Address of Company Contact Person) Securities registered or to be registered pursuant to Section 12(b) of the Act: Title of each class Trading symbol(s) Name of each exchange on which registered 25p ordinary shares* Not applicable* New York Stock Exchange* American Depositary Shares, each representing four 25p ordinary shares BCS New York Stock Exchange 3.65% Fixed Rate Senior Notes due 2025 BCS25 New York Stock Exchange 5.25% Fixed Rate Senior Notes due 2045 BCS45 New York Stock Exchange 4.375% Fixed Rate Senior Notes due 2026 BCS26 New York Stock Exchange
5.20% Fixed Rate Subordinated Notes due 2026 BCS26A New York Stock Exchange 4.337% Fixed Rate Senior Notes due 2028 BCS28 New York Stock Exchange 4.950% Fixed Rate Senior Notes due 2047 BCS47 New York Stock Exchange 4.836% Fixed Rate Subordinated Callable Notes due 2028 BCS28A New York Stock Exchange 3.250% Fixed Rate Senior Notes due 2033 BCS33 New York Stock Exchange 4.972% Fixed-to-Floating Rate Senior Notes due 2029 BCS29 New York Stock Exchange 5.088% Fixed-to-Floating Rate Subordinated Notes due 2030 BCS30 New York Stock Exchange 2.852% Fixed-to-Floating Rate Senior Notes due 2026 BCS26B New York Stock Exchange 2.645% Fixed Rate Resetting Senior Callable Notes due 2031 BCS31 New York Stock Exchange 3.564% Fixed Rate Resetting Subordinated Callable Notes due 2035 BCS35 New York Stock Exchange 2.667% Fixed Rate Resetting Senior Callable Notes due 2032 BCS32 New York Stock Exchange 3.811% Fixed Rate Resetting Subordinated Callable Notes due 2042 BCS42 New York Stock Exchange 2.279% Fixed Rate Resetting Senior Callable Notes due 2027 BCS27 New York Stock Exchange 2.894% Fixed Rate Resetting Senior Callable Notes due 2032 BCS32A New York Stock Exchange 3.330% Fixed Rate Resetting Senior Callable Notes due 2042 BCS42A New York Stock Exchange 5.304% Fixed Rate Resetting Senior Callable Notes due 2026 BCS26C New York Stock Exchange 5.501% Fixed Rate Resetting Senior Callable Notes due 2028 BCS28B New York Stock Exchange 5.746% Fixed Rate Resetting Senior Callable Notes due 2033 BCS33A New York Stock Exchange 7.325% Fixed Rate Resetting Senior Callable Notes due 2026 BCS26D New York Stock Exchange 7.385% Fixed Rate Resetting Senior Callable Notes due 2028 BCS28C New York Stock Exchange 7.437% Fixed Rate Resetting Senior Callable Notes due 2033 BCS33B New York Stock Exchange 5.829% Fixed-to-Floating Rate Resetting Senior Callable Notes due 2027 BCS27A New York Stock Exchange 6.224% Fixed-to-Floating Rate Resetting Senior Callable Notes due 2034 BCS34 New York Stock Exchange 7.119% Fixed-to-Floating Rate Subordinated Callable Notes due 2034 BCS34A New York Stock Exchange 6.496% Fixed-to-Floating Rate Senior Callable Notes due 2027 BCS27B New York Stock Exchange
6.490% Fixed-to-Floating Rate Senior Callable Notes due 2029 BCS29A New York Stock Exchange 6.692% Fixed-to-Floating Rate Senior Callable Notes due 2034 BCS34B New York Stock Exchange Floating Rate Senior Callable Notes due 2027 BCS27C New York Stock Exchange 5.674% Fixed-to-Floating Rate Senior Callable Notes due 2028 BCS28D New York Stock Exchange 5.690% Fixed-to-Floating Rate Senior Callable Notes due 2030 BCS30A New York Stock Exchange 6.036% Fixed-to-Floating Rate Senior Callable Notes due 2055 BCS55 New York Stock Exchange Floating Rate Senior Callable Notes due 2028 BCS28E New York Stock Exchange 4.837% Fixed-to-Floating Rate Senior Callable Notes due 2028 BCS28F New York Stock Exchange 4.942% Fixed-to-Floating Rate Senior Callable Notes due 2030 BCS30B New York Stock Exchange 5.335% Fixed-to-Floating Rate Senior Callable Notes due 2035 BCS35A New York Stock Exchange * Not for trading, but in connection with the registration of American Depository Shares, pursuant to the requirements to the Securities and Exchange Commission. Securities registered or to be registered pursuant to Section 12(g) of the Act: None Securities for which there is a reporting obligation pursuant to Section 15(d) of the Act: None Indicate the number of outstanding shares of each of the issuer’s classes of capital or common stock as of the close of the period covered by the annual report. 25p ordinary shares 14,419,599,565 Indicate by check mark if the registrant is a well-known seasoned issuer, as defined in Rule 405 of the Securities Act. Yes þ No ¨ If this report is an annual or transition report, indicate by check mark if the registrant is not required to file reports pursuant to Section 13 or 15(d) of the Securities Exchange Act of 1934. Yes ¨ No þ Note – Checking the box above will not relieve any registrant required to file reports pursuant to Section 13 or 15(d) of the Securities Exchange Act of 1934 from their obligations under those Sections. Indicate by check mark whether the registrant (1) has filed all reports required to be filed by Section 13 or 15(d) of the Securities Exchange Act of 1934 during the preceding 12 months (or for such shorter period that the registrant was required to file such reports), and (2) has been subject to such filing requirements for the past 90 days. Yes þ No ¨ Indicate by check mark whether the registrant has submitted electronically every Interactive Data File required to be submitted pursuant to Rule 405 of Regulation S-T (§ 232.405 of this chapter) during the preceding 12 months (or for such shorter period that the registrant was required to submit such files). Yes þ No ¨
Indicate by check mark whether the registrant is a large accelerated filer, an accelerated filer, a non-accelerated filer, or an emerging growth company. See definition of “large accelerated filer”, “accelerated filer” and “emerging growth company” in Rule 12b-2 of the Exchange Act: Large Accelerated Filer þ Accelerated Filer ¨ Non-Accelerated Filer ¨ Emerging growth company ¨ If an emerging growth company that prepares its financial statements in accordance with U.S. GAAP, indicate by check mark if the registrant has elected not to use the extended transition period for complying with any new or revised financial accounting standards† provided pursuant to Section 13(a) of the Exchange Act. ̈ † The term “new or revised financial accounting standard” refers to any update issued by the Financial Accounting Standards Board to its Accounting Standards Codification after April 5, 2012. Indicate by check mark whether the registrant has filed a report on and attestation to its management’s assessment of the effectiveness of its internal control over financial reporting under Section 404(b) of the Sarbanes-Oxley Act (15 U.S.C. 7262(b)) by the registered public accounting firm that prepared or issued its audit report. þ If securities are registered pursuant to Section 12(b) of the Act, indicate by check mark whether the financial statements of the registrant included in the filing reflect the correction of an error to previously issued financial statements.̈ Indicate by check mark whether any of those error corrections are restatements that required a recovery analysis of incentive- based compensation received by any of the registrant's executive officers during the relevant recovery period pursuant to §240.10D-1(b). ̈ *Indicate by check mark which basis of accounting the registrant has used to prepare the financial statements included in this filing: U.S. GAAP ¨ International Financial Reporting Standards as issued by the International Accounting Standards Board þ Other ¨ *If “Other” has been checked in response to the previous question, indicate by check mark which financial statement item the registrant has elected to follow: Item 17 ¨ Item 18 ¨ If this is an annual report, indicate by check mark whether the registrant is a shell company (as defined in Rule 12b-2 of the Exchange Act). Yes ¨ No þ (APPLICABLE ONLY TO ISSUERS INVOLVED IN BANKRUPTCY PROCEEDINGS DURING THE PAST FIVE YEARS) Indicate by check mark whether the registrant has filed all documents and reports required to be filed by Sections12, 13 or 15(d) of the Securities Exchange Act of 1934 subsequent to the distribution of securities under a plan confirmed by a court. Yes ¨ No ¨ SEC Form 20-F Cross reference information Form 20-F item number Page and caption references in this document* 1 Identity of Directors, Senior Management and Advisers Not applicable 2 Offer Statistics and Expected Timetable Not applicable 3 Key Information A. [Reserved] B. Capitalization and indebtedness Not applicable C. Reason for the offer and use of proceeds Not applicable
D. Risk factors 194-208 4 Information on the Company A. History and development of the company 4, 72-74, 322-350, 413-417 (Note 25), 453, 460 B. Business overview iii (Market and other data), 4-14, 196-197, 308-320, 369-371 (Note 2) C. Organizational structure 431-435 (Notes 33 and 34), 446-448 (Note 43) D. Property, plants and equipment 404-406 (Notes 19 and 20) 4A Unresolved staff comments Not applicable 5 Operating and Financial Review and Prospects A. Operating results 95-100, 201-205, 209-220, 285-294, 300, 308-320, 322-350, 385-391 (Note 14) B. Liquidity and capital resources 201-202, 215, 285-294, 296, 361, 364, 365 (Note 1), 385-391 (Note 14), 418-421 (Notes 26 and 27), 431-432 (Note 33), 436-437 (Note 36), 474-483 C. Research and development, patents and licenses, etc Not applicable D. Trend information 194-208, 285-303, 322-350 E. Critical Accounting Estimates Not applicable 6 Directors, Senior Management and Employees A. Directors and senior management 64-67, 71, 106-111 B. Compensation 112-165, 424-430 (Notes 31 and 32), 440-442 (Note 38), 472-473, 485 C. Board practices 64-67, 69-71, 86-94, 104-105, 112, 137, 139, 164-165 D. Employees 16-18, 328, 331, 333, 335, 338, 340, 369-371 (Note 2), 469 E. Share ownership 162-163, 424-425 (Note 31), 440-442 (Note 38), 472-473, 485 F. Disclosure of a registrant's action to recover erroneously awarded compensation Not applicable 7 Major Shareholders and Related Party Transactions A. Major shareholders 109, 456, 463 B. Related party transactions 440-442 (Note 38), 485 C. Interests of experts and counsel Not applicable 8 Financial Information A. Consolidated statements and other financial information 353-355, 356-449, 454, 456 B. Significant changes Not applicable 9 The Offer and Listing A. Offer and listing details 456, 462 B. Plan of distribution Not applicable C. Markets 456, 462 D. Selling shareholders Not applicable E. Dilution Not applicable F. Expenses of the issue Not applicable 10 Additional Information A. Share capital Not applicable B. Memorandum and articles of association 106-111, 453-455 C. Material contracts 130-139, 467 D. Exchange controls 460
E. Taxation 457-460 F. Dividends and paying agents Not applicable G. Statement by experts Not applicable H. Documents on display 460 I. Subsidiary information 431-432 (Note 33), 446-448 (Note 43) J. Annual Report to Security Holders Not applicable 11 Quantitative and Qualitative Disclosure about Market Risk 192-320, 385-402 (Notes 14-17) 12 Description of Securities Other than Equity Securities A. Debt Securities Not applicable B. Warrants and Rights Not applicable C. Other Securities Not applicable D. American Depositary Shares 461 13 Defaults, Dividends Arrearages and Delinquencies Not applicable 14 Material Modifications to the Rights of Security Holders and Use of Proceeds Not applicable 15 Controls and Procedures A. Disclosure controls and procedures 464 B. Management's annual report on internal control over financial reporting 105, 110-111 C. Attestation report of the registered public accounting firm 353-355 D. Changes in internal control over financial reporting 110-111 16 Reserved 16A Audit Committee Financial Expert 67, 86-94 16B Code of Ethics 462 16C Principal Accountant Fees and Services 93-94, 442 (Note 39) 16D Exemptions from the Listing Standards for Audit Committees Not applicable 16E Purchases of Equity Securities by the Issuer and Affiliated Purchasers 162-163 16F Change in Registrant's Certifying Accountant Not applicable 16G Corporate Governance 104-105, 462 16H Mine Safety Disclosure Not applicable 16I Disclosure Regarding Foreign Jurisdictions that Prevent Inspections Not applicable 16J Insider Trading Policies 467 16K Cybersecurity 72-74, 98-100, 187-189, 202-203, 304-305 17 Financial Statements See item 8 18 Financial Statements Not applicable 19 Exhibits Exhibit Index * Captions have been included only in respect of pages with multiple sections on the same page in order to identify the relevant caption on that page covered by the corresponding Form 20-F item number.
2024 Annual Report on Form 20-F Notes The terms Barclays or Group refer to Barclays PLC together with its subsidiaries. Unless otherwise stated, the income statement analysis compares the year ended 31 December 2024 to the corresponding twelve months of 2023 and balance sheet analysis as at 31 December 2024 with comparatives relating to 31 December 2023. The abbreviations ‘£m’ and ‘£bn’ represent millions and thousands of millions of Pounds Sterling respectively; the abbreviations ‘$m’ and ‘$bn’ represent millions and thousands of millions of US Dollars respectively; and the abbreviations ‘€m’ and ‘€bn’ represent millions and thousands of millions of Euros respectively. There are a number of key judgement areas, for example impairment calculations, which are based on models and which are subject to ongoing adjustment and modifications. Reported numbers reflect best estimates and judgements at the given point in time. Relevant terms that are used in this document but are not defined under applicable regulatory guidance or International Financial Reporting Standards (IFRS) are explained in the results glossary that can be accessed at home.barclays/investor-relations/reports-and-events/latest- financial-results. Barclays is a frequent issuer in the debt capital markets and regularly meets with investors via formal road-shows and other ad hoc meetings. Consistent with its usual practice, Barclays expects that from time to time over the coming quarter it will meet with investors globally to discuss these results and other matters relating to the Group. Non-IFRS performance measures The Group's management believes that the non-IFRS performance measures included in this document provide valuable information to the readers of the financial statements as they enable the reader to identify a more consistent basis for comparing the businesses’ performance between financial periods and provide more detail concerning the elements of performance which the managers of these businesses are most directly able to influence or are relevant for an assessment of the Group. They also reflect an important aspect of the way in which operating targets are defined and performance is monitored by Barclays management. However, any non-IFRS performance measures in this document are not a substitute for IFRS measures and readers should consider the IFRS measures as well. Refer to the appendix on pages 342 to 350 for further information and calculations of non-IFRS performance measures included throughout this document, and the most directly comparable IFRS measures. Key non-IFRS measures included in this document, and the most directly comparable IFRS measures, are: – Average allocated equity represents the average shareholders’ equity that is allocated to the businesses. The comparable IFRS measure is average equity. A reconciliation is provided on page 344; – Average allocated tangible equity is calculated as the average of the previous month’s period end allocated tangible equity and the current month’s period end allocated tangible equity. The average allocated tangible equity for the period is the average of the monthly averages within that period. Period end allocated tangible equity is calculated as 13.5% (2023: 13.5%) of RWAs for each business, adjusted for capital deductions, excluding goodwill and intangible assets, reflecting the assumptions the Group uses for capital planning purposes. Head Office allocated tangible equity represents the difference between the Group’s tangible shareholders’ equity and the amounts allocated to businesses. The comparable IFRS measure is average equity. A reconciliation is provided on page 344; – Average tangible shareholders’ equity is calculated as the average of the previous month’s period end tangible equity and the current month’s period end tangible equity. The average tangible shareholders’ equity for the period is the average of the monthly averages within that period. The comparable IFRS measure is average equity. A reconciliation is provided on page 344; – Group income excluding the impact of inorganic activity represents income excluding the impact of inorganic activity; – Group net interest income (NII) excluding Barclays Investment Bank (IB) and Head Office represents Group NII excluding IB NII and Head Office NII. The comparable IFRS measure is Group NII. A reconciliation is provided on page 348; – Income excluding the impact of the Over-issuance of Securities represents income excluding the impact of the Over-issuance of Securities; – Income excluding the impact of Q423 structural cost actions represents income excluding the impact of Q423 structural cost actions; – Inorganic activity refers to certain inorganic transactions announced as part of the FY23 Investor Update designed to improve Group RoTE beyond 2024. In FY24 this included the £220m loss on sale of the performing Italian retail mortgage portfolio, the £9m loss on disposal from the German consumer finance business and the £26m loss on sale of the non-performing Italian retail mortgage portfolio. This was offset by the day 1 net profit before tax of £346m from the acquisition of Tesco Bank. – Operating expenses excluding litigation and conduct represents operating expenses excluding litigation and conduct charges. The comparable IFRS measure is operating expenses. A reconciliation is provided on page 348; – Operating expenses excluding Q423 structural cost actions represents operating expenses excluding Q423 structural cost actions. The comparable IFRS measure is operating expenses. A reconciliation is provided on page 348; – Performance measures excluding the day 1 impact of the Tesco bank acquisition are calculated by excluding the day 1 impact of the Tesco Bank acquisition, comprising an income gain of £556m as a result of consideration payable for the net assets being lower than fair value, partially offset by the post-acquisition £209m impairment charge from IFRS 9 recognition. See page 346 for the reconciliation of performance measures excluding the day 1 impact of the Tesco Bank acquisition; – Return on average allocated equity represents the return on shareholders’ equity that is allocated to the businesses. The comparable IFRS measure is return on equity. A reconciliation is provided on page 350; – Return on average allocated tangible equity is calculated as the annualised profit after tax attributable to ordinary equity holders of the parent, as a proportion of average allocated tangible equity. The comparable IFRS measure is return on equity. A reconciliation is provided on page 350; – Return on average tangible shareholders’ equity is calculated as the annualised profit after tax attributable to ordinary equity holders of the parent, as a proportion of average shareholders’ equity excluding non-controlling interests and other equity instruments adjusted for the deduction of intangible assets and goodwill. The comparable IFRS measure is return on equity. A reconciliation is provided on page 350; – Return on average tangible shareholders’ equity excluding inorganic activity is calculated by excluding the impact of the inorganic activity from the return on average tangible equity calculation. A reconciliation is added on page 345; – Return on average tangible shareholders’ equity excluding the impact of Q423 structural cost actions is calculated by excluding the impact of Q423 structural cost actions from the return on average tangible equity calculation. A reconciliation is provided on page 348; and – Tangible net asset value per share is calculated by dividing shareholders’ equity, excluding non-controlling interests and other equity instruments, less goodwill and intangible assets, by the number of issued ordinary shares. A reconciliation is provided on page 349.
Forward-looking statements This document contains certain forward-looking statements within the meaning of Section 21E of the US Securities Exchange Act of 1934, as amended, and Section 27A of the US Securities Act of 1933, as amended, with respect to the Group. Barclays cautions readers that no forward- looking statement is a guarantee of future performance and that actual results or other financial condition or performance measures could differ materially from those contained in the forward-looking statements. Forward-looking statements can be identified by the fact that they do not relate only to historical or current facts. Forward-looking statements sometimes use words such as ‘may’, ‘will’, ‘seek’, ‘continue’, ‘aim’, ‘anticipate’, ‘target’, ‘projected’, ‘expect’, ‘estimate’, ‘intend’, ‘plan’, ‘goal’, ‘believe’, ‘achieve’ or other words of similar meaning. Forward-looking statements can be made in writing but also may be made verbally by directors, officers and employees of the Group (including during management presentations) in connection with this document. Examples of forward-looking statements include, among others, statements or guidance regarding or relating to the Group’s future financial position, business strategy, income levels, costs, assets and liabilities, impairment charges, provisions, capital leverage and other regulatory ratios, capital distributions (including policy on dividends and share buybacks), return on tangible equity, projected levels of growth in banking and financial markets, industry trends, any commitments and targets (including environmental, social and governance (ESG) commitments and targets), plans and objectives for future operations, International Financial Reporting Standards (“IFRS”) and other statements that are not historical or current facts. By their nature, forward-looking statements involve risk and uncertainty because they relate to future events and circumstances. Forward-looking statements speak only as at the date on which they are made. Forward-looking statements may be affected by a number of factors, including, without limitation: changes in legislation, regulations, governmental and regulatory policies, expectations and actions, voluntary codes of practices and the interpretation thereof, changes in IFRS and other accounting standards, including practices with regard to the interpretation and application thereof and emerging and developing ESG reporting standards; the outcome of current and future legal proceedings and regulatory investigations; the Group’s ability along with governments and other stakeholders to measure, manage and mitigate the impacts of climate change effectively or navigate inconsistencies and conflicts in the manner in which climate policy is implemented in the regions where the Group operates, including as a result of the adoption of anti-ESG rules; environmental, social and geopolitical risks and incidents and similar events beyond the Group’s control; financial crime; the impact of competition in the banking and financial services industry; capital, liquidity, leverage and other regulatory rules and requirements applicable to past, current and future periods; UK, US, Eurozone and global macroeconomic and business conditions, including inflation; volatility in credit and capital markets; market related risks such as changes in interest rates and foreign exchange rates; reforms to benchmark interest rates and indices; higher or lower asset valuations; changes in credit ratings of any entity within the Group or any securities issued by it; changes in counterparty risk; changes in consumer behaviour; the direct and indirect consequences of the conflicts in Ukraine and the Middle East on European and global macroeconomic conditions, political stability and financial markets; political elections, including the impact of the UK, European and US elections in 2024; developments in the UK’s relationship with the European Union (EU); the risk of cyberattacks, information or security breaches, technology failures or operational disruptions and any subsequent impact on the Group’s reputation, business or operations; the Group’s ability to access funding; and the success of acquisitions (including the acquisition of Tesco Bank completed in November 2024), disposals and other strategic transactions. A number of these factors are beyond the Group’s control. As a result, the Group’s actual financial position, results, financial and non-financial metrics or performance measures or its ability to meet commitments and targets may differ materially from the statements or guidance set forth in the Group’s forward-looking statements. In setting its targets and outlook for the period 2024-2026, Barclays has made certain assumptions about the macroeconomic environment, including, without limitation, inflation, interest and unemployment rates, the different markets and competitive conditions in which Barclays operates, and its ability to grow certain businesses and achieve costs savings and other structural actions. Additional risks and factors which may impact the Group’s future financial condition and performance are identified in Barclays PLC’s filings with the SEC (including, without limitation, this Barclays PLC Annual Report on Form 20-F for the financial year ended 31 December 2024), which are available on the SEC’s website at www.sec.gov. Subject to Barclays PLC’s obligations under the applicable laws and regulations of any relevant jurisdiction (including, without limitation, the UK and the US) in relation to disclosure and ongoing information, we undertake no obligation to update publicly or revise any forward-looking statements, whether as a result of new information, future events or otherwise. Market and other data This document contains information, including statistical data, about certain Barclays markets and its competitive position. Except as otherwise indicated, this information is taken or derived from Datastream and other external sources. Barclays cannot guarantee the accuracy of information taken from external sources, or that, in respect of internal estimates, a third party using different methods would obtain the same estimates as Barclays. Uses of Internet addresses This document contains inactive textual addresses to internet websites operated by us and third parties. Reference to such websites is made for information purposes only, and information found at such websites is not incorporated by reference into this document. References to Strategic Report and Pillar 3 Report This document contains references throughout to the Barclays PLC Strategic Report and Pillar 3 Report. References to the aforementioned reports are made for information purposes only, and information found in said reports is not incorporated by reference into this document.
Strategy 1 Climate and sustainability report 20 Governance ■ Governance 63 ■ Directors’ report 64 ■ Remuneration report 112 Risk review ■ Risk management 192 ■ Material existing and emerging risks 194 ■ Principal risk management 209 ■ Risk performance 221 ■ Supervision and regulation 308 Financial review ■ Key performance indicators 322 ■ Consolidated summary income statement 324 ■ Income statement commentary 325 ■ Consolidated summary balance sheet 326 ■ Balance sheet commentary 327 ■ Analysis of results by business 328 ■ Non-IFRS performance measures 342 Financial statements ■ Consolidated financial statements 356 ■ Notes to the financial statements 365 Shareholder information ■ Key dates, Annual General Meeting, dividends, and other useful information 450
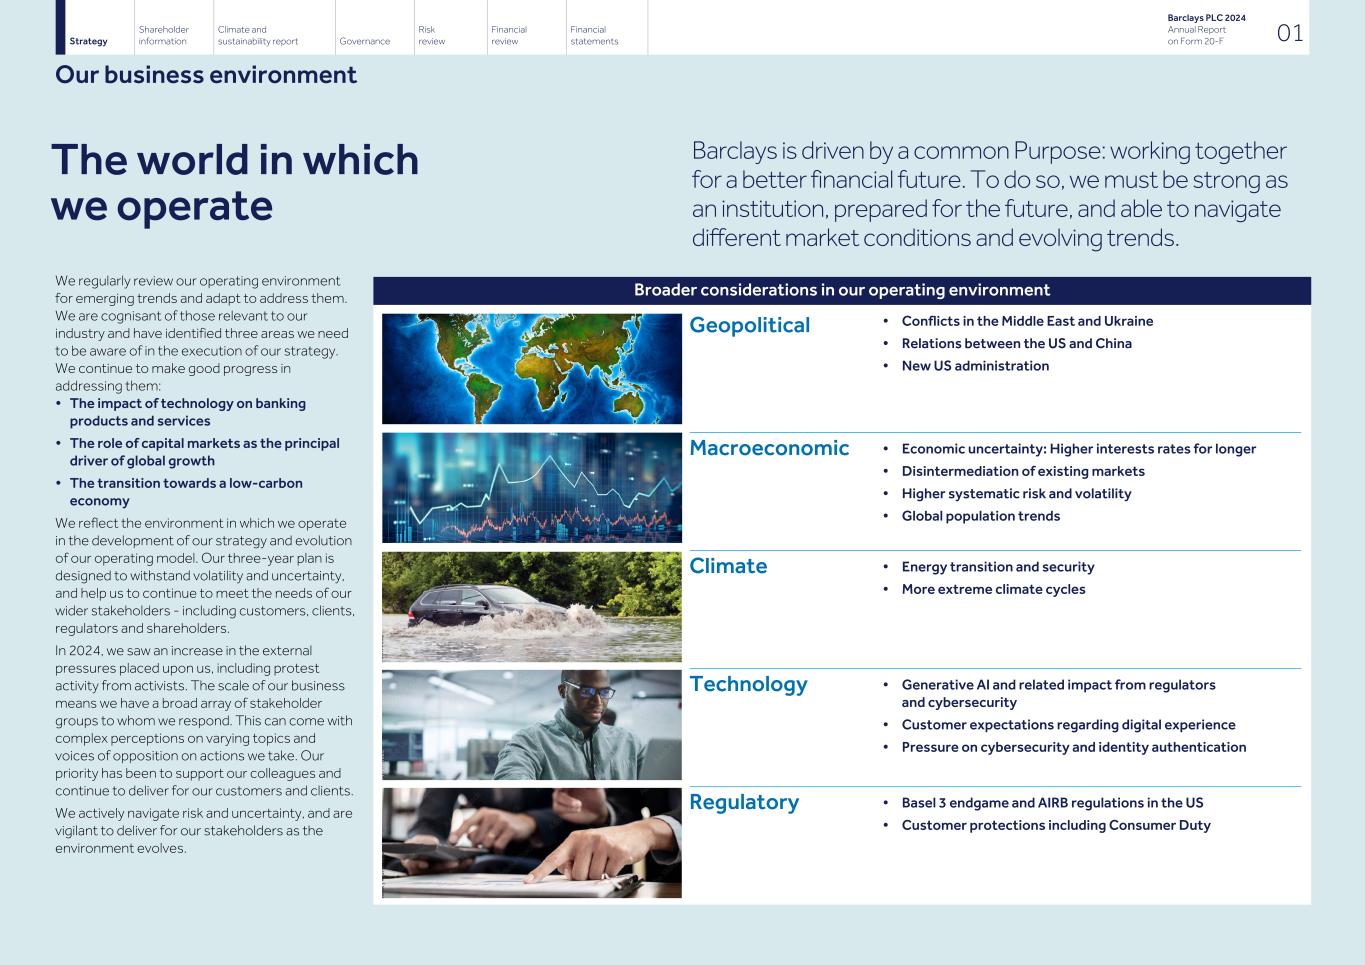
The world in which we operate Barclays is driven by a common Purpose: working together for a better financial future. To do so, we must be strong as an institution, prepared for the future, and able to navigate different market conditions and evolving trends. We regularly review our operating environment for emerging trends and adapt to address them. We are cognisant of those relevant to our industry and have identified three areas we need to be aware of in the execution of our strategy. We continue to make good progress in addressing them: • The impact of technology on banking products and services • The role of capital markets as the principal driver of global growth • The transition towards a low-carbon economy We reflect the environment in which we operate in the development of our strategy and evolution of our operating model. Our three-year plan is designed to withstand volatility and uncertainty, and help us to continue to meet the needs of our wider stakeholders - including customers, clients, regulators and shareholders. In 2024, we saw an increase in the external pressures placed upon us, including protest activity from activists. The scale of our business means we have a broad array of stakeholder groups to whom we respond. This can come with complex perceptions on varying topics and voices of opposition on actions we take. Our priority has been to support our colleagues and continue to deliver for our customers and clients. We actively navigate risk and uncertainty, and are vigilant to deliver for our stakeholders as the environment evolves. Broader considerations in our operating environment Geopolitical • Conflicts in the Middle East and Ukraine • Relations between the US and China • New US administration Macroeconomic • Economic uncertainty: Higher interests rates for longer • Disintermediation of existing markets • Higher systematic risk and volatility • Global population trends Climate • Energy transition and security • More extreme climate cycles Technology • Generative AI and related impact from regulators and cybersecurity • Customer expectations regarding digital experience • Pressure on cybersecurity and identity authentication Regulatory • Basel 3 endgame and AIRB regulations in the US • Customer protections including Consumer Duty Strategy Shareholder information Climate and sustainability report Governance Risk review Financial review Financial statements Barclays PLC 2024 Annual Report on Form 20-F 01 Our business environment
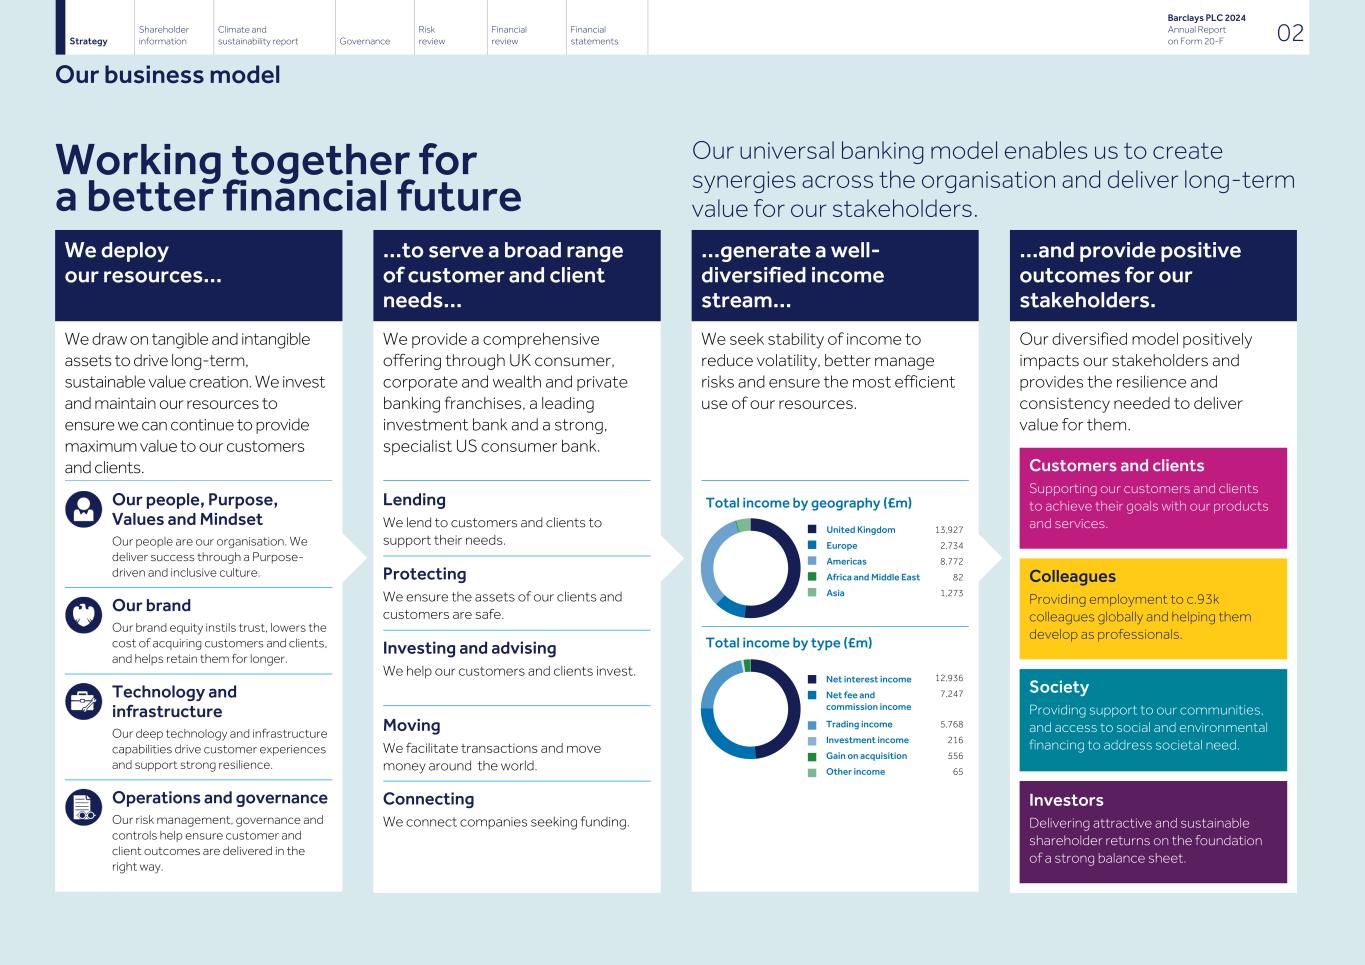
Working together for a better financial future Our universal banking model enables us to create synergies across the organisation and deliver long-term value for our stakeholders. We deploy our resources... We draw on tangible and intangible assets to drive long-term, sustainable value creation. We invest and maintain our resources to ensure we can continue to provide maximum value to our customers and clients. Our people, Purpose, Values and Mindset Our people are our organisation. We deliver success through a Purpose- driven and inclusive culture. Our brand Our brand equity instils trust, lowers the cost of acquiring customers and clients, and helps retain them for longer. Technology and infrastructure Our deep technology and infrastructure capabilities drive customer experiences and support strong resilience. Operations and governance Our risk management, governance and controls help ensure customer and client outcomes are delivered in the right way. ...to serve a broad range of customer and client needs... We provide a comprehensive offering through UK consumer, corporate and wealth and private banking franchises, a leading investment bank and a strong, specialist US consumer bank. Lending We lend to customers and clients to support their needs. Protecting We ensure the assets of our clients and customers are safe. Investing and advising We help our customers and clients invest. Moving We facilitate transactions and move money around the world. Connecting We connect companies seeking funding. ...generate a well- diversified income stream... We seek stability of income to reduce volatility, better manage risks and ensure the most efficient use of our resources. Total income by geography (£m) Total income by type (£m) ...and provide positive outcomes for our stakeholders. Our diversified model positively impacts our stakeholders and provides the resilience and consistency needed to deliver value for them. Customers and clients Supporting our customers and clients to achieve their goals with our products and services. Colleagues Providing employment to c.93k colleagues globally and helping them develop as professionals. Society Providing support to our communities, and access to social and environmental financing to address societal need. Investors Delivering attractive and sustainable shareholder returns on the foundation of a strong balance sheet. Strategy Shareholder information Climate and sustainability report Governance Risk review Financial review Financial statements Barclays PLC 2024 Annual Report on Form 20-F 02 Our business model n United Kingdom 13,927 n Europe 2,734 n Americas 8,772 n Africa and Middle East 82 n Asia 1,273 n Net interest income 12,936 n								 Net fee and commission income 7,247 n								Trading income 5,768 n								Investment income 216 n								Gain on acquisition 556 n								Other income 65
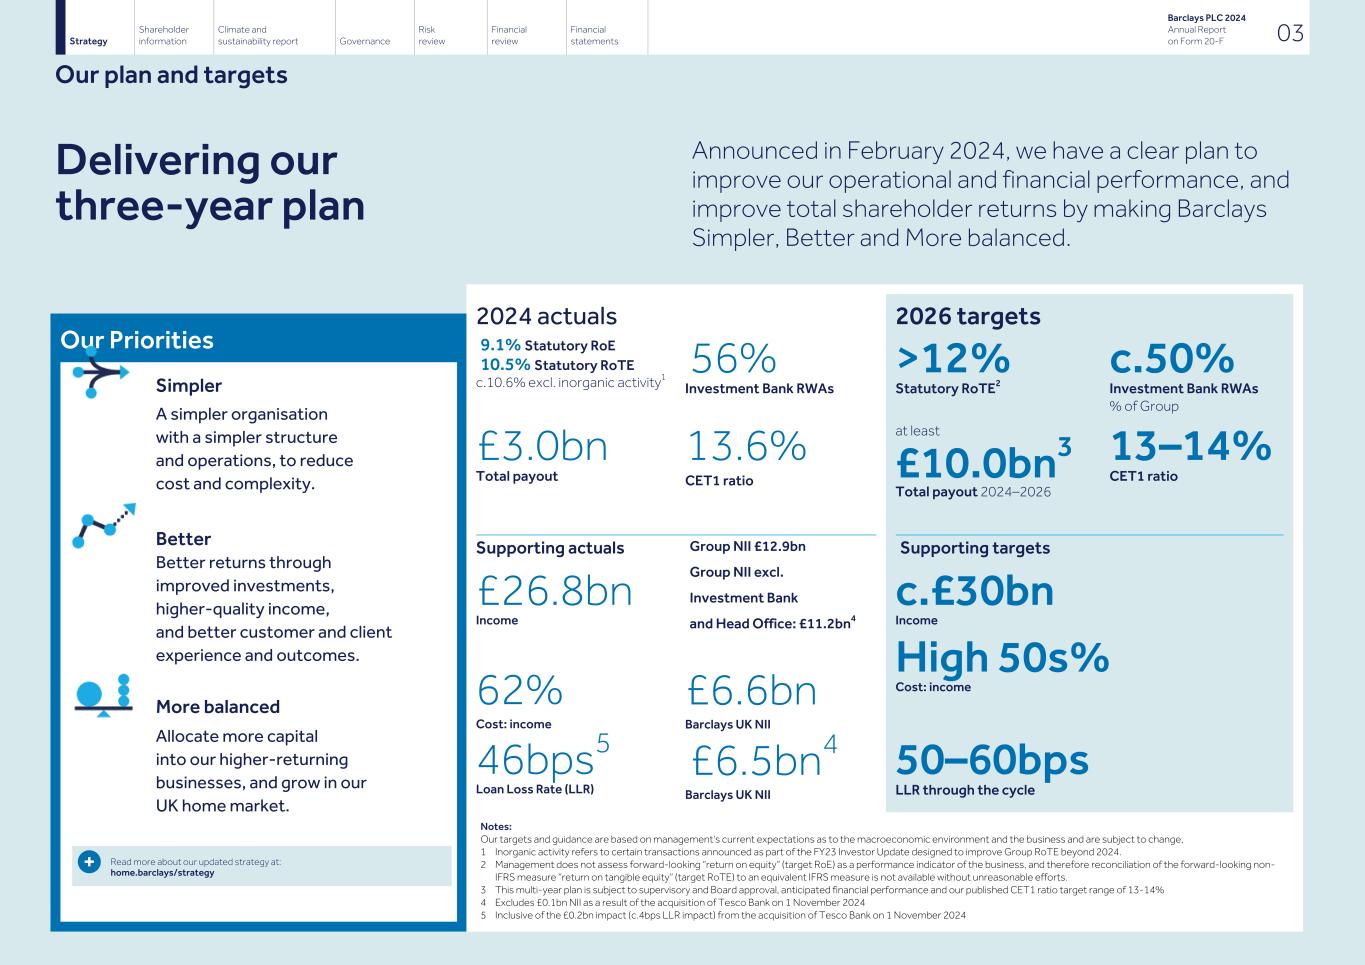
Delivering our three-year plan Announced in February 2024, we have a clear plan to improve our operational and financial performance, and improve total shareholder returns by making Barclays Simpler, Better and More balanced. bOur Priorities Simpler A simpler organisation with a simpler structure and operations, to reduce cost and complexity. Better Better returns through improved investments, higher-quality income, and better customer and client experience and outcomes. More balanced Allocate more capital into our higher-returning businesses, and grow in our UK home market. 2024 actuals 2026 targets 9.1% Statutory RoE 10.5% Statutory RoTE c.10.6% excl. inorganic activity1 56% Investment Bank RWAs >12% Statutory RoTE2 c.50% Investment Bank RWAs % of Group £3.0bn Total payout 13.6% CET1 ratio at least £10.0bn3 Total payout 2024–2026 13–14% CET1 ratio Supporting actuals £26.8bn Income Group NII £12.9bn Group NII excl. Investment Bank and Head Office: £11.2bn4 Supporting targets c.£30bn Income 62% Cost: income High 50s% Cost: income£6.6bn Barclays UK NII £6.5bn4 Barclays UK NII 46bps5 Loan Loss Rate (LLR) 50–60bps LLR through the cycle Notes: Our targets and guidance are based on management's current expectations as to the macroeconomic environment and the business and are subject to change, 1 Inorganic activity refers to certain transactions announced as part of the FY23 Investor Update designed to improve Group RoTE beyond 2024. 2 Management does not assess forward-looking “return on equity” (target RoE) as a performance indicator of the business, and therefore reconciliation of the forward-looking non- IFRS measure “return on tangible equity” (target RoTE) to an equivalent IFRS measure is not available without unreasonable efforts. 3 This multi-year plan is subject to supervisory and Board approval, anticipated financial performance and our published CET1 ratio target range of 13-14% 4 Excludes £0.1bn NII as a result of the acquisition of Tesco Bank on 1 November 2024 5 Inclusive of the £0.2bn impact (c.4bps LLR impact) from the acquisition of Tesco Bank on 1 November 2024 Strategy Shareholder information Climate and sustainability report Governance Risk review Financial review Financial statements Barclays PLC 2024 Annual Report on Form 20-F 03 Our plan and targets Read more about our updated strategy at: home.barclays/strategy
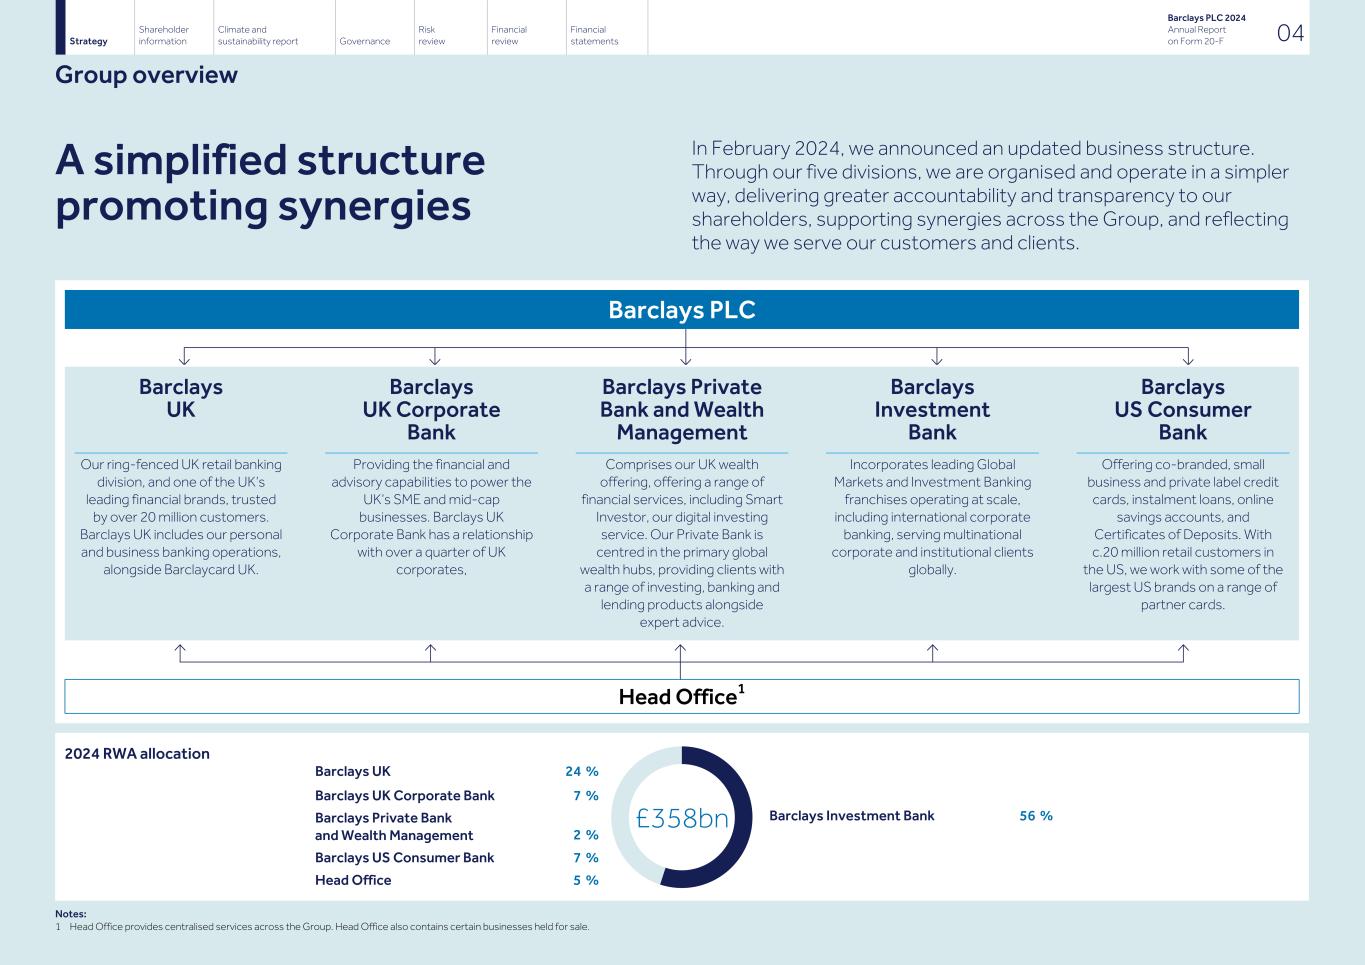
A simplified structure promoting synergies In February 2024, we announced an updated business structure. Through our five divisions, we are organised and operate in a simpler way, delivering greater accountability and transparency to our shareholders, supporting synergies across the Group, and reflecting the way we serve our customers and clients. Barclays PLC Barclays UK Barclays UK Corporate Bank Barclays Private Bank and Wealth Management Barclays Investment Bank Barclays US Consumer Bank Our ring-fenced UK retail banking division, and one of the UK’s leading financial brands, trusted by over 20 million customers. Barclays UK includes our personal and business banking operations, alongside Barclaycard UK. Providing the financial and advisory capabilities to power the UK’s SME and mid-cap businesses. Barclays UK Corporate Bank has a relationship with over a quarter of UK corporates, Comprises our UK wealth offering, offering a range of financial services, including Smart Investor, our digital investing service. Our Private Bank is centred in the primary global wealth hubs, providing clients with a range of investing, banking and lending products alongside expert advice. Incorporates leading Global Markets and Investment Banking franchises operating at scale, including international corporate banking, serving multinational corporate and institutional clients globally. Offering co-branded, small business and private label credit cards, instalment loans, online savings accounts, and Certificates of Deposits. With c.20 million retail customers in the US, we work with some of the largest US brands on a range of partner cards. Head Office1 2024 RWA allocation Notes: 1 Head Office provides centralised services across the Group. Head Office also contains certain businesses held for sale. Strategy Shareholder information Climate and sustainability report Governance Risk review Financial review Financial statements Barclays PLC 2024 Annual Report on Form 20-F 04 Group overview Barclays UK 24 % Barclays UK Corporate Bank 7 % Barclays Private Bank and Wealth Management 2 % Barclays US Consumer Bank 7 % Head Office 5 % Barclays Investment Bank 56 %£358bn
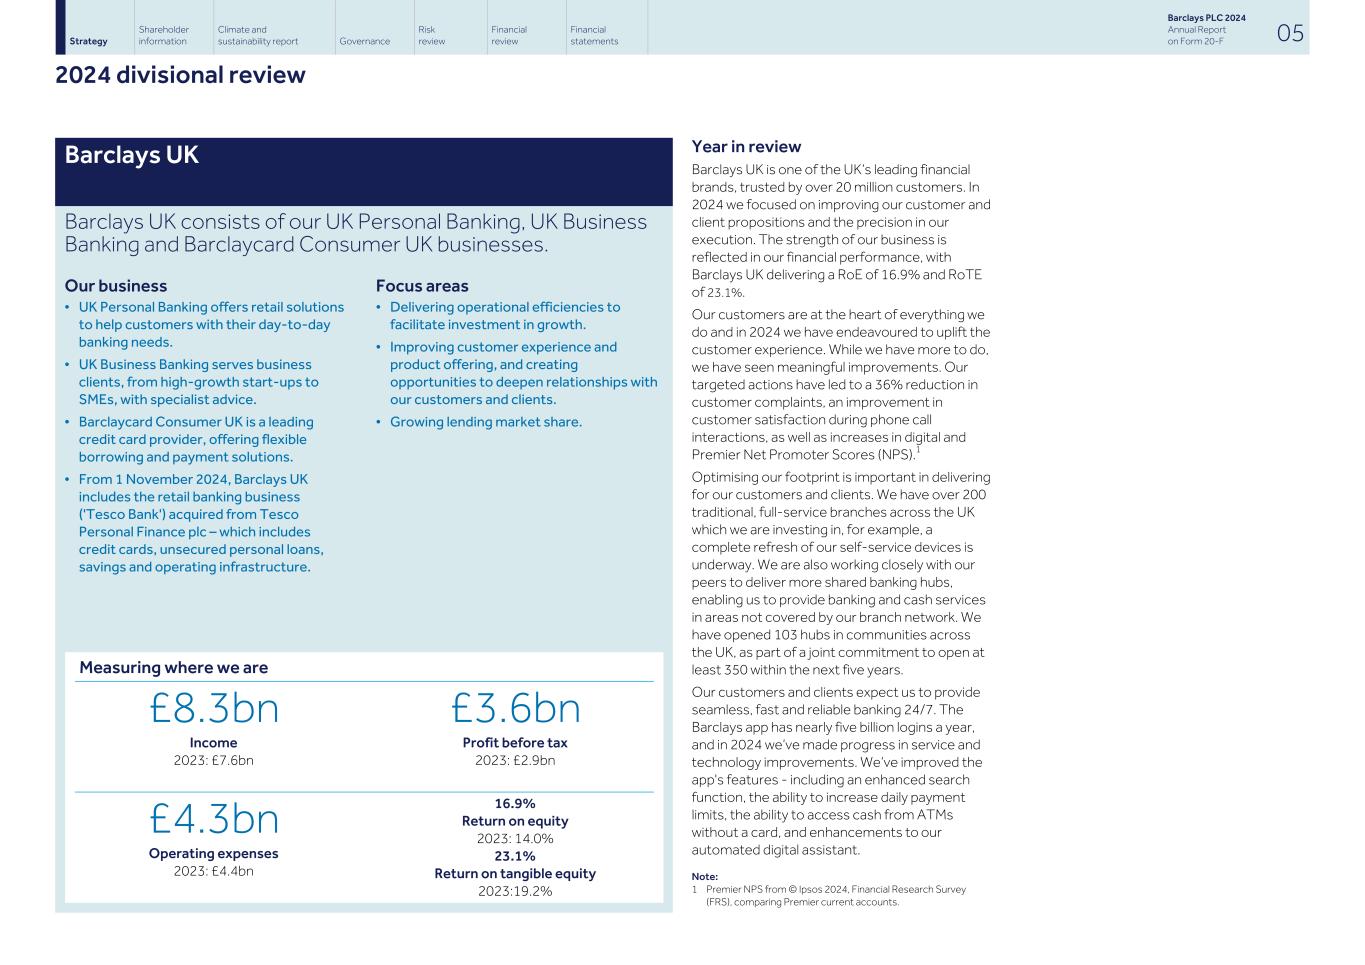
Our customers want a broader proposition and we’ve improved our products and offerings. For example, we’ve added Apple TV+ to the benefits included in Blue Rewards and given Premier customers access to all Barclays Blue Rewards features. We’ve supported over 100,000 homebuyers and owners with their mortgage applications in 2024. A new Mortgage Charter journey has enabled customers experiencing short-term payment difficulties to temporarily reduce their payments via the Barclays app, simplifying the experience and helping them to make informed decisions. Our subsidiary, Kensington Mortgages, launched a new Step Down mortgage where payments reduce after two years, helping customers facing financial changes. Kensington is currently the only mortgage provider in the UK to offer this. Through our Business Banking business, in 2024 we lent £2.17bn to SMEs to help them grow. We have also migrated 650,000 business clients from legacy infrastructure and pricing onto a new standard current account tariff that provides streamlined, competitive pricing for all. In November 2024, we completed the acquisition of Tesco Bank, which includes credit cards, unsecured personal loans,savings and operating infrastructure. Barclays UK has also entered a long-term, exclusive partnership with Tesco Stores Limited for an initial period of 10 years to market and distribute credit cards, unsecured personal loans and deposits using the Tesco brand, as well as to explore other opportunities to offer financial services to Tesco customers. This builds on Barclays UK’s existing strategic partnerships with other leading brands. “In 2024, we have endeavoured to uplift the customer experience and our targeted actions have led to a 36% reduction in customer complaints.” Vim Maru CEO of Barclays UK Looking ahead Over the next two years, we will remain focused on improving our products and services, as we deliver for customers and strive to provide a world-class experience. Our customers expect more from us, and we will continue to enhance and evolve our product offerings and how they experience them. Technology and innovation bring advancements. We will focus on delivering improved capability through functional and scalable technology – simplifying by investing in digitisation, automation and data. Our digital channels – including our onboarding and application processes, and our virtual customer care support – are being regularly upgraded. We are leveraging the use of AI to simplify and improve operations; increasing efficiencies, and enhancing productivity, enabling colleagues to be there for customers and clients when they need us the most. We have the opportunity to meet our ambitions with a stronger market position in key product lines – becoming more balanced by growing market share, particularly in unsecured and secured lending and business banking. We will leverage the Tesco Bank acquisition and partnership to maximise the opportunity. Note: 1 Internal research based on a survey taken in November 2023 with 100 client responses. Strategy Shareholder information Climate and sustainability report Governance Risk review Financial review Financial statements Barclays PLC 2024 Annual Report on Form 20-F 06 2024 divisional review (continued)
UK Corporate Bank UK Corporate Bank offers a range of Corporate Lending and Transaction Banking services to clients with an annual revenue of more than £6.5m through to FTSE350 companies. Our business • Corporate Lending: Offers a range of term, revolving, and overdraft facilities to clients across the UK, with financing solutions tailored to specific industry sectors. • Transaction Banking: Provides cash management, trade and working capital solutions, risk management solutions and payment services internationally. Focus areas • Driving productivity and seamless digital delivery, simplifying and improving client experience. • Growing broad-based income through deeper client relationships with products and solutions which address their needs. • Growing share of lending and attracting new clients. Year in review UK Corporate Bank has been described as the ‘beating heart’ of Barclays, given the role it has played in serving clients in the UK for over 330 years and its ability to join together the different aspects of the organisation to deliver for businesses and institutions. Our UK Corporate Bank delivered a RoE of 16.0% and a RoTE of 16.0%, which - while representing a reduction against the prior year - continues to demonstrate the strong franchise and long- lasting client relationships we maintain. In 2024, we focused on laying the foundations for transformation with investment in online digitalisation, strategic hiring in line with market opportunity and deepening relationships with clients. Against a challenging backdrop, we are pleased with the progress made. We have been proactive in our client outreach, attracting 550 new clients and issuing communications to clients affirming our support and willingness to lend, totalling more than £4.2bn. This focus enabled us to achieve total loan growth of £1bn1 for the year, after adjusting for perimeter changes with International Corporate Banking. Our lending plays a crucial role in clients’ investment in their futures, and helps improve economic productivity and drive growth. In 2024, we launched the Business Prosperity Fund, representing £22bn of funding available from our UK Corporate and Business Banking businesses – which we will lend to new and existing clients in 2025. Notes: 1 FY24 Loan balance growth of c.£1bn excludes a c.£2bn reduction from refinements to the perimeter with International Corporate Banking within IB. 2 sng.org.uk/press-release/sng-reports-strong-position Strategy Shareholder information Climate and sustainability report Governance Risk review Financial review Financial statements Barclays PLC 2024 Annual Report on Form 20-F 07 2024 divisional review (continued) Measuring where we are £1.8bn Income 2023: £1.8bn £0.7bn Profit before tax 2023: £0.9bn £1.0bn Operating expenses 2023: £0.9bn 16.0% Return on equity 2023: 20.5% 16.0% Return on tangible equity 2023: 20.5%
We are deepening relationships with our clients by developing and improving products and services to better meet their needs. In 2024, we completed the implementation of our end-to- end global trade finance solution, Trade360, in the UK. This platform provides clients with greater connectivity and visibility into their trade transactions, allowing them to optimise working capital efficiency, funding and risk mitigation. Trade360 differentiates our capabilities from our UK-focused peers, evidenced by Barclays being named Best Trade Finance Bank in the UK in 20241. Using cloud-based functionality for corporate banking clients, we can offer an improved user experience through easy access and real-time integration with essential information, combined with the latest trade solutions as industry-wide digitisation continues to accelerate. “Against a challenging backdrop, we are pleased with the progress made, having achieved total loan growth of £1bn for the year.” Matt Hammerstein CEO of UK Corporate Bank and Head of Public Policy and Corporate Responsibility We also enhanced our cash management client experience, reducing the average time it takes for clients to open additional accounts. We made improvements to our Virtual Account Management tool, where clients can manage large-scale virtual account operations and achieve comprehensive cash management. Additionally, we’ve increased the number of client interactions that can be self-served, enabling more clients to easily access the support they need. We have enhanced our client experience through the streamlining of processes and a focus on digitisation. This includes faster client onboarding times, such as our new fast-track process for UK-domiciled clients with simple ownership structures. These efforts are reflected through consistent improvements in our Overall Client Satisfaction (OSAT) score, an independent benchmarking score measured by Savanta, a market research company, with 62% of clients surveyed rating us ‘Excellent’ or ‘Very Good’, an increase of 6% since 2023. Looking ahead We remain committed to supporting the delivery of Barclays’ three-year plan through a continued drive to grow lending; building deeper client relationships; and continued investment in our digital capabilities to enhance our clients’ experience. Note: 1 By Global Trade Review at Leaders in Trade awards 2024. Strategy Shareholder information Climate and sustainability report Governance Risk review Financial review Financial statements Barclays PLC 2024 Annual Report on Form 20-F 08 2024 divisional review (continued)
Private Bank and Wealth Management Private Bank and Wealth Management (PBWM) comprises PBWM UK – serving clients across the full wealth continuum in the UK and Crown Dependencies – and PBWM International, serving high- and ultra-high net worth clients in selected international markets. Our business • Private Banking UK is a full-service proposition for clients with investable assets of £3m+. • Private Banking International is a full- service proposition for clients with investable assets of £5m+ internationally1, with a focus on clients in the Europe, Middle East and Asia wealth corridors. • UK Affluent is for UK clients with £250k to £3m of investable assets. • UK Digital Investing is for UK self-directed investors, with investment starting from just £1. Focus areas • Moving to a simplified business structure, aligned to market opportunity in the UK and internationally, as well as reinvesting cost efficiencies to support growth. • Strengthening the proposition across the UK wealth continuum and the International Private Bank. • Growing assets under management to increase the relative contribution of non- interest income, to deliver high-quality recurring revenue. Note: 1 For India, the Private Bank proposition is available for clients with investable assets of £3m+. Year in review Private Bank and Wealth Management’s vision is to be the investment partner for our clients, their families, and the next generation. The strength of our business is reflected in our 2024 performance, with assets under management growing 14%, and PBWM delivering a RoE of 25.7% and a RoTE of 28.1%. To continue to serve our customers and clients, and to deliver on the bank’s strategy, we have simplified our operating model. From February 2025, PBWM will operate through two core areas: PBWM UK, focused on the full UK continuum from first time investors to ultra-high net worth individuals and family offices , and PBWM International, focused on clients in Europe, Middle East, and Asia. Investing is a fundamental part of wealth creation and growth, and in the UK there is an opportunity to support savers to become investors. Barclays’ digital investing service, Smart Investor, is embedded in the Barclays app and has over 331,000 active customers, providing them access to 8,500 different securities and funds including ready-made investments. Over the past year, we have focused on improving our digital investing proposition. The scaling and enhancement of Smart Investor is a strategic priority for Private Bank and Wealth Management as part of Barclays’ three-year plan. In 2024 we introduced more competitive pricing and simplified customer journeys – for example making it easier for customers to research, open, fund and trade ready-made investment funds in the Barclays app. These improvements have contributed to over 58,000 customers choosing to open a Smart Investor account in 2024 – a 141% increase compared to 2023 – and further enhancements are planned in 2025. Smart Investor presents a growth opportunity for Private Bank and Wealth Management, in particular through synergies and cross- collaboration with Barclays UK. Strategy Shareholder information Climate and sustainability report Governance Risk review Financial review Financial statements Barclays PLC 2024 Annual Report on Form 20-F 09 2024 divisional review (continued) Measuring where we are £1.3bn Income 2023: £1.2bn £0.4bn Profit before tax 2023: £0.4bn £0.9bn Operating expenses 2023: £0.8bn 25.7% Return on equity 2023: 29.9% 28.1% Return on tangible equity 2023: 32.7%
“Our vision is to be the investment partner for our clients, their families, and the next generation. We have focused on improving the service we deliver for clients as we help them achieve their goals." Sasha Wiggins CEO of Private Bank and Wealth Management Our research indicates that a number of people in the UK may benefit from financial advice but are not receiving it. To address this need, we have built the foundations of a new UK Affluent proposition to provide advice to our customers and clients at each stage of their personal financial journey. It aims to deliver scalable and accessible financial planning, which is fairly priced and transparently constructed. It will be fully integrated within the Barclays app – making it seamless for our customers to access the advice they need alongside their day-to-day banking requirements. The UK Affluent service is currently being piloted and will be launched in 2025. We have focused on providing a best-in-class offering for our Private Bank clients. We continued to enhance our personalised service and improve the products we offer, including our ability to offer credit against investments and expanding our alternative offerings with the launch of new Private Markets solutions. We also launched a unitised fund based on our top- quartile performing1 multi-asset class discretionary strategy. Internationally, we are developing the foundations for future growth in the Middle East and Asia. Across our business, we have automated processes and digitised services to improve our operations. For instance, in Europe, we increased automation in our banking offering to improve operations and controls, and reduce processing times. Looking ahead We are focused on improving efficiencies across our business, strengthening our propositions and growing our assets under management to drive a more balanced income profile across net interest income and fees. A continued focus is to deepen the relationships we have with our existing clients and continue to grow our assets and liabilities. We will do this by being more consistent with the way we collaborate with clients across the wider firm. For example, we have identified that there are roughly four million customers in Barclays UK today that have sufficient liquidity and/or investment appetite that could benefit from the services of PBWM. Within the UK Corporate Bank and the Investment Bank, there are also a significant number of business owners, family offices and executives of large corporations who would benefit from our Private Bank services. Our priorities for the year ahead include further improvements to our UK Digital Investing proposition, launching our new UK Affluent proposition, and continuing to improve our proposition and digital experience in the Private Bank – both in the UK and internationally. We are also focused on progressing our plans to establish a new Private Bank booking centre in Singapore. We remain committed to improving our underlying technology infrastructure and digital client experience. Note: 1 The Asset Risk Consultants (ARC) Balanced PCI Index provides a comparative measure of performance, using the returns of actual client portfolios where risk relative to world equities is 40%-60%. The data is taken from 138 investment managers. Data as of 30 June 2024. Strategy Shareholder information Climate and sustainability report Governance Risk review Financial review Financial statements Barclays PLC 2024 Annual Report on Form 20-F 10 2024 divisional review (continued)
Investment Bank Investment Bank provides money managers, financial institutions, governments, supranational organisations and corporate clients with advisory, finance and risk management services. Our business • Barclays’ Global Markets division provides institutional investors, sovereigns and corporates with a full range of execution services, ideas and risk management solutions across asset classes (Equities, Credit, Rates, FX and Securitised Products). The Research team provides institutional investors with data- driven analysis, actionable insights and access to our analysts across global sectors, markets and economies. • Barclays’ Investment Banking division partners with companies, governments and financial institutions worldwide to provide expert advice, innovative solutions and access to capital. It includes International Corporate Banking, which provides financial institutions and large corporate clients with wholesale lending and sophisticated treasury solutions – supported by deep industry knowledge and local, on-the- ground specialists. Focus areas • Monetising our deep client relationships while maintaining prudent risk management. • In Global Markets, sustaining momentum in our businesses with Top 5 market share2, growing our next focus businesses and continuing to scale more stable financing income. • In Investment Banking, maintaining our historical strength in Debt Capital Markets (DCM) while growing share in Advisory and Equity Capital Markets (ECM) with Financial Sponsor and Corporate clients, and together with the International Corporate Bank, driving growth via coordinated coverage of our clients’ Treasury functions. Year in review Barclays has a top-tier Investment Bank with a strong global ranking. Our market share in Investment Banking has improved, and we maintained our #6 Dealogic1 global fee share ranking (3.3% fee share) - the highest of any non-US domiciled bank. Though there is still work to do, we are making progress, and this is reflected in RoE of 8.5% and the 150bps increase in RoTE to 8.5%, closing in on the RoTE target to align to the Group. With 2024 marked by episodes of both optimism and risk aversion, the Investment Bank continued to help clients navigate a complex landscape shaped by economic data, geopolitical events and policy change – delivering strategic solutions through our diversified portfolio of products and services. Through the year, we continued to grow income with a focus on more stable income streams which along with greater efficiency resulted in positive jaws for the year. Income was up 7%, with costs up 2%. The growth in income together with stronger management of RWAs, allowed us to deliver revenue over average RWAs of 5.8%, up 30bps on 2023. In Global Markets, our synergies between sales, trading, financing, and with our partners in Investment Banking, give us the opportunity to drive a more cohesive and trusted relationship with clients and deliver a fuller suite of products and services, delivering revenue growth of 4%. We have made strong progress with improved performance in the three focus businesses in Markets, while sustaining momentum in financing within Markets. Notes: 1 Dealogic for the period 1 January 2024 to 31 December 2024. 2 Top 5 market share as defined in the 20 February 2024 Investor Update. For further details, see: https://home.barclays/content/ dam/home-barclays/documents/investor-relations/ ResultAnnouncements/FullYear2023Results/20240220- Barclays-Investor-Update-Presentation.pdf Strategy Shareholder information Climate and sustainability report Governance Risk review Financial review Financial statements Barclays PLC 2024 Annual Report on Form 20-F 11 2024 divisional review (continued) Measuring where we are £11.8bn Income 2023: £11.0bn £3.8bn Profit before tax 2023: £3.2bn £7.9bn Operating expenses 2023: £7.7bn 8.5% Return on equity (2023: 7.0%) 8.5% Return on tangible equity 2023: 7.0%
Our acute focus on growing our share with the top 100 clients by deepening our relationships continues to progress. We grew our Top 5 rank from 49 to 56 in 2024.1 Our Research team continues to rank highly amongst our institutional client base, as evidenced by the results in the Extel 2024 surveys, where Barclays ranks #3 in Global Fixed Income, #5 in European Equity Research and #8 in US Equity Research. In Investment Banking, we delivered revenue growth of 12% year on year, and improved overall global fee share by 30bps to 3.3%2. In 2024, we maintained our traditional strengths in DCM, consisting of Investment Grade (#6, 3.5% share1) and Leveraged Finance (#5, 4.7% share1) while making progress in rebalancing our footprint towards Advisory (#11%, 2.6% share, flat to 20231), and ECM (#7, 3.1+ %, up from #11, 2.1% in 20231). While corporate banking revenues were down 5% driven by lower liquidity pool income and margin compression on deposits, we made progress in developing our international offering and improved our digital offering to meet the increasingly sophisticated needs of our clients. Additionally, we continued to integrate our activities through our combined Treasury Coverage model, unifying engagement for clients’ wider Investment Bank treasury needs. “We continued to help clients power possibilities and plan for their future with confidence – drawing on the breadth and depth of our franchises, our strategic advice, and our comprehensive financing and risk management solutions.” Cathal Deasy Global Co-Head of Investment Banking Looking ahead Our goal in the Investment Bank is to continue to improve returns to deliver in line with Group RoTE in 2026 and leverage our strength in the UK to consolidate our position as a leading global investment bank. We aim to achieve this through high single-digit compound annual growth rate (CAGR) income growth, disciplined cost management and increase in capital efficiency. Notes: 1 Based on Barclays analysis using internal and external sources. 2 Dealogic for the period 1 January 2024 to 31 December 2024. Strategy Shareholder information Climate and sustainability report Governance Risk review Financial review Financial statements Barclays PLC 2024 Annual Report on Form 20-F 12 2024 divisional review (continued)
US Consumer Bank US Consumer Bank (USCB) is a leading co-branded credit card issuer and financial services partner in the United States. Our business • Barclays US Consumer Bank has more than 20 million customers and partnerships with 20 of America’s leading brands across the airline, travel, retail and affinity sectors. • We provide co-branded credit cards, small business credit cards, instalment loans, point-of-sale finance, online savings accounts and certificates of deposits. Focus areas • Scaling and diversifying by growing existing partnerships and winning new partners. • Investing in digitisation to deliver operational efficiencies and enhanced customer experience. • Improving net interest margin by optimising pricing and credit mix, while reducing funding costs. • Selective risk transfer to optimise use of balance sheet. f Year in review The US is the world’s largest credit card market, and growing. With a c.2-3% share1 of the total market and partnerships with 20 major brands, the USCB has a significant opportunity. In 2024, we delivered a RoE of 8.1% (2023: 3.4%) and RoTE of 9.1%, up from 4.1% in 2023, with returns improving in each quarter. The results have been impacted by the appreciation of average GBP against USD through 2024, however when normalised for FX movements, in USD terms income was up 4% and PBT was up 140% year on year. We are focused on building lasting partnerships with leading US brands. In 2024, we launched a new co-branded card programme with Breeze Airways and extended our current partnership agreements with Hawaiian Airlines, Frontier and RCI. While we made a strategic decision not to bid to become American Airlines’ sole card issuer from 2026, we were selected as the new issuing partner for the General Motors card programme, which will launch in the first half of 2025. Our acquisition of Luxury Card, a global leader in the premium credit card market, supports our objective to optimise and diversify our broader card portfolio and bring more aspirational experiences to its cardmembers. We have continued to expand our online retail deposits business. In 2024 we launched Barclays Tiered Savings product, which features tiered pricing and the ability to earn higher rates with higher balances while our customers’ savings grow. Note: 1 Estimated using reported end net receivables compared to US consumer credit market in the US as per federalreserve.gov/. Strategy Shareholder information Climate and sustainability report Governance Risk review Financial review Financial statements Barclays PLC 2024 Annual Report on Form 20-F 13 2024 divisional review (continued) Measuring where we are £3.3bn Income 2023: £3.3bn £0.4bn Profit before tax 2023: £0.2bn £1.6bn Operating expenses 2023: £1.7bn 8.1% Return on equity 2023: 3.4% 9.1% Return on tangible equity 2023: 4.1%
We added c.three million new customers organically in 2024 – and we strive to provide them all with a world-class experience. We have made various improvements to our customer journeys, using digitisation and automation to help us serve customers in a way that works for them – including the digitisation of letters and improved telephony with AWS Connect. We have also integrated a formerly separate deposits mobile app into the Barclays US app so our customers can access all their accounts in one place. And with investments in Digital Day One, we realised an increase of 26% in mobile users from 2023. As part of Digital Day One, customers no longer need to wait to receive a physical card before registering for our digital environment, allowing them to have access to digital on day one. Transaction NPS for both digital and contact centre agent servicing increased in the year, averaging +63 and +51 respectively. “In 2024, we launched a new co-branded card programme with Breeze Airways, were selected as the new issuing partner for the General Motors card programme, and extended our current partnership agreements with Hawaiian Airlines, Frontier and RCI. Denny Nealon CEO of US Consumer Bank Looking ahead: As we continue to deliver on Barclays’ strategic plan, we will work closely with our card partners to drive organic growth in existing programmes, while actively pursuing new partnership opportunities with a focus in the retail segment – which will improve through-the-cycle risk- adjusted margins. In our digital deposits business, our aim is that continued investment in our products and new co-branded marketing programmes will drive growth that will enable us to reduce funding costs. Ongoing, programmatic investments in the digitisation of our customer experience, as well as in tools and automation to assist our colleagues, will further drive improvements in overall cost efficiency. We will continue to explore risk transfer transactions as a mechanism for reducing capital consumption. Strategy Shareholder information Climate and sustainability report Governance Risk review Financial review Financial statements Barclays PLC 2024 Annual Report on Form 20-F 14 2024 divisional review (continued)
Barclays UK Net Promoter Score (NPS) 2024 2023 2022 17 17 11 3 3 9 About this KPI and why we use it Net Promoter Score (NPS) is used to measure the strength of customer relationships. We track NPS to identify both our strengths and where there is room for improvement, informing how we develop our services and products in the future. Maintaining strong, personal relationships and building trust and advocacy is key across all our divisions, but most observable and material in Barclays UK. With over 20 million customers, Barclays UK represents the largest customer base for which we serve customers throughout their financial lives. How we performed We maintained our NPS of +17. Underlying this, we saw significant improvements in Premier and our digital channel NPS. We continue to focus on improving customer experience and service. Barclays UK complaints (% movement year on year) -36 18 -17 2024 2023 2022 About this KPI and why we use it The FCA publishes complaints information every six months – a good measure of how well UK institutions are driving customer outcomes. We measure our volume of complaints, tracking against goals and reviewing root causes to inform changes to our products and services. How we performed In 2024, we saw a 36% reduction in customer complaints after putting in place a rigorous plan to address issues that cause them, improving the basics and enhancing customer experience. We recognise there is more to do and addressing the root cause of complaints is a continued focus for us. US Consumer Bank digital engagement (%) 71.1 68.7 67.5 2024 2023 2022 About this KPI and why we use it Digital engagement assesses our digital value proposition and user experience. We measure usage over a 90-day period as a percentage of balance-active customers, reflecting the general health of the digital experience and allowing us to uncover any issues we may need to address.1 How we performed Overall digital active rate improved by 240bps year on year, driven by reduced friction to register and advertisable new features. This was driven by investments in our mobile app and digital self-serve capabilities.2 Investment Bank revenue ranks and market shares (%, #) 2024 6.3 3.3 #6 #6 2023 6.5 3.0 #6 #6 2022 7.3 3.1 2.7 6.9 #6 #6 n Global Markets revenue ranking and share3 n Dealogic Investment Banking global fee ranking and share demonstrating our performance vs peers. About this KPI and why we use it Revenue ranks and market shares are a good indicator to monitor success and identify opportunities. By using Dealogic Investment Banking global fee ranking and share, and a comparison to global peers' share of reported revenues for Global Markets, we can assess our relative performance versus a defined peer group3 clearly and transparently. How we performed In 2024, we maintained our rank of sixth across the Investment Bank in both Global Markets and Investment Banking. Notes: 1 The KPI is measured at exit at end of December 2024. 2 Historically, we have shown digital engagement excluding the Gap portfolio, purchased in 2021. Excluding Gap, activity rate increased from 76.0% to 77.7%. 3 FY24 Market share for Barclays is based on external reported revenues. Peer banks include Barc, BoA, BNP, CITI, DB, GS, JPM, MS and UBS. Strategy Shareholder information Climate and sustainability report Governance Risk review Financial review Financial statements Barclays PLC 2024 Annual Report on Form 20-F 15 Our stakeholders See page 112 for details on Executive Director remuneration linked to these KPIs
Colleagues At the heart of achieving our plan to make Barclays Simpler, Better and More balanced are our c.93,000 colleagues. We are united by a shared Purpose, Values and Mindset, delivering to a consistently excellent standard in all we do – and we are making Barclays a great place to work, where every colleague can reach their potential. Engaging with colleagues Sharing our strategy and how colleagues can contribute towards delivery has been a key part of our 2024 engagement. Regular, two-way dialogue helps us to understand what is working well across the organisation and where we can improve. Engagement with colleagues is delivered through townhalls, skip-level meetings, site visits, leader- led sessions, focus groups and surveys. Through our bi-annual all-colleague Your View surveys, our people have the opportunity to share their feedback on working at Barclays – and in 2024 we saw the highest participation to date, with 79% of colleagues taking part. We create a respectful and inclusive environment where colleagues feel safe to speak up. Additionally, our raising concerns and whistleblowing processes provide anonymous channels for colleagues if preferred. Our long-standing partnership with Unite in the UK also offers further insight into the views of our people. We continue to consult with Unite on major change programmes, to minimise compulsory job losses and focus on reskilling and redeployment. Continuing to deliver to a consistently excellent standard A consistently excellent standard is an integral part of our culture and a key enabler of our three- year plan. It continues to be embedded through the Group-wide multi-year Consistently Excellent culture change programme. In 2024, our focus has been supporting colleagues from understanding what it means to deliver to a higher standard to putting it into practice every day, with a focus on strengthening risk management and controls. We have rolled out Consistently Excellent workshops which have been completed by almost 60,000 colleagues, and we’ve also launched new risk and control focused training. This standard is now central to our hiring, promotion and colleague performance management processes. We continued to recognise colleagues for high standards through our recognition portal, our CEO Awards and our Exceptional Achievement Awards. Our leaders are critical here and, for the second year running, members of the Group Executive Committee visited sites across the world to talk about being consistently excellent – with a focus on how this enables delivery of the strategic plan. We continue to measure colleague understanding of what it means to be consistently excellent. Our Your View data tells us that 86% of colleagues say that their people leader clearly communicates the actions they need to take to deliver consistently excellent outcomes in their role. Investing in our talent Our talent ambition continues to underpin Barclays’ approach to talent attraction, retention and development. In 2024 we refreshed, simplified and enhanced our selection experience and introduced a new single Global Talent Framework. We also introduced a new HR platform to deliver these changes at scale to our people. Our leadership framework continues to set the benchmark for what it means to lead at Barclays. It is the foundation for our leaders to improve how they lead and create an environment where colleagues can learn, grow and succeed. Development opportunities empower colleagues to build skills, advance their career and achieve sustainable high performance. We continue to deliver our key leadership development programmes - Strategic Leaders and Aspire, alongside our People Leader programme, Evolution, equipping our people leaders with effective management skills. All colleagues also have access to online learning addressing an extensive range of development topics. Strategy Shareholder information Climate and sustainability report Governance Risk review Financial review Financial statements Barclays PLC 2024 Annual Report on Form 20-F 16 Our stakeholders (continued) Where to find out more: For more information on our commitment to building a diverse, equitable and inclusive workplace, see home.barclays/ sustainability/esg-resource-hub/reporting and disclosures/
Alongside being ranked in the top ten of LinkedIn’s 2024 UK Top Companies list, Barclays also ranked in the top ten of The Times Top 100 Graduate Employers 2024 list, recognising the focus on our Early Careers population as a key talent pipeline for the future. In 2024, we hired 1,449 Interns, 1,224 Graduates and 217 Apprentices globally. We are continuing to build on our relationships with key partners to increase access to, and inclusivity of our cohorts, including the Grace Hopper Celebration, bringing together women and non-binary people in technology, and Bright Network, an early careers platform connecting employers with students. Our ambitions Barclays is committed to abiding by the laws in all jurisdictions in which it operates, including anti- discrimination laws. Building an inclusive and equitable culture, reflecting a diversity of views and backgrounds, where all colleagues can thrive is a business priority. We are focused on actions and outcomes that support a culture of belonging and diversity of thought. Our initiatives help to develop a leadership pipeline through which qualified candidates are considered for leadership roles regardless of their gender, race, or any other protected characteristic. At the end of 2024, 30% of the Managing Director and Director populations were female. In the UK and US, there were 50 Managing Directors from underrepresented ethnicities at the end of 2024. Our original all-colleague race and ethnicity ambition in the UK, set in 2021, was to increase the number of employees from underrepresented ethnicities by 25% by the end of 2025. We achieved this two years ahead of time, and as a result, reset and increased our ambition. As at the end of 2024, we have made steady progress against our revised UK ambition with 5.2% of colleagues being from underrepresented ethnicities. Currently in the US, 18.6% of colleagues are from underrepresented ethnicities. We are evolving and developing our strategy to focus on enabling and sustaining an inclusive culture where all colleagues belong and can thrive. We are also continuing to equip our senior leadership and people leaders to support their teams. Supporting our workforce Helping our people be at their best remains a priority. Our structured hybrid working model enables colleagues to connect in-person and plan their work to make the most of their time in the office and at home, where appropriate to their role. We continue to test and learn from our approach. We are also focused on supporting colleague wellbeing. We use data-driven insights and engagement through campaigns to help our people build healthy habits and promote a supportive culture, contributing to our Wellbeing Index score being 87% favourable in our 2024 Autumn Your View survey. Our mental health awareness eLearning, which launched in 2018, has been completed by 82% of current colleagues and 89% of current people leaders. In 2024, we refreshed this learning to ensure it remains relevant. Our people policies Our people policies1 help us recruit the best people, provide equal opportunities and create an inclusive culture, in line with our Purpose, Values and Mindset, and in support of our long- term success. They are regularly reviewed and updated to ensure they are aligned with our broader people strategy. In 2024, we continued to review our policies to optimise colleague experience, standardising policies globally where possible, and supporting colleagues and people leaders to navigate them. As part of our Fair Pay Agenda, we are committed to paying our colleagues fairly and appropriately relative to their role, skills, experience and performance, including paying at least a living wage in all our locations. This means our remuneration policies reward sustainable performance in line with our Purpose, Values and Mindset, and with our consistently excellent standard. Creating a Simpler, Better, More balanced Barclays is a monumental task. In recognition of our colleagues’ contribution and the effort that is still required, we are granting employees a one-off share award, to be retained until after we announce our full-year 2026 results. This share award will further reinforce the alignment of colleagues’ interests with those of our shareholders, ensuring everyone is working towards the same goals to drive the Group’s success. It will not be granted to our most-senior population,2 who are typically awarded Barclays shares as part of their deferred compensation. This share award is separate from our all-employee plans, which we continue to operate in locations representing 99% of employees globally. Read more about our commitment to fair pay in the Remuneration report, from page 112, and in our Fair Pay Report at: home.barclays/annualreport. Companies Act Diversity Disclosure On a Companies Act 2006 414C3 basis as at 31 December 2024, Barclays employed 97,689 colleagues across the globe (53,337 male, 43,565 female, and 787 undisclosed), including 462 senior managers (342 male, 120 female). We also had 13 Directors on the Board of Barclays PLC (8 male, 5 female). Notes: 1 Our policies reflect relevant employment law, including the provisions of the Universal Declaration of Human Rights and the International Labour Organization (ILO) Declaration on Fundamental Principles and Rights at Work. 2 Employees who are Managing Directors or who have been identified as ‘Material Risk Takers'. 3 Headcount basis, including colleagues on long-term leave. Undisclosed refers to colleagues who do not record their gender in our systems. 'Senior managers' is defined by the Companies Act and is different to both our Senior Managers under the FCA and PRA Senior Managers regime, and a narrower scope than our Director and Managing Director corporate grades. It includes Barclays PLC Group Executive Committee members, their direct reports and directors on the boards of undertakings of the Group, but excludes Directors on the Board of Barclays PLC. Where such persons hold multiple directorships across the Group they are only counted once. Strategy Shareholder information Climate and sustainability report Governance Risk review Financial review Financial statements Barclays PLC 2024 Annual Report on Form 20-F 17 Our stakeholders (continued)
Colleague engagement (%) 2024 2023 2022 85 86 84 About this KPI and why we use it Colleague engagement is derived from the responses to three questions in our Your View survey that measure advocacy, motivation and sense of personal accomplishment. The questions that make up this KPI are: I would recommend Barclays to people I know as a great place to work; my work provides me with a sense of personal accomplishment; Barclays motivates me to contribute more than is normally required to complete my work It enables us to monitor how engaged our workforce is and closely relates to key organisational and colleague outcomes such as productivity, wellbeing and retention. How we performed Colleague engagement decreased by 1ppt to 85%. Overall, this continues to be a strong engagement score and is 4ppt above our external benchmark.1 Females at Managing Director and Director level (%) 2024 2023 2022 30 30 29 About this KPI and why we use it This metric is used to monitor our progress against our gender ambition of 33% females at Managing Director and Director level by the end of 2025. How we performed In 2024, we remained flat at 30%. “I believe that my team and I do a good job of role modelling the Values every day” (%) 2024 2023 2022 93 94 92 About this KPI and why we use it This question within our Your View survey measures colleagues’ perception of how well the Barclays Values are role-modelled by colleagues. The Values are our moral compass; the fundamentals of who we are and what we believe is right. How we performed In 2024, we saw a small decrease of -1ppt. This score has remained largely consistent over the past three years. “I believe strongly in the goals and objectives of Barclays” (%) 2024 2023 2022 88 89 88 About this KPI and why we use it To measure colleague perception of, and belief in our three-year plan we are disclosing this KPI from our Your View survey. It replaces the previous KPI , “I would recommend Barclays as a great place to work” – which is measured as part of our colleague engagement score KPI. How we performed In 2024, 88% of colleagues expressed strong belief in Barclays' goals and objectives. This remains consistent year-on-year, with a slight decrease of 1ppt compared to 2023 – prior to the launch of the three-year plan. We will continue to track this KPI over the next two years. Note 1 The Qualtrics 2023 75th percentile Financials benchmark of 81% is based on a three-year rolling average from 2020-2023. Strategy Shareholder information Climate and sustainability report Governance Risk review Financial review Financial statements Barclays PLC 2024 Annual Report on Form 20-F 18 Our stakeholders (continued) See page 112 for details on Executive Director remuneration linked to these KPIs
Net zero operations: Scope 1 and 2 market- based emissions1 ('000 tCO2e) 10.7 16.9 22.1 11,300.0Δ 5,100.0Δ About this KPI and why we use it Barclays is working to achieve net zero operations, consistent with a 1.5°C aligned pathway, and we plan to counterbalance2 any residual emissions. This metric measures total gross Scope 1 and 2 (market-based) emissions generated directly from Barclays’ branches, offices, campuses, data centres and car fleet, as well as emissions generated indirectly from our global real estate portfolio’s3 energy consumption. How we performed In 2024 we continued to source 100% renewable electricity for our global real estate portfolio ahead of our 2025 year end target and to track ahead of our target of 90% absolute reduction of our Scope 1 and 2 market-based emissions against a 2018 baseline – reducing these emissions by 95%. Sustainable and Transition Financing facilitated ($bn) 2024 2023 94.4 67.8 About this KPI and why we use it In 2022, we set a target of $1trn Sustainable and Transition Financing between 2023 and the end of 2030 – encompassing green, social, transition and sustainability-linked financing, having exceeded our previous targets to facilitate £150bn of social, environmental and sustainability linked financing by 2025 and £100bn of green financing by 2030. How we performed During 2024 we facilitated an additional $94.4bn of Sustainable and Transition Financing, bringing the total to date to $162.2bn. The 39% year-on-year increase in financing facilitated demonstrates our continued efforts on supporting our clients on their sustainability journeys. Skills and employability: Number of people upskilled (millions) 2024 2023 2.77 3.27 About this KPI and why we use it Barclays is delivering skills and employment opportunities for people in the communities where we operate. The total number of unique people supported to unlock skills and employment opportunities includes those upskilled through our LifeSkills, Digital Eagles and Military and Veterans Outreach programmes. How we performed After removing duplicates to account for repeat users, we upskilled a further 2.77m people in 2024 through Barclays LifeSkills, Digital Eagles and Military and Veterans Outreach, growing the total to 6.05m since the beginning of 2023 and demonstrating good momentum across Barclays’ community programmes. Sustainable growth: Number of businesses supported (thousands) 2024 2023 4.61 5.63 About this KPI and why we use it Barclays is championing innovation and sustainable growth through programmes that unlock the world of finance, enabling businesses and economies to grow. The total number of businesses supported in our communities includes those engaged through Barclays’ Eagle Labs, Rise, Unreasonable Impact and select impact-led portfolios managed by Barclays’ Principal Investments team. How we performed After removing duplicates to account for repeat users, in 2024 we supported a further 4,614 businesses through these programmes, demonstrating Barclays’ continued commitment to providing a connected pathway of support for start-ups and scale- ups at every stage of their growth journey. Progress of financed emissions Portfolio December 2024 Cumulative performance vs. baseline Upstream Energy 41.1 MtCO2e (absolute emissions) -45 % Power 219 KgCO2e/MWh (physical intensity) -30 % Cement 0.576 tCO2e/t (physical intensity) -9 % Steel 1.492 tCO2e/t (physical intensity) -23 % Automotive manufacturing 176.3 gCO2e/km (physical intensity) +1 % UK Commercial real estate 29.5 kgCO2e m2 (physical intensity) -2 % UK Agriculture 0.47 MtCO2e (absolute emissions) -11 % Aviation 879 gCO2e/RTK (physical intensity) 0 % UK Housing 31.8 kgCO2e/m2 (physical intensity) -1 % Date baseline set: n December 2020 n December 2021 n December 2022 n December 2023 About this KPI and why we use it Barclays is committed to reducing our financed emissions, those deriving from the activities of the clients that we finance and those generated in their respective value chains, by providing financial advice and support as they transition to a low-carbon economy. How we performed Our detailed analysis of our sectors and performance is contained within the Climate and Sustainability section from page 35. Notes: 1 For improved accuracy we have updated the heading and metric description of the net zero operations KPIs in comparison to the equivalent section of 2023 Bplc Annual Report. 2 We aim to develop our approach to counterbalance residual emissions as we near 2050, by evaluating latest technology and market practices on carbon credits. 3 In the net zero operations section. a reference to global real estate portfolio includes offices, branches, campuses and data centres within our operational control. Strategy Shareholder information Climate and sustainability report Governance Risk review Financial review Financial statements Barclays PLC 2024 Annual Report on Form 20-F 19 Our stakeholders (continued) See page 112 for details on Executive Director remuneration linked to these KPIs Please see page 48 for further detail on our target 2024 2023 2022
A strategy for a better financial future Our climate strategy is driven by consideration of relevant risks and opportunities and in alignment with our Purpose: working together for a better financial future for our customers, clients and communities. Barclays’ climate strategy 1 2 3 Achieving net zero operations Reducing our financed emissions Financing the transition Barclays is working to reduce its Scope 1, Scope 2 and Scope 3 operational emissions1 consistent with a 1.5°C aligned pathway, and we plan to counterbalance1 any residual emissions. Barclays is committed to aligning its financing with the goals and timelines of the Paris Agreement, consistent with limiting the increase in global temperatures to 1.5°C. Barclays is helping to provide the green and sustainable finance required to transform the economies, customers and clients we serve. Our strategy is underpinned by the way we assess and manage our exposure to climate-related risk Our ambition is to be a net zero bank by 2050, aligning our financing with the goals and timelines of the Paris Agreement, by achieving net zero operations, reducing our financed emissions and financing the transition. Achieving net zero operations We are committed to achieving net zero operations and have maintained and further progressed on our milestones and targets. We continued to source 100% renewable electricity for our global real estate portfolio ahead of our 2025 target and track ahead of our target of 90% reduction of our Scope 1 and 2 market-based emissions against a 2018 baseline – reducing these emissions by 95%. We also enhanced our visibility and understanding of our supply chain emissions data through increased supplier engagements, unlocking new opportunities to seek to decarbonise our supply chain. Reducing our financed emissions Driven by consideration of relevant risks and opportunities and in alignment with our Purpose, we are also committed to reducing our financed emissions, which are those deriving from in- scope activities of the clients that we finance. To support our efforts to do so we have set 2030 financed emissions targets which integrate 1.5oC aligned scenarios for eight high-emitting sectors: Upstream Energy, Power, Cement, Steel, Automotive manufacturing, Aviation, UK Agriculture and UK Commercial Real Estate, as well as 2025 targets for Upstream Energy and Power and a convergence point for our UK Housing portfolio. Our Climate Change Statement outlines the policy that supports our effort to reduce our financed emissions in relation to certain sensitive sectors. In addition, our Client Transition Framework, through which we evaluate in-scope corporate clients' progress toward business models aligned with a transition to a low-carbon economy, helps to inform our approach to reducing financed emissions, and our client engagement and decision-making processes. We set out our progress against our financed emissions targets in this report. In particular, we have reduced the emissions intensity of our Power portfolio by 30% between 2020 and 2024 against our target of 30% by 2025 and our Upstream Energy portfolio by 45% between 2020 and 2024 against our target of 40% by end of 2030. Note: 1 We define our Scope 3 operational emissions to include supply chain, waste, business travel and leased assets Strategy Shareholder information Climate and sustainability report Governance Risk review Financial review Financial statements Barclays PLC 2024 Annual Report on Form 20-F 20 Barclays’ climate strategy
Financing the transition Capital is critical for a successful energy transition and the scale of our business gives us the opportunity to help finance this – to use our global reach, products, expertise and position in the global economy to work with our clients. We believe banks can play a broader, systems-wide role in supporting the transition beyond financing, such as helping to create the ecosystems in which low carbon technology can flourish. This includes working with clients and other organisations to unlock new financial solutions, understanding and informing policy and regulatory debates, and identifying ways to support innovation and new climate solutions for our clients. The world needs to accelerate and scale the supply and capacity of renewables and climate tech solutions that will help to decarbonise high- emitting activities, to reduce reliance on fossil fuels. Many highly carbon-intensive sectors require finance to transition to a low-carbon economy. The Climate Policy Initiative estimates that this requires $7.4trillion of climate finance annually through 20301. Barclays is committed to help finance the energy transition. In 2022 we set a target to facilitate $1trn of Sustainable and Transition Financing between 2023 and the end of 2030. In 2024 we facilitated $94.4bn of Sustainable and Transition Financing, of which $88.7bn was Sustainable Financing and $5.7bn was Transition Financing. We are also focused on investing and scaling climate tech, the physical and digital technologies that will reduce or remove greenhouse gas emissions or improve resilience or adaption to the physical impacts of climate change, for example, – hydrogen, carbon capture, batteries, amongst others . To support this, Barclays Climate Ventures, formerly Sustainable Impact Capital, has a mandate to invest up to £500m of Barclays’ own capital by the end of 2027 and has invested £203m into over 20 innovative companies since 2020. Integrating nature and human rights considerations into our approach Nature and social impacts are interlinked with climate change and the efforts to mitigate and adapt to it. During 2024, we continued our work to build an understanding of how our activities, and those of our clients, impact and depend on nature. We also took further steps to enhance and embed the Group’s approach to respecting human rights informed by the 2023 salient human rights risk assessments with the corporate and investment bank financing portfolios2. Implementing our strategy against a shifting landscape While we have made progress in our ambition towards becoming a net zero bank, and continue to see a significant opportunity to demonstrate our commercial leadership and support for our clients in the transition, we recognise that the shift to a low-carbon economy is complex and subject to significant uncertainties. Our ability to implement our climate strategy depends heavily on our clients’ ability to commercially decarbonise their business models, which is influenced by a wide range of external factors, including market developments, technological progress and its financial viability, a stable and supportive policy environment, regulatory alignment, changes to societal behaviour, geopolitical developments and regional variations. 2024 marked the first year in which the monthly global average temperature exceeded 1.5°C3 and real economy emissions and government policies to reduce them remain misaligned with maintaining global warming at a 1.5°C average. Further divergence in the policy environment across the major global economies is likely to exacerbate that trend in 2025. Since we set our first emissions targets in 2020, we have evolved our approach significantly, developing new data sources, tools and products to support our clients. Our climate strategy will continue to evolve as we continue to pursue our ambition of being a net zero bank by 2050 against the shifting and rapidly developing landscape. Additionally, as scientific evidence relating to climate change and information on real world progress towards net zero emerges, we will incorporate this into our thinking and our approach. Our Transition Plan Work is underway on a Transition Plan which will set out in detail the actions we are taking to support the implementation of our climate strategy. The plan will also seek to incorporate our developing thinking on nature and social issues, highlight the key dependencies on our the path towards net zero and hopefully encourage broader support in tackling them. We intend to publish our Transition Plan later this year. Please see the Barclays Climate and Sustainability report from page 20 for further details on Barclays' ambition to be a net zero bank by 2050. Further details on our BlueTrack™ methodology can be found within our Financed Emissions Methodology paper (published in 2024) accessible at: home.barclays/sustainability/esg- resource-hub/reporting-and-disclosures/ Notes: 1 Climate Policy Initiative - Global Landscape of Climate Finance climatepolicyinitiative.org/wp-content/uploads/2024/10/ Global-Landscape-of-Climate-Finance-2024.pdf 2 This saliency assessment was completed for the then Corporate and Investment Bank portfolio in 2023, which in today’s Group structure equates to the Investment Bank and select parts of the UK Corporate Bank. 3 https://climate.copernicus.eu/copernicus-2024-first-year- exceed-15degc-above-pre-industrial-level#:~:text=The %20monthly%20global%20average%20temperature,2024%2C %20at%2017.16%C2%B0C. Strategy Shareholder information Climate and sustainability report Governance Risk review Financial review Financial statements Barclays PLC 2024 Annual Report on Form 20-F 21 Barclays’ climate strategy (continued)
Our strategy, selected targets and progress The table below sets out progress against our strategy and selected targets Strategic pillar Previously Announced Target Progress 1 Achieving net zero operations By end 2025 2024 performance Energy • 100% renewable electricity sourcing for our global real estate portfolio by end of 2025 100% sourced Reduction of GHG emissions • 90% absolute reduction in Scope 1 and 2 GHG emissions (market-based, against a 2018 baseline) -95% reduction 2 Reducing our financed emissions Portfolio reduction targets/ convergence point By the end of 2030 Cumulative change Upstream Energy1 • 40% reduction in absolute CO2e emissions against a 2020 baseline of 74.1 MtCO2e (Scopes 1, 2 & 3) -45% Power1 • 50-69% reduction in CO2e emissions intensity against a 2020 baseline of 311 kgCO2e/MWh (Scope 1) -30% Cement1 • 20-26% reduction in CO2e emission intensity against a 2021 baseline of 0.631 tCO2e/t (Scopes 1 & 2) -9% Steel • 20-40% reduction in CO2e emissions intensity against a 2021 baseline of 1.945 tCO2e/t (Scopes 1 & 2) -23% Automotive Manufacturing • 40-64 % reduction in CO2e emissions intensity against a 2022 baseline of 174.8 gCO2e/km (Scopes 1, 2 & 3) 1% Aviation • 11-16 % reduction in CO2e emissions intensity against a 2023 baseline of 882 gCO2e/RTK (Scopes 1 & 3) 0% UK Commercial Real Estate • 51% reduction in CO2e emissions intensity against a 2023 baseline of 30.0 kgCO2e/m2 (Scopes 1 & 2) -2% UK Agriculture1 • 21% reduction in absolute CO2e emissions against a 2023 baseline of 0.53 MtCO2e (Scopes 1, 2 & 3) -11% UK Housing • Convergence point: 40% reduction in CO2e emissions intensity against a 2023 baseline of 32.1 kgCO2e/m2 (Scopes 1 & 2) -1% 3 Financing the transition 2024 performance Sustainable financing • Facilitate $1trn of Sustainable and Transition Financing between 2023 and the end of 20302 • $94.4bn • (LTD $162.2bn) Barclays Climate Ventures (formerly Sustainable Impact Capital) • Increase mandate to invest up to £500m of Barclays' capital in climate tech start-ups by the end of 2027 • £65m (£203m invested by the end of 2024) Notes: 1 Previously reported baseline values have been re-baselined in the current year. 2 Our previously announced target to facilitate £150bn of social, environmental and sustainability-linked financing by 2025 was exceeded in 2021 and £100bn of green financing by 2030 was exceeded in 2023. Strategy Shareholder information Climate and sustainability report Governance Risk review Financial review Financial statements Barclays PLC 2024 Annual Report on Form 20-F 22 Barclays’ climate strategy (continued)
Climate action roadmap Barclays has been taking action on climate change for a number of years. The below roadmap highlights key targets, actions and policies relating to achieving net zero operations, reducing our financed emissions and financing the transition. These are key milestones on the way to achieving our ambition to be a net zero bank by 2050. Pre- 2018 2018 2019 2020 2021 2022 2023 2024 2025 2026 2030 2035 2050 Notes: 1 Financial Stability Board | 2 Taskforce on Climate-related Financial Disclosures | 3 See our Climate Change Statement which sets out our position and approach to financing certain sensitive sectors, taking into account relevant risk and other considerations as well as our Purpose. | 4 See section on Net Zero Operations for latest targets and milestones | 5 Paris Agreement Capital Transition Assessment | 6 See section Reducing our financed emissions | 7 Originally called Residential Real Estate, updated in 2024 | 8 Barclays' Climate Ventures, previously Sustainable Impact Capital | 9 Net-Zero Banking Alliance | 10 Partnership for Carbon Accounting Financials | 11 PCAF Standard - PCAF (2022). The Global GHG Accounting and Reporting Standard Part A: Financed Emissions. Second Edition. Strategy Shareholder information Climate and sustainability report Governance Risk review Financial review Financial statements Barclays PLC 2024 Annual Report on Form 20-F 23 Barclays’ climate strategy (continued) • Joined Paris Pledge for Action in 2015 • Signed statement of support of the FSB’s1 TCFD2 in 2017 • Joined PACTA5 pilot • Published Climate Change Statement3 setting out restrictions for sensitive sectors • Founding member of the NZBA9 • Exceeded target to facilitate £150bn of social, environmental and sustainability-linked financing by 2025 • Exceeded 2025 operational emissions and energy targets4 • Announced 2030 Autos financed emissions target, convergence point for UK Housing7 and ambition for 50% of mortgages to have EPC C or better by 20306 • Expanded our net zero operations approach and announced new operational milestones4 • Exceeded target to facilitate £100bn of green financing by 2030 • Financing restrictions came into effect for certain thermal coal mining, coal power and oil sands clients3 • Tightened financing restrictions for coal-fired power generation clients3 came into effect • Transition plan expectations for Energy Groups in effect3 • Financing to thermal coal mining or coal-fired power generation clients in the EU and OECD will be phased out3 • Financing to clients with >10% revenue from thermal coal mining or coal-fired power generation in the RoW will be restricted3 • NZ ambition • Announced 2025 £150bn social and environmental financing target and 2030 £100bn green financing target • One of the first UK banks to launch a 'Green Home Mortgage' • Announced targets to reduce operational emissions by 80% and procure 90% renewable energy by 20254 • Announced ambition to be a net zero bank by 2050 • Launched BlueTrack™ with 2025 Upstream Energy and Power financed emissions targets6 • Launched £175m Barclays' Climate Ventures8 initiative • Announced 2030 Upstream Energy, Power, Cement and Steel targets6 • Announced $1tn Sustainable and Transition Financing target and increased BCV8 mandate to invest up to £500m • Announced new operational emissions and electricity sourcing targets4 • Elevated Climate Risk to Principal Risk • Held a ‘Say on Climate’ advisory vote • Updated Climate Change Statement with new financing restrictions for upstream oil and gas3 • Announced 2030 financed emissions targets for UK Agriculture, UK Commercial Real Estate, and Aviation, and updated scope of UK Housing7 convergence point6 and EPC ambition • Reported estimated full in- scope balance sheet financed emissions using PCAF10 Standard11 methodology for first time • Minimum requirements for Scope 1 and 2 targets, methane abatement and venting/flaring for Energy Groups will come into effect3 • All financing to thermal coal mining or coal-fired power generation clients will be phased out3
Climate-related risks identified over the short, medium and long term Our climate strategy is underpinned by the way we assess and manage our exposure to climate-related risks. Climate Risk is a Principal Risk within the Barclays Enterprise Risk Management Framework. Barclays faces exposure to climate-related risks either directly through its operations and infrastructure or indirectly through its financing and investment activities. The two main categories of climate risk are physical risks and transition risks. - Physical risk is defined by Barclays as the risk of financial losses related to physical impacts of a changing climate. Physical risks can be event driven (acute risks), including increased frequency and/or severity of extreme weather events such as cyclones, hurricanes and flood. Longer term shifts in climate patterns (chronic risks) arise from sustained higher temperatures that may cause rises in sea levels, rising mean temperatures and more severe weather events such as increased occurrence of floods or fires. - Transition risk is defined by Barclays as the risk of financial losses caused by extensive policy, legal, technology and market changes to address mitigation and adaptation requirements related to climate change. Physical and transition risks can have varying degrees of impact on Barclays and its clients, influenced by geographic and jurisdictional factors, including differing vulnerabilities to physical hazards like flooding and hurricanes as well as diverse regulatory requirements that must be adhered to for transitioning to a low- carbon economy. Time horizons The impact of physical and transition risks can be significant and widespread, affecting Barclays' portfolio and financial performance over short, medium and long-term horizons. Significant uncertainty remains around the timing of major climate-related impacts, although some effects have already surfaced, So far, these impacts, have been largely contained within specific geographies and sectors, but they carry the potential to escalate and trigger broader impact on financial systems. In the short term, physical risks arising from extreme weather events and climate-related disasters pose a direct threat to Barclays' physical assets and infrastructure. This can potentially result in immediate losses, increased costs for repair and higher insurance premiums. Similarly, acute events may also potentially damage the physical facilities of Barclays' clients or cause business disruptions, which may adversely impact the value of clients' assets, reduce their profitability and subsequently lead to potential increase in credit risk for Barclays. Additionally, business facilities and operations in regions prone to high physical risks may also experience higher insurance premiums or limited insurance coverage. Transition risks could occur in all timeframes. Short to medium-term developments may be largely driven by new regulations and technological breakthroughs aimed at replacing carbon- intensive methods. There remains significant uncertainty around the speed and scale of transition. The cost of transitioning to cleaner technologies and sustainable business practices may strain the financial resources of businesses, affecting their profitability and long-term viability. There may be challenges related to employment opportunities as businesses transition away from carbon-intensive practices. This in turn may impact the creditworthiness of Barclays' clients and their ability to repay loans. Financial institutions like Barclays could also face significant increases in costs and resources allocated to adhere to new policies, laws and regulations aimed at transitioning to a low-carbon economy. This in turn may lead to higher conduct and operational risks to Barclays. Transition risks aimed at mitigating climate change can also impact the profitability and value of assets in Barclays' portfolio, particularly those linked to carbon-intensive industries. Companies perceived as slow to adapt or unresponsive to environmental concerns may face reputational damage or legal actions leading to decreased customer trust and investor support. With escalating concerns and heightened global awareness of climate risks, it is likely that litigation linked to these risks will increase. Additionally, Barclays may face greater scrutiny of the type of business it conducts – including in the form of adverse media coverage and an increase in climate-related litigation cases. This in turn may adversely impact customer demand for Barclays' products, returns on business activities, value of assets and trading positions, resulting in higher impairment charges. Looking to the longer term, the cumulative effects of global temperature rise are likely to become increasingly pronounced – influencing ecosystems, sea levels and societal structures. Climate change can also trigger tipping points through feedback loops that amplify its effects. Certain tipping points are already underway, manifesting in observable changes across the globe. Different tipping points, such as the melting of ice sheets or changes in ocean circulation, have varying time horizons. As the climate science develops, it appears that some tipping points may run on a shorter timeline than initially expected. Accordingly, the uncertainty of exact timeframes in which such tipping points are expected to materialise adds a layer of complexity – making it challenging to precisely predict when impacts will materialise. When considering the timescales of climate- related risks, Barclays has categorised short, medium and long term as follows: • Short term (S): 0-1 year • Medium term (M): 1-5 years • Long term (L): > 5 years. The short-term timescale coincides with the short- term plan for annual budgets and granular financial plans. The medium term coincides with the five- year financial, capital and funding plans. Barclays has updated its definition for the long term horizon from 5-30 years to >5 years. The revised definition offers flexibility to conduct assessments across a range of long-term timeframes, while also supporting the development of Barclays' climate strategy, including its sustainable finance objectives. Additionally, the updated definition aligns with the guidelines on time horizons specified in European Sustainability Reporting Standards. Climate change as a driver of risk The feedback effects of climate risk drivers through macro and micro transmission channels are observed in Barclays' portfolio through traditional risk categories such as credit risk, market risk, treasury and capital risk, operational risk and reputational risk.The approach for managing climate-related risks is consistent with other key risks, however there remains significant uncertainty around when these risks will materialise. Barclays has implemented a risk management framework for managing financial and operational risks from climate change which integrates within the broader Enterprise Risk Management Framework. This framework aims to guide effective management of climate risk and support the delivery of Barclays' climate strategy. Climate risk may also drive non- financial risks such as reputational risk, which continue to be managed under their respective risk frameworks. Strategy Shareholder information Climate and sustainability report Governance Risk review Financial review Financial statements Barclays PLC 2024 Annual Report on Form 20-F 24 Risk and opportunities TCFD Strategy Recommendation A
The Climate Risk Framework is reinforced by policies, standards and guidelines which contain control objectives and requirements that must be adhered to by different teams across business lines and risk management departments. Barclays' approach and framework undergoes regular reviews and updates – including changes to the risk taxonomy, definitions and methodology – to align with changing regulatory expectations and external developments. The potential impacts of physical and transition risk drivers will vary across Barclays' portfolios depending on composition, industry, geographic location, business operations and other contextual factors. The tables below set out the example drivers, example potential impacts and expected time horizons of various physical and transition risks in accordance with the TCFD categories. Further details on how Barclays manages climate risk can be found on pages 209 to 212. Transition risks Policy and legal Reputation Technology Market Example drivers • Carbon tax impacting sectors and clients • Enhanced GHG reporting obligations • Government and non-governmental organisations taking litigation actions • Increased stakeholder concern or negative stakeholder feedback • Shifts in consumer preferences • Stigmatisation of sectors • Disruptive substitute technologies being favoured because of lower carbon footprint • Development of emissions capture and recycling facilities • Investments in energy efficient products • Changes in supply and demand of raw materials • Uncertainty in market signals • Changing market sentiment Example potential impacts • Increased operating costs and expenses to comply with new regulations • Write-offs and early retirement of assets due to policy changes • Increased costs associated with litigation actions • Increased costs and reduced demand for products and services • Decreased production capacity due to poor employee attraction and retention • Reduction in capital availability • Write-offs and early retirement of carbon-intensive assets • Research and development expenditure in new technologies • Costs for adoption of new practices and processes • Increased costs and reduced demand for products and services • Increased production costs due to changing input prices and output requirements • Decreased revenue and repricing of assets Expected time horizons S, M, L Physical risks Acute Chronic Example drivers • Damage to fixed assets and infrastructure (e.g. property, power supplies) by wildfires • Adverse impact on agriculture and production of soft commodities due to drought • Transport difficulties and damage to infrastructure due to severe storm and flooding • Change in weather and precipitation patterns resulting in reduced agricultural yields and land no longer suitable for farming • Potential population migration due to uninhabitable land • Increase in sea levels and consequent coastal erosion requiring building of new seawall and flood defences • Rising temperatures resulting in diminished productivity and health issues Example potential impacts • Increased costs due to damage to facilities and potential devaluation of properties • Reduced revenue from decreased production capacity • Increased operating costs and decrease in sales due to unavailability of raw materials and supply chain disruptions • Reduced revenue from decreased production capacity and early retirement of assets • Decrease in property values • Increased costs and insurance for assets in high-risk locations • Reduced revenue from lower sales and output Expected time horizons S, M, L M, L Strategy Shareholder information Climate and sustainability report Governance Risk review Financial review Financial statements Barclays PLC 2024 Annual Report on Form 20-F 25 Barclays’ climate strategy (continued)
Building our understanding of nature-related risk Nature-related risks arise from an organisation's dependencies and impacts on nature. These risks can be physical risks and transition risks, which in turn can present financial risks. As part of our work to further build our understanding and management of nature-related dependencies, impacts, risks and opportunities, we applied the Taskforce on Nature- related Financial Disclosures' (TNFD) ‘LEAP’ framework to clients in our Barclays Mining and Barclays Europe Power portfolios. This work has drawn on experience from our previous sector heatmap analyses and LEAP assessment of our Food and Agriculture portfolio in the UK and Europe, with the intention of developing a replicable approach for assessing nature at a sector level. Through these assessments Barclays sought to identify the locations of operating sites of in scope Mining and Power clients and their overlap with the Sensitive Locations criteria recommended by the TNFD. For a selection of prioritised impacts such as land use change, water use, air and water pollution, Barclays evaluated the potential severity and likelihood of these impacts occurring at these sites located in Sensitive Locations and assessed the related physical and transition risks in a preliminary exercise using scenario analysis techniques over short and medium-term horizons. We are developing a set of recommendations to enhance our approach to managing nature- related impacts and risks, informed by the LEAP assessment findings. In 2025, we plan to build on our work undertaken in 2024 to conduct a pilot engagement exercise with a selection of in scope Mining and Power clients, to share insights and - where applicable - to explore their strategic and financing requirements as well as undertake a further sectoral LEAP assessment. Furthermore, in 2025 we intend to publish a whitepaper which details our approach and insights from applying the LEAP framework as a financial services provider. Note: In applying the above approach to our Barclays Europe Power and Barclays Mining portfolios, we recognise that there remain limitations in the coverage and quality of certain data sets - for example differing spatial resolutions for 'state of nature' data, or limited availability of site level corporate impact data - that limit the ability of the exercise to draw reliably accurate conclusions for certain areas at this time. We also note that the Power and Mining sectors are highly regulated industries, subject to environmental permitting and scrutiny throughout the lifecycle of all such operations. Sustainability and climate-related opportunities identified over the short, medium and long term We recognise the opportunities for Barclays arising from the global transition to a low- carbon economy, which includes scaling up zero or near-zero emitting technologies and businesses and supporting emissions reductions in high-emitting and hard-to- abate sectors. At the end of 2022, we announced a target to facilitate $1trn of Sustainable and Transition Financing by the end of 2030. This followed a review in 2022 of the financing requirements arising from the global transition and the potential addressable market for Barclays. The market opportunity Our 2022 analysis indicated, across North America, Europe and Asia Pacific (excluding China) and based on the then existing policy, technology and market developments, a 10-year addressable opportunity of over $16trn to finance the energy transition, including renewables and early-stage climate technologies that are needed to scale to support the transition to net zero, and an estimated $3.5trn-6trn annual opportunity in sustainable finance instruments through to the end of 2030. In the UK specifically, the analysis indicated that Green Home Mortgages and retrofit finance for homes represented a ~$400-600bn opportunity through to the end of 2030; while retrofit investment needed for non-residential buildings in the UK represented a ~$27-41bn opportunity over the same period. We have continued to analyse the opportunity in sustainable and transition finance as markets evolve, building on our 2022 review, to further inform strategic decision-making and evaluate how we can best support our clients as they transition. In 2024 our analysis looked at financing opportunities for climate technologies under a range of climate scenarios up to the end of 2030 and identified key growth opportunities in the short and medium term across renewable energy (including wind and solar), low-emissions transport, power grid and energy efficiency technologies. We continue to see a significant opportunity for Barclays. To determine the addressable global market for sustainable finance to the end of 2030, our 2022 market review leveraged widely used and credible third-party sources including the IEA, IRENA, Climate Bonds Initiative and the IFC as well as Barclays' own industry, ESG and market research. The analysis considered the investment needed through to the end of 2030 for the world to align to net zero, including the accelerated scenarios reflecting possible policy and market developments. Having determined the global addressable opportunity, Barclays developed scenarios for the Bank's potential market for various asset classes, product sets, technological sectors and geographic markets, validated through comparison with historic growth rates and our projected share of the overall market. We continue to assess and update our view of the sustainable and transition finance market opportunity, working with third- party consultants and completing proprietary analysis. $1trn Sustainable and Transition Financing target Following analysis of the market opportunity for sustainable financing, together with a review of the Group's capabilities, in December 2022 we announced a new target to facilitate $1trn of Sustainable and Transition Financing between 2023 and the end of 2030. We recognise that we must tackle the decarbonisation of 'hard-to-abate' sectors that are carbon intensive – including through scaling and commercialising new technologies such as hydrogen and carbon capture. During 2023 we developed a Transition Finance Framework, which we published in early 2024. The Transition Finance Framework sets out the criteria for the inclusion of transition financing in our $1trn target. The inclusion of transition financing reflects our recognition of the importance of lending and facilitating funding and investing in technologies and activities that support GHG emission reduction (directly or indirectly) in high-emitting and hard-to-abate sectors. Our progress towards achieving our ambition of facilitating $1trn of Sustainable and Transition financing will be non-linear and depend on appetite from our clients as well as broader regulatory and policy factors. We will continue to evaluate and evolve our approach to focus on where Barclays can best support its clients and capture the biggest share of the opportunity in alignment with our broader Group strategy. Further details of Barclays' sustainable finance targets can be found on page 48. Further details of Barclays' Transition Finance Framework can be found on page 50. Strategy Shareholder information Climate and sustainability report Governance Risk review Financial review Financial statements Barclays PLC 2024 Annual Report on Form 20-F 26 Barclays’ climate strategy (continued)
Group sustainable finance strategy In 2023, we developed a roadmap to build a market leading sustainable finance franchise and to deliver on our $1trn financing target between 2023 and 2030 while supporting clients through the energy transition. This work built on the findings of the 2022 market opportunity analysis we completed and considered Barclays' competitive strengths to identify strategic opportunities in sustainable and transition finance where we believe Barclays can differentiate itself and best support our clients and the global economy to accelerate the transition to net zero. The strategy aligns with the climate and environmental themes that were identified when we announced our $1trn Sustainable and Transition Financing target in December 2022 and therefore underpins our plan to deliver on that ambition. Our strategy to deliver on our sustainable finance ambition Three pillars where we can deliver for clients and stakeholders: Support UK net zero Leading climate tech partner Sustainable banking and credit markets • Deliver for customers and clients through our propositions for Real Estate, SMEs and Agriculture • Be the leading partner for UK treasurers for sustainable finance and sustainable banking • Support UK transition projects through advisory and financing solutions • Facilitate the flow of capital to new and existing technologies critical to the net zero transition • Develop expertise and infrastructure financing solutions for the deployment of new technologies • Support climate tech companies across their lifecycle, from idea to IPO and connecting corporate customers to the start-up ecosystem • Utilise our strength in credit markets to facilitate clients’ transition plans • Play a leading role in the creation of carbon and nature markets • Unlock additional sources of capital, including through securitisation, savings and investments In 2024, we continued to execute against this strategy. We have mobilised a cumulative $162.2bn towards our $1trn financing target since the start of 2023, hired experienced talent, launched new products across our businesses and developed new partnerships. Our progress was recognised in 2024 by being awarded the 'Best Bank for ESG in the UK' award by Euromoney for the second year running. In 2024 we evolved our sustainable finance strategy to adapt to internal and external factors, including aligning it to the Group’s updated strategy, with a refined ambition to be the UK centred leader in Sustainable Finance. In 2024, a new role of Group Head of Sustainable and Transition Finance was created bringing together our Group Sustainability and Sustainable Finance teams under one leadership. This new structure has strengthened the team’s ability to provide deep expertise, advice and high- quality support to deliver commercial results whilst also meeting the expectations of the communities we serve. See page 170 for more details. Identifying nature-related opportunities Nature-related financing presents future opportunities for the financial sector given the capital requirements to halt and reverse nature loss by 2030 as outlined in the Global Biodiversity Framework. The Framework, adopted at COP15, outlines the biodiversity financing gap, including the role of both public and private capital as an estimated $700bn per year1. As we execute our sustainable finance strategy, we aim to identify opportunities to play a role in supporting the financing of nature. In 2024, we assessed the potential nature opportunities and products that Barclays could target, with a deep dive review of four material sectors for nature: Food, Agriculture, Mining and Power. This found that there are opportunities to support clients and their value chains with the nature-positive transition. In many cases, opportunities arise from helping clients avoid and minimise negative impacts on nature, enhancing their resilience and response to societal and regulatory pressures. Note: 1 cbd.int/doc/c/e6d3/cd1d/daf663719a03902a9b116c34/ cop-15-l-25-en.pdf Strategy Shareholder information Climate and sustainability report Governance Risk review Financial review Financial statements Barclays PLC 2024 Annual Report on Form 20-F 27 Barclays’ climate strategy (continued)
Achieving net zero operations Although financing activities account for the greatest proportion of our climate impact, we continue to address our operational emissions – an important factor in meeting our ambition to be a net zero bank by 2050. Decarbonising our operations can have substantial benefits for Barclays including cost savings, greater operational resilience, potential commercial opportunities, and strengthening relationships with clients and Third Party Service Providers (TPSPs)1. Defining net zero operations We define net zero operations as the state in which we will achieve GHG emissions reduction of our Scope 1, Scope 2 and Scope 3 operational emissions2 consistent with a 1.5oC-aligned pathway and we plan to counterbalance3 any residual emissions. We continue to review and enhance our approach as data quality, scientific developments and market practices evolve. Net zero operations strategy Our net zero operations strategy is focused on decarbonising the most emission-intensive areas of our operations, where we think we have the greatest ability to influence a reduction in those emissions over time, for example our real estate, technology, travel and supply chain. Our strategic levers of decarbonisation include: • Reducing energy demand, improving energy efficiency, electrification of our global real estate portfolio and vehicles, renewable electricity sourcing and replacing fossil-fuel- powered infrastructure with low-emission alternatives to reduce our Scope 1 and 2 emissions; • Key stakeholder engagements and collaborations, including with TPSPs, landlords and our colleagues, to track, manage and reduce Scope 1, 2 and 3 operational GHG emissions – while continuing to embed climate considerations across our decision-making processes, policies and contractual requirements. Progress to date We have set milestones4 and targets5 to support our progress towards net zero operations. In 2024 we continued to track ahead of our our milestone to reduce by 50% our absolute Scope 1 and 2 location-based GHG emissions by the end of 2030 – reducing these emissions by 56% against a 2018 baseline. This reduction is driven by ongoing work across our global real estate portfolio6, including energy demand reduction, for example by right- sizing7 our real estate and by improving our real estate's energy efficiency through our energy optimisation programme, and by our progress with our company cars electrification. Also, an external contributor to our Scope 2 location-based emissions reduction was the decarbonisation of some of the electricity grids in the countries in which we have operational presence. In 2024 we continued to source 100% renewable electricity8 for our global real estate portfolio ahead of our 2025 year end target and continued to track ahead of our target of 90% absolute reduction of our Scope 1 and 2 market-based emissions against a 2018 baseline – reducing these emissions by 95%. Our focus on renewable electricity sourcing helped us maintain this target performance. We have observed a reduction in our absolute supply chain emissions of 36% against our 2018 baseline. Whilst we have observed a reduction, there are limitations to our reported figure, as 54% of our supply chain emissions are estimated using GHG conversion factors applied to spend, therefore our reported reduction may not directly correlate to actual supply chain emissions decarbonisation. To try to address this limitation, our objective is to continue to work with our TPSPs to seek to increase the volume and quality of our primary data, having by the end of 2024 increased it by 19% from previous year. Enhanced visibility and understanding of our TPSPs' climate- related data will help us to assess our TPSPs’ progress more effectively against our milestones and enhance our TPSPs' engagements. Notes: 1 TPSP means any entity that has entered an arrangement with Barclays in order to provide business functions, activities, goods and/or services to Barclays 2 We define our Scope 3 operational emissions to include supply chain, waste, business travel and leased assets. 3 We aim to develop our approach to counterbalance residual emissions as we near 2050, by evaluating latest technology and market practices on carbon credits. 4 In this Achieving net zero operations section, a reference to a 'milestone' denotes an indicator we are working towards and report against. 5 In this Achieving net zero operations section, a reference to a 'target'” denotes an indicator linked to our executive remuneration. 6 In this Achieving net zero operations section. a reference to global real estate portfolio includes offices, branches, campuses and data centres within our operational control. 7 In this Achieving net zero operations section, a reference to, right-sizing means, we are exercising opportunities through lease events or by way of negotiation to alter the square footage of an existing occupation to optimise our space and associated resources for our operational requirements in that location. 8 In 2024 we maintained 100% renewable electricity sourcing for our global real estate portfolio through instruments including green tariffs (16%), energy attribute certificates (EACs)(48%), and energy attribute certificates from power purchase agreement (PPA) (36%). Green tariffs are programmes in regulated electricity markets offered by utilities, allowing large commercial and industrial customers to buy bundled renewable electricity from a specific project through a special utility tariff rate. EACs are the official documentation to prove renewable energy procurement. Each EAC represents proof that 1 MWh of renewable energy has been produced and added to the grid. Global EAC standards for renewable claims are primarily Guarantees of Origin in Europe and UK, Renewable Energy Certificates (RECs) in North America and International RECs (I- RECs) in a growing number of countries in Asia, Africa, the Middle East and Latin America. Strategy Shareholder information Climate and sustainability report Governance Risk review Financial review Financial statements Barclays PLC Annual Report 2024 28 Implementing our Climate Strategy TCFD Strategy Recommendation (b) | Strategic Pillar 1
Our net zero operations milestones1 and targets1 By the end of Scope 1 and 2 2023 performance 2024 performance Scope 3 2023 performance 2024 performance 2025 We have a target1 of 100% renewable electricity sourcing for our global real estate portfolio 100% 100% We intend to work towards the milestone1 of 70% of our suppliers, by addressable spend6, having science- based GHG emissions reduction targets7 in place 57%8 64%8 We have a target1 of 90% absolute reduction in our Scope 1 and 2 market-based GHG emissions against a 2018 baseline 93% 95% We intend to work towards the milestone1 of 100% electric vehicles (EV) transition for UK company cars 88% 98%2 2030 We intend to work towards the milestone1of 100% EV or ultra-low emissions vehicles (ULEV) for all company cars 42% 57%3 We intend to work towards the milestone1 of 90% of our suppliers, by addressable spend6, having science- based GHG emissions reduction targets7 in place 57%8 64%8 We intend to work towards the milestone1 of 50% absolute reduction in our Scope 1 and 2 location-based GHG emissions against a 2018 baseline 52%4 56% We intend to work towards the milestone1 of 50% absolute GHG supply chain emissions reduction against a 2018 baseline 32%9 36% 2035 We intend to work towards the milestone1 of 115 kWh/ m2/year average energy use intensity across our corporate offices5 2294 kWh/m2/year 225 kWh/m2/year (-28% against 2018 baseline) We intend to work towards the milestone1 of 90% diversion of waste from landfill, incineration and the environment across key campuses10 53% 57% We intend to work towards the milestone1 of 10 MW on-site renewable electricity capacity installed across our global real estate portfolio 0.40MW 0.40MW (<1% total electricity use) 2050 We intend to work towards the milestone1 of 90% absolute GHG supply chain emissions reduction against a 2018 baseline 32%9 36% Notes: 1 We have made changes to our net zero operations progress table to more clearly distinguish between milestones and targets. This has not changed Barclays' approach to net zero operations and our milestones and targets. In this Achieving net zero operations section, a reference to a 'milestone' denotes an indicator we are working towards and report against and a reference to a 'target' denotes an indicator linked to our executive remuneration. 2 The 98% comprise Battery Electric Vehicles (BEVs) and Plug-In Hybrid Vehicles (PHEVs) that are at a maximum of 50g CO2/km and a minimum 30 miles in electric range. 3 The 57% comprise for UK vehicles, BEVs and PHEVs that are at a maximum of 50g CO2/km and a minimum 30 miles in electric range; for Europe, vehicles BEVs and PHEVs that are at a maximum of 50g CO2/km; for India, vehicles BEVs. 4 For our FY2024 emissions portfolio we have re-categorised a portion of our Scope 2 emissions to Scope 3 Category 8 (Upstream Leased Assets) as these emissions have been identified as outside of our operational control. This has resulted in minor updates to FY2023 reported EUI performance (a change from 228kWh/m2/year to 229 kWh/m2/year) and to FY2023 Scope 1 and 2 location-based GHG emissions performance (a change from 51% to 52%). 5 Corporate offices include campuses and offices within our operational control. 6 Addressable spend is defined as external costs incurred by Barclays in the normal course of business where Procurement has influence over where the spend is placed. It excludes costs such as regulatory fines or charges, exchange fees, taxation, employee expenses or litigation costs, and property rent. 7 Targets are considered ‘science-based’ if they are in line with what the latest climate science deems necessary to meet the goals and timelines of the Paris Agreement – limiting global warming to well below 2°C above pre-industrial levels and pursuing efforts to limit warming to 1.5°C. The Science Based Targets initiative (SBTi), a partnership between CDP, the United Nations Global Compact, World Resources Institute (WRI) and the World Wide Fund for Nature (WWF), provides companies with independent assessment and validation of targets and is currently the internationally accepted standard. 8 Indicative number provided to illustrate the number of TPSPs by total addressable spend that have committed to or have science-based targets in place. 9 Assurance findings on our 2018 supply chain baseline identified certain data previously excluded from the initial data set. In addition to this, in 2024 the UK Department for Environment, Food & Rural Affairs (Defra) revised their GHG emissions conversion factors, which Barclays uses to calculate spend-based supply chain emissions. Our supply chain emissions baseline has therefore been recalculated to reflect both points, resulting in an aggregate increase in our 2018 supply chain baseline and therefore improvements in our previously reported supply chain performance for 2023 (previously 28% GHG emissions reduction, now 32% GHG emissions reduction). 10 Campuses include 1 Churchill Place, Radbroke, Northampton, Glasgow, Pune, Whippany, 745 7th Avenue, Dryrock. Strategy Shareholder information Climate and sustainability report Governance Risk review Financial review Financial statements Barclays PLC 2024 Annual Report on Form 20-F 29 Implementing our Climate Strategy TCFD Strategy Recommendation B | Strategic Pillar 1
Key external factors, dependencies and assumptions Our progress against our net zero operations milestones and targets is likely to be volatile and non-linear, due to our dependencies on broader industry and external factors. For example, dependencies on low-carbon technology developments and their market adoption, electricity grid decarbonisation and key policy and regulatory changes in the markets where we and our TPSPs operate. Our progress may also be impacted by internal management decisions based on key drivers unrelated to climate, for example prudent risk management practices. We will aim to continue to evaluate and evolve our strategic levers of decarbonisation taking into consideration key external factors and internal management decisions. Our approach to operational climate- related data Accurate and meaningful climate-related data1 is central to our net zero operations strategy. The data helps us better identify significant sources and categories of emissions, understand which actions to prioritise to reduce these emissions, and model expected implications of our activities and external factors. Ultimately, the data better informs our strategic decision-making. To date, we have been focusing our efforts on increasing our climate-related data quality and coverage. For example, in 2024: • through continued TPSP engagements we progressed to having 46% supply chain emissions primary data in comparison to no such data collection in 2018 • we expanded our operational GHG emissions coverage to include an estimate of our global employee commute emissions2, that include emissions from the transportation of employees between their homes and their worksites and those from teleworking (working from home). We plan to monitor these emissions over time and seek to improve our data accuracy, as we explore solutions to try to address these. We are investing in our internal ESG Data Hub, our enterprise ESG data platform built on modern, serverless cloud infrastructure. It sources, stores, and transforms ESG data, and aims to improve access to ESG data across the Group, onboarding data from multiple sources and making it available through applications or to our other internal systems. To support our net zero operations strategy, the ESG Data Hub will aim to provide access to our climate-related data on a timely basis, enhancing insights on the climate impacts of our business decisions across our operations. The evolving nature of climate-related data, market methodologies and our continuous data enhancements, are likely to result in changes to previously reported figures and the overall trajectory of our decarbonisation efforts. In 2024 we recalculated our previously reported supply chain emissions' baseline and 2023 emissions due to the following: • Assurance findings on our 2018 supply chain baseline identified certain data previously excluded from the initial data set. • In 2024 the UK Department for Environment, Food & Rural Affairs (Defra) revised their GHG emissions conversion factors, which Barclays uses to calculate spend-based supply chain emissions. Our supply chain emissions baseline and our 2023 reported supply chain emissions have therefore been updated to reflect both points. These changes resulted in improvements to our previously reported supply chain performance for 2023 (previously 28% GHG emissions reduction, now 32% GHG emissions reduction). Moving forward To continue to inform our strategic approach, focus areas and business decisions, in 2025 we intend to review our net zero operations scope, milestones and targets in line with short-, medium- and long-term 1.5oC-aligned pathways. As part of our review we will aim to evaluate the latest science, market standards, and assess our coverage of the most material operational emissions. Notes: 1 In this net zero operations section, climate-related data refers to quantitative and qualitative data that informs our net zero operations strategy. This may include but is not limited to GHG emissions data, energy and water usage, TPSP decarbonisation activities and industry data on climate scenarios. 2 Our employee commute emissions accounting approach aligns to the GHG Protocol Corporate Standard guidance. Employee commute includes emissions from the transportation of employees between their homes and their worksites and those from teleworking (working from home). We estimate these emissions by using various data sources including survey data on Barclays employees' commuting habits. Strategy Shareholder information Climate and sustainability report Governance Risk review Financial review Financial statements Barclays PLC 2024 Annual Report on Form 20-F 30 Implementing our Climate Strategy TCFD Strategy Recommendation B | Strategic Pillar 1
Operational footprint dashboard 2024 Operational GHG emissions by Scope (location-based) Scope 3 categories 1 Category 1, 2 & 4 supply chain emissions 68.3% 3 Category 3 fuel and energy-related activities 1.3% 5 Category 5 waste generated in operations 0.02% 6 Category 6 business travel 5.3% 7 Category 7 employee commute 10.8% 8 Category 8 upstream leased assets 3.2% 13 Category 13 downstream leased assets 0.1% Scope 1 and Scope 2 emissions (location-based) '000 tonnes CO2e Scope 1 and Scope 2 emissions (market-based) '000 tonnes CO2e Supply chain emissions1 '000 tonnes CO2e 2024 8.9 2023 15.3 2018 baseline 29.0 84.8 86.5 182.1 93.8 101.8 211.2 n Scope 1 n Scope 2 (location-based) Total 2024 8.9 2023 15.3 2018 baseline 29.0 1.8 1.6 205.7 10.7 16.9 234.7 n Scope 1 n Scope 2 (market-based) Total 2024 2023 2018 basel ine 584.8 622.8 914.0 n Category 1,2 & 4 supply chain emissions Notes 1 Our reporting of supply chain emissions includes the following GHG Protocol Scope 3 categories: Category 1: Purchased Goods and Services, Category 2: Capital Goods, Category 4: Upstream transportation and distribution. In 2024 we reported GHG emissions of Categories 1, 2 and 4 by aggregating these under Category 1. It is our intent to assign emissions to each of these separate categories in due course. 2 The methodology used to calculate our GHG emissions follows the ‘Greenhouse Gas Protocol (GHG): A Corporate Accounting and Reporting Standard (Revised Edition)’, defined by the World Resources Institute/World Business Council for Sustainable Development. We have adopted the operational control approach on reporting boundaries. 3 We continuously review and update our performance data based on updated GHG emission factor, improvements in data quality and updates to estimates previously applied. For 2024, we have applied the latest emissions factors as of 31 December 2024. All location- and market-based figures are gross and do not include netted figures from carbon credits. 4 For our FY2024 emissions portfolio we have re-categorised a portion of our Scope 2 emissions to Scope 3 Category 8 (Upstream Leased Assets) as these emissions have been identified as outside of our operational control. This has resulted in minor updates to FY2023 Scope 2 location-based GHG emissions (a change from 87,197 tCO2e to 86,543 tCO2e). 5 Assurance findings on our 2018 supply chain baseline identified certain data previously excluded from the initial data set. In addition to this, in 2024 the UK Department for Environment, Food & Rural Affairs (Defra) revised their GHG emissions conversion factors, which Barclays uses to calculate spend-based supply chain emissions. Our supply chain baseline and 2023 emissions have therefore been recalculated to reflect both points, resulting in an aggregate increase in our 2018 supply chain baseline (from 765,634 tCO2e to 913,967 tCO2e) and increase in our 2023 supply chain emissions (from 552,367 tCO2e to 622,783 tCO2e). Our operational footprint data follows a reporting period of 1 October 2023 to 30 September 2024. Strategy Shareholder information Climate and sustainability report Governance Risk review Financial review Financial statements Barclays PLC 2024 Annual Report on Form 20-F 31 Implementing our Climate Strategy (continued) TCFD Strategy Recommendation B | Strategic Pillar 1 Scope 3 categories location-based 3 7 8 6 1 89.1% 9.9% 1.0% Scope 3 Scope 2 Scope 1 -56% -95% -36%
Reducing our Scope 1 and 2 emissions In 2024, to reduce our Scope 1 and 2 emissions, we continued to focus on: • reducing our energy demand and improving the energy efficiency of our global real estate portfolio • working on electrification of our global real estate portfolio heating and cooling systems and company vehicles • working on renewable electricity sourcing and installing on-site renewable electricity capacity across our global real estate portfolio. Global real estate portfolio Reducing energy demand and increasing energy efficiency To reduce our energy demand and increase energy efficiency, we continued to right-size our global real estate portfolio, and expanded our UK energy optimisation programme to global sites. The programme aims to reduce energy demand of existing infrastructure during periods of low or no occupancy and to increase energy efficiency during normal operating hours, contributing in 20241 to approximately 8.26 GWh in energy savings at our corporate offices and 0.33 GWh at our retail branches. For example: • As part of the programme our engineers carried out evening inspections at 1 Churchill Place, London2 where they identified cases where equipment was running unnecessarily, even though there was low or no occupancy. As a result of these inspections in October 2024 the engineers adjusted our building management system (BMS) settings, for example by automatically switching off some of the large screens across the building, resulting in energy demand reductions. • In 2024, through the energy optimisation programme and infrastructure upgrades, we also increased our energy efficiency during normal operating hours. For example, we upgraded our chillers and BMS at our Sunderland corporate office3, resulting in energy efficiencies at that site. • We right-sized and improved the sustainability of three of our retail branches by moving into new sites. The designs of the new sites focused on energy efficient infrastructure installations including new lighting and Heating, Ventilation, and Air Conditioning (HVAC) systems and in some instances solutions to reduce heat and cooling loss by including lobbies. All of these efforts have resulted in a 49% decrease in energy consumption across our global real estate portfolio against a 2018 baseline and progress with our global corporate offices energy use intensity (EUI) milestone to 225 kWh/m2/year in comparison to 229 kWh/m2/ year4 in 2023. As we continue implementing our energy optimisation programme and investing in new efficient equipment, our energy savings may take time to materialise as we adjust our building operations to these changes. Electrification and reducing reliance on fossil- fuel-powered infrastructure In 2024, we continued to electrify our infrastructure at selected sites, by replacing end- of-life natural gas heating equipment with electric powered alternatives and where possible, investing in electrification as part of our campus redevelopments. For example, at our Henderson corporate office5 we installed an all-electric kitchen, and as part of our Radbroke campus6 redevelopment, we plan to install ground source heat pumps, to further reduce reliance on natural gas and associated Scope 1 emissions. Our approach to renewable energy In 2024, we maintained 100% renewable electricity sourcing for our global real estate portfolio, of which the UK PPA7 contributed to 36% of our sourcing, as it came live in 2024. The remaining instruments used for our 100% renewable electricity sourcing were green tariffs and energy attribute certificates8, contributing to the remaining 64% of our total sourcing. We also continued to build on our on-site renewable electricity capacity in pursuit of our 2035 milestone to have 10 MW on-site renewable electricity capacity installed across our global real estate portfolio. In 2024, we started installing solar panels at our Whippany9 campus, received planning permission from the local council to proceed with solar panel installations at our Radbroke campus and prepared to install solar panels at 1 Churchill Place. Collectively, our global real estate portfolio has maintained 0.40 MW of renewable electricity capacity, we expect this to increase once Whippany, 1 Churchill Place and Radbroke campus installations are complete. We recognise that due to slow permitting processes, inadequate grid infrastructure and challenges with supply chain disruptions, materials availability and market volatility, we may experience longer lead times between initial investments and the deployment of the renewable energy projects. Notes: 1 Data represents reduction from 1 October 2023 to 30 September 2024. 2 1 Churchill Place, Canary Wharf, London, E14 5HP, UK. 3 Barclays Doxford Park, Sunderland, SR3 3XW, UK. 4 For our FY2024 emissions portfolio we have re-categorised a portion of our Scope 2 emissions to Scope 3 Category 8 (Upstream Leased Assets) as these emissions have been identified as outside of our operational control. This has resulted in minor updates to FY2023 reported EUI performance (a change from 228kWh/m2/year to 229 kWh/m2/year). 5 2280 corporate circle, Henderson, Nevada, USA. 6 Radbroke Hall, Knutsford, WA16 9EU, UK. 7 In 2022 Barclays signed a 10-year Power Purchase Agreement, committing to purchase up to 160 GWh per year of energy from Creah Riabhach, an onshore wind farm project in Scotland. 8 Energy attribute certificates not derived from our UK PPA. 9 400 Jefferson Park, Whippany, NJ 07981, USA. Strategy Shareholder information Climate and sustainability report Governance Risk review Financial review Financial statements Barclays PLC 2024 Annual Report on Form 20-F 32 Implementing our Climate Strategy (continued) TCFD Strategy Recommendation B | Strategic Pillar 1
Car fleet Electrifying company cars As part of our commitment to Climate Group’s EV100 initiative, we have made progress in transitioning our corporate vehicle fleet to electric vehicles (EVs) or ultra-low emissions vehicles (ULEVs). By the end of 2024, 98% of our 2,238 UK fleet were EVs and 57% of our 4,179 global fleet were EVs. To support the programme, we continue to offer all UK colleagues that require a company car for their role funded home-charging equipment to ease their transition to EVs. So far, 70% of eligible colleagues have been provided with an EV charging point at their home. As of the end of 2024, we have also fully replaced our existing Barclays Local Customer Channel vans with electric vans. Technology In 2024 Barclays’ technology operations contributed to a large proportion of Barclays’ operational GHG emissions. To continue to address these emissions the Group Sustainability Chief Information Office (CIO) has developed granular GHG emissions dashboards for Barclays’ technology applications. These dashboards have been embedded into standard reporting frameworks, empowering application teams to take informed actions aligned to our net zero operations milestones and targets. Further information about how Barclays addresses technology- related operational GHG emissions can be found in the Supply Chain section on page 33. Addressing our Scope 3 operational emissions As of 2024, our accounted Scope 3 operational emissions include supply chain, employee commute, business travel, waste3, fuel and energy- related activities3 and leased assets3, representing approximately 89% of our total4 operational GHG emissions, with supply chain contributing to the largest proportion. Supply chain We have observed a reduction in our absolute supply chain emissions of 36% against our 2018 baseline. Whilst we have observed a reduction, there are limitations to our reported figure, as 54% of our supply chain emissions are estimated using GHG conversion factors applied to spend, therefore our reported reduction may not directly correlate to actual supply chain emissions decarbonisation. To try to address this limitation, our objective is to continue to work with our TPSPs to seek to increase the volume and quality of our primary data, having by the end of 2024 increased it by 19% from previous year. Enhanced visibility and understanding of our TPSPs' climate-related data will help us to assess our TPSPs’ progress more effectively against our milestones and enhance our TPSP engagements. Supply chain emissions primary and spend-based data 0 10 20 30 40 50 60 70 80 90 100 2024 2023 2018 n Spend* n Primary Data** Notes: * Spend-based method, in other words our calculation is based on the economic value of the goods and services purchased, multiplied by relevant industry average emission factors (Defra) ** Primary (TPSP sourced) data. Integrating climate-related considerations in our TPSP lifecycle Since 2022 we have been integrating climate- related considerations within our TPSP lifecycle, including requirements in our standard contract terms for our TPSPs. These requirements include an obligation for our TPSPs to have an emissions reduction programme in place, supported by a public science-based reduction target and a commitment to achieve net zero GHG emissions no later than the end of 2050. In 2024, we integrated consideration of inclusion of climate-related clauses into our procurement process for all new contracts, contract renewals, extensions and material change notes executed by sourcing managers. We have also included similar climate-related considerations in our Barclays Code of Conduct for Third Party Service Providers. By the end of 2024, 64% of our TPSPs, by addressable spend, had science-based reduction targets in place, nearing our milestone of 70% by the end of 2025. Working together to address our supply chain emissions We continued to invite our TPSPs to disclose their climate-related information such as governance, risk strategy, targets and performance, emissions methodology and data, through CDP. In 2024, 78.5% of our invited TPSPs responded to CDP, an increase from previous year and representing approximately 73% of Barclays' 2024 supply chain emissions. This has enabled us to garner insights on our TPSPs’ decarbonisation maturity and to continue fostering collaborative and transparent conversations with them. Notes: 1 Altimus, Whispering Heights Real Estate Plot 130, Pandurang Budhkar Road, Mumbai, India. 2 333 Bay Street, Toronto, ON M5H 2R2, Canada 3 While emissions from our waste, fuel and energy-related activities and leased assets are lower than other operational emissions. 4 In this net zero operations section, our total accounted operational GHG emissions include Scope 1, Scope 2 (location- based) and Scope 3 category 1-8 and 13. 5 In this section, when referring to 'spend', this is addressable spend, defined as external costs incurred by Barclays in the normal course of business where Procurement has influence over where the spend is placed. It excludes costs such as regulatory fines or charges, exchange fees, taxation, employee expenses or litigation costs, and property rent Following from the CDP response, we directly engaged with over 150 TPSPs, these represent approximately 61% of Barclays' 2024 supply chain emissions. As part of the engagements, we outlined our climate expectations, discussed their progress towards GHG emissions reductions, and learned about their future plans. We also emphasised the need to increase provision of primary emissions data. Enhancing our supply chain engagements Supply chain emissions by procurement category In 2024, we began to develop a systematic approach to prioritise our supply chain engagements. We conducted a pilot focusing on the technology category, as it is the biggest contributor to our supply chain emissions, representing 43% of these emissions in 2024, therefore a category that will be prioritised for business and TPSP engagements. From this category we selected 25 TPSPs undergoing contract negotiations, where we engaged both the business owners of those contracts and the TPSPs to evaluate and discuss opportunities to reduce the TPSP's GHG emissions and improve their climate-related data. Strategy Shareholder information Climate and sustainability report Governance Risk review Financial review Financial statements Barclays PLC 2024 Annual Report on Form 20-F 33 Implementing our Climate Strategy (continued) TCFD Strategy Recommendation B | Strategic Pillar 1 n Technology n Real Estate n Professional Services n Banking Operations n Marketing n Market Data n HR n Trade Cycle n Other 43% Technology
Following from the pilot, we recognised the need for early engagements with prioritised TPSPs and key decision makers to enhance our supply chain decarbonisation efforts. Therefore, in 2024 we invited our internal decision-makers who oversee 63% of our top 500 TPSPs by emissions, namely Accountable Executives from our Technology and Real Estate procurement category, to attend our first ESG supply chain training programme. The intent of the programme is to equip our internal decision-makers with the information to drive meaningful climate engagement with our TPSPs and to inform decisions in relation to our supply chain, for example working on inclusion of climate-related clauses in our contract renewals terms and the inclusion of climate-related criteria in our Requests for Proposals. In 2024, we also assessed the climate commitments and primary data progress of our top 50 TPSPs (based on emissions value), to gain insights into their performance and identify TPSPs and spend categories that require increased attention going forward. The insights from the pilot and our top 50 TPSPs' review have informed the development of the Barclays Supplier Transition Framework (STF), which is intended to help scale the pilot principles for prioritising TPSP engagement and drive more tailored actions to decarbonise our supply chain. In 2025, we intend to continue to develop and operationalise the STF. Even though we are taking multiple steps to reduce our supply chain emissions, we recognise that the decarbonisation of our supply chain depends on the progress of our TPSPs, including their dependencies on data availability, market conditions and ultimately the broader decarbonisation of the real economy. Travel We continue to share guidelines with colleagues on more sustainable business travel choices, including at the point of booking and in our Travel and Expense Policy. This Policy outlines our travel principles, which include encouraging colleagues to consider the climate impact of their travel choices, and our expectation for colleagues to consider whether travel is appropriate, or whether the same business needs could be met in another way. In 2024, we also continued to review uptake of sustainable aviation fuel (SAF) with our preferred airline partners, by gathering insights on their future plans to increase SAF use. Our 2024 total colleague business travel emissions reduced by 35% against a 2018 baseline – noting these emissions increased by 15% compared to 2023. As we continue to observe a resumption of air travel in comparison to 2020 levels, we will evaluate other levers of decarbonisation to try to reduce our business travel emissions without compromising our client service and employee experience. In 2024, to improve coverage of our operational GHG emissions we have calculated an estimate of our employee commute emissions2. Although we have already offered some options that will support our employees to reduce these emissions, for example EV charging stations across selected sites and our UK EV Salary Sacrifice offering, we plan to improve the accuracy of our data and monitor these emissions over time, as we explore other solutions to try to address them. We recognise to decarbonise our travel emissions we are largely dependent on transport and grid decarbonisation in the markets in which we operate. Carbon credits Following a review of our approach to the use of voluntary carbon market credits against our operational emissions, we are aiming to introduce an internal carbon pricing system from 2025. Our new internal carbon price will be linked to emissions generated from air business travel. We intend to use the proceeds of this pricing system to purchase carbon removal credits.	 Supporting our colleagues We offer colleagues the tools and support needed to inform and help reduce their individual environmental footprints. In 2024, for example: • We continued to provide sustainability-related benefits offering, for example our UK EV Salary Sacrifice and Bike4Work schemes. We also increased the sustainability-focused offers on our corporate discount platform for UK employees, for example by offering home energy audits and discounts on EV charging equipment. • Colleagues completed over 310,000 environmental activities by using our Barclays Go Green sustainability gamification programme, that informs and allows colleagues to track their actions to reduce their personal environmental footprint. • Recycle for Good was launched in six of our UK corporate offices in partnership with Computacenter (our global electronic waste partner) to give colleagues a secure way to recycle old personal technology and divert raw materials in the devices back into the supply chain. Note: 1 Our employee commute emissions accounting approach aligns to the GHG Protocol Corporate Standard guidance. Employee commute includes emissions from the transportation of employees between their homes and their worksites and those from teleworking (working from home). We estimate these emissions by using various data sources including survey data on Barclays employees' commuting habits. Strategy Shareholder information Climate and sustainability report Governance Risk review Financial review Financial statements Barclays PLC 2024 Annual Report on Form 20-F 34 Implementing our Climate Strategy (continued) TCFD Strategy Recommendation B | Strategic Pillar 1
Reducing our financed emissions We are committed to aligning our financing with the goals and timelines of the Paris Agreement, consistent with limiting the increase in global temperatures to 1.5°C. To meet our ambition, we need to reduce the client emissions we finance – not just for lending but for capital markets activities, too. We work closely with our clients to ensure that over time the activities we finance are aligned to the goals and timelines of the Paris Agreement. Consistent with our Purpose, and taking into account considerations of all relevant business factors, we have set emissions reduction targets for our Upstream Energy, Power, Steel, Cement, Automotive manufacturing, Aviation, UK Commercial Real Estate, UK Agriculture portfolios and convergence point for UK Housing. We have also set clear restrictions on financing certain activities. Further details on our financing restrictions can be found on page 47 Understanding our financed emissions A building block for Barclays' ambition to be a net zero bank by 2050 is our ability to estimate the full in-scope balance sheet financed emissions 1 In 2020, we developed our BlueTrack™ methodology to measure our financed emissions and track our progress against our Upstream Energy and Power generation targets. As of 2023, we extended the scope of our calculations to cover the full in-scope balance sheet financed emissions based on methodology which has been developed using the PCAF Standard and expanded the scope of BlueTrack™ to track our progress against targets for a total of eight sectors as well as UK Housing for which we set a convergence point. 2 In 2024, we have refreshed our estimate of full in-scope balance sheet financed emissions. These emissions are set out on pages 35 to 38 where we also set out further information about this methodology. Because it takes time to fully analyse this data, these emissions are as at December 2023. For sectors where we have set 2030 targets, we have continued to use the BlueTrack™ methodology and have updated our financed emissions metrics and progress against those targets with data as at December 2024. Our approach to disclosing financed emissions is pivoted across two sections: 1 Estimating the full in-scope balance sheet financed emissions (Scope 3, Category 15) using a methodology which has been developed using the PCAF Standard. The data reported in this section of the Annual Report (up to page 38) is as at December 2023. Hence, these numbers follow a lag of one year when compared to other climate-related disclosures based on December 2024 in this report, due to the lead time required to fully analyse our entire in-scope exposures. 2 Continuing to use the BlueTrack™ methodology to assess financed emissions for material sectors and set 2030 targets integrating 1.5°C scenarios. This data is being reported as at December 2024. Note: 1 PCAF Standard - PCAF (2022). The Global GHG Accounting and Reporting Standard Part A: Financed Emissions. Second Edition. Estimating the full in-scope balance sheet financed emissions Scope of activities included and basis of preparation We have estimated the financed emissions for c.£793bn of Barclays' activity as at December 2023 (of which c. £441bn are on-balance-sheet exposures) as set out in the following table. Identification of in-scope exposure to calculate financed emissions (as at December 2023) Category Value (as at Dec 2023) in £m Comments Total Barclays balance sheet 1,477,487 Exclusions: Cash and bank balances, Cash collateral and settlement balances, Derivative financial instruments, Goodwill and intangible assets, Current tax assets, Deferred tax assets, Other assets, Trading portfolio assets, Reverse Repos, and Retail lending (personal lending, retail cards) (-)1,029,687 Exposures which have been excluded by the PCAF Standard Property, plant and equipment (-)3,417 Emissions covered under Barclays Scope 1 and Scope 2 Retirement benefit assets (-)3,667 Emissions on Barclays Bank UK Retirement Fund reported separately as part of Task Force on Climate-related Financial Disclosures Report 2023 Total Barclays exposure in scope for computing financed emissions 440,716 Inclusions Total Undrawn commitments and contingent liabilities (+)250,227 We have gone beyond the scope of PCAF’s definition of asset classes to additionally cover undrawn commitments and contingent liabilities. We have excluded exposures for which PCAF is yet to establish a methodology (personal lending, retail cards and Trading balances) from our total undrawn commitments and contingent liabilities. Capital markets financing (33% of Barclays share) (+)102,238 Equity holdings, Bond issuances, Equity issuances, Syndicated loans Total Barclays activities considered for financed emissions calculations 793,181 Strategy Shareholder information Climate and sustainability report Governance Risk review Financial review Financial statements Barclays PLC 2024 Annual Report on Form 20-F 35 Implementing our Climate Strategy (continued) TCFD Strategy Recommendation B | Strategic Pillar 1
Our approach for estimating financed emissions is based on a methodology which has been developed using the PCAF Standard with the following key exceptions: 1 We have gone beyond the scope of PCAF’s definition of asset classes to additionally cover undrawn commitments, contingent liabilities and capital markets financing activities. For instance, in the case of a loan we consider the committed amount (both drawn and undrawn), as opposed to just outstanding amounts (which is the approach preferred by PCAF) for calculating financed emissions. 2 We have also consistently used the book value of equity and debt for all clients to calculate the attribution factor, while PCAF recommends using the Enterprise Value Including Cash (EVIC) for listed entities. 3 PCAF recommends calculating emissions at a client level. For certain sectors, clients could have presence in activities across multiple parts of the value chain and in such cases reported emissions may not be consistent and reliable to estimate financed emissions. To overcome this challenge we calculate emissions at an activity level, using a range of options aligned to the PCAF Standard's guidance to calculate client emissions. For certain activities – including Upstream Energy, Power Generation, Automotive manufacturing, UK Agriculture and Aviation – we employ asset-level production data to estimate client emissions. For activities such as Cement and Steel production, we use client reported emissions. Where we do not have sufficient data on reported emissions or physical activities – for example, in relation to mortgages where we do not have EPC data available – we use fall-backs based on emission factors. For an immaterial part of our balance sheet (c.1%), where the appropriate sector fall-backs could not be reliably obtained, we have used the respective asset class average economic emissions intensity to estimate emissions. Our Financed Emissions Methodology paper (published in 2025) provides more details of our methodology and can be found within the ESG Resource Hub: home.barclays/sustainability/ esg-resource-hub/reporting-and-disclosures/ Emissions coverage We have estimated the full in-scope balance sheet financed emissions based on Scope 1 and Scope 2 of our clients’ emissions as at December 2023. Hence, these numbers follow a lag of one year when compared to other disclosures based on December 2024 in this report. The lag of one year is due to the lead time required to fully analyse our entire in-scope exposures. We have excluded our clients’ Scope 3 emissions from these calculations except for activities where we have set a target which covers Scope 3 emissions (which includes Upstream Energy, Automotive manufacturing LDVs, Aviation and UK Agriculture - Livestock and Dairy Farming). This is due to challenges in sourcing reliable and consistent data, not just on reported Scope 3 emissions but also the fall-back emission factors for downstream emission estimations. As we refine our approach and data sourcing strategy, we will assess the suitability of including Scope 3 emissions in our financed emissions disclosures. We have included emissions on a CO2e basis. For activities where we have set targets, we have included emissions relating to GHGs which are relevant and material for the relevant sector. One of the approaches that we can use to assess the extent to which our financing is aligned to a well-below 2 oC pathway is by calculating the extent to which our financed emissions reduction targets cover our full in-scope balance sheet. Our 2030 financed emissions targets (and our UK Housing convergence point) covering Scope 1 and 2 emissions integrate 1.5°C-aligned scenarios and cover 43% of our full in-scope balance sheet financed emissions. We have also set 2030 financed emissions targets integrating a 1.5°C aligned scenario covering Scope 3 emissions for Upstream Energy, Automotive manufacturing LDVs, Aviation and UK Agriculture – Livestock and Dairy Farming. Our coverage of emissions where we have set targets integrating a 1.5°C aligned scenarios decreased from 55% reported last year. This reduction was primarily driven by the decline in emissions from power generation following reductions in our total financing volumes within this portfolio as well as impacts from changes in company book value. Strategy Shareholder information Climate and sustainability report Governance Risk review Financial review Financial statements Barclays PLC 2024 Annual Report on Form 20-F 36 Implementing our Climate Strategy (continued) TCFD Strategy Recommendation B | Strategic Pillar 1
Financed emissions for activities with targets (as at December 2023) Activities Scope 1,2 emissions (MtCO2e) Scope 3 emissions (MtCO2e) On-balance-sheet lending Undrawn commitments and contingent liabilities Capital markets financing Data Quality score1 On-balance-sheet lending Undrawn commitments and contingent liabilities Capital markets financing Data Quality score Mining and Quarrying Upstream Energy 0.7 3.7 0.3 3.1 5.1 29.3 2.8 3.1 Energy and water Power Generation 1.0 11.5 4.2 3.1 - - - - Agriculture, Food and Forest Products UK Agriculture 0.4 0.1 - 4.4 0.0 0.0 - 4.4 Manufacturing Automotive Manufacturing (LDV) 0.0 0.1 0.1 2.3 0.6 3.7 1.6 3.2 Cement Manufacturing 0.1 0.5 0.1 2.1 - - - - Steel Manufacturing 0.2 0.8 0.3 2.4 - - - - Mortgages UK Housing (Convergence point) 1.6 0.1 0.0 3.5 - - - - Materials and Building UK Commercial Real Estate 0.1 0.0 - 4.2 - - - - Transport Aviation 0.7 2.5 0.3 3.0 0.1 0.5 0.1 3.0 Total Portfolio 4.9 19.4 5.2 - 5.8 33.6 4.5 - Financed emissions for other activities not covered by targets (as at December 2023) Activities Scope 1,2 emissions (MtCO2e) On-balance-sheet lending Undrawn commitments and contingent liabilities Capital markets financing Data Quality score Mining and Quarrying 1.3 1.6 0.3 2.8 Energy and water 1.2 2.8 0.7 2.7 Agriculture, Food and Forest Products 1.0 0.3 - 4.6 Manufacturing 1.5 6.6 1.3 2.8 Mortgages 0.2 - - 5.0 Materials and Building 0.2 0.2 0.0 4.0 Transport 0.5 2.2 1.1 3.7 Other Sectors 3.8 6.0 2.5 4.0 Total Portfolio 9.7 19.8 5.9 - Government and central bank 17.9 - - - Government and central bank (excluding LULUCF2) 19.2 - - - Emissions covered under targets integrating 1.5°C scenarios (excluding Government and central bank) 43% Notes: 1 For further details on Data quality score please refer 'Data sourcing and data quality' section on page 38. 2 Emissions excluding land-use, land-use change and forestry. Strategy Shareholder information Climate and sustainability report Governance Risk review Financial review Financial statements Barclays PLC 2024 Annual Report on Form 20-F 37 Implementing our Climate Strategy (continued) TCFD Strategy Recommendation B | Strategic Pillar 1
Data sourcing and data quality There are data quality challenges inherent in the calculation of financed emissions. Climate data, models and methodologies are evolving – and are not yet at the same standard as more traditional financial metrics. Our financed emissions calculations rely on externally sourced data mapped to internal customer and client identifiers. The externally sourced data has various limitations for each sector, including lack of coverage, low resolution, consistency and transparency of company-reported data, as well as the time lag for external sources to report estimates or actuals. Time lags in our external data could be as much as two years for data such as company value, company revenue share, emissions, production capacity and capacity factors. As a result, our financed emissions metrics are at best an estimate of our clients' activities on a given date, using the external data available at that point in time. We have scored the quality of the data we have used to estimate our financed emissions using PCAF's Global GHG Accounting and Reporting Standard. In the Standard, data quality score DQ1 and 2 relates to high quality from company disclosures, DQ3 to emissions estimated using physical activity data and DQ4 and DQ5 to deriving emissions estimated using revenue or asset-based emission factors. We disclose DQ score at an activity level. For activities where we have set targets (and for our UK Housing convergence point), DQ is mostly concentrated across DQ1/2 and DQ3 signifying that most of the relevant estimated financed emissions are either company-reported or calculated using the company’s physical activity data. For activities where we have not set targets, activities have DQ score spread across the scale which signifies we have used a combination of company reported emissions and revenue/asset fallbacks to calculate financed emissions. Our data vendor does not provide a split for reported emissions between DQ1 and DQ2. Hence, where we have relied on reported emissions sourced from the data vendor, we have conservatively used DQ2 for calculating DQ scores at an activity level. This indicates that we need to consider the current estimate of financed emissions for these activities as highly preliminary and indicative only, and which can change materially as we improve data quality. Our approach to reporting financed emissions data Given the evolving nature of climate data, models and methodologies, past-period metrics may change to reflect updates. To manage the impact of these changes we have adopted a principles-based approach to guide whether prior metrics and baselines should be restated or re-baselined. Where information has been restated or re-baselined this will be identified or explained. We will continue to review and evolve our approach as our processes mature and as accounting practices become clearer. • A restatement involves updating the historical starting point for a period and, if the impact is greater than five percentage points, recalculating the historical performance. • A re-baseline involves keeping the historical performance constant and recalculating the current period baseline to ensure consistency when reviewing performance. The indicative historical baseline will also be disclosed. As a result, reported baseline metrics may change from one reporting period to another and direct like-for-like comparisons may not always be possible from one reporting period to another. Updates in external client data are captured in-year. In line with our reporting approach for past period metrics, we have re-baselined the following metrics: • Our Upstream Energy baseline absolute emissions metric from 75.4 to 74.1 MtCO2e to de-scope two clients which were identified as non-active in energy extraction activities following internal assessment; and • Our Power baseline physical intensity metric from 326 to 311 kgCO2e/MWh primarily to also include the emissions associated with purchased power agreements for US municipal power generation clients. • Our UK Agriculture metric has been re- baselined to reflect an enhanced methodology that uses internal data on customers’ farming activity (where such data is available (DQ3)), with fallbacks to asset-based emission intensities (DQ5) for customers where we do not have such internal data available. The enhanced methodology led to a significant decline in baseline emissions reported last year (which were calculated using PCAF emission factors (DQ4-5)). Although our enhanced methodology represents an improvement in data quality, we still see limitations in the internal data on customers' farming activity including low coverage, lack of consistency and time lags. As we continue to address these data challenges and improve the coverage of internal data, we may see further re-baselining of the metrics in future years. Please refer to page 42 for the re-baselined metrics for these sectors. Within Cement, we have included an additional client in the portfolio baseline. Since the overall impact of this addition was not material (<1%), we have not restated the past period progress, instead reflecting the progress in 2024. Strategy Shareholder information Climate and sustainability report Governance Risk review Financial review Financial statements Barclays PLC 2024 Annual Report on Form 20-F 38 Implementing our Climate Strategy (continued) TCFD Strategy Recommendation B | Strategic Pillar 1
Our approach to reporting financed emissions data Scenario Our approach Error identified in our internal finance data or methodology Restatement • Financed emissions metrics for all years impacted by the error will be recalculated including the baseline year • If the impact to portfolio progress over the reporting period is less than 5 percentage points (pp) we will reflect the updated progress in the current reporting period and update the baseline. If the impact is greater than 5pp we will restate prior progress. Changes to our methodology and/or data sources to calculate financed emissions (for example, including additional GHGs) Re-baseline • The updated methodology will be applied from the start of the current reporting period • The last reported financed emissions spot metric will be recalculated using the new methodology/data source to provide the new baseline. This will ensure consistency of data and methodology when calculating our performance • The recalculated baseline and the progress achieved to date will be used to disclose the theoretical baseline for the year in which the targets were originally set • The cumulative progress will be for the current reporting period (using the new methodology) and the progress up until the last reporting period (using the old methodology). Updates to external counterparty data driven by timing lags when data is reported (for example, counterparty valuations or emissions estimates) Capture in-year • The impact of updated external data will be included in the current period financed emissions data and the progress metric for the current reporting period • Data lags are inherent to the process and Barclays will endeavour to use the latest available data . Historically reported metrics will not be updated for data lags. Financed emissions in scope of our targets Our targets We set our initial targets for our Upstream Energy1 and Power portfolios in 2020, and since then have expanded the scope of sectors covered under a target to also include Cement, Steel, Automotive manufacturing, Aviation, UK Commercial Real Estate and UK Agriculture. We have also set a convergence point for the UK Housing sector. We keep our targets, policies that support our progress towards them, and our year-on-year and cumulative progress under review in light of the rapidly changing external environment and our need to balance a range of factors when managing our portfolios including commercial objectives, effective risk management and the need to support governments and clients both in delivering an orderly transition and providing energy security. We expect progress towards our targets to be volatile and non-linear. As the external environment in which we and our clients operate shifts, and new information becomes available to us, we may need to update our approach to manage the effectiveness and impact of our efforts to reduce our financed emissions, while remaining focused on our ambition to be a net zero bank by 2050. Measuring our progress We have developed our BlueTrackTM methodology to measure and track our progress against our targets. The first step of our methodology is to use an external climate scenario to construct a Paris- aligned portfolio benchmark that defines how a given financing portfolio will need to reduce emissions over time. We estimate certain financed emissions within the selected boundary for a sector, then aggregate these into a portfolio-level metric, which is then compared to the benchmark. Our approach is explained in more detail below. Our Financed Emissions Methodology paper (published in 2025) provides more details of our methodology and can be found within the ESG Resource Hub at: home.barclays/sustainability/ esg-resource-hub/reporting-and-disclosures/ Sector boundaries We have set targets on the segment of the value chain where either (i) it is generally recognised that decarbonisation efforts are likely to spur the rest of the sector value chain to fall into alignment or (ii) where financiers are likely to be able to engage with companies active in that segment. Our choice of segment is based on Barclays' own view, informed by guidance and recommended practice from portfolio alignment initiatives such as PACTA, SBTi and others. Emissions scope Within the boundary of our target we aim to capture the part of a company's value chain that generates most of their emissions, taking into account considerations including materiality, consistency to benchmark, level of control and whether the emissions can be abated by the company. The financed emissions covered under BlueTrackTM are therefore a subset of the total financed emissions for each customer or client, as they only include the portion of the client's activities that are within both the value chain we have chosen for the sector, and the scope and type of greenhouse gas emissions we deem material for that activity. For example, our Upstream Energy target includes Scope 3 emissions for carbon dioxide and methane – recognising they are significant for a company extracting fossil fuels. Use of carbon credits We do not allow company-purchased offsets such as carbon credits to reduce emissions, as we believe it is important to base a metric on operational activities under a company's control. We therefore do allow company-operated removals, such as on-site carbon capture at a plant. Given that company-operated removals are currently marginal in the context of emissions, they currently have no impact on our portfolio-financed emissions metrics. Strategy Shareholder information Climate and sustainability report Governance Risk review Financial review Financial statements Barclays PLC 2024 Annual Report on Form 20-F 39 Implementing our Climate Strategy (continued) TCFD Strategy Recommendation B | Strategic Pillar 1
Portfolio-level metrics Barclays uses two financed emissions metrics: 1. Absolute Emissions: a measure of the absolute emissions generated, or fair share of the company's emissions over time; 2. Emissions Intensity: how much CO2e (Carbon Dioxide Equivalent) is released on average for a certain amount of economic activity or material produced. We use absolute emissions for the Upstream Energy and UK Agriculture sectors, whose decarbonisation pathways rely on a reduction in production volume as well as on a reduction in intensity. The Upstream Energy sector cannot reduce its carbon emissions intensity below a certain point – a barrel of oil cannot be decarbonised, for instance – and therefore a reduction in absolute carbon emissions is more appropriate. The Agriculture sector requires a shift away from the production of meat and dairy towards alternative protein sources, as farmers respond to changing diets, and therefore a reduction in absolute emissions is more appropriate. We use emissions intensity for the other sectors, whose decarbonisation pathways rely primarily on reduction in intensity rather than volumes. Both absolute and intensity metrics are sensitive to factors which are not directly related to real world emissions. For example, absolute emissions are sensitive to changes in the book value of debt and equity, and intensity metrics are sensitive to changes in revenue share. Reference scenario2 Each of our 2030 targets were developed with reference to a 1.5°C-aligned scenario. For the majority this was using the most recently available vintage of the IEA's Net Zero by 2050 (NZE2050) scenario. In calculating a convergence point for our UK Housing portfolio and a target for UK Agriculture, we use a UK- focused Balanced Net Zero Scenario developed by the UK's Climate Change Committee (CCC BNZ). For the UK CRE portfolio we use the CRREM scenario that provides decarbonisation pathways across different property types consistent with the NZE2050 scenario. For the Aviation sector we use the Mission Possible Partnership (MPP)'s 'Prudent' (PRU) scenario – a 1.5°C-compatible roadmap for the sector to achieve net zero emissions by 2050. Baseline year We measure our financed emissions for each portfolio against a baseline metric determined in the year we first assessed that target. The baseline year therefore varies across the nine sectors assessed to date, to ensure we are using the most up-to-date data available when we set our targets – or, in the case of UK Housing, a convergence point. Use of target ranges Our 2030 financed emissions targets for five sectors (Power, Cement, Steel, Automotive manufacturing, and Aviation) are expressed as ranges. The upper end of each range represents the reduction needed to align with the 1.5°C benchmark pathway at the time we set these targets. The lower end reflects our assessment of sector and client commitments at that time. Since these targets were set, the NZE2050 scenario we used to inform these targets has been updated and the scenario assumes slower progress to the transition up to 20303. As a result, some of our target ranges now exceed the emissions reductions reflected in the latest 1.5°C scenario. While we continue to seek to reduce our financed emissions in line with our ambition to be a net zero bank by 2050, our ability to achieve reductions within these ranges at any given point in time depends on a wide range of factors and scenario assumptions as explained in the Future target progress section on page 45. Notes: 1 Originally called 'Energy', we updated the name in 2025 to 'Upstream Energy' to more precisely reflect the scope of the target. 2 When we first developed BlueTrackTM, the best available scenario to develop Paris-aligned benchmarks for our financing portfolios was the International Energy Agency’s Sustainable Development Scenario (SDS) which was aligned to a 1.7°C world. The 2025 targets set for the Upstream Energy and Power sectors were informed by the SDS scenario. 3 www.iea.org/reports/world-energy-outlook-2024 Strategy Shareholder information Climate and sustainability report Governance Risk review Financial review Financial statements Barclays PLC 2024 Annual Report on Form 20-F 40 Implementing our Climate Strategy (continued) TCFD Strategy Recommendation B | Strategic Pillar 1
Overview of financed emissions targets and progress Sector Setting our targets Monitoring our progress in 2024 Sector Sector boundaries Emissions scope GHG included Reference scenario Target metric Unit of measurement Baseline year Target versus baseline Cumulative change Absolute emissions (MtCO2e) Physical intensity Upstream Energy Upstream Energy (producers of coal, oil, gas and NGLs) 1,2 & 3 Carbon dioxide and methane IEA SDS Absolute emissions MtCO2e (absolute) 2020 -15% by end of 2025 -45% 41.1 59.1 gCO2e/MJ IEA NZE2050 -40% by end of 2030 Power Power generators 1 Carbon dioxide IEA SDS Physical intensity kgCO2e/MWh 2020 -30% by end of 2025 -30% 14.0 219 IEA NZE2050 -50% to -69% by end of 2030 Cement Cement manufacturers 1 & 2 All GHGs IEA NZE2050 Physical intensity tCO2e/t 2021 -20% to -26% by end of 2030 -9% 0.8 0.576 Steel Steel manufacturers 1 & 2 All GHGs IEA NZE2050 Physical intensity tCO2e/t 2021 -20% to -40% by end of 2030 -23% 0.9 1.492 Automotive Manufacturing Light Duty Vehicles manufacturers 1,2 & 3 All GHGs for Scope 1 and 2; carbon dioxide for Scope 3 IEA NZE2050 Physical intensity gCO2e/km1 2022 -40% to -64% by end of 2030 1% 3.8 176.3 Aviation Commercial Aviation (Air Travel) – Passenger (including belly cargo) and Dedicated cargo 1 & 3 Carbon dioxide for Scope 1; All GHGs for Scope 3 MPP Prudent Physical intensity gCO2e/RTK 2023 -11% to -16% by end of 2030 0% 4.9 879 UK Commercial Real Estate UK Corporate Bank 1 & 2 Carbon dioxide, methane and nitrous oxide CRREM II Physical intensity kgCO2e/m2 2023 -51% by end of 2030 -2% 0.1 29.5 UK Agriculture Livestock and dairy Farmers 1, 2 & 3 Carbon dioxide, methane and nitrous oxide CCC BNZ Absolute emissions MtCO2e 2023 -21% by end of 2030 -11% 0.5 N/A UK Housing2 UK buy-to-let and owner- occupied mortgages, Social Housing and Business Banking 1 & 2 Carbon dioxide, methane and nitrous oxide CCC BNZ Physical intensity kgCO2e/m2 2023 Portfolio convergence point vs. baseline -1% 1.7 31.8 -40% by end of 2030 Notes: 1 Physical intensity (CO2e emissions per v-km travelled by LDV produced), expressed in gCO2e/km. 2 Barclays has identified a 2030 emissions intensity convergence point for UK Housing but has not set a formal target. Strategy Shareholder information Climate and sustainability report Governance Risk review Financial review Financial statements Barclays PLC 2024 Annual Report on Form 20-F 41 Implementing our Climate Strategy (continued) TCFD Strategy Recommendation B | Strategic Pillar 1
Baselines at December 2024 Sector Unit Baseline year Baseline metric (last reported) Previously reported metrics Recalculated metrics Financed emissions for December 2023 Change at December 2023 (percentage change) Recalculated financed emissions for December 2023 Theoretical baseline metric (re-baselined) Upstream Energy MtCO2e (absolute) 2020 75.4 42.5 -44% 42.0 74.1 Power kgCO2e/MWh 326 241 -26% 232 311 Cement tCO2e/t 2021 0.626 0.573 -8% 0.574 0.631 Steel tCO2e/t 1.945 No major impact of methodology changes Automotive Manufacturing gCO2e/km 2022 174.8 No major impact of methodology changes Aviation gCO2e/RTK 2023 882 No major impact of methodology changes UK Commercial Real Estate kgCO2e/m2 30.0 No major impact of methodology changes UK Agriculture MtCO2e (absolute) 2.4 Re-baselining the UK Agriculture metric with an updated methodology 0.53 UK Housing1 kgCO2e/m2 32.1 No major impact of methodology changes Note: 1 Barclays has identified a 2030 emissions intensity convergence point for UK Housing but has not set a formal target. Strategy Shareholder information Climate and sustainability report Governance Risk review Financial review Financial statements Barclays PLC 2024 Annual Report on Form 20-F 42 Implementing our Climate Strategy (continued) TCFD Strategy Recommendation B | Strategic Pillar 1
Update on progress against targets This section of the report provides an update on our metrics and progress towards achieving our 2025 and 2030 targets. There are multiple drivers behind the changes in our portfolio metrics both in 2024 as well as cumulatively against the relevant baseline years. This includes changes in our financing across both our lending and capital markets financing activity, our clients' emissions, client data and metrics such as company valuation, and other data inputs and methodology updates as defined in our Financed Emissions Methodology paper (published in 2024). Our progress in 2024 and our future progress towards, and ability to meet, our targets will be influenced by a wide range of external factors in addition to the continued management of our portfolios, balancing between our commercial goals, risk management and other non-financial objectives in support of our strategy. We expect to continue to see this impact our metrics in the future as data availability and quality, methodologies, guidance, and best practices for calculating our financed emissions metrics – all of which include differing levels of estimation –continue to evolve and be refined. Additionally, our Cement and Steel portfolios are comprised of a small number of clients. For these metrics we rely on data reported by the clients in those portfolios. Changes in the availability and quality of that data can have a material impact on our financed emissions metrics and progress towards our targets. Our future progress towards our targets is highly sensitive to changes in our financing mix or in clients’ emissions intensity data, including its quality and availability. See future target progress on page 45. As noted on page 38 in line with our reporting approach for past period metrics, we have re- baselined our Upstream Energy, Power, Cement and UK Agriculture metrics. See 'Data sourcing and data quality' on page 38 for more information on the data used to estimate our financed emissions Upstream Energy Our absolute financed emissions from our Upstream Energy portfolio have cumulatively decreased by 45% from our 2020 baseline. Our cumulative progress largely reflects reductions in our total financing volumes for this portfolio as well as impacts from changes in company book values which fluctuate year to year and thus impact progress (either positively or negatively) against our target. The 1% decrease in our financed emissions in 2024 from our recalculated 2023 metric was the net result of the impacts of client merger activity that reduced Barclays attributed share of client emissions partially offset by an increase in our capital markets financing activity. While our cumulative reductions continued to be above the levels of our 2025 and 2030 targets for this sector, as with all of our targets, there could be further volatility, which could lead to changes in our progress above or below our targets and the likelihood of achieving our targets could be significantly impacted by these variables and dependencies, as well as actions that we may need to take to manage our portfolio. Of our total financed emissions in 2024, c.79% was related to clients who have activities in oil, gas and natural gas liquids (NGLs) production, with NGLs being relatively immaterial. The remaining c.21% was attributable to clients who have coal production. Power Our Power portfolio emissions intensity has cumulatively reduced by 30% from our 2020 baseline the metrics for which were re-baselined in 2024 (see page 38). The 4% decrease in our portfolio emissions intensity in 2024 from our recalculated 2023 metric was primarily driven by our clients' continued progress in reducing their own emissions intensity partially offset by a net decrease in our lending volumes to low intensity clients as facilities matured. Within our Power portfolio, our clients' ability to continue transitioning (and therefore our ability to further increase our green financing to Power portfolio clients which supports our progress towards our target) is dependent on supply chains for renewable energy, required investments in grid infrastructure, a stable and positive policy environment, and other factors beyond their and our control, as well as our clients' strategic and financing decisions, amongst other things. While our 2024 reported level is at our 2025 target, as with all our targets, there could be further volatility, which could lead to changes in our progress above or below our targets and the likelihood of achieving our targets could be significantly impacted by these variables and dependencies, as well as actions that we may need to take to manage our portfolio. Cement Our Cement portfolio emissions intensity has cumulatively reduced by 9% from our 2021 baseline, the metrics for which were re-baselined in 2024. In 2024, there was a 1% decrease in our portfolio emissions intensity from our recalculated 2023 metric which includes the impact of the inclusion of an additional in-scope client as discussed in our 'Our approach to reporting financed emissions data' section on page 38. Of the small number of clients in this portfolio our progress to date has been driven by increased activity with a very limited number of those clients. Steel Our Steel portfolio emissions intensity has cumulatively reduced by c.23% from our 2021 baseline. In 2024, our Steel portfolio emissions intensity reduced by -7%. This was primarily driven by changes in our financing portfolio. Automotive manufacturing Our Automotive manufacturing portfolio emissions intensity has cumulatively increased by c.1% from our 2022 baseline. In 2024, this was primarily driven by increases to the emissions factors used in our metric partially offset by changes in our financing portfolio. Aviation In 2024, our Aviation portfolio emissions intensity has largely remained flat as compared to our 2023 baseline. Decarbonising aviation remains dependent on both the price and availability of sustainable aviation fuel (SAF) and the continued production and delivery of lower emissions aircraft. These are key factors in determining how quickly emissions intensity can reduce in this sector. UK Agriculture An improvement in data quality, achieved through the integration of farm-level data, has allowed us to enhance the Dairy & Livestock BlueTrackTM model, now as an asset-based emissions model (see BlueTrackTM financed emissions methodology). Over time, this will enable us to better assess the impact of on-farm emissions reduction measures and where our clients are making positive change. We have re-baselined our 2023 Agriculture model on this basis. This does not impact the existing 21% reduction target from 2023-2030. In 2024, our UK Agriculture portfolio absolute financed emissions have reduced by 11%. This reflects the alignment of our financing activity towards clients with lower emissions profiles and those taking positive action towards reducing on-farm emissions. We also consider impacts from changes in client company value, which can fluctuate year to year and is reported at a delay due to the size of clients in this portfolio. Strategy Shareholder information Climate and sustainability report Governance Risk review Financial review Financial statements Barclays PLC 2024 Annual Report on Form 20-F 44 Implementing our Climate Strategy (continued) TCFD Strategy Recommendation B | Strategic Pillar 1
However, we continue to face challenges to calculating emissions in the sector, notably a lack of data on the activities and practices of our agricultural customers, and modelling challenges around agricultural emissions intensity. To help advance approaches to Agriculture financed emissions measurement, we are engaged in a three-year collaboration with Oxford University to develop food type production datasets for the UK, with the aim of quantifying Barclays-financed emissions in more detail and consider additional transition risks. UK Commercial Real Estate During 2024, our UK Commercial Real Estate portfolio emissions intensity has decreased by 2% from our 2023 baseline. This is against a backdrop of a 5% increase in new lending in our portfolio in 2024, reflecting that the new lending was orientated towards better EPC rated properties. The relationship-led nature of the UK Corporate Bank and our in-house asset management expertise enables a client-first approach to influence transition planning at a portfolio level. The decarbonisation of the UK built environment remains dependent on external changes and public policy interventions. UK Housing In 2024, we further expanded the scope of our UK Housing portfolio to include our Kensington Mortgage Company Limited book. Our UK Housing portfolio’s emissions intensity decreased by 1% during this period. This reflects the dependence of the decarbonisation of this portfolio on external changes and public policy interventions. Without these external changes, Barclays cannot materially decrease the emissions intensity of its UK Housing portfolio, which is why we continue to measure our progress against a 2030 emissions intensity 'convergence point', but have not set a formal target at this time. We have made strong progress against our EPC ambition for 55% of in- scope properties and collateral with a known EPC to be rated band C or better by 2030, achieving 49.7% by the end of 2024. EPC	ratings of properties and collateral in scope of EPC ambition 2024 total: 746,715 16,963 88,554 266,976 235,025 133,056 3,408 2,734 n EPC rating G n EPC rating F n EPC rating E n EPC rating D n EPC rating C n EPC rating B n EPC rating A 49.7% of properties and collateral rated A-C of available EPCs Future target progress Our progress towards our targets will be influenced by a wide range of external factors including shifts in capital markets, changes in client financing needs, and the need to support energy security and an orderly transition. Our progress will likely remain volatile and non-linear and will be affected by the complexity and significant uncertainties around the transition to a low-carbon economy as outlined in further detail in 'Implementing our strategy against a Shifting Landscape' on page 21 and by the examples outlined above in relation to specific financed emissions targets (including in relation to particular portfolio sensitivities such as those relevant to Cement and Steel). In addition, the data available to us continues to develop and as new information becomes available, we may need to update our approach. We continue to manage our portfolios, balancing between our commercial goals, risk management and other non-financial objectives in support of our strategy. As part of this we take into account our relevant climate-related risks and considerations, including how our portfolios are performing against our financed emissions targets so this can be evaluated in context alongside other relevant business metrics. We monitor our performance against our targets on a regular basis. Where we identify targets are potentially at risk of being missed – particularly as target dates draw nearer and the opportunities for us to take management actions narrow – we will continue to reassess our approach, taking into account broader business considerations including potential franchise impacts. Further details of how climate risk-related considerations are managed can be found in the managing impacts in lending and financing section on page 172. Notes: 1 EPC ambition scope does not currently include Private Bank due to EPC data reporting limitations. 2 Metric based on number of properties and collateral in portfolios that make up the EPC ambition scope as of 31 December 2024. 3 EPC data for Barclays UK mortgages and Kensington Mortgage Company Limited are as of 30 September 2024. Matched EPC data for Social Housing and Business Banking Real Estate are as of 30 November 2024. Strategy Shareholder information Climate and sustainability report Governance Risk review Financial review Financial statements Barclays PLC 2024 Annual Report on Form 20-F 45 Implementing our Climate Strategy (continued) TCFD Strategy Recommendation B | Strategic Pillar 1
Client Transition Framework (CTF) We continue to embed our Client Transition Framework (CTF) which is a tool we use to evaluate certain corporate clients' progress towards business models aligned with a transition to a low-carbon economy. We conduct annual assessments for Investment Bank clients that are in-scope in sectors with 2030 financed emissions targets. Clients who are assessed receive a CTF score of T1 (best) to T5 (worst) taking into account both ambition and credibility components of our CTF as well as sector- specific considerations. In 2024, we assessed transition plans and emissions trajectories for in-scope clients across our Power, Upstream Energy, Steel, Cement, Automotive Manufacturing, and Aviation portfolios. We have enhanced our data collection and scoring process, leveraging AI and other technology to improve the quality and speed of our review process. CTF assessments continue to help to inform our approach to reducing financed emissions, and our client engagement and decision-making processes. Financing decisions remain transaction-specific and subject to standard committee reviews, including for credit risk, reputation, and capital impact. Our CTF was assessed by Oliver Wyman, a leading management consultancy, who found the framework to be well designed, conceptually sound and to compare well to current peer and third-party approaches. We plan to continue to implement enhancements to the CTF during 2025. The CTF relies on clients' public transition plans and other related disclosures. Any changes in the breadth or depth of these, often voluntary, disclosures could materially impact the results of our CTF assessments. Aggregate CTF results 5% 2% 6% 4% 21% 8% 17% 10% 36% 43% 48% 47% 37% 40% 29% 36% 1% 7% 4% 2023 n T1 (best) n T2 n T3 n T4 n T5 (worst) 2024 n T1 (best) n T2 n T3 n T4 n T5 (worst) Note: Charts and figures exclude clients determined to be out of scope for the CTF assessments. Clients may have scores in multiple sectors but are included only once to avoid double-counting. In 2024 our assessments produced a net improvement in client CTF Scores, reflecting both enhanced transition plans and better data collection. To illustrate this take for example one of our criteria as shown below using client counts. Evidence of emissions reduction progress for Scope 1 and 2 2023 2024 n Increased emissions n Decreased emissions Note: Analysis includes Scope 1 for Power and Aviation and Scope 1 and 2 for all other sectors. Where intensity-based emissions data was unavailable, absolute metrics were used as an alternative measure. Where insufficient disclosure history is available the worst score is assumed. In 2024, more data to assess this criteria was available as clients continued reporting on their emissions metrics over time. This showed that more clients have decreased their Scope 1 and 2 emissions than increased them. Other findings, by client count, from our assessments include: • 83% have a short or medium term public emissions reduction target, a 2% increase from 2023 • 85% have explicit board oversight of their transition plan, a 3% increase from 2023 • 63% disclose that they have quantified at least portion of their forward-looking capex plans that align with their climate and sustainability objectives, a 5% increase from 2023 Upstream Energy portfolio CTF results % by client count % by lending limits 2023 n T1 (best) n T2 n T3 n T4 n T5 (worst) 2024 n T1 (best) n T2 n T3 n T4 n T5 (worst) Power portfolio CTF results % by client count % by lending limits 2023 n T1 (best) n T2 n T3 n T4 n T5 (worst) 2024 n T1 (best) n T2 n T3 n T4 n T5 (worst) Note: Charts and figures exclude clients determined to be out of scope for the CTF assessments. Incorporating nature into the CTF In 2024, we piloted nature-related questions within our CTF assessment for Power portfolio clients. The evaluation covered four areas: governance, strategy, policy approach, and disclosure. Initial results showed that around one-third of clients have Board-level nature oversight, while most reference nature in their policy commitments and in their sustainability strategies. We plan to expand these nature questions across CTF evaluations in 2025. Strategy Shareholder information Climate and sustainability report Governance Risk review Financial review Financial statements Barclays PLC 2024 Annual Report on Form 20-F 46 Implementing our Climate Strategy (continued) TCFD Strategy Recommendation B | Strategic Pillar 1 % by client count % by lending limits Two years of history
Sensitive sector and area policies In addition to setting sector-specific emission reduction targets, consistent with our Purpose and driven by consideration of all relevant risks and other factors, we have outlined our approach to financing certain sensitive sectors and areas in our policies, each of which contains various conditions, restrictions and other provisions relevant to how we apply them. These policies are listed below and set out in detail within our policy statements. Our sensitive sector and area policies are regularly reviewed and updated in light of the rapidly changing external environment, including changing laws and regulations, and are informed by engagement with our stakeholders, including shareholders, clients, subject specialists and civil society groups. Our Climate Change Statement sets out our positions and approach to certain sensitive sectors, with tightening policy criteria and increasing expectations over time. In 2024 we have updated the Climate Change Statement to include requirements for upstream oil and gas and restrictions on the type of exposures and risk we will finance going forward, as well as additional restrictions on financing in relation to the Amazon Biome, ultra-deep water and extra heavy oil and enhanced due diligence requirements for biomass. Barclays will continue to support an energy sector in transition in line with our strategy and associated policies. Requirements may be affected (positively or negatively) by external factors, including, for example, the public policy and regulatory environment, technological advancement, geopolitical or regional developments, energy security, cost of living and just transition factors. We intend to continue to work with and support our clients as they transition their business and to monitor and engage with them on their progress and the impact of external factors over time, including through our enhanced due diligence (EDD) and Client Transition Framework (CTF). Further details on Enhanced Due Diligence can be found on page 172 and Client Transition Framework on page 46. We anticipate that companies which are unable to effectively manage their sustainability and climate-related risks may find it increasingly difficult to access financing, including through Barclays. Additional positions and approach to financing sensitive sectors and areas are set out in our policy statements relating to Forestry and Agricultural Commodities as well as Protected Sensitive sector policies Climate Change Forestry and Agricultural Commodities • Upstream oil and gas • Unconventional oil and gas – Oil sands – Fracking – Arctic oil and gas – Amazon oil and gas – Ultra-deep water – Extra heavy oil • Thermal coal mining • Thermal coal power • Biomass • Timber, pulp and paper • Palm oil • Soy • Beef Areas (previously World Heritage Site and Ramsar Wetlands), with the latter being updated in February 2025. Our Forestry and Agricultural Commodities Statement aims to address the potential deforestation, land conversion and human rights impacts associated with our financing of the forestry and agricultural commodities sectors. We will keep our policies, targets and progress under review in light of the output of both EDD and CTF reviews, the rapidly changing external environment and the need to support governments and clients, in our efforts to meet our ambition of being a net zero bank by 2050. Note: 1 A Protected Area is a clearly defined geographical space, recognised, dedicated and managed, through legal or other effective means, to achieve the long term conservation of nature with associated ecosystem services and cultural values. Source: https://iucn.org/our-work/topic/effective-protected-areas Strategy Shareholder information Climate and sustainability report Governance Risk review Financial review Financial statements Barclays PLC 2024 Annual Report on Form 20-F 47 Implementing our Climate Strategy (continued) TCFD Strategy Recommendation B | Strategic Pillar 1 Further details can be found at: home.barclays/sustainability/esg-resource-hub/statements-and-policy-positions/
Financing the transition Reaching net zero means finding low- carbon ways of doing necessary activities – including electricity generation, transport and heating. The world needs to accelerate and scale the supply of renewables and climate tech solutions to reduce reliance on fossil fuels. Barclays is committed to help finance the energy transition and to help do this we set a target to facilitate $1trn of Sustainable and Transition Financing between 2023 and the end of 2030. We are also focused on investing and scaling the climate technologies – hydrogen, carbon capture, batteries, amongst others - needed by society and our clients to transition, generate economic growth and create a new wave of green jobs. We have a mandate to invest up to £500m of Barclays’ own capital by the end of 2027 in global climate tech start-ups, with an aim to bridge financing gaps and support the acceleration of solutions to environmental challenges. Facilitating $1trn of Sustainable and Transition Financing At Barclays we are clear that addressing climate change is a complex challenge that demands a transformation of the global economy. Low- carbon technologies, infrastructure and capacity must be scaled up to meet growing energy demands and for the world to reach net zero. The financial sector has an important role to play in supporting the transition and we are determined to play our part. We are deploying financing to help scale-up the necessary activities needed in the transition to net zero. For further details on climate-related opportunities see page 26. Our $1trn Sustainable and Transition Financing target encompasses the green, social, transition and broader sustainability-linked financing requirements of clients including corporates, governments and the public sector, financial institutions and consumers. This includes financing of climate and environmental solutions including green mortgages, energy efficient technology and renewable energy, as well as financing for broader social and sustainability work – including sustainability-linked structures and areas such as affordable housing. We are also facilitating funding into green technologies and low-carbon infrastructure projects, as well as using our advisory capabilities, product sets and financial expertise to help our customers and clients realise their own transitions to a low- carbon economy. The inclusion of transition financing in this target reflects our recognition of the importance of supporting the decarbonisation of hard-to-abate sectors that are carbon intensive. In 2024, we announced our Transition Finance Framework (TFF), which outlines the criteria for transactions to qualify as transition financing and sits alongside our Sustainable Finance Framework (SFF) to define what can be included against this target. Our ability to meet the $1trn target and progress towards it from year to year will be dependent on a number of factors and variables outside our control. Factors such as market conditions, policy, laws, regulation, geopolitical developments and stakeholder expectations - including approaches to product labelling and regulatory scrutiny of green, sustainability-linked and social products - could impact lending and capital markets appetite and our approach to risk management, and therefore present a risk to our progress against, and delivery of, the target. Additionally, new climate and decarbonisation technologies may scale at varying rates, including being reliant on the supply and demand of raw materials, which may impact financing volumes. We will continue to review and adapt our approach to Sustainable and Transition Financing in response to the evolving market environment. Progress against our $1trn target During 2024 we facilitated $94.4bn of Sustainable and Transition Financing, of which $88.7bn was sustainable financing, up on 2023 of $67.4bn, and $5.7bn was transition financing, up on 2023 of $0.4bn. The 39% year-on-year increase in financing facilitated demonstrates our continued focus on supporting our clients on their transition journeys. Bond issuance1 was the largest product category in 2024, accounting for 69% of total Sustainable and Transition Financing while loans and equity accounted for 22% and 5% respectively. This mix showed a small shift towards loan and equity activity and away from bonds compared to the mix of our 2023 Sustainable and Transition Financing, which comprised 76% bond issuance, 19% loans and 3% equity. As at the end of 2024 we had facilitated a cumulative $162.2bn against our $1trn Sustainable and Transition Financing target. Sustainable finance Sustainable financing, aligned to our Sustainable Finance Framework, consists of financing for dedicated use of proceeds, financing for clients with an eligible business mix in relevant environmental and social categories, and sustainability-linked financing which refers to general purpose funding. Social financing Raising finance for clients including supranational, national and regional development institutions was a key driver of the $46.2bn of social financing facilitated in 2024 (2023: $32.4bn). In 2024, we continued to see issuers aligning their financing commitments to social use of proceeds bonds which allocate funds to categories such as access to healthcare, affordable housing and essential services. Environmental financing In 2024, we facilitated $30.6bn of environmental financing (2023: $24.1bn). This performance reflected continued demand from our clients and our strategy to work with them to help facilitate their transitions to a low-carbon economy. Sustainability-linked financing Sustainability-linked bonds (SLBs) and sustainability-linked loans (SLLs) are forward- looking, performance-based debt instruments issued with specific sustainability performance targets. Our sustainability-linked financing totalled $12.0bn in 2024 (2023: $10.9bn). The sustainability-linked market continues to be of importance to both investors and issuers alike who use these instruments to embed their sustainability targets into financing commitments and we look forward to continuing to work with our clients to innovate the product set. Note: 1 Bond issuance includes Bonds (DCM), CMBS, Securitization, Munis and PCM Debt. Strategy Shareholder information Climate and sustainability report Governance Risk review Financial review Financial statements Barclays PLC 2024 Annual Report on Form 20-F 48 Implementing our Climate Strategy (continued) TCFD Strategy Recommendation B | Strategic Pillar 1
Transition financing In 2024, we published our Transition Finance Framework outlining the criteria for transition finance transactions that will contribute to our $1trn Sustainable and Transition Financing target. 2024 marked the first full year of utilisation of the Framework. Over the year, we facilitated $5.7bn of transition finance compared to $0.4bn in 2023. While new technologies are still emerging, we are identifying opportunities to finance pathways across high-emitting sectors, including energy, power, chemicals, and metals & mining. We are looking to play a role in supporting a range of carbon and emission reduction projects – from the manufacturing of blue hydrogen and related infrastructure for end-use sectors with limited decarbonisation alternatives, to the electrification of compressor units, resulting in the elimination of natural gas use, as well as the adoption of low-carbon technologies, As emerging technologies scale and continue to develop, we are committed to leveraging our expertise to further identify opportunities for transition financing. We participated in the financing for the Northern Endurance Partnership (NEP), the CO2 transportation and storage provider for the East Coast Cluster. Once constructed, the NEP infrastructure will initially serve the Teesside-based carbon capture projects – NZT Power, H2Teesside and Teesside Hydrogen CO2 Capture from 2027– that were selected for first connection to NEP by DESNZ in March 2023 as part of the UK’s cluster sequencing process for CCUS. NEP was granted the first Carbon Dioxide Transport and Storage Licence in the UK under the Transportation and storage Regulatory Investment (TRI) regime – a regulatory regime that unlocks private investment in long-term infrastructure by providing incentives and protections to support the development of the nascent CCUS market in the UK. The infrastructure includes a CO2 gathering network, onshore compression facilities, a 145km offshore pipeline and subsea injection facilities in to the Endurance saline aquifer located around 1000m below the North Sea seabed. It is expected to permanently store up to an initial four million tonnes of CO2 per year. Barclays Bank PLC acted as IRS Hedge Execution bank, Mandate Lead Arranger and IRS hedge bank to NEP. We also supported Net Zero Teesside Power (NZT) in the UK, a new build, first of a kind fully integrated combined gas cycle gas turbine (CCGT) power plant with post combustion amine-based carbon capture technology. The captured CO2 will be received by the NEP project infrastructure which will compress, transport and store the captured CO2 in the Endurance geological store under the North Sea. Once operational NZT could produce up to 742MWs of flexible, low carbon power, with up to two million tonnes of CO2 per year expected to be captured at the plant. NZT is supported by the UK Government’s Dispatchable Power Agreement which enables natural gas power plants with carbon capture technology to play a mid-merit order role in the meeting electricity demand, displacing unabated thermal generation plants. Barclays Bank PLC acted as Mandated Lead Arranger and IRS hedge bank to NZT. For further details on our Sustainable Finance Framework and Transition Finance Framework see page 50. Barclays Climate Ventures (BCV) portfolio: Invest up to £500m into climate tech start-ups We firmly believe that innovation is key to tackling climate change and we are committed to supporting transformative change by investing our own capital in entrepreneurial companies. In 2020 Barclays announced that it would invest up to £175m equity capital in pioneering climate technology companies by 2025 – helping support our clients to transition to a low-carbon economy, scale solutions to environmental challenges, and fill their growth-stage funding gaps. In evidence of the success of this strategy, in December 2022 we announced an increase of the investment mandate to invest up to £500m by the end of 2027. To date we have invested £203m into more than 20 innovative companies. These investments have supported many aspects of climate tech innovation, from property retrofit solutions to long-duration energy storage and hydrogen technologies. Barclays acts as an engaged partner in a portfolio company’s growth, offering value-added support to these companies. This engagement contributes towards wider commercial and strategic opportunities for Barclays UK, Corporate Banking and Investment Banking with those companies. We continue to focus on decarbonisation technologies supporting transition within carbon-intensive sectors, particularly where Barclays has meaningful client exposure – such as Buildings, Energy, Transport, Agriculture and Industry – including solutions delivering carbon capture, carbon dioxide removal and green hydrogen. Note: 1 In 2024, Sustainable Impact Capital was rebranded to Barclays Climate Ventures (BCV) to better reflect our focus and mandate. Strategy Shareholder information Climate and sustainability report Governance Risk review Financial review Financial statements Barclays PLC 2024 Annual Report on Form 20-F 49 Implementing our Climate Strategy (continued) TCFD Strategy Recommendation B | Strategic Pillar 1
Sustainable finance dashboard $1trn Sustainable and Transition Financing facilitated (2023-2030)* Achieved to date $162.2bn Annual breakdown by category ($bn) 2024 30.6 46.2 12.0 5.7 2023 24.1 32.4 10.9 0.4 n Environmental n Social n Sustainability-linked n Transition Annual breakdown by region ($bn) 2024 37.1 51.3 6.0 2023 22.9 38.9 6.0 n Americas n UK/Europe n Asia and Rest of World Annual breakdown by product ($bn) 2024 65.5 5.0 21.2 2.7 2023 51.3 2.0 12.9 1.6 n Bonds n Equity n Loans n Investments n Other (Contingent) Barclays' Sustainable and Transition Finance Frameworks Sustainable Finance Framework We seek to be transparent about our approach to reporting against our sustainable finance targets. Our sustainable financing is tracked using the methodology set out in the Barclays Sustainable Finance Framework (SFF). This framework defines the criteria we use for social financing, sustainable financing, green financing and sustainability-linked financing. This includes ‘dedicated purpose’ green and social financing, ‘general purpose’ financing based on eligible company business mix and sustainability-linked financing, and sets out applicable criteria drawing on industry guidelines and principles. It should be noted that the methodology is reliant on a range of data sources including Dealogic and Bloomberg transaction listings and league tables, as well as other third-party data and verification sources including company disclosures to aid the classification of financing into eligible green and social categories. We recognise that the quality, consistency and comparability of the data relied upon is not yet of the same standard as more traditional financial metrics and presents an inherent limitation to the performance reported. We will continue to review available data sources and enhance our methodology and processes to improve the robustness of the performance disclosed. The legal and regulatory landscape relating to sustainable financing – including the naming and categorisation of products as ‘green’, ‘social’, ‘sustainability-linked’ and otherwise – is rapidly evolving with differing regulations across jurisdictions. We may wish to revisit our approach in that context in the future. There is currently no globally accepted framework or definition (legal, regulatory or otherwise) governing what constitutes 'ESG', 'green', 'sustainable', or similarly labelled products – nor is there unanimous agreement on what attributes a particular investment, product or asset should have to be labelled as such. Furthermore, no assurance can be given that a globally accepted definition or consensus will develop over time. We will continue to monitor and comply with applicable jurisdictional regulatory taxonomy definitions and product labelling obligations as they emerge. As innovation in sustainable finance continues to accelerate, we will continue to review and update our SFF, our measurement of our performance against targets, and keep our general approach under review. We published version 4.2 of the SFF in February 2025, which will apply prospectively from 2025 onwards, to capture market evolution on nature themes and added new financing products. We have enhanced nature-related eligibility criteria on existing and new themes such as Sustainable Food, Agriculture and Forestry, Pollution Prevention and Control, Resource Efficiency and Circular Economy, Sustainable Water and Nature-based Solutions. Barclays' Sustainable Finance Framework can be found online in our ESG Resource Hub at: home.barclays/sustainability/esg- resource-hub/reporting-and-disclosures/ Strategy Shareholder information Climate and sustainability report Governance Risk review Financial review Financial statements Barclays PLC 2024 Annual Report on Form 20-F 50 Implementing our Climate Strategy (continued) TCFD Strategy Recommendation B | Strategic Pillar 1
Transition Finance Framework Our transition financing is tracked using the methodology set out in the Barclays Transition Finance Framework (TFF). We first published the TFF in February 2024, with version 1.1 published in 2025, for classifying financing as 'transition' for the purpose of tracking and disclosing our performance against our target to facilitate $1trn of Sustainable and Transition Financing between 2023 and the end of 2030. This framework will apply prospectively from 2025 onwards. The inclusion of transition financing in this target reflects our recognition of the importance of lending, facilitating funding and investing in technologies and activities that support GHG emissions reduction, directly or indirectly, in high-emitting and hard-to-abate sectors. The TFF is complementary to our Sustainable Finance Framework, The TFF sits alongside Barclays' SFF and determines the eligibility of transition activities that are outside the green and social sustainable finance criteria already covered by the SFF. As there is no universal consensus as to how to define 'transition' activities, Barclays has developed its own definition of transition finance as follows: Our definition of transition finance Transition finance is any financing including lending, capital markets and other financing solutions provided to clients for activities – including technologies – that support GHG emissions reduction directly or indirectly in high-emitting and hard-to-abate sectors towards a 1.5°C pathway. The TFF outlines the criteria for eligible transactions with a set of defined principles to guide us in the application of our definition of transition finance as we support high-emitting clients and finance real economy decarbonisation. Version 1.1 of the TFF includes enhancements to the categorisation of transition activities/ technologies (such as ‘pink hydrogen’) and further expansion to include eligible social and just transition expenditures for corporate and public sector issuers. As innovation and market principles in relation to transition finance continue to accelerate and evolve, we will continue to consider and develop our definition of transition finance and the coverage under the TFF. The importance of transition finance is recognised in the findings in November 2024 by the United Kingdom's Transition Finance Market Review (TFMR) report (https:// www.theglobalcity.uk/tfmr) that has usefully set out recommendations on scaling a robust transition finance market. Barclays participated in the TFMR and supported the final report's findings and recommendations. We also released a policy paper which spotlights three focus areas where policymakers should take action and will facilitate the delivery of the TFMR’s recommendations, including developing a National Transition Plan with clear sector decarbonisation pathways, a stronger suite of internationally competitive incentives for companies looking to raise financing, and financing mechanisms to de-risk and facilitate the growth of transition finance in the UK. We also recommend the development of a supportive and balanced regulatory and policy framework. https://home.barclays/news/press- releases/2024/10/three-actions-to-bolster- the-uk-s-transition-finance-efforts-/ Barclays' Transition Finance Framework can be found online in our ESG Resource Hub at: home.barclays/sustainability/esg- resource-hub/reporting-and-disclosures/ Strategy Shareholder information Climate and sustainability report Governance Risk review Financial review Financial statements Barclays PLC 2024 Annual Report on Form 20-F 51 Implementing our Climate Strategy (continued) TCFD Strategy Recommendation B | Strategic Pillar 1
Barclays Climate Ventures portfolio by Barclays Principal Investments Barclays' Treasury plays a key role in helping Barclays meet its climate goals by allocating, managing and governing its financial resources effectively and executing sustainable principal investments and transactions, supporting businesses to advance strategic climate objectives in the transition to a low- carbon economy. Barclays Climate Ventures In 2024, Sustainable Impact Capital was rebranded to Barclays Climate Ventures (BCV) to better reflect our focus and mandate. BCV has a mandate to invest up to £500m into climate tech start-ups by the end of 2027 with the Barclays Principal Investments team driving the plan towards delivering on the commitment and helping support our clients’ transition to a low- carbon economy. Further examples of our green innovation financing can be found at: home.barclays/sustainability/our-position-on-climate- change/accelerating-the-transition/sustainable-impact- capital/ Our aim is to bridge financing gaps and support the acceleration of solutions to environmental challenges, which may include nature-positive outcomes as with ECOncrete, one of BCV's portfolio companies, delivering high- performance ecological concrete technologies that enhances marine biodiversity. During 2024, we continued to strategically provide support and capital to innovative early- stage climate tech companies pioneering breakthroughs in clean energy technology. We have made meaningful progress towards building a portfolio of strategic investments. £203m of our £500m investment mandate has been deployed since 2020, with £65m invested in 2024 – up 31% from 2023. We continue to focus on decarbonisation technologies supporting transition within carbon-intensive sectors, particularly where Barclays has meaningful client exposure – such as Buildings, Energy, Transport, Agriculture and Industry – including solutions delivering carbon capture, carbon dioxide removal and green hydrogen. Achieved to date £203m Our portfolio of investments since 2020 £m 24 30 35 49 65 n 2020 n 2021 n 2022 n 2023 n 2024 n Mandate by end of 2027 Green bond investment portfolio Treasury invests in green bonds as part of the liquidity pool. As an investor we undertake work to ascertain the ESG credentials of proposed investments. We engage with green, social and sustainability bond issuers to understand how their frameworks and goals align with our investment approach. The proceeds of our green bond investments fund projects in areas such as renewable energy and clean transport. We continue to consider new investments in supranational organisations and government- issued green bonds as they become available, with the aim to invest £4bn over time. Green bond investment portfolio size by year £bn 2024 2023 2022 2021 2.0 2.2 2.8 3.4 Green bond investment portfolio impact by sector (%) 36 28 2 5 29 n Renewable Energy and Energy Efficiency n Water and Waste n Agriculture, Land Use n Transport n Other Strategy Shareholder information Climate and sustainability report Governance Risk review Financial review Financial statements Barclays PLC 2024 Annual Report on Form 20-F 52 Implementing our Climate Strategy (continued) TCFD Strategy Recommendation B | Strategic Pillar 1
Green bond investment portfolio impact by region (%) 75 12 6 5 2 n Europe n Africa n Asia n North America n South America Strategy Shareholder information Climate and sustainability report Governance Risk review Financial review Financial statements Barclays PLC 2024 Annual Report on Form 20-F 53 Implementing our Climate Strategy (continued) TCFD Strategy Recommendation B | Strategic Pillar 1
Embedding climate and sustainability into our business We are embedding climate and sustainability throughout Barclays, taking into account the impact of climate-related risks and opportunities on our businesses, strategy and financial planning. Impact of climate-related risks and opportunities on our business, strategy and financial planning Barclays’ 2024 financial planning process included a review of our strategy, its implementation, and tracking of our progress against climate-related targets – as well as capturing a view of climate-related risks and opportunities. During 2024 we continued to enhance our monthly reporting framework to cover a view of the balance sheet and revenue from Sustainable and Transition Financing. This supports our ability to review our Sustainable and Transition Financing portfolio at greater granularity and improve relevant business engagement through the financial planning process. Enhancements were made to help us further evaluate the portfolio's performance and identify opportunities to maximise revenue generation activities. These outputs have been incorporated in our financial planning process for 2024. Our planning process also considered current climate policies to ensure they are included in the base scenario. We also considered impairment over the horizon of the financial plan. At this point in time, there are no associated material amendments required to the financial plan. All key businesses and applicable functions are involved in integrating climate-related risks and opportunities into our financial planning process. Implementing our climate strategy is managed through central Sustainable Finance teams under the Group Head of Sustainable and Transition Finance. For example: • The three pillars of our climate strategy are key drivers of our finance planning process with a pathway towards aiming to achieve this as well as risks and opportunities reviewed with business heads. • We continue to develop our sustainable and transition finance to ensure that we have a full offering for our clients and customers. • We strive to continue to decarbonise our own operations, reducing our Scope 1 and 2 emissions and our Scope 3 operational emissions. • We are tracking progress towards portfolio alignment of our financed emissions with the goals and timelines of the Paris Agreement through BlueTrack™, which includes a number of portfolio alignment metrics and levers available to manage the portfolio against these targets while understanding their financial implications. The metrics are subject to second-line review to assess the strategy against the targets. We have developed an internal approach to track and monitor progress against our targets. • We conduct portfolio reviews to monitor whether business activities are conducted within Barclays’ mandate and aligned with our expectations, and whether they are of an appropriate scale relative to the risk and reward of the underlying activities. Mandate & Scale Exposure Controls form part of our overall Risk Appetite Control Framework and climate risks have been integrated into annual credit portfolio reviews for elevated risk sectors since 2020. We continue to monitor against mandate and scale limits linked to scoring within our Client Transition Framework. The 2024 financial planning process used a five- year baseline scenario to consider the impacts of climate risks. The baseline scenario considered the impact of current and agreed climate policies across the UK, US and EU on macroeconomic variables such as GDP and unemployment. This was done via a detailed assessment of climate policy impacts, likelihood of implementation and current level of policy progress. The outcome of this assessment led to a conclusion that there is currently a de minimis impact on the macroeconomic variables used to project financial performance. We will continue to review how climate risks manifest in the economy through a baseline scenario. Workstreams specifically related to finance have been further embedded within our overall global financial planning processes, including dedicated climate management reporting information. Further details of how this work has served as an input in our five-year financial planning process and are set out below – including our approach to Sustainable and Transition Financing, targets and capital investments. During the 2024 financial planning process we assessed the financial impact of embedding individual parts of our climate strategy, new initiatives and targets across our businesses. A range of scenario analyses was undertaken during 2024 with the aim to further uncover areas of risk and opportunity, as well as integrate climate scenario analysis into our strategic and financial planning. This included a climate aware internal stress-test with the results allowing Barclays to also understand resilience to climate risks in this scenario. Strategy Shareholder information Climate and sustainability report Governance Risk review Financial review Financial statements Barclays PLC 2024 Annual Report on Form 20-F 54 Implementing our Climate Strategy (continued) TCFD Strategy Recommendation B
The strategic review of sustainable financing was also refreshed during the year across key businesses. The review built upon both new and previously identified commercial opportunities. The output was considered in the financial planning process, including incremental revenue, cost and capital. For further detail on the strategy, please see the ‘Sustainability and climate-related opportunities identified over the short, medium and long term'. Key opportunities continue to reside within Debt Capital Markets, Equity Capital Markets, Transaction Banking and lending, and some smaller new markets. The planning process included an assessment of our financed emissions portfolios for the eight high-emitting sectors where we have set absolute emissions or emissions intensity targets: Upstream Energy, Power, Cement, Steel, Aviation, Automotive manufacturing, UK Commercial Real Estate and UK Agriculture, as well as our UK Housing portfolio for which we have set a convergence point. The impacts of our current plans to achieve these targets (where applicable) have been integrated into our financial planning process. Barclays continues to engage with our clients to support their transition to a low-carbon economy. Our current emissions targets are not currently forecasted to materially impact financial performance over the next five years. The financial planning process also covered a review of our net zero operations strategy. We have formed key teams and continued to hire to grow our existing talent with a focus on expanding our product capabilities as we continue to drive performance against our selected targets. An example is the Energy Transition Group. The Energy Transition Group seeks to provide holistic and cohesive strategic advice and financing solutions through the energy value chain, with a particular emphasis on decarbonisation. Those teams will allow us to further implement our climate strategy and increase co-ordination, with a focus on how we can help our customers and clients with their individual transitions to a low-carbon economy. We will continue to endeavour to further enhance how Barclays' climate strategy is embedded into the way we think about financial planning over the coming years – reflecting on the progress we made during 2024. Incentives For the Executive Directors of Barclays PLC, an element of each of their 2024 annual bonus and 2024-2026 Long Term Incentive Plan awards was driven by non-financial performance measures, including measures relating to climate and sustainability. Barclays’ performance against non-financial measures, including climate and sustainability- related measures, was also explicitly considered in the determination of the incentive pool for 2024 performance, impacting pay levels across the workforce. Individual bonus outcomes are determined based on Group, business, and individual performance. Performance for all colleagues, including the Executive Directors and other Executive Committee members, is assessed against colleague-specific performance objectives, which are aligned to the five lenses of the consistently excellent standard. The lenses include world-class service, precision, focus, simplicity, and diversity of thought, with sustainability considerations included as part of our objective to deliver world-class service. The Group Executive Committee members responsible for Barclays’ five business divisions have specific business-related sustainability- related objectives included in their performance assessment. For all other employees, sustainability-related objectives will be role dependent. For example, within the Public Policy and Corporate Responsibility function, objectives for relevant roles will include measures to support the delivery of our climate strategy, or for relevant roles in the Investment Banking energy transition team objectives will include progress towards our financed emissions targets. Non-financial performance for the Executive Directors’ 2024 annual bonus and the 2024 incentives pool was assessed against four categories: Customers & clients; Colleagues; Climate & Sustainability, and Risk & operational excellence. The Climate & Sustainability category assessment included measures such as performance against our Sustainable and Transition Financing target, financed emissions reduction targets, targets relating to achieving net zero operations – as well as measures relating to our investment in communities. Further details can be found in our Remuneration report from page 112. Strategy Shareholder information Climate and sustainability report Governance Risk review Financial review Financial statements Barclays PLC Annual Report 2024 55 Implementing our Climate Strategy (continued) TCFD Strategy Recommendation B
Scenario analysis Climate scenario analysis forms a key part of Barclays' approach to assessing and quantifying the impact of physical and transition climate risks on the Bank's portfolios¹. We use this to better understand the significant uncertainty that arises from how climatic weather patterns will change, as well as the rapidly evolving nature of the climate transition from government policies, new technologies and changing individuals' sentiment. Through climate scenario analysis, these risks and uncertainties can be translated into financial impacts to the Bank, allowing Barclays to better understand the resilience of its business strategy. The scenarios explored in this section are under a stressed pathway. Barclays uses climate scenario analysis primarily for (1) understanding Barclays’ resilience to climate scenarios, (2) as a consideration within its financial planning process, (3) assessing the financial impacts from Barclays meeting its sectoral BlueTrackTM targets consistent with limiting the increase in global temperatures to 1.5°C, and (4) as a consideration within its assessment of Expected Credit Losses reported under IFRS 9. More detail on the use of BlueTrackTM targets and the Expected Credit Losses uses can be found on pages 44 and 251, respectively. History and evolution Since 2018, Barclays has progressively developed its internal scenario analysis capabilities, developing new climate assessment methodologies, running internal targeted exercises with external subject matter experts, and participating in regulatory climate stress-testing. In the 2024 Internal Stress Test, a single scenario was designed to assess Barclays' financial resiliency to both climate and traditional macroeconomic risk– and the extent to which Barclays would remain within risk appetite. This was an enhancement to 2023 where climate was an add-on to the Internal Stress Test. To further explore climate risks, a Reverse Stress Test was run to assess climate risks over a longer-term time horizon (2040). Finally, a Nature Stress Test was executed to assess the resilience and vulnerabilities of Barclays Europe to environmental shocks. Barclays continues to build its use of scenario analysis to explore and further understand the evolving landscape – identifying areas of risks and opportunities – to challenge existing assumptions of future climate pathways and measure the risks that climate change poses to the Bank. Note: 1 Informed by the Basel Committee on Banking Supervision's 2021 'Climate-related financial risks - measurement methodologies' report, Barclays considers climate scenario analysis as forward- looking projections of climate risk outcomes, with climate stress- testing a subset of this where the exercise is designed to evaluate financial resiliency to a severe but plausible scenario. Internal short-term transition scenario • Short-term assessment exploring the potential transition risk impact of a ‘Climate Minsky Moment’ with a rapid market correction, followed by broader macroeconomic shocks. • Scenario narrative and shocks informed by external publications such as the PRA insurance climate stress and DNB energy transition stress test. Exploratory climate scenarios by the Bank of England (BoE) • Barclays participated in the BoE’s Climate Biennial Exploratory Scenario. • Stress test covers three long-term scenarios: Early Action, Late Action and No Action. • Assessments focused on credit risk impacts to wholesale and retail portfolios. Stress-testing and integration • Quantitative integration of stress- testing results into internal capital adequacy and CET1 assessments. • Conducted two short-term climate stress tests, including a physical tipping point (H1) and full macroeconomic expansion (H2). • Development of new climate-aware models and methodologies. External case studies through UNEP FI • Case study exercises covering Power, Utilities, Oil and Gas and Residential Real Estate. • Scenario assessment based on REMIND 2°C scenario, assessing a specific client set in each sector. • Judgement-led and simplistic approach to calculate climate probabilities of default. Internal climate scenarios informed by NGFS • Long-term climate internal stress test. • Scenario narrative and shocks informed by NGFS Disorderly Transition, combined with internal scenario of comparable sensitivity (pre-COVID IFRS 9 Downside 1). • Second assessment considered incremental physical risk impact from the Hot House World scenario. Framework, regulatory and internal scenario analysis • Barclays participated in regulatory stress-tests such as ECB CRST. • Conduction of bespoke internal scenario analysis exercise. • Development of an internal framework to structure scenario- based climate risk measurement exercises. Further embedment of climate risks into stress testing framework • Climate further integrated as part of the Internal Stress Test; single scenario produced which accounted for climate risk drivers. • Reverse Stress Test run assessing the impact of transition and physical risks over a long period of time (2040), to understand impacts from extreme tail events. • Nature Exploratory Stress Test to assess resilience and vulnerability of Barclays Europe to environmental-related shocks. Strategy Shareholder information Climate and sustainability report Governance Risk review Financial review Financial statements Barclays PLC 2024 Annual Report on Form 20-F 56 Resilience of our strategy TCFD Strategy Recommendation (c) 20242018 2019 2020 2021 2022 2023
Barclays' resilience to climate scenarios Two stress tests which incorporate climate risk have been conducted during 2024, each with their own scenario which are aligned to a less than 2°C pathway, to assess the Bank's financial resiliency to transition and physical risks. Firstly, a single scenario which contained climate risk drivers over a five-year time period was designed for the 2024 Internal Stress Test and was executed utilising the bank’s stress testing framework. This year, the approach was enhanced to that taken in 2023 as climate risk was incorporated into our main internal stress test, rather than being an add-on to the macroeconomic internal stress test last year. Secondly, a reverse stress test was run to assess climate risks over a longer-term time horizon (2040), to understand the impact from extreme tail events and plausible triggers that could lead to these events unfolding sooner. Furthermore, to assess climate-related and environmental risks that the institution is exposed to, in 2024 the Bank has designed a Nature Exploratory Stress Test to assess the resilience and vulnerabilities of Barclays Europe to environmental shocks. The overall impact of the exercise is manageable within the Bank’s existing risk profile. Based on the results of the scenario analysis performed to date, our understanding is that Barclays' strategy remains resilient to climate scenarios. Given the evolving climate landscape, we seek to further enhance our capabilities and modelling to refine our understanding of the Bank's resilience to various climate scenarios, particularly given high uncertainty in this area. Internal Stress Test The 2024 Internal Stress Test was designed as a Bank-wide exercise, conducted over a five-year time period and the climate aspect of the scenario was designed to assess an accelerated transition and specific climate vulnerabilities to the Bank's business plan. The exercise includes an assessment of the financial impact to our clients of a structural decline in fossil fuel demand and consumption and shift towards low- carbon products and services. For 2024, the assessment of climate risks has been extended to be aligned with Barclays' existing stress testing approach. Scenario The 2024 Internal Stress Test scenario has been internally designed with consideration of Barclays' specific portfolio vulnerabilities. External scenarios such as those provided by the Network for Greening the Financial System (NGFS), while offering granular and detailed scenario information for financial institutions, tend to focus on longer trends and display limited volatility, with assumptions that may be less relevant to our specific businesses. As such, we have designed scenarios with a greater focus on short-term tail risks and volatility to assess Barclays' resilience. The scenario narrative was designed over a five-year timeframe aligned with the Bank's Medium Term Planning and Internal Stress Testing scenarios. Specific variables were expanded using a combination of models and subject matter expert judgement by Barclays' internal Scenario Expansion Team to assess both physical and transition climate risks. The exercise is designed to complement conventional Barclays macroeconomic stress- testing, and seeks to understand: 1) How climate can influence conventional macroeconomic stressed environment pathways and severity; and 2) The incremental impact of climate above macroeconomic stressed pathways. The climate scenario includes initial policy announcements that trigger immediate asset repricing, while more stringent policy requirements unfold over a longer time horizon – dampening recovery in the outer years as depicted in the below chart through Stages 1, 2, and 3. Against this backdrop the scenario also includes consideration of physical risk. Implications and policies of the three stages are outlined below: Strategy Shareholder information Climate and sustainability report Governance Risk review Financial review Financial statements Barclays PLC 2024 Annual Report on Form 20-F 57 Resilience of our strategy (continued) TCFD Strategy Recommendation C
Stage 1: 1 Consumer preferences shift toward greener products and practices while consumption is cut to cope with the recessionary environment. Behavioural shifts are pronounced at sector level as consumers turn away from firms who finance carbon-heavy industries. 2 Investors reassess their participation with certain firms. Those with heavy exposure to brown income and/or assets, combined with poor transition plans, are negatively impacted in equity markets – with capital reallocated to greener firms. 3 In the UK, existing proposals to tighten EPC minimum standards are accelerated, bringing forward the compliance date for Buy-to-Let, Social Housing, and UK Commercial Real Estate buildings to be at EPC C or above. Scenario impact (Illustrative only) A series of risk events lead to a drastic shift in public sentiment, demanding a policy response. Faced with a severe economic recession, impactful policies are announced to take effect during economic recovery. However it leads to an immediate repricing of assets. Existing government climate policies come into affect and contribute to the recovery, as these policies are largely investment and funding which will spur on economic activity. More stringent government climate policies - the expansion of the Emissions Trading Scheme (ETS) and the rapid introduction of a Carbon Border Adjustment Mechanism (CBAM) - come into effect. This induces a carbon price shock and leads to a dampened recovery. Jump-off Year 1.5 Year 2.5 Stress Recovery Dampened recovery Stage 2: 1 As the economy moves past peak recession, large parts of it start to consider how it can build back greener. Under continued behavioural pressure from consumers and investors, large-scale plans for transitioning to a more sustainable business model occur where possible. The return of capital on these plans and the associated delay to recovery leads to a slight prolonging of the stress, but the creation of a transition plan leads to confidence in financial markets by investors. 2 Additional policies in the UK and US are accelerated or announced. For example, the government will rapidly increase the investment and deployment of EV charging infrastructure to support faster transition in the automotive sector. Stage 3: 1 The EU and UK governments ramp up their existing emissions trading schemes to achieve 1.5°C, with a carbon price shock increasing $141/tCO2 within 12 months from 2027 and continuously increasing. This dampens economic recovery and leads to prolonged higher inflation as production costs are higher due to increased energy costs. However, to some extent, this is offset by both public and private investment to enable faster transition. 2 Introduction of Carbon Border Adjustment Mechanisms, resulting in supply-side shocks, a reduction in exports, and other trading frictions. The scenario will have significant impacts on Barclays, including: 1) Amplified market shocks: additional to existing macroeconomic shocks, there will be further equity and credit shocks for brown industries and financiers, as a result of immediate repricing. 2) Amplified credit deterioration: additional credit risk on brown industries as a result of lower earnings expectations and refinancing risks. 3) Increase in frequency of physical risk events: throughout the time horizon, there is an increase in the occurrence of physical hazards such as flood, hurricanes and droughts. Following the above narrative, scenario variables are provided with varying levels of granularity. For example, global variables – notably demand in climate-sensitive sectors such as Energy, Power and Automotive – national variables – including unemployment rates, GDP, HPI, CPI, government legislation on EPC with further distinction between commercial and residential real estate – and property level variables, including subsidence and flood. Calibration is guided by the narrative with consideration for compounding effects of existing economic downturn and climate stresses, informing the shape and magnitude of variable calibration over the scenario horizon. Material technological development has not been assumed within the economic projections, given the immediate and short time horizon of the scenario. Strategy Shareholder information Climate and sustainability report Governance Risk review Financial review Financial statements Barclays PLC 2024 Annual Report on Form 20-F 58 Resilience of our strategy (continued) TCFD Strategy Recommendation C + - — Economic Only Stress Scenario — Economic and Climate Stress
Results and insights Over the five-year period, the results of the exercise indicate a 10% impact on cumulative attributable profit in line with prior exercises. Whilst these are significant, they remain manageable within the Bank's existing risk profile. In the Investment Bank and UK Corporate portfolio, losses were driven mostly by companies operating in heavily emission intensive industries due to rising carbon prices ($349/tCO2e) over the scenario, or those within sectors where demand for products and services is rapidly falling due to consumer behaviour shifts or wider decarbonisation of the economy. For the Oil and Gas sector, whilst many companies were able to withstand the five-year stress given strong balance sheets post high prices in 2022, over longer time frames, non-linear increases in defaults are likely to be observed as carbon costs severely cut into the industry’s profits, alongside increasingly uneconomical assets due to market shifts caused by transition risk and increased frequency of physical risk. In addition, market pressures and government policies on low energy- efficiency Commercial Real Estate leads to deterioration in these markets, both in the UK and US. The impact of increased frequency of acute events is most obvious to our BUK business, where real estate and agricultural assets are susceptible to physical risks such as drought and flood. Despite this, the portfolios remain resilient due to availability of household insurance and the strong loan-to-value profile of the lending. However, considering the increasing challenges and concern with ongoing availability of insurance, a sensitivity on zero household insurance availability was conducted to better understand portfolio resiliency. Results indicated that a small population would be subjected to disproportionate impacts, though on average, resultant impacts to customer affordability and property value across the portfolio was limited. For future exercises, we will continue to refine and adapt our insurance assumptions to reflect ongoing changes in market expectations. Transition policies on emissions reductions and energy efficiency improvements do yield greater impacts, notably as customers begin to price energy performance more explicitly in their decisions. However, the resultant impact on annual profits remain manageable. For our Unsecured portfolios, the resultant GDP trajectory of the scenario notably gives rise to higher unemployment rates across Barclays’ major operating geographies, with negative impacts on consumer affordability through the loss of jobs and a weakened macroeconomic environment. Nevertheless, Barclays remains resilient and current risk management practices for these macroeconomic factors are sufficient. Results from the exercise have been integrated into Barclays' internal capital adequacy assessment process to ensure Barclays remains sufficiently capitalised to both climate and macroeconomic stresses. We acknowledge however that further advances in modelling capability and data availability are needed. For example, the scenario does not capture compounding and interaction effects between physical and transition risks that could potentially amplify such losses. As such, Barclays' annual stress testing cycle is in place to better our understanding, by testing our business under different climate scenarios, to continuously enhance our methodologies. Reverse Stress Test A climate-based Reverse Stress Test was conducted during 2024 with the objective of understanding specific extreme climate events that would make the Group’s business model no longer viable. The exercise considered a breakdown of the insurance/re-insurance market following heightened physical risks over a longer period going into 2040, along with elevated financial stress of customers and clients unable to transition within this timeframe. The narrative was designed internally (with reference to the IEA’s Announced Pledges Scenario (APS)). The associated climate events position the world in 2040, where economies have transitioned in line with APS, however the transition is uneven and fragile, leaving many companies and sectors unable to adjust and therefore still highly vulnerable to transition risks. In this context, while the world has significantly reduced its reliance on fossil fuels, certain segments of the economy were unable to reduce their carbon footprint and use of fossil fuels for electricity generation continued due to higher demand for electricity. In this scenario, we assumed that the clients with slow and delayed progress on their transition plans and lower credit worthiness to be most affected. For physical risk, the narrative considered increased frequency and severity of physical perils leading to consecutive years of losses in the insurance industry. Heightened secondary perils (more frequent, but with lower severity, such as flooding and wildfire), would lead to repeated loss claims, leading to significant shifts in the insurance industry and adjustment of their risk appetite, reducing insurance availability in the areas most exposed to physical risks. Additionally, it was assumed that governments do not intervene in the insurance markets and the UK Government’s Flood Re scheme expires in 2039 as currently planned. This resulted in many customers and clients, either not insuring, self-insuring or facing significantly higher insurance premiums, driving affordability constraints and significant asset devaluation. Results and insights Three sensitivities related to increasing the proportion of the portfolio impacted were tested for the Corporate, Mortgages and Structured Lending and Financing portfolio, reflecting the high level of uncertainty of the scenario. The Group’s business model could reach non-viability in the two most extreme cases which tested our vulnerability to profit and Risk Weighted Assets. The exercise highlighted how the portfolios could be the major driver of losses in a climate scenario, particularly due to physical risk. For UK mortgages in particular, the exercise provided valuable insights of the potential effects of the Flood Re reinsurance scheme expiring, particularly in customers that currently see a lower insurance premium due to the scheme. For the Corporates portfolio, results highlighted how the portfolio is exposed to both fast and slow transition risks, and for physical risk, how secondary perils could strain the portfolio if they drive repeated loss claims that insurance companies struggle to price and model. For our Structured Lending and Financing portfolio, the exercise pointed out that extreme tail risk is driven by commensurately severe devaluation of properties in certain US states. Nature Exploratory Stress Test During 2024, the Bank undertook a Nature Exploratory Stress Test (NEST) to assess the vulnerability and resilience of Barclays Europe's portfolio to environment-related shocks. The NEST exercise was conducted as an incremental exercise to the internal stress test and focused on credit, market, liquidity and operational risk categories. The nature scenario narrative and five- year horizon aligned to the Internal Supply chain scenario published by Green Finance Institute in February 2024. The scenario also leveraged the Network for Greening the Financial System recommendations on selected risk drivers and transmission channels. Results and insights Over the five-year period, the results of the exercise indicated an adverse impact to Barclays Europe, due to clients operating in TNFD nature priority sectors such as Automotive, Chemicals, Food, Bev and Tobacco. However, these impacts Strategy Shareholder information Climate and sustainability report Governance Risk review Financial review Financial statements Barclays PLC 2024 Annual Report on Form 20-F 59 Resilience of our strategy (continued) TCFD Strategy Recommendation C
are manageable within the bank's existing risk profile. 2024 Enhancements During 2024, Barclays have made several key enhancements across climate scenario development, climate risk modelling, and the ways in which we embed climate learnings into our risk management • Climate scenarios are designed and developed with our internal specialist scenario expansion team, leveraging the tools and approaches of the existing scenario expansion processes and supplementing these with specific climate analysis. This ensures consistency in climate scenario design alongside existing regulatory scenarios, as well as detailed and granular climate scenario expansion. • Our climate scenarios are gradually becoming more embedded within our existing stress testing procedures, producing climate aware stressed scenarios. Climate has been integrated into the Internal Stress Test; with a single scenario produced which accounted for climate risk drivers. • A suite of qualitative and quantitative models have been developed and enhanced to be able to analyse the risk due to physical and transition drivers specifically across large corporates, mortgages, agriculture and real estate. • Further embedment of climate risk into capital risk appetite, via climate informed stress loss limits and supporting climate stress loss riggers, to control the Bank's activity within its CET1 capital constraint. • The Corporate Model was redeveloped this year to become a production based model (more cognisant of company business activity), as well as linking to the Barclays’ Client Transition Framework such that companies that have insufficient transition plans fare worse under the stress scenario. • The model also introduces asset-level modelling where carbon policies are applied taking into consideration the different jurisdictions that companies operate in. This takes into consideration both a differential carbon tax policy as well as the risk a company is prone to from acute and chronic physical risk. • We have continued to enhance our modelling capabilities in the UK Residential Mortgages space by considering additional transmission channels as well as streamlining the execution process through technological platforming, to allow results to flow more seamlessly for downstream consumption. The model now captures properties which do not have an EPC certificate using an EPC fall-back. • For Real Estate portfolios, while the model remains qualitative this year, in addition to loan to value impacts, rental impacts were also assessed as the 2024 Internal Stress Test scenario called for upgrading properties to Minimum Energy Efficiency Standards. The approach was also adapted to allow for better downstream integration for this portfolio. • For our Agriculture portfolio, impacts of methane tax were a key consideration. The scenario narrative this year had a consistent view of carbon and methane tax. It included for the first time calibration for methane tax as a tax on sales on beef, lamb and dairy in line with the UK Standard VAT rate. For physical risk, the likelihood of drought was assessed on a broader population. Challenges and limitations Barclays is continuing to bettering its understanding of the interlinking relationships between climate, particularly transition risk, and macro variables. A lack of adequate historical data being a key limitation to progress. Data There are inherent challenges in climate modelling due to limitations in data quality and availability, given the short history of climate assessments within the financial services industry. • Data coverage is often lacking, where a subset of assets may not have the appropriate information publicly disclosed. Climate scenario risk analysis requires approaches and tools that are more granular (e.g. focus on company-level analysis), which differs from more traditional stress-testing exercises conducted at portfolio or sector level. This creates a need for more granular data. • While high data granularity is desirable to model client specific features, the balances between high data granularity and the additional insights provided must be investigated to assess the appropriate level of modelling • Data coherence issues may present inconsistencies in modelling. Emissions data is often one-year lagged, thus where the latest quarter/year financials are available, the emissions data may not be reflective of the company's operations, especially where there has been substantial growth or decline, mergers and acquisitions or other special activities. Scenario There are inherent uncertainties with scenario design largely attributed to limited history of the interactions between climate risks and the economy. • Timing and interactions of physical and transition risks can impact the Bank's assessment of capital adequacy and resilience. Assumptions around such compounding effects, while nuanced, are critical to our loss assessment and subsequently risk management processes and business strategy • There is a significant level of uncertainty with climate stress-testing projections in (i) how the scenario will manifest; (ii) how customers and clients will react; and (iii) the final loss quantification • An understanding of compounding risks and feedback loops between financial systems, the economy, and climate risks remains a challenge, given the lack of historical precedent of such interactions. Over longer time horizons, it becomes increasingly difficult to capture the range of second-order effects as physical and transition risks evolve, assess the rate in which risks manifest or subside, or identify inflection points. • The Nature scenario and outcomes are more uncertain than climate-equivalents, in part driven by the absence of publicly available scenarios, such as the IEA or NGFS in climate (the Green Finance Institute publication being the first of its kind). There is also likely to be interplay between climate and nature outcomes which has not been considered as part of the Nature Exploratory Stress Test. Strategy Shareholder information Climate and sustainability report Governance Risk review Financial review Financial statements Barclays PLC 2024 Annual Report on Form 20-F 60 Resilience of our strategy (continued) TCFD Strategy Recommendation C
Information provided in climate and sustainability disclosures What is important to our investors and stakeholders evolves over time, and we aim to anticipate and respond to these changes. Disclosure expectations in relation to climate change and sustainability matters are particularly fast moving, and differ from more traditional areas of reporting including in relation to the level of detail and forward-looking nature of the information involved and the consideration of impacts on the environment and other persons. We have adapted our approach in relation to the disclosure of such matters. Our climate and sustainability disclosures take into account the wider context relevant to these topics, which may include evolving stakeholder views, the development of our climate strategy, longer timeframes for assessing potential risks and impacts, international long-term climate- and nature-based policy goals, evolving sustainability-related policy frameworks (and the harmonisation or interoperability of relevant regulation) and geopolitical developments and regional variations. Our climate and sustainability disclosures are subject to more uncertainty than disclosures relating to other subjects, given market challenges in relation to data reliability, consistency and timeliness – the use of estimates, judgements and assumptions which are likely to change over time, the application and development of data, models, scenarios and methodologies, the change in regulatory landscape, and variations in reporting standards. These factors mean disclosures may be amended, updated, and recalculated in future as market practice and data quality and availability develops, and could cause actual achievements, results, performance or other future events or conditions to differ, in some cases materially, from those stated, implied and/or reflected in any forward-looking statements or metrics included in our climate and sustainability disclosures. We give no assurance as to the likelihood of the achievement or reasonableness of any projections, estimates, forecasts, targets, commitments, ambitions, prospects or returns contained in our climate and sustainability disclosures and make no commitment to revise or update any such disclosures to reflect events or circumstances occurring or existing after the date of such statements. Disclaimers In preparing the climate and sustainability content within the Barclays PLC annual report on Form 20-Fwherever it appears, we have: • Made certain key judgements, estimations and assumptions. This is, for example, the case in relation to financed emissions, portfolio alignment, classification of environmental and social financing, operational emissions and sustainability metrics, measurement of climate risk and scenario analysis • Used climate and sustainability data, models, scenarios and methodologies we consider to be appropriate and suitable for these purposes as at the date on which they were deployed. This includes data, models, scenarios and methodologies made available by third parties (over which we have no control) and which may have been prepared using a range of different methodologies, or where the basis of preparation may not be known to us. Methodologies, interpretations or assumptions may not be capable of being independently verified and may therefore be inaccurate. Climate and sustainability data, models, scenarios and methodologies are subject to future risks and uncertainties and may change over time. Climate and sustainability disclosures in this document, including climate and sustainability-related data, models and methodologies, are not of the same standard as those available in the context of other financial information and use a greater number and level of judgements, assumptions and estimates, including with respect to the classification of climate and sustainable financing activities. Climate and sustainability disclosures are also not subject to the same or equivalent disclosure standards, historical reference points, benchmarks or globally accepted accounting principles. Historical data cannot be relied on as a strong indicator of future trajectories in the case of climate change and its evolution. Outputs of models, processed data, scenario analysis and the application of methodologies will also be affected by underlying data quality, which can be hard to assess, or challenges in accessing data on a timely basis • Continued (and will continue) to review and develop our approach to data, models, scenarios and methodologies in line with market principles and standards as this subject area matures. The data, models, scenarios and methodologies used (including those made available by third parties) and the judgements, estimates and/or assumptions made in them or by us are rapidly evolving, including scientific evidence relating to climate change and scenarios outlining pathways to net zero, and this may directly or indirectly affect the metrics, data points, targets, convergence points and milestones contained in the climate and sustainability content within the annual report on Form 20-F. Further, changes in external factors which are outside of our control such as accounting and/or reporting standards, improvements in data quality, data availability, or updates to methodologies and models and/or updates or restatements of data by third parties, could impact – potentially materially – the performance metrics, data points, targets, convergence points and milestones contained in the climate and sustainability content within the annual report on Form 20-F. In future reports we may present some or all of the information for this reporting period (including information made available by third parties) using updated or more granular data or improved models, scenarios methodologies, market practices or standards. Equally, we may need to re- baseline, restate, revise, recalculate or recalibrate performance against targets, convergence points or milestones on the basis of such updated data. Strategy Shareholder information Climate and sustainability report Governance Risk review Financial review Financial statements Barclays PLC 2024 Annual Report on Form 20-F 61 Important information/Disclaimers
Such updated information may result in different outcomes than those included in the annual report on Form 20-F. It is important for readers and users of the annual report on Form 20-F to be aware that direct, like-for-like comparisons of each piece of information disclosed may not always be possible from one reporting period to another. The “Implementing our climate strategy” section of the annual report on Form 20-F highlights where information in respect of a previous reporting period has been updated. Our principles-based approach to reporting financed emissions data (see page 38) sets out when financed emissions information in respect of a prior year will be identified and explained • Included in the annual report on Form 20-F a number of graphics, infographics, text boxes and illustrative case studies and credentials which aim to give a high-level overview of certain elements of the climate and sustainability content within the annual report on Form 20-F and improve accessibility for readers. These graphics, infographics, text boxes and illustrative case studies and credentials are designed to be read within the context of the annual report on Form 20-F as a whole. There are a variety of internal and external factors which may impact our reported metrics and progress against our targets, convergence points and milestones. Strategy Shareholder information Climate and sustainability report Governance Risk review Financial review Financial statements Barclays PLC 2024 Annual Report on Form 20-F 62 Important information / Disclaimers (continued)
Board Governance Welcome to our 2024 Board Governance report. The report sets out the composition of our Board and explains how our Board governance framework operates, alongside the key areas of focus of our Board and Board Committees in 2024. Aim of our governance The primary aim of our governance is that it: • seeks to ensure that our decision-making is aligned to our Purpose, Values and Mindset • creates long-term sustainable value for our shareholders, having regard to the interests of all our stakeholders • is effective in providing constructive challenge, advice and support to management • provides checks and balances and drives informed, collaborative and accountable decision-making. Compliance with the Code • Our Board Governance report reflects the requirements of the 2018 UK Corporate Governance Code (the Code). • To view how we comply with the Code, please see pages 104 to 105. Certain additional information, signposted throughout this report, is available at home.barclays/corporategovernance Directors’ report Board of Directors 64 Group Executive Committee 68 Our governance framework 69 Key Board activities 72 Board Nominations Committee report 75 Board Audit Committee report 86 Board Risk Committee report 95 Board Sustainability Committee report 101 How we comply 104 Other statutory and regulatory information 106 Remuneration report 112 Strategy Shareholder information Climate and sustainability report Risk review Financial review Financial statements Barclays PLC 2024 Annual Report on Form 20-F 63Governance
Setting our strategic direction Responsible for the overall leadership of the Group, driven by our Purpose, Values and Mindset. Board Committee membership Audit Committee Member Remuneration Committee Member Sustainability Committee Member Nominations Committee Member Risk Committee Member Committee Chair Skills, experience and contribution: • seasoned business leader with extensive experience in, and understanding of, banking and the financial services industry • strong track record in leading and chairing organisations • significant experience in providing strategic advice to major international organisations and governments • keenly focused on culture and corporate governance. Nigel spent 36 years at Rothschild & Co. where his last role was as Deputy Chairman. Prior to that he had been Co-Chief Executive, Chairman of the Group Executive Committee and Managing Partner of Rothschild & Co for a decade. Nigel was appointed a member of the Board Remuneration Committee with effect from 31 January 2025. Key current appointments: Chairman, Sadler’s Wells; Non-Executive Director, Tetra Laval Group Nigel Higgins Group Chairman Appointed March 2019 (Board) May 2019 (Chairman) Skills, experience and contribution: • highly regarded leader with significant global banking experience • extensive background in financial markets and risk management • deep understanding of the business and the areas within which the Group operates. Prior to his appointment as Group Chief Executive, Venkat served as Head of Global Markets and Co-President of Barclays Bank PLC from October 2020 and Group Chief Risk Officer from 2016 to 2020. Before joining Barclays in 2016, Venkat worked at JPMorgan Chase from 1994, holding senior roles in Asset Management, Investment Banking, and in Risk. For a period during 2024, Venkat served as a member of a new National Wealth Fund Taskforce, comprised of leading figures from the UK's investment and financial services sector advising the incoming UK government. Key current appointments: Board Member, Institute of International Finance; Chair, Financial Services Taskforce to the Sustainable Markets Initiative; Director, Focusing Capital on the Long Term (FCLT) Global C.S. Venkatakrishnan Group Chief Executive Appointed November 2021 Skills, experience and contribution: • extensive senior level experience of management, finance and strategy • deep experience of US and UK shareholder engagement • significant experience with, and understanding of, the challenges and opportunities inherent in advancing a sustainable energy future. Brian spent much of his career with BP p.l.c. in senior leadership roles, where most latterly he held the role of Chief Financial Officer. His other senior-level experience includes serving on the boards of various commercial and charitable organisations. Brian was Chair of The 100 Group of FTSE 100 Finance Directors, a member of the UK Treasury Financial Management Review Board and has served on various Business in the Community Leadership Teams. Key current appointments: Non-Executive Chair, INEOS Energy; Non- Executive Director, Defence Board, Ministry of Defence; Chair, The Royal Navy and Royal Marines Charity; Senior Independent Director, The Francis Crick Institute Brian Gilvary Senior Independent Director (SID) Appointed February 2020 (Board) January 2021 (SID) Strategy Shareholder information Climate and sustainability report Risk review Financial review Financial statements Barclays PLC 2024 Annual Report on Form 20-F 64Governance Directors’ report: Board of Directors
Skills, experience and contribution: • proven track record of management of risk exposure for a global financial institution and building a modern group- wide risk management organisation • strong record of integrating risk management with strategy • significant experience in finance, model development and trading. Robert has considerable risk management expertise having had a 28-year career at Goldman Sachs, where, prior to his retirement in 2018, he held the role of Co- Deputy Chief Risk Officer. Key current appointments: Trustee, High Watch Recovery Center (incorporating President, Alina Lodge) Robert Berry Independent Non-Executive Director Appointed February 2022 Skills, experience and contribution: • significant experience in strategic planning • extensive financial services experience • detailed knowledge of risk management and UK and EU regulation. Tim is Chair of Barclays Bank Ireland PLC (also referred to as Barclays Europe). He had a distinguished career with Legal & General where, among other roles, he was the Group Chief Executive Officer until June 2012. Tim also served as Chair of the Association of British Insurers. Key current appointments: Chair, Quilter Investors Limited Tim Breedon CBE Independent Non-Executive Director Appointed November 2012 Skills, experience and contribution: • extensive accounting and financial services expertise • deep understanding of banking and retail sectors • significant financial leadership experience of financial institutions. Anna is a chartered accountant and Group Finance Director with responsibility for the Finance function, including Tax, Treasury, Investor Relations and Strategy. Prior to joining Barclays, Anna worked in both banking and retail and held various roles at Asda, HBOS and Lloyds Banking Group. Since joining Barclays in 2013, Anna was appointed Chief Financial Officer of Barclays Bank UK PLC in 2016, Group Financial Controller in 2019 and Deputy Group Finance Director in 2020. She joined the Group Executive Committee in February 2022, before taking up the role of Group Finance Director in April 2022. Key current appointments: Chair, The 100 Group of FTSE 100 Finance Directors Anna Cross Group Finance Director Appointed April 2022 Skills, experience and contribution: • extensive management experience of international financial institutions • strong financial and strategic leadership experience • detailed knowledge of the markets in which the Group operates. Dawn holds the role of Chief Executive Officer and Chief Investment Officer at Soros Fund Management LLC. Her previous experience includes 25 years with UBS, most recently as Head of Investments for UBS Asset Management. Key current appointments: Chief Executive Officer and Chief Investment Officer, Soros Fund Management LLC; Advisory Council Member, The Bretton Woods Committee; Chair, Financial Sector Advisory Council, Federal Reserve Bank of Dallas Dawn Fitzpatrick Independent Non-Executive Director Appointed September 2019 Strategy Shareholder information Climate and sustainability report Risk review Financial review Financial statements Barclays PLC 2024 Annual Report on Form 20-F 65Governance Directors’ report: Board of Directors (continued)
Skills, experience and contribution: • extensive board-level experience across a range of industries • strong focus on reputation management and promoting board governance values • detailed understanding of the interaction between public and private sectors. Mary's previous appointments include Non- Executive Directorships at the Bank of England, Alliance & Leicester, Aviva, Centrica and Swiss Re Group. In her executive career, Mary held senior positions with both HM Treasury and the Prime Minister's Office and served as Director General of the Association of British Insurers. Mary is the Barclays Bank PLC Consumer Duty Champion. Key current appointments: Senior Independent Director, PensionBee Group PLC; Member, UK Takeover Appeal Board Mary Francis CBE Independent Non-Executive Director Appointed October 2016 Skills, experience and contribution: • deep background in financial services • strong leadership qualities and chair experience • extensive expertise providing strategic advice to Government. John is Chair of Barclays Bank UK PLC. He had a long Whitehall career, where he was Second Permanent Secretary to HM Treasury and was also closely involved in the UK response to the financial crisis, handling the resolution of Northern Rock and leading negotiations with RBS, Lloyds and HBOS on their £37bn recapitalisation. John was also the first Chief Executive of UK Financial Investments Ltd (UKFI), and from 2010-2012, he was Global Co-Head of the Financial Institutions Group at Rothschild. From 2016 to 2021, John was the first Chair of UK Research & Innovation, which oversees Government science funding of c.£8bn a year. Between 2020 and January 2023, he was Chair of Tesco Personal Finance plc. Key current appointments: Chair, Legal & General Group plc; Trustee & Deputy Chair of the Board of Trustees, The National Gallery Sir John Kingman Independent Non-Executive Director Appointed June 2023 Skills, experience and contribution: • strong technical finance background in accounting and audit-related matters • significant board and senior executive- level risk management experience • extensive knowledge of banking and financial services. Marc is a chartered accountant and his financial services experience extends over 43 years, initially as a trader and then in senior executive roles as an audit partner at PwC, and Chief Financial Officer of JPMorgan Europe. He joined HSBC in 2005 where he was Group Chief Risk Officer for nine years and joined the group board as an executive director in 2014. He retired from HSBC in 2019. Key current appointments: None Marc Moses Independent Non-Executive Director Appointed January 2023 Skills, experience and contribution: • deep experience of financial services sector • strong operations, technology and transformation experience • detailed knowledge and understanding of US financial regulation. Brian was appointed Chair of BX with effect from 1 February 2025. Brian's executive and non-executive career extends to over 40 years in the financial services industry. He was Vice Chairman and Chief Executive Officer of Investment Services at BNY Mellon from 2014 until his retirement in 2017. Prior to this, he served in a variety of executive roles, including as Chief Executive Officer of Pershing, LLC. (a BNY Mellon company).  He is a former non-executive director of Fidelity National Information Services, Inc. and has also held several US securities industry and regulatory board and advisory committee positions. Key current appointments: Board of Directors, Ameriprise Financial, Inc.; Board of Directors, RBB Fund, Inc.; Board of Trustees, Catholic Charities of the Archdiocese of New York Brian Shea Independent Non-Executive Director Appointed July 2024 Strategy Shareholder information Climate and sustainability report Risk review Financial review Financial statements Barclays PLC 2024 Annual Report on Form 20-F 66Governance Directors’ report: Board of Directors (continued)
Skills, experience and contribution: • significant board and executive-level strategic and financial leadership experience • extensive accounting, audit and financial services expertise • strong UK regulatory experience. Julia is a chartered accountant and was the Group Finance Director of 3i Group plc, having served on its board from 2008 until she stepped down in June 2022. Prior to joining 3i she was Group Director of Corporate Finance at Cable & Wireless where she also held a number of finance-related roles. Julia was appointed a Non-Executive Director at Legal & General Group plc in 2011. She chaired L&G’s Audit Committee between 2013 and 2016 and was Senior Independent Director from 2016 until she stepped down from L&G in March 2021. Julia previously served as the Chair of The 100 Group of FTSE 100 Finance Directors. Julia was appointed a Non-Executive Director of Bunzl plc in December 2024 and will become Chair of the Audit Committee in April 2025. Key current appointments: Non-Executive Director, Bunzl plc Julia Wilson Independent Non-Executive Director Appointed April 2021 Relevant skills and experience: Hannah is an experienced lawyer and company secretary with significant experience in corporate governance, regulatory, disclosure and market conduct matters. Career: Hannah joined Barclays in September 2012 as Chief of Staff to the Investment Bank General Counsel. Having moved from the Legal function to Barclays Corporate Secretariat in 2016, she was subsequently appointed Deputy Company Secretary of Barclays PLC in 2018. In February 2023, Hannah was appointed Group Company Secretary and was subsequently invited to join the Group Executive Committee as a standing attendee in 2024. Prior to joining Barclays, Hannah was a Senior Associate in the London Corporate practice of Clifford Chance LLP. Hannah Ellwood Group Company Secretary Appointed February 2023 Strategy Shareholder information Climate and sustainability report Risk review Financial review Financial statements Barclays PLC 2024 Annual Report on Form 20-F 67Governance Directors’ report: Board of Directors (continued)
Leading the execution of our strategy The Group Executive Committee (ExCo), as the most senior management committee for the Barclays Group, supports the Group Chief Executive in executing Barclays' strategic priorities. C.S. Venkatakrishnan Group Chief Executive Anna Cross Group Finance Director Alistair Currie Group Chief Operating Officer and Chief Executive, Barclays Execution Services Limited (BX) Stephen Dainton President of Barclays Bank PLC and Head of Investment Bank Management Cathal Deasy Global Co-Head of Investment Banking Matt Fitzwater Group Chief Compliance Officer Matt Hammerstein Chief Executive of the UK Corporate Bank and Head of Public Policy and Corporate Responsibility Adeel Khan Head of Global Markets Vim Maru Chief Executive of Barclays UK Denny Nealon Chief Executive Officer for Barclays US Consumer Bank (USCB) and Barclays Bank Delaware (BBDE) Tristram Roberts Group Human Resources Director Taalib Shaah Group Chief Risk Officer Stephen Shapiro Group General Counsel Sasha Wiggins Chief Executive of Private Bank and Wealth Management Taylor Wright Global Co-Head of Investment Banking Changes in ExCo during 2024 Barclays announced on 20 February 2024 the re-segmentation of its operating structure into five divisions, with each of the divisional heads appointed as members of ExCo in their new roles. This resulted in: • Stephen Dainton, Cathal Deasy, Adeel Khan and Taylor Wright becoming members of ExCo, having previously joined as standing attendees • Denny Nealon joining as a new ExCo member in his capacity as Chief Executive Officer, USCB and BBDE • Matt Hammerstein, Vim Maru and Sasha Wiggins retaining their prior ExCo membership but in their new capacities as relevant business heads. During 2024 we also welcomed Matt Fitzwater to ExCo as Group Chief Compliance Officer. We are grateful for the contributions made by Paul Compton (Global Head of the Corporate and Investment Bank, and President of BBPLC) and Kirsty Everett (Group Chief Compliance Officer) as they stepped down from their respective roles during 2024. Standing attendees The Group Chief Executive continues to extend a standing invitation to Craig Bright, Chief Information Officer. During 2024, standing invitations to ExCo were also extended to: • Gijs Borghouts, Group Chief Internal Auditor (and Lindsay O'Reilly, the prior Group Chief Internal Auditor, before she stepped down from this role) • Hannah Ellwood, Group Company Secretary • Anita Tanna, Group Chief of Staff. Ex-officio posts ExCo continues to utilise ex-officio positions on the Committee to promote diversity of thought, provide specialist input and bring new perspectives, with each appointee serving a four-month rotation. During 2024, the following attendees joined ExCo meetings as an ex-officio: • Betty Gee, Americas Head of Equities Distribution within the Corporate and Investment Bank • Hannah Bernard, Head of Business Banking, Barclays UK • Claire Peel, Chief Financial Officer, Barclays UK • Jaideep Khanna, Head of Barclays, Asia Pacific. Strategy Shareholder information Climate and sustainability report Risk review Financial review Financial statements Barclays PLC 2024 Annual Report on Form 20-F 68Governance Directors’ report: Group Executive Committee
A governance framework to facilitate effective decision-making across the Group Committed to high standards of corporate governance to drive long-term sustainable value for our shareholders. Group structure Barclays PLC (BPLC) is the Group’s parent company and is listed on the London Stock Exchange. Each of the Group’s key operating entities - Barclays Bank PLC (BBPLC), Barclays Bank UK PLC (BBUKPLC), Barclays Bank Ireland PLC (Barclays Europe), Barclays US LLC and Barclays Bank Delaware - has its own board (with executive and non-executive directors) and board committees. These main operating entities are supported by our Group-wide service company, Barclays Execution Services Limited (BX), which provides technology, operations and functional services to businesses across the Group. Barclays PLC BBPLC Barclays' non-ring fenced operations Barclays Europe Barclays US LLC Barclays Bank Delaware BBUKPLC Barclays' ring-fenced bank BX Barclays' service company Our governance framework The Board recognises the importance of effective governance as an enabler to the successful development and execution of the Group’s strategy. We consider governance to be how the Board makes decisions and provides oversight to promote Barclays’ success for the long- term sustainable benefit of our shareholders, having regard to the interests of our stakeholders, which include our customers and clients, colleagues and the society and wider environment in which we operate. Our Group-wide governance framework is designed to: • facilitate the effective management of the Group by our Group Chief Executive and his ExCo across our diverse businesses; and • support and provide oversight and constructive challenge of the Group’s major subsidiary boards in the UK, Ireland and the US, having regard to the legal, regulatory and independence requirements applicable to those entities. Generally, there is one set of rules for the Group. Group-wide frameworks, policies and standards are adopted throughout the Group unless local laws or regulations require otherwise (for example, the ring- fencing obligations applicable to BBUKPLC), or ExCo decides otherwise in a particular instance. Corporate Governance Operating Manual Our Corporate Governance Operating Manual sets out how the Group’s significant subsidiaries (and their respective boards and board committees) should interact with each other. It also provides guidance and clarity for management and Directors as to how these relationships and processes should work in practice. This is a dynamic document that evolves alongside the changing nature of the Group. The role of the Board The BPLC Board sets the purpose, strategic direction and risk appetite for the Group and is the ultimate decision-making body for matters of Group-wide strategic, financial, regulatory and/or reputational significance. The Board also has direct oversight of matters relating to culture. Membership of the BPLC and BBPLC Boards is partially consolidated in order to drive efficiency and co-ordination, whilst also reducing complexity and unnecessary duplication. As a result, membership of the BBPLC Board is a subset of the BPLC Board, with all members of the BPLC Board (except for the Senior Independent Director (SID), Chair of BBUKPLC and at least one other Non-Executive Director) also serving on the BBPLC Board. We believe that having members of the BPLC Board serving as the Chairs of some of the Group’s main operating entities supports improved efficiency, oversight, escalation and co-ordination while ensuring an appropriate focus is given to matters relevant to each entity. Strategy Shareholder information Climate and sustainability report Risk review Financial review Financial statements Barclays PLC 2024 Annual Report on Form 20-F 69Governance Directors’ report: Our governance framework
Board governance framework Barclays PLC Board Responsible for the overall leadership of the Group (with direct oversight of strategy, culture and strategic reputational matters relating to the Group) Board Nominations Committee Board Audit Committee Board Risk Committee Board Sustainability Committee Board Remuneration Committee Oversees the composition of, and appointments to, the Board, Board Committees and ExCo. Reviews financial reports and monitors the internal control environment. Oversees risk appetite and management of principal risks. Oversees climate and sustainability matters. Sets principles and parameters of remuneration policy. Matters reserved to the Board Our bespoke Matters Reserved to the Board, which is reviewed on a regular basis, sets out the matters reserved solely for the decision-making power of the Board. These matters include material decisions relating to strategy, risk appetite, medium term plans, capital and liquidity plans, risk management and controls frameworks, strategic reputational matters and the approval of financial statements, large transactions, share allotments, dividends and share buy-backs. Responsibility for the Group’s business on a day-to-day basis has been delegated by the Board to the Group Chief Executive, supported by his ExCo, to make and implement strategy and operational decisions. Information provided to the Board The Group Chairman is responsible for setting the Board’s agenda, primarily focused on strategy, performance, value creation, culture and stakeholders. In addition, the Group Chairman is responsible for ensuring that Board members receive timely and high-quality information to enable sound decision- making and promote the success of BPLC. The Group Company Secretary, working in collaboration with the Group Chairman, is responsible for ensuring good governance and information flow to support the Board’s effectiveness. In addition to the presentations delivered to the Board and the Board Committees as part of formal meetings, the Board is kept informed of key business and external developments during the year through updates from the Executive Directors, ExCo and senior management. Directors have access to the advice of the Group Company Secretary and are also able to seek independent and professional advice at Barclays’ expense, where required, to enable them to fulfil their obligations to BPLC. Board Committees The Board is supported in its work by its Committees: the Board Nominations Committee, Board Audit Committee, Board Risk Committee, Board Sustainability Committee and the Board Remuneration Committee. Each Board Committee has its own terms of reference setting out its remit and decision-making powers. The Board Committees are comprised solely of Non-Executive Directors, with the exception of the Board Sustainability Committee of which the Group Chief Executive is an Executive member. In that role, the Group Chief Executive brings invaluable climate and sustainability insights to the Committee’s discussions, including external perspectives from his outside appointments. The Chairs of each Committee report regularly on their Committee's work to the Board. You can read more about the work of each Board Committee later in the Governance report. The Board may from time to time establish ad hoc Committees to oversee specific matters as and when they arise. Conflicts of interest The Board has the authority to authorise Director conflicts of interest in accordance with the Companies Act 2006 and BPLC’s articles of association (Articles). This ensures that the influence of third parties does not compromise the independent judgement of the Board. Directors are required to declare any potential or actual conflicts of interest that could interfere with their ability to act in the best interests of the Group. A conflicts register recording actual and potential conflicts of interest, together with any Board authorisations of conflicts, is maintained. Authorisations are for an indefinite period but are reviewed on an annual basis by the Board. The Board also considers the effectiveness of the conflicts authorisation process. The Board retains the power to vary or terminate conflicts authorisations at any time. Attendance at Board meetings Directors are expected to attend every Board meeting. Where a Director is not able to attend a Board meeting, the relevant Director's views are generally made known to the Group Chairman in advance of the meeting. The Group Chairman also meets privately, on a regular basis, with the Non-Executive Directors. Details of Director attendance at Board meetings during 2024 is set out on the next page, and details of Director attendance at Board Committee meetings is set out in the report of each Board Committee. Board effectiveness The effectiveness of the Board, Board Committees and individual Directors is assessed on an annual basis. In line with the requirements of the Code, an externally facilitated performance review was conducted for 2024. You can read about the results of this review, as well as progress against the recommendations from the internally facilitated Board review for 2023, in the report of the Board Nominations Committee from page 75. Strategy Shareholder information Climate and sustainability report Risk review Financial review Financial statements Barclays PLC 2024 Annual Report on Form 20-F 70Governance Directors’ report: Our governance framework (continued) For more information, see page 75. For more information, see page 86. For more information, see page 95. For more information, see page 101. For more information, see page 112.
Division of responsibilities and Board meeting attendance Roles on the Board In line with the provisions of the Code, a clear division of responsibilities has been established between Executive and Non-Executive Directors. Our Charter of Expectations sets out the individual role profiles and required behaviours and competencies for the Chair, SID, Non-Executive Directors, Executive Directors and Committee Chairs. A summary of the role profiles for Board members is set out in the table below. Attendance at Board meetings The table below provides details of Director attendance at Board meetings during 2024. The aggregate attendance for Board and Board Committee meetings in 2024 did not fall below 75% for any Director. Role on Board Meetings attended/eligible to attend Ad hoc meetings attended/eligible to attend Responsibilities Chair Nigel Higgins1 7/7 1/1 The Chair is responsible for: • leading the Board and its overall effectiveness in directing the Company • promoting a culture of openness and inclusion, and facilitating and encouraging open constructive challenge and debate between all Directors • ensuring the Board has a clear understanding of shareholder views. Senior Independent Director Brian Gilvary 7/7 0/12 The SID is responsible for: • providing a sounding board for the Chair; serving as a trusted intermediary for the other Directors and shareholders when necessary • maintaining contact as required with major shareholders to understand their issues and concerns, and ensuring the Board is aware of their views • leading the appraisal of the Chair’s performance, at least annually. Group Chief Executive C.S. Venkatakrishnan 7/7 1/1 The Group Chief Executive, supported by his ExCo, is responsible for: • managing the Group’s business on a day-to-day basis and making and implementing operational decisions • leading Barclays towards the achievement of its strategic objectives and implementing the strategy set by the Board • promoting and demonstrating the appropriate culture, values and behaviours, including Barclays’ Purpose, Values and Mindset. Group Finance Director Anna Cross 7/7 1/1 The Group Finance Director is responsible for: • together with the Group Chief Executive, the achievement of financial targets for the Group • providing strategic and functional leadership of the Finance functions • managing and responding to feedback on Barclays' business performance from investors, financial institutions, regulators and auditors. Non-Executive Directors Robert Berry 7/7 1/1 Non-Executive Directors (including the Chair and SID) are responsible for: • providing effective oversight, strategic guidance and constructive challenge • helping to develop proposals on strategy and empowering the Executive Directors to implement the Group’s strategy while scrutinising and holding to account the performance of management and Executive Directors against agreed performance objectives • with the support of the Board Nominations Committee, the appointment and removal and succession planning for Executive Directors. Notes: 1 As required by the Code, the Group Chairman was independent on appointment. 2 The ad hoc meeting was called at short notice. Brian Gilvary was unable to attend due to a prior commitment. 3 Brian Shea was appointed to the Board with effect from 19 July 2024. 4 Mohamed A. El-Erian stepped down from the Board on 31 August 2024. 5 Diane Schueneman retired from the Board with effect from 31 January 2025. Tim Breedon 7/7 1/1 Dawn Fitzpatrick 7/7 1/1 Mary Francis 7/7 1/1 Sir John Kingman 7/7 1/1 Marc Moses 7/7 1/1 Brian Shea3 4/4 0/0 Julia Wilson 7/7 1/1 Former Directors Mohamed A. El-Erian4 4/4 1/1 Diane Schueneman5 7/7 1/1 Strategy Shareholder information Climate and sustainability report Risk review Financial review Financial statements Barclays PLC 2024 Annual Report on Form 20-F 71Governance Directors’ report: Our governance framework (continued)
Key Board activities in 2024 Overseeing the implementation of our three-year strategy. A key focus for the Board during 2024 has been overseeing the implementation of our three-year strategy announced at the Investor Update on 20 February 2024 and the Group's priorities on being 'Simpler, Better and More balanced'. Throughout the year, the Board received regular focused updates in relation to each of the five re-segmented business divisions, in addition to regular updates from the Group Chief Executive, and considered strategic opportunities for the Group, as well as transformation initiatives designed to support the delivery of the Group’s strategy. Alongside this, the Board continued to give consideration to colleague matters, including Group culture and the ‘consistently excellent’ cultural change programme. Spotlight Board engagement with stakeholders The Board strongly believes in the importance of engaging with our stakeholders, which brings valuable outside perspectives to the Board. The Group Chairman met with institutional investors during the course of the year and the Group Chief Executive and Group Finance Director held briefings with investors at each set of quarterly results. The Board recognises that our colleagues are critical to our success, and our continued investment in them protects and strengthens our culture. In addition to receiving formal updates about colleague engagement and sentiment, Board members also had an opportunity to meet colleagues at events held during the year. Examples of Board member engagement with stakeholders during the year are set out in the timeline below. Group Finance Director Anna Cross speaking at the Finance MD Leadership Forum in January 2025 January February May June Barclays UK CEO Forum Investor Update Annual General Meeting (AGM) Campus Visit Colleague Engagement Event – Investment Banking and Global Markets Citizenship and Diversity Awards Business deep dive – UKCB London London Glasgow Glasgow New York London London Audience: Clients Audience: Investors Audience: Shareholders Audience: Colleagues Audience: Colleagues Audience: Colleagues Audience: Investors October November December India Visit Business deep dive – Investment Banking Barclays Asia Forum Barclays Professional Services Conference Business deep dive – PBWM Noida, Pune and Mumbai London Singapore London London Audience: Colleagues Audience: Investors Audience: Investors, Clients Audience: Clients Audience: Investors Group Chief Executive C.S Venkatakrishnan at the Investment Banking deep dive Strategy Shareholder information Climate and sustainability report Risk review Financial review Financial statements Barclays PLC 2024 Annual Report on Form 20-F 72Governance Directors’ report: Key Board activities
Key focus areas The following two pages highlight the key areas of focus for the Board during 2024 and the key stakeholder groups central to the matters considered and decisions taken. Strategy and business review • Held regular strategy discussions throughout the year, including dedicated corporate strategy sessions at the September and December Board meetings. • Reviewed and discussed the 2024 Medium Term Plan (MTP), including macroeconomic variables. • Reviewed materials for the Investor Update in February and the subsequent investor presentations on UK Corporate Bank (UKCB), Investment Banking and Private Bank and Wealth Management (PBWM). • Received business reviews throughout the year to understand key risks and opportunities and monitor progress against the targets set in our three-year plan on each of the main business areas - PBWM, Global Markets, US Consumer Bank, Barclays UK, Investment Banking and UKCB. • Received focused presentations to deepen the Board’s understanding of matters of Group- wide relevance, such as financial crime risk, reputation risk, cybersecurity risk and controls and operational resilience. • Considered the entity and location strategy for Barclays Europe. Key decisions ü Approved the re-segmentation of the Group’s businesses into five focused business divisions. ü Approved the 2024 MTP. ü Confirmed support for the location strategy for Barclays Europe. Strategic transactions • Evaluated potential strategic opportunities for the Group and received updates on the progress of key strategic transactions across the Group, reflecting our ambition to simplify Barclays and focus on growing key businesses. Key decisions ü In Q1 2024, approved the acquisition of Tesco Bank. ü In Q3 2024, approved the sale of the German consumer finance business. Supporting implementation of strategy • Received updates on the progress of transformation initiatives to support the delivery of the Group’s strategy, including in relation to customer journey transformation and automating core processes to drive efficiency. Climate and sustainability strategy • Received and discussed updates on the Group’s climate and sustainability strategy through reports from the Board Sustainability Committee, including in relation to the Group’s sustainable finance strategy, energy strategy and the development of a Transition Plan. • Received updates on, and considered management’s engagement with stakeholders on, Barclays’ climate strategy. • Received a briefing on the external climate reporting landscape. Key decisions ü In early 2024, approved the 2023 Group Modern Slavery Statement. ü Approved an updated Barclays Group Statement on Human Rights. Strategy 	 	 	 Topic Board activity Risk, resilience and recovery and resolution 	 					 Topic Board activity Risk profile • Considered the Group’s risk profile and emerging risks in the context of the macroeconomic, regulatory and geopolitical outlook. • Considered risk appetite in the context of Barclays' strategic plan and MTP. • Received updates on financial crime risk. • Received updates on Barclays' principal risks, including reputation risk and the Group’s approach to reputation risk management. Key decisions ü Approved Barclays’ Risk Appetite Statement. ü Approved updates to the Enterprise Risk Management Framework (ERMF) for the Group, including the elevation of financial crime risk to a principal risk which took effect on 1 January 2025. ü Approved updates to the Matters Reserved to the Board and Committee terms of reference to clarify the responsibilities between the Board and the Board Risk Committee in respect of the oversight of reputation risk. Resolution and recovery • Received a briefing on the key findings from the Bank of England’s second Resolvability Assessment Framework assessment and updates on activities to enhance the Group’s resolvability arrangements, including management's testing and assurance plans. • Considered the Group Recovery Plan setting out the options available to execute in a severe financial stress. • Board members participated in a simulation exercise to test the efficacy of the available management actions in the event of an operational crisis with severe financial implications. The Board subsequently received an update on the actions resulting from the exercise. Key decisions ü Approved the Group Recovery Plan. Technology, operations and resilience • Considered the Group’s annual operational resilience self-assessment and management actions to enhance recovery capability for the Group’s Important Business Services. • Board members participated in a series of formal and informal briefings with the Group Chief Security Officer on cybersecurity risk and crisis response, focusing on governance and Board decision-making in the event of a crisis-level cybersecurity incident. The briefings culminated in a Board-level tabletop exercise. • Participated in a deep dive session on the responsible use of generative artificial intelligence (AI) and considered the opportunities and risks relating to the use of this technology. • Considered how to bring additional technology expertise and perspectives to the Board. Key decisions ü Approved the Group operational resilience self- assessment. ü Approved three new Important Business Services and their impact tolerances. Strategy Shareholder information Climate and sustainability report Risk review Financial review Financial statements Barclays PLC 2024 Annual Report on Form 20-F 73Governance Directors’ report: Key Board activities (continued) Stakeholder groups Customers and clients Society Colleagues Investors
Finance 						 Topic Board activity Financial performance and reporting • Received regular updates from the Group Finance Director on the financial performance of the Group and business divisions, including delivery against targets, investor feedback and market reaction to the Group’s financial results. Key decisions ü Approved the BPLC Annual Report and Accounts for the year ended 31 December 2023. ü Approved Q1 2024, HY 2024 and Q3 2024 financial results announcements. Capital and liquidity position and distributions • Monitored the Group’s capital and liquidity position, and considered distributions proposals in the context of the Group’s three-year strategy. Key decisions ü Approved a full year dividend for the year ended 31 December 2023 of 5.3p per ordinary share and a full year share buy-back for 2023 of up to £1bn. ü Approved a half year dividend of 2.9p per ordinary share for the six months ended 30 June 2024 and a half year share buy-back of up to £750m. Governance and regulatory matters 	 			 Topic Board activity Succession • Upon the recommendation of the Board Nominations Committee, considered succession planning and proposed changes to Board and Board Committee membership. • Received an update on ExCo membership changes approved by the Board Nominations Committee to reflect the re-segmented business divisions. Key decisions ü Approved the appointment of Brian Shea as a Non-Executive Director. Regulatory engagement and oversight • Invited representatives from key regulators to join Board meetings to support and deepen senior relationships, discuss their priorities, feedback and areas of focus for Barclays. This was in addition to meetings held between individual Directors and regulatory stakeholders throughout the year. • Considered updates on regulatory developments impacting the Group. Consumer Duty • Received updates on the Group’s implementation of the FCA’s Consumer Duty for closed products and preparation of the first Consumer Duty Annual Board Reports by BBPLC and BBUKPLC ahead of the 31 July 2024 regulatory deadline. This included updates on embedment and observations from the Chair of BBUKPLC and the BBPLC Consumer Duty Champion on the Consumer Duty programmes within their respective entities. Culture, colleague and inclusion 	 Topic Board activity Culture, colleague engagement and talent • Received regular updates on the Group-wide cultural change programme to deliver to a consistently excellent standard and considered progress on embedment through management reporting and Your View colleague survey results. • Considered Barclays’ method of workforce engagement to confirm it remained effective in facilitating meaningful, regular two-way dialogue with colleagues. • Considered Barclays' workforce policies and practices, including how they support the attraction, development and retention of diverse and inclusive talent. • Board members participated in colleague events during the year. Key decisions ü Confirmed that Barclays’ method of workforce engagement has been effective in 2024. ü Confirmed that Barclays’ workforce policies and practices are consistent with Barclays’ Values and support Barclays’ long-term sustainable success. Diversity, equity and inclusion (DEI) • Received an update on DEI activities during 2024, including progress against the Group’s DEI ambitions for senior women and colleagues from underrepresented races and ethnicities. • Considered the gender and ethnic diversity targets in the Board Diversity and Inclusion Policy to determine if they remained appropriate. Key decisions ü Reaffirmed the targets set out in the Board Diversity and Inclusion Policy. Strategy Shareholder information Climate and sustainability report Risk review Financial review Financial statements Barclays PLC 2024 Annual Report on Form 20-F 74Governance Directors’ report: Key Board activities (continued) Please refer to the report of the Board Nominations Committee from page 75 for further information on Board composition, succession planning and effectiveness reviews. Details of the Board Diversity and Inclusion Policy can be found in the Board Nominations Committee report from page 75.
Focused on effective composition and succession to support delivery of the Group's strategy Overseeing composition, succession and effectiveness to ensure continuity of strong leadership. Board Nominations Committee Nigel Higgins Chair, Board Nominations Committee Committee membership and meeting attendance during 20241 Member Meetings attended/eligible to attend Nigel Higgins 3/3 Brian Gilvary 3/3 Diane Schueneman3 3/3 Julia Wilson 3/3 Mohamed A. El-Erian2 1/2 Notes 1 There were three scheduled meetings of the Committee in 2024. Mohamed A. El-Erian was unable to attend one meeting due to a prior commitment. 2 Stepped down on 31 August 2024 3 Stepped down with effect from 31 January 2025 Introduction The Committee’s focus in 2024 has been on ensuring that the Board, Board Committees and ExCo continue to have the right composition of skills, experience, knowledge and diversity of thought, as well as on robust succession planning, to support the delivery of the Group’s strategy as announced at the Investor Update on 20 February 2024. In 2024, we welcomed Brian Shea to the Board as an additional Non-Executive Director and Mohamed A. El-Erian stepped down from the Board in August. Following nine years' tenure on the Board, Diane Schueneman retired as a Non-Executive Director with effect from 31 January 2025. During 2024, the Committee also oversaw changes to the composition of the Board Committees and ExCo. With the announcement in February 2024 that, going forward, Barclays would be managed and reported via five focused operating divisions, there were a number of changes to ExCo to reflect the leadership of these operating divisions which were also overseen by the Committee. In addition, Board related succession matters are typically discussed at Board level, with the Board having received regular updates on the skills-based Non- Executive Director recruitment priorities during the course of the year. Further details of Board, Board Committee and ExCo changes are discussed later in this report. Committee membership and activity during 2024 The Group Chairman chairs the Committee, with its membership composed solely of independent Non- Executive Directors. In 2024, the Committee met three times with no ad hoc meetings (2023: three times, no ad hoc meetings) and the attendance by members at these meetings is shown on this page. In addition to its members, Committee meetings were attended by representatives from senior management, including the Group Chief Executive and Group HR Director. The Committee's activities during 2024 are set out in this report. The Committee’s terms of reference are available at home.barclays/who-we-are/our- governance/board-committees/ Strategy Shareholder information Climate and sustainability report Risk review Financial review Financial statements Barclays PLC 2024 Annual Report on Form 20-F 75Governance Directors’ report: Board Nominations Committee report Changes to Board and Board Committee composition in 2024 and prior to publication of this report Board Board Nominations Committee Board Risk Committee Board Audit Committee Board Remuneration Committee Brian Shea appointed 19 July 2024 Mohamed A. El-Erian stepped down 31 August 2024 Diane Schueneman stepped down 31 May 2024 Diane Schueneman stepped down 31 January 2025 Nigel Higgins appointed 31 January 2025 Mohamed A. El-Erian stepped down 31 August 2024 Diane Schueneman stepped down 31 January 2025 Mohamed A. El-Erian stepped down 31 August 2024 Diane Schueneman stepped down 31 January 2025
Composition The Committee keeps under review the Board’s composition and its Non- Executive recruitment priorities, taking into consideration the skills, experience, knowledge and diversity of thought required for an effective Board, in order to ensure robust succession planning. You can find biographies for each Director, including details of the skills, experience and knowledge they bring to the Board, their Board Committee memberships and other principal appointments from page 64. Changes to Board composition Succession planning is a key part of the Committee’s remit in order to bring the right balance of skills, experience and diversity of thought to the Board. A crucial part of the role of the Non-Executive Directors is to provide informed and constructive challenge to executive management, whilst at the same time providing support and guidance. During 2024, we welcomed Brian Shea to the Board on 19 July and, on 31 August, Mohamed A. El-Erian stepped down from the Board. The table on the previous page shows the Board and Board Committee changes in 2024 and prior to publication of this report. Having served for nine years as a Non- Executive Director as of June 2024, Diane Schueneman retired from the Board and as a Non-Executive Director and Chair of the BX Board with effect from 31 January 2025. Diane will continue to serve as a Non-Executive Director of Barclays US LLC. The Committee and the Board are grateful for Mohamed and Diane’s significant contributions to Barclays during their respective tenures, and for Diane’s continued role on one of the Group’s important subsidiary boards. Neither Mohamed nor Diane raised any concerns about the operation of the Board or management. Following Diane’s retirement as Chair of BX, Brian Shea succeeded Diane as Chair of the BX Board with effect from 1 February 2025. Brian joined both the Board and the BX Board in July 2024, bringing with him deep experience in financial services, including in the areas of operations, technology and transformation, and US regulation, developed during his executive and non- executive career which extends to over 40 years in the financial services industry. These attributes make him well placed to take up the BX Board Chair role. In addition, with effect from 31 January 2025, Nigel Higgins was appointed as an additional member of the Board Remuneration Committee, having regularly attended meetings of that Committee during 2024. Board size As at 31 December 2024, the size of the Board was 13. Following Diane Schueneman's retirement from the Board with effect from 31 January 2025, the size of the Board reduced to 12. The Committee considers that the size of the Board contributes to its effectiveness. Continuing to review the optimal size of the Board is an important part of the Committee’s medium and longer-term succession planning. As part of this, the Committee takes into account the need for the Board to be small enough to operate in an efficient and collaborative manner yet large enough to ensure an appropriate mix of skills and diversity, to support succession planning and to accommodate the additional roles and responsibilities of some of our Directors on Board Committees, and as members of the Boards of BBPLC, BBUKPLC, Barclays Europe, Barclays US LLC, BX and other Group subsidiaries. Board composition as at 31 December 20241 Length of tenure (Chairman and Non-Executive Directors) (number of Directors) 0-3 years 3-6 years 6-9 years 9+ years2 4 4 2 1 International experience3,4 (number of Directors) UK US Rest of the World 13 7 7 Industry and leadership experience3 (number of Directors) 13 13 10 5 2 Notes: 1 Diane Schueneman retired as a Non-Executive Director with effect from 31 January 2025. 2 Please refer to the sections entitled 'Process for Appointments' and ‘Succession’ later in this report in relation to Tim Breedon’s tenure and the Board's assessment of his continued independence. 3 Individual Directors may fall into one or more categories. 4 International experience is based on the location of the headquarters/registered office of a company. Strategy Shareholder information Climate and sustainability report Risk review Financial review Financial statements Barclays PLC 2024 Annual Report on Form 20-F 76Governance Directors’ report: Board Nominations Committee report (continued) Financial services Political/Regulatory experience Current/recent Chair/CEO Accountancy/ Auditing Operations/ Technology
Diversity The Committee and the Board recognise the benefits of an inclusive and diverse Board, reflective of the communities in which Barclays operates, and in driving effective decision-making. The Committee and the Board are committed to operating in a way that supports a culture of inclusion, non- discrimination and diversity of thought, where all Directors’ views are both encouraged and heard, values which are reflected in the Barclays' Board Diversity and Inclusion Policy and our obligations under the Listing Rules as further described in this section. Gender and ethnic diversity reporting Disclosures in the form prescribed by the UK Listing Rules of the Financial Conduct Authority (Listing Rules) requirements relating to gender and ethnic diversity of the Board and executive management are set out in this section. Data relating to the gender identity and ethnic diversity of the Board was collected by way of a questionnaire. This questionnaire asked all individual Board members to disclose their gender identity and ethnic background, on a voluntary self- reporting basis, by selecting options aligned with those in the left-hand columns of the tables on this page (and therefore included the option not to specify an answer). Barclays’ employees (including executive management, as defined in the table on this page) are asked to confirm their gender and ethnicity on a voluntary basis. Data relating to gender, and ethnic diversity through self-identification, of executive management (as defined) was sourced from this existing data, which is held within Barclays’ secure HR system. Gender diversity reporting as at 31 December 2024 Board members1 Senior positions on Board (CEO, CFO, SID and Chair) Executive management2 n Women n Women n Women n Men n Men n Men Board members Number of senior positions on the Board (CEO, CFO, SID and Chair) Executive management2 Number Percentage Number Percentage Men 8 62 % 3 (75%) 13 81% Women 5 38 % 1 (25%) 3 19% Other categories Not specified/prefer not to say 1 Diane Schueneman retired as a Non-Executive Director with effect from 31 January 2025. 2 In accordance with the requirements of the Listing Rules and for the purposes of this table only, 'executive management' comprises the Group Executive Committee and the Group Company Secretary. Ethnic diversity reporting as at 31 December 2024 Board members1 Senior positions on Board (CEO, CFO, SID and Chair) Executive management2 n White British or other White (including minority-white groups) n White British or other White (including minority-white groups) n White British or other White (including minority-white groups) n Asian/British Asian n Asian/British Asian n Asian/British Asian n Other ethnic group Board members Number of senior positions on the Board (CEO, CFO, SID and Chair) Executive management2 Number Percentage3 Number Percentage White British or other White (including minority-white groups) 11 85% 3 (75%) 12 75% Mixed/Multiple Ethnic Groups Asian/British Asian 1 8% 1 (25%) 4 25% Black/African/Caribbean/ Black British Other ethnic group 1 8% Not specified/prefer not to say 1 Diane Schueneman retired as a Non-Executive Director with effect from 31 January 2025. 2 In accordance with the requirements of the Listing Rules and for the purposes of this table only, 'executive management' comprises the Group Executive Committee and the Group Company Secretary. 3 Totals may not equal 100% due to rounding. Board Diversity and Inclusion Policy - Targets In February 2024, the Board adopted the following targets: Gender diversity target To ensure that by 2025: • the proportion of women on the Board is at least 40%; and • at least one of the following senior Board positions is held by a woman: Chair, Chief Executive, Senior Independent Director or Chief Financial Officer, and that this is maintained going forward. Ethnic diversity target To ensure that at least one Board member is from a minority ethnic background excluding white ethnic groups and that this is maintained going forward. Strategy Shareholder information Climate and sustainability report Risk review Financial review Financial statements Barclays PLC 2024 Annual Report on Form 20-F 77Governance Directors’ report: Board Nominations Committee report (continued) 5 8 1 3 3 13 11 1 1 3 1 12 4
Board Diversity and Inclusion Policy On the recommendation of the Committee, the Board adopted a revised version of the Board Diversity and Inclusion Policy on 8 February 2024. The policy sets out the Board’s existing gender and ethnic diversity targets detailed in the table on the previous page, which are aligned with the targets recommended by the FTSE Women Leaders Review on gender diversity and the Parker Review Committee Report into Ethnic Diversity of UK Boards. These targets are also reflected in the Listing Rules. The policy confirms the Board’s support for the Group’s culture in which Barclays is committed to continuing to build an inclusive workplace, and that the Board recognises the benefits of an inclusive and diverse Board, reflective of the communities in which Barclays operates, in driving effective decision-making. It also confirms Barclays’ commitment to ensuring that Board appointments and succession plans are based on merit and objective criteria, recognising the benefits that diversity, in all its forms, brings to the Board. Gender and ethnic diversity on the Board As set out in the table within this section, at 31 December 2024, the proportion of women on the Board was 38%. Following Diane Schueneman's retirement from the Board with effect from 31 January 2025, Board gender diversity fell to 33% female. The Board Diversity and Inclusion Policy and its targets were reviewed by the Board in December 2024. In considering whether to revise the existing targets in the policy, the Board recognised that the target for 40% female representation on the Board by 2025 had not yet been met and therefore decided to reaffirm the existing policy and targets for a further year until the end of 2025. The Board is focused on meeting its 40% Board gender diversity target during the course of 2025 whilst at the same time remaining committed to ensuring that all Board appointments and succession plans are based on merit and objective criteria. During 2024, the Board satisfied its additional gender target of having at least one woman in a senior Board role. You can read more about the Board appointments process and succession planning in the sections that follow. We also recognise and embrace the benefits of inclusiveness at Board Committee level. As at the date of this report, Board Committee gender diversity was as follows: • Board Nominations Committee: 33% women • Board Audit Committee: 33% women • Board Risk Committee: 40% women • Board Sustainability Committee: 43% women • Board Remuneration Committee: 50% women. As at 31 December 2024, 15% of the Board (two members) were from a minority ethnic background (excluding minority white ethnic groups). Following Diane Schueneman's retirement from the Board with effect from 31 January 2025, as at the date of this report, 17% of the Board (two members) were from a minority ethnic background (excluding minority white ethnic groups), meeting the targets set out in the Listing Rules, the recommendations contained within the Parker Review Committee Report into the Ethnic Diversity of UK Boards and the ethnic diversity target in the Board Diversity and Inclusion Policy. Gender and ethnic diversity within ExCo, ExCo direct reports and the wider workforce Barclays is focused on actions and outcomes that support a culture of belonging and diversity of thought, where all of our colleagues can thrive. Barclays is committed to abiding by the laws in all jurisdictions in which it operates, including anti-discrimination laws. To support representation of women in our senior leadership population, Barclays is working towards achieving our global Gender Ambition of 33% representation of women at Managing Director and Director level. The Board received an update on gender and ethnic diversity of the wider workforce during 2024, including progress against the Group's ambitions for senior women and under-represented colleagues, as described in the Key Board activities section on page 73. Regular updates are also shared with ExCo to track progress on Barclays' global Gender Ambition. We recognise that there is more to do to achieve progress with respect to inclusion, and the Group is evolving and developing our approach with this in mind. As at 31 December 2024, representation of women among Managing Directors and Directors was at 30% globally. The Committee is also mindful of the voluntary target recommended by the FTSE Women Leaders Review of 40% representation of women for ExCo and their direct reports by the end of 2025. Barclays was an early signatory of the HM Treasury Women in Finance Charter. As a signatory, we publicly report on our progress against our global Gender Ambition annually and the pledges set out in the charter to drive gender balance across financial services. As at 31 December 2024, representation of women among ExCo and their direct reports stood at 27% - flat with 2023. While this fell short of the FTSE Women Leaders Review recommendation, supporting gender diversity within both ExCo and their direct reports remains a key priority for Barclays and the Committee. In 2024, Barclays continued to have one ex-officio position on ExCo, with each appointee serving for a four-month rotation. This initiative brings benefits to ExCo meetings, providing diversity of thought and broadening the scope of perspectives and contributions made to ExCo. The initiative also provides appointees with exposure to matters of Group-wide significance and further leadership experience, supporting longer- term succession planning. There are additional initiatives and actions being taken across our businesses to further strengthen the senior leadership pipeline. These include using the ex officio position on business unit executive committees, sponsorship programmes to strengthen individual development and working with senior recruitment partners to build our external pipeline. You can find details of ExCo membership, including ex-officio appointees during the course of 2024, on page 68. Alongside the Board, the Committee continues to support the Group’s Multicultural agenda, including Barclays' Underrepresented Race and Ethnicity Ambitions. In 2022, Barclays set an ambition to increase the number of Managing Directors from underrepresented races and ethnicities by 50% - to 83 in the UK and US combined by the end of 20251. At the end of 2024, this was 50 - a decrease of 4 since the end of 2023. Aligned to the recommendations set out in the Parker Review Committee Report into the ethnic diversity of UK senior management, we are working towards a 15% target for Group ExCo and their direct reports by the end of 2027. As at 31 December 2024, 13% of Group ExCo and their direct reports were from a minority ethnic background. You can read more about Barclays' approach to DEI within the Colleagues section in the Strategy report from page 17. You can find a copy of our Board Diversity and Inclusion Policy at home.barclays/who-we-are/our- governance/our-framework-code-and-rules Note 1 As part of our HR Transformation programme we have reviewed and simplified some definitions related to how we report people data. Some of our metrics have undergone changes to previously published numbers as a result. Strategy Shareholder information Climate and sustainability report Risk review Financial review Financial statements Barclays PLC 2024 Annual Report on Form 20-F 78Governance Directors’ report: Board Nominations Committee report (continued)
Process for appointments The Committee leads the process for Board appointments, ensuring that all appointments are based on merit and objective criteria. In considering Board appointments, the Committee considers the skills, experience and knowledge required for the Board’s effectiveness and to support the continued delivery of the Group’s strategy, while also promoting inclusiveness, non-discrimination and diversity of thought. Appointments to the Board are made following a merit-based, formal, rigorous and transparent procedure, facilitated by the Committee with the aid of external search consultancy firms. Non-Executive Director recruitment The Committee regularly reviews and refreshes a series of skills-based Non- Executive Director recruitment priorities. These priorities underpin the searches required for the Board to ensure orderly succession as Non-Executive Directors approach the end of their tenure and to ensure an optimum balance of skills and experience on the Board. The Committee considered and refreshed the priorities throughout 2024, including in light of changes to Board and Committee composition during the year. Based on the agreed priorities, the Committee has set rigorous criteria for the roles it is seeking to fill, both in terms of experience and personal qualities. Independent search firms Egon Zehnder, Perrett Laver and Russell Reynolds supported our targeted external mapping and search processes for additional Non- Executive Directors to complement the range of skills on the Board in 2024, based on the agreed criteria. Skills and experience remain at the forefront of those searches. As part of the recruitment process, the Committee has agreed that all Board members should have the opportunity to meet leading candidates. Egon Zehnder, Perrett Laver and Russell Reynolds do not have any connection to Barclays or any of the Directors other than to assist with searches for executive and non-executive talent. Open advertising for Board positions was not used in 2024. Please refer to the Succession section below for further detail regarding Board succession planning. The Committee will continue to review the Board’s recruitment priorities and give further consideration to the desired skills and experience for potential candidates, to ensure that due consideration continues to be given to strong potential candidates who would enhance the effectiveness of the Board. Non-Executive Director independence In line with the requirements of the Code, a majority of our Board comprises independent Non-Executive Directors. The independence of our Non-Executive Directors is considered by the Committee on appointment and thereafter on an annual basis, having regard to the independence criteria set out in the Code. As part of this process, the Committee reviews the length of tenure of all Directors, which per the Code guidance is one of a list of factors which can affect independence, and makes any recommendations to the Board accordingly. The Committee reviewed the independence of all Non-Executive Directors serving on the Board as at 31 December 2024. Reflective of the fact that during the course of 2025 Nigel Higgins will have served six years on the Board and Mary Francis will have served nine years on the Board, each of Nigel and Mary were subject to a more rigorous review. The Committee remains satisfied that the length of their tenure has no impact on their respective levels of independence or the effectiveness of their contributions. Director appointments and reappointments Director term Our standard practice is to appoint any new Non-Executive Director or Chair to the Board for an initial three-year term, subject to annual re-election at the AGM (as outlined below). This may be extended at the request of the Board. Our Chair and Non-Executive Directors typically serve up to a minimum of six years, although this period may be extended for a further three year term where considered appropriate by the Committee. Director appointment and reappointment at the AGM All Directors are subject to appointment or reappointment (as appropriate) each year by shareholders at the AGM. As at 1 November 2024, Tim Breedon had served on the Board for 12 years. Further context regarding Tim’s tenure is set out in the Succession section below. With regards to Tim’s continued independence, in early 2025, the Committee undertook a rigorous assessment of this, as it had done in the three previous years. The Committee and the Board consider that length of tenure is only one of the factors to be considered with respect to Director independence, and accordingly, that tenure alone should not result in a loss of independence. Following careful consideration, the Committee concluded that Tim remains independent. In reaching this conclusion, the Committee recognises the significant advice, support and value that Tim continues to bring to Board discussions and decision-making, particularly given his breadth of financial services sector experience and deep knowledge of risk and regulatory issues. Both the Committee and the Board continue to believe that it is generally advantageous for Group-wide decision- making to have the Chairs of the Group’s significant subsidiaries as members of the BPLC Board, considering that this provides connectivity with the Group's significant subsidiaries, bringing with it important insight into Board discussions. With these factors in mind, and in light of Tim’s ongoing role as Chair of Barclays Europe, the Group’s principal European subsidiary, the Committee and the Board consider it is appropriate for Tim to continue as an independent Non- Executive Director. The Committee and the Board consider all of the Non-Executive Directors to be independent. Strategy Shareholder information Climate and sustainability report Risk review Financial review Financial statements Barclays PLC 2024 Annual Report on Form 20-F 79Governance Directors’ report: Board Nominations Committee report (continued)
Time commitment Prior to their appointment, all proposed new Directors are asked to disclose their other significant commitments, which are then taken into account by the Committee and/or the Board when considering their appointment to ensure that Directors can discharge their responsibilities to Barclays effectively. Ahead of his appointment to the Board, the Committee reviewed the existing commitments disclosed by Brian Shea and was comfortable that they would not impact his ability to devote such time as is necessary to discharge his duties to Barclays effectively. Expected time commitments are agreed with each Non-Executive Director on an individual basis, and include time to understand the business and complete training as well as time to attend and prepare for formal Board and Board Committee meetings. The Committee and/or the Board considers relevant regulatory and Code requirements when considering whether a Director has sufficient time to commit to their role, in addition to key investor and proxy adviser guidelines. External executive and non-executive directorships held within listed companies for each of the Directors are set out in the table on this page. You can find details of other principal appointments for each Director from page 64. Before a Director accepts any significant new commitment outside of Barclays, they are required to seek approval from the Board (providing an indication of expected overall time commitment). Prior to approving any significant new external commitment for a Director, the Board reviews all relevant facts and circumstances (including the expected role and time commitment, as well as the nature of the external organisation). In 2024, all external appointment requests were approved on the basis that the Board was satisfied with any actual or potential conflicts and the Board was confident that the Director in question remained able to devote such time necessary to discharge their duties to Barclays effectively. All Directors are expected, where circumstances require it, to commit additional time as necessary to their work on the Board. For the year ended 31 December 2024 and as at the date of publication, the Board is satisfied that none of the Directors are over-committed and that each of the Directors allocates sufficient time to their role in order to discharge their responsibilities effectively. A record of each Director’s external time commitments is maintained. Barclays PLC Board – Listed company external directorships1 As at 31 December 2024 Director Executive Non-Executive Non-Executive Chair Total Nigel Higgins None C.S. Venkatakrishnan None Anna Cross None Robert Berry None Tim Breedon None Dawn Fitzpatrick None Mary Francis 12 1 Brian Gilvary None Sir John Kingman 12 1 Marc Moses None Diane Schueneman4 None Brian Shea 23 2 Julia Wilson 12 1 Notes: 1 For the purposes of this table, 'listed company' means companies whose shares are listed and traded on a regulated stock exchange, excluding appointments within the Barclays Group, and directorships held with the same group or within undertakings (including non-financial entities) in which the relevant firm holds a qualifying holding. 2 UK public listed company. 3 US public listed company. 4 Diane Schueneman retired as a Non-Executive Director with effect from 31 January 2025. Strategy Shareholder information Climate and sustainability report Risk review Financial review Financial statements Barclays PLC 2024 Annual Report on Form 20-F 80Governance Directors’ report: Board Nominations Committee report (continued)
Director training and development The Committee and the Group Company Secretary support the Group Chairman in developing and monitoring effective induction, training and development for the Board in accordance with the Committee’s Terms of Reference. Directors are provided with the opportunity to take part in ongoing training and development as part of the Board or Board Committee schedule, but can also request specific training as required. All Directors receive a comprehensive induction tailored to their individual requirements on appointment, designed to provide them with an understanding of the operation of the Group, its purpose and strategy and key business areas and functions. When a Director is joining a Board Committee, their induction schedule will also include an induction to the operation of that Committee. During 2024, Directors continued to deepen their understanding of the business through Board deep dives, covering the five operating divisions as well as updates from key Group functions including Legal, Risk, Compliance and Internal Audit. In addition, the Board continued to receive regular updates on developments in corporate governance matters and an annual briefing on the Senior Managers Regime and certain Barclays Compliance Risk policies and standards, including concerning financial crime. See below for further detail on some key areas of training and development provided to Directors in 2024. Climate and sustainability – external reporting landscape In the context of an evolving legal and regulatory environment with respect to climate and sustainability, the Board received a briefing on the external reporting landscape in this area. The briefing provided a deep dive on the more prominent legal and regulatory disclosure requirements, including those introduced by the International Sustainability Standards Board (IFRS S1 and S2) and the European Corporate Sustainability Reporting Directive, and Barclays’ approach to these new requirements. Human rights briefing Recognising the importance of external perspectives and the current landscape, members of the Board Sustainability Committee received an external briefing on business, human rights and the financial sector. With an increasing reputational, regulatory and legal focus arising from human rights, the briefing covered matters including the UN Guiding Principles on Business and Human Rights and the scope of business responsibility to respect human rights. This session provided valuable insights on the external human rights landscape and supported the Committee’s understanding of relevant frameworks and responsibilities. New Director induction A tailored induction programme is created for all new Directors appointed to the Board. Following Brian Shea’s appointment in July 2024, he participated in a detailed induction programme which included sessions covering the Group’s strategy and culture, stakeholder landscape and relationships, and Board and Board Committee structure. This also involved meetings with other Board members, the chairs of significant subsidiaries in the Group, and various senior executives from across the business and key Group functions. Alongside Group sessions, a comprehensive induction programme covering BX was also prepared for Brian Shea. Strategy Shareholder information Climate and sustainability report Risk review Financial review Financial statements Barclays PLC 2024 Annual Report on Form 20-F 81Governance Directors’ report: Board Nominations Committee report (continued) Brian Shea's biography can be found on page 64.
Succession The Committee oversees succession planning to ensure that Barclays continues to strike the right balance of skills, experience, diversity of thought and effectiveness on the Board, Board Committees and ExCo, as well as accounting for current and anticipated future business needs. The Committee’s work in this area includes both medium-term planning (orderly refreshing of the Board, Board Committees and ExCo) and long-term planning (looking ahead to the skills that may be required on the Board and the ExCo in the future). Committee consideration of succession A key part of the Committee’s work is the consideration of succession planning for the Board, Board Committees and ExCo. Following the announcement of the Group’s three year strategy in February 2024, and consequent changes to ExCo, in support of these senior management changes, the Committee and the Board have continued to focus on the development of a broad and deep bench of future leaders across the business. The Committee regularly reviews the composition of the Board to ensure that its members have the right balance of skills and experience to support management in the delivery of the Group’s strategy and to ensure that the Board is best placed to capitalise on the opportunities and navigate the challenges faced by an organisation such as Barclays. The Committee regularly refreshes the Board’s Non-Executive Director recruitment priorities and leads the search process for any new Board appointments. This year we welcomed Brian Shea to the Board who brings with him strong operations, technology and transformation experience. Brian’s appointment was part of the Board’s longer term succession planning for Diane Schueneman who in June 2024 had served on the Board for nine years. Diane retired from the Board and as Chair of the board of our service company, BX with effect from 31 January 2025, with Brian succeeding Diane as Chair of BX with effect from 1 February 2025. Both the Committee and the Board continue to believe that it is advantageous for Group- wide decision-making to have the Chairs of the Group’s significant subsidiaries sit on the BPLC Board, considering that this provides connectivity with the significant subsidiaries, bringing with it important insight into Board discussions. During 2024, the Committee continued to focus on succession planning for Tim Breedon both for his role on the Board and as Chair of Barclays Europe. The Board is making good progress with these arrangements and will provide an update when appropriate. Tenure Our Chair and Non-Executive Directors are typically appointed for an initial term of three years and may be invited to serve for a further term of up to three years based on the needs of the Board. A further extension of tenure for an additional three year term (and any extension beyond this) is subject to the discretion of the Committee. In determining whether it remains appropriate to extend a Chair or Non-Executive Director’s tenure, the Committee will have regard to a number of factors including whether the Board is satisfied that the Director in question continues to be independent, having regard to the factors set out in the Code, their performance which is assessed annually, whether they have the ability to dedicate sufficient time to the role and the benefits of having diversity on the Board. You can read more about the Board’s review of each Non-Executive Director’s independence in the Process for Appointments section. During 2025, Robert Berry will reach his three year anniversary on the Board, Nigel Higgins his six year anniversary and Mary Francis her nine year anniversary. Having undertaken a review of Non-Executive Director tenure and having due regard to the factors referred to above, the Committee and the Board agreed to extend the tenure of each of Robert and Nigel for a further three year term and that of Mary for a further year, reflective of her longer tenure on the Board. As already noted in this report, Tim Breedon has served on the Board for 12 years. The Board’s discussions regarding the further extension of his tenure considered that an extension was appropriate in order to conclude the arrangements for his succession both on the Board and as Chair of Barclays Europe. In light of this, and having regard to the other factors referred to above in regard to his continued independence, the Board extended Tim’s tenure on the Board for up to a further year. Once the arrangements for Tim's succession are concluded, an announcement will be published at the appropriate time. ExCo succession The Group Chief Executive, supported by his ExCo, is responsible for the delivery of the Group’s strategy as set by the Board. It is key that ExCo composition comprises the right balance of skills, experience and diversity of thought to drive that delivery while providing appropriate challenge and debate in discussions. With this in mind, the Committee considers and approves all changes to ExCo prior to announcement, taking into account executive succession plans. In early 2024, the Committee reviewed and approved proposed changes to the membership of ExCo in connection with the announcement of five focused operating divisions at the Investor Update in February, with each of the divisional heads being appointed as members of ExCo in their new roles and reporting directly to the Group Chief Executive. The Committee also considered changes to ExCo during the year, including approving the appointment of a new Group Chief Compliance Officer. You can read about the changes to ExCo during 2024 on page 68. During the year, the Committee received updates regarding ExCo and executive talent and succession planning. Ensuring there is a strong talent pipeline, while considering the need to foster diversity of thought in that pipeline, is a key consideration for the Committee. You can read more about gender diversity within ExCo and their direct reports in the Diversity section of this Board Nominations Committee report. Strategy Shareholder information Climate and sustainability report Risk review Financial review Financial statements Barclays PLC 2024 Annual Report on Form 20-F 82Governance Directors’ report: Board Nominations Committee report (continued)
Effectiveness The Committee ensures that a formal and rigorous review of the performance of the Board, Board Committees and individual Directors is undertaken each year, in line with the requirements of the Code. The 2024 effectiveness review was facilitated externally, in line with the Code requirements that the Board effectiveness review be conducted by an external facilitator at least every three years. The last externally facilitated review of the Board was conducted in 2021. Progress against the 2023 Board effectiveness review As reported in last year's Annual Report, the 2023 Board effectiveness review was facilitated internally, in line with the Code. The table on this page sets out the key recommendations outlined in the 2023 review and actions taken during 2024 to address them: 2024 Board effectiveness review The 2024 review of the performance of the Board, Board Committees and individual Directors was externally facilitated. 2024 Board, Board Committee and individual Director review process Further to a selection process facilitated by the Committee to identify a suitable external facilitator, which involved seeking views from Committee members and consideration of a number of potential facilitators, Christopher Saul Associates (CSA), an independent, external corporate governance advisory firm was appointed by the Board to facilitate the 2024 review. CSA conducted the 2021 external review and it was considered that this would enable insightful feedback in terms of any observations on how Board and Board Committee practices might have evolved in the last three years. Save for this prior engagement to conduct the 2021 review and as disclosed below, CSA has no connection to the Group or any individual Director. CSA’s Managing Director, Christopher Saul, comprised the CSA team and had overall responsibility for work conducted by CSA in connection with the 2024 BPLC and BBPLC effectiveness review. Christopher Saul is a member of The International Register of Board Reviewers. Recommendation from 2023 review Actions taken during 2024 Consider how Board agendas might be structured to (i) allow for deeper discussion of business performance; and (ii) create more flexibility for discussion of key topics and reflections within the agenda. • Focus on ensuring that appropriate time is allocated to key reports to allow for discussion and reflection, in particular in respect of the Group Chief Executive and Group Finance Director presentations. • A deeper review of individual business performance is provided through individual business review presentations. Identify opportunities for more open and wide-ranging discussions on big picture issues. • The introduction of ‘letters to the Board’ from the Group Chief Executive, coupled with Board dinners and regular CEO Reports to the Board, have provided the opportunity to exchange views on big picture topics. • Deep dive discussions were utilised to focus on big picture topics, including on the UK macroeconomic environment. Continue to focus on ensuring balanced papers which clearly identify substantive points and key issues for the Board’s attention. • The Group Chairman and Group Chief Executive continued working with management to ensure that substantive points and key issues for discussion by the Board are articulated clearly and concisely. Continue to identify opportunities to bring external perspectives into the Board. • External speakers were invited to join Board sessions to discuss the external landscape, including in respect of the UK and US geopolitical landscape. • The Board Sustainability Committee received an external briefing on ‘Business, Human Rights and the Financial Sector’ and the current landscape. In 2017 to 2018 and February 2020, CSA was engaged by Barclays in an advisory capacity (alongside external legal counsel, Slaughter and May) in relation to certain legal and regulatory matters. From July 2019 to June 2021, Christopher Saul, provided mentoring support to a member of the ExCo. Whilst acting in his capacity as a partner at Slaughter and May (from which he retired in April 2016), Mr Saul gave legal advice to Barclays in relation to certain corporate law related matters. CSA and Mr Saul have no current advisory or mentoring engagements relating to Barclays, the Board or ExCo. The Committee considered CSA’s independence prior to the firm’s appointment and was confident that, notwithstanding that CSA and Mr Saul had previously advised Barclays as outlined above, CSA would not be constrained in its ability to express an independent view as the external facilitator of the 2024 Board, Board Committee and individual Director effectiveness review and that there were no conflicts of interest arising. 2024 review process Appointed CSA following a selection process Review brief agreed with CSA Certain Board and Board Committee meetings observed by CSA One-to-one interviews conducted Observations shared with the Group Chairman and Board Committee Chairs CSA presented findings to the Board Reports shared with Board Committees for review Strategy Shareholder information Climate and sustainability report Risk review Financial review Financial statements Barclays PLC 2024 Annual Report on Form 20-F 83Governance Directors’ report: Board Nominations Committee report (continued)
The Boards of each of BBPLC, BBUKPLC and Barclays Europe also elected to appoint CSA to undertake an independent, external review of their effectiveness. CSA’s review of the effectiveness of the BBPLC Board, Board Committees and individual Directors was conducted in parallel with the BPLC review given the partially consolidated structure of the BPLC and BBPLC Boards. As part of the BPLC and BBPLC review, CSA conducted a structured one-on-one interview process with each member of the Board, all members of ExCo, certain members of the BBPLC ExCo and other members of senior management, and the lead audit engagement partner of the Group’s auditor, KPMG, to obtain feedback on the effectiveness of the Board, the Board Committees and individual directors throughout 2024. CSA also observed certain meetings of the Board and its Board Committees during the period from September to December 2024. CSA presented its reports on the findings of the effectiveness review to the Boards of BPLC and BBPLC in December 2024. The Group Company Secretary was responsible for providing CSA with the necessary access and support required for the purposes of the review. CSA had briefings with the Group Chairman, SID and Group Company Secretary to assist with determining the scope of CSA’s review, and a number of touchpoints with these individuals during the effectiveness review process. Both the Group Chairman and SID were available as a point of escalation for CSA if required. CSA conducted a comprehensive review of all aspects of the Board’s effectiveness, including with regard to Board dynamics, succession, agendas, papers, meetings, Board Committees, engagement with the Group ExCo and stakeholders, the Board’s business understanding and areas for focus over the next 12 months. CSA was provided with the opportunity to comment on the description of the process followed and the findings arising from the review, including any opinions attributed to CSA, for the purposes of this report. CSA’s feedback provides important input into the further development of the performance of the Board, in particular in identifying areas in which the Board could be more effective. Following consideration of the findings of the 2024 Board effectiveness review, the Committee remains satisfied that the Board is operating effectively. Feedback from 2024 review Feedback from this review indicated that the Board is operating effectively, commenting favourably on the culture of the Board and observing that the Board is hard working, collegiate and well led, providing an appropriate level of constructive challenge and support to management. Meetings were considered to be well-chaired, with the review recognising the Group Chairman’s thoughtful and inclusive style which encourages contributions from all Directors during meetings. Board composition is considered well- balanced, bringing together a diverse and complementary range of skills, knowledge, and expertise. The interaction between the Board, Board Committees and senior management was commented upon favourably, with regular reporting ensuring the Board has good visibility on key areas including strategy and performance. The review recognised the Board’s engagement with colleagues during the course of the year and the value that hearing from external speakers throughout the year brought to Board discussions. Feedback from the review confirms that concurrent meetings of the BPLC and BBPLC Boards remain effective and work well in practice, with the cadence and length of meetings considered appropriate in the context of the Board’s understandably full agenda and confirming that the Board Committees operate effectively and are duly integrated into overall Board processes. Recommendations from the 2024 review CSA agreed with the Board's priorities for 2025 and the Board will be giving further consideration to the implementation of the following matters during 2025: • In light of the Group’s three-year strategy announced in early 2024, how future Board agendas might be best shaped to support continued discussion of the execution of the Group’s three- year strategic plan and the Group’s longer-term strategy • Reflective of the changes to the senior management structure announced as part of Barclays three-year strategy, to maintain its focus on succession planning to continue to develop a deep and broad bench of future leaders • How best to bring greater focus and insights on Tech, Data and Digital matters into the Boardroom • A continued focus on the process of making papers shorter and more targeted • Identifying further opportunities to bring relevant outside perspectives into the Boardroom. The Board has already taken action to address some of these recommendations, and the other items will be subject to further consideration and discussion through the course of this year. Strategy Shareholder information Climate and sustainability report Risk review Financial review Financial statements Barclays PLC 2024 Annual Report on Form 20-F 84Governance Directors’ report: Board Nominations Committee report (continued)
2024 Board Committee effectiveness review The Board Committee reviews are an important part of the way Barclays monitors and improves Committee performance and effectiveness, maximising strengths and highlighting areas for further development. CSA conducted a comprehensive review of all aspects of each Board Committee’s effectiveness, including with regard to meeting dynamics and constructive challenge, agendas, papers, Committee composition and interaction with the Board and other Board Committees. The results of the 2024 Board Nominations Committee effectiveness review are reported below, and the results of the reviews of the effectiveness of the other Board Committees are reported within their individual reports elsewhere in this Board Governance report. Following consideration of the findings of the 2024 Board Committee effectiveness reviews, the Committee remains satisfied that each of the Board Committees are operating effectively. Review of Board Nominations Committee effectiveness As part of the review of this Committee’s effectiveness, CSA conducted one-on- one interviews with each member of the Committee and the Group Human Resources Director. The results of the review confirm the Committee is operating effectively. It is considered to be well constituted and chaired, providing an effective and appropriate level of constructive challenge and oversight of the areas within its remit, with feedback confirming a good level of engagement from Directors in meetings. The review highlights that the Committee is considered to have the right level of skills and experience and is of an appropriate size. The Committee’s interaction with the Board, Board Committees and senior management is considered effective, noting that the Committee is well integrated into overall Board processes. The review recognised the importance that both the Committee and the Board place on effective succession planning for the Board and ExCo and key subsidiaries within the Group. This work is coupled with a focus on broader talent development across the business. Feedback indicated that concurrent meetings of the BPLC and BBPLC Board Nominations Committee continue to be effective, with coverage of BBPLC matters considered appropriate. Interaction with the BBUKPLC Board Nominations Committee was also considered effective, confirming that the Committee continues to exercise appropriate oversight of issues relevant to the Committee’s remit relating to BBUKPLC. Individual Director effectiveness All Directors in office at the end of 2024 were subject to an individual effectiveness review as part of the external review facilitated by CSA. CSA discussed the results of the individual effectiveness reviews with the Group Chairman, with the results of the Group Chairman’s individual effectiveness review discussed with the Senior Independent Director. CSA considered each Director’s individual contribution to the Board, as well as any feedback received as part of the broader Board and Board Committee effectiveness review. Based on the feedback obtained through the individual effectiveness reviews facilitated by CSA, the Board supported the view of the Committee that each Director continues to be effective and contributes to Barclays’ long-term sustainable success. In accordance with the Code, all of the current Directors who will be continuing in office intend to submit themselves for election or re-election at the 2025 AGM to be held on 7 May 2025. Strategy Shareholder information Climate and sustainability report Risk review Financial review Financial statements Barclays PLC 2024 Annual Report on Form 20-F 85Governance Directors’ report: Board Nominations Committee report (continued)
Strengthening our internal control environment to underpin success Overseeing the integrity of our financial disclosures and the effectiveness of the internal control environment. Board Audit Committee Julia Wilson Chair, Board Audit Committee Committee membership and meeting attendance in 20241 Member Meetings attended/eligible to attend (including ad hoc meetings) Julia Wilson 15/16 Robert Berry 16/16 Marc Moses 16/16 Diane Schueneman2 12/16 Notes 1 There were 14 scheduled and two ad hoc meetings of the Committee in 2024. Julia Wilson was unable to attend one short ad hoc meeting, which was called at short notice, due to an unavoidable personal commitment. Diane Schueneman was unable to attend three scheduled meetings (held in short succession) due to a prior commitment and one scheduled meeting due to travel disruptions. 2 Stepped down with effect from 31 January 2025. Dear Fellow Shareholders The announcement of our three-year strategy at the Investor Update in February, and the statement of the Group’s priorities to be Simpler, Better and More balanced, set the framework for the Committee’s focus during 2024. As part of the Investor Update, it was confirmed that Barclays will be managed and reported via five focused operating divisions. As a result, Barclays’ segmental reporting since Q1 2024 has reflected these five operating divisions, in addition to Head Office, bringing greater transparency to the key operating businesses. In anticipation of this, early in the year the Committee oversaw the preparation of a resegmentation document, published alongside the Barclays PLC 2023 Annual Report, as well as the work undertaken by management during the year to ensure a smooth transition for our external reporting systems to support the new reporting segments. The Committee reviewed the Investor Update materials, including considerations around the key messaging and how the three-year targets were presented. The Committee also reviewed the materials presented at the separate deep dive sessions held during the year, by way of follow on to the Investor Update, on the UK Corporate Bank, the Investment Banking business and Private Bank and Wealth Management. Overseeing the integrity of our financial disclosures is a key role of the Committee. The Committee reviewed the Group’s financial and narrative reporting for each quarterly and half-year results period, including how the new segments have been presented and updates on progress against our three-year targets. The Committee continues to challenge management’s approach to significant accounting estimates and judgements, including in relation to credit impairment and coverage, provisions, litigation, valuations and tax. It also monitored management’s approach to completion of the acquisition of Tesco Bank from a financial reporting perspective. The Committee is supported in its role by the independent assurance provided by KPMG as our statutory auditors including areas of management challenge by KPMG and how they were resolved. The legal and regulatory landscape for climate and sustainability reporting continues to evolve. In terms of consistent and universal reporting standards, this remains a nascent area, and as such requires the continued development and improvement in our approach, processes and controls to meet evolving requirements. During the year, Committee members received presentations on the current and future climate and sustainability reporting landscape, the new European Corporate Sustainability Reporting Directive (CSRD) (which applied to BBPLC and Barclays Europe for the first time for the year ended 31 December 2024, but is not expected to apply to BPLC until 1 January 2028), and the control framework to support the commitments made in Barclays’ Modern Slavery Statement and the implementation of the Barclays Human Rights Statement. The Chair and members of the Committee are also members of the Board Risk Committee and, in the case of myself and Robert Berry, the Board Sustainability Committee. Taking account of the work of those Committees' assessment of climate change and related political responses, the Committee continues to monitor how any related impacts and disclosure recommendations have been considered in preparing the Group’s financial statements. As the Group looks to deliver on our three- year strategy, it is imperative that our business' performance is underpinned by a robust control environment to support success and to achieve its consistently excellent objectives. With a strong controls tone from the top and building on the momentum from the previous year, the Committee was pleased to see the significant progress made in driving sustainable improvements in the Group’s internal control environment. As well as the benefit of the improvements made, it is important that management capacity is created to address the need to continue to upgrade internal controls as external threats such as cyber risk and financial crime continue generally to increase, and regulatory and political frameworks continue to change. Strategy Shareholder information Climate and sustainability report Risk review Financial review Financial statements Barclays PLC 2024 Annual Report on Form 20-F 86Governance Directors’ report: Board Audit Committee report
The Committee received regular updates on the control environment, including any emerging trends which might impact controls and a forward looking view of operational risk events which might impact the control environment. Following Committee feedback, management reporting was enhanced to provide a holistic view of controls matters across all three lines of defence, as well as refinements in reporting to provide a more aligned view across controls and operational risk. Maintaining an effective system of internal control is an ongoing process and the Committee welcomed management’s proposals to undertake a review of the group-wide controls framework to further enhance and streamline it where appropriate. The Committee works closely with the Board Risk Committee, particularly in regard to operational risk matters. The Committee continues to receive regular updates on the more material remediation programmes across the Group, brought together under an internal programme which has the aim of enhancing controls in order to achieve a consistently excellent operating environment across the Group. The Committee has had oversight of this internal programme since its inception at the end of 2022. The Committee encourage management to provide greater visibility and transparency of progress against milestones and also where timelines are extended as a result of new elements being added to existing programmes. The Committee welcomes the ongoing efforts by management to continue to strengthen and enhance the control environment around regulatory reporting and trading controls. Controls in relation to financial crime remain an area of Group-wide focus for both the Committee and management, and the recent severe systems incident impacting many areas of our UK business is a reminder of the need for continued focus in the management of operational risk. During 2024 we welcomed the appointment of a new Group Chief Internal Auditor, Gijs Borghouts. The Committee monitored the smooth transition between Gijs and his predecessor and the continued effectiveness of the Barclays Internal Audit (BIA) function during this time, both of which were successful. The independent assurance provided by BIA is critical in supporting the work of the Committee and the Committee was satisfied with BIA’s performance against its objectives for the year and concluded that it continues to perform effectively. The Committee continues to work closely with the other Board Committees to ensure a consistent and streamlined approach to, and view of, key/thematic matters across the Group. This interconnectivity is supported by committee cross-memberships, including having the Chair of the Board Risk Committee as a member of the Board Audit Committee and my membership on the Board Risk, Sustainability and Remuneration Committees. The Committee has oversight of Barclays’ whistleblowing programme and I continue to hold the role of Group Whistleblowers' Champion. During 2024, I held regular meetings with the Whistleblowing team together with the BBUKPLC Whistleblowers’ Champion to discuss cases being raised via the whistleblowing channels, any potential trends or emerging themes and key areas of focus. The Committee continues to receive detailed semi-annual whistleblowing updates. During the year I attended meetings of the Board Audit Committees of BBUKPLC, Barclays Europe and Barclays US LLC/ Barclays Bank Delaware. I also held regular meetings with the Chair of the BBUKPLC Board Audit Committee, the Group Finance Director, the Group Chief Internal Auditor, the Group Chief Operating Officer and the KPMG lead audit partner, as well as having engagement with the Group’s key regulators. Committee effectiveness The 2024 Committee effectiveness review was externally facilitated, as required by the Code. The review is an important part of the way Barclays monitors and improves Committee performance and effectiveness, maximising strengths and highlighting areas for further development. The Board appointed CSA to facilitate the review. As part of the review, CSA conducted one-on-one interviews with each member of the Committee, the Group Finance Director, BBPLC Chief Financial Officer, Group Chief Operating Officer, Group Chief Compliance Officer and Group Chief Risk Officer. CSA also observed the October 2024 Committee meeting. The results of the Committee effectiveness review confirm the Committee is operating effectively. It is considered appropriately constituted and diligently chaired, providing an effective and appropriate level of constructive challenge and oversight of the areas within its remit, with thoughtful and well- informed contributions from members in meetings. The review highlights that the Committee is considered to have the right level of skills and experience and is of an appropriate size. Agendas are considered appropriate having regard to the Committee’s broad remit, allowing for a good balance between high level and detailed discussion during meetings. The Committee’s interaction with the Board, Board Committees and senior management is considered effective, noting that the Committee is well integrated into overall Board processes, with regular reporting by the Chair to the Board on key issues arising from the work of the Committee. Feedback noted the benefits of having the Chair of the Board Risk Committee serving on the Committee, helping to reduce any potential overlap between the work of the two Committees. The review suggested that members would welcome additional training and external perspectives on topics of relevance to the work of the Committee. In addition, a continued focus on ensuring shorter and more focused papers which clearly identify the key matters for the Committee’s attention was considered beneficial. Feedback indicated that concurrent meetings of the BPLC and BBPLC Board Audit Committee continue to be effective, with coverage of BBPLC matters considered appropriate. Interaction with the BBUKPLC Board Audit Committee was also considered effective, noting the regular interactions between the respective Committee Chairs and confirming that the Committee continues to exercise appropriate oversight of issues relevant to the Committee’s remit relating to BBUKPLC. Please see the report of the Board Nominations Committee for further details on the process for conducting the 2024 Committee effectiveness review. Strategy Shareholder information Climate and sustainability report Risk review Financial review Financial statements Barclays PLC 2024 Annual Report on Form 20-F 87Governance Directors’ report: Board Audit Committee report (continued)
Looking ahead In 2024, the FRC published updates to the Code. A key change relates to provision 29 of the Code which requires the board to monitor a company’s risk management and internal control framework and provide a declaration in the annual report as to the effectiveness of the company’s material controls. The new requirements under provision 29 will apply to financial years beginning on or after 1 January 2026. The Committee will be considering management’s proposals for identifying ‘material controls’ for these purposes within Barclays and the reporting to the Committee on the effectiveness of those controls, ahead of implementation of the new rules and reporting in subsequent years. The Committee welcomes the assurances from the Financial Reporting Council that the implementation of these new requirements should be applied proportionately and take account of the specific risks of each organisation, to avoid unnecessary duplication and disclosure of non-material matters. As announced in December 2024, Barclays commenced an external tender process for the Group’s statutory auditor. This process is being led by the Board Audit Committee, and supported by management who will have an advisory role only. The tender process is expected to conclude in June 2025, when the Committee will make its recommendation to the Board for selection of the preferred firm. The successful firm will commence the provision of services for the financial year ending 31 December 2027. Please see page 94 of this report for further information on the audit tender process. Julia Wilson Chair, Board Audit Committee 12 February 2025 Strategy Shareholder information Climate and sustainability report Risk review Financial review Financial statements Barclays PLC 2024 Annual Report on Form 20-F 88Governance Directors’ report: Board Audit Committee report (continued)
Committee composition and meetings The Committee is composed solely of independent Non-Executive Directors. Membership of the Committee is designed to provide the breadth of financial expertise and commercial acumen that the Committee needs to fulfil its responsibilities. Its members as a whole have recent and relevant experience of the banking and financial services sector, in addition to general management and commercial experience and are financially literate. Julia Wilson, the Committee Chair, who is the designated financial expert on the Committee for the purposes of SOx, has significant corporate finance, tax and accounting experience, including previously serving as the Group Finance Director of 3i plc and as chair of the board audit committee at Legal & General Group plc. In 2024, the Committee met 16 times, including two ad hoc meetings (2023: 12 times, with no ad hoc meetings). Attendance by members at Committee meetings is shown on page 86. Committee meetings were attended by representatives from management, including the Group Chief Executive, Group Finance Director, Group Chief Internal Auditor, Group Chief Operating Officer, Head of Group Control, Group Chief Risk Officer and Group Chief Compliance Officer, as well as representatives from the business and other functions, and also BBPLC senior management (reflecting the partially consolidated operation of the BPLC and BBPLC Committee meetings). The lead audit engagement partner of KPMG also attended Committee meetings. In addition, the Committee held regular private sessions with the Group Finance Director. The Board, together with the Committee, is responsible for ensuring the independence and effectiveness of the internal audit function and external auditors. For this reason, the Committee holds regular private sessions with each of the Group Chief Internal Auditor and the lead KPMG audit engagement partner without management present. The appointment and removal of the Group Chief Internal Auditor is a matter reserved to the Committee, and the appointment and removal of the external auditor is a matter reserved to the Board based on the recommendation of the Committee. Neither task is delegated to management. Role of the Committee The role of the Committee is to review and monitor, among other things: • the integrity of the Group’s financial statements and related announcements • the effectiveness of the Group’s internal controls • the independence and effectiveness of the internal and external audit processes • the Group’s relationship with the external auditor • the effectiveness of the Group’s whistleblowing procedures. The Committee’s terms of reference are available at home.barclays/who- we-are/our-governance/board- committees/ Further information about the skills and experience of the Committee members can be found in their biographies in Our Board of Directors section from page 64. Primary activities The Committee discharged its responsibilities in 2024 through monitoring the effectiveness of the internal control environment and internal and external audit processes, as well as the integrity of financial statements and related announcements. Financial reporting Fair, balanced and understandable reporting In light of the Board’s obligation under the Code, the Committee assesses external reporting to ensure it is fair, balanced and understandable. In addition to this Annual Report and associated year-end reports, the Committee also reviewed the Group’s half-year and quarterly results announcements and associated investor presentations. The Committee informed these reviews through: • consideration of reports of the Group Disclosure Committee • direct questioning of management on the transparency and accuracy of disclosures • feedback from KPMG, including areas in which they challenged management and how those discussions impacted the disclosures • consideration of the results of management’s testing of controls relating to financial reporting processes, including the output of the Group’s internal control assessments and the SOx s404 internal control processes. The Committee closely considered the Group's financial disclosures and provided feedback, including on areas where disclosures could be enhanced and clarity provided. Having evaluated the available information, the assurances by management and KPMG and underlying processes used to prepare the published financial information, the Committee concluded and recommended to the Board that the 2024 Annual Report and Accounts are fair, balanced and understandable. Areas of focus Role of Committee / Key issues considered Conclusion / action taken Strategy Shareholder information Climate and sustainability report Risk review Financial review Financial statements Barclays PLC 2024 Annual Report on Form 20-F 89Governance Directors’ report: Board Audit Committee report (continued)
Critical accounting estimates and judgements Conduct provisions Barclays makes certain assumptions and estimates, analysis of which underpins provisions made for the costs of customer redress. The Committee analyses the judgements and estimates made by management to evaluate the adequacy of the provisions. The Committee reviewed and challenged management’s approach to conduct provisions throughout the year, including in relation to the review commissioned by the FCA on historical motor finance commission arrangements and any potential related provision. The Committee also sought KPMG’s views on the timeliness and adequacy of provisioning in relation to conduct matters, as well as the triggers for raising a provision and the appropriateness of any decision to not raise a provision. The Committee was satisfied that management's judgement and approach resulted in an adequate and appropriate level of provision in relation to conduct matters. (refer to Note 23 to the financial statements) Impairment of financial instruments The Committee monitors management's judgements in relation to expected credit losses (ECLs), which are modelled using a range of forecast economic scenarios. Forward-looking models are used which require judgements to be made over modelling assumptions, including: • the determination of macroeconomic scenarios to be used • the methodology for weighting of scenarios • the criteria used to determine significant deterioration in credit quality • the application of management adjustments to the ECL modelled output. The Committee considered regular reports from management on: • credit performance across the different businesses • the impact of the macroeconomic environment, including central bank interest rate decisions, inflation trends and unemployment levels • the use of post-model adjustments (PMAs), including the retention or release of PMAs • the refresh of macroeconomic variables and associated weighting. The Committee closely considered management’s judgement on impairment coverage levels, including in respect of material exposures and the impact of delinquencies in certain areas of the portfolios. The Committee also considered areas of challenge from KPMG on management’s approach to judgements, including with respect to the use and release of PMAs. As a consequence of the acquisition of Tesco Bank, the Committee reviewed the treatment of the acquired balances. Having considered and scrutinised the reports, the Committee agreed with management’s conclusion that the impairment provision was appropriate. (refer to Note 8 to the financial statements) Impairment of goodwill and intangibles The Committee considers management's judgement in relation to goodwill and intangibles. The carrying value of goodwill and intangible assets is assessed on the basis of discounted forecast future earnings. Given the significant component of earnings attributable to net interest income, such forecasts are particularly sensitive to the level of long-term interest rates and assumed levels of future lending. The period over which intangible assets are amortised appropriately reflects the useful economic life. The Committee considered management's reports on its assessment of the Group's goodwill balances and intangibles to identify any indicators of impairment, including the methodology and controls applied to the process. The Committee was satisfied with management's determination that no indicators of impairment had been identified.(refer to Note 21 to the financial statements) Legal, competition and regulatory provisions Barclays is engaged in various legal, competition and regulatory matters which may give rise to provisioning based on the facts. The level of provisioning is subject to management judgement on the basis of legal advice. The Committee received regular reports on the status of current legal, competition and regulatory matters and considered the impact of those matters on the Group’s provision levels. It challenged management’s judgements on the level of provision to be taken and triggers for making a provision. The Committee also sought KPMG’s views on the adequacy of provisions and areas where they had challenged management, including the steps taken by management to satisfy KPMG on the position taken. The Committee agreed that the level of provision at the year-end was appropriate. The Committee also reviewed the disclosures made in the legal, competition and regulatory notes during the year, providing feedback to enhance transparency in disclosures where appropriate, and concluded that they provided appropriate information for investors. (refer to Note 25 to the financial statements) Valuations Barclays exercises judgement in the valuation and disclosure of financial instruments, derivative assets and certain portfolios, particularly where quoted market prices are not available. The Committee received updates on and scrutinised management's approach to valuations during the year. The Committee requested enhanced reporting from management on material positions and challenged management on decisions made with respect to valuations in the leveraged finance portfolio. Acknowledging the judgement involved in this area, the Committee sought KPMG’s views on their analysis and alignment with management on valuation decisions taken. The Committee was satisfied with the accounting treatment in respect of the various valuation matters. (refer to Notes 13 to 17 to the financial statements) Areas of focus Role of Committee / Key issues considered Conclusion / action taken Strategy Shareholder information Climate and sustainability report Risk review Financial review Financial statements Barclays PLC 2024 Annual Report on Form 20-F 90Governance Directors’ report: Board Audit Committee report (continued)
Critical accounting estimates and judgements Tax The Committee is responsible for considering the Group's tax strategy and overseeing compliance with the Group's Tax Principles. Barclays is subject to taxation in a number of jurisdictions globally and makes judgements with regard to provisioning for tax at risk and to the recognition and measurement of deferred tax assets. The Committee received reports from the Global Head of Tax on developments in tax matters during the year, including updates on the work of the Tax Management Oversight Committee. The Committee monitored the Group’s interactions with tax authorities, developments in tax litigation matters across the Group and the material tax risks for the Group (including considering the adequacy of tax provisions and KPMG's views). The Committee approved the UK Tax Strategy statement published in the Country Snapshot report and recommended the Country Snapshot to the Board for approval. (refer to Note 9 to the financial statements) Going concern and viability Going concern and long-term viability Barclays is required to assess whether it is appropriate to prepare the financial statements on a going concern basis. In accordance with the Code, Barclays must provide a statement of its viability. To support this, the Committee considers both the going concern assumption and the form and content of the Viability Statement. The Committee considered both the going concern assumption and the form and content of the Viability Statement taking into account: • the Medium Term Plan and Working Capital Report • the forecast capital, liquidity and funding profiles • the results of stress tests based on internal and regulatory assumptions. The Committee recommended to the Board that the financial statements should be prepared on a going concern basis and that there were no material uncertainties that would impact the going concern statement which required disclosure. The Committee also recommended the Viability Statement to the Board for approval. Distributions Distributions and return of capital to shareholders The Committee assesses the distributable reserves position in considering management’s proposals for distributions. The Committee reviewed and recommended to the Board that there were sufficient distributable reserves in relation to (i) a dividend for the financial year ended 31 December 2023 of 5.3p per share along with a share buy-back of up to £1bn; and (ii) a dividend for the half year ended 30 June 2024 of 2.9p per share along with a share buy-back of up to £750m. In early 2025, the Committee reviewed and reported to the Board on the distributable reserves position for the full year dividend for the year ended 31 December 2024 along with a proposed share buy-back. Internal controls Internal controls and business control environment The Committee considers the effectiveness of the overall control environment, including the status of any significant control issues and the progress of specific remediation plans. The Committee: • considered feedback received from regulatory stakeholders on the Group’s internal control environment and management’s response • received regular reports on the more significant control matters and remediation programmes across the Group • discussed reports from the heads of BUK, the Investment Bank (both Markets and Investment Banking), PBWM, UKCB and USCB on their control environment, together with views from the second and third lines of defence. The Committee requested enhancements to management reporting to provide greater visibility on progress of material remediation programmes and enable earlier intervention by the Committee if appropriate. Following Committee feedback, management reporting on controls matters was enhanced to reflect a more integrated approach across the three lines of defence as well as a more streamlined view across the areas of controls and operational risk. The Committee acknowledged management's progress in driving sustainable improvements in the Group's internal control environment, and agreed with management's recognition that this did not reduce the need for constant focus on identifying further improvements. In that context, the Committee welcomed proposals to undertake a review of the Group-wide controls framework to further enhance and streamline it where appropriate. (read more about Barclays' internal control and risk management processes on page 105) Whistleblowing Raising concerns The Committee considers the adequacy of the Group’s arrangements to allow colleagues to raise concerns in confidence and anonymously without fear of retaliation, and the outcomes of any substantiated case. The Committee received detailed semi-annual reports on whistleblowing from management. It monitored key whistleblowing metrics, the 'speak up' culture across the Group and any potential whistleblowing trends including around retaliation and anonymity. The Committee sought feedback from management on the effectiveness of enhancements made to the whistleblowing process, including impact on colleague experience and suggested ways in which speaking up among colleagues could be further encouraged. Areas of focus Role of Committee / Key issues considered Conclusion / action taken Strategy Shareholder information Climate and sustainability report Risk review Financial review Financial statements Barclays PLC 2024 Annual Report on Form 20-F 91Governance Directors’ report: Board Audit Committee report (continued)
Internal audit Internal audit The Committee monitors and assesses the performance of Barclays Internal Audit (BIA) and delivery of the internal audit plan, including scope of work performed, the level of resources, and the methodology and coverage of the internal audit plan. Through regular reports from BIA, the Committee: • reviewed and agreed the internal audit plan, methodology and deliverables for 2024, including consideration of how regulatory priorities are managed alongside cyclical audit plans • reviewed BIA's audit reports in relation to specific audits, key areas of focus and emerging themes • tracked the levels of adverse audits and issues raised by BIA and monitored related remediation plans • received updates on BIA colleague matters, including colleague engagement and resourcing • discussed BIA's assessment of the control environment and management control approach in Group companies and functions. The Committee supported the new Group Chief Internal Auditor as he transitioned into the role. It welcomed enhancements made to BIA papers which supported the Committee’s review and understanding of key items of focus for the internal audit team. The Committee noted the independence of the BIA function. It also received regular updates from BIA's quality assurance function and monitored trends in the quality assurance report findings. Committee members, along with the board audit committee chairs of BBUKPLC, Barclays Europe and Barclays US LLC, attended a ‘BIA Teach In’. This covered BIA talent and succession planning, BIA’s approach to auditable entities and BIA’s use of AI to support in the effective provision of assurance work. At the end of the year, the Committee approved the 2025 audit plan and also approved BIA's Audit Charter following the annual review. The Committee conducted a performance assessment of BIA for 2024 and concluded it was satisfied with BIA's performance against its objectives agreed with the Committee Chair at the beginning of the year. External audit External audit The Committee monitors the work and performance of KPMG as the Group’s statutory auditor. The Committee: • met with key members of the KPMG audit team to discuss the 2024 audit plan and KPMG’s areas of focus and subsequently approved the 2024 audit plan • assessed regular reports from KPMG on the progress of the 2024 audit • discussed KPMG’s draft reports on control areas of focus and the control environment • approved the terms of the audit engagement letter and audit fees for 2024, on behalf of the Board. The Committee sought KPMG's views on a number of specific matters, including management's approach to accounting judgements such as the use and release of PMAs and treatment of M&A transactions, and sought to understand where KPMG had challenged management's assessment prior to reaching a conclusion. This included considering KPMG’s challenge in relation impairment decisions, valuations, provisioning for litigation and conduct matters and the approach to disclosures in the Group's full year, half-year and interim financial results. The Committee received updates from KPMG in relation to the limited assurance conducted on CSRD disclosures made for the first time by the Group’s significant subsidiaries, BBPLC and Barclays Europe. While BPLC is not expected to come into scope of CSRD reporting until 1 January 2028, the Committee will be looking to leverage learnings from the assurance conducted on BBPLC and Barclays Europe. The Committee considered KPMG’s response to the PRA Written Auditor Reporting for 2023, and discussed with KPMG the questions in scope for the 2024 Written Auditor Reporting. See the next page for further detail on the Committee’s assessment of KPMG’s performance for 2024. Areas of focus Role of Committee / Key issues considered Conclusion / action taken Strategy Shareholder information Climate and sustainability report Risk review Financial review Financial statements Barclays PLC 2024 Annual Report on Form 20-F 92Governance Directors’ report: Board Audit Committee report (continued)
External auditor Following an external audit tender in 2015, KPMG was appointed as Barclays’ statutory auditor with effect from the 2017 financial year. Stuart Crisp, Barclays’ lead audit engagement partner, has been in the role since 2022 and attends all meetings of the Committee. Assessing external auditor effectiveness, objectivity and independence The Committee is responsible for assessing the effectiveness, objectivity and independence of the Group’s statutory auditor. This responsibility was discharged by the Committee throughout the year at formal Committee meetings, during private meetings with the KPMG lead audit engagement partner and through discussions with key Group executives. Committee conclusion on KPMG effectiveness The Committee is satisfied that the external audit process for 2024 was effective. In particular, the Committee considered that KPMG maintained its independence and objectivity, exercised robust challenge and demonstrated professional scepticism in the audit process. The Committee assessed KPMG’s effectiveness, objectivity and independence in the following ways: Reporting throughout the year • Met with senior members of the KPMG audit team from the UK, Ireland and US to discuss the approach to the 2024 audit and key areas of focus, including how the audit plan would address feedback from the prior year’s auditor effectiveness assessment. • Received regular reports from management on the non-audit services provided by KPMG to Barclays. • Received regular reports from management detailing any employees or workers hired from KPMG. • Discussed with KPMG their consideration of internal controls over financial reporting. • Considered areas in which KPMG challenged management’s assumptions in areas of key judgement. • Monitored for any potential threats to independence. No such matters were identified and reported by KPMG during 2024. Annual assessment and audit quality reporting • The Group undertakes an annual formal assessment of KPMG’s performance, independence and objectivity. The assessment for 2024 was conducted by way of a questionnaire completed by key stakeholders across the Group who have regular interaction with KPMG. The questionnaire was designed to evaluate KPMG’s audit process, its effectiveness and overall output. It included questions covering areas such as performance regarding key judgements, independence and quality of people. • During 2024, the Committee received reports from the KPMG UK Head of Audit Quality on her assessment of audit quality for Barclays as well as areas of focus for KPMG in improving audit quality for Barclays and generally. This included her views on the quality of the audit team dedicated to Barclays and how KPMG intends to utilise AI/technology in delivering the Barclays audit. The KPMG Global Head of Audit attended one of these meetings. External reports • The FRC published its Audit Quality Inspection and Supervision Report on KPMG LLP in July 2024. In the report, the FRC highlighted that KPMG has made notable improvements in priority areas and noted an improvement in audit quality. The percentage of audits inspected by the FRC requiring no more than limited improvements was 89%. • The FRC outlined two areas of key findings, relating to (1) improving the quality and consistency of the audit of estimates, particularly for impairment assessments and ECL provisions and (2) improving the quality and consistency of risk assessment and response to internal control deficiencies. • The results of the FRC review were shared with the Committee. While there remain areas for improvement, the FRC’s findings provided additional comfort to the Committee on the quality and effectiveness of KPMG’s audit. Non-audit services In order to safeguard the auditor’s independence and objectivity, Barclays has in place the Group Policy on the Provision of Services by the Group Statutory Auditor (the Policy) setting out the circumstances in which the auditor may be engaged to provide non-audit services. The Policy applies to all Barclays subsidiaries and other material entities over which Barclays has significant influence. The core principle of the Policy is that non-audit services (other than those legally required to be carried out by the Group’s auditor) should be performed by the auditor only in certain controlled circumstances. A summary of the Policy can be found at home.barclays/ who-we-are/our-governance/auditor- independence/ The Policy sets out the type of services that the auditor is permitted to carry out and pre-approves certain of these services provided the fee is below a certain threshold, except for specific categories of permitted services that require explicit Committee approval. All other permitted services must be approved in advance by the Committee. The Policy requires that all proposed work must be sponsored by a senior executive who is not involved in any work to which the proposed engagement relates. The audit assignment partner must also confirm that the engagement has been approved in accordance with the auditor’s own internal ethical standards and does not pose any threat to the auditor’s independence or objectivity. The Policy is reviewed by the Committee on an annual basis to ensure that it is fit for purpose and that it reflects applicable rules and guidelines. The Policy is aligned with both the FRC’s requirements and KPMG’s own internal policy on non-audit services for FTSE 350 companies, which broadly restricts non-audit work to services that are ‘closely related’ to the audit. Strategy Shareholder information Climate and sustainability report Risk review Financial review Financial statements Barclays PLC 2024 Annual Report on Form 20-F 93Governance Directors’ report: Board Audit Committee report (continued)
The fees payable to KPMG for the year ended 31 December 2024 amounted to £91m (2023: £78m), of which £20m (2023: £14m) was payable in respect of non-audit services. A breakdown of the fees payable to the auditor for statutory audit and non- audit work can be found in Note 39 of the financial statements. Of the £20m of non-audit services provided by KPMG during 2024, the significant categories of engagement, i.e. services where the fees amounted to more than £500,000, included: • limited assurance services provided pursuant to CSRD requirements in relation to disclosures by BBPLC and Barclays Europe • audit-related services, such as services in connection with CASS (Client Assets Sourcebook) audits • other services in connection with regulatory, compliance and internal control reports and specific audit procedures, required by law or regulation to be provided by the statutory auditor • other attestation and assurance services, such as ongoing attestation and assurance services for treasury and capital markets transactions to meet regulatory requirements, including regular reporting obligations and verification reports. External audit tender An external audit tender was conducted in 2015 and the decision was made to appoint KPMG as Barclays’ external auditor with effect from the 2017 financial year. Barclays is in compliance with the requirements of The Statutory Audit Services for Large Companies Market Investigation (Mandatory Use of Competitive Tender Processes and Audit Committee Responsibilities) Order 2014, which relates to the frequency and governance of tenders for the appointment of the external auditor and the setting of a policy on the provision of non-audit services. As a UK public interest entity, Barclays is required to tender the external audit every 10 years and rotate the Group statutory auditor every 20 years. We disclosed in our Annual Report in 2023 that any tender was expected to be in respect of the 2027 financial year onwards. On 12 December 2024, Barclays announced its intention to conduct a formal audit tender process for the Group statutory auditor with effect from the 2027 financial year onwards. The audit tender process is being led by the Board Audit Committee, having regard to the FRC guidance on best practice for audit tenders. Management will support the Committee in the audit tender process, and will share their views on an advisory only basis with the Committee. During 2024, Barclays undertook an initial ‘Request for Information’ (RFI) to identify firms which satisfied our minimum requirements relating to credibility, capacity and independence. The size and complexity of Barclays requires an audit firm of sufficient size, resource and geographical reach to be able to ensure a high quality audit. As part of the RFI, the Chair of the Committee together with senior members of Finance management met interested firms to discuss with them Barclays' key priorities for the audit. As part of the Request for Proposal (RFP) phase of the tender, firms will be invited to submit proposals to provide statutory audit services to the Barclays Group for up to a period of 10 years commencing from the financial year ending 31 December 2027. Barclays’ primary objective for the audit tender process is ensuring a fair and transparent tender process and appointing the audit firm which will provide the highest quality audit in an effective and efficient manner. Firms will be assessed against criteria determined by the Board Audit Committee. At the conclusion of the RFP phase, the Committee expects to recommend two audit firms to the Board for it to select the preferred firm. The audit tender process is expected to conclude in June 2025 and an announcement will be made following the selection of the preferred firm by the Board. An overview of the process is set out below. Strategy Shareholder information Climate and sustainability report Risk review Financial review Financial statements Barclays PLC 2024 Annual Report on Form 20-F 94Governance Directors’ report: Board Audit Committee report (continued) Audit tender process RFI circulated and responses considered Recommendation from the Committee to the Board to formally commence the audit tender process RFP process, workshops held and final presentations to the Committee Committee review of proposals and recommendation to the Board Board selection of preferred audit firm and announcement released confirming selected firm
Providing rigorous risk oversight during uncertain times Strengthening risk management and resilience amid complex global challenges. Board Risk Committee Robert Berry Chair, Board Risk Committee Committee membership and meeting attendance in 20241 Member Meetings attended/eligible to attend Robert Berry 10/10 Dawn Fitzpatrick 9/10 Sir John Kingman 9/10 Marc Moses 10/10 Julia Wilson 9/10 Mohamed A. El-Erian2 5/6 Diane Schueneman3 3/4 Notes 1 There were 10 scheduled meetings of the Committee in 2024. Owing to prior commitments, Mohamed A. El Erian, Sir John Kingman and Diane Schueneman were each unable to attend one meeting. Dawn Fitzpatrick was unable to attend one meeting due to being called to jury service. Julia Wilson was unable to attend one meeting due to an unavoidable personal commitment. 2 Stepped down on 31 August 2024. 3 Stepped down with effect from 31 May 2024. Dear Fellow Shareholders During 2024, the Committee focused on positioning the Group to navigate the financial and operational challenges arising from macroeconomic uncertainty, inflation and geopolitical tensions through proactive oversight and strengthened resilience. Following the announcement of the Group's three-year strategy in February 2024, and the re-segmentation of the business into five business lines, the Committee receives regular business risk updates from management of those divisions. Reflecting the new business segmentation, the Committee undertook its annual review of Risk Appetite and considered the potential capital impacts from a number of strategic projects including the acquisition of Tesco Bank, and considered and approved an updated view of the Group's stress loss limits. The Committee also examined governance and compliance risk management processes and controls in place to effectively mitigate and oversee the inherent compliance risk arising from the Group transformation initiatives. As part of the annual review of the Enterprise Risk Management Framework (ERMF), financial crime was elevated to a principal risk by the Board on recommendation of the Committee. This reflects the heightened financial crime risk environment and importance of related risks to Barclays and its stakeholders. This change took effect on 1 January 2025, with the Committee having overseen management’s work to put in place a financial crime risk management framework to support this change, including the development of a financial crime risk appetite statement and reporting dashboard. In addition, the Committee has continued oversight of management’s initiatives to detect and mitigate financial crime risk across the Group, ensuring alignment with strengthened regulatory expectations. The Committee continued to monitor closely the rapidly changing macroeconomic environment throughout the year as well as the periodic bouts of volatility in traded markets and the potential for higher delinquencies in wholesale and retail lending due to pressure on margins and cost of living. This included impacts on structured financing portfolios with underlying retail exposure, as well as counterparties susceptible to the impacts of elevated rates. The Committee oversaw the active monitoring and risk mitigating actions put in place by management to manage these financial risks, including regular asset valuations and margining. The Committee received regular updates on capital and liquidity management and oversaw compliance with the Group's prudential requirements, including judgements around risk-weighted assets and capital adequacy, and related enhancements to the governance oversight framework. The Committee also engaged in a detailed session on the strategic management of inherent interest rate risk via structural hedging arrangements. The Committee continues to oversee work to drive robust operational risk management across Barclays, with the recent severe systems incident impacting many areas of our UK business a reminder of the need for continued vigilance in this area. During 2024, the Committee tracked Barclays' progress towards its goal of ensuring it can recover its important business services within impact tolerance in the event of material service disruption by the regulatory deadline of 31 March 2025, as required under the UK operational resilience framework. The Committee considered the risks associated with a cyberattack and the potential impact on customers and clients with management providing updates on ongoing efforts to strengthen the bank’s cybersecurity defences. Strategy Shareholder information Climate and sustainability report Risk review Financial review Financial statements Barclays PLC 2024 Annual Report on Form 20-F 95Governance Directors’ report: Board Risk Committee report
In addition, the Committee oversaw work to improve risk management in the process for new and amended product approvals, by enhancing end-to-end control processes, strengthening senior management accountability and governance. The Committee continued to oversee the management of risks arising from the impact of climate change on Barclays and its customers. In particular, the Committee reviewed the climate-related components of the Group Stress tests to understand the impact of climate risk on Barclays' financial viability. The Committee also oversaw the management of risks to Barclays meeting its disclosed targets on reducing its financed emissions. The Group uses models and data to support a broad range of business decisions and risk management activities across the Group. The Committee has continued its oversight of model risk management, including enhancements to the model risk framework to support regulatory compliance and address regulatory expectations. Compliance risk remained a key area of oversight. The Committee received updates from Compliance management on its assessment of business activities that have the potential of posing higher levels of compliance risk. The Committee examined the output of read across exercises to inform enhancements to the bank’s compliance risk management capabilities such as surveillance mechanisms, as well as leveraging lessons learned from fines and penalties imposed on peer firms to ensure that Barclays practices align with regulatory expectations and proactively mitigate those risks with the potential to cause customer harm. During 2024, the Committee’s remit was expanded to include responsibility for the oversight of the effectiveness of the executive’s approach to reputation risk management, with matters of strategic Group-wide reputation risk being reserved to the Board, supported by clear escalation protocols. As part of the Committee’s oversight of Barclays’ recovery and resolvability capabilities, the Committee oversaw management’s testing and assurance plans under the BoE’s Resolvability Assessment Framework. Reflective of the need to ensure that Barclays’ financial and operational crisis management frameworks are aligned, the Committee participated in a simulation to test Barclays’ response to a serious and fast moving operational crisis with severe financial implications. The exercises provided valuable learnings for the Committee and the wider organisation as to how Barclays can best prepare for and respond to any such crisis event. The outputs also support the Group's Recovery Plan which sets the actions available to the Group and its material entities in a severe financial stress event. The Committee continues to work closely with the Board Audit Committee and Board Sustainability Committee to ensure a consistent approach is taken in relation to key matters across the Group. This interconnectivity is supported by Committee cross-memberships, including the Chair of the Board Audit Committee being a member of the Board Risk Committee and my membership on the Board Audit and Sustainability Committees. To ensure that I have visibility over any material and key emerging issues impacting the Group (including its key subsidiaries), during the year I attended meetings of the Barclays US LLC/Barclays Bank Delaware Board Risk Committee. I also took the opportunity to visit Barclay’s operations in India (Pune and Mumbai), meeting with the India Risk management team and with Risk colleagues across both offices. In 2024, the Committee oversaw a change to the senior management of the Compliance function, with the appointment of a new Group Chief Compliance Officer, Matt Fitzwater, who took up the role in October 2024. Committee effectiveness The 2024 Committee effectiveness review was externally facilitated, as required by the Code. The review is an important part of the way Barclays monitors and improves Committee performance and effectiveness, maximising strengths and highlighting areas for further development. The Board appointed CSA to facilitate the review. As part of the review, CSA conducted one-on-one interviews with each member of the Committee, the Group Chief Risk Officer, Group Finance Director, BBPLC General Counsel, Group Chief Operating Officer, Group Chief Compliance Officer and BBPLC Chief Compliance Officer. CSA also observed the September 2024 Committee meeting. The results of the Committee effectiveness review confirm the Committee is operating effectively. It is considered appropriately constituted and diligently chaired, providing an effective and appropriate level of constructive challenge and oversight of the areas within its remit, with thoughtful and well- informed contributions from members in meetings. The review highlights that the Committee is considered to have the right level of skills and experience and is of an appropriate size. The Committee’s interaction with the Board, Board Committees and senior management is considered effective, noting that the Committee is well integrated into overall Board processes, with regular reporting from the Chair to the Board on key issues arising from the work of the Committee. Feedback noted the benefits of having the Chair of the Board Audit Committee serve on the Committee, helping to reduce any potential overlap between the work of the two Committees. Whilst agendas are considered appropriate having regard to the Committee’s broad remit, the review recommended that consideration be given to how future Committee agendas might be shaped towards more open-ended discussion and to bring in more external perspectives. A continued focus on ensuring shorter and more focused papers which clearly identify key matters for the Committee’s attention was considered beneficial. Strategy Shareholder information Climate and sustainability report Risk review Financial review Financial statements Barclays PLC 2024 Annual Report on Form 20-F 96Governance Directors’ report: Board Risk Committee report (continued)
Feedback indicated that concurrent meetings of the BPLC and BBPLC Board Risk Committee continue to be effective, with coverage of BBPLC matters considered appropriate. Interaction with the BBUKPLC Board Risk Committee was also considered effective, noting the regular interactions between the respective Committee Chairs and confirming that the Committee continues to exercise appropriate oversight of issues relevant to the Committee’s remit relating to BBUKPLC. Please see the report of the Board Nominations Committee for further details on the process for conducting the 2024 Committee effectiveness review. Looking ahead As we move into 2025 the Committee will continue to oversee management’s efforts to effectively monitor, manage and mitigate the impact of the risks most likely to pose harm or disruption to the Group’s operations and stability. In doing so, the Committee expects to maintain focus on several key topics including geopolitical tensions, macroeconomic uncertainty and ongoing inflationary pressures, with possible regulatory divergence on some issues likely to increase the complexity of effective risk management. Robert Berry Chair, Board Risk Committee 12 February 2025 Committee meetings In 2024, the Committee met 10 times, with no ad hoc meetings (2023: 11 times, including two ad hoc meetings) and the attendance by members at these meetings is shown on page 95. In addition to its members, Committee meetings were attended by representatives from senior management, including the Group Chief Executive, Group Chief Risk Officer, Group Finance Director, Group Chief Internal Auditor, Group Treasurer, Group Chief Compliance Officer and Group General Counsel, as well as representatives from the businesses and additional colleagues from the Risk and Compliance functions. The lead audit engagement partner of KPMG also attended Committee meetings. The Committee held regular private sessions with each of the Group Chief Risk Officer and the Group Chief Compliance Officer, without other management present. Role of the Committee The Committee is responsible for reviewing, on behalf of the Board, management’s recommendations on the principal risks as set out in the ERMF (with the exception of reputation risk with strategic implications relating to the Group, which is a matter reserved to the Board), and in particular: • reviewing, on behalf of the Board, the management of those principal risks in the ERMF • considering and recommending to the Board the Group’s risk appetite and tolerances for those principal risks • reviewing, on behalf of the Board, the Group’s risk profile for those principal risks • commissioning, receiving and considering reports on key risk issues • safeguarding the independence, and overseeing the performance, of Barclays’ Risk and Compliance functions. The Committee’s terms of reference are available at home.barclays/who- we-are/our-governance/board- committees/ Strategy Shareholder information Climate and sustainability report Risk review Financial review Financial statements Barclays PLC 2024 Annual Report on Form 20-F 97Governance Directors’ report: Board Risk Committee report (continued)
Primary activities The Committee discharged its responsibilities in 2024 through reviewing and monitoring Group exposures in the context of the current and emerging risks facing the Group. The Committee seeks to promote a strong culture of disciplined risk management. Risk framework and governance • To review the design of the ERMF and recommend to the Board for approval any relevant changes. • To track the progress of significant risk management projects. • To consider risk management matters raised by Barclays’ regulators and monitor the actions being taken by management to respond. • To review the effectiveness of the Group’s risk management systems. • The Committee reviewed and recommended to the Board updates to the ERMF to elevate financial crime to a principal risk, include the climate risk constraint and realign oversight of legal risk from Risk to Compliance. • The Committee reviewed reports from management on guidance, letters and reviews received from regulators. The Committee examined management’s responses to the matters raised by regulators and received updates on key remediation programmes. • The Committee considered and recommended to the Board for approval updates to the Committee’s Terms of Reference including changes to reflect the Committee’s new responsibilities with respect to the oversight of reputation risk. • The Committee oversaw enhancements to the governance framework for the management of regulatory reporting Risk appetite and stress testing i.e. the level of risk the Group chooses to take in pursuit of its business objectives, including testing whether the Group’s financial position and risk profile provide sufficient resilience to withstand the impact of severe but plausible economic scenarios. • To propose to the Board an appropriate risk appetite and tolerance for the principal risks, including an overall Group risk appetite and limits. • To review and approve the methodology used to establish the Group’s risk appetite and associated stress testing. • To discuss and agree stress loss and mandate and scale limits for credit risk, market risk, operational risk and treasury and capital risk. • To consider and approve internal stress test (IST) themes, and consider the financial constraints and scenarios, for stress testing risk appetite for the MTP. • To consider and approve the results of stress tests required by regulatory bodies. • The Committee considered and recommended to the Board for approval Barclays’ Risk Appetite Statement. • The Committee discussed and approved the mandate and scale limits as well as the stress loss limits for the Group. Subsequent changes were reviewed and approved during the year. • The Committee considered and approved stress test results, including those of the 2024 IST (including climate risk embedded for the first time this year), as well as the associated risk appetite for the MTP. The Committee also approved the results of the 2024 reverse IST, and considered key learnings. • The Committee considered the results of Barclays US LLC’s 2024 supervisory stress test conducted by the Federal Reserve Board. • The Committee considered the conclusions from the due diligence conducted on the acquisition of Tesco Bank and the impact of the acquisition on the Group’s risk profile and its overall risk appetite and strategy. Risk profile i.e. the impact on the Group’s risk profile of geopolitical and macroeconomic developments and conditions. • To evaluate and report to the Board on the Group’s risk profile and monitoring of the principal risks in the ERMF. • To consider proposed material changes to the Group’s risk profile. • The Committee received regular updates on the Group's risk profile and compliance profile from the Group Chief Risk Officer and Group Chief Compliance Officer respectively. • The Committee examined key risk themes in order to monitor the evolving risk environment in which Barclays operates, the response of management, and the changing risk profile of the Group. • The Committee considered macroeconomic developments, including the evolving rates environment, US Government fiscal position, disintermediation, the UK economy, the EU geopolitical and economic landscape and execution risk relating to the Group’s strategy. • The Committee monitored the Group's exposures to geopolitical risks and considered longer-term and emerging risk themes. • The Committee received regular business division risk reviews from the first and second lines of defence. Areas of focus Key role of Committee Conclusion / action taken Strategy Shareholder information Climate and sustainability report Risk review Financial review Financial statements Barclays PLC 2024 Annual Report on Form 20-F 98Governance Directors’ report: Board Risk Committee report (continued)
Credit risk and market risk i.e. the risk of loss from the failure of customers, clients or counterparties to fully honour their obligations; or due to market movements. • To review and consider vulnerabilities to credit losses in the Group’s lending and banking transactions which expose the firm to credit risk • To review and consider the risk of loss arising from potential adverse changes in the value of the firm’s assets and liabilities from fluctuation in market variables. • The Committee received regular updates on credit risk and market risk within the Investment Bank, with a particular focus on the structured lending and finance and leveraged finance portfolios. Treasury and capital risk i.e. liquidity risk, capital risk and interest rate risk in the banking book. • To review capital performance against plan, tracking the capital trajectory, any challenges and opportunities and regulatory policy developments. • To assess liquidity performance against both internal and regulatory requirements, and review any challenges and opportunities. • To monitor capital and funding requirements. • To consider the ICAAP and ILAAP scenario review. • The Committee reviewed capital and liquidity performance and the forecast capital and funding trajectory, including the actions identified by management to manage the Group's capital position, taking into account relevant macroeconomic factors. • The Committee received a preliminary assessment of the ICAAP and the ILAAP in January 2024. The Committee subsequently discussed and approved the Group's 2024 ICAAP and the Group's 2024 ILAAP prior to their submission to the PRA. • The Committee recommended to the Board for approval the Group Recovery Plan, which forms part of the Group’s capital and liquidity risk management framework. • The Committee reviewed the key findings from the Bank of England's second Resolvability Assessment Framework assessment and plans for the enhancement of Barclays’ resolvability arrangements. • The Committee monitored preparations for compliance with Trading Wind Down capabilities in the context of recovery planning and post-resolution restructuring. • The Committee received a number of teach-in sessions from management on treasury-related matters, including the structural hedge. • The Committee received regular reports from the Group Regulatory Management Oversight Committee. Climate risk i.e. the risk of financial losses arising from climate change through physical risks and risks associated with transitioning to a low-carbon economy. • To consider and assess the impact of climate risk on the Group’s activities. • The Committee received regular updates on climate risk including areas of elevated climate risk and progress against sector targets. • The Committee reviewed how climate change is driving financial and operational risks and how Barclays is managing them. Operational risk i.e. the risk of loss arising from inadequate or failed processes and systems, human factors or due to external events. • To review the Group’s operational risk profile and consider specific areas of operational risks, including fraud, conduct risk, operational recovery planning, cybersecurity risk, execution risk, technology and data, including the controls that are in place for managing and mitigating such risks. • To track operational risk key indicators. • The Committee received regular reporting on key operational risk indicators and was briefed by management on a number of operational risk topics, including those relating to technology risk, fraud, third party risk management, cyber and information security and the risks associated with new business activities. • The Committee considered operational resilience, including reviewing and recommending to the Board for approval the 2024 Barclays Operational Resilience Self- Assessment report, detailing the resilience risks which may impact Barclays’ ability to recover its important business services within impact tolerance, and to ensure Barclays' plans align to enhanced expectations around appropriate measures to reduce risk to market integrity, financial stability, safety and soundness, and customer/client harm. • The Committee received updates on cybersecurity resilience and the results of internal and external tests of Barclays’ performance against cybersecurity risk appetite Areas of focus Key role of Committee Conclusion / action taken Strategy Shareholder information Climate and sustainability report Risk review Financial review Financial statements Barclays PLC 2024 Annual Report on Form 20-F 99Governance Directors’ report: Board Risk Committee report (continued)
Model risk i.e. the potential for adverse consequences from decisions based on incorrect or misused model outputs and reports. ▪ To evaluate the appropriateness of the Model Risk Management Framework, including receiving updates on findings in relation to specific modelling processes. • The Committee reviewed and discussed regular updates on model risk, including progress in developing the Model Risk Management Framework, and in relation to the continued focus and momentum required to address increasing regulatory expectations. Compliance risk i.e. compliance risk is comprised of (i) laws, rules and regulation (LRR) risk and (ii) conduct risk, which is the risk of poor outcomes to customers, clients and markets, arising from the delivery of the Group's products and services. • To receive updates from management on conduct risk and consider performance against key conduct risk indicators and the status of initiatives in place to address those risks to further strengthen the culture of the business. • To review the effectiveness of the Conduct Risk Framework. • To oversee how Barclays mitigates the risk of non-compliance with LRR risk. • The Committee received regular updates on conduct risk and assessments of potential risks to the Group following market events. • The Committee received updates on lessons learned reviews undertaken in response to industry developments and events, and continued to monitor ongoing remediation activities. • The Committee received regular updates on the management of the Group’s financial crime risk and a dedicated deep dive on the financial crime control environment with a focus on inherent risk for sanctions, anti-bribery and corruption and anti-tax evasion facilitation. Legal risk i.e. the risk of loss or imposition of penalties, damages or fines from the failure of the Group to meet its legal obligations, including regulatory or contractual requirements. • To monitor the Group’s legal risk profile, including considering potential material emerging legal risks. • The Committee received regular updates on the legal risks faced by the Group, including horizon scanning for key areas of emerging legal risk and Barclays’ ability to manage these and other risk trends. Remuneration • To make a recommendation to the Board Remuneration Committee on the financial and operational risk factors to be taken into account in annual remuneration decisions. • The Committee considered the 2024 ex-ante risk adjustment methodology, including input from the Group Chief Risk Officer and the Group Chief Compliance Officer. Oversight of the Risk and Compliance functions • To safeguard the independence, and oversee the performance, of Barclays' Risk and Compliance functions. • To satisfy itself that the Barclays Compliance and Risk functions are adequately resourced and have appropriate access to information so as to be able to perform their functions effectively. • To review the Compliance function’s Annual Compliance Plan. • To oversee the Group’s compliance and risk culture. • The Committee considered assessments of the performance of the Risk and Compliance functions. • The Committee met privately with the Chief Risk Officer and Chief Compliance Officer on a regular basis. • The Committee approved the Annual Compliance Plan and monitored progress on key deliverables during the year. • The Committee received updates on the compliance and risk culture within the Group. Areas of focus Key role of Committee Conclusion / action taken Strategy Shareholder information Climate and sustainability report Risk review Financial review Financial statements Barclays PLC 2024 Annual Report on Form 20-F 100Governance Directors’ report: Board Risk Committee report (continued)
Continuing to progress on our sustainability targets Committed to delivering our climate and sustainability strategy. Board Sustainability Committee Nigel Higgins Chair, Board Sustainability Committee Committee membership and meeting attendance during 20241 Member Meetings attended/eligible to attend Nigel Higgins 5/5 Robert Berry 5/5 Dawn Fitzpatrick 4/5 Mary Francis 5/5 Brian Gilvary 4/5 C.S. Venkatakrishnan 4/5 Julia Wilson 5/5 Note: 1 There were five scheduled meetings of the Committee in 2024. Owing to other/prior commitments, Dawn Fitzpatrick, Brian Gilvary and C.S. Venkatakrishnan were each unable to attend one meeting. Dear Fellow Shareholders In 2024, the Barclays Group continued to make progress in supporting the transition to a low-carbon economy, delivering on the strategic pillars of our ambition to be a net zero bank by 2050 and supporting wider sustainability priorities. Climate change continues to be a critical and complex challenge and addressing it remains a priority for Barclays. The Committee has played a key role in assisting the Board and management, particularly as we consider how best to navigate increasing policy divergence and uncertainty. It has helped strengthen the Board’s understanding of the challenges around climate change and overseen the development of a wide range of tools as we improve our evaluation and support of our clients’ transition plans, how we finance sustainable and transition opportunities and scale up new technologies. The Committee also maintained its focus on wider sustainability issues such as nature and human rights, including receiving externally-led training and overseeing the publication of the updated Barclays Human Rights Statement. Our approach to climate has continued to evolve and become more multifaceted than when we determined our first emissions targets in 2020. We will set out what we have learnt as part of a Transition Plan, which we intend to publish later this year, and in which we will also seek to incorporate our developing thinking on nature and social issues. While we continue to make progress towards our climate commitments, we recognise that we cannot fully realise the impact of those changes on our own and the Transition Plan will provide an opportunity to highlight our key dependencies on the path towards net zero and hopefully encourage broader support in tackling them. As an Executive member of the Committee, our Group Chief Executive, C.S. Venkatakrishnan, brings invaluable climate and sustainability insight to the Committee’s discussions, including the views of key external stakeholders. Through his past and current external roles, including as Chair of the Financial Services Task Force to the Sustainable Markets Initiative, he brings external perspectives on key climate and sustainability matters relevant to the Committee’s discussions. The Committee was pleased to see further progress across the three pillars of our climate strategy. We continued to track ahead of our target of 90% absolute reduction of our Scope 1 and 2 market- based emissions against a 2018 baseline – reducing these emissions by 95%. We also enhanced our visibility and understanding of our supply chain emissions data resulting from increased supplier engagements - unlocking new opportunities to decarbonise our supply chain. For our financed emissions, where we now have eight sector targets, the Committee received regular updates on our progress. The Committee is aware that future progress will likely remain volatile and non-linear due to factors and external dependencies beyond our control. Our upstream energy emissions reductions stayed above 40%, our 2030 target, and well ahead of our 2025 target of 15%. The Committee received an update on the implementation of our updated Climate Change Statement, announced in February 2024, which reinforced our focus on clients with transition plans and low-carbon intensive sources of energy. Strategy Shareholder information Climate and sustainability report Risk review Financial review Financial statements Barclays PLC 2024 Annual Report on Form 20-F 101Governance Directors’ report: Board Sustainability Committee report
The Committee reviewed the sustainable finance strategy and has been pleased to see our continued role as a provider of capital and expertise to low-carbon infrastructure projects and innovative climate technologies, as witnessed by the £94.4bn of financing towards our $1 trillion target of Sustainable and Transition Financing, a 39% increase year on year. This progress is underpinned by our Sustainable and Transition Finance Frameworks which have robust methodologies to track and disclose against our target. We have also invested £203m to date in climate tech companies whose technologies have the potential to substantially reduce the emissions in the industries of our clients if they can be scaled appropriately. The table on page 103 provides an overview of the Committee’s key activities over the year. The Committee advises the Board in its role overseeing the Group’s climate and sustainability strategy. The Committee receives presentations on the challenges and opportunities pertinent to its work (including external input on specific areas of focus), undertakes detailed reviews and discussions and makes recommendations to the Board. The topics covered by the Committee are reviewed regularly to ensure that members have visibility of material regulatory, legal and political developments in our key markets. Given the breadth of climate and sustainability matters and their impact across the Group, it is important we approach such matters with a cohesive view. Having cross-membership on the Committee with the Chairs of our Board Audit, Remuneration and Risk Committees helps to ensure a streamlined approach to Board-level oversight of all climate and sustainability related matters. The Committee continues to have a non- executive representative from the BBUKPLC Board, which provides further connectivity across Group matters. Committee effectiveness The 2024 Committee effectiveness review was externally facilitated, as required by the Code. The review is an important part of the way Barclays monitors and improves Committee performance and effectiveness, maximising strengths and highlighting areas for further development. The Board appointed CSA to facilitate the review. As part of the review, CSA conducted one-on-one interviews with each member of the Committee, the Chief Executive of the UK Corporate Bank and Head of Public Policy and Corporate Responsibility, the Group Head of Sustainability and the Global Head of Sustainable and Transition Finance. The results of the Committee effectiveness review confirm the Committee is operating effectively. It is considered well constituted and chaired, providing an effective and appropriate level of constructive challenge and oversight of the areas within its remit, with feedback confirming a good and varied level of debate during meetings. The Committee is considered to have the right level of skills and experience and is of an appropriate size. The review noted the benefits of having cross-membership between the Committee and the Board Risk Committee and the Board Audit Committee, and having the Group Chief Executive as a member of the Committee in the context of the development of Barclays’ climate and sustainability strategy as well as the relevant experience he brings to the Committee. The Committee’s interaction with the Board, Board Committees and senior management is considered effective, noting that the Committee is well integrated into overall Board processes, with regular reporting by the Chair to the Board on key climate and sustainability matters, and recognising the level of diligent support provided to the Committee by senior management. Papers presented to the Committee were considered appropriate to the business of the meeting. A continued focus on the potential overlap between the work of the Committee and that of the Board Audit and Risk Committees was considered beneficial. The review suggested that there may be merit in considering how agendas for future Committee meetings might be shaped to include regular horizon scanning items for emerging topics and to create opportunities for Committee members to hear from third party experts. Feedback indicated that concurrent meetings of the BPLC and BBPLC Board Sustainability Committee are effective, with coverage of BBPLC matters considered appropriate. The addition of a representative to the Committee from the BBUKPLC Board at the beginning of 2024 was considered to support ongoing BBUKPLC Board engagement in respect of climate and sustainability matters impacting the Group. Please see the report of the Board Nominations Committee for further details on the process for conducting the 2024 Committee effectiveness review. Looking ahead Looking ahead to 2025, the Committee will focus on developing the Transition Plan and nurturing more nascent areas of our sustainability agenda such as nature. We remain thoughtful on how we best address the complex issue of climate change whilst supporting a successful and growing economy with secure and affordable energy. We expect further divergence in the policy environment across the US, Europe and the UK and will carefully consider the implications for our clients and our own business and strategy in how we develop our approach in each region. We continue to see a significant ongoing opportunity for Barclays to demonstrate its commercial leadership and support for its clients in the transition to a low-carbon economy. We will continue to regularly liaise with our external stakeholders, following valuable and constructive engagements in 2024, to explain how we can work towards successfully achieving our sustainability goals while managing the impact of the energy transition. The Committee is looking forward to continuing to oversee the work towards achieving our ambition to become a net zero bank by 2050. Nigel Higgins Chair, Board Sustainability Committee 12 February 2025 Strategy Shareholder information Climate and sustainability report Risk review Financial review Financial statements Barclays PLC 2024 Annual Report on Form 20-F 102Governance Directors’ report: Board Sustainability Committee report (continued)
The role of the Board and Board Committees in the oversight of climate and sustainability matters Board Sets and oversees the Group's climate and sustainability strategy, including sustainable finance strategy, energy transition and transition planning. Board Audit Committee Board Risk Committee Board Sustainability Committee Board Remuneration Committee Considers the impact of climate on the Group’s financial statements and reviews key climate- related disclosures. Oversees Barclays’ progress in its climate risk management approach, including a focus on developing quantitative risk appetites. Supports the Board in its oversight of policies, setting targets, and implementation of the Client Transition Framework. Sets climate-related targets for executive management. Committee composition and meetings In 2024, the Committee met five times, with no ad hoc meetings and attendance by members at these meetings is shown on page 101. Committee meetings in 2024 were also attended by representatives from management, including the Head of Public Policy and Corporate Responsibility, the Group Head of Sustainability, the Group Head of Sustainable and Transition Finance, and the Head of Legal, Public Policy and Corporate Responsibility. Role of the Committee The role of the Committee is to provide oversight of climate matters and the sustainability agenda, and in particular to: • support and advise the Board on its oversight of climate and sustainability matters relating to (i) the services and products provided to Barclays’ clients and customers, (ii) particular sectors, and (iii) its own corporate activities • support the Board in monitoring the implementation of the Group’s climate and sustainability strategy • review and make recommendations to the Board on the suitability of the Group’s climate and sustainability strategy, position statements, frameworks, ambitions, metrics, and targets • report to the Board on the climate and sustainability matters for which it is responsible, escalating issues and making recommendations to the Board where appropriate. The Committee’s terms of reference are available at home.barclays/who-we-are/ our-governance/board-committees/ Primary activities The Committee’s key areas of focus in 2024 are outlined below. Climate and sustainability strategy The Committee: • Oversaw developments in our Sustainable Finance Strategy, which saw continued progress toward our Sustainable and Transition Financing target. • Reviewed the strategic considerations emerging from the development of the Transition Plan. • Examined the potential market barriers in relation to client transitions, and policy changes required to enable a better client transition aligned to a goal of 1.5C. • Received updates on the energy related sections of Barclays’ Climate Change Statement, including the planned updates to that statement and the impact of those updates. • Received updates from management on opportunities to make further progress on achieving 2030 financed emissions targets, considering financial impacts, risks and actions required for real world transition. Investor feedback The Committee considered investor feedback and the perspectives of both our institutional investors as well as our retail shareholder base. During the year, members of the Committee engaged with institutional investors on climate-related matters, helping inform the development of our climate strategy. Human rights The Committee: • Recommended an updated Barclays Group Statement on Human Rights to the Board for approval, outlining our commitment and approach to respecting human rights. • Received an external briefing on business, human rights and the financial sector to support the Committee’s understanding of relevant frameworks and responsibilities. • Received an update on the establishment of a Group-wide human rights programme and plans to make progress in key areas across the Group. Areas of focus Conclusion/action taken Strategy Shareholder information Climate and sustainability report Risk review Financial review Financial statements Barclays PLC 2024 Annual Report on Form 20-F 103Governance Directors’ report: Board Sustainability Committee report (continued) See the Board Audit Committee report from page 86. See the Board Risk Committee report from page 95. See the Board Sustainability Committee report from page 101. See the Remuneration report from page 112.
Reporting against the Code's principles and provisions As Barclays PLC is listed on the London Stock Exchange, the principles and provisions of the Code apply, a copy of which can be found at frc.org.uk For the year ended 31 December 2024, and as at the date of this report, we are pleased to confirm that Barclays PLC has complied in full with the requirements of the Code. This section and our Board Governance report sets out how we complied with the Code in 2024. By virtue of the information included in the Annual Report, we comply with the corporate governance statement requirements of the FCA’s Disclosure and Transparency Rules (DTRs). The information required to be disclosed pursuant to DTR 7.2.6 is located on pages 106 to 111. Information in relation to the Board Diversity and Inclusion Policy, as required to be disclosed pursuant to DTR 7.2.8A, can be found on pages 77 to 78. Barclays is permitted by NYSE rules to follow UK corporate governance practices instead of those applied in the US. Any significant variations must be explained in Barclays PLC's Annual Report on Form 20-F filing. The way in which Barclays has applied the principles and provisions of the Code during 2024 is summarised below and on the next page. Board Leadership and Company Purpose Our Board governance is designed to deliver an effective and entrepreneurial Board, which discharges its role effectively and efficiently. Details can be found on pages 69 to 70, including our Group-wide governance framework and the Board's responsibilities. Key Board activities for 2024 are set out on pages 72 to 74. The Board is fully supportive of The Barclays Way, which sets out our Purpose, Values and Mindset, and is our Code of Conduct, providing a path for achieving a dynamic and positive culture in the Group. Refer to page 181 for further detail. Our Group Whistleblowing Standard enables colleagues to raise any matters of concern anonymously and is embedded into our business. Further information can be found on page 182. Throughout 2024, we engaged with our stakeholders through a variety of means. Examples of Board member engagement with stakeholders during 2024 can be found on page 72. Division of Responsibility The majority of the Board comprises independent Non-Executive Directors. The Group Chairman and Group Company Secretary work in collaboration to ensure an effective and efficient Board, as further described in Our governance framework from page 70. All Directors have access to the advice of the Group Company Secretary. The roles of Chair, Group Chief Executive, SID and Non-Executive Directors are defined within the Barclays Charter of Expectations, along with the behaviours and competencies for each role, as outlined on page 71. Directors are expected to commit sufficient time to ensure they can discharge their obligations to Barclays effectively, as detailed in our Board Nominations Committee report on page 80. The Board is responsible for setting the strategy for the Group. The day-to-day management of the Group is delegated by the Board to the Group Chief Executive who is supported by his ExCo, the composition of which is outlined on page 68. Details of the number of meetings of the Board and its Committees, and the individual attendance by Directors, can be found in Our governance framework on page 71 and in each respective Board Committee report. Composition, Succession and Evaluation All Board and senior management appointments are based on merit and objective criteria, which focus on the skills, experience and diversity of thought required for the Board's effectiveness and the delivery of the Group's strategy. A revised Board Diversity and Inclusion Policy was adopted in February 2024. In December 2024, the Board reaffirmed the gender and ethnic diversity targets set out in the Policy for 2025. For further detail on the Board Diversity and Inclusion Policy, refer to the Board Nominations Committee report on page 78. Board appointments are made following a rigorous and transparent process facilitated by the Board Nominations Committee, with the aid of external search consultancy firms. All Directors are subject to annual re-election at the AGM. See page 106 for further detail. Each year, an effectiveness review is carried out on the performance of the Board, Board Committees and individual Directors. In line with the Code, an externally-facilitated review was conducted for 2024. Refer to the Board Nominations Committee report from page 83 for details of the 2024 effectiveness review as well as progress against the findings from the internally facilitated Board review for 2023. Strategy Shareholder information Climate and sustainability report Risk review Financial review Financial statements Barclays PLC 2024 Annual Report on Form 20-F 104Governance Directors’ report: How we comply
Audit, Risk and Internal Control Remuneration The Board, together with the Board Audit Committee, is responsible for ensuring the integrity of this Annual Report and that the financial statements as a whole present a fair, balanced and understandable assessment of Barclays' performance, position and prospects. The Board, together with the Board Audit Committee, is responsible for ensuring the independence and effectiveness of the internal audit function and external auditors. The Directors are responsible for ensuring that management maintains an effective system of risk management and internal control and for assessing its effectiveness. Such a system is designed to identify, evaluate and manage, rather than eliminate, the risk of failure to achieve business objectives and can only provide reasonable, and not absolute, assurance against material misstatement or loss. Processes are in place for identifying, evaluating and managing the principal risks facing the Group. A key component of The Barclays Guide is the ERMF. The purpose of the ERMF is to identify and set minimum requirements of the main risks to the strategic objectives of the Group. The Group is committed to operating within a strong system of internal control. The Barclays Guide contains the overarching framework setting out the approach of the Group to internal governance. Effectiveness of risk management and internal controls is reviewed regularly by the Board Risk Committee (responsible for overseeing the ERMF and current and potential future risk exposures) and the Board Audit Committee (responsible for evaluating the effectiveness of internal controls). Key controls are assessed on a regular basis for both design and operating effectiveness. Issues arising out of these assessments, where appropriate, are reported to the Board Audit Committee. The Board Audit Committee is supported in its review of internal controls by the assurance conducted by BIA and KPMG. The Board Audit Committee oversees the control environment (and remediation of related issues). It also reviews annually the risk management and internal control system. The Board Audit Committee has concluded that throughout the year ended 31 December 2024 and to date, the Group has operated an effective system of internal control that provides reasonable assurance of financial and operational controls and compliance with laws, rules and regulations. You can read more about the Board Audit Committee and its work, including its oversight of the internal control framework and areas of ongoing enhancement, from page 86. The Remuneration report from page 112 sets out the purpose and activities of the Board Remuneration Committee, the remuneration policy for the Executive Directors and how it is aligned with the policy for the wider workforce, as well as the Directors’ remuneration outcomes for 2024. The remuneration policies and procedures support the Group's strategy and enable us to reward sustainable performance, which is a key element of our Remuneration Philosophy, in line with our Values, Mindset and risk expectations. All Executive Director and senior management remuneration policies are developed in accordance with the Group's formal and transparent procedures (ensuring that no Director is involved in deciding their own remuneration outcomes) and are, where possible, aligned to wider workforce policies. Board Remuneration Committee members exercise independent judgement and discretion when determining remuneration outcomes, considering the company and individual performance, wider workforce and other relevant stakeholder considerations. We also note the release by the Financial Reporting Council (FRC) of the revised UK Corporate Governance Code 2024 (the 2024 Code), which will apply to financial years beginning on or after 1 January 2025. We will report against the 2024 Code, in accordance with the timeframes prescribed by the FRC. Strategy Shareholder information Climate and sustainability report Risk review Financial review Financial statements Barclays PLC 2024 Annual Report on Form 20-F 105Governance Directors’ report: How we comply (continued)
Other statutory and regulatory information The Directors present their report together with the audited accounts for the year ended 31 December 2024. Other information that is relevant to the Directors’ report, and which is incorporated by reference into this report, can be located as follows: Page Remuneration policy, including details of the remuneration of each Director and Directors’ interests in shares 122, 140, 161 to 163 Corporate Governance Statement 178 to179 Risk review 190 Disclosures required pursuant to Large and Medium-sized Companies and Groups (Accounts and Reports) Regulations 2008 as updated by Companies (Miscellaneous Reporting) Regulations 2018 can be found on the following pages: Page Engagement with employees (Sch. 7, Para 11 and 11A 2008/2018 Regs) 16 to 18 Engagement with suppliers, customers and others in a business relationship (Sch. 7, Para 11 B 2008/2018 Regs) 15, 19 and 176 to 180 Financial instruments (Sch. 7, para 6 2008 Regs) 385 Hedge accounting policy (Sch. 7, para 6 2008 Regs) 471 Disclosures required pursuant to Listing Rule 6.6.1R can be found on the following pages: Page Allotment for cash of equity securities 420 Waiver of dividends 106 Section 414A of the Companies Act 2006 requires the Directors to present a Strategic report in the Annual Report and Financial Statements. Profit and dividends Statutory profit after tax for 2024 was £6,356 m (2023: £5,323m, 2022: £5,973). The 2024 full year dividend of 5.5p per ordinary share will be paid on 4 April 2025 to shareholders whose names are on the Register of Members at the close of business on 28 February 2025. With the 2024 half year dividend totalling 2.9p per ordinary share, paid in September 2024, the total dividend for 2024 is 8.4p (2023: 8.00p) per ordinary share. The half year and full year dividends for 2024 amounted to £1,221m (2023: £1,210m). BPLC also completed share buy-back programmes during 2024, further details of which can be found later in this section. Shareholders may have their dividends reinvested in Barclays by joining the Barclays Dividend Reinvestment Plan (DRIP). Further details regarding the DRIP can be found at home.barclays/dividends and shareview.co.uk/info/drip The nominee company of certain Employee Benefit Trusts (EBTs) holding shares in Barclays in connection with the operation of our employee share plans has lodged evergreen dividend waivers on shares held by it that have not been allocated to employees. The total amount of dividends waived during the year ended 31 December 2024 was £8.4m (2023: £1.70m). Board of Directors The names of the current Directors of BPLC, along with their biographical details, are set out on pages 64 to 67 and are incorporated into this Directors’ report by reference. Changes to Directors during the year and up to the date of this report are set out below. Name Role Effective date Brian Shea Non- Executive Director Appointed 19 July 2024 Mohamed A. El-Erian Non- Executive Director Stepped down 31 August 2024 Diane Schueneman Non- Executive Director Stepped down 31 January 2025 Appointment and retirement of Directors The appointment and retirement of Directors is governed by our Articles, the Code, the Companies Act 2006 and related legislation. The Articles may be amended only by a special resolution of the shareholders. The Board has the power to appoint additional Directors or to fill a casual vacancy among the Directors and any Director so appointed holds office only until the next AGM and may offer themselves for re-election. The Code recommends that all directors of FTSE 350 companies should be subject to annual re- election. All Directors intend to offer themselves for election or re-election at the 2025 AGM. Directors’ indemnities Qualifying third party indemnity provisions (as defined by Section 234 of the Companies Act 2006) were in force during the course of the financial year ended 31 December 2024 for the benefit of the then Directors of the Company and the then Directors of certain of the Company's subsidiaries and, at the date of this report, are in force for the benefit of the Directors of the Company and the directors of certain of the Company's subsidiaries in relation to certain losses and liabilities which they may incur (or have incurred) in connection with their duties, powers or office. The Group also maintains Directors’ and Officers’ Liability Insurance which gives appropriate cover for legal action brought against its Directors. Qualifying pension scheme indemnity provisions (as defined by Section 235 of the Strategy Shareholder information Climate and sustainability report Risk review Financial review Financial statements Barclays PLC 2024 Annual Report on Form 20-F 106Governance Directors’ report: Other statutory and regulatory information
Companies Act 2006) were in force during the course of the financial year ended 31 December 2024 for the benefit of the then Directors, and at the date of this report are in force for the benefit of directors of Barclays Pension Funds Trustees Limited as trustee of the Barclays Bank UK Retirement Fund, and Barclays Executive Schemes Trustees Limited as Trustee of Barclays Capital International Pension Scheme (No.1) and Barclays PLC Funded Unapproved Retirement Benefits Scheme. The directors of the trustees are indemnified against liability incurred in connection with the trustees’ activities in relation to the Barclays Bank UK Retirement Fund, Barclays Capital International Pension Scheme (No.1) and Barclays PLC Funded Unapproved Retirement Benefits Scheme. Political donations The Group did not give any money for political purposes in the UK or outside the UK, nor did it make any political donations to political parties or other political organisations or to any independent election candidates, nor did it incur any political expenditure during the year. In accordance with the US Federal Election Campaign Act, Barclays provides administrative support to a federal Political Action Committee (PAC) in the US, funded by the voluntary political contributions of eligible employees. The PAC is not controlled or funded by Barclays and all decisions regarding the amounts and recipients of contributions are directed by a steering committee comprising employees eligible to contribute to the PAC. Contributions to political organisations reported by the PAC during the calendar year 2024 totalled $75,000 (2023: $60,159). Country-by-Country reporting The Capital Requirements (Country-by- Country reporting) Regulations 2013 require the Company to publish additional information in respect of the year ended 31 December 2024. This information is included in the Barclays Country Snapshot available on the Barclays website: home.barclays/ annualreport Support for candidates and colleagues with disabilities and long-term conditions Barclays' commitment to inclusion means we want to ensure that candidates with disabilities and long-term health conditions receive support and adjustments in the application process and beyond. Barclays welcomes applications from all candidates and is committed to ensuring reasonable adjustments (accommodations) are put in place to ensure a fair and inclusive candidate experience. Barclays is committed to providing all colleagues with the support and tools they need to have a productive and fulfilling career. We can consider making adjustments to remove or reduce barriers colleagues might face if they have a disability, health concern or mental health condition. We also ensure opportunities for training, career development and promotion are available to all. Research and development In the ordinary course of business, the Group develops new products and services in each of its business divisions. Greenhouse gas emissions, energy consumption and energy efficiency action Although financing activities account for the greatest proportion of our climate impact, we have also continued to address our operational emissions – an important factor in meeting our ambition to be a net zero bank by 2050. Decarbonising our operations can have substantial benefits for Barclays including cost savings, greater operational resilience, potential commercial opportunities, and strengthening relationships with clients and Third Party Service Providers (TPSPs)1. Progress to date We have set milestones2 and targets3 to support our progress towards net zero operations. In 2024 we continued to track ahead of our milestone to reduce by 50% our absolute Scope 1 and 2 location-based GHG emissions by the end of 2030 – reducing these emissions by 56% against a 2018 baseline. This reduction is driven by ongoing work across our global real estate portfolio4, including energy demand reduction for example by right-sizing5 our real estate and by improving our real estate's energy efficiency through our energy optimisation programme, and by our progress with our company cars electrification. These measures build on those taken during 2023 to implement our net zero operations strategy. Further information is available on page 186 of the Barclays PLC Annual Report 2023. Also, an external contributor to our Scope 2 location-based emissions reduction was the decarbonisation of some of the electricity grids in the countries in which we have operational presence. In 2024 we continued to source 100% renewable electricity6 for our global real estate portfolio ahead of our 2025 year end target and continued to track ahead of our target of 90% absolute reduction of our Scope 1 and 2 market-based emissions against 2018 baseline – reducing these emissions by 95%. Our focus on renewable electricity sourcing helped us maintain this target performance. Our progress against our net zero operations milestones and targets is likely to be volatile and non-linear, due to our dependencies on broader industry and external factors. For example, dependencies on low-carbon technology developments and their market adoption, electricity grid decarbonisation as well as key policy and regulatory changes in the markets where we and our TPSPs operate. Our progress may also be impacted by internal management decisions based on key drivers unrelated to climate, for example prudent risk management practices. We will aim to continue to evaluate and evolve our strategic levers of decarbonisation taking into consideration key external factors and internal management decisions. We have disclosed global GHG emissions and energy use data as required by the Large and Medium-sized Companies and Groups (Accounts and Reports) Regulations 2008. . We also provide insights on our annual waste production, energy, water consumption and renewable electricity consumption by region. For further information about Barclays’ net zero operations strategy, see page 74 of the Barclays PLC Annual Report 2024. Notes: 1 TPSP means any entity that has entered an arrangement with Barclays in order to provide business functions, activities, goods and/or services to Barclays 2 In this section, a reference to a 'milestone' denotes an indicator we are working towards and report against. 3 In this section, a reference to a “target” denotes an indicator linked to our executive remuneration. 4 In this section a reference to global real estate portfolio includes offices, branches, campuses and data centres within our operational control. 5 In this section when referencing right-sizing, we are exercising opportunities through lease events or by way of negotiation to alter the square footage of an existing occupation to optimise our space and associated resources for our operational requirements in that location. 6 We maintained 100% renewable electricity sourcing for our global real estate portfolio through instruments including green tariffs (16%), energy attribute certificates (EACs)(48%), and energy attribute certificates from power purchase agreement (PPA) (36%). Green tariffs are programmes in regulated electricity markets offered by utilities, allowing large commercial and industrial customers to buy bundled renewable electricity from a specific project through a special utility tariff rate. Energy attribute certificates are the official documentation to prove renewable energy procurement. Each EAC represents proof that 1 MWh of renewable energy has been produced and added to the grid. Global EAC standards for renewable claims are primarily Guarantees of Origin in Europe and UK, Renewable Energy Certificates (RECs) in North America and International RECs (I-RECs) in a growing number of countries in Asia, Africa, the Middle East and Latin America. Strategy Shareholder information Climate and sustainability report Risk review Financial review Financial statements Barclays PLC 2024 Annual Report on Form 20-F 107Governance Directors’ report: Other statutory and regulatory information (continued)
GHG Emissions Table and Notes Current Reporting Year 20241 Previous Reporting Year 2023 UK & Offshore Area Global GHG Emissions UK & Offshore Area Global GHG Emissions Group Operational GHG Emissions2 (tCO2e) Total3 Scope 1, Scope 2 location-based, Scope 3 operational GHG emissions (000' tonnes) 124.9 271.7 91.6 183.4 Scope 1 CO2e emissions (000' tonnes)4 3.6 8.9 9.4 15.3 Scope 2 location-based CO2e emissions (000' tonnes)5 32.0 84.8 35.7 86.5 Scope 3 CO2e emissions (000' tonnes)6 89.3 177.9 46.5 81.6 Category 3 fuel and energy-related activities CO2e emissions (000' tonnes) 11.0 11.3 12.9 13.4 Category 5 waste generated in operations CO2e emissions (000' tonnes) 0.09 0.21 0.19 0.36 Category 6 business travel CO2e emissions (000' tonnes) 18.6 45.3 15.3 39.5 Category 7 employee commute CO2e emissions (000' tonnes)7 41.7 92.8 — — Category 8 upstream leased assets CO2e emissions (000' tonnes) 18.1 27.5 18.1 27.7 Category 13 downstream leased assets CO2e emissions (000' tonnes) 0 0.77 0 0.72 Energy consumption used to calculate operational GHG emissions (MWh)8 172,213 337,388 208,564 372,489 Intensity Ratio Total Full-Time Employees (FTE) 43,421 91,500 45,300 92,900 Total CO2e per FTE (tonnes)9 2.88 2.97 2.02 1.97 Market-based emissions10 Scope 2 market-based CO2e emissions (000' tonnes) 0 1.8 0 1.6 Total Scope 14 and 2 market-based CO2e emissions (000' tonnes) 3.6 10.7 9.4 16.9 Notes: 1 The carbon reporting year for our GHG emissions is 1 October to 30 September. The carbon reporting year is not fully aligned to the financial reporting year covered by this Directors’ report. 2 The methodology used to calculate our GHG emissions follows the 'Greenhouse Gas Protocol (GHG): A Corporate Accounting and Reporting Standard (Revised Edition)', defined by the World Resources Institute/World Business Council for Sustainable Development. We have adopted the operational control approach to define our reporting boundary. For 2024, we have applied the latest emission factors as of 31 December 2024. 3 In this section, our total accounted operational GHG emissions include Scope 1, Scope 2 (location-based) and scope 3 category 3, 5-8 and 13. In 2024, we expanded our operational GHG emissions coverage to include an estimate of our global employee commute emissions (see footnote 7). As a result our operational emissions figures will show an increase year on year. 4 Scope 1 emissions include our direct GHG emissions from natural gas, diesel, company cars and HFC refrigerants. In the case of company-owned vehicles, emissions are limited to UK vehicles only as this is the only country in which expense data is available. Scope 1 GHG emissions have reduced in FY2024 as we are using primary data to calculate Scope 1 fugitives for the UK compared to estimates in FY2023. 5 Scope 2 GHG emissions include our indirect GHG emissions from purchased electricity, purchased heat, cooling and steam. For our FY2024 emissions portfolio we have re-categorised a portion of our Scope 2 emissions to Scope 3 Category 8 (Upstream Leased Assets) as these emissions have been identified as outside of our operation control. This has resulted in minor updates to FY2023 Scope 2 location-based GHG emissions (a change from 87,197 tCO2e to 86,543 tCO2e). 6 Scope 3 category 1, 2 and 4 emissions are excluded as these emissions cannot be broken down by country. In 2024, we expanded our operational GHG emissions coverage to include an estimate of our global employee commute emissions (see footnote 7). As a result our operational emissions figures will show an increase year on year. 7 In 2024, we expanded our operational GHG emissions coverage to include an estimate of our global employee commute emissions. Our employee commute emissions accounting approach aligns to the GHG Protocol Corporate Standard guidance. Employee commute includes emissions from the transportation of employees between their homes and their worksites and those from teleworking (working from home). We estimate these emissions by using various data sources including survey data on Barclays employees' commuting habits. 8 Energy consumption data is captured through utility billing; meter reads or estimates. Principal measures we have undertaken in 2024 to improve energy efficiency include the following: • Right-sized our global real estate portfolio, therefore optimising our space and associated resources for our operational needs. • Expanded our energy optimisation programme from UK to global sites. The programme aims to reduce energy demand of existing infrastructure during periods of low or no occupancy and to increase energy efficiency during normal operating hours, contributing in 2024 to approximately 8.26 GWh in energy savings at our corporate offices and 0.33 GWh at our retail branches. Further information about our energy efficiency measures is available on page 32 of the Barclays PLC Annual Report 2024. 9 Intensity ratio calculations have been calculated using total accounted operational GHG emissions as reported in footnote 3. In 2024, we expanded our operational GHG emissions coverage to include an estimate of our global employee commute emissions (see footnote 7). As a result our operational emissions intensity figures will show an increase year on year. 10 For Scope 2 market-based emissions we have used a zero emission factor where we have green tariffs or energy attribute certificates in place globally. Share capital Share capital structure The Company has ordinary shares in issue. The Company’s Articles also allow for the issuance of sterling, US dollar, euro and yen preference shares (preference shares). No preference shares have been issued as at 11 February 2025 (the latest practicable date for inclusion in this report). Ordinary shares therefore represent 100% of the total issued share capital as at 31 December 2024 and as at 11 February 2025 (the latest practicable date for inclusion in this report). Details of the movement in ordinary share capital during the year can be found in Note 27 to the financial statements. The rights and obligations attaching to the Company's ordinary shares and preference shares are set out in the Company's Articles, a copy of which is available on the Company's website at home.barclays/corporategovernance Voting Every member who is present in person or represented at any general meeting of the Company, and who is entitled to vote, has one vote on a show of hands. Every proxy present has one vote on a show of hands. The proxy will have one vote for, and one vote against, a resolution if they have been instructed to vote for, or against, the resolution by different members or in one direction by a member while another member has permitted the proxy discretion as to how to vote. On a poll, every member who is present in person or by proxy and who is entitled to vote has one vote for every share held. In the case of joint holders, only the vote of the senior holder (as determined by the order in the share register) or their proxy may be counted. If any sum payable Strategy Shareholder information Climate and sustainability report Risk review Financial review Financial statements Barclays PLC 2024 Annual Report on Form 20-F 108Governance Directors’ report: Other statutory and regulatory information (continued)
remains unpaid in relation to a member’s shareholding, that member is not entitled to vote that share or exercise any other right in relation to a meeting of the Company unless the Board otherwise determines. If any member, or any other person appearing to be interested in any of the Company’s ordinary shares, is served with a notice under Section 793 of the Companies Act 2006 and does not supply the Company with the information required in the notice, then the Board, in its absolute discretion, may direct that that member shall not be entitled to attend or vote at any meeting of the Company. The Board may further direct that, if the shares of the defaulting member represent 0.25% or more of the issued shares of the relevant class, dividends or other monies payable on those shares shall be retained by the Company until the direction ceases to have effect and no transfer of those shares shall be registered (other than certain specified ‘excepted transfers’). A direction ceases to have effect seven days after the Company has received the information requested, or when the Company is notified that an excepted transfer of all of the relevant shares to a third party has occurred, or as the Board otherwise determines. Transfers Ordinary shares may be held in either certificated or uncertificated form. Certificated ordinary shares may be transferred in writing in any usual or other form approved by the Group Company Secretary and executed by or on behalf of the transferor. Transfers of uncertificated ordinary shares must be made in accordance with the Companies Act 2006 and the CREST Regulations. The Board is not bound to register a transfer of partly paid ordinary shares or fully paid shares in exceptional circumstances approved by the FCA. The Board may also decline to register an instrument of transfer of certificated ordinary shares unless (i) it is duly stamped, deposited at the prescribed place and accompanied by the share certificate(s) and such other evidence as reasonably required by the Board to evidence right to transfer, (ii) it is in respect of one class of shares only, and (iii) it is in favour of a single transferee or not more than four joint transferees (except in the case of executors or trustees of a member). The Company is not aware of any agreements between holders of securities that may result in restrictions on the transfer of securities or voting rights. Variation of rights The rights attached to any class of shares may be varied either with the consent in writing of the holders of at least 75% in nominal value of the issued shares of that class, or with the sanction of a special resolution passed at a separate meeting of the holders of the shares of that class. The rights of shares shall not (unless expressly provided by the rights attached to such shares) be deemed varied by the creation of further shares ranking equally with them or subsequent to them. Limitations on foreign shareholders There are no restrictions imposed by the Articles or (subject to the effect of any economic sanctions that may be in force from time to time) by current UK laws which relate only to non-residents of the UK and which limit the rights of such non- residents to hold or (when entitled to do so) vote the ordinary shares. Exercisability of rights under an employee share scheme EBTs operate in connection with certain of the Group’s Employee Share Plans (Plans). The trustees of the EBTs may exercise all rights attached to the shares in accordance with their fiduciary duties, other than as specifically restricted in the documents governing the Plans. The trustees of the EBTs have informed the Company that their normal policy is to abstain from voting in respect of the Barclays shares held in trust. The trustees of the Global Sharepurchase EBT and UK Sharepurchase EBT may vote in respect of Barclays shares held in the EBTs, but only as instructed by participants in those Plans in respect of their partnership shares and (when vested) matching and dividend shares. The trustees will not otherwise vote in respect of shares held in the Sharepurchase EBTs. Special rights There are no persons holding securities that carry special rights with regard to the control of the Company. Major shareholders Major shareholders do not have different voting rights from those of other shareholders. Information provided to the Company by substantial shareholders (holding voting rights of 3% or more in the financial instruments of the Company) pursuant to the DTRs are published via a Regulatory Information Service and is available on the Company’s website. As at 31 December 2024, the Company had been notified under Rule 5 of the DTRs of the following holdings of voting rights in its shares. Between 31 December 2024 and 11 February 2025 (the latest practicable date for inclusion in this report), the Company has not received any additional notifications pursuant to Rule 5 of the DTRs. Person interested Number of Barclays Shares % of total voting rights attaching to issued share capital1 Nature of holding (direct or indirect) BlackRock, Inc.2 944,022,209 5.78 indirect Notes: 1 The percentage of voting rights detailed above was calculated at the time of the relevant disclosures made in accordance with Rule 5 of the DTRs. 2 Total shown includes 6,687,206 contracts for difference to which voting rights are attached. Part of the holding is held as American Depositary Receipts. Strategy Shareholder information Climate and sustainability report Risk review Financial review Financial statements Barclays PLC 2024 Annual Report on Form 20-F 109Governance Directors’ report: Other statutory and regulatory information (continued)
Powers of Directors to issue and allot or buy back the Company’s shares The powers of the Directors are determined by the Companies Act 2006 and the Company’s Articles. The Directors are authorised to issue and allot shares and to buy back shares subject to, and on the terms of, the annual shareholder approval at the AGM. Such authorities were granted by shareholders at the 2024 AGM. It will be proposed at the 2025 AGM that the Directors be granted new authorities to issue and allot and buy back shares. Repurchase of shares On 21 February 2024 and 5 August 2024 the Company commenced share buy-back programmes to purchase its ordinary shares of £0.25p each up a maximum consideration of £1bn and £750m, respectively. The first share buy-back programme concluded on 30 July 2024 and the second share buy-back programme concluded on 5 December 2024. The Company repurchased for cancellation 497,923,138 ordinary shares at a volume weighted average price of 200.8342 pence per ordinary share during the first buy-back programme and 320,247,475 ordinary shares at a volume weighted average price of 234.1939 pence per ordinary share during the second buy- back programme. The purpose of the buy- back programmes was to reduce the Company’s number of outstanding ordinary shares. In aggregate, the Company purchased 818,170,613 ordinary shares during 2024 with an aggregate nominal value of approximately £205m (this represented approximately 5.7% of the Company's issued share capital as at 31 December 2024) for an aggregate consideration of £1,750m excluding taxes and expenses. All of the repurchased ordinary shares have been cancelled. No further shares have been repurchased since the completion of the second share buy-back programme on 5 December 2024. The maximum number of ordinary shares which could be repurchased by the Company as part of any share buy-back under the authority for on-market share buy-backs granted at the 2024 AGM is 1,192,639,429 ordinary shares (being 1,512,886,904 less the 320,247,475 shares repurchased as part of the second share buy-back programme). Distributable reserves As at 31 December 2024, the distributable reserves of the Company were £20,866m (2023: £21,162m). Change of control There are no significant agreements to which the Company is a party that take effect, alter or terminate on a change of control of the Company following a takeover bid. There are no agreements between the Company and its Directors or employees providing for compensation for loss of office or employment that occurs because of a takeover bid. Controls over financial reporting A framework of disclosure controls and procedures is in place to support the approval of the financial statements of the Group. Specific governance committees are responsible for examining the financial reports and disclosures to help ensure that they have been subject to adequate verification and comply with applicable standards and legislation. Where appropriate, these committees report their conclusions to the Board Audit Committee, which debates such conclusions and provides further challenge. Finally, the Board scrutinises and approves results announcements and the Annual Report to ensure that appropriate disclosures have been made. This governance process is designed to ensure that both management and the Board are given sufficient opportunity to debate and challenge the financial statements of the Group and other significant disclosures before they are made public. Management’s report on internal control over financial reporting Management is responsible for establishing and maintaining adequate internal control over financial reporting under the supervision of the principal executive and financial officers, to provide reasonable assurance regarding the reliability of financial reporting and the preparation of financial statements, in accordance with (a) UK-adopted international accounting standards; and (b) International Financial Reporting Standards (IFRS) as issued by the International Accounting Standards Board (IASB), including interpretations issued by the IFRS Interpretations Committee. Internal control over financial reporting includes policies and procedures that pertain to the maintenance of records that, in reasonable detail: • accurately and fairly reflect transactions and dispositions of assets • provide reasonable assurances that transactions are recorded as necessary to permit preparation of financial statements in accordance with UK- adopted international accounting standards and IFRS and that receipts and expenditures are being made only in accordance with authorisations of management and the respective Directors • provide reasonable assurance regarding prevention or timely detection of unauthorised acquisition, use or disposition of assets that could have a material effect on the financial statements. Internal control systems, no matter how well designed, have inherent limitations and may not prevent or detect misstatements. Also, projections of any evaluation of effectiveness to future periods are subject to the risk that internal control over financial reporting may become inadequate because of changes in conditions or that the degree of compliance with the policies or procedures may deteriorate. Management has assessed internal control over financial reporting as at 31 December 2024. In making its assessment, management utilised the criteria set out in the 2013 COSO framework. Management has concluded that, based on its assessment, internal control over financial reporting was effective as at 31 December 2024. Management’s assessment of, and conclusion on, the effectiveness of internal control over financial reporting did not include internal controls relating to the retail banking business of Tesco which was acquired on 1 November 2024. These businesses have been included in Barclays consolidated financial statements for the year ended 31 December 2024. The businesses represented approximately 0.4% of the group income and 0.7% of the total assets of Barclays for the year ended 31 December 2024. Strategy Shareholder information Climate and sustainability report Risk review Financial review Financial statements Barclays PLC 2024 Annual Report on Form 20-F 110Governance Directors’ report: Other statutory and regulatory information (continued)
The system of internal financial and operational controls is also subject to regulatory oversight in the UK and overseas. Further information on supervision by financial services regulators is provided under Supervision and Regulation in the Risk review section on pages 308 to 320 Changes in internal control over financial reporting There have been no changes that occurred during the period covered by this report, which have materially affected or are reasonably likely to materially affect the Group’s internal control over financial reporting. Preparation of accounts and audit report Disclosure of information to the auditor Each Director confirms that, so far as he/ she is aware, there is no relevant audit information of which our auditor is unaware and that each of the Directors has taken all the steps that he/she ought to have taken as a Director to make himself/herself aware of any relevant audit information and to establish that our auditor is aware of that information. This confirmation is given pursuant to Section 418 of the Companies Act 2006 and should be interpreted in accordance with, and subject to, those provisions. Directors’ responsibilities The following statement, which should be read in conjunction with the Auditor’s report set out on pages 353 to 355, is made with a view to distinguishing for shareholders the respective responsibilities of the Directors and of the auditor in relation to the accounts. Going concern The Group’s business activities and factors likely to affect its future development and performance are disclosed in the Strategy and Risk review sections of this report. The financial performance is disclosed within the Financial review with funding, liquidity and capital details contained within the Risk performance section. The Group’s objectives and policies in managing the financial risks to which it is exposed are discussed in the Risk management section. The Directors considered it appropriate to prepare the financial statements on a going concern basis. In preparing each of the Group and company financial statements, the Directors are required to: • assess the Group and Company’s ability to continue as a going concern, disclosing, as applicable, matters related to going concern • use the going concern basis of accounting unless they either intend to liquidate the Group or the Parent company or to cease operations, or have no realistic alternative but to do so. Preparation of accounts The Directors are required by the Companies Act 2006 to prepare Group and Company accounts for each financial year and, with regard to Group accounts, in accordance with UK-adopted international accounting standards. The Directors have prepared these accounts in accordance with (a) UK-adopted international accounting standards; and (b) IFRS as issued by the IASB, including interpretations issued by the IFRS Interpretations Committee. Pursuant to the Companies Act 2006, the Directors must not approve the accounts unless they are satisfied that they give a true and fair view of the state of affairs of the Group and the Company and of their profit or loss for that period. The Directors consider that, in preparing the financial statements, the Group and the Company have used appropriate accounting policies, supported by reasonable judgements and estimates, and that all accounting standards which they consider to be applicable have been followed. The Directors are satisfied that the Annual Report and financial statements, taken as a whole, are fair, balanced and understandable, and provide the information necessary for shareholders to assess the Group and Company’s position and performance, business model and strategy. The Directors are responsible for such internal controls as they determine are necessary to enable the preparation of financial statements that are free from material misstatement, whether due to fraud or error. Auditor’s report The Auditor’s report on the Financial Statements of Barclays PLC for the year ended 31 December 2024 was unmodified and its statement under Section 496 of the Companies Act 2006 was also unmodified. By order of the Board Hannah Ellwood Group Company Secretary 12 February 2025 Registered in England. Company No. 48839 Registered office: 1 Churchill Place, London E14 5HP Strategy Shareholder information Climate and sustainability report Risk review Financial review Financial statements Barclays PLC 2024 Annual Report on Form 20-F 111Governance Directors’ report: Other statutory and regulatory information (continued)
Annual statement from the Chair of the Board Remuneration Committee Board Remuneration Committee Brian Gilvary Chair, Board Remuneration Committee Committee membership and meeting attendance during 20241,2 Member Meetings attended/eligible to attend Brian Gilvary 8/8 Dawn Fitzpatrick 7/8 Mary Francis 8/8 Sir John Kingman 8/8 Julia Wilson 8/8 Notes: 1 There were five scheduled meetings and three ad hoc meetings of the Committee in 2024. Owing to a prior commitment, Dawn Fitzpatrick was unable to attend one ad hoc meeting of the Committee. 2 Nigel Higgins was appointed to the Committee on 31 January 2025. He regularly attended meetings of the Committee during 2024. Contents Annual statement 112 Executive Director remuneration outcomes at a glance 116 Wider workforce remuneration 118 Directors’ Remuneration Policy 124 Annual report on Directors’ remuneration 140 Dear Fellow Shareholders On behalf of the Board, I am pleased to present the Remuneration report for 2024. As the Group Chief Executive set out in his review, in February 2024 we delivered our Investor Update, setting out a three-year plan to make Barclays Simpler, Better and More balanced, and we are encouraged by the progress we have made so far. It is against this backdrop that the Committee made its remuneration decisions for 2024, focused on rewarding sustainable performance as we are every year, taking into account delivery against our financial and non-financial targets, as well as the views and experiences of our stakeholders. Review of our bonus cap for Material Risk Takers (MRTs) Regulatory changes in October 2023 removed the requirement for UK banks to set the maximum ratio of variable pay to fixed pay for their MRTs (‘bonus cap’) at no more than 2:1, instead allowing banks to set their own appropriate bonus caps. Following those changes, we put forward a resolution at our 2024 AGM to confirm Barclays' flexibility to determine its own bonus cap or caps, which received a 99.75% shareholder vote in favour. The Committee then considered the appropriate bonus cap to set for Barclays MRTs, and adopted a formal cap of 10:1, effective from performance-year 2024. The change in bonus cap does not alter the way that Barclays sets the incentive pool for colleagues, including MRTs, which is based on overall Group performance, adjusted for current and future risks. A 2:1 bonus cap continues to apply in certain Barclays businesses that are subject to ongoing EU regulations, which continue to mandate this. Directors' Remuneration Policy (DRP) review The pay structure and opportunity for our Executive Directors was not impacted by the move to a 10:1 bonus cap, as their pay is governed by the Directors’ Remuneration Policy (‘DRP’) that was approved by shareholders at the 2023 AGM, to apply for a maximum of three years. However, the removal of the bonus cap affords us additional flexibility in how we structure Executive Director pay. In that context, the Committee carried out a detailed DRP review during 2024, which focused on two key areas: • Strengthening the alignment of pay with sustainable performance, and by doing so strengthening the alignment of interests between the Executive Directors and shareholders, as well as other stakeholders • Providing a pay opportunity for each Executive Director commensurate with their role, and competitive compared to similar roles within our international banking peers, reflecting Barclays’ scope and complexity. As a result, we are submitting a new DRP to shareholders for approval at our 2025 AGM, a year earlier than the current DRP is due to expire. In support of the new DRP, we will also propose a change to our existing Long Term Incentive Plan (LTIP) rules, to align the maximum that can be granted to an Executive Director under the LTIP to the maximum under the DRP. In carrying out this review, we engaged with shareholders representing c.60% of our register, on both the principles and the specifics of our proposals, to understand their perspectives and to factor those into our proposed DRP changes. The investment of time that our shareholders made, to listen to our thinking and share their views and feedback, was greatly appreciated. That shareholder feedback was invaluable, and our proposed DRP reflects their input, striking a balance across the relevant factors. Reflecting on that, the Committee considered a range of different options to achieve the objectives of the DRP review. We have detailed more of the context and rationale for the proposed DRP changes from page 124, and the full DRP is shown from page 130. The Committee believes that the proposed DRP is the right thing to do to support our strategy and the delivery of our three-year plan. We encourage shareholders to vote to approve the proposed new DRP and amendment to our LTIP rules at our 2025 AGM. For more details of our DRP review, including the context and rationale for our proposed changes, see page 124 Strategy Shareholder information Climate and sustainability report Risk review Financial review Financial statements Barclays PLC 2024 Annual Report on Form 20-F 112Governance Remuneration report
Performance in 2024 In 2024, we completed the first year of our three-year plan to create a higher returning, more strongly performing Barclays. We are pleased with the progress we have made. All five of our operating businesses delivered solid income performance, resulting in Group income of £26.8bn, up 6% on 2023. These results reflect our continued focus on the quality and stability of our income mix. We continued to invest in talent and technology while maintaining our focus on costs and delivering £1bn of efficiency savings across the Group. Our profit before tax was £8.1bn (2023: £6.6bn, or £7.5bn excluding structural cost actions of £927m taken in the fourth quarter), RoE was 9.1% and RoTE was 10.5%, achieving our greater-than-10% target for 20241. We ended the year with a CET1 ratio of 13.6%, within our target range of 13% to 14%. Capital distributions announced in relation to 2024 were £3.0bn, in line with our guidance of being flat on 2023. This includes £1.2bn of dividends, enabling a 5% increase in our dividend per share to 8.4 pence per share for 2024, and £1.75bn in buybacks. Each of our businesses contributed to this performance, and made headway in delivering against their business-specific objectives, which are the building blocks of our Group strategy. • In Barclays UK, we completed the acquisition of Tesco Bank and made meaningful progress in improving customer experience, reflected in customer satisfaction improvements across a range of metrics and a 36% reduction in the number of complaints. • The UK Corporate Bank achieved total loan growth of £1bn2, developing and improving products and services to better meet client needs, and improving client self-serve capabilities. • The Private Bank and Wealth Management business focused on improving the digital investing proposition, introducing more competitive pricing and simplifying customer journeys, improvements that contributed to over 58,000 customers choosing to open a Smart Investor account in 2024 – up 141% from 2023. • RoTE for the Investment Bank grew by 150bps to 8.5%3, reflecting growth in income from more stable sources and greater efficiency, together with stronger management of RWAs. • In the US Consumer Bank, while we made a strategic decision not to bid to become American Airlines' sole card issuer from 2026, we announced a new partnership with General Motors, and grew RoTE from 4.1% to 9.1%3 as impairment changes normalised and we proactively improved operational performance. During 2024, the management team has also continued to focus on strengthening our foundation and supporting the delivery of sustainable performance. In the second year of our Consistently Excellent change programme, we have taken further steps to ensure that delivering to a consistently excellent standard becomes part of our culture, through aligning objective setting, performance assessment, recognition systems and reward processes for all colleagues to the consistently excellent standard. In recognition of our colleagues’ collective efforts and achievements in 2024, and the continued delivery of our three-year plan, we are granting all our colleagues below the Managing Director level, excluding Material Risk Takers4, a one off award of 170 Barclays shares, which will need to be retained until after we announce our full- year 2026 results. This share award, worth around £5005 per participant, will reinforce the alignment of colleagues’ interests with those of our shareholders, and ensure more of our colleagues participate directly in the continued success of the Group. Colleague remuneration Alongside rewarding sustainable performance, our Fair Pay Agenda continues to underpin all our remuneration decisions – ensuring that we are paying colleagues fairly for the work they do and appropriately recognising the contributions of all. You can read more about our Fair Pay Agenda in the ‘Wider workforce remuneration’ section on page 118, and in our seventh Fair Pay Report (published alongside this Annual Report). We have also published pay gaps figures for employees in UK and Ireland. Find more about our approach to pay fairness in our Fair Pay Report 2024 at: home.barclays/annualreport Our UK pay gap figures for 2024 and narrative explaining them are at: home.barclays/diversity Note: 1 Management does not assess forward-looking “return on equity” (target RoE) as a performance indicator of the business, and therefore reconciliation of the forward-looking non-IFRS measure “return on tangible equity” (target RoTE) to an equivalent IFRS measure is not available without unreasonable efforts. 2 After adjusting for perimeter changes with International Corporate Bank. 3 Please refer to the "Non-IFRS performance measures" section of this Annual Report on Form 20-F for further information on and a reconciliation of the non-IFRS measure “return on tangible equity” against the most directly comparable IFRS measure. 4 Employees at Managing Director grade or who have been identified as Material Risk Takers are typically awarded Barclays shares as part of their deferred compensation. 5 At the 10 February 2025 mid market closing share price. Strategy Shareholder information Climate and sustainability report Risk review Financial review Financial statements Barclays PLC 2024 Annual Report on Form 20-F 113Governance Remuneration report (continued)
Paying at least a living wage to all our colleagues is a central element of our Fair Pay Agenda. We continue to ensure that we meet or exceed living wage benchmarks in every jurisdiction in which our employees are based. In the UK, we have further increased our minimum full- time equivalent salary to £25,000, which is, like in previous years, above the Living Wage Foundation’s benchmarks. In all other countries, we continue to meet or exceed the Fair Wage Network living wage benchmarks. In setting this year's incentive pool, the Committee considered Barclays’ financial and non-financial performance, and the performance of the individual businesses that make up the Group, in both absolute and relative terms. We considered each business's contribution to the achievement of our strategic targets and its importance to our future success. Taking all of this into account, the Committee has approved a Group incentive pool for 2024 performance of £1,914m (2023: £1,745m), up 10% year on year. This compares to profit before tax that is up 24%, or up 8% when last year’s fourth quarter structural cost actions of £927m are excluded from the 2023 figure. This level of incentive funding for 2024 reflects performance across the Group, enabling us to reward colleagues for the performance delivered – recognising the progress made against our three-year plan and our ambition to be consistently excellent in our operations. The incentive pool reduced in each of the previous two years, and as a result this 2024 incentive pool is broadly the same level as that for performance-year 2021. Over the same three-year period, performance has improved across a range of measures. The compensation to income ratio for 2024 is 32.7%, the lowest since 2015. As always, a significant portion of the pool will be delivered in shares, most of which will be deferred over a number of years. Executive Director remuneration Determining the Executive Directors' pay outcomes The Committee considered the Executive Directors’ annual bonus and LTIP outcomes in the context of the Group’s performance and the performance of each Executive Director during 2024. The 2024 annual bonus outcome for C.S. Venkatakrishnan (known as Venkat) was 81.0% of maximum, and for Anna Cross was 80.5% of maximum (2023: 53.3% for Venkat and 54.3% for Anna). Profit before tax provided a 40.1% outcome out of a possible 50%, and total operating expenses provided a 9.4% outcome out of a possible 10%. Performance against the strategic non-financial measures was good, which resulted in a 17.5% outcome out of a possible 25%. The performance of each of the Executive Directors against their personal objectives was also assessed and taken into account, recognising the strategic progress achieved over 2024 (14% for Venkat and 13.5% for Anna out of a possible 15% for each). The 2022-2024 LTIP is the first LTIP that Venkat was awarded following his appointment as Group Chief Executive and an Executive Director. Anna did not receive a 2022-2024 LTIP award as she was not an Executive Director at the time it was granted. The vesting outcome for Venkat’s 2022-2024 LTIP was 67.5%, reflecting average RoTE exceeding our target range, relative TSR performance between median and upper quartile, and good performance against the strategic non-financial measures. The value of the vesting LTIP has increased since it was awarded, due to the increase in the Barclays share price over that period. This accounts for 36% of the vesting LTIP value, or £1.852m. Over the same performance period, Barclays market capitalisation increased by £7.3bn and over £8bn was returned to shareholders through dividends and share buy-backs. The Committee also satisfied itself that this LTIP vesting did not constitute a 'windfall gain', as outlined on page 152. Before finalising those incentive outcomes, the Committee reflected on the appropriateness for both the 2024 annual bonus and 2022-2024 LTIP. We reviewed the underlying financial health of the Group, which is strong and well capitalised. We considered the bonus outcomes in the context of the bonus outcomes for the wider workforce, ensuring appropriate alignment both this year and over a multi-year period, and also compared to historical outcomes for the Executive Directors in the context of performance each year. We concluded that the outcomes are appropriate in the context of the performance achieved and that no discretionary adjustment was warranted. The single total figure for 2024 remuneration for the Group Chief Executive is 127% higher than the figure for 2023. The principal driver of that increase is Venkat's first LTIP vesting, including the impact of the share price growth since the award was granted. That LTIP value makes up almost 50% of this year's single total remuneration figure, and without it the single total remuneration figure would be up 16%. The Executive Directors' pay in 2025 As set out in more detail on page 127, the new DRP proposes changes to the structure of Executive Director pay. Under the new DRP, the Committee will reduce the fixed pay levels for each Executive Director – with the agreement of each – to around half their current fixed pay levels, at £1,590,000 for Venkat and £950,000 for Anna. As part of that change,‘Fixed Pay’ will be renamed ‘salary’ and be paid in cash, in line with industry norms across the UK. The new DRP sees a larger proportion of each Executive Director's total compensation opportunity delivered as variable pay, which will further strengthen the alignment of Executive Director and shareholder interests, and creates a stronger link between pay and performance. As part of this, the Committee has decided to defer granting awards under the 2025-2027 LTIP cycle until after the DRP has been considered by shareholders at the 2025 AGM, with the intention to grant 2025-2027 LTIP awards in line with the award level under the new policy. The levels of awards reflect strong performance in 2024, and each Executive Director’s personal contributions to that, and provide each with an incentive award subject to forward-looking performance conditions across 2025 to 2027. The Committee reviewed the measures in the 2025 annual bonus and 2025-2027 LTIP, taking into account the shareholder feedback received through the consultation on the DRP review, as well as the Group and business priorities announced at the Investor Update. Shareholders expressed a preference for: • A higher weighting to financial measures • Simpler and more-focused measures (both financial and non-financial) • Less overlap between the annual bonus and LTIP. Strategy Shareholder information Climate and sustainability report Risk review Financial review Financial statements Barclays PLC 2024 Annual Report on Form 20-F 114Governance Remuneration report (continued)
Reflecting on this, we made the decision to increase the minimum weightings for financial measures under the new DRP, from 60% to 65% for bonus and 70% to 75% for LTIP. We also reviewed the financial and non-financial performance measures in each plan, in support of our new DRP, to address shareholder feedback – and in doing so more directly incentivise the achievement of the targets and priorities set out under our three-year plan, and beyond. For the Executive Directors' 2025 annual bonus, we will focus on just two financial measures. PBT will be weighted 55%, as a key building block for RoTE (a key external target), alongside cost: income ratio weighted 10%. We will focus 20% of the bonus on strategic objectives, the key objectives for each Executive Director based on strategic priorities and milestones to further support progress towards the delivery of our three-year plan, in place of the personal objectives category that was weighted 15%. Those changes will be accommodated by a 10% reduction in the weighting to strategic non-financial KPIs, from 25% for 2024 to 15% for 2025. Progress on sustainability is best assessed over a multi- year period, and so sustainability measures have been removed from the annual bonus and will be assessed in the LTIP. The weighting of the Risk & operational excellence category in the bonus is reduced by 5%, with the final 10% of the bonus remaining focused on measures relating to Customers, clients & colleagues. For the 2025-2027 LTIP, we will support the higher opportunity under our new DRP with simplified financial and non-financial measures. 50% of the overall outcome will be determined based on RoTE performance, up from 30% in the previous LTIP cycle. This reflects the focus on improving RoTE within the Group’s external targets. A further 25% will depend on total shareholder return relative to a basket of other international banks, up from 20%. To accommodate those changes and focus the LTIP measures on our key external targets, cost: income ratio will be removed from the LTIP and instead be included in the bonus, and CET1 will be removed from the LTIP but will continue to be covered as an underpin to PBT in the annual bonus. The remaining 25% of the LTIP outcome will reflect longer-term strategic priorities relating to Sustainability, customers & clients. Shareholder alignment The proportion of the total variable pay awards to Venkat and Anna in respect of 2024 performance (2024 annual bonus plus 2025-2027 LTIP) that will be in shares is 90% and 89% respectively. Those shares must be retained for a period of between two and eight years from grant – aligning the Executive Directors' interests with those of our shareholders. Both Venkat and Anna already have significant shareholdings in excess of their respective shareholding requirements. Group Chair and Non-Executive Director fees The Committee reviews the Group Chair’s fee each year. At our most recent review, in the early part of 2025, the Committee observed that over time it had fallen significantly behind that paid across the other large UK-headquartered banking groups. The fee was last increased with effect from 1 January 2024, but prior to 2023 had not been increased since the start of 2016. As a result, we increased the fee for the Group Chair to £925,000 per annum, with effect from 1 January 2025, an 8% increase (with Nigel Higgins having recused himself from that discussion). From 1 January 2016 through to 1 January 2025, the compound annual fee increase equates to 1.6% per annum. The current DRP allows for increases of up to 20% during the policy’s three-year term, and this increase brings the total increase during the first two years of the policy’s term to 10%. In December 2024, the Board reviewed the other Non-Executive Directors’ fees, which were also last increased with effect from 1 January 2024. The Board approved an increase of 2%, which was also effective 1 January 2025 (with the relevant Non- Executive Directors having recused themselves from those discussions). Looking ahead As we move into 2025, the Committee maintains its commitment to rewarding sustainable performance. We confirmed Nigel Higgins, Group Chairman, as a member of the Committee on 31 January. Nigel regularly attended our meetings during 2024, adding to our decision making and enhancing the Committee's linkages into other Board and Committee activities, and his Committee membership formalises this. We welcome the PRA’s and FCA’s ‘Consultation Paper 16/24’ on proposed changes to the UK remuneration regulations for banks. We believe that the proposed changes complement the regulators’ removal of the 2:1 bonus cap in 2023, and would go some way to achieving the regulators’ objective to improve the competitiveness of UK banks. We will continue to engage with our shareholders and other stakeholders on pay. In particular, we will be available to meet with institutional shareholders, to discuss our proposed new DRP and pay outcomes for 2024, ahead of the 2025 AGM. We will continue to use our remuneration philosophy, policies and practices to incentivise the Executive Directors, the management team and employees to deliver against our plan to make Barclays Simpler, Better and More balanced, improve operational and financial performance, and by doing so improve shareholder returns. Beyond this, we will maintain focus on our Fair Pay Agenda, supporting colleagues and ensuring the way we pay supports the long-term health and success of the Group. Brian Gilvary Chair, Board Remuneration Committee February 2025 Strategy Shareholder information Climate and sustainability report Risk review Financial review Financial statements Barclays PLC 2024 Annual Report on Form 20-F 115Governance Remuneration report (continued)
At a glance – Executive Director remuneration for 2024 + + + = Total remuneration Total remuneration outcomes (£000)1 C.S. Venkatakrishnan (Group Chief Executive) 2024 Single total remuneration 2024 max 2024 actual 2023 actual 2,935 2,935 2,860 242 242 356 2,741 2,219 1,425 4,126 3,285 1,852 8,681 Total excluding share price appreciation 10,533 Total including share price appreciation Anna Cross (Group Finance Director) 2024 max 2024 actual 2023 actual 1,837 1,837 1,788 107 107 106 1,661 1,336 879 2,472 1 The LTIP values shown for C.S. Venkatakrishnan's and Anna Cross's 2023 actual total remuneration are nil as neither participated in the 2021-2023 LTIP cycle, and likewise Anna Cross's 2024 actual total remuneration as she did not participate in the 2022-2024 LTIP cycle. The LTIP value shown for C.S. Venkatakrishnan's 2024 actual remuneration includes the 2022-2024 LTIP vesting included in the single total figure for remuneration table. Of the total LTIP value, 36% reflects the increase in the Barclays share price since the award was granted, which is shown in the chart in a dashed box. The LTIP values shown for C.S. Venkatakrishnan's and Anna Cross's 2024 maximum represent the maximum LTIP award value that could have been granted under the current DRP. Annual bonus outcomes LTIP outcome Annual bonus measures Weighting (proportion of bonus opportunity) Outcome C.S. Venkatakrishnan Outcome Anna Cross LTIP measure Weighting (proportion of LTIP) Outcome C.S. Venkatakrishnan Financial2 60.0% 49.5% 49.5% Financial2 70.0% 46.7% • Profit before tax 50.0% 40.1% 40.1% • RoTE 25.0% 25.0% • Total operating expenses 10.0% 9.4% 9.4% • Cost: income ratio 10.0% 3.2% Strategic non-financial 25.0% 17.5% 17.5% • CET1 ratio 10.0% 10.0% Personal 15.0% 14.0% 13.5% • Relative TSR 25.0% 8.5% Risk scorecard 10.0% 6.8% Strategic non-financial 20.0% 14.0% Total 100.0% 81.0% 80.5% Total 100.0% 67.5% Final outcome approved by the Committee Final outcome approved by the Committee 2 The financial measures are defined as excluding material items. Proportion delivered in shares3 C.S. Venkatakrishnan Anna Cross C.S. Venkatakrishnan Anna Cross of 2024 variable pay 90% 89% of 2024 total remuneration 80% 79% 3 2024 variable pay comprises the actual 2024 annual bonus and the grant-date face value of the 2025-2027 LTIP award that will be granted in respect of 2024 performance, subject to shareholder approval of the new DRP. 2024 total remuneration consists of 2024 variable pay and 2024 Fixed Pay, including pension and benefits. Share ownership (£000) Shareholding shown as at 31 December 2024, using the Q4 2024 average share price of £2.5159. C.S. Venkatakrishnan Anna Cross 13,170 10,749 6,867 Based on 31 December 2024 Fixed Pay of £2,947k. 4,917 4,749 4,133 Based on 31 December 2024 Fixed Pay of £1,845k. ¢ Actual shareholdings, including unvested shares not subject to performance conditions (estimated after-tax value) ¢ Unvested shares subject to performance conditions (estimated after- tax value), which do not count towards the shareholding requirement ¢ Shareholding requirement under the current DRP Strategy Shareholder information Climate and sustainability report Risk review Financial review Financial statements Barclays PLC 2024 Annual Report on Form 20-F 116Governance Remuneration report (continued) 81.0% 80.5% 10,044 4,641 6,077 2,773 Fixed Pay Pension and benefits Annual bonus LTIP 3,280 Value from share price appreciation See single total figure for 2024 remuneration on page 140 67.5%
At a glance – Executive Director remuneration for 2025 under the new Directors' Remuneration Policy Policy implementation for 2025 (subject to shareholder approval at the 2025 AGM) Implementation effective from date of AGM. Delivery of remuneration is outlined below. Element C.S. Venkatakrishnan Anna Cross Salary (previously Fixed Pay) £1,590,000 paid in cash £950,000 paid in cash Pension and benefits Pension: £159,000, 10% of salary Benefits: entitlement as per the policy Pension: £95,000, 10% of salary Benefits: entitlement as per the policy Annual bonus Up to 250% of salary, based on forward-looking performance measures set near the start of the year Up to 250% of salary, based on forward-looking performance measures set near the start of the year LTIP Up to 550% of salary, based on forward-looking performance measures set shortly before the time of grant Up to 500% of salary, based on forward-looking performance measures set shortly before the time of grant Shareholding requirement Holding requirement: 550% of salary Shareholding requirements extend for two years after stepping down as an Executive Director Holding requirement: 500% of salary Shareholding requirements extend for two years after stepping down as an Executive Director Alignment of performance measures and strategy Performance measures Weighting in annual bonus and LTIP Alignment to strategy Direct alignment to stakeholder groups Financial Profit before tax (with a CET1 ratio underpin) • A measure of annual financial performance and a key factor that drives RoTE • Cost: income ratio • A measure of the productivity of our business operations over time • Return on tangible equity (RoTE) • A measure of the returns we generated for shareholders • Relative total shareholder return • A measure of Barclays' share performance (comprising share price appreciation and dividends paid) relative to those of a basket of other international banks • Strategic objectives • Individual objectives for each Executive Director, aligned to our strategic priorities •• • Strategic non-financial • Includes the Group's non-financial key performance indicators, including Customers, clients & colleagues as key stakeholder groups, and Risk & operational excellence, which is fundamental to operating at a consistently excellent standard to deliver sustainable performance •• • Sustainability, customers and clients • Includes longer term objectives relating to Sustainability, as a strategic priority, and Customers & clients as a key stakeholder group • •• l 2025 annual bonus l 2025-2027 LTIP l Customers & clients l Colleagues l Society l Investors Delivery of remuneration4 Performance year Year 1 Year 2 Year 3 Year 4 Year 5 Year 6 Year 7 Year 8 Year 9 Salary Paid in cash Pension Cash in lieu of pension contributions Annual bonus Performance period 50% in upfront cash 50% in deferred shares vesting over two years Holding period LTIP Preliminary performance period Three-year post-grant performance period Deferral in shares in five equal annual instalments Holding period 4 Illustrative timing that the different elements of remuneration are normally received. All tranches of annual bonus and LTIP shares typically vest in March of the relevant year and are subject to a 12-month holding period from the date they vest. Strategy Shareholder information Climate and sustainability report Risk review Financial review Financial statements Barclays PLC 2024 Annual Report on Form 20-F 117Governance Remuneration report (continued) 55% 55% 10% 50% 50% 20% 25% 20% 15% 15% 5% 25%
Diversity ambitions and pay gaps Wider workforce remuneration Our remuneration philosophy Our remuneration philosophy applies to all employees and sets out the way we approach remuneration. Its aim is to be as simple and clear as possible, while ensuring strong alignment with risk and conduct as well as our Values and Mindset. It is also closely aligned with Provision 40 of the FRC's UK Corporate Governance Code. The remuneration decisions set out in this report are a result of the application of our remuneration philosophy in respect of 2024. Philosophy Attract and retain talent needed to deliver Barclays’ strategy Long-term success depends on the talent of our employees. This means attracting and retaining an appropriate range of talent to deliver against our strategy, and paying the right amount for that talent. Align pay with investor and other stakeholder interests Remuneration should be designed with appropriate consideration of the views, rights and interests of stakeholders. This means listening to our shareholders, other investors, regulators, government, customers and employees and ensuring their views are appropriately represented in remuneration decision-making. Reward sustainable performance Sustainable performance means making a positive and enduring difference to investors, customers and communities, delivering good customer outcomes, taking pride in leaving things better than we found them and playing a valuable role in society. Support Barclays’ Values and culture Results must be achieved in a manner consistent with our Values. Our Values, culture and Mindset should drive the way that business is conducted. Align with risk appetite, risk exposure and conduct expectations Designed to reward employees for achieving results in line with the Group’s risk appetite and conduct expectations. Be fair, transparent and as simple as possible We are committed to ensuring pay is fair, simple and transparent for all our stakeholders. All employees and stakeholders should understand how we reward our employees, and fairness should be a lens through which we make remuneration decisions. Our Fair Pay Agenda Paying people fairly is an essential element of our pay philosophy. We have developed our fair pay approach over a number of years, and we continue to ensure that fairness is a key and explicit consideration in the way we make all of our pay decisions. Our fair pay principles Fair pay for the lowest paid Paying fairly for work done, in a simple and transparent way. Equal opportunities to progress Providing equal employment opportunities to all, so everyone can enjoy a successful career at Barclays. Engaging with colleagues Engaging with colleagues to understand their views on the culture of the organisation and enabling the representation of employees in our remuneration decision-making process. Alignment of employee and Executive Director pay Linking both Executive Director and employee pay to sustainable business performance. Equal pay commitment Rewarding employees fairly for their contribution and making sure pay and performance decisions never take into account any protected characteristics. Supporting our colleagues • Over 97% of employees are eligible for private medical cover • In the UK, over 28,000 private doctors' appointments were booked in 2024 • Continued to enhance our wellbeing provision – over 48,900 colleagues registered on our Be Well wellbeing portal • Increased transparency of skills, pay and career progression using the features of our new HR platform • One-off share award for all employees globally (except the most senior) recognising their collective effort and to share in our success Diversity ambitions 33% 33% females at Managing Director and Director level by 2025 50% 50% increase in Managing Directors from underrepresented ethnicities in the UK and US combined by 2025 (from 2022 baseline) 12.5% Increase underrepresented minority representation in the UK by 12.5% by 2025 (from 2023 baseline) 5% Increase underrepresented minority representation in the US by 5% by 2025 (from 2023 baseline) Pay gaps We disclose pay gaps for locations where this is required, including the UK, Ireland and France. • Our gender and ethnicity pay gaps are primarily due to representation differences for males and females, and for certain ethnic minority groups compared to white employees. • Being transparent about this, and the resulting pay gaps, is important as it helps us track where we are in the pursuit of our goals and understand what tangible actions we can take to improve representation over time. For information on our progress against our diversity ambitions, see page 143 More information on our diversity ambitions and pay gaps can be found at: home.barclays/diversity UK gender and ethnicity pay gaps for 2024 are shown in our UK Pay Gaps 2024 disclosure, which can be found at: home.barclays/diversity Strategy Shareholder information Climate and sustainability report Risk review Financial review Financial statements Barclays PLC 2024 Annual Report on Form 20-F 118Governance Remuneration report (continued) More information on our fair pay approach can be found in our Fair Pay Report 2024 at: home.barclays/annualreport
Alignment of remuneration policy for the wider workforce and Executive Directors A new Directors' Remuneration Policy (DRP) is to apply to Executive Directors from 2025, subject to shareholder approval at the 2025 AGM. Most elements of the remuneration policy are aligned for the wider workforce and the Executive Directors. Differences in policy implementation between seniority levels reflect our remuneration philosophy. For example, the balance between fixed and variable pay is shifted toward fixed pay for employees in more-junior roles and towards variable pay for those in more-senior roles. A large proportion of variable pay for senior employees, or the majority of variable pay for the Executive Directors, is delivered in shares over multiple years – aligning their interests more closely with those of shareholders – whereas pay is primarily in cash for more-junior employees. Aligned with our Fair Pay Agenda, UK employer pension contributions are also higher for our junior employees. The table below provides a summary of remuneration arrangements for the wider workforce and the Executive Directors. Element Junior employees Senior employees How Executive Director policy aligns Fixed pay Reflects the individual’s role, skills and experience and is reviewed annually. Fixed pay is increased where justified by role change, increased responsibility or a change in the market rate for the role. Salaries may also be increased in line with local statutory requirements and with union and works council commitments. Reflects the individual’s role, skills and experience, and is reviewed annually. Annual increases will typically be no more than the average increase for UK employees. Delivery All in salary for most, paid in cash. Some roles are also entitled to receive certain cash allowances. All in salary for most. For a small number of senior employees (2% globally) a proportion is delivered in Role Based Pay (RBP), in cash or shares, to recognise the seniority, scale and complexity of their role. All will be paid in salary, delivered in cash. No entitlement to any allowances. Pension Competitive pension offering set by location. Minimum of 12% of salary for more-junior colleagues in the UK. Competitive pension offering set by location. Minimum of 10% of salary in the UK. The Executive Directors receive cash in lieu of pension equal to 10% of salary. Benefits Market-aligned benefits offering appropriate to the role and reflecting local market practice to support with health and wellbeing. Market-aligned benefits offering, but typically a lower proportion of total pay than for junior employees. Market-aligned benefits offering, but typically a lower proportion of total pay than for the wider workforce. Annual bonus Annual bonuses incentivise and reward the achievement of Group, business and individual objectives, and reward employees for demonstrating individual behaviours in line with Barclays’ Values and Mindset. All employees are considered, subject to eligibility criteria. Assessed against predetermined targets and measures to align with financial performance, strategic objectives and strategic non-financial key performance indicators. Delivery In cash following the performance year. For many a proportion of annual bonus is deferred to future years. Deferred bonuses are generally delivered half in deferred cash and half in deferred shares, released in equal annual instalments over three, four, five or seven years, with shares subject to a further six or 12-month holding period for some roles. A substantial proportion of annual bonus is generally deferred in shares and then subject to a further 12-month holding period. Across the annual bonus and any LTIP award combined, deferral will always at least meet regulatory requirements. Long Term Incentive Plan (LTIP) award Not applicable to the wider workforce. The value received from LTIP awards depends on assessment of performance over a three-year period against Group- wide financial and non-financial measures. Delivery is in shares between the third and seventh year from grant, with each release subject to a further 12- month holding period. All-employee share plans Provide an opportunity for all employees to acquire Barclays shares, in some locations on beneficial terms. Barclays operates all- employee share plans in locations representing 99% of employees globally. Role of the Remuneration Committee in wider workforce remuneration The Committee considers the overarching objectives, principles and parameters of remuneration policy across the Group, ensuring a coherent approach in respect of all employees. In discharging this responsibility the Committee seeks to ensure the policy is fair, transparent and avoids complexity. It assesses, among other things, the impact of pay arrangements in supporting the Group's culture, Values and strategy, and on all elements of risk management. The Committee performs the following activities in relation to wider workforce remuneration: • Ensures alignment of remuneration with the remuneration philosophy, Fair Pay Agenda and Barclays' Purpose, Values, Mindset, conduct expectations and long-term success • Ensures alignment of wider workforce and Executive Director remuneration policies • Approves the bonus pool across the wider workforce and reviews wider workforce pay outcomes • Reviews the annual Group fixed pay budgets. Strategy Shareholder information Climate and sustainability report Risk review Financial review Financial statements Barclays PLC 2024 Annual Report on Form 20-F 119Governance Remuneration report (continued)
Performance management Performance management plays a key role in enabling colleagues to deliver to a higher standard as well as supporting their career progression. Our performance management approach centres on continuous performance management principles. This encourages people leaders to discuss performance throughout the year, including reviewing progress made against ‘what’ has been delivered (performance against objectives) and ‘how’ this has been achieved (demonstration of our Values and Mindset for all colleagues, as well as leadership behaviours for all leaders). At year-end, colleagues are assessed separately on the ‘what’ and the ‘how' of their performance. This assessment is reflected in colleague performance ratings and bonus outcomes. For 2024, higher standards of delivery were further embedded into our performance approach through global objectives for all colleagues aligned to the consistently excellent standard, as well as our leadership behaviours being embedded as part of the ‘how’ for all leaders. For Group Executive Committee members, the performance assessment is more structured, reflecting key Group and business area priorities in support of our three-year plan. How stakeholder views are considered in remuneration decisions We seek to consider the views of all of our stakeholders in remuneration decision-making, including colleagues, investors and regulators. Colleagues Investors Other stakeholders We engage with colleagues to understand their views through our regular all-colleague Your View surveys, union and works council engagements, and 'townhall' meetings. We also engage with colleagues through our Employee Resource Groups, webcasts, and workshops. Our ongoing engagement with the union Unite in the UK covers a range of topics, such as fair pay and how we support colleagues, and this enables the views of colleagues to be shared directly with senior leaders to inform decision-making. For information on our 2025 pay deal with Unite see 'Salary budget for 2025', below. We publish information to explain to colleagues how the Group’s performance and pay approach aligns to the Fair Pay Agenda, and to help them understand the employee benefits Barclays provides – so they can make the most of what is on offer. To communicate pay in a clear way, each colleague receives a Compensation Profile detailing their fixed pay and incentives for the previous year and their fixed pay for the following year. We recognise that remuneration is an area of particular interest to shareholders. We listen to their views and take these into account when setting remuneration or considering changes to remuneration policies. Accordingly, the Group Chair or Remuneration Committee Chair hold meetings each year with major shareholders and representative groups to understand their views, accompanied by senior Barclays employees. This kind of engagement helps inform the Committee's work and contributes directly to the decisions it makes in relation to Executive Directors' remuneration. In 2024, we discussed proposed changes to the DRP with our largest shareholders.The shareholder feedback we received was a key consideration in the Committee's decision to put forward a new DRP for shareholder approval one year early, at the 2025 AGM. The details of the new policy are set out from page 130. More information on shareholder engagement on the DRP is provided from page 134). Each year, the Barclays Internal Audit or Chief Controls Office teams review our remuneration policies and how we've operated our remuneration processes, to provide assurance to the management team and the Committee that we are compliant with regulatory requirements. Whenever regulations on remuneration are changed, we review our remuneration policies and practices to ensure they are compliant – and make changes if necessary. In 2024, following changes to UK regulations, we replaced the 2:1 bonus cap for MRTs with a new bonus cap of 10:1, We continued to engage with our regulators to ensure we understand their perspectives, and to explain our performance, pay priorities and decision-making. We took their views into consideration when making our remuneration decisions for 2024, and continue to ensure we have ongoing regulatory dialogue on remuneration. Fixed pay decisions for 2025 Living wage employer We continue to ensure that we at least meet the living wage benchmarks for each location in which our colleagues are based, and are an accredited Living Wage employer in the UK. Salary budget for 2025 We targeted our salary increase budgets so there are higher increases for the most junior colleagues. In the UK, with the union Unite, we have agreed a salary increase budget of 3.23% for our junior employees and 2.27% for other union-recognised employees. For junior employees in India and the US, salary increase budgets are 9% and 3.5% respectively. Exceeding the living wage We pay at least the living wage in all locations. Below are our minimum hourly rates from 1 March 2025 for the UK, USA and India, where 93% of employees are based. £13.74 UK 2024: £13.19 $22.50 USA 2024: $22.50 ₹158.00 India 2024: R150.00 Pay transparency Our pay approach for junior colleagues is set in a simple and easy to understand way – pay levels and annual salary increases for our most junior roles in Barclays UK and support functions in the UK are based on role type, and starting salaries are published. Annual bonus approaches for those populations are harmonised with outcomes set as a percentage of salary, differentiated by each employee's performance rating. In 2024, we implemented a new global HR system, which provides additional features to make jobs, skills, pay and career progression more transparent for colleagues and their managers. Strategy Shareholder information Climate and sustainability report Risk review Financial review Financial statements Barclays PLC 2024 Annual Report on Form 20-F 120Governance Remuneration report (continued) For more details see our Fair Pay Report 2024 at: home.barclays/annualreport
Incentive pool and annual bonus outcomes for 2024 Incentive pool and annual bonus outcomes for 2024 0 500 1,000 1,500 2,000 2,500 0% 20% 40% 60% 80% 100% Determining the Group incentive pool In determining the 2024 Group incentive pool, the Committee considered: • The Group's financial and non-financial performance during 2024 • The performance of individual businesses within the Group and their contributions to our strategic targets and vision • The Group’s capital position and current and future risks • The need to reward strong performers appropriately, as well as recognising colleagues who have exemplified the Barclays Values and Mindset • Compensation market data and expected market trends, to maintain competitiveness where performance warrants. The Committee used its judgement to reach a balanced decision on the level of the Group incentive pool, in line with our remuneration philosophy. The 2024 incentive pool supports outcomes that reflect the performance of the Group without paying more than is necessary. It will support the Group's continuing ability to attract, retain and reward colleagues who will drive the delivery of the Group’s strategy and sustainable growth for shareholders in the future. On that basis, the Committee approved a Group incentive pool for 2024 performance of £1,914m (2023: £1,745m), up 10% compared to the final incentive pool for 2023. The incentive pool reflects risk and conduct adjustments of £174m. The incentive pool before risk adjustments each year rose by c.8% from 2024 to 2023, as seen in the chart on the right. The Group incentive pool and Group Chief Executive bonus outcomes The incentive approach for our Executive Directors is significantly more structured than for other employees, as required by institutional shareholders for directors of UK-listed companies. This more-structured approach, with a need for direct alignment to specific financial performance metrics, leads to greater year-on-year volatility in incentive outcomes – both up and down – for the Executive Directors compared to other employees. For 2024, like every year, the Committee considered the Executive Director bonus outcomes in the context of the bonus outcomes for the wider workforce, ensuring appropriate alignment both this year and over a multi-year period. It also reviewed the historical outcomes for the Executive Directors in the context of performance each year. It concluded they were appropriate in the context of the performance achieved. Group incentive pool and Group Chief Executive bonus outcomes over the years 2019 2020 2021 2022 2023 2024 < Group incentive pool (£m) Group Chief Executive bonus outcome (% of maximum) < Risk and conduct adjustments (£m) Annual percentage change in fixed pay of Group Chief Executive and employees • The annual percentage change in fixed pay earned in 2024, compared to 2023, is 2.6% for the Group Chief Executive and 3.1% for the UK employee median – reflecting the Fixed Pay and salary increases awarded in early 2024. Group Chief Executive pay ratio: 182:1 • Our Group Chief Executive median pay ratio for 2024 is up vs. 2023 (83:1). This principally reflects the Group Chief Executive having a vesting LTIP award this year, the value of which also reflects share price growth since it was granted. Strategy Shareholder information Climate and sustainability report Risk review Financial review Financial statements Barclays PLC 2024 Annual Report on Form 20-F 121Governance Remuneration report (continued) Full details and supporting narrative. See page 158. Full details and supporting narrative. See page 159.
Alignment with Provision 40 of the UK Corporate Governance Code Code requirements How the Committee has addressed the requirement Clarity – remuneration arrangements should be transparent and promote effective engagement with shareholders and the workforce • A clear remuneration philosophy with aligned policies and practices for Executive Directors and the wider workforce • Our Fair Pay Report, which sets out how pay fairness is central to what we stand for, is used to engage with our shareholders and our colleagues • Regular engagement on remuneration with our largest institutional shareholders, including extensive shareholder engagement on the DRP review • Clear and transparent disclosure of the context and rationale for the proposed DRP changes Simplicity – remuneration structures should avoid complexity and their rationale and operation should be easy to understand • Clear disclosure of rationale for and operation of each element of the DRP • The new DRP proposes simplified fixed pay for the Executive Directors, all in cash and renamed as salary, in line with normal practice • Executive Directors incentivised via annual bonus with deferral and LTIP • Prospective disclosure of bonus metrics and LTIP targets, and full retrospective disclosure of outcomes against financial and non-financial targets and criteria, with full supporting commentary Risk – remuneration arrangements should ensure reputational and other risks from excessive rewards, and behavioural risks that can arise from target-based incentive plans, are identified and mitigated • Assessment of 'What' and 'How' performance is achieved • Ex-ante and ex-post risk factored into the assessment of business performance • Significant deferral into shares, to align with shareholder experience • Committee discretion to adjust all variable remuneration outcomes • Malus and / or clawback provisions apply to all elements of variable remuneration Predictability – the range of possible values of rewards to individual Directors and any other limits or discretions should be identified and explained at the time of approving the policy • Maximum incentive outcomes set out in the DRP • Scenario charts illustrate potential payouts under each element of the Policy • Key areas of Committee discretion clearly outlined in the Policy Proportionality – the link between individual awards, the delivery of strategy and the long- term performance of the company should be clear. Outcomes should not reward poor performance • The new DRP would increase alignment of pay and sustainable performance, via higher weightings to financial performance measures, higher weighting to LTIP and higher shareholding requirements • Annual bonus and LTIP measures reviewed each year to maintain alignment to strategic priorities and KPIs • Significant deferral into shares, to align with shareholder experience • Committee discretion, malus and clawback provisions apply to all elements of variable remuneration, to ensure outcomes do not reward poor performance Alignment to culture – incentive schemes should drive behaviours consistent with company Purpose, Values and strategy • The Committee reviews all policies and practices, including incentive schemes, ensuring alignment to the Group's Purpose, Values, Mindset and conduct expectations • A key aspect of remuneration philosophy is rewarding sustainable performance • Executive Directors' bonus and LTIP based on a balanced scorecard of financial and non- financial measures, with financial measures aligned to external financial targets and non- financial measures aligned to supporting Customers & clients, Colleagues, and to the Group's Sustainability ambitions • Commitment to pay fairness across the workforce • Executive Director remuneration outcomes considered in the context of outcomes across the wider workforce Strategy Shareholder information Climate and sustainability report Risk review Financial review Financial statements Barclays PLC 2024 Annual Report on Form 20-F 122Governance Remuneration report (continued)
Sustainability and remuneration Executive Directors The Committee reviews the Executive Directors' incentive measures each year to ensure they continue to support the delivery of our strategic priorities, including ESG priorities. The Executive Directors' annual bonus and LTIP have included sustainability-related measures over the recent years. The Committee aligns these measures each year with the Group's evolving sustainability ambitions, metrics and targets. As most of our sustainability-related measures and targets are longer term, including those relating to financing the transition and financed emissions, a larger weighting was placed on these measures in the 2024-2026 LTIP vs. the 2024 annual bonus. As described earlier, for this year's forward-looking incentives the Committee has shifted the climate / sustainability measures fully to the LTIP, as progress towards these targets is expected to be volatile and non-linear and is best assessed over a multi-year period. For the 2025-2027 LTIP the sustainability measures are included as part of a broader, renamed category of measures relating to Sustainability, customers & clients, weighted at 25%. The Sustainability measures will include financing the transition, reducing our financed emissions and achieving net zero operations, as well as supporting our communities. Additionally, 10% of the 2025 bonus will be determined on a combination of colleagues measures, including inclusion and engagement, and measures relating to customers and clients, including customer and client satisfaction, reduction in customer complaints, maintaining rankings and market share, and increasing digital engagement, Risk & operational excellence measures are also weighted at 5% in the 2025 bonus, as the management of risk underpins delivery against our strategy. Outcomes will be determined based on an assessment of performance against a range of measures of our risk culture, operational precision and controls. Other employees Barclays’ performance against non-financial measures, including sustainability-related measures, is factored into the determination of the Group incentive pool – impacting annual bonus awards of all employees. In determining the Group incentive pool for 2024 performance, the measures used for the non-financial assessment included climate-related measures focused on our progress towards our Sustainable and Transition Financing target, reductions in our financed emissions and reductions in our operational emissions. The incentive pool is also adjusted to take account of risks, both crystallised and potential future risks. Consideration is given to vulnerabilities across all of Barclays’ Principal Risks, including Climate Risk. Individual bonus outcomes are determined based on Group, business, and individual performance. Performance for all colleagues is assessed against colleague-specific performance objectives, which are aligned to the five lenses of the consistently excellent standard and include sustainability considerations, where relevant. Specific sustainability-related objectives will depend on the role of the individual. The Group Executive Committee members responsible for Barclays’ five business divisions have specific sustainability- related objectives relevant to the businesses they manage included in their performance objectives and assessment. Strategy Shareholder information Climate and sustainability report Risk review Financial review Financial statements Barclays PLC 2024 Annual Report on Form 20-F 123Governance Remuneration report (continued)
Our 2025 Directors' Remuneration Policy (DRP) review The Committee in 2024 commenced an in-depth review of the remuneration policy for the Executive Directors. At the forefront of our thinking was a desire to align the Executive Directors’ pay outcomes more closely to the performance of our business and the experience of our shareholders, in support of our strategy and the delivery of our three-year plan. The feedback shareholders provided was invaluable to help shape our thinking and inform our final DRP proposals. We engaged with shareholders representing c.60% of our shareholder register, to better understand their views and perspectives on both the challenges we are trying to address and the proposals we are putting forward to do so. More information on the shareholder feedback received is provided from page 134. And throughout, our thinking has been aligned with the Barclays remuneration philosophy, which remains the cornerstone of our remuneration approach across the Group. On the next few pages we set out more information on the context and rationale for the DRP changes that we propose, and a summary of the proposed changes. The DRP itself is set out from page 130. Context for considering DRP changes Additional flexibility following UK regulatory changes Our current DRP was approved by shareholders at the 2023 AGM, to apply for up to three years from that date. That DRP was designed within the constraints of the 2:1 bonus cap, and consequently sets higher Executive Director fixed pay and lower variable pay opportunities than the Committee would otherwise have chosen. The 2:1 cap has limited our ability to pay competitively, with maximum total compensation opportunities well below the levels typically seen at peers that were not subject to the same rules. The removal of the 2:1 bonus cap requirement by UK regulators, and the adoption by Barclays of a 10:1 bonus cap for other MRTs, provided us with additional flexibility to consider improving the structure of Executive Director pay. Supporting and driving continued strategic progress and growth We are still on our journey to make Barclays Better, Simpler and More balanced. It is therefore vital that we remain execution focused, and continue to deliver against our plan, with a focus on shareholder value creation for the longer term. Our CEO and GFD have already driven significant progress for the Group since they were appointed, in 2021 and 2022 respectively: • Delivered consistent RoTE in excess of 10% each year1, achieving our previous longstanding RoTE target of greater than 10% • Set out a new three-year plan in February 2024, with ambitious and clear targets for the Group, including 2026 RoTE of greater than 12% and returns to shareholders of at least £10bn across 2024 to 2026, supported by targets for each business area • Simplified our business into five divisions that reflect how we serve our customers and clients, providing greater accountability and transparency to our shareholders • Driven Group-wide culture change, establishing delivery to a consistently excellent standard as an integral part of our culture via an ongoing multi-year change programme • The progress made to date in delivering our three-year plan has supported a £19bn increase in market capitalisation2 (up 78%), and £3.0bn of distributions to shareholders, since we announced our three-year plan. The proposed new DRP will support the achievement of our plans, by providing significantly greater performance alignment in the Executive Directors’ remuneration, with incentive performance measures strongly aligned to our strategic priorities and stretching external targets, and beyond. Improving the competitive positioning of Executive Directors' maximum total compensation opportunity In considering the competitive positioning of the Executive Directors' maximum total compensation opportunity, we first reviewed the companies against which Barclays Executive Directors' pay levels are compared. The Committee satisfied itself that the international banking peers described on the following page – the principal companies against which investors, employees and other stakeholders compare Barclays, and our key competitors for management talent – are the relevant comparators. Compared to those peers, our Executive Directors’ maximum total compensation opportunities under the current DRP are well below market, and not commensurate with the Executive Directors’ roles given Barclays’ scope and complexity. The proposed new DRP seeks to deliver maximum total compensation opportunities that are more reflective of the skills required for their roles. More detail in support of these competitiveness considerations is set out on the following page. Strategy Shareholder information Climate and sustainability report Risk review Financial review Financial statements Barclays PLC 2024 Annual Report on Form 20-F 124Governance Remuneration report (continued) Notes: 1 Excluding Q423 structural cost actions in 2023. 2 At the 10 February 2025 mid-market closing share price.
Ensuring Executive Director pay is appropriately competitive An important part of the context for our DRP review is the market competitiveness of the ED remuneration packages. International banking peers Our current and potential investors, employees and other stakeholders compare Barclays to international banking peers. We have deep roots in the UK, where we support retail customers, small businesses and corporations. The Group also includes a top-tier investment bank, with a strong global ranking, and has a significant and important US presence. As a result, these stakeholders compare Barclays to other large and complex international banks headquartered in the US, Europe and the UK. The international banking peer group against which the Committee compares the EDs’ pay competitiveness consists of the same kinds of companies, as the most relevant comparators to Barclays: other large universal banks from continental Europe / the UK, and the large US universal and investment banks. We also include the most comparable to Barclays of the other large UK- listed banks, to help maintain balance. Five firms out of 11 in the peer group are US based, reflecting the Group’s large US operations and key competitors. Based on the size and complexity analysis below, Barclays is more complex than most UK and European peers, and around the mid- point versus this peer group overall, if taking the average across the different measures shown. Size and complexity of Barclays versus the peer group1 Companies are ordered based on average score across all measures and bar lengths are relative to largest value in each category Size Complexity Company Total assets (£bn) Revenue (£m) Geographic scope2 Revenue from US/ Americas (%) Markets & Banking proportion3 Markets & Banking revenue (£m) JPMorgan Chase & Co (JPM) Goldman Sachs (GS) Morgan Stanley (MS) Bank of America (BofA) Citigroup (Citi) Barclays (BARC) UBS Group4 (UBS) Deutsche Bank (DB) HSBC Holdings (HSBC) BNP Paribas (BNPP) Standard Chartered (SC) Lloyds Banking Group (LBG) Notes: 1 Peer group data relate to the 2023 financial year, and are provided by the independent advisors to the Committee (PwC). 2 ‘Geographic scope’ based on peer Annual Reports indicating geographic breadth of revenue origination e.g. empty circle indicating 100% of revenues from the country where the company is headquartered; full circle >10% of revenues from each of three other regions. Citigroup geographic scope estimated as disclosure is insufficiently granular. 3 ‘Markets & Banking proportion’ based on those businesses’ revenues as a proportion of total revenues. BNP Paribas includes only Markets, as their disclosures combine investment banking and corporate banking revenues. 4 UBS: underlying revenue includes Credit Suisse revenues but excludes one-off transaction impacts. Geographical scope excludes Credit Suisse as revenues by geographical regions are not disclosed on the same basis. Sources of senior management talent The same banking peers that we referred to above are also our main source of senior talent. Over the last 10 years, 53% of hires into roles on the Barclays Group Executive Committee and their direct reports have come from our international banking peers. The percentage increases to c.70% if we include other US financial services firms. Very few of these hires (less than 5%) were from UK-listed companies outside of financial services, reflecting the need for relevant banking experience. Barclays hiring over the last 10 years – ExCo and ExCo-1 n From international banking peers 53% n From other US financial services firms 14% n From other financial services firms from UK, Europe and other regions 19% n From firms outside financial services that are not UK-listed 10% n From UK-listed firms outside financial services 4% Strategy Shareholder information Climate and sustainability report Risk review Financial review Financial statements Barclays PLC 2024 Annual Report on Form 20-F 125Governance Remuneration report (continued)
These CEOs are/were subject to the 2:1 bonus cap. Fixed pay is higher than at firms not subject to bonus cap These firms offer far greater incentive opportunity, and lower fixed pay - though UBS has adopted a more balanced approach Executive Directors' maximum total compensation opportunity versus market When the 2:1 bonus cap was introduced, we reduced variable pay opportunity and increased fixed pay, to remain competitive with international peers not subject to the same rules. Fixed pay is more certain than variable pay, so the amount by which we increased the Executive Directors’ fixed pay was less than the amount by which we reduced their variable pay opportunity; each £100 reduction in variable pay opportunity saw a £41 increase to fixed pay for the CEO, or a £44 increase for the GFD. This significantly reduced the maximum total compensation opportunity for each Executive Director. Since then, when reviewing the Executive Directors’ fixed pay, for several years the Committee made no increases, given the very high level of fixed pay required under the 2:1 bonus cap. However, over time the Committee noted that the Executive Directors’ maximum total compensation opportunities were falling even further behind market, and so when reviewing fixed pay in recent years we moved to award the Executive Directors modest increases that would feed through to slightly higher maximum total compensation opportunities, within the confines of the 2:1 bonus cap. Nonetheless, the reduction in pay opportunity on implementing the 2:1 bonus cap, combined with only moderate fixed pay increases since then, has left the maximum total compensation opportunity for the Barclays CEO uncompetitive versus market, as shown in the chart below. The same is true for the GFD. The competitive positioning would have been better had the 2:1 bonus cap not been introduced. For example, if we were to take the maximum total compensation opportunity of the Barclays CEO in 2011, and assume salary increases of 2%-3% per annum thereafter, the maximum total compensation opportunity for the Barclays CEO in 2025 might have been in the range of c.£15m-£17m. Barclays CEO maximum total compensation opportunity for 2024 compared to market (£m)1 £m n Fixed pay n Max incentive n Barclays fixed pay n Barclays max incentive € Indicates the 'Bulge bracket' investments banks † Firms that may amend their DRP / max total comp. post bonus cap removal Note: 1 Market total compensation opportunity data provided by Willis Towers Watson (WTW), from each company’s public financial year 2023 disclosures (including assumptions if no maximum total compensation was disclosed). The uncompetitive pay positioning creates other challenges. For example, the Committee is conscious that the uncompetitive pay positioning compared to market would likely cause significant challenges if we were faced with a succession scenario. Candidates for the Barclays CEO or GFD roles must have significant breadth and depth of investment banking and global markets knowledge and experience, so the candidate pool is limited, and the current ED pay opportunity is likely to be unattractive for many of these candidates, both internal and external: • Internally, over recent years the total compensation awarded to several Barclays Executive Committee members has been materially higher than that awarded to the Barclays CEO (in some cases up to 50%). This is reflective of the levels of pay these roles command in the market. Venkat himself had to agree to a pay reduction when he was promoted to the CEO role. • While the DRP does not cap pay below Board level, the current level of ED pay opportunity can also make it more challenging to hire into other senior roles that are critical to delivering our strategy, due to candidates’ concerns and perception around potential pay compression and future opportunity. • Externally, pay opportunity for business heads reporting to the CEO is in many cases higher than the pay opportunity for the Barclays CEO. Business heads' pay at those peer companies for which this data is available can be seen in the chart on the following page. Strategy Shareholder information Climate and sustainability report Risk review Financial review Financial statements Barclays PLC 2024 Annual Report on Form 20-F 126Governance Remuneration report (continued) Upper Quartile Median Lower Quartile 40 30 20 10 0 BNPP LBG † SC † DB € BARC € HSBC † UBS € BofA € Citi € GS € MS € JPMC €
Peer 1 Peer 2 Peer 3 Peer 4 Peer 6 Pay for illustrative external candidate pool1 versus current Barclays CEO pay (%) 0 50 100 150 200 250 300 350 400 u Peer business head (Barclays ExCo equivalent) 2023 total compensation as a % of Barclays CEO total compensation Notes: 1 2023 total compensation of US and European peers’ business heads estimated by WTW, based on those firms’ public disclosures in 2024, where available. 2 Barclays CEO total compensation is 2023 year-end Fixed Pay, 2023 annual bonus and 2024-2026 LTIP, assuming 50% vesting (in line with average vesting over last five cycles). Objectives and improvements under the new DRP The Committee identified the following key objectives and improvements for the new DRP, reflecting on the context for the DRP review and on feedback received from shareholders during engagement in support of the review: • A material salary reduction compared to the EDs’ current level of Fixed Pay • Significantly greater performance alignment, so the EDs would receive lower pay than under our current DRP at lower levels of performance but have the potential to earn more if justified by strong performance • Incentive performance measures strongly aligned to our stretching external targets, with fewer, simpler and more-focused measures – and an increased weighting to financial measures while still maintaining appropriate balance vs. non-financial factors • More longer-term alignment to sustainable performance, via higher LTIP weighting (rather than bonus) and materially higher shareholding requirements • Higher maximum total compensation opportunities, though still below the median across our international banking peers, to reflect our UK-listed context Each of these is addressed via our proposed DRP changes. Proposed changes to the DRP Having considered a broad range of factors and options for improving the Executive Directors’ pay structure (including a less significant reduction in fixed pay and alternative incentive plan structures), alignment with shareholders and other stakeholders, and addressing competitiveness challenges, the proposed changes to the policy and Executive Directors’ salaries for 2025 are presented in the table below: DRP element Proposed changes Salary In place of ‘fixed pay’ under the current DRP • Reduced by 46% for the CEO, from £2.95m to £1.59m, and by 49% for the GFD, from £1.85m to £0.95m. • Alongside that, we will simplify the structure of fixed pay. Under the current DRP, half of fixed pay is delivered in fixed pay shares. As fixed pay is being brought into line with norms at banking peers that are not (and were not) subject to the 2:1 cap, this unusual, complex delivery structure will be removed, so fixed pay will revert to being ‘salary’ and be paid entirely in cash. • With lower fixed pay, a greater proportion of Executive Directors’ pay will be performance-based. Annual bonus • Increased maximum annual bonus opportunity to 250% of salary for both the CEO and GFD. Of this, financial factors will normally guide at least 65% of the bonus opportunity. • Under the current DRP, the annual bonus opportunities are 93% and 90% of fixed pay respectively, though those are multiples of significantly higher fixed pay so are not directly comparable. Financial factors normally guide at least 60% of the opportunity. LTIP award • Increased maximum LTIP opportunity to 550% of salary for the CEO and 500% for the GFD. Of this, financial measures will normally make up at least 75% of the total opportunity. • Under the current DRP, the maximum LTIP grant is 140% of fixed pay for the CEO and 134% for the GFD, noting again that these multiples are based on significantly higher fixed pay so are not directly comparable. Financial measures normally make up at least 70% of the total opportunity. Balance of incentives • Larger proportion of variable pay opportunity delivered in LTIP (69% vs 60% currently), rather than bonus, to promote a longer- term focus. • Increased weighting to financial measures, which we will use to make a larger proportion of pay dependent on delivery of sustained performance in line with the targets set out in our February 2024 Investor Update, and beyond. Pension • Will be 10% of salary, largely unchanged – under the current DRP the maximum annual cash allowance in lieu of pension for the EDs is 10% of the cash element of Fixed Pay. • The percentage cash in lieu of pension remains aligned to that for the wider workforce. Shareholding requirement • Increased to the level of the new LTIP opportunity – minimum shareholding is up 27% for the CEO, to 550% of salary, and 15% for the GFD, to 500% of salary. Strategy Shareholder information Climate and sustainability report Risk review Financial review Financial statements Barclays PLC 2024 Annual Report on Form 20-F 127Governance Remuneration report (continued) Almost 4x Barclays CEO 2023 total compensation2 Peer 5
Significantly greater pay-for-performance alignment Alongside the DRP review, the Committee also reviewed the performance measures and weightings in the Executive Directors' incentives (as set out on page 154 in respect of the 2025 annual bonus and page 155 in respect of the 2025-2027 LTIP). Based on shareholder feedback, the 2025 annual bonus and the 2025-2027 LTIP measures were simplified, to uplift the weighting to financial measures, to have fewer different measures, and to ensure greater alignment to the Group’s external targets in support of our three-year plan. These changes in measures, as well as the DRP changes described, deliver a greater pay-for-performance alignment under the new DRP: • Lower pay than under the current DRP for lower levels of performance, with total compensation down c.20% vs. the current DRP at threshold performance (e.g. RoTE of 10% based on 2025-2027 LTIP targets). • A ‘crossover’, where payout under the proposed DRP equals that under the current DRP, is at RoTE of c.11%, which was achieved in only one of the last 10 years and is higher than our previous long-standing greater-than-10% RoTE target. • Higher pay outcomes for achieving sustained performance commensurate with our stretching three-year plan – e.g. c.12% average RoTE – would result in payouts of c.£9m for our CEO and c.£5m for our GFD. • Maximum pay, £14.3m and £8.1m respectively, only for outstanding performance well beyond our external targets, including average RoTE of at least 14%, compared to our external target of greater than 12% RoTE in 2026. The full impact of policy changes will not be realised until 2033, when the final tranche of the first LTIP award made under the new policy is released. Illustrative CEO total compensation outcomes under different performance scenarios (£m)1 2.95 1.59 5.01 4.13 5.78 6.04 7.41 9.22 9.81 14.31 Current Proposed Current Proposed Current Proposed Current Proposed Current Proposed n Fixed pay (excluding pension and benefits) n Bonus n LTIP Notes: 1. ‘Proposed’ DRP outcomes reflect changes in pay mix (fixed pay at £1,590k) and performance measures, with target modelled at c.60% and threshold at c.20%. ‘Current’ DRP outcomes reflect old pay mix and historic performance measures. 2. The RoTE levels shown as representative of ‘threshold’, ‘cross-over’, ‘target’ and ‘maximum’ performance are based on the calibration used within the 2025-2027 LTIP. Competitive maximum total compensation opportunities for the Executive Directors The Committee concluded that our Executive Directors’ maximum total compensation opportunities under the current DRP are well below market, and not commensurate with the Executive Directors’ roles given Barclays’ scope and complexity. At the same time, we recognise that some of our peers are larger than Barclays. We also recognise that market pay levels for executive directors of US companies are often higher than those of UK companies. In light of this, in determining the appropriate level of the Executive Directors’ maximum total compensation opportunity under the new DRP, the Committee increased pay opportunity but determined that the competitive positioning should remain below market median – and very significantly below the pay levels of US peers, to reflect our UK-listed context. The resulting competitive positioning of the maximum total compensation opportunity for each Executive Director is shown on the following page, relative to international banking peers, and to the FTSE 30 companies (i.e. the 30 largest FTSE 100 companies, based on their market capitalisation at 31 December 2024, from which Barclays itself was then removed). Strategy Shareholder information Climate and sustainability report Risk review Financial review Financial statements Barclays PLC 2024 Annual Report on Form 20-F 128Governance Remuneration report (continued) Current DRP Proposed DRP Minimum outcome (fixed pay only) Threshold outcome (RoTE c.10%2) Cross-over outcome (RoTE c.11%2) Target outcome RoTE c.12%2) Maximum outcome (RoTE c.14%2) Impact £1.36m Impact £0.87m Impact — flat Impact £1.81m Impact £4.50m
Executive Director maximum total compensation opportunity under the proposed DRP relative to market benchmarks Group Chief Executive C.S. Venkatakrishnan International banking peer group FTSE 30 Group Finance Director Anna Cross International banking peer group FTSE 30 n Bottom quartile n 3rd quartile n 2nd quartile n Top quartile Positioning of maximum total compensation opportunity at Barclays relative to market benchmarks Notes • Barclays and market benchmark data reflect maximum total compensation opportunity, excluding pension and benefits. • Benchmark data for the international banking peer group and FTSE 30 was provided by WTW, based on publicly disclosed data in respect of each company's 2023 or 2023/24 financial years, incorporating assumptions where companies do not disclose a maximum total compensation opportunity. • Maximum total compensation opportunities across the FTSE 30 have been increased, assuming modest salary increases of 2% since the underlying data was published, reflecting that maximum total compensation in respect of 2025 will be higher than for 2024. Ensuring outcomes under the new DRP are appropriate An important part of the DRP remains the Board-level overrides and discretions, and the other guardrails that ensure alignment to risk and conduct. Using these, we will continue to ensure that outcomes are appropriate. In this context, the proposed new DRP: • Maintains a balance of incentive performance measures, both financial and non-financial, including risk. • Continues to deliver the vast majority of variable pay in shares, which release over a multi-year period. • Retains the Committee’s discretion to reduce incentive outcomes if these are considered not to be commensurate with performance delivered – the Committee has a proven track record of using discretion to reduce ED outcomes when it determines that to be appropriate. • Delivers a larger proportion of variable pay opportunity via LTIP, so based on longer-term performance measured over concurrent overlapping multi-year periods. • Includes increased shareholding requirements, and continues to require Executive Directors to maintain a shareholding for two years after stepping down as an Executive Director. • Continues to apply malus and clawback provisions to all variable pay, whereas malus and clawback terms cannot be applied to fixed pay, so the shift to lower fixed pay means these provisions apply to significantly more of total compensation. Malus and clawback mean variable pay awards can be revisited and reduced, or forfeited entirely, if conduct or performance later comes to light that would warrant such an adjustment. Amending our LTIP rules to support the new DRP To support the operation of the new DRP, we are proposing a corresponding change to the individual limits set out in our LTIP rules. Currently, the LTIP rules limit awards granted to an Executive Director each year to the lower of the maximum LTIP grant permitted under the DRP, or 500% of fixed pay. This was based on our old Executive Director pay construct, with very high fixed pay under a 2:1 bonus cap. The new DRP sees salaries almost 50% lower, and the Group Chief Executive’s maximum LTIP award increased to 550% of salary. As a result, we propose to amend the LTIP rules, so that the maximum award that might be granted to an Executive Director each year is set as the maximum permitted under the binding DRP that shareholders have approved at that time. The Board recommends that shareholders vote in favour of the proposed new DRP and corresponding LTIP rule change at the 2025 AGM The new DRP will strengthen the alignment of the Executive Directors' pay with performance, and with shareholder interests, achieved by delivering a greater proportion of maximum total compensation opportunity in the form of variable pay and reducing fixed pay, placing a higher weighting on LTIP and increasing shareholding requirements. The pay opportunity under the new DRP will better reflect the size, scope and complexity of the Executive Directors’ roles, with CEO pay of c.£9m for sustained performance commensurate with our stretching three-year plan, and maximum payout only for significant and sustained outperformance across all performance measures, including RoTE of 14% or higher. We believe that the changes proposed to Executive Directors’ pay under the new DRP will further support the delivery against our strategy and we look forward to your support of our proposals at the forthcoming AGM. Strategy Shareholder information Climate and sustainability report Risk review Financial review Financial statements Barclays PLC 2024 Annual Report on Form 20-F 129Governance Remuneration report (continued)
Directors’ Remuneration Policy (DRP) This section sets out the formal terms of the proposed new DRP, which will apply for three years beginning on the date of the 2025 AGM, subject to shareholder approval. The proposed changes and the rationale for those changes are detailed in the discussion of the DRP review from page 124, and a summary of how shareholder views were taken into account by the Committee in setting the policy can be found on page 134. The current DRP can be found on pages 209 to 217 of the 2022 Annual Report or at home.barclays/ annualreport. Remuneration policy – Executive Directors Salary To support the recruitment, retention and development of the right calibre of individual for the role. Determination of salary When setting salary for the Executive Directors, the factors the Committee considers include: • the size and scope of the role, taking into account the size, complexity and breadth of the organisation • the skills, experience and performance of the individual • market practice and market data (on which the Committee receives independent advice) The salary level for each Executive Director is set to provide fixed remuneration and maximum total compensation opportunity that is appropriately competitive, within the framework of the policy. Each Executive Directors’ salary and resulting maximum total compensation is benchmarked against similar roles at a peer group of international banks of comparable scope and complexity, as determined by the Committee. The Committee reviews the peer group regularly to ensure it remains a relevant comparison to Barclays or if circumstances make this necessary (for example, as a result of takeovers or mergers). Delivery structure Salary is paid in cash, monthly via payroll. Risk and conduct adjustment, malus and clawback provisions do not apply to salary. Salary for each Executive Director is reviewed annually. Percentage increases will normally be no more than the average annual percentage increase for UK employees. A higher increase may be made if the Committee considers it appropriate, for example to reflect an increase in the scope and/ or responsibility of the individual’s role, development of the individual within the role, or because a significant gap to market has arisen over time. Payment of salary is not contingent on any performance measures. Pension To support Executive Directors to build long- term retirement savings. Executive Directors receive an annual cash allowance in lieu of participation in a pension arrangement, paid monthly via payroll. Risk and conduct adjustments, malus and clawback provisions do not apply to pension. The maximum annual cash allowance value is currently 10% of salary. The Committee may change the maximum annual cash allowance in lieu of pension, provided that the maximum allowance will not exceed the employer pension contribution rate provided to the wider UK workforce. There are no performance measures. Element and purpose Operation Maximum value and performance measures Strategy Shareholder information Climate and sustainability report Risk review Financial review Financial statements Barclays PLC 2024 Annual Report on Form 20-F 130Governance Remuneration report (continued)
Benefits Executive Directors’ benefits provision includes, but is not restricted to, private medical cover, annual health check, life assurance and ill health income protection, and use of a Company vehicle and driver for business purposes (including any tax liabilities that may arise from these benefits). All-employee share plans – Executive Directors are eligible to participate in the Company’s all-employee share schemes on the same terms as other eligible employees. Mobility policy – if an Executive Director relocates to perform their role, additional support may be provided for a defined and limited period, in line with Barclays’ general employee mobility policies and practices. This would include, but is not restricted to, the provision of temporary accommodation, tax advice, home leave flights, removals assistance and relocation flights for the Executive Director and their dependents as well as tax and/or social security costs arising in connection with such benefits. The maximum value of benefits is determined by the nature of the benefit itself and costs of provision may depend on external factors, e.g. insurance costs. There are no performance measures. To provide a competitive and cost-effective benefits package appropriate to the role and reflecting local market practice, and to support the health and wellbeing of the Executive Directors. Annual bonus To reward delivery of short-term financial targets and strategic objectives, and the individual performance of the Executive Directors in achieving those. Delivery in part in shares increases alignment with shareholders and encourages longer-term focus. Determination of annual bonus Annual bonuses are entirely discretionary and decisions are based on the Committee’s judgement of Executive Directors’ performance in the year, measured against financial and other strategic objectives. Although the Committee takes a structured approach to considering the level of bonus outcome each year, any amount may be awarded from zero to the maximum value. Delivery structure Annual bonuses are typically delivered as a combination of cash and shares. A proportion of annual bonus may be deferred and/or subject to a holding period including where required by regulations. Malus and clawback provisions apply to annual bonus awards (described later in this policy). Deferral proportions and vesting schedules will be structured so that, in combination with any LTIP award, the proportion of variable pay that is deferred is no less than that required by regulations (currently 60%). Deferred bonuses are granted subject to the relevant plan rules. Vesting is dependent on certain requirements, including continued employment, and is subject to malus and clawback provisions. If regulations do not permit dividend equivalents to be awarded, the number of shares to be awarded under the deferred portion of any bonus may be based on the adjusted fair value of the shares over which awards are granted taking into account that dividends do not accrue during the vesting period. In such circumstances, the Committee has discretion to reduce the number of shares that vest if actual dividends paid over the period are materially lower than the original dividend assumption (but does not have a corresponding discretion to increase the number of shares if dividends were higher than originally assumed). The maximum annual bonus opportunity is 250% of salary for each of the Group Chief Executive and Group Finance Director. Performance measures, weightings and targets for the annual bonus are set by the Committee near the start of each year, covering financial and non-financial measures. Financial measures will normally make up at least 65% of annual bonus opportunity. The targets are set each year so that they are appropriately stretching in the context of the Board-approved business plan for the year, taking into account factors such as strategic priorities, external targets, prior-year performance outcomes, market expectations and the wider economic landscape. At the end of the year, the Committee considers performance against those measures and targets in determining the annual bonus outcomes for the Executive Directors. Although the Committee takes a structured approach to considering the level of annual bonus outcome each year, it is able to apply discretion to ensure the annual bonus award is reflective of the performance of the Group and the individual over the period. Element and purpose Operation Maximum value and performance measures Strategy Shareholder information Climate and sustainability report Risk review Financial review Financial statements Barclays PLC 2024 Annual Report on Form 20-F 131Governance Remuneration report (continued)
Long Term Incentive Plan (LTIP) award Determination of LTIP award LTIP award levels are determined by the Committee following discussion of recommendations made by the Chairman (for the Group Chief Executive’s LTIP award) and by the Group Chief Executive (for the Group Finance Director's LTIP award), based on satisfactory performance over the prior year (i.e. preliminary performance period). Delivery structure LTIP awards are granted subject to the plan rules, in the form of conditional rights to receive Barclays shares at no cost (although they may be satisfied in other instruments as may be required by regulation). Vesting is dependent on certain requirements, including the achievement of performance measures and continued employment, and subject to malus and clawback provisions. LTIP awards are structured so that when combined with the annual bonus the proportion of variable pay that is deferred is no less than that required by regulations (currently 60%). No part of an award vests before the third anniversary of grant, the final tranche of the awards will be released no earlier than the fifth anniversary of grant, and no faster than permitted by regulations (currently, vesting in five equal annual instalments after the third to seventh anniversaries of grant with shares then subject to an additional holding period). If regulations do not permit dividend equivalents to be awarded, the number of shares to be awarded under the LTIP may be based on the adjusted fair value of the shares over which awards are granted, taking into account that dividends do not accrue during the vesting period. In such circumstances, the Committee has discretion to reduce the number of shares that vest if actual dividends paid over the period are materially lower than the original dividend assumption (but does not have a corresponding discretion to increase the number of shares if dividends were higher than originally assumed). The maximum annual LTIP award is 550% of salary for the Group Chief Executive and 500% of salary for the Group Finance Director. For each award, the Committee sets forward-looking performance measures, weightings and targets around the time awards are granted, covering financial and non-financial measures. Financial measures will normally make up at least 75% of the total opportunity. The targets over the performance period are set so that they are appropriately stretching in the context of the Board- approved medium-term business plan, taking into account factors such as strategic priorities, external targets, recent performance, market expectations and the wider economic landscape. Straight-line vesting typically applies between the defined threshold and maximum performance targets. For each measure, no more than 25% will vest at threshold performance. At the end of the performance period, the Committee considers performance against those measures and targets in determining the LTIP outcome for the Executive Directors. There is no retesting allowed of performance in future years if targets are not met. The Committee is able to apply discretion to reduce the vesting of any award, to ensure the proportion that vests is reflective of the performance of the Group and the individual over the period. To incentivise execution of Barclays’ strategy over the longer-term. The multi-year performance period and deferral into Barclays shares encourage a long-term view and serve to align Executive Directors’ interests with those of shareholders. Element and purpose Operation Maximum value and performance measures Strategy Shareholder information Climate and sustainability report Risk review Financial review Financial statements Barclays PLC 2024 Annual Report on Form 20-F 132Governance Remuneration report (continued)
Shareholding requirement To further enhance the alignment of Executive Directors’ interests with those of shareholders, in long-term value creation. Executive Directors have a contractual obligation to build up a shareholding, within five years from their date of appointment as Executive Director, with a value equivalent to 550% of salary for the Group Chief Executive and 500% of salary for the Group Finance Director. Executive Directors will have a reasonable period to build up to this requirement again if it is not met because of a significant share price depreciation. For two years after stepping down as an Executive Director, they must maintain a shareholding at a level equal to: (i) the number of shares to be held under the shareholding requirement, as determined immediately prior to their stepping down as an Executive Director; or (ii) the actual number of shares held on stepping down, if lower (subject to the Committee determining that the resulting level of shareholding is appropriate given the relevant Executive Director’s tenure). Shares that count towards the shareholding requirement are those beneficially owned by the Executive Director, plus the value of any vested share awards (including those subject only to holding periods), the estimated after-tax value of any shares from unvested deferred share bonuses, and the estimated after-tax value of any unvested LTIP awards provided that no performance conditions remain untested. After the Executive Director has stepped down, the shareholding requirement will be maintained through self certification, to the extent it is not met via relevant awards under the Group’s employee share plans or shares held in Barclays nominee accounts. No maximum, the requirement sets out the minimum required shareholding and timeframes. Element and purpose Operation Maximum value and performance measures Legacy arrangements This DRP also permits the Group to honour any commitments with current or former Directors entered into prior to the approval and implementation of the policy (such as the grandfathering of past deferred compensation awards), provided that such commitments complied with any applicable remuneration policy in effect at the time they were entered into. Risk and conduct adjustment – malus and clawback Any annual bonus or LTIP awarded is subject to malus and clawback provisions. The malus provisions enable the Committee to reduce the amount of unvested bonus or LTIP (including to nil) prior to vesting in specified circumstances, including but not limited to: • a participant deliberately misleading Barclays, the market and/ or shareholders in relation to the financial performance of the Barclays Group • a participant causing harm to Barclays’ reputation or where his/ her actions have amounted to misconduct, incompetence, poor performance, material error or negligence • a material restatement of the financial statements of the Barclays Group or any subsidiary, or the Group or any business unit suffering a material downturn in its financial performance • a material failure of risk management in the Barclays Group • a significant deterioration in the financial health of the Barclays Group. The clawback provisions enable amounts to be recovered after they have been paid or vested, for a period in line with applicable regulation – currently seven years from grant (which can be extended to up to 10 years if a relevant investigation is ongoing at the end of the initial seven-year period) where (i) a participant’s actions or omissions have amounted to misbehaviour or material error and/or (ii) Barclays or the relevant business unit has suffered a material failure of risk management. Performance measures and targets for the Executive Directors' annual bonus and LTIP awards The Committee selects financial performance measures that are fundamental to delivery against the Bank’s strategy and are considered to be the most important financial measures used by the Executive Directors and the Board to oversee the direction of the business. The non-financial performance measures are chosen to represent key indicators of the success of our strategy, to provide a balanced view of our performance during the period, and are robustly monitored and reported on to management. Financial targets for both the annual bonus and LTIP are set to be stretching but achievable and are aligned to enhancing shareholder value. The financial measures and weightings for the annual bonus will be disclosed at the start of the relevant performance year, as part of the previous year’s Annual report on Directors’ remuneration. Strategy Shareholder information Climate and sustainability report Risk review Financial review Financial statements Barclays PLC 2024 Annual Report on Form 20-F 133Governance Remuneration report (continued)
Where the Committee considers the annual bonus targets to be commercially sensitive and that it would be detrimental to disclose the targets at the start of the relevant performance year, the specific targets will be disclosed at the end of the relevant performance year, alongside details of the actual performance achieved against those targets, in that year’s Annual report on Directors’ remuneration (subject to commercial sensitivity no longer remaining). In respect of the LTIP, the financial measures, weightings and targets will be disclosed in the Annual report on Directors’ remuneration published shortly after the start of the relevant performance period. Discretion The Committee applies judgement where necessary to ensure that amounts paid out under the annual bonus and LTIP are not out of line with the Group’s overall performance. This policy provides it with discretion to adjust the formulaic outcome of incentives to ensure amounts paid out are reflective of the performance of the Company and the individual over the period. In exceptional circumstances, the Committee has discretion (permitted under the plan rules approved by shareholders) to amend targets, measures, or the number of shares under the LTIP if an event happens (for example, a major transaction) that, in the opinion of the Committee, causes the original targets or measures no longer to be appropriate or such adjustment to be reasonable. In addition to the various operational discretions that the Committee can exercise in the performance of its duties (including those discretions set out in the Company’s share plans), the Committee also reserves the right to make minor or administrative amendments to the policy to benefit its operation. The Committee further reserves the right to make more material amendments in light of new laws, regulations and/or regulatory guidance, if these could not be accommodated within the existing policy. The Committee would only exercise this right if it believed it was in the best interests of the Company to do so and where it is not possible, practicable or proportionate to seek or await shareholder approval in a General Meeting. Remuneration policy alignment between the Executive Directors and all other employees of the Group The structure of remuneration packages for the Executive Directors is closely aligned with that for the broader employee population. Employees receive salary, pension and benefits and are eligible to be considered for a bonus. The broader employee population typically does not have a contractual limit on the quantum of remuneration (though an internal cap on the ratio of variable to fixed remuneration currently applies for MRTs). As for the Executive Directors, variable pay for the broader employee population is performance based. Variable pay for both the Executive Directors and the broader employee population is subject to deferral requirements. Executive Directors and other MRTs are subject to deferral at least equal to that required by regulation, currently a minimum rate of 40% to 60%, depending on the total value of variable pay. For non-MRTs, bonuses in excess of £65,000 are currently subject to a graduated level of deferral. The terms of deferred bonus awards for Executive Directors and the wider employee population are broadly the same, in particular the vesting of all deferred bonuses is subject to service and malus conditions. The broader employee population does not participate in the Barclays LTIP. While we have not sought employee views on the DRP, we have considered remuneration policies for the broader employee population when reviewing the DRP. In our Fair Pay Report, we explain in more detail how employee and Executive Director pay is aligned. How shareholder views are taken into account by the Committee in setting the policy We recognise that remuneration is an area of particular interest to shareholders and that it is important that we listen to shareholder views and take these into account when setting and considering changes to remuneration. In developing the new policy, we engaged with shareholders and had meetings with shareholder representative bodies and proxy agencies, in the latter part of 2024 and the early part of 2025. The Committee found the feedback from shareholders during consultation on the DRP review invaluable, in converging on the proposed DRP changes. Shareholders expressed alike views across a wide range of topics. There was universally strong support to proceed with a revised DRP in 2025, in light of the removal of the 2:1 bonus cap regulations. There was also wide- ranging recognition of the strong rationale for change and desire to increase pay for performance alignment. On some topics shareholder views differed, for example on the favourability of relative TSR as a measure for Executive Directors’ LTIP awards. The Committee reflected on and discussed the feedback received, to understand the broad gamut of shareholder perspectives. Importantly, the Committee worked to ensure that the proposed DRP changes reflect the views that shareholders provided, using its judgement to balance differing perspectives and other key DRP considerations. The table below summarises the key feedback from shareholders and how the Committee reflected that in its proposals. Strategy Shareholder information Climate and sustainability report Risk review Financial review Financial statements Barclays PLC 2024 Annual Report on Form 20-F 134Governance Remuneration report (continued)
How shareholder feedback is reflected in the proposed DRP Shareholder feedback Committee considerations and how the feedback is reflected in the proposed DRP Support to significantly reduce fixed pay, and increase variable pay, within our 10:1 bonus cap The proposal is to reduce fixed pay by 46% for the CEO and 49% for the GFD, while increasing variable pay opportunity. The Committee considered smaller reductions in fixed pay, but in context of broader considerations on the most appropriate ED pay structure, deemed this to be the appropriate level of reduction. The Committee chose a ratio of variable pay opportunity to fixed pay of 8:1 for the CEO, and 7.5:1 for the GFD. Preference to increase weighting to financial measures The weighting to financial measures will normally be at least 65% for the annual bonus and 75% for LTIP awards, up from 60% and 70% respectively. The weightings to key financial targets, such as RoTE, have been increased (up from 30% in the 2024-2026 LTIP to 50% in the 2025-2027 LTIP). Preference to reduce the number of measures The number of financial measures has been reduced from four to two in the LTIP (2024-2026 cycle: RoTE: 30%, cost: income ratio: 10%; CET1 ratio: 10%, TSR: 20%; 2025-2027 cycle: RoTE: 50%, TSR: 25%). Preference to simplify the non-financial measures Non-financial measures have been simplified in the 2025 annual bonus and 2025-2027 LTIP. Sustainability measures are moved into LTIP, accompanied by measures relating to customers and clients. In annual bonus, we have increased the weighting allocated to the strategic objectives that support our three-year plan. Emphasis that it is important not to incentivise excessive risk taking The Committee considered this in detail and ensured that the new DRP retains existing guardrails, such as the Committee’s overrides and discretions to ensure incentive outcomes are aligned with the results achieved. With the reduction in fixed pay and increase in variable pay opportunity, the new DRP will see a greater proportion of pay subject to malus and clawback provisions. Support for higher pay opportunities – provided any higher payout is justified by strong performance The new DRP increases the Executive Directors' pay competitiveness, though without the maximum total compensation opportunity approaching that of US peers, recognising the Group's UK-listed context – and recognising that maximum would only be delivered for outstanding outperformance, e.g. average RoTE of 14% or more. Payout ‘cross-over’ versus the current DRP, where payout under the proposed DRP equals that under the current DRP, is c.11% RoTE, a level achieved in only one of the last 10 years, and higher than our previous greater-than-10% external RoTE target. Other levels of maximum total compensation opportunity were considered. Balancing the range of considerations and perspectives, the Committee determined the proposals to provide the appropriate level of maximum total compensation opportunity. Recognition that Barclays has consistently set stretching targets, and will continue to do so For example, over 2019-2023 (the five years prior to the DRP review) the average CEO annual bonus outcome was 67% of maximum, and the average LTIP vesting was 49%. Recent bonus and LTIP calibrations are aligned with the Group’s external targets and truly stretching, with maximum payout only for performance well above those targets. For example, maximum 2024-2026 LTIP payout requiring delivery of 2026 RoTE of 14% is extremely stretching in light of our 2026 external target of >12% RoTE. Calibrations for 2025-2027 LTIP require sustained RoTE performance of 14% over 2026 and 2027 to achieve maximum payout (as shown on page 128). Support for increased shareholding requirements Shareholding requirements to be equal to the LTIP opportunity. This results in a significant increase in the absolute value from the shareholding required under the current DRP, an increase by 27% for the CEO and 15% for the GFD. Strategy Shareholder information Climate and sustainability report Risk review Financial review Financial statements Barclays PLC 2024 Annual Report on Form 20-F 135Governance Remuneration report (continued)
Executive Directors' policy on recruitment Barclays operates in a highly specialised sector and many of its competitors for talent are outside of the UK. The Committee’s approach to remuneration on recruitment of a new Executive Director is to pay the amount necessary to fill the role with a suitable candidate of the quality required to fulfil the role successfully, while avoiding paying more than is necessary. Approval of the remuneration package offered on appointment to any new Executive Director is a specific requirement of the Committee’s Terms of Reference. The terms of such packages must be approved by the Committee in consultation with the Chairman and (except for the terms of his own remuneration or that of his successor) the Group Chief Executive. Any new Executive Director’s package would include the same elements as those of the existing Executive Directors, as follows. Element and purpose Operation Fixed Pay In line with policy Pension In line with policy Benefits In line with policy Annual bonus and LTIP award The ongoing annual bonus and LTIP award eligibility for an appointment to the Group Chief Executive or Group Finance Director role would be as set out in the policy table for Executive Directors. If any new Executive Director role is appointed to the Board, the Committee will consider the appropriate maximum annual bonus and maximum LTIP opportunities for the role, as a multiple of salary. Neither of these will exceed the parameters of the policy for the Group Chief Executive. The maximum level of variable remuneration that may be awarded following recruitment is 250% of salary under the annual bonus and 550% of salary for the Group Chief Executive and 500% of salary for the Group Finance Director under the LTIP (excluding any buy-outs, as described below), in line with policy maxima for the existing Executive Directors. Buy-out The Committee can consider buying out forfeited incentive opportunity and/ or incentive awards that the new Executive Director has forfeited as a result of accepting the appointment with Barclays, subject to proof of forfeiture where applicable. The Committee will take reasonable steps to ensure that any award made to compensate for forfeited remuneration from the new Executive Director’s previous employment is not more generous than, and mirrors as far as possible the expected value, timing, form of delivery and terms of the forfeited remuneration, and ensure the award is in the long-term best interests of Barclays. All buy-out awards will comply with regulations and Barclays’ deferral policy shall apply as a minimum to any buy-out of annual bonus opportunity. The value of any buy-out is not included within the maximum annual bonus and LTIP award levels above since it relates to a buy-out of forfeited incentive opportunity or incentive awards from a previous employer. Notice periods Notice from the Company and from the Executive Director will normally be six months. Legal fees The Group may pay reasonable fees (plus any associated tax liabilities) for a new Executive Director to obtain independent legal advice in relation to their appointment. Any remuneration commitment made prior to an individual becoming a Director and not in anticipation of their appointment to the Board may be honoured, even where it is not consistent with the DRP in place at the time the commitment was made or at the time it is fulfilled. For these purposes, commitments include but are not restricted to the satisfaction of past awards of variable remuneration, the terms of which are set at the time the award is granted. Strategy Shareholder information Climate and sustainability report Risk review Financial review Financial statements Barclays PLC 2024 Annual Report on Form 20-F 136Governance Remuneration report (continued)
Executive Directors’ policy on payment for loss of office (including following a takeover) The Committee’s approach to payments in the event of termination is to take account of the individual circumstances including the reason for termination, individual performance, contractual obligations and the terms of the deferred bonus plans and LTIPs in which the Executive Director participates. Notice period Executive Directors may be required to work during their notice period, or may be placed on garden leave, or may not be required to work the full notice period and instead may be provided with pay in lieu of notice. For C.S. Venkatakrishnan, the contractual notice period is 12 months’ notice from the Company and six months’ notice from the Executive Director, as his existing notice period prior to his appointment to the Board was honoured when he was promoted to the Board. For Anna Cross, the contractual notice period is six months’ notice from the Company and six months’ notice from the Executive Director (she did not have any pre-existing contractual commitment to a longer period). Pay during notice period or payment in lieu of notice per service contracts Salary and pension allowance will continue to be paid monthly, and other contractual benefits provided, through the notice period. Where Barclays elects to terminate employment with immediate effect by making a payment in lieu of notice, the Executive Director will receive salary as a lump sum or in instalments. Any payments may be subject to mitigation as relevant. In the event of termination for gross misconduct neither notice nor payment in lieu of notice is given. Eligibility for annual bonus and LTIP awards There is no automatic entitlement to be granted a bonus or LTIP award for the year of termination, but eligibility for either or both may be considered at the Committee’s discretion, pro-rated for service, and subject to performance measures being met. No annual bonus or LTIP award would be granted in the case of gross misconduct or resignation. Treatment of unvested deferred bonus and LTIP awards The treatment of unvested deferred bonus or LTIP awards will be in accordance with the relevant plan rules. Unvested deferred bonus and LTIP awards normally lapse if the Executive Director leaves by reason of resignation prior to the fifth anniversary of the date of grant, is terminated for gross misconduct or cause, or is otherwise not an ‘eligible leaver’. Eligible leaver is defined as leaving due to injury, disability or ill health, retirement, redundancy, the business or company which employs the Executive Director ceasing to be part of the Group, or otherwise at the discretion of the Committee. The Committee will normally apply its discretion to apply eligible leaver status in the event of resignation after the fifth anniversary of grant, or in the case of deferred bonuses if it is the employer that terminates employment (other than in circumstances that amount to gross misconduct or dismissal for cause). Where eligible leaver treatment applies, deferred bonus and LTIP awards will normally continue to vest, on the scheduled vesting dates and subject to the rules of the relevant plan, unless the Committee determines otherwise in exceptional circumstances. On death, deferred bonus and LTIP awards are normally accelerated and deferred bonus awards are released in full. In an ‘eligible leaver’ situation and in the case of death, LTIP awards are pro-rated for time (over the whole performance period, including the preliminary performance period prior to grant) and with the proportion that vests remaining subject to performance against the performance conditions, subject to the Committee’s discretion to determine otherwise, in accordance with the plan rules, as amended from time to time. Any post-vesting holding period to which vested or unvested shares may be subject, under the terms of their award, will normally continue to apply following cessation of employment. Unvested awards that continue beyond termination remain subject to malus provisions, which enable the Committee to reduce the vesting level of deferred bonuses and LTIP awards (including to nil), and after vesting awards remain subject to clawback provisions (as described in the main policy). In the event of a takeover or other major corporate event, the Committee has absolute discretion to determine whether all outstanding awards would vest early (subject to applicable regulation and to achievement, or the Committee’s estimate of achievement, of any performance conditions for the LTIP) or whether they should continue in the same or revised form following the change of control. The Committee may also determine that participants may exchange existing awards for awards over shares in an acquiring company with the agreement of that company. In the event of an internal reorganisation, the Committee may determine that outstanding awards will be exchanged for equivalent awards in another company. Repatriation Except in the case of gross misconduct or resignation, where an Executive Director has been relocated at the commencement of or during their employment, the Company may pay for the Executive Director’s repatriation costs in line with Barclays’ general employee mobility policy including temporary accommodation, payment of removal costs and relocation flights for the Executive Director, spouse and children. The Company will pay the Executive Director’s tax on the relocation costs but will not tax equalise and will also not pay tax on his or her other income relating to the termination of employment. Other Except in the case of gross misconduct or resignation, the Company may pay for the Executive Director’s legal fees and tax advice relating to the termination of employment and other reasonable benefits and provide outplacement services, plus any tax liabilities that may arise as a result. Standard provision Commentary Strategy Shareholder information Climate and sustainability report Risk review Financial review Financial statements Barclays PLC 2024 Annual Report on Form 20-F 137Governance Remuneration report (continued)
Illustrative scenarios for Executive Directors' remuneration The charts below show the potential value of the current Executive Directors’ 2025 total remuneration in four scenarios: ‘Minimum’ (i.e. salary, pension and benefits), ‘Mid-point’ (i.e. salary, pension, benefits and 50% of the maximum variable pay that may be awarded), ‘Maximum’ (i.e. salary, pension, benefits and the maximum variable pay that may be awarded) and ‘Maximum with illustrative share price increase applied to LTIP’ (‘Maximum’ scenario, assuming share price appreciation of 50% on the LTIP). These charts assume a constant share price, save for the illustrative share price appreciation applied to the LTIP value only in the latter scenario. The value of pension and benefits in these charts is based on an estimated annual value for regular contractual benefits provision during 2025. Additional ad hoc benefits may arise (for example overseas relocation of Executive Directors if that was required) but will always be provided in line with the DRP. A significant proportion of the potential remuneration of the Executive Directors is performance related, delivered in Barclays shares, subject to deferral, and subject to malus and clawback terms. Group Chief Executive £m 0 2 4 6 8 10 12 14 16 18 Group Finance Director £m 0 2 4 6 8 10 12 14 16 18 n Fixed Pay1 n LTIP n Pension and benefits2 n Potential outcome of a 50% share price increase on the LTIPn Annual bonus Notes: 1 The Fixed Pay shown reflects each Executive Director's annual salary under the new DRP with effect from 7 May 2025. 2 Pension and benefits include the value of cash in lieu of pension and the anticipated value of taxable benefits. Strategy Shareholder information Climate and sustainability report Risk review Financial review Financial statements Barclays PLC 2024 Annual Report on Form 20-F 138Governance Remuneration report (continued) Minimum 90% 10% Total: 1.06 Mid-point 21% 2% 26% 51% Total: 4.62 Maximum 12% 1% 29% 58% Total: 8.18 Maximum with illustrative share price increase applied to LTIP 9% 1% 22% 46% 22% Total: 10.56 Minimum 86% 14% Total: 1.84 Mid-point 19% 3% 24% 54% Total: 8.20 Maximum 11% 2% 27% 60% Total: 14.56 Maximum with illustrative share price increase applied to LTIP 8% 1% 21% 47% 23% Total: 18.94
Remuneration policy – Non-Executive Directors Fees Reflect individual responsibilities and membership of Board Committees and are set to attract Non-Executive Directors who have relevant skills and experience to oversee the implementation of our strategy Fees are set at a level which reflects the role, responsibilities and time commitment which are expected from the Chair and Non-Executive Directors The Chair is paid an all-inclusive fee for all Board responsibilities. The Chair has a time commitment equivalent of up to 80% of a full-time role. The other Non- Executive Directors receive a basic Board fee, with additional fees payable where individuals take on additional roles or responsibilities, including, but not limited to, serving as a member or Chair of a Committee of the Board or as a Senior Independent Director. Fees are periodically reviewed by the Board. Non-Executive Directors may also receive fees where they serve as directors of subsidiary companies of Barclays PLC. In the case of certain subsidiary appointments, such additional remuneration is approved by the Barclays PLC Board Remuneration Committee. No variable pay is provided, enabling the Chair and Non- Executive Directors to maintain appropriate independence, focus on long-term decision-making and constructively review and challenge the performance of the Executive Directors. Fees are reviewed against those for Non- Executive Directors in banks and other companies of similar size and complexity. Other than in exceptional circumstances, fees will not increase by more than 20% above the current fee levels during this policy period. Additional fees may be paid for new Committees of the Board and / or where a Non-Executive Director takes on additional responsibilities and / or performs an additional role, provided these are not greater than fees payable for the existing roles on the Committees of the Board as detailed in the Annual report on Directors' remuneration. Any increases to such additional fees over the period of the policy will be made in accordance with the principles set out above for current fees. Benefits To provide a competitive and cost effective benefits package appropriate to the role and location The Chair is provided with private medical cover subject to the terms of the Barclays’ scheme rules from time to time, and is provided with the use of a Company vehicle and driver when required for business purposes (including settlement of any tax liabilities that may arise from this benefit). Benefits which are minor in nature and in any event do not exceed a cost of £500 may be provided to Non- Executive Directors. Non-Executive Directors are not eligible to join Barclays’ pension plans. Expenses The Chair and Non-Executive Directors are reimbursed for any reasonable and appropriate expenses incurred for business reasons. Any tax that arises on these reimbursed expenses is paid by Barclays. Bonus and share plans The Chair may be invited to participate in Sharesave, an HMRC employee tax advantaged share scheme, due to the level of their time commitment to the role. The Chair is not eligible to participate in any other Barclays’ cash, share or long-term incentive plans. All other Non-Executive Directors are not eligible to participate in Barclays’ cash, share or long-term incentive plans. Shareholding requirements An element of the basic fee before deduction of tax and other statutory deductions, equal to £100,000 for the Chair and £30,000 for each Non-Executive Director, is used to purchase Barclays’ shares which are retained on the Non-Executive Director’s behalf until they retire from the Board. Notice and termination provisions Instead of service contracts, the Chair and the Non-Executive Directors each have a letter of appointment that reflect their responsibilities and time commitments. Non-Executive Directors are entitled to notice under their letters of appointment but, other than in respect of the Chair, no compensation is due in the event of termination, other than standard payments for the period served up to the termination date. Each Director’s appointment is for an initial three-year term, renewable at Barclays’ discretion for a further term of three years thereafter and subject to annual re-election by shareholders. Non-Executive Directors appointed beyond six years will be at the discretion of the Board Nominations Committee. Notice period Chair: Six months from the Company, six months from the Chair. Termination payment policy The Chair’s appointment may be terminated by Barclays on six months’ notice or immediately in which case six months’ fees are payable in instalments at the times they would have been received had the appointment continued, but subject to mitigation if they were to obtain alternative employment. No continuing payments of fees (or benefits) are due if a Non-Executive Director is not re-elected by shareholders at the Barclays PLC AGM. Element and purpose Operation Maximum value In accordance with the policy table above, any new Chair would be paid an all-inclusive fee only and any new Non-Executive Director would be paid a basic fee for their appointment as a Non- Executive Director, plus fees for their participation on and/or chairing of any Board committees and for taking on additional responsibilities and/ or performing an additional role, time apportioned in the first year as necessary. No sign-on payments are offered to Non-Executive Directors. Strategy Shareholder information Climate and sustainability report Risk review Financial review Financial statements Barclays PLC 2024 Annual Report on Form 20-F 139Governance Remuneration report (continued)
Annual report on Directors’ remuneration This section explains how our current Directors’ Remuneration Policy (DRP) was implemented for 2024 Executive Directors Single total figure for 2024 remuneration The following table shows a single total figure for 2024 remuneration in respect of qualifying service for each Executive Director, together with comparative figures for 2023. 1) Fixed Pay £000 2) Pension £000 3) Taxable benefits £000 Total fixed pay £000 4) Annual bonus £000 5) LTIP – excluding share price appreciation 6) LTIP – share price appreciation 7) Total LTIP £000 Total variable pay £000 Total £000 C.S. Venkatakrishnan 2024 2,935 147 95 3,177 2,219 3,285 1,852 5,137 7,356 10,533 2023 2,860 143 213 3,216 1,425 __ __ __ 1,425 4,641 Anna Cross 2024 1,837 92 15 1,944 1,336 __ __ __ 1,336 3,280 2023 1,788 89 17 1,894 879 __ __ __ 879 2,773 Note: 1 The LTIP amounts for 2024 relate to the award granted in 2022, with vesting based on performance measured over 2022 to 2024. The value was estimated using the Q4 2024 average share price of £2.5159. as this Annual Report 2024 was finalised prior to the vesting date. This is the first LTIP vesting for C.S. Venkatakrishnan following his appointment as Group Chief Executive on 1 November 2021. The share price increased by 56% between the date of grant and the share price used to estimate the award value, and column 6) separately shows the impact of share price appreciation contained in the total LTIP value. Additional information in respect of each element of pay for the Executive Directors 1) Fixed Pay Under the current DRP, Fixed Pay is delivered 50% in cash, paid monthly, and 50% in shares, delivered quarterly. The shares are subject to a holding period, with restrictions lifting over five years (20% each year). More information on the Committee's considerations in respect of the Executive Directors' Fixed Pay is set out on page 217 of the Barclays PLC Annual Report 2023. More information on the Committee's DRP review, including in respect of the Executive Directors' future fixed pay, is set out from page 124. 2) Pension Under the current DRP, Executive Directors are paid cash in lieu of pension contributions equal to 5% of their Fixed Pay (equivalent to 10% of the cash element of Fixed Pay). The pension cash allowance paid during 2024 was £146,750 for C.S. Venkatakrishnan and £91,875 for Anna Cross. No other benefits were received by Executive Directors from any Barclays' pension plan. 3) Taxable benefits Taxable benefits include private medical cover, life assurance, income protection, tax advice and the use of a Company vehicle and driver when required for business purposes. For C.S. Venkatakrishnan, the benefits figure for 2024 also includes some minor relocation support costs to the Company, in line with Barclays’ general employee mobility policies and practices, and consistent with the DRP (and for 2023 includes relocation support costs during 2023, as set out in last year's Remuneration report). Strategy Shareholder information Climate and sustainability report Risk review Financial review Financial statements Barclays PLC 2024 Annual Report on Form 20-F 140Governance Remuneration report (continued)
4) 2024 annual bonus The bonus amounts included in the single total remuneration figures are the value awarded or scheduled to be awarded in Q1 following the financial year to which it relates. In determining the bonus in respect of 2024 performance, the Committee considered the performance achieved against the Financial (60% weighting) and Strategic non-financial (25% weighting) performance measures that had been set to reflect Group priorities for 2024. Performance against each Executive Director's Personal objectives (15% weighting) for 2024 was assessed on an individual basis. The outcome for each of the Financial measures would be 0% for performance below threshold, and then was determined on a straight-line basis, between a 25% outcome for threshold performance and 100% for achievement of maximum performance. A summary of the assessment is provided in the following table. 2024 annual bonus outcomes Measures Weighting Threshold Maximum 2024 actual Outcome C.S. Venkatakrishnan Anna Cross Profit before tax (excluding material items), with CET1 ratio underpin 50% £7.0bn £9.0bn See footnote 1 40.1% 40.1% Total operating expenses3 (excluding material items) 10% £16.9bn £16.2bn See footnote 2 9.4% 9.4% Strategic non-financial 25% Performance against strategic measures, organised around four main categories: Customers & clients, Colleagues, Climate & sustainability, and Risk & operational excellence 17.5% 17.5% Personal 15% Individual performance against each of the Executive Director's personal objectives, assessed by the Committee 14.0% 13.5% Total 81.0% 80.5% Final 2024 annual bonus outcome approved by the Committee 81.0% 80.5% Note: 1 Profit before tax of £8.471bn; which excludes material items: 2024 structural cost actions of £273m and £90m provision in respect of the FCA motor finance review. The latter relates to historical activity that neither Executive Director was directly involved with given their roles at the time. C.S. Venkatakrishnan was the Chief Risk Officer when the decision was taken to exit the business in 2019. 2 Total operating expenses of £16.255bn; which excludes material items: 2024 structural cost actions of £273m, £90 provision in respect of the FCA motor finance review and the impact of the Bank of England (BoE) levy of £93m. The replacement by the BoE of the Cash Ratio Deposit scheme with the BoE levy moved this charge from negative income to an annual operating expense. This was not included when total operating expenses targets were set and so has been excluded from this measure. 3 Measured at specific FX rates so that achievement against this measure is more closely based on management's actions and decisions rather than external factors. Based on the assessment outlined above, the Committee determined an overall formulaic 2024 annual bonus outcome for C.S. Venkatakrishnan and Anna Cross that equates to £2,219,000, and £1,336,000 respectively. Further detail on the assessment of the Strategic non-financial measures, and performance against Personal objectives, is set out on the following pages. The Committee reflected on the appropriateness of these overall annual bonus outcomes, in the context of the performance achieved against the Financial measures, Strategic non-financial measures and Personal objectives. The Committee considered the underlying financial health of the Group, which is strong and well-capitalised, and more holistically the performance and contribution of each Executive Director during 2024. The bonus outcomes were considered in the context of those for the wider workforce – ensuring appropriate alignment both this year and over a multi-year period – and also by comparing to historical outcomes for the Executive Directors in the context of performance each year. The Committee believes that the overall 2024 bonus outcomes above are aligned appropriately with stakeholder considerations and with the performance achieved. Based on this, the Committee concluded that no discretionary adjustment was warranted. The 2024 annual bonus award will be paid half in upfront cash, in March 2025, and half as a grant of deferred bonus shares that will vest in two equal tranches on the first and second anniversaries of grant, followed by an additional one-year holding period from each vesting date, All of the 2024 variable pay (both the 2024 annual bonus award and the 2025-2027 LTIP award) is subject to clawback provisions, which allow the Committee to recover amounts that have been paid in certain circumstances, and the deferred elements are subject to malus provisions, which enable the Committee to delay or reduce the vesting of unvested amounts (including reducing to nil) in certain circumstances. Of the total variable pay to be awarded (the annual bonus and LTIP combined), a total of 90% of C.S. Venkatakrishnan’s 2024 variable pay will be in Barclays shares, and 89% for Anna Cross. In line with the DRP, due to regulations prohibiting dividend equivalents being paid on unvested deferred share awards, the number of shares awarded to each Executive Director under the Share Value Plan (the Group's main employee share plan for granting deferred bonus shares to employees) and LTIP will be based on the adjusted fair value of the shares over which awards are granted, taking into account that dividends do not accrue during the vesting period. The valuation will be aligned to IFRS 2 and determined by an independent adviser. Strategy Shareholder information Climate and sustainability report Risk review Financial review Financial statements Barclays PLC 2024 Annual Report on Form 20-F 141Governance Remuneration report (continued)
Colleagues Diversity 33% females at Managing Director and Director level by 2025 30% in 2024 (2023: 30%) • Senior female representation largely unchanged versus 2023 and slightly below level expected to achieve our 2025 Gender Ambition. Behind track Increase underrepresented minority1 representation in the UK by 12.5% and in the US by 5% by 2025 (from 2023 baseline) UK: 5.2% (2023 baseline of 5.1%) US: 18.6% (2023 baseline of 21%) • Achieved our previous underrepresented minority ambition two years early and reset our ambition in 2023. • In 2024, underrepresented minority representation remained broadly flat in the UK and decreased in the US. • The number of Managing Directors from underrepresented ethnicities also decreased slightly versus 2023. 50% increase in the number of Managing Directors from underrepresented ethnicities in the UK and the US combined by 2025 (from 2022 baseline of 55) 50 Managing Directors (2023: 55) Inclusion Improve inclusion indicators Inclusion Index from all- colleague Your View survey 81% (2023: 83%) • 89% of colleagues told us they feel included in their team (2023: 90%). • 83% of colleagues told us they believe that senior leaders are truly committed to building a diverse workforce (2023 85%). Slightly behind track Engagement Maintain engagement at healthy levels Employee Engagement score from Your View survey 85% (2023: 86%) • Employee Engagement score is 85%, 4% points above the Qualtrics 2023 75th percentile Financials benchmark. Ahead of track Culture Maintain culture indicators 88% of employees in Your View survey believe strongly in the goals and objectives of Barclays (2023: 89%) • Since we launched our three-year plan in February 2024, we are focused on understanding colleague perception and belief in Barclays' goals and objectives. We have introduced this as one of our four main Colleague KPIs, and are disclosing data on this for the first time (see also page 18). We will continue to track this KPI over the next two years. • As part of the Consistently Excellent culture change programme, the higher operating standard was incorporated into our existing Values and Mindset behaviours, and as part of an enhanced set of leadership behaviours in 2023. For 2024, this was integrated into performance management processes for all employees. • 86% of colleagues told us that they felt their people leader 'clearly communicates the actions they need to take to deliver consistently excellent outcomes' (new question for 2024). Slightly ahead of track 93% of employees in Your View survey believe that they and their team do a good job of role-modelling the Barclays Values every day (2023: 94%) 92% of employees in Your View survey believe that they and their team do a good job of role-modelling the Barclays Mindset every day (2023: 93%) Total Colleague: 2.75% out of 5% Measure Criteria Performance Commentary Outcome Notes: 1 Underrepresented minorities refers to individual who are Black or Multiracial (referred to as Mixed or multiple ethnic groups in the UK Census) in the UK, and African American/Black, Multiracial, Hispanic/Latinx, Native Alaskan/Native American or Native Hawaiian/Pacific Islander in the US. Strategy Shareholder information Climate and sustainability report Risk review Financial review Financial statements Barclays PLC 2024 Annual Report on Form 20-F 143Governance Remuneration report (continued)
Climate & sustainability Sustainable and Transition Financing Facilitate $1trn of Sustainable and Transition Financing between 2023 and end of 2030 $94.4bn • Facilitated $94.4bn of Sustainable and Transition Financing in 2024, up 39% versus 2023, making progress towards our 2030 target. • Future progress and our ability to meet our target will be dependent on a number of factors and variables outside our control, such as market conditions, policy, laws, regulation, geopolitical developments and stakeholder expectations. On track Reducing our financed emissions Deliver progress on our commitment to align our financing with the goals and timelines of the Paris Climate Agreement: • For power and upstream energy, we are on track to achieve 2025 targets. • We recognise that continued focus is required to reduce our financed emissions in line with our commitment to become a net zero bank by 2050. • Future progress against these targets will likely be non- linear and may be volatile due to the many external dependencies and variables beyond Barclays’ control that may determine the pace of transition and impact our strategy and ability to achieve our targets. On track 30% reduction in power portfolio emissions intensity (Scope 1) by the end of 2025, from a 2020 baseline Power portfolio emissions intensity: 219KgCO2e/ MWh, 30% down versus 2020 15% reduction in upstream energy portfolio absolute emissions (Scope 1, 2 and 3) by the end 2025, from a 2020 baseline Upstream energy portfolio absolute emissions: 41.1MtCO2e, 45% down versus 2020 Reducing our greenhouse gas (GHG) emissions 90% reduction in Scope 1 and 2 GHG emissions by the end of 2025 (market-based, against a 2018 baseline) 95% reduction • Continued to track ahead of our target, reducing our absolute Scope 1 and 2 market-based emissions by 95%. Ahead of track Renewable electricity 100% renewable electricity sourcing for our global real estate portfolio by the end of 2025 100% • Maintained and continued to track ahead of our target date, sourcing 100% renewable electricity for our global real estate portfolio1. Ahead of track LifeSkills – people upskilled Upskill 8.70 million people from 2023 to the end of 2027 1.95m upskilled in 2024 • From 2023, new investment through LifeSkills is focused on targeted support for people in the most underserved communities and underrepresented groups. • In 2024, the number of people upskilled exceeded our per annum target. Slightly ahead of track LifeSkills – people placed into work Place 250,000 people into work (2023 to the end of 2027) 53,494 people placed into work in 2024 • Exceeded our per annum target of 50,000 people placed into work in 2024. Slightly ahead of track Unreasonable Impact (partnership with the Unreasonable Group) Support an additional 200 businesses solving social and environmental challenges (2023 to the end of 2027) 38 ventures supported in 2024 • The strategic partnership with Unreasonable Group was renewed in 2023 to enable Barclays to support an additional 200 entrepreneurs over 5 years. 348 ventures have been supported so far, collectively raising over $14bn in financing and employing more than 31,000 people. • We remain on track to achieve our 2027 target. On track Total Climate & sustainability: 4.25% out of 5% Measure Criteria Performance Commentary Outcome Notes: 1 Global real estate portfolio includes offices, branches, campuses and data centres within our operational control. Strategy Shareholder information Climate and sustainability report Risk review Financial review Financial statements Barclays PLC 2024 Annual Report on Form 20-F 144Governance Remuneration report (continued)
Risk & operational excellence Category Performance Risk awareness • The Committee was satisfied that the Group operated in line with its Board-approved risk appetite. • ‘Being consistently excellent’ workshops have been running throughout 2024. The workshops provide our people with the skills and knowledge to take personal accountability for driving higher standards across the organisation, with a focus on remediating risk and control weaknesses. All Managing Directors, Directors and Vice President People Leaders have completed their workshops. • Litigation and conduct costs were £220m, including a provision of £90m in respect of the FCA’s review into historical motor finance commission arrangements. A management decision was taken in 2019 to exit this business, following a strategic review. Excluding this provision, litigation and conduct costs were £130m. • The trend of conduct breaches year on year improved. Operational excellence • The control environment continues to improve, as business areas and functions strengthened reporting and controls while pursuing remediation initiatives to address key issues. • During 2024, total operational risk losses1 reduced to £124m (2023: £141m) and the number of recorded events for 2024 (2,395) decreased from the level for 2023 (2,925). The total operational risk losses for the year were mainly driven by events falling within the External fraud and Execution delivery & process management categories, which tend to be higher in volume but smaller in magnitude. • 58% reduction on major technology incidents vs. 2023. • High standards of internal service delivery retained during 2024, with 97% of Service Level Agreements meeting their target. Total Risk & operational excellence: 7% out of 10% Overall strategic non-financial outcome for the 2024 annual bonus (out of a maximum possible 25%) 17.5% Note: 1 The data disclosed includes operational risk losses for reportable events impacting the Barclays Group business areas, having an impact greater than £10,000 and excludes events that are compliance or legal risk, aggregate and boundary events. A boundary event is an operational risk events that results in a credit risk impact. Due to the nature of risk events that keep evolving, prior year losses are updated. Strategy Shareholder information Climate and sustainability report Risk review Financial review Financial statements Barclays PLC 2024 Annual Report on Form 20-F 145Governance Remuneration report (continued)
Assessment of performance against the Personal objectives set for the 2024 annual bonus (15% weighting) Individual performance against each of the Executive Directors’ personal objectives for 2024 was assessed by the Committee. Performance for C.S. Venkatakrishnan and Anna Cross was assessed against both the individual objectives set for their respective roles and their shared personal objectives, which had a 15% weighting overall for each Executive Director's 2024 annual bonus. The table below summarises performance against the shared personal objectives. Shared personal objectives for C.S. Venkatakrishnan and Anna Cross Deliver new financial targets including RoTE and capital distributions • Met our 2024 financial targets, with operational and financial performance improvement driven by disciplined execution of the three-year plan announced in February 2024. • Delivered Group statutory RoTE of 10.5%1, achieving 2024 target of >10%2. • Group NII excluding IB and Head Office of £11.2bn3, achieving 2024 target of >£11.0bn, of which Barclays UK NII was £6.5bn. • The Group cost: income ratio was 62% (2023: 67%), achieving our target of c.63%, as the Group delivered the targeted £1.0bn gross cost efficiency saving in FY24. • Total capital distributions of £3.0bn announced in relation to 2024 (2023: £3.0bn), comprising £1.2bn of dividends and £1.75bn of share buybacks. Maintain robust capital ratios across the Group and within the main operating entities • Strong capital position maintained, with a Group CET1 ratio of 13.6%, within our target range of 13% to 14%. • Similarly strong capital ratios prevail in all main operating entities: at the end of 2024, Barclays Bank PLC’s CET1 ratio was 12.1% and Barclays Bank UK PLC’s CET1 ratio was 14.2%, well in excess of regulatory minimums. Continue to simplify the organisation in terms of its operations and financial reporting • Introduced updated business structure in February 2024 with five business divisions – BUK, UKCB, PBWM, IB and USCB – which enables the Group to be organised and operate in a simpler way, delivering greater accountability and transparency to our shareholders, supporting synergies across the Group. • Delivered against the strategic actions we set out in February 2024, selling our German consumer finance business and Italian mortgage book. • Continued to upgrade legacy technology, decommissioning 210 legacy applications (450-500 legacy applications to be decommissioned over 2024 to 2026). Deliver better customer outcomes, income quality and investment priorities across our businesses • Continued to progress investment and income opportunities across our businesses, including completing the acquisition of Tesco Bank. • Invested in customer technology across the Bank – introduced enhanced features in the Barclays banking app, implemented our end-to-end global trade finance solution, Trade360, and improved our Smart Investor digital investing proposition. • The Investment Bank continued to grow income, with a focus on more stable income streams. Global Markets deepened relationships with the top 100 clients: we are now ranked top 5 at 56 of those clients (2023: top 5 at 49)4. Investment Banking maintained its traditional strengths in DCM, while making progress in rebalancing its footprint towards Advisory and ECM. • The US Consumer Bank launched a new co-branded card programme with Breeze Airways, and extended our existing partnership agreements with Hawaiian Airlines, Frontier and RCI, while also expanding its online retail deposits business. Demonstrate progress towards reallocating capital to the highest returning businesses • Deployed £13bn5 of RWAs, of c.£30bn planned RWA growth through to 2026, into business growth activity across our three highest-returning divisions, including c.£7bn RWAs from the Tesco Bank acquisition. • Investment Bank RWAs as a percentage of Group RWAs reduced from 58% in 2023 to 56% in 2024. The growth in income, together with stronger management of RWAs, allowed it to deliver revenue over average RWAs of 5.8%, up 30bps on 2023. Continue to drive the sustainability strategy of the bank to achieve our ambition to be a net zero bank by 2050 • Facilitated $162.2bn of Sustainable and Transition Financing since 2023 (of which $94.4bn in 2024), against our target to facilitate $1trn by the end of 2030. Additionally, Barclays Climate Ventures, formerly Sustainable Impact Capital, has a mandate to invest up to £500m of the Bank’s own capital in climate tech start-ups by the end of 2027. To date, £203m investments have been made, including £65m deployed in 2024. • Barclays UK has lent £1.1bn through our Green Home Mortgage product to support customers to purchase energy efficient new-build homes (£4.7bn since 2018). • The UK Corporate Bank has developed a partnership with the National Wealth Fund to provide up to £500m of sustainable lending to social housing clients. • The Investment Bank helped National Grid raise a £7bn equity rights issue, which will help upgrade grid infrastructure in the UK and US. Objective Outcomes Notes: 1 Please refer to the "Non-IFRS performance measures" section of this Annual Report on Form 20-F for further information on and a reconciliation of the non-IFRS measure “return on tangible equity” against the most directly comparable IFRS measure. 2 Management does not assess forward-looking “return on equity” (target RoE) as a performance indicator of the business, and therefore reconciliation of the forward-looking non-IFRS measure “return on tangible equity” (target RoTE) to an equivalent IFRS measure is not available without unreasonable efforts. 3 Please refer to the "Non-IFRS performance measures" section of this Annual Report on Form 20-F for further information on and a reconciliation of the non-IFRS measure “Group NII excluding IB and Head Office” against the most directly comparable IFRS measure. 4 Based on Barclays analysis using internal and external sources. 5 £13bn represents RWAs from business growth but excludes the effects of securitisations, model updates and other methodological changes. Total RWA increase to the three UK businesses is £15bn. Strategy Shareholder information Climate and sustainability report Risk review Financial review Financial statements Barclays PLC 2024 Annual Report on Form 20-F 146Governance Remuneration report (continued)
The table below summarises performance against the personal objectives for Anna Cross. Personal objectives for Anna Cross Objective Outcomes Continue to simplify, standardise and automate Finance and Treasury processes to improve effectiveness and efficiency • Expanded the range of Artificial Intelligence and Machine Learning initiatives being piloted in the Finance function. • Launched the Finance Transformation Office, with a mandate to develop and drive a strategy for the wholesale transformation of the function. Appropriate management of capital and resources using oversight committees to ensure we comply with governance and regulatory requirements • The Group continues to exceed regulatory requirements for overall capital, leverage and Minimum Requirement for Own Funds and Eligible Liabilities. • The Group’s CET1 target ratio of 13-14% takes into account minimum capital requirements and applicable buffers. The Group remains above its minimum capital regulatory requirements and applicable buffers. Effectively manage relationships with key external stakeholders, including regulators and investors • Continued to deepen relationships with the investment community and regulators, including extensive engagement with shareholders after the February Investor Update • Regularly meets with our principal regulators, to provide them with the transparency they require on key issues. • Chairs the 100 Group Main Committee, which represents the views of the finance directors of FTSE 100 and several large UK private companies Oversee the effective management of risk and control across Group Finance, ensuring we take full ownership of our end- to-end processes • Enhanced Financial Reporting Risk framework, delivering a simplified and transparent risk management framework, with revised Key Indicators and identification of early warning measures. • The Finance Control Environment and Management Control Approach were strengthened during 2024 and are overall rated Satisfactory. Retain focus on the colleague agenda across Group Finance - driving employee engagement, continuing to improve diversity & inclusion, developing senior talent and succession • Maintained a strong level of colleague engagement across Finance, at 81% (2023: 85%) • Continued focus on embedding the Barclays Mindset within the function, with high scores on all three indices: Empower at 84% (2023: 87%), Challenge at 82% (2023:84%), and Drive at 86% (2023: 88%) • Senior female representation in Group Finance was 33% at the end of 2024 The Committee recognised Anna Cross's very strong performance during 2024, ensuring delivery towards the achievement of the Group’s three-year plan, and the substantial achievements against both her individual and shared personal objectives. Based on that performance, the Committee assessed that an outcome of 13.5% out of a maximum of 15% was appropriate. 5) Vesting of the 2022-2024 LTIP cycle (also covers sections 6 and 7 of the single figure) The total LTIP value included in the single total figure for 2024 for C.S. Venkatakrishnan is based on the amount that will be released on 7 March 2025 in relation to the 2022-2024 LTIP award granted in March 2022. No LTIP award was granted to Anna Cross in March 2022 as she was not an Executive Director at that time. The total LTIP value that will vest to C.S. Venkatakrishnan (column 7 in the single figure) has been estimated using the Q4 2024 average share price of £2.5159, as this Annual Report 2024 was finalised prior to the vesting date. Of the estimated LTIP value, 36% relates to share price appreciation between the grant date of the award and the share price used to estimate the award value. Column 5) of the single total figure for remuneration shows the estimated LTIP value excluding the impact of share price appreciation and column 6) shows the value of the share price increase. Release is dependent on, among other things, performance over the period from 1 January 2022 to 31 December 2024. In determining what proportion of the award would vest, the Committee considered the performance achieved against the Financial (70% weighting) and non-financial (30% weighting) performance measures that had been set shortly before the award was granted. The outcome for each of the Financial measures would be 0% for performance below threshold. The outcome for threshold performance under the average return on tangible equity and average cost: income ratio measures would be 0%, and for the relative total shareholder return measure would be 25%, rising on a straight-line basis to 100% for achievement of maximum performance for each of those measures. The CET1 ratio measure operates differently, as described in the table on the following page. A summary of the assessment of performance is also provided in that table. Strategy Shareholder information Climate and sustainability report Risk review Financial review Financial statements Barclays PLC 2024 Annual Report on Form 20-F 148Governance Remuneration report (continued)
2022-2024 LTIP outcomes Average return on tangible equity (RoTE) (excluding material items1,2) 25% 0% of award vests for RoTE of 7.0%, rising on a straight-line basis 25% of award vests for RoTE of 11.0% or higher 11.3%3 25.0 % Average cost: income ratio (excluding material items)4 10% 0% of award vests for average cost: income ratio of 65.0%, rising on a straight-line basis 10% of award vests for average cost: income ratio of 59.0% or lower 63.1% 3.2% Maintain CET 1 ratio within the target range 10% If CET1 is below MDA hurdle +190bps during the period, the Committee will consider what portion of this element should vest, based on the causes of the CET1 reduction. If CET1 is above MDA hurdle +290bps but does not make progress towards the range over the period, the Committee will consider what portion of this element should vest, based on the reasons for the elevated levels of CET1 versus target range and the associated impacts. If CET1 ratio between 190bps and 290bps above the MDA hurdle throughout the period or if CET1 is above MDA hurdle +290bps but making progress towards the target range 2022:13.9% 2023:13.8% 2024:13.6% (more information is provided below the table) 10.0 % Relative total shareholder return5 25% 6.25% of award vests for performance at median of the peer group6, rising on a straight-line basis 25% of award vests for performance at or above the upper quartile Between median and upper quartile (rank 9 out of 18) 8.5% Strategic non-financial measures (details from page 150) 20% The evaluation focused on key strategic non-financial measures, which the Committee assessed to determine the percentage of the award that will vest, between 0% and 20%. The measures are organised around three main categories: Customers & clients (weighted 5%), Colleagues (weighted 5%); and Climate & sustainability (weighted 10%). 14.0% Risk scorecard (details on page 152) 10% The Risk scorecard captures a range of risks and is aligned with the annual incentive risk alignment framework shared with the regulators. The framework measures performance against three broad categories – Capital & liquidity, Control environment and Conduct – using a combination of quantitative and qualitative metrics. 6.8% Total 67.5% Final 2022-2024 LTIP vesting outcome approved by the Committee 67.5% Performance measure Weighting Threshold Maximum vesting Actual % of award vesting Notes: 1 Barclays Group average tangible shareholder’s equity based on an assumed CET1 ratio at the mid-point of the Group range, 13-14% (2024: £50.5bn; 2023: £46.5bn; 2022: £47.7bn). 2 Material items consist of post-tax structural cost actions (2024: £209m; 2023: £739m taken in Q423; 2022: £110m), post-tax provision of £68m recognised in respect of the 2024 FCA motor finance review, 2022 customer remediation post-tax provision of £228m relating to legacy loan portfolios, and 2022 re-measurement of UK deferred tax assets of £346m. The litigation and conduct impacts from the Over-issuance of Securities and the devices settlements are not excluded. 3 Please refer to the "Non-IFRS performance measures" section of this Annual Report on Form 20-F for further information on and a reconciliation of the non-IFRS measure “return on tangible equity” against the most directly comparable IFRS measure. 4 Material items consist of certain structural cost actions (2024: £273m; 2023: £927m taken in Q423; 2022: £151m), provision of £90m recognised in respect of the 2024 FCA motor finance review, impact of the Bank of England levy scheme of £93m in 2024 and corresponding benefit to 2024 income from closure of the Cash Ratio Deposit scheme (c.£75m), and 2022 customer remediation provision of £282m relating to legacy loan portfolios. The litigation and conduct impacts from the Over-issuance of Securities in 2022 and 2021 and the devices settlements in 2022 are not excluded. 5 Performance assessed over the period from 1 January 2022 to 31 December 2024, using the Q4 average TSR data for 2021 and 2024 respectively, measured in GBP for each company. 6 The total shareholder return peer group is comprised of multinational banks in the UK, Europe and North America of comparable size to Barclays and with a high degree of correlation to Barclay of weekly share price returns. The peer group for the 2022-2024 LTIP award consists of: Banco Santander, Bank of America, BBVA, BNP Paribas, Citigroup, Credit Agricole, Credit Suisse, Deutsche Bank, HSBC, ING Groep, Lloyds Banking Group, Morgan Stanley, NatWest Group, Societe Generale, Standard Chartered, UBS and Unicredit. The CET1 ratio target was set in early 2022 as a range of 190bps to 290bps above the regulatory Minimum Distributable Amount (MDA). At that time the MDA hurdle was 11.1% so the LTIP target range was consistent with our externally disclosed CET1 target range of 13% to 14% (which was the external target at that time and remains so). Since then, the MDA hurdle increased from 11.1% to 12% but the Group decided to maintain its external target range for the CET1 ratio at 13% to 14%. As a result, the formulaic LTIP target range for the CET1 ratio works out at 13.9% to 14.9% and is misaligned with our external target range of 13% to 14%. As the CET1 ratio was 13.6% at the end of 2024 (and 13.8% in 2023), below the bottom of the LTIP target range, as required under this performance target the Committee considered what portion of this element should vest based on the reason why the CET1 ratio was below the formulaic range. The external target range of 13% to 14% reflects the judgement of the Board as to the appropriate CET1 ratio for the Group to operate within. The CET1 ratio over the period 2022-24 remained consistently within that range, as originally intended, allowing capital to be returned to shareholders via a progressive dividend and a series of share buy-backs. As such, the Committee was satisfied that the reason the CET1 ratio fell outside the defined LTIP range was technical in nature, that the Group’s capital position had been appropriately and sensibly managed in the interests of shareholders and within the Board’s target range, and that it was appropriate that this portion of the LTIP should vest in full. Strategy Shareholder information Climate and sustainability report Risk review Financial review Financial statements Barclays PLC 2024 Annual Report on Form 20-F 149Governance Remuneration report (continued)
Assessment of the Strategic non-financial measures for the 2022-2024 LTIP A summary of the Committee’s assessment against the Strategic non-financial performance measures over the three-year performance period follows. The measures used reflect key strategic priorities of the Group. Measure Criteria Performance commentary Customer & clients Global Markets revenue ranking and share1 Maintain client rankings and market share • Global Markets revenue ranking was maintained at 6th over the period. Revenue share is also largely unchanged (6.3% for 2024 compared to 6.4% in 2021). Investment Banking fee ranking and share2 • Investment Banking fee rank was 6th in 2021 and remains at 6th in 2024. Fee share fell from 3.6% in 2021 to 3.3% in 2024. Barclays UK NPS USCB Non-digital Care tNPS3 USCB Digital Composite tNPS4 Improve • Barclays UK NPS score improved by 6 points over the period, ending at +17. • USCB has focused on improving the mobile app and other online self-service facilities, as well as better equipping call centre operations to improve customer service. This is reflected in an increase in Transaction Net Promoter Scores for both non-digital (contact centre) and digital servicing. Barclays UK customer complaints Reduce customer complaints and improve resolution time • Barclays UK customer complaints reduced over the period, driven by our targeted actions to improve the customer experience. • In 2024, 96% of complaints were resolved within 56 days, up from 94% in 2021. Barclays UK digitally active customers USCB digitally active customers5 Increase digital engagement • Steady increase in the number of Barclays UK digitally active customers over the period. • New app features introduced throughout the period. • The proportion of digitally active customers in USCB decreased as expected following the acquisition of a partnership credit card portfolio from Gap in 2022, but has been increasing year- on-year since then. Total Customer and clients: 3% Notes: 1 Global Markets market share for Barclays is based on external reported revenues of peer banks BofA, BNP, CITI, DB, GS, JPM, MS and UBS. 2 Investment Banking fee share for Barclays calculated by Dealogic for the period covering 1 January 2021 to 31 December 2024. 3 USCB Non-Digital Care tNPS measures customer experience across Contact Centre Agent Servicing, including Care + Chat, Fraud, Disputes & Credit (2021: Care + Chat only). 4 USCB Digital Composite tNPS measures USCB customer experience at the digital journey level. 5 USCB digitally active customers represents the percentage of USCB balance-active consumer card customers who have logged in to either Web or App within the past 90 days. 2022 and beyond includes Gap customers. Measure Criteria Performance commentary Colleagues Gender diversity 33% females at Managing Director and Director level by 2025 • Percentage of employees in Managing Director and Director roles who are female has increased over the period, from 28% in 2021 to 30% in 2024. • Equivalent figure for Barclays in the UK is now 33%. Underrepresented minority representation Increase underrepresented minority1 representation in the UK by 12.5% and in the US by 5% by 2025 (from 2023 baseline) 50% increase in the number of Managing Directors from underrepresented ethnicities in the UK and the US combined by 2025 (from 2022 baseline) • At the end of 2023, 5.1% of UK and 21% of US colleagues were from underrepresented ethnicities. • We have now reset this ambition for 2025. • Achieved our Ambition to double the number of Black MDs by 2022 and reset this ambition, to deliver a 50% increase in Managing Directors from underrepresented ethnicities in the UK and US combined by 2025 (from 2022 baseline). Inclusion Improve inclusion indicators • The inclusion index is at 81% for 2024, up from 79% in 2021. • 89% percentage of employees in the Your View survey told us they feel included in their team (2021: 88%). Engagement Maintain engagement at healthy levels • Engagement levels across Barclays are at 85%, up 3% points since 2021. • The percentage of employees in Your View survey who would recommend Barclays as a great place to work has increased to 86% (2021: 82%). Culture Maintain culture and conduct indicators • The vast majority of colleagues believe they and their team do a good job of role-modelling the Barclays Values and Mindset every day (93% for Values and 92% for Mindset). • In 2024, 88% of colleague have told us that they believe strongly in the goals and objectives of Barclays. Total Colleagues: 3.5% Note: 1 Underrepresented minorities refers to individuals who are Black or Multiracial (referred to as Mixed or multiple ethnic groups in the UK Census) in the UK, and African American/Black, Multiracial, Hispanic/Latinx, Native Alaskan/Native American or Native Hawaiian/Pacific Islander in the US. Strategy Shareholder information Climate and sustainability report Risk review Financial review Financial statements Barclays PLC 2024 Annual Report on Form 20-F 150Governance Remuneration report (continued)
Measure Criteria Performance commentary Climate & sustainability Progress towards our green financing commitments Facilitate £100bn of green financing by 2030 • Achieved our £100bn green financing target in 2023, seven years early. • In December 2022, announced a new target to facilitate $1trn of Sustainable and Transition financing between 2023 and end of 2030. • Facilitated $162.2bn of Sustainable and Transition Financing, on a cumulative basis, since 2023, currently on track against 2030 target. Future progress and our ability to meet our target will be dependent on a number of factors and variables outside our control, such as market conditions, policy, laws, regulation, geopolitical developments and stakeholder expectations. Facilitate $1trn of Sustainable and Transition Financing between 2023 and end of 2030 Reduce operational and supply chain carbon footprint and increase use of renewable energy 90% reduction in Scope 1 and 2 GHG emissions (market- based, against a 2018 baseline by end of 2025) • Achieved our absolute Scope 1 and 2 (market-based) GHG emissions target in 2022, three years ahead of target and continued to make progress in 2023 and 2024. 100% renewable electricity sourcing for our global real estate portfolio by end of 2025 • Sourced 100% of electricity for our global real estate portfolio1 from renewable sources since 2022, three years ahead of target. Progress towards achieving our ambition to be a net zero bank by 2050 and our commitment to aligning our financing with the goals and timelines of the Paris Agreement Set targets for highest emitting sectors • Set out our strategy to align our financing with the goals and timelines of the Paris Climate Agreement, including setting 2030 targets for eight high-emitting sectors and a convergence point for UK Housing. • On track to achieve 2025 targets for upstream energy and power. • Future progress against these targets will likely be non-linear and may be volatile due to the many external dependencies and variables beyond Barclays’ control that may determine the pace of transition and impact our strategy and ability to achieve our targets. 30% reduction in power portfolio emissions intensity (2020-2025) 15% reduction in upstream energy portfolio absolute emissions (2020-2025) Continue to invest in our communities LifeSkills: Upskill 10 million people from 2018-2022 and a further 8.70 million from 2023-2027 • 12.6m people upskilled between 2018 and 2022, surpassing our target of upskilling 10m people from 2018-2022. • Upskilled a further 4.61m in 2023 and 2024, making good progress towards our 2023-2027 target. LifeSkills: Place 250,000 people into work from 2019-2022 and a further 250,000 from 2023-2027 • Surpassed our target of 250,000 people placed into work by 2022. • Placed over 107,000 people into work since 2023, making good progress towards our 2023-2027 target. Unreasonable Impact (partnership with the Unreasonable Group): Support 250 businesses solving social and environmental challenges from 2016-2022 and a further 200 from 2023-2027 • After achieving by the end of 2022 our previous goal to support 250 high-growth entrepreneurs that seek to address pressing social and environmental challenges, this strategic global partnership with Unreasonable Group was renewed in 2023 to enable Barclays to support an additional 200 entrepreneurs over five years. Total Climate and sustainability: 7.5% Overall strategic non-financial outcome for the 2022-2024 LTIP: 14.0% Note: 1 Global real estate portfolio includes offices, branches, campuses and data centres within our operational control. Strategy Shareholder information Climate and sustainability report Risk review Financial review Financial statements Barclays PLC 2024 Annual Report on Form 20-F 151Governance Remuneration report (continued)
Assessment of the Risk scorecard for the 2022-2024 LTIP A summary of the Committee’s assessment against the Risk scorecard performance measure over the three-year performance period is provided below. Category Performance Capital and liquidity • Group CET1 ratio stands at 13.6%,toward the upper end of the 13% to 14% target range. • Stress tests results indicate that Barclays is positioned to withstand a severe recession scenario featuring low consumer demand and business investment, as well as a severe contraction in asset prices. • Our Liquidity Coverage Ratio was significantly above the 100% regulatory requirement in the period, and there were no breaches. Control environment • The control environment has remained stable over the period, as business areas and functions continue to strengthen controls and remediation initiatives. • Most of the Group's operations achieved a ‘Satisfactory’ rating, with any exceptions covered by appropriate remediation plans. Conduct/ Compliance • The Compliance control environment over the period was assessed using Compliance Risk Dashboards that set out key indicators designed to monitor Compliance Risk exposure and the effectiveness of Compliance Risk controls to ensure any issues are addressed in a timely and effective manner, so that the Group continues to operate within Risk Appetite. • The Compliance Risk Dashboards are provided to the respective Board Risk Committees and senior management to support effective oversight and decision making Overall Risk scorecard outcome for the 2022-2024 LTIP: 6.8% out of 10% The Committee was satisfied that the level of vesting was consistent with the performance delivered over the period, and that the underlying financial health of the Group is strong. Based on that, they concluded that no discretionary reduction to the vesting outcome was required, so the award should vest at 67.5% of the maximum number of shares under the total award, to be released in five equal tranches annually, starting from March 2025. After release, each tranche of shares is subject to an additional 12-month holding period. The 2022-2024 LTIP award was granted in line with the Group's usual annual timetable, in early March 2022.The share price at grant of £1.609 was 8% lower than the share price at the time of the prior year LTIP grant. This level of share price movement between successive grants is very typical. There was a larger increase in share price over the lifetime of the award, during which the share price increased by 56% between the date of grant and the Q4 2024 average share price of £2.5159 on which the value vesting is estimated. As the share price growth was largely over 2024, reflective of strong performance following the announcement of the three-year plan at the Investor Update in February 2024, the Committee concluded that there is no windfall gain and that therefore no adjustment was required. Strategy Shareholder information Climate and sustainability report Risk review Financial review Financial statements Barclays PLC 2024 Annual Report on Form 20-F 152Governance Remuneration report (continued)
LTIP awards granted during 2024 Awards were granted to C.S. Venkatakrishnan and Anna Cross on 8 March 2024 under the 2024-2026 LTIP. The value used to calculate the number of shares under each award was based on a discounted fair value per share of £1.33158, determined by an independent adviser to take into account that dividends or equivalents do not accrue during the vesting period, in accordance with the DRP. The table that follows provides details of those awards. % of Fixed Pay Number of shares Face value at grant Performance period C.S. Venkatakrishnan 140 % 3,022,724 £4,024,999 2024-2026 Anna Cross 134 % 1,811,381 £2,411,999 2024-2026 The performance measures for the 2024-2026 LTIP awards are as follows: Performance measure Weighting Threshold Maximum vesting Financial measures 2026 RoTE, with an underpin based on average RoTE over the performance period (RoTE excluding material items in each case)1 30% 6% of the award vests for 2026 RoTE of 10.0%, rising on a straight-line basis 30% of the award vests for 2026 RoTE of 14.0% or higher This element is also subject to an underpinning requirement that average RoTE over the performance period is at least 10%. If average RoTE over the period is less than 10%, the Committee will consider the reasons why and determine what portion of this element of the LTIP award should vest, if any Average cost: income ratio (excluding material items)1 10% 0% of the award vests for average cost: income ratio of 62.5%, rising on a straight-line basis 10% of the award vests for average cost: income ratio of 58.0% or lower Maintain CET 1 ratio within the target range2 10% If CET1 is below the target range during the period, the Committee will consider what portion of this element should vest, based on the reasons for the CET1 shortfall If CET1 is above the range and does not make progress towards the range over the period, the Committee will consider what portion of the element should vest, based on the reasons for the elevated levels of CET1 versus target range and the associated impacts 10% vests if either: • CET1 is within the range during the period or • CET1 is above but making progress towards the target range Relative total shareholder return3 20% 5% vests for performance at the median of the peer group4, rising on a straight-line basis 20% of award vests for performance at or above the peer group4 upper quartile Strategic non-financial measures The evaluation will focus on a range of key metrics, with a detailed retrospective narrative on progress against each during the year. Performance against the measures will be assessed by the Committee to determine the percentage of the award that may vest between 0% and 30%. The measures are organised around four main categories and measures will likely include the following: Climate & sustainability 15% Progress to be measured against four key objectives: • Progress towards our Sustainable and Transition Financing target • Reduce our financed emissions • Reduce our operational emissions • Support our communities Customers & clients 5% Drive world class outcomes for customers and clients: • Improve Net Promoter Scores • Reduce Barclays UK customer complaints and improve resolution time • Maintain client rankings and market share within Barclays Investment Bank • Increase digital engagement Colleagues 5% Protect and strengthen our culture through our Purpose, Values and Mindset: • Continue to improve diversity in leadership roles • Improve inclusion indicators • Maintain engagement at healthy levels • Maintain culture indicators Risk & operational excellence 5% Support a consistently excellent operating standard, risk management and controls: • Performance measured against two categories – Operational excellence and Risk & conduct – using a combination of quantitative and qualitative metrics Notes: 1 Material items are defined as those large atypical one-offs that are called out in the financial reporting. The exclusion is not automatic, and the Committee will determine whether each item should be treated as material for these purposes at the time that outcomes are determined 2 Currently 13% to 14%. 3 Performance assessed over the period from 1 January 2024 to 31 December 2026. Start and end total shareholder return data will be the Q4 average for 2023 and 2026 respectively and will be measured in GBP for each company. 4 The peer group is comprised of banks in the UK, Europe and North America of comparable size to Barclays and with a high degree of correlation to Barclays of weekly share price returns. The peer group for the 2024-2026 LTIP award is: Banco Santander, Bank of America, BBVA, BNP Paribas, Citigroup, Credit Agricole, Deutsche Bank, HSBC, ING Group, Lloyds Banking Group, Morgan Stanley, NatWest Group, Societe Generale, Standard Chartered, UBS, and UniCredit. Strategy Shareholder information Climate and sustainability report Risk review Financial review Financial statements Barclays PLC 2024 Annual Report on Form 20-F 153Governance Remuneration report (continued)
Executive Directors: Statement of implementation of remuneration policy in 2025 An overview of how the new DRP will be implemented in 2025 is set out on pages 117 and 127. The shareholder feedback that helped inform thinking on the annual bonus and LTIP measures that follow is set out from page 134. Performance measures for the 2025 annual bonus Performance measures with appropriately stretching targets were selected to cover a range of financial and non-financial goals that support the key strategic objectives of the Group. In support of our new DRP, and reflecting shareholder feedback, several changes were made to the 2025 annual bonus measures compared to those for 2024, to more closely align these with the priorities set out under our three-year plan. For the 2025 annual bonus, the amendments made to the performance measures (compared to the 2024 annual bonus) include: – Increasing the overall weighting of Financial measures from 60% to 65%, and within the Financial measures: – Increasing the weighting of Profit before tax from 50% to 55%, since it is a principal financial measure and key building block to RoTE. – Replacing total operating expenses with cost: income ratio, at the same 10% weighting, which is a secondary target for the Group as set out in the three-year plan. – Replacing Personal objectives with Strategic objectives, focused on the priorities set out as part of our three-year plan, with an increase in weighting from 15% to 20%. – The above changes have been achieved by reducing the weighting of Strategic non-financial measures from 25% to 15%, and within the Strategic non-financial measures: – Removing the climate / sustainability category (previously 5%) from the annual bonus, so Sustainability measures are now focused in the LTIP, as progress on these is best assessed over a multi-year period. – Reducing the weighting of the Risk & operational excellence measure from 10% to 5%. The performance measures and weightings that result are shown below: Financial measures Profit before tax (with CET1 underpin1) (excluding material items2) 55% A performance target range has been set for this financial measure, which will be disclosed in the next Remuneration report. Cost: income ratio (excluding material items)2 10% A performance target range has been set for this financial measure, which will be disclosed in the next Remuneration report. Strategic non-financial measures The evaluation will focus on a range of key metrics, with a detailed retrospective narrative on progress against each during the year. Performance against the measures will be assessed by the Committee to determine the percentage of the award that may vest between 0% and 15%. The measures are organised around two categories and will likely include the following: Customers, clients & colleagues 10% Driving world-class outcomes for customers and clients – with measures to include: • Improve customer and client satisfaction • Reduce customer complaints • Maintain rankings and market share in Barclays Investment Bank • Increase digital engagement Protecting and strengthening our culture through our Purpose, Values and Mindset – with measures to include: • Maintain inclusion indicators • Maintain engagement at healthy levels • Maintain culture indicators Risk & operational excellence 5% Supporting a consistently excellent operating standard, risk management and controls: • Performance measured against two categories – Operational excellence and Risk & conduct – using a combination of quantitative and qualitative metrics Notes: 1 Pay-out of the PBT element will also depend on the CET1 ratio at the end of the performance year. If the CET1 ratio is below the MDA hurdle at the end of the performance year, the Committee will consider what part if any of this element should pay out. 2 Material items are defined as those large atypical one-offs that are called out in the financial reporting. As in previous years, the exclusion is not automatic, and the Committee will determine whether each item should be treated as material for these purposes at the time that outcomes are determined. Performance measure Weighting Metrics Strategy Shareholder information Climate and sustainability report Risk review Financial review Financial statements Barclays PLC 2024 Annual Report on Form 20-F 154Governance Remuneration report (continued)
Strategic objectives Strategic objectives 20% Joint personal objectives: • Deliver key financial targets including RoTE and capital distributions • Maintain robust capital ratios across the Group and within the main operating entities • Continue to reduce organisational complexity and upgrade legacy technology • Deliver better income quality, growth within higher returning divisions and greater RWA productivity in the Investment Bank • Drive growth in our home UK market C.S. Venkatakrishnan: • Continue to drive better customer and client experience and outcomes, through technology and improved offerings • Drive delivery to a consistently excellent standard • Drive leadership accountability to further strengthen our risk management and controls • Continue to invest in talent and continue to grow a winning culture Anna Cross: • Continue to simplify, standardise and automate Group Finance processes to improve effectiveness and efficiency • Oversee the effective management of risk and control across Group Finance • Appropriate management of capital and resources to ensure we comply with governance and regulatory requirements • Retain focus on the talent and culture agenda across Group Finance Performance measure Weighting Metrics 2025-2027 LTIP awards and performance measures The Committee decided to grant awards under the 2025-2027 LTIP cycle to C.S. Venkatakrishnan and Anna Cross with face values at grant equal to 550% and 500% of their new salaries of £1,590,000 and £950,000 respectively, subject to approval of the new DRP and amendment to the LTIP rules at the 2025 AGM. The grant of these awards will be deferred until after the AGM, so will take place in June 2025. These share-based awards ensure alignment with future performance over the three-year assessment period, as well as share price alignment over the long release period (up to eight years from date of grant). For the 2025-2027 LTIP, changes were made to the financial and non-financial performance measures compared to the 2024-2026 LTIP cycle granted early in 2024, in support of the new DRP. – Increasing the overall weighting of Financial measures from 70% to 75%, and within the Financial measures: – Increasing the weighting of the RoTE measure from 30% to 50%, given that it is the Group's principal financial metric and target as set out in the three-year plan. The measure will be based on average RoTE over the period 2026 and 2027. – Increasing the weighting of relative total shareholder return from 20% to 25%. – Removing the cost: income ratio measure as it is a supporting target and has been incorporated into the 2025 annual bonus. – Removing the CET1 ratio measure, which is an important supporting target but considered more of an underpinning measure. The CET1 ratio is used as an underpin to the Profit before tax measure in the 2025 annual bonus. – Reducing the weighting of Strategic non-financial measures from 30% to 25%, and within the Strategic non-financial measures: – Focusing the measures to longer-term strategic priorities relating to Sustainability, customers & clients, with an aggregate weighting of 25%. – The Group's sustainability targets are longer term, through to 2050, and the trajectory is expected to be volatile and non-linear, so progress is best assessed over a multi-year period. In light of this, the climate / sustainability measures have been removed from the annual bonus and Sustainability measures are instead focused in the LTIP. – The previous LTIP cycle included Colleague measures and measures relating to Risk & operational excellence. These categories remain important to the Group and are included in the 2025 annual bonus. Strategy Shareholder information Climate and sustainability report Risk review Financial review Financial statements Barclays PLC 2024 Annual Report on Form 20-F 155Governance Remuneration report (continued)
Performance measures and weightings are shown below. The 2025-2027 LTIP award will be subject to the following forward-looking performance measures. Financial measures Average RoTE (excluding material items1) 50% 10% of award vests for average of 2026 and 2027 RoTE of 10.0%, rising on a straight-line basis 50% of award vests for average of 2026 and 2027 RoTE of 14.0% or higher Relative total shareholder return2 25% 6.25% vests for performance at the median of the peer group3, rising on a straight-line basis 25% of award vests for performance at or above the peer group3 upper quartile Strategic non-financial measures The evaluation will focus on a range of key metrics, with a detailed retrospective narrative on progress during the year. Performance against the measures will be assessed by the Committee to determine the percentage of the award that may vest between 0% and 25%. The measures will focus on sustainability, customers and clients, and will likely include the following: Sustainability, customers & clients 25% Sustainability (including climate) – with measures to include: • Financing the transition • Reducing our financed emissions • Achieving net zero operations • Supporting our communities Driving world class outcomes for customers and clients – with measures to include: • Improve customer and client satisfaction • Reduce customer complaints • Maintain rankings and market share in Barclays Investment Bank • Increase digital engagement Performance measure Weighting Threshold Maximum vesting Notes: 1 Material items are defined as those large atypical one-offs that are called out in the financial reporting. The exclusion is not automatic, and the Committee will determine whether each item should be treated as material for these purposes at the time that outcomes are determined. 2 Performance assessed over the period from 1 January 2025 to 31 December 2027. Start and end total shareholder return will be the Q4 average for 2024 and 2027 respectively and will be measured in GBP for each company. 3 The peer group is comprised of banks in the UK, Europe and North America of comparable size to Barclays and with a high degree of correlation to Barclays of weekly share price returns. The peer group for the 2025-2027 LTIP award is Bank of America, BNP Paribas, Citigroup, Credit Agricole, Deutsche Bank, Goldman Sachs, HSBC Holdings, ING Groep, Intesa Sanpaolo, JP Morgan Chase & Co, Lloyds Banking Group, Morgan Stanley, NatWest Group, Standard Chartered, and UBS Group. Strategy Shareholder information Climate and sustainability report Risk review Financial review Financial statements Barclays PLC 2024 Annual Report on Form 20-F 156Governance Remuneration report (continued)
Additional remuneration disclosures Group performance graph and Group Chief Executive remuneration The performance graph below compares the total shareholder return of Barclays shares with the total shareholder return of the FTSE 100 index over the 10 years ended 31 December 2024. The FTSE 100 index has been selected because it represents a cross-section of leading UK companies, of which Barclays is a long-standing constituent. Total shareholder return – rebased to 100 in 2014 Year ended 31 December 100 92 97 89 68 84 69 89 79 80 145 100 99 118 132 120 141 125 148 154 166 182 Barclays FTSE 100 2014 2015 2016 2017 2018 2019 2020 2021 2022 2023 2024 Group Chief Executive remuneration (£000) Year 2015 2016 2017 2018 2019 2020 2021 2022 2023 2024 Group Chief Executive Antony Jenkins John McFarlane Jes Staley Jes Staley1 Jes Staley1 Jes Staley1 Jes Staley1 Jes Staley1 Jes Staley2 C.S. Venkata- krishnan3 C.S. Venkata- krishnan C.S. Venkata- krishnan C.S. Venkata- krishnan Single total remuneration figure for Group Chief Executive 3,399 305 277 4,233 3,873 3,362 5,929 4,220 2,121 866 5,197 4,641 10,533 Annual bonus award as a % of maximum 48.0% n/a n/a 60.0% 48.5% 48.3% 75.0% 38.6% n/a2 92.6% 75.4% 53.3% 81.0% Long-term incentive plan vesting as a % of maximum 39.0% n/a4 n/a4 n/a4 n/a4 n/a4 48.5% 23.0% n/a2 n/a4 n/a4 n/a4 67.5 % Notes: 1 Jes Staley's remuneration figures for performance years 2016 to 2020 reflect the single total figures of remuneration as disclosed at the time. These have not been restated for the decision made by the Committee during 2023 that Jes Staley's unvested bonus and LTIP awards should be forfeited, as outlined earlier in the Remuneration report 2023. 2 Jes Staley stepped down as Group Chief Executive on 31 October 2021. The remuneration shown for 2021 is in respect of his services as an Executive Director between 1January 2021 and 31 October 2021. This figure does not include variable remuneration as the Committee determined that Jes Staley should be ineligible for 2021 bonus and should forfeit his unvested LTIP awards. 3 The 2021 remuneration shown is in respect of C.S. Venkatakrishnan's services during 2021 following his appointment as Group Chief Executive on 1 November 2021. 4 Not applicable as the individual was not a participant in a long-term incentive cycle that vested in the period. Strategy Shareholder information Climate and sustainability report Risk review Financial review Financial statements Barclays PLC 2024 Annual Report on Form 20-F 157Governance Remuneration report (continued)
Group Chief Executive pay ratios The table below shows, for each year since 2019, the ratios of the Group Chief Executive’s total remuneration to the total remuneration of UK employees. The change in these pay ratios from 2023 to 2024 is explained below the table. Option 25th percentile Median 75th percentile 2024 A 263 x 182 x 107 x 2023 A 122 x 83 x 49 x 2022 A 154 x 101 x 58 x 2021 1 A 95 x 62 x 35 x 2020 2 A 144 x 95 x 53 x 2019 2 A 213 x 140 x 77 x Notes: 1 2021 pay ratios reflect the sum of the single total figures for 2021 remuneration for C.S. Venkatakrishnan and Jes Staley, for their respective periods of service as Group Chief Executive in 2021. Jes Staley was ineligible for an annual bonus in respect of 2021 after he stepped down as Group Chief Executive. 2 The 2020 and 2019 ratios reflect the disclosed single total figures for 2020 and 2019 remuneration for Jes Staley and have not been restated for the decision made by the Committee in 2023 that Jes Staley's unvested bonus and LTIP awards should be forfeited, as outlined in the Remuneration report 2023. The Directors' Remuneration Report regulations provide three options that companies may use to calculate total pay for the employees at the 25th percentile, median and 75th percentile. Option A was selected as this is the most robust methodology, calculating total pay for all employees on the same basis that the single total figure for remuneration is calculated for Executive Directors. Total pay for each employee includes earned fixed pay, which is made up of salary, any Role Based Pay and any relevant allowances, annual incentives awarded for 2024 performance, and an estimate of pension and benefits for 2024 (based on what new UK hires at each corporate grade currently receive). Other elements of pay such as overtime and shift allowances have been excluded. Calculations use full-time equivalent pay data taken from our HR systems for all UK employees, using the employee population on 31 December for each year. Total pay and fixed pay for the UK employees at the 25th percentile, median and 75th percentile are set out in the table below. 25th percentile Median 75th percentile Total pay Fixed pay Total pay Fixed pay Total pay Fixed pay 2024 £40,094 £33,277 £— £57,854 £46,628 £— £98,224 £77,333 2023 £38,194 £31,897 £55,801 £45,230 £95,341 £75,583 2022 £33,711 £28,300 £51,493 £41,608 £89,911 £71,071 2021 £31,404 £26,035 £48,253 £39,461 £85,407 £67,408 2020 £29,380 £24,706 £44,631 £37,460 £79,324 £64,272 2019 £27,875 £23,348 £42,362 £35,158 £77,488 £62,263 The pay ratios have increased between 2023 and 2024. This is due to the increase this year in the Group Chief Executive single total figure for remuneration, though employee pay has also increased, up 5%, 4% and 3% at the 25th percentile, median and 75th percentile respectively. The Group Chief Executive single total figure for 2024 remuneration is 127% higher than for 2023, largely due to two factors: – The figure for 2024 includes an LTIP, for the first time since 2020. The 2022-2024 LTIP is the first LTIP vesting for C.S. Venkatakrishnan, following his appointment as Group Chief Executive on 1 November 2021. His single figure for 2023 remuneration did not include any LTIP value as he was not an Executive Director at the time of the 2021-2023 LTIP grant, in March 2021. – The value of the 2022-2024 LTIP increased over the lifetime of the award. The value includes a 56% increase in the share price between the date of grant and the Q4 2024 average share price of £2.5159 on which the value vesting is estimated. This share price increase accounts for 36% of the vesting LTIP value. More information on the value of the vesting LTIP is provided from page 148. The analysis of pay for the wider workforce does not capture any similar benefits from the increase to the share price, either on shares granted as part of deferred compensation or on shares employees acquired through participation in the Group's all-employee share plans. Without the LTIP value, the 2024 CEO pay ratios would be 135:1, 93:1 and 55:1 compared to the employee 25th percentile, median and 75th percentile respectively. The Committee is satisfied that the single total figure for 2024 remuneration for the Group Chief Executive, the total pay and fixed pay outcomes for UK employees, and the resulting pay ratios reflect the application of the Group's remuneration philosophy and are commensurate with experience of stakeholders. Barclays' remuneration philosophy is set out earlier in this report, and all remuneration decisions for the Executive Directors and the wider workforce are made within this framework. The Group Chief Executive pay ratios are an outcome of all these decisions, which are explained in more detail in the Committee Chair’s annual statement. As such, the Committee is satisfied that the pay ratios for 2024 are consistent with the reward and performance management policies and processes that apply to the Group's UK employees, taken as a whole. To ensure Executive Director remuneration outcomes are commensurate with those of the wider workforce, the Committee specifically considers each year whether the bonus and LTIP outcomes for the Executive Directors appropriately reflect the Group’s performance and the remuneration outcomes for the wider workforce, when considering whether a discretionary adjustment should be made to the Executive Directors’ incentive outcomes. In respect of the Group Chief Executive's 2024 annual bonus and 2022-2024 LTIP award vesting, the Committee concluded that no discretionary adjustments were warranted. Strategy Shareholder information Climate and sustainability report Risk review Financial review Financial statements Barclays PLC 2024 Annual Report on Form 20-F 158Governance Remuneration report (continued)
Annual percentage change in remuneration of Directors and employees The table below shows the percentage change in the Executive Directors’ Fixed Pay, benefits and bonus each year between 2019 and 2024, compared with the percentage change in each of those components of pay for UK-based employees of Barclays Group and for employees of Barclays PLC, the Group’s parent company. The percentage changes from 2023 to 2024 are explained below the table. For the Executive Directors, year-on-year percentage change figures are calculated using the single total figures for remuneration, annualised to a full-year equivalent where the individual served as an Executive Director for only part of the year. Fixed pay Benefits Annual bonus 2023/2024 C.S. Venkatakrishnan1 3% (55%) 56% Anna Cross2 3% (12%) 52% Median UK employee 3% 13% 12% Median employee of Barclays PLC3 2% 2% 20% 2022/2023 C.S. Venkatakrishnan1 3% (38%) (27%) Anna Cross2 4% 17% (25%) Median UK employee 9% 11% (5%) Median employee of Barclays PLC3 1% 10% (43%) 2021/2022 C.S. Venkatakrishnan1 2% 853% (16%) Anna Cross2 n/a n/a n/a Tushar Morzaria 2% 82% (20%) Median UK employee 5% 10% 3% Median employee of Barclays PLC3 10% 15% (2%) 2020/2021 C.S. Venkatakrishnan1 n/a n/a n/a Tushar Morzaria 2% (10%) 152% Jes Staley4 1% (12%) n/a Median UK employee 5% 6% 42% Median employee of Barclays PLC3 11% 0% 38% 2019/2020 Tushar Morzaria 0% 9% (49%) Jes Staley4 0% 10% (49%) Median UK employee 7% 20% (16%) Median employee of Barclays PLC3 7% 26% (16%) Notes: 1 C.S. Venkatakrishnan was appointed as Group Chief Executive with effect from 1 November 2021. His remuneration figures for 2021 are annualised to a full-year equivalent for the purpose of this comparison. The value of his benefits includes the cost to the Group of providing him with relocation support, including immigration assistance, home search support in London, and payments (which ended on 31 October 2023) for temporary accommodation in London. No percentage change figures can be calculated for 2020/21 as he did not receive any remuneration in respect of services provided as an Executive Director in 2020. 2 Anna Cross was appointed as Group Finance Director with effect from 23 April 2022. Her remuneration figures for 2022 are annualised to a full-year equivalent for the purpose of this comparison. No percentage change figures can be calculated for 2021/22 as she did not receive any remuneration in respect of services provided as an Executive Director in 2021. 3 The Barclays PLC comparison is included because this is a statutory requirement, though Barclays PLC employs only a very small number of Head Office employees (64 in 2024). 4 Jes Staley's bonus figures reflect the disclosed figures and have not been restated for the decision made by the Committee in 2023 that Jes Staley should be ineligible for 2021 bonus and should forfeit his unvested bonus awards, as outlined in the Remuneration report 2023. For C.S. Venkatakrishnan and Anna Cross, the 2023 to 2024 Fixed Pay changes principally reflect the 2.5% increases agreed for each in early 2024, effective 1 March 2024, as disclosed in the Remuneration report 2023, as well as their previous Fixed Pay increases effective 1 March 2023. The annual bonus outcomes for C.S. Venkatakrishnan and Anna Cross are up 56% and 52% respectively, reflective of Group and personal performance in 2024 compared to Group and personal performance in 2023. More information on the determination of the Executive Directors' 2024 annual bonus outcomes is provided from page 141. The reduction in the value of benefits for C.S. Venkatakrishnan in 2024 primarily reflects a significantly lower value of relocation support provided by the Company than in the previous year; in particular the provision to him of temporary accommodation in London ended in 2023. The reduction in the value of benefits for Anna Cross is c.£2,000. For UK employees across the Group, the 3.1% increase in median fixed pay primarily reflects higher-than-normal salary increases in early 2024 as part of that year's UK pay deal. The 12% increase in median bonus reflects the 10% increase in the Group incentive pool. The 13% increase in benefits costs is largely due to an increase in the cost of providing private medical cover in 2024. Barclays PLC only employs a very small number of Head Office employees (64 in 2024), and there is frequent movement of employees between Barclays PLC and other entities within the Barclays Group. For comparison purposes, the Barclays PLC figures are therefore based only on the 36 individuals who were employed by Barclays PLC in both years. Strategy Shareholder information Climate and sustainability report Risk review Financial review Financial statements Barclays PLC 2024 Annual Report on Form 20-F 159Governance Remuneration report (continued)
The table below shows the percentage change in fee each year between 2019 and 2024 for the Chairman and the Non-Executive Directors serving on the Barclays PLC Board during 2024, including fees for Board Committee memberships and/or subsidiary board positions. The changes in fees shown relate to changes in responsibilities of the Non-Executive Directors. The Non-Executive Directors appointed to the Barclays PLC Board during 2024 are not shown, as they did not receive relevant fees prior to 2024 so no percentage change figures can be calculated. 2023/2024 fees1,2 2022/2023 fees1 2021/2022 fees1 2020/2021 fees1 2019/2020 fees1 Nigel Higgins 2% 5% 0% 0% 0% Robert Berry 5% 9% n/a n/a n/a Tim Breedon 0% 1% (19%) 64% 24% Mohamed A. El-Erian3 2% 12% 3% 11% n/a Dawn Fitzpatrick 5% 11% 18% 14% 36% Mary Francis 4% 24% 5% 8% (3%) Brian Gilvary (2%) 2% 3% 95% n/a Sir John Kingman 3% n/a n/a n/a n/a Marc Moses 2% n/a n/a n/a n/a Diane Schueneman4 (2%) 12% 4% (4%) 3% Julia Wilson5 21% 107% 13% n/a n/a Notes: 1 In the year that a Non-Executive Director was appointed to or stepped down from the Barclays PLC Board, fees for that year are annualised to a full-year equivalent. Additional information has been provided in the notes that follow where 2023/2024 percentage changes in fees, which excludes benefits, were greater than 10%. 2 Fees for the Group Chairman and Non-Executive Director roles on the Board and Board Committees of Barclays PLC were increased by 2%, with effect from 1 January 2024. 3 Mohamed A. El-Erian stepped down from the Board on 31 August 2024. 4 Diane Schueneman stepped down from the Board with effect from 31 January 2025. 5 Julia Wilson joined the Board Sustainability Committee with effect from 23 March 2023, the Barclays Bank PLC Board with effect from 1 April 2023, and the Board Remuneration Committee with effect from 1 July 2023. She was appointed Chair of the Board Audit Committee with effect from 1 April 2023 and Chair of the Barclays Capital Securities Limited Board with effect from 24 April 2023, and received pro-rata fees for that year. For 2024, the full-year fees were paid, therefore increasing the fees paid from 2023 to 2024. Relative importance of spend on pay A year-on-year comparison of Group compensation costs and of distributions to shareholders is shown below. The distributions shown relate to dividends paid and share buyback programmes completed during the year. The distributions for 2024 do not include the dividends and share buyback programme announced on 13 February 2025. Group compensation costs £m 2024 2023 8,758 8,719 6,893 6,969 1,865 1,750 n Other compensation-related income statement charges7 n Income statement charge for performance costs Distributions to shareholders6 £m 2024 2023 2,971 2,460 1,750 1,250 1,221 1,210 n Share buybacks n Dividends Notes: 6 The chart shows dividends paid and share buyback programmes completed during the year. For example, for 2024, the figure represents the 2023 full-year dividend paid, the share buyback programme announced with the 2023 results, the 2024 half-year dividend, and the share buyback programme announced with the half-year results. The shareholder distributions announced on 13 February 2025 are not reflected in this chart. 7 Relates to costs arising from salaries and other elements of fixed pay, social security costs, post-retirement benefits and other compensation costs. Strategy Shareholder information Climate and sustainability report Risk review Financial review Financial statements Barclays PLC 2024 Annual Report on Form 20-F 160Governance Remuneration report (continued)
Chairman and Non-Executive Directors Remuneration for Non-Executive Directors reflects their responsibilities and time commitment, and the fees paid are comparable with those paid in Barclays' international peer group, with a particular focus on the UK-headquartered banks. Fees shown reflect actual fees paid for periods of service on the Board, any Board Committees and, where applicable, subsidiary Boards and Board Committees. Non-Executive Directors are reimbursed expenses that are incurred for business reasons. Any tax that arises on these reimbursed expenses is paid by Barclays. Chairman and Non-Executive Directors: Single total figure for 2024 remuneration Fees Benefits Total 2024 2023 2024 2023 2024 2023 £000 £000 £000 £000 £000 £000 Chairman Nigel Higgins1 857 840 9 8 866 848 Non-Executive Directors Robert Berry 288 273 — — 288 273 Tim Breedon 396 396 — — 396 396 Mohamed A. El-Erian2 118 173 — — 118 173 Dawn Fitzpatrick 233 221 — — 233 221 Mary Francis 218 210 — — 218 210 Brian Gilvary 241 246 — — 241 246 Sir John Kingman 589 334 — — 589 334 Marc Moses 193 178 — — 193 178 Diane Schueneman3 425 433 — — 425 433 Brian Shea4 77 — — — 77 — Julia Wilson 338 279 — — 338 279 Notes: 1 Nigel Higgins does not receive a fee in respect of his role as Chairman of Barclays Bank PLC. 2 Mohamed A. El-Erian stepped down from the Board on 31 August 2024. 3 Diane Schueneman stepped down from the Board with effect from 31 January 2025. 4 Brian Shea was appointed to the Board with effect from 19 July 2024. Chairman and Non-Executive Directors: Statement of implementation of remuneration policy in 2025 The fees for Non-Executive Directors and the Chairman are reviewed annually. The fees for Non-Executive Directors (including Board and Board Committee roles) were reviewed in December 2024 and increased by 2% and the fees for the Chairman were reviewed in the early part of 2025 and increased by 8% (see the Committee Chair’s annual statement from page112 for further information). Both increases in fees take effect from 1 January 2025 and are set out in the table below. 1 January 2025 1 January 2024 £ £ Chairman1 925,000 856,800 Board member 98,300 96,400 Additional responsibilities Senior Independent Director 39,300 38,600 Chair of Board Audit or Risk Committee 87,400 85,700 Chair of Board Remuneration Committee 76,500 75,000 Membership of Board Audit, Remuneration or Risk Committee 32,700 32,100 Membership of Board Nominations Committee 16,400 16,100 Membership of Board Sustainability Committee 15,600 15,300 Note: 1 The Chairman does not receive any fees in addition to the Chairman fees shown above. Strategy Shareholder information Climate and sustainability report Risk review Financial review Financial statements Barclays PLC 2024 Annual Report on Form 20-F 161Governance Remuneration report (continued)
Directors’ shareholdings and share interests Interests in Barclays PLC shares The table below shows the number of ordinary shares of 25p each of the Company (ordinary shares) owned beneficially by each person who served as a Director during 2024 (including any ordinary shares owned beneficially by their connected persons). The ordinary shares held carry no additional or different voting rights to those of other holders of ordinary shares. The rights attaching to ordinary shares are set out from page 108. For the Executive Directors, the table shows the number of ordinary shares over which each holds awards that are subject to either deferral terms or to deferral terms plus performance measures, and the number of shares owned outright includes shares purchased by the Director as well as shares received in relation to remuneration. All Barclays employees, including the Executive Directors, are prohibited from investment activities that may create conflicts of interest, and in particular from using personal hedging strategies to undermine the risk alignment effects embedded in remuneration, or any other hedging in respect of Barclays securities. The numbers shown for shares that are subject to performance measures represent the maximum number of shares that may be released if those performance measures were to be satisfied in full. The total share interests at 11 February 2025, being the latest practicable date for inclusion in this report, were the same as shown below for all Directors in service as at 31 December 2024. Each Director’s individual shareholding constituted less than 1% of the issued share capital of the Company as at 31 December 2024 and 11 February 2025. The Executive Directors and Non-Executive Directors do not currently participate in any share option plans operated by Barclays. Interests in Barclays PLC shares as at 31 December (or date of retirement from the Board, if earlier)1 Owned outright Unvested deferred awards Total Subject to performance measures Not subject to performance measures Executive Directors C.S. Venkatakrishnan 4,002,463 8,994,923 2,594,262 15,591,648 Anna Cross 1,420,673 3,561,628 1,006,680 5,988,981 Chairman Nigel Higgins 1,888,073 — — 1,888,073 Non-Executive Directors Robert Berry 24,831 — — 24,831 Tim Breedon 231,559 — — 231,559 Mohamed A. El-Erian2 159,033 — — 159,033 Dawn Fitzpatrick 968,409 — — 968,409 Mary Francis 94,889 — — 94,889 Brian Gilvary 175,213 — — 175,213 Sir John Kingman 10,569 — — 10,569 Marc Moses 14,263 — — 14,263 Diane Schueneman3 144,962 — — 144,962 Brian Shea4 — — — — Julia Wilson 41,305 — — 41,305 Notes: 1 Where American Depository Receipts (ADRs) are held, the ordinary shares equivalent is shown in the table. One ADR is the equivalent of four ordinary shares. 2 Mohamed A. El-Erian stepped down from the Board on 31 August 2024 and as a result his share interests are shown as at that date. 3 Diane Schueneman stepped down from the Board with effect from 31 January 2025. 4 Brian Shea was appointed to the Board with effect from 19 July 2024. In line with the remuneration policy for Non-Executive Directors, an element of Brian Shea's fees will be used to purchase ordinary shares. The first such purchase is expected to take place shortly after publication of this document. Strategy Shareholder information Climate and sustainability report Risk review Financial review Financial statements Barclays PLC 2024 Annual Report on Form 20-F 162Governance Remuneration report (continued)
Executive Directors’ shareholdings and share interests The charts below show the value of Barclays shares held as at 31 December 2024 by C.S. Venkatakrishnan and Anna Cross, in each case using the Q4 2024 average Barclays ordinary share price of £2.5159. Under the current DRP, for C.S. Venkatakrishnan the shareholding requirement is 233% of year-end Fixed Pay, and for Anna Cross it is 224% of year-end Fixed Pay. Barclays shares held beneficially by each Executive Director count towards the shareholding requirement, as well as unvested shares that are not subject to performance conditions (net of estimated income tax and social security). C.S. Venkatakrishnan and Anna Cross had five years from their respective dates of appointment as Executive Directors to meet this requirement, and both have already met it. Unvested shares that are still subject to performance conditions do not count towards the shareholding requirements, but contribute to aligning the Executive Directors' interests with those of shareholders through share price exposure, and are therefore also shown below (net of estimated income tax and social security). For the unvested shares subject to performance conditions, the proportion that is ultimately released may range from 0% to 100% depending on the achievement of the performance measures for each award, and on continued employment in accordance with the relevant plan rules and the DRP. C.S. Venkatakrishnan Anna Cross £000 £000 13,170 10,749 6,867 4,917 4,749 4,133 Based on 31 December 2024 Fixed Pay of £2,947k. Based on 31 December 2024 Fixed Pay of £1,845k. n Actual shareholdings, including unvested shares not subject to performance conditions (estimated after-tax value) n Unvested shares subject to performance conditions (estimated after-tax value), which do not count towards the shareholding requirement n Shareholding requirement Executive Directors have a contractual obligation to build up the required shareholding within five years from their date of appointment as an Executive Director. They are issued a shareholding statement twice yearly, reminding them of the level of shareholding they are required to build and maintain under the shareholding requirement, and informing them of the value of their current holdings. After an Executive Director has stepped down, some of the continuing shareholding requirement will likely be met via shares held within the Group’s employee share plans and nominee accounts. In many cases this will be sufficient to cover the requirement in full. To the extent it is not, compliance with the balance of the requirement will be monitored and maintained through self-certification. Payments to former Directors Former Group Finance Director: Tushar Morzaria In 2024, Tushar Morzaria was provided with UK and US tax compliance services in respect of Barclays employment income. Previous AGM voting outcomes The table below shows the shareholder voting results in respect of our 2023 Remuneration report approved by shareholders at the AGM held on 9 May 2024, and DRP approved at the 2023 AGM. For (% of votes cast and total number) Against (% of votes cast and total number) Withheld (total number) Vote on the 2023 Remuneration report at the 2024 AGM 97.54 % 2.46 % 9,994,998,399 251,678,560 10,883,304 Vote on the Directors’ Remuneration Policy at the 2023 AGM 96.69 % 3.31 % 9,402,353,401 322,148,965 16,010,604 Strategy Shareholder information Climate and sustainability report Risk review Financial review Financial statements Barclays PLC 2024 Annual Report on Form 20-F 163Governance Remuneration report (continued) Actual Requirement Actual Requirement
Barclays Board Remuneration Committee Committee responsibilities The Board Remuneration Committee is responsible for overseeing remuneration at Barclays. The role of the Committee, as set out in the Terms of Reference, is to: • Set the overarching principles and parameters of remuneration policy across the Group • Consider and approve the remuneration arrangements of (i) the Group Chair, (ii) the Executive Directors, (iii) members of the Barclays Group Executive Committee and any other senior executives specified by the Committee from time to time, and (iv) all other Group employees whose total annual compensation is equal to or exceeds an amount determined by the Committee from time to time • Exercise oversight of remuneration issues (including retirement benefits). Advisers to the Committee The Committee appointed PricewaterhouseCoopers (PwC) as its independent adviser in October 2017. The Committee considered the advice provided by PwC to the Committee during the year and was satisfied that the advice is independent and objective. PwC is a signatory to the voluntary code of conduct in relation to executive remuneration consulting in the UK. PwC was paid £150, 391 (excluding VAT) in fees for its advice to the Committee in 2024 relating to the remuneration of the Directors (either exclusively or along with other employees within the Committee’s Terms of Reference). In addition to advising the Committee, PwC provided unrelated consulting advice to the Group in respect of strategic advice on business, regulation, risk and controls, operational models and cost, taxation, technology, pensions, HR and sustainability issues. Throughout 2024, Willis Towers Watson (WTW) provided the Committee with market data on compensation, as context when considering incentive levels and remuneration packages. WTW was paid £84,500 (excluding VAT) in fees for these services. In addition to the services provided to the Committee, WTW also provides market data on compensation for other roles below Board level, pensions and benefits advice and brokerage services to the Barclays Group, and administration services to a number of the Group's pension funds. In the course of its deliberations, the Committee also considered the views of the Group Chairman, the Group Chief Executive, the Group Human Resources Director and the Group Reward and Performance Director. The Group Finance Director and the Group Chief Risk Officer provided regular updates on Group and business financial performance and risk profiles respectively. The Head of Corporate Communications attended when requested, to advise on reward communications and disclosures. The Group General, Counsel or other representatives from the Legal function, and the Company Secretary advised on legal and governance-related matters. No Barclays employee or Director participated in decisions of the Committee relating to his or her own remuneration. No other advisers provided services to the Committee in the year. Committee effectiveness in 2024 The 2024 Committee effectiveness review was externally facilitated, as required by the Code. The review is an important part of the way Barclays monitors and improves Committee performance and effectiveness, maximising strengths and highlighting areas for further development. The Board appointed Christopher Saul Associates (CSA) to facilitate the review. As part of the review, CSA conducted one-on-one interviews with each member of the Committee, the Group Chief Executive and the Group Human Resources Director. CSA also observed the October 2024 Committee meeting. The results of the Committee effectiveness review confirm the Committee is operating effectively. It is considered to be well constituted and chaired, providing an effective and appropriate level of constructive challenge and oversight of the areas within its remit, including in respect of areas of judgement and discretion, with balanced contributions from participants observed in meetings. The review highlights that the Committee is considered to have the right level of skills and experience and is of an appropriate size. The Committee’s interaction with the Board, Board Committees and senior management is considered effective, noting that the Committee is well integrated into overall Board processes and the review recognised the strong level of support provided to the Committee by senior management. The Committee’s interaction with the BBPLC Board Remuneration Committee was considered effective. The report of the Board Nominations Committee provides further details on the process for conducting the 2024 Committee effectiveness review. More information on the 2024 Committee effectiveness review process can be found in the Board Nominations Committee report page 75. Strategy Shareholder information Climate and sustainability report Risk review Financial review Financial statements Barclays PLC 2024 Annual Report on Form 20-F 164Governance Remuneration report (continued) The Committee’s terms of reference are available at home.barclays/who-we-are/our-governance/board-committees
Committee activity in 2024 and early 2025 The following table summarises the Committee’s activity during 2024, and at the January and February 2025 meetings at which remuneration decisions reported in this Remuneration report were finalised. The Committee is also provided with updates at each scheduled meeting on: the operation of the Committee’s Remuneration Control Framework on hiring, retention and termination; headcount and employee attrition; and extant LTIP performance. January 2024 February 2024 June 2024 October 2024 December 2024 January 2025 February 2025 Overall remuneration Finance and Risk updates ▪ ▪ ▪ ▪ ▪ ▪ Incentive funding proposals including risk and control adjustments ▪ ▪ ▪ ▪ ▪ ▪ Remuneration report 2023 ▪ ▪ Group budgets for fixed pay increases ▪ ▪ ▪ ▪ ▪ ▪ Wider workforce considerations ▪ ▪ ▪ ▪ ▪ ▪ ▪ Incentive funding approach ▪ Barclays’ Fair Pay Agenda and Report ▪ ▪ ▪ ▪ ▪ ▪ ▪ Bonus cap for Material Risk Takers ▪ One-off all-colleague1 share award ▪ Remuneration report 2024 ▪ ▪ ▪ Executive Directors’ and senior executives’ remuneration Executive Directors’ and senior executives’ bonus outcomes ▪ ▪ ▪ ▪ ▪ Directors' Remuneration Policy ▪ ▪ ▪ ▪ ▪ Annual bonus and LTIP performance measures and target calibration ▪ ▪ ▪ ▪ ▪ Governance Regulatory and stakeholder matters ▪ ▪ ▪ ▪ ▪ ▪ ▪ Discussion with independent adviser ▪ ▪ ▪ ▪ ▪ ▪ Remuneration Review Panel update ▪ ▪ ▪ ▪ Review of Committee effectiveness ▪ ▪ Notes: 1 Employees at Managing Director grade or who have been identified as Material Risk Takers are not included. They are typically awarded Barclays shares as part of their deferred compensation. In addition, three ad-hoc Committee meetings were called during 2024. Strategy Shareholder information Climate and sustainability report Risk review Financial review Financial statements Barclays PLC 2024 Annual Report on Form 20-F 165Governance Remuneration report (continued)
Other Governance This section aims to provide an overview of certain governance matters of particular relevance to ESG ratings agencies and investors across a range of ESG matters. It covers topics such as our Code of Conduct, Whistleblowing, Tax, Financial crime, Health and Safety and how we manage our Data privacy and Security as well as Resilience. This section also includes our approach to managing social and environmental impacts as well as our Governance disclosures as part of the TCFD recommendations. This section does not discuss general corporate governance matters. Refer to the Board Governance report from page 63 in the Annual Report for information relating to the Board, ExCo and Board Committees, our Board governance framework and how we complied with the requirements of the 2018 UK Corporate Governance Code during 2024. Climate and sustainability governance 167 Managing impacts in lending and financing 172 Human rights / Modern slavery 174 Our supply chain 176 Supporting our customers 178 The Barclays Way 181 Whistleblowing 182 Tax 183 Financial crime 185 Health and safety 186 Managing data privacy, security and resilience 187 Strategy Shareholder information Climate and sustainability report Risk review Financial review Financial statements Barclays PLC 2024 Annual Report on Form 20-F 166Governance
Climate and sustainability governance Oversight and management of climate and sustainability-related issues are embedded within our governance structure1. Barclays’ climate and sustainability governance structure consists of the Barclays PLC Board (Board) and its Committees along with Executive and Management Committees which span both business and legal entity lines. The Board sets the Group’s climate and sustainability-related strategy and oversees its implementation by senior management. Climate and sustainability governance structure2 Barclays PLC Board Group Executive Committee (Group ExCo) Group Risk Committee Business / Legal Entity Functions / Committees and Forums Group Chief Compliance Officer Group Chief Operating Officer Group Chief Risk Officer Business CEOs Group Finance Director Group Head of PPCR Group Sustainability Chief Information Officer Group Head of Climate Risk BX Risk and Finance Chief Operating Officer Group Head of Sustainable and Transition Finance Group Head of Finance - Sustainability and ESG Notes: 1 The committees, forums and governance bodies described here are non-exhaustive and their construct and Terms of Reference may vary on a legal entity basis or across the Group. 2 The presentation of Group Committees and senior management is not directly illustrative of the committees / forums they report into. Climate and sustainability governance changes during 2024 In September 2024, the Group Head of Sustainable and Transition Finance role was created, bringing together the Group Sustainability and Sustainable Finance teams under one leadership. This new role has oversight of the Group’s policies and standards, and the Group’s sustainable finance strategy. The Group Sustainability team leadership and the BUK Head of Sustainable Finance report into this new role. In October 2024, the Group Sustainability Committee (GSC) Terms of Reference (ToR) were updated to delegate full authority to the Chair of the GSC to recommend and approve sustainability matters on behalf of the Group Executive Committee. During the year, the Financed Emissions Programme closed following completion of all programme milestones. We have established the Sustainability Change Portfolio Governance Board to govern the execution of Group Sustainability Change programmes, in line with Barclays Change Delivery Management Standards. Strategy Shareholder information Climate and sustainability report Risk review Financial review Financial statements Barclays PLC 2024 Annual Report on Form 20-F 167Governance ESG Governance Board Sustainability Committee Board Risk Committee Board Audit Committee Board Remuneration Committee Operational Sustainability Steering Committee BBplc Business-Level Committees for transaction reviews Principal Investments Equity Committee Sustainability Change Portfolio Governance Board Group Sustainability Committee Disclosure Committee Group Reputation Risk Committee Climate Risk Committee G ro up C om m it te es B oa rd S en io r m an ag em en t B us in es s / Le ga l En ti ty / F un ct io n
Board and Board Committee oversight of climate and sustainability-related risks and opportunities Barclays PLC Board The Board and, as appropriate, its Committees are responsible for the oversight of climate and sustainability matters, including climate-related risks and opportunities. During 2024, the Board received five reports from the Board Sustainability Committee. These covered matters such as updates on the Group's climate and sustainability strategy, including in relation to our sustainable finance strategy, energy strategy and the development of a Transition Plan, as well as stakeholder engagement. Please see the Key Board activities section from page 72 for further detail about what the Board considered in relation to climate and sustainability matters in 2024. Outside of formal Board briefings, the Group Head of Public Policy and Corporate Responsibility and Group Head of Sustainable and Transition Finance also engaged with Board members on matters relating to the Group’s climate and sustainability strategy. The Board is supported in its work by its Committees, each of which has its own Committee Terms of Reference setting out its remit and decision-making powers. The Chairs of each Committee report regularly on their Committee's work to the Board. Board Sustainability Committee During 2024, the Board Sustainability Committee met five times. It reviewed climate and sustainability updates and proposals prior to Board consideration, received regular progress updates from management in relation to the Group’s climate and sustainability strategy, as well as internal and external briefings on climate and sustainability matters. In 2024, the Committee continued to monitor progress against targets and also reviewed the development of the Transition Plan. Please refer to the report of the Board Sustainability Committee from page 101 for further detail on the work of this Committee. Board Risk Committee The Board Risk Committee plays an important role in overseeing and challenging the Group's progress towards achieving its climate targets and assessing the impact of climate risks on the overall risk profile and financial position. During 2024, the Board Risk Committee received regular updates on climate risk, including elevated areas of climate risk and progress against sector targets. It also received risk reports from the Head of Climate Risk, including receiving four Climate Risk dashboards during the year, providing the Committee with an update on key climate risk metrics. The Committee received regular updates during the year from the businesses (including BUK and the Investment Bank) on their climate strategy. Please refer to the report of the Board Risk Committee from page 95 for further detail on the work of this Committee. Board Audit Committee The Board Audit Committee provides oversight of the climate and sustainability disclosures within the Group's narrative reporting, seeking views from the Board Sustainability Committee on those disclosures where appropriate. Taking account of the work of the Board Risk Committee's and Board Sustainability Committee's respective assessments of climate change and related political responses, the Board Audit Committee continues to monitor how any related impacts and disclosure recommendations have been considered in preparing the Group’s financial statements. Please refer to the report of the Board Audit Committee from page 86 for further detail on the work of this Committee. Board Remuneration Committee The Board Remuneration Committee is responsible for setting the overarching principles and parameters of remuneration policy across the Group. The Committee has responsibility for aligning the remuneration of the Executive Directors of Barclays PLC with strategic priorities, including in relation to sustainability matters. The principal activities of the Board Remuneration Committee include: setting the Barclays Group Remuneration Policy; determining the incentive pool, including consideration of sustainability-related performance measures so these impact pay levels across the workforce; and aligning Executive Director remuneration with strategic priorities, including in relation to sustainability matters. A proportion of both the 2025 annual bonus and 2025-2027 LTIP award for the Executive Directors will be driven by non- financial performance measures, aligned with the Group’s strategic priorities. Climate / sustainability measures will be shifted fully to the LTIP, as progress towards these targets is expected to be non-linear and is best assessed over a multi-year period. In the 2025-2027 LTIP, the sustainability measures will be included as part of a broader, renamed category of measures relating to Sustainability, customers & clients, weighted at 25%. The Sustainability measures will include Financing the transition, reducing our financed emissions and achieving net zero operations, as well as supporting our communities. Please refer to the Remuneration report from page 112 for further detail on the work of the Board Remuneration Committee. Roles and responsibilities of the Board and Board Committees with respect to climate and sustainability- related matters Roles and responsibilities Board Board Sustainability Committee Board Risk Committee Board Audit Committee Board Remuneration Committee Responsible for the overall leadership of the Group (with direct oversight of strategy, culture and strategic reputational matters relating to the Group). The Board sets the Group’s strategy, including in respect of climate. Responsible for oversight of climate matters and the Group’s sustainability agenda (including in relation to nature and human rights). The Committee supports the Board in considering the suitability and monitoring the implementation of the Group’s climate and sustainability strategy. Responsible for monitoring Principal Risks (including Climate Risk), considering the Group’s risk appetite and tolerances, along with reviewing the Group’s risk profile and commissioning, receiving and considering reports on key risk issues. Responsible for overseeing the integrity of the Group's financial disclosures and the effectiveness of the internal control environment. The Committee oversees financial and narrative reporting, which encompasses ESG and climate disclosures within the Annual Report. Responsible for setting the overarching principles and parameters of remuneration policy across the Group. The Committee has responsibility for aligning Executive Director remuneration with strategic priorities, including in relation to climate and sustainability matters. Strategy Shareholder information Climate and sustainability report Risk review Financial review Financial statements Barclays PLC 2024 Annual Report on Form 20-F 168Governance ESG Governance (continued)
Management's role in assessing and managing sustainability and climate-related risks and opportunities Oversight and management of Barclays' climate and sustainability strategy is increasingly embedded in business-as- usual management structures, including executive committees. These committees are mandated and form part of Barclays’ formal governance architecture. They are convened to oversee a specific attribute of the Barclays control framework. Each committee is itself governed by Terms of Reference that lay out the duties, decision-making authority and escalation route of any material issues. The executive management committees receive regular briefings on matters including climate change and consider both risks and opportunities. Climate and sustainability-related risks are assessed and escalated as appropriate through the various risk forums. The Group Sustainability Committee assists the Group Executive Committee and the Board Sustainability Committee (BSC) in considering sustainability-related matters across the Group, with a mandate to review and approve amendments to the Group sustainability strategy for approval by the BSC. Group Executive Committee (Group ExCo) Throughout 2024 Group ExCo has been provided with regular updates on our climate strategy, including progress on our commitments, stakeholder engagement and expectations, and target-setting. The Group Head of PPCR is a member of Group ExCo and is accountable for ensuring the Group’s societal purpose is present in strategic decision-making at the highest levels in the organisation. The Group Head of PPCR, and their team, regularly updates Group ExCo on a range of Public Policy and Corporate Responsibility matters, covering key government and regulatory policy, regulator engagement and ESG matters, including climate. In particular, in 2024 Group ExCo was provided updates on sustainability matters including proposed amendments to the Climate Change Statement and Group Statement on Human Rights, ahead of the publication of updated versions of those documents in February 2024. Group ExCo also received an update on the Group's sustainable finance strategy. The Group Chief Risk Officer is a member of Group ExCo and is accountable for the approach to managing climate-related financial and operational risks to Barclays; this is implemented within the Group's Enterprise Risk Management Framework (ERMF). The Group Sustainability Committee, established by Group ExCo in 2023, continued to provide updates on a broad range of sustainability issues. Executive Remuneration Annual bonus outcomes and Long Term Incentive Plan (LTIP) award outcomes for the Executive Directors of Barclays PLC are assessed against a framework of measures set by the Remuneration Committee at the start of the performance period for each award. A proportion of both the 2025 annual bonus and 2025-2027 LTIP award for the Executive Directors of Barclays PLC will be driven by non-financial performance measures, aligned with the Group's strategic priorities. Climate / sustainability measures will be shifted fully to the LTIP, as progress towards these targets is expected to be non-linear and is best assessed over a multi-year period. In the 2025-2027 LTIP, the sustainability measures will be included as part of a broader, renamed category of measures relating to Sustainability, customers & clients, weighted at 25%. The Sustainability measures will include Financing the transition, reducing our financed emissions and achieving net zero operations, as well as supporting our communities. Group Risk Committee (GRC) The GRC is the designated forum to review and recommend, where necessary, submissions to the BRC. The GRC is the most senior risk executive body responsible for reviewing and overseeing the risk profile and risk practices of the Group. This includes coverage of all Principal Risks, and any other material risks, to which the Group is exposed. In relation to climate, the GRC reviews and recommends proposed climate risk appetite and relevant limits to the BRC. The GRC oversees monitoring and reporting of climate risk, reviews periodic updates on climate risk exposures (including physical and transition risk metrics), progress against financed emission reduction targets for sectors and mitigation plans, external developments and trends on climate risk, results of scenario analysis and stress test exercises including implications on risk appetite and limits. The GRC is also responsible for the oversight of design and effectiveness of Climate Risk Framework. The GRC receives escalations from the Climate Risk Committee, noting none were received in 2024. Group Sustainability Committee (GSC) The GSC is a sub-committee of Group ExCo and is chaired by the Group Head of PPCR. GSC members include senior sustainability representatives from across the businesses, including the Group Head of Sustainable and Transition Finance, as well as members representing key functions across the Group. The GSC is responsible for approving and recommending the overall Group sustainability strategy to the Board Sustainability Committee and enabling alignment of business unit climate strategies to the overall strategy. The GSC is also responsible for determining, agreeing or recommending position statements, frameworks, targets, relevant disclosures and advocacy areas necessary to support strategy delivery and agreeing the strategic change priorities to support overall sustainability strategy. Climate Risk Committee (CRC) To support the oversight of Barclays' climate risk profile, the CRC was established in 2021 as a sub-committee of GRC. The authority of the CRC is delegated by the GRC, and the Group Head of Climate Risk is the Chair of CRC. The CRC has reviewed and approved a range of updates including the climate risk appetite and plans for embedding climate risk into business activities. Additionally, quantitative and qualitative metrics, emerging climate risk trends and progress against targets are presented and discussed at the CRC. Disclosure Committee (DisCom) DisCom, which is chaired by the Group Finance Director, has been set up as a sub- committee of the Group ExCo. DisCom is convened to review and monitor the integrity of the Group’s financial and narrative statements and other information provided to stakeholders, whether by means of announcement or otherwise. In addition to reporting to the Group ExCo, DisCom also reports to the Board Audit Committee (BAC). Strategy Shareholder information Climate and sustainability report Risk review Financial review Financial statements Barclays PLC 2024 Annual Report on Form 20-F 169Governance ESG Governance (continued) Further details can be found in our Remuneration report from page 112.
DisCom is convened to undertake a number of specific duties, including: • financial reporting: to review and monitor the integrity of the Group’s financial statements, interim management statements, preliminary announcements (if prepared), and any other formal announcements relating to the Group’s financial performance. • narrative reporting: to review and monitor the integrity of the Group’s narrative statements, including but not limited to the Country Snapshot, ESG disclosures, the TCFD disclosures and the Modern Slavery Statement. Group Reputation Risk Committee (GRRC) The GRRC is a sub-committee of the Group ExCo which reviews and challenges, and directs as appropriate, the management and mitigation of Reputation Risk matters in the Barclays Group as they are brought to the attention of the GRRC via relevant Reputation Risk assessment and escalation processes. This includes Reputation Risk associated with climate- related matters. The GRRC is co-chaired by the Head of Public Policy and Corporate Responsibility and Group Chief Risk Officer, and members include the Group Chief Compliance Officer and Group General Counsel. Group Chief Executive Officer (Group CEO) The Group CEO is responsible for driving Barclays’ focus on external societal and environmental stewardship, and overseeing progress towards Barclays’ ambition to be a net zero bank by 2050. The Group CEO is Chair of Group ExCo. The Group CEO is closely involved in identifying and promoting the development of Barclays’ climate and sustainable finance growth opportunities as we transition to a low-carbon economy. The Group CEO has been an active member of the Sustainable Markets Initiative's (SMI) Financial Services Task Force and became chair of the Task Force in November 2024, focusing on the mobilisation of capital towards a nature- positive transition through engagement with the SMI's real economy and other financial services taskforces. The Group CEO hosted a roundtable on scaling climate tech at Barclays' annual Sustainable Finance Conference in New York and led a discussion at London Climate Action Week on the need for partnership between the public and private sector in the energy transition. Chief Risk Officer (CRO) The Group CRO is accountable for the approach to managing climate-related financial and operational risks to Barclays. This encompasses the measurement, monitoring and limit setting for climate risk and the supporting governance. Group Head of PPCR The Group Head of PPCR leads the Group’s overall sustainability agenda. Specifically, the role is responsible for overseeing the development and implementation of Barclays’ sustainability strategy, including seeking to embed the transition to a low-carbon business model across the Group. Group Head of Sustainable and Transition Finance The Group Head of Sustainable and Transition Finance leads the Group Sustainability and Sustainable Finance teams, reporting to the Group Head of PPCR, the Global Co-Head of Investment Banking and the Global Head of Markets. The role leads the strategic direction and execution of Barclays’ policies and practices across a broad range of sustainability matters, including climate change, nature and human rights as well as the development and execution of the Group’s sustainable finance strategy to support clients navigate the opportunities and challenges of transitioning to a low- carbon economy. In these capacities, the role oversees the development of standards and metrics to advance sustainable finance and supports innovation in sustainable product development. Group Head of Climate Risk The Group Head of Climate Risk is the Climate Principal Risk owner accountable for the management and oversight of the climate risk profile. The Group Head of Climate Risk reports directly to the Group CRO and is the Chair of CRC. The Group Head of Climate Risk is responsible for the development and implementation of climate risk governance, including ownership of Barclays’ Climate Risk Framework, Standard and Policy. The Group Head of Climate Risk is also responsible for integrating climate risk considerations into existing risk management processes and overseeing climate risk management activities, including identifying, assessing, and monitoring climate risk drivers and proposing climate risk appetite, limits and controls. The Group Head of Climate Risk also leads the development of climate risk methodologies and Barclays’ approach to carbon modelling, including the BlueTrack™ methodology. Group Sustainability Chief Information Officer The Group Sustainability Chief Information Officer (CIO) brings together technology, data and change execution expertise. The Group Sustainability CIO works in partnership with the business and functions to deliver new capabilities that enable and accelerate delivery against the Group's sustainability strategy. Group Head of Finance - Sustainability and ESG The role Group Head of Finance - Sustainability and ESG encompasses leading Barclays' global external, internal and regulatory reporting capabilities relating to sustainability and ESG, and tracking progress made across our businesses to meet our climate targets, which is fundamental to support our ambition to be a net zero bank by 2050. This includes embedding climate-related disclosures such as the TCFD into our framework of disclosure procedures, governance and controls supporting the creation, review and approval of the Group’s financial statements. Further responsibilities include embedding climate-related risks and opportunities into financial planning. Strategy Shareholder information Climate and sustainability report Risk review Financial review Financial statements Barclays PLC 2024 Annual Report on Form 20-F 170Governance ESG Governance (continued)
Implementation - business working level committees, forums and reports Operational Sustainability Steering Committee (OSSCo) Barclays’ Operational Sustainability Steering Committee (OSSCo) is responsible for oversight of Barclays' net zero operations strategy. OSSCo is chaired by the Barclays Execution Services Chief Operating Officer and comprises leadership from Corporate Real Estate Solutions (CRES) & Location Strategy, Procurement, Functions Technology, Corporate Communications, Group Sustainability & ESG, and Legal. OSSCo approves and monitors progress of our sustainability operational targets and milestones, reviews operational sustainability programmes and seeks to manage risks to the delivery of the net zero operations strategy. The governance body also facilitates coordination and alignment across the functions responsible for implementing the net zero operations strategy. OSSCo provides updates to the GSC annually, which then reports to the Barclays PLC Board. BBplc Business-Level Committees for transaction reviews Business-level committees are convened for senior management to review all transactions that contain material Reputation Risk and escalate directly to the Group Reputation Risk Committee. These committees have responsibility to ensure alignment with local entity and regulatory expectations and requirements when making decisions that impact the various subsidiaries of BBplc, including Barclays Bank Ireland PLC ('Barclays Europe') and the US Intermediate Holding Company. Transactions reviewed include transactions, relationships, agreements, strategies and other business activities. Principal Investments Equity Committee The Principal Investments Equity Committee (the 'Committee') undertakes the senior approval responsibilities relating to the execution and management of all principal strategic equity and workout equity transactions managed on behalf of Barclays PLC and all other Barclays Group entities. The formation and authority of this Committee comes from the Group CEO, acting through the Group ExCo. The Committee consists of senior stakeholders who meet on a regular basis which, when considering the Barclays Climate Ventures (formerly known as Sustainable Impact Capital) portfolio, includes the Group Head of Sustainable and Transition Finance. Sustainability Change Portfolio Governance Board The Sustainability Change Portfolio Governance Board is responsible for the strategic integration, governance and control (including budgetary), prioritisation, risk management and approval of change (subject to agreed tolerances), of the Group Sustainability portfolio of work. Material decision-making is escalated to the GSC as required. The Board is chaired by the Group Head of Sustainable and Transition Finance. Strategy Shareholder information Climate and sustainability report Risk review Financial review Financial statements Barclays PLC 2024 Annual Report on Form 20-F 171Governance ESG Governance (continued)
Managing impacts in lending and financing Appropriate management of environmental and social impacts helps to ensure the longevity of our business and our ability to serve our clients. At Barclays, we recognise the importance of risk identification and management in the provision of financial services to our customers and clients. Our assessment of environmental and social risks informs our wholesale credit risk management and helps safeguard our reputation. This supports the longevity of our business and also enhances our ability to serve our clients and support them in improving their own sustainability practices and disclosures. Managing environmental and social risks Environmental and social risks are governed and managed through our Enterprise Risk Management Framework (ERMF), setting our strategic approach for risk management by defining standards, objectives and responsibilities for all areas of Barclays. The ERMF is complemented by a number of other frameworks, policies and standards, all of which are aligned to individual Principal Risks. Our Climate Change Statement covers our approach to certain sensitive sectors (thermal coal mining, coal-fired power generation, mountain-top coal removal, upstream oil & gas and unconventional oil & gas including oil sands, Arctic oil & gas, hydraulic fracturing ('fracking'), Amazon oil & gas, ultra-deep water and extra heavy oil and biomass). We have also established policy statements on Forestry and Agricultural Commodities, Protected Areas (previously World Heritage Sites and Ramsar Wetlands) which was updated in February 2025 and on the Defence and Security Sector. In addition, we have developed an internal standard which reflects the policy statements in more detail.The standard, which sits under the management of Reputation risk in the ERMF, guides our approach to climate change and relevant sensitive sectors and is considered as part of our existing transaction origination, review and approval process. Enhanced due diligence Our standard currently includes an enhanced due diligence approach for certain clients in scope of the Climate Change, Forestry and Agricultural Commodities, Protected Areas and Defence and Security Sector Statements. This approach was extended to cover the additional sub sectors brought into scope of the Climate Change Statement which was updated in February 2024. All clients in-scope of the above mentioned standard must be assessed annually via a detailed Sustainability enhanced due diligence questionnaire, which is used to evaluate their performance on a range of environmental and social issues and may be supplemented by a review of client policies / procedures, further client engagement and adverse media checks as appropriate. This annual review generates an Environmental and Social Impact (ESI) risk rating (low, medium, high) which in turn determines whether further review and client engagement may be required throughout the year. The Defence and Security Sector ESI ratings have been aligned with the other sectors where At Appetite or Within Appetite are no longer used. We follow a risk-based approach where certain clients would require further risk assessment prior to execution of transactions We undertook 775 (2023:593) reviews in 2024, being a combination of Sustainability annual due diligence reviews and individual transaction reviews. The number of reviews increased in 2024 due to matters including the updated scope of the Climate Change Statement. Monitoring As part of our management of environmental and social risks, we may require further client engagement in relation to the specific environmental and social risks that we have identified as part of our enhanced due diligence process. We have used this engagement as an opportunity to gain a more detailed understanding of the risks and challenges that the client is facing and to better understand any climate transition plan that they may have. Escalation and decision-making Where client relationships or transactions are assessed as higher-risk (high or medium ESI rating) following a Sustainability enhanced due diligence review, they are then considered for escalation to the appropriate business unit review committee (e.g. IB Sustainability Review Committee, BBplc Transaction Review Committee) for consideration and, if transaction-related, a decision on whether to proceed. Business unit review committees comprise of business management and representatives from the control functions, including Reputation Risk. Should the front office business team or the Group Sustainability team believe the issues are sufficiently material and the front office business team wish to proceed, these clients/relationships would be escalated to the Group Reputation Risk Committee (GRRC) for more senior consideration and decision. GRRC includes representation from the Group Executive Committee. These Committees may make the following determinations: • approve the transaction or relationship • reject the transaction or relationship • approve the transaction or relationship, subject to prescribed modifications • escalate the review of the transaction or relationship to the Barclays Group CEO Further details about the roles of these Committees and their activities during 2024 are set out on page 169 and 170. Strategy Shareholder information Climate and sustainability report Risk review Financial review Financial statements Barclays PLC 2024 Annual Report on Form 20-F 172Governance ESG Governance (continued)
Training Barclays continues to expand the range and coverage of training to educate colleagues on sustainability and climate change risk and opportunities, their impact on society and Barclays, and Barclays' strategy and response. Transactions and client relationships reviewed by Group Sustainability 26 426 26 106 128 42 1 323 27 72 9 109 25 n Agriculture n Chemicals n Commodity Traders n Defence, Aerospace & Security n Infrastructure & Transportation n Manufacturing n Metals & Mining n Oil & Gas n Paper & Forestry n Power & Utilities n Waste n Other 2024 Total 775 2023 Total 593 Equator Principles For project-related finance, we conduct assessments for environmental and social risks in line with the Equator Principles and relevant International Finance Corporation (IFC) Performance Standards. In 2024, Barclays strengthened its approach to client engagement when applying the Principles. Barclays was one of the four banks that contributed to developing the Principles ahead of their launch in 2003. During 2024, six transactions (2023: four transactions) were reviewed for social and environmental risks under the scope of the Equator Principles. Further details can be found at: equator-principles.com/ Equator Principles transactions in 2024 Category Sector A B C Mining Infrastructure Oil & Gas Power 5 1 Others Region A B C Americas 3 EMEA 2 1 APAC Country designation A B C Designated 5 1 Non-designated Independent review A B C Yes 5 No 1 Finance type A B C Project finance 5 1 Category A: Projects with potentially significant adverse social or environmental impacts that are diverse, irreversible or unprecedented. Category B: Projects with potentially limited adverse social and environmental impacts that are few in number, generally site-specific, largely reversible and readily addressed through mitigation measures. Category C: Projects with minimal or no social or environmental impacts. Country Designation is based on the World Bank's income criteria. Projects in designated countries (High Income OECD members) are assessed only according to local laws. Projects in 'non-designated' countries are assessed according to local laws and the IFC's standards. Strategy Shareholder information Climate and sustainability report Risk review Financial review Financial statements Barclays PLC 2024 Annual Report on Form 20-F 173Governance ESG Governance (continued) 14 1 6 2 8 16 1 1
Human rights Barclays is continuing to develop and enhance our approach to respecting human rights. The Barclays Group Statement on Human Rights, updated in 2024, reiterates our commitment to respecting human rights as defined in the International Bill of Human Rights and the International Labour Organization’s (ILO) Declaration on Fundamental Principles and Rights at Work. Our approach is guided by the UN Guiding Principles on Business and Human Rights (UNGPs) and the OECD Guidelines for Multinational Enterprises on Responsible Business Conduct. Over 2024, Barclays has undertaken steps to establish a formal programme of work focused on continuing to enhance and embed the Group's approach to respecting human rights across our business. The Human Rights Programme provides a governance structure and platform for business and functions to collaborate and make progress in key areas including human rights risk identification, further embedding and enhancing controls, and capability-building to upskill and strengthen colleagues' understanding of human rights risk and responsibilities. For further information of our management of environmental and social impacts in our lending please see page 172. Following work undertaken in 2023 to identify the most salient human rights risks associated with the then Corporate and Investment Bank, Barclays developed its Focus Areas for Progress, setting out the actions we intend to undertake over time to enhance our approach to the management of our salient issues. Below we provide an update of our progress in these areas during 2024: Focus Areas for Progress Corporate Culture Saliency Assessments Policies and EDD Just Transition Remedy Strengthen a culture of respect for human rights • Build capacity to support colleagues’ understanding of human rights risks and responsibilities Identify salient issues beyond corporate and investment bank financing portfolios • Extend saliency assessment to other areas of the bank, looking to engage with internal and external stakeholders Enhance sustainability policies and EDD to reflect salient issues for corporate and investment bank financing portfolios • Review existing sustainability policies and EDD and work to integrate salient issues • Evolve our approach to engaging with clients when responding to salient issues Support a transition to a low-carbon economy which accounts for the social risks as well as the opportunities • Work to consider just transition in our Transition Plan and Client Transition Framework • Continue engagement to help shape the way just transition is defined and implemented in practice Develop our approach to remedy • Explore approach to remedy in engagement with clients Corporate culture Beyond the work to establish capacity building as a core pillar of the Human Rights Programme, tangible steps were taken during 2024 to help build colleagues' understanding around human rights. Notably, senior stakeholders and decision- making committees within the organisation, including the Board Sustainability Committee, received external training on business, human rights and the financial sector to support their understanding of relevant frameworks and responsibilities. A broader awareness campaign was also run internally during 2024, including materials focused on how human rights risks could materialise across the Group's operations and value chain, and how certain colleagues may seek to identify and manage these risks. Existing mandatory training modules for certain colleagues were updated to include new content on human rights. We have also integrated content on social considerations into new training modules relating to sustainable finance to be rolled out in 2025 . Saliency assessments One of the key pillars of work within the remit of Barclays' Human Rights Programme focuses on the assessment of human rights risk across the broader Group, beyond the corporate and investment bank financing portfolios. Work has already been undertaken to upskill relevant colleagues across the Group in human rights risk assessment with the aim of initiating further assessments in 2025. To further support this work, a cross- functional working group was convened as part of the Human Rights Programme to collectively agree on a definition of human rights risk for the Group. This work aimed to develop a collective internal understanding of human rights risk and leverage this definition to support the evolution of our approach to risk management. Barclays also extended its approach to saliency assessments, during the first half of 2024, the Procurement team worked with Shift, a non-profit and leading centre of expertise on business and human rights, to identify and prioritise the potential salient human rights impacts within our supply chain. For more information on the supply chain saliency assessment, see page 175. Policies and enhanced due diligence Barclays' Human Rights Programme also aims to consider the way in which human rights risks are managed across the Group through our frameworks, policies, and controls. This core pillar of work focuses on continuing to evolve and, where appropriate, enhance the way Barclays' approach to human rights risk Strategy Shareholder information Climate and sustainability report Risk review Financial review Financial statements Barclays PLC 2024 Annual Report on Form 20-F 174Governance ESG Governance (continued)
management is embedded across the organisation. During 2024, Group Sustainability updated certain sensitive sector statements and underlying enhanced due diligence processes. Where opportunities to better reflect the salient issues identified for the then Corporate and Investment Bank were identified, work was undertaken to embed considerations for these issues within our public position statements and relevant enhanced due diligence processes. For example, reference to in-scope clients' approach to human rights due diligence was built out in the updated Climate Change Statement. Just transition Just transition is part of Barclays' climate strategy. Recognising that engagement is key to our approach to human rights, Barclays Climate Venture portfolio companies were engaged to build their understanding of how they can contribute to a just transition. As a result, one portfolio company was supported to enhance social and human rights considerations in its supply chain due diligence processes, including aligning questions more closely with relevant social risks. Remedy During 2024, Barclays continued to actively participate in industry-wide discussions aimed at advancing collective understanding around the role of the financial sector in effective remedy. We engaged with industry groups and fora such as Equator Principles and Thun Group to understand best practice to support our evolving approach. Barclays seeks to engage clients on their approach to remedy, particularly in the context of project finance as part of implementing the Equator Principles. This includes engaging with clients around implementing grievance mechanisms aligned with UN Guiding Principles effectiveness criteria at the project level. Modern slavery and human rights in our supply chain This process is further detailed in the Third Party Service Provider operational and reputational risk management section on page 176. Barclays Code of Conduct for Third Party Service Providers (TPSP CoC) sets out our expectations that TPSPs support our commitment to respect human rights through topics including health, safety and welfare, freely chosen employment, freedom of religion or belief, avoidance of child labour, worker freedom of association and collective bargaining, avoidance of discrimination, harassment and abuse, and accessible grievance and whistleblowing mechanism. These expectations are an important part of our efforts to meet our responsibility to respect human rights, including assessing, identifying, and mitigating modern slavery risk in our supply chain. In 2022 we set out an ambition that by 2025 TPSPs making up 70% of our addressable spend2 will have a modern slavery policy or standard in place. In 2024, 75 % of our TPSPs had a modern slavery policy or standard in place, exceeding our ambition. We continue to strengthen the way we assess, identify and mitigate modern slavery risk in our supply chain and we describe our approach in our Modern Slavery Statement. Supply chain human rights saliency assessment During the first half of 2024, Barclays worked with Shift, a non-profit leading centre of expertise on the UNGPs, to identify and prioritise the potential salient human rights impacts, including modern slavery risks, on workers providing goods or services within our supply chain. We gathered a range of perspectives through engagement with both internal and external stakeholders, including the civil society, to seek to understand the salient human rights impacts on the potentially most affected workers within our supply chain. Our internal engagement included deep-dive interviews and a series of workshops with colleagues from a wide range of functions including Sustainability, Risk, and Accountable Executives who own key TPSP relationships. Additionally, we engaged with three external organisations who have the expertise in understanding and representing vulnerable groups of workers in complex, global supply chains. These activities helped us to identify the potential salient human rights impacts across our supply chain, which are set out in the table below. Potential salient supply chain impact Forced labour Child labour Working conditions and hours Freedom of association and collective bargaining Fair wages Occupational health and safety Privacy Discrimination and harassment We intend to use the outcomes from this assessment to consider any enhancements that could be made to our existing processes and the TPSP CoC, in addition to future training and engagement with TPSPs and internal stakeholders. Notes: 1 UNGPs: United Nations Guiding Principles on Business and Human Rights. 2 Addressable spend is defined as external costs incurred by Barclays in the normal course of business where Procurement has influence over where the spend is placed. It excludes costs such as regulatory fines or charges, exchange fees, taxation, employee expenses, litigation costs or property rent. Strategy Shareholder information Climate and sustainability report Risk review Financial review Financial statements Barclays PLC 2024 Annual Report on Form 20-F 175Governance ESG Governance (continued)
Supporting our supply chain With nearly 7,5001 companies coming from 30 countries supplying us, our supply chain helps our businesses deliver for our customers, clients and colleagues. The Barclays Group engages with Third Party Service Providers (TPSPs), seeking to integrate sustainability considerations across our supply chain and provide inclusive procurement opportunities and drive economic impact to diverse2 TPSPs (in addition to publicly traded, large businesses). Please see further details on our requirements of our Third Party Service Providers at: home.barclays/who- we-are/our-suppliers/our-requirements-of- external-suppliers/ Third Party Service Provider operational and reputational risk management Barclays expects its TPSPs to make responsible decisions that, where relevant, take our stakeholders' needs into account in both the short and long term. Barclays also expects its TPSPs to comply with all applicable laws, rules and regulations within the geographies in which they operate as well as Barclays' defined minimum control standards for the risks within scope of the service. Barclays' standard approach3 to new TPSP on- boarding and renewal begins by assessing the services that are being provided and ascertaining the level of risk. TPSPs that are assessed as being above a low risk of exposure from a business risk perspective (at the point of onboarding and on an ongoing basis) are subject to Barclays' Supplier Control Obligations (SCOs). TPSPs to whom the SCOs apply become managed TPSPs and are subject to ongoing management and controls assurance during the term of service. Prior to contractual agreement and service go- live, these TPSPs are required to complete a pre-contractual questionnaire which captures their adherence to the SCOs and the TPSP CoC. The TPSP CoC encourages our TPSPs to adopt our approach to doing business and details our expectations for matters including environmental management, human rights and also for living the Barclays Values. On an annual basis, Barclays' risk owners and/or subject matter experts are engaged to confirm any required changes to the risk assessment process, SCOs and the TPSP CoC to help ensure TPSPs minimum control requirements remain aligned to Barclays and their stakeholders’ requirements. Managed TPSPs are subject to controls assurance on an annual basis to assess whether the controls required of them under the SCOs are maintained and operating effectively. They are also asked to complete an annual self-certification against the individual topics contained within the TPSP CoC. Where TPSPs are unable to meet our expectations under the TPSP CoC and SCOs, the issue will be escalated and we will look for options to manage the risk, which may include additional oversight, heightened Barclays controls or electing not to do business with the TPSP. The TPSP CoC and SCOs are published on the Barclays public website for all new and existing TPSPs to view and are refreshed at least annually. Notes: 1 Includes non-addressable spend and One Time Vendors (OTV). 2 Diverse TPSPs include businesses diverse in size (micro, small and medium-sized businesses), demographic ownership make-up (largely owned and controlled by members of under-represented groups) or mission (social enterprises). 3 We do have relationships with financial institutions and market counterparties which, because of the nature of the services being provided (such as international account holding services), are not subject to our usual TPSP onboarding procedures and which are therefore not subject to the TPSP CoC. Please see further details on our climate change initiatives in our supply chain within our Achieving net zero operations section from page 28 within the Climate and Sustainability report. Payment on time Prompt payment is critical to the cash flow of every business, and especially to smaller businesses within the supply chain as cash flow issues are a major contributor to business failure. We aim to pay our TPSPs within clearly defined terms, and to help ensure there is a proper process for dealing with any issues that may arise. We measure prompt payment globally by calculating the percentage of TPSP spend paid within 45 days following invoice date. The measurement applies against all invoices by value over a three-month rolling average period for all entities where invoices are managed centrally. At the end of 2024, we achieved 91% on-time payments to our TPSPs, continuing to exceed our public commitment to annually pay 85% of TPSPs on time (by invoice value). Moving forward we intend to review and enhance our measures aimed at ensuring prompt payment aligned with market practices. We will continue supporting small businesses and engage with Small Business Commissioner and other organisations, including Good Business Pays, to raise awareness to the public and larger businesses on late payments and the impact these can have on businesses and business owners. Strategy Shareholder information Climate and sustainability report Risk review Financial review Financial statements Barclays PLC 2024 Annual Report on Form 20-F 176Governance ESG Governance (continued)
Diversity and inclusion in our supply chain Barclays believes that diversity in all forms across our supply chain expands our ability to attract and harness third-party innovations that complement our own capabilities, create value for customers and clients, and deliver economic opportunities for wider, underrepresented segments of society. To that end in 2013 we created an internal Global Supplier Diversity (GSD) initiative, with the aim of providing inclusive procurement opportunities and driving economic impact to diverse TPSPs across our supply chain (in addition to publicly traded, large businesses). Diverse TPSPs include businesses diverse in size (micro, small and medium-sized businesses), demographic ownership make-up (largely owned and controlled by members of under- represented groups) or mission (social enterprises). The GSD initiative is underpinned by three strategic programmes: market-access, supplier development and banking access programmes. These programmes are further supported by our signature events to facilitate networking and relationship building between potential diverse TPSPs and our internal decision-makers who oversee our TPSPs. Through our GSD initiative, we have progressed towards our ambition to spend 10% of our global addressable spend1 with micro, small and medium-sized businesses, ownership- and mission- diverse TPSPs by the end of 2025 - spending approximately 9% by the end of 2024. In support of the delivery of the GSD initiative, Barclays is a corporate member of several organisations including but not limited to, Minority Supplier Development UK (msduk.org.uk) and OutBritain (outbritain.co.uk). The aim of these strategic relationship-building initiatives, is to support diverse suppliers' growth, access to capital and ability to competitively deliver solutions across global supply chains. Note: 1 Addressable spend is defined as external costs incurred by Barclays in the normal course of business where Procurement has influence over where the spend is placed. It excludes costs such as regulatory fines or charges, exchange fees, taxation, employee expenses or litigation costs, property rent. Strategy Shareholder information Climate and sustainability report Risk review Financial review Financial statements Barclays PLC 2024 Annual Report on Form 20-F 177Governance ESG Governance (continued)
Supporting customers through Barclays UK Barclays has a large retail presence in the UK, offering a wide range of products and services to c.20 million customers through Barclays UK. Access to banking Customers are looking for more convenient, simpler ways to bank that fit their lives, including banking digitally: we have over 13 million digitally active customers. We are continuing to help deliver these solutions at pace Alongside our investment in technology enabling digital customers to access tools and products whenever they need them, we are transforming our physical locations across the UK with a view to ensuring that customers can still access banking face to face where required. We have welcomed the FCA’s new rules on Access to Cash and are committed to working with other banks, the Post Office and LINK to ensure customers have access to cash and banking services through Banking Hubs and other touchpoints being delivered on a shared basis. We were pleased to make a joint commitment to open 350 banking hubs over the course of this parliament, alongside the major retail banks and the Post Office - this is in additional to the 103 currently operational (correct as at 31/12/24). We are committed to our full physical offering across the UK, with a complete refresh of our self-service devices well underway, with 183 of our 216 branches now having 24/7 cash deposit and account servicing capability via externally placed Smart ATMs. Alongside these changes, we are investing in multi-skilled training for our colleagues, so they are better able to serve customers in ways that meet their needs today as well as breaking down internal barriers to enable quicker resolution of customer queries. Economic crime and scams We take our responsibility to protect our customers’ money very seriously and are proud to have one of the lowest scam rates and highest reimbursement rates in the industry1. This is due to our continued investment in robust security systems and our established programme to educate customers and reduce the likelihood of them falling victim to scams. We have a dedicated Fraud and Scams hub on the Barclays website, which hosts a variety of content and resources to help the public learn how to keep themselves safe. Additionally, for each of the 50 million+ payments our UK customers make every month, our fraud detection systems and machine learning models determine in less than a second if it is likely to be a fraudster rather than the customer, or if our customer appears at risk of being scammed. If the transaction appears as risky, the customer is presented with additional checks prior to the payment being released. We continue to invest in security features aimed at providing protection against fraud and scams, including ‘App ID’, which allows customers to verify that they are speaking to a Barclays colleague and not an impersonator. We are also part of the ‘Do not originate’ scheme, created in partnership with the telecommunications industry, UK Finance and Ofcom, aimed at preventing our most common inbound helpline phone numbers from being used in a scam. We are committed to providing measures that help prevent Authorised Push Payment (APP) scams taking place and building increased consumer protection standards for customers through both the UK Payment Systems Regulator's( PSR) new APP Scam Regulations that came into effect in October 2024 and the previous Contingent Reimbursement Model code. We are founding members of Stop Scams UK, a cross-industry group made up of banks, telecoms and tech firms that have come together to seek to put an end to scams by collaborating, sharing best practices and engaging with the government and regulators to make it harder for scammers to operate. We have published a series of policy recommendations to tackle the spread of scams. If you suspect that you have been approached by fraudsters please tell the FCA using the share fraud reporting form at fca.org.uk/scams You can also call the FCA Helpline on 0800 111 6768 or through Action Fraud on 0300 123 2040 Note: 1 The PSR’s latest report covering 2023 includes the UK’s 14 largest banking groups, along with the data for 11 other smaller firms that were in the top 20 highest receivers of fraud. Frontier Economics report on Tacking Fraud and Scams: home.barclays/news/press- releases/2023/08/eight-in-ten-brits-feel-unsafe- on-social-media-due-to-scammers/ Digital accessibility Digital services and workplace tools must be designed and developed to be easy to see, hear, understand and use for all customers and colleagues, including people with disabilities. There is a legal requirement and moral imperative to ensure that people with disabilities are not left out or left behind from using our digital services. All digital services and content must comply with our Barclays digital accessibility standards. These standards align to the Web Content Accessibility Guidelines (WCAG) v2.2 A level and apply to both internal projects as well as external suppliers. Corrective actions are taken in a timely manner where issues are discovered through testing against these standards. We continue to strengthen our oversight processes to ensure our services are compliant as technologies are updated. The Barclays Accessibility Statement barclays.co.uk/who-we-are/our-suppliers/our- requirements-of-external-suppliers/ Building financial wellbeing As part of our aim to deliver a world-class money management experience and help money work for our customers, particularly through the cost of living crisis, we are delivering more tools and features to educate them on managing their money. We are providing knowledge and expertise through our colleagues, including helping customers to use our digital platforms via the Digital Eagles. The Barclays Money Management Hub gives us the ability to provide proactive money management information directly to customers, giving them a better grasp on their spending behaviours and steps they can take to improve their financial wellbeing and provide customers greater control over their finances. We also have a range of early intervention strategies which aim to support customers whose account behaviours may be showing signs of lacking financial resilience. These strategies largely focus on pro- active communication with the customer, based on sets of customer behavioural triggers, and look to support customers to help them maintain or regain control of their finances. Where customers engage with these contact strategies, our Barclays Financial Assistance colleagues provide broad money management advice and, where appropriate, may suggest a range of solutions to manage their financial situation. This suite of solutions includes forbearance and non-forbearance options. Strategy Shareholder information Climate and sustainability report Risk review Financial review Financial statements Barclays PLC 2024 Annual Report on Form 20-F 178Governance ESG Governance (continued)
Gambling Barclays understands that gambling and financial difficulty can often go hand in hand and that customers may sometimes find it hard to ask for help. We have dedicated training available for customer-facing colleagues to help them understand and support customers impacted by problematic gambling. Our specialist colleagues are trained to calmly and professionally deal with the most emotive and complex conversations and signpost where needed to external support charities and organisations. Further details can be found at: barclays.co.uk/gambling-support/ Domestic abuse To support customers impacted by domestic abuse, we continue our partnership with Refuge, the largest domestic abuse service provider in England, offering specialist support for women and their children. This enables us to direct those impacted by domestic abuse to expert advice and assist survivors with the opening of bank accounts and gaining access to banking services in situations where they may not have the requisite documentation. In 2024, the Barclays Refuge partnership was awarded Gold at the Corporate Engagement Awards in the category of Best Charity, NGO or NFP programme. We continue to be a committed signatory to the UK Finance Domestic Abuse Code of Practice, which sets out how participating banks and building societies should support customers who are victims and survivors of economic or financial abuse. Homelessness We continue to support those with limited documentation such as homeless people to open a basic current account. Bereavement Throughout 2024, we have continued to prioritise making this extremely difficult time in people's lives a little easier. Our programme of work to enhance the customer experience remains front of mind. Highlights this year include: introducing video banking appointments to support notifications of bereavement and providing an instant email confirmation following a notification of bereavement to all customers that provide an email address with their notification. Further details can be found at: barclays.co.uk/what-to-do-when-someone-dies/ notify-us/ Authorised users For almost three years, we’ve given customers the ability to manage their current account with the help of a trusted person in their life. Whether they need someone to spend on their behalf or help managing their finances, the Authorised User feature provides a reliable and accessible tool, at no additional cost. Further details can be found at: barclays.co.uk/ways-to-bank/authorised-users/ manage-account/ Specialist support team The Vulnerability Care Hub are a dedicated and expertly trained team, who support all BUK’s most vulnerable customers and colleagues in emotionally demanding environments, regardless of their financial position. Their enhanced skills are supported through internal and external training, which aids vulnerability discussions. Accessibility & Vulnerability (A&V) Framework Throughout 2024 we have made a number of enhancements to our Accessibility & Vulnerability Framework, giving colleagues within Barclays the ability to record disclosed customer vulnerability on our systems. This enables us to provide customers with the correct level of service based on their particular needs and/or adjustments. We have focused on improving access to communications in alternative formats and increasing the range of vulnerability indicators which customers can apply (and find help for) themselves in our digital channel. Circa 36,000 Barclays UK colleagues completed the mandatory Customers in Vulnerable Circumstances annual eLearning module in 2024. The training improves awareness and understanding of vulnerability for our frontline and Head Office colleagues. We have continued to deliver vulnerability induction training to equip new colleagues with how to identify and support customers who may be vulnerable or going through a life event. Barclays UK Performance Framework The Framework seeks to mitigate the risks of inappropriate performance management practices, including by (among other things) seeking to ensure there is no undue pressure on colleagues to sell products, which can result in mis- selling. The Performance Framework operates controls to provide insight and subsequent oversight that the business is operating aligned to the expectations set out in the Performance Framework Policy Standards. Basic current account Since 2015, we have been offering our basic current account to individuals who may not be eligible for a standard account access to banking, including over the counter services, access to ATMs, and digital banking and free text alerts to manage finances. There were over 609,000 Barclays basic current accounts open at the end of 20241. Access to a transactional bank account enables consumers to benefit from bill reductions through paying by direct debit and access to cheaper goods and services on the internet, to help them along their financial journey. If their circumstances change, customers on the basic current account are able to apply for a standard Barclays Current Account at any time. Periodically we also review accounts to upgrade customers from basic current account to Barclays Bank Account where eligible. Number of basic current accounts (#) 2024 2023 2022 609,120 650,863 661,991 Note: 1 In 2024, we upgraded more than 62,000 customers from our Barclays Basic Bank Account to our Barclays Bank Account Strategy Shareholder information Climate and sustainability report Risk review Financial review Financial statements Barclays PLC 2024 Annual Report on Form 20-F 179Governance ESG Governance (continued)
Barclays' mortgages and first-time buyers 2024 has seen a reduction of the rate environment, with the first Bank of England base rate decrease seen in August of this year, however, we recognise customers are still experiencing increasing rates as they roll off their fixed rates and as such our commitment remains to support these customers. Given this, we have made it simpler for customers to apply under the Mortgage Charter for a temporary move to interest only or for an extension of their mortgage term by digitising the application journey. We have also continued to support customers who are buying their first home through the UK Government mortgage guarantee scheme, the Barclays Family Springboard and our Barclays Boost mortgages – re-branding and more clearly highlighting our Joint Borrower, Sole Proprietor proposition. In 2024, we have helped over 49,000 first-time buyer customers get onto the property ladder across over 31,000 purchases. The Mortgage Guarantee Scheme offers mortgages which are backed by a UK Government guarantee. Customers can apply for the scheme with a minimum deposit of 5% of the property purchase price, and it is available for first-time buyers and those looking to make their next move on the property ladder. Financial inclusion in our US consumer business The Community Reinvestment Act (CRA) is a US federal law designed to encourage financial institutions to help meet the needs of borrowers in all segments of their communities, including low and moderate- income neighbourhoods. Barclays meets the CRA requirement by supporting and investing in local Community Development Financial Institutions (CDFIs), small- medium businesses and non-profits. The success of CDFIs, small-medium businesses and non-profits are key to a thriving community. Barclays has predefined goals with specific performance targets that we must meet each year in order to be considered in compliance with CRA guidelines. Barclays has met its CRA goals for 2024, evidencing that we are continuing to invest in the communities where we live, work and serve. Barclays Bank Delaware (BBDE) is committed to fair and equitable treatment of all prospective and existing customers without regard to race, sex, colour, national origin, religion, age, marital status, disability, sexual orientation, military status, gender identity, familial status, Limited English Proficiency, receipt of public assistance income, and good faith exercise of rights under the Consumer Credit Protection Act. We believe Barclays’ core Values of Respect, Integrity, Service, Excellence, and Stewardship reflect our commitment to fair lending and fair treatment principles and practices. We strive to develop long- term relationships by providing products and services that meet prospective and existing customer needs, avoid causing prospective and existing customer detriment or harm, and place our prospective and existing customers' interests at the heart of our strategy, planning, and decision-making processes. Strategy Shareholder information Climate and sustainability report Risk review Financial review Financial statements Barclays PLC 2024 Annual Report on Form 20-F 180Governance ESG Governance (continued)
The Barclays Way The Barclays Way is our Code of Conduct. Together with more formal policies and practices, this provides a clear path towards achieving a positive and dynamic culture within the Group. Our commitment to being a responsible business includes seeking to ensure that: • we conduct ourselves in line with The Barclays Way, our Code of Conduct, to create the best possible working environment for our colleagues • we treat our customers fairly and the products and services we deliver are transparent and responsible • we operate in line with relevant laws and regulations including those applicable to financial crime • we safeguard the data that has been entrusted to us. Our Code of Conduct reflects the trust that millions of people place in us every day. We know that trust is earned by repeatedly doing the right thing. We believe the best way to build that trust is to invest in our culture and support our people in the choices they make every day, with guidance and policies that help them do this. That starts with our Purpose, Values and Mindset, and is locked into our organisation through The Barclays Way, the touchstone for everyone in Barclays on the standard of conduct we expect, setting an unequivocal tone from the top about who we are and what we stand for. In challenging times such as these, it is more important than ever that we conduct ourselves in the right way. The Barclays Way sets out the standards of behaviour we should all aspire to in our professional lives. It is a guiding light for everyone in Barclays, helping us to make the right decisions every day.” The Barclays Way was launched in 2013, replacing a number of existing codes of conduct with a single document. Endorsed by our Chairman, it governs our way of working across our business globally and constitutes a reference point covering all aspects of colleagues’ working relationships, specifically but not exclusively with other Barclays employees, customers and clients, governments, regulators, business partners, suppliers, competitors and the broader community. It is aligned to the Code of Professional Conduct, published by the Chartered Banker Professional Standards Board, which sets out the ethical and professional attitudes and behaviours expected of bankers. Barclays subscribes to this code and is committed to embedding its broad principles into our business. The Barclays Way includes information and guidance on how employees are expected to behave and take personal accountability for making decisions. We apply a range of criteria, over and above financial considerations, aimed at building a sustainable, strong and profitable business for the long term and adding value to our business relationships and the broader communities in which we live and work. We provide guidance across all key stakeholder groups, including in relation to servicing our customers and clients, promoting respect, diversity and performance in the workplace and maintaining strong governance, robust controls and strict ethical standards. The Barclays Way also includes advice and guidance on speaking up and raising concerns. It is important for the success of Barclays, and for the safety and wellbeing of our customers, clients and colleagues, that we encourage a culture that supports speaking up when things aren’t as they should be. All colleagues are required to undertake training on The Barclays Way. We know that our success over the long term is based not just on how well we run the organisation commercially, but also on how well we manage it to protect the environment, support positive social progress and make responsible, well- governed decisions. We are focused on the areas where we can have the greatest long-term impact: making growth ‘green’, sustainable and inclusive; managing the environmental and social impacts of our business; running a responsible business; and investing in our communities. Employee survey results % "I believe that my team and I do a good job of role modelling the Values every day" 2024 2023 93 94 % of colleagues completing mandatory training on The Barclays Way 100% The Barclays Way Code of Conduct is available at: home.barclays/citizenship/the-way-we-do- business/code-of-conduct/ Strategy Shareholder information Climate and sustainability report Risk review Financial review Financial statements Barclays PLC 2024 Annual Report on Form 20-F 181Governance ESG Governance (continued) “
Whistleblowing We support a culture where colleagues feel safe to speak up. Barclays is committed to providing a respectful and inclusive environment to work in and colleagues are encouraged to speak up about actions and behaviours that have no place in the organisation. 81% of global respondents of the 2024 Your View survey said it was 'safe to speak up' at Barclays. Colleagues are encouraged to speak up directly to their people leader, Compliance, HR or Legal. However, where they do not feel comfortable using these avenues, the Raising Concerns process is available. The Raising Concerns team carefully assess concerns and refer them to the most appropriate team for review and, where appropriate, investigation. All concerns are taken seriously and managed sensitively and confidentially. Information on how to raise a concern is available both internally and externally. One of the channels to which concerns may be referred is the whistleblowing programme. Information about the whistleblowing programme is provided to colleagues globally, including through annual mandatory training. Whistleblowing relates to concerns which fall within the wider public interest. This may include a breach of our policies or procedures, breaches of law and regulation or other behaviour that harms or is likely to harm the reputation or financial wellbeing of the Group. Concerns assessed by Raising Concerns as whistleblowing are directed to a dedicated impartial team within the Compliance function. All whistleblowing concerns are taken seriously, and controls are in place to protect the confidentiality of whistleblowers. Barclays has a zero-tolerance approach to retaliation against any whistleblower or any individual who has provided information as part of an investigation. Any act of retaliation by a colleague may result in disciplinary action, including dismissal. In 2024, the whistleblowing team opened a total of 69 (2023: 67) whistleblowing concerns including 15 (2023: 19) retaliation concerns. 22% (2023: 25%) of whistleblowing concerns closed in 2024 were found to have some level of substantiation and other issues were identified in a further 19% (2023: 38%) of concerns. None of the retaliation concerns closed in 2024 were substantiated. In addition, 57 (2023: 64) actions arising from concerns raised in 2024 were implemented to address issues identified during the course of investigation concerns . This includes recommendations to enhance processes and controls. The Chair of the Group Board Audit Committee is the Group Whistleblowers’ Champion and the Chair of the Barclays Bank UK PLC (BBUKPLC) Board Audit Committee is the BBUKPLC Whistleblowers’ Champion. Whistleblowing cases closed by region Whistleblowing cases opened by (top 4) categories 1 Breach of controls, process or other 2 Retaliation 3 Breach of Policy 4 Financial Crime 5 Other The Whistleblowers’ Champions have responsibility for ensuring and overseeing the integrity, independence and effectiveness of Barclays’ whistleblowing programme across their respective entities. Their oversight is supported by periodic impartial reviews and assurance of the whistleblowing process. Barclays also works with Protect, the UK Whistleblowing Charity. The whistleblowing programme has benchmarked highly under Protect’s best practice benchmark framework. Strategy Shareholder information Climate and sustainability report Risk review Financial review Financial statements Barclays PLC 2024 Annual Report on Form 20-F 182Governance ESG Governance (continued) 68 cases closed in 2024 36 15 6 3 9 37 EMEA 15 APAC 16 Americas
Tax Barclays supports a fair and transparent tax system. We were shortlisted for the 2024 PwC Building Trust Award for Tax Reporting in the FTSE 350 (Multinationals) Group.” Barclays takes a responsible approach to tax. We have strong governance and risk management over tax risk and are committed to transparency around tax. We know that it is important for our investors, customers and clients, regulators, tax authorities and other stakeholders to understand our approach to tax and our tax contributions in the countries in which we operate. Our success in being able to clearly explain our approach to tax and understand what matters to our stakeholders is reflected in Barclays being one of three companies shortlisted for the 2024 PwC Building Trust Award for Tax Reporting in the FTSE 350 (Multinationals) Group. This award, which we won in 2023, recognises the clear explanations that companies provide about their tax affairs and their responsiveness to both stakeholder interest and the continually changing tax transparency landscape. Taxes paid globally £2,891m Taxes paid globally in more detail £m 1,283758 637 155 58 n Corporation tax and withholding taxes n Employer payroll taxes n Irrecoverable VAT n Bank levy n Other taxes including business rates 2023 taxes paid globally £2,505m Tax contribution We continue to make substantial tax contributions across the jurisdictions in which we operate, both in terms of taxes paid and taxes collected. Our total tax contribution for 2024 was £6,439m. This includes taxes paid of £2,891m which represent a cost to us, and taxes collected on behalf of governments of £3,548m. Barclays was ranked as the seventh- largest UK taxpayer, in terms of taxes paid, in the most recent PwC Total Tax Contribution survey of the One Hundred Group (‘100 Group’). The 100 Group represents members of the FTSE 100 along with several large UK private companies. Over the last decade we have paid £14bn of taxes in the UK alone. For further details, see our Country Snapshot report at: home.barclays/annualreport Approach to tax Barclays’ Purpose is working together, with all our stakeholders, for a better financial future for our customers, clients and communities. Our approach to taxation, also known as our tax strategy, is aligned with this Purpose as well as our Values of Respect, Integrity, Service, Excellence and Stewardship. Our approach to tax has three core objectives: • responsible approach to tax • effective interaction with tax authorities, and • transparency in relation to our tax affairs. We manage our tax affairs in accordance with our Tax Principles, Tax Code of Conduct and HMRC’s Code of Practice on Taxation for Banks and aim to file our returns on time and pay the correct amount of tax. We make clear disclosures to tax authorities and we are committed to only dealing with customer and client assets that have been appropriately declared to the relevant tax authority. We are also committed to being a leader in tax transparency. We have published details of the taxes we pay by country and our approach to tax since 2013, and have chosen to expand our external publications such as the Country Snapshot. Our Country Snapshot is publicly available, it sets out our approach to tax in detail, including our Tax Principles, and is reviewed and approved annually by the Barclays PLC Board. Key highlights from our approach to tax include: • we follow clear Tax Principles that we have published. These allow us to balance the needs of all our stakeholders and make clear that tax planning must support genuine commercial activity • as a result of this approach, transactions which artificially transfer profits into a low tax jurisdiction would not be consistent with our Tax Principles • we seek to comply with the spirit as well as the letter of the law and we take account of established practice in the territories in which we operate. We are transparent in both the disclosure of our tax affairs to tax authorities as well as our tax reporting to other stakeholders, and • we aim to comply with all of our tax obligations in the territories in which we operate and where there is uncertainty we may seek external tax advice in order to help ensure our tax filings are appropriate. Tax governance, control and risk management As a Global Systemically Important Bank, our Group-wide risk and governance procedures are subject to continuous review and scrutiny. More details on our approach to tax governance, control and risk management can be found in our Country Snapshot, the key highlights of which include: • our Board has ultimate responsibility for tax matters and the Board Audit Committee oversees our approach to tax • at Barclays, risks are identified and managed through our ERMF, which supports the business in its aim to embed effective risk management and a strong risk management culture. Under the ERMF all risks, including tax risk, are managed in accordance with a ‘three lines of defence’ model Strategy Shareholder information Climate and sustainability report Risk review Financial review Financial statements Barclays PLC 2024 Annual Report on Form 20-F 183Governance ESG Governance (continued) “
• as part of the ‘first line of defence’ the tax department identifies and manages tax risk by developing appropriate policies, standards and controls to apply across our organisation. Risk and Compliance comprise the ‘second line of defence’, and Barclays Internal Audit is the ‘third line of defence’, and these functions review, challenge and provide assurance to the Board in relation to the effectiveness of governance, risk management and controls including those relating to tax risk • we are subject to the Sarbanes-Oxley Act control requirements in relation to financial statements disclosures including those related to tax • our tax department comprises appropriately qualified in-house professionals who are subject to clear standards including that they uphold our Tax Principles and follow our Tax Code of Conduct, which is an integral part of how we operate • our governance requires that suitably qualified people are involved in decisions related to tax, tax is fully taken into account when making business decisions and tax risk is identified, assessed and kept under review, and • we have no tolerance for tax evasion, have measures in place to prevent tax evasion facilitation and have well- established mechanisms for speaking up about unethical or unlawful behaviour through our raising concerns and whistleblowing processes, which apply equally to tax matters. Stakeholder engagement and management of uncertainties related to tax: Our reputation is very important to us and we take our external stakeholders’ expectations into account when we make decisions in relation to our tax affairs. More details on our approach to stakeholder engagement and managing stakeholder concerns related to tax can be found in our Country Snapshot, and key highlights include: • we believe that it is important to be transparent in the disclosure of our tax affairs both to tax authorities and stakeholders more broadly • our dealings with tax authorities are handled proactively, constructively and transparently, in real-time where possible • we recognise that early resolution of our tax affairs is in everyone’s interest. We have ongoing engagement with tax authorities to discuss their inquiries and material issues in relation to our tax affairs, and we respond to feedback from tax authorities • where we face significant uncertainty in relation to the application of tax law, we may seek to agree with the tax authority how the tax law should apply • where relevant we seek to reach agreement with tax authorities using mechanisms available to all taxpayers including Advance Pricing Agreements and Mutual Agreement Procedures to clearly establish in which territories our profits should be taxed • we engage with governments, tax authorities and NGOs through public consultations and other discussions to assist with the development of tax policy and the improvement of tax systems, and maintain our transparency with these stakeholders, and • we cooperate with tax authorities globally to reduce the scope for individuals and companies to evade tax, and have met all of our 2024 information reporting obligations under the Common Reporting Standard and Foreign Account Tax Compliance Act. The BPLC Board Audit Committee is responsible for considering the Group's tax strategy and overseeing compliance with the Group's Tax Principles. Please refer to page 91 for details of BPLC Board Audit Committee oversight of tax related matters. Strategy Shareholder information Climate and sustainability report Risk review Financial review Financial statements Barclays PLC 2024 Annual Report on Form 20-F 184Governance ESG Governance (continued)
Financial crime Barclays recognises that financial crime has an adverse effect on individuals and communities wherever it occurs. Endemic financial crime can threaten laws, damage communities, impoverish states and distort trade and competition. Barclays recognises that financial crime has an adverse effect on individuals and communities wherever it occurs. Endemic financial crime can threaten laws, damage communities, impoverish states and distort trade and competition. Barclays is committed to conducting its global activities with integrity and respecting its regulatory, ethical, and social responsibilities to: a. Protect customers, employees, and others with whom we do business, and b. Support governments, regulators, and law enforcement in wider financial crime prevention. Barclays seeks at all times to operate its business in accordance with all applicable laws, rules and regulations. Barclays does not tolerate any breach of financial crime laws and regulations that apply to our business and the transactions we undertake. The Financial Crime Risk Management Framework (FCRMF) outlines how the Barclays Group manages and measures its Financial Crime risk profile. The Group Chief Compliance Officer is accountable for developing, maintaining and overseeing the Group wide FCRMF. The Legal Entity Money Laundering Reporting Officers are responsible for providing effective oversight, management and escalation of financial crime risk in line with the FCRMF at the Entity and Subsidiary level. This includes defining and owning the relevant financial crime risk policies which detail the control objectives, principles and other core requirements for the activities of the Group. It is the responsibility of the first line of defence to establish financial crime related controls to manage its performance and assess conformance to these policies and controls. The FCRMF is supported by a Group-wide Financial Crime Policy. The Financial Crime Policy sets control objectives for the first line of defence to manage four key risks: anti-bribery & corruption (ABC); anti- money laundering & counter-terrorist financing (AML); anti-tax evasion facilitation (ATEF) and sanctions, including proliferation financing. This combined approach allows us to identify and manage relevant synergies and connections between these risks. Employees are made aware that failure to comply with the Financial Crime Policy may give rise to disciplinary action, up to and including dismissal. Anti-Bribery and Corruption Bribery and corruption comprise: a. Improperly obtaining or retaining business; b. Improperly securing a business or personal advantage; c. Inducing another person to perform their role in breach of an expectation of good faith, impartiality or trust. Barclays and its employees are prohibited from engaging in or facilitating any form of bribery and corruption (giving and receiving, directly or indirectly). The Financial Crime Policy contains the minimum risk-based control requirements that all our businesses, legal entities and employees must follow. The Financial Crime Policy is designed to ensure that Barclays’ employees know how to identify and manage the legal, regulatory and reputational risks associated with all forms of bribery and corruption. Anti-Money Laundering Money laundering and terrorist financing have been identified as major threats to the international financial services community and therefore to Barclays. The Barclays Financial Crime Policy include the requirement for Barclays businesses and legal entities to have adequate systems, procedures, and controls in place to manage the risk of Barclays being used to facilitate money laundering and terrorist financing. The requirements of UK legislation apply to Barclays globally. As a transatlantic bank, the Financial Crime Policy take into account US anti-money laundering requirements, in addition to EU and other jurisdiction in which we operate. Barclays also takes into account guidance issued by bodies such as the Wolfsberg Group. Anti-Tax Evasion Facilitation Tax evasion is a financial crime and a predicate offence to money laundering in the UK and many other countries in which we operate. Barclays takes a zero- tolerance approach to deliberate facilitation of tax evasion in any country and has procedures in place to prevent it. We also expect the same from our employees and third parties providing services for or on our behalf. Barclays is committed to preventing tax evasion facilitation by our employees or third parties acting for or on our behalf. Sanctions Sanctions are restrictions on activity with targeted countries, regions, governments, entities, individuals and industries that are imposed by bodies such as the European Union, the United Nations, (including but not limited to the proliferation of nuclear, chemical, or biological weapons), groups of countries, or individual countries, such as the United Kingdom and the United States. In order to protect its reputation and other legitimate business interests, in certain circumstances Barclays' sanctions risk appetite may be stricter than its legal obligations. The Financial Crime Policy is designed to ensure that Barclays and its employees know how to identify and manage the risks associated with sanctions, including the risk that activity is undertaken through Barclays in breach of sanctions regulations. For further details of the Barclays approach to Financial Crime compliance and prevention, please see our Financial Crime Compliance Statement in the ESG Resource Hub at https://home.barclays/ sustainability/esg-resource-hub/statements-and- policy-positions/ Strategy Shareholder information Climate and sustainability report Risk review Financial review Financial statements Barclays PLC 2024 Annual Report on Form 20-F 185Governance ESG Governance (continued)
Health and Safety Policy and Standard Barclays has a suite of health and safety (H&S) policies and standards, which include clear roles and responsibilities for leadership and colleagues. These combine under a single high-level statement of commitment endorsed by the Group Exco. Health and Safety Management System Barclays has implemented and maintains a comprehensive H&S management system globally, which is certified to the international standard ISO45001 in the USA, UK, India, Singapore, Hong Kong and Japan. Health and Safety Risk Assessment and Assurance Barclays H&S management system is validated through H&S assurance and risk assessment programmes. Risk assessments identify hazards and the control measures required to proportionately manage the associated risks, whilst H&S assurance validates that control measures are designed effectively, implemented and operating effectively, and that site monitoring is taking place. While H&S legislative requirements vary globally, our assurance and risk assessment programmes apply a risk- based approach, designed by our internal H&S team and informed by their experience, specific legislative requirements and relevant factors such as building type, building criticality, activities, and occupancy. The Health and Safety Risk Management Framework overview is as follows: Health and Safety Forum Leadership Statement of Commitment for Health and Safety H&S Data Data: Performance against commitment Horizontal Premises People Physical Security Risks Harm to people through physical injury arising from Barclays' activities (excluding Physical Security incidents) Harm to colleagues as a result of health and wellbeing related hazard mismanagement L3 Physical security incidents resulting in harm to staff or external parties L3 Policies Premises – Property and Health & Safety Policy Health Services & Wellbeing Policy Physical Security Policy Standards Premises – Health & Safety Standard Health Services & Wellbeing Standard Physical Security Standard Incident Management Barclays’ incident reporting system ensures incidents are recorded and investigated appropriately, as required by local regulatory statute, and escalated as required by Barclays’ risk management frameworks. Measure 2024 2023 Lost Time Incidents (per 100 employees) 0.018 0.025 Contractor Management Suppliers are subject to a supplier H&S risk evaluation during onboarding, annually thereafter and when they notify a change in service delivery. In addition, suppliers complete an annual control obligation review. Health and Safety Training Colleagues complete annual mandatory H&S training with additional information and guidance provided on Barclays’ H&S intranet. This information includes risk assessments, guidance and templates for personal emergency evacuation plans, display screen equipment assessments, manual handling, occupational stress, and lone working. Governance Key indicators (KIs) and control environment characteristics (CECs) are defined to support the oversight and monitoring of Barclays’ global H&S performance. These are reviewed at least annually and reported at least quarterly. KIs include quantitative and qualitative measures against defined tolerance, and in 2024 our assurance tolerance threshold tightened by 5%. Examples of KIs and CECs include: • Investigation of reported incidents • Completion of H&S assurance • Completion of fire risk assessments • Mandatory H&S training completion • Testing of supplier H&S controls. Barclays’ programME of internal control testing supports the effective performance of KIs and CECs, and enables improvement opportunities to be identified and acted upon. H&S performance is reported to the Group H&S Forum which oversees effective management of H&S globally. Barclays operates a reward and recognition scheme through which colleagues are recognised for improving controls, including those supporting the H&S management system. Management Information The H&S team collates and reviews management information including incident, risk assessment and H&S assurance data to identify themes and trends. Relevant insights, emerging themes and other information are reported to and reviewed by the Group H&S Forum. 2024 Improvements H&S improvement delivered in 2024 include: • Extending ISO45001 certification in line with our continuous improvement strategy • Launching new driving for work programme to improve how associated risks are managed for colleagues who drive for business. • Enhancing the process for colleagues completing display screen equipment assessments. • Improving horizon scanning, to keep up- to-date with new or revised H&S legislation. • Strengthening contractor management processes. Strategy Shareholder information Climate and sustainability report Risk review Financial review Financial statements Barclays PLC 2024 Annual Report on Form 20-F 186Governance ESG Governance (continued)
Strategy
Shareholder
information
Climate and sustainability
report
Risk review
Financial review
Financial
statements
Barclays PLC 2024
Annual Report on
Form 20-F
187
Governance
ESG Governance (continued)
Managing data privacy, security
and resilience
We have strict policies to protect privacy
and keep data secure.
Data privacy
Most of the jurisdictions in which Barclays
operates have privacy and data protection
laws in effect. While these may vary in
detail, generally they reflect internationally
recognised privacy principles found in the
UN’s Universal Declaration of Human
Rights, the European Convention on
Human Rights and the European Union’s
Charter of Fundamental Rights.
We strive to operate in accordance with
these standards and recognise that
respect for privacy rights is a key element
of good corporate governance and social
responsibility. We strive to be transparent
about our use of personal information
when delivering our products and services
and acknowledge the responsibility we
have for safeguarding privacy.
As Barclays increasingly adopts digital
solutions to deliver next-generation
consumer financial services, we appreciate
our clients, customers and others may
wish to understand how this may impact
the use of their personal information. A
globally applicable Barclays Data Privacy
Standard sets out what is expected of all
Barclays businesses and functions when
collecting, using and sharing personal
information.
To promote clear accountability, the
Standard includes the requirement for
each business to appoint an accountable
executive who has ultimate responsibility
for the processing of personal data within
that business. An agreed assurance
programme measures compliance with
the Data Privacy Standard. Barclays
colleagues must complete annual privacy
training which is reviewed and refreshed
each year, with additional tailored training
provided as necessary. The Group Data
Protection Officer (DPO) reports on data
privacy issues to the highest level of
management.
Through client, customer and employee
privacy notices, we endeavour to explain
clearly and openly how and why we use
personal information and the legal grounds
we rely on. When we receive complaints we
seek to address them fairly. Several
jurisdictions also provide individuals with
specific rights, such as the right to have
access to or request deletion of their
personal information.
Barclays provides a public mailbox and
secure channels via its website to enable
individuals to make their privacy requests
and receive responses from a dedicated
team.
Barclays requires its suppliers to comply
with data protection and privacy laws,
regulations and standards relevant to the
jurisdictions in which they operate and
relevant to any transferred personal data.
Our requirements are set out and
principally managed through our supplier
contract templates, which require that
suppliers commit to ensuring personal
data shared with them is safeguarded and
respected throughout the supply chain.
Data security
As detailed below, Barclays' Chief Security
Office and Chief Information Security
Office operate controls aimed at
mitigating cybersecurity-related risks and
understanding internal and external
threats.
Barclays deploys controls designed to
protect its sensitive information and the
data that has been entrusted to us by
customers and clients, in line with our
Standards, taking into account findings
from internal and external reviews of our
controls.
Barclays seeks to protect the security of
data we share with third parties, including
by conducting remote and on-site
inspections with certain suppliers to review
their controls against contractual
obligations and industry standards. A Third
Party Service Provider Framework is in
place which sets out control requirements
for business units to manage the
operational, reputational, conduct and
legal risks to Barclays through its supply
chain.
In operating under a hybrid working model,
we have continued to educate colleagues
on cybersecurity risks in order to help
minimise risks related to remote working,
such as data exploitation or leakage.
Barclays works with industry bodies and
cybersecurity vendors to learn from risk
events in other organisations. Our teams
use such intelligence to simulate plausible
cybersecurity and data compromise
scenarios that allow us to exercise, review
and improve our response and recovery
plans in preparation for evolving threats.
Operational resilience
Customers and clients have increased
expectations for us to be ‘Always On’. The
interconnectivity of the financial sector
means the stability and resilience of our
systems, workforce and the continued
provision of third-party services, all have a
direct impact on the quality of our service.
Resilience and security is a focus for the
Board. Barclays continues to strengthen its
resilience posture and is focused on its
ability to recover from a range of ‘severe
but plausible’ scenarios which could cause
detriment to its customers and clients and
the broader financial market. To enable this,
we define Group-wide business services
and their interdependencies across the
Group, including technology, third-party
services and our workforce. Recovery plans
and business response plans have been
developed for a range of different
disruption events, such as cyber or data
integrity disruptions, or technology failures.
These recovery plans are reviewed and
validated through regular testing which
supports our aim to reduce the volume and
impact of operational incidents year on
year. We also conduct regular assurance on
third parties to assess their capability.
Operational resilience is delivered through
an established and robust Operational
Resilience Framework underpinned by a
Policy, Standards, methodologies and
procedures. These are integrated with
Barclays’ Enterprise Risk Management
Framework (ERMF) and set the tone from
the top. The Standards are embedded
within the Barclays Controls Framework
and provide a consistent approach across
the firm.
The Operational Recovery Planning Policy
and Standards drive the identification of
the business services that are most
important to Barclays, its customers,
clients and the markets in which Barclays
operates. The Standards also define
requirements for setting recovery targets,
Strategy
Shareholder
information
Climate and sustainability
report
Risk review
Financial review
Financial
statements
Barclays PLC 2024
Annual Report on
Form 20-F
188
Governance
ESG Governance (continued)
mapping of dependencies, planning and
testing.
Resilience and security is the responsibility
of everyone within the Group. All
permanent employees are required to
complete annual mandatory training on
these topics.
Please refer to page 99 for details of Barclays PLC Board
Risk Committee oversight relating to operational
resilience.
Please refer to the 'Material existing and emerging risks'
1The scope of elevated risk sector mapping has been revised based on our periodic assessment of climate risk sectors, resulting in activities such as renewable energy within Power
Utilities, Water Utilities, Construction and Material, Food and fashion related activities (Others) now classified as elevated risk sectors/carbon related assets. The prior year comparatives
have been re-presented to align with the updated sector mapping.
2As industries decarbonise, sectors will increasingly include both carbon and non-carbon related activities e.g. Power Utilities will also include, in part, their generation capacity from
renewable energy sources.
3Physical risk and Transition risk indicators are added for elevated risk sectors to indicate the drivers of risk. See page 24 for further details.
4Loans & advances includes debt securities at amortised cost amounting to £68,210 (2023: £56,749m) of which carbon related assets are £1,929m (2023: £2,950m). These carbon
related assets comprises £1,388m (2023: £2,643m) in Material & Buildings, £241m (2023: £nil) in Other Financial Corporations, £228m (2023: £238m) in Transport and storage, £63m
(2023: £69m) in Energy and water and £9m (2023: £nil) in Wholesale and retail distribution and leisure.
5Loan commitments excludes the fair value exposures of £15,350m in 2024 (2023: £15,203m).
6Diversified miners with minority interests in thermal coal mining are included in this category.
7Residential Real Estate includes mortgage portfolio within the UK as an elevated risk sectors.
Strategy
Shareholder
information
Climate and
sustainability report
Governance
Risk
review
Financial
review
Financial
statements
Barclays PLC 2024
Annual Report
on Form 20-F
223
Risk performance - Climate risk (continued)
Nature priority sectors
According to TNFD, certain industry segments ("nature priority sectors") are considered to have material nature-related dependencies
and impacts.The table below shows Barclays exposure to these sectors which we have produced by mapping the industry codes
provided by TNFD to Barclays Industry classifications.
The monitoring and reporting of our exposures to these priority sectors will continue to evolve in line with approaches taken to nature-
related risk management and as such, are subject to change in future. Nature-related risks within a sector may vary substantially
according to company and project.
Credit exposures to nature priority sectors 1, 2,3
2024
2023
(£m)
(£m)
Loans & advances4
Loan
commitments5
Total
Loans & advances4
Loan
commitments5
Total
% change
Agriculture
3,430
803
4,233
3,597
914
4,511
(6%)
Food, Bev and Tobacco
925
5,906
6,831
962
5,705
6,667
2%
Paper and Forest Products
219
544
763
186
748
934
(18%)
Oil and Gas
2,313
11,286
13,599
2,256
12,402
14,658
(7%)
Power Utilities
2,284
15,401
17,685
2,793
14,727
17,520
1%
Cement
34
303
337
161
381
542
(38%)
Chemicals
380
3,729
4,109
372
3,947
4,319
(5%)
Construction & Materials
2,315
1,941
4,256
1,569
3,255
4,824
(12%)
Manufacturing - Personal Care Products
49
578
627
80
729
809
(22%)
Manufacturing - Semiconductors
and Semiconductor Equipments
254
582
836
240
886
1,126
(26%)
Manufacturing - Textiles, Apparel
and Luxury Goods
152
459
611
242
526
768
(20%)
Metals
347
453
800
228
500
728
10%
Mining (incl. diversified miners)6
263
1,612
1,875
221
1,705
1,926
(3%)
Packaging manufacturers: Metal,
Glass and Plastics
135
242
377
113
303
416
(9%)
Steel
17
126
143
43
145
188
(24%)
Automotive
673
4,460
5,133
858
5,691
6,549
(22%)
Aviation
232
2,346
2,578
262
2,349
2,611
(1%)
Other Transport Services
686
1,318
2,004
687
1,263
1,950
3%
Ports
87
88
175
75
124
199
(12%)
Road Haulage
430
484
914
398
417
815
12%
Shipping
137
706
843
119
799
918
(8%)
Pharmaceuticals
345
6,491
6,836
315
6,022
6,337
8%
Sewerage, Waste Collection, Treatment
244
484
728
278
562
840
(13%)
Water Utilities
512
1,508
2,020
654
1,565
2,219
(9%)
Nature Priority Sector Assets Grand Total
16,463
61,850
78,313
16,709
65,665
82,374
(5%)
Total Loans & Advances and Loan
Commitments
414,483
407,799
822,282
399,496
375,234
774,730
6%
Nature priority sectors assets / Total
loans & advances and loan commitments
4%
15%
10%
4%
17%
11%
Notes:
1The scope of nature priority sector mapping has been revised based on our periodic assessment of version 1 of the TNFD published in September 2023, resulting in reclassification of
activities from Homebuilding and property development to Real Estate and Construction & Material within the nature priority sectors .The prior year comparatives have been re-
presented to align with the updated sector mapping.
2As industries decarbonise, sectors will increasingly include both carbon and non-carbon related activities e.g. Power Utilities will also include, in part, their generation capacity from
renewable energy sources.
3The TNFD highlights real estate development as a high-priority sector for nature. Barclays has £32,949m (2023: £32,709m) of Loans & Advances and Loan Commitments to Real Estate
Management and Development, of which the majority is from real estate investment activity. As a result, this has been excluded from the Priority sector assets for Nature.
4Loans & advances includes debt securities at amortised cost amounting to £68,210 (2023: £56,749m) of which nature priority sectors are £291m (2023: £307m).
5Loan commitments excludes the fair value exposures of £15,350m in 2024 (2023: £15,203m).
6Diversified miners with minority interests in thermal coal mining are included in this category.
Strategy
Shareholder
information
Climate and
sustainability report
Governance
Risk
review
Financial
review
Financial
statements
Barclays PLC 2024
Annual Report
on Form 20-F
224
Risk performance - Climate risk (continued)
Financing
To facilitate greater understanding and transparency of our capital markets financing, we disclose the total capital raised for clients
across all sectors using data sourced from Dealogic. We have provided the breakdown of our 2023 and 2024 financing below. We have
constructed this table based on the mapping of issuers’ industry assignment in Dealogic data and Barclays’ internal industry taxonomy
called Barclays Industry Classification (BIC). Financing volumes are reported on a manager-proceeds basis including bonds, equities,
loans and securitised bonds and no modifications have been made by Barclays. This data represents a third party view of our financing
and is subject to Dealogic’s league table methodology, which pro-rates volume across lead-managers. We are presenting the data in
this format to support transparency and comparability but it should be noted that this data is subject to further analysis and
methodological enhancements, before it is included in BlueTrack™.
Carbon-related sectors in wholesale credit (Dealogic Industry Classification)1, 2
31.12.2024 (£m)
Of which:
Elevated
31.12.2023 (£m)
Of which:
Elevated
% Change
Agriculture, Food and Forest Products
95
95
—
—
Agriculture
95
95
—
—
Energy & Waters
28,979
28,979
22,920
22,920
26%
Power Utilities
27,868
27,868
21,967
21,967
Water Utilities
1,111
1,111
953
953
Manufacturing
31,901
10,973
29,702
12,398
7%
Automotive
5,347
5,347
6,948
6,861
Cements
344
344
278
278
Chemicals
4,146
3,894
2,903
2,685
Food, Bev and Tobacco
7,591
115
6,845
460
Manufacturing - Others
10,618
49
10,277
198
Metals
1,280
623
298
55
Oil and Gas (refining)
601
601
1,225
1,225
Packaging Manufacturers: Metal, Glass and Plastics
1,056
—
223
—
Paper and Forest Products
918
—
69
—
Steel
—
—
636
636
Materials and Building
6,190
731
3,853
686
61%
Construction and Materials
810
731
770
686
Real Estate Management and Development
5,380
—
3,083
—
Mining and Quarrying
6,290
6,244
3,080
3,080
Mining (Incl. diversified miners)3
585
539
783
783
Oil and Gas (extraction)
5,705
5,705
2,297
2,297
Transport & storage
17,190
15,182
8,082
6,774
Aviation
4,292
4,292
1,821
1,653
Oil and Gas (midstream)
10,076
10,076
4,255
4,255
Other Transport Services
1,620
—
957
—
Ports
64
64
—
—
Road Haulage
633
245
207
24
Shipping
505
505
842
842
Wholesale and retail distribution and leisure
4,160
1,066
3,605
1,063
15%
Oil and Gas (wholesale)
235
100
539
466
Others
3,925
966
3,066
597
Other Financial Institutions
1,774
—
760
—
Real Estate Management and Development (REITs)
1,774
—
760
—
Carbon-related Assets Grand Total
96,579
63,270
72,002
46,921
34%
Capital Market Financing Total
415,433
308,034
35%
Financing to Carbon-related Sector / Total Capital Market Financing %
23%
23%
Sub-total of sectors spanning in multiple industries
,
Oil and Gas
16,617
16,482
8,316
8,243
Notes:
1The scope of elevated risk sector mapping has been revised based on our periodic assessment of climate risk sectors, resulting in activities such as renewable energy within Power
Utilities, Water Utilities, Construction and Material, Food and fashion related activities (Others) now classified as elevated risk sectors/carbon related assets. The prior year comparatives
have been re-presented to align with the updated sector mapping.
2As industries decarbonise, sectors will increasingly include both carbon and non-carbon related activities e.g. the clients present within the sector exposure reported under Power
Utilities will also have part of their generation capacity from renewable energy sources, which represents a non-carbon related activity.
3Diversified miners with minority interests in thermal coal mining are included in this category.
Strategy
Shareholder
information
Climate and
sustainability report
Governance
Risk
review
Financial
review
Financial
statements
Barclays PLC 2024
Annual Report
on Form 20-F
225
Risk performance - Climate risk (continued)
Subsidence: Total Volume of stock (as % of total UK
Mortgages portfolio) per risk band
Subsidence is driven by the interplay of precipitation, temperature
and soil type factors, which result in volumetric changes to the
soil. Increased volatility in weather conditions, as a result of
climate change, contributes to the acceleration of subsidence
impacts. Some areas, particularly those with high concentrations
of clay soil, for example London, are more susceptible to
subsidence. This shrink-swell impact can cause localised property
level impacts, resulting in impacts to the valuation of a property, or
impacts to affordability through remediation costs and high
insurance premiums.
Barclays works with a third-party climate data provider to support
climate risk data enhancements within the UK Mortgages
portfolio. This includes the ability to map subsidence risk at a
property level granularity. The subsidence risk scoring is based on
soil properties, in particular the extent to which the soil will shrink
under hot and dry weather conditions, as well as the predicted
temperature and probability of extreme rainfall. These variables
are combined with subsidence claims per postcode to generate a
pseudo-quantitative score, where a property in class 9 is around
nine times as likely as a property in class 1 to make a subsidence
claim. A small proportion of the UK Mortgage portfolio is not
mapped to a subsidence risk score (c.5.6%). This is due either to a
lack of data coverage (i.e. the property is not covered by
underlying maps), or a lack of certainty in address matching.
As at 30 September 2024
As at 30 September 2023
Risk Band
Qualitative Risk Score
Volume %
Volume %
0
No Subsidence Risk
—
—
1
Low
9.6
9.5
2
36.1
36.0
3
23.4
23.5
4
Moderate
4.7
4.7
5
4.6
4.7
6
3.3
3.4
7
High
2.4
2.4
8
—
—
9
0.2
0.3
10
Very High
5.3
5.4
11
—
—
12
2.6
2.6
13
—
—
14
—
—
15
2.2
2.3
Missing
5.6
5.2
Note:
Data collected from 3rd party source based on one quarter lag. 30 September 2024 closest
available dataset.
Flood: Total Volume of stock (as % of total UK Mortgages
portfolio) per risk band
Flooding in the UK is forecast to increase over time, with the
potential for this increase to accelerate if greenhouse gas
emissions are not reduced. The increased risk of flooding has the
potential to impact the valuation of properties directly, as well as
indirectly where areas may become high risk and property
demand falls. Remediation costs, high insurance premiums or
potential lack of insurance coverage have the potential to impact
affordability.
Barclays works with a third-party climate data provider to support
climate risk data enhancements within the UK Mortgages
portfolio. This has enabled Barclays to move from postcode level
to property level flood data granularity. Flood Risk bands are based
on average annual loss, generated using flood hazard frequency
and flood depth from tidal, surface, pluvial and fluvial flooding and
accounting for the mitigating impact of flood defences where
these are present. Properties in the Moderate and High Risk bands
are expected to face above average insurance costs given their
elevated exposure to flood risk. Those within the Very High band
and which meet certain requirements (e.g. owner-occupied, built
before-2009, are a single residential unit or a building comprising
of two or three residential units) are considered likely to be eligible
for Flood Re (a government subsidised flood insurance scheme).
As at 30 September 2024
As at 30 September 2023
Risk Band
Volume %
Volume %
Negligible
80.9
81.3
Very Low
7.6
7.6
Low
1.8
1.8
Moderate
1.6
1.6
High
2.6
2.6
Very High
1.2
1.2
Missing
4.3
3.9
Note:
Data collected from 3rd party source based on one quarter lag. 30 September 2024 closest
available dataset.
Strategy
Shareholder
information
Climate and
sustainability report
Governance
Risk
review
Financial
review
Financial
statements
Barclays PLC 2024
Annual Report
on Form 20-F
226
Risk performance - Climate risk (continued)
Flood: Very High & High Flood Risk Exposure per region (as % of Total Regional Exposure)
The map below represents the proportion of properties within the UK Mortgages portfolio at High and Very High risk of flood per region
as a percentage of the total regional exposure (excluding Kensington Mortgage Company originated properties). The flood metrics are
presented on current risk levels and are based on average annual loss, generated using flood hazard frequency and flood depth from
tidal, surface, pluvial and fluvial flooding and accounting for the mitigating impact of flood defences where these are present. The
mapping covers c.95% of the UK Mortgages portfolio on a total exposure basis - the remaining c.5% of properties are not currently
mapped to flood risk ratings on a property level basis as a result of a lack of data coverage (i.e. the property is not covered by underlying
maps), or a lack of certainty in address matching.
% of Total Lending
(as % of total UK
Mortgages balances)
–High: 2.5%
–Very High: 1.0%
N. Ireland
% of Total Lending: 0.9%
of which:
–High: 1.1%
–Very High: 0.5%
North West
% of Total Lending: 6.0%
of which:
–High: 2.7%
–Very High: 1.7%
Wales
% of Total Lending: 2.3%
of which:
–High: 2.2%
–Very High: 0.6%
West Midlands
% of Total Lending: 5.2%
of which:
–High: 1.5%
–Very High: 0.5%
South West
% of Total Lending: 6.3%
of which:
–High: 2.4%
–Very High: 0.9%
Scotland
% of Total Lending: 3.7%
of which:
–High: 1.9%
–Very High: 0.9%
North East
% of Total Lending: 1.9%
of which:
–High: 1.2%
–Very High: 0.7%
Yorks & the Humber
% of Total Lending: 4.0%
of which:
–High: 2.3%
–Very High: 1.3%
East Midlands
% of Total Lending: 4.5%
of which:
–High: 2.9%
–Very High: 2.5%
East of England
% of Total Lending: 12.2%
of which:
–High: 2.4%
–Very High: 0.9%
London
% of Total Lending: 32.5%
Of which
–High: 2.6%
–Very High: 0.6%
South East
% of Total Lending: 20.6%
of which:
–High: 3.0%
–Very High: 1.0 %
Darker shades indicate higher proportion of high or very high flood risk exposure
High and Very High Flood Risk are shown as % of regional exposure
Note:
Data collected from third party source based on one quarter lag. 30 September 2024 closest available dataset.
Strategy
Shareholder
information
Climate and
sustainability report
Governance
Risk
review
Financial
review
Financial
statements
Barclays PLC 2024
Annual Report
on Form 20-F
227
Risk performance - Climate risk (continued)
Coastal Erosion: Total Volume of stock (as % of total UK Mortgages portfolio) per risk band
Coastal Erosion is defined as the loss or displacement of land, or the long-term removal of sediment and rocks along the coastline due
to the action of waves, currents, tides, wind-driven water, waterborne ice, or other impacts of storms. The increased volatility of
weather conditions, as a result of climate change contribute to the acceleration of coastal erosion impacts.
Coastal erosion risk is calculated using the modelled hazard level and the likelihood of that particular hazard impacting the value of the
property. For example, a score of 100 (Very High Risk) might be assigned to a property within an area of predicted coastline retreat. In
this situation, the likelihood of the ground collapsing is high (the coastal erosion data has determined that the current surface will no
longer exist in n years) and the potential severity of damage to the property is also high (the building itself could partially or completely
collapse into the sea).
As at 30 September 2024
As at 30 September 2023
Risk Band
Volume %
Volume %
Negligible
94.4
94.8
Low
0.0
0.0
Moderate
0.0
0.0
Very High
0.0
0.0
Missing
5.6
5.2
Note
Data collected from 3rd party source based on one quarter lag, 30 September 2024 closest available dataset.
Current and Potential Energy Performance Certificate (EPC): Total Volume of stock (as % of total UK Mortgages portfolio) per
EPC rating
The transition risk in the UK Mortgages portfolio is assessed via the distribution of Current & Potential EPC ratings across the portfolio.
One of the levers to decarbonise the UK housing stock for the UK Government is to tighten energy efficiency requirements. In 2024,
the UK Government announced that the minimum EPC rating of rental properties will be raised to EPC C (from EPC E) by 2030. It is
anticipated that any tightening of Minimum Energy Efficiency Standards (MEES) will focus initially on buy-to-let properties. Buy-to-Let
properties which are privately rented are currently required to have a minimum EPC rating of E. The transition risk identified has the
potential to impact the valuation of properties directly, alongside impacting affordability as properties which fall under MEES may no
longer be able to be rented out or the landlord may need to pay for retrofitting to be brought up to standard.
EPC ratings range from A (most efficient) to G (least efficient). Current & Potential EPC ratings are used as the basis for assessing
expected energy costs but do not give a precise picture of emission intensity. The UK Mortgages portfolio is mapped to the
Government EPC Register. Properties may not feature on the Government EPC Register as some properties may have never been
required to have an EPC rating (not been sold or rented out since 2007), their EPC rating may have expired (EPC ratings are valid for 10
years) or the property may be in Scotland or Northern Ireland (which use separate databases). Whilst Barclays’ proportion of ‘missing
EPC ratings’ has declined year on year, the issue of missing EPC ratings is prevalent across the industry.
Current EPC: Residential and Buy-to-let balances and volume of stock per EPC rating as at September 20241
Current EPC Rating
Residential Mortgage
Balances
Balance as % of
Residential Mortgages
portfolio
Volume as % of
Residential Mortgages
portfolio
Buy-to-Let Mortgage
Balances
Balance as % of Buy-to-
Let Mortgages portfolio
Volume as % of Buy-to-
Let Mortgages portfolio
£m
%
%
£m
%
%
A
601
0.4
0.3
19
0.1
0.1
B
23,205
16.5
15.2
1,940
11.0
9.1
C
26,952
19.1
18.4
5,456
30.9
31.8
D
42,000
29.8
27.4
5,986
33.9
34.2
E
16,695
11.9
9.9
1,587
9.0
9.2
F
3,817
2.7
2.1
98
0.6
0.6
G
723
0.5
0.4
25
0.1
0.1
Missing
26,769
19.1
26.3
2,529
14.4
14.9
Total
140,762
100
100
17,640
100
100
Note:
1Data matching provided by 3rd party source based on one quarter lag, 30 September 2024 closest available dataset - EPC monitoring based on Sept-24 portfolio and Sept-24
Government EPC Register. If no valid EPC is mapped, the expired EPC (where available) is included as a proxy.
Strategy
Shareholder
information
Climate and
sustainability report
Governance
Risk
review
Financial
review
Financial
statements
Barclays PLC 2024
Annual Report
on Form 20-F
228
Risk performance - Climate risk (continued)
EPC: Residential and Buy-to-let balances and volume of stock per EPC rating as at September 20231
Current EPC Rating
Residential Mortgage
Balances
Balance as % of
Residential Mortgages
portfolio
Volume as % of
Residential Mortgages
portfolio
Buy-to-Let Mortgage
Balances
Balance as % of Buy-to-
Let Mortgages portfolio
Volume as % of Buy-to-
Let Mortgages portfolio
£m
%
%
£m
%
%
A
487
0.3
0.2
20
0.1
0.1
B
22,514
15.8
14.3
2,144
10.7
8.9
C
24,954
17.5
16.6
5,781
28.9
29.6
D
41,575
29.3
26.4
6,842
34.3
34.4
E
17,546
12.3
10.2
1,991
10.0
10.1
F
4,132
2.9
2.2
129
0.6
0.7
G
780
0.5
0.4
31
0.2
0.2
Missing
30,528
21.4
29.7
3,033
15.2
16.0
Total
142,516
100
100
19,971
100
100
Note:
1Data matching provided by 3rd party source based on one quarter lag, 30 September 2023 closest available dataset - EPC monitoring based on Sept-23 portfolio and Sept-23
Government EPC Register. If no valid EPC is mapped, the expired EPC (where available) is included as a proxy.
Potential EPC1: Residential and Buy-to-let balances and volume of stock per EPC rating as at September 20242
Potential EPC Rating
Residential Mortgage
Balances
Balance as % of
Residential Mortgages
portfolio
Volume as % of
Residential Mortgages
portfolio
Buy-to-Let Mortgage
Balances
Balance as % of Buy-to-
Let Mortgages portfolio
Volume as % of Buy-to-
Let Mortgages portfolio
£m
%
%
£m
%
%
A
13,892
9.9
9.3
474
2.7
2.9
B
52,672
37.4
36.0
8017
45.4
45.8
C
37,461
26.6
22.4
5802
32.9
31.8
D
7,471
5.3
4.6
716
4.1
4.0
E
2,012
1.4
1.1
87
0.5
0.5
F
398
0.3
0.2
13
0.1
0.1
G
87
0.1
0.1
3
0.0
0.0
Missing
26,769
19.0
26.3
2528
14.3
14.9
Total
140,762
100
100
17640
100
100
Notes:
1The potential EPC is the EPC rating that a property can reasonably be expected to achieve if the recommended energy efficiency upgrades are undertaken.
2Data matching provided by 3rd party source based on one quarter lag, 30 September 2024 closest available dataset - EPC monitoring based on Sept-24 portfolio and Sept-24
Government EPC Register. If no valid EPC is mapped, the expired EPC (where available) is included as a proxy.
Potential EPC: Residential and Buy-to-let balances and volume of stock per EPC rating as at September 20231
Potential EPC Rating
Residential Mortgage
Balances
Balance as % of
Residential Mortgages
portfolio
Volume as % of
Residential Mortgages
portfolio
Buy-to-Let Mortgage
Balances
Balance as % of Buy-to-
Let Mortgages portfolio
Volume as % of Buy-to-
Let Mortgages portfolio
£m
%
%
£m
%
%
A
13,193
9.3
0.2
516
2.6
2.9
B
50,094
35.1
14.3
8,783
44.0
44.2
C
37,594
26.4
16.6
6,585
33.0
31.8
D
8,244
5.8
26.4
915
4.6
4.5
E
2,297
1.6
10.1
118
0.6
0.6
F
468
0.3
2.2
17
0.1
0.1
G
100
0.1
0.4
4
0.0
0.0
Missing
30,526
21.4
29.8
3,033
15.1
15.9
Total
142,516
100
100
19,971
100
100
Note:
1Data matching provided by 3rd party source based on one quarter lag, 30 September 2023 closest available dataset - EPC monitoring based on Sept-23 portfolio and Sept-23
Government EPC Register. If no valid EPC is mapped, the expired EPC (where available) is included as a proxy.
Business Banking - Dairy & Cattle Exposure
Given methane’s global warming potential the Dairy & Cattle sector is a significant contributor to the UK’s emissions footprint and is
therefore susceptible to the transition risks of climate change, namely consumer preference changes and potential emissions taxation.
In 2024 Barclays Bank UK launched a Client Transition Tool, which is a data set compiled for Barclays Bank UK Business Banking clients in
Dairy & Cattle sectors for all new or refinanced lending to assess transition trajectories against Barclays’ targets and benchmarks. This
tool will provide further granularity on clients' transition plans and progress. Coverage of the Client Transition Tool across the portfolio
will increase over time. In 2024 Barclays Bank UK also implemented an enhanced Climate & Environment Lens questionnaire for clients
in elevated climate risk sectors.
Strategy
Shareholder
information
Climate and
sustainability report
Governance
Risk
review
Financial
review
Financial
statements
Barclays PLC 2024
Annual Report
on Form 20-F
229
Risk performance - Credit risk
Credit risk
Credit risk: summary of contents
Page
Credit risk represents a significant risk and mainly arises
from exposure to loans and advances together with the
counterparty credit risk arising from derivative contracts
Maximum exposure and effects of netting, collateral and risk transfer
The following tables present a reconciliation between the Group's maximum exposure and its net exposure to credit risk, reflecting the
financial effects of risk mitigation reducing the Group's exposure.
The Group mitigates the credit risk to which it is exposed through netting and set-off, collateral and risk transfer. Further detail on the
Group’s policies to each of these forms of credit enhancement is presented on pages132 to 135of the Barclays PLC Pillar 3 Report
2024 (unaudited).
Collateral obtained
Where collateral has been obtained in the event of default, the Group does not, ordinarily, use such assets for its own operations and
they are usually sold on a timely basis. The carrying value of assets held by the Group as at 31 December 2024, as a result of the
enforcement of collateral, was £12m (2023: £6m).
Maximum exposure and effects of netting, collateral and risk transfer (audited)
Maximum
exposure
Netting and
set-off
Cash
collateral
Non-cash
collateral
Risk transfer
Exposure net
of risk
mitigation
As at 31 December 2024
£m
£m
£m
£m
£m
£m
On-balance sheet:
Cash and balances at central banks
210,184
—
—
—
—
210,184
Cash collateral and settlement balances
119,843
—
—
—
—
119,843
Loans and advances at amortised cost:
Retail mortgages
168,061
—
(22)
(168,026)
—
13
Retail credit cards
34,779
—
—
—
—
34,779
Retail other
13,808
—
(1,106)
(2,502)
(36)
10,164
Corporate loans
129,625
(3,006)
(1,107)
(67,909)
(11,548)
46,055
Total loans and advances at amortised cost
346,273
(3,006)
(2,235)
(238,437)
(11,584)
91,011
Of which credit-impaired (Stage 3):
Retail mortgages
1,875
—
—
(1,874)
—
1
Retail credit cards - excluding POCI
396
—
—
—
—
396
Retail credit cards - POCI
40
—
—
—
—
40
Retail other - excluding POCI
217
—
(21)
(175)
—
21
Retail other - POCI
17
—
—
—
—
17
Corporate loans
2,490
—
(32)
(1,108)
(415)
935
Total credit-impaired loans and advances at amortised cost
5,035
—
(53)
(3,157)
(415)
1,410
Debt securities at amortised cost
68,210
—
—
(583)
(90)
67,537
Reverse repurchase agreements and other similar secured lending
4,734
—
—
(4,734)
—
—
Trading portfolio assets:
Debt securities
78,014
—
—
(657)
—
77,357
Traded loans
13,470
—
—
(878)
—
12,592
Total trading portfolio assets
91,484
—
—
(1,535)
—
89,949
Financial assets at fair value through the income statement:
Loans and advances
45,068
—
(17)
(41,766)
—
3,285
Debt securities
2,965
—
—
(182)
—
2,783
Reverse repurchase agreements
141,773
—
(2,429)
(138,905)
—
439
Other financial assets
110
—
—
—
—
110
Total financial assets at fair value through the income statement
189,916
—
(2,446)
(180,853)
—
6,617
Derivative financial instruments
293,530
(230,434)
(30,637)
(12,633)
(5,284)
14,542
Financial assets at fair value through other comprehensive income
78,055
—
—
(1,104)
(246)
76,705
Other assets
891
—
(1)
—
—
890
Assets held for sale
9,544
—
—
—
—
9,544
Total on-balance sheet
1,412,664
(233,440)
(35,319)
(439,879)
(17,204)
686,822
Off-balance sheet:
Contingent liabilities
25,346
—
(2,664)
(441)
(248)
21,993
Loan commitments
423,149
—
(550)
(55,327)
(1,899)
365,373
Total off-balance sheet
448,495
—
(3,214)
(55,768)
(2,147)
387,366
Total
1,861,159
(233,440)
(38,533)
(495,647)
(19,351)
1,074,188
Off-balance sheet exposures are shown gross of provisions of£439m (2023: £504m). See Note 24 for further details. In addition to the
above, the Group holds forward starting reverse repos with notional contract amounts of £108.6bn (2023: £54.3bn). These balances
are fully collateralised. Corporate loans at amortised cost include £3.3bn (2023: £5.3bn) of BBLS, CBILS and CLBILS supported by UK
governmentguarantees of £3.2bn (2023: £5.1bn), which are included within the Risk transfer column in the table. Reported off-balance
sheet loan commitments also include exposures relating to financial assets classified as assets held for sale.
Strategy
Shareholder
information
Climate and
sustainability report
Governance
Risk
review
Financial
review
Financial
statements
Barclays PLC 2024
Annual Report
on Form 20-F
232
Risk performance - Credit risk (continued)
Maximum exposure and effects of netting, collateral and risk transfer (audited)
Maximum
exposure
Netting and
set-off
Cash
collateral
Non-cash
collateral
Risk transfer
Exposure net
of risk
mitigation
As at 31 December 2023
£m
£m
£m
£m
£m
£m
On-balance sheet:
Cash and balances at central banks
224,634
—
—
—
—
224,634
Cash collateral and settlement balances
108,889
—
—
—
—
108,889
Loans and advances at amortised cost:
Retail mortgages
171,512
—
(13)
(171,484)
—
15
Retail credit cards
34,221
—
—
—
—
34,221
Retail other
9,952
—
(1,028)
(2,329)
(39)
6,556
Corporate loans
127,062
(3,876)
(1,117)
(61,892)
(14,716)
45,461
Total loans and advances at amortised cost
342,747
(3,876)
(2,158)
(235,705)
(14,755)
86,253
Of which credit-impaired (Stage 3):
Retail mortgages
1,996
—
—
(1,994)
—
2
Retail credit cards - excluding POCI
387
—
—
—
—
387
Retail credit cards - POCI
—
—
—
—
—
—
Retail other - excluding POCI
317
—
(23)
(263)
—
31
Retail other - POCI
—
—
—
—
—
—
Corporate loans
1,956
—
(4)
(1,098)
(546)
308
Total credit-impaired loans and advances at amortised cost
4,656
—
(27)
(3,355)
(546)
728
Debt securities at amortised cost
56,749
—
—
(956)
(156)
55,637
Reverse repurchase agreements and other similar secured lending
2,594
—
—
(2,594)
—
—
Trading portfolio assets:
Debt securities
75,498
—
—
(521)
—
74,977
Traded loans
12,653
—
—
(189)
—
12,464
Total trading portfolio assets
88,151
—
—
(710)
—
87,441
Financial assets at fair value through the income statement:
Loans and advances
47,639
—
(47)
(41,334)
(4)
6,254
Debt securities
2,586
—
—
(221)
—
2,365
Reverse repurchase agreements
149,131
—
(3,416)
(145,292)
—
423
Other financial assets
110
—
—
—
—
110
Total financial assets at fair value through the income statement
199,466
—
(3,463)
(186,847)
(4)
9,152
Derivative financial instruments
256,836
(198,809)
(31,211)
(10,036)
(3,791)
12,989
Financial assets at fair value through other comprehensive income
71,830
—
—
(362)
(198)
71,270
Other assets
2,197
—
(1)
—
—
2,196
Assets held for sale
3,855
—
—
—
—
3,855
Total on-balance sheet
1,357,948
(202,685)
(36,833)
(437,210)
(18,904)
662,316
Off-balance sheet:
Contingent liabilities
25,340
—
(2,225)
(358)
(283)
22,474
Loan commitments
390,437
—
(1,506)
(41,862)
(1,773)
345,296
Total off-balance sheet
415,777
—
(3,731)
(42,220)
(2,056)
367,770
Total
1,773,725
(202,685)
(40,564)
(479,430)
(20,960)
1,030,086
Strategy
Shareholder
information
Climate and
sustainability report
Governance
Risk
review
Financial
review
Financial
statements
Barclays PLC 2024
Annual Report
on Form 20-F
233
Risk performance - Credit risk (continued)
Expected Credit Losses
Loans and advances at amortised cost by geography
Total loans and advances at amortised cost in the credit risk performance section includes loans and advances at amortised cost to
banks and loans and advances at amortised cost to customers.
The table below presents a product and geographical breakdown by stages of loans and advances at amortised cost and the
impairment allowance, including purchased or originated credit-impaired (POCI) balances. POCI balances represent a fixed pool of
assets purchased at a deep discount to face value reflecting credit losses incurred from the point of origination to date of acquisition.
Also included are stage allocation of debt securities and off-balance sheet loan commitments and financial guarantee contracts by
gross exposure, impairment allowance and coverage ratio.
Impairment allowance under IFRS 9 considers both the drawn and the undrawn counterparty exposure. For retail portfolios, the total
impairment allowance is allocated to gross loans and advances to the extent allowance does not exceed the drawn exposure and any
excess is reported on the liabilities side of the balance sheet as a provision. For corporate portfolios, impairment allowance on undrawn
exposure is reported on the liability side of the balance sheet as a provision.
Loans and advances at amortised cost by geography (audited)
Gross exposure
Impairment allowance
Stage 1
Stage 2
Stage 3
excluding
POCI
Stage 3 POCI
Total
Stage 1
Stage 2
Stage 3
excluding
POCI
Stage 3 POCI
Total
As at 31 December 2024
£m
£m
£m
£m
£m
£m
£m
£m
£m
£m
Retail mortgages
145,039
19,507
1,793
—
166,339
36
61
61
—
158
Retail credit cards
13,497
2,064
179
40
15,780
219
440
91
—
750
Retail other
10,606
1,218
257
17
12,098
135
110
138
—
383
Corporate loans1
52,284
7,266
2,171
—
61,721
133
196
420
—
749
Total UK
221,426
30,055
4,400
57
255,938
523
807
710
—
2,040
Retail mortgages
1,651
89
169
—
1,909
2
1
26
—
29
Retail credit cards
17,629
2,953
1,724
—
22,306
334
807
1,416
—
2,557
Retail other
1,844
155
121
—
2,120
3
1
23
—
27
Corporate loans
64,224
3,901
945
—
69,070
76
135
206
—
417
Total Rest of the
World
85,348
7,098
2,959
—
95,405
415
944
1,671
—
3,030
Total loans and
advances at
amortised cost
306,774
37,153
7,359
57
351,343
938
1,751
2,381
—
5,070
Debt Securities at
amortised cost
64,988
3,245
—
—
68,233
12
11
—
—
23
Total loans and
advances at
amortised cost
including Debt
Securities
371,762
40,398
7,359
57
419,576
950
1,762
2,381
—
5,093
Off-balance sheet loan
commitments and
financial guarantee
contracts2
412,255
18,728
1,168
6
432,157
164
250
25
—
439
Total3,4
784,017
59,126
8,527
63
851,733
1,114
2,012
2,406
—
5,532
Strategy
Shareholder
information
Climate and
sustainability report
Governance
Risk
review
Financial
review
Financial
statements
Barclays PLC 2024
Annual Report
on Form 20-F
234
Risk performance - Credit risk (continued)
Net Exposure
Coverage ratio
Stage 1
Stage 2
Stage 3
excluding
POCI
Stage 3 POCI
Total
Stage 1
Stage 2
Stage 3
excluding
POCI
Stage 3 POCI
Total
As at 31 December 2024
£m
£m
£m
£m
£m
%
%
%
%
%
Retail mortgages
145,003
19,446
1,732
—
166,181
—
0.3
3.4
—
0.1
Retail credit cards
13,278
1,624
88
40
15,030
1.6
21.3
50.8
—
4.8
Retail other
10,471
1,108
119
17
11,715
1.3
9.0
53.7
—
3.2
Corporate loans1
52,151
7,070
1,751
—
60,972
0.3
2.7
19.3
—
1.2
Total UK
220,903
29,248
3,690
57
253,898
0.2
2.7
16.1
—
0.8
Retail mortgages
1,649
88
143
—
1,880
0.1
1.1
15.4
—
1.5
Retail credit cards
17,295
2,146
308
—
19,749
1.9
27.3
82.1
—
11.5
Retail other
1,841
154
98
—
2,093
0.2
0.6
19.0
—
1.3
Corporate loans
64,148
3,766
739
—
68,653
0.1
3.5
21.8
—
0.6
Total Rest of the
world
84,933
6,154
1,288
—
92,375
0.5
13.3
56.5
—
3.2
Total loans and
advances at
amortised cost
305,836
35,402
4,978
57
346,273
0.3
4.7
32.4
—
1.4
Debt securities at
amortised cost
64,976
3,234
—
—
68,210
—
0.3
—
—
—
Total loans and
advances at
amortised cost
including debt
securities
370,812
38,636
4,978
57
414,483
0.3
4.4
32.4
—
1.2
Off-balance sheet loan
commitments and
financial guarantee
contracts2
412,091
18,478
1,143
6
431,718
—
1.3
2.1
—
0.1
Total3, 4
782,903
57,114
6,121
63
846,201
0.1
3.4
28.2
—
0.6
Notes:
1Includes Business Banking, which has a gross exposure of £13.1bn and an impairment allowance of £356m. This comprises £60m impairment allowance on £8.9bn Stage 1 exposure,
£60m on £2.8bn Stage 2 exposure and £236m on £1.5bn Stage 3 exposure. Excluding this, total coverage for corporate loans in UK is 0.8%.
2Excludes loan commitments and financial guarantees of £16.3bn carried at fair value and includes exposures relating to financial assets classified as assets held for sale.
3Other financial assets subject to impairment excluded in the table above include cash collateral and settlement balances, reverse repurchase agreements and other similar secured
lending, financial assets at fair value through other comprehensive income and other assets. These have a total gross exposure of £204.2bn and an impairment allowance of £156m.
This comprises £19m impairment allowance on £202.7bn Stage 1 exposure, £7m on £1.3bn Stage 2 exposure and £130m on £139m Stage 3 exposure.
4The annualised loan loss rate is 46bps after applying the total impairment charge of £1,982m.
Strategy
Shareholder
information
Climate and
sustainability report
Governance
Risk
review
Financial
review
Financial
statements
Barclays PLC 2024
Annual Report
on Form 20-F
235
Risk performance - Credit risk (continued)
Loans and advances at amortised cost by geography (audited)
Gross exposure
Impairment allowance
Stage 1
Stage 2
Stage 3
excluding
POCI
Stage 3 POCI
Total
Stage 1
Stage 2
Stage 3
excluding
POCI
Stage 3 POCI
Total
As at 31 December 2023
£m
£m
£m
£m
£m
£m
£m
£m
£m
£m
Retail mortgages
146,001
19,123
1,812
—
166,936
43
77
112
—
232
Retail credit cards
8,094
2,128
198
—
10,420
111
492
107
—
710
Retail other
6,832
1,252
264
—
8,348
56
117
144
—
317
Corporate loans1
54,257
8,673
1,692
—
64,622
191
214
346
—
751
Total UK
215,184
31,176
3,966
—
250,326
401
900
709
—
2,010
Retail mortgages
4,201
346
612
—
5,159
7
28
316
—
351
Retail credit cards
22,315
3,450
1,522
—
27,287
412
1,138
1,226
—
2,776
Retail other
1,637
91
229
—
1,957
3
1
32
—
36
Corporate loans
58,248
4,629
862
—
63,739
96
200
252
—
548
Total Rest of the
World
86,401
8,516
3,225
—
98,142
518
1,367
1,826
—
3,711
Total loans and
advances at
amortised cost
301,585
39,692
7,191
—
348,468
919
2,267
2,535
—
5,721
Debt securities at
amortised cost
52,869
3,907
—
—
56,776
11
16
0
—
27
Total loans and
advances at
amortised cost
including debt
securities
354,454
43,599
7,191
—
405,244
930
2,283
2,535
—
5,748
Off-balance sheet
loan commitments
and financial
guarantee contracts2
374,063
24,208
1,037
—
399,308
173
287
44
—
504
Total3,4
728,517
67,807
8,228
—
804,552
1,103
2,570
2,579
—
6,252
Strategy
Shareholder
information
Climate and
sustainability report
Governance
Risk
review
Financial
review
Financial
statements
Barclays PLC 2024
Annual Report
on Form 20-F
236
Risk performance - Credit risk (continued)
Net Exposure
Coverage ratio
Stage 1
Stage 2
Stage 3
excluding
POCI
Stage 3 POCI
Total
Stage 1
Stage 2
Stage 3
excluding
POCI
Stage 3 POCI
Total
As at 31 December 2023
£m
£m
£m
£m
£m
%
%
%
%
%
Retail mortgages
145,958
19,046
1,700
—
166,704
—
0.4
6.2
—
0.1
Retail credit cards
7,983
1,636
91
—
9,710
1.4
23.1
54.0
—
6.8
Retail other
6,776
1,135
120
—
8,031
0.8
9.3
54.5
—
3.8
Corporate loans1
54,066
8,459
1,346
—
63,871
0.4
2.5
20.4
—
1.2
Total UK
214,783
30,276
3,257
—
248,316
0.2
2.9
17.9
—
0.8
Retail mortgages
4,194
318
296
—
4,808
0.2
8.1
51.6
—
6.8
Retail credit cards
21,903
2,312
296
—
24,511
1.8
33.0
80.6
—
10.2
Retail other
1,634
90
197
—
1,921
0.2
1.1
14.0
—
1.8
Corporate loans
58,152
4,429
610
—
63,191
0.2
4.3
29.2
—
0.9
Total Rest of the
World
85,883
7,149
1,399
—
94,431
0.6
16.1
56.6
—
3.8
Total loans and
advances at
amortised cost
300,666
37,425
4,656
—
342,747
0.3
5.7
35.3
—
1.6
Debt securities at
amortised cost
52,858
3,891
—
—
56,749
—
0.4
—
—
—
Total loans and
advances at
amortised cost
including debt
securities
353,524
41,316
4,656
—
399,496
0.3
5.2
35.3
—
1.4
Off-balance sheet
loan commitments
and financial
guarantee contracts2
373,890
23,921
993
—
398,804
—
1.2
4.2
—
0.1
Total3, 4
727,414
65,237
5,649
—
798,300
0.2
3.8
31.3
—
0.8
Notes:
1Includes Business Banking, which has a gross exposure of £15.2bn and an impairment allowance of £431m. This comprises £99m impairment allowance on £9.8bn Stage 1 exposure,
£81m on £4.1bn Stage 2 exposure and £251m on £1.3bn Stage 3 exposure. Excluding this, total coverage for corporate loans in UK is 0.6%.
2Excludes loan commitments and financial guarantees of £16.5bn carried at fair value and includes exposures relating to financial assets classified as assets held for sale.
3Other financial assets subject to impairment excluded in the table above include cash collateral and settlement balances, reverse repurchase agreements and other similar secured
lending, financial assets at fair value through other comprehensive income and other assets. These have a total gross exposure of £186.2bn and an impairment allowance of £151m.
This comprises £16m impairment allowance on £185.4bn Stage 1 exposure, £2m on £0.6bn Stage 2 exposure and £133m on £140m Stage 3 exposure.
4The annualised loan loss rate is 46bps after applying the total impairment charge of £1,881m.
Strategy
Shareholder
information
Climate and
sustainability report
Governance
Risk
review
Financial
review
Financial
statements
Barclays PLC 2024
Annual Report
on Form 20-F
237
Risk performance - Credit risk (continued)
Loans and advances at amortised cost by product (audited)
The table below presents a product breakdown by stages of loans and advances at amortised cost. Also included is a breakdown of
Stage 2 past due balances.
Loans and advances at amortised cost by product (audited)
Stage 2
As at 31 December 2024
Stage 1
Not past due
<=30 days
past due
>30 days past
due
Total
Stage 3
excluding
POCI
Stage 3 POCI
Total
Gross exposure
£m
£m
£m
£m
£m
£m
£m
£m
Retail mortgages
146,690
16,790
2,034
772
19,596
1,962
—
168,248
Retail credit cards
31,126
4,435
303
279
5,017
1,903
40
38,086
Retail other
12,450
1,056
211
106
1,373
378
17
14,218
Corporate loans
116,508
10,849
144
174
11,167
3,116
—
130,791
Total
306,774
33,130
2,692
1,331
37,153
7,359
57
351,343
Impairment allowance
Retail mortgages
38
42
13
7
62
87
—
187
Retail credit cards
553
959
122
166
1,247
1,507
—
3,307
Retail other
138
76
17
18
111
161
—
410
Corporate loans
209
316
7
8
331
626
—
1,166
Total
938
1,393
159
199
1,751
2,381
—
5,070
Net exposure
Retail mortgages
146,652
16,748
2,021
765
19,534
1,875
—
168,061
Retail credit cards
30,573
3,476
181
113
3,770
396
40
34,779
Retail other
12,312
980
194
88
1,262
217
17
13,808
Corporate loans
116,299
10,533
137
166
10,836
2,490
—
129,625
Total
305,836
31,737
2,533
1,132
35,402
4,978
57
346,273
Coverage ratio
%
%
%
%
%
%
%
%
Retail mortgages
—
0.3
0.6
0.9
0.3
4.4
—
0.1
Retail credit cards
1.8
21.6
40.3
59.5
24.9
79.2
—
8.7
Retail other
1.1
7.2
8.1
17.0
8.1
42.6
—
2.9
Corporate loans
0.2
2.9
4.9
4.6
3.0
20.1
—
0.9
Total
0.3
4.2
5.9
15.0
4.7
32.4
—
1.4
As at 31 December 2023
Gross exposure
£m
£m
£m
£m
£m
£m
£m
£m
Retail mortgages
150,202
16,834
1,971
664
19,469
2,424
—
172,095
Retail credit cards
30,409
4,858
392
328
5,578
1,720
—
37,707
Retail other
8,469
1,094
126
123
1,343
493
—
10,305
Corporate loans
112,505
12,960
179
163
13,302
2,554
—
128,361
Total
301,585
35,746
2,668
1,278
39,692
7,191
—
348,468
Impairment allowance
Retail mortgages
50
73
20
12
105
428
—
583
Retail credit cards
523
1,257
166
207
1,630
1,333
—
3,486
Retail other
59
82
18
18
118
176
—
353
Corporate loans
287
399
8
7
414
598
—
1,299
Total
919
1,811
212
244
2,267
2,535
—
5,721
Net exposure
Retail mortgages
150,152
16,761
1,951
652
19,364
1,996
—
171,512
Retail credit cards
29,886
3,601
226
121
3,948
387
—
34,221
Retail other
8,410
1,012
108
105
1,225
317
—
9,952
Corporate loans
112,218
12,561
171
156
12,888
1,956
—
127,062
Total
300,666
33,935
2,456
1,034
37,425
4,656
—
342,747
Coverage ratio
%
%
%
%
%
%
%
%
Retail mortgages
—
0.4
1.0
1.8
0.5
17.7
—
0.3
Retail credit cards
1.7
25.9
42.3
63.1
29.2
77.5
—
9.2
Retail other
0.7
7.5
14.3
14.6
8.8
35.7
—
3.4
Corporate loans
0.3
3.1
4.5
4.3
3.1
23.4
—
1.0
Total
0.3
5.1
7.9
19.1
5.7
35.3
—
1.6
Strategy
Shareholder
information
Climate and
sustainability report
Governance
Risk
review
Financial
review
Financial
statements
Barclays PLC 2024
Annual Report
on Form 20-F
238
Risk performance - Credit risk (continued)
Movement in gross exposures and impairment allowance including provisions for loan commitments and
financial guarantees (audited)
The following tables present a reconciliation of the opening to the closing balance of the exposure and impairment allowance.
Transfers between stages in the tables have been reflected as if they had taken place at the beginning of the year. 'Net drawdowns,
repayments, net-remeasurement and movements due to exposure and risk parameter changes' includes additional drawdowns and
partial repayments from existing facilities. Additionally, the below tables do not include other financial assets subject to impairment such
as debt securities at amortised cost, reverse repurchase agreements and other similar secured lending, cash collateral and settlement
balances, financial assets at fair value through other comprehensive income and other assets.
The movements are measured over a 12-month period.
Strategy
Shareholder
information
Climate and
sustainability report
Governance
Risk
review
Financial
review
Financial
statements
Barclays PLC 2024
Annual Report
on Form 20-F
239
Risk performance - Credit risk (continued)
Loans and advances at amortised cost (audited)
Stage 1
Stage 2
Stage 3 excluding POCI
Stage 3 POCI
Total
Gross
exposure
ECL
Gross
exposure
ECL
Gross
exposure
ECL
Gross
exposure
ECL
Gross
exposure
ECL
£m
£m
£m
£m
£m
£m
£m
£m
£m
£m
Retail mortgages
As at 1 January 2024
150,202
50
19,469
105
2,424
428
—
—
172,095
583
Transfers from Stage 1 to
Stage 2
(10,013)
(5)
10,013
5
—
—
—
—
—
—
Transfers from Stage 2 to
Stage 1
6,591
29
(6,591)
(29)
—
—
—
—
—
—
Transfers to Stage 3
(388)
—
(530)
(10)
918
10
—
—
—
—
Transfers from Stage 3
82
3
142
2
(224)
(5)
—
—
—
—
Business activity in the year
22,881
8
792
4
7
—
—
—
23,680
12
Refinements to models used
for calculation
—
—
—
—
—
—
—
—
—
—
Net drawdowns, repayments,
net re-measurement and
movements due to exposure
and risk parameter changes
(7,297)
(37)
(918)
36
(53)
23
—
—
(8,268)
22
Final repayments
(12,680)
(5)
(2,099)
(11)
(394)
(24)
—
—
(15,173)
(40)
Disposals1
(2,688)
(5)
(682)
(40)
(699)
(328)
—
—
(4,069)
(373)
Write-offs
—
—
—
—
(17)
(17)
—
—
(17)
(17)
As at 31 December 2024
146,690
38
19,596
62
1,962
87
—
—
168,248
187
Retail credit cards
As at 1 January 2024
30,409
523
5,578
1,630
1,720
1,333
—
—
37,707
3,486
Transfers from Stage 1 to
Stage 2
(2,093)
(66)
2,093
66
—
—
—
—
—
—
Transfers from Stage 2 to
Stage 1
1,933
461
(1,933)
(461)
—
—
—
—
—
—
Transfers to Stage 3
(702)
(26)
(1,079)
(469)
1,781
495
—
—
—
—
Transfers from Stage 3
26
13
25
10
(51)
(23)
—
—
—
—
Business activity in the year2
7,217
184
400
118
32
29
40
—
7,689
331
Refinements to models used
for calculation3
—
5
—
(29)
—
4
—
—
—
(20)
Net drawdowns, repayments,
net re-measurement and
movements due to exposure
and risk parameter changes
658
(450)
838
628
(7)
1,143
—
—
1,489
1,321
Final repayments
(136)
(7)
(41)
(16)
(5)
(3)
—
—
(182)
(26)
Transfers to assets held for
sale4
(5,495)
(64)
(689)
(161)
(57)
(46)
—
—
(6,241)
(271)
Disposals1
(691)
(20)
(175)
(69)
(407)
(322)
—
—
(1,273)
(411)
Write-offs
—
—
—
—
(1,103)
(1,103)
—
—
(1,103)
(1,103)
As at 31 December 2024
31,126
553
5,017
1,247
1,903
1,507
40
—
38,086
3,307
Notes:
1The £4.1bn of gross disposals reported within Retail mortgages include £3.2bn sale of the Italian mortgage portfolio and £0.8bn of transfer of facilities to a non-consolidated SPV for the
purpose of securitisation. The £1.3bn of gross disposals reported within Retail credit cards include £0.9bn sale of the outstanding US Cards receivables to Blackstone and £0.4bn of
other debt sales undertaken during the year.
2Business activity in the year reported within Retail credit cards includes an acquisition of Tesco Bank's credit card receivables of £4.2bn.
3Refinements to models used for calculation reported within Retail credit cards include a £(31)m movement in UK Cards and a £11m movement in the US Cards portfolio. These reflect
model enhancements made during the year. Barclays continually reviews the output of models to determine accuracy of the ECL calculation including review of model monitoring,
external benchmarking and experience of model operation over an extended period of time. This helps to ensure that the models used continue to reflect the risks inherent across the
businesses.
4Transfers to assets held for sale reported within Retail credit cards relate to a co-branded card portfolio within USCB.
Strategy
Shareholder
information
Climate and
sustainability report
Governance
Risk
review
Financial
review
Financial
statements
Barclays PLC 2024
Annual Report
on Form 20-F
240
Risk performance - Credit risk (continued)
Loans and advances at amortised cost (audited)
Stage 1
Stage 2
Stage 3 excluding POCI
Stage 3 POCI
Total
Gross
exposure
ECL
Gross
exposure
ECL
Gross
exposure
ECL
Gross
exposure
ECL
Gross
exposure
ECL
£m
£m
£m
£m
£m
£m
£m
£m
£m
£m
Retail other
As at 1 January 2024
8,469
59
1,343
118
493
176
—
—
10,305
353
Transfers from Stage 1 to
Stage 2
(619)
(8)
619
8
—
—
—
—
—
—
Transfers from Stage 2 to
Stage 1
423
27
(423)
(27)
—
—
—
—
—
—
Transfers to Stage 3
(209)
(2)
(151)
(30)
360
32
—
—
—
—
Transfers from Stage 3
82
1
52
4
(134)
(5)
—
—
—
—
Business activity in the year1
7,590
105
252
30
24
22
17
—
7,883
157
Refinements to models used
for calculation
—
—
—
—
—
—
—
—
—
—
Net drawdowns, repayments,
net re-measurement and
movements due to exposure
and risk parameter changes
(265)
(33)
(125)
13
59
116
—
—
(331)
96
Final repayments
(3,021)
(11)
(194)
(5)
(273)
(41)
—
—
(3,488)
(57)
Disposals2
—
—
—
—
(46)
(34)
—
—
(46)
(34)
Write-offs
—
—
—
—
(105)
(105)
—
—
(105)
(105)
As at 31 December 2024
12,450
138
1,373
111
378
161
17
—
14,218
410
Corporate loans
As at 1 January 2024
112,505
287
13,302
414
2,554
598
—
—
128,361
1,299
Transfers from Stage 1 to
Stage 2
(3,810)
(28)
3,810
28
—
—
—
—
—
—
Transfers from Stage 2 to
Stage 1
3,316
75
(3,316)
(75)
—
—
—
—
—
—
Transfers to Stage 3
(1,073)
(6)
(892)
(37)
1,965
43
—
—
—
—
Transfers from Stage 3
269
14
230
22
(499)
(36)
—
—
—
—
Business activity in the year
27,032
45
897
36
415
26
—
—
28,344
107
Refinements to models used
for calculation3
—
(6)
—
42
—
—
—
—
—
36
Net drawdowns, repayments,
net re-measurement and
movements due to exposure
and risk parameter changes4
4,191
(124)
(531)
4
(631)
341
—
—
3,029
221
Final repayments
(25,861)
(46)
(2,322)
(98)
(363)
(21)
—
—
(28,546)
(165)
Transfers to assets held for
sale5
(49)
(1)
(9)
(3)
(1)
(1)
(59)
(5)
Disposals2
(12)
(1)
(2)
(2)
(2)
(2)
—
—
(16)
(5)
Write-offs
—
—
—
—
(322)
(322)
—
—
(322)
(322)
As at 31 December 2024
116,508
209
11,167
331
3,116
626
—
—
130,791
1,166
Notes:
1Business activity in the year reported within Retail other includes an acquisition of Tesco Bank's unsecured personal loans of £4.1bn.
2The £46m of gross disposals reported within Retail other relate to debt sales undertaken during the period. The £16m of gross disposals reported within Corporate loans relate to debt
sales undertaken during the year.
3Refinements to models used for calculation reported within Corporate loans include a £69m movement in IB and a £(33)m movement in the ESHLA portfolio. These reflect model
enhancements made during the year. Barclays continually reviews the output of models to determine accuracy of the ECL calculation including review of model monitoring, external
benchmarking and experience of model operation over an extended period of time. This helps to ensure that the models used continue to reflect the risks inherent across the
businesses.
4'Net drawdowns, repayments, net re-measurement and movements due to exposure and risk parameter changes' reported within Corporate loans also include assets of £2.7bn
derecognised due to payment received on defaulted loans from government guarantees issued under the Government’s Bounce Back Loans Scheme.
5Transfers to assets held for sale reported within Corporate loans relate to a co-branded card portfolio within USCB.
Strategy
Shareholder
information
Climate and
sustainability report
Governance
Risk
review
Financial
review
Financial
statements
Barclays PLC 2024
Annual Report
on Form 20-F
241
Risk performance - Credit risk (continued)
Reconciliation of ECL movement to credit impairment charge/(release) for the period
Stage 1
Stage 2
Stage 3
excluding
POCI
Stage 3
POCI
Total
£m
£m
£m
£m
£m
Retail mortgages
(7)
(3)
4
—
(6)
Retail credit cards
114
(153)
1,645
—
1,606
Retail other
79
(7)
124
—
196
Corporate loans
(76)
(78)
353
—
199
ECL movements excluding assets held for sale, disposals and write-offs1
110
(241)
2,126
—
1,995
ECL movement on loan commitments and other financial guarantees
(9)
(37)
(19)
—
(65)
ECL movement on other financial assets
3
5
(3)
—
5
ECL movement on debt securities at amortised cost
1
(5)
—
—
(4)
Recoveries and reimbursements2
(21)
20
(90)
—
(91)
ECL charge on assets held for sale3
74
Total exchange and other adjustments
68
Total credit impairment charge for the year
1,982
Notes:
1In 2024, gross write-offs amounted to £1,547m and post write-off recoveries amounted to £76m. Net write-offs represent gross write-offs less post write-off recoveries and
amounted to £1,471m.
2Recoveries and reimbursements include £15m for reimbursements expected to be received under the arrangement where Group has entered into financial guarantee contracts which
provide credit protection over certain assets with third parties and cash recoveries of previously written off amounts of £76m.
3ECL charge on assets held for sale relate to the German consumer finance business.
Strategy
Shareholder
information
Climate and
sustainability report
Governance
Risk
review
Financial
review
Financial
statements
Barclays PLC 2024
Annual Report
on Form 20-F
242
Risk performance - Credit risk (continued)
Loan commitments and financial guarantees (audited)1
Stage 1
Stage 2
Stage 3 excluding POCI
Stage 3 POCI
Total
Gross
exposure
ECL
Gross
exposure
ECL
Gross
exposure
ECL
Gross
exposure
ECL
Gross
exposure
ECL
£m
£m
£m
£m
£m
£m
£m
£m
£m
£m
Retail mortgages
As at 1 January 2024
7,776
—
448
—
4
—
—
—
8,228
—
Net transfers between stages
(47)
—
41
—
6
—
—
—
—
—
Business activity in the year
8,048
—
—
—
—
—
—
—
8,048
—
Net drawdowns, repayments,
net re-measurement and
movement due to exposure
and risk parameter changes
(4,336)
—
(106)
—
(7)
—
—
—
(4,449)
—
Limit management and final
repayments
(348)
—
(43)
—
(1)
—
—
—
(392)
—
As at 31 December 2024
11,093
—
340
—
2
—
—
—
11,435
—
Retail credit cards
As at 1 January 2024
144,791
59
2,807
54
142
—
—
—
147,740
113
Net transfers between stages
(1,940)
30
1,853
(30)
87
—
—
—
—
—
Business activity in the year
31,376
13
226
5
2
—
6
—
31,610
18
Net drawdowns, repayments,
net re-measurement and
movement due to exposure
and risk parameter changes
2,148
(36)
(1,969)
4
(88)
—
—
—
91
(32)
Limit management and final
repayments
(13,904)
(13)
(402)
(20)
(21)
—
—
—
(14,327)
(33)
As at 31 December 2024
162,471
53
2,515
13
122
—
6
—
165,114
66
Retail other
As at 1 January 2024
8,607
6
535
2
44
—
—
—
9,186
8
Net transfers between stages
(9)
—
(8)
—
17
—
—
—
—
—
Business activity in the year
781
2
1
—
—
—
—
—
782
2
Net drawdowns, repayments,
net re-measurement and
movement due to exposure
and risk parameter changes
110
(2)
(77)
(2)
(13)
—
—
—
20
(4)
Limit management and final
repayments
(1,073)
—
(11)
—
(23)
—
—
—
(1,107)
—
As at 31 December 2024
8,416
6
440
—
25
—
—
—
8,881
6
Corporate loans
As at 1 January 2024
212,889
108
20,418
231
847
44
—
—
234,154
383
Net transfers between stages
1,241
29
(1,555)
(32)
314
3
—
—
—
—
Business activity in the year
50,411
33
1,666
31
193
—
—
—
52,270
64
Net drawdowns, repayments,
net re-measurement and
movement due to exposure
and risk parameter changes
10,109
(39)
(1,383)
70
(46)
(14)
—
—
8,680
17
Limit management and final
repayments
(44,375)
(26)
(3,713)
(63)
(289)
(8)
—
—
(48,377)
(97)
As at 31 December 2024
230,275
105
15,433
237
1,019
25
—
—
246,727
367
Note:
1Loan commitments reported also include financial assets classified as held for sale.
Strategy
Shareholder
information
Climate and
sustainability report
Governance
Risk
review
Financial
review
Financial
statements
Barclays PLC 2024
Annual Report
on Form 20-F
243
Risk performance - Credit risk (continued)
Loans and advances at amortised cost (audited)
Stage 1
Stage 2
Stage 3 excluding POCI
Stage 3 POCI
Total
Gross
exposure
ECL
Gross
exposure
ECL
Gross
exposure
ECL
Gross
exposure
ECL
Gross
exposure
ECL
£m
£m
£m
£m
£m
£m
£m
£m
£m
£m
Retail mortgages
As at 1 January 2023
153,672
29
18,200
73
2,414
414
—
—
174,286
516
Transfers from Stage 1 to Stage 2
(9,557)
(2)
9,557
2
—
—
—
—
—
—
Transfers from Stage 2 to Stage 1
6,052
22
(6,052)
(22)
—
—
—
—
—
—
Transfers to Stage 3
(453)
—
(530)
(13)
983
13
—
—
—
—
Transfers from Stage 3
26
1
122
2
(148)
(3)
—
—
—
—
Business activity in the year1
23,329
13
978
7
26
11
—
—
24,333
31
Refinements to models used for
calculation
—
—
—
—
—
—
—
—
—
—
Net drawdowns, repayments, net
re-measurement and movements
due to exposure and risk parameter
changes
(11,505)
(8)
(1,136)
65
(502)
27
—
—
(13,143)
84
Final repayments
(10,837)
(3)
(1,666)
(9)
(328)
(15)
—
—
(12,831)
(27)
Disposals2
(525)
(2)
(4)
—
(2)
—
—
—
(531)
(2)
Write-offs
—
—
—
—
(19)
(19)
—
—
(19)
(19)
As at 31 December 2023
150,202
50
19,469
105
2,424
428
—
—
172,095
583
Retail credit cards
As at 1 January 2023
29,788
458
6,449
1,620
1,380
955
—
—
37,617
3,033
Transfers from Stage 1 to Stage 2
(2,406)
(68)
2,406
68
—
—
—
—
—
—
Transfers from Stage 2 to Stage 1
2,900
590
(2,900)
(590)
—
—
—
—
—
—
Transfers to Stage 3
(678)
(27)
(874)
(374)
1,552
401
—
—
—
—
Transfers from Stage 3
54
32
31
18
(85)
(50)
—
—
—
—
Business activity in the year
2,775
60
332
116
29
25
—
—
3,136
201
Refinements to models used for
calculation3
—
(28)
—
37
—
11
—
—
—
20
Net drawdowns, repayments, net
re-measurement and movements
due to exposure and risk parameter
changes
(162)
(465)
649
797
(47)
998
—
—
440
1,330
Final repayments
(241)
(14)
(70)
(21)
(26)
(19)
—
—
(337)
(54)
Transfers to assets held for sale4
(1,621)
(15)
(445)
(41)
(92)
(68)
—
—
(2,158)
(124)
Disposals2
—
—
—
—
(186)
(115)
—
—
(186)
(115)
Write-offs
—
—
—
—
(805)
(805)
—
—
(805)
(805)
As at 31 December 2023
30,409
523
5,578
1,630
1,720
1,333
—
—
37,707
3,486
Retail other
As at 1 January 2023
13,470
100
1,468
166
720
308
—
—
15,658
574
Transfers from Stage 1 to Stage 2
(1,179)
(13)
1,179
13
—
—
—
—
—
—
Transfers from Stage 2 to Stage 1
463
36
(463)
(36)
—
—
—
—
—
—
Transfers to Stage 3
(549)
(4)
(154)
(44)
703
48
—
—
—
—
Transfers from Stage 3
33
3
9
4
(42)
(7)
—
—
—
—
Business activity in the year
7,302
27
197
23
28
21
—
—
7,527
71
Refinements to models used for
calculation
—
—
—
—
—
—
—
—
—
—
Net drawdowns, repayments, net
re-measurement and movements
due to exposure and risk parameter
changes
(4,163)
(57)
(247)
31
(146)
115
—
—
(4,556)
89
Final repayments
(5,347)
(13)
(358)
(7)
(421)
(44)
—
—
(6,126)
(64)
Transfers to assets held for sale4
(1,561)
(20)
(288)
(32)
(84)
(60)
—
—
(1,933)
(112)
Disposals2
—
—
—
—
(134)
(74)
—
—
(134)
(74)
Write-offs
—
—
—
—
(131)
(131)
—
—
(131)
(131)
As at 31 December 2023
8,469
59
1,343
118
493
176
—
—
10,305
353
Notes:
1Business activity in the year reported within Retail mortgages includes an acquisition of Kensington Mortgage Company in UK Mortgages of £2.4bn.
2The £531m of gross disposals reported within Retail mortgages relate to transfer of facilities to a non-consolidated special purpose vehicle for the purpose of securitisation. The £186m
of gross disposals reported within Retail credit cards include debt sales undertaken during the year. The £134m of gross disposals reported within Retail other include £64m part sale of
Wealth portfolio in Italy and £70m of debt sales undertaken during the year.
3Refinements to models used for calculation reported within Retail credit cards include a £88m movement in UK Cards, £43m movement in US Cards and £(111)m movement in the
German consumer finance business. These reflect model enhancements made during the year. Barclays continually reviews the output of models to determine accuracy of the ECL
calculation including review of model monitoring, external benchmarking and experience of model operation over an extended period of time. This helps to ensure that the models used
continue to reflect the risks inherent across the businesses.
4Transfers to assets held for sale reported within Retail credit cards and Retail other relate to the German consumer finance business.
Strategy
Shareholder
information
Climate and
sustainability report
Governance
Risk
review
Financial
review
Financial
statements
Barclays PLC 2024
Annual Report
on Form 20-F
244
Risk performance - Credit risk (continued)
Loans and advances at amortised cost (audited)
Stage 1
Stage 2
Stage 3 excluding POCI
Stage 3 POCI
Total
Gross
exposure
ECL
Gross
exposure
ECL
Gross
exposure
ECL
Gross
exposure
ECL
Gross
exposure
ECL
£m
£m
£m
£m
£m
£m
£m
£m
£m
£m
Corporate loans
As at 1 January 2023
111,891
461
16,818
424
2,572
542
—
—
131,281
1,427
Transfers from Stage 1 to Stage 2
(6,172)
(45)
6,172
45
—
—
—
—
—
—
Transfers from Stage 2 to Stage 1
5,592
108
(5,592)
(108)
—
—
—
—
—
—
Transfers to Stage 3
(758)
(10)
(1,011)
(27)
1,769
37
—
—
—
—
Transfers from Stage 3
195
16
403
22
(598)
(38)
—
—
—
—
Business activity in the year
23,213
43
933
29
205
29
—
—
24,351
101
Refinements to models used for
calculation1
—
(61)
—
174
—
—
—
—
—
113
Net drawdowns, repayments, net
re-measurement and movements
due to exposure and risk parameter
changes2
2,079
(179)
(1,618)
(73)
(667)
405
—
—
(206)
153
Final repayments
(23,149)
(43)
(2,689)
(46)
(406)
(65)
—
—
(26,244)
(154)
Disposals3
(386)
(3)
(114)
(26)
(108)
(99)
—
—
(608)
(128)
Write-offs
—
—
—
—
(213)
(213)
—
—
(213)
(213)
As at 31 December 2023
112,505
287
13,302
414
2,554
598
—
—
128,361
1,299
Reconciliation of ECL movement to credit impairment charge/(release) for the period
Stage 1
Stage 2
Stage 3
excluding
POCI
Stage 3
POCI
Total
£m
£m
£m
£m
£m
Retail mortgages
23
32
33
—
88
Retail credit cards
80
51
1,366
—
1,497
Retail other
(21)
(16)
133
—
96
Corporate loans
(171)
16
368
—
213
ECL movement excluding assets held for sale ,disposals and write-offs4
(89)
83
1,900
—
1,894
ECL movement on loan commitments and financial guarantees
(72)
(28)
21
—
(79)
ECL movement on other financial assets
6
(7)
(11)
—
(12)
ECL movement on debt securities at amortised cost
2
(17)
—
—
(15)
Recoveries and reimbursements5
4
(4)
(73)
—
(73)
Total exchange and other adjustments
166
Total credit impairment charge for the year
1,881
Notes:
1Refinements to models used for calculation reported within Corporate loans include a £93m movement in UKCB and IB portfolio and £20m movement in Barclaycard Payments
portfolio. These reflect model enhancements made during the year. Barclays continually reviews the output of models to determine accuracy of the ECL calculation including review of
model monitoring, external benchmarking and experience of model operation over an extended period of time. This helps to ensure that the models used continue to reflect the risks
inherent across the businesses.
2'Net drawdowns, repayments, net re-measurement and movements due to exposure and risk parameter changes' reported within Corporate loans also include assets of £0.8bn
derecognised due to payment received on defaulted loans from government guarantees issued under the Government’s Bounce Back Loans Scheme.
3The £608m of gross disposals reported within Corporate loans relate to debt sales undertaken during the year.
4In 2023, gross write-offs amounted to £1,168m and post write-off recoveries amounted to £44m. Net write-offs represent gross write-offs less post write-off recoveries and
amounted to £1,124m.
5Recoveries and reimbursements include £29m for reimbursements expected to be received under the arrangement where Group has entered into financial guarantee contracts which
provide credit protection over certain assets with third parties and cash recoveries of previously written off amounts of £44m.
Strategy
Shareholder
information
Climate and
sustainability report
Governance
Risk
review
Financial
review
Financial
statements
Barclays PLC 2024
Annual Report
on Form 20-F
245
Risk performance - Credit risk (continued)
Loan commitments and financial guarantees (audited)1
Stage 1
Stage 2
Stage 3 excluding POCI
Stage 3 POCI
Total
Gross
exposure
ECL
Gross
exposure
ECL
Gross
exposure
ECL
Gross
exposure
ECL
Gross
exposure
ECL
£m
£m
£m
£m
£m
£m
£m
£m
£m
£m
Retail mortgages
As at 1 January 2023
11,714
—
450
—
6
—
—
—
12,170
—
Net transfers between stages
(62)
—
53
—
9
—
—
—
—
—
Business activity in the year
4,184
—
—
—
—
—
—
—
4,184
—
Net drawdowns, repayments,
net re-measurement and
movement due to exposure
and risk parameter changes
(7,669)
—
(11)
—
(11)
—
—
—
(7,691)
—
Limit management and final
repayments
(391)
—
(44)
—
—
—
—
—
(435)
—
As at 31 December 2023
7,776
—
448
—
4
—
—
—
8,228
—
Retail credit cards
As at 1 January 2023
144,957
50
5,435
83
228
—
—
—
150,620
133
Net transfers between stages
448
61
(538)
(61)
90
—
—
—
—
—
Business activity in the year
19,098
16
224
13
1
—
—
—
19,323
29
Net drawdowns, repayments,
net re-measurement and
movement due to exposure
and risk parameter changes
(5,863)
(59)
(1,769)
53
(101)
—
—
—
(7,733)
(6)
Limit management and final
repayments
(13,849)
(9)
(545)
(34)
(76)
—
—
—
(14,470)
(43)
As at 31 December 2023
144,791
59
2,807
54
142
—
—
—
147,740
113
Retail other
As at 1 January 2023
10,427
5
520
—
80
—
—
—
11,027
5
Net transfers between stages
(171)
—
140
—
31
—
—
—
—
—
Business activity in the year
1,639
—
1
—
4
—
—
—
1,644
—
Net drawdowns, repayments,
net re-measurement and
movement due to exposure
and risk parameter changes
(1,690)
1
(93)
2
(59)
—
—
—
(1,842)
3
Limit management and final
repayments
(1,598)
—
(33)
—
(12)
—
—
—
(1,643)
—
As at 31 December 2023
8,607
6
535
2
44
—
—
—
9,186
8
Corporate loans
As at 1 January 2023
205,847
190
24,289
232
866
23
—
—
231,002
445
Net transfers between stages
2,416
23
(2,423)
(23)
7
—
—
—
—
—
Business activity in the year
54,807
27
2,271
43
39
2
—
—
57,117
72
Net drawdowns, repayments,
net re-measurement and
movement due to exposure
and risk parameter changes
3,556
(106)
97
25
206
24
—
—
3,859
(57)
Limit management and final
repayments
(53,737)
(26)
(3,816)
(46)
(271)
(5)
—
—
(57,824)
(77)
As at 31 December 2023
212,889
108
20,418
231
847
44
—
—
234,154
383
Note:
1Loan commitments reported also include financial assets classified as held for sale.
Strategy
Shareholder
information
Climate and
sustainability report
Governance
Risk
review
Financial
review
Financial
statements
Barclays PLC 2024
Annual Report
on Form 20-F
246
Risk performance - Credit risk (continued)
Stage 2 decomposition
Stage 2 exposures are predominantly identified using quantitative tests where the lifetime probability of default (PD) has deteriorated
more than a pre-determined amount since origination during the year. This is augmented by inclusion of accounts meeting the
designated high risk criteria (including watchlist) for the portfolio under the qualitative test.
A small number of other accounts (0.6% of impairment allowance and 2.6% of gross exposure) are included in Stage 2. These accounts
are not otherwise identified by the quantitative or qualitative tests but are more than 30 days past due. The percentage triggered by
these backstop criteria is a measure of the effectiveness of the Stage 2 criteria in identifying deterioration prior to delinquency. These
balances include items in the UK Corporate Bank and Investment Bank for reasons such as outstanding interest and fees rather than
principal balances.
Loans and advances at amortised cost1
Gross Exposure
Impairment Allowance
Quantitative
test
Qualitative test
30 days past due
backstop
Total Stage 2
Quantitative
test
Qualitative test
30 days past due
backstop
Total Stage 2
As at 31 December 20242
£m
£m
£m
£m
£m
£m
£m
£m
Retail mortgages
9,143
9,681
683
19,507
42
15
4
61
Retail credit cards
1,719
345
—
2,064
367
73
—
440
Retail other
746
464
8
1,218
94
15
1
110
Corporate loans
5,406
1,743
117
7,266
143
52
1
196
Total UK
17,014
12,233
808
30,055
646
155
6
807
Retail mortgages
3
13
73
89
1
—
—
1
Retail credit cards
2,200
744
9
2,953
620
183
4
807
Retail other
15
72
68
155
—
1
—
1
Corporate loans
2,985
903
13
3,901
103
32
—
135
Total Rest of the World
5,203
1,732
163
7,098
724
216
4
944
Retail mortgages
9,146
9,694
756
19,596
43
15
4
62
Retail credit cards
3,919
1,089
9
5,017
987
256
4
1,247
Retail other
761
536
76
1,373
94
16
1
111
Corporate loans
8,391
2,646
130
11,167
246
84
1
331
Total Stage 2
22,217
13,965
971
37,153
1,370
371
10
1,751
As at 31 December 2023
£m
£m
£m
£m
£m
£m
£m
£m
Retail mortgages
8,905
9,589
629
19,123
49
22
6
77
Retail credit cards
1,798
330
—
2,128
416
76
—
492
Retail other
775
462
15
1,252
104
12
1
117
Corporate loans
6,745
1,845
83
8,673
177
36
1
214
Total UK
18,223
12,226
727
31,176
746
146
8
900
Retail mortgages
301
28
17
346
24
2
2
28
Retail credit cards
2,399
1,020
31
3,450
750
367
21
1,138
Retail other
9
41
41
91
1
—
—
1
Corporate loans
3,593
964
72
4,629
155
42
3
200
Total Rest of the World
6,302
2,053
161
8,516
930
411
26
1,367
Retail mortgages
9,206
9,617
646
19,469
73
24
8
105
Retail credit cards
4,197
1,350
31
5,578
1,166
443
21
1,630
Retail other
784
503
56
1,343
105
12
1
118
Corporate loans
10,338
2,809
155
13,302
332
78
4
414
Total Stage 2
24,525
14,279
888
39,692
1,676
557
34
2,267
Notes:
1Where balances satisfy more than one of the above three criteria for determining a significant increase in credit risk, the corresponding gross exposure and impairment allowance have
been assigned in order of categories presented.
2Exposures exclude the portfolios which have been classified as assets held for sale.
Strategy
Shareholder
information
Climate and
sustainability report
Governance
Risk
review
Financial
review
Financial
statements
Barclays PLC 2024
Annual Report
on Form 20-F
247
Risk performance - Credit risk (continued)
Stage 3 decomposition
Stage 3 comprises exposures that are considered to be credit impaired. An asset is considered credit impaired when one or more
events occur that have a detrimental impact on the estimated future cash flows of the financial asset. This comprises assets defined as
defaulted, other individually assessed exposures and POCI as part of Tesco bank acquisition where imminent default or actual loss is
identified.
Loans and advances at amortised cost
Gross Exposure
Impairment Allowance
Stage 3 excluding POCI
Stage 3 excluding POCI
Exposures
not charged-
off
Exposures
individually
assessed or
in recovery
book
Total
POCI
Total Stage 3
Exposures
not charged-
off
Exposures
individually
assessed or
in recovery
book
Total
POCI
Total Stage 3
As at 31 December 20241
£m
£m
£m
£m
£m
£m
£m
£m
£m
£m
Retail mortgages
1,438
355
1,793
—
1,793
28
33
61
—
61
Retail credit cards
179
—
179
40
219
88
3
91
—
91
Retail other
164
93
257
17
274
77
61
138
—
138
Corporate loans
1,294
877
2,171
—
2,171
110
310
420
—
420
Total UK
3,075
1,325
4,400
57
4,457
303
407
710
—
710
Retail mortgages
45
124
169
—
169
4
22
26
—
26
Retail credit cards
707
1,017
1,724
—
1,724
428
988
1,416
—
1,416
Retail other
21
100
121
—
121
1
22
23
—
23
Corporate loans
41
904
945
—
945
2
204
206
—
206
Total Rest of the World
814
2,145
2,959
—
2,959
435
1,236
1,671
—
1,671
Retail mortgages
1,483
479
1,962
—
1,962
32
55
87
—
87
Retail credit cards
886
1,017
1,903
40
1,943
516
991
1,507
—
1,507
Retail other
185
193
378
17
395
78
83
161
—
161
Corporate loans
1,335
1,781
3,116
—
3,116
112
514
626
—
626
Total Stage 3
3,889
3,470
7,359
57
7,416
738
1,643
2,381
—
2,381
As at 31 December 2023
£m
£m
£m
£m
£m
£m
£m
£m
£m
£m
Retail mortgages
1,473
339
1,812
—
1,812
67
45
112
—
112
Retail credit cards
198
—
198
—
198
107
—
107
—
107
Retail other
177
87
264
—
264
80
64
144
—
144
Corporate loans
1,198
494
1,692
—
1,692
139
207
346
—
346
Total UK
3,046
920
3,966
—
3,966
393
316
709
—
709
Retail mortgages
155
457
612
—
612
23
293
316
—
316
Retail credit cards
617
905
1,522
—
1,522
413
813
1,226
—
1,226
Retail other
65
164
229
—
229
2
30
32
—
32
Corporate loans
50
812
862
—
862
3
249
252
—
252
Total Rest of the World
887
2,338
3,225
—
3,225
441
1,385
1,826
—
1,826
Retail mortgages
1,628
796
2,424
—
2,424
90
338
428
—
428
Retail credit cards
815
905
1,720
—
1,720
520
813
1,333
—
1,333
Retail other
242
251
493
—
493
82
94
176
—
176
Corporate loans
1,248
1,306
2,554
—
2,554
142
456
598
—
598
Total Stage 3
3,933
3,258
7,191
—
7,191
834
1,701
2,535
—
2,535
Note:
1Exposures exclude the portfolios which have been classified as assets held for sale.
Strategy
Shareholder
information
Climate and
sustainability report
Governance
Risk
review
Financial
review
Financial
statements
Barclays PLC 2024
Annual Report
on Form 20-F
248
Risk performance - Credit risk (continued)
Management adjustments to models for impairment (audited)
Management adjustments to impairment models are applied in order to factor in certain conditions or changes in policy that are not
fully incorporated into the impairment models, or to reflect additional facts and circumstances at the period end. Management
adjustments are reviewed and incorporated into future model development where applicable.
Management adjustments are captured through “Economic uncertainty” and “Other” adjustments, and are presented by product and
geography below:
Management adjustments to models for impairment allowance presented by product and geography (audited)1
Impairment
allowance pre
management
adjustments2
Economic
uncertainty
adjustments
(a)
Other
adjustments3
(b)
Management
adjustments
(a+b)
Total
impairment
allowance4
Proportion of
management
adjustments to
total impairment
allowance
As at 31 December 2024
£m
£m
£m
£m
£m
%
Retail mortgages
51
36
71
107
158
67.7%
Retail credit cards
787
—
(22)
(22)
765
(2.9)%
Retail other
298
—
90
90
388
23.2%
Corporate loans
759
42
39
81
840
9.6%
Total UK
1,895
78
178
256
2,151
11.9%
Retail mortgages
29
—
—
—
29
—%
Retail credit cards
2,631
—
(23)
(23)
2,608
(0.9)%
Retail other
24
—
4
4
28
14.3%
Corporate loans
695
—
(2)
(2)
693
(0.3)%
Total Rest of the World
3,379
—
(21)
(21)
3,358
(0.6)%
Total
5,274
78
157
235
5,509
4.3%
Debt securities at amortised cost
30
—
(7)
(7)
23
(30.4)%
Total including debt securities at amortised cost
5,304
78
150
228
5,532
4.1%
As at 31 December 2023
£m
£m
£m
£m
£m
%
Retail mortgages
54
57
121
178
232
76.7
Retail credit cards
700
45
(9)
36
736
4.9
Retail other
251
9
62
71
322
22.0
Corporate loans
761
71
10
81
842
9.6
Total UK
1,766
182
184
366
2,132
17.2
Retail mortgages
354
—
(3)
(3)
351
(0.9)
Retail credit cards
2,855
—
8
8
2,863
0.3
Retail other
45
—
(6)
(6)
39
(15.4)
Corporate loans
828
16
(4)
12
840
1.4
Total Rest of the World
4,082
16
(5)
11
4,093
0.3
Total
5,848
198
179
377
6,225
6.1
Debt securities at amortised cost
27
—
—
—
27
—
Total including debt securities at amortised cost
5,875
198
179
377
6,252
6.0
Strategy
Shareholder
information
Climate and
sustainability report
Governance
Risk
review
Financial
review
Financial
statements
Barclays PLC 2024
Annual Report
on Form 20-F
249
Risk performance - Credit risk (continued)
Economic uncertainty adjustments presented by stage (audited)
Stage 1
Stage 2
Stage 3
Total
As at 31 December 2024
£m
£m
£m
£m
Retail mortgages
7
18
11
36
Retail credit cards
—
—
—
—
Retail other
—
—
—
—
Corporate loans
26
10
6
42
Total UK
33
28
17
78
Retail mortgages
—
—
—
—
Retail credit cards
—
—
—
—
Retail other
—
—
—
—
Corporate loans
—
—
—
—
Total Rest of the World
—
—
—
—
Total
33
28
17
78
Stage 1
Stage 2
Stage 3
Total
As at 31 December 2023
£m
£m
£m
£m
Retail mortgages
12
32
13
57
Retail credit cards
8
37
—
45
Retail other
3
6
—
9
Corporate loans
48
12
11
71
Total UK
71
87
24
182
Retail mortgages
—
—
—
—
Retail credit cards
—
—
—
—
Retail other
—
—
—
—
Corporate loans
4
12
—
16
Total Rest of the World
4
12
—
16
Total
75
99
24
198
Notes:
1Positive values reflect an increase in impairment allowance and negative values reflect a reduction in the impairment allowance.
2Includes £4.7bn (2023: £5.2bn) of modelled ECL, £0.5bn (2023: £0.4bn) of individually assessed impairments, £0.4bn (2023: £0.3bn) of ECL from non-modelled exposures and debt
securities and excludes £(0.3)bn (2023: £nil) of ECL from assets held for sale (co-branded card portfolio).
3Management adjustments related to other financial assets subject to impairment not included in the table above include financial assets at fair value through other comprehensive
income £(2)m, reverse repurchase agreements £(2)m and cash collateral and settlement balances £(1)m within the IB portfolio.
4Total impairment allowance consists of ECL stock on drawn and undrawn exposure.
Economic uncertainty adjustments
Economic uncertainty adjustments continue to be captured in two ways. Firstly, customer uncertainty: the identification of customers
and clients who may be more vulnerable to economic instability; and secondly, model uncertainty: to capture the impact from model
limitations and sensitivities to specific macroeconomic parameters which are applied at a portfolio level.
The previously held uncertainty adjustments reflecting affordability concerns were reduced during the year, informed by lower
inflationary risk and a resilient credit performance in UK retail lending.
The balance as at 31 December 2024 is £78m (2023: £198m) and includes:
Customer and client uncertainty provisions of £53m (2023: £166m):
Retail mortgages (UK) £11m (2023: £25m):This adjustment reflects the risk of borrowers refinancing onto higher rates in the
medium term and was partially utilised during the year.
Retail credit cards (UK) £nil (2023: £45m) and Retail other (UK) £nil (2023: £9m):The previously held affordability linked adjustments
in the UK unsecured lending portfolio have been retired, supported by a resilient credit performance from UK customers, evidenced by
continued low and stable delinquencies.
Corporateloans:
UK £42m (December 2023: £71m): This adjustment reflects the possible cross default risk on Barclays’ lending in respect of clients
who have taken bounce back loans and is partially reduced on account of the latest credit performance.
ROW £nil (December 2023: £16m): The previously held adjustment to provide for expected downside uncertainties on European
Corporates has been retired following a resilient credit performance and updated macroeconomic outlook.
Model uncertainty provisions of £25m (2023: £32m):
Retail mortgages (UK) £25m (2023: £32m): This adjustment remediates the higher recovery expectations impacted by model
oversensitivity to certain macroeconomic variables and has reduced following the updated macroeconomic outlook.
Strategy
Shareholder
information
Climate and
sustainability report
Governance
Risk
review
Financial
review
Financial
statements
Barclays PLC 2024
Annual Report
on Form 20-F
250
Risk performance - Credit risk (continued)
Other adjustments
Other adjustments are operational in nature and are expected to remain in place until they can be reflected in the underlying models.
These adjustments result from data limitations and model performance related issues identified through model monitoring and other
established governance processes.
Other adjustments of £150m (2023: £179m) includes:
Adjustments for definition of default (DOD) under the Capital Requirements Regulation and model monitoring across products.
Retail mortgages (UK) £71m (2023: £121m):The reduction is driven by the adoption of a new LGD2 (Loss Given Default) model for the
default book and re-sizing of model monitoring adjustments.
Retail credit cards (UK) £(22)m (2023: £(9)m): The movement is driven by a model monitoring adjustment to correct for 12m PD over
prediction.
Retail credit cards (ROW) £(23)m (2023: £8m): The movement is driven by an adjustment introduced in the US to enhance the
qualitative measures used to identify high-risk account management (HRAM) accounts.
Retail other (UK) £90m (2023: £62m): The increase reflects re-sizing of operational adjustments including model monitoring in the
Barclays Partner Finance and Consumer Loan portfolios.
Corporate loans (UK) £39m (2023: £10m):The increase reflects re-sizing of an adjustment to remediate conservative modelled
recovery expectations in the ESHLA portfolio partially offset by a reduction in the adjustment for DOD following model remediation.
Debt securities £(7)m:This reflects an adjustment applied to Exposure at Default (EAD) within the IB portfolio to remediate an overly
conservative modelled amortisation expectation.
Strategy
Shareholder
information
Climate and
sustainability report
Governance
Risk
review
Financial
review
Financial
statements
Barclays PLC 2024
Annual Report
on Form 20-F
251
Risk performance - Credit risk (continued)
Climate Risk ECL assessment
Barclays performed a credit risk assessment of physical and transition risk due to climate change. This was delivered through a
combination of a scenario approach and targeted reviews on specific portfolios identified as more susceptible to climate risk.
Scenario Approach: The IFRS 9 Downside 2 scenario has been updated and aligned to the 2024 Internal Stress Test scenario which is
climate aware, ensuring that climate is being considered within the modelled ECL output via existing macroeconomic variables.
Specific Approach: The approach reviewed portfolios previously identified from both internal and external stress tests as more
susceptible to climate risks. In particular, new climate modelling techniques were utilised to inform customer level PD and LGD spreads
of physical and transition risk due to climate change for i) the UK Mortgages portfolio (both PD and LGD) and ii) certain elevated risk
sectors (predominantly Oil & Gas, Aviation, Automotive and Power sectors) within the Wholesale portfolio (PD only). The output of this
review did not provide variances in ECL deemed sufficiently certain to warrant raising an additional climate-related charge in 2024.
Barclays acknowledges that impairment could increase over time as risks become more tangible and impact consumers and clients
through physical risks or via impacts from the transition to a low carbon economy. Therefore, Barclays continues to review credit risk
outputs to determine if any additional physical or transition climate risks are identified that are not sufficiently captured via model
output.
Refer to the Barclays resilience to climate scenarios on page 57 for further details.
Strategy
Shareholder
information
Climate and
sustainability report
Governance
Risk
review
Financial
review
Financial
statements
Barclays PLC 2024
Annual Report
on Form 20-F
252
Risk performance - Credit risk (continued)
Measurement uncertainty and sensitivity analysis
The measurement of modelled ECL involves complexity and judgement, including estimation of probabilities of default (PD), loss given
default (LGD), a range of unbiased future economic scenarios, estimation of expected lives, estimation of exposures at default (EAD)
and assessing significant increases in credit risk. The Group uses a five-scenario model to calculate ECL. An external consensus
forecast is assembled from key sources, including HM Treasury (short and medium term forecasts) and Bloomberg (based on median
of economic forecasts) which forms the Baseline scenario. In addition, two adverse scenarios (Downside 1 and Downside 2) and two
favourable scenarios (Upside 1 and Upside 2) are derived, with associated probability weightings. The adverse scenarios are calibrated
to a broadly similar severity to the Group's internal stress tests and stress scenarios provided by regulators whilst also considering IFRS
9 specific sensitivities and non-linearity. The favourable scenarios are designed to reflect plausible upside risks to the Baseline scenario
which are broadly consistent with the economic narrative approved by the Senior Scenario Review Committee. All scenarios are
regenerated at a minimum semi-annually. The scenarios include key economic variables, (including GDP, unemployment, House Price
Index (HPI) and base rates in both the UK and US markets), and expanded variables using statistical models based on historical
correlations. The upside and downside shocks are designed to evolve over afive-year stress horizon, with all five scenarios converging
to a steady state after approximately seven years. The same scenarios used in the estimation of expected credit losses are also used to
inform the Group's internal planning.
Scenarios used to calculate the Group’s ECL charge were refreshed in Q424 with the Baseline scenario reflecting the latest consensus
macroeconomic forecasts available at the time of the scenario refresh.In the Baseline scenario, following an encouraging first half of
2024, UK economic growth slowed in H224. However, it is further stimulated as restrictive monetary policy continues to loosen. UK and
US GDP growth in 2025 is expected to be 1.4% and 2.0% respectively. Labour markets in major economies remain broadly resilient with
unemployment rates relatively close to historic lows and are only expected to increase moderately.The UK unemployment rate peaks
at 4.5% in 2026 before returning to 4.4% for the reminder of the 5-year projection period. US unemployment peaks at 4.3%, falling to
4.2% from 2026. The Bank of England cuts rates three times by 25bp in 2025. Similarly, the Fed finishes 2025 with rates at 4.0%. As
lower rates feed into new mortgages, UK house prices stabilise and resume the upward trend from 2025. US house prices continue to
grow at a decent pace.
The Downside 2 scenario has been broadly aligned to the Group’s 2024 internal stress test which includes climate drivers. Under this
scenario, long-standing structural issues, restrictive monetary policy and persistent household affordability loss leads to a sharp
demand-driven economic contraction that precipitates into a severe global recession and disinflation process. The economic
slowdown leads to rising unemployment rates as lay-offs intensify. UK and US unemployment peak at 8.4% and 7.5% respectively,
during 2026. The combination of high interest rates and subdued growth leads to inflation declines which in turn causes central banks to
reduce rates. In the Upside 2 scenario, a rise in labour force participation and higher productivity contribute to accelerated economic
growth, without creating new inflationary pressures. Central banks lower interest rates stimulating private consumption and investment
growth. Demand for labour increases. and unemployment rates stabilise and start falling again. As geopolitical tensions ease, low
inflation supports consumer purchasing power and contributes further to a healthy GDP growth.
The strong economic outlook and lower interest rates provide a boost to house prices growth and support bullish financial markets.
The methodology for estimating scenario probability weights involves simulating a range of future paths for UK and US GDP using
historical data with the five scenarios mapped against the distribution of these future paths. The median is centred around the Baseline
with scenarios further from the Baseline attracting a lower weighting before the five weights are normalised to total 100%. The
increases in the Upside scenario weightings were driven by the improvement in GDP in the Baseline scenario, bringing the Baseline
scenario closer to the Upside scenarios. For further details see page255.
The economic uncertainty adjustments of £0.1bn (2023: £0.2bn) have been applied as overlays to the modelled ECL output. Previously
held uncertainty adjustments reflecting affordability concerns were reduced during the year, informed by lower inflationary risk and a
resilient credit performance in UK retail lending. For further details see pages 248 to 250.
The tables below show the key macroeconomic variables used in the five scenarios (5 year annual paths), the probability weights applied
to each scenario and the macroeconomic variables by scenario using ‘specific bases’ i.e. the most extreme position of each variable in
the context of the scenario, for example, the highest unemployment for downside scenarios and the lowest unemployment for upside
scenarios. 5-year average tables and movement over time graphs provide additional transparency. Annual paths show quarterly
averages for the year (unemployment and base rate) or change in the year (GDP and HPI).
Strategy
Shareholder
information
Climate and
sustainability report
Governance
Risk
review
Financial
review
Financial
statements
Barclays PLC 2024
Annual Report
on Form 20-F
253
Risk performance - Credit risk (continued)
Baseline
2024
2025
2026
2027
2028
As at 31 December 2024
%
%
%
%
%
UK GDP1
1.0
1.4
1.5
1.6
1.5
UK unemployment2
4.3
4.4
4.5
4.4
4.4
UK HPI3
2.8
3.3
1.6
4.5
3.0
UK bank rate
5.1
4.3
4.0
4.0
3.8
US GDP1
2.7
2.0
2.0
2.0
2.0
US unemployment4
4.1
4.3
4.2
4.2
4.2
US HPI5
6.5
2.6
2.7
3.0
3.0
US federal funds rate
5.1
4.1
4.0
3.8
3.8
Downside 2
UK GDP1
1.0
(2.3)
(1.3)
2.6
2.3
UK unemployment2
4.3
6.2
8.1
6.6
5.5
UK HPI3
2.8
(24.8)
(5.2)
10.0
14.6
UK bank rate
5.1
3.5
1.7
0.6
1.1
US GDP1
2.7
(1.3)
(1.3)
3.3
2.9
US unemployment4
4.1
5.8
7.2
6.2
5.5
US HPI5
6.5
(8.0)
(0.7)
5.2
4.0
US federal funds rate
5.1
2.5
0.6
0.8
1.5
Downside 1
UK GDP1
1.0
(0.5)
0.1
2.1
1.9
UK unemployment2
4.3
5.3
6.3
5.5
5.0
UK HPI3
2.8
(11.6)
(1.8)
7.2
8.7
UK bank rate
5.1
3.9
2.9
2.3
2.4
US GDP1
2.7
0.3
0.4
2.7
2.4
US unemployment4
4.1
5.1
5.7
5.2
4.9
US HPI5
6.5
(2.7)
1.0
4.1
3.5
US federal funds rate
5.1
3.4
2.3
2.3
2.7
Upside 2
UK GDP1
1.0
3.0
3.7
2.9
2.4
UK unemployment2
4.3
3.8
3.4
3.5
3.5
UK HPI3
2.8
11.9
8.4
5.1
4.1
UK bank rate
5.1
3.9
2.9
2.8
2.8
US GDP1
2.7
2.8
3.1
2.8
2.8
US unemployment4
4.1
3.8
3.5
3.5
3.5
US HPI5
6.5
6.2
4.7
4.8
4.9
US federal funds rate
5.1
3.7
3.3
3.1
2.8
Upside 1
UK GDP1
1.0
2.2
2.6
2.2
2.0
UK unemployment2
4.3
4.1
4.0
4.0
4.0
UK HPI3
2.8
7.6
4.9
4.8
3.5
UK bank rate
5.1
4.1
3.5
3.4
3.3
US GDP1
2.7
2.4
2.6
2.4
2.4
US unemployment4
4.1
4.0
3.9
3.9
3.9
US HPI5
6.5
4.4
3.7
3.9
3.9
US federal funds rate
5.1
4.0
3.8
3.6
3.3
Notes:
1Average Real GDP seasonally adjusted change in year.
2Average UK unemployment rate 16-year+.
3Change in year end UK HPI = Halifax All Houses, All Buyers index, relative to prior year end.
4Average US civilian unemployment rate 16-year+.
5Change in year end US HPI = FHFA house price index, relative to prior year end.
Strategy
Shareholder
information
Climate and
sustainability report
Governance
Risk
review
Financial
review
Financial
statements
Barclays PLC 2024
Annual Report
on Form 20-F
254
Risk performance - Credit risk (continued)
Baseline
2023
2024
2025
2026
2027
As at 31 December 2023
%
%
%
%
%
UK GDP1
0.5
0.3
1.2
1.6
1.6
UK unemployment2
4.2
4.7
4.7
4.8
5.0
UK HPI3
(3.3)
(5.1)
0.7
3.1
5.3
UK bank rate
4.7
4.9
4.1
3.8
3.5
US GDP1
2.4
1.3
1.7
1.9
1.9
US unemployment4
3.7
4.3
4.3
4.3
4.3
US HPI5
5.4
3.4
3.0
3.3
3.3
US federal funds rate
5.1
5.0
3.9
3.8
3.8
Downside 2
UK GDP1
0.5
(1.5)
(2.6)
2.4
1.6
UK unemployment2
4.2
5.2
7.9
6.3
5.5
UK HPI3
(3.3)
(19.3)
(16.8)
14.5
12.4
UK bank rate
4.7
6.6
1.3
1.0
1.0
US GDP1
2.4
(0.6)
(2.0)
3.1
2.0
US unemployment4
3.7
5.2
7.2
5.9
5.2
US HPI5
5.4
(6.5)
(5.7)
7.2
6.4
US federal funds rate
5.1
6.3
1.8
1.5
1.5
Downside 1
UK GDP1
0.5
(0.6)
(0.7)
2.0
1.6
UK unemployment2
4.2
4.9
6.3
5.6
5.2
UK HPI3
(3.3)
(12.4)
(8.3)
8.7
8.8
UK bank rate
4.7
5.8
2.7
2.5
2.3
US GDP1
2.4
0.3
(0.2)
2.5
1.9
US unemployment4
3.7
4.7
5.8
5.1
4.8
US HPI5
5.4
(1.7)
(1.4)
5.2
4.8
US federal funds rate
5.1
5.7
2.9
2.8
2.8
Upside 2
UK GDP1
0.5
2.4
3.7
2.9
2.4
UK unemployment2
4.2
3.9
3.5
3.6
3.6
UK HPI3
(3.3)
7.8
7.6
4.5
5.6
UK bank rate
4.7
4.3
2.7
2.5
2.5
US GDP1
2.4
2.8
3.1
2.8
2.8
US unemployment4
3.7
3.5
3.6
3.6
3.6
US HPI5
5.4
6.1
4.3
4.5
4.6
US federal funds rate
5.1
4.3
2.9
2.8
2.8
Upside 1
UK GDP1
0.5
1.4
2.5
2.3
2.0
UK unemployment2
4.2
4.3
4.1
4.2
4.3
UK HPI3
(3.3)
1.2
4.1
3.8
5.4
UK bank rate
4.7
4.6
3.4
3.3
3.0
US GDP1
2.4
2.0
2.4
2.4
2.4
US unemployment4
3.7
3.9
3.9
4.0
4.0
US HPI5
5.4
4.7
3.7
3.9
3.9
US federal funds rate
5.1
4.7
3.5
3.3
3.3
Notes:
1Average Real GDP seasonally adjusted change in year.
2Average UK unemployment rate 16-year+.
3Change in year end UK HPI = Halifax All Houses, All Buyers index, relative to prior year end.
4Average US civilian unemployment rate 16-year+.
5Change in year end US HPI = FHFA house price index, relative to prior year end.
Strategy
Shareholder
information
Climate and
sustainability report
Governance
Risk
review
Financial
review
Financial
statements
Barclays PLC 2024
Annual Report
on Form 20-F
255
Risk performance - Credit risk (continued)
Scenario probability weighting (audited)1
Upside 2
Upside 1
Baseline
Downside 1
Downside 2
%
%
%
%
%
As at 31 December 2024
Scenario probability weighting
17.4
26.8
32.5
14.7
8.6
As at 31 December 2023
Scenario probability weighting
13.8
24.7
32.4
18.3
10.8
Note
1For further details on changes to scenario weights see page 252.
Specific bases shows the most extreme position of each variable in the context of the downside/upside scenarios, for example, the
highest unemployment for downside scenarios, average unemployment for baseline scenarios and lowest unemployment for upside
scenarios. GDP and HPI downside and upside scenario data represents the lowest and highest cumulative position relative to the start
Average basis represents the average quarterly value of variables in the 20 quarter period with GDP and HPI based on yearly average
and quarterly CAGRs respectively.
Macroeconomic variables (5 year averages) (audited)1
Upside 2
Upside 1
Baseline
Downside 1
Downside 2
As at 31 December 2024
%
%
%
%
%
UK GDP5
2.6
2.0
1.4
0.9
0.5
UK unemployment6
3.7
4.0
4.4
5.3
6.1
UK HPI7
6.4
4.7
3.0
0.8
(1.6)
UK bank rate
3.5
3.9
4.2
3.3
2.4
US GDP5
2.9
2.5
2.2
1.7
1.2
US unemployment6
3.7
3.9
4.2
5.0
5.8
US HPI7
5.4
4.5
3.5
2.4
1.2
US federal funds rate
3.6
4.0
4.2
3.2
2.1
As at 31 December 2023
UK GDP5
2.4
1.7
1.1
0.6
0.1
UK unemployment6
3.7
4.2
4.7
5.2
5.8
UK HPI7
4.4
2.2
0.1
(1.7)
(3.5)
UK bank rate
3.3
3.8
4.2
3.6
2.9
US GDP5
2.8
2.3
1.8
1.4
0.9
US unemployment6
3.6
3.9
4.2
4.8
5.4
US HPI7
5.0
4.3
3.7
2.4
1.2
US federal funds rate
3.6
4.0
4.3
3.9
3.2
Notes:
1UK GDP = Real GDP growth seasonally adjusted; UK unemployment = UK unemployment rate 16-year+; UK HPI = Halifax All Houses, All Buyers Index; US GDP = Real GDP growth
seasonally adjusted; US unemployment = US civilian unemployment rate 16-year+; US HPI = FHFA house price index. 20 quarter period starts from Q124 (2023: Q123).
2Maximum growth relative to Q423 (2023: Q422), based on 20 quarter period in Upside scenarios; 5-year yearly average CAGR in Baseline; minimum growth relative to Q423 (2023:
Q422), based on 20 quarter period in Downside scenarios.
3Lowest quarter in Upside scenarios; 5-year average in Baseline; highest quarter in Downside scenarios. Period based on 20 quarters from Q124 (2023: Q123).
4Maximum growth relative to Q423 (2023: Q422), based on 20 quarter period in Upside scenarios; 5-year quarter end CAGR in Baseline; minimum growth relative to Q423 (2023: Q422),
based on 20 quarter period in Downside scenarios.
55-year yearly average CAGR, starting 2023 (2023: 2022).
65-year average, Period based on 20 quarters from Q124 (2023: Q123).
75-year quarter end CAGR, starting Q423 (2023: Q422).
Strategy
Shareholder
information
Climate and
sustainability report
Governance
Risk
review
Financial
review
Financial
statements
Barclays PLC 2024
Annual Report
on Form 20-F
256
Risk performance - Credit risk (continued)
The graphs below plot the historical data for the quarterly, year on year GDP growth rate (Q v Q-4) and the quarterly unemployment
rate in the UK and US as well as the forecasted data under each of the five scenarios.
UK GDP
(%)
US GDP
(%)
UK unemployment
(%)
US unemployment
(%)
GDP growth based on year on year growth each quarter (Q/(Q-4)).
Strategy
Shareholder
information
Climate and
sustainability report
Governance
Risk
review
Financial
review
Financial
statements
Barclays PLC 2024
Annual Report
on Form 20-F
257
Risk performance - Credit risk (continued)
ECL sensitivity analysis (audited)
The table below shows the modelled ECL assuming each of the five modelled scenarios are 100% weighted with the dispersion of
results around the Baseline, highlighting the impact on exposure and ECL across the scenarios.
Model exposure uses exposure at default (EAD) values and is not directly comparable to gross exposure used in prior disclosures.
Scenarios1
As at 31 December 2024
Weighted2
Upside 2
Upside 1
Baseline
Downside 1
Downside 2
Stage 1 Model exposure (£m)
Retail mortgages
139,086
140,828
140,079
139,188
136,671
134,861
Retail credit cards
63,937
63,821
63,859
63,894
63,980
63,975
Retail other
7,952
8,074
8,025
7,968
7,804
7,614
Corporate loans
213,905
216,064
215,215
214,293
212,007
207,062
Stage 1 Model ECL (£m)
Retail mortgages
1
—
1
1
3
6
Retail credit cards
535
512
523
534
560
586
Retail other
34
32
32
33
36
40
Corporate loans
270
235
247
258
311
363
Stage 1 Coverage (%)
Retail mortgages
—
—
—
—
—
—
Retail credit cards
0.8
0.8
0.8
0.8
0.9
0.9
Retail other
0.4
0.4
0.4
0.4
0.5
0.5
Corporate loans
0.1
0.1
0.1
0.1
0.1
0.2
Stage 2 Model exposure (£m)
Retail mortgages
20,401
18,178
19,072
20,134
23,359
26,339
Retail credit cards
6,904
6,747
6,817
6,889
7,052
7,310
Retail other
1,232
1,110
1,159
1,215
1,380
1,570
Corporate loans
21,197
18,889
19,793
20,827
23,238
28,340
Stage 2 Model ECL (£m)
Retail mortgages
4
1
2
3
8
16
Retail credit cards
1,473
1,387
1,422
1,459
1,567
1,714
Retail other
81
68
72
77
101
134
Corporate loans
532
424
461
505
655
932
Stage 2 Coverage (%)
Retail mortgages
—
—
—
—
—
0.1
Retail credit cards
21.3
20.6
20.9
21.2
22.2
23.4
Retail other
6.6
6.1
6.2
6.3
7.3
8.5
Corporate loans
2.5
2.2
2.3
2.4
2.8
3.3
Stage 3 Model exposure (£m)3
Retail mortgages
1,062
1,062
1,062
1,062
1,062
1,062
Retail credit cards
2,197
2,197
2,197
2,197
2,197
2,197
Retail other
158
158
158
158
158
158
Corporate loans
4,051
4,051
4,051
4,051
4,051
4,051
Stage 3 Model ECL (£m)
Retail mortgages
19
12
14
17
29
41
Retail credit cards
1,625
1,585
1,606
1,627
1,663
1,695
Retail other
92
90
91
92
95
97
Corporate loans4
71
66
67
69
79
89
Stage 3 Coverage (%)
Retail mortgages
1.8
1.1
1.3
1.6
2.7
3.9
Retail credit cards
74.0
72.1
73.1
74.1
75.7
77.2
Retail other
58.2
57.0
57.6
58.2
60.1
61.4
Corporate loans4
1.8
1.6
1.7
1.7
2.0
2.2
Total Model ECL (£m)
Retail mortgages
24
13
17
21
40
63
Retail credit cards
3,633
3,484
3,551
3,620
3,790
3,995
Retail other
207
190
195
202
232
271
Corporate loans4
873
725
775
832
1,045
1,384
Total Model ECL
4,737
4,412
4,538
4,675
5,107
5,713
Strategy
Shareholder
information
Climate and
sustainability report
Governance
Risk
review
Financial
review
Financial
statements
Barclays PLC 2024
Annual Report
on Form 20-F
258
Risk performance - Credit risk (continued)
Reconciliation to total ECL
£m
Total weighted model ECL
4,737
ECL from individually assessed exposures4
461
ECL from non-modelled exposures and others5
358
ECL from debt securities at amortised cost
23
ECL from held for sale assets (co-branded card portfolio)
(282)
ECL from post model management adjustments
235
Of which: ECL from economic uncertainty adjustments
78
Total ECL
5,532
Notes:
1Model exposure and ECL reported within Retail credit cards and Retail Other excludes the German consumer finance business, sale of which completed after the balance sheet date.
Model exposure and ECL reported within Retail credit cards and Corporate loans continues to include a co-branded card portfolio, as the sale is expected to close in 2026.
2Model exposures are allocated to a stage based on an individual scenario rather than a probability-weighted approach, as required for Barclays reported impairment allowances. As a result, it is not
possible to back solve the final reported weighted ECL from individual scenarios given balances may be assigned to a different stage dependent on the scenario.
3Model exposures allocated to Stage 3 does not change in any of the scenarios as the transition criteria relies only on an observable evidence of default as at 31 December 2024 and not on
macroeconomic scenario.
4Material corporate loan defaults are individually assessed across different recovery strategies. As a result, ECL of £461m is reported as an individually assessed impairment in the reconciliation
table.
5ECL from non-modelled exposures and others includes ECL on Tesco Bank of £209m calculated using a benchmarked approach based on UK cards and UK retail loans. The sensitivity
of the non-modelled exposures would materially reflect the sensitivity of the benchmarked model.
The use of five scenarios with associated weighting results in a total weighted ECL uplift from the Baseline ECL of 1.3%.
Retail mortgages:Total weighted ECL of £24m represents a 14.3% increase over the Baseline ECL (£21m) with coverage ratios
remaining steady across the Upside scenarios, Baseline and Downside 1 scenario. Under the Downside 2 scenario, total ECL increases
to £63m driven by a fall in UK HPI.
Retail credit cards:Total weighted ECL of £3,633m is broadly aligned to the Baseline ECL (£3,620m). Total ECL increases to £3,995m
under the Downside 2 scenario, driven by an increase in UK and US unemployment rate.
Retail other:Total weighted ECL of £207m represents a 2.5% increase over the Baseline ECL (£202m). Total ECL increases to £271m
under the Downside 2 scenario, largely driven by an increase in UK unemployment rate.
Corporate loans: Total weighted ECL of £873m represents a 4.9% increase over the Baseline ECL (£832m). Total ECL increases to
£1,384m under the Downside 2 scenario, driven by a decrease in UK and US GDP.
Strategy
Shareholder
information
Climate and
sustainability report
Governance
Risk
review
Financial
review
Financial
statements
Barclays PLC 2024
Annual Report
on Form 20-F
259
Risk performance - Credit risk (continued)
Scenarios1
As at 31 December 2023
Weighted2
Upside 2
Upside 1
Baseline
Downside 1
Downside 2
Stage 1 Model exposure (£m)
Retail mortgages
145,226
147,415
146,653
145,405
142,543
138,925
Retail credit cards
66,512
66,459
66,482
66,497
66,580
66,580
Retail other
8,749
8,915
8,841
8,758
8,631
8,479
Corporate loans
175,282
179,567
177,923
175,903
172,328
167,541
Stage 1 Model ECL (£m)
Retail mortgages
9
4
5
7
11
22
Retail credit cards
562
529
545
561
584
605
Retail other
32
31
32
32
32
31
Corporate loans
275
243
257
270
298
318
Stage 1 Coverage (%)
Retail mortgages
—
—
—
—
—
—
Retail credit cards
0.8
0.8
0.8
0.8
0.9
0.9
Retail other
0.4
0.3
0.4
0.4
0.4
0.4
Corporate loans
0.2
0.1
0.1
0.2
0.2
0.2
Stage 2 Model exposure (£m)
Retail mortgages
20,615
17,769
18,702
20,149
23,836
28,822
Retail credit cards
7,076
6,897
6,976
7,064
7,183
7,387
Retail other
1,382
1,216
1,290
1,373
1,500
1,653
Corporate loans
24,374
19,919
21,621
23,763
27,445
32,375
Stage 2 Model ECL (£m)
Retail mortgages
41
23
27
34
59
123
Retail credit cards
1,684
1,554
1,609
1,668
1,775
1,922
Retail other
85
72
78
84
95
105
Corporate loans
663
509
565
633
782
1,031
Stage 2 Coverage (%)
Retail mortgages
0.2
0.1
0.1
0.2
0.2
0.4
Retail credit cards
23.8
22.5
23.1
23.6
24.7
26.0
Retail other
6.2
5.9
6.0
6.1
6.3
6.4
Corporate loans
2.7
2.6
2.6
2.7
2.8
3.2
Stage 3 Model exposure (£m)3
Retail mortgages
1,672
1,672
1,672
1,672
1,672
1,672
Retail credit cards
1,827
1,827
1,827
1,827
1,827
1,827
Retail other
164
164
164
164
164
164
Corporate loans
3,436
3,436
3,436
3,436
3,436
3,436
Stage 3 Model ECL (£m)
Retail mortgages
333
308
316
325
351
393
Retail credit cards
1,315
1,279
1,296
1,313
1,341
1,366
Retail other
95
94
94
95
96
97
Corporate loans4
77
71
73
75
82
89
Stage 3 Coverage (%)
Retail mortgages
19.9
18.4
18.9
19.4
21.0
23.5
Retail credit cards
72.0
70.0
70.9
71.9
73.4
74.8
Retail other
57.9
57.3
57.3
57.9
58.5
59.1
Corporate loans4
2.2
2.1
2.1
2.2
2.4
2.6
Total Model ECL (£m)
Retail mortgages
383
335
348
366
421
538
Retail credit cards
3,561
3,362
3,450
3,542
3,700
3,893
Retail other
212
197
204
211
223
233
Corporate loans4
1,015
823
895
978
1,162
1,438
Total Model ECL
5,171
4,717
4,897
5,097
5,506
6,102
Strategy
Shareholder
information
Climate and
sustainability report
Governance
Risk
review
Financial
review
Financial
statements
Barclays PLC 2024
Annual Report
on Form 20-F
260
Risk performance - Credit risk (continued)
Reconciliation to total ECL
£m
Total weighted model ECL
5,171
ECL from individually assessed exposures4
401
ECL from non-modelled exposures and others
276
ECL from debt securities at amortised cost
27
ECL from post model management adjustments
377
Of which: ECL from economic uncertainty adjustments
198
Total ECL
6,252
Notes:
1Model exposure and ECL reported within Retail credit cards and Retail other excludes the German consumer finance business portfolio which has now been classified as assets held for
sale.
2Model exposures are allocated to a stage based on an individual scenario rather than a probability-weighted approach, as required for Barclays reported impairment allowances. As a result, it is not
possible to back solve the final reported weighted ECL from individual scenarios given balances may be assigned to a different stage dependent on the scenario.
3Model exposures allocated to Stage 3 does not change in any of the scenarios as the transition criteria relies only on an observable evidence of default as at 31 December 2023 and not on
macroeconomic scenario.
4Material corporate loan defaults are individually assessed across different recovery strategies. As a result, ECL of £401m is reported as an individually assessed impairment in the reconciliation table.
Strategy
Shareholder
information
Climate and
sustainability report
Governance
Risk
review
Financial
review
Financial
statements
Barclays PLC 2024
Annual Report
on Form 20-F
261
Risk performance - Credit risk (continued)
Analysis of the concentration of credit risk
A concentration of credit risk exists when a number of counterparties are located in a common geographical region or are engaged in
similar activities and have similar economic characteristics that would cause their ability to meet contractual obligations to be similarly
affected by changes in economic or other conditions. The Group implements limits on concentrations in order to mitigate the risk.
The table below presents an industry credit risk concentration analysis of loans and advances at amortised cost net of impairment
allowance including breakdown by geographical location of the counterparty or customers, impairment stage, maturity and an indicator
of inclusion in carbon-related sectors. A further table is included with geography, impairment stage and maturity allocation of debt
securities at amortised cost, off- balance sheet commitments and financial guarantees and contingent liabilities at amortised cost.
Further detail on the Group policies with regard to managing concentration risk is presented in the Barclays PLC Pillar 3 Report 2024
(unaudited).
Credit risk concentration by Industry for contractual maturity, staging and geography
Loans and advances at amortised cost net of impairment allowance
Industry
Geography (audited)
Stage (audited)
Maturity
Carbon
related
sectors1
United
Kingdom
Americas
Europe
Others
Total
Stage 1
Stage 2
Stage 3
Total
< 1 year
1-5
Years
>5 years
Total
As at 31 December 2024
£m
£m
£m
£m
£m
£m
£m
£m
£m
£m
£m
£m
£m
Agriculture, Food and
Forest Products
3,430
—
—
—
3,430
2,518
484
428
3,430
769
1,109
1,552
3,430
Yes
Mining and Quarrying
515
708
189
—
1,412
1,335
76
1
1,412
346
1,060
6
1,412
Yes
Manufacturing
3,578
1,418
828
349
6,173
4,764
1,237
172
6,173
3,151
2,715
307
6,173
Yes
Government and central
bank
3,373
—
2
342
3,717
3,674
43
—
3,717
254
291
3,172
3,717
Banks
730
3,573
1,301
2,721
8,325
8,323
2
—
8,325
8,166
159
—
8,325
Energy and water
2,109
401
203
287
3,000
2,537
206
257
3,000
809
1,300
891
3,000
Yes
Materials and Building
18,502
2,816
399
220
21,937
18,987
2,536
414
21,937
4,535
10,944
6,458
21,937
Yes
Wholesale and retail
distribution and leisure
7,934
831
294
616
9,675
7,850
1,565
260
9,675
3,647
4,943
1,085
9,675
Transport and storage
763
421
300
96
1,580
1,321
164
95
1,580
480
925
175
1,580
Yes
Home Loans
166,181
113
899
868
168,061
146,652
19,534
1,875
168,061
1,674
9,585
156,802
168,061
Yes
Business and other services
13,266
5,196
3,646
1,031
23,139
19,301
3,049
789
23,139
6,510
13,524
3,105
23,139
Other Financial Institutions
6,772
30,791
7,121
2,553
47,237
45,689
1,474
74
47,237
16,552
24,002
6,683
47,237
Cards, unsecured loans and
other personal lending
26,745
20,079
994
769
48,587
42,885
5,032
670
48,587
10,505
19,218
18,864
48,587
Total loans and advances
at amortised cost
253,898
66,347
16,176
9,852
346,273
305,836
35,402
5,035
346,273
57,398
89,775
199,100
346,273
Debt securities at
amortised cost³
25,939
19,721
15,558
6,992
68,210
64,976
3,234
—
68,210
7,051
32,631
28,528
68,210
Total loans and advances
at amortised cost
including debt securities
279,837
86,068
31,734
16,844
414,483
370,812
38,636
5,035
414,483
64,449
122,406
227,628
414,483
Contingent liabilities
5,721
10,742
5,514
2,381
24,358
21,028
2,835
495
24,358
24,358
—
—
24,358
Loan commitments
114,458
243,619
41,361
8,361
407,799
391,227
15,893
679
407,799
407,731
68
—
407,799
Total off-balance sheet²
120,179
254,361
46,875
10,742
432,157
412,255
18,728
1,174
432,157
432,089
68
—
432,157
Strategy
Shareholder
information
Climate and
sustainability report
Governance
Risk
review
Financial
review
Financial
statements
Barclays PLC 2024
Annual Report
on Form 20-F
262
Risk performance - Credit risk (continued)
Loans and advances at amortised cost net of impairment allowance
Industry
Geography (audited)
Stage (audited)
Maturity
Carbon
related
sectors¹
United
Kingdom
Americas
Europe
Others
Total
Stage 1
Stage 2
Stage 3
Total
< 1 year
1-5
Years
>5 years
Total
As at 31 December 2023
£m
£m
£m
£m
£m
£m
£m
£m
£m
£m
£m
£m
£m
Agriculture, Food and
Forest Products
3,597
—
—
5
3,602
2,734
611
257
3,602
808
1,071
1,723
3,602
Yes
Mining and Quarrying
490
843
260
121
1,714
1,526
188
—
1,714
814
897
3
1,714
Yes
Manufacturing
4,200
1,279
826
416
6,721
5,036
1,515
170
6,721
2,873
3,522
326
6,721
Yes
Government and central
bank
5,987
—
5
30
6,022
5,975
46
1
6,022
2,218
4
3,800
6,022
Banks
437
3,606
1,520
1,896
7,459
7,458
1
—
7,459
7,365
94
—
7,459
Energy and water
2,181
486
879
180
3,726
3,394
324
8
3,726
750
2,033
943
3,726
Yes
Materials and Building
18,631
2,623
448
118
21,820
18,918
2,318
584
21,820
5,154
9,156
7,510
21,820
Yes
Wholesale and retail
distribution and leisure
7,585
1,061
481
452
9,579
7,099
2,151
329
9,579
3,114
5,169
1,296
9,579
Transport and storage
868
536
182
118
1,704
1,275
395
34
1,704
402
1,046
256
1,704
Yes
Home Loans
166,704
97
3,882
829
171,512
150,152
19,364
1,996
171,512
2,009
10,334
159,169
171,512
Yes
Business and other services
13,802
6,032
3,151
1,021
24,006
19,815
3,726
465
24,006
7,088
12,190
4,728
24,006
Other Financial Institutions
6,093
25,589
6,481
2,546
40,709
38,988
1,613
108
40,709
13,955
22,111
4,643
40,709
Cards, unsecured loans and
other personal lending
17,741
24,317
1,385
730
44,173
38,296
5,173
704
44,173
8,109
15,839
20,225
44,173
Total loans and advances
at amortised cost
248,316
66,469
19,500
8,462
342,747
300,666
37,425
4,656
342,747
54,659
83,466
204,622
342,747
Debt securities at amortised
cost³
26,093
11,681
10,262
8,713
56,749
52,858
3,891
—
56,749
10,061
28,739
17,949
56,749
Total loans and advances
at amortised cost including
debt securities
274,409
78,150
29,762
17,175
399,496
353,524
41,316
4,656
399,496
64,720
112,205
222,571
399,496
Contingent liabilities
5,668
10,262
5,919
2,225
24,074
20,884
2,607
583
24,074
24,073
1
—
24,074
Loan commitments
96,135
227,618
43,397
8,084
375,234
353,179
21,601
454
375,234
375,179
55
—
375,234
Total off-balance sheet²
101,803
237,880
49,316
10,309
399,308
374,063
24,208
1,037
399,308
399,252
56
—
399,308
Notes:
1Refer to Carbon related assets table on page 222 for more details on the "Exposures towards sectors that highly contribute to carbon related assets" under the respective Industry
sectors.
2The Off-balance sheet contingent liabilities and loan commitments excludes the fair value balance of £16,338m in 2024 (2023: £16,469m) and includes exposures relating to financial
assets classified as assets held for sale.
3Debt securities at amortised cost primarily includes £39,699m (2023: £34,237m) in Government and central bank, £24,007m (2023: £16,265m) in other financial institutions, £1,388m
(2023: £2,854m) in materials & building and £1,249m (2023: £1,516m) in Banks.
- For analysis of Debt securities by issuer, refer to "Analysis of Debt Securities" on page 276.
4Loans and advances stage 3 includes POCI assets of £57m .
Strategy
Shareholder
information
Climate and
sustainability report
Governance
Risk
review
Financial
review
Financial
statements
Barclays PLC 2024
Annual Report
on Form 20-F
263
Risk performance - Credit risk (continued)
The approach to management and representation of credit quality
Asset credit quality
The credit quality distribution is based on the IFRS 912-month probability of default (PD) at the reporting date to ensure comparability
with other ECL disclosures in the Expected Credit Losses section.
The following internal measures are used to determine credit quality for loans:
PD Range %
Internal Default
Grade Band
Default Probability
Credit Quality
description
Moody’s
Standard and
Poor’s
>Min
Mid
<=Max
0.00 to < 0.15
1
0.00%
0.01%
0.02%
Strong
Aaa, Aa1, Aa2
AAA, AA+, AA,
AA-
2
0.02%
0.03%
0.03%
Aa3
AA-
3
0.03%
0.04%
0.05%
A1, A2, A3
A+, A
4
0.05%
0.08%
0.10%
A1, A2, A3
A-
5
0.10%
0.13%
0.15%
Baa1
BBB+
0.15 to < 0.25
6
0.15%
0.18%
0.20%
Strong
Baa2
BBB
7
0.20%
0.23%
0.25%
Baa2
BBB-
0.25 to < 0.50
8
0.25%
0.28%
0.30%
Strong
Baa3
BBB-
9
0.30%
0.35%
0.40%
Baa3
BB+
10
0.40%
0.45%
0.50%
Ba1
BB+
0.50 to < 0.75
11
0.50%
0.55%
0.60%
Strong
Ba1
BB
12
0.60%
0.68%
0.75%
Satisfactory
Ba2
BB, BB-
0.75 to < 2.50
12
0.75%
0.98%
1.20%
Satisfactory
Ba2
BB, BB-
13
1.20%
1.38%
1.55%
Ba3
BB-
14
1.55%
1.85%
2.15%
Ba3
B+
15
2.15%
2.33%
2.50%
B1
B+
2.50 to < 10.00
15
2.50%
2.78%
3.05%
Satisfactory
B1
B+
16
3.05%
3.75%
4.45%
B2
B
17
4.45%
5.40%
6.35%
B3, Caa1
B
18
6.35%
7.50%
8.65%
B3, Caa1
B-
19
8.65%
9.32%
10.00%
Caa2
B-
10.00 to < 100.00
19
10.00%
10.67%
11.35%
Satisfactory
Caa2
B-
20
11.35%
15.00%
18.65%
Higher Risk
Caa2
CCC+
21
18.65%
30.00%
99.99%
Higher Risk
Caa3, Ca, C
CCC, CCC-,
CC+, CC, C
100.00 (Default)
22
100%
100%
100%
Credit
Impaired
D
D
For retail clients, a range of analytical tools is used to derive the probability of default of clients at inception and on an ongoing basis.
For loans that are not past due, these descriptions can be summarised as follows:
Strong: there is a very high likelihood of the asset being recovered in full.
Satisfactory: while there is a high likelihood that the asset will be recovered and therefore, of no cause for concern to the Group, the
asset may not be collateralised, or may relate to unsecured retail facilities. At the lower end of this grade there are customers that are
being more carefully monitored, for example, corporate customers which are indicating some evidence of deterioration, home loans
with a high loan to value, and unsecured retail loans operating outside normal product guidelines.
Higher risk: there is concern over the obligor’s ability to make payments when due. However, these have not yet converted to actual
delinquency. There may also be doubts over the value of collateral or security provided. However, the borrower or counterparty is
continuing to make payments when due and is expected to settle all outstanding amounts of principal and interest.
Loans that are past due are monitored closely, with impairment allowances raised as appropriate and in line with the Group’s
impairment policies. These loans are all considered higher risk for the purpose of this analysis of credit quality.
Debt securities
For assets held at fair value, the carrying value on the balance sheet will include, among other things, the credit risk of the issuer. Most
listed and some unlisted securities are rated by external rating agencies. The Group mainly uses external credit ratings provided by
Standard & Poor’s, Fitch or Moody’s. Where such ratings are not available or are not current, the Group will use its own internal ratings
for the securities.
Strategy
Shareholder
information
Climate and
sustainability report
Governance
Risk
review
Financial
review
Financial
statements
Barclays PLC 2024
Annual Report
on Form 20-F
264
Risk performance - Credit risk (continued)
Balance sheet credit quality
The following tables present the credit quality of the Group’s assets exposed to credit risk.
Overview
As at 31 December 2024, the ratio of the Group’s on-balance sheet assets classified as strong (0.0 to <0.60%) remained stable at 86%
(2023: 87%) of total assets exposed to credit risk. Further analysis of debt securities by issuer and issuer type and netting and collateral
arrangements on derivative financial instruments is presented in the Analysis of debt securities section and Analysis of derivatives
section.
Balance sheet credit quality (audited)
PD Range
Total
PD range
Total
0.0 to <0.60%
0.60 to
<11.35%
11.35 to
100%
0.0 to <0.60%
0.60 to
<11.35%
11.35 to
100%
£m
£m
£m
£m
%
%
%
%
As at 31 December 2024
Cash and balances at central banks
210,184
—
—
210,184
100
—
—
100
Cash collateral and settlement balances
104,446
15,371
26
119,843
87
13
—
100
Loans and advances at amortised cost:
Retail mortgages
160,441
5,332
2,288
168,061
96
3
1
100
Retail credit cards
11,157
21,779
1,843
34,779
32
63
5
100
Retail other
6,014
7,390
404
13,808
44
53
3
100
Corporate loans
95,560
29,303
4,762
129,625
73
23
4
100
Total loans and advances at amortised cost
273,172
63,804
9,297
346,273
79
18
3
100
Debt securities at amortised cost
67,645
565
—
68,210
99
1
—
100
Reverse repurchase agreements and other
similar secured lending
2,966
1,768
—
4,734
63
37
—
100
Trading portfolio assets:
Debt securities
65,994
11,478
542
78,014
84
15
1
100
Traded loans
2,543
7,442
3,485
13,470
19
55
26
100
Total trading portfolio assets
68,537
18,920
4,027
91,484
75
21
4
100
Financial assets at fair value through the
income statement:
Loans and advances
25,051
19,444
573
45,068
56
43
1
100
Debt securities
1,756
1,156
53
2,965
59
39
2
100
Reverse repurchase agreements
103,571
37,565
637
141,773
74
26
—
100
Other financial assets
88
22
—
110
80
20
—
100
Total financial assets at fair value through the
income statement
130,466
58,187
1,263
189,916
68
31
1
100
Derivative financial instruments
275,232
18,104
194
293,530
94
6
—
100
Financial assets at fair value through other
comprehensive income
78,005
50
—
78,055
100
—
—
100
Other assets
815
69
7
891
91
8
1
100
Assets held for sale
1,178
8,235
131
9,544
12
87
1
100
Total on-balance sheet
1,212,646
185,073
14,945
1,412,664
86
13
1
100
Strategy
Shareholder
information
Climate and
sustainability report
Governance
Risk
review
Financial
review
Financial
statements
Barclays PLC 2024
Annual Report
on Form 20-F
265
Risk performance - Credit risk (continued)
Balance sheet credit quality (audited)
PD Range
Total
PD range
Total
0.0 to <0.60%
0.60 to
<11.35%
11.35 to
100%
0.0 to <0.60%
0.60 to
<11.35%
11.35 to
100%
£m
£m
£m
£m
%
%
%
%
As at 31 December 2023
Cash and balances at central banks
224,634
—
—
224,634
100
—
—
100
Cash collateral and settlement balances
99,092
9,789
8
108,889
91
9
—
100
Loans and advances at amortised cost:
Retail mortgages
160,647
8,313
2,552
171,512
94
5
1
100
Retail credit cards
10,201
22,322
1,698
34,221
30
65
5
100
Retail other
6,005
3,490
457
9,952
60
35
5
100
Corporate loans
89,972
32,824
4,266
127,062
71
26
3
100
Total loans and advances at amortised cost
266,825
66,949
8,973
342,747
77
20
3
100
Debt securities at amortised cost
56,398
350
1
56,749
99
1
—
100
Reverse repurchase agreements and
other similar secured lending
2,424
170
—
2,594
93
7
—
100
Trading portfolio assets:
Debt securities
65,469
9,642
387
75,498
86
13
1
100
Traded loans
4,006
5,893
2,754
12,653
32
46
22
100
Total trading portfolio assets
69,475
15,535
3,141
88,151
78
18
4
100
Financial assets at fair value through
the income statement:
Loans and advances
30,509
16,852
278
47,639
64
35
1
100
Debt securities
1,449
1,095
42
2,586
56
42
2
100
Reverse repurchase agreements
112,799
35,988
344
149,131
76
24
—
100
Other financial assets
88
22
—
110
80
20
—
100
Total financial assets at fair value through
the income statement
144,845
53,957
664
199,466
73
27
—
100
Derivative financial instruments
245,086
11,616
134
256,836
95
5
—
100
Financial assets at fair value through
other comprehensive income
71,375
455
—
71,830
99
1
—
100
Other assets
2,138
56
3
2,197
97
3
—
100
Assets held for sale
1,110
2,618
127
3,855
29
68
3
100
Total on-balance sheet
1,183,402
161,495
13,051
1,357,948
87
12
1
100
Strategy
Shareholder
information
Climate and
sustainability report
Governance
Risk
review
Financial
review
Financial
statements
Barclays PLC 2024
Annual Report
on Form 20-F
266
Risk performance - Credit risk (continued)
Credit exposures by internal PD grade
The below tables represent credit risk profiles by PD grade for loans and advances at amortised cost, contingent liabilities and loan
commitments.
Stage 1 higher risk assets, presented gross of associated collateral held, are of weaker credit quality but have not significantly
deteriorated since origination.
IFRS 9 Stage 1 and Stage 2 classification is not dependent solely on the absolute probability of default but on elements that determine a
Significant Increase in Credit Risk, including relative movement in probability of default since initial recognition. There is therefore no
direct relationship between credit quality and IFRS 9 stage classification.
Credit risk profile by internal PD grade for retail mortgages (audited)
Gross carrying amount
Allowance for ECL
Net
exposure
Coverage
ratio
Grading
PD range
Credit
quality
description
Stage 1
Stage 2
Stage 3
excluding
POCI
Stage 3
POCI
Total
Stage 1
Stage 2
Stage 3
excluding
POCI
Stage 3
POCI
Total
%
£m
£m
£m
£m
£m
£m
£m
£m
£m
£m
£m
%
As at 31 December 2024
1 - 3
0.0 to <0.05%
Strong
26,799
649
—
—
27,448
1
—
—
—
1
27,447
—
4 - 5
0.05 to <0.15%
Strong
90,420
6,864
—
—
97,284
16
3
—
—
19
97,265
—
6 - 8
0.15 to <0.30%
Strong
18,574
4,417
—
—
22,991
8
6
—
—
14
22,977
0.1
9 - 11
0.30 to <0.60%
Strong
9,829
2,945
—
—
12,774
12
10
—
—
22
12,752
0.2
12 - 14
0.60 to <2.15%
Satisfactory
863
2,741
—
—
3,604
1
19
—
—
20
3,584
0.6
15 - 19
2.15 to <11.35%
Satisfactory
83
1,681
—
—
1,764
—
16
—
—
16
1,748
0.9
20 - 21
11.35 to <100%
Higher Risk
122
299
—
—
421
—
8
—
—
8
413
1.9
22
100%
Credit
Impaired
—
—
1,962
—
1,962
—
—
87
—
87
1,875
4.4
Total
146,690
19,596
1,962
—
168,248
38
62
87
—
187
168,061
0.1
Credit risk profile by internal PD grade for retail credit cards3 (audited)
Gross carrying amount
Allowance for ECL
Net
exposure
Coverage
ratio
Grading
PD Range
Credit
quality
description
Stage 1
Stage 2
Stage 3
excluding
POCI
Stage 3
POCI
Total
Stage 1
Stage 2
Stage 3
excluding
POCI
Stage 3
POCI
Total
%
£m
£m
£m
£m
£m
£m
£m
£m
£m
£m
£m
%
As at 31 December 2024
1 - 3
0.0 to <0.05%
Strong
119
—
—
—
119
—
—
—
—
—
119
—
4 - 5
0.05 to <0.15%
Strong
1,706
4
—
—
1,710
2
—
—
—
2
1,708
0.1
6 - 8
0.15 to <0.30%
Strong
3,592
5
—
—
3,597
9
—
—
—
9
3,588
0.3
9 - 11
0.30 to <0.60%
Strong
5,758
10
—
—
5,768
26
—
—
—
26
5,742
0.5
12 - 14
0.60 to <2.15%
Satisfactory
10,298
171
—
—
10,469
179
12
—
—
191
10,278
1.8
15 - 19
2.15 to <11.35%
Satisfactory
9,330
2,907
—
—
12,237
290
446
—
—
736
11,501
6.0
20 - 21
11.35 to <100%
Higher Risk
323
1,920
—
—
2,243
47
789
—
—
836
1,407
37.3
22
100%
Credit
Impaired
—
—
1,903
40
1,943
—
—
1,507
—
1,507
436
77.6
Total
31,126
5,017
1,903
40
38,086
553
1,247
1,507
—
3,307
34,779
8.7
Credit risk profile by internal PD grade for retail other3 (audited)
Gross carrying amount
Allowance for ECL
Net
exposure
Coverage
ratio
Grading
PD Range
Credit
quality
description
Stage 1
Stage 2
Stage 3
excluding
POCI
Stage 3
POCI
Total
Stage 1
Stage 2
Stage 3
excluding
POCI
Stage 3
POCI
Total
%
£m
£m
£m
£m
£m
£m
£m
£m
£m
£m
£m
%
As at 31 December 2024
1 - 3
0.0 to <0.05%
Strong
76
1
—
—
77
1
—
—
—
1
76
1.3
4 - 5
0.05 to <0.15%
Strong
575
5
—
—
580
2
—
—
—
2
578
0.3
6 - 8
0.15 to <0.30%
Strong
774
6
—
—
780
4
—
—
—
4
776
0.5
9 - 11
0.30 to <0.60%
Strong
4,539
59
—
—
4,598
11
3
—
—
14
4,584
0.3
12 - 14
0.60 to <2.15%
Satisfactory
5,762
239
—
—
6,001
82
10
—
—
92
5,909
1.5
15 - 19
2.15 to <11.35%
Satisfactory
656
887
—
—
1,543
21
41
—
—
62
1,481
4.0
20 - 21
11.35 to <100%
Higher Risk
68
176
—
—
244
17
57
—
—
74
170
30.3
22
100%
Credit
Impaired
—
—
378
17
395
—
—
161
—
161
234
40.8
Total
12,450
1,373
378
17
14,218
138
111
161
—
410
13,808
2.9
Strategy
Shareholder
information
Climate and
sustainability report
Governance
Risk
review
Financial
review
Financial
statements
Barclays PLC 2024
Annual Report
on Form 20-F
267
Risk performance - Credit risk (continued)
Credit risk profile by internal PD grade for corporate loans3 (audited)
Gross carrying amount
Allowance for ECL
Net
exposure
Coverage
ratio
Grading
PD Range
Credit
quality
description
Stage 1
Stage 2
Stage 3
excluding
POCI
Stage 3
POCI
Total
Stage 1
Stage 2
Stage 3
excluding
POCI
Stage 3
POCI
Total
%
£m
£m
£m
£m
£m
£m
£m
£m
£m
£m
£m
%
As at 31 December 2024
1 - 3
0.0 to <0.05%
Strong
41,412
228
3
—
41,643
6
1
2
—
9
41,634
—
4 - 5
0.05 to <0.15%
Strong
24,082
145
—
—
24,227
10
—
—
—
10
24,217
—
6 - 8
0.15 to <0.30%
Strong
11,933
575
—
—
12,508
9
2
—
—
11
12,497
0.1
9 - 11
0.30 to <0.60%
Strong
16,861
377
—
—
17,238
23
3
—
—
26
17,212
0.2
12 - 14
0.60 to <2.15%
Satisfactory
16,673
3,766
—
—
20,439
79
44
—
—
123
20,316
0.6
15 - 19
2.15 to <11.35%
Satisfactory
5,331
3,857
—
—
9,188
73
128
—
—
201
8,987
2.2
20 - 21
11.35 to <100%
Higher Risk
216
2,219
—
—
2,435
9
153
—
—
162
2,273
6.7
22
100%
Credit
Impaired
—
—
3,113
—
3,113
—
—
624
—
624
2,489
20.0
Total
116,508
11,167
3,116
—
130,791
209
331
626
—
1,166
129,625
0.9
Credit risk profile by internal PD grade for loans and advances at amortised cost3 (audited)
Gross carrying amount
Allowance for ECL
Net
exposure
Coverage
ratio
Grading
PD Range
Credit
quality
description
Stage 1
Stage 2
Stage 3
excluding
POCI
Stage 3
POCI
Total
Stage 1
Stage 2
Stage 3
excluding
POCI
Stage 3
POCI
Total
%
£m
£m
£m
£m
£m
£m
£m
£m
£m
£m
£m
%
As at 31 December 2024
1 - 3
0.0 to <0.05%
Strong
68,406
878
3
—
69,287
8
1
2
—
11
69,276
—
4 - 5
0.05 to <0.15%
Strong
116,783
7,018
—
—
123,801
30
3
—
—
33
123,768
—
6 - 8
0.15 to <0.30%
Strong
34,873
5,003
—
—
39,876
30
8
—
—
38
39,838
0.1
9 - 11
0.30 to <0.60%
Strong
36,987
3,391
—
—
40,378
72
16
—
—
88
40,290
0.2
12 - 14
0.60 to <2.15%
Satisfactory
33,596
6,917
—
—
40,513
341
85
—
—
426
40,087
1.1
15 - 19
2.15 to <11.35%
Satisfactory
15,400
9,332
—
—
24,732
384
631
—
—
1,015
23,717
4.1
20 - 21
11.35 to <100%
Higher Risk
729
4,614
—
—
5,343
73
1,007
—
—
1,080
4,263
20.2
22
100%
Credit
Impaired
—
—
7,356
57
7,413
—
—
2,379
—
2,379
5,034
32.1
Total
306,774
37,153
7,359
57
351,343
938
1,751
2,381
—
5,070
346,273
1.4
Credit risk profile by internal PD grade for retail mortgages (audited)
Gross carrying amount
Allowance for ECL
Net
exposure
Coverage
ratio
Grading
PD Range
Credit
quality
description
Stage 1
Stage 2
Stage 3
excluding
POCI
Stage 3
POCI
Total
Stage 1
Stage 2
Stage 3
excluding
POCI
Stage 3
POCI
Total
%
£m
£m
£m
£m
£m
£m
£m
£m
£m
£m
£m
%
As at 31 December 2023
1 - 3
0.0 to <0.05%
Strong
25,759
587
—
—
26,346
1
—
—
—
1
26,345
—
4 - 5
0.05 to <0.15%
Strong
58,656
3,386
—
—
62,042
12
2
—
—
14
62,028
—
6 - 8
0.15 to <0.30%
Strong
51,292
7,235
—
—
58,527
18
8
—
—
26
58,501
—
9 - 11
0.30 to <0.60%
Strong
11,350
2,447
—
—
13,797
12
12
—
—
24
13,773
0.2
12 - 14
0.60 to <2.15%
Satisfactory
2,833
3,114
—
—
5,947
6
25
—
—
31
5,916
0.5
15 - 19
2.15 to <11.35%
Satisfactory
194
2,243
—
—
2,437
1
39
—
—
40
2,397
1.6
20 - 21
11.35 to <100%
Higher Risk
118
457
—
—
575
—
19
—
—
19
556
3.3
22
100%
Credit
Impaired
—
—
2,424
—
2,424
—
—
428
—
428
1,996
17.7
Total
150,202
19,469
2,424
—
172,095
50
105
428
—
583
171,512
0.3
Strategy
Shareholder
information
Climate and
sustainability report
Governance
Risk
review
Financial
review
Financial
statements
Barclays PLC 2024
Annual Report
on Form 20-F
268
Risk performance - Credit risk (continued)
Credit risk profile by internal PD grade for retail credit cards3 (audited)
Gross carrying amount
Allowance for ECL
Net
exposure
Coverage
ratio
Grading
PD Range
Credit
quality
description
Stage 1
Stage 2
Stage 3
excluding
POCI
Stage 3
POCI
Total
Stage 1
Stage 2
Stage 3
excluding
POCI
Stage 3
POCI
Total
%
£m
£m
£m
£m
£m
£m
£m
£m
£m
£m
£m
%
As at 31 December 2023
1 - 3
0.0 to <0.05%
Strong
133
—
—
—
133
—
—
—
—
—
133
—
4 - 5
0.05 to <0.15%
Strong
1,463
4
—
—
1,467
2
—
—
—
2
1,465
0.1
6 - 8
0.15 to <0.30%
Strong
3,374
6
—
—
3,380
9
—
—
—
9
3,371
0.3
9 - 11
0.30 to <0.60%
Strong
5,248
11
—
—
5,259
27
—
—
—
27
5,232
0.5
12 - 14
0.60 to <2.15%
Satisfactory
11,010
173
—
—
11,183
137
14
—
—
151
11,032
1.4
15 - 19
2.15 to <11.35%
Satisfactory
8,867
3,436
—
—
12,303
314
699
—
—
1,013
11,290
8.2
20 - 21
11.35 to <100%
Higher Risk
314
1,948
—
—
2,262
34
917
—
—
951
1,311
42.0
22
100%
Credit
Impaired
—
—
1,720
—
1,720
—
—
1,333
—
1,333
387
77.5
Total
30,409
5,578
1,720
—
37,707
523
1,630
1,333
—
3,486
34,221
9.2
Credit risk profile by internal PD grade for retail other3 (audited)
Gross carrying amount
Allowance for ECL
Net
exposure
Coverage
ratio
Grading
PD Range
Credit
quality
description
Stage 1
Stage 2
Stage 3
excluding
POCI
Stage 3
POCI
Total
Stage 1
Stage 2
Stage 3
excluding
POCI
Stage 3
POCI
Total
%
£m
£m
£m
£m
£m
£m
£m
£m
£m
£m
£m
%
As at 31 December 2023
1 - 3
0.0 to <0.05%
Strong
67
—
—
—
67
1
—
—
—
1
66
1.5
4 - 5
0.05 to <0.15%
Strong
569
4
—
—
573
1
—
—
—
1
572
0.2
6 - 8
0.15 to <0.30%
Strong
964
6
—
—
970
2
—
—
—
2
968
0.2
9 - 11
0.30 to <0.60%
Strong
4,369
50
—
—
4,419
16
4
—
—
20
4,399
0.5
12 - 14
0.60 to <2.15%
Satisfactory
1,899
241
—
—
2,140
15
15
—
—
30
2,110
1.4
15 - 19
2.15 to <11.35%
Satisfactory
583
862
—
—
1,445
22
43
—
—
65
1,380
4.5
20 - 21
11.35 to <100%
Higher Risk
18
180
—
—
198
2
56
—
—
58
140
29.3
22
100%
Credit
Impaired
—
—
493
—
493
—
—
176
—
176
317
35.7
Total
8,469
1,343
493
—
10,305
59
118
176
—
353
9,952
3.4
Credit risk profile by internal PD grade for corporate loans (audited)
Gross carrying amount
Allowance for ECL
Net
exposure
Coverage
ratio
Grading
PD Range
Credit
quality
description
Stage 1
Stage 2
Stage 3
excluding
POCI
Stage 3
POCI
Total
Stage 1
Stage 2
Stage 3
excluding
POCI
Stage 3
POCI
Total
%
£m
£m
£m
£m
£m
£m
£m
£m
£m
£m
£m
%
As at 31 December 2023
1 - 3
0.0 to <0.05%
Strong
36,981
146
4
—
37,131
4
—
2
—
6
37,125
—
4 - 5
0.05 to <0.15%
Strong
23,344
92
—
—
23,436
15
—
—
—
15
23,421
0.1
6 - 8
0.15 to <0.30%
Strong
10,833
346
—
—
11,179
9
3
—
—
12
11,167
0.1
9 - 11
0.30 to <0.60%
Strong
17,914
390
—
—
18,304
41
4
—
—
45
18,259
0.2
12 - 14
0.60 to <2.15%
Satisfactory
17,433
4,694
—
—
22,127
106
68
—
—
174
21,953
0.8
15 - 19
2.15 to <11.35%
Satisfactory
5,779
5,360
—
—
11,139
101
167
—
—
268
10,871
2.4
20 - 21
11.35 to <100%
Higher Risk
221
2,274
—
—
2,495
11
172
—
—
183
2,312
7.3
22
100%
Credit
Impaired
—
—
2,550
—
2,550
—
—
596
—
596
1,954
23.4
Total
112,505
13,302
2,554
—
128,361
287
414
598
—
1,299
127,062
1.0
Strategy
Shareholder
information
Climate and
sustainability report
Governance
Risk
review
Financial
review
Financial
statements
Barclays PLC 2024
Annual Report
on Form 20-F
269
Risk performance - Credit risk (continued)
Credit risk profile by internal PD grade for loans and advances at amortised cost3 (audited)
Gross carrying amount
Allowance for ECL
Net
exposure
Coverage
ratio
Grading
PD Range
Credit
quality
description
Stage 1
Stage 2
Stage 3
excluding
POCI
Stage 3
POCI
Total
Stage 1
Stage 2
Stage 3
excluding
POCI
Stage 3
POCI
Total
%
£m
£m
£m
£m
£m
£m
£m
£m
£m
£m
£m
%
As at 31 December 2023
1 - 3
0.0 to <0.05%
Strong
62,940
733
4
—
63,677
6
—
2
—
8
63,669
—
4 - 5
0.05 to <0.15%
Strong
84,032
3,486
—
—
87,518
30
2
—
—
32
87,486
—
6 - 8
0.15 to <0.30%
Strong
66,463
7,593
—
—
74,056
38
11
—
—
49
74,007
0.1
9 - 11
0.30 to <0.60%
Strong
38,881
2,898
—
—
41,779
96
20
—
—
116
41,663
0.3
12 - 14
0.60 to <2.15%
Satisfactory
33,175
8,222
—
—
41,397
264
122
—
—
386
41,011
0.9
15 - 19
2.15 to <11.35%
Satisfactory
15,423
11,901
—
—
27,324
438
948
—
—
1,386
25,938
5.1
20 - 21
11.35 to <100%
Higher Risk
671
4,859
—
—
5,530
47
1,164
—
—
1,211
4,319
21.9
22
100%
Credit
Impaired
—
—
7,187
—
7,187
—
—
2,533
—
2,533
4,654
35.2
Total
301,585
39,692
7,191
—
348,468
919
2,267
2,535
—
5,721
342,747
1.6
Credit risk profile by internal PD grade for contingent liabilities1 (audited)
Gross carrying amount
Allowance for ECL
Net
exposure
Coverage
ratio
Grading
PD range
Credit
quality
description
Stage 1
Stage 2
Stage 3
excluding
POCI
Stage 3
POCI
Total
Stage 1
Stage 2
Stage 3
excluding
POCI
Stage 3
POCI
Total
%
£m
£m
£m
£m
£m
£m
£m
£m
£m
£m
£m
%
As at December 31, 2024
1-3
0.0 to <0.05%
Strong
8,132
310
—
—
8,442
1
1
—
—
2
8,440
—
4-5
0.05 to <0.15%
Strong
4,934
—
—
—
4,934
2
—
—
—
2
4,932
—
6-8
0.15 to <0.30%
Strong
2,717
391
—
—
3,108
2
—
—
—
2
3,106
0.1
9-11
0.30 to <0.60%
Strong
2,177
119
—
—
2,296
4
—
—
—
4
2,292
0.2
12-14
0.60 to <2.15%
Satisfactory
2,309
563
—
—
2,872
12
7
—
—
19
2,853
0.7
15-19
2.15 to <11.35%
Satisfactory
730
937
—
—
1,667
22
36
—
—
58
1,609
3.5
20-21
11.35 to <100%
Higher Risk
29
515
—
—
544
—
82
—
—
82
462
15.1
22
100%
Credit
Impaired
—
—
495
—
495
—
—
16
—
16
479
3.2
Total
21,028
2,835
495
—
24,358
43
126
16
—
185
24,173
0.8
Credit risk profile by internal PD grade for contingent liabilities1 (audited)
Gross carrying amount
Allowance for ECL
Net
exposure
Coverage
ratio
Grading
PD range
Credit
quality
description
Stage 1
Stage 2
Stage 3
excluding
POCI
Stage 3
POCI
Total
Stage 1
Stage 2
Stage 3
excluding
POCI
Stage 3
POCI
Total
%
£m
£m
£m
£m
£m
£m
£m
£m
£m
£m
£m
%
As at December 31, 2023
1-3
0.0 to <0.05%
Strong
7,582
79
—
—
7,661
1
—
—
—
1
7,660
—
4-5
0.05 to <0.15%
Strong
3,337
3
—
—
3,340
2
—
—
—
2
3,338
0.1
6-8
0.15 to <0.30%
Strong
3,211
157
—
—
3,368
3
1
—
—
4
3,364
0.1
9-11
0.30 to <0.60%
Strong
2,848
285
—
—
3,133
3
4
—
—
7
3,126
0.2
12-14
0.60 to <2.15%
Satisfactory
2,388
701
—
—
3,089
8
6
—
—
14
3,075
0.5
15-19
2.15 to <11.35%
Satisfactory
1,501
1,027
—
—
2,528
29
41
—
—
70
2,458
2.8
20-21
11.35 to <100%
Higher Risk
17
355
—
—
372
1
61
—
—
62
310
16.7
22
100%
Credit
Impaired
—
—
583
—
583
—
—
22
—
22
561
3.8
Total
20,884
2,607
583
—
24,074
47
113
22
—
182
23,892
0.8
Strategy
Shareholder
information
Climate and
sustainability report
Governance
Risk
review
Financial
review
Financial
statements
Barclays PLC 2024
Annual Report
on Form 20-F
270
Risk performance - Credit risk (continued)
Credit risk profile by internal PD grade for loan commitments1 (audited)
Gross carrying amount
Allowance for ECL
Net
exposure
Coverage
ratio
Grading
PD range
Credit
quality
description
Stage 1
Stage 2
Stage 3
excluding
POCI
Stage 3
POCI
Total
Stage 1
Stage 2
Stage 3
excluding
POCI
Stage 3
POCI
Total
%
£m
£m
£m
£m
£m
£m
£m
£m
£m
£m
£m
%
As at 31 December 2024
1-3
0.0 to <0.05%
Strong
92,589
342
—
—
92,931
3
—
—
—
3
92,928
—
4-5
0.05 to <0.15%
Strong
82,489
342
—
—
82,831
8
—
—
—
8
82,823
—
6-8
0.15 to <0.30%
Strong
63,004
1,071
—
—
64,075
12
1
—
—
13
64,062
—
9-11
0.30 to <0.60%
Strong
70,770
904
—
—
71,674
19
1
—
—
20
71,654
—
12-14
0.60 to <2.15%
Satisfactory
68,038
3,179
—
—
71,217
36
12
—
—
48
71,169
0.1
15-19
2.15 to <11.35%
Satisfactory
13,633
6,535
—
—
20,168
41
50
—
—
91
20,077
0.5
20-21
11.35 to <100%
Higher Risk
704
3,520
—
—
4,224
2
60
—
—
62
4,162
1.5
22
100%
Credit
Impaired
—
—
673
6
679
—
—
9
—
9
670
1.3
Total
391,227
15,893
673
6
407,799
121
124
9
—
254
407,545
0.1
Credit risk profile by internal PD grade for loan commitments1 (audited)
Gross carrying amount
Allowance for ECL
Net
exposure
Coverage
ratio
Grading
PD range
Credit
quality
description
Stage 1
Stage 2
Stage 3
excluding
POCI
Stage 3
POCI
Total
Stage 1
Stage 2
Stage 3
excluding
POCI
Stage 3
POCI
Total
%
£m
£m
£m
£m
£m
£m
£m
£m
£m
£m
£m
%
As at December 31, 2023
1-3
0.0 to <0.05%
Strong
77,689
715
—
—
78,404
2
—
—
—
2
78,402
—
4-5
0.05 to <0.15%
Strong
75,399
479
—
—
75,878
6
1
—
—
7
75,871
—
6-8
0.15 to <0.30%
Strong
63,545
2,798
—
—
66,343
12
1
—
—
13
66,330
—
9-11
0.30 to <0.60%
Strong
66,423
1,441
—
—
67,864
22
2
—
—
24
67,840
—
12-14
0.60 to <2.15%
Satisfactory
54,686
4,177
—
—
58,863
38
15
—
—
53
58,810
0.1
15-19
2.15 to <11.35%
Satisfactory
14,690
8,275
—
—
22,965
40
71
—
—
111
22,854
0.5
20-21
11.35 to <100%
Higher Risk
747
3,716
—
—
4,463
6
84
—
—
90
4,373
2.0
22
100%
Credit
Impaired
—
—
454
—
454
—
—
22
—
22
432
4.8
Total
353,179
21,601
454
—
375,234
126
174
22
—
322
374,912
0.1
Notes:
1 Excludes loan commitments and financial guarantees of £16.3bn (2023: £16.5bn) carried at fair value.
2 Reported off-balance sheet loan commitments reported also include exposures relating to financial assets classified as assets held for sale.
3Exposures reported within Retail credit cards, Retail other and Corporate loans does not include the German consumer finance business and a co-branded card portfolio (2024) which is
classified as assets held for sale.
Strategy
Shareholder
information
Climate and
sustainability report
Governance
Risk
review
Financial
review
Financial
statements
Barclays PLC 2024
Annual Report
on Form 20-F
271
Risk performance - Credit risk (continued)
Analysis of specific portfolios and asset types
This section provides an analysis of principal portfolios and businesses, in particular, home loans, credit cards, unsecured loans and
other retail lending.
Secured home loans
The UK home loans portfolio comprises first lien home loans and accounts for 97% (2023: 95%) of the Group’s total home loan
balances.
Home loans principal portfolios
Barclays UK
As at 31 December
2024
2023
Gross loans and advances (£m)
163,197
163,639
>90 day arrears, excluding recovery book (%)
0.2
0.2
Annualised gross charge-off rates (%)
0.5
0.5
Recovery book proportion of outstanding balances (%)
0.6
0.6
Recovery book impairment coverage ratio (%)1
3.7
7.2
Note:
1Recovery Book Impairment Coverage Ratio excludes KMC.
Within the UK home loans portfolio:
•Gross loans and advances decreased by £0.4bn (0.3%) reflecting a £2.0bn (10.3%) decrease in Buy to Let, partially offset by a £1.6bn
(1.1%) increase in Residential.
•Owner-occupied interest-only home loans comprised 15% (2023: 17%) of total balances. The average balance weighted LTV on
owner occupied loans decreased to 52.7% (2023: 53.1%).
•BTL home loans comprised 11.0% (2023: 12.3%) of total balances. In BTL, the average balance weighted LTV decreased to 55.7%
(2023: 56.9%).
Home loans principal portfolios - distribution of balances by LTV1
Distribution of Balances
Distribution of impairment allowance
Coverage ratio
Stage 1
Stage 2
Stage 3
Total
Stage 1
Stage 2
Stage 3
Total
Stage 1
Stage 2
Stage 3
Total
Barclays UK
%
%
%
%
%
%
%
%
%
%
%
%
As at 31 December 2024
<=75%
74.5
10.7
0.9
86.1
8.3
15.8
18.7
42.8
—
0.1
1.8
—
>75% and <=90%
11.8
1.2
0.1
13.1
10.2
24.2
9.7
44.1
0.1
1.7
13.0
0.3
>90% and <=100%
0.8
—
—
0.8
1.3
2.3
4.0
7.6
0.1
4.9
35.8
0.8
>100%
—
—
—
—
0.2
1.4
3.9
5.5
1.6
45.9
68.7
24.8
As at 31 December 2023
<=75%
73.5
10.4
0.9
84.8
8.5
16.2
26.7
51.4
—
0.2
3.8
0.1
>75% and <=90%
12.3
1.2
0.1
13.6
7.4
16.7
12.8
36.9
0.1
1.9
27.9
0.4
>90% and <=100%
1.5
0.1
—
1.6
1.2
2.5
3.6
7.3
0.1
2.6
63.3
0.6
>100%
—
—
—
—
0.3
0.7
3.4
4.4
1.0
12.1
100.0
12.4
Note:
1Portfolio marked to market based on the most updated valuation including recovery book balances. Updated valuations reflect the application of the latest HPI available as at
31 December 2024.
Strategy
Shareholder
information
Climate and
sustainability report
Governance
Risk
review
Financial
review
Financial
statements
Barclays PLC 2024
Annual Report
on Form 20-F
272
Risk performance - Credit risk (continued)
Home loans principal portfolios – average LTV
Barclays UK
As at 31 December
2024
2023
Overall portfolio LTV (%):
Balance weighted %
53.0
53.6
Valuation weighted %
39.7
40.0
For >100% LTVs:
Balances £m
30
75
Marked to market collateral £m
26
65
Average LTV: Balance weighted %
190.3
146.7
Average LTV: Valuation weighted %
142.0
123.6
% of Balances in Recoveries
30.7
11.5
Home loans principal portfolios - new lending
Barclays UK
As at 31 December 2024
2024
2023
New Home loan bookings (£m)
23,895
22,669
New home loan proportion above 90% LTV (%)
0.9
0.6
Average LTV on new home loan: balance weighted (%)
65.5
62.6
Average LTV on new home loan: valuation weighted (%)
56.3
53.8
New home loans bookings increased 5% to £23.9bn (2023: £22.7bn), mainly driven by interest rate reductions leading to lower
mortgage pricing and a corresponding increase in mortgage affordability and demand, along with a strategy to increase mortgage
market share.
Head Office: Italian home loans balances reduced to £0.4bn (2023: £3.6bn) due to the disposal of the performing portfolio in Q224 and
the disposal of the majority of loans in the non-performing portfolio in Q424. The residual portfolio is secured on residential property
with an average balance weighted marked to market LTV of 86.3% (2023: 55.6%). 90-day arrears increased to 3.1% (2023: 2.4%)
due to a decrease in the portfolio credit quality given the majority of the disposed assets were performing. The gross charge-off rate
was 0.9% (2023: 0.7%).The residual portfolio includes a Swiss-Franc linked portfolio of £0.2bn (2023: £0.3bn).
Strategy
Shareholder
information
Climate and
sustainability report
Governance
Risk
review
Financial
review
Financial
statements
Barclays PLC 2024
Annual Report
on Form 20-F
273
Risk performance - Credit risk (continued)
Retail Credit Cards and Retail Other
The principal portfolios listed below accounted for 91% (2023: 91%) of the Group’s total retail credit cards and retail other.
Retail Credit Cards and Retail Other
Gross exposure
30 day arrears rate,
excluding
recoveries book
90 day arrears rate,
excluding
recoveries book
Annualised gross
write-off rates
Annualised net
write-off rates
£m
%
%
%
%
As at 31 December 2024
Barclays UK
UK cards1
15,781
0.7
0.2
1.1
0.9
UK cards – excluding Tesco Bank cards
11,611
0.7
0.2
1.4
1.1
Tesco Bank cards1
4,170
0.8
0.3
0.1
0.1
UK personal loans1
8,051
1.0
0.4
0.7
0.5
UK personal loans – excluding Tesco Bank personal loans
3,993
1.4
0.6
1.3
1.0
Tesco Bank personal loans1
4,058
0.5
0.2
0.1
0.0
Barclays Partner Finance
1,609
0.6
0.3
1.0
1.0
Barclays US Consumer Bank
US cards2
28,548
3.0
1.6
3.8
3.7
As at 31 December 2023
Barclays UK
UK cards
10,420
0.9
0.2
1.4
1.3
UK personal loans
3,641
1.5
0.6
1.3
1.0
Barclays Partner Finance
2,344
0.6
0.3
0.7
0.7
Barclays US Consumer Bank
US cards
27,286
2.9
1.5
2.3
2.3
Notes:
1Tesco Bank arrears rates calculated using POCI balances adjusted to fair value. This has the impact of reducing the Tesco Bank arrears rates.
2Includes a co-branded card portfolio, classified as held for sale (see table below)
Retail Credit Cards and Retail Other held for sale
Gross exposure
30 day arrears rate,
excluding
recoveries book
90 day arrears rate,
excluding
recoveries book
Annualised gross
write-off rates
Annualised net
write-off rates
As at 31 December 2024
Barclays US Consumer Bank
6,241
1.3
0.5
2.0
2.0
Head Office - German consumer finance business
3,733
1.8
0.9
1.3
1.2
As at 31 December 2023
Head Office - German consumer finance business
4,094
1.7
0.8
1.0
1.0
UK cards: Gross exposure increased from £10.4bn to £15.8bn due to the acquisition of Tesco Bank (£4.2bn) and growth in spend and
promotional balances. The inclusion of Tesco Bank had limited impact on arrears rates. Excluding Tesco Bank, 30 day arrears rates
reduced to 0.7% (2023: 0.9%) following lower inflow whilst 90 day arrears rates remained stable at 0.2% (2023: 0.2%). Gross and net
write off rates reduced to 1.1% (2023: 1.4%) and 0.9% (2023: 1.3%) reflecting limited write offs in the Tesco Bank cards portfolio post
the acquisition. Excluding Tesco Bank, gross and net write off rates remained relatively stable at 1.4% (2023: 1.4%) and 1.1% (2023:
1.3%) respectively.
UK personal loans: Gross exposure increased from £3.6bn to £8.1bn due to the purchase of Tesco Bank (£4.1bn) and growth in new
lending. 30 and 90 day arrears rates reduced to 1.0% (2023: 1.5%) and 0.4% (2023: 0.6%) respectively, reflecting the inclusion of Tesco
Bank. Excluding Tesco Bank, 30 and 90 day arrears rates remained broadly stable at 1.4% (2023: 1.5%) and 0.6% (2023: 0.6%)
respectively. Gross and net write off rates reduced to 0.7% (2023: 1.3%) and 0.5% (2023: 1.0%) reflecting limited write offs in the Tesco
Bank loans portfolio post the acquisition. Excluding Tesco Bank, gross and net write off rates remained stable at 1.3% (2023: 1.3%) and
1.0% (2023: 1.0%) respectively.
Barclays Partner Finance: 30 and 90 day arrears rates remained stable at 0.6% (2023: 0.6%) and 0.3% (2023: 0.3%) respectively. Total
exposure fell to £1.6bn (2023: £2.3bn) due to a strategic decision to reduce the number of active partner businesses. Both annualised
gross and net write off rates increased to 1.0% (2023: 0.7%) following the reduction in gross exposure.
US cards: 30 and 90 day arrears rates increased to 3.0% (2023: 2.9%) and 1.6% (2023: 1.5%) respectively due to higher flow into and
through delinquency. The increase in both gross and net write-off rates reflected the overall delinquency trends through to charge-off
lagged by the charge off to write-off period of 12 months as well as a sale in the year.
German consumer finance business: Gross exposure decreased 8.8% as loan originations were limited to existing customers
following the discontinuation of Open Market loan originations in 2023. Cards origination strategy moved to a more profitable revolver
customer segment in 2024 resulting in expected increases in 30 and 90 day arrears and write-offs rates.
Strategy
Shareholder
information
Climate and
sustainability report
Governance
Risk
review
Financial
review
Financial
statements
Barclays PLC 2024
Annual Report
on Form 20-F
274
Risk performance - Credit risk (continued)
Forbearance
Forbearance measures consist of concessions towards a debtor that is experiencing or about to experience difficulties in meeting their
financial commitments ('financial difficulties').
Analysis of forbearance programmes
Balances
Impairment allowance
Stage 1
Stage 2
Stage 3
Total
Stage 1
Stage 2
Stage 3
Total
£m
£m
£m
£m
£m
£m
£m
£m
As at 31 December 2024
Barclays UK
58
108
596
762
—
15
133
148
Barclays US Consumer Bank
—
—
448
448
—
—
209
209
Head Office
4
1
7
12
—
—
2
2
Total retail
62
109
1,051
1,222
—
15
344
359
Barclays UK
74
91
431
596
—
2
37
39
Barclays Investment Bank
—
361
514
875
—
14
103
117
Barclays UK Corporate Bank
2
597
109
708
—
11
41
52
Barclays Private Bank and Wealth Management
—
1
205
206
—
—
16
16
Head Office
—
—
—
—
—
—
—
—
Total wholesale
76
1,050
1,259
2,385
—
27
197
224
Group total
138
1,159
2,310
3,607
—
42
541
583
As at 31 December 2023
Barclays UK
59
82
514
655
—
12
137
149
Barclays US Consumer Bank
—
—
290
290
—
—
128
128
Head Office
39
20
60
119
—
2
9
11
Total retail
98
102
864
1,064
—
14
274
288
Barclays UK
133
224
502
859
1
3
52
56
Barclays Investment Bank
—
631
308
939
—
18
80
98
Barclays UK Corporate Bank
2
546
127
675
—
11
29
40
Barclays Private Bank and Wealth Management
—
19
214
233
—
—
16
16
Head Office
—
—
—
—
—
—
—
—
Total wholesale
135
1,420
1,151
2,706
1
32
177
210
Group total
233
1,522
2,015
3,770
1
46
451
498
Analysis of Portfolios- held for sale in Forbearance Programmes
Balances
Impairment allowance
Stage 1
Stage 2
Stage 3
Total
Stage 1
Stage 2
Stage 3
Total
£m
£m
£m
£m
£m
£m
£m
£m
As at 31 December 2024
Head Office
German consumer finance business
1
1
25
27
—
—
18
18
As at 31 December 2023
Head Office
German consumer finance business
1
1
30
32
—
—
22
22
Retail balances on forbearance reflected increases in UK Home Finance and US cards.
Barclays UK wholesale forbearance balances decreased to £596m (2023: £859m) due to a reduction in ESHLA exposures, mostly
through repayments, and a reduction in the in the Bounce Back Loan book reflecting increased exits and lower inflows.
Note:
1Tesco Bank balances not included.
Strategy
Shareholder
information
Climate and
sustainability report
Governance
Risk
review
Financial
review
Financial
statements
Barclays PLC 2024
Annual Report
on Form 20-F
275
Risk performance - Credit risk (continued)
Retail forbearance programmes
Forbearance on the Group’s principal retail portfolios is presented below. The principal portfolios account for 98% (2023: 99%) of total
retail forbearance balances.
Analysis of Key Portfolios in Forbearance Programmes
Balances on Forbearance Programmes
Marked to market
LTV of forbearance
balances: balance
weighted
Marked to market
LTV of forbearance
balances: valuation
weighted
Impairment
allowances marked
against balances
on forbearance
programmes
Total balances on
forbearance
programmes
coverage ratio
Total
% of gross retail
loans and advances
£m
£m
%
%
£m
%
As at 31 December 2024
Barclays UK
UK Home Loans
473
0.3
51.3
41.8
10
2.1
UK cards
192
1.7
n/a
n/a
76
39.6
UK personal loans
51
1.3
n/a
n/a
34
66.7
Barclays Partner Finance
16
1.0
n/a
n/a
9
56.3
Barclays US Consumer Bank
US cards
448
1.6
n/a
n/a
209
46.7
Head Office
Italy Mortgages
12
30.0
78.5
48.9
2
16.7
As at 31 December 2023
Barclays UK
UK Home Loans
366
0.2
44.7
32.2
15
4.1
UK cards
215
2.1
n/a
n/a
86
40.0
UK personal loans
46
1.3
n/a
n/a
30
65.2
Barclays Partner Finance
17
0.7
n/a
n/a
10
58.8
Barclays US Consumer Bank
US cards
290
1.1
n/a
n/a
128
44.1
Head Office
Italy Mortgages
119
3.3
59.8
44.6
11
9.2
Analysis of Portfolios- held for sale in Forbearance Programmes
Balances on Forbearance Programmes
Marked to market
LTV of forbearance
balances: balance
weighted
Marked to market
LTV of forbearance
balances: valuation
weighted
Impairment
allowances marked
against balances
on forbearance
programmes
Total balances on
forbearance
programmes
coverage ratio
Total
% of gross retail
loans and advances
£m
£m
%
%
£m
%
As at 31 December 2024
Head Office
German consumer finance business
27
0.7
n/a
n/a
18
66.7
As at 31 December 2023
Head Office
German consumer finance business
32
0.8
n/a
n/a
22
68.8
Note:
1Tesco Bank balances not included.
UK home loans: Forbearance balances rose to £473m (2023: £366m) due to an increase in temporary switches to Interest-Only along
with concessionary interest rates given to support customers facing rising mortgage interest rates and increased affordability stress.
UK cards: Balances on forbearance decreased to £192m (2023: £215m) due to increased outflow, against a reducing forbearance inflow
across 2024.
UK personal loans: Balances on forbearance programmes increased to £51m (2023: £46m), due to the impact of enhanced
forbearance classification data.
Barclays Partner Finance: Balances on forbearance remained stable.
US cards: Forbearance balances increased to £448m (2023: £290m) reflecting an increase in new enrolments in 2024 following
elevated delinquency trends through the year.
German consumer finance business: Forbearance balances decreased to £27m (2023: £32m) due to lower customer demand and
increased operational focus on early delinquency stages.
Italian home loans: Forbearance balances decreased to £12m (2023: £119m) due to the disposal of the performing portfolio in Q224.
Strategy
Shareholder
information
Climate and
sustainability report
Governance
Risk
review
Financial
review
Financial
statements
Barclays PLC 2024
Annual Report
on Form 20-F
276
Risk performance - Credit risk (continued)
Wholesale forbearance programmes
The table below details balance information for wholesale forbearance cases.
Analysis of wholesale balances in forbearance programmes
Balances on forbearance programmes
Impairment
allowances marked
against balances
on forbearance
programmes
Total balances on
forbearance
programmes
coverage ratio
Total balances
% of gross
wholesale loans
and advances
£m
%
£m
%
As at 31 December 2024
Barclays UK
596
2.9
39
6.5%
Barclays Investment Bank
875
1.2
117
13.4%
Barclays UK Corporate Bank
708
2.7
52
7.3%
Barclays Private Bank and Wealth Management
206
3.4
16
7.8%
Total
2,385
1.8
224
9.4%
As at 31 December 2023
Barclays UK
859
3.5
56
6.5%
Barclays Investment Bank
939
1.4
98
10.4%
Barclays UK Corporate Bank
675
2.5
40
6.0%
Barclays Private Bank and Wealth Management
233
4.1
16
6.9%
Total
2,706
2.1
210
7.8%
Analysis of debt securities
Debt securities include government securities held as part of the Group’s treasury management portfolio for liquidity and regulatory
purposes, and are for use on a continuing basis in the activities of the Group.
The following tables provide an analysis of debt securities held by the Group for trading and investment purposes by issuer type. Further
information on the credit quality of debt securities is presented in the Balance sheet credit quality section.
Debt securities
2024
2023
As at 31 December
£m
%
£m
%
Of which issued by:
Governments and other public bodies
134,786
60.2
130,816
63.5
Corporate and other issuers
45,559
20.3
43,001
20.9
US agency
17,262
7.7
12,907
6.3
Mortgage and asset backed securities
26,354
11.8
19,168
9.3
Total
223,961
100.0
205,892
100
Strategy
Shareholder
information
Climate and
sustainability report
Governance
Risk
review
Financial
review
Financial
statements
Barclays PLC 2024
Annual Report
on Form 20-F
277
Risk performance - Credit risk (continued)
Analysis of derivatives
The tables below set out the fair values of the derivative assets together with the value of those assets subject to enforceable
counterparty netting arrangements for which the Group holds offsetting liabilities and eligible collateral.
Derivative assets (audited)
2024
2023
Balance sheet
assets
Counterparty
netting
Net
exposure
Balance sheet
assets
Counterparty
netting
Net
exposure
As at 31 December
£m
£m
£m
£m
£m
£m
Foreign exchange
126,098
98,677
27,421
89,533
69,570
19,963
Interest rate
95,796
70,138
25,658
109,609
79,861
29,748
Credit derivatives
6,898
5,728
1,170
7,662
6,758
904
Equity and stock index
62,912
54,237
8,675
48,171
40,946
7,225
Commodity derivatives
1,826
1,654
172
1,861
1,674
187
Total derivative assets
293,530
230,434
63,096
256,836
198,809
58,027
Cash collateral held
30,637
31,211
Net exposure less collateral
32,459
26,816
Derivative asset exposures would be £261bn (2023: £230bn) lower than reported under IFRS if netting were permitted for assets and
liabilities with the same counterparty or for which the Group holds cash collateral. Similarly, derivative liabilities would be £254bn (2023:
£223bn) lower reflecting counterparty netting and collateral placed. In addition, non-cash collateral of £13bn (2023: £10bn) was held in
respect of derivative assets. The Group received collateral from clients in support of over the counter derivative transactions. These
transactions are generally undertaken under International Swaps and Derivative Association (ISDA) agreements governed by either UK
or New York law.
Assets held for sale
This section presents portfolios classified as assets held for sale. These include a co-branded card portfolio and German consumer
finance business.
For further details on assets held for sale, see Note 40 to the financial statements in Barclays PLC Annual Report 2024.
Loans and advances by product
Loans and advances to customers classified as assets held for sale (audited)
Stage 1
Stage 2
Stage 3
Total
Gross
ECL
Coverage
Gross
ECL
Coverage
Gross
ECL
Coverage
Gross
ECL
Coverage
As at 31 December 2024
£m
£m
%
£m
£m
%
£m
£m
%
£m
£m
%
Retail credit cards - US
5,495
64
1.2
689
161
23.4
57
46
80.7
6,241
271
4.3
Retail credit cards - Germany
1,908
18
0.9
307
29
9.4
93
69
74.2
2,308
116
5.0
Retail other - Germany
1,134
16
1.4
220
33
15.0
71
48
67.6
1,425
97
6.8
Corporate loans - US
49
1
2.0
9
3
33.3
1
1
100.0
59
5
8.5
Total Rest of the World
8,586
99
1.2
1,225
226
18.4
222
164
73.9
10,033
489
4.9
As at 31 December 2023
Retail credit cards - US
—
—
—
—
—
—
—
—
—
—
—
—
Retail credit cards - Germany
1,621
15
0.9
445
41
9.2
92
68
73.9
2,158
124
5.7
Retail other - Germany
1,561
20
1.3
288
32
11.1
84
60
71.4
1,933
112
5.8
Corporate loans - US
—
—
—
—
—
—
—
—
—
—
—
—
Total Rest of the World
3,182
35
1.1
733
73
10.0
176
128
72.7
4,091
236
5.8
Strategy
Shareholder
information
Climate and
sustainability report
Governance
Risk
review
Financial
review
Financial
statements
Barclays PLC 2024
Annual Report
on Form 20-F
278
Risk performance - Credit risk (continued)
Stage 2 decomposition
Loans and advances at amortised cost classified as held for sale
Gross Exposure
Impairment Allowance
Quantitative
test
Qualitative test
30 days past due
backstop
Total Stage 2
Quantitative
test
Qualitative test
30 days past due
backstop
Total Stage 2
As at 31 December 2024
£m
£m
£m
£m
£m
£m
£m
£m
Retail credit cards - US
564
123
2
689
130
30
1
161
Retail credit cards - Germany
209
96
2
307
19
9
1
29
Retail other - Germany
207
11
2
220
31
1
1
33
Corporate loan - US
7
2
—
9
2
1
—
3
Total Stage 2
987
232
6
1,225
182
41
3
226
As at 31 December 2023
£m
£m
£m
£m
£m
£m
£m
£m
Retail credit cards - US
—
—
—
—
—
—
—
—
Retail credit cards - Germany
387
56
2
445
34
6
1
41
Retail other - Germany
265
20
3
288
29
2
1
32
Corporate loan - US
—
—
—
—
—
—
—
—
Total Stage 2
652
76
5
733
63
8
2
73
Stage 3 decomposition
Loans and advances at amortised cost classified as held for sale
Gross Exposure
Impairment Allowance
Stage 3 excluding POCI
Stage 3 excluding POCI
Exposures
not charged-
off
Exposures
individually
assessed or
in recovery
book
Total
POCI
Total Stage 3
Exposures
not charged-
off
Exposures
individually
assessed or
in recovery
book
Total
POCI
Total Stage 3
As at 31 December 2024
£m
£m
£m
£m
£m
£m
£m
£m
£m
£m
Retail credit cards - US
57
—
57
—
57
46
—
46
—
46
Retail credit cards -
Germany
68
25
93
—
93
49
20
69
—
69
Retail other - Germany
51
20
71
—
71
32
16
48
—
48
Corporate loan - US
1
—
1
—
1
1
—
1
—
1
Total Stage 3
177
45
222
—
222
128
36
164
—
164
As at 31 December 2023
£m
£m
£m
£m
£m
£m
£m
£m
£m
£m
Retail credit cards - US
—
—
—
—
—
—
—
—
—
—
Retail credit cards -
Germany
65
27
92
—
92
45
23
68
—
68
Retail other - Germany
61
23
84
—
84
38
22
60
—
60
Corporate loan - US
—
—
—
—
—
—
—
—
—
—
Total Stage 3
126
50
176
—
176
83
45
128
—
128
Strategy
Shareholder
information
Climate and
sustainability report
Governance
Risk
review
Financial
review
Financial
statements
Barclays PLC 2024
Annual Report
on Form 20-F
279
Risk performance - Credit risk (continued)
Management adjustments to models for impairment (audited)
Management adjustments to models for impairment allowance presented by product (audited)
Impairment
allowance pre
management
adjustments
Economic
uncertainty
adjustments
(a)
Other
adjustments
(b)
Management
adjustments
(a+b)
Total
impairment
allowance
Proportion of
Management
adjustments to
total impairment
allowance
As at 31 December 2024
£m
£m
£m
£m
£m
%
Retail credit cards - US
277
—
—
—
277
—
Retail credit cards - Germany1
101
—
16
16
117
13.7
Retail other - Germany1
80
—
17
17
97
17.5
Corporate loans - US
5
—
—
—
5
—
Total Rest of the World
463
—
33
33
496
6.7
As at 31 December 2023
£m
£m
£m
£m
£m
%
Retail credit cards - US
—
—
—
—
—
Retail credit cards - Germany1
111
—
14
14
125
11.2
Retail other - Germany1
96
—
17
17
113
15.0
Corporate loans - US
—
—
—
—
—
Total rest of the World
207
—
31
31
238
13.0
Note:
1Management adjustments of £33m (2023: £31m) include an adjustment for definition of default under the Capital Requirements Regulation (CRR) and an adjustment for recalibration of
LGD to reflect revised recovery expectations partially offset by adjustments for model monitoring.
Credit exposures by internal PD grade
Credit risk profile by internal PD grade classified as assets held for sale for Retail credit cards - US (audited)
Gross carrying amount
Allowance for ECL
Net
exposure
Coverage
ratio
Grading
PD Range
Credit
quality
description
Stage 1
Stage 2
Stage 3
excluding
POCI
Stage 3
POCI
Total
Stage 1
Stage 2
Stage 3
excluding
POCI
Stage 3
POCI
Total
%
£m
£m
£m
£m
£m
£m
£m
£m
£m
£m
£m
%
As at 31 December 2024
1 - 3
0.0 to <0.05%
Strong
—
—
—
—
—
—
—
—
—
—
—
—
4 - 5
0.05 to <0.15%
Strong
—
—
—
—
—
—
—
—
—
—
—
—
6 - 8
0.15 to <0.30%
Strong
—
—
—
—
—
—
—
—
—
—
—
—
9 - 11
0.30 to <0.60%
Strong
—
—
—
—
—
—
—
—
—
—
—
—
12 - 14
0.60 to <2.15%
Satisfactory
5,495
—
—
—
5,495
64
—
—
—
64
5,431
1.2
15 - 19
2.15 to <11.35%
Satisfactory
—
689
—
—
689
—
161
—
—
161
528
23.4
20 - 21
11.35 to <100%
Higher Risk
—
—
—
—
—
—
—
—
—
—
—
—
22
100%
Credit
Impaired
—
—
57
—
57
—
—
46
—
46
11
80.7
Total
5,495
689
57
—
6,241
64
161
46
—
271
5,970
4.3
Credit risk profile by internal PD grade classified as assets held for sale for Retail credit cards - Germany (audited)
Gross carrying amount
Allowance for ECL
Net
exposure
Coverage
ratio
Grading
PD Range
Credit
quality
description
Stage 1
Stage 2
Stage 3
excluding
POCI
Stage 3
POCI
Total
Stage 1
Stage 2
Stage 3
excluding
POCI
Stage 3
POCI
Total
%
£m
£m
£m
£m
£m
£m
£m
£m
£m
£m
£m
%
As at 31 December 2024
1 - 3
0.0 to <0.05%
Strong
62
—
—
—
62
—
—
—
—
—
62
—
4 - 5
0.05 to <0.15%
Strong
289
—
—
—
289
1
—
—
—
1
288
0.3
6 - 8
0.15 to <0.30%
Strong
152
—
—
—
152
1
—
—
—
1
151
0.7
9 - 11
0.30 to <0.60%
Strong
250
—
—
—
250
1
—
—
—
1
249
0.4
12 - 14
0.60 to <2.15%
Satisfactory
928
5
—
—
933
9
—
—
—
9
924
1.0
15 - 19
2.15 to <11.35%
Satisfactory
227
229
—
—
456
6
15
—
—
21
435
4.6
20 - 21
11.35 to <100%
Higher Risk
—
73
—
—
73
—
14
—
—
14
59
19.2
22
100%
Credit
Impaired
—
—
93
—
93
—
—
69
—
69
24
74.2
Total
1,908
307
93
—
2,308
18
29
69
—
116
2,192
5.0
Strategy
Shareholder
information
Climate and
sustainability report
Governance
Risk
review
Financial
review
Financial
statements
Barclays PLC 2024
Annual Report
on Form 20-F
280
Risk performance - Credit risk (continued)
Credit risk profile by internal PD grade classified as assets held for sale for Retail other - Germany (audited)
Gross carrying amount
Allowance for ECL
Net
exposure
Coverage
ratio
Grading
PD Range
Credit
quality
description
Stage 1
Stage 2
Stage 3
excluding
POCI
Stage 3
POCI
Total
Stage 1
Stage 2
Stage 3
excluding
POCI
Stage 3
POCI
Total
%
£m
£m
£m
£m
£m
£m
£m
£m
£m
£m
£m
%
As at 31 December 2024
1 - 3
0.0 to <0.05%
Strong
1
—
—
—
1
—
—
—
—
—
1
—
4 - 5
0.05 to <0.15%
Strong
25
—
—
—
25
—
—
—
—
—
25
—
6 - 8
0.15 to <0.30%
Strong
110
—
—
—
110
—
—
—
—
—
110
—
9 - 11
0.30 to <0.60%
Strong
294
—
—
—
294
1
—
—
—
1
293
0.3
12 - 14
0.60 to <2.15%
Satisfactory
534
17
—
—
551
6
4
—
—
10
541
1.8
15 - 19
2.15 to <11.35%
Satisfactory
170
182
—
—
352
9
22
—
—
31
321
8.8
20 - 21
11.35 to <100%
Higher Risk
—
21
—
—
21
—
7
—
—
7
14
33.3
22
100%
Credit
Impaired
—
—
71
—
71
—
—
48
—
48
23
67.6
Total
1,134
220
71
—
1,425
16
33
48
—
97
1,328
6.8
Credit risk profile by internal PD grade classified as assets held for sale for Corporate loans - US (audited)
Gross carrying amount
Allowance for ECL
Net
exposure
Coverage
ratio
Grading
PD Range
Credit
quality
description
Stage 1
Stage 2
Stage 3
excluding
POCI
Stage 3
POCI
Total
Stage 1
Stage 2
Stage 3
excluding
POCI
Stage 3
POCI
Total
%
£m
£m
£m
£m
£m
£m
£m
£m
£m
£m
£m
%
As at 31 December 2024
1 - 3
0.0 to <0.05%
Strong
—
—
—
—
—
—
—
—
—
—
—
—
4 - 5
0.05 to <0.15%
Strong
—
—
—
—
—
—
—
—
—
—
—
—
6 - 8
0.15 to <0.30%
Strong
—
—
—
—
—
—
—
—
—
—
—
—
9 - 11
0.30 to <0.60%
Strong
—
—
—
—
—
—
—
—
—
—
—
—
12 - 14
0.60 to <2.15%
Satisfactory
49
—
—
—
49
1
—
—
—
1
48
2.0
15 - 19
2.15 to <11.35%
Satisfactory
—
9
—
—
9
—
3
—
—
3
6
33.3
20 - 21
11.35 to <100%
Higher Risk
—
—
—
—
—
—
—
—
—
—
—
—
22
100%
Credit
Impaired
—
—
1
—
1
—
—
1
—
1
—
100.0
Total
49
9
1
—
59
1
3
1
—
5
54
8.5
Credit risk profile by internal PD grade classified as assets held for sale for Retail credit cards - Germany (audited)
Gross carrying amount
Allowance for ECL
Net
exposure
Coverage
ratio
Grading
PD Range
Credit
quality
description
Stage 1
Stage 2
Stage 3
excluding
POCI
Stage 3
POCI
Total
Stage 1
Stage 2
Stage 3
excluding
POCI
Stage 3
POCI
Total
%
£m
£m
£m
£m
£m
£m
£m
£m
£m
£m
£m
%
As at 31 December 2023
1 - 3
0.0 to <0.05%
Strong
52
—
—
—
52
—
—
—
—
—
52
—
4 - 5
0.05 to <0.15%
Strong
232
—
—
—
232
—
—
—
—
—
232
—
6 - 8
0.15 to <0.30%
Strong
148
—
—
—
148
—
—
—
—
—
148
—
9 - 11
0.30 to <0.60%
Strong
226
—
—
—
226
1
—
—
—
1
225
0.4
12 - 14
0.60 to <2.15%
Satisfactory
755
74
—
—
829
8
5
—
—
13
816
1.6
15 - 19
2.15 to <11.35%
Satisfactory
208
302
—
—
510
6
22
—
—
28
482
5.5
20 - 21
11.35 to <100%
Higher Risk
—
69
—
—
69
—
14
—
—
14
55
20.3
22
100%
Credit
Impaired
—
—
92
—
92
—
—
68
—
68
24
73.9
Total
1,621
445
92
—
2,158
15
41
68
—
124
2,034
5.7
Strategy
Shareholder
information
Climate and
sustainability report
Governance
Risk
review
Financial
review
Financial
statements
Barclays PLC 2024
Annual Report
on Form 20-F
281
Risk performance - Credit risk (continued)
Credit risk profile by internal PD grade classified as assets held for sale for Retail other - Germany (audited)
Gross carrying amount
Allowance for ECL
Net
exposure
Coverage
ratio
Grading
PD Range
Credit
quality
description
Stage 1
Stage 2
Stage 3
excluding
POCI
Stage 3
POCI
Total
Stage 1
Stage 2
Stage 3
excluding
POCI
Stage 3
POCI
Total
%
£m
£m
£m
£m
£m
£m
£m
£m
£m
£m
£m
%
As at 31 December 2023
1 - 3
0.0 to <0.05%
Strong
—
—
—
—
—
—
—
—
—
—
—
—
4 - 5
0.05 to <0.15%
Strong
16
—
—
—
16
—
—
—
—
—
16
—
6 - 8
0.15 to <0.30%
Strong
90
—
—
—
90
—
—
—
—
—
90
—
9 - 11
0.30 to <0.60%
Strong
348
—
—
—
348
1
—
—
—
1
347
0.3
12 - 14
0.60 to <2.15%
Satisfactory
791
18
—
—
809
8
2
—
—
10
799
1.2
15 - 19
2.15 to <11.35%
Satisfactory
316
240
—
—
556
11
24
—
—
35
521
6.3
20 - 21
11.35 to <100%
Higher Risk
—
30
—
—
30
—
6
—
—
6
24
20.0
22
100%
Credit
Impaired
—
—
84
—
84
—
—
60
—
60
24
71.4
Total
1,561
288
84
—
1,933
20
32
60
—
112
1,821
5.8
Strategy
Shareholder
information
Climate and
sustainability report
Governance
Risk
review
Financial
review
Financial
statements
Barclays PLC 2024
Annual Report
on Form 20-F
282
Risk performance - Market risk
Market risk
Summary of contents
Page
Outlines key measures used to summarise the market risk
The daily average, high and low values of management VaR
Management VaR (95%, one day) (audited)
2024
2023
Average
High1
Low1
Average
High1
Low1
For the year ended 31 December
£m
£m
£m
£m
£m
£m
Credit risk
21
27
17
40
57
22
Interest rate risk
15
25
7
15
25
9
Equity risk
6
12
2
6
10
3
Basis risk
5
8
4
13
25
8
Spread risk
5
7
3
9
14
5
Foreign exchange risk
4
9
2
4
9
1
Commodity risk
—
1
—
—
1
—
Inflation risk
4
5
2
6
11
2
Diversification effect1
(34)
n/a
n/a
(51)
n/a
n/a
Total management VaR
26
36
15
42
60
24
Note:
1Diversification effects recognise that forecast losses from different assets or businesses are unlikely to occur concurrently, hence the expected aggregate loss is lower than the sum of
the expected losses from each area. Historical correlations between losses are taken into account in making these assessments. The high and low VaR figures reported for each
category did not necessarily occur on the same day as the high and low VaR reported as a whole. Consequently, a diversification effect balance for the high and low VaR figures would not
be meaningful and is therefore omitted from the above table.
Group Management VaR
(£m)
Strategy
Shareholder
information
Climate and
sustainability report
Governance
Risk
review
Financial
review
Financial
statements
Barclays PLC 2024
Annual Report
on Form 20-F
284
Risk performance - Treasury and Capital risk
Treasury and Capital risk
Treasury and Capital risk: summary of contents
Page
Liquidity risk performance
The risk that the firm is unable to meet its contractual or contingent obligations or that
it does not have the appropriate amount, tenor and composition of funding and liquidity
to support its assets.
This section provides an overview of the Group’s liquidity risk.
1LCR represents average of the last 12 spot month end
ratios.
2NSFR represents average of the last four spot quarter
end ratios.
Summary of performance
The liquidity pool at £297bn (December
2023: £298bn) reflects the Group’s
prudent approach to liquidity
management. The Average Liquidity
Coverage Ratio (LCR) remained well above
the 100% regulatory requirement at 172%
(December 2023: 161%), equivalent to a
surplus of £127bn (December 2023:
£118bn).
A decrease in net stress outflows led by
an increase in the proportion of corporate
deposits treated as operational, and an
increase in Inflows from secured lending
led to an increase in the LCR ratio. The Net
Stable Funding Ratio (NSFR) (average of
last four quarter ends) was 135%
(December 2023: 138%), which
represents a surplus of £163bn
(December 2023: £167bn) above the
100% regulatory requirement.
During the year, the Group issued £15.1bn
of minimum requirement for own funds
and eligible liabilities (MREL) instruments in
a range of tenors and currencies.
Barclays Bank PLC continued to issue in
the shorter-term and medium-term
markets and Barclays Bank UK PLC
continued to issue in the shorter-term
markets and maintain active secured
funding programmes. This funding
capacity enables the respective entities to
maintain their stable and diversified
funding bases.
The Group’s reliance on short-term
wholesale funding, as measured by the
proportion of wholesale funding maturing
in less than one year decreased year-on-
year to 30% (December 2023: 33%).
Liquidity risk stress testing
Barclays’ Liquidity Risk is managed within
the Principal Risk: Treasury and Capital
Risk Framework. Under this framework,
the Group has established a liquidity risk
appetite together with the appropriate
limits for the management of the liquidity
risk. This is the level of liquidity risk the
Group chooses to take in pursuit of its
business objectives and in meeting its
regulatory obligations. The Group sets its
internal liquidity risk appetite based on
internal liquidity risk stress tests and,
external regulatory requirements namely
the LCR and NSFR.
Internal Liquidity Stress Tests (ILST)
The Internal Liquidity Risk Stress Test
measures the potential contractual and
contingent stress outflows under a range
of internally defined stress scenarios,
which are then used to determine the size
of the liquidity pool that is immediately
available to meet anticipated outflows
should a stress occur.
As part of the ILST, the Group runs four
liquidity stress scenarios, aligned to the
PRA’s prescribed stresses:
•90 days market-wide stress event
•30 days Barclays-specific stress event
•30 days combined market-wide and
Barclays-specific stress event
•12 months market wide stress
Strategy
Shareholder
information
Climate and
sustainability report
Governance
Risk
review
Financial
review
Financial
statements
Barclays PLC 2024
Annual Report
on Form 20-F
286
Risk performance - Treasury and Capital risk (continued)
Key ILST assumptions
For the year ended 31 December 2024
Drivers of Liquidity Risk
ILST Combined stress – key assumptions
Wholesale Secured and Unsecured Funding Risk
Zero rollover of maturing wholesale unsecured funding
Partial loss of repo capacity on non-extremely liquid repos at contractual maturity date
Roll of repo for extremely liquid repo at wider haircut at contractual maturity date
Withdrawal of contractual buyback obligations, excess client futures margin, Prime Brokerage
(PB) client cash and overlifts
Haircuts applied to the market value of marketable assets held in the liquidity buffer
Retail and Corporate Funding Risk
Retail and Corporate deposit outflows as counterparties seek to diversify their deposit balances
Intraday Liquidity Risk
Liquidity held to meet increased intraday liquidity usage due to payment and receipts volatility,
loss of unsecured credit lines and haircuts applied to collateral values used to back secured credit
lines, in a stress
Intra-Group Liquidity Risk
Liquidity support for material subsidiaries. Surplus liquidity held within certain subsidiaries is not
taken as a benefit to the wider Group
Cross-Currency Liquidity Risk
Deterioration in FX market capacity that may result in restriction in net currency positions
(managed as a separate framework)
Off-Balance Sheet Liquidity Risk
Drawdown on committed facilities based on facility and counterparty type
Collateral outflows due to a two-notch credit rating downgrade
Increase in the Group's initial margin requirement across all major exchanges
Variation margin outflows from collateralised risk positions
Outflow of collateral owing but not called
Loss of internal sources of funding within the PB synthetics business
Franchise-Viability Risk
Liquidity held to enable the firm to meet select non-contractual obligations to ensure market
confidence in the firm is maintained, including debt buy-backs, swap tear-ups and increased
prime brokerage margin debits
Funding Concentration Risk
Funding from counterparties providing greater than 1% of total funding
As at 31 December 2024, the Group held eligible liquid assets well in excess of 100% of net stress outflows of the 30 days combined
scenario, which has the highest net outflows of the three short-term liquidity stress scenarios and the 12 month market-wide scenario.
Liquidity regulation
Barclays Group monitors its position against both the LCR and NSFR according to the PRA regulatory requirements which include
certain Basel III standards that were retained in the UK regulatory framework from 1 January 2022 as part of the UK's withdrawal from
the EU. The LCR requirement takes into account the relative stability of different sources of funding and potential incremental funding
requirements in a stress. The LCR is designed to promote short-term resilience of a bank's liquidity risk profile by holding sufficient High
Quality Liquid Assets (HQLA) to survive an acute stress scenario lasting for 30 days. The NSFR has been developed to promote a
sustainable and stable structure of assets and liabilities.
Strategy
Shareholder
information
Climate and
sustainability report
Governance
Risk
review
Financial
review
Financial
statements
Barclays PLC 2024
Annual Report
on Form 20-F
287
Risk performance - Treasury and Capital risk (continued)
Liquidity coverage ratio
The external LCR requirement is designed to promote short-term resilience of a bank’s liquidity risk profile by holding sufficient High
Quality Liquid Assets (HQLA) to survive an acute stress scenario lasting for 30 days.
Liquidity Coverage Ratio (LCR)1
2024
2023
As at 31 December
£bn
£bn
LCR Eligible High Quality Liquid Assets (HQLA)
304
310
Net stress outflows
(177)
(192)
Surplus
127
118
Liquidity coverage ratio
172%
161%
Note:
1 Liquidity Coverage Ratio is now shown on an average basis, based on the average of the last 12 spot month end ratios. The HQLA, Net Stress outflow, and Surplus balances in the table
above are average month end balances for the past 12 months. Prior period HQLA, Net Stress Outflows, Surplus & LCR comparatives have been updated for consistency.
Net Stable Funding Ratio (NSFR)
The external NSFR metric requires banks to maintain a stable funding profile taking into account both on and certain off balance sheet
exposures over a medium to long term period. The ratio is defined as the Available Stable Funding (capital and certain liabilities which are
defined as stable sources of funding) relative to the Required Stable Funding (a measure of assets on the balance sheet and certain off
balance sheet exposures which may require longer term funding). The NSFR was 135% at December 2024 ( December 2023: 138%)
(average of last four quarter ends) equivalent to a surplus of £163bn (2023: £167bn) above the regulatory requirement and
1Average represents the last four spot quarter end ratios.
As part of the liquidity risk appetite, Barclays establishes minimum LCR, NSFR and internal liquidity stress test limits. The Group plans to
maintain its surplus to the internal and regulatory requirements at an efficient level. Risks to market funding conditions, the Group’s
liquidity position and funding profile are assessed continuously, and actions are taken to manage the size of the liquidity pool and the
funding profile as appropriate.
Liquidity pool
The Group liquidity pool as at 31 December 2024 was £297bn (2023: 298bn). In 2024, the month-end liquidity pool ranged from £297bn
to £341bn (2023: £298bn to £342bn), and the month-end average balance was £322bn (2023: 328bn). The liquidity pool is held
unencumbered and is intended to offset stress outflows. It comprises the following cash and unencumbered assets.
Composition of the Group liquidity pool as at 31 December 2024
LCR eligible High Quality Liquid Assets (HQLA)1
Liquidity pool
Cash
Level 1
Level 2A
Level 2B
Total
2024
2023
£bn
£bn
£bn
£bn
£bn
£bn
£bn
Cash and deposits with central banks2
196
196
216
232
Government bonds3
AAA to AA-
58
1
59
55
48
A+ to A-
2
2
2
1
BBB+ to BBB-
1
1
1
1
Total government bonds
61
1
62
58
50
Other
Government guaranteed issuers, PSEs and GSEs
4
3
7
9
5
International organisations and MDBs
7
7
7
3
Covered bonds
2
5
7
7
7
Other
2
2
1
Total other
13
8
2
23
23
16
Total as at 31 December 2024
196
74
9
2
281
297
Total as at 31 December 2023
211
52
9
2
274
298
Notes:
1The LCR eligible HQLA is adjusted for operational restrictions upon consolidation under Article 8 of the Liquidity Coverage Ratio section of the PRA rulebook (CRR) such as trapped
liquidity within Barclays subsidiaries. It also reflects differences in eligibility of assets between the LCR and Barclays’ Liquidity Pool.
2Includes cash held at central banks and surplus cash at central banks related to payment schemes. Of which over 98% (2023: over 99%) was placed with the Bank of England, US Federal
Reserve, European Central Bank, Bank of Japan and Swiss National Bank.
3Of which over 85% (2023: over 80%) comprised UK, US, French, German, Japanese, Swiss and Dutch securities.
Strategy
Shareholder
information
Climate and
sustainability report
Governance
Risk
review
Financial
review
Financial
statements
Barclays PLC 2024
Annual Report
on Form 20-F
288
Risk performance - Treasury and Capital risk (continued)
The Group liquidity pool is well diversified by major currency and the Group monitors ILST stress scenarios for major currencies.
Liquidity pool by currency
USD
EUR
GBP
Other
Total
£bn
£bn
£bn
£bn
£bn
Liquidity pool as at 31 December 2024
92
75
109
21
297
Liquidity pool as at 31 December 2023
82
76
117
23
298
Management of the liquidity pool
The composition of the liquidity pool is subject to limits set by the Board and the independent liquidity risk, credit risk and market risk
functions. In addition, the investment of the liquidity pool is monitored for concentration risk by issuer, currency and asset type. Given
the returns generated by these highly liquid assets, the risk and reward profile is continuously managed.
As at 31 December 2024, 60% (2023: 59%) of the liquidity pool was located in Barclays Bank PLC, 23% (2023: 22%) in Barclays Bank UK
PLC and 9% (2023: 11%) in Barclays Bank Ireland PLC. The residual portion of the liquidity pool is held outside of these entities,
predominantly in the US subsidiaries, to meet entity-specific stress outflows and local regulatory requirements. To the extent the use
of this portion of the liquidity pool is restricted due to local regulatory requirements, it is assumed to be unavailable to the rest of the
Group in calculating the LCR.
Contingent liquidity
In addition to the Group liquidity pool, the Group has access to other unencumbered assets which provide a source of contingent
liquidity. While these are not relied on in the Group’s ILST, a portion of these assets may be monetised in a stress to generate liquidity
through their use as collateral for secured funding or through outright sale.
In a Barclays-specific, market-wide or combined liquidity stress, liquidity available via market sources could be severely disrupted. In
circumstances where market liquidity is unavailable or available only at significantly elevated prices, the Group could generate liquidity
via central bank facilities. To this end, as at 31 December 2024, the Group had £87.9bn (December 2023: £72.5bn) of assets positioned
at various central banks.
For more detail on the Group’s other unencumbered assets, see pages 199 to 203 of the Barclays PLC Pillar 3 Report 2024 (unaudited).
Funding structure and funding relationships
The basis for sound liquidity risk management is a funding structure that reduces the probability of a liquidity stress leading to an inability
to meet funding obligations as they fall due. The Group’s overall funding strategy is to develop a diversified funding base (geographically,
by type and by counterparty) and maintain access to a variety of alternative funding sources, to provide protection against unexpected
fluctuations, while minimising the cost of funding.
Within this, the Group aims to align the sources and uses of funding. As such, retail and corporate loans and advances are largely funded
by deposits in the relevant entities, with the surplus primarily funding the liquidity pool. The majority of reverse repurchase agreements
are matched by repurchase agreements. Derivative liabilities and assets are largely matched. A substantial proportion of balance sheet
derivative positions qualify for counterparty netting and the remaining portions are largely offset when netted against cash collateral
received and paid. Wholesale debt and equity is used to fund residual assets.
These funding relationships are summarised below:
2024
2023
2024
2023
Assets
£bn
£bn
Liabilities
£bn
£bn
Loans and advances at amortised cost1
392
386
Deposits at amortised cost
561
539
Group liquidity pool
297
298
<1 Year wholesale funding
55
59
>1 Year wholesale funding
131
118
Reverse repurchase agreements, trading
portfolio assets, cash collateral and
settlement balances
433
435
Repurchase agreements, trading portfolio
liabilities, cash collateral and settlement
balances
358
380
Derivative financial instruments
294
257
Derivative financial instruments
279
250
Other assets2
102
101
Other liabilities
62
59
Equity
72
72
Total assets
1,518
1,477
Total liabilities
1,518
1,477
Notes:
1Adjusted for liquidity pool debt securities reported at amortised costs of £22bn (December 2023: £18bn).
2Other assets include fair value assets that are not part of reverse repurchase agreements or trading portfolio assets, and other asset categories.
Strategy
Shareholder
information
Climate and
sustainability report
Governance
Risk
review
Financial
review
Financial
statements
Barclays PLC 2024
Annual Report
on Form 20-F
289
Risk performance - Treasury and Capital risk (continued)
Deposit funding
2024
2023
Funding of loans and advances
Loans and
advances,debt
securities at
amortised cost
Deposits at
amortised cost
Loan: deposit
ratio1
Loan: deposit
ratio
As at 31 December 2024
£bn
£bn
%
%
Barclays UK
225
244
92
92
Barclays UK Corporate Bank
26
83
31
31
Barclays Private Bank and Wealth Management
15
70
21
23
Barclays Investment Bank
124
141
88
82
Barclays US consumer Bank
21
23
91
125
Head Office
3
—
Barclays Group
414
561
74
74
Note:
1The loan: deposit ratio is calculated as loans and advances at amortised cost and debt securities at amortised cost divided by deposits at amortised cost.
As at 31 December 2024, £233bn (2023: £224bn) of deposits at amortised cost were insured through the UK Financial Services
Compensation Scheme (FSCS) and other similar schemes. In addition to these customer deposits £8.0bn (2023: £5.6n) of other
liabilities are insured by other governments.
Contractually current accounts are repayable on demand and savings accounts at short notice. In practice, their observed maturity is
typically longer than their contractual maturity. Similarly, repayment profiles of certain types of assets e.g. mortgages, overdrafts and
credit card lending, differ from their contractual profiles. The Group therefore assesses the behavioural maturity of both customer
assets and liabilities to identify structural balance sheet funding gaps. In doing so, it applies quantitative modelling and qualitative
assessments which take into account historical experience, current customer composition, and macroeconomic projections.
The Group’s broad base of customers, numerically and by depositor type, helps protect against unexpected fluctuations in balances
and hence provides a stable funding base for the Group’s operations and liquidity needs.
Wholesale funding
Barclays Bank Group and Barclays Bank UK Group maintain access to a variety of sources of wholesale funds in major currencies,
including those available from term investors across a variety of distribution channels and geographies, short-term funding markets and
repo markets.
Barclays Bank Group has direct access to US, European and Asian capital markets through its global investment banking operations and
to long-term investors through its clients worldwide. Key sources of wholesale funding include money markets, certificates of deposit,
commercial paper, medium term issuances (including structured notes) and securitisations.
Key sources of wholesale funding for Barclays Bank UK Group include money markets, certificates of deposit, commercial paper,
covered bonds and other securitisations.
The Group expects to continue issuing public wholesale debt from Barclays PLC (the Parent company), in order to maintain compliance
with indicative MREL requirements and maintain a stable and diverse funding base by type, currency and market. During the year, the
Group issued £15.1bn of MREL instruments from Barclays PLC in a range of different currencies and tenors.
Barclays Bank PLC continued to issue in the shorter-term markets and medium-term notes programmes. Barclays Bank UK PLC
continued to issue in the shorter-term markets and maintain active secured funding programmes. This funding capacity enables the
respective entities to maintain their stable and diversified funding bases.
As at 31 December 2024, the Group’s total wholesale funding outstanding (excluding repurchase agreements) was £186.0bn (2023:
£176.8n), of which £20.5bn (2023: £19.0bn) was secured funding and £165.5bn (2023: £157.8bn) unsecured funding. Unsecured
funding includes £78.9bn (2023: £69.2bn) of privately placed senior unsecured notes issued through a variety of distribution channels
including intermediaries and private banks.
Wholesale funding of £55.0bn (2023: £58.6bn) matures in less than one year, representing 30% (December 2023: 33%) of total
wholesale funding outstanding. This includes £22.0bn (2023: £18.7bn) related to term funding2. Although not a requirement, the
liquidity pool exceeded the wholesale funding maturing in less than one year by £242bn (2023: £239bn).
Barclays Bank Group and Barclays Bank UK Group also support various central bank monetary initiatives, such as the Bank of England’s
Term Funding Scheme with additional incentives for SMEs (TFSME), and the European Central Bank’s Targeted Long-Term Refinancing
Operations (TLTRO). These are reported under ‘repurchase agreements and other similar secured borrowing’ on the balance sheet.
In 2024, Barclays fully repaid its entire outstanding TLTRO balance of £0.5bn. In addition, Barclays repaid £3.6bn of its TFSME drawings
reducing its outstanding balance to £18.4bn at year end.
Strategy
Shareholder
information
Climate and
sustainability report
Governance
Risk
review
Financial
review
Financial
statements
Barclays PLC 2024
Annual Report
on Form 20-F
290
Risk performance - Treasury and Capital risk (continued)
Maturity profile of wholesale funding1,2
<1 month
1-3
months
3-6
months
6-12
months
<1 year
1-2 years
2-3 years
3-4 years
4-5 years
>5 years
Total
£bn
£bn
£bn
£bn
£bn
£bn
£bn
£bn
£bn
£bn
£bn
Barclays PLC (the Parent company)
Senior unsecured (Public benchmark)
—
1.6
—
—
1.6
9.8
5.9
7.8
4.6
23.8
53.5
Senior unsecured (Privately placed)
—
—
—
—
—
—
—
—
0.1
0.9
1.0
Subordinated liabilities
—
—
—
—
—
1.7
—
1.6
—
7.3
10.6
Barclays Bank PLC (including
subsidiaries)
Certificates of deposit and commercial
paper
0.7
7.3
5.2
4.4
17.6
0.7
—
—
—
—
18.3
Asset backed commercial paper
2.4
8.8
1.3
—
12.5
—
—
—
—
—
12.5
Senior unsecured (Public benchmark)
—
—
—
—
—
—
—
—
—
—
—
Senior unsecured (Privately placed)3
1.9
3.4
4.5
8.6
18.4
9.3
11.0
8.3
9.8
20.9
77.7
Asset backed securities
—
—
0.8
0.8
1.6
0.5
—
0.7
0.1
2.6
5.5
Subordinated liabilities
—
0.2
0.1
0.1
0.4
0.4
0.1
—
—
0.4
1.3
Barclays Bank UK PLC (including
subsidiaries)
Certificates of deposit and commercial
paper
2.9
—
—
—
2.9
—
—
—
—
—
2.9
Senior unsecured (Privately placed)
—
—
—
—
—
—
—
—
—
0.2
0.2
Covered bonds
—
—
—
—
—
—
0.5
0.2
0.5
0.7
1.9
Asset backed securities
—
—
—
—
—
0.6
—
—
—
—
0.6
Total as at 31 December 2024
7.9
21.3
11.9
13.9
55.0
23.0
17.5
18.6
15.1
56.8
186.0
Of which secured
2.4
8.8
2.1
0.8
14.1
1.1
0.5
0.9
0.6
3.3
20.5
Of which unsecured
5.5
12.5
9.8
13.1
40.9
21.9
17.0
17.7
14.5
53.5
165.5
Total as at 31 December 2023
7.5
19.6
13.9
17.6
58.6
20.3
20.4
11.7
13.5
52.3
176.8
Of which secured
2.4
8.2
1.1
1.0
12.7
1.2
0.5
0.5
0.3
3.8
19.0
Of which unsecured
5.1
11.4
12.8
16.6
45.9
19.1
19.9
11.2
13.2
48.5
157.8
Notes:
1The composition of wholesale funds comprises the balance sheet reported financial liabilities at fair value, debt securities in issue and subordinated liabilities. It does not include
participation in the central bank facilities reported within repurchase agreements and other similar secured borrowing.
2Term funding comprises public benchmark and privately placed senior unsecured notes, covered bonds, asset-backed securities and subordinated debt where the original maturity of
the instrument was more than one year.
3Includes structured notes of £63.5bn, of which £15.5bn matures within one year.
Currency composition of wholesale debt
As at 31 December 2024, the proportion of wholesale funding by major currencies was as follows:
Currency composition of wholesale funding
USD
EUR
GBP
Other
%
%
%
%
Certificates of deposit and commercial paper
72
24
3
1
Asset backed commercial paper
87
5
8
—
Senior unsecured (Public benchmark)
65
19
12
4
Senior unsecured (Privately placed)
59
18
5
18
Covered bonds / Asset backed securities
76
12
12
—
Subordinated liabilities
76
7
15
2
Total as at 31 December 2024
66
18
7
9
Total as at 31 December 2023
64
19
8
9
To manage cross currency refinancing risk, the Group manages to currency mismatch limits, which limit risk at specific maturities.
Strategy
Shareholder
information
Climate and
sustainability report
Governance
Risk
review
Financial
review
Financial
statements
Barclays PLC 2024
Annual Report
on Form 20-F
291
Risk performance - Treasury and Capital risk (continued)
Contractual maturity of financial assets and liabilities
The table below provides detail on the contractual maturity of all financial instruments and other assets and liabilities. Derivatives (other
than those designated in a hedging relationship) and trading portfolio assets and liabilities are included in the ‘not more than one month'
column at their fair value. Liquidity risk on these items is not managed on the basis of contractual maturity since they are not held for
settlement according to such maturity and will frequently be settled before contractual maturity at fair value. Derivatives designated in a
hedging relationship are included according to their contractual maturity.
Contractual maturity of financial assets and liabilities (audited)
As at 31 December 2024
Not more
than one
month
Over one
month but
not more
than three
months
Over three
months but
not more
than six
months
Over six
months but
not more
than one year
Over one
year but not
more than
three years
Over three
years but not
more than
five years
Over five
years
Total
£m
£m
£m
£m
£m
£m
£m
£m
Assets
Cash and balances at central banks
210,184
—
—
—
—
—
—
210,184
Cash collateral and settlement balances
82,661
37,182
—
—
—
—
—
119,843
Debt securities at amortised cost
233
1,009
2,218
3,591
20,231
12,400
28,528
68,210
Loans and advances at amortised cost to banks
and customers
24,290
6,237
8,327
18,544
57,020
32,755
199,100
346,273
Reverse repurchase agreements and other
similar secured lending
1,390
37
292
359
1,676
980
—
4,734
Trading portfolio assets
166,453
—
—
—
—
—
—
166,453
Financial assets at fair value through the income
statement
152,935
11,628
4,489
4,494
10,174
5,568
4,446
193,734
Derivative financial instruments
291,006
293
512
710
783
79
147
293,530
Financial assets at fair value through other
comprehensive income
1,473
1,067
351
944
14,239
23,511
36,474
78,059
Assets included in disposal groups classified as
held for sale
—
3,710
—
—
6,144
—
—
9,854
Other financial assets
786
29
55
18
2
—
1
891
Total financial assets
931,411
61,192
16,244
28,660
110,269
75,293
268,696
1,491,765
Other assets
26,437
Total assets
1,518,202
Liabilities
Deposits at amortised cost from banks and
customers
450,889
40,688
34,512
26,999
5,283
1,505
787
560,663
Cash collateral and settlement balances
76,655
29,574
—
—
—
—
—
106,229
Repurchase agreements and other similar
secured borrowing
18,771
1,823
84
8,537
10,200
—
—
39,415
Debt securities in issue
2,928
16,868
5,859
3,469
17,477
15,378
30,423
92,402
Subordinated liabilities
—
96
65
80
2,126
1,583
7,971
11,921
Trading portfolio liabilities
56,908
—
—
—
—
—
—
56,908
Financial liabilities designated at fair value
160,429
23,084
16,739
15,328
28,320
19,050
19,274
282,224
Derivative financial instruments
278,616
27
18
17
282
263
192
279,415
Liabilities included in disposal groups classified as
held for sale
—
3,726
—
—
—
—
—
3,726
Other financial liabilities
4,957
4
30
61
202
140
739
6,133
Total financial liabilities
1,050,153
115,890
57,307
54,491
63,890
37,919
59,386
1,439,036
Other liabilities
6,685
Total liabilities
1,445,721
Strategy
Shareholder
information
Climate and
sustainability report
Governance
Risk
review
Financial
review
Financial
statements
Barclays PLC 2024
Annual Report
on Form 20-F
292
Risk performance - Treasury and Capital risk (continued)
Contractual maturity of financial assets and liabilities (audited)
As at 31 December 2023
Not more
than one
month
Over one
month but
not more
than three
months
Over three
months but
not more
than six
months
Over six
months but
not more
than one year
Over one
year but not
more than
three years
Over three
years but not
more than
five years
Over five
years
Total
£m
£m
£m
£m
£m
£m
£m
£m
Assets
Cash and balances at central banks
224,634
—
—
—
—
—
—
224,634
Cash collateral and settlement balances
61,837
47,052
—
—
—
—
—
108,889
Debt securities at amortised cost
3
4,779
579
4,700
16,626
12,113
17,949
56,749
Loans and advances at amortised cost to banks
and customers
22,457
5,907
9,929
16,366
50,126
33,340
204,622
342,747
Reverse repurchase agreements and other similar
secured lending
1,435
—
—
34
1,123
—
2
2,594
Trading portfolio assets
174,605
—
—
—
—
—
—
174,605
Financial assets at fair value through the income
statement
158,213
17,761
6,214
5,902
11,119
2,966
4,476
206,651
Derivative financial instruments
254,655
100
91
160
1,070
533
227
256,836
Financial assets at fair value through other
comprehensive income
1,789
2,421
365
8,699
12,424
17,179
28,959
71,836
Assets included in disposal groups classified as
held for sale
—
—
—
3,916
—
—
—
3,916
Other financial assets
2,122
26
36
9
1
1
2
2,197
Total financial assets
901,750
78,046
17,214
39,786
92,489
66,132
256,237
1,451,654
Other assets
25,833
Total assets
1,477,487
Liabilities
Deposits at amortised cost from banks and
customers
440,122
36,812
22,665
29,464
7,691
1,321
714
538,789
Cash collateral and settlement balances
65,227
28,857
—
—
—
—
—
94,084
Repurchase agreements and other similar
secured borrowing
12,164
12,433
1,307
247
8,279
7,092
79
41,601
Debt securities in issue
5,535
17,004
9,949
7,286
17,558
12,079
27,414
96,825
Subordinated liabilities
—
121
—
584
1,987
1,554
6,248
10,494
Trading portfolio liabilities
58,669
—
—
—
—
—
—
58,669
Financial liabilities designated at fair value
180,554
31,587
13,867
14,579
23,469
13,994
19,489
297,539
Derivative financial instruments
249,481
21
—
24
82
64
372
250,044
Liabilities included in disposal groups classified as
held for sale
—
—
—
3,164
—
—
—
3,164
Other financial liabilities
6,492
265
40
77
266
182
377
7,699
Total financial liabilities
1,018,244
127,100
47,828
55,425
59,332
36,286
54,693
1,398,908
Other liabilities
6,715
Total liabilities
1,405,623
Expected maturity date may differ from the contractual dates, to account for:
•trading portfolio assets and liabilities and derivative financial instruments, which may not be held to maturity as part of the Group’s trading
strategies
•corporate and retail deposits, reported under deposits at amortised cost, are repayable on demand or at short notice on a contractual basis.
In practice, their behavioural maturity is typically longer than their contractual maturity, and therefore these deposits provide stable funding
for the Group’s operations and liquidity needs because of the broad base of customers, both numerically and by depositor type
•loans to corporate and retail customers, which are included within loans and advances at amortised cost and financial assets at fair value, may
be repaid earlier in line with terms and conditions of the contract
•debt securities in issue, subordinated liabilities, and financial liabilities designated at fair value, may include early redemption features.
Strategy
Shareholder
information
Climate and
sustainability report
Governance
Risk
review
Financial
review
Financial
statements
Barclays PLC 2024
Annual Report
on Form 20-F
293
Risk performance - Treasury and Capital risk (continued)
Contractual maturity of financial liabilities on an undiscounted basis
The table below presents the cash flows payable by the Group under financial liabilities by remaining contractual maturities at the
balance sheet date. The amounts disclosed in the table are the contractual undiscounted cash flows of all financial liabilities (i.e. nominal
values).
The balances in the below table do not agree directly to the balances in the consolidated balance sheet as the table incorporates all
cash flows, on an undiscounted basis, related to both principal as well as those associated with all future coupon payments.
Derivative financial instruments held for trading and trading portfolio liabilities are included in the 'not more than one month' column at
their fair value.
Contractual maturity of financial liabilities - undiscounted (audited)
Not more
than one
month
Over one
month but
not more
than three
months
Over three
months but
not more
than six
months
Over six
months but
not more
than one year
Over one
year but not
more than
three years
Over three
years but not
more than
five years
Over five
years
Total
£m
£m
£m
£m
£m
£m
£m
£m
As at 31 December 2024
Deposits at amortised cost from banks and
customers
451,093
40,992
34,963
27,670
5,579
1,752
1,025
563,074
Cash collateral and settlement balances
76,658
29,745
—
—
—
—
—
106,403
Repurchase agreements and other similar
secured borrowing
18,790
1,832
84
8,822
10,953
—
—
40,481
Debt securities in issue
2,937
16,981
5,938
3,593
18,365
17,563
46,183
111,560
Subordinated liabilities
—
96
65
80
2,283
1,777
10,726
15,027
Trading portfolio liabilities
56,908
—
—
—
—
—
—
56,908
Financial liabilities designated at fair value
160,604
23,256
16,968
15,709
29,999
21,427
34,407
302,370
Derivative financial instruments
278,620
27
18
17
304
307
403
279,696
Liabilities included in disposal groups classified as
held for sale
—
3,726
—
—
—
—
—
3,726
Other financial liabilities
4,963
16
49
96
322
239
4,149
9,834
Total financial liabilities
1,050,573
116,671
58,085
55,987
67,805
43,065
96,893
1,489,079
As at 31 December 2023
Deposits at amortised cost from banks and
customers
440,184
37,101
23,055
30,377
8,107
1,540
882
541,246
Cash collateral and settlement balances
65,230
29,096
—
—
—
—
—
94,326
Repurchase agreements and other similar
secured borrowing
12,196
12,516
1,326
252
9,042
7,902
213
43,447
Debt securities in issue
5,546
17,142
10,121
7,481
18,674
13,688
40,154
112,806
Subordinated liabilities
—
121
—
601
2,241
1,822
8,594
13,379
Trading portfolio liabilities
58,669
—
—
—
—
—
—
58,669
Financial liabilities designated at fair value
180,687
31,794
14,174
15,013
24,891
15,309
34,035
315,903
Derivative financial instruments
249,482
21
—
24
90
75
705
250,397
Liabilities included in disposal groups classified as
held for sale
—
—
—
3,164
—
—
—
3,164
Other financial liabilities
6,492
269
45
89
309
220
615
8,039
Total financial liabilities
1,018,486
128,060
48,721
57,001
63,354
40,556
85,198
1,441,376
Strategy
Shareholder
information
Climate and
sustainability report
Governance
Risk
review
Financial
review
Financial
statements
Barclays PLC 2024
Annual Report
on Form 20-F
294
Risk performance - Treasury and Capital risk (continued)
Maturity of off-balance sheet commitments given
The table below presents the maturity split of the Group’s off-balance sheet commitments given at the balance sheet date. The
amounts disclosed in the table are the undiscounted cash flows (i.e. nominal values) on the basis of earliest opportunity at which they
are available.
Maturity analysis of off-balance sheet commitments given (audited)
Not more than
one month
Over one month
but not more
than three
months
Over three months
but not more than
six months
Over six months
but not more
than one year
Over one
year but not
more than
three years
Over three years
but not more
than five years
Over five
years
Total
£m
£m
£m
£m
£m
£m
£m
£m
As at 31 December 2024
Contingent liabilities and financial
guarantees
25,322
22
1
1
—
—
—
25,346
Documentary credits and other short-
term trade related transactions
1,432
1
—
—
—
—
—
1,433
Standby facilities, credit lines and other
commitments1
421,648
—
—
—
68
—
—
421,716
Total off-balance sheet
commitments given
448,402
23
1
1
68
—
—
448,495
As at 31 December 2023
Contingent liabilities and financial
guarantees
25,217
119
2
1
1
—
—
25,340
Documentary credits and other short-
term trade related transactions
2,348
3
1
—
—
—
—
2,352
Standby facilities, credit lines and other
commitments1
388,030
—
—
—
55
—
—
388,085
Total off-balance sheet
commitments given
415,595
122
3
1
56
—
—
415,777
Note:
1Includes exposures relating to financial assets classified as assets held for sale.
Strategy
Shareholder
information
Climate and
sustainability report
Governance
Risk
review
Financial
review
Financial
statements
Barclays PLC 2024
Annual Report
on Form 20-F
295
Risk performance - Treasury and Capital risk (continued)
Capital risk
All disclosures in this section are unaudited
unless otherwise stated.
Overview
The CET1 ratio, among other metrics, is a
measure of the capital strength and
resilience of Barclays. Maintenance of our
capital resources is vital in order to meet
the overall regulatory capital requirement,
to withstand the impact of the risks that
may arise under normal and stressed
conditions, and maintain adequate capital
to cover current and forecast business
needs and associated risks to provide a
viable and sustainable business offering.
This section provides an overview of the
Group’s: (i) CET1 capital, leverage and own
funds and eligible liabilities requirements;
(ii) capital resources; (iii) risk weighted
assets (RWAs); (iv) leverage ratios and
exposures; and (v) own funds and eligible
liabilities.
More details on monitoring and managing
capital risk may be found in the risk
management sections of the Barclays PLC
Pillar 3 Report 2024 (unaudited).
Significant regulatory updates in the
period
Following its 12 December 2023
publication of ‘Implementation of the Basel
3.1 standards near-final part 1’ (PS17/23),
covering Credit Valuation Adjustments,
Counterparty Credit Risk, Market Risk and
Operational Risk, on 12 September 2024
the PRA published its near-final policy
statement ‘Implementation of the Basel
3.1 standards near-final part 2’ (PS9/24)
covering the remaining aspects of the
Basel 3.1 standards. This covered Credit
Risk, Credit Risk Mitigation, the Output
Floor, and Reporting and Disclosure
requirements. On 17 January 2025 the
PRA announced a delay in the
implementation of Basel 3.1 in the UK until
1 January 2027.
Key metrics
Common Equity Tier 1 ratio
13.6%
UK leverage ratio
5.0%
Own funds and eligible liabilities ratio as a
percentage of RWAs
34.4%
Summary of performance in the
period
The Group continues to be in excess of
overall capital, leverage and MREL
regulatory requirements.
The reported CET1 ratio decreased by
c.20bps to 13.6% (December 2023:
13.8%) as RWAs increased by £15.4bn to
£358.1bn partially offset by an increase in
CET1 capital of £1.3bn to £48.6bn.
Excluding the c.20bps decrease as a result
of the acquisition of Tesco Bank,
significant movements in the year were:
▪c.140bps increase from attributable
profit including other inorganic activity
▪c.80bps decrease driven by shareholder
distributions including the completed
share buybacks announced with FY23
and H124 results and an accrual for the
FY24 dividend
▪c.30bps decrease from other capital
movements including decreases in the
other qualifying reserves
▪c.30bps decrease as a result of an
£8.4bn increase in RWAs, including
strategic growth in lending within UKCB
and Barclays UK and regulatory driven
methodology changes
The UK leverage ratio decreased to 5.0%
(December 2023: 5.2%) due to an increase
in exposure of £38.2bn to £1,206.5bn
(December 2023: £1,168.3bn). The
increase in exposure was largely driven by
an increase in derivatives in Global
Markets, and the acquisition of Tesco
Bank.
Minimum capital requirements
As at 31 December 2024, the Group’s
Overall Capital Requirement for CET1
remained at 12.0% comprising a 4.5% Pillar
1 minimum, a 2.5% Capital Conservation
Buffer (CCB), a 1.5% Global Systemically
Important Institution (G-SII) buffer, a 2.6%
Pillar 2A requirement and a 1.0%
Countercyclical Capital Buffer (CCyB).
The Group’s CCyB is based on the buffer
rate applicable for each jurisdiction in which
the Group has exposures. The buffer rates
set by other national authorities for non-
UK exposures are not currently material.
The Group’s Pillar 2A requirement as per
the PRA's Individual Capital Requirement
was 4.6% with at least 56.25% to be met
with CET1 capital, equating to 2.6% of
RWAs. The Pillar 2A requirement, based on
a point in time assessment, has been set
as a proportion of RWAs and is subject to
at least annual review.
The Group’s CET1 target ratio of 13-14%
takes into account minimum capital
requirements and applicable buffers. The
Group remains above its minimum capital
regulatory requirements and applicable
buffers.
Minimum leverage requirements
As at 31 December 2024, the Group was
subject to a UK leverage ratio requirement
of 4.1% as at 31 December 2024. This
comprises the 3.25% minimum
requirement, a G-SII additional leverage
ratio buffer (G-SII ALRB) of 0.53% and a
countercyclical leverage ratio buffer
(CCLB) of 0.3%.
The Group is also required to disclose an
average UK leverage ratio which is based
on capital on the last day of each month in
the quarter and an exposure measure for
each day in the quarter.
Minimum requirements for own
funds and eligible liabilities
As at 31 December 2024, the Group was
required to meet the higher of: (i) two
times the sum of 8% Pillar 1 and 4.6% Pillar
2A equating to 25.2% of RWAs; and (ii)
6.75% of leverage exposures. In addition,
the higher of regulatory capital and
leverage buffers apply. CET1 capital
cannot be counted towards both MREL
and the buffers, meaning that the buffers,
including the above mentioned
confidential institution-specific PRA buffer,
will effectively be applied above MREL
requirements.
Strategy
Shareholder
information
Climate and
sustainability report
Governance
Risk
review
Financial
review
Financial
statements
Barclays PLC 2024
Annual Report
on Form 20-F
296
Risk performance - Treasury and Capital risk (continued)
Capital resources
Capital ratios1, 2
As at 31 December
2024
2023
CET1
13.6%
13.8%
Tier 1 (T1)
16.9%
17.7%
Total regulatory capital
19.6%
20.1%
MREL ratio as a percentage of total RWAs
34.4%
33.6%
Own funds and eligible liabilities (audited)
2024
2023
As at 31 December
£m
£m
Total equity excluding non-controlling interests per the balance sheet
71,821
71,204
Less: other equity instruments (recognised as AT1 capital)
(12,075)
(13,259)
Adjustment to retained earnings for foreseeable ordinary share dividends
(786)
(795)
Adjustment to retained earnings for foreseeable other equity coupons
(35)
(43)
Other regulatory adjustments and deductions
Additional value adjustments (PVA)
(2,051)
(1,901)
Goodwill and intangible assets
(8,272)
(7,790)
Deferred tax assets that rely on future profitability excluding temporary differences
(1,451)
(1,630)
Fair value reserves related to gains or losses on cash flow hedges
2,930
3,707
Excess of expected losses over impairment
(403)
(296)
Gains or losses on liabilities at fair value resulting from own credit
981
136
Defined benefit pension fund assets
(2,367)
(2,654)
Direct and indirect holdings by an institution of own CET1 instruments
(1)
(20)
Adjustment under IFRS 9 transitional arrangements
138
288
Other regulatory adjustments
129
357
CET1 capital
48,558
47,304
AT1 capital
Capital instruments and related share premium accounts
12,108
13,263
Other regulatory adjustments and deductions
(32)
(60)
AT1 capital
12,076
13,203
T1 capital
60,634
60,507
T2 capital
Capital instruments and related share premium accounts
9,150
7,966
Qualifying T2 capital (including minority interests) issued by subsidiaries
367
569
Other regulatory adjustments and deductions
(33)
(160)
Total regulatory capital
70,118
68,882
Less : Ineligible T2 capital (including minority interests) issued by subsidiaries
(367)
(569)
Eligible liabilities
53,547
46,995
Total own funds and eligible liabilities3
123,298
115,308
Total RWAs (Unaudited)
358,127
342,717
Notes:
1CET1, T1 and T2 capital, and RWAs are calculated applying the transitional arrangements in accordance with UK CRR. This includes IFRS 9 transitional arrangements and the
grandfathering of certain capital instruments until 28 June 2025. Effective from 1 January 2025, the IFRS9 transitional arrangements no longer applied.
2The fully loaded CET1 ratio, as is relevant for assessing against the conversion trigger in Barclays PLC AT1 securities, was 13.5%, with £48.4bn of CET1 capital and £358.1bn of RWAs
calculated without applying the transitional arrangements in accordance with UK CRR.
3As at 31 December 2024, the Group's MREL requirement, excluding the PRA buffer, was to hold £108.0bn of own funds and eligible liabilities equating to 30.2% of RWAs. The Group
remains above its MREL regulatory requirement including the PRA buffer.
Strategy
Shareholder
information
Climate and
sustainability report
Governance
Risk
review
Financial
review
Financial
statements
Barclays PLC 2024
Annual Report
on Form 20-F
297
Risk performance - Treasury and Capital risk (continued)
Movement in CET1 capital
2024
£m
Opening balance as at 1 January
47,304
Profit for the period attributable to equity holders
6,307
Own credit relating to derivative liabilities
20
Ordinary share dividends paid and foreseen
(1,212)
Purchased and foreseeable share repurchase
(1,750)
Other equity coupons paid and foreseen
(983)
Increase in retained regulatory capital generated from earnings
2,382
Net impact of share schemes
235
Fair value through other comprehensive income reserve
(507)
Currency translation reserve
(46)
Other reserves
(108)
Decrease in other qualifying reserves
(426)
Pension remeasurements within reserves
(303)
Defined benefit pension fund asset deduction
287
Net impact of pensions
(16)
Additional value adjustments (PVA)
(150)
Goodwill and intangible assets
(482)
Deferred tax assets that rely on future profitability excluding those arising from temporary differences
179
Excess of expected loss over impairment
(107)
Direct and indirect holdings by an institution of own CET1 instruments
19
Adjustment under IFRS 9 transitional arrangements
(150)
Other regulatory adjustments
5
Decrease in regulatory capital due to adjustments and deductions
(686)
Closing balance as at 31 December
48,558
CET1 capital increased by £1.3bn to £48.6bn (December 2023: £47.3bn). Significant movements in the period were:
•£6.3bn of capital generated from profit partially offset by distributions of £3.9bn comprising:
–£1.8bn of completed share buybacks announced with FY23 and H124 results
–£1.2bn of ordinary share dividend paid and foreseen reflecting £0.4bn interim dividend paid and a £0.8bn accrual towards the FY24
dividend
–£1.0bn of equity coupons paid and foreseen
•£0.4bn decrease in other qualifying reserves including a £0.5bn reduction in the fair value through other comprehensive income
reserve primarily due to a decrease in EUR asset swap spreads
•£0.5bn increase in the goodwill and intangible assets deduction related to business acquisitions during the period, including Tesco
Bank's retail business
Strategy
Shareholder
information
Climate and
sustainability report
Governance
Risk
review
Financial
review
Financial
statements
Barclays PLC 2024
Annual Report
on Form 20-F
298
Risk performance - Treasury and Capital risk (continued)
Risk weighted assets
Risk weighted assets (RWAs) by risk type and business
Credit risk
Counterparty credit risk
Market risk
Operational
risk
Total RWAs
Std
IRB
Std
IRB
Settlement
risk
CVA
Std
IMA
As at 31 December 2024
£m
£m
£m
£m
£m
£m
£m
£m
£m
£m
Barclays UK
15,516
55,301
146
11
—
74
228
—
13,181
84,457
Barclays UK Corporate Bank
3,932
15,680
106
336
—
12
16
548
3,282
23,912
Barclays Private Bank & Wealth
Management
5,058
434
118
31
—
16
44
330
1,859
7,890
Barclays Investment Bank
40,957
49,231
21,889
24,094
70
2,913
12,442
23,023
24,164
198,783
Barclays US Consumer Bank
21,019
966
—
—
—
—
—
—
4,864
26,849
Head Office
6,580
8,162
1
20
—
4
—
212
1,257
16,236
Barclays Group
93,062
129,774
22,260
24,492
70
3,019
12,730
24,113
48,607
358,127
As at 31 December 2023
Barclays UK
10,472
50,761
178
—
—
94
274
—
11,715
73,494
Barclays UK Corporate Bank
3,458
13,415
262
167
—
14
2
541
3,024
20,883
Barclays Private Bank & Wealth
Management
4,611
455
182
27
—
30
1
322
1,546
7,174
Barclays Investment Bank
37,749
52,190
18,512
21,873
159
3,248
14,623
24,749
24,179
197,282
Barclays US Consumer Bank
19,824
966
—
—
—
—
—
—
4,051
24,841
Head Office
6,772
10,951
1
21
—
6
1
248
1,043
19,043
Barclays Group
82,886
128,738
19,135
22,088
159
3,392
14,901
25,860
45,558
342,717
Movement analysis of risk weighted assets
Credit risk
Counterparty
credit risk
Market risk
Operational risk
Total RWAs
Risk weighted assets
£m
£m
£m
£m
£m
As at 31 December 2023
211,624
44,774
40,761
45,558
342,717
Book size
2,786
4,623
(3,814)
2,328
5,923
Acquisitions and disposals
5,353
—
—
721
6,074
Book quality
(797)
(304)
—
—
(1,101)
Model updates
196
680
—
—
876
Methodology and policy
3,607
550
—
—
4,157
Foreign exchange movement1
67
(482)
(104)
—
(519)
Total RWA movements
11,212
5,067
(3,918)
3,049
15,410
As at 31 December 2024
222,836
49,841
36,843
48,607
358,127
Note:
1Foreign exchange movements does not include impact of foreign exchange for modelled market risk or operational risk.
Overall RWAs increased £15.4bn to £358.1bn (December 2023: £342.7bn).
Credit risk RWAs increased £11.2bn:
•A £2.8bn increase in book size primarily driven by strategic growth in lending within UKCB and Barclays UK
•A £5.4bn increase in acquisitions and disposals primarily driven by the acquisition of Tesco Bank's retail banking business, partially
offset by the sale of the Italian mortgage portfolio
•A £3.6bn increase in methodology and policy within Barclays UK and IB
Counterparty Credit risk RWAs increased £5.1bn:
•A £4.6bn increase in book size primarily driven by increased client derivative activity within Global Markets
Market risk RWAs decreased £3.9bn:
•A £3.8bn decrease in book size RWAs due to trading activity within Global Markets
Operational risk RWAs increased £3.0bn:
•A £2.3bn increase in book size primarily driven by the inclusion of higher 2024 income compared to 2021
Strategy
Shareholder
information
Climate and
sustainability report
Governance
Risk
review
Financial
review
Financial
statements
Barclays PLC 2024
Annual Report
on Form 20-F
299
Risk performance - Treasury and Capital risk (continued)
Leverage ratios and exposures
Leverage ratios1,2
2024
2023
As at 31 December
£m
£m
UK leverage ratio3
5.0%
5.2%
T1 capital
60,634
60,507
UK leverage exposure
1,206,502
1,168,275
Average UK leverage ratio
4.6%
4.8%
Average T1 capital
60,291
60,343
Average UK leverage exposure
1,308,335
1,266,880
Notes:
1Capital and leverage measures are calculated applying the transitional arrangements in accordance with UK CRR . This includes IFRS 9 transitional arrangements and the grandfathering
of certain capital instruments until 28 June 2025. Effective from 1 January 2025, the IFRS9 transitional arrangements no longer applied.
2 Fully loaded UK leverage ratio was 5.0%, with £60.5n of T1 capital and £1,206.4bn of leverage exposure. Fully loaded average UK leverage ratio was 4.6% with £60.2bn of T1 capital and
£1,308.2bn of leverage exposure. Fully loaded UK leverage ratios are calculated without applying the transitional arrangements in accordance with UK CRR.
3Although the leverage ratio is expressed in terms of T1 capital, the leverage ratio buffers and 75% of the minimum requirement must be covered solely with CET1 capital. The CET1
capital held against the 0.53% G-SII ALRB was £6.3bn and against the 0.3% CCLB was £3.6bn.
The UK leverage ratio decreased to 5.0% (December 2023: 5.2%) due to an increase in exposure of £38.2bn to £1,206.5bn (December
2023: £1,168.3bn). The increase in exposure was largely driven by an increase in derivatives in Global Markets, increased investment in
debt securities and the acquisition of Tesco Bank.
Strategy
Shareholder
information
Climate and
sustainability report
Governance
Risk
review
Financial
review
Financial
statements
Barclays PLC 2024
Annual Report
on Form 20-F
300
Risk performance - Treasury and Capital risk (continued)
Foreign exchange risk (audited)
The Group is exposed to two sources of foreign exchange risk.
a) Transactional foreign currency exposure
Transactional foreign currency exposures represent exposure on banking assets and liabilities, denominated in currencies other than
the functional currency of the transacting entity.
The Group’s risk management policies are designed to prevent the holding of significant open positions in foreign currencies outside
the trading portfolio managed by Barclays Investment bank which is monitored through VaR.
Banking book transactional foreign exchange risk outside of Barclays Investment bank is monitored on a daily basis by the market risk
function and minimised by the businesses.
b) Translational foreign exchange exposure
The Group’s investments in overseas subsidiaries and branches create capital resources denominated in foreign currencies, principally
USD and EUR. Changes in the GBP value of the net investments due to foreign currency movements are captured in the currency
translation reserve, resulting in a movement in CET1 capital.
The Group’s strategy is to minimise the volatility of the capital ratios caused by foreign exchange movements, by matching the CET1
capital movements to the revaluation of the Group’s foreign currency RWA exposures.
Functional currency of operations (audited)
Foreign currency
net investments
Borrowings which
hedge the net
investments
Derivatives which
hedge the net
investments
Structural
currency
exposures pre-
economic hedges
Other equity
Instruments
Remaining
structural currency
exposures
£m
£m
£m
£m
£m
£m
31 December 2024
USD
28,012
(6,243)
(2,230)
19,539
(5,846)
13,693
EUR
9,549
(5,655)
—
3,894
(264)
3,630
INR
1,403
—
(992)
411
—
411
JPY
628
(215)
—
413
—
413
Other currencies
2,037
(76)
(792)
1,169
(849)
320
Total
41,629
(12,189)
(4,014)
25,426
(6,959)
18,467
31 December 2023
USD
26,524
(7,308)
(2,179)
17,037
(7,326)
9,711
EUR
9,868
(5,603)
—
4,265
(276)
3,989
INR
1,287
0
(891)
396
0
396
JPY
646
(174)
—
472
—
472
Other currencies
2,042
(72)
(674)
1,296
(505)
791
Total
40,367
(13,157)
(3,744)
23,466
(8,107)
15,359
Other equity instruments relate to exposures arising on foreign currency denominated preference share and AT1 instruments. These
are accounted for at historical cost under IFRS and do not qualify as hedges for accounting purposes. The gain or loss arising from
changes in the GBP value of these instruments is recognised on redemption in retained earnings.
During 2024, total structural currency exposure net of hedging instruments increased by £3.1bn to £18.5bn (2023: £15.4bn). Foreign
currency net investments increased by £1.2bn to £41.6bn (2023: £40.4bn) driven predominantly by a£1.4bn increase in USD & increase
in INR by £0.1bn, offset by £0.3bn decrease in EUR. The hedges (excluding economic hedges) associated with these investments
decreasedby £0.7bn to £16.2bn (2023: £16.9bn).
Pension risk review
The UK Retirement Fund (UKRF) represents approximately 96% (2023: 96%) of the Group’s total retirement benefit obligations globally.
As such this risk review section focuses exclusively on the UKRF. The UKRF is closed to new entrants and there is no new final salary
benefit being accrued. Existing active members accrue a combination of a cash balance benefit and a defined contribution element.
Pension risk arises as the market value of the pension fund assets may decline, investment returns may reduce or the estimated value
of the pension liabilities may increase.
Refer to the Management of pension risk section in the Barclays PLC Pillar 3 Report 2024 (unaudited) for more information on how
pension risk is managed.
Assets
The Trustee Board of the UKRF defines its overall long-term investment strategy with investments across a broad range of asset
classes. This results in a diversified mix of return seeking assets as well as liability matching assets to better match future pension
obligations. The two largest risks within the asset portfolio are credit spread and growth assets. The split of scheme assets is shown
within Note 32 to the financial statements. The fair value of the UKRF assets was £21.9bn as at 31 December 2024 (2023: £24.2bn).
Strategy
Shareholder
information
Climate and
sustainability report
Governance
Risk
review
Financial
review
Financial
statements
Barclays PLC 2024
Annual Report
on Form 20-F
301
Risk performance - Treasury and Capital risk (continued)
Liabilities
The UKRF retirement benefit obligations are a series of future cash flows with relatively long duration. On an IAS 19 basis these cash
flows are sensitive to changes in the expected long-term price inflation rate (RPI) and the discount rate (GBP AA corporate bond yield):
•An increase in long-term expected inflation corresponds to an increase in liabilities;
•A decrease in the discount rate corresponds to an increase in liabilities.
Pension risk is generated through the Group’s defined benefit schemes and this risk is set to reduce over time as the main defined
benefit scheme is closed to new entrants. The chart below outlines the shape of the UKRF’s liability cash flow profile as at 31 December
2024 that takes account of the future inflation indexing of payments to beneficiaries. The majority of the cash flows (approximately
97%) fall between 0 and 40 years, peaking between 11 and 20 years and reducing thereafter. The shape may vary depending on
changes to inflation and longevity expectations and any members who elect to transfer out. Transfers out will bring forward the liability
cash flows.
For more detail on the UKRF’s financial and demographic assumptions, see Note 32 to the financial statements.
Proportion of liability cash flows
(%)
n
0-10 years
32.7
n
11-20 years
33.3
n
21-30 years
21.1
n
31-40 years
10
n
41-50 years
2.7
n
51+ years
0.2
Net IAS 19 position
(£bn)
6
5
4
3
2
1
0
The graph above shows the evolution of the UKRF’s net IAS 19 position over the last four years. During 2024 the decrease in the UKRF
surplus was driven by changes in market conditions, primarily due to the high rates environment.
Refer to Note 32 to the financial statements for the sensitivity of the UKRF to changes in key assumptions.
Risk measurement
In line with Barclays’ risk management framework, the assets and liabilities of the UKRF are modelled within a VaR framework to show
the volatility of the pension position at a total portfolio level. This enables the risks, diversification and liability matching characteristics of
the UKRF obligations and investments to be adequately captured. VaR is measured and monitored on a quarterly basis. Risks are
reviewed and reported regularly at the Pensions Executive Board. The VaR model takes into account the valuation of the liabilities on an
IAS 19 basis (see Note 32 to the financial statements). The Trustee receives quarterly VaR measures on a funding basis.
The pension liability is also sensitive to post-retirement mortality assumptions which are reviewed regularly (See Note 32 to the
financial statements). To mitigate part of this risk the UKRF has entered into longevity reinsurance contracts approximately 70% of
current pensioner liabilities.
In addition, the impact of pension risk to the Group is taken into account as part of the stress testing process. Stress testing is
performed internally on at least an annual basis. The UKRF exposure is also included as part of regulatory stress tests.
Barclays defined benefit pension schemes affects capital in two ways:
•An IAS 19 deficit is treated as a liability on the Group’s balance sheet. Movement in a deficit due to remeasurements, including
actuarial losses, are recognised immediately through Other Comprehensive Income and as such reduces shareholders’ equity and
CET1 capital. An IAS 19 surplus is treated as an asset on the balance sheet and increases shareholders’ equity; however, it is
deducted for the purposes of determining CET1 capital.
•In the Group’s statutory balance sheet an IAS 19 surplus or deficit is partially offset by a deferred tax liability or asset respectively.
These may or may not be recognised for calculating CET1 capital depending on the overall deferred tax position of the Group at the
particular time.
Pension risk is taken into account in the Pillar 2A capital assessment undertaken by the PRA at least annually. The Pillar 2A requirement
forms part of the overall capital requirement for the Group.
Strategy
Shareholder
information
Climate and
sustainability report
Governance
Risk
review
Financial
review
Financial
statements
Barclays PLC 2024
Annual Report
on Form 20-F
302
Risk performance - Treasury and Capital risk (continued)
Interest rate risk in the banking
book
All disclosures in this section are unaudited
unless otherwise stated.
Overview
The treasury and capital risk framework
covers interest rate sensitive exposures
held in the banking book, mostly relating to
amortised cost accounted and fair value
through other comprehensive income
(FVOCI) instruments. The potential
volatility of net interest income is
measured by an Annual Earnings at Risk
(AEaR) metric which is monitored regularly
and reported to senior management and
the Barclays PLC Board Risk Committee as
part of the limit monitoring framework.
For further detail on the interest rate risk in
the banking book governance and
framework refer to page 178 of the
Barclays PLC Pillar 3 Report 2024
(unaudited).
Key metrics
AEaR
-£44m
AEaR across the Group from a -25bps
Shock to forward interest rate curves.
Summary of performance in the
period
Net Interest Income (NII) sensitivity to
interest rate shocks has decreased year on
year due to changes in the customer
banking book's composition as well as
changes in currency composition. NII
sensitivity asymmetry is due to the timing
impact of customer rate changes following
a rate shock and is also impacted by
changes in balance sheet composition.
Net interest income sensitivity
The table below shows a sensitivity
analysis on pre-tax net interest income for
non-traded financial assets and liabilities,
including the effect of any hedging. This
analysis is not a forward guidance on NII
and is intended as a quantification of risk
exposure utilising the NII metric as
described on page 178 of the Barclays PLC
Pillar 3 Report 2024 (unaudited), which
includes documentation of the main model
assumptions.
Net interest income sensitivity (AEaR) by currency (audited)
2024
2023
+25 basis points
-25 basis points
+25 basis points
-25 basis points
As at 31 December
£m
£m
£m
£m
GBP
56
(76)
(1)
(33)
USD
(30)
30
17
(18)
EUR
(5)
5
20
(21)
Other currencies
3
(3)
(15)
15
Total
24
(44)
21
(57)
Strategy
Shareholder
information
Climate and
sustainability report
Governance
Risk
review
Financial
review
Financial
statements
Barclays PLC 2024
Annual Report
on Form 20-F
303
Risk performance - Treasury and Capital risk (continued)
Analysis of equity sensitivity
Equity sensitivity measures the overall impact of a +/-25bps movement in interest rates on retained earnings, FVOCI, cash flow hedge
reserves and pensions. For non-NII items a DV01 metric is used, which is an indicator of the shift in value for a 1bp movement in the
yield curve.
Analysis of equity sensitivity (audited)
2024
2023
+25 basis
points
-25 basis
points
+25 basis
points
-25 basis
points
As at 31 December
£m
£m
£m
£m
Net interest income
24
(44)
21
(57)
Taxation effects on the above
(6)
11
(5)
13
Effect on profit for the year
18
(33)
16
(44)
As percentage of net profit after tax
0.3%
(0.5%)
0.3%
(0.8%)
Effect on profit for the year (per above)
18
(33)
16
(44)
Fair value through other comprehensive income reserve
(189)
196
(246)
254
Cash flow hedge reserve
(907)
907
(744)
744
Taxation effects on the above1
307
(309)
228
(230)
Effect on equity
(771)
761
(746)
724
As percentage of equity
(1.1%)
1.0%
(1.0%)
1.0%
Note:
The 2024 methodology has been updated to reflect the expected tax rates of each component impacting equity.
Movements in the FVOCI reserve impact CET1 capital. However, movements in the cash flow hedge reserve and pensions
remeasurement reserve recognised in FVOCI do not affect CET1 capital.
Volatility of the FVOCI portfolio in the liquidity pool
Changes in value of FVOCI exposures flow directly through capital via the FVOCI reserve. The volatility of the value of the FVOCI
investments in the liquidity pool is captured and managed through a value measure rather than an earning measure, i.e. non-traded
market risk VaR.
Although the underlying methodology to calculate the non-traded VaR is identical to the one used in traded management VaR, the two
measures are not directly comparable. The non-traded VaR represents the volatility to capital driven by the FVOCI exposures. These
exposures are in the banking book and do not meet the criteria for trading book treatment.
Analysis of volatility of the FVOCI portfolio in the liquidity pool
2024
2023
Average
High
Low
Average
High
Low
For the year ended 31 December
£m
£m
£m
£m
£m
£m
Non-traded market value at risk (daily, 95%)
61
70
50
76
90
61
Daily Value at Risk has been lower on an average in 2024 relative to 2023 driven by a combination of position changes and market
volatility reduction.
Strategy
Shareholder
information
Climate and
sustainability report
Governance
Risk
review
Financial
review
Financial
statements
Barclays PLC 2024
Annual Report
on Form 20-F
304
Risk performance - Operational risk
Operational risk
All disclosures in this section are unaudited unless otherwise stated.
Overview
Operational risks are inherent in the
Group’s business activities, and it is not
cost effective or possible to attempt to
eliminate all operational risks. The
Operational Risk Framework is therefore
focused on identifying operational risks,
assessing them and managing them within
the Group’s approved risk appetite
The Operational Risk principal risk
comprises the following risks: Change
Delivery Management Risk, Data and
Records Management Risk; Financial
Reporting Risk; Fraud Risk; Information
Security Risk; Operational Recovery
Planning Risk; Payments Process Risk;
People Risk; Physical Security Risk;
Premises Risk; Risk Reporting; Supplier
Risk; Tax Risk; Technology Risk and
Transaction Operations Risk. The
operational risk profile is also informed by a
number of Connected Risks: Data,
Resilience, Third Party Service Provider
and Model Connected Risk. These
Connected Risks represent threats to the
Group that extend across multiple risk
types, and therefore require an integrated
risk approach to reporting and monitoring
the risk exposure.
For definitions of these risks refer to pages
180 to 185 of the Barclays PLC Pillar 3
Report 2024. To provide complete
coverage of the potential adverse impacts
on the Group arising from operational risk,
the Operational Risk Taxonomy extends
beyond the risks listed above to cover
operational risks associated with other
Principal Risks too
This section provides an analysis of the
Group’s operational risk profile, including
events above the Group’s reportable
threshold, which have had a financial
impact in 2024. The Group’s operational
risk profile is informed by bottom-up risk
assessments undertaken by each business
unit and top-down qualitative review for
each risk type. Fraud, Transaction
Operations, Information Security and
Technology continue to be highlighted as
key operational risk exposures.
For information on compliance risk events,
see the compliance risk section.
Key metrics
86%
of the Group’s net reportable operational
risk events had a loss value of £50,000 or
less
84%
of events by number are due to External
Fraud
44%
of losses are from events aligned to
External Fraud
35%
of losses are from events aligned to
Execution, Delivery and Process
Management
Summary of performance
in the period
During 2024, total operational risk losses1
reduced to £124m (2023: £141m) while
the number of recorded events for 2024
(2395) decreased from the level for 2023
(2,925). The total operational risk losses
for the year were mainly driven by events
falling within the Execution, Delivery &
Process Management and External Fraud
categories, which tend to be high volume
but low impact events.
Operational risk profile
Within operational risk, there are a large
number of smaller value risk events. In
2024,86% (2023: 83%) of the Group’s
reportable operational risk events by
volume had a value of less than £50,000
each. Cumulatively, events under this
£50,000 threshold accounted for only 31%
(2023:34%) of the Group’s total net
operational risk losses. A small proportion
of operational risk events have a material
impact on the financial results of the
Group.
Strategy
Shareholder
information
Climate and
sustainability report
Governance
Risk
review
Financial
review
Financial
statements
Barclays PLC 2024
Annual Report
on Form 20-F
305
Risk performance - Operational risk (continued)
The analysis below presents the Group’s operational risk events
by Basel event category:
Operational risk events by BASEL
event category1
% of total risk events by count
% of total risk events by value
Internal fraud
Internal fraud
2024
2023
External fraud
2024
2023
Execution delivery
and process management
2024
2023
Employment practices
and workplace safety
2024
2023
Damage to physical assets
2024
2023
Clients, products
and business practices
2024
2023
Business disruption
and system failures
2024
2023
Note
1The data disclosed includes operational risk losses for reportable events impacting the Barclays Group business
areas, having impact of > £10,000 and excludes events that are compliance or legal risk, aggregate and boundary
events. A boundary event is an operational risk event that results in a credit risk impact. Due to the nature of risk
events that keep evolving, prior year losses are updated.
In assessing the financial performance of the Group, management uses a range of KPIs which focus on the Group’s financial strength,
the delivery of sustainable returns and cost management. KPIs reflect the targets and ambitions followed during 2024.
Non-IFRS performance measures
The Group’s management believes that the non-IFRS performance measures included in this document provide valuable information
to the readers of the financial statements as they enable the reader to identify a more consistent basis for comparing the businesses’
performance between financial periods, and provide more detail concerning the elements of performance which the managers of these
businesses are most directly able to influence or are relevant for an assessment of the Group.
They also reflect an important aspect of the way in which operating targets are defined and performance is monitored by management.
However, any non-IFRS performance measures in this document are not a substitute for IFRS measures and readers should consider
the IFRS measures as well. Refer to the non-IFRS performance measures section for further information and calculations of non-IFRS
performance measures included throughout this section and the most directly comparable IFRS measures.
Definition
Why is it important and how the Group performed
Common Equity
Tier 1 (CET1) ratio
Capital requirements are part of the
regulatory framework governing how
banks and depository institutions are
supervised. Capital ratios express a bank’s
capital as a percentage of its risk weighted
assets (RWAs) as defined by the PRA.
CET1 ratio is a measure of capital as
defined within the Definition of Capital
section of the PRA's Prudential and
Resolution Policy - Banking Index.
The Group’s capital management objective is to maximise
shareholder value by prudently managing the level and mix
of its capital to: ensure the Group and all of its subsidiaries
are appropriately capitalised relative to their regulatory
minimum and stressed capital requirements, support the
Group’s risk appetite, growth and strategic options, while
seeking to maintain a robust credit proposition for the
Group and its subsidiaries.
The CET1 ratio of 13.6% (December 2023: 13.8%) was
within our target range of 13-14%. The c.20bps decrease
was due to RWAs increasing by £15.4bn to £358.1bn
inclusive of Tesco Bank acquisition, strategic growth in
lending and regulatory driven methodology changes. This
was partially offset by an increase in CET1 capital of £1.3bn
to £48.6bn.
Group target: a CET1 ratio in the range of 13-14%.3
CET1 ratio
13.6%
2023: 13.8%
2022: 13.9%
Return on average
shareholders’ equity
RoE is calculated as profit after tax
attributable to ordinary shareholders, as a
proportion of average shareholders’ equity
excluding non-controlling interests and
other equity instruments.
This measure indicates the return generated by the
management of the business based on shareholders'
equity. RoE for the Group was 9.1% (2023: 7.6%, 2022:
8.9%).
Group RoE
9.1%
2023: 7.6%
2022: 8.9%
Return on average tangible
shareholders’ equity (RoTE)
RoTE is calculated as Group attributable
profit, as a proportion of average tangible
shareholders’ equity.
This measure indicates the return generated by the
management of the business based on ordinary
shareholders’ tangible equity. Achieving a target RoTE
demonstrates the organisation’s ability to execute its
strategy and align management’s interests with the
shareholders’. RoTE lies at the heart of the Group’s capital
allocation and performance management process.
The Group performed in line with both RoTE2 targets in
2024. Statutory Group RoTE was 10.5% (2023: 9.0%) .
Excluding the impact of inorganic activity1, Group RoTE
was 10.5%.
2024 Group target: RoTE2 of greater than 10.0% and
c.10.5% excluding inorganic activity.
2026: targeting Group RoTE2 of greater than 12%.3
Group RoTE
10.5%
2023: 9.0%
2022: 10.4%
Notes:
1Inorganic activity refers to certain inorganic transactions announced as part of the FY23 Investor Update designed to improve Group RoTE beyond 2024. In FY24 this included the
£220m loss on sale of the performing Italian retail mortgage portfolio, the £9m loss on disposal from the German consumer finance business and the £26m loss on sale of the non-
performing Italian retail mortgage portfolio. This was offset by the day 1 net profit before tax of £347m from the acquisition of Tesco Bank.
2Management does not assess forward-looking “return on equity” (target RoE) as a performance indicator of the business, and therefore reconciliation of the forward-looking non-
IFRS measure “return on tangible equity” (target RoTE) to an equivalent IFRS measure is not available without unreasonable efforts.
3Our targets and guidance are based on management's current expectations as to the macroeconomic environment and the business and are subject to change.
Strategy
Shareholder
information
Climate and
sustainability report
Governance
Risk
review
Financial
review
Financial
statements
Barclays PLC 2024
Annual Report
on Form 20-F
323
Key performance indicators (continued)
Definition
Why is it important and how the Group performed
Total operating expenses
Barclays views total operating expenses as a key strategic
area for banks; those who actively manage costs and
control them effectively will gain a strong competitive
advantage.
Group total operating expenses decreased to £16.7bn
(2023: £16.9bn) including the £93m impact from the Bank
of England levy scheme introduced in 2024. Group
operating costs were 3% lower at £16.2bn, reflecting
offset by inflation, investment spend and business growth,
enabled by £1.0bn of cost efficiency savings. 2024 total
structural cost actions were £0.3bn (2023: £1.0bn) with
Q424 structural cost actions of £0.1bn (Q423: £0.9bn).
Total operating expenses
£16.7bn
2023: £16.9bn
2022: £16.7bn
Cost: income ratio
Total operating expenses divided by total
income.
This is a measure management uses to assess the
productivity of the business operations. Managing the cost
base is a key execution priority for management and
includes a review of all categories of discretionary spending
and an analysis of how we can run the business to ensure
that costs increase at a slower rate than income.
The Group cost: income ratio was 62% (2023: 67%), in line
with our target of c.63%, as the Group delivered positive
cost:income jaws of 7%.
2024 Group target: a cost: income ratio of c.63%.
2026: targeting Group cost:income ratio of high 50s in
percentage terms.1
Cost: income ratio
62%
2023: 67%
2022: 67%
Note:
1Our targets and guidance are based on management's current expectations as to the macroeconomic environment and the business and are subject to change.
Strategy
Shareholder
information
Climate and
sustainability report
Governance
Risk
review
Financial
review
Financial
statements
Barclays PLC 2024
Annual Report
on Form 20-F
324
Consolidated summary income statement
2024
2023
2022
2021
2020
For the year ended 31 December
£m
£m
£m
£m
£m
Interest income
38,326
35,075
19,096
11,240
11,892
Interest expense
(25,390)
(22,366)
(8,524)
(3,167)
(3,770)
Net interest income
12,936
12,709
10,572
8,073
8,122
Fee and commission income
10,847
10,121
9,637
9,880
8,641
Fee and commission expense
(3,600)
(3,592)
(3,038)
(2,206)
(2,070)
Net fee and commission income
7,247
6,529
6,599
7,674
6,571
Other income
6,605
6,140
7,785
6,193
7,073
Total income
26,788
25,378
24,956
21,940
21,766
Operating costs
(16,195)
(16,714)
(14,957)
(14,092)
(13,434)
UK regulatory levies
(320)
(180)
(176)
(170)
(299)
Litigation and conduct
(220)
(37)
(1,597)
(397)
(153)
Total operating expenses
(16,735)
(16,931)
(16,730)
(14,659)
(13,886)
Other net income/(expenses)
37
(9)
6
260
23
Profit before impairment
10,090
8,438
8,232
7,541
7,903
Credit impairment (charges)/releases
(1,982)
(1,881)
(1,220)
653
(4,838)
Profit before tax
8,108
6,557
7,012
8,194
3,065
Tax charge
(1,752)
(1,234)
(1,039)
(1,138)
(604)
Profit after tax
6,356
5,323
5,973
7,056
2,461
Non-controlling interests
(49)
(64)
(45)
(47)
(78)
Other equity instrument holders
(991)
(985)
(905)
(804)
(857)
Attributable profit
5,316
4,274
5,023
6,205
1,526
Selected financial statistics
Basic earnings per share
36.0p
27.7p
30.8p
36.5p
8.8p
Diluted earnings per share
34.8p
26.9p
29.8p
35.6p
8.6p
Return on average shareholders’ equity
9.1%
7.6%
8.9%
11.2%
2.7%
Return on average tangible shareholders’ equity
10.5%
9.0%
10.4%
13.1%
3.2%
Cost: income ratio
62%
67%
67%
67%
64%
The financial information above is extracted from the published accounts. This information should be read together with the
information included in the accompanying consolidated financial statements.
Strategy
Shareholder
information
Climate and
sustainability report
Governance
Risk
review
Financial
review
Financial
statements
Barclays PLC 2024
Annual Report
on Form 20-F
325
Income statement commentary
2024 compared to 2023
•Barclays delivered a profit before tax of £8,108m (2023: £6,557m), RoE of 9.1%, (2023: 7.6%), RoTE of 10.5% (2023: 9.0%) and EPS of
36.0p (2023: 27.7p)
•The Group has a diverse income profile across businesses and geographies including a significant presence in the US. The
appreciation of average GBP against USD negatively impacted income and positively impacted credit impairment charges and total
operating expenses. The full-year impact of FX was broadly neutral to profits.
•Group statutory income increased 6% to £26,788m (2023: £25,378m), including the impact of inorganic activity1
–Excluding the £327m impact of inorganic activity1, Group income increased 4%, as higher structural hedge income, higher
Investment Banking fees, increased income in Equities and balance growth in USCB were partially offset by mortgage margin
compression and adverse product dynamics in deposits in Barclays UK, which have stabilised throughout 2024, as well as lower
FICC income
•Group total operating expenses decreased to £16,735m (2023: £16,931m), including the £93m impact of the BoE levy scheme
introduced in 2024
–Group operating costs were 3%lower at £16,195m, reflecting £0.8bn lower structural cost actions year-on-year partially offset by
inflation, investment spend and business growth, enabled by £1.0bn of cost efficiency savings
–2024 total structural cost actions were £273m (2023: £1,046m) with Q424 structural cost actions of £110m (Q423: £927m)
•Credit impairment charges increased to £1,982m (2023: £1,881m), driven by the £209m charge on the acquisition of Tesco Bank and
the anticipated higher delinquencies in US cards, partially offset by the impact of credit risk management actions and methodology
enhancements. Total coverage ratio reduced to 1.2% (December 2023: 1.4%) primarily driven by the reclassification of a co-branded
cards portfolio in USCB to assets held for sale
•The effective tax rate (ETR) was 21.6% (2023: 18.8%). The 2024 ETR includes tax relief on payments made under Additional Tier 1
(AT1) instruments and on holdings of inflation-linked government bonds.
•Attributable profit was £5,316m (2023: £4,274m)
Note:
1Inorganic activity refers to certain inorganic transactions announced as part of the FY23 Investor Update designed to improve Group RoTE beyond 2024. In FY24 this included the
£220m loss on sale of the performing Italian retail mortgage portfolio, the £9m loss on disposal from the German consumer finance business and the £26m loss on sale of the non-
performing Italian retail mortgage portfolio. This was offset by the day 1 net profit before tax of £347m from the acquisition of Tesco Bank which completed 1 November 2024.
Please refer to the Financial review section in the Annual Report on Form 20-F for the year ended 31 December 2023 for a comparative
discussion of the 2023 financial results compared to 2022.
Strategy
Shareholder
information
Climate and
sustainability report
Governance
Risk
review
Financial
review
Financial
statements
Barclays PLC 2024
Annual Report
on Form 20-F
326
Consolidated summary balance sheet
2024
2023
2022
2021
2020
As at 31 December
£m
£m
£m
£m
£m
Assets
Cash and balances at central banks
210,184
224,634
256,351
238,574
191,127
Cash collateral and settlement balances
119,843
108,889
112,597
92,542
101,367
Debt securities at amortised cost
68,210
56,749
45,487
31,831
23,805
Loans and advances at amortised cost to banks
8,327
9,459
10,015
9,698
8,900
Loans and advances at amortised cost to customers
337,946
333,288
343,277
319,922
309,927
Reverse repurchase agreements and other similar secured
lending at amortised cost
4,734
2,594
776
3,227
9,031
Trading portfolio assets
166,453
174,605
133,813
147,035
127,950
Financial assets at fair value through the income statement
193,734
206,651
213,568
191,972
175,151
Derivative financial instruments
293,530
256,836
302,380
262,572
302,446
Financial assets at fair value through other comprehensive
income
78,059
71,836
65,062
61,753
78,688
Other assets
37,182
31,946
30,373
25,159
21,122
Total assets
1,518,202
1,477,487
1,513,699
1,384,285
1,349,514
Liabilities
Deposits at amortised cost from banks
13,203
14,472
19,979
17,819
17,343
Deposits at amortised cost from customers
547,460
524,317
525,803
501,614
463,693
Cash collateral and settlement balances
106,229
94,084
96,927
79,371
85,423
Repurchase agreements and other similar secured borrowings at
amortised cost
39,415
41,601
27,052
28,352
14,174
Debt securities in issue
92,402
96,825
112,881
98,867
75,796
Subordinated liabilities
11,921
10,494
11,423
12,759
16,341
Trading portfolio liabilities
56,908
58,669
72,924
54,169
47,405
Financial liabilities designated at fair value
282,224
297,539
271,637
250,960
249,765
Derivative financial instruments
279,415
250,044
289,620
256,883
300,775
Other liabilities
16,544
17,578
16,193
13,450
11,917
Total liabilities
1,445,721
1,405,623
1,444,439
1,314,244
1,282,632
Equity
Called up share capital and share premium
4,186
4,288
4,373
4,536
4,637
Other equity instruments
12,075
13,259
13,284
12,259
11,172
Other reserves
(468)
(77)
(2,192)
1,770
4,461
Retained earnings
56,028
53,734
52,827
50,487
45,527
Total equity excluding non-controlling interests
71,821
71,204
68,292
69,052
65,797
Non-controlling interests
660
660
968
989
1,085
Total equity
72,481
71,864
69,260
70,041
66,882
Total liabilities and equity
1,518,202
1,477,487
1,513,699
1,384,285
1,349,514
Net asset value per ordinary share
414p
382p
347p
339p
315p
Tangible net asset value per share
357p
331p
295p
291p
269p
Number of ordinary shares of Barclays PLC (in millions)
14,420
15,155
15,871
16,752
17,359
Year-end USD exchange rate
1.25
1.28
1.20
1.35
1.37
Year-end EUR exchange rate
1.21
1.15
1.13
1.19
1.11
Strategy
Shareholder
information
Climate and
sustainability report
Governance
Risk
review
Financial
review
Financial
statements
Barclays PLC 2024
Annual Report
on Form 20-F
327
Balance sheet commentary
2024 compared to 2023
Total assets
Total assets increased £40.7bn to £1,518.2bn.
Cash and balances at central banks decreased by £14.5bn to £210.2bn primarily driven by a change in the composition of the Group
liquidity pool from cash and deposits at central banks to debt securities.
Debt securities at amortised cost increased by £11.5bn to £68.2bn and Financial assets at fair value through other comprehensive
income increased £6.2bn to £78.1bn primarily driven by a change in the composition of the Group liquidity pool from cash and deposits
at central banks to debt securities.
Loans and advances at amortised cost to banks and customers increased £3.5bn to £346.3bn driven by the acquisition of Tesco Bank
and higher lending in Global Markets, partially offset by the reclassification of a co-branded card portfolio to assets held for sale.
Trading portfolio assets decreased £8.2bn to £166.5bn and Financial assets at fair value through the income statement decreased
£12.9bn to £193.7bn as increases in client activity and underlying growth in financing balances were more than offset by balance sheet
efficiencies and increased netting opportunities.
Derivative financial instrument assets increased £36.7bn to £293.5bn. In addition to increased client activity, increased mark-to-market
on FX derivatives was driven by USD appreciation in Q424, partially offset by a reduction in interest rate derivatives due to an increase in
the USD and GBP forward rate curves. Cash collateral and settlement balances increased by £11.0bn to £119.8bn.
Total liabilities
Total liabilities increased £40.1bn to £1,445.7bn.
Deposits at amortised cost to banks and customers increased £21.9bn to £560.7bn driven by deposit growth in International Corporate
Bank and Private Bank and Wealth Management.
Derivative financial instrument liabilities increased £29.4bn to £279.4bn. In addition to increased client activity, increased mark-to-
market on FX derivatives was driven by USD appreciation in Q424, partially offset by a reduction in interest rate derivatives due to an
increase in the USD and GBP forward rate curves. Cash collateral and settlement balances increased by £12.1bn to £106.2bn.
Trading portfolio liabilities decreased £1.8bn to £56.9bn and Financial liabilities designated at fair value decreased £15.3bn to £282.2bn
driven by balance sheet efficiencies and increased netting opportunities.
Total shareholders’ equity
Total shareholders’ equity increased £0.6bn to £72.5bn.
Retained earnings increased £2.3bn to £56bn, mainly due to profits of £5.3bn, offset by share repurchases of £1.8bn and dividends of
£1.2bn.
Other equity instruments decreased £1.2bn to £12.1bn, due to two redemptions (£1.3bn and $2.0bn) partially offset by issuance of two
AT1 instruments (£1.3bn andSGD 0.6bn). AT1 securities are perpetual subordinated contingent convertible securities structured to
qualify as AT1 instruments under prevailing capital rules applicable as at the relevant issue date.
Other reserves decreased by £0.4bn, due to an increase in the cumulative loss in the own credit reserve of £0.8bn to a £1.1bn loss
which principally reflects the tightening of credit spreads and an increase in the cumulative loss in fair value through other
comprehensive income reserve of £0.5bn to a £1.9bn loss, driven by a decrease in EUR asset swap spreads, partially offset by a gain in
the cash flow hedging reserve of £0.8bn to a £2.9bn accumulated loss driven by accumulated losses transferred to the income
statement offset by a loss from fair value movements on interest rate swaps as major interest rate forward curves increased.
Net asset value per share increased to 414p (December 2023: 382p).
Tangible net asset value per share increased to357p (December 2023: 331p) including EPS of 36.0p, a c.7p benefit from the reduction
in share count as a result of the completion of the share buybacks announced at FY23 and H124 Results and a 5p benefit from the cash
flow hedging reserve. These were partially offset by an 8p reduction from dividends paid during 2024 and net negative other reserve
movements.
Strategy
Shareholder
information
Climate and
sustainability report
Governance
Risk
review
Financial
review
Financial
statements
Barclays PLC 2024
Annual Report
on Form 20-F
328
Analysis of results by business
Barclays UK
2024
2023
2022
£m
£m
£m
Income statement information
Net interest income
6,627
6,431
5,893
Net fee, commission and other income
1,647
1,156
1,366
Total income
8,274
7,587
7,259
Operating costs
(4,235)
(4,393)
(4,260)
UK regulatory levies
(78)
(30)
(26)
Litigation and conduct
(16)
8
(41)
Total operating expenses
(4,329)
(4,415)
(4,327)
Other net income
—
—
—
Profit before impairment
3,945
3,172
2,932
Credit impairment charges
(365)
(304)
(286)
Profit before tax
3,580
2,868
2,646
Attributable profit
2,465
1,962
1,877
Performance measures
Return on average allocated equity
16.9%
14.0%
13.8%
Return on average allocated tangible equity
23.1%
19.2%
18.7%
Average allocated equity
£14.6bn
£14.0bn
£13.6bn
Average allocated tangible equity
£10.7bn
£10.2bn
£10.0bn
Cost: income ratio
52%
58%
60%
Loan loss rate (bps)
16
14
13
Net interest margin
3.29%
3.13%
2.86%
Key facts
UK mortgage balances
£163.1bn
£163.5bn
£162.2bn
Mortgage gross lending flow
£23.9bn
£22.7bn
£30.3bn
Average LTV of mortgage portfolio1
53%
54%
50%
Average LTV of new mortgage lending1
66%
63%
68%
Number of branches
221
306
481
Digitally active customers2
13.4m
12.7m
12.1m
30 day arrears rate - Barclaycard Consumer UK3
0.7%
0.9%
0.9%
Number of employees (full time equivalent)
18,000
6,800
6,200
Balance sheet information
Loans and advances to customers at amortised cost
£207.7bn
£202.8bn
£205.1bn
Total assets
£299.8bn
£293.1bn
£313.2bn
Customer deposits at amortised cost
£244.2bn
£241.1bn
£258.0bn
Loan: deposit ratio
92%
92%
87%
Risk weighted assets
£84.5bn
£73.5bn
£73.1bn
Notes:
1Average loan to value (LTV) of mortgages is balance weighted and reflects both residential and buy-to-let (BTL) mortgage portfolios within the Home Loans portfolio.
2Mobile active customers has been replaced by digitally active customers as a more complete reflection of digital adoption by Barclays UK customers.
3Excluding the impact of Tesco Bank acquisition.
Strategy
Shareholder
information
Climate and
sustainability report
Governance
Risk
review
Financial
review
Financial
statements
Barclays PLC 2024
Annual Report
on Form 20-F
329
Analysis of results by business (continued)
Analysis of Barclays UK
2024
2023
2022
£m
£m
£m
Analysis of total income
Personal Banking1
5,333
4,729
4,540
Barclaycard Consumer UK
937
964
1,093
Business Banking
2,004
1,894
1,626
Total income
8,274
7,587
7,259
Analysis of credit impairment (charges)/releases
Personal Banking1
(281)
(170)
(167)
Barclaycard Consumer UK
(113)
(162)
30
Business Banking
29
28
(149)
Total credit impairment charges
(365)
(304)
(286)
Analysis of loans and advances to customers at amortised cost
Personal Banking
£177.0bn
£170.1bn
£169.7bn
Barclaycard Consumer UK
£11.0bn
£9.7bn
£9.2bn
Business Banking
£19.7bn
£23.0bn
£26.2bn
Total loans and advances to customers at amortised cost
£207.7bn
£202.8bn
£205.1bn
Analysis of customer deposits at amortised cost
Personal Banking
£191.4bn
£185.4bn
£195.6bn
Barclaycard Consumer UK
—
—
—
Business Banking
£52.8bn
£55.7bn
£62.4bn
Total customer deposits at amortised cost
£244.2bn
£241.1bn
£258.0bn
2024 compared to 2023
•Profit before tax increased25% to £3,580m. Barclays UK delivered a RoE of 16.9% (2023: 14.0%) and a RoTE of 23.1% (2023: 19.2%)
supported by robust income, strong asset quality and disciplined cost management, with continued investment in delivering a
simpler, better and more balanced retail bank
•Excluding the net positive day 1 impact from the Tesco Bank acquisition of £347m, profit before tax increased 13% to £3,233m
with a RoTE of 20.8%
•Total income increased9% to £8,274m primarily driven by the £556m day 1 gain from the acquisition of Tesco Bank. Excluding the
impact of the day 1 gain, income increased 2% to £7,718m. NII increased3% to £6,627m, as continued structural hedge momentum
and the Q424 Tesco Bank NII benefit were partially offset by adverse deposit dynamics, which have stabilised throughout 2024, and
mortgage margin compression. Net fee, commission and other income increased42% to £1,647m driven primarily by the £556m day
1 gain from the acquisition of Tesco Bank. Excluding the impact from the day 1 gain, net fee, commission and other income
decreased 6% to £1,091m primarily driven by the transfer of WM&I to PBWM2
–Personal Banking income increased13% to £5,333m, driven primarily by the £556m day 1 gain from the acquisition of Tesco Bank.
Excluding the impact from the day 1 gain, income was broadly stable at £4,777m, as continued structural hedge momentum and
the Q424 Tesco Bank NII were partially offset by adverse deposit dynamics and mortgage margin compression
–Barclaycard Consumer UK income decreased3% to £937m due to lower interest earning lending balances, resulting from higher
customer spend being more than offset by repayments
–Business Banking income increased6% to £2,004m driven by continued structural hedge momentum, partially offset by lower
government scheme lending as repayments continue and lower deposit volumes
•Total operating expenses decreased2% to £4,329m, driven by lower structural cost actions and by the transfer of WM&I to PBWM1
partially offset by Q424 Tesco Bank costs and inflation. Ongoing efficiency savings continue to be reinvested, to drive sustainable
improvement to the cost: income ratio
•Credit impairment charges were £365m (2023: £304m), driven by the £209m day 1 impact from the acquisition of Tesco Bank,
partially offset by a resilient credit performance in UK cards and UK mortgages. UK cards 30 and 90 day arrears remained low at 0.7%3
(Q423: 0.9%) and 0.2%3 (Q423: 0.2%) respectively. The UK cards total coverage ratio reduced to 4.8% (December 2023: 6.8%)
following the day 1 impact from the acquisition of Tesco Bank and release of the affordability linked adjustments
•Loans and advances to customers at amortised cost increased by £4.9bn to £207.7bn, primarily driven by a c.£8bn increase from the
acquisition of Tesco Bank, growth in unsecured lending and mortgage lending, partially offset by securitisation of mortgage balances
in Q424 and continued repayment of government scheme lending in Business Banking
•Customer deposits at amortised cost increased by £3.1bn to £244.2bn, driven by a c.£7bn increase from the acquisition of Tesco
Bank, partially offset by reduction in Business Banking and retail current account balances, however these dynamics have stabilised
throughout 2024. The loan: deposit ratio remained stable at 92% (December 2023: 92%)
•RWAs increased to £84.5bn (December 2023: £73.5bn), primarily driven by a c.£7bn increase from the acquisition of Tesco Bank,
lending business growth and regulatory driven methodology changes
Notes:
1Following the completion of the acquisition on 1 November 2024, Tesco Bank is reported in Personal Banking. In Q424 and FY24, total income includes the £556m day 1 gain, and total
credit impairment charges include the £209m day 1 impact.
2WM&I was transferred in May 2023.
3Excluding the impact of Tesco Bank acquisition.
Strategy
Shareholder
information
Climate and
sustainability report
Governance
Risk
review
Financial
review
Financial
statements
Barclays PLC 2024
Annual Report
on Form 20-F
330
Analysis of results by business (continued)
2023 compared to 2022
•Profit before tax increased8% to £2,868m with a RoE of 14.0% (2022: 13.8%) andRoTE of 19.2% (2022: 18.7%)
•Total income increased5% to £7,587m. Net interest income (NII) increased9% to £6,431m with a net interest margin (NIM) of 3.13%
(2022: 2.86%), as higher interest rates and associated structural hedge benefit outweighed mortgage margin pressure and adverse
deposit dynamics reflecting wider market trends. Net fee, commission and other income decreased15% to £1,156m including the
impact of the transfer of WM&I to CC&P
•Total operating expenses increased2% to £4,415m, including £168m impact from Q423 structural cost actions. Excluding the
impact of Q423 structural cost actions, operating expenses decreased 2%, driven by the transfer of WM&I to PBWM partially offset
by the impact of inflation and the acquisition of Kensington Mortgage Company (KMC). Ongoing efficiency savings continue to be
reinvested, including in our transformation programme to support sustainable improvement to the cost: income ratio over the longer
term
•Credit impairment charges increased to £304m (2022: £286m), consistent with low delinquencies in UK cards and a high quality
mortgage lending portfolio. UK cards 30 and 90 day arrears remained low at 0.9% (Q422: 0.9%) and 0.2% (Q422: 0.2%) respectively.
The UK cards total coverage ratio was 6.8% (December 2022: 7.6%)
•Customer deposits at amortised cost decreased 7% to £241.1bn (December 2022: £258.0bn). Primarily driven by reduced current
account balances in Personal and Business Banking, reflecting broader market trends. The loan: deposit ratio increased to 92%
(December 2022: 87%)
•Risk weighted assets (RWAs) increased to £73.5bn (December 2022: £73.1bn), primarily due to the acquisition of KMC, broadly offset
by reduction across lending portfolios
Strategy
Shareholder
information
Climate and
sustainability report
Governance
Risk
review
Financial
review
Financial
statements
Barclays PLC 2024
Annual Report
on Form 20-F
331
Analysis of results by business (continued)
Barclays UK Corporate Bank
2024
2023
2022
£m
£m
£m
Income statement information
Net interest income
1,206
1,160
1,132
Net fee, commission, trading and other income
574
610
525
Total income
1,780
1,770
1,657
Operating costs
(935)
(905)
(812)
UK regulatory levies
(37)
(8)
(7)
Litigation and conduct
(1)
1
—
Total operating expenses
(973)
(912)
(819)
Other net (expenses)/income
—
(3)
1
Profit before impairment
807
855
839
Credit impairment (charges)/releases
(76)
27
—
Profit before tax
731
882
839
Attributable profit
490
584
563
Performance measures
Return on average allocated equity
16.0%
20.5%
19.2%
Return on average allocated tangible equity
16.0%
20.5%
19.2%
Average allocated equity
£3.1bn
£2.9bn
£2.9bn
Average allocated tangible equity (£bn)
£3.1bn
£2.9bn
£2.9bn
Cost: income ratio
55%
52%
49%
Loan loss rate (bps)
29
(10)
—
Key facts
Number of employees (full time equivalent)
1,900
1,800
1,700
Balance sheet information
Loans and advances to customers at amortised cost
£25.4bn
£26.4bn
£26.9bn
Deposits at amortised cost
£83.1bn
£84.9bn
£84.4bn
Risk weighted assets
£23.9bn
£20.9bn
£21.1bn
Analysis of total income
£m
£m
£m
Corporate lending
267
262
247
Transaction banking
1,513
1,508
1,410
Total income
1,780
1,770
1,657
2024 compared to 2023
•Profit before tax decreased17% to £731m (2023: £882m). UKCB delivered a RoE of 16.0% (2023: 20.5%) and a RoTE of 16.0%
(2023: 20.5%), as income from increased average deposit balances was offset by lower liquidity pool income, and the continuing
investment to support future growth ambitions
•Total income was broadly stable at £1,780m as increased deposit income from higher average balances was largely offset by lower
liquidity pool income
•Total operating expenses increased7% to £973m, reflecting higher ongoing spend to support growth ambitions and the BoE levy
scheme
•Credit impairment charges were £76m (2023: £27m release), driven by stable underlying credit performance and limited single name
charges. The release in the prior period was driven by the improved macroeconomic outlook
•Loans and advances to customers at amortised cost decreased to £25.4bn (December 2023: £26.4bn) as strategic growth in
balances was more than offset by a c.£2bn reduction from refinements to the perimeter with the International Corporate Bank within
IB
•Customer deposits at amortised cost decreased to £83.1bn (December 2023: £84.9bn) primarily driven by a c.£2bn reduction from
refinements to the perimeter with the International Corporate Bank within IB
•RWAs increased to £23.9bn (December 2023: £20.9bn), reflecting higher client lending limits and strategic growth in lending balances
Strategy
Shareholder
information
Climate and
sustainability report
Governance
Risk
review
Financial
review
Financial
statements
Barclays PLC 2024
Annual Report
on Form 20-F
332
Analysis of results by business (continued)
2023 compared to 2022
•Profit before tax increased5% to £882m, with a RoE of 20.5% (2022: 19.2%) and with a RoTE of 20.5% (2022: 19.2%). Excluding the
impact of Q423 structural cost actions RoTE was 21.2%
•Total income increased7% to £1,770m, with NII increasing to £1,160m from improved margins. Net fee, commission, trading and
other income increased 16% as a result of higher interest rate environment
•Total operating expenses increased11% to £912m, reflecting higher investment spend to support growth, £27m of Q423 structural
cost actions and the impact of inflation partially offset by efficiency savings
•Credit impairment releases were£27m (2022: £nil), driven by resilient underlying credit performance and the marginally improved
year-on-year macroeconomic outlook
•RWAs were broadly stable at £20.9bn (December 2022: £21.1bn)
Strategy
Shareholder
information
Climate and
sustainability report
Governance
Risk
review
Financial
review
Financial
statements
Barclays PLC 2024
Annual Report
on Form 20-F
333
Analysis of results by business (continued)
Barclays Private Bank and Wealth Management
2024
2023
2022
£m
£m
£m
Income statement information
Net interest income
767
768
715
Net fee, commission and other income
542
440
299
Total income
1,309
1,208
1,014
Operating costs
(911)
(795)
(545)
UK regulatory levies
(9)
(4)
(4)
Litigation and conduct
—
2
—
Total operating expenses
(920)
(797)
(549)
Other net income
—
—
—
Profit before impairment
389
411
465
Credit impairment charges
(6)
(4)
(5)
Profit before tax
383
407
460
Attributable profit
288
330
370
Performance measures
Return on average allocated equity
25.7%
29.9%
33.2%
Return on average allocated tangible equity
28.1%
32.7%
36.3%
Average allocated equity
£1.1bn
£1.1bn
£1.1bn
Average allocated tangible equity (£bn)
£1.0bn
£1.0bn
£1.0bn
Cost: income ratio
70%
66%
54%
Loan loss rate (bps)
4
3
4
Key facts
Invested assets1
124.6
108.8
61.9
Client assets and liabilities2
208.9
182.9
139.4
Number of employees (full time equivalent)
1,900
2,100
1,100
Balance sheet information
Loans and advances to customers at amortised cost
£14.5bn
£13.6bn
£14.4bn
Deposits at amortised cost
£69.5bn
£60.3bn
£62.3bn
Risk weighted assets
£7.9bn
£7.2bn
£7.8bn
2024 compared to 2023
•Profit before tax decreased6% to £383m with a RoE of 25.7% (2023: 29.9%) and a RoTE of 28.1% (2023: 32.7%), as the business
continues to see an inflow of new client balances across deposits, lending and investments which reflects the strong product offering
and client engagement. Together with the impact from market movement, this has resulted in continued income growth of 8%.
Costs are higher by 15% which is due to the continued investment in people, product and the platform to deliver our three year plan
•Total income increased8% to £1,309m driven by client assets and liabilities balances growth and the transfer of WM&I from Barclays
UK3. Net interest income was broadly flat, as the impact from higher deposits balances was offset by lower liquidity pool income. Net
fee, commission and other income increased 23%, driven by higher investment balances and transactional activity
•Total operating expenses increased15% to £920m, reflecting the transfer of WM&I from Barclays UK and higher investment spend,
to support business growth ambitions
•Client assets and liabilities increased £26.0bn to £208.9bn, driven by £15.8bn increase in invested assets as a result of market
movements and underlying balance growth, as well as £9.2bn increase in deposits and £0.9bn increase in gross loans to clients
•RWAs increased to £7.9bn (December 2023: £7.2bn)
Notes:
1Invested assets represent assets under management and supervision.
2Client assets and liabilities refers to customer deposits, lending and invested assets.
3WM&I was transferred in May 2023.
Strategy
Shareholder
information
Climate and
sustainability report
Governance
Risk
review
Financial
review
Financial
statements
Barclays PLC 2024
Annual Report
on Form 20-F
334
Analysis of results by business (continued)
2023 compared to 2022
•Profit before tax decreased12% to £407m, with a RoE of 29.9% (2022: 33.2%) and a RoTE of 32.7% (2022: 36.3%). Excluding the
impact of Q423 structural cost actions, RoTE was 35.1%
•Total income increased19% to £1,208m, due to the transfer of WM&I from Barclays UK, client balance growth and improved deposit
margins in the higher rate environment
•Total operating expenses increased45% to £797m, reflecting the transfer of WM&I from Barclays UK, £29m of Q423 structural cost
actions, higher investment spend to support growth and the impact of inflation partially offset by efficiency savings
•RWAs decreased to £7.2bn (December 2022: £7.8bn), reflecting reduction in lending balances as clients repaid balances in light of the
higher interest rate environment
Strategy
Shareholder
information
Climate and
sustainability report
Governance
Risk
review
Financial
review
Financial
statements
Barclays PLC 2024
Annual Report
on Form 20-F
335
Analysis of results by business (continued)
Barclays Investment Bank
2024
2023
2022
£m
£m
£m
Income statement information
Net interest income
1,031
1,393
836
Net trading income
6,241
6,040
7,724
Net fee, commission and other income
4,533
3,602
3,363
Total income
11,805
11,035
11,923
Operating costs
(7,666)
(7,619)
(6,955)
UK regulatory levies
(187)
(123)
(119)
Litigation and conduct
(55)
5
(1,189)
Total operating expenses
(7,908)
(7,737)
(8,263)
Other net income
—
—
1
Profit before impairment
3,897
3,298
3,661
Credit impairment charges
(123)
(102)
(181)
Profit before tax
3,774
3,196
3,480
Attributable profit
2,513
2,041
2,806
Performance measures
Return on average allocated equity
8.5%
7.0%
9.3%
Return on average allocated tangible equity
8.5%
7.0%
9.3%
Average allocated equity
£29.7bn
£29.0bn
£30.0bn
Average allocated tangible equity (£bn)
£29.7bn
£29.0bn
£30.0bn
Cost: income ratio
67%
70%
69%
Loan loss rate (bps)
10
9
18
Key facts
Number of employees (full time equivalent)
7,100
7,100
6,700
Balance sheet information
Loans and advances to customers at amortised cost
£69.7bn
£62.7bn
£64.6bn
Loans and advances to banks at amortised cost
£6.8bn
£7.3bn
£8.1bn
Debt securities at amortised cost
£47.9bn
£38.9bn
£27.2bn
Loans and advances at amortised cost
£124.4bn
£108.9bn
£99.9bn
Trading portfolio assets
£166.1bn
£174.5bn
£133.7bn
Derivative financial instrument assets
£291.6bn
£255.1bn
£301.6bn
Financial assets at fair value through the income statement
£190.4bn
£202.5bn
£209.4bn
Cash collateral and settlement balances
£111.1bn
£102.3bn
£106.2bn
Deposits at amortised cost
£140.5bn
£132.7bn
£121.5bn
Derivative financial instrument liabilities
£279.0bn
£249.7bn
£288.9bn
Risk weighted assets
£198.8bn
£197.3bn
£195.9bn
Analysis of total income
£m
£m
£m
FICC
4,667
4,845
5,695
Equities
2,875
2,373
3,149
Global Markets
7,542
7,218
8,844
Advisory
661
593
768
Equity capital markets
351
219
166
Debt capital markets
1,492
1,148
1,281
Banking fees and underwriting
2,504
1,960
2,215
Corporate lending
153
213
(479)
Transaction banking
1,606
1,644
1,343
International Corporate Bank
1,759
1,857
864
Investment Banking
4,263
3,817
3,079
Total income
11,805
11,035
11,923
Strategy
Shareholder
information
Climate and
sustainability report
Governance
Risk
review
Financial
review
Financial
statements
Barclays PLC 2024
Annual Report
on Form 20-F
336
Analysis of results by business (continued)
2024 compared to 2023
•IB has a diverse income profile across businesses and geographies including a significant presence in the US. The appreciation of
average GBP against USD adversely impacted income and profits, and positively impacted total operating expenses
•Profit before tax increased to £3,774m (2023: £3,196m). IB delivered a RoE of 8.5% (2023: 7.0%) and a RoTE of 8.5% (2023: 7.0%)
which reflects the deep client relationships, synergies across the Investment Bank, prudent capital deployment and risk
management. The performance is supported by growth in our diversified income streams including improved performance in
Financing1 and Equities within Global Markets, Equity and Debt Capital markets in Investment Banking. Costs have grown by 2%
reflecting the commitment to grow costs modestly
•Total income increased7% to £11,805m
–Global Markets income increased4% to £7,542m driven by increased income in Equities, partially offset by lower income in FICC
–Equities income increased21% to £2,875m, reflecting increased client activity in Derivatives and Cash products and growth in
Prime financing balances, additionally supported by a £125m fair value gain on Visa B shares in Q124
–FICC income decreased4%to £4,667m, reflecting lower client activity in Macro and the non-repeat of the inflation benefit from
prior year, partially offset by strong performance in Securitised products
–Investment Banking income increased12% to £4,263m
–Banking fees and underwriting income increased28% to £2,504m reflecting an increase in the fee pool and an increased market
share2. Debt capital markets fee increased30% to £1,492m driven by increased activity in leverage finance and investment grade
issuance. Equity capital markets fees increased60% to £351m driven by increased deal activity including fees booked on a large UK
rights issue completed in Q224. Advisory fee income increased11% to £661m
–International Corporate Bank income decreased5% to £1,759m driven by lower liquidity pool income, as higher income from
growth in deposit balances was offset by margin compression in deposit products including the impact of customers migrating to
higher interest returning products. Corporate lending income was broadly stable
•Total operating expenses increased2% to £7,908m driven by UK regulatory levies and litigation and conduct costs. Operating
expenses excluding UK regulatory levies and litigation and conduct, remained broadly stable as the impact of inflation, and higher
performance costs was offset by efficiency savings
•Credit impairment charges were £123m (2023: £102m), driven by single name charges, partially offset by the benefit of credit
protection
•Loans and advances at amortised costs increased to £124.4bn (December 2023: £108.9bn) driven by increased investment in debt
securities and higher lending in Global Markets
•Trading portfolio assets decreased to £166.1bn (December 2023: £174.5bn) and Financial assets at fair value through the income
statement decreased to £190.4bn (December 2023: £202.5bn). Increases in client activity and underlying growth in financing
balances were more than offset by balance sheet efficiencies and increased netting opportunities
•Derivative assets and liabilities increased to £291.6bn (December 2023: £255.1bn) and£279.0bn (December 2023: £249.7bn)
respectively. In addition to increased client activity, increased mark-to-market on FX derivatives was driven by USD appreciation in
Q424, partially offset by a reduction in interest rate derivatives due to an increase in the USD and GBP forward rate curves.
•Deposits at amortised cost increased to £140.5bn (December 2023: £132.7bn driven by deposit growth in International Corporate
Bank
•RWAsremained broadly stable at£198.8bn (December 2023: £197.3bn) reflecting the commitment to improve productivity whilst
not increasing RWAs materially
Notes:
1Markets Financing includes income related to client financing in both FICC and Equities. In FICC this includes fixed income securities repurchase agreements, structured credit,
warehouse and asset backed lending. In Equities this includes prime brokerage margin lending, securities lending, quantitative prime services, futures clearing and settlement, synthetic
financing, and equity structured financing. All other items are considered intermediation.
2Data source: Dealogic for the period covering 1 January to 31 December 2024.
Strategy
Shareholder
information
Climate and
sustainability report
Governance
Risk
review
Financial
review
Financial
statements
Barclays PLC 2024
Annual Report
on Form 20-F
337
Analysis of results by business (continued)
2023 compared to 2022
•Barclays Investment Bank RoE was 7.0% (2022: 9.3%) and RoTE was 7.0% (2022: 9.3%) with a profit before tax of £3,196m (2022:
£3,480m) including £169m of Q423 structural cost actions. Excluding the impact of Q423 structural cost actions, Barclays
Investment Bank delivered a RoTE of 7.5%
•Total income decreased7% to £11,035m and decreased 5% excluding £292m impact from prior year hedging arrangements related
to the Over-issuance of Securities1
–Global Markets income decreased 18% to £7,218m against a record prior year comparative. FICC income decreased 15% to
£4,845m, reflecting lower market volatility and client activity. Equities income decreased 25% to £2,373m, driven by a decline in
derivatives income reflecting less volatile equity market conditions
–Investment Banking fees decreased 12% to £1,960m due to the reduced fee pool across the industry2. Advisory decreased 23%
and Debt capital markets decreased 10%, while Equity capital markets increased 32%
–Transaction banking income increased 22% to £1,644m driven by improved deposit margins in the higher interest rate
environment. Corporate lending income increased to £213m (2022: £479m loss) mainly driven by lower costs of hedging and lower
fair value losses on leverage finance lending net of mark to market gains on related hedges
•Total operating expenses decreased6% to £7,737m. Operating expenses excluding litigation and conduct charges increased 9% to
£7,742m reflecting investment in talent and technology, £169m of Q423 structural cost actions and the impact of inflation, partially
offset by efficiency savings
•Credit impairment charges decreased to £102m (2022: £181m), driven by single name charges, partially offset by the benefit of
credit protection
•RWAs increased to £197.3bn (December 2022: £195.9bn)
Notes:
12022 included £292m of income gain related to hedging arrangements to manage the risks of the rescission offer in relation to the Over-issuance of Securities, impacting Equities within
Global Markets and Investment Bank.
2Data source: Dealogic for the period covering 1 January to 31 December 2023.
Strategy
Shareholder
information
Climate and
sustainability report
Governance
Risk
review
Financial
review
Financial
statements
Barclays PLC 2024
Annual Report
on Form 20-F
338
Analysis of results by business (continued)
Barclays US Consumer Bank
2024
2023
2022
£m
£m
£m
Income statement information
Net interest income
2,659
2,604
1,972
Net fee, commission and other income
667
664
667
Total income
3,326
3,268
2,639
Operating costs
(1,612)
(1,650)
(1,525)
UK regulatory levies
—
—
—
Litigation and conduct
(14)
(6)
(3)
Total operating expenses
(1,626)
(1,656)
(1,528)
Other net income
—
—
—
Profit before impairment
1,700
1,612
1,111
Credit impairment charges
(1,293)
(1,438)
(624)
Profit before tax
407
174
487
Attributable profit
302
131
356
Performance measures
Return on average allocated equity
8.1%
3.4%
9.8%
Return on average allocated tangible equity
9.1%
4.1%
12.7%
Average allocated equity
£3.7bn
£3.8bn
£3.6bn
Average allocated tangible equity (£bn)
£3.3bn
£3.2bn
£2.8bn
Cost: income ratio
49%
51%
58%
Loan loss rate (bps)
431
514
237
Net interest margin
10.65%
10.85%
9.69%
Key facts
US cards 30 day arrears rate
3.0%
2.9%
2.2%
US cards customer FICO score distribution
<660
12%
12%
11%
>660
88%
88%
89%
End net receivables ($bn)
33.1
32.2
29.0
Number of employees (full time equivalent)
2,300
600
600
Balance sheet information
Loans and advances to customers at amortised cost
£20.0bn
£24.2bn
£23.6bn
Deposits at amortised cost
£23.3bn
£19.7bn
£18.3bn
Risk weighted assets
£26.8bn
£24.8bn
£23.9bn
2024 compared to 2023
•The appreciation of average GBP against USD adversely impacted income and profits, and positively impacted credit impairment
charges and total operating expenses
•Profit before tax was £407m (2023: £174m). RoE of 8.1% (2023: 3.4%) and a RoTE of 9.1% (2023: 4.1%) driven by a reduced
impairment charge from lower reserve build, and growth in cards balances driving higher income, partially offset by the strengthening
of GBP against USD. c.£0.9bn ($1.1bn) of the outstanding credit card receivables were sold to Blackstone in Q124, providing a benefit
from reduced RWAs
•Total income increased2% to £3,326m. NII increased2% to £2,659mreflecting underlying growth in cards balances. Net fee,
commission and other income remained stable driven by higher purchases and account growth1
•Total operating expenses decreased2% to £1,626m, driven by efficiency savings
•Credit impairment charges were £1,293m (2023: £1,438m), informed by the anticipated higher delinquencies in US cards partially
offset by the impact of credit risk management actions and methodology enhancements. US cards 30 and 90 day arrears were 3.0%2
(Q423: 2.9%) and 1.6%2 (Q423: 1.5%) respectively. The USCB total coverage ratio increased to 11.4% (December 2023: 10.1%),
primarily driven by the reclassification of a co-branded cards portfolio to assets held for sale, excluding which the coverage ratio was
9.8%
•Loans and advances to customers at amortised cost decreased to £20.0bn (December 2023: £24.2bn) driven by the a
reclassification of balances to assets held for sale. Adjusting for this reclassification, loans and advances to customers at amortised
cost grew to £26.0bn driven by growth in cards balances
•Customer deposits at amortised cost grew to £23.3bn (December 2023: £19.7bn), with underlying deposit growth, in line with
USCB's ambition to grow core deposits
•RWAs increased to £26.8bn (December 2023: £24.8bn), driven by increased receivables
Notes:
1Includes Barclays accounts and those serviced for third parties.
2Including a co-branded card portfolio classified as assets held for sale.
Strategy
Shareholder
information
Climate and
sustainability report
Governance
Risk
review
Financial
review
Financial
statements
Barclays PLC 2024
Annual Report
on Form 20-F
339
Analysis of results by business (continued)
2023 compared to 2022
•Profit before tax was £174m (2022: £487m), with a RoE of 3.4% (2022: 9.8%) and a RoTE of 4.1% (2022: 12.7%). Excluding the impact
of Q423 structural cost actions RoTE was 4.6%
•Total income increased24% to £3,268m, reflecting higher cards balances and improved margins, including the Gap Inc. portfolio
acquisition in Q222
•Total operating expenses increased8% to £1,656m, driven by higher investment spend to support growth, mainly in marketing and
partnership costs, £19m of Q423 structural cost actions and the impact of inflation, partially offset by efficiency savings
•Credit impairment charges increased to £1,438m (2022: £624m), driven by higher delinquencies in US cards, which was anticipated
and led to higher coverage ratios. 30 and 90 day arrears at 2.9% (Q422: 2.2%) and 1.5% (Q422: 1.2%) respectively. The US cards total
coverage ratio was 10.2% (December 2022: 8.1%)
•RWAs increased to £24.8bn (December 2022: £23.9bn), reflecting balance growth
Strategy
Shareholder
information
Climate and
sustainability report
Governance
Risk
review
Financial
review
Financial
statements
Barclays PLC 2024
Annual Report
on Form 20-F
340
Analysis of results by business (continued)
Head Office
2024
2023
2022
£m
£m
£m
Income statement information
Net interest income
646
353
24
Net fee, commission and other income
(352)
157
440
Total income
294
510
464
Operating costs
(836)
(1,352)
(860)
UK regulatory levies
(9)
(14)
(20)
Litigation and conduct
(134)
(48)
(364)
Total operating expenses
(979)
(1,414)
(1,244)
Other net (expenses)/income
37
(6)
4
Loss before impairment
(648)
(910)
(776)
Credit impairment charges
(119)
(60)
(124)
Loss before tax
(767)
(970)
(900)
Attributable loss
(742)
(774)
(949)
Performance measures
Average allocated equity
£6.5bn
£5.0bn
£5.2bn
Average allocated tangible equity
£2.9bn
£1.1bn
£1.6bn
Key facts
Number of employees (full time equivalent)1
61,800
74,000
71,100
Balance sheet information
Risk weighted assets
£16.2bn
£19.0bn
£14.7bn
2024 compared to 2023
•Loss before tax was £767m (2023: £970m)
•Total income decreased to £294m (2023: £510m) mainly driven by the £220m loss on sale of the performing Italian retail mortgage
portfolio and the £9m negative impact from the disposal of the German consumer finance business
•Total operating expenses decreased to £979m (2023: £1,414m)mainly due to the non-repeat of prior year structural cost actions.
Q424 included a £90m provision in relation to historical motor finance commission arrangements1
•Credit impairment charges were £119m (2023: £60m), including a £26m loss on sale on the non-performing Italian mortgage
portfolio. The lower charge in the prior period was influenced by easing inflationary pressure in the modelled German consumer
finance business
•RWAs decreased to £16.2bn (December 2023: £19.0bn) mainly from the sale of the Italian retail mortgage portfolios and a decrease
in relation to merchant acquiring cash in transit settlement balances
Note:
1See Note 25 Legal, competition and regulatory matters for more information on the basis of preparation.
Strategy
Shareholder
information
Climate and
sustainability report
Governance
Risk
review
Financial
review
Financial
statements
Barclays PLC 2024
Annual Report
on Form 20-F
341
Analysis of results by business (continued)
2023 compared to 2022
•Loss before tax was £970m (2022: £900m) including £515m of Q423 structural cost actions
•Total income was broadly stable at £510m (2022: £464m)
•Total operating expenses increased to £1,414m (2022: £1,244m) primarily driven by £515m of Q423 structural cost actions, partially
offset by lower litigation and conduct charges
•Head Office structural cost actions principally include the goodwill and intangible asset impairments related to the merchant
acquiring Payment business, and the Canary Wharf office lease exit
•Credit impairment charges were £60m (2022: £124m) driven by stable credit quality and easing inflationary pressure in the modelled
German consumer finance business
•RWAs increased to £19.0bn (December 2022: £14.7bn) primarily driven by methodology and policy updates including increases in
non-customer assets in merchant acquiring relating to settlement balances
Strategy
Shareholder
information
Climate and
sustainability report
Governance
Risk
review
Financial
review
Financial
statements
Barclays PLC 2024
Annual Report
on Form 20-F
342
Non-IFRS performance measures
The Group’s management believes that the non-IFRS performance measures included in this document provide valuable information
to the readers of the financial statements as they enable the reader to identify a more consistent basis for comparing the businesses’
performance between financial periods, and provide more detail concerning the elements of performance which the managers of these
businesses are most directly able to influence or are relevant for an assessment of the Group.
They also reflect an important aspect of the way in which operating targets are defined and performance is monitored by management.
However, any non-IFRS performance measures in this document are not a substitute for IFRS measures and readers should consider
the IFRS measures as well.
Strategy
Shareholder
information
Climate and
sustainability report
Governance
Risk
review
Financial
review
Financial
statements
Barclays PLC 2024
Annual Report
on Form 20-F
343
Non-IFRS performance measures (continued)
Margins analysis
For the year ended 31 December
2024
2023
2022
Net interest
income
Average
customer
assets
Net interest
margin
Net interest
income
Average
customer
assets
Net interest
margin
Net interest
income
Average
customer
assets
Net interest
margin
£m
£m
%
£m
£m
%
£m
£m
%
Barclays UK
6,627
201,152
3.29
6,431
205,667
3.13
5,893
205,972
2.86
Barclays UK Corporate Bank
1,206
22,776
5.30
1,160
23,207
5.00
1,132
23,066
4.91
Barclays Private Bank and Wealth Management
767
13,983
5.49
768
13,935
5.51
715
14,158
5.05
Barclays US Consumer Bank1
2,659
24,978
10.65
2,604
23,999
10.85
1,972
20,360
9.69
Group excluding IB and Head Office1
11,259
262,889
4.28
10,963
266,808
4.11
9,712
263,556
3.68
Barclays Investment Bank
1,031
1,393
836
Head Office
646
353
24
Barclays Group net interest income
12,936
12,709
10,572
Note:
1 Average customer assets includes held for sale balances generating net interest income.
The Group excluding IB and Head Office Net interest margin increased by 17 bps from 4.11% to 4.28% in 2024, due to continued structural
hedge momentum and higher cards balances in USCB, partially offset by mortgage margin compression in Barclays UK and adverse product
dynamics in deposits.
Structural hedge
The Group employs a structural hedge programme designed to stabilise NIM on fixed rate non-maturity balance sheet items that are
behaviourally stable. As interest rates move, such balances would otherwise drive material income volatility where there is a re-pricing
mismatch with floating rate assets.
The structural hedge predominantly covers non-interest-bearing current accounts and the fixed portion of instant access savings accounts
as well as equity, which are invested into either floating rate customer assets or balances at central banks, creating an exposure to changes in
interest rates. The structural hedge is executed via a portfolio of receive fixed, pay variable interest rate swaps, with an amortising structure so
that a small portion matures and is reinvested each month at prevailing market rates. The pay-floating leg of the interest rate swaps nets down
a proportion of the receive-floating income from the customer assets, leaving a receive-fixed income stream from the structural hedge.
The purpose of the structural hedge is to smooth the Group NII through time. The floating leg of the swap will re-price immediately, whereas the
fixed rate yield on the portfolio reprices gradually, as a portion of the swap portfolio matures and the roll is re-invested onto new market rates.
When interest rates are higher than our structural hedge yield, the pay floating rate will typically be higher than our average receive fixed rate. In
this scenario, when viewed in isolation, the structural hedge will be a net drag to Group NII. When floating rates are lower than our structural
hedge yield, the hedge in isolation will be a net benefit.
Since the receive-fixed swaps are booked for a specific term, an element of NII is ‘locked in’. The income stabilising feature of the structural
hedge provides greater net interest income certainty through the interest rate cycle.
The structural hedge is one component of a larger portfolio of interest rate risk management activities that includes non-structural hedging
(e.g. pay fixed and receive variable flows for asset hedging), and other offsetting flows. The net risk of these positions is executed externally
through interest rate swaps and managed for accounting risk (i.e. income volatility arising from the accounting mismatch of swaps at fair value
through profit and loss and underlying hedged items at amortised cost) within the cash flow hedge reserve1. Overall the Group has external
derivatives designated as cash flow hedges that hedge interest rate risk with a notional £106bn (December 2023: £128bn) which reflects the
structural hedge notional of £232bn (December 2023: £246bn) netted with non-structural hedging positions of £126bn (December 2023:
£118bn). The majority of these interest rate swaps are cleared with Central Clearing Counterparties and margined daily with an average
duration of 3 years (2023: c2.5 years).
Sustained higher interest rates have resulted in a gradual shift in balance sheet composition, with customers migrating from non-interest-
bearing current accounts and instant access savings accounts to higher yielding trackers and term deposits. These trends have stabilised
throughout 2024.
Economic risk management objectives and strategies have remained consistent as the reduction in balances available for structural hedging
has been affected through existing management actions, with buffers utilised and reinvestment of maturing hedges partially paused to
gradually reduce c.£14bn of notional during 2024.
Cashflow hedges on the net externalised risk position have likewise been adjusted through designation/de-designation activity throughout
the year, with associated reserve amounts recycled back to the income statement over the life of the respective designations.
Gross structural hedge contributions were £4,708m (FY23: £3,623m). Gross structural hedge contributions represent the absolute interest
income earned on the fixed legs of the swaps in the structural hedge as the floating leg is offset by the base rate funding of the deposits.
Note:
1Structural hedging derivatives are a component of the net externalised interest rate risk. The net externalised risk position is managed within the cash flow hedge reserve. Note 14
includes details of the net externalised interest rate risk position in "Interest Rate derivatives designated as cash flow hedges” on page 386and cash flow hedge of interest rate risk on
Return on average tangible equity excluding inorganic activity
10.5%
Note:
1Inorganic activity refers to certain inorganic transactions announced as part of the FY23 Investor Update designed to improve Group RoTE beyond 2024. In FY24 this included the
£220m loss on sale of the performing Italian retail mortgage portfolio, the £9m loss on disposal from the German consumer finance business and the £26m loss on sale of the non-
performing Italian retail mortgage portfolio. This was offset by the day 1 net profit before tax of £347m from the acquisition of Tesco Bank which completed 1 November 2024.
Strategy
Shareholder
information
Climate and
sustainability report
Governance
Risk
review
Financial
review
Financial
statements
Barclays PLC 2024
Annual Report
on Form 20-F
346
Non-IFRS performance measures (continued)
Reconciliation of Barclays UK financial results excluding the day 1 impact of Tesco Bank acquisition
Barclays UK
For the year ended 31
December 2024
For the year ended 31
December 2023
% change
£m
£m
%
Total income
8,274
7,587
9
Day 1 income impact of the Tesco Bank acquisition
556
—
Total income excluding day 1 impact of the Tesco Bank acquisition
7,718
7,587
2
Net fee, commission and other income
1,647
1,156
42
Day 1 income impact of the Tesco Bank acquisition
556
—
Net fee, commission and other income excluding day 1 impact of the Tesco
Bank acquisition
1,091
1,156
(6)
Profit before tax
3,580
2,868
25
Day 1 income impact of the Tesco Bank acquisition
556
—
Day 1 impairment impact of the Tesco Bank acquisition
(209)
—
Profit before tax excluding day 1 impact of the Tesco Bank acquisition
3,233
2,868
13
Attributable profit
2,465
1,962
26
Post-tax impact of day 1 impact of the Tesco Bank acquisition
250
—
Attributable profit excluding the day 1 impact of the Tesco Bank acquisition
2,215
1,962
13
Average tangible equity (£bn)
£10.7bn
£10.2bn
Return on average tangible equity excluding the day 1 impact of the Tesco
Bank acquisition
20.8%
19.2%
Personal Banking
£m
£m
% change
Total income
5,333
4,729
13
Day 1 income impact of the Tesco Bank acquisition
556
—
Total income excluding the day 1 impact of the Tesco Bank acquisition
4,777
4,729
1
The reconciliations above show certain Barclays UK performance measures excluding the day 1 impact of the Tesco Bank acquisition,
comprising an income gain of £556m as a result of consideration payable for the net assets being lower than fair value, partially offset by
the post-acquisition £209m impairment charge from IFRS 9 recognition.
Strategy
Shareholder
information
Climate and
sustainability report
Governance
Risk
review
Financial
review
Financial
statements
Barclays PLC 2024
Annual Report
on Form 20-F
347
Non-IFRS performance measures (continued)
Reconciliation of loan loss rate excluding the day 1 impact of Tesco Bank acquisition
Barclays Group
For the year ended 31
December 2024
£m
Credit impairment charges
(1,982)
Day 1 impact of the Tesco Bank acquisition
(209)
Credit impairment charges excluding day 1 impact of the Tesco Bank acquisition
(1,773)
Gross loans and advances held at amortised cost (including portfolios reclassified as held for sale)
£429.6bn
Tesco Bank gross loans and advances held at amortised cost
£8.3bn
Gross loans and advances held at amortised cost (including portfolios reclassified as held for sale) excluding Tesco
Bank
£421.3bn
Loan loss rate (bps)
46
Tesco Bank day 1 loan loss rate impact (bps)
4
Loan loss rate excluding the day 1 impact of Tesco Bank acquisition (bps)
42
Barclays UK
£m
Credit impairment charges
(365)
Day 1 impact of the Tesco Bank acquisition
(209)
Credit impairment charges excluding day 1 impact of the Tesco Bank acquisition
(156)
Gross loans and advances held at amortised cost (including portfolios reclassified as held for sale)
£227.5bn
Tesco Bank gross loans and advances held at amortised cost
£8.3bn
Gross loans and advances held at amortised cost (including portfolios reclassified as held for sale) excluding Tesco
Bank
£219.2bn
Loan loss rate (bps)
16
Tesco Bank day 1 loan loss rate impact (bps)
9
Loan loss rate excluding the day 1 impact of Tesco Bank acquisition (bps)
7
Strategy
Shareholder
information
Climate and
sustainability report
Governance
Risk
review
Financial
review
Financial
statements
Barclays PLC 2024
Annual Report
on Form 20-F
348
Non-IFRS performance measures (continued)
Performance measures excluding the impact of Q423 structural cost actions
For the year ended 31 December 2023
Barclays UK
Barclays UK
Corporate
Bank
Barclays
Private Bank
and Wealth
Management
Barclays
Investment
Bank
Barclays US
Consumer
Bank
Head Office
Barclays Group
£m
£m
£m
£m
£m
£m
Total operating expenses
(4,415)
(912)
(797)
(7,737)
(1,656)
(1,414)
(16,931)
Q423 structural cost actions
(168)
(27)
(29)
(169)
(19)
(515)
(927)
Total operating expenses excluding Q423
structural cost actions
(4,247)
(885)
(768)
(7,568)
(1,637)
(899)
(16,004)
Total income
7,587
1,770
1,208
11,035
3,268
510
25,378
Cost: income ratio excluding Q423 structural
cost actions
56%
50%
64%
69%
50%
n/m
63%
Attributable profit/(loss)
1,962
584
330
2,041
131
(774)
4,274
Post-tax impact of Q423 structural cost actions
(122)
(20)
(24)
(126)
(14)
(433)
(739)
Attributable profit/(loss) excluding the impact of
Q423 structural cost actions
2,084
604
354
2,167
145
(341)
5,013
Average tangible equity
£10.2bn
£2.9bn
£1.0bn
£29.0bn
£3.2bn
£1.1bn
£47.4bn
Return on average tangible equity excluding
Q423 structural cost actions
20.4%
21.2%
35.1%
7.5%
4.6%
n/m
10.6%
Reconciliation of total operating expenses to operating costs
2024
2023
2022
£m
£m
£m
Total operating expenses
(16,735)
(16,931)
(16,730)
UK regulatory levies
(320)
(180)
(176)
Litigation and conduct
(220)
(37)
(1,597)
Operating costs
(16,195)
(16,714)
(14,957)
Reconciliation of group net interest income excluding IB and Head Office
2024
2023
2022
£m
£m
£m
Total Barclays Group net interest income
12,936
12,709
10,572
Barclays Investment Bank
1,031
1,393
836
Head Office
646
353
24
Group NII excluding IB and Head Office
11,259
10,963
9,712
Strategy
Shareholder
information
Climate and
sustainability report
Governance
Risk
review
Financial
review
Financial
statements
Barclays PLC 2024
Annual Report
on Form 20-F
349
Non-IFRS performance measures (continued)
Tangible net asset value per share
2024
2023
2022
£m
£m
£m
Total equity excluding non-controlling interests
71,821
71,204
68,292
Other equity instruments
(12,075)
(13,259)
(13,284)
Shareholders' equity attributable to ordinary shareholders of the parent
59,746
57,945
55,008
Goodwill and intangibles
(8,275)
(7,794)
(8,239)
Tangible shareholders’ equity attributable to ordinary shareholders of the parent
51,471
50,151
46,769
Shares in issue
14,420m
15,155m
15,871m
Net asset value per share
414p
382p
347p
Tangible net asset value per share
357p
331p
295p
Strategy
Shareholder
information
Climate and
sustainability report
Governance
Risk
review
Financial
review
Financial
statements
Barclays PLC 2024
Annual Report
on Form 20-F
350
Non-IFRS performance measures (continued)
Return on equity
Profit/(loss) attributable
to ordinary equity holders
of the parent
Average equity
Return on average equity
£m
bn
%
For the year ended 31 December 2024
Barclays UK
2,465
14.6
16.9
Barclays UK Corporate Bank
490
3.1
16.0
Barclays Private Bank and Wealth Management
288
1.1
25.7
Barclays Investment Bank
2,513
29.7
8.5
Barclays US Consumer Bank
302
3.7
8.1
Head Office
(742)
6.5
n/m
Barclays Group
5,316
58.7
9.1
For the year ended 31 December 2023
Barclays UK
1,962
14.0
14.0
Barclays UK Corporate Bank
584
2.9
20.5
Barclays Private Bank and Wealth Management
330
1.1
29.9
Barclays Investment Bank
2,041
29.0
7.0
Barclays US Consumer Bank
131
3.8
3.4
Head Office
(774)
5.0
n/m
Barclays Group
4,274
55.8
7.6
For the year ended 31 December 2022
Barclays UK
1,877
13.6
13.8
Barclays UK Corporate Bank
563
2.9
19.2
Barclays Private Bank and Wealth Management
370
1.1
33.2
Barclays Investment Bank
2,806
30.0
9.3
Barclays US Consumer Bank
356
3.6
9.8
Head Office
(949)
5.2
n/m
Barclays Group
5,023
56.4
8.9
Financial statements
Detailed analysis of our statutory accounts,
independently audited and providing in-depth
disclosure on the financial performance of the Group.
Barclays has adopted the British Bankers’ Association (BBA) Code for Financial Reporting
Disclosure as adopted by UK Finance in 2017 and has prepared the 2024 Annual Report in
compliance with the BBA Code. Barclays is committed to continuously reflect the objectives
Reportof Independent Registered Public Accounting Firm
To the Shareholders and Board of Directors of Barclays PLC:
Opinions on the Consolidated Financial Statements and Internal Control Over Financial Reporting
We have audited the accompanying consolidated balance sheets of Barclays PLC and subsidiaries (the Company) as of December 31,
2024 and 2023, the related consolidated income statements, consolidated statements of comprehensive income, consolidated
statements of changes in equity, and consolidated cash flow statements for each of the years in the three-year period ended
December 31, 2024, and the related notes and specific disclosures described in Note 1 of the consolidated financial statements as
being part of the consolidated financial statements (collectively, the consolidated financial statements). We also have audited the
Company’s internal control over financial reporting as of December 31, 2024, based on criteria established in Internal Control –
Integrated Framework (2013) issued by the Committee of Sponsoring Organizations of the Treadway Commission.
In our opinion, the consolidated financial statements referred to above present fairly, in all material respects, the financial position of the
Company as of December 31, 2024 and 2023, and the results of its operations and its cash flows for each of the years in the three-year
period ended December 31, 2024, in conformity with International Financial Reporting Standards, as issued by the International
Accounting Standards Board. Also in our opinion, the Company maintained, in all material respects, effective internal control over
financial reporting as of December 31, 2024 based on criteria established in Internal Control – Integrated Framework (2013) issued by
the Committee of Sponsoring Organizations of the Treadway Commission.
The Company acquired the retail banking business of Tesco Personal Finance plc during 2024 (acquired business referred as ‘Tesco
Bank’), and management excluded from its assessment of the effectiveness of the Company’s internal control over financial reporting
as of December 31, 2024, Tesco Bank’s internal control over financial reporting associated with approximately 0.4% of gross income
and 0.7% of total assets included in the consolidated financial statements of the Company as of and for the year ended December 31,
2024. Our audit of internal control over financial reporting of the Company also excluded an evaluation of the internal control over
financial reporting of Tesco Bank.
Basis for Opinions
The Company’s management is responsible for these consolidated financial statements, for maintaining effective internal control over
financial reporting, and for its assessment of the effectiveness of internal control over financial reporting, included in the accompanying
Management’s report on internal control over financial reporting. Our responsibility is to express an opinion on the Company’s
consolidated financial statements and an opinion on the Company’s internal control over financial reporting based on our audits. We are
a public accounting firm registered with the Public Company Accounting Oversight Board (United States) (PCAOB) and are required to
be independent with respect to the Company in accordance with the U.S. federal securities laws and the applicable rules and regulations
of the Securities and Exchange Commission and the PCAOB.
We conducted our audits in accordance with the standards of the PCAOB. Those standards require that we plan and perform the audits
to obtain reasonable assurance about whether the consolidated financial statements are free of material misstatement, whether due
to error or fraud, and whether effective internal control over financial reporting was maintained in all material respects.
Our audits of the consolidated financial statements included performing procedures to assess the risks of material misstatement of the
consolidated financial statements, whether due to error or fraud, and performing procedures that respond to those risks. Such
procedures included examining, on a test basis, evidence regarding the amounts and disclosures in the consolidated financial
statements. Our audits also included evaluating the accounting principles used and significant estimates made by management, as well
as evaluating the overall presentation of the consolidated financial statements. Our audit of internal control over financial reporting
included obtaining an understanding of internal control over financial reporting, assessing the risk that a material weakness exists, and
testing and evaluating the design and operating effectiveness of internal control based on the assessed risk. Our audits also included
performing such other procedures as we considered necessary in the circumstances. We believe that our audits provide a reasonable
basis for our opinions.
Definition and Limitations of Internal Control Over Financial Reporting
A company’s internal control over financial reporting is a process designed to provide reasonable assurance regarding the reliability of
financial reporting and the preparation of financial statements for external purposes in accordance with generally accepted accounting
principles. A company’s internal control over financial reporting includes those policies and procedures that (1) pertain to the
maintenance of records that, in reasonable detail, accurately and fairly reflect the transactions and dispositions of the assets of the
company; (2) provide reasonable assurance that transactions are recorded as necessary to permit preparation of financial statements
in accordance with generally accepted accounting principles, and that receipts and expenditures of the company are being made only in
accordance with authorization of management and directors of the company; and (3) provide reasonable assurance regarding
prevention or timely detection of unauthorized acquisition, use, or disposition of the company’s assets that could have a material effect
on the financial statements.
Because of its inherent limitations, internal control over financial reporting may not prevent or detect misstatements. Also, projections
of any evaluation of effectiveness to future periods are subject to the risk that controls may become inadequate because of changes in
conditions, or that the degree of compliance with the policies or procedures may deteriorate.
Critical Audit Matters
The critical audit matters communicated below are matters arising from the current period audit of the consolidated financial
statements that were communicated or required to be communicated to the audit committee and that: (1) relate to accounts or
disclosures that are material to the consolidated financial statements and (2) involved our especially challenging, subjective, or complex
Strategy
Shareholder
information
Climate and
sustainability report
Governance
Risk
review
Financial
review
Financial
statements
Barclays PLC 2024
Annual Report
on Form 20-F
354
Independent Auditor's Report (continued)
judgements. The communication of critical audit matters does not alter in any way our opinion on the consolidated financial
statements, taken as a whole, and we are not, by communicating the critical audit matters below, providing separate opinions on the
critical audit matters or on the accounts or disclosures to which they relate.
Impairment allowance for loans and advances at amortized cost, including off-balance sheet elements of the allowance
As discussed in note 8 to the consolidated financial statements, and in the Credit risk management (audited) disclosures on pages229
to 281, the Company’s impairment allowance for loans and advances, including off-balance sheet elements at amortised cost was
£5.5bn as at December 31, 2024.
We identified the assessment of impairment allowance for loans and advances at amortised cost, including off balance sheet elements
as a critical audit matter. A high degree of audit effort, including specialised skills and knowledge was required because it involved
significant measurement uncertainty. Complex and subjective auditor judgement was required to assess the following:
•Model estimations – Complex and subjective auditor judgement was applied in assessing the Company’s modelled estimations of
Expected Credit Losses (“ECL”) due to the inherently judgemental nature of the underlying models including the IFRS 9 Probability of
Default (“PD”) models, the Loss Given Default (“LGD”) models and the Exposure at Default (“EAD”) models, and the associated
assumptions. Certain IFRS 9 models and assumptions are the key drivers of complexity and uncertainty, and minor changes to these
could have a significant effect on the Company’s calculation of the ECL estimate.
•Economic scenarios – Complex and subjective auditor judgement was applied in assessing the forward-looking economic scenarios
used by the Company as an input to calculate ECL, the probability weightings applied to them and the complexity of models used to
derive the probability weightings.
•Qualitative adjustments – Complex and subjective auditor judgement was applied in assessing certain qualitative adjustments to the
model-driven impairment allowance due to the inherent estimation uncertainty associated with these adjustments.
The following are the primary procedures we performed to address this critical audit matter.
•We evaluated the design and tested the operating effectiveness of certain internal controls over the Company’s process for
estimating the impairment allowance for loans and advances at amortised cost, including off-balance sheet elements. This included
controls relating to the (1) application of the staging criteria, (2) model validation, implementation and monitoring, (3) authorisation
and calculation of qualitative adjustments and management overlays, (4) selection and implementation of economic variables and
the controls over the economic scenario selection and probabilities, and (5) credit reviews that determine customer risk ratings used
in the models for a population of wholesale customers.
•We involved credit risk modelling professionals with specialised skills and knowledge, who assisted in the following:
–Evaluating the Company’s impairment methodologies for compliance with IFRS 9;
–Inspecting model code for the calculation of certain components of the ECL model to assess its consistency with the Company’s
modelling methodology;
–Evaluating model changes (including the updated model code) for a selection of models which were changed or updated during the
year as to whether they were appropriate by assessing the updated model methodology against the applicable accounting
standard;
–Reperforming the calculation of certain adjustments to assess consistency with the qualitative adjustment methodologies;
–Evaluating the model output for a selection of models by inspecting the corresponding model functionality and independently
implementing the model by rebuilding the model code and comparing our independent output with management’s output;
–Assessing the appropriateness of certain assumptions by inspecting and evaluating management’s documented methodology for
how the assumption is determined; and
–Reperforming and assessing, for a selection of models, the reasonableness of the model predictions by comparing them against
actual results and evaluating the resulting differences.
In addition, we involved economic professionals with specialised skills and knowledge, who assisted in:
–Assessing the reasonableness of the Company’s methodology and models used for determining the economic scenarios used
and the probability weightings applied to them;
–Assessing key economic variables which included comparing a selection of economic variables to external sources; and
–Assessing the overall reasonableness of the economic forecasts by comparing the Company’s forecasts to our own modelled
forecasts.
Valuation of certain level 3 and level 2 financial instruments recorded at fair value
As discussed in Note 17 to the Company’s consolidated financial statements, the balances of financial assets and liabilities recorded at
fair value as at December 31, 2024 were £732bn and £619bn, respectively. This includes Level 3 assets (£24bn) and liabilities (£7bn)
respectively. The Company has Level 2 financial assets at fair value of £600bn and financial liabilities at fair value of £584bn. The
Company is required to apply valuation techniques which often involve the exercise of significant judgement and the use of
assumptions and valuation models over certain level 3 and level 2 financial assets and liabilities.
We identified the valuation of certain level 3 and level 2 financial instruments recorded at fair value as a critical audit matter. This is
because there was significant measurement uncertainty associated with the fair value estimates of these instruments and subjective
auditor judgement, including specialised skills and knowledge, was required to evaluate pricing data inputs, valuation models and fair
value adjustments ("FVA"), including portfolio-level FVAs related to credit, collateralisation and funding (commonly referred to as
"XVAs").
Strategy
Shareholder
information
Climate and
sustainability report
Governance
Risk
review
Financial
review
Financial
statements
Barclays PLC 2024
Annual Report
on Form 20-F
355
Independent Auditor's Report (continued)
The following are the primary procedures we performed to address this critical audit matter:
•We evaluated the design and tested the operating effectiveness of certain internal controls over the Company’s process to measure
fair value of these portfolios. This included controls related to (1) the independent price verification (IPV) of certain pricing data inputs,
(2) the determination or calculation of FVAs, including exit adjustments (to mark the portfolio to bid or offer prices), model
shortcoming reserves to address model limitations and XVAs, and (3) the validation, completeness, implementation and usage of
valuation models including assessment of the impact of model limitations and assumptions.
•For a selection of collateral disputes identified by management, we challenged management’s valuation where significant fair value
differences were observable with the market participant’s valuation on the other side of the trade. We also utilised collateral dispute
data to identify fair value financial instruments with significant fair value differences against market counterparties and selected these
to independently reprice.
•We performed a retrospective review by inspecting significant gains and losses on a selection of new fair value financial instruments,
historical exit prices on similar instruments and restructurings throughout the audit period and evaluated whether these data points
indicated elements of fair value not incorporated in the current valuation methodologies. We also inspected movements in
unobservable inputs throughout the period to challenge whether any gain or loss generated was appropriate.
•We involved valuation professionals with specialised skills and knowledge, who assisted in the following:
–Independently re-pricing a selection of fair value financial instruments and challenging management on the valuations where they
were outside our tolerance; and
–Challenging the appropriateness of significant models and methodologies used in calculating fair values, risk exposures and in
calculating FVAs and XVAs, including comparison to industry practice.
•We inspected trading revenue arising on level 3 positions to assess whether material gains or losses generated were in line with the
accounting standards.
UK Pension Scheme – Defined Benefit Obligation (DBO) assumptions
As discussed in Note 32 to the consolidated financial statements, the total fair value of the Company’s defined benefit pension
obligation as of December 31, 2024 was £20bn, of which £19bn was related to the UK Retirement Fund (UKRF). The determination of
the Company’s defined benefit pension obligation with respect to these plans is dependent on certain actuarial assumptions, including
the discount rate, inflation rate (or retail price index) and mortality assumptions.
We identified the valuation of the defined benefit pension obligation in respect of UKRF as a critical audit matter. Subjective and
complex auditor judgement, including specialised skills and knowledge, was required in evaluating the discount rates, retail price index
('RPI') and mortality assumptions used, as small changes would have a significant impact on the measurement of the defined benefit
pension obligation.
The following are the primary procedures we performed to address this critical audit matter:
•We evaluated the design and tested the operating effectiveness of certain internal controls over the Company’s defined benefit
pension obligation process, this included controls related to management’s review of IAS 19 assumptions including discount rate, RPI
and mortality assumptions, and;
•We involved actuarial professionals with specialised skills and knowledge who assisted in assessing the Company’s discount rate, RPI
and mortality assumptions by evaluating those assumptions against expectations derived from external sources.
/s/KPMG LLP
We have served as the Company’s auditor since 2017.
London, United Kingdom
February 12, 2025
Strategy
Shareholder
information
Climate and
sustainability report
Governance
Risk
review
Financial
review
Financial
statements
Barclays PLC 2024
Annual Report
on Form 20-F
356
Consolidated financial statements
Consolidated income statement
2024
2023
2022
For the year ended 31 December
Notes
£m
£m
£m
Interest and similar income
3
38,326
35,075
19,096
Interest and similar expense
3
(25,390)
(22,366)
(8,524)
Net interest income
12,936
12,709
10,572
Fee and commission income
4
10,847
10,121
9,637
Fee and commission expense
4
(3,600)
(3,592)
(3,038)
Net fee and commission income
7,247
6,529
6,599
Net trading income
5
5,768
5,945
8,049
Net investment income/(expense)
6
216
61
(434)
Gain on acquisition
41
556
—
—
Other income
65
134
170
Total income
26,788
25,378
24,956
Staff costs
30
(9,876)
(10,017)
(9,252)
Infrastructure costs
7
(3,549)
(4,095)
(3,435)
Administration and general expenses
7
(2,770)
(2,602)
(2,270)
UK regulatory levies
7
(320)
(180)
(176)
Litigation and conduct
7
(220)
(37)
(1,597)
Operating expenses
7
(16,735)
(16,931)
(16,730)
Share of post-tax results of associates and joint ventures
37
(9)
6
Profit before impairment
10,090
8,438
8,232
Credit impairment charges
8
(1,982)
(1,881)
(1,220)
Profit before tax
8,108
6,557
7,012
Taxation
9
(1,752)
(1,234)
(1,039)
Profit after tax
6,356
5,323
5,973
Attributable to:
Equity holders of the parent
5,316
4,274
5,023
Other equity instrument holders
991
985
905
Total equity holders of the parent
6,307
5,259
5,928
Non-controlling interests
29
49
64
45
Profit after tax
6,356
5,323
5,973
Earnings per share
p
p
p
Basic earnings per ordinary share
10
36.0
27.7
30.8
Diluted earnings per share
10
34.8
26.9
29.8
Strategy
Shareholder
information
Climate and
sustainability report
Governance
Risk
review
Financial
review
Financial
statements
Barclays PLC 2024
Annual Report
on Form 20-F
357
Consolidated financial statements (continued)
Consolidated statement of comprehensive income
2024
2023
2022
For the year ended 31 December
£m
£m
£m
Profit after tax
6,356
5,323
5,973
Other comprehensive income/(loss) that may be recycled to profit or loss:
Currency translation reserve
Currency translation differences1
(59)
(1,110)
2,032
Tax
13
9
—
Fair value through other comprehensive income reserve movements relating to debt securities
Net (losses)/gains from changes in fair value
(863)
1,486
(7,516)
Net (gains)/losses transferred to net profit on disposal
(164)
(26)
111
Net losses/(gain) relating to (releases of) impairment
1
(1)
9
Net gains/(losses) due to fair value hedging
325
(1,184)
5,452
Tax
194
(78)
523
Cash flow hedging reserve
Net (losses)/gains from changes in fair value
(784)
4,447
(9,052)
Net losses transferred to net profit
1,842
423
339
Tax
(281)
(1,342)
2,331
Other comprehensive income/(loss) that may be recycled to profit or loss
224
2,624
(5,771)
Other comprehensive income/(loss) not recycled to profit or loss:
Retirement benefit remeasurements
(427)
(1,193)
(754)
Fair value through other comprehensive income reserve movements relating to equity instruments
—
(3)
228
Own credit
(1,130)
(983)
2,092
Tax
432
611
(156)
Other comprehensive (loss)/income not recycled to profit or loss
(1,125)
(1,568)
1,410
Other comprehensive (loss)/income for the year
(901)
1,056
(4,361)
Total comprehensive income for the year
5,455
6,379
1,612
Attributable to:
Equity holders of the parent
5,406
6,315
1,567
Non-controlling interests
49
64
45
Total comprehensive income for the year
5,455
6,379
1,612
Note:
1Includes £1m gain (2023: £0m ; 2022: £1m gain ) on recycling of currency translation differences to net profit.
Strategy
Shareholder
information
Climate and
sustainability report
Governance
Risk
review
Financial
review
Financial
statements
Barclays PLC 2024
Annual Report
on Form 20-F
358
Consolidated financial statements (continued)
Consolidated balance sheet
2024
2023
As at 31 December
Notes
£m
£m
Assets
Cash and balances at central banks
210,184
224,634
Cash collateral and settlement balances
119,843
108,889
Debt securities at amortised cost
68,210
56,749
Loans and advances at amortised cost to banks
8,327
9,459
Loans and advances at amortised cost to customers
337,946
333,288
Reverse repurchase agreements and other similar secured lending at amortised cost
4,734
2,594
Trading portfolio assets
12
166,453
174,605
Financial assets at fair value through the income statement
13
193,734
206,651
Derivative financial instruments
14
293,530
256,836
Financial assets at fair value through other comprehensive income
15
78,059
71,836
Investments in associates and joint ventures
35
891
879
Goodwill and intangible assets
21
8,275
7,794
Property, plant and equipment
19
3,604
3,417
Current tax assets
155
121
Deferred tax assets
9
6,321
5,960
Retirement benefit assets
32
3,263
3,667
Assets included in disposal group classified as held for sale
40
9,854
3,916
Other assets
4,819
6,192
Total assets
1,518,202
1,477,487
Liabilities
Deposits at amortised cost from banks
13,203
14,472
Deposits at amortised cost from customers
547,460
524,317
Cash collateral and settlement balances
106,229
94,084
Repurchase agreements and other similar secured borrowing at amortised cost
39,415
41,601
Debt securities in issue
92,402
96,825
Subordinated liabilities
26
11,921
10,494
Trading portfolio liabilities
12
56,908
58,669
Financial liabilities designated at fair value
16
282,224
297,539
Derivative financial instruments
14
279,415
250,044
Current tax liabilities
566
529
Deferred tax liabilities
9
18
22
Retirement benefit liabilities
32
240
266
Provisions
23
1,383
1,584
Liabilities included in disposal group classified as held for sale
40
3,726
3,164
Other liabilities
22
10,611
12,013
Total liabilities
1,445,721
1,405,623
Equity
Called up share capital and share premium
27
4,186
4,288
Other equity instruments
27
12,075
13,259
Other reserves
28
(468)
(77)
Retained earnings
56,028
53,734
Total equity excluding non-controlling interests
71,821
71,204
Non-controlling interests
29
660
660
Total equity
72,481
71,864
Total liabilities and equity
1,518,202
1,477,487
The Board of Directors approved the financial statements on pages 356 to 449 on 12 February 2025.
Nigel Higgins
Group Chairman
C.S. Venkatakrishnan
Group Chief Executive
Anna Cross
Group Finance Director
Strategy
Shareholder
information
Climate and
sustainability report
Governance
Risk
review
Financial
review
Financial
statements
Barclays PLC 2024
Annual Report
on Form 20-F
359
Consolidated financial statements (continued)
Consolidated statement of changes in equity
Called up share
capital and share
premium1
Other equity
instruments1
Other reserves2
Retained earnings
Total equity
excluding non-
controlling
interests
Non-controlling
interests
Total equity
£m
£m
£m
£m
£m
£m
£m
Balance as at 1 January 2024
4,288
13,259
(77)
53,734
71,204
660
71,864
Profit after tax
—
991
—
5,316
6,307
49
6,356
Currency translation
movements
—
—
(46)
—
(46)
—
(46)
Fair value through other
comprehensive income reserve
—
—
(507)
—
(507)
—
(507)
Cash flow hedges
—
—
777
—
777
—
777
Retirement benefit
remeasurements
—
—
—
(303)
(303)
—
(303)
Own credit reserve
—
—
(822)
—
(822)
—
(822)
Total comprehensive income
for the year
—
991
(598)
5,013
5,406
49
5,455
Employee share schemes and
hedging thereof
103
—
—
874
977
—
977
Issue and redemption of other
equity instruments
—
(1,155)
—
(96)
(1,251)
—
(1,251)
Other equity instruments
coupons paid
—
(991)
—
—
(991)
—
(991)
Increase in treasury shares
—
—
(269)
—
(269)
—
(269)
Vesting of shares under
employee share schemes
—
—
268
(508)
(240)
—
(240)
Dividends paid
—
—
—
(1,221)
(1,221)
(49)
(1,270)
Repurchase of shares
(205)
—
205
(1,760)
(1,760)
—
(1,760)
Other reserve movements
—
(29)
3
(8)
(34)
—
(34)
Balance as at 31 December
2024
4,186
12,075
(468)
56,028
71,821
660
72,481
Balance as at 1 January 2023
4,373
13,284
(2,192)
52,827
68,292
968
69,260
Profit after tax
—
985
—
4,274
5,259
64
5,323
Currency translation
movements
—
—
(1,101)
—
(1,101)
—
(1,101)
Fair value through other
comprehensive income reserve
—
—
194
—
194
—
194
Cash flow hedges
—
—
3,528
—
3,528
—
3,528
Retirement benefit
remeasurements
—
—
—
(855)
(855)
—
(855)
Own credit reserve
—
—
(710)
—
(710)
—
(710)
Total comprehensive income
for the year
—
985
1,911
3,419
6,315
64
6,379
Employee share schemes and
hedging thereof
124
—
—
497
621
—
621
Issue and redemption of other
equity instruments
—
(30)
—
(38)
(68)
(312)
(380)
Other equity instruments
coupons paid
—
(985)
—
—
(985)
—
(985)
Increase in treasury shares
—
—
(285)
—
(285)
—
(285)
Vesting of shares under
employee share schemes
—
—
277
(506)
(229)
—
(229)
Dividends paid
—
—
—
(1,210)
(1,210)
(64)
(1,274)
Repurchase of shares
(209)
—
209
(1,257)
(1,257)
—
(1,257)
Other reserve movements
—
5
3
2
10
4
14
Balance as at 31 December
2023
4,288
13,259
(77)
53,734
71,204
660
71,864
Notes:
1For further details refer to Note 27.
2For further details refer to Note 28.
Strategy
Shareholder
information
Climate and
sustainability report
Governance
Risk
review
Financial
review
Financial
statements
Barclays PLC 2024
Annual Report
on Form 20-F
360
Consolidated financial statements (continued)
Called up share
capital and share
premium
Other equity
instruments
Other reserves
Retained earnings
Total equity
excluding non-
controlling
interests
Non-controlling
interests
Total equity
£m
£m
£m
£m
£m
£m
£m
Balance as at 1 January 2022
4,536
12,259
1,770
50,487
69,052
989
70,041
Profit after tax
—
905
—
5,023
5,928
45
5,973
Currency translation
movements
—
—
2,032
—
2,032
—
2,032
Fair value through other
comprehensive income reserve
—
—
(1,193)
—
(1,193)
—
(1,193)
Cash flow hedges
—
—
(6,382)
—
(6,382)
—
(6,382)
Retirement benefit
remeasurements
—
—
—
(281)
(281)
—
(281)
Own credit reserve
—
—
1,463
—
1,463
—
1,463
Total comprehensive income
for the year
—
905
(4,080)
4,742
1,567
45
1,612
Employee share schemes and
hedging thereof
70
—
—
476
546
—
546
Issue and exchange of other
equity instruments
—
1,032
—
28
1,060
(20)
1,040
Other equity instruments
coupons paid
—
(905)
—
—
(905)
—
(905)
Disposal of Absa holding
—
—
(84)
84
—
—
—
Increase in treasury shares
—
—
(248)
—
(248)
—
(248)
Vesting of shares under
employee share schemes
—
—
253
(485)
(232)
—
(232)
Dividends paid
—
—
—
(1,028)
(1,028)
(45)
(1,073)
Repurchase of shares
(233)
—
233
(1,508)
(1,508)
—
(1,508)
Own credit realisation
—
—
(36)
36
—
—
—
Other reserve movements
—
(7)
—
(5)
(12)
(1)
(13)
Balance as at 31 December
2022
4,373
13,284
(2,192)
52,827
68,292
968
69,260
Strategy
Shareholder
information
Climate and
sustainability report
Governance
Risk
review
Financial
review
Financial
statements
Barclays PLC 2024
Annual Report
on Form 20-F
361
Consolidated financial statements (continued)
Consolidated cash flow statement
2024
2023
2022
For the year ended 31 December
Notes
£m
£m
£m
Reconciliation of profit before tax to net cash flows from operating activities:
Profit before tax
8,108
6,557
7,012
Adjustment for non-cash items:
Credit impairment charges
1,982
1,881
1,220
Depreciation, amortisation and impairment of property, plant, equipment and intangibles
1,734
2,147
1,786
Other provisions, including pensions
500
482
1,724
Net loss on disposal of investments and property, plant and equipment
20
11
54
Other non-cash movements including exchange rate movements
2,384
10,729
(13,298)
Changes in operating assets and liabilities
Net decrease/(increase) in cash collateral and settlement balances
2,391
1,165
(881)
Net decrease/(increase) in loans and advances at amortised cost
284
10,947
(24,949)
Net (increase)/decrease in reverse repurchase agreements and other similar secured lending
(2,140)
(1,818)
2,451
Net increase/(decrease) in deposits at amortised cost
14,952
(6,958)
26,349
Net (decrease)/increase in debt securities in issue
(9,978)
(19,640)
9,210
Net (decrease)/increase in repurchase agreements and other similar secured borrowing
(2,186)
14,549
(1,300)
Net (increase)/decrease in derivative financial instruments
(7,303)
5,968
(7,071)
Net decrease/(increase) in trading portfolio assets
8,152
(40,792)
13,222
Net (decrease)/increase in trading portfolio liabilities
(1,761)
(14,255)
18,755
Net (decrease)/increase in financial assets and liabilities at fair value through the income statement
(2,408)
32,819
(919)
Net increase in other assets
(4,040)
(1,521)
(3,497)
Net (decrease)/increase in other liabilities
(2,295)
(2,362)
1,051
Corporate income tax paid
(1,283)
(836)
(688)
Net cash from operating activities
7,113
(927)
30,231
Purchase of debt securities at amortised cost
(28,945)
(19,977)
(27,731)
Proceeds from redemption or sale of debt securities at amortised cost
17,505
7,332
14,277
Purchase of financial assets at fair value through other comprehensive income
(80,980)
(66,415)
(69,380)
Proceeds from sale or redemption of financial assets at fair value through other comprehensive income
73,819
59,756
62,821
Purchase of property, plant and equipment and intangibles
(1,574)
(1,718)
(1,746)
Acquisition of business
(460)
(2,415)
—
Other cash flows associated with investing activities2
2,749
23
86
Net cash from investing activities
(17,886)
(23,414)
(21,673)
Dividends paid and other coupon payments on equity instruments
(2,261)
(2,259)
(1,978)
Issuance of subordinated liabilities
26
1,870
1,523
1,477
Redemption of subordinated liabilities
26
(476)
(2,239)
(2,679)
Issue of shares and other equity instruments
1,684
3,251
3,205
Repurchase of shares and other equity instruments
(4,525)
(4,750)
(3,655)
Issuance of debt securities1
12,144
9,836
11,139
Redemption of debt securities1
(7,143)
(6,252)
(6,335)
Net purchase of treasury shares
(509)
(499)
(478)
Net cash from financing activities
784
(1,389)
696
Effect of exchange rates on cash and cash equivalents
(2,407)
(5,053)
10,330
Net (decrease)/increase in cash and cash equivalents
(12,396)
(30,783)
19,584
Cash and cash equivalents at beginning of year
248,007
278,790
259,206
Cash and cash equivalents at end of year
235,611
248,007
278,790
Cash and cash equivalents comprise:
Cash and balances at central banks
210,184
224,634
256,351
Loans and advances to banks with original maturity of three months or less
7,230
6,639
6,431
Cash collateral balances with central banks with original maturity of three months or less
16,650
15,450
15,150
Treasury and other eligible bills with original maturity of three months or less
1,547
1,284
858
Cash and cash equivalents at end of year
235,611
248,007
278,790
Notes:
1Issuance of debt securities and redemption of debt securities included in financing activities relate to instruments that qualify as eligible liabilities and satisfy regulatory requirements for
MREL instruments which came into effect during 2019. Refer to Note 1, paragraph 4(vi), for further details.
2This relates to the net proceeds from sale of Italian retail mortgage portfolio.
Interest received was £38,212m (2023: £35,089m; 2022: £18,283m) and interest paid was £25,287m (2023: £20,303m; 2022:
£8,686m). 2023 and 2022 comparative figures have been amended to make the cash flow statement more relevant following a review
of the disclosure and the basis of preparation applied. Following that review, the basis of preparation of interest received and paid has
been amended to reflect interest received and interest paid on activity where interest is recognised on an effective interest rate basis
to make the cash flow statement information more relevant with reference to net interest income recognised in the income statement
and enhancing comparability with industry peers. Previously, amounts related to trading activities were also included.
Dividends received were £3m (2023: £0m; 2022: £31m).
The Group is required to maintain balances with central banks and other regulatory authorities. These amounted to £2,945m (2023:
£3,758m; 2022: £3,457m) and are included within the Cash and cash equivalents. For the purposes of the cash flow statement, cash
comprises cash on hand and demand deposits and cash equivalents comprise highly liquid investments that are convertible into cash
with an insignificant risk of changes in value with original maturities of three months or less. Repurchase and reverse repurchase
agreements are not considered to be part of cash equivalents.
Strategy
Shareholder
information
Climate and
sustainability report
Governance
Risk
review
Financial
review
Financial
statements
Barclays PLC 2024
Annual Report
on Form 20-F
362
Parent company accounts
Statement of comprehensive income
2024
2023
2022
For the year ended 31 December
Notes
£m
£m
£m
Dividend received from subsidiaries
42
3,087
2,818
2,797
Net interest expense
(15)
(11)
(163)
Other income/(expense)
42
1,183
1,174
(654)
Operating expenses
(264)
(296)
(257)
Profit before tax
3,991
3,685
1,723
Taxation
91
81
440
Profit after tax
4,082
3,766
2,163
Other comprehensive income
—
—
—
Total comprehensive income
4,082
3,766
2,163
Profit after tax attributable to:
Ordinary equity holders
3,092
2,781
1,258
Other equity instrument holders
990
985
905
Profit after tax
4,082
3,766
2,163
Total comprehensive income attributable to:
Ordinary equity holders
3,092
2,781
1,258
Other equity instrument holders
990
985
905
Total comprehensive income
4,082
3,766
2,163
For the year ended 31 December 2024, profit after tax was £4,082m (2023: £3,766m, 2022: £2,163m) and total comprehensive income
was £4,082m (2023: £3,766m, 2022: £2,163m).The Company has58members of staff (2023: 61, 2022: 61).
Balance sheet
2024
2023
As at 31 December
Notes
£m
£m
Assets
Investment in subsidiaries
42
63,315
64,461
Loans and advances to subsidiaries
42
18,407
18,926
Financial assets at fair value through the income statement
42
44,435
35,787
Derivative financial instruments
31
33
Other assets
441
407
Total assets
126,629
119,614
Liabilities
Deposits at amortised cost
542
542
Debt securities in issue
42
16,337
18,308
Subordinated liabilities
42
9,706
10,018
Financial liabilities designated at fair value
42
42,324
31,832
Derivative financial instruments
42
654
711
Other liabilities
80
175
Total liabilities
69,643
61,586
Equity
Called up share capital and share premium
42
4,186
4,288
Other equity instruments
42
12,033
13,198
Other reserves
1,202
997
Retained earnings
39,565
39,545
Total equity
56,986
58,028
Total liabilities and equity
126,629
119,614
The financial statements on pages 362 to 364 and the accompanying note on page 445 were approved by the Board of Directors on 12
February 2025 and signed on its behalf by:
Nigel Higgins
Group Chairman
C.S.Venkatakrishnan
Group Chief Executive
Anna Cross
Group Finance Director
Strategy
Shareholder
information
Climate and
sustainability report
Governance
Risk
review
Financial
review
Financial
statements
Barclays PLC 2024
Annual Report
on Form 20-F
363
Parent company accounts (continued)
Statement of changes in equity
Called up share
capital and share
premium
Other equity
instruments
Other reserves
Retained earnings
Total equity
£m
£m
£m
£m
£m
Balance as at 1 January 2024
4,288
13,198
997
39,545
58,028
Profit after tax and other comprehensive income
—
990
—
3,092
4,082
Issue of shares under employee share schemes
103
—
—
22
125
Issue and exchange of other equity instruments
—
(1,165)
—
(93)
(1,258)
Vesting of shares under employee share schemes
—
—
—
(24)
(24)
Dividends paid
—
—
—
(1,221)
(1,221)
Other equity instruments coupons paid
—
(990)
—
—
(990)
Repurchase of shares
(205)
—
205
(1,760)
(1,760)
Other reserve movements
—
—
—
4
4
Balance as at 31 December 2024
4,186
12,033
1,202
39,565
56,986
Balance as at 1 January 2023
4,373
13,250
788
39,256
57,667
Profit after tax and other comprehensive income
—
985
—
2,781
3,766
Issue of shares under employee share schemes
124
—
—
22
146
Issue and exchange of other equity instruments
—
(52)
—
(25)
(77)
Vesting of shares under employee share schemes
—
—
—
(22)
(22)
Dividends paid
—
—
—
(1,210)
(1,210)
Other equity instruments coupons paid
—
(985)
—
—
(985)
Repurchase of shares
(209)
—
209
(1,257)
(1,257)
Balance as at 31 December 2023
4,288
13,198
997
39,545
58,028
Statement of changes in equity
Called up share
capital and share
premium
Other equity
instruments
Other reserves
Retained earnings
Total equity
Notes
£m
£m
£m
£m
£m
Balance as at 1 January 2022
4,536
12,241
555
40,505
57,837
Profit after tax and other comprehensive income
—
905
—
1,258
2,163
Issue of shares under employee share schemes
70
—
—
34
104
Issue and exchange of other equity instruments
—
1,009
—
17
1,026
Vesting of shares under employee share schemes
—
—
—
(22)
(22)
Dividends paid
—
—
—
(1,028)
(1,028)
Other equity instruments coupons paid
—
(905)
—
—
(905)
Repurchase of shares
(233)
—
233
(1,508)
(1,508)
Balance as at 31 December 2022
4,373
13,250
788
39,256
57,667
Strategy
Shareholder
information
Climate and
sustainability report
Governance
Risk
review
Financial
review
Financial
statements
Barclays PLC 2024
Annual Report
on Form 20-F
364
Parent company accounts (continued)
Cash flow statement
2024
2023
2022
For the year ended 31 December
£m
£m
£m
Reconciliation of profit before tax to net cash flows from operating activities:
Profit before tax
3,991
3,685
1,723
Adjustment for non-cash items:
Other non-cash items
107
(627)
868
Changes in operating assets and liabilities
(85)
17
1,037
Net cash generated from operating activities
4,013
3,075
3,628
Net increase in loans and advances to subsidiaries of the parent1
(8,008)
(2,587)
(5,087)
Capital contribution to and investment in subsidiary
1,214
83
(1,769)
Net cash used in investing activities
(6,794)
(2,504)
(6,856)
Issue of shares and other equity instruments
1,660
3,251
3,180
Redemption of other equity instruments
(2,765)
(3,181)
(2,097)
Net increase in debt securities in issue2
8,005
3,585
4,813
Proceeds of borrowings and issuance of subordinated debt
(339)
(764)
1,000
Repurchase of shares
(1,760)
(1,257)
(1,508)
Dividends paid
(1,221)
(1,210)
(1,028)
Coupons paid on other equity instruments
(991)
(985)
(905)
Net cash generated/ (used in) from financing activities
2,589
(561)
3,455
Net (decrease)/increase in cash equivalents
(192)
10
227
Cash equivalents at beginning of year
486
476
249
Cash equivalents at end of year3
294
486
476
Notes:
1Includes financial assets at fair value through the income statement.
2Includes financial liabilities designated at fair value.
3Cash equivalents comprise loans and advances to banks with original maturity of three months or less, contained within loans and advances to subsidiaries.
The Parent company’s principal activity is to hold the investment in its wholly-owned subsidiaries, Barclays Bank PLC, Barclays Bank UK
PLC, Barclays Execution Services Limited and Barclays Principal Investments Limited. Dividends received are treated as operating
income.
Interest received was £2,828m (2023: £2,360m; 2022: £1,519m) and interest paid was £2,888m (2023: £2,355m; 2022: £1,694m). The
2023 and 2022 comparative figures have been amended to make the cash flow statement more relevant following a review of the
disclosure and the basis of preparation applied. Following that review, the basis of preparation of interest received and paid has been
amended to reflect interest received and interest paid on activity where interest is recognised on an effective interest rate basis to
make the cash flow statement information more relevant with reference to net interest income recognised in the income statement
and enhancing comparability with industry peers.
Dividends received were £3,087m (2023: £2,818; 2022: £2,797m).
Strategy
Shareholder
information
Climate and
sustainability report
Governance
Risk
review
Financial
review
Financial
statements
Barclays PLC 2024
Annual Report
on Form 20-F
365
Notes to the financial statements
For the year ended 31 December 2024
This section describes the Group’s material accounting policies and critical accounting estimates and judgements that relate to the
financial statements and notes as a whole. If an accounting policy or a critical accounting estimate or judgement relates to a particular
note, disclosure is contained within the relevant note.
1 Material accounting policies
1. Reporting entity
Barclays PLC is a public company limited by shares registered in England under company number 48839, having its registered office at
1 Churchill Place, London, E14 5HP.
These financial statements are prepared for Barclays PLC and its subsidiaries (the Group) under Section 399 of the Companies Act
2006. The Group is a major global financial services provider engaged in retail banking, credit cards, wholesale banking, investment
banking, wealth management and investment management services. In addition, separate financial statements have been presented
for the holding company.
2.Compliance with International Financial Reporting Standards
The consolidated financial statements of the Group, and the separate financial statements of Barclays PLC, have been prepared in
accordance with UK-adopted international accounting standards.
The consolidated financial statements of the Group, and the separate financial statements of Barclays PLC, have also been prepared in
accordance with International Financial Reporting Standards (IFRS) as issued by the International Accounting Standards Board (IASB),
including interpretations issued by the IFRS Interpretations Committee, as there are no applicable differences from IFRS as issued by
the IASB for the periods presented.
The principal accounting policies applied in the preparation of the consolidated and separate financial statements are set out below, and
in the relevant notes to the financial statements. These policies have been consistently applied with the exception of Classification of
Liabilities as Current or Non-current (Amendments to IAS 1), which was effective from 1 January 2024 and applies retrospectively.
3. Basis of preparation
The consolidated and separate financial statements have been prepared under the historical cost convention modified to include the
fair valuation of investment property, and particular financial instruments, to the extent required or permitted under IFRS as set out in
the relevant accounting policies.These financial statements are stated in millions of Pounds Sterling (£m), the functional currency of
Barclays PLC.
The financial statements have been prepared for Barclays PLC and its subsidiaries (the Group) under Section 399 of the Companies Act
2006 as applicable to companies using IFRS. The financial statements are prepared on a going concern basis, as the Board is satisfied
that the Group and the parent company have the resources to continue in business for a period of at least 12 months from approval of
the financial statements.
In making this assessment, the Board has considered a wide range of information relating to present and future conditions and includes
a review of a working capital report (WCR). The WCR is used by the Board to assess the future performance of the Group and that it has
the resources in place that are required to meet its ongoing regulatory requirements. The assessment is based upon business plans
which contain future projections of profitability taken from the Group’s medium-term plan as well as projections of regulatory capital
requirements and business funding needs. The WCR also includes an assessment of the impact of internally generated stress testing
scenarios on the liquidity and capital requirement forecasts. The stress tests used were based upon an assessment of reasonably
possible downside economic scenarios that the Group could experience.
The WCR showed that the Group had sufficient capital and liquidity in place to support its future business requirements and remained
above its regulatory minimum requirements in the stress scenarios. Accordingly, the Directors concluded that there was a reasonable
expectation that the Group and parent company has adequate resources to continue as a going concern for a period of at least 12
months from the date of approval of the financial statements.
4. Accounting policies
The Group prepares financial statements in accordance with IFRS. The Group’s material accounting policies relating to specific financial
statement items, together with a description of the accounting estimates and judgements that were critical to preparing those items,
are set out under the relevant notes. Accounting policies that affect the financial statements as a whole are set out below.
(i) Consolidation
The consolidated financial statements combine the financial statements of Barclays PLC and all its subsidiaries. Subsidiaries are entities
over which Barclays PLC has control. The Group has control over another entity when the Group has all of the following:
1)power over the relevant activities of the investee, for example through voting or other rights
2)exposure to, or rights to, variable returns from its involvement with the investee, and
3)the ability to affect those returns through its power over the investee.
As the consolidated financial statements include partnerships where the Group member is a partner, advantage has been taken of the
exemption under Regulation 7 of the Partnership (Accounts) Regulations 2008 with regard to preparing and filing of individual
partnership financial statements.
Details of the principal subsidiaries are given in Note 33.
Strategy
Shareholder
information
Climate and
sustainability report
Governance
Risk
review
Financial
review
Financial
statements
Barclays PLC 2024
Annual Report
on Form 20-F
366
Notes to the financial statements (continued)
For the year ended 31 December 2024
(ii)Foreign currency translation
Transactions in foreign currencies are translated into Sterling at the rate ruling on the date of the transaction. Foreign currency
monetary balances are translated into Sterling at the period end exchange rates. Exchange gains and losses on such balances are taken
to the income statement.
The Group’s foreign operations (including subsidiaries, joint ventures, associates and branches) based mainly outside the UK may have
different functional currencies. The functional currency of an operation is the currency of the main economy to which it is exposed.
Prior to consolidation (or equity accounting) the assets and liabilities of non-Sterling operations are translated at the period end
exchange rate and items of income, expense and other comprehensive income are translated into Sterling at the rate on the date of
the transactions. Exchange differences arising on the translation of foreign operations are included in currency translation reserves
within equity. These are transferred to the income statement when the Group disposes of the entire interest in a foreign operation,
when partial disposal results in the loss of control of an interest in a subsidiary, when an investment previously accounted for using the
equity method is accounted for as a financial asset, or on the disposal of a foreign operation within a branch.
(iii)Financial assets and liabilities
Recognition
The Group recognises financial assets and liabilities when it becomes a party to the terms of the contract. Trade date or settlement
date accounting is applied depending on the classification of the financial asset.
Classification and measurement
Financial assets are classified on the basis of two criteria:
i)the business model within which financial assets are managed, and
ii)their contractual cash flow characteristics (whether the cash flows represent ‘solely payments of principal and interest’ (SPPI)).
The Group assesses the business model criteria at a portfolio level. Information that is considered in determining the applicable
business model includes (i) policies and objectives for the relevant portfolio, (ii) how the performance and risks of the portfolio are
managed, evaluated and reported to management, and (iii) the frequency, volume and timing of sales in prior periods, sales expectation
for future periods, and the reasons for such sales.
The contractual cash flow characteristics of financial assets are assessed with reference to whether the cash flows represent SPPI.
Terms that could change the contractual cash flows so that it would not meet the condition for SPPI are considered, including: (i)
contingent and leverage features, (ii) non-recourse arrangements, (iii) features that could modify the time value of money, and (iv)
Social, Environmental and Sustainability-linked features. Terms with de minimis impact do not preclude cash flows from representing
SPPI.
The accounting policy for each type of financial asset or liability is included within the relevant note for the item. The Group’s policies for
determining the fair values of the assets and liabilities are set out in Note 17.
Derecognition
The Group derecognises a financial asset, or a portion of a financial asset, from its balance sheet where (i) the contractual rights to cash
flows from the asset have expired, or (ii) the contractual rights to cash flows from the asset have been transferred (usually by sale) and
with them either (a) substantially all the risks and rewards of the asset have been transferred, or (b) where neither substantially all the
risks and reward have been transferred or retained, where control over the asset has been lost.
Financial liabilities are derecognised when the liability has been settled, has expired or has been extinguished. An exchange of an existing
financial liability for a new liability with the same lender on substantially different terms – generally a difference of 10% or more in the
present value of the cash flows or a substantive qualitative amendment – is accounted for as an extinguishment of the original financial
liability and the recognition of a new financial liability.
It may not be obvious whether substantially all of the risks and rewards of a transferred asset, or portion of an asset, have been
transferred. It is often necessary to perform a quantitative analysis that compares the Group's exposure to variability in asset cash flows
before the transfer with its retained exposure after the transfer. A cash flow analysis of this nature may require judgement. In particular,
it is necessary to estimate the asset’s expected future cash flows as well as potential variability around this expectation. The method of
estimating expected future cash flows depends on the nature of the asset, with market and market-implied data used to the greatest
extent possible. The potential variability around this expectation is typically determined by stressing underlying parameters to create
reasonable alternative upside and downside scenarios. Probabilities are then assigned to each scenario. Stressed parameters may
include default rates, loss severity, or prepayment rates.
Accounting for reverse repurchase and repurchase agreements including other similar lending and borrowing
Reverse repurchase agreements (and stock borrowing or similar transactions) are a form of secured lending whereby the Group
provides a loan or cash collateral in exchange for the transfer of collateral, generally in the form of marketable securities subject to an
agreement to transfer the securities back at a fixed price in the future. Repurchase agreements are where the Group obtains such loans
or cash collateral, in exchange for the transfer of collateral.
The Group purchases (a reverse repurchase agreement) or borrows securities subject to a commitment to resell or return them. The
securities are not included in the balance sheet as the Group does not acquire the risks and rewards of ownership. Consideration paid
(or cash collateral provided) is accounted for as a loan asset at amortised cost, unless it is designated or mandatorily at fair value
through profit and loss.
Strategy
Shareholder
information
Climate and
sustainability report
Governance
Risk
review
Financial
review
Financial
statements
Barclays PLC 2024
Annual Report
on Form 20-F
367
Notes to the financial statements (continued)
For the year ended 31 December 2024
The Group may also sell (a repurchase agreement) or lend securities subject to a commitment to repurchase or redeem them. The
securities are retained on the balance sheet as the Group retains substantially all the risks and rewards of ownership. Consideration
received (or cash collateral provided) is accounted for as a financial liability at amortised cost, unless it is designated at fair value through
profit and loss.
(iv)Issued debt and equity instruments
Issued financial instruments or their components are classified as liabilities if the contractual arrangement results in the Group having an
obligation to either deliver cash or another financial asset, or a variable number of equity shares, to the holder of the instrument. If this is
not the case, the instrument is generally an equity instrument and the proceeds included in equity, net of transaction costs. Dividends
and other returns to equity holders are recognised when paid or declared by the members at the Annual General Meeting and treated
as a deduction from equity.
Where issued financial instruments contain both liability and equity components, these are accounted for separately. The fair value of
the debt is estimated first and the balance of the proceeds is included within equity.
(v) Cash flow statement
Cash comprises cash on hand and balances at central banks. Cash equivalents comprise loans and advances to banks, cash collateral
balances with central banks related to payment schemes and treasury and other eligible bills, all with original maturities of three months
or less.
Investments in debt securities at amortised cost are deemed to be investing activities for the purposes of the cash flow statement,
except those instruments considered to be cash equivalents.
Debt securities issued and redeemed are considered to be operating activities, except qualifying eligible liabilities that satisfy regulatory
requirements for MREL instruments (or have previously satisfied these requirements since 2019 when they came into effect), which are
considered to be financing activities.
5. New and amended standards and interpretations
The accounting policies adopted have been consistently applied, with the exception of the following:
Classification of Liabilities as Current or Non-current (Amendments to IAS 1)
In January 2020 the IASB issued amendments to IAS 1 to clarify the presentation of liabilities in the balance sheet, with an effective date
that was subsequently deferred to 1 January 2024.
The amendments clarify that a liability should be classified as non-current only if the entity has the right to defer settlement of the
liability for at least 12 months after the reporting period, and that (i) the right to defer settlement must exist at the end of the reporting
period and (ii) management’s intentions or expectations about whether it will exercise its right to defer settlement does not affect the
classification. Further clarifications include how lending conditions affect classification and classification of liabilities the entity will or
may settle by issuing its own equity instruments.
In October 2022, the IASB also issued further amendments to IAS 1 to improve the information an entity provides when its right to
defer settlement of a liability for at least 12 months is subject to compliance with covenants, and to respond to stakeholders’ concerns
about the classification of such a liability as current or non-current.
The impact to the Group from these amendments is not considered to be material.
Future accounting developments
The following accounting standards have been issued by the IASB but are not yet effective:
Amendment to IFRS 9 and IFRS 7 - Classification and Measurement of Financial Instruments
In May 2024, the IASB issued targeted amendments to IFRS 9 to address feedback received from stakeholders following a post-
implementation review. The amendments include:
•additional guidance to clarify when certain financial assets may be compliant with SPPI requirements, including instruments with
contingent features (e.g. ESG-linked financing), as well as contractually-linked instruments and non-recourse financing.
•clarifying the derecognition requirements for financial assets and financial liabilities, including establishing a new accounting policy
choice for derecognition of a financial liability when a payment is initiated by the reporting entity using an electronic payment
system provided specified criteria is met.
The amendments are effective from 1 January 2026, but are not yet endorsed for use in the UK. The Group is currently assessing the
impact of these amendments.
IFRS 18 Presentation and Disclosure in Financial Statements
In August 2024, the IASB issued a new IFRS Accounting Standard to replace IAS 1 Presentation of Financial Statements. The new
standard creates detailed requirements for the classification and aggregation of income and expenses in the income statement, and
disclosure requirements for management-defined performance measures.
The new standard is effective from 1 January 2027, but has not yet been endorsed for use in the UK. The Group is currently assessing
the impact of these amendments.
Amendments to IAS 21 - Lack of Exchangeability
In August 2023, the IASB issued amendments to IAS 21 to define when a currency is exchangeable into another currency and, when it is
not, to determine the exchange rate to use.
The amendments are effective from 1 January 2025, however the impact to the Group is not expected to be material.
Strategy
Shareholder
information
Climate and
sustainability report
Governance
Risk
review
Financial
review
Financial
statements
Barclays PLC 2024
Annual Report
on Form 20-F
368
Notes to the financial statements (continued)
For the year ended 31 December 2024
6. Critical accounting estimates and judgements
The preparation of financial statements in accordance with IFRS requires the use of estimates. It also requires management to exercise
judgement in applying the accounting policies. The key areas involving a higher degree of judgement or complexity or areas where
assumptions are significant to the consolidated and individual financial statements are highlighted under the relevant note.
▪Treasury and Capital risk – liquidity on pages 215 and 285 to 294
▪Treasury and Capital risk – capital on pages 215 to 216and 295 to 301
These disclosures are covered by the audit opinion (included on pages 353 to 355) where referenced as audited.
Strategy
Shareholder
information
Climate and
sustainability report
Governance
Risk
review
Financial
review
Financial
statements
Barclays PLC 2024
Annual Report
on Form 20-F
369
Notes to the financial statements (continued)
For the year ended 31 December 2024
Financial performance and returns
The notes included in this section focus on the results and performance of the Group. Information on the income generated,
expenditure incurred, segmental performance, tax, earnings per share and dividends are included here. For further detail on
performance, see income statement commentary within the Financial review (unaudited).
2 Segmental reporting
Presentation of segmental reporting
Operating segments are reported in a manner consistent with the internal reporting provided to the Executive Committee, which is
responsible for allocating resources and assessing performance of the operating segments, and has been identified as the chief
operating decision maker. All transactions between business segments are conducted on an arm’s-length basis. Income and expenses
directly associated with each segment are included in determining business segment performance.
Barclays is a British universal bank diversified by business, geography and income type, serving consumer and wholesale customers and
clients globally. In addition to its rooting in the UK, Barclays also has a strong presence in the US.
As part of the 20 February 2024 Investor Update, Barclays has announced changes to its operating divisions which impacts segmental
reporting going forward. 2023 and 2022 financials have been restated to reflect the resegmentation.
The Group presents its financial disclosures through the following segments (plus Head Office):
▪Barclays UK: this segment broadly represents businesses that sit within the UK ring-fenced bank entity, Barclays Bank UK PLC, and
comprises Personal Banking, Business Banking and Barclaycard Consumer UK.
▪Barclays UK Corporate Bank: this division brings together lending, trade and working capital, liquidity, payments and FX solutions for
UK corporate clients with an annual turnover from £6.5 million and higher, excluding those clients that form part of the FTSE 350,
which are included within the IB.
▪Barclays Private Bank and Wealth Management: this division serves UK and international private banking clients providing a range of
investment, banking and lending products alongside expert advice. It also serves UK wealth management and UK digital investing
clients offering a range of financial services.
▪Barclays Investment Bank: this segment incorporates the Global Markets, Investment Banking and International Corporate Banking
businesses, serving FTSE 350, multinationals and financial institution clients that are regular users of Investment Bank services.
▪Barclays US Consumer Bank: is a co-branded credit card issuer and financial services partner in the United States for travel,
entertainment, retail and affinity institutions. It offers co-branded, small business and private label credit cards, instalment loans,
online savings accounts and certificates of deposits.
•Head Office: comprises central support, central treasury operations, Barclays Execution Services assets and legacy businesses. In
addition to these elements, as part of the resegmentation announced at the FY23 Investor Update on 20 February 2024, Head Office
now also includes the German consumer finance business, which is currently accounted for as held for sale, and the merchant
acquiring component of the Payments business.
Analysis of results by business
Barclays UK
Barclays UK
Corporate
Bank
Barclays
Private Bank &
Wealth
Management
Barclays
Investment
Bank
Barclays US
Consumer
Bank
Head Office
Group results
£m
£m
£m
£m
£m
£m
£m
For the year ended 31 December 2024
Net interest income
6,627
1,206
767
1,031
2,659
646
12,936
Non-interest income
1,647
574
542
10,774
667
(352)
13,852
Total income
8,274
1,780
1,309
11,805
3,326
294
26,788
Operating costs
(4,235)
(935)
(911)
(7,666)
(1,612)
(836)
(16,195)
UK regulatory levies
(78)
(37)
(9)
(187)
—
(9)
(320)
Litigation and conduct
(16)
(1)
—
(55)
(14)
(134)
(220)
Total operating expenses
(4,329)
(973)
(920)
(7,908)
(1,626)
(979)
(16,735)
Other net income1
—
—
—
—
—
37
37
Profit/(loss) before impairment
3,945
807
389
3,897
1,700
(648)
10,090
Credit impairment charges
(365)
(76)
(6)
(123)
(1,293)
(119)
(1,982)
Profit/(loss) before tax
3,580
731
383
3,774
407
(767)
8,108
Total assets (£bn)
299.8
61.2
34.1
1,053.9
35.4
33.8
1,518.2
Total liabilities (£bn)
284.1
94.4
75.0
952.1
24.5
15.6
1,445.7
Number of employees (full time equivalent)
18,000
1,900
1,900
7,100
2,300
61,800
93,000
Average number of employees (full time equivalent)
91,300
Average number of employees (headcount)
92,900
Note:
1Other net income represents the share of post-tax results of associates and joint ventures, profit on disposal of subsidiaries, associates and joint ventures, and gains on acquisitions.
Strategy
Shareholder
information
Climate and
sustainability report
Governance
Risk
review
Financial
review
Financial
statements
Barclays PLC 2024
Annual Report
on Form 20-F
370
Notes to the financial statements (continued)
For the year ended 31 December 2024
Barclays UK
Barclays UK
Corporate
Bank
Barclays
Private Bank &
Wealth
Management
Barclays
Investment
Bank
Barclays US
Consumer
Bank
Head Office
Group results
£m
£m
£m
£m
£m
£m
£m
For the year ended 31 December 2023
Net interest income
6,431
1,160
768
1,393
2,604
353
12,709
Non-interest income
1,156
610
440
9,642
664
157
12,669
Total income
7,587
1,770
1,208
11,035
3,268
510
25,378
Operating costs
(4,393)
(905)
(795)
(7,619)
(1,650)
(1,352)
(16,714)
UK bank levy
(30)
(8)
(4)
(123)
—
(14)
(180)
Litigation and conduct
8
1
2
5
(6)
(48)
(37)
Total operating expenses
(4,415)
(912)
(797)
(7,737)
(1,656)
(1,414)
(16,931)
Other net expenses1
—
(3)
—
—
—
(6)
(9)
Profit/(loss) before impairment
3,172
855
411
3,298
1,612
(910)
8,438
Credit impairment (charges)/releases
(304)
27
(4)
(102)
(1,438)
(60)
(1,881)
Profit/(loss) before tax
2,868
882
407
3,196
174
(970)
6,557
Total assets (£bn)
293.1
61.5
32.0
1,019.2
33.6
38.1
1,477.5
Total liabilities (£bn)
264.2
85.9
60.9
904.5
21.1
69.0
1,405.6
Number of employees (full time equivalent)
6,800
1,800
2,100
7,100
600
74,000
92,400
Average number of employees (full time equivalent)
92,900
Average number of employees (headcount)
94,800
Note:
1Other net expenses represents the share of post-tax results of associates and joint ventures, profit on disposal of subsidiaries, associates and joint ventures, and gains on acquisitions.
Barclays UK
Barclays UK
Corporate
Bank
Barclays
Private Bank &
Wealth
Management
Barclays
Investment
Bank
Barclays US
Consumer
Bank
Head
Office
Group results
£m
£m
£m
£m
£m
£m
£m
For the year ended 31 December 2022
Net interest income
5,893
1,132
715
836
1,972
24
10,572
Non-interest income
1,366
525
299
11,087
667
440
14,384
Total income
7,259
1,657
1,014
11,923
2,639
464
24,956
Operating costs
(4,260)
(812)
(545)
(6,955)
(1,525)
(860)
(14,957)
UK bank levy
(26)
(7)
(4)
(119)
—
(20)
(176)
Litigation and conduct
(41)
—
—
(1,189)
(3)
(364)
(1,597)
Total operating expenses
(4,327)
(819)
(549)
(8,263)
(1,528)
(1,244)
(16,730)
Other net income1
—
1
—
1
—
4
6
Profit/(loss) before impairment
2,932
839
465
3,661
1,111
(776)
8,232
Credit impairment charges
(286)
—
(5)
(181)
(624)
(124)
(1,220)
Profit/(loss) before tax
2,646
839
460
3,480
487
(900)
7,012
Total assets (£bn)
313.2
88.2
42.7
1,014.0
30.4
25.2
1,513.7
Total liabilities (£bn)
287.3
86.0
62.4
920.1
19.5
69.1
1,444.4
Number of employees (full time equivalent)
6,200
1,700
1,100
6,700
600
71,100
87,400
Average number of employees (full time equivalent)
83,900
Average number of employees (headcount)
86,200
Note:
1Other net income represents the share of post-tax results of associates and joint ventures, profit (or loss) on disposal of subsidiaries, associates and joint ventures, and gains on
acquisitions.
Strategy
Shareholder
information
Climate and
sustainability report
Governance
Risk
review
Financial
review
Financial
statements
Barclays PLC 2024
Annual Report
on Form 20-F
371
Notes to the financial statements (continued)
For the year ended 31 December 2024
Income by geographic region1
2024
2023
2022
For the year ended 31 December
£m
£m
£m
United Kingdom
13,927
13,295
14,908
Europe
2,734
2,517
2,321
Americas
8,772
8,109
6,353
Africa and Middle East
82
87
63
Asia
1,273
1,370
1,311
Total
26,788
25,378
24,956
.
Income from individual countries which represent more than 5% of total income1
2024
2023
2022
For the year ended 31 December
£m
£m
£m
United Kingdom
13,927
13,295
14,908
United States
8,614
7,911
6,176
Note:
1The geographical analysis is based on the location of the office where the transactions are recorded.
3 Net interest income
Accounting for interest income and expenses
Interest income on loans and advances at amortised cost, financial assets at fair value through other comprehensive income, interest
expense on financial liabilities held at amortised cost are calculated using the effective interest method which allocates interest, and
direct and incremental fees and costs, over the expected lives of the assets and liabilities.
The effective interest method requires the Group to estimate future cash flows, in some cases based on its experience of customers’
behaviour, considering all contractual terms of the financial instrument, as well as the expected lives of the assets and liabilities.
The Group incurs certain costs to originate credit card balances with the most significant being co-brand partner fees. To the extent
these costs are attributed to customers that continuously carry an outstanding balance (revolvers) and incremental to the origination
of credit card balances, they are capitalised and subsequently included within the calculation of the effective interest rate. They are
amortised to interest income over the period of expected repayment of the originated balance. Costs attributed to customers that
settle their outstanding balances each period (transactors) are deferred on the balance sheet as a cost of obtaining a contract and
amortised to fee and commission expense over the life of the customer relationship (refer to Note 4). There are no other individual
estimates involved in the calculation of effective interest rates that are material to the results or financial position.
2024
2023
2022
£m
£m
£m
Cash and balances at central banks
11,076
10,262
2,916
Debt securities at amortised cost
2,445
2,337
1,251
Loans and advances at amortised cost
17,836
14,742
12,125
Fair value through other comprehensive income
3,821
4,907
1,963
Cash collateral
2,408
2,375
460
Other1
740
452
381
Interest and similar income
38,326
35,075
19,096
Deposits at amortised cost
(14,092)
(11,252)
(3,573)
Debt securities in issue
(6,708)
(6,344)
(3,240)
Subordinated liabilities
(945)
(866)
(530)
Cash collateral
(2,276)
(2,254)
(396)
Other2
(1,369)
(1,650)
(785)
Interest and similar expense
(25,390)
(22,366)
(8,524)
Net interest income
12,936
12,709
10,572
Notes:
1 Includes interest income from reverse repurchase agreements and other similar secured lending at amortised cost and negative interest on liabilities.
2 Includes interest expense from repurchase agreement and other similar secured lending at amortised cost and negative expense on assets.
Interest and similar income presented above represents interest revenue calculated using the effective interest method. Costs to
originate credit card balances of £1,016m (2023: £935m; 2022: £786m) have been amortised to interest and similar income during the
year.
Strategy
Shareholder
information
Climate and
sustainability report
Governance
Risk
review
Financial
review
Financial
statements
Barclays PLC 2024
Annual Report
on Form 20-F
372
Notes to the financial statements (continued)
For the year ended 31 December 2024
4 Net fee and commission income
Accounting for net fee and commission income
The Group recognises fee and commission income charged for services provided by the Group as and when performance obligations
are satisfied, for example, on completion of the underlying transaction. Incremental costs are reported within fee and commission
expense if they are directly attributable to generating identifiable fee and commission income. Where the contractual arrangements
also result in the Group recognising financial instruments in scope of IFRS 9, such financial instruments are initially recognised at fair
value in accordance with IFRS 9 before applying the provisions of IFRS 15.
Fee and commission income is disaggregated below by fee types that reflect the nature of the services offered across the Group and
operating segments, in accordance with IFRS 15. The below table includes a total for fees in scope of IFRS 15. Refer to Note 2 for more
detailed information about operating segments.
2024
Barclays UK
Barclays UK
Corporate
Bank
Barclays
Private Bank
and Wealth
Management
Barclays
Investment
Bank
Barclays US
Consumer
Bank
Head Office
Barclays
Group
£m
£m
£m
£m
£m
£m
£m
Fee type
Transactional
1,150
448
33
336
2,661
342
4,970
Advisory
—
—
319
739
—
—
1,058
Brokerage and execution
215
—
129
1,580
—
—
1,924
Underwriting and syndication
36
92
—
2,596
—
—
2,724
Other
15
1
—
—
—
18
34
Total revenue from contracts with customers
1,416
541
481
5,251
2,661
360
10,710
Other non-contract fee income
—
25
—
112
—
—
137
Fee and commission income
1,416
566
481
5,363
2,661
360
10,847
Fee and commission expense
(408)
(90)
(38)
(1,121)
(1,855)
(88)
(3,600)
Net fee and commission income
1,008
476
443
4,242
806
272
7,247
2023
Barclays UK
Barclays UK
Corporate
Bank
Barclays
Private Bank
and Wealth
Management
Barclays
Investment
Bank
Barclays US
Consumer
Bank
Head Office
Barclays
Group
£m
£m
£m
£m
£m
£m
£m
Fee type
Transactional
1,124
429
32
327
2,603
301
4,816
Advisory
52
—
251
652
—
—
955
Brokerage and execution
234
—
89
1,674
—
—
1,997
Underwriting and syndication
33
82
—
1,998
—
—
2,113
Other
36
1
—
—
—
64
101
Total revenue from contracts with customers
1,479
512
372
4,651
2,603
365
9,982
Other non-contract fee income
—
28
1
110
—
—
139
Fee and commission income
1,479
540
373
4,761
2,603
365
10,121
Fee and commission expense
(368)
(96)
(33)
(1,247)
(1,765)
(83)
(3,592)
Net fee and commission income
1,111
444
340
3,514
838
282
6,529
2022
Barclays UK
Barclays UK
Corporate
Bank
Barclays
Private Bank
and Wealth
Management
Barclays
Investment
Bank
Barclays US
Consumer
Bank
Head Office
Barclays
Group
£m
£m
£m
£m
£m
£m
£m
Fee type
Transactional
1,084
378
31
296
2,294
257
4,340
Advisory
161
—
144
820
—
—
1,125
Brokerage and execution
256
—
56
1,465
—
—
1,777
Underwriting and syndication
—
75
1
1,961
—
—
2,037
Other
59
(1)
2
9
4
142
215
Total revenue from contracts with customers
1,560
452
234
4,551
2,298
399
9,494
Other non-contract fee income
—
28
5
110
—
—
143
Fee and commission income
1,560
480
239
4,661
2,298
399
9,637
Fee and commission expense
(319)
(65)
(13)
(944)
(1,618)
(79)
(3,038)
Net fee and commission income
1,241
415
226
3,717
680
320
6,599
Strategy
Shareholder
information
Climate and
sustainability report
Governance
Risk
review
Financial
review
Financial
statements
Barclays PLC 2024
Annual Report
on Form 20-F
373
Notes to the financial statements (continued)
For the year ended 31 December 2024
Fee types
Transactional
Transactional fees are service charges on deposit accounts, cash management services fees and transactional processing fees. These
include interchange and merchant fee income generated from credit and bank card usage. Transaction and processing fees are
recognised at the point in time the transaction occurs or service is performed. Interchange and merchant fees are recognised upon
settlement of the card transaction payment.
The Group incurs certain card-related costs including those related to cardholder reward programmes and payments to co-brand
partners. Cardholder reward programme costs related to customers that settle their outstanding balance each period (transactors) are
expensed when incurred and presented in fee and commission expense, while costs related to customers that continuously carry an
outstanding balance (revolvers) are included in the effective interest rate of the receivable (refer to Note 3). Payments to partners for
new cardholder account originations related to transactor accounts are deferred as costs to obtain a contract under IFRS 15, while
costs related to revolver accounts are included in the effective interest rate of the receivable (refer to Note 3). Those costs deferred
under IFRS 15 are capitalised and amortised over the estimated life of the customer relationship. Payments to co-brand partners based
on revenue sharing to the extent the revenue share relates to 'revolvers' are included in the effective interest rate of the receivable and
to the extent revenue share relates to 'transactors' it must be presented in fee and commission expense. Payments based on
profitability are presented in fee and commission expense.
Advisory
Advisory fees are generated from wealth management services and investment banking advisory services related to mergers,
acquisitions and financial restructurings. Wealth management advisory fees are earned over the period the services are provided and
are generally recognised quarterly when the market value of client assets is determined. Investment banking advisory fees are
recognised at the point in time when the services related to the transaction have been completed under the terms of the engagement.
Investment banking advisory costs are recognised as incurred in fee and commission expense if direct and incremental to the advisory
services or are otherwise recognised in operating expenses.
Brokerage and execution
Brokerage and execution fees are earned for executing client transactions with various exchanges and over-the-counter markets and
assisting clients in clearing transactions and facilitating foreign exchange transactions for spot/forward contracts. Brokerage and
execution fees are recognised at the point in time the associated service has been completed which is generally the trade date of the
transaction.
Underwriting and syndication
Underwriting and syndication fees are earned for the distribution of client equity or debt securities and the arrangement and
administration of a loan syndication. This includes commitment fees to provide loan financing. Underwriting fees are generally
recognised on trade date if there is no remaining contingency, such as the transaction being conditional on the closing of an acquisition
or another transaction. Underwriting costs are deferred and recognised in fee and commission expense when the associated
underwriting fees are recorded. Syndication fees are earned for arranging and administering a loan syndication; however, the associated
fee may be subject to variability until the loan has been syndicated to other syndicate members or until other contingencies have been
resolved and therefore the fee revenue is deferred until the uncertainty is resolved.
Included in the underwriting and syndication fees are loan commitment fees, when the drawdown is not probable. Such commitment
fees are recognised over time through to the contractual maturity of the commitment.
Contract assets and contract liabilities
The Group had no material contract assets or contract liabilities as at 31 December 2024 (2023: £nil; 2022: £nil).
Impairment of fee receivables and contract assets
During 2024, there have been no material impairments recognised in relation to fees receivable and contract assets (2023: £nil; 2022:
£nil). Fees in relation to transactional business can be added to outstanding customer balances. These amounts may be subsequently
impaired as part of the overall loans and advances balance.
Remaining performance obligations
The Group applies the practical expedient of IFRS 15 and does not disclose information about remaining performance obligations that
have original expected durations of one year or less or because the Group has a right to consideration that corresponds directly with
the value of the service provided to the client or customer.
Costs incurred in obtaining or fulfilling a contract
The Group expects that incremental costs of obtaining a contract such as success fee and commission fees paid are recoverable and
therefore capitalises such contract costs. Capitalised contract costs net of amortisation as at 31 December 2024 are £122m(2023:
£217m; 2022: £198m).
Capitalised contract costs are amortised over the customer relationship period depending on the transfer of services to which the
asset pertains. In 2024, the amount of amortisation was £62m (2023: £55m; 2022: £47m) and there was no impairment loss recognised
in connection with the capitalised contract costs (2023: £nil; 2022: £nil).
Strategy
Shareholder
information
Climate and
sustainability report
Governance
Risk
review
Financial
review
Financial
statements
Barclays PLC 2024
Annual Report
on Form 20-F
374
Notes to the financial statements (continued)
For the year ended 31 December 2024
5 Net trading income
Accounting for net trading income
Trading positions are held at fair value, and the resulting gains and losses are included in net trading income, together with interest and
dividends arising from long and short positions and funding costs relating to trading activities. Incremental costs are reported within net
trading income if they are directly attributable to generating identifiable trading income.
Income arises from both the sale and purchase of trading positions, margins which are achieved through market-making and customer
business and from changes in fair value caused by movements in interest and exchange rates, equity prices and other market variables.
Gains or losses on non-trading financial instruments designated or mandatorily at fair value with changes in fair value recognised in the
income statement are included in net trading income.
2024
2023
2022
£m
£m
£m
Net gains on financial instruments held for trading
4,038
4,257
6,021
Net gains on financial instruments designated at fair value
529
380
508
Net gains on financial instruments mandatorily at fair value
1,201
1,308
1,520
Net trading income
5,768
5,945
8,049
6 Net investment income/(expense)
Accounting for net investment income/(expense)
Dividends are recognised when the right to receive the dividend has been established. Incremental costs are reported within net
investment income if they are directly attributable to generating identifiable investment income. Other accounting policies relating to
net investment income are set out in Note 13 and Note 15.
2024
2023
2022
£m
£m
£m
Net gains/(losses) from financial instruments mandatorily at fair value
326
171
(51)
Net gains/(losses) from disposal of debt instruments at fair value through other comprehensive
income
164
26
(111)
Net losses from disposal of financial assets and liabilities measured at amortised cost1
(209)
(17)
(18)
Dividend income
3
0
31
Net losses on other investments2
(68)
(119)
(285)
Net investment income/(expense)
216
61
(434)
Notes:
1 Included within the 2024 balance are losses of £220m on sale of the performing Italian retail mortgage portfolio.
2 Included within the 2022 balance are losses of £74m on sale arising from disposal of Barclays’ equity stake in Absa Group Limited (Absa) in April 2022 and September 2022.
Strategy
Shareholder
information
Climate and
sustainability report
Governance
Risk
review
Financial
review
Financial
statements
Barclays PLC 2024
Annual Report
on Form 20-F
375
Notes to the financial statements (continued)
For the year ended 31 December 2024
7 Operating expenses
2024
2023
2022
£m
£m
£m
Infrastructure costs
Property and equipment1
1,815
1,948
1,649
Depreciation and amortisation
1,700
1,784
1,723
Impairment of property, equipment and intangible assets1
34
363
63
Total infrastructure costs
3,549
4,095
3,435
Administration and general expenses
Consultancy, legal and professional fees
829
782
669
Marketing and advertising
649
585
500
Other administration and general expenses
1,292
1,235
1,101
Total administration and general expenses
2,770
2,602
2,270
Staff costs1
9,876
10,017
9,252
UK regulatory levies2
320
180
176
Litigation and conduct3
220
37
1,597
Operating expenses
16,735
16,931
16,730
Notes:
1Infrastructure costs and Staff costs included £927m relating to structural cost actions taken in Q4 2023.
2Comprises the impact of the Bank of England (BoE) levy scheme and the UK bank levy.
3Included within the 2022 balance are costs of £966m related to the Over-issuance of Securities.
For further details on staff costs including accounting policies, refer to Note 30.
8 Credit impairment charges/(releases)
Accounting for the impairment of financial assets
Impairment
The Group is required to recognise expected credit losses (ECLs) based on unbiased forward-looking information for all financial assets
at amortised cost, lease receivables, debt financial assets at fair value through other comprehensive income, loan commitments and
financial guarantee contracts.
At the reporting date, an allowance (or provision for loan commitments and financial guarantees) is required for the 12-month (Stage 1)
ECLs. If the credit risk has significantly increased since initial recognition (Stage 2), or if the financial instrument is credit impaired
(Stage 3), an allowance (or provision) should be recognised for the lifetime ECLs.
The measurement of ECL is calculated using three main components: (i) probability of default (PD) (ii) loss given default (LGD) and (iii)
the exposure at default (EAD).
The 12-month and lifetime ECLs are calculated by multiplying the respective PD, LGD and the EAD. The 12-month and lifetime PDs
represent the PD occurring over the next 12 months and the remaining maturity of the instrument respectively. The EAD represents
the expected balance at default, taking into account the repayment of principal and interest from the balance sheet date to the default
event together with any expected drawdowns of committed facilities. The LGD represents expected losses on the EAD given the event
of default, taking into account, among other attributes, the mitigating effect of collateral value at the time it is expected to be realised
and the time value of money.
Expected credit loss measurement is based on the ability of borrowers to make payments as they fall due. The Group also considers
sector-specific risks and whether additional adjustments are required in the measurement of ECL. Credit risk may be impacted by
climate considerations for certain sectors, such as oil and gas.
Determining a significant increase in credit risk since initial recognition:
The Group assesses when a significant increase in credit risk has occurred based on quantitative and qualitative assessments. The
credit risk of an exposure is considered to have significantly increased when:
i) Quantitative test
The annualised lifetime PD has increased by more than an agreed threshold relative to the equivalent at origination.
PD deterioration thresholds are defined as percentage increases, and are set at an origination score band and segment level to ensure
the test appropriately captures significant increases in credit risk at all risk levels. Generally, thresholds are inversely correlated to the
origination PD, i.e. as the origination PD increases, the threshold value reduces.
The assessment of the point at which a PD increase is deemed ‘significant’, is based upon analysis of the portfolio’s risk profile against a
common set of principles and performance metrics (consistent across both retail and wholesale businesses), incorporating expert
credit judgement where appropriate. Application of quantitative PD floors does not represent the use of the low credit risk exemption
as exposures can separately move into Stage 2 via the qualitative route described below.
Wholesale assets apply a 100% increase in PD and0.2% PD floor to determine a significant increase in credit risk.
Retail assets apply bespoke relative increase and absolute PD thresholds based on product type and origination PD. Thresholds are
subject to maximums defined by Group policy and typically apply minimum relative thresholds of50-100%and a maximum relative
threshold of400%.
Strategy
Shareholder
information
Climate and
sustainability report
Governance
Risk
review
Financial
review
Financial
statements
Barclays PLC 2024
Annual Report
on Form 20-F
376
Notes to the financial statements (continued)
For the year ended 31 December 2024
For existing/historical exposures where origination point scores or data are no longer available or do not represent a comparable
estimate of lifetime PD, a proxy origination score is defined, based upon:
•back-population of the approved lifetime PD score either to origination date or, where this is not feasible, as far back as possible
(subject to a data start point no later than 1 January 2015); or
•use of available historical account performance data and other customer information, to derive a comparable ‘proxy’ estimation of
origination PD.
ii) Qualitative test
This is relevant for accounts that meet the portfolio’s ‘high risk’ criteria and are subject to closer credit monitoring.
High risk customers may not be in arrears but either through an event or an observed behaviour exhibit credit distress. The definition
and assessment of high risk includes as wide a range of information as reasonably available, such as industry and Group-wide customer
level data, including but not limited to bureau scores and high consumer indebtedness index, wherever possible or relevant.
Whilst the high risk populations applied for IFRS 9 impairment purposes are aligned with risk management processes, they are also
regularly reviewed and validated to ensure that they capture any incremental segments where there is evidence of credit deterioration.
iii) Backstop criteria
This is relevant for accounts that are more than 30 calendar days past due. The 30 days past due criteria is a backstop rather than a
primary driver of moving exposures into Stage 2.
The criteria for determining a significant increase in credit risk for assets with bullet repayments follows the same principle as all other
assets, i.e. quantitative, qualitative and backstop tests are all applied.
Exposures will move back to Stage 1 once they no longer meet the criteria for a significant increase in credit risk. This means that, at a
minimum all payments must be up-to-date, the PD deterioration test is no longer met, the account is no longer classified as high risk,
and the customer has evidenced an ability to maintain future payments.
Exposures are only removed from Stage 3 and reassigned to Stage 2 once the original default trigger event no longer applies.
Exposures being removed from Stage 3 must no longer qualify as credit impaired, and:
a)the obligor will also have demonstrated consistently good payment behaviour over a 12-month period, by making all consecutive
contractual payments due and, for forborne exposures, the relevant EBA defined probationary period has also been successfully
completed or;
b)(for non-forborne exposures) the performance conditions are defined and approved within an appropriately sanctioned restructure
plan, including 12 months’ payment history have been met.
Management overlays and other exceptions to model outputs are applied only if consistent with the objective of identifying significant
increases in credit risk.
Forward-looking information
The measurement of ECL involves complexity and judgement, including estimation of PD, LGD, a range of unbiased future economic
scenarios, estimation of expected lives (where contractual life is not appropriate), and estimation of EAD and assessing significant
increases in credit risk.
Credit losses are the expected cash shortfalls from what is contractually due over the expected life of the financial instrument,
discounted at the original effective interest rate (EIR). ECLs are the unbiased probability-weighted credit losses determined by
evaluating a range of possible outcomes and considering future economic conditions.
Refer to the Measurement uncertainty and sensitivity analysis section on page 252 for further details.
Definition of default, credit impaired assets, write-offs, and interest income recognition
The definition of default for the purpose of determining ECLs, and for internal credit risk management purposes, has been aligned to
the Regulatory Capital CRR Article 178 definition of default, to maintain a consistent approach with IFRS 9 and associated regulatory
guidance. The Regulatory Capital CRR Article 178 definition of default considers indicators that the debtor is unlikely to pay, includes
exposures in forbearance and is no later than when the exposure is more than 90 days past due. When exposures are identified as credit
impaired at the time when they are purchased or originated, interest income is calculated on the carrying value net of the impairment
allowance.
An asset is considered credit impaired when one or more events occur that have a detrimental impact on the estimated future cash
flows of the financial asset. This comprises assets defined as defaulted and other individually assessed exposures where imminent
default or actual loss is identified.
Uncollectable loans are written off against the related allowance for loan impairment on completion of the Group’s internal processes
and when all reasonably expected recoverable amounts have been collected. Subsequent recoveries of amounts previously written off
are credited to the income statement. The timing and extent of write-offs may involve some element of subjective judgement.
Nevertheless, a write-off will often be prompted by a specific event, such as the inception of insolvency proceedings or other formal
recovery action, which makes it possible to establish that some or the entire advance is beyond realistic prospect of recovery.
Strategy
Shareholder
information
Climate and
sustainability report
Governance
Risk
review
Financial
review
Financial
statements
Barclays PLC 2024
Annual Report
on Form 20-F
377
Notes to the financial statements (continued)
For the year ended 31 December 2024
Purchased or originated credit impaired (POCI)
Purchased or originated credit impaired assets include a fixed pool of credit card and unsecured personal loan balances that were
purchased as part of the Tesco acquisition at a deep discount to face value reflecting credit losses incurred from the point of origination
to the date of acquisition. Hence, POCI assets do not carry any impairment allowance on initial recognition. All changes in lifetime
expected credit losses subsequent to the assets’ initial recognition are recognised as an impairment charge. Over time, these POCI
assets will run off as the loans redeem, pay down or as loans are written off.
Accounting for purchased financial guarantee contracts
The Group may enter into a financial guarantee contract which requires the issuer of such contract to reimburse the Group for a loss it
incurs because a specified debtor fails to make payment when due in accordance with the terms of a debt instrument. For these
separate financial guarantee contracts, the Group recognises a reimbursement asset aligned with the recognition of the underlying
ECLs, if it is considered virtually certain that a reimbursement would be received if the specified debtor fails to make payment when due
in accordance with the terms of the debt instrument.
Loan modifications and renegotiations that are not credit-impaired
When modification of a loan agreement occurs as a result of commercial restructuring activity rather than due to the credit risk of the
borrower, an assessment must be performed to determine whether the terms of the new agreement are substantially different from
the terms of the existing agreement. This assessment considers both the change in cash flows arising from the modified terms as well
as the change in overall instrument risk profile. In respect of payment holidays granted to borrowers which are not due to forbearance, if
the revised cash flows on a present value basis (based on the original EIR) are not substantially different from the original cash flows, the
loan is not considered to be substantially modified.
Where terms are substantially different, the existing loan will be derecognised and a new loan will be recognised at fair value, with any
difference in valuation recognised immediately within the income statement, subject to observability criteria.
Where terms are not substantially different, the loan carrying value will be adjusted to reflect the present value of modified cash flows
discounted at the original EIR, with any resulting gain or loss recognised immediately within the income statement as a modification gain
or loss.
Expected life
Lifetime ECLs must be measured over the expected life. This is restricted to the maximum contractual life and takes into account
expected prepayment, extension, call and similar options. The exceptions are certain revolving financial instruments, such as credit
cards and bank overdrafts, that include both a drawn and an undrawn component where the entity’s contractual ability to demand
repayment and cancel the undrawn commitment does not limit the entity’s exposure to credit losses to the contractual notice period.
For revolving facilities, expected life is analytically derived to reflect the behavioural life of the asset, i.e. the full period over which the
business expects to be exposed to credit risk. Behavioural life is typically based upon historical analysis of the average time to default,
closure or withdrawal of facility. Where data is insufficient or analysis inconclusive, an additional ‘maturity factor’ may be incorporated to
reflect the full estimated life of the exposures, based upon experienced judgement and/or peer analysis. Potential future modifications
of contracts are not taken into account when determining the expected life or EAD until they occur.
Discounting
ECLs are discounted at the EIR at initial recognition or an approximation thereof and consistent with income recognition. For loan
commitments the EIR is the rate that is expected to apply when the loan is drawn down and a financial asset is recognised. Issued
financial guarantee contracts are discounted at the risk-free rate. Lease receivables are discounted at the rate implicit in the lease. For
variable/floating rate financial assets, the spot rate at the reporting date is used and projections of changes in the variable rate over the
expected life are not made to estimate future interest cash flows or for discounting.
Modelling techniques
Currently, Internal Ratings-Based models are leveraged to calculate the point-in-time PD and LGD, which serve as key inputs to the
IFRS 9 models. Thereafter, these inputs are extrapolated by the IFRS 9 models to create macroeconomic sensitive forecasts of PDs,
LGDs and, in turn, ECL.
Forbearance
A financial asset is subject to forbearance when it is modified due to the credit distress of the borrower. A modification made to the terms of an
asset due to forbearance will typically be assessed as a non-substantial modification that does not result in derecognition of the original loan,
except in circumstances where debt is exchanged for equity.
Both performing and non-performing forbearance assets are classified as Stage 3 except where it is established that the concession granted
has not resulted in diminished financial obligation and that no other regulatory definition of default criteria have been triggered, in which case
the asset is classified as Stage 2. The minimum probationary period for non-performing forbearance is 12 months and for performing
forbearance, 24 months. Hence, a minimum of 36 months is required for non-performing forbearance to move out of a forborne state.
No financial instrument in forbearance can transfer back to Stage 1 until all of the Stage 2 thresholds are no longer met and can only
move out of Stage 3 when no longer credit impaired.
Critical accounting estimates and judgements
IFRS 9 impairment involves several important areas of judgement, including estimating forward-looking modelled parameters (PD, LGD
and EAD), developing a range of unbiased future economic scenarios, estimating expected lives and assessing significant increases in
credit risk, based on the Group’s experience of managing credit risk. The determination of expected life is most material for Barclays'
credit card portfolios which is obtained via behavioural life analysis to materially capture the risk of these facilities.
Strategy
Shareholder
information
Climate and
sustainability report
Governance
Risk
review
Financial
review
Financial
statements
Barclays PLC 2024
Annual Report
on Form 20-F
378
Notes to the financial statements (continued)
For the year ended 31 December 2024
Within the retail and small businesses portfolios, which comprise large numbers of small homogeneous assets with similar risk characteristics
where credit scoring techniques are generally used, the impairment allowance is calculated using forward-looking modelled parameters which
are typically run at account level. There are many models in use, each tailored to a product, line of business or customer category. Judgement
and knowledge is needed in selecting the statistical methods to use when the models are developed or revised. Management adjustments to
impairment models, which contain an element of subjectivity, are applied in order to factor in certain conditions or changes in policy that are not
fully incorporated into the impairment models, or to reflect additional facts and circumstances at the period end. Management adjustments are
reviewed and incorporated into future model development where appropriate.
For individually significant assets in Stage 3, impairment allowances are calculated on an individual basis and all relevant considerations that have
a bearing on the expected future cash flows across a range of economic scenarios are taken into account. These considerations can be
particularly subjective and can include the business prospects for the customer, the realisable value of collateral, the Group’s position relative to
other claimants, the reliability of customer information and the likely cost and duration of the work-out process. The level of the impairment
allowance is the difference between the value of the discounted expected future cash flows (discounted at the loan’s original effective interest
rate), and its carrying amount. Furthermore, judgements change with time as new information becomes available or as work-out strategies
evolve, resulting in frequent revisions to the impairment allowance as individual decisions are taken. Changes in these estimates would result in a
change in the allowances and have a direct impact on the impairment charge.
Further information on impairment allowances, impairment charges, management adjustments to models for impairment, measurement
uncertainty, sensitivity analysis and related credit information is set out within the Credit risk performance section.
Temporary adjustments to calculated IFRS 9 impairment allowances may be applied in limited circumstances to account for situations where
known or expected risk factors or information have not been considered in the ECL assessment or modelling process. For further information
please see page 248 in the Credit risk performance section.
Information about the potential impact of the physical and transition risks of climate change on borrowers is considered, taking into account
reasonable and supportable information to make accounting judgements and estimates. Climate change is inherently of a long-term nature,
with significant levels of uncertainty, and consequently requires judgement in determining the possible impact in the next financial year, if any.
2024
2023
2022
Impairment
charges/
(releases)
Recoveries and
reimbursements1
Total2,3
Impairment
charges/
(releases)
Recoveries and
reimbursements1
Total
Impairment
charges/
(releases)
Recoveries and
reimbursements1
Total
£m
£m
£m
£m
£m
£m
£m
£m
£m
Loans and advances at amortised cost4
2,115
(94)
2,021
2,017
(73)
1,944
1,428
(263)
1,165
Off-balance sheet loan
commitments and financial
guarantee contracts
(46)
—
(46)
(61)
—
(61)
18
—
18
Total
2,069
(94)
1,975
1,956
(73)
1,883
1,446
(263)
1,183
Cash collateral and settlement balances
(3)
—
(3)
4
—
4
28
—
28
Financial instruments at fair value
1
—
1
(1)
—
(1)
9
—
9
Reverse Repo
8
—
8
—
—
—
—
—
—
Other financial asset measured at cost
1
—
1
(5)
—
(5)
—
—
—
Credit impairment charges /(releases)
2,076
(94)
1,982
1,954
(73)
1,881
1,483
(263)
1,220
Notes:
1Recoveries and reimbursements include £15m (2023: £29m, 2022: £199m) for reimbursements expected to be received under the arrangement where Group has entered into financial
guarantee contracts which provide credit protection over certain assets with third parties and cash recoveries of previously written off amounts of £79m (2023: £44m, 2022: £64m).
2Includes net impairment charge relating to portfolios classified as held for sale. These include a co-branded card portfolio £160m within USCB and German Consumer Finance business
£74m.
3Includes net impairment charge of £209m on the acquisition of Tesco Bank.
4Includes Debt securities measured at amortised cost.
Write-offs that can be subjected to enforcement activity
The contractual amount outstanding on financial assets that were written off during the year and that can still be subjected to
enforcement activity is £746m (2023: £597m, 2022: £949m) including £45m (2023: £41m) pertaining to German consumer finance
business classified as held for sale.This is lower than the write-offs presented in the movement in the gross exposures and impairment
allowance table due to assets sold during the year post write-offs and post write-off recoveries.
Modification of financial assets
Financial assets of £2,146m (2023: £2,690m, 2022: £2,412m), with a loss allowance measured at an amount equal to lifetime ECL, were
subject to non-substantial modification during the year, with a resulting loss of £78m (2023: £4m, 2022: £4m). The gross carrying
amount of financial assets subject to non-substantial modification for which the loss allowance has changed to a 12-month ECL during
the year amounts to £101m (2023: £149m, 2022: £1,077m).
9 Tax
Accounting for income taxes
The Group applies IAS 12 Income Taxes in accounting for taxes on income. Income tax payable on taxable profits (current tax) is
recognised as an expense in the periods in which the profits arise. Withholding taxes are also treated as income taxes. Income tax
recoverable on tax allowable losses is recognised as a current tax asset only to the extent that it is regarded as recoverable by offsetting
Strategy
Shareholder
information
Climate and
sustainability report
Governance
Risk
review
Financial
review
Financial
statements
Barclays PLC 2024
Annual Report
on Form 20-F
379
Notes to the financial statements (continued)
For the year ended 31 December 2024
against taxable profits arising in the current or prior periods. Current tax is measured using tax rates and tax laws that have been
enacted or substantively enacted at the balance sheet date.
Deferred tax assets are recognised to the extent that it is probable that taxable profit will be available against which the deductible
temporary differences, and the carry forward of unused tax credits and unused tax losses can be utilised. Deferred tax liabilities are
recognised for all taxable temporary differences except for the initial recognition of goodwill. Deferred tax is not recognised where the
temporary difference arises from the initial recognition of an asset or liability in a transaction that is not a business combination and, at
the time of the transaction, affects neither the accounting profit nor taxable profit or loss. Deferred tax is determined using tax rates
and legislation enacted or substantively enacted by the balance sheet date which are expected to apply when the deferred tax asset is
realised or the deferred tax liability is settled. Deferred tax assets and liabilities are only offset when there is both a legal right to set-off
and an intention to settle on a net basis.
The Group has adopted the International Tax Reform - Pillar Two Model Rules amendments to IAS 12, which were issued on 23 May
2023 and approved by the UK Endorsement Board on 19 July 2023, and has applied the exception set out in paragraph 4A in respect of
recognising and disclosing information about deferred tax assets and liabilities related to Pillar Two income taxes.
The Group considers an uncertain tax position to exist when it considers that ultimately, in the future, the amount of profit subject to
tax may be greater than the amount initially reflected in the Group’s tax returns. The Group accounts for provisions in respect of
uncertain tax positions in two different ways.
A current tax provision is recognised when it is considered probable that the outcome of a review by a tax authority of an uncertain tax
position will alter the amount of cash tax due to, or from, a tax authority in the future. From recognition, the current tax provision is then
measured at the amount the Group ultimately expects to pay the tax authority to resolve the position. The accrual of interest and
penalty amounts in respect of uncertain income tax positions is recognised as an expense within profit before tax.
Deferred tax provisions are adjustments made to the carrying value of deferred tax assets in respect of uncertain tax positions. A
deferred tax provision is recognised when it is considered probable that the outcome of a review by a tax authority of an uncertain tax
position will result in a reduction in the carrying value of the deferred tax asset. From recognition of a provision, measurement of the
underlying deferred tax asset is adjusted to take into account the expected impact of resolving the uncertain tax position on the loss or
temporary difference giving rise to the deferred tax asset.
The approach taken to measurement takes account of whether the uncertain tax position is a discrete position that will be reviewed by
the tax authority in isolation from any other position, or one of a number of issues which are expected to be reviewed together
concurrently and resolved simultaneously with a tax authority. The Group’s measurement of provisions is based upon its best estimate
of the additional profit that will become subject to tax. For a discrete position, consideration is given only to the merits of that position.
Where a number of issues are expected to be reviewed and resolved together, the Group will take into account not only the merits of its
position in respect of each particular issue but also the overall level of provision relative to the aggregate of the uncertain tax positions
across all the issues that are expected to be resolved at the same time. In addition, in assessing provision levels, it is assumed that tax
authorities will review uncertain tax positions and that all facts will be fully and transparently disclosed.
Critical accounting estimates and judgements
There are two key areas of judgement that impact the reported tax position. Firstly, the level of provisioning for uncertain tax positions;
and secondly, the recognition and measurement of deferred tax assets.
The Group does not consider there to be a significant risk of a material adjustment to the carrying amount of current and deferred tax
balances, including provisions for uncertain tax positions in the next financial year. The provisions for uncertain tax positions cover a
diverse range of issues and reflect advice from external counsel where relevant. It should be noted that only a proportion of the total
uncertain tax positions will be under audit at any point in time, and could therefore be subject to challenge by a tax authority over the
next year.
Deferred tax assets have been recognised based on business profit forecasts which included consideration for the current view of
climate impacts. Details on the recognition of deferred tax assets are provided in this note.
2024
2023
2022
£m
£m
£m
Current tax charge/(credit)
Current year
1,633
1,359
1,045
Adjustments in respect of prior years
26
(181)
(444)
1,659
1,178
601
Deferred tax charge/(credit)
Current year
128
(95)
235
Adjustments in respect of prior years
(35)
151
203
93
56
438
Tax charge
1,752
1,234
1,039
Strategy
Shareholder
information
Climate and
sustainability report
Governance
Risk
review
Financial
review
Financial
statements
Barclays PLC 2024
Annual Report
on Form 20-F
380
Notes to the financial statements (continued)
For the year ended 31 December 2024
The table below shows the reconciliation between the actual tax charge and the tax charge that would result from applying the standard
UK corporation tax rate to the Group’s profit before tax.
2024
2024
2023
2023
2022
2022
£m
%
£m
%
£m
%
Profit before tax
8,108
6,557
7,012
Tax charge based on the applicable UK corporation tax rate of 25%
(2023: 23.5%; 2022: 19% )
2,027
25.0%
1,541
23.5%
1,332
19.0%
Impact of profits/losses earned in territories with different statutory
rates to the UK (weighted average tax rate is 23.8% (2023: 23.6%;
2022: 21.4% ))
(97)
(1.2%)
4
0.1%
167
2.4%
Recurring items:
Non-creditable taxes including withholding taxes
105
1.3%
130
2.0%
126
1.8%
Banking surcharge1 and other items
91
1.1%
49
0.8%
131
1.8%
Changes in recognition of deferred tax and effect of unrecognised tax
69
0.8%
(58)
(0.9%)
(146)
(2.1%)
Non-deductible expenses
61
0.8%
65
1.0%
51
0.7%
Impact of UK bank levy being non-deductible
56
0.7%
42
0.6%
33
0.5%
Adjustments in respect of prior years
(9)
(0.1%)
(30)
(0.5%)
(241)
(3.4%)
Non-taxable gains and income
(125)
(1.5%)
(65)
(1.0%)
(135)
(1.9%)
Tax relief on holdings of inflation-linked government bonds
(186)
(2.3%)
(214)
(3.3%)
(556)
(7.9%)
Tax relief on payments made under AT1 instruments
(241)
(3.0%)
(222)
(3.4%)
(172)
(2.4%)
Non-recurring items:
Remeasurement of UK deferred tax assets due to tax rate changes
—
—
—
—
346
4.9%
Non-deductible provisions for investigations and litigation
(1)
(0.0%)
—
—
93
1.3%
Non-deductible provisions for UK customer redress
2
0.0%
(8)
(0.1%)
10
0.1%
Total tax charge
1,752
21.6%
1,234
18.8%
1,039
14.8%
Note:
1Banking surcharge includes the impact of the 3% UK banking surcharge rate on profits/losses and tax adjustments relating to UK banking entities.
Factors influencing the effective tax rate
The effective tax rate of 21.6% is lower than the UK corporation tax rate of 25% primarily due to tax relief on payments made under AT1
instruments and tax relief on holdings of inflation-linked government bonds. These factors, which have each decreased the effective
tax rate, are partially offset by non-creditable taxes including withholding taxes, and banking surcharge and other items.
Factors that may influence the effective tax rate in future periods
The Group’s future tax charge will be sensitive to the geographic mix of profits earned, the tax rates in force and changes to the tax
rules in the jurisdictions that the Group operates in.
A gain of £556m has arisen on the acquisition of Tesco Bank. The acquisition is expected to generate a gain as a result of the
consideration payable for net assets being lower than their fair value. The Group considers that the UK corporation tax treatment of
£475m of the day 1 gain is unclear. The Group has treated the gain as taxable in preparing its 2024 financial statements and intends to
engage with HM Revenue & Customs (HMRC) with a view to achieving clarity of treatment prior to filing Barclays Bank UK PLC's
corporation tax return for the year ended 31 December 2024.
Tax law is, at times, complex, and it is the role of courts and tribunals to act as the final authority on the correct interpretation of tax law.
In October 2023, a First-tier Tax Tribunal hearing took place between Barclays Bank PLC and HMRC in respect of the UK corporation tax
treatment of an element of the finance costs associated with reserve capital instruments issued as part of the capital raising
announced by Barclays in October 2008, which have since been redeemed. The judgment was handed down in March 2024 and was in
HMRC’s favour. In January 2025, Barclays was granted permission from the Upper Tribunal to appeal against the judgment. A provision
is carried that is expected to be sufficient to cover the tax cost (once tax attributes that are available to partially offset a potential tax
liability in respect of this issue are taken into account) in the event that the appeal is unsuccessful and the existing judgment were to
stand.
The UK Government enacted legislation in 2023 to implement the OECD's global minimum tax rules (the Pillar Two rules) and a UK
domestic minimum tax. The rules apply from 1 January 2024 and apply in respect of profits for every jurisdiction where the Group
operates. Additional taxes resulting from the implementation of Pillar Two of £14m have arisen in respect of a limited number of
jurisdictions in which the Group operates, principally in the Isle of Man, Jersey, and Guernsey, by virtue of their low statutory tax rates. It
is not expected that additional taxes will significantly increase the Group’s tax charge in future periods.
Additionally, the Group may be subject to Qualifying Domestic Minimum Top-up Taxes (QDMTTs) under the Pillar Two rules
implemented in its operating jurisdictions. The application of QDMTT rules should not affect the overall impact of any additional taxes
resulting from the Pillar Two regime on the Group’s tax charge, as any taxes paid under a local QDMTT would be expected to result in a
reduction in any top-up tax being payable in the UK. The Group will continue to review and assess the impact of further guidance
released by the OECD and governments implementing this new tax regime.
Strategy
Shareholder
information
Climate and
sustainability report
Governance
Risk
review
Financial
review
Financial
statements
Barclays PLC 2024
Annual Report
on Form 20-F
381
Notes to the financial statements (continued)
For the year ended 31 December 2024
Tax in the consolidated statement of comprehensive income
Tax relating to each component of other comprehensive income can be found in the consolidated statement of comprehensive
income.
Tax included directly in equity
Tax included directly in equity comprises a £135m credit (2023: £9m credit, 2022: £1m credit) relating to share-based payments and
deductible costs on issuing other equity instruments.
Deferred tax assets and liabilities
The deferred tax amounts on the balance sheet were as follows:
2024
2023
£m
£m
UK Tax Group
4,451
4,081
US Intermediate Holding Company Tax Group ('IHC Tax Group')
1,162
973
Barclays Bank PLC's US Branch Tax Group
270
386
Other (outside the UK and US tax groups)
438
520
Deferred tax asset
6,321
5,960
Deferred tax liability
(18)
(22)
Net deferred tax
6,303
5,938
UK Tax Group deferred tax asset
The deferred tax asset in the UK Tax Group of £4,451m (2023: £4,081m) includes £1,385m (2023: £1,566m) relating to tax losses, with
the balance relating to temporary differences. There is no time limit on utilisation of UK tax losses and business profit forecasts indicate
that these losses will be fully recovered.
US deferred tax assets in the IHC and US Branch Tax Groups
The deferred tax asset in the IHC Tax Group of £1,162m (2023: £973m) includes £38m (2023: £35m) relating to tax losses, with the
balance relating to temporary differences. The deferred tax asset in Barclays Bank PLC’s US Branch Tax Group of £270m (2023:
£386m) relates entirely to temporary differences.
In relation to the IHC Tax Group, these temporary differences include £365m (2023: £387m) arising from New York State and City prior
net operating loss conversion which can be carried forward and will expire in 2034. Business profit forecasts indicate that these
amounts will be utilised prior to expiry.
Other deferred tax assets (outside the UK and US tax groups)
The deferred tax asset of £438m (2023: £520m) in other entities within the Group includes £111m (2023: £147m) relating to tax losses.
These deferred tax assets relate to a number of different territories and their recognition is based on profit forecasts or local country
law which indicate that it is probable that those deferred tax assets will be fully recovered.
Of the deferred tax asset of £438m (2023: £520m), an amount of £4m (2023: £20m) relates to entities which have suffered a loss in
either the current or prior year and for which the utilisation of the deferred tax is dependent on future taxable profits. This has been
taken into account in reaching the above conclusion that these deferred tax assets will be fully recovered in the future.
The table below shows movements on deferred tax assets and liabilities during the year. The amounts are different from those
disclosed on the balance sheet and in the preceding table as they are presented before offsetting asset and liability balances where
there is a legal right to set-off and an intention to settle on a net basis.
Strategy
Shareholder
information
Climate and
sustainability report
Governance
Risk
review
Financial
review
Financial
statements
Barclays PLC 2024
Annual Report
on Form 20-F
382
Notes to the financial statements (continued)
For the year ended 31 December 2024
Fixed asset
timing
differences
Fair value
through other
comprehensive
income
Cash flow
hedges
Retirement
benefit
obligations
Loan
impairment
allowance
Own credit
Share-based
payments and
deferred
compensation
Other
temporary
differences
Tax losses
carried
forward
Total
£m
£m
£m
£m
£m
£m
£m
£m
£m
£m
Assets
1,277
571
1,477
38
628
85
449
1,146
1,748
7,419
Liabilities
(124)
—
—
(1,014)
—
—
—
(343)
—
(1,481)
As at 1 January 2024
1,153
571
1,477
(976)
628
85
449
803
1,748
5,938
Income statement
159
—
—
4
(110)
1
(34)
101
(214)
(93)
Other comprehensive
income and reserves
—
194
(269)
118
—
308
110
1
—
462
Other movements
6
—
2
—
(19)
—
9
(2)
—
(4)
1,318
765
1,210
(854)
499
394
534
903
1,534
6,303
Assets
1,435
765
1,223
43
499
394
534
1,203
1,534
7,630
Liabilities
(117)
—
(13)
(897)
—
—
—
(300)
—
(1,327)
As at 31 December 2024
1,318
765
1,210
(854)
499
394
534
903
1,534
6,303
Assets
1,296
675
2,875
40
702
—
433
1,280
1,646
8,947
Liabilities
(77)
—
—
(1,315)
—
(190)
—
(390)
—
(1,972)
As at 1 January 2023
1,219
675
2,875
(1,275)
702
(190)
433
890
1,646
6,975
Income statement
(63)
(26)
—
(26)
(43)
—
43
(46)
105
(56)
Other comprehensive
income and reserves
—
(78)
(1,398)
327
—
273
(14)
—
—
(890)
Other movements
(3)
—
—
(2)
(31)
2
(13)
(41)
(3)
(91)
1,153
571
1,477
(976)
628
85
449
803
1,748
5,938
Assets
1,277
571
1,477
38
628
85
449
1,146
1,748
7,419
Liabilities
(124)
—
—
(1,014)
—
—
—
(343)
—
(1,481)
As at 31 December 2023
1,153
571
1,477
(976)
628
85
449
803
1,748
5,938
Other movements include the impact of changes in foreign exchange rates as well as deferred tax amounts relating to acquisitions and
disposals.
The amount of deferred tax assets expected to be recovered after more than 12 months is £6,663m (2023: £5,325m). The amount of
deferred tax liability expected to be settled after more than 12 months is £1,044m (2023: £1,173m). These amounts are before
offsetting asset and liability balances where there is a legal right to set-off and an intention to settle on a net basis.
Unrecognised deferred tax
Tax losses and temporary differences
Deferred tax assets have not been recognised in respect of gross deductible temporary differences of £373m (2023: £527m), unused
tax credits of £359m (2023: £381m), and gross tax losses of £21,295m (2023: £21,681m). The tax losses include capital losses of
£3,903m (2023: £3,965m). Of these tax losses, £13m (2023: £79m) expire within five years, £6m (2023: £13m) expire within six to ten
years, £11,789m (2023: £10,504m) expire within eleven to twenty years and £9,487m (2023: £11,085m) can be carried forward
indefinitely. Deferred tax assets have not been recognised in respect of these items because it is not probable that future taxable
profits and gains will be available against which they can be utilised.
Group investments in subsidiaries, branches and associates
Deferred tax is not recognised in respect of the value of the Group's investments in subsidiaries, branches and associates where the
Group is able to control the timing of the reversal of the temporary differences and it is probable that such differences will not reverse in
the foreseeable future. The aggregate amount of these temporary differences for which deferred tax liabilities have not been
recognised was £920m (2023: £873m).
Strategy
Shareholder
information
Climate and
sustainability report
Governance
Risk
review
Financial
review
Financial
statements
Barclays PLC 2024
Annual Report
on Form 20-F
383
Notes to the financial statements (continued)
For the year ended 31 December 2024
10Earnings per share
2024
2023
2022
£m
£m
£m
Profit attributable to ordinary equity holders of the parent
5,316
4,274
5,023
2024
2023
2022
million
million
million
Basic weighted average number of shares in issue
14,755
15,445
16,333
Number of potential ordinary shares
516
450
534
Diluted weighted average number of shares
15,271
15,895
16,867
Basic earnings per share
Diluted earnings per share
2024
2023
2022
2024
2023
2022
p
p
p
p
p
p
Earnings per ordinary share
36.0
27.7
30.8
34.8
26.9
29.8
The calculation of basic earnings per share is based on the profit attributable to equity holders of the parent and the basic weighted
average number of shares excluding treasury shares held in employee benefit trusts or held for trading. When calculating the diluted
earnings per share, the weighted average number of shares in issue is adjusted for the effects of all expected dilutive potential ordinary
shares held in respect of Barclays PLC, totalling 516m ( 2023: 450m, 2022: 534m) shares. The number of share options outstanding,
under schemes that were considered to be potentially dilutive was 713m (2023: 750m, 2022: 789m) in total. These options have strike
prices ranging from £0.84 to £1.79.
Of the total number of employee share options and share awards at 31 December 2024, 29m (2023: 39m, 2022: 27m) were anti-
dilutive.
The 690m decrease (2023: 888m decrease, 2022: 652m decrease) in the basic weighted average number of shares is primarily due to
the impact of the share buyback programmes completed each year.
11 Dividends on ordinary shares
The Directors have approved a total dividend in respect of 2024 of 8.4p per ordinary share of 25p each. The full year dividend for 2024
of 5.5p per ordinary share will be paid on 4 April 2025 to shareholders on the Share Register on 28 February 2025. On 31 December
2024, there were 14,420m ordinary shares in issue. The financial statements for the year ended 31 December 2024 do not reflect this
dividend, which will be accounted for in shareholders’ equity as an appropriation of retained profits in the year ending 31 December
2025.
For qualifying US and Canadian resident American Depositary Receipt (ADR) holders, the 2024 full year dividend of 5.5p per ordinary
share becomes 22p per American Depositary Share (ADS) (representing four shares). The ex-dividend date for ADR holders is 28
February 2025. The dividend record date is 28 February 2025 and dividend payment date for ADR holders is 4 April 2025.
The Directors have confirmed their intention to initiate a share buyback of up to £1bn after the balance sheet date. The proposed share
buyback is expected to commence in the first quarter of 2025. The financial statements for the year ended 31 December 2024 do not
reflect the impact of the proposed share buyback, which will be accounted for as and when shares are repurchased by the Company.
The 2024 financial statements include the 2024 interim dividend of £425m (2023: £417m, 2022: £364m); a full year dividend declared in
relation to 2023 of £796m (2022: £793m, 2021: £664m ) and two share buyback programmes totalling £1,750m (2023: £1,250m, 2022:
£1,500m). Dividends and share buybacks are funded out of distributable reserves.
Strategy
Shareholder
information
Climate and
sustainability report
Governance
Risk
review
Financial
review
Financial
statements
Barclays PLC 2024
Annual Report
on Form 20-F
384
Notes to the financial statements (continued)
Assets and liabilities held at fair value
Assets and liabilities held at fair value
The notes included in this section focus on assets and liabilities the Group holds and recognises at fair value. Detail regarding the
Group’s approach to managing market risk can be found in the Market risk management section.
12Trading portfolio
Accounting for trading portfolio assets and liabilities
All assets and liabilities held for trading purposes are held at fair value with gains and losses in the changes in fair value taken to the
income statement in net trading income (Note 5).
Trading portfolio assets
Trading portfolio liabilities
2024
2023
2024
2023
£m
£m
£m
£m
Debt securities and other eligible bills
78,014
75,498
(37,050)
(40,547)
Equity securities
74,859
86,353
(19,858)
(18,122)
Traded loans
13,470
12,653
—
—
Commodities
110
101
—
—
Trading portfolio assets/(liabilities)
166,453
174,605
(56,908)
(58,669)
13 Financial assets at fair value through the income statement
Accounting for financial assets designated at fair value
Financial assets, other than those held for trading, are classified in this category if they are so irrevocably designated at inception and
the use of the designation removes or significantly reduces an accounting mismatch.
Subsequent changes in fair value for these instruments are recognised in the income statement in net investment income, except if
reporting it in trading income reduces an accounting mismatch.
The details on how the fair value amounts are derived for financial assets at fair value are described in Note 17.
Accounting for financial assets mandatorily at fair value
Financial assets that are held for trading are recognised at fair value through profit or loss. In addition, financial assets are held at fair
value through profit or loss if they do not contain contractual terms that give rise on specified dates to cash flows that are SPPI, or if the
financial asset is not held in a business model that is either (i) a business model to collect the contractual cash flows or (ii) a business
model that is achieved by both collecting contractual cash flows and selling.
Mandatorily at fair value
Designated at fair value
Total
2024
2023
2024
2023
2024
2023
£m
£m
£m
£m
£m
£m
Loans and advances
42,487
44,557
2,581
3,082
45,068
47,639
Debt securities
2,783
2,456
182
130
2,965
2,586
Equity securities
3,818
7,185
—
—
3,818
7,185
Reverse repurchase agreements and other
similar secured lending
141,773
149,131
—
—
141,773
149,131
Other financial assets
110
110
—
—
110
110
Financial assets at fair value through the
income statement
190,971
203,439
2,763
3,212
193,734
206,651
Credit risk of financial assets designated at fair value and related credit derivatives
The following table shows the maximum exposure to credit risk, the changes in fair value attributable to changes in credit risk, and the
cumulative changes in fair value since initial recognition for loans and advances. The table does not include debt securities designated at
fair value as they have minimal exposure to credit risk due to limited gross exposure.
Maximum exposure as at 31 December
Changes in fair value during the year
ended
Cumulative changes in fair value from
inception
2024
2023
2024
2023
2024
2023
£m
£m
£m
£m
£m
£m
Loans and advances designated at fair value,
attributable to credit risk
2,581
3,081
(1)
3
(8)
(3)
Value mitigated by related credit derivatives
405
613
0
(5)
0
(5)
Strategy
Shareholder
information
Climate and
sustainability report
Governance
Risk
review
Financial
review
Financial
statements
Barclays PLC 2024
Annual Report
on Form 20-F
385
Notes to the financial statements (continued)
Assets and liabilities held at fair value
14Derivative financial instruments
Accounting for derivatives
Derivative instruments are contracts whose value is derived from one or more underlying financial instruments or indices defined in the
contract. They include swaps, forward-rate agreements, futures, options and combinations of these instruments and primarily affect
the Group’s net interest income, net trading income and derivative assets and liabilities. Notional amounts of the contracts are not
recorded on the balance sheet. Derivatives are used to hedge interest rate, credit risk, inflation risk, exchange rate, commodity equity
exposures, and exposures to certain indices such as house price indices and retail price indices related to non-trading positions.
All derivative instruments are held at fair value through profit or loss, except for derivatives that are in a designated cash flow or net
investment hedge accounting relationship. Derivatives are classified as assets when their fair value is positive or as liabilities when their
fair value is negative.
Hedge accounting
The Group applies the requirements of IAS 39Financial Instruments: Recognition and Measurement for hedge accounting purposes.
The Group applies hedge accounting to represent the economic effects of its interest rate, currency and contractually-linked inflation
risk management strategies. Where derivatives are held for risk management purposes, and when transactions meet the required
criteria for documentation and hedge effectiveness, the Group applies fair value hedge accounting, cash flow hedge accounting, or
hedging of a net investment in a foreign operation, as appropriate to the risks being hedged.
Fair value hedge accounting
Changes in fair value of derivatives that qualify and are designated as fair value hedges are recorded in the income statement, together
with changes in the fair value of the hedged asset or liability that are attributable to the hedged risk. The fair value changes adjust the
carrying value of the hedged asset or liability held at amortised cost.
If hedge relationships no longer meet the criteria for hedge accounting, hedge accounting is discontinued. For fair value hedges of
interest rate risk, the fair value adjustment to the hedged item is amortised to the income statement over the period to maturity of the
previously designated hedge relationship using the effective interest method. If the hedged item is sold or repaid, the unamortised fair
value adjustment is recognised immediately in the income statement. For items classified as fair value through other comprehensive
income, the hedge accounting adjustment is included in other comprehensive income.
Cash flow hedge accounting
For qualifying cash flow hedges, the fair value gain or loss associated with the effective portion of the cash flow hedge is recognised
initially in other comprehensive income, and then recycled to the income statement in the periods when the hedged item will affect
profit or loss. Any ineffective portion of the gain or loss on the hedging instrument is recognised in the income statement immediately.
When a hedging instrument expires or is sold, or when a hedge no longer meets the criteria for hedge accounting, any cumulative gain
or loss existing in equity at that time remains in equity and is recognised when the hedged item is ultimately recognised in the income
statement. When a forecast transaction is no longer expected to occur, the cumulative gain or loss that was recognised in equity is
immediately transferred to the income statement.
Hedges of net investments
The Group’s net investments in foreign operations, including monetary items accounted for as part of the net investment, are hedged
for foreign currency risks using both derivatives and foreign currency borrowings. Hedges of net investments are accounted for
similarly to cash flow hedges; the effective portion of the gain or loss on the hedging instrument is being recognised directly in other
comprehensive income and the ineffective portion being recognised immediately in the income statement. The cumulative gain or loss
recognised in other comprehensive income is recognised in the income statement on the disposal or partial disposal of the foreign
operation, or other reductions in the Group’s investment in the operation.
Total derivatives
2024
2023
Notional contract
amount
Fair value
Notional contract
amount
Fair value
Assets
Liabilities
Assets
Liabilities
£m
£m
£m
£m
£m
£m
Total derivative assets/(liabilities) held for trading
84,125,071
290,991
(278,595)
64,993,491
254,643
(249,458)
Total derivative assets/(liabilities) held for risk
management
310,376
2,539
(820)
299,576
2,193
(586)
Derivative assets/(liabilities)
84,435,447
293,530
(279,415)
65,293,067
256,836
(250,044)
Further information on netting arrangements of derivative financial instruments can be found within Note 18.
The fair values and notional amounts of derivative instruments held for trading and held for risk management are set out in the following
table:
Strategy
Shareholder
information
Climate and
sustainability report
Governance
Risk
review
Financial
review
Financial
statements
Barclays PLC 2024
Annual Report
on Form 20-F
386
Notes to the financial statements (continued)
Assets and liabilities held at fair value
Derivatives held for trading and held for risk management
2024
2023
Notional
contract
amount
Fair value
Notional
contract
amount
Fair value
Assets
Liabilities
Assets
Liabilities
£m
£m
£m
£m
£m
£m
Derivatives held for trading
Foreign exchange derivatives
OTC derivatives
8,249,213
123,489
(116,429)
6,536,257
86,987
(82,711)
Derivatives cleared by central counterparty
240,612
228
(235)
186,672
529
(512)
Exchange traded derivatives
27,441
7
(7)
17,899
2
(2)
Foreign exchange derivatives
8,517,266
123,724
(116,671)
6,740,828
87,518
(83,225)
Interest rate derivatives
OTC derivatives
26,422,379
91,488
(79,925)
19,671,577
104,618
(92,467)
Derivatives cleared by central counterparty
36,810,961
1,479
(1,344)
27,662,853
1,989
(2,065)
Exchange traded derivatives
7,672,496
2,664
(2,698)
6,800,161
2,824
(2,895)
Interest rate derivatives
70,905,836
95,631
(83,967)
54,134,591
109,431
(97,427)
Credit derivatives
OTC derivatives
593,702
3,474
(4,307)
587,472
4,936
(6,005)
Derivatives cleared by central counterparty
943,413
3,424
(3,148)
860,878
2,726
(2,625)
Credit derivatives
1,537,115
6,898
(7,455)
1,448,350
7,662
(8,630)
Equity and stock index derivatives
OTC derivatives
598,297
21,965
(26,319)
448,780
17,792
(25,779)
Exchange traded derivatives
2,347,247
40,947
(42,309)
2,017,045
30,379
(32,549)
Equity and stock index derivatives
2,945,544
62,912
(68,628)
2,465,825
48,171
(58,328)
Commodity derivatives
OTC derivatives
7,084
17
(32)
4,734
44
(4)
Exchange traded derivatives
212,226
1,809
(1,842)
199,163
1,817
(1,844)
Commodity derivatives
219,310
1,826
(1,874)
203,897
1,861
(1,848)
Derivative assets/(liabilities) held for trading
84,125,071
290,991
(278,595)
64,993,491
254,643
(249,458)
Total OTC derivatives
35,870,675
240,433
(227,012)
27,248,820
214,377
(206,966)
Total derivatives cleared by central counterparty
37,994,986
5,131
(4,727)
28,710,403
5,244
(5,202)
Total exchange traded derivatives
10,259,410
45,427
(46,856)
9,034,268
35,022
(37,290)
Derivative assets/(liabilities) held for trading
84,125,071
290,991
(278,595)
64,993,491
254,643
(249,458)
Derivatives held for risk management
Derivatives designated as cash flow hedges
OTC foreign exchange derivatives
35,202
2,338
(320)
26,661
1,904
(8)
OTC interest rate derivatives
105
—
—
195
—
—
Interest rate derivatives cleared by central
counterparty
111,873
—
—
130,961
—
—
Derivatives designated as cash flow hedges
147,180
2,338
(320)
157,817
1,904
(8)
Derivatives designated as fair value hedges
OTC interest rate derivatives
11,955
165
(434)
8,697
178
(533)
Interest rate derivatives cleared by central
counterparty
147,227
—
—
129,318
—
—
Derivatives designated as fair value hedges
159,182
165
(434)
138,015
178
(533)
Derivatives designated as hedges of net
investments
OTC foreign exchange derivatives
4,014
36
(66)
3,744
111
(45)
Derivatives designated as hedges of net
investments
4,014
36
(66)
3,744
111
(45)
Derivative assets/(liabilities) held for risk
management
310,376
2,539
(820)
299,576
2,193
(586)
Total OTC derivatives
51,276
2,539
(820)
39,297
2,193
(586)
Total derivatives cleared by central counterparty
259,100
—
—
260,279
—
—
Derivative assets/(liabilities) held for risk
management
310,376
2,539
(820)
299,576
2,193
(586)
Strategy
Shareholder
information
Climate and
sustainability report
Governance
Risk
review
Financial
review
Financial
statements
Barclays PLC 2024
Annual Report
on Form 20-F
387
Notes to the financial statements (continued)
Assets and liabilities held at fair value
Hedge accounting
Hedge accounting is applied predominantly for the following risks:
▪Interest rate risk – arises due to a mismatch between fixed interest rates and floating interest rates. Interest rate risk also includes
exposure to inflation risk for certain types of investments
▪Currency risk – arises due to assets or liabilities being denominated in different currencies than the functional currency of the relevant
entity. At a consolidated level, currency risk also arises when the functional currency of subsidiaries are different from the parent
▪Contractually-linked inflation risk – arises from financial instruments within contractually specified inflation risk. The Group does not
hedge inflation risk that arises from other activities
In order to hedge these risks, the Group uses the following hedging instruments:
▪Interest rate derivatives to swap interest rate exposures into either fixed or variable rates
▪Currency derivatives to swap foreign currency exposures into the entity’s functional currency, and net investment exposure to local
currency
▪Inflation derivatives to swap inflation exposure into either fixed or variable interest rates
In some cases, certain items which are economically hedged may be ineligible hedged items for the purposes of IAS 39, such as core
deposits and equity. In these instances, a proxy hedging solution can be utilised whereby portfolios of floating rate assets are
designated as eligible hedged items in cash flow hedges
In some hedging relationships, the Group designates risk components of hedged items as follows:
▪Benchmark interest rate risk as a component of interest rate risk, such as the Risk Free Rate (RFR) component
▪Inflation risk as a contractually specified component of a debt instrument
▪Exchange rate risk for foreign currency financial assets or financial liabilities
▪Components of cash flows of hedged items, for example certain interest payments for part of the life of an instrument
Using the benchmark interest rate risk results in other risks, such as credit risk and liquidity risk, being excluded from the hedge
accounting relationship.
In respect of many of the Group’s hedge accounting relationships, the hedged item and hedging instrument change frequently due to
the dynamic nature of the risk management and hedge accounting strategy. The Group applies hedge accounting to dynamic
scenarios, predominantly in relation to interest rate risk, with a combination of hedged items in order for its financial statements to
reflect as closely as possible the economic risk management undertaken. In some cases, if the hedge accounting objective changes,
the relevant hedge accounting relationship is de-designated and is replaced with a different hedge accounting relationship.
Changes in the GBP value of net investments due to foreign currency movements are captured in the currency translation reserve,
resulting in a movement in CET1 capital. The Group mitigates this by matching the CET1 capital movements to the revaluation of the
foreign currency RWA exposures. Net investment hedges are designated where necessary to reduce the exposure to movement in a
particular exchange rate to within limits mandated by Risk. As far as possible, existing external currency liabilities are designated as the
hedging instruments.
The hedging instruments share the same risk exposures as the hedged items. Hedge effectiveness is determined with reference to
quantitative tests, predominantly regression testing, but to the extent hedging instruments are exposed to different risks than the
hedged items, this could result in hedge ineffectiveness or hedge accounting failures.
Sources of ineffectiveness include the following:
▪Mismatches between the contractual terms of the hedged item and hedging instrument, including basis differences
▪Changes in credit risk of the hedging instruments
▪If a hedging relationship becomes over-hedged, for example in hedges of net investments if the net asset value designated at the
start of the period falls below the amount of the hedging instrument
▪Cash flow hedges using external swaps with non-zero fair values
Strategy
Shareholder
information
Climate and
sustainability report
Governance
Risk
review
Financial
review
Financial
statements
Barclays PLC 2024
Annual Report
on Form 20-F
388
Notes to the financial statements (continued)
Assets and liabilities held at fair value
Hedged items in fair value hedges
Accumulated fair value adjustment
included in carrying amount
Hedged item statement of financial position classification and
risk category
Carrying amount
Total
Of which:
Accumulated fair
value adjustment
on items no longer
in a hedge
relationship
Change in fair
value used as a
basis to determine
ineffectiveness
Hedge
ineffectiveness
recognised in the
income
statements1
£m
£m
£m
£m
£m
2024
Assets
Loans and advances at amortised cost
- Interest rate risk
2,394
(3,853)
(1,786)
(848)
22
- Inflation risk
318
219
102
(17)
7
Debt securities classified at amortised cost
- Interest rate risk
8,223
(47)
8
62
69
- Inflation risk
10,100
(1,400)
(37)
(575)
(40)
Financial assets at fair value through other comprehensive
income2
- Interest rate risk
47,293
(1,381)
(423)
(126)
226
- Inflation risk
8,477
(254)
(86)
(113)
(35)
Total assets
76,805
(6,716)
(2,222)
(1,617)
249
Liabilities
Debt securities in issue
- Interest rate risk
(50,209)
2,747
775
333
(49)
Subordinated liabilities
- Interest rate risk
(10,765)
648
38
(4)
8
Deposits at amortised cost from banks and customers
- Interest rate risk
(8,596)
(12)
(1)
(4)
(2)
Repurchase agreements and other similar secured borrowing at
amortised cost
- Interest rate risk
—
—
—
—
—
Total liabilities
(69,570)
3,383
812
325
(43)
Total hedged items
7,235
(3,333)
(1,410)
(1,292)
206
2023
Assets
Loans and advances at amortised cost
- Interest rate risk
3,543
(3,193)
(1,867)
113
11
- Inflation risk
450
246
—
3
(5)
Debt securities classified at amortised cost
- Interest rate risk
2,390
(24)
(21)
49
21
- Inflation risk
8,119
(836)
(57)
(30)
(26)
Financial assets at fair value through other comprehensive
income2
- Interest rate risk
42,420
(1,392)
(667)
1,244
197
- Inflation risk
5,237
(202)
(176)
(84)
(10)
Total assets
62,159
(5,401)
(2,788)
1,295
188
Liabilities
Debt securities in issue
- Interest rate risk
(43,763)
2,450
968
(1,193)
(35)
Subordinated liabilities
- Interest rate risk
(9,772)
666
61
(234)
10
Deposits at amortised cost from banks and customers
- Interest rate risk
(10,766)
(18)
(2)
(31)
(2)
Repurchase agreements and other similar secured borrowing at
amortised cost
- Interest rate risk
(433)
7
7
(4)
3
Total liabilities
(64,734)
3,105
1,034
(1,462)
(24)
Total hedged items
(2,575)
(2,296)
(1,754)
(167)
164
Notes:
1Hedge ineffectiveness is recognised in net interest income.
2For items classified as fair value through other comprehensive income, the hedge accounting adjustment is not included in the carrying amount, but rather adjusts other comprehensive
income.
Strategy
Shareholder
information
Climate and
sustainability report
Governance
Risk
review
Financial
review
Financial
statements
Barclays PLC 2024
Annual Report
on Form 20-F
389
Notes to the financial statements (continued)
Assets and liabilities held at fair value
The following table shows the fair value hedging instruments which are carried on the Group’s balance sheet:
Carrying value
Nominal amount
Change in fair
value used as a
basis to determine
ineffectiveness
Derivative assets
Derivative liabilities
Loan liabilities
Hedge type
Risk category
£m
£m
£m
£m
£m
As at 31 December 2024
Fair value
Interest rate risk
26
(3)
—
138,354
861
Inflation risk
139
(431)
—
20,828
637
Total
165
(434)
—
159,182
1,498
As at 31 December 2023
Fair value
Interest rate risk
2
(2)
—
123,016
261
Inflation risk
176
(531)
—
14,999
70
Total
178
(533)
—
138,015
331
The following table profiles the expected notional values of current hedging instruments in future years:
2024
2025
2026
2027
2028
2029
2030 and later
As at 31 December
£m
£m
£m
£m
£m
£m
£m
Fair value hedges of:
Interest rate risk (outstanding notional amount)
138,354
121,988
104,512
86,187
74,481
62,046
50,785
Inflation risk (outstanding notional amount)
20,828
20,591
18,395
15,608
13,259
11,728
9,691
There are 2,212 (2023: 1,996) interest rate risk fair value hedges with an average fixed rate of 3.29% (2023: 1.64%) across the
relationships and 196 (2023: 136) inflation risk fair value hedges with an average rate of 0.59% (2023: 0.85%) across the relationships.
Strategy
Shareholder
information
Climate and
sustainability report
Governance
Risk
review
Financial
review
Financial
statements
Barclays PLC 2024
Annual Report
on Form 20-F
390
Notes to the financial statements (continued)
Assets and liabilities held at fair value
Hedged items in cash flow hedges and hedges of net investments in foreign operations
Description of hedge
relationship and hedged risk
Change in value of
hedged item used
as the basis for
recognising
ineffectiveness
Balance in cash
flow hedging
reserve for
continuing hedges
Balance in currency
translation reserve
for continuing
hedges
Balances remaining
in cash flow
hedging reserve
for which hedge
accounting is no
longer applied
Balances remaining
in currency
translation reserve
for which hedge
accounting is no
longer applied
Hedging gains or
losses recognised
in other
comprehensive
income
Hedge
ineffectiveness
recognised in the
income statement1
£m
£m
£m
£m
£m
£m
£m
2024
Assets
Cash flow hedge of:
Interest rate risk
Loans and advances at
amortised cost
362
608
—
1,273
—
362
18
Cash and balances at central
banks
443
674
—
1,389
—
443
8
Foreign exchange risk
Loans and advances at
amortised cost
300
106
—
—
—
300
5
Debt securities classified at
amortised cost
(449)
142
—
—
—
(449)
—
Inflation risk
Debt securities classified at
amortised cost
118
(73)
—
25
—
118
—
Liabilities
Cash flow hedge of:
Foreign exchange risk
Subordinated liabilities
34
(12)
—
—
—
34
—
Total cash flow hedge
808
1,445
—
2,687
—
808
31
Hedge of net investment in
foreign operations
USD foreign operations
160
—
1,520
—
—
160
—
EUR foreign operations
(242)
—
(209)
—
—
(242)
—
Other foreign operations
(18)
—
100
—
23
(18)
—
Total foreign operations
(100)
—
1,411
—
23
(100)
—
2023
Cash flow hedge of:
Interest rate risk
Loans and advances at
amortised cost
(1,172)
395
2,069
(1,172)
34
Cash and balances at central
banks
(1,371)
470
2,051
(1,371)
115
Foreign exchange risk
Loans and advances at
amortised cost
(463)
30
—
—
—
(463)
6
Debt securities classified at
amortised cost
(1,088)
333
—
—
—
(1,088)
1
Inflation risk
Debt securities classified at
amortised cost
(313)
(181)
—
21
—
(313)
—
Total cash flow hedge
(4,407)
1,047
—
4,141
—
(4,407)
156
Hedge of net investment in
foreign operations
USD foreign operations
(595)
—
1,421
—
—
(595)
—
EUR foreign operations
(113)
—
33
—
—
(113)
—
Other foreign operations
(118)
—
119
—
23
(118)
—
Total foreign operations
(826)
—
1,573
—
23
(826)
—
Note:
1Hedge ineffectiveness is recognised in net interest income.
Strategy
Shareholder
information
Climate and
sustainability report
Governance
Risk
review
Financial
review
Financial
statements
Barclays PLC 2024
Annual Report
on Form 20-F
391
Notes to the financial statements (continued)
Assets and liabilities held at fair value
The following table shows the cash flow and net investment hedging instruments which are carried on the Group’s balance sheet:
Carrying value
Nominal amount
Change in fair
value used as a
basis to determine
ineffectiveness
Derivative assets
Derivative
liabilities
Loan liabilities
Hedge type
Risk category
£m
£m
£m
£m
£m
As at 31 December 2024
Cash flow
Interest rate risk
—
—
—
105,600
(779)
Foreign exchange risk
2,338
(320)
—
35,202
120
Inflation risk
—
—
—
6,378
(118)
Total
2,338
(320)
—
147,180
(777)
Net investment
Foreign exchange risk
36
(66)
(12,189)
16,203
100
As at 31 December 2023
Cash flow
Interest rate risk
—
—
—
128,349
2,692
Foreign exchange risk
1,904
(8)
—
26,661
1,558
Inflation risk
—
—
—
2,807
313
Total
1,904
(8)
—
157,817
4,563
Net investment
Foreign exchange risk
111
(45)
(13,157)
16,901
826
There are 45 (2023: 50) foreign exchange risk cash flow hedges with an average foreign exchange rate of 142.93JPY:1 GBP (2023:
147.94 JPY: 1 GBP) across the relationships, 11 (2023: 8) foreign exchange risk cash flow hedges with an average foreign exchange rate
of 1.26 USD:1 GBP (2023: 1.25) across the relationships, 11(2023: none) foreign exchange risk cash flow hedges with an average
foreign exchange rate of 1.94 AUD:1 GBP (2023:none) across the relationships and 2 (2023: none) foreign exchange risk cash flow
hedges with an average foreign exchange rate of 1.12 CHF:1 GBP (2023: none) across the relationships.
The effect on the income statement and other comprehensive income of recycling amounts in respect of cash flow hedges and net
investment hedges of foreign operations is set out in the following table:
2024
2023
Amount recycled
from other
comprehensive
income due to
hedged item
affecting income
statement
Amount recycled
from other
comprehensive
income due to sale
of investment, or
cash flows no
longer expected to
occur
Amount recycled
from other
comprehensive
income due to
hedged item
affecting income
statement
Amount recycled
from other
comprehensive
income due to sale
of investment, or
cash flows no
longer expected to
occur
Description of hedge relationship and hedged risk
£m
£m
£m
£m
Cash flow hedge of interest rate risk
Recycled to net interest income
(1,830)
0
(1,752)
2
Cash flow hedge of foreign exchange risk
Recycled to trading income
(12)
—
1,327
—
Hedge of net investment in foreign operations
Recycled to trading income
—
(1)
—
(6)
A detailed reconciliation of the movements of the cash flow hedging reserve and the currency translation reserve is as follows:
2024
2023
Cash flow hedging
reserve
Currency
translation reserve
Cash flow hedging
reserve
Currency
translation reserve
£m
£m
£m
£m
Balance on 1 January
(3,707)
3,671
(7,235)
4,772
Currency translation movements
24
(160)
40
(1,942)
Hedging (losses)/gains for the year
(808)
100
4,407
826
Amounts reclassified in relation to cash flows affecting profit or loss
1,842
1
423
6
Tax
(281)
13
(1,342)
9
Balance on 31 December
(2,930)
3,625
(3,707)
3,671
Strategy
Shareholder
information
Climate and
sustainability report
Governance
Risk
review
Financial
review
Financial
statements
Barclays PLC 2024
Annual Report
on Form 20-F
392
Notes to the financial statements (continued)
Assets and liabilities held at fair value
15Financial assets at fair value through other comprehensive income
Accounting for financial assets at fair value through other comprehensive income (FVOCI)
Financial assets that are debt instruments held in a business model that is achieved by both collecting contractual cash flows and selling
and that contain contractual terms that give rise on specified dates to cash flows that are SPPI are measured at FVOCI. They are
subsequently remeasured at fair value and changes therein (except for those relating to impairment, interest income and foreign
currency exchange gains and losses) are recognised in other comprehensive income until the assets are sold. Interest (calculated using
the effective interest method) is recognised in the income statement in net interest income (Note 3). Upon disposal, the cumulative
gain or loss recognised in other comprehensive income is included in net investment income (Note 6).
In determining whether the business model is achieved by both collecting contractual cash flows and selling financial assets, it is
determined that both collecting contractual cash flows and selling financial assets are integral to achieving the objective of the business
model. The Group will consider past sales and expectations about future sales to establish if the business model is achieved.
For equity securities that are not held for trading, the Group may make an irrevocable election on initial recognition to present
subsequent changes in the fair value of the instrument in other comprehensive income (except for dividend income which is recognised
in profit or loss).
2024
2023
£m
£m
Debt securities and other eligible bills
74,772
71,059
Equity securities
4
6
Loans and advances
3,283
771
Financial assets at fair value through other comprehensive income
78,059
71,836
16Financial liabilities designated at fair value
Accounting for liabilities designated at fair value through profit and loss
In accordance with IFRS 9, financial liabilities may be designated at fair value, with gains and losses taken to the income statement within
net trading income (Note 5) and net investment income (Note 6). Movements in own credit are reported through other comprehensive
income, unless the effects of changes in the liability's credit risk would create or enlarge an accounting mismatch in P&L. In these
scenarios, all gains and losses on that liability (including the effects of changes in the credit risk of the liability) are presented in P&L. On
derecognition of the financial liability no amount relating to own credit risk is recycled to the income statement. The Group has the
ability to make the fair value designation when holding the instruments at fair value reduces an accounting mismatch (caused by an
offsetting liability or asset being held at fair value), or is managed by the Group on the basis of its fair value, or includes terms that have
substantive derivative characteristics (Note 14).
The details on how the fair value amounts are arrived at for financial liabilities designated at fair value are described in Note 17.
2024
2023
Fair value
Contractual
amount due
on maturity
Fair value
Contractual
amount due
on maturity
£m
£m
£m
£m
Debt securities
80,218
96,316
68,261
82,820
Deposits
46,383
48,201
43,552
44,862
Repurchase agreements and other similar secured borrowing
155,606
156,180
185,716
186,593
Other financial liabilities
17
17
10
10
Financial liabilities designated at fair value
282,224
300,714
297,539
314,285
The cumulative own credit net loss recognised is £1,434m (2023: £307m loss).
Strategy
Shareholder
information
Climate and
sustainability report
Governance
Risk
review
Financial
review
Financial
statements
Barclays PLC 2024
Annual Report
on Form 20-F
393
Notes to the financial statements (continued)
Assets and liabilities held at fair value
17 Fair value of financial instruments
Accounting for financial assets and liabilities – fair value
Financial instruments that are held for trading are recognised at fair value through profit or loss. In addition, financial assets are held at
fair value through profit or loss if they do not contain contractual terms that give rise on specified dates to cash flows that are SPPI, or if
the financial asset is not held in a business model that is either (i) a business model to collect the contractual cash flows or (ii) a business
model that is achieved by both collecting contractual cash flows and selling. Subsequent changes in fair value for these instruments are
recognised in the income statement in net investment income, except if reporting it in trading income reduces an accounting
mismatch.
Wherever possible, fair value is determined by reference to a quoted market price for that instrument. For many of the Group’s financial
assets and liabilities, especially derivatives, quoted prices are not available and valuation models are used to estimate fair value. The
models calculate the expected cash flows under the terms of each specific contract and then discount these values back to a present
value. These models use as their basis independently sourced market inputs including, for example, interest rate yield curves, equities
and commodities prices, option volatilities and currency rates.
For financial liabilities measured at fair value, the carrying amount reflects the effect on fair value of changes in own credit spreads
derived from observable market data such as in primary issuance and redemption activity for structured notes.
On initial recognition, it is presumed that the transaction price is the fair value unless there is observable information available in an
active market to the contrary.
For valuations that have made use of unobservable inputs, the difference between the model valuation and the initial transaction price
(Day one profit) is recognised in profit or loss either: on a straight-line basis over the term of the transaction; or over the period until all
inputs will become observable where appropriate; or released in full when previously unobservable inputs become observable.
Various factors influence the availability of observable inputs, and these may vary from product to product and change over time.
Factors include the depth of activity in the relevant market, the type of product, whether the product is new and not widely traded in the
marketplace, the maturity of market modelling and the nature of the transaction (bespoke or generic). To the extent that valuation is
based on models or inputs that are not observable in the market, the determination of fair value can be more subjective, dependent on
the significance of the unobservable input to the overall valuation. Unobservable inputs are determined based on the best information
available, for example by reference to similar assets, similar maturities, or other analytical techniques.
The sensitivity of valuations used in the financial statements to possible changes in significant unobservable inputs is shown on
Valuation: Where available, valuations are based on observable market prices sourced from broker quotes and inter-dealer prices and
external vendor provides who provide pricing. Otherwise, valuations are determined using industry standard discounted cash flow
analysis that calculates the fair value based on valuation inputs such as constant default rate, conditional prepayment rate, loss given
default and yield. These inputs are determined by reference to a number of sources including proxying to observed transactions,
market indices or market research, and by assessing underlying collateral performance.
Proxying to observed transactions, indices or research requires an assessment and comparison of the relevant securities’ underlying
attributes including collateral, tranche, vintage, underlying asset composition (historical losses, borrower characteristics and loan
attributes such as loan to value ratio and geographic concentration) and credit ratings (original and current).
Observability: Where an asset backed product does not have an observable market price and the valuation is determined using a
discounted cash flow analysis, the instrument is considered unobservable.
Government debt
Description: Government bonds, supra sovereign bonds and agency bonds.
Valuation: Liquid bonds that are actively traded through an exchange or clearing house are marked to the levels observed in these
markets. Other actively traded bonds are valued using observable market prices sourced from broker quotes, inter-dealer prices or
other reliable pricing sources.
Observability: Prices for actively traded bonds are considered observable. Unobservable bonds prices are generally determined by
reference to bond yields for actively traded bonds from the same (or a similar) issuer.
Issued debt
Description: Debt notes issued by Barclays.
Valuation: Issued debt is valued using discounted cash flow techniques incorporating various inputs observed for each instrument.
Observability: Barclays issued notes are generally observable. Structured notes are debt instruments containing embedded derivatives.
Where either an input to the embedded derivative or the debt instrument is deemed unobservable and significant to the overall
valuation of the note, the structured note is classified as Level 3.
Other products
Description: Other products include funds and fund-linked products, equity cash products, investment property, foreign exchange
derivatives and credit derivatives.
Assets and liabilities reclassified between Level 1 and Level 2
During the year ended 31 December 2024, there were no material transfers between Level 1 and Level 2 (year ended 31 December
2023: there were no material transfers between Level 1 and Level 2).
Level 3 movement analysis
The following table summarises the movements in the Level 3 balances during the year. Transfers have been reflected as if they had
taken place at the beginning of the year.
Asset and liability transfers between Level 2 and Level 3 are primarily due to i) an increase or decrease in observable market activity
related to an input or ii) a change in the significance of the unobservable input, with assets and liabilities classified as Level 3 if an
unobservable input is deemed significant.
Analysis of movements in Level 3 assets and liabilities
As at 1
January
2024
Total gains and (losses)
in the period
recognised in the
income statement
Total gains
and (losses)
in the
period
recognised
in OCI
Transfers
As at 31
December
2024
Purchases
Sales
Issues
Settlements
Trading
income2
Other
income
In
Out
£m
£m
£m
£m
£m
£m
£m
£m
£m
£m
£m
Trading portfolio assets
6,509
5,848
(1,817)
—
(865)
(9)
—
—
775
(326)
10,115
Financial assets at fair value
through the income statement
8,249
2,704
(2,072)
—
(793)
(1)
218
—
207
(88)
8,424
Assets at fair value through other
comprehensive income
1,078
3,116
(43)
—
—
3
22
(1)
49
(485)
3,739
Investment properties
2
9
(2)
—
—
—
—
—
—
—
9
Trading portfolio liabilities
(368)
(26)
20
—
—
(7)
—
—
(15)
1
(395)
Financial liabilities designated at
fair value
(1,222)
(415)
19
(1,146)
143
(74)
(20)
—
(893)
350
(3,258)
Net derivative financial
instruments1
(1,113)
(568)
(6)
—
(16)
(64)
(1)
—
163
501
(1,104)
Total
13,135
10,668
(3,901)
(1,146)
(1,531)
(152)
219
(1)
286
(47)
17,530
Strategy
Shareholder
information
Climate and
sustainability report
Governance
Risk
review
Financial
review
Financial
statements
Barclays PLC 2024
Annual Report
on Form 20-F
397
Notes to the financial statements (continued)
Assets and liabilities held at fair value
Analysis of movements in Level 3 assets and liabilities
As at 1
January
2023
Total gains and (losses)
in the period
recognised in the
income statement
Total gains
and (losses)
in the
period
recognised
in OCI
Transfers
As at 31
December
2023
Purchases
Sales
Issues
Settlements
Trading
income2
Other
income
In
Out
£m
£m
£m
£m
£m
£m
£m
£m
£m
£m
£m
Trading portfolio assets
6,480
3,394
(3,023)
—
(602)
11
—
—
1,059
(810)
6,509
Financial assets at fair value
through the income statement
9,125
3,966
(3,435)
—
(1,429)
109
61
—
239
(387)
8,249
Assets at fair value through other
comprehensive income
11
926
—
—
(3)
—
—
(3)
147
—
1,078
Investment properties
5
—
(4)
—
—
—
1
—
—
—
2
Trading portfolio liabilities
(56)
(367)
45
—
—
—
—
—
—
10
(368)
Financial liabilities designated at
fair value
(1,050)
(40)
—
(403)
—
(38)
(3)
—
(147)
459
(1,222)
Net derivative financial
instruments1
(1,189)
(640)
24
—
83
(92)
—
—
388
313
(1,113)
Total
13,326
7,239
(6,393)
(403)
(1,951)
(10)
59
(3)
1,686
(415)
13,135
Notes:
1The derivative financial instruments are represented on a net basis. On a gross basis, derivative financial assets are £2,077m (2023: £3,540m) and derivative financial liabilities are
£(3,181)m (2023: £(4,653)m).
2 Trading income represents gains and losses on Level 3 financial instruments which in the majority are offset by losses and gains on financial instruments disclosed in Level 2.
Unrealised gains and losses on Level 3 financial assets and liabilities
The following table discloses the unrealised gains and losses recognised in the year arising on Level 3 financial assets and liabilities held
at year end.
Unrealised gains and (losses) recognised during the period on Level 3 assets and liabilities held at year end
2024
2023
Income statement
Other
compre-
hensive
income
Total
Income statement
Other
compre-
hensive
income
Total
Trading
income1
Other
income
Trading
income1
Other
income
£m
£m
£m
£m
£m
£m
£m
£m
Trading portfolio assets
(9)
—
—
(9)
10
—
—
10
Financial assets at fair value through the income
statement
2
94
—
96
113
72
—
185
Fair value through other comprehensive income
3
22
(1)
24
—
—
(3)
(3)
Investment property
—
—
—
—
—
1
—
1
Trading portfolio liabilities
(7)
—
—
(7)
—
—
—
—
Financial liabilities designated at fair value
(77)
(9)
—
(86)
(38)
(3)
—
(41)
Net derivative financial instruments
(57)
(1)
—
(58)
(107)
—
—
(107)
Total
(145)
106
(1)
(40)
(22)
70
(3)
45
Note:
1Trading income represents gains and losses on Level 3 financial instruments which in the majority are offset by losses and gains on financial instruments disclosed in Level 2.
Strategy
Shareholder
information
Climate and
sustainability report
Governance
Risk
review
Financial
review
Financial
statements
Barclays PLC 2024
Annual Report
on Form 20-F
398
Notes to the financial statements (continued)
Assets and liabilities held at fair value
Significant unobservable inputs
The following table discloses the valuation techniques and significant unobservable inputs for material products recognised at fair value
and classified as Level 3 along with the range of values used for those significant unobservable inputs:
Valuation technique(s)1
Significant unobservable inputs
2024 Range
2023 Range
Min
Max
Min
Max
Units2
Derivative financial
instruments3
Interest rate derivatives
Discounted cash flows
Inflation forwards
3
3
4
7
%
Credit spread
14
1,972
15
1,672
bps
Yield
0
12
1
7
%
Growth curve
n/m4
n/m4
(1)
2
%
Option model
Inflation volatility
n/m4
n/m4
66
257
bps vol
Interest rate volatility
19
175
26
515
bps vol
FX - IR correlation
(36)
30
(20)
78
%
IR - IR correlation
33
98
(20)
98
%
IR - Inflation correlation
10
10
10
10
%
Inflation - Inflation
correlation
5
5
5
5
%
Equity derivatives
Option model
Equity volatility
1
133
5
138
%
Equity - equity
correlation
40
100
40
100
%
Discounted cash flow
Discount margin
(215)
351
(238)
110
bps
Non-derivative financial
instruments
Loans
Discounted cash flows
Loan spread
35
908
40
802
bps
Credit spread
194
1,011
186
870
bps
Discount margin
230
345
230
345
bps
Yield
2
18
7
18
%
Comparable pricing
Comparable price
0
240
0
287
points
Asset backed securities
Comparable pricing
Comparable price
0
125
0
5,000
points
Discounted cash flows
Discount margin
(137)
(25)
n/m4
n/m4
bps
Option Model
Equity volatility
15
32
n/m4
n/m4
%
Private equity investments
EBITDA multiple
EBITDA multiple
2
7
15
17
Multiple
Earnings multiple
Earnings multiple
3
17
3
25
Multiple
Discounted cash flow
Credit spread
210
430
380
630
bps
Discount margin
8
10
8
10
%
Corporate debt
Comparable pricing
Comparable price
0
2,322
0
352
points
Government debt
Comparable pricing
Comparable price
0
123
1
127
points
Issued debt
Discounted cash flows
Credit spread
50
198
60
192
bps
Option model
Equity volatility
1
111
4
91
%
Interest rate volatility
19
211
11
391
bps vol
Reverse repurchase and
repurchase agreements
Discounted cash flows
Repo spread
14
186
385
468
bps
Notes:
1A range has not been provided for Net Asset Value as there would be a wide range reflecting the diverse nature of the positions.
2The units used to disclose ranges for significant unobservable inputs are percentages, points and basis points. Points are a percentage of par; for example, 100 points equals 100% of
par. A basis point equals 1/100th of 1%; for example, 150 basis points equals 1.5%.
3Certain derivative instruments are classified as Level 3 due to a significant unobservable credit spread input into the calculation of the Credit Valuation Adjustment for the instruments.
The range of significant unobservable credit spreads is between 14-1,972bps (2023: 29-1,672bps).
4Non-material level 3 balances for these unobservable inputs.
Strategy
Shareholder
information
Climate and
sustainability report
Governance
Risk
review
Financial
review
Financial
statements
Barclays PLC 2024
Annual Report
on Form 20-F
399
Notes to the financial statements (continued)
Assets and liabilities held at fair value
The following section describes the significant unobservable inputs identified in the table above, and the sensitivity of fair value
measurement of the instruments categorised as Level 3 assets or liabilities to increases in significant unobservable inputs. Where
sensitivities are described, the inverse relationship will also generally apply.
Where reliable interrelationships can be identified between significant unobservable inputs used in fair value measurement, a
description of those interrelationships is included below.
Forwards
A price or rate that is applicable to a financial transaction that will take place in the future.
In general, a significant increase in a forward in isolation will result in a fair value increase for the contracted receiver of the underlying
(currency, bond, commodity, etc.), but the sensitivity is dependent on the specific terms of the instrument.
Credit spread
Credit spreads typically represent the difference in yield between an instrument and a benchmark security or reference rate. Credit
spreads reflect the additional yield that a market participant demands for taking on exposure to the credit risk of an instrument and
form part of the yield used in a discounted cash flow calculation.
In general, a significant increase in credit spread in isolation will result in a movement in a fair value decrease for a cash asset.
For a derivative instrument, a significant increase in credit spread in isolation can result in a fair value increase or decrease depending on
the specific terms of the instrument.
Volatility
Volatility is a measure of the variability or uncertainty in return for a given derivative underlying. It is an estimate of how much a particular
underlying instrument input or index will change in value over time. In general, volatilities are implied from observed option prices. For
unobservable options the implied volatility may reflect additional assumptions about the nature of the underlying risk, and the strike/
maturity profile of a specific contract.
In general, a significant increase in volatility in isolation will result in a fair value increase for the holder of a simple option, but the
sensitivity is dependent on the specific terms of the instrument.
There may be interrelationships between unobservable volatilities and other unobservable inputs (e.g. when equity prices fall, implied
equity volatilities generally rise) but these are generally specific to individual markets and may vary over time.
Correlation
Correlation is a measure of the relationship between the movements of two variables. Correlation can be a significant input into
valuation of derivative contracts with more than one underlying instrument. Credit correlation generally refers to the correlation
between default processes for the separate names that make up the reference pool of a CDO structure.
A significant increase in correlation in isolation can result in a fair value increase or decrease depending on the specific terms of the
instrument.
Comparable price
Comparable instrument prices are used in valuation by calculating an implied yield (or spread over a liquid benchmark) from the price of a
comparable observable instrument, then adjusting that yield (or spread) to account for relevant differences such as maturity or credit
quality. Alternatively, a price-to-price basis can be assumed between the comparable and unobservable instruments in order to
establish a value.
Loans includes a portfolio of loans extended to clients within the Group’s leveraged finance business. Leveraged finance loans are
originated where Barclays provide financing commitments to clients to facilitate strategic transactions such as leverage buyouts and
acquisitions. The sensitivity of the portfolio to unobservable inputs is judgmental reflecting their illiquid nature and the significance of
unobservable price inputs to the valuation.
In general, a significant increase in comparable price in isolation will result in an increase in the price of the unobservable instrument. For
derivatives, a change in the comparable price in isolation can result in a fair value increase or decrease depending on the specific terms
of the instrument.
Loan spread
Loan spreads typically represent the difference in yield between an instrument and a benchmark security or reference rate. Loan
spreads typically reflect credit quality, the level of comparable assets such as gilts and other factors, and form part of the yield used in a
discounted cash flow calculation.
In general, a significant increase in loan spreads in isolation will result in a fair value decrease for a loan.
Strategy
Shareholder
information
Climate and
sustainability report
Governance
Risk
review
Financial
review
Financial
statements
Barclays PLC 2024
Annual Report
on Form 20-F
400
Notes to the financial statements (continued)
Assets and liabilities held at fair value
EBITDA multiple
EBITDA multiple is the ratio of the valuation of the investment to the earnings before interest, taxes, depreciation and amortisation.
In general, a significant increase in the multiple will result in a fair value increase for an investment.
Earnings multiple
Earnings or Revenue multiple is the ratio of the valuation of the investment to the earnings or revenue. In general, a significant increase
in the multiple will result in a fair value increase for an investment.
Sensitivity analysis of valuations using unobservable inputs (Relates to Level 3 Portfolios)
2024
2023
Favourable changes
Unfavourable changes
Favourable changes
Unfavourable changes
Income
statement
Equity
Income
statement
Equity
Income
statement
Equity
Income
statement
Equity
£m
£m
£m
£m
£m
£m
£m
£m
Loans
653
43
(766)
(43)
612
2
(801)
(2)
Corporate debt
87
—
(56)
—
34
—
(22)
—
Asset backed securities
57
4
(40)
(4)
37
1
(27)
(1)
Government debt
47
—
(56)
—
31
—
(34)
—
Private equity investments
232
—
(232)
—
263
1
(263)
(1)
Interest rate derivatives
98
—
(212)
—
78
—
(158)
—
Equity derivatives
199
—
(269)
—
142
—
(226)
—
Other products1
92
—
(104)
—
89
—
(98)
—
Total
1,465
47
(1,735)
(47)
1,286
4
(1,629)
(4)
Note:
1Other products includes equity cash products, credit derivatives, foreign exchange derivatives and fund and fund linked products
The effect of stressing unobservable inputs to a range of reasonably possible alternatives, alongside considering the impact of using
alternative models, would be to increase fair values by up to £1,512m (2023: £1,290m) or to decrease fair values by up to £1,782m
(2023: £1,633m) with substantially all the potential effect impacting profit and loss. Unfavourable changes shown in the table above are
partly provided for through the capital and prudential valuation adjustment framework.
Fair value adjustments
Key balance sheet valuation adjustments are quantified below:
2024
2023
£m
£m
Exit price adjustments derived from market bid-offer spreads
(542)
(569)
Uncollateralised derivative funding
19
(4)
Derivative credit valuation adjustments
(184)
(209)
Derivative debit valuation adjustments
108
144
Exit price adjustments derived from market bid-offer spreads
The Group uses mid-market pricing where it is a market maker and has the ability to transact at, or better than, mid-price (which is the
case for certain equity, bond and vanilla derivative markets). For other financial assets and liabilities, bid-offer adjustments are recorded
to reflect the exit level for the expected close out strategy. The methodology for determining the bid-offer adjustment for a derivative
portfolio involves calculating the net risk exposure by offsetting long and short positions by strike and term in accordance with the risk
management and hedging strategy.
Bid-offer levels are generally derived from market quotes such as broker data. Less liquid instruments may not have a directly
observable bid-offer level. In such instances, an exit price adjustment may be derived from an observable bid-offer level for a
comparable liquid instrument, or determined by calibrating to derivative prices, or by scenario or historical analysis.
Exit price adjustments derived from market bid-offer spreads have decreased by £27m from £(569)m to £(542)m.
Discounting approaches for derivative instruments
Collateralised
In line with market practice, the methodology for discounting collateralised derivatives takes into account the nature and currency of
the collateral that can be posted within the relevant credit support annex (CSA). The CSA aware discounting approach recognises the
‘cheapest to deliver’ option that reflects the ability of the party posting collateral to change the currency of the collateral.
Uncollateralised
A fair value adjustment of £19m is applied to account for the impact of incorporating the cost of funding into the valuation of
uncollateralised and partially collateralised derivative portfolios and collateralised derivatives where the terms of the agreement do not
allow the rehypothecation of collateral received. The derivative funding adjustment has moved by £23m from £(4)m to £19m.
Strategy
Shareholder
information
Climate and
sustainability report
Governance
Risk
review
Financial
review
Financial
statements
Barclays PLC 2024
Annual Report
on Form 20-F
401
Notes to the financial statements (continued)
Assets and liabilities held at fair value
Derivative credit and debit valuation adjustments
Derivative credit valuation adjustments and derivative debit valuation adjustments are incorporated into derivative valuations to reflect
the impact on fair value of counterparty credit risk and Barclays’ own credit quality respectively. These adjustments are calculated for
uncollateralised and partially collateralised derivatives across all asset classes. Derivative credit valuation adjustments and derivative
debit valuation adjustments are calculated using estimates of exposure at default, probability of default and recovery rates, at a
counterparty level. Counterparties include (but are not limited to) corporates, Sovereigns and Sovereign agencies and Supranationals.
Exposure at default is generally estimated through the simulation of underlying risk factors through approximating with a more vanilla
structure, or by using current or scenario-based mark to market as an estimate of future exposure.
Probability of default and recovery rate information is generally sourced from the CDS markets. Where this information is not available,
or considered unreliable, alternative approaches are taken based on mapping internal counterparty ratings onto historical or market-
based default and recovery information.
Derivative credit valuation adjustments decreased by £25mfrom £(209)m to £(184)m as a result of a tightening in input counterparty
credit spreads. Derivative debit valuation adjustments decreased by £36m from £144m to £108m as a result of a tightening in input
own credit spreads.
Correlation between counterparty credit and underlying derivative risk factors, termed ‘wrong-way,’ or ‘right-way’ risk, is not
systematically incorporated into the derivative credit valuation adjustments calculation but is adjusted where the underlying exposure is
directly related to the counterparty.
Barclays continues to monitor market practices and activity to ensure the approach to uncollateralised derivative valuation remains
appropriate.
Portfolio exemptions
The Group uses the portfolio exemption in IFRS 13 Fair Value Measurement to measure the fair value of groups of financial assets and
liabilities. Financial instruments are measured using the price that would be received to sell a net long position (i.e. an asset) for a
particular risk exposure or to transfer a net short position (i.e. a liability) for a particular risk exposure in an orderly transaction between
market participants at the balance sheet date under current market conditions. Accordingly, the Group measures the fair value of the
group of financial assets and liabilities consistently with how market participants would price the net risk exposure at the measurement
date.
Unrecognised gains as a result of the use of valuation models using unobservable inputs
The amount that has yet to be recognised in income that relates to the difference between the transaction price (the fair value at initial
recognition) and the amount that would have arisen had valuation models using unobservable inputs been used on initial recognition,
less amounts subsequently recognised, is £273m (2023: £205m) for financial instruments measured at fair value and £173m (2023:
£192m) for financial instruments carried at amortised cost. There are additions and FX revaluation of £173m (2023: £136m), and
amortisation and releases of £105m (2023: £57m) for financial instruments measured at fair value and additions of £nil (2023: £nil) and
amortisation and releases of £19m (2023:£24m) for financial instruments measured at amortised cost.
Third-party credit enhancements
Structured and brokered certificates of deposit issued by Barclays are insured up to $250,000 per depositor by the Federal Deposit
Insurance Corporation (FDIC) in the US. The FDIC is funded by premiums that Barclays and other banks pay for deposit insurance
coverage. The carrying value of these issued certificates of deposit that are designated under the IFRS 9 fair value option includes this
third-party-credit enhancement. The on-balance sheet value of these brokered certificates of deposit amounted to £4,844m
(2023: £5,162m).
Strategy
Shareholder
information
Climate and
sustainability report
Governance
Risk
review
Financial
review
Financial
statements
Barclays PLC 2024
Annual Report
on Form 20-F
402
Notes to the financial statements (continued)
Assets and liabilities held at fair value
Comparison of carrying amounts and fair values for assets and liabilities not held at fair value
The following table summarises the fair value of financial assets and liabilities measured at amortised cost on the Group’s balance
sheet:
2024
2023
Carrying
amount
Fair value
Level 1
Level 2
Level 3
Carrying
amount
Fair value
Level 1
Level 2
Level 3
£m
£m
£m
£m
£m
£m
£m
£m
£m
£m
Financial assets
Debt securities at amortised cost
68,210
67,354
19,341
46,429
1,584
56,749
55,437
13,976
39,014
2,447
Loans and advances at amortised cost
346,273
343,016
6,977
73,606
262,433
342,747
334,706
5,854
80,533
248,319
Reverse repurchase agreements and
other similar secured lending
4,734
4,734
—
4,734
—
2,594
2,594
—
2,594
—
Assets included in disposal groups
classified as held for sale
9,544
9,628
—
3,520
6,108
3,855
3,855
—
3,855
—
Financial liabilities
Deposits at amortised cost
(560,663)
(560,393)
(410,955)
(146,607)
(2,831)
(538,789)
(538,502)
(382,345)
(150,757)
(5,400)
Repurchase agreements and other similar
secured borrowing
(39,415)
(39,415)
—
(39,415)
—
(41,601)
(41,601)
—
(41,601)
—
Debt securities in issue
(92,402)
(94,463)
—
(92,066)
(2,397)
(96,825)
(98,123)
—
(95,999)
(2,124)
Subordinated liabilities
(11,921)
(12,434)
—
(11,697)
(737)
(10,494)
(10,803)
—
(10,608)
(195)
Liabilities included in disposal groups
classified as held for sale
(3,647)
(3,647)
—
(3,647)
—
(3,077)
(3,077)
—
(3,077)
—
The fair value is an estimate of the price that would be received to sell an asset or paid to transfer a liability in an orderly transaction
between market participants at the measurement date. As a wide range of valuation techniques are available, it may not be appropriate
to directly compare this fair value information to independent market sources or other financial institutions. Different valuation
methodologies and assumptions can have a significant impact on fair values which are based on unobservable inputs.
Financial assets
Debt Securities at amortised cost
Debt securities at amortised cost are valued using observable market prices sourced from broker quotes, inter-dealer prices or other
reliable pricing sources. Prices for actively traded bonds are considered observable. Where market data for the underlying bond is
unavailable, a number of proxy/extrapolation techniques are employed to determine the appropriate fair value.
Loans and advances at amortised cost
The fair value of loans and advances, for the purpose of this disclosure, is derived from discounting expected cash flows in a way that
reflects the current market price for lending to issuers of similar credit quality. Where market data or credit information on the
underlying borrowers is unavailable, a number of proxy/extrapolation techniques are employed to determine the appropriate discount
rates.
Reverse repurchase agreements and other similar secured borrowing
The fair value of reverse repurchase agreements approximates carrying amount as these balances are generally short dated and fully
collateralised.
Financial liabilities
Deposits at amortised cost
In many cases, the fair value disclosed approximates carrying value because the instruments are short-term in nature or have interest
rates that reprice frequently, such as customer accounts and other deposits and short-term debt securities.
The fair value for deposits with longer-term maturities, mainly time deposits, are estimated using discounted cash flows applying either
market rates or current rates for deposits of similar remaining maturities.
Repurchase agreements and other similar secured borrowing
The fair value of repurchase agreements approximates carrying amounts as these balances are generally short dated.
Debt securities in issue
Fair values of other debt securities in issue are based on quoted prices where available or, where the instruments are short dated,
carrying amount approximates fair value.
Subordinated liabilities
Fair values for dated and undated convertible and non-convertible loan capital are based on quoted market rates for the issuer
concerned or issuers with similar terms and conditions.
Assets & liabilities included in disposal groups classified as held for sale.
The fair value for the purposes of this disclosure has been prepared in accordance with the products held for sale, and valuation
techniques used to determine the expected sales price of these assets and liabilities that will be achieved when the disposal group is
sold.
Strategy
Shareholder
information
Climate and
sustainability report
Governance
Risk
review
Financial
review
Financial
statements
Barclays PLC 2024
Annual Report
on Form 20-F
403
Notes to the financial statements (continued)
Assets and liabilities held at fair value
18Offsetting financial assets and financial liabilities
The Group reports financial assets and financial liabilities on a net basis on the balance sheet only if there is a legally enforceable right to
set-off the recognised amounts and there is intention to settle on a net basis, or to realise the asset and settle the liability
simultaneously. The following table shows the impact of netting arrangements on:
▪All financial assets and liabilities that are reported net on the balance sheet
▪All derivative financial instruments and reverse repurchase and repurchase agreements and other similar secured lending and
borrowing agreements that are subject to enforceable master netting arrangements or similar agreements, but do not qualify for
balance sheet netting.
The ‘Net amounts’ presented are not intended to represent the Group’s actual exposure to credit risk, as a variety of credit mitigation
strategies are employed in addition to netting and collateral arrangements.
Amounts subject to enforceable netting arrangements
Amounts not
subject to
enforceable
netting
arrangements3
Balance sheet
total4
Effects of offsetting on-balance sheet
Related amounts not offset
Gross amounts
Amounts
offset1
Net amounts
reported on
the balance
sheet
Financial
instruments
Financial
collateral2
Net amount
£m
£m
£m
£m
£m
£m
£m
£m
As at 31 December 2024
Derivative financial assets
334,885
(47,207)
287,678
(230,434)
(43,270)
13,974
5,852
293,530
Reverse repurchase agreements and
other similar secured lending5
701,482
(556,373)
145,109
—
(144,670)
439
1,398
146,507
Total assets
1,036,367
(603,580)
432,787
(230,434)
(187,940)
14,413
7,250
440,037
Derivative financial liabilities
(318,897)
46,040
(272,857)
230,434
27,677
(14,746)
(6,558)
(279,415)
Repurchase agreements and other
similar secured borrowing5
(731,622)
556,373
(175,249)
—
175,249
—
(19,772)
(195,021)
Total liabilities
(1,050,519)
602,413
(448,106)
230,434
202,926
(14,746)
(26,330)
(474,436)
As at 31 December 2023
Derivative financial assets
307,429
(55,781)
251,648
(198,809)
(41,247)
11,592
5,188
256,836
Reverse repurchase agreements and
other similar secured lending5
677,175
(527,864)
149,311
—
(148,888)
423
2,414
151,725
Total assets
984,604
(583,645)
400,959
(198,809)
(190,135)
12,015
7,602
408,561
Derivative financial liabilities
(297,449)
54,241
(243,208)
198,809
27,978
(16,421)
(6,836)
(250,044)
Repurchase agreements and other
similar secured borrowing5
(731,200)
527,864
(203,336)
—
203,336
—
(23,980)
(227,316)
Total liabilities
(1,028,649)
582,105
(446,544)
198,809
231,314
(16,421)
(30,816)
(477,360)
Notes:
1Amounts offset for derivative financial assets additionally includes cash collateral netted of £5,126m (2023: £7,527m). Amounts offset for derivative financial liabilities additionally
includes cash collateral netted of £6,293m (2023: £9,067m). Settlements assets and liabilities have been offset amounting to £25,133m (2023: £29,297m).
2Financial collateral of £43,270m (2023: £41,247m) was received in respect of derivative assets, including £30,637m (2023: £31,211m) of cash collateral and £12,633m (2023: £10,036m)
of non-cash collateral. Financial collateral of £27,677m (2023: £27,978m) was placed in respect of derivative liabilities, including £23,126m (2023: £24,260m) of cash collateral and
£4,551m (2023: £3,718m) of non-cash collateral. The collateral amounts are limited to net balance sheet exposure so as to not include overcollateralisation.
3This column includes contractual rights of set-off that are subject to uncertainty under the laws of the relevant jurisdiction.
4The balance sheet total is the sum of ‘Net amounts reported on the balance sheet’ that are subject to enforceable netting arrangements and ‘Amounts not subject to enforceable
netting arrangements’.
5Reverse repurchase agreements and other similar secured lending of £146,507m (2023: £151,725m) is split by fair value £141,773m (2023: £149,131m) and amortised cost £4,734m
(2023: £2,594m). Repurchase agreements and other similar secured borrowing of £195,021m (2023: £227,316m) is split by fair value £155,606m (2023: £185,715m) and amortised cost
£39,415m (2023: £41,601m).
Derivative assets and liabilities
The ‘Financial instruments’ column identifies financial assets and liabilities that are subject to set-off under netting agreements, such as
the ISDA Master Agreement or derivative exchange or clearing counterparty agreements, whereby all outstanding transactions with
the same counterparty can be offset and close-out netting applied across all outstanding transactions covered by the agreements if an
event of default or other predetermined events occur.
Financial collateral refers to cash and non-cash collateral obtained, typically daily or weekly, to cover the net exposure between
counterparties by enabling the collateral to be realised in an event of default or if other predetermined events occur.
Repurchase and reverse repurchase agreements and other similar secured lending and borrowing
The ‘Financial instruments’ column identifies financial assets and liabilities that are subject to set-off under netting agreements, such as
Global Master Repurchase Agreements and Global Master Securities Lending Agreements, whereby all outstanding transactions with
the same counterparty can be offset and close-out netting applied across all outstanding transactions covered by the agreements if an
event of default or other predetermined events occur.
Financial collateral typically comprises highly liquid securities which are legally transferred and can be liquidated in the event of
counterparty default.
These offsetting and collateral arrangements and other credit risk mitigation strategies used by the Group are further explained in the
Credit risk management section.
Strategy
Shareholder
information
Climate and
sustainability report
Governance
Risk
review
Financial
review
Financial
statements
Barclays PLC 2024
Annual Report
on Form 20-F
404
Notes to the financial statements (continued)
Assets at amortised cost and other investments
Assets at amortised cost and other investments
The notes included in this section focus on the Group’s property, plant and equipment, leases and goodwill and intangible assets.
Details regarding the Group’s liquidity and capital position can be found in the Treasury and Capital risk section.
19Property, plant and equipment
Accounting for property, plant and equipment
Property, plant and equipment is stated at cost, which includes direct and incremental acquisition costs less accumulated depreciation
and provisions for impairment, if required. Subsequent costs are capitalised if these result in enhancement of the asset.
Depreciation is provided on the depreciable amount of items of property, plant and equipment on a straight-line basis over their estimated useful
economic lives. Depreciation rates, methods and the residual values underlying the calculation of depreciation of items of property, plant and equipment
are kept under review to take account of any change in circumstances including consideration on future Climate and Sustainability investments.
The Group uses the following annual rates in calculating depreciation:
Annual rates in calculating depreciation
Depreciation rate
Freehold land
Not depreciated
Freehold buildings
2-3.3%
Leasehold property
Over the remaining life of the lease
Costs of adaptation of freehold and leasehold property
6-10%
Equipment installed in freehold and leasehold property
6-10%
Computers and similar equipment
17-33%
Fixtures and fittings and other equipment
9-20%
Costs of adaptation and installed equipment are depreciated over the shorter of the life of the lease or the depreciation rates noted in
the table above.
Investment property
The Group initially recognises investment property at cost, and subsequently at fair value at each balance sheet date, reflecting market
conditions at the reporting date. Gains and losses on remeasurement are included in the income statement.
Investment
property
Property
Equipment
Right of use
assets1
Total
£m
£m
£m
£m
£m
Cost
As at 1 January 2024
2
3,578
2,347
2,002
7,929
Additions
9
165
186
48
408
Disposals2
(2)
(140)
(273)
(96)
(511)
Exchange and other movements3
—
25
(15)
261
271
As at 31 December 2024
9
3,628
2,245
2,215
8,097
Accumulated depreciation and impairment
As at 1 January 2024
—
(1,778)
(1,563)
(1,171)
(4,512)
Depreciation charge
—
(143)
(250)
(139)
(532)
Impairment
—
(1)
—
(14)
(15)
Disposals2
—
131
258
94
483
Exchange and other movements
—
(7)
(2)
92
83
As at 31 December 2024
—
(1,798)
(1,557)
(1,138)
(4,493)
Net book value
9
1,830
688
1,077
3,604
Cost
As at 1 January 2023
5
3,585
3,018
1,950
8,558
Additions
—
112
297
20
429
Disposals
(3)
(24)
(954)
(50)
(1,031)
Exchange and other movements
—
(95)
(14)
82
(27)
As at 31 December 2023
2
3,578
2,347
2,002
7,929
Accumulated depreciation and impairment
As at 1 January 2023
—
(1,642)
(2,244)
(1,056)
(4,942)
Depreciation charge
—
(163)
(256)
(157)
(576)
Impairment
—
(33)
—
(27)
(60)
Disposals
—
10
944
48
1,002
Exchange and other movements
—
50
(7)
21
64
As at 31 December 2023
—
(1,778)
(1,563)
(1,171)
(4,512)
Net book value
2
1,800
784
831
3,417
Notes:
1Right of use (ROU) asset balances relate to property leases under IFRS 16. Refer to Note 20 for further details.
2Disposals primarily pertain to fully depreciated assets which are not in use.
3Exchange and other movements in Right of use (ROU) asset balances include modification related to a lease extended by ~91 years
Strategy
Shareholder
information
Climate and
sustainability report
Governance
Risk
review
Financial
review
Financial
statements
Barclays PLC 2024
Annual Report
on Form 20-F
405
Notes to the financial statements (continued)
Assets at amortised cost and other investments
Property rentals of £11m (2023: £12m) have been included in other income.
The fair value of investment property is determined by reference to current market prices for similar properties, adjusted as necessary
for condition and location, or by reference to recent transactions updated to reflect current economic conditions. Discounted cash
flow techniques may be employed to calculate fair value where there have been no recent transactions, using current external market
inputs such as market rents and interest rates. Valuations are carried out by management with the support of appropriately qualified
independent valuers.
20Leases
Accounting for leases
When the Group is the lessee, it is required to recognise both:
▪a lease liability, measured at the present value of remaining cash flows on the lease
▪a right of use (ROU) asset, measured at the amount of the initial measurement of the lease liability, plus any lease payments made
prior to commencement date, initial direct costs, and estimated costs of restoring the underlying asset to the condition required by
the lease, less any lease incentives received.
Subsequently the lease liability will increase for the accrual of interest, resulting in a constant rate of return throughout the life of the
lease, and reduce when payments are made. The right of use asset will amortise to the income statement over the life of the lease.
When the lease liability is remeasured, a corresponding adjustment is made to the carrying amount of the ROU asset, or is recorded in
the income statement if the carrying amount of the ROU asset has been reduced to nil.
On the balance sheet, the ROU assets are included within property, plant and equipment and the lease liabilities are included within
other liabilities.
The Group applies the recognition exemption in IFRS 16 for leases with a term not exceeding 12 months. For these leases the lease
payments are recognised as an expense on a straight-line basis over the lease term unless another systematic basis is more
appropriate.
When the Group is the lessor, the lease must be classified as either a finance lease or an operating lease. A finance lease is a lease which
confers substantially all the risks and rewards of the leased assets on the lessee. An operating lease is a lease where substantially all of
the risks and rewards of the leased asset remain with the lessor.
As a lessor
Finance lease receivables are included within loans and advances at amortised cost.
The following table sets out a maturity analysis of lease receivables, showing the lease payments to be received after the reporting
date.
2024
2023
Gross
investment in
finance lease
receivables
Future finance
income
Present value
of minimum
lease
payments
receivable
Unguaranteed
residual
values
Gross
investment in
finance lease
receivables
Future finance
income
Present value
of minimum
lease
payments
receivable
Unguaranteed
residual
values
£m
£m
£m
£m
£m
£m
£m
£m
Not more than one year
7
(1)
6
—
3
—
3
—
One to two years
3
(1)
2
—
2
—
2
—
Two to three years
—
—
—
—
—
—
—
—
Three to four years
—
—
—
—
—
—
—
—
Four to five years
—
—
—
—
—
—
—
—
Over five years
—
—
—
—
—
—
—
—
Total
10
(2)
8
—
5
—
5
—
Barclays Asset Finance provided leasing and other asset finance facilities across a broad range of asset types to business and individual
customers. There is no significant impairment allowance for finance lease receivables in current and previous year.
The Group does not have any material operating leases as a lessor.
Finance lease income
Finance lease income is included within interest income. The following table shows amounts recognised in the income statement
during the year.
2024
2023
£m
£m
Finance income from net investment in lease
2
1
Profit on sales
—
—
Strategy
Shareholder
information
Climate and
sustainability report
Governance
Risk
review
Financial
review
Financial
statements
Barclays PLC 2024
Annual Report
on Form 20-F
406
Notes to the financial statements (continued)
Assets at amortised cost and other investments
As a Lessee
The Group leases various offices, branches and other premises under non-cancellable lease arrangements to meet its operational
business requirements. In some instances, Barclays will sublease property to third parties when it is no longer needed to meet business
requirements. Currently, Barclays does not have any material subleasing arrangements.
ROU asset balances relate to property leases only. Refer to Note 19 for the carrying amount of ROU assets.
The total expenses recognised during the year for short-term leases were £1m (2023: £2m). The portfolio of short-term leases to
which Barclays is exposed at the end of the year is not dissimilar to the expenses recognised in the year.
Lease liabilities
2024
2023
£m
£m
As at 1 January
971
1,216
Interest expense
71
54
New leases
45
19
Disposals
(18)
(11)
Cash payments1
(204)
(406)
Exchange and other movements2
340
99
As at 31 December (see Note 22)
1,205
971
Notes:
1Cash payments in 2023 include a one time lease liability payment of £182m related to structural cost action in relation to the real estate review.
2Exchange and other movements include modification related to a lease extended by ~91 years.
The table below sets out a maturity analysis of undiscounted lease liabilities, showing the lease payments after the reporting date.
Undiscounted lease liabilities maturity analysis
2024
2023
£m
£m
Not more than one year
195
174
One to two years
173
169
Two to three years
149
144
Three to four years
126
120
Four to five years
113
97
Five to ten years
395
338
Greater than ten years
3,754
282
Total undiscounted lease liabilities as at 31 December
4,905
1,324
During the year, Barclays had a lease modification for property "New York, 745 7th Avenue" wherein there is an extension of lease term
by ~91 years, resulting in increase in the above stated undiscounted lease liabilities.
In addition to the cash flows identified above, the Group is exposed to:
▪Variable lease payments: This variability will typically arise from either inflation index instruments or market-based pricing
adjustments. Currently, Barclays has 238 (2023: 517) leases out of the total 631 (2023: 756) leases which have variable lease payment
terms based on market-based pricing adjustments. Of the gross cash flows identified above £4,634m (2023: £1,062m) is attributable
to leases with some degree of variability predominantly linked to market-based pricing adjustments.
▪Extension and termination options: The table above represents Barclays' best estimate of future cash outflows for leases, including
assumptions regarding the exercising of contractual extension and termination options. The above gross cash flows have been
reduced by £10m (2023: £441m) for leases where Barclays is highly expected to exercise an early termination option. The above
gross cash flows have been increased by £3,581m, of which £1,872m (2023: nil) for leases where Barclays is expected to exercise an
extension option.
In2024, the Group does not have any sale and leaseback transaction (2023: nil).
The Group does not have any restrictions or covenants imposed by the lessor on its property leases which restrict its businesses.
Strategy
Shareholder
information
Climate and
sustainability report
Governance
Risk
review
Financial
review
Financial
statements
Barclays PLC 2024
Annual Report
on Form 20-F
407
Notes to the financial statements (continued)
Assets at amortised cost and other investments
21 Goodwill and intangible assets
Accounting for goodwill and intangible assets
Goodwill
Goodwill arising on the acquisition of subsidiaries represents the excess of the fair value of the purchase consideration over the fair
value of the Group’s share of the assets acquired and the liabilities and contingent liabilities assumed on the date of the acquisition.
Goodwill is reviewed annually for impairment, or more frequently when there are indications that impairment may have occurred. The
test involves comparing the carrying value of a cash generating unit (CGU) including goodwill with the present value of the pre-tax cash
flows, discounted at a rate of interest that reflects the inherent risks, of the CGU to which the goodwill relates, or the CGU's fair value if
this is higher.
Intangible assets
Intangible assets are initially recognised when they are separable or arise from contractual or other legal rights, the cost can be
measured reliably and, in the case of intangible assets not acquired in a business combination, where it is probable that future economic
benefits attributable to the assets will flow from their use.
For internally generated intangible assets, only costs incurred during the development phase are capitalised. Expenditure in the
research phase is expensed when it is incurred.
Intangible assets are stated at cost (which is, in the case of assets acquired in a business combination, the acquisition date fair value)
less accumulated amortisation and impairment, if any, and are amortised over their useful lives in a manner that reflects the pattern to
which they contribute to future cash flows, generally using the amortisation periods set out below:
Annual rates in calculating amortisation
Amortisation period
Goodwill
Not amortised
Internally generated software1
12 months to 6 years
Other software
12 months to 6 years
Core Deposit
12 months to 5 years
Brand
12 months to 10 years
Customer lists
12 months to 25 years
Licences and other
12 months to 25 years
Note:
1Exceptions to the above rate relate to useful lives of certain core banking platforms that are assessed individually and, if appropriate, amortised over longer periods ranging from 10
to 15 years.
Intangible assets are reviewed for impairment when there are indications that impairment may have occurred. Intangible assets not yet
available for use are reviewed annually for impairment.
Strategy
Shareholder
information
Climate and
sustainability report
Governance
Risk
review
Financial
review
Financial
statements
Barclays PLC 2024
Annual Report
on Form 20-F
408
Notes to the financial statements (continued)
Assets at amortised cost and other investments
Intangible assets
Goodwill
Internally
generated
software
Other
software
Core deposits
Brand
Customer
lists
Licences
and other
Total
£m
£m
£m
£m
£m
£m
£m
£m
2024
Cost
As at 1 January 2024
5,035
7,190
717
—
7
1,569
156
14,674
Additions
263
1,225
12
17
—
66
66
1,649
Disposals1
—
(1,156)
(58)
—
—
(90)
(6)
(1,310)
Exchange and other movements2
10
21
—
—
—
(315)
3
(281)
As at 31 December 2024
5,308
7,280
671
17
7
1,230
219
14,732
Accumulated amortisation and
impairment
As at 1 January 2024
(858)
(3,965)
(478)
—
(1)
(1,438)
(140)
(6,880)
Disposals1
—
1,156
58
—
—
90
6
1,310
Amortisation charge
—
(1,066)
(67)
(1)
(1)
(28)
(5)
(1,168)
Impairment charge
—
(19)
—
—
—
—
—
(19)
Exchange and other movements2
—
(3)
1
—
—
303
(1)
300
As at 31 December 2024
(858)
(3,897)
(486)
(1)
(2)
(1,073)
(140)
(6,457)
Net book value
4,450
3,383
185
16
5
157
79
8,275
2023
As at 1 January 2023
4,737
7,627
620
—
—
1,654
984
15,622
Additions
311
1,203
164
—
7
—
4
1,689
Disposals1
—
(1,546)
19
—
—
—
(2)
(1,529)
Exchange and other movements3
(13)
(94)
(86)
—
—
(85)
(830)
(1,108)
As at 31 December 2023
5,035
7,190
717
—
7
1,569
156
14,674
Accumulated amortisation and
impairment
As at 1 January 2023
(825)
(4,195)
(385)
—
—
(1,475)
(503)
(7,383)
Disposals1
—
1,546
(26)
—
—
—
2
1,522
Amortisation charge
—
(1,050)
(69)
—
(1)
(39)
(49)
(1,208)
Impairment charge
(33)
(309)
(3)
—
—
—
—
(345)
Exchange and other movements3
—
43
5
—
—
76
410
534
As at 31 December 2023
(858)
(3,965)
(478)
—
(1)
(1,438)
(140)
(6,880)
Net book value
4,177
3,225
239
—
6
131
16
7,794
Notes:
1Disposals pertain to fully amortised assets which are not in use.
2Customer list with cost of £338m and accumulated depreciation of £326m has moved to assets held for sale.
3In 2023, the Group reclassified assets with a total net book value of £412m recognised on balance sheet relating to sign-on bonus payments made to co-brand credit card partners from
Intangible Assets (Licenses and other) to Other Assets. This change in classification has been made to more appropriately reflect the nature of the assets.
In 2024, Goodwill has increased by £263m due to the acquisition of Luxury Cards US. In 2023, the German consumer finance business
moved to assets held for sale during the year and this resulted in an impairment of Intangible assets of £32m.
Goodwill
Goodwill and Intangible assets are allocated to business operations according to business segments as follows:
2024
2023
Goodwill
Intangibles
Total
Goodwill
Intangibles1
Total
£m
£m
£m
£m
£m
£m
Barclays UK
3,872
1,042
4,914
3,872
1,096
4,968
Barclays UK Corporate Bank
—
59
59
—
310
310
Barclays UK Private Bank and Wealth
Management
95
251
346
95
232
327
Barclays US Consumer Bank
444
513
957
172
649
821
Barclays Investment Bank
—
1,902
1,902
0
1,274
1,274
Head Office
39
58
97
38
56
94
Total
4,450
3,825
8,275
4,177
3,617
7,794
Note:
1The 2023 comparatives are re-presented to align to the segmental reporting under the new operating divisions announced as part of the 20 February 2024 Investor Update. The
Goodwill in Barclays UK Private Bank and Wealth Management and Barclays US Consumer Bank was previously disclosed under Consumer Cards and Payments.
Strategy
Shareholder
information
Climate and
sustainability report
Governance
Risk
review
Financial
review
Financial
statements
Barclays PLC 2024
Annual Report
on Form 20-F
409
Notes to the financial statements (continued)
Assets at amortised cost and other investments
Critical accounting estimates and judgements
Goodwill
Testing goodwill for impairment involves a significant amount of judgement. Goodwill is allocated to CGUs for the purpose of
impairment testing. The review of goodwill for impairment involves calculating a value in use (VIU) valuation which is compared to the
carrying value of a CGU associated with the goodwill to determine whether any impairment has occurred. This includes the
identification of independent CGUs across the organisation and the allocation of goodwill to those CGUs.
The calculation of a value in use contains a high degree of uncertainty in estimating the future cash flows and the rates used to discount
them. Key judgements include determining the carrying value of the CGU, the cash flows and discount rates used in the calculation.
▪The cash flow forecasts used by management involve judgement and are based upon a view of the prospects of the business and
market conditions at the point in time the assessment is prepared, including the potential effect of climate change. The estimation of
cash flows is sensitive to the periods for which detailed forecasts are available and to assumptions regarding long-term sustainable
cash flows.
▪The discount rates applied to the future cash flows also involve judgement. The discount rates used are compared to market
participants to ensure that they are appropriate and based on an estimated cost of equity for each CGU.
▪The choice of a terminal growth rate used to determine the present value of the future cash flows of the CGUs is also a judgement
that can impact the outcome of the assessment. The terminal growth rate and discount rates used may vary due to external market
rates and economic conditions that are beyond management’s control, including the potential effect of climate change.
Further details of some of the key judgements are set out below.
2024 impairment review
The 2024 impairment review was performed during Q42024, with the approach and analysis set out below.
Determining the carrying value of CGUs
The carrying value for each CGU is the sum of the tangible equity, goodwill and intangible asset balances associated with that CGU.
The Group manages the assets and liabilities of its CGUs with reference to the tangible equity of the respective businesses. That
tangible equity is derived from the level of risk weighted assets (RWAs) and capital required to be deployed in the CGU and therefore
reflects its relative risk, as well as the level of capital that management consider a market participant would be required to hold and
retain to support business growth.
Goodwill is initially allocated to CGUs or groups of CGUs that are expected to benefit from the synergies of the acquisition that
generated it. Goodwill is only reallocated if there is a change in its use or when reporting structures are altered in a way that changes the
composition of one or more cash generating units to which goodwill has been allocated. The CGUs have been aligned to the changes in
business operating segments announced in the 20 February 2024 Investor Update and the 2023 comparatives represented.
Cash flows
The five-year cash flows used in the calculation are based on the formally agreed medium-term plans approved by the Board. These are
prepared using macroeconomic assumptions which management consider reasonable and supportable, and reflect business agreed
initiatives for the forecast period. The macroeconomic assumptions underpinning the medium-term plan were determined during 2024
and management has considered whether there are subsequent significant changes in those assumptions which would adversely
impact the results of the impairment review.
As required by IAS 36, estimates of future cash flows exclude cash inflows or outflows that are expected to arise from restructuring
initiatives where a constructive obligation to carry out the plan does not yet exist.
In line with prior year treatment, the Education, Social Housing and Local Authority (ESHLA) portfolio has been excluded from the
Business Banking CGU cash flows. This is a legacy loan portfolio which was previously within the Non-Core bank and was not part of the
business to which the goodwill relates. As such, the cash flows relating to this portfolio have been excluded from the Business Banking
VIU calculation.
Discount rates
IAS 36 requires that the discount rate used in a value in use calculation reflects the pre-tax rate an investor would require if they were to
choose an investment that would generate similar cash flows to those that the entity expects to generate from the asset. In
determining the discount rate, management identified the cost of equity associated with market participants that closely resemble the
Group's CGUs. The cost of equity has been used as the discount rate in the impairment assessment and applied to the post-tax cash
flows of the CGU. This post-tax method incorporates the impact of changing tax rates on the cash flows and is expected to produce
the same VIU result as a pre-tax method adjusted for varying tax rates. Using the resultant VIU, the equivalent pre-tax discount rate has
been calculated. The cost of equity rate used for all CGUs in this year’s calculation has increased driven by a rise in the risk free rate as
measured by the 30 year gilt rate and an increase in the observed market return. The range of equivalent pre-tax discount rates
applicable across the CGUs range from 14.7% to 19.2% (2023: 14.7% to 18.5%).
Terminal growth rate
The terminal growth rate is used to estimate the effect of projecting cash flows to the end of an asset’s useful economic life. It is
management’s judgement that the cash flows associated with the CGUs will grow in line with the major economies in which the Group
operates. Inflation rates are used as an approximation of future growth rates and form the basis of the terminal growth rates applied.
The terminal growth rate used is 2.0% (2023: 2.0%).
Strategy
Shareholder
information
Climate and
sustainability report
Governance
Risk
review
Financial
review
Financial
statements
Barclays PLC 2024
Annual Report
on Form 20-F
410
Notes to the financial statements (continued)
Assets at amortised cost and other investments
Outcome of goodwill and intangibles review
The Personal Banking and Business Banking CGUs carry the majority of the Group’s goodwill balance, predominantly as a consequence
of the Woolwich acquisition. The goodwill within Personal Banking was £3,064m (2023: £3,064m), of which £2,501m (2023: £2,501m)
was attributable to Woolwich, and within Business Banking was £629m (2023: £629m), fully attributable to Woolwich.
The largest portion of the Group's intangible assets sits within the Barclays Investment Bank CGU, with an allocation of £1,902m
(2023: £1,274m).
The recoverable amount for both Personal Banking and Business Banking have decreased in comparison to the 2023 impairment
review, reflective of changes in the interest rate and macroeconomic outlook.
Based on management's plans and assumptions the value in use exceeds the carrying value of the CGUs and no impairment has been
indicated in 2024. In 2023, an impairment of £33m of goodwill and £257m of intangible assets was identified and recognised for the
year, fully impairing the goodwill and intangibles of the Merchant Acquiring CGU.
The outcome of the impairment review for Personal Banking, Business Banking, Barclaycard Consumer UK and Barclays US Consumer
Bank are set out below:
Cash generating unit
Tangible equity
Goodwill
Intangibles
Carrying value
Value in use
Value in use
exceeding carrying
value 2024
Value in use
exceeding carrying
value 2023
£m
£m
£m
£m
£m
£m
£m
Personal Banking
7,702
3,064
691
11,457
13,107
1,650
2,361
Business Banking
1,940
629
199
2,768
5,965
3,197
3,286
Barclaycard Consumer UK
1,891
179
142
2,212
2,487
275
26
Barclays US Consumer Bank1
2,763
415
517
3,695
4,175
480
1,175
Total
14,296
4,287
1,549
20,132
25,734
5,602
6,848
Note:
1The 2023 comparatives are represented to align to the segmental reporting under the new operating divisions announced as part of the 20 February 2024 Investor Update.
All CGUs with exception of Barclays UK Corporate Bank and Barclaycard Consumer UK have seen a reduction in value in use in the period
which is mainly attributable to the increase in the discount rates.
Sensitivity of key judgements
The CGUs are sensitive to possible adverse changes in the key assumptions that support the recoverable amount:
Cash flows: The medium-term plans used to determine the cash flows used in the VIU calculation rely on macroeconomic forecasts,
including interest rates, GDP and unemployment, and forecast levels of market and client activity. Interest rate assumptions impact
planned cash flows from both customer income and structural hedge contributions and therefore cash flow expectations are highly
sensitive to movements in the yield curve. The cash flows also contain assumptions with regard to the prudential and financial conduct
regulatory environment which may be subject to change. Given the current level of economic uncertainty, a 10% reduction in cash flows
has been provided to show the sensitivity of the outcome to a change in these key assumptions.
Discount rate: The discount rate should reflect the market risk-free rate adjusted for the inherent risks of the business it is applied to.
Management have identified discount rates for comparable businesses and consider these to be a reasonable estimate of a suitable
market rate for the profile of the business unit being tested. The risk that these discount rates may not be appropriate is quantified below
and shows the impact of a 100bps change in the discount rate.
Terminal growth rate: The terminal growth rate is used to estimate the cash flows into perpetuity based on the expected longevity of the
CGU's businesses. The terminal growth rate is sensitive to uncertainties in the macroeconomic environment. The risk that using inflation
data may not be appropriate for its determination is quantified below and shows the impact of 100bps change in the terminal growth rate.
Allocated capital rate: Tangible equity is allocated based on the level of risk weighted assets (RWAs) and capital required to be deployed in
the CGU which is dependent on the relative risk of businesses. The capital ratio used in determining the level of tangible equity allocated to
the CGU and its capital cash flows could move over time. The impact of a 50bps increase in capital ratio is quantified below.
The sensitivity of the value in use to key judgements in the calculations for certain CGUs holding goodwill balances is set out below:
Cash generating unit
Carrying
value
Value in
use
Value in
use
exceeding
carrying
value
Discount
rate
Terminal
growth
rate
Reduction in headroom
Change required to reduce headroom to zero
100 bps
increase
in the
discount
rate
100 bps
decrease
in terminal
growth
rate
50 bps
increase to
allocated
capital rate
10%
reduction in
forecasted
cash flows
Discount
rate
Terminal
growth
rate
Allocated
capital
rate
Cash
flows
£m
£m
£m
%
%
£m
£m
£m
£m
%
%
%
%
Personal Banking
11,457
13,107
1,650
19.2
2.0
(1,106)
(759)
(352)
(1,513)
1.6
(2.4)
2.3
(10.9)
Barclaycard
Consumer UK
2,212
2,487
275
18.1
2.0
(220)
(148)
(79)
(279)
1.3
(2.0)
1.7
(9.8)
Barclays US
Consumer Bank
3,695
4,175
480
17.0
2.0
(531)
(402)
(234)
(657)
0.9
(1.2)
1.0
(7.3)
Total
17,364
19,769
2,405
Strategy
Shareholder
information
Climate and
sustainability report
Governance
Risk
review
Financial
review
Financial
statements
Barclays PLC 2024
Annual Report
on Form 20-F
411
Notes to the financial statements (continued)
Accruals, provisions, contingent liabilities and legal proceedings
Accruals, provisions, contingent liabilities and legal proceedings
The notes included in this section focus on the Group’s accruals, provisions and contingent liabilities. Provisions are recognised for
present obligations arising as consequences of past events where it is probable that a transfer of economic benefit will be necessary to
settle the obligation, and it can be reliably estimated. Contingent liabilities reflect potential liabilities that are not recognised on the
balance sheet.
22 Other liabilities
2024
2023
£m
£m
Accruals and deferred income
4,479
4,315
Other creditors
4,828
6,638
Items in the course of collection due to other banks
99
89
Lease liabilities (refer to Note 20)
1,205
971
Other liabilities
10,611
12,013
23Provisions
Accounting for provisions
Provisions are recognised for present obligations arising as consequences of past events where it is more likely than not that a transfer
of economic benefit will be necessary to settle the obligation, which can be reliably estimated.
Critical accounting estimates and judgements
The financial reporting of provisions involves a significant degree of judgement and is complex. Identifying whether a present obligation
exists and estimating the probability, timing, nature and quantum of the outflows that may arise from past events requires judgements
to be made based on the specific facts and circumstances relating to individual events and often requires specialist professional advice.
When matters are at an early stage, accounting judgements and estimates can be difficult because of the high degree of uncertainty
involved. Management continues to monitor matters as they develop to re-evaluate on an ongoing basis whether provisions should be
recognised, however there can remain a wide range of possible outcomes and uncertainties, particularly in relation to legal, competition
and regulatory matters, and as a result it is often not practicable to make meaningful estimates even when matters are at a more
advanced stage.
The amount that is recognised as a provision can also be very sensitive to the assumptions made in calculating it. This gives rise to a
large range of potential outcomes which require judgement in determining an appropriate provision level. See Note 25 for more detail of
legal, competition and regulatory matters.
Legal, competition
and regulatory
matters
Sundry
provisions
Redundancy and
restructuring
Customer redress
Onerous leases
Total
£m
£m
£m
£m
£m
£m
As at 1 January 2024
397
295
99
—
289
1,080
Additions
317
121
106
14
144
702
Amounts utilised
(405)
(162)
(132)
—
(50)
(749)
Unused amounts reversed
(95)
(20)
(15)
—
(53)
(183)
Exchange and other movements1
(1)
65
1
—
29
94
As at 31 December 2024
213
299
59
14
359
944
Undrawn contractually committed facilities and
guarantees2
As at 1 January 2024
504
Net change in expected credit loss provision and
other movements
(65)
As at 31 December 2024
439
Total provisions
As at 1 January 2024
1,584
As at 31 December 2024
1,383
Notes:
1Included within Exchange and other movements is an amount of £62mrelated to indemnified provisions arising from the acquisition of Tesco Bank. Further details regarding the nature
of these indemnities are disclosed in Note 41 - Business Acquisitions.
2Undrawn contractually committed facilities and guarantees provisions are accounted for under IFRS 9. Further analysis of the movement in the expected credit loss provision is
disclosed within the 'Movement in gross exposures and impairment allowance including provisions for loan commitments and financial guarantees' table on page 238.
Provisions expected to be recovered or settled within no more than 12 months after 31 December 2024 were £1,192m (2023:
£1,357m).
Strategy
Shareholder
information
Climate and
sustainability report
Governance
Risk
review
Financial
review
Financial
statements
Barclays PLC 2024
Annual Report
on Form 20-F
412
Notes to the financial statements (continued)
Accruals, provisions, contingent liabilities and legal proceedings
Redundancy and restructuring
These provisions comprise the estimated cost of restructuring, including redundancy costs where an obligation exists. For example,
when the Group has a detailed formal plan for restructuring a business and has raised valid expectations in those affected by the
restructuring by announcing its main features or starting to implement the plan.
Customer redress
Customer redress provisions comprise the estimated cost of making redress payments to customers, clients and counterparties for
losses or damages associated with inappropriate judgement in the execution of the Group’s business activities.
In light of recent legal and regulatory developments in the UK, including the Court of Appeal judgment in October 2024 against other
lenders in three motor finance commissions cases (subject to appeal to the Supreme Court, which is scheduled to be heard in early April
2025), and the ongoing FCA review into historical motor finance commission arrangements and sales, Clydesdale Financial Services
has recognised a provision of £90m (2023: £nil). Taking into account the information currently available, Barclays has estimated the
potential impact of these matters by considering the potential basis for and timing of redress, which complaints may be valid or invalid,
and the potential level of such complaints. All these assumptions are subject to significant uncertainty and will be monitored and
updated if any significant new information becomes available. The legal and regulatory outcomes and the nature, extent and timing of
any remediation action if required remain uncertain and, as a result the ultimate financial impact could be materially higher or lower to
the amount provided. The FCA plans to set out the next steps of its review in May 2025. Under the FCA's rules, Barclays’ obligation to
respond to motor finance commission complaints is paused until after 4 December 2025. Barclays ceased operating in the motor
finance market in late 2019, although historical operations before this time may be in scope of any potential FCA consumer redress
scheme.
Legal, competition and regulatory matters
The Group is engaged in various legal proceedings, both in the UK and a number of other overseas jurisdictions, including the US. For
further information in relation to legal proceedings and discussion of the associated uncertainties, refer to Note 25.
Onerous leases
Onerous leases provisions comprise an estimate of the unavoidable costs involved with fulfilling the terms and conditions of contracts
net of any expected benefits to be received.
Sundry provisions
This category includes provisions that do not fit into any of the other categories, such as fraud losses and dilapidation provisions.
Undrawn contractually committed facilities and guarantees
Impairment allowance under IFRS 9 considers both the drawn and the undrawn counterparty exposure. For retail portfolios, the total
impairment allowance is allocated to the drawn exposure to the extent that the allowance does not exceed the exposure as ECL is not
reported separately. Any excess is reported on the liability side of the balance sheet as a provision. For wholesale portfolios, the
impairment allowance on the undrawn exposure is reported on the liability side of the balance sheet as a provision. For further
information, refer to the Credit risk section for loan commitments and financial guarantees on page 238.
24 Contingent liabilities and commitments
Accounting for contingent liabilities
Contingent liabilities are possible obligations whose existence will be confirmed only by uncertain future events and present obligations
where the transfer of economic resources is uncertain or cannot be reliably measured. Contingent liabilities are not recognised on the
balance sheet but are disclosed unless the likelihood of an outflow of economic resources is remote.
The following table summarises the nominal principal amount of contingent liabilities and commitments which are not recorded on-
balance sheet:
2024
2023
£m
£m
Guarantees and letters of credit pledged as collateral security
16,713
17,353
Performance guarantees, acceptances and endorsements
8,633
7,987
Total contingent liabilities and financial guarantees
25,346
25,340
Of which: Financial guarantees and letters of credit carried at fair value
988
1,266
Documentary credits and other short-term trade related transactions
1,433
2,352
Standby facilities, credit lines and other commitments
421,716
388,085
Total commitments1
423,149
390,437
Of which: Loan commitments carried at fair value
15,350
15,203
Note:
1Includes exposures relating to financial assets classified as assets held for sale.
Provisions for expected credit losses held against contingent liabilities and commitments equal £439m (2023: £504m) and are reported
in Note 23. Further details on contingent liabilities relating to legal and competition and regulatory matters can be found in Note 25.
Strategy
Shareholder
information
Climate and
sustainability report
Governance
Risk
review
Financial
review
Financial
statements
Barclays PLC 2024
Annual Report
on Form 20-F
413
Notes to the financial statements (continued)
Accruals, provisions, contingent liabilities and legal proceedings
25 Legal, competition and regulatory matters
The Group faces legal, competition and regulatory challenges, many of which are beyond our control. The extent of the impact of these
matters cannot always be predicted but may materially impact our operations, financial results, condition and prospects. Matters arising
from a set of similar circumstances can give rise to either a contingent liability or a provision, or both, depending on the relevant facts
and circumstances.
The recognition of provisions in relation to such matters involves critical accounting estimates and judgements in accordance with the
relevant accounting policies applicable to Note 23, Provisions. We have not disclosed an estimate of the potential financial impact or
effect on the Group of contingent liabilities where it is not currently practicable to do so. Various matters detailed in this note seek
damages of an unspecified amount. While certain matters specify the damages claimed, such claimed amounts do not necessarily
reflect the Group’s potential financial exposure in respect of those matters.
Matters are ordered under headings corresponding to the financial statements in which they are disclosed.
1. Barclays PLC and Barclays Bank PLC
Investigations into certain advisory services agreements and other proceedings
FCA proceedings
In 2008, Barclays Bank PLC and Qatar Holdings LLC entered intotwo advisory service agreements (the Agreements). The FCA
conducted an investigation into whether the Agreements may have related to Barclays PLC’s capital raisings in June and November
2008 (the Capital Raisings) and therefore should have been disclosed in the announcements or public documents relating to the Capital
Raisings. In 2013, the FCA issued warning notices (the Warning Notices) finding that Barclays PLC and Barclays Bank PLC acted
recklessly and in breach of certain disclosure-related listing rules, and that Barclays PLC was also in breach of Listing Principle 3. The
financial penalty provided in the Warning Notices was £50m. Barclays PLC and Barclays Bank PLC contested the findings. In 2022, the
FCA’s Regulatory Decisions Committee (RDC) issued decision notices finding that Barclays PLC and Barclays Bank PLC breached
certain disclosure-related listing rules. The RDC also found that in relation to the disclosures made in the Capital Raising of November
2008, Barclays PLC and Barclays Bank PLC acted recklessly, and that Barclays PLC breached Listing Principle 3. The RDC upheld the
combined penalty of £50m on Barclays PLC and Barclays Bank PLC, the same penalty as in the Warning Notices. Barclays PLC and
Barclays Bank PLC referred the RDC’s findings to the Upper Tribunal for reconsideration. In November 2024, Barclays PLC and Barclays
Bank PLC withdrew the reference to the Upper Tribunal and agreed a settlement with the FCA for a combined penalty of £40m without
accepting the FCA’s findings. This matter is now concluded.
Other proceedings
In 2023, Barclays Bank PLC received requests for arbitration from twoJersey special purpose vehicles connected to PCP International
Finance Limited asserting claims in relation to the October 2008 capital raising. Barclays Bank PLC is defending these claims.
Civil actions related to LIBOR and other benchmarks
Various individuals and corporates in a range of jurisdictions have threatened or brought civil actions against the Group and other banks
in relation to the alleged manipulation of LIBOR and/or other benchmarks.
US civil actions related to LIBOR
Multiple civil actions have been filed in the US against the Group and other banks alleging manipulation of USD LIBOR, Sterling LIBOR
and the LIBOR benchmark that was administered by the Intercontinental Exchange Inc. and certain of its affiliates (ICE LIBOR).
With respect to USD LIBOR,twoactions alleging that Barclays Bank PLC, Barclays Capital Inc. (BCI) and other financial institutions
individually and collectively violated provisions of the US Sherman Antitrust Act (Antitrust Act), the US Commodity Exchange Act (CEA),
the US Racketeer Influenced and Corrupt Organizations Act (RICO), the US Securities Exchange Act of 1934 and various state laws by
manipulating USD LIBOR rates remain pending in the Southern District of New York (SDNY). Both seek unspecified damages. Barclays
Bank PLC has moved for summary judgment in these actions, and briefing on that motion was completed in January 2025. Barclays
Bank PLC has settled two other actions asserting substantially similar claims in 2023 and 2024. The financial impact of these
settlements is not material to the Group’s operating results, cash flows or financial position.
With respect to Sterling LIBOR, consolidated class actions filed in the SDNY against Barclays Bank PLC, BCI and other Sterling LIBOR
panel banks alleging, among other things, manipulation of the Sterling LIBOR rate in violation of the Antitrust Act, CEA and RICO, were
dismissed in 2018. Oral argument on the plaintiffs’ appeal of that dismissal was heard by the US Court of Appeals for the Second Circuit
(Second Circuit) in April 2024.
With respect to ICE LIBOR, in August 2020, a group of individual plaintiffs in the US District Court for the Northern District of California
on behalf of individual borrowers and consumers of loans and credit cards with variable interest rates linked to USD ICE LIBOR brought
an action against Barclays Bank PLC and other financial institutions alleging Antitrust Act violations. The defendants’ motion to dismiss
the case was granted in 2022. The US Court of Appeals for the Ninth Circuit affirmed the dismissal in December 2024.
Non-US benchmarks civil actions
There remains one claim, issued in 2017, against Barclays Bank PLC and other banks in the UK in connection with alleged manipulation
of LIBOR. Proceedings have also been brought in a number of other jurisdictions in Europe and Israel relating to alleged manipulation of
LIBOR and EURIBOR.
Foreign exchange civil actions
Various individuals and corporates in a range of jurisdictions have threatened or brought civil actions against the Group and other banks
in relation to alleged manipulation of foreign exchange markets.
Strategy
Shareholder
information
Climate and
sustainability report
Governance
Risk
review
Financial
review
Financial
statements
Barclays PLC 2024
Annual Report
on Form 20-F
414
Notes to the financial statements (continued)
Accruals, provisions, contingent liabilities and legal proceedings
US retail basis civil action
In 2015, a putative class action was filed against several international banks, including Barclays PLC and BCI, on behalf of a proposed
class of individuals who exchanged currencies on a retail basis at bank branches (Retail Basis Claims). The SDNY has ruled that the Retail
Basis Claims are not covered by the settlement agreement in the consolidated FX action. The court subsequently dismissed all Retail
Basis Claims against the Group and all other defendants. The plaintiffs filed an amended complaint. The defendants’ motion for
summary judgment was granted in 2023, dismissing the plaintiffs’ remaining claims. The plaintiffs appealed the decision and the
dismissal was upheld by the appellate court in May 2024. The plaintiffs' motion for reconsideration was denied. The plaintiffs did not
seek US Supreme Court review and the matter is now concluded.
Non-US FX civil actions
Legal proceedings have been brought or are threatened against Barclays PLC, Barclays Bank PLC, BCI and Barclays Execution Services
Limited (BX) in connection with alleged manipulation of foreign exchange in the UK, a number of other jurisdictions in Europe, Israel,
Brazil and Australia.
The above-mentioned proceedings includetwo purported class actions filed against Barclays PLC, Barclays Bank PLC, BX, BCI and
other financial institutions in the UK Competition Appeal Tribunal (CAT) in 2019. The second class action has now been discontinued.
The CAT refused to certify the remaining claim in 2022 and, in 2023, the Court of Appeal overturned the CAT’s decision and found that
the claim should be certified on an opt-out basis. Barclays and the other financial institutions involved have obtained permission to
appeal this decision to the UK Supreme Court.
Metals-related civil actions
A US civil complaint alleging manipulation of the price of silver in violation of the CEA, the Antitrust Act and state antitrust and consumer
protection laws was brought by a proposed class of plaintiffs against a number of banks, including Barclays Bank PLC, BCI and BX, and
transferred to the SDNY. The complaint was dismissed against these Barclays entities and certain other defendants in 2018, and
against the remaining defendants in 2023. The plaintiffs have appealed the dismissal of the complaint against all defendants.
Civil actions have also been filed in Canadian courts against Barclays PLC, Barclays Bank PLC, Barclays Capital Canada Inc. and BCI on
behalf of proposed classes of plaintiffs alleging manipulation of gold and silver prices.
US residential mortgage-related civil action
There remainsone US Residential Mortgage-Backed Securities (RMBS) related civil action arising from unresolved repurchase requests
submitted by Trustees for certain RMBS, alleging breaches of various loan-level representations and warranties (R&Ws) made by
Barclays Bank PLC and/or a subsidiary acquired in 2007. Barclays’ motion to dismiss the action was denied in 2023. The parties appealed
the decision and, in January 2025, the appellate court reversed the lower court’s decision and dismissed the action. The plaintiff has the
right to request review by the New York State Court of Appeals.
Government and agency securities civil actions
Treasury auction securities civil actions
Consolidated putative class action complaints filed in US federal court against Barclays Bank PLC, BCI and other financial institutions
under the Antitrust Act and state common law allege that the defendants (i) conspired to manipulate the US Treasury securities market
and/or (ii) conspired to prevent the creation of certain platforms by boycotting or threatening to boycott such trading platforms. The
court dismissed the consolidated action in 2021. The plaintiffs filed an amended complaint. The defendants’ motion to dismiss the
amended complaint was granted in 2022. The plaintiffs appealed this decision, and in February 2024 the appellate court affirmed the
dismissal. The plaintiffs did not seek US Supreme Court review, thereby concluding the matter.
In addition, certain plaintiffs have filed a related, direct action against BCI and certain other financial institutions, alleging that defendants
conspired to fix and manipulate the US Treasury securities market in violation of the Antitrust Act, the CEA and state common law. This
action remains stayed.
Supranational, Sovereign and Agency bonds civil actions
Civil antitrust actions have been filed in the Federal Court of Canada in Toronto against Barclays Bank PLC, BCI, BX, Barclays Capital
Securities Limited and Barclays Capital Canada Inc. and other financial institutions alleging that the defendants conspired to fix prices
and restrain competition in the market for US dollar-denominated Supranational, Sovereign and Agency bonds.
The parties have reached a settlement, which has received final court approval and has been paid. The financial impact of the
settlement is not material to the Group’s operating results, cash flows or financial position.
Variable Rate Demand Obligations civil actions
Civil actions have been filed against Barclays Bank PLC and BCI and other financial institutions alleging the defendants conspired or
colluded to artificially inflate interest rates set for Variable Rate Demand Obligations (VRDOs). VRDOs are municipal bonds with interest
rates that reset on a periodic basis, most commonly weekly. An action in state court has been filed by private plaintiffs on behalf of the
state of California and the matter is in discovery. Three putative class action complaints have been consolidated in the SDNY. In the
consolidated SDNY class action, certain of the plaintiffs’ claims were dismissed in 2020 and 2022 and the plaintiffs’ motion for class
certification was granted in 2023, which means the case may proceed as a class action. The defendants are appealing this decision.
Strategy
Shareholder
information
Climate and
sustainability report
Governance
Risk
review
Financial
review
Financial
statements
Barclays PLC 2024
Annual Report
on Form 20-F
415
Notes to the financial statements (continued)
Accruals, provisions, contingent liabilities and legal proceedings
Odd-lot corporate bonds antitrust class action
In 2020, BCI, together with other financial institutions, were named as defendants in a putative class action in the US. The complaint
alleges a conspiracy to boycott developing electronic trading platforms for odd-lots and price fixing. The plaintiffs demand unspecified
money damages. The defendants’ motion to dismiss was granted in 2021, which the plaintiffs appealed. In July 2024, the Second Circuit
vacated the judgment and remanded the case to the SDNY, where the plaintiffs filed a second amended complaint in September 2024.
The defendants have filed a motion to dismiss.
Credit Default Swap civil action
A putative antitrust class action is pending in New Mexico federal court against Barclays Bank PLC, BCI and various other financial
institutions. The plaintiffs, the New Mexico State Investment Council and certain New Mexico pension funds, allege that the defendants
conspired to manipulate the benchmark price used to value Credit Default Swap (CDS) contracts at settlement (i.e. the CDS final
auction price). The plaintiffs allege violations of US antitrust laws and the CEA, and unjust enrichment under state law. The defendants’
motion to dismiss was denied in 2023. In January 2024, the SDNY ruled that settlement in an earlier CDS antitrust litigation bars these
plaintiffs from asserting claims based on conduct occurring before 30 June 2014. The plaintiffs have appealed to the Second Circuit.
Interest rate swap and credit default swap US civil actions
Barclays PLC, Barclays Bank PLC and BCI, together with other financial institutions that act as market makers for interest rate swaps
(IRS), are named as defendants in several antitrust actions, including one putative class action and individual actions brought by certain
swap execution facilities, which are consolidated in the SDNY. The complaints allege the defendants conspired to prevent the
development of exchanges for IRS and demand unspecified money damages. The parties have reached a settlement of the class
action, which received preliminary court approval and has been paid. The financial impact of the settlement is not material to the
Group’s operating results, cash flows or financial position. The individual claims will proceed separately in the SDNY. In 2017, Tera Group
Inc. (Tera) filed a separate civil antitrust action in the SDNY claiming that certain conduct alleged in the IRS cases also caused Tera to
suffer harm with respect to the Credit Default Swaps market. In 2019, the court dismissed Tera’s claims for unjust enrichment and
tortious interference but denied motions to dismiss the antitrust claims. Tera filed an amended complaint in 2020. Barclays’ motion to
dismiss all claims was granted in 2023. Tera initially appealed this decision, but in September 2024, Tera declined to pursue its appeal
against Barclays. In October 2024, the Second Circuit affirmed the dismissal against the remaining defendants, including Barclays, and
the matter is now concluded.
BDC Finance L.L.C.
In 2008, BDC Finance L.L.C. (BDC) filed a complaint in the Supreme Court of the State of New York, demanding damages of $298m,
alleging that Barclays Bank PLC had breached a contract in connection with a portfolio of total return swaps governed by an ISDA
Master Agreement (the Master Agreement). Following a trial, the court ruled in 2018 that Barclays Bank PLC was not a defaulting party,
which was affirmed on appeal. In 2021, the trial court entered judgment in favour of Barclays Bank PLC for $3.3m and as yet to be
determined legal fees and costs. In 2022, the appellate court reversed the trial court’s summary judgment decision in favour of Barclays
Bank PLC and remanded the case to the lower court for further proceedings. The parties filed cross-motions on the scope of trial. In
January 2024, the court ruled in Barclays’ favour. In December 2024, the appellate court reversed the trial court’s judgment.
Civil actions in respect of the US Anti-Terrorism Act
Eight civil actions, on behalf of more than 4,000 plaintiffs, were filed in US federal courts in the US District Court in the Eastern District of
New York (EDNY) and SDNY against Barclays Bank PLC and a number of other banks. The complaints generally allege that Barclays Bank
PLC and those banks engaged in a conspiracy to facilitate US dollar-denominated transactions for the Iranian government and various
Iranian banks, which in turn funded acts of terrorism that injured or killed the plaintiffs or the plaintiffs’ family members. The plaintiffs
seek to recover damages for pain, suffering and mental anguish under the provisions of the US Anti-Terrorism Act, which allow for the
trebling of any proven damages.
The court granted the defendants’ motions to dismissthree out of the six actions in the EDNY. The plaintiffs appealed in one action and
the dismissal was affirmed, and judgment was entered, in 2023. The plaintiffs’ motion to vacate the judgment is fully briefed. The other
two dismissed actions in the EDNY were consolidated into one action. The plaintiffs in that action, and in one other action in the EDNY,
filed amended complaints in 2023. The two other actions in the EDNY are currently stayed. Out of the two actions in the SDNY, the
court granted the defendants’ motion to dismiss the first action. That action is stayed, and the second SDNY action is stayed pending
any appeal on the dismissal of the first.
Shareholder derivative action
In 2020, a purported Barclays shareholder filed a putative derivative action in New York state court against BCI and a number of current
and former members of the Board of Directors of Barclays PLC and senior executives or employees of the Group. The shareholder
plaintiff filed the claim on behalf of nominal defendant Barclays PLC, alleging that the individual defendants harmed the company
through breaches of their duties, including under the Companies Act 2006. The plaintiff seeks damages on behalf of Barclays PLC for
the losses that Barclays PLC allegedly suffered as a result of these alleged breaches. An amended complaint was filed in 2021, which BCI
and certain other defendants moved to dismiss. The motion to dismiss was granted in 2022. The plaintiff appealed the decision, and the
dismissal was unanimously affirmed in 2023 by the First Judicial Department in New York. The plaintiff has appealed the First Judicial
Department’s decision to the New York Court of Appeals.
Derivative transactions civil action
In 2021, Vestia, a Dutch housing association, brought a claim against Barclays Bank PLC in the UK High Court in relation to a series of
derivative transactions entered into with Barclays Bank PLC between 2008 and 2011, seeking damages of £329m. In May 2024, Barclays
Bank PLC reached a settlement whereby Barclays paid €43.5m with no acknowledgement of liability. This matter is now closed.
Strategy
Shareholder
information
Climate and
sustainability report
Governance
Risk
review
Financial
review
Financial
statements
Barclays PLC 2024
Annual Report
on Form 20-F
416
Notes to the financial statements (continued)
Accruals, provisions, contingent liabilities and legal proceedings
Skilled person review in relation to historic timeshare loans and associated matters
Clydesdale Financial Services Limited (CFS), which trades as Barclays Partner Finance and houses Barclays’ point-of-sale finance
business, was required by the FCA to undertake a skilled person review in 2020 following concerns about historic affordability
assessments for certain loans to customers in connection with timeshare purchases. The skilled person review was concluded in 2021.
CFS complied fully with the skilled person review requirements, including carrying out certain remediation measures. CFS was not
required to conduct a full back book review. Instead, CFS reviewed limited historic lending to ascertain whether its practices caused
customer harm and is remediating any examples of harm. This work was substantially completed during 2023, utilising provisions
booked to account for any remediations. The remaining provisions are expected to be utilised during early 2025. This matter is
otherwise concluded.
Motor finance commission arrangements
In January 2024, the FCA appointed a skilled person to undertake a review of the historical use of discretionary commission
arrangements and sales in the motor finance market across several firms. Barclays is co-operating fully with the FCA’s skilled person
review, the outcome of which is unknown. This review follows two final decisions by the UK Financial Ombudsman Service (FOS),
including one upholding a complaint against CFS in relation to commission arrangements and disclosure in the sale of motor finance
products, and a number of complaints and court claims, including some against CFS.
In April 2024, CFS filed a judicial review challenge in the High Court against the FOS’s decision in relation to commission arrangements
and disclosure in the sale of motor finance products. In December 2024, the High Court ruled against CFS. CFS has obtained
permission to appeal.
Separately, in October 2024, the English Court of Appeal issued judgment against the lenders in three motor finance commissions
cases. CFS is not a party to this litigation. The Supreme Court has agreed to hear an appeal of these cases, which will take place in April
2025. In light of this decision and onward appeal, the FCA has extended its pause on complaints to include all motor finance
commissions, not just discretionary commission arrangements. CFS ceased operating in the motor finance market in late 2019. In
2020, CFS was transferred from Barclays Bank PLC to Barclays Principal Investments Ltd (BPIL), another subsidiary of Barclays PLC.
Barclays Bank PLC has provided an intragroup indemnity to BPIL in respect of historic litigation and conduct matters relating to CFS.
Over-issuance of securities in the US
In 2022, executive management became aware that Barclays Bank PLC had issued securities materially in excess of the set amount
under its US shelf registration statements.
In 2022, a purported class action claim was filed in the US District Court in Manhattan seeking to hold Barclays PLC, Barclays Bank PLC
and former and current executives responsible for declines in the price of Barclays PLC’s American depositary receipts, which the
plaintiffs claim occurred as a result of alleged misstatements and omissions in its public disclosures. The defendants’ motion to dismiss
the case was granted in part and denied in part in February 2024. The parties have reached a settlement in respect of such lawsuit,
which has received preliminary court approval and has been paid. The financial impact of this settlement is not material to the Group’s
operating results, cash flows or financial position. In addition, holders of a series of ETNs have brought a purported class action in
federal court in New York against Barclays PLC, Barclays Bank PLC, and former and current executives and board members in the US
alleging, among other things, that Barclays’ failure to disclose that these ETNs were unregistered securities misled investors and that,
as a result, Barclays is liable for the holders’ alleged losses following the suspension of further sales and issuances of such series of
ETNs. The plaintiffs were granted leave to amend and filed a new complaint in March 2024. Barclays has filed a motion to dismiss.
In March 2024, a putative class action was filed in federal court in New York against Barclays PLC, Barclays Bank PLC and former and
current executives. The plaintiff purports to bring claims on behalf of a class of short sellers, alleging that their short positions suffered
substantial losses when Barclays suspended new issuances and sales of VXX ETNs as a result of the over-issuance of securities.
Barclays has filed a motion to dismiss.
2. Barclays PLC, Barclays Bank PLC and Barclays Bank UK PLC
HM Revenue & Customs (HMRC) assessments concerning UK Value Added Tax
In 2018, HMRC issued notices that have the effect of either removing certain Barclays overseas subsidiaries that have operations in the
UK from Barclays’ UK VAT group or preventing them from joining it. Supplies between members of a UK VAT group are generally free
from VAT. The notices had both retrospective and prospective effect. Barclays appealed HMRC’s decisions to the First-Tier Tribunal
(Tax Chamber) in relation to both the retrospective VAT assessments and the ongoing VAT payments made since 2018. £181m of
VAT (inclusive of interest) was assessed retrospectively by HMRC covering the periods 2014 to 2018, of which approximately £128m is
expected to be attributed to Barclays Bank UK PLC and £53m to Barclays Bank PLC. This retrospectively assessed VAT was paid in
2018 and an asset, adjusted to reflect expected eventual recovery, is recognised. Since 2018 Barclays has paid, and recognised as an
expense, VAT on intra-group supplies from the relevant subsidiaries to the members of the VAT group. In respect of the ongoing VAT
payments, the court upheld HMRC’s denial of the VAT grouping in August 2024. Barclays has appealed this decision to the Upper
Tribunal.
FCA investigation concerning financial crime systems and controls and compliance with the Money Laundering Regulations 2007
The FCA is conducting a civil enforcement investigation into Barclays Bank UK PLC’s and Barclays Bank PLC’s compliance with the
Money Laundering Regulations 2007 and the FCA’s Principles of Business and Rules relating to anti-money laundering and financial
crime systems and controls. The FCA's investigation focuses primarily on the historical oversight and management of certain
customers with heightened risk. Barclays has been co-operating with the investigation.
Strategy
Shareholder
information
Climate and
sustainability report
Governance
Risk
review
Financial
review
Financial
statements
Barclays PLC 2024
Annual Report
on Form 20-F
417
Notes to the financial statements (continued)
Accruals, provisions, contingent liabilities and legal proceedings
UK bank levy
In November 2024, HMRC updated its published guidance on the treatment of beneficiary accounts for the purposes of the exclusion
of protected deposits from the UK bank levy charge. HMRC’s interpretation of the UK bank levy legislation differs from Barclays’
interpretation of the legislation, which has been applied in Barclays’ UK bank levy returns and which Barclays continues to consider is
correct. In December 2024, HMRC wrote to notify Barclays of its intention to challenge this treatment. Engagement with HMRC is at an
early stage and assessments have not yet been issued.
3. Barclays PLC
Civil action in respect of Barclays’ statements regarding the relationship between its former CEO and Jeffrey Epstein
In 2023, a purported class action was filed in federal court in California against Barclays PLC and a number of current and former senior
executives of Barclays PLC. It was amended in 2024 to assert claims under US and UK securities laws against Barclays PLC and
individual defendants. The complaint seeks to hold the defendants responsible for declines in the price of Barclays PLC’s American
depositary receipts and Barclays’ shares, which the plaintiffs claim occurred as a result of alleged misstatements and omissions in
Barclays’ public disclosures relating to its former CEO’s relationship with Jeffrey Epstein. Barclays has filed a motion to dismiss.
Alternative trading systems
In 2020, a claim was brought against Barclays PLC in the UK in the High Court by various shareholders regarding Barclays PLC’s share
price based on the allegations contained within a complaint by the New York State Attorney General (NYAG) in 2014, which alleged,
among other things, that Barclays PLC and BCI engaged in fraud and deceptive practices in connection with LX, BCI’s SEC-registered
alternative trading system. The NYAG claim was settled in 2016, as previously disclosed. A settlement, which is not material to the
Group’s operating results, cash flows or financial position, was reached with the claimants in December 2024. This matter is now
concluded.
General
The Group is engaged in various other legal, competition and regulatory matters in the UK, the US and a number of other overseas
jurisdictions. It is subject to legal proceedings brought by and against the Group which arise in the ordinary course of business from time
to time, including (but not limited to) disputes in relation to contracts, securities, guarantees, debt collection, consumer credit, fraud,
trusts, client assets, competition, data management and protection, intellectual property, money laundering, financial crime,
employment, environmental and other statutory and common law issues.
The Group is also subject to enquiries and examinations, requests for information, audits, investigations and legal and other
proceedings by regulators, governmental and other public bodies in connection with (but not limited to) consumer protection
measures, measures to combat money laundering and financial crime, compliance with legislation and regulation, wholesale trading
activity and other areas of banking and business activities in which the Group is or has been engaged. The Group is cooperating with the
relevant authorities and keeping all relevant agencies briefed as appropriate in relation to these matters and others described in this
note on an ongoing basis.
At the present time, Barclays PLC does not expect the ultimate resolution of any of these other matters to have a material adverse
effect on the Group’s financial position. However, in light of the uncertainties involved in such matters and the matters specifically
described in this note, there can be no assurance that the outcome of a particular matter or matters (including formerly active matters
or those matters arising after the date of this note) will not be material to Barclays PLC’s results, operations or cash flows for a particular
period, depending on, among other things, the amount of the loss resulting from the matter(s) and the amount of profit otherwise
reported for the reporting period.
Strategy
Shareholder
information
Climate and
sustainability report
Governance
Risk
review
Financial
review
Financial
statements
Barclays PLC 2024
Annual Report
on Form 20-F
418
Notes to the financial statements (continued)
Capital instruments, equity and reserves
Capital instruments, equity and reserves
The notes included in this section focus on the Group’s loan capital and shareholders’ equity including issued share capital, retained
earnings, other equity balances and interests of minority shareholders in our subsidiary entities (non-controlling interests). For more
information on capital management and how the Group maintains sufficient capital to meet our regulatory requirements refer to the
Capital risk management section.
26 Subordinated liabilities
Accounting for subordinated liabilities
Subordinated liabilities are measured at amortised cost using the effective interest method under IFRS 9.
The notes included in this section focus on the costs and commitments associated with employing our staff.
30Staff costs
Accounting for staff costs
Deferred cash and share awards are made to employees to incentivise performance over the period employees provide services.
To receive an award, an individual must have provided service over the vesting period and been employed on the scheduled vesting
date or be considered an eligible leaver. The expense for deferred cash and share awards is recognised over the period employees’
services contribute to the awards. The Group considers it appropriate to recognise the expense over the vesting period including the
financial year prior to the grant date.
The accounting policies for share-based payments and pensions and other post-retirement benefits are included in Note 31 and
Note 32 respectively.
2024
2023
2022
£m
£m
£m
Incentive awards granted:
Current year bonus
1,278
1,202
1,241
Deferred bonus
636
543
549
Total incentive awards granted
1,914
1,745
1,790
Reconciliation of incentive awards granted to income statement charge:
Less: deferred bonuses granted but not charged in current year
(452)
(384)
(388)
Add: current year charges for deferred bonuses from previous years
405
390
399
Other differences between incentive awards granted and income statement charge
(2)
(1)
35
Income statement charge for performance costs
1,865
1,750
1,836
Other income statement charges:
Salaries
4,994
5,120
4,732
Social security costs
754
755
714
Post-retirement benefits1
558
539
563
Other compensation costs
587
555
504
Total compensation costs2
8,758
8,719
8,349
Other resourcing costs:
Outsourcing
693
601
607
Redundancy and restructuring
235
452
(7)
Temporary staff costs
61
91
113
Other
129
154
190
Total other resourcing costs
1,118
1,298
903
Total staff costs
9,876
10,017
9,252
Group compensation costs as a % of total income
32.7
34.4
33.5
Group staff costs as a % of total income
36.9
39.5
37.1
Notes:
1Post-retirement benefits charge includes £377m (2023: £371m; 2022: £313m) in respect of defined contribution schemes and £181m (2023: £168m; 2022: £250m) in respect of
defined benefit schemes.
2£875m (2023: £860m; 2022: £604m) of Group compensation cost was capitalised as internally generated software and excluded from the Staff cost disclosed above.
Strategy
Shareholder
information
Climate and
sustainability report
Governance
Risk
review
Financial
review
Financial
statements
Barclays PLC 2024
Annual Report
on Form 20-F
424
Notes to the financial statements (continued)
Employee benefits
31 Share-based payments
Accounting for share-based payments
Employee incentives include awards in the form of shares and share options, as well as offering employees the opportunity to purchase
shares on favourable terms. The cost of the employee services received in respect of the shares or share options granted is recognised
in the income statement over the period that employees provide services. The overall cost of the award is calculated using the number
of shares and options expected to vest and the fair value of the shares or options at the date of grant.
The number of shares and options expected to vest takes into account the likelihood that performance and service conditions included
in the terms of the awards will be met. For other share-based payment schemes such as Sharesave and Sharepurchase, there are non-
vesting conditions which must be met. Failure to meet the non-vesting condition is treated as a cancellation, resulting in an acceleration
of recognition of the cost of the employee services.
The fair value of shares is the market price ruling on the grant date, in some cases adjusted to reflect restrictions on transferability. The
fair value of options granted is determined using the Black-Scholes model to estimate the numbers of shares likely to vest. The model
takes into account the exercise price of the option, the current share price, the risk-free interest rate, the expected volatility of the
share price over the life of the option and other relevant factors. Market conditions that must be met in order for the award to vest are
also reflected in the fair value of the award, as are any other non-vesting conditions – such as continuing to make payments into a
share-based savings scheme.
The charge for the year arising from share-based payment schemes was as follows:
Charge for the year
2024
2023
2022
£m
£m
£m
Share Value Plan and Deferred Share Value Plan
319
284
295
Others
178
191
214
Total equity settled
497
475
509
Cash settled
10
4
4
Total share based payments
507
479
513
The terms of the main current plans are as follows:
Share Value Plan (SVP)
SVP awards have been granted to participants in the form of a conditional right to receive Barclays PLC shares or provisional allocations
of Barclays PLC shares which vest or are considered for release over a period of three, four, five or seven years. Participants do not pay
to receive an award or to receive a release of shares. For awards granted before December 2017, the grantor may also make a dividend
equivalent payment to participants on release of a SVP award. SVP awards are also made to eligible employees for recruitment
purposes. All awards are subject to potential forfeiture in certain leaver scenarios.
Deferred Share Value Plan (DSVP)
The terms of the DSVP are materially the same as the terms of the SVP as described above, save that Executive Directors are not
eligible to participate in the DSVP and the DSVP operates over market purchase shares only.
Other schemes
In addition to the SVP and DSVP, the Barclays PLC Group operates a number of other schemes settled in Barclays PLC Shares including
Sharesave (both UK and Ireland), Sharepurchase (both UK and overseas), and the Barclays PLC Group Long Term Incentive Plan. A
delivery of upfront shares to ‘Material Risk Takers’ can be made as a Share Incentive Award (Holding Period) under the SVP.
Share option and award plans
The weighted average fair value per award granted, weighted average share price at the date of exercise/release of shares during the
year, weighted average contractual remaining life and number of options and awards outstanding (including those exercisable) at the
balance sheet date were as follows:
2024
2023
Weighted
average fair
value per
award granted
in year
Weighted
average share
price at
exercise/
release during
year
Weighted
average
remaining
contractual
life
Number of
options/
awards
outstanding
Weighted
average fair
value per
award granted
in year
Weighted
average share
price at
exercise/
release during
year
Weighted
average
remaining
contractual
life
Number of
options/
awards
outstanding
£
£
in years
(000s)
£
£
in years
(000s)
SVP and DSVP1,2
1.52
1.74
1
504,825
1.49
1.68
1
495,724
Others1,3
0.81-2.10
1.71-2.12
0-3
240,029
0.31-1.69
1.43-1.69
0-3
288,755
SVP and DSVP are nil cost awards on which the performance conditions are substantially completed at the date of grant. Consequently,
the fair value of these awards is based on the market value at that date.
Strategy
Shareholder
information
Climate and
sustainability report
Governance
Risk
review
Financial
review
Financial
statements
Barclays PLC 2024
Annual Report
on Form 20-F
425
Notes to the financial statements (continued)
Employee benefits
Sharesave has a contractual life of 3 years and 5 years, the expected volatility is 30.31% for 3 years and 27.49% for 5 years. The risk-free
interest rates used for valuations are 4.09% and 3.97% for 3 years and 5 years respectively. The pure dividend yield rates used for
valuations are 2.91% and 3.00% for 3 years and 5 years respectively. The repo rates used for valuations are (0.54)% and (0.61)% for
3 years and 5 years respectively. The inputs into the model such as risk-free interest rate, expected volatility, pure dividend yield rates
and repo rates are derived from market data.
Movements in options and awards
The movement in the number of options and awards for the major schemes and the weighted average exercise price of options was:
SVP and DSVP1,2
Others1,3
Number (000s)
Number (000s)
Weighted average exercise price (£)
2024
2023
2024
2023
2024
2023
Outstanding at beginning of year/acquisition date
495,724
501,454
288,755
316,534
1.06
0.97
Granted in the year
224,385
232,479
132,013
198,386
1.79
1.17
Exercised/released in the year
(191,471)
(196,900)
(163,322)
(193,669)
0.95
0.88
Less: forfeited in the year
(23,813)
(41,309)
(15,164)
(29,424)
1.19
1.20
Less: expired in the year
—
—
(2,253)
(3,072)
1.25
1.42
Outstanding at end of year
504,825
495,724
240,029
288,755
1.19
1.06
Of which exercisable:
—
—
25,164
67,967
1.23
0.87
Notes:
1Options/award granted over Barclays PLC shares.
2Weighted average exercise price is not applicable for SVP and DSVP awards as these are not share option schemes.
3The number of awards within Others at the end of the year principally relates to Sharesave (number of awards exercisable at end of year was 5,343,579). The weighted average exercise
price relates to Sharesave.
Awards and options granted under the Group’s share plans may be satisfied using new issue shares, treasury shares and market
purchase shares. Awards granted under the DSVP may be satisfied using market purchase shares only.
There were no significant modifications to the share-based payments arrangements in 2024 and 2023.
As at 31 December 2024, the total liability arising from cash-settled share-based payments transactions was £11m (2023: £5m).
Holdings of Barclays PLC shares and hedges
Various employee benefit trusts established by the Group hold shares in Barclays PLC to meet obligations under the Barclays share-
based payment schemes. The total number of Barclays shares held in these employee benefit trusts at 31 December 2024 was 19m
(2023: 19m). Dividend rights have been waived on all these shares. The total market value of the shares held in trust based on the year
end share price of £2.68 (2023: £1.54) was £50m (2023: £29m). For accounting of treasury shares, see Note 28.
The Group has entered into physically settled forward contracts to hedge the settlement of certain share-based payment schemes.
The fixed forward price to be paid under these contracts is £274m and has been recorded in retained earnings.
Strategy
Shareholder
information
Climate and
sustainability report
Governance
Risk
review
Financial
review
Financial
statements
Barclays PLC 2024
Annual Report
on Form 20-F
426
Notes to the financial statements (continued)
Employee benefits
32Pensions and post-retirement benefits
Accounting for pensions and post-retirement benefits
The Group operates a number of pension schemes and post-employment benefit schemes.
Defined contribution schemes – the Group recognises contributions due in respect of the accounting period in the income statement.
Any contributions unpaid at the balance sheet date are included as a liability.
Defined benefit schemes – the Group recognises its obligations to members of each scheme at the period end, less the fair value of the
scheme assets after applying the asset ceiling test.
Each scheme’s obligations are calculated using the projected unit credit method. Scheme assets are stated at fair value as at the period end.
Changes in pension scheme liabilities or assets (remeasurements) that do not arise from regular pension cost, net interest on net
defined benefit liabilities or assets, past service costs, settlements or contributions to the scheme, are recognised in other
and what has actually occurred), the effects of changes in actuarial assumptions, return on scheme assets (excluding amounts included
in the interest on the assets) and any changes in the effect of the asset ceiling restriction (excluding amounts included in the interest on
the restriction).
Post-employment benefit schemes – the cost of providing healthcare benefits to retired employees is accrued as a liability in the
financial statements over the period that the employees provide services to the Group, using a methodology similar to that for defined
benefit pension schemes.
Pension schemes
UK Retirement Fund (UKRF)
The UKRF is the Group’s main scheme, representing 96% (2023: 96%) of the Group’s total retirement benefit obligations. Barclays Bank
PLC is the principal employer of the UKRF. The UKRF was closed to new entrants on 1 October 2012, and comprises 10 sections, the
two most significant of which are:
▪Afterwork, which comprises a contributory cash balance defined benefit element, and a voluntary defined contribution element. The
cash balance element is accrued each year and revalued until Normal Retirement Age in line with the increase in Retail Price Index
(RPI) (up to a maximum of 5% p.a.). The main risks that Barclays runs in relation to Afterwork are limited although additional
contributions are required if pre-retirement investment returns are not sufficient to provide for the benefits.
▪The 1964 Pension Scheme. Most UK employees recruited before July 1997 built up benefits in this non-contributory defined benefit
scheme in respect of service up to 31 March 2010. Pensions were calculated by reference to service and pensionable salary. From
1 April 2010, members became eligible to accrue future service benefits in either Afterwork or the Pension Investment Plan, a historic
defined contribution section which is now closed to future contributions. The risks that Barclays runs in relation to the 1964 section
are typical of final salary pension schemes, principally that investment returns fall short of expectations, that inflation exceeds
expectations, and that retirees live longer than expected.
Barclays Pension Savings Plan (BPSP)
The BPSP is a defined contribution scheme providing benefits for all new UK hires from 1 October 2012. BPSP is not subject to the
same investment return, inflation or life expectancy risks for Barclays that defined benefit schemes are. Members’ benefits reflect
contributions paid and the level of investment returns achieved.
Other
Apart from the UKRF and the BPSP, Barclays operates a number of smaller pension and long-term employee benefits and post-
retirement healthcare plans globally, the largest of which are the US defined benefit and defined contribution schemes. Many of the
schemes are funded, with assets backing the obligations held in separate legal vehicles such as trusts. Others are operated on an
unfunded basis. The benefits provided, the approach to funding, and the legal basis of the schemes, reflect local environments.
Governance
The UKRF operates under trust law and is managed and administered on behalf of the members in accordance with the terms of the
Trust Deed and Rules and all relevant legislation. The Corporate Trustee is Barclays Pension Funds Trustees Limited, a private limited
company and a wholly owned subsidiary of Barclays Bank PLC. The Trustee is the legal owner of the assets of the UKRF which are held
separately from the assets of the Group.
The Trustee Board comprises six Management Directors selected by Barclays, of whom three are independent Directors with no
relationship with Barclays (and who are not members of the UKRF), plus three Member Nominated Directors selected from eligible
active, deferred or pensioner members who apply for the role.
The BPSP is a Group Personal Pension arrangement which operates as a collection of personal pension plans. Each personal pension
plan is a direct contract between the employee and the BPSP provider (Legal & General Assurance Society Limited), and is regulated by
the FCA.
Similar principles of pension governance apply to the Group’s other pension schemes, depending on local legislation.
Strategy
Shareholder
information
Climate and
sustainability report
Governance
Risk
review
Financial
review
Financial
statements
Barclays PLC 2024
Annual Report
on Form 20-F
427
Notes to the financial statements (continued)
Employee benefits
Amounts recognised
The following tables include amounts recognised in the income statement and an analysis of benefit obligations and scheme assets for
all Group defined benefit schemes. The net position is reconciled to the assets and liabilities recognised on the balance sheet. The
tables include funded and unfunded post-retirement benefits. The income statement charge with respect to Defined contribution
schemes is disclosed as part of footnotes to Note 30 Staff costs.
Income statement (credit)/charge
2024
2023
2022
£m
£m
£m
Current service cost
180
165
227
Net finance (income)/cost
(154)
(222)
(122)
Past service cost
—
—
20
Other movements
1
3
3
Total
27
(54)
128
Balance sheet reconciliation
2024
2023
Total
Of which relates to
UKRF
Total
Of which relates to
UKRF
£m
£m
£m
£m
Benefit obligation at beginning of the year
(21,513)
(20,618)
(20,881)
(19,990)
Current service cost
(180)
(155)
(165)
(141)
Interest costs on scheme liabilities
(933)
(901)
(959)
(929)
Remeasurement (loss)/gain – financial
1,794
1,797
(708)
(683)
Remeasurement (loss)/gain – demographic
12
13
311
310
Remeasurement (loss)/gain – experience
(55)
(54)
(264)
(260)
Employee contributions
(6)
—
(5)
(1)
Benefits paid
1,230
1,189
1,115
1,075
Exchange and other movements
51
—
43
1
Benefit obligation at end of the year
(19,600)
(18,729)
(21,513)
(20,618)
Fair value of scheme assets at beginning of the year
24,914
24,234
25,360
24,680
Interest income on scheme assets
1,087
1,062
1,181
1,155
Employer contribution
37
22
54
39
Remeasurement – return on scheme assets (less)/greater than discount rate
(2,192)
(2,184)
(532)
(548)
Employee contributions
6
—
5
1
Benefits paid
(1,221)
(1,189)
(1,115)
(1,075)
Exchange and other movements
(8)
(17)
(39)
(18)
Fair value of scheme assets at end of the year
22,623
21,928
24,914
24,234
Net surplus
3,023
3,199
3,401
3,616
Retirement benefit assets
3,263
3,199
3,667
3,616
Retirement benefit liabilities
(240)
—
(266)
—
Net retirement benefit assets
3,023
3,199
3,401
3,616
Included within the benefit obligation is £695m (2023: £694m) relating to overseas pensions and £175m (2023: £201m) relating to other post-
employment benefits.
Barclays has considered the potential implications for the UKRF of the ruling and appeal in Virgin Media v NTL Pension Trustees II Ltd. Activity
to date has not identified any relevant amendments to the UKRF (of the nature of that found to have been void in the Virgin Media case) that
were not subject to actuarial confirmation. No material additional benefit obligation is expected.
As at 31 December 2024, the UKRF’s scheme assets were in surplus versus IAS 19 obligations by £3,199m (2023: £3,616m). During 2024, the
decrease in the UKRF surplus was driven by changes in market conditions. Defined benefit obligation reduced due to increases in underlying
corporate bond yields, however assets reduced by a higher amount. The UKRF’s hedging strategy is more aligned to the funding basis than the
accounting basis.
The weighted average duration of the benefit payments reflected in the defined benefit obligation for the UKRF is 11 years (2023: 12
years). The UKRF expected benefits promised to date are projected to be paid out for in excess of 50 years, although 32% of the benefits are
expected to be paid in the next 10 years; 33% in years 11 to 20 and 21% in years 21 to 30. The remainder of the benefits are expected to be
paid beyond 30 years.
Of the £1,189m (2023: £1,075m) UKRF benefits paid out, £165m (2023: £122m) related to transfers out of the fund.
Where a scheme’s assets exceed its obligation, an asset is recognised to the extent that it does not exceed the present value of future
contribution holidays or refunds of contributions (the asset ceiling). In the case of the UKRF the asset ceiling is not applied as, in certain
specified circumstances such as wind-up, the Group expects to be able to recover any surplus. Similarly, a liability in respect of future minimum
funding requirements is not recognised. The Trustee does not have a substantive right to augment benefits, nor do they have the right to wind
up the plan except in the dissolution of the Group or termination of contributions by the Group. The application of the asset ceiling to other
plans and recognition of additional liabilities in respect of future minimum funding requirements are considered on an individual plan basis.
Strategy
Shareholder
information
Climate and
sustainability report
Governance
Risk
review
Financial
review
Financial
statements
Barclays PLC 2024
Annual Report
on Form 20-F
428
Notes to the financial statements (continued)
Employee benefits
Critical accounting estimates and judgements
Actuarial valuation of the scheme's obligation is dependent upon a series of assumptions. Below is a summary of the main financial and
demographic assumptions adopted for the UKRF.
2024
2023
Key UKRF financial assumptions
% p.a.
% p.a.
Discount rate
5.44
4.49
Inflation rate (RPI)
3.32
3.17
The UKRF discount rate assumption for 2024 was based on a standard WTW RATE Link model. The RPI inflation assumption for 2024
was set by reference to the Bank of England’s implied inflation curve. The inflation assumption incorporates a deduction of 20 basis
points as an allowance for an inflation risk premium. The methodology used to derive the discount rate and inflation assumptions is
consistent with that used at the prior year end.
The UKRF’s post-retirement mortality assumptions are based on best estimates derived from an analysis in 2022 of the UKRF’s own
post-retirement mortality experience and taking account of recent evidence from published mortality surveys. An allowance has been
made for future mortality improvements based on the 2023 core projection model published by the Continuous Mortality Investigation
Bureau subject to a long-term trend of 1.25% per annum in future improvements (2023: 1.25% per annum).The table below shows how
the assumed life expectancy, for members of the UKRF, has changed since last year:
Assumed life expectancy1
2024
2023
Life expectancy at 60 for current pensioners (years)
– Males
26.5
26.5
– Females
29.4
29.3
Life expectancy at 60 for future pensioners currently aged 40 (years)
– Males
28.0
28.0
– Females
30.8
30.7
Note:
1The life expectancies disclosed are in respect of a population of the membership that represents c60% of the Defined Benefit Obligation of UKRF (excluding the Afterwork section which
has no post-retirement mortality risk) with the remaining members having life expectancy at age 60 of between 26.3 years and 29.4 years.
Approximately, 70% of the longevity risk for current pensioners has been reinsured and the transactions will provide income to the
UKRF if pensions are paid out for longer than expected. The contracts form part of the UKRF’s investment portfolio.
Sensitivity analysis on actuarial assumptions
The sensitivity analysis has been calculated by valuing the UKRF liabilities using the amended assumptions shown in the table below and
keeping the remaining assumptions the same as disclosed in the table above, except in the case of the inflation sensitivity where other
assumptions that depend on assumed inflation have also been amended correspondingly. The difference between the recalculated
liability figure and that stated in the balance sheet reconciliation table above is the figure shown. The selection of these movements to
illustrate the sensitivity of the defined benefit obligation to key assumptions should not be interpreted as Barclays expressing any
specific view of the probability of such movements happening.
Change in key assumptions
2024
2023
(Decrease)/
Increase in UKRF
defined benefit
obligation
(Decrease)/
Increase in UKRF
defined benefit
obligation
£bn
£bn
Discount rate
0.5% p.a. increase
(1.0)
(1.2)
0.25% p.a. increase
(0.5)
(0.6)
0.25% p.a. decrease
0.5
0.6
0.5% p.a. decrease
1.1
1.3
Assumed RPI
0.5% p.a. increase
0.7
0.8
0.25% p.a. increase
0.3
0.4
0.25% p.a. decrease
(0.4)
(0.4)
0.5% p.a. decrease
(0.7)
(0.8)
Life expectancy at 60
One year increase
0.5
0.6
One year decrease
(0.5)
(0.6)
Strategy
Shareholder
information
Climate and
sustainability report
Governance
Risk
review
Financial
review
Financial
statements
Barclays PLC 2024
Annual Report
on Form 20-F
429
Notes to the financial statements (continued)
Employee benefits
Assets
A long-term investment strategy has been set for the UKRF, with its asset allocation comprising a mixture of gilts, bonds, property and
other appropriate assets. This recognises that different asset classes are likely to produce different long-term returns and some asset
classes may be more volatile than others. The long-term investment strategy ensures, among other aims, that investments are
adequately diversified.
The value of the assets of the schemes and their percentage in relation to total scheme assets were as follows:
Analysis of scheme assets
Total
Of which relates to UKRF
Quoted
£m
Unquoted1
£m
Value
£m
% of total fair
value of
scheme assets
%
Quoted
£m
Unquoted1
£m
Value
£m
% of total fair
value of
scheme assets
%
As at 31 December 2024
Equities
121
—
121
0.5
—
—
—
—
Private equities
—
2,134
2,134
9.4
—
2,134
2,134
9.7
Bonds - fixed government
1,546
—
1,546
6.8
1,306
—
1,306
6.0
Bonds - index-linked government
8,234
—
8,234
36.4
8,214
—
8,214
37.5
Bonds - corporate and other
5,604
717
6,321
27.9
5,395
717
6,112
27.9
Property
19
1,238
1,257
5.6
—
1,238
1,238
5.6
Infrastructure
—
1,388
1,388
6.1
—
1,388
1,388
6.3
Hedge funds
9
1,390
1,399
6.2
—
1,390
1,390
6.3
Derivatives
(7)
(1,799)
(1,806)
(8.0)
(7)
(1,799)
(1,806)
(8.2)
Longevity reinsurance contracts
—
(117)
(117)
(0.5)
—
(117)
(117)
(0.5)
Cash and liquid assets2
(454)
2,529
2,075
9.2
(464)
2,529
2,065
9.4
Mixed investment funds
8
—
8
—
—
—
—
—
Other
7
56
63
0.4
—
4
4
—
Fair value of scheme assets
15,087
7,536
22,623
100.0
14,444
7,484
21,928
100.0
As at 31 December 2023
Equities
116
—
116
0.5
—
—
—
—
Private equities
—
2,259
2,259
9.1
—
2,259
2,259
9.3
Bonds - fixed government
1,544
—
1,544
6.2
1,289
—
1,289
5.3
Bonds - index-linked government
9,400
—
9,400
37.7
9,383
—
9,383
38.8
Bonds - corporate and other
6,014
1,237
7,251
29.1
5,818
1,237
7,055
29.1
Property
17
1,197
1,214
4.9
—
1,197
1,197
4.9
Infrastructure
814
720
1,534
6.2
814
720
1,534
6.3
Hedge funds
11
1,309
1,320
5.3
—
1,309
1,309
5.4
Derivatives
25
(1,584)
(1,559)
(6.3)
25
(1,584)
(1,559)
(6.4)
Longevity reinsurance contract
—
(131)
(131)
(0.5)
—
(131)
(131)
(0.5)
Cash and liquid assets2
(1,134)
3,036
1,902
7.6
(1,143)
3,036
1,893
7.8
Mixed investment funds
12
—
12
—
—
—
—
—
Other
5
47
52
0.2
—
5
5
—
Fair value of scheme assets
16,824
8,090
24,914
100.0
16,186
8,048
24,234
100.0
Notes:
1Valuation of unquoted assets is provided by the underlying managers or qualified independent valuers. The valuation for some of the unquoted assets, in particular private equities, is
based on valuations as at 30 September 2024 adjusted by cash flows, these being the latest available valuations as at the point of publication. All valuations are determined in
accordance with relevant industry guidance. Barclays does not believe these valuations will differ materially from the fair value, in the context of the overall UKRF asset size.
2Cash and liquid assets for the UKRF consists of £404m (2023: £354m) Cash, £80m (2023: £91m) Receivables/payables, £2,529m (2023: £3,036m) Pooled cash funds and £(948)m
(2023: £(1,588)m) Repurchase agreements.
Included within the fair value of UKRF scheme assets was nil (2023: nil) relating to shares in Barclays PLC and nil (2023: nil) relating to
bonds issued by Barclays PLC. The UKRF also invests in pooled investment vehicles which may hold shares or debt issued by Barclays
PLC.
At 31 December 2024, 38% of the UKRF assets were invested in liability-driven investment strategies; primarily UK gilts as well as
interest rate and inflation swaps. These swaps are used to better match the assets to its liabilities. The swaps are used to reduce the
scheme’s inflation and duration risks against its liabilities.
The UKRF employs derivative instruments, where appropriate, to match assets more closely to liabilities, or to achieve a desired
exposure or return. The value of assets shown reflects the assets held by the UKRF, with any derivative holdings reflected on a fair value
basis. The UKRF uses repurchase agreements and reverse repurchase agreements to achieve the Trustee’s liability hedging objective.
Investment managers are allowed to undertake repo transactions on the UKRF’s existing gilt holdings to raise cash with which to buy
additional gilts for efficient portfolio management; and reverse repo transactions to receive gilts and be paid a fee for providing cash.
Strategy
Shareholder
information
Climate and
sustainability report
Governance
Risk
review
Financial
review
Financial
statements
Barclays PLC 2024
Annual Report
on Form 20-F
430
Notes to the financial statements (continued)
Employee benefits
The UKRF has a comprehensive and robust liquidity framework in place. The aim of the liquidity framework is to ensure that pension
payments and other liquidity outflows are paid in due course, sufficient liquidity and collateral is maintained to achieve strategic
allocation targets and that all liquidity outflows/collateral needs are covered without forced sale or strategic asset allocation changes.
The UKRF holdstwo longevity reinsurance contracts covering 70% of the current pensioner liabilities. The contracts provide income to
the UKRF if pensions are paid out for longer than expected. At 31 December 2024, the combined value of the contracts was £(117)m
(2023: £(131)m). The negative value reflects the estimated impact of changes in the reinsurance market, demographic assumptions
and risk premia since the contracts were entered into by the UKRF.
For information on the UKRF Trustee’s approach to Responsible Investment and Climate Risk, in the context of managing the UKRF,
please refer to the UKRF Trustee website at epa.towerswatson.com/accounts/barclays/public/barclays-bank-responsible-
investment-policy/.
Triennial valuation
The UKRF annual funding update as at 30 September 2024 showed a funding surplus of £1.75bn compared to £2.02bn at 30
September 2023. The main reasons for the decrease were the impact of investment returns relative to liabilities and benefit accrual
exceeding contributions received.
The main differences between the funding and accounting assumptions are a different approach to setting the discount rate and a
more conservative life expectancy assumption for funding.
As part of the 2022 triennial valuation, the Trustee and Barclays Bank PLC agreed an annual adequacy test on a basis more prudent than
the IAS 19 or funding bases. Should the UKRF be sufficiently funded on this basis, the regular employer contributions to the UKRF to
fund future Afterwork accrual will not be required in the following calendar year. The test will be reviewed at the 2025 triennial valuation.
The test was passed in September, so no regular employer contributions are required for 2025.
The next funding valuation of the UKRF is due to be completed in 2026 with an effective date of 30 September 2025.
Other support measures agreed which remain in place
Collateral – Barclays Bank PLC has entered into an agreement with the UKRF Trustee to provide collateral to cover at least 100% of any
funding deficit with an overall cap of £9bn, to provide security if the UKRF is in a funding deficit. The collateral pool is currently zero,
reflecting the surplus funding position. The arrangement provides the UKRF Trustee with dedicated access to the pool of assets in the
event of Barclays Bank PLC not paying any required deficit reduction contribution to the UKRF or in the event of Barclays Bank PLC’s
insolvency.
Participation – As permitted under the Financial Services and Markets Act 2000 (Banking Reform) (Pensions) Regulations 2015,
currently Barclays Bank UK PLC is a participating employer in the UKRF and will remain so during a transitional phase as set out in a deed
of participation. Barclays Bank PLC, a fellow subsidiary of Barclays PLC, is the principal employer of the UKRF. In the event of Barclays
Bank PLC’s insolvency during this period provision has been made to require Barclays Bank UK PLC to become the principal employer of
the UKRF. Barclays Bank PLC’s Section 75 debt would be triggered by the insolvency (the debt would be calculated after allowing for the
payment to the UKRF of any collateral above). To meet the requirements of the Financial Services and Markets Act 2000 (Banking
Reform) (Pensions) Regulations 2015 it is Barclays' intention to sectionalise the UKRF in July 2025, creating two separate sections – the
Barclays Bank Section and the Barclays UK Section (with Barclays Bank UK PLC participating in the Barclays UK Section only). This will
not change the financial position of the UKRF from a consolidated Group perspective, and members’ benefits will be unchanged as a
result of the actions Barclays is taking to meet its regulatory obligations.
Defined benefit contributions paid to the UKRF were £22m (2023: £39m).
There were nil (2023: nil) Section 75 contributions included within the Group’s contributions paid as no participating employers left the
UKRF in 2024.
The Group’s expected contribution to the UKRF in respect of defined benefits in 2025 is £47m. In addition, the expected contributions
to UK defined contribution schemes in 2025 is £18m to the UKRF and £302m to the BPSP.
Strategy
Shareholder
information
Climate and
sustainability report
Governance
Risk
review
Financial
review
Financial
statements
Barclays PLC 2024
Annual Report
on Form 20-F
431
Notes to the financial statements (continued)
Scope of consolidation
Scope of consolidation
The notes included in this section present information on the Group’s investments in subsidiaries, joint ventures and associates and its
interests in structured entities. Detail is also given on securitisation transactions the Group has entered into and arrangements that are
held off-balance sheet.
33 Principal subsidiaries
The significant judgements used in applying this policy are set out below.
Accounting for investment in subsidiaries
In the individual financial statements of Barclays PLC, investments in subsidiaries are stated at cost less impairment.
Principal subsidiaries for the Group are set out below. This includes those subsidiaries that are most significant in the context of the
Group’s business, results or financial position.
Principal place of business or
incorporation
Percentage of
voting rights held
Non-controlling
interests -
proportion of
ownership
interests
Non-controlling
interests -
proportion of
voting interests
Company name
Nature of business
%
%
%
Barclays Bank PLC
United Kingdom
Banking, holding company
100
1
—
Barclays Bank UK PLC
United Kingdom
Banking, holding company
100
—
—
Barclays Bank Ireland PLC
Ireland
Banking
100
—
—
Barclays Execution Services
Limited
United Kingdom
Service company
100
—
—
Barclays Capital Inc.
United States
Securities dealing
100
—
—
Barclays Capital Securities
Limited
United Kingdom
Securities dealing
100
—
—
Barclays Securities Japan
Limited
Japan
Securities dealing
100
—
—
Barclays US LLC
United States
Holding company
100
—
—
Barclays Bank Delaware
United States
Credit card issuer
100
—
—
The country of registration or incorporation is also the principal area of operation of each of the above subsidiaries.
Ownership interests are in some cases different to voting interests due to the existence of non-voting equity interests, such as
preference shares. Refer to Note 29 for more information.
Determining whether the Group has control of an entity is generally straightforward based on ownership of the majority of the voting
capital. However, in certain instances, this determination will involve judgement, particularly in the case of structured entities where
voting rights are often not the determining factor in decisions over the relevant activities. This judgement will involve assessing the
purpose and design of the entity. It will also often be necessary to consider whether the Group, or another involved party with power
over the relevant activities, is acting as a principal in its own right or as an agent on behalf of others.
There is also often considerable judgement involved in the ongoing assessment of control over structured entities. In this regard, where
market conditions have deteriorated such that the other investors’ exposures to the structure’s variable returns have been
substantively eliminated, the Group may conclude that the managers of the structured entity are acting as its agent and therefore will
consolidate the structured entity.
An interest in equity voting rights exceeding 50% would typically indicate that the Group has control of an entity. Until 25 October 2024
Palomino Limited was excluded from consolidation despite the Group holding 100% of the voting rights as it was managed by an
external counterparty and the Group was not exposed to its variable returns. Following the termination of the management agreement,
as from 26 October 2024 the entity is now fully consolidated.
Percentage of
voting rights held
Equity
shareholders'
funds
Retained profit for
the year
Company name
Country of registration or incorporation
%
£m
£m
Palomino Limited
Cayman Islands
100
—
—
Interests relating to the entity are included in Note 34 for the year ended 31 December 2023.
Significant restrictions
As is typical for a group of its size and international scope, there are restrictions on the ability of Barclays PLC to obtain distributions of
capital, access the assets or repay the liabilities of members of its Group due to the statutory, regulatory and contractual requirements
of its subsidiaries and due to the protective rights of non-controlling interests. These are considered below.
Regulatory requirements
Barclays’ principal subsidiary companies have assets and liabilities before intercompany eliminations of£2,015bn (2023: £2,022bn) and
£1,919bn (2023: £1,927bn) respectively. Certain of these assets and liabilities are subject to prudential regulation and regulatory capital
requirements in the countries in which they are regulated. These require entities to maintain minimum capital levels which cannot be
returned to the parent company, Barclays PLC, on a going concern basis.
Strategy
Shareholder
information
Climate and
sustainability report
Governance
Risk
review
Financial
review
Financial
statements
Barclays PLC 2024
Annual Report
on Form 20-F
432
Notes to the financial statements (continued)
Scope of consolidation
In order to meet capital requirements, subsidiaries may issue certain equity-accounted and debt-accounted financial instruments and
non-equity instruments such as Tier 1 and Tier 2 capital instruments and other forms of subordinated liabilities. Refer to Note 26 and
Note 27 for particulars of these instruments. These instruments may be subject to cancellation clauses or preference share
restrictions that would limit the ability of the entity to repatriate the capital on a timely basis.
Liquidity requirements
Regulated subsidiaries of the Group are required to meet applicable PRA or local regulatory requirements pertaining to liquidity. The
regulated subsidiaries include Barclays Bank PLC and Barclays Capital Securities Limited (which are regulated on a combined basis
under a Domestic Liquidity Sub-Group (DoLSub) arrangement), Barclays Bank UK PLC, Barclays Bank Ireland PLC, Barclays Capital Inc.
and Barclays Bank Delaware. Refer to the Liquidity risk section for further details of liquidity requirements, including those of the Group’s
significant subsidiaries.
Statutory requirements
The Group’s subsidiaries are subject to statutory requirements not to make distributions of capital and unrealised profits and generally
to maintain solvency. These requirements restrict the ability of subsidiaries to make remittances of dividends to Barclays PLC, the
ultimate parent, except in the event of a legal capital reduction or liquidation. In most cases, the regulatory restrictions referred to
above exceed the statutory restrictions.
Asset encumbrance
The Group uses its financial assets to raise finance in the form of securitisations and through the liquidity schemes of central banks, as
well as to provide security to the UK Retirement Fund. Once encumbered, the assets are not available for transfer around the Group.
The assets typically affected are disclosed in Note 37.
Other restrictions
The Group is required to maintain cash balances with central banks and other regulatory authorities, and these amounted to £2,945m
(2023: £3,758m).
34 Structured entities
A structured entity is an entity in which voting or similar rights are not the dominant factor in deciding who controls the entity. Voting
rights may relate to administrative tasks only, with the relevant activities of the entity being directed by means of contractual
arrangements. Structured entities are generally created to achieve a narrow and well-defined objective with restrictions around their
ongoing activities.
Depending on the Group’s power over the activities of the entity and its exposure to and ability to influence its own returns, it may
consolidate the entity. In other cases, it may sponsor or have exposure to such an entity but not consolidate it.
Consolidated structured entities
The Group has contractual arrangements which may require it to provide financial support to the following types of consolidated
structured entities:
•Securitisation vehicles: The Group uses securitisation as a source of financing and a means of risk transfer. Where entities are
controlled by the Group, they are consolidated. Refer to Note 36 for further detail.
▪Commercial Paper (CP) conduits: These entities issue CP and use the proceeds to lend to clients as part of the Group's multi-seller
conduit programme. The Group has provided £23.9bn (2023: £22.4bn) in contractual liquidity facilities to the CP conduits that the
Group consolidates. These amounts represent the maximum the conduits can lend externally. The amounts of CP conduit lending
(drawn and undrawn) to unconsolidated structured entities can be seen in Other interests in unconsolidated structured entities
under multi-seller conduit programme in the Nature of interest table.
▪Employee benefit trusts: The Group provides capital contributions to employee benefit trusts to enable them to meet obligations to
employees in relation to share-based remuneration arrangements.
▪Tender Option Bond (TOB) trusts: During 2024, the Group provided undrawn liquidity facilities of £4.0bn (2023: £3.7bn) to
consolidated TOB trusts. These trusts invest in fixed income instruments issued by state, local or other municipalities in the United
States, funded by long-term senior floating-rate notes and junior residual securities.
Unconsolidated structured entities
The term ‘unconsolidated structured entities’ refers to structured entities not controlled by Barclays, and are established either by
Barclays or a third party. An interest in a structured entity is any form of contractual or non-contractual involvement which creates
variability in returns arising from the performance of the entity for the Group. Such interests include holdings of debt or equity
securities, derivatives that transfer financial risks from the entity to the Group, lending, loan commitments, financial guarantees and
investment management agreements.
The Group enters into transactions with unconsolidated structured entities in the normal course of business to facilitate customer
transactions, to provide risk management services and for specific investment opportunities. This is predominantly within the Barclays
investment bank business. Structured entities may take the form of funds, trusts, securitisation vehicles, and private investment
companies. The largest transactions for Barclays include loans and derivatives with hedge fund structures and special purpose entities,
multi-seller conduit lending, holding notes issued by securitisation vehicles, and facilitating customer requirements through funds.
Strategy
Shareholder
information
Climate and
sustainability report
Governance
Risk
review
Financial
review
Financial
statements
Barclays PLC 2024
Annual Report
on Form 20-F
433
Notes to the financial statements (continued)
Scope of consolidation
The nature and extent of the Group’s interests in structured entities is summarised below:
Summary of interests in unconsolidated structured entities
Secured financing
Short-term traded
interests
Traded derivatives
Other interests
Total
£m
£m
£m
£m
£m
As at 31 December 2024
Assets
Trading portfolio assets
—
23,941
—
—
23,941
Financial assets at fair value through the income statement
87,546
—
—
1,295
88,841
Derivative financial instruments
—
—
6,540
—
6,540
Financial assets at fair value through other comprehensive
income
—
—
—
5,571
5,571
Loans and advances at amortised cost
—
—
—
47,151
47,151
Debt securities at amortised cost
—
—
—
24,331
24,331
Reverse repurchase agreements and other similar secured
lending
3,145
—
—
—
3,145
Other assets
—
—
—
—
—
Total assets
90,691
23,941
6,540
78,348
199,520
Liabilities
Derivative financial instruments
—
—
6,978
—
6,978
As at 31 December 2023
Assets
Trading portfolio assets
—
15,482
—
—
15,482
Financial assets at fair value through the income statement
74,551
—
—
1,141
75,692
Derivative financial instruments
—
—
5,685
—
5,685
Financial assets at fair value through other comprehensive
income
—
—
—
838
838
Loans and advances at amortised cost
—
—
—
34,316
34,316
Debt securities at amortised cost
—
—
—
18,487
18,487
Reverse repurchase agreements and other similar secured
lending
896
—
—
—
896
Other assets
—
—
—
130
130
Total assets
75,447
15,482
5,685
54,912
151,526
Liabilities
Derivative financial instruments
—
—
6,173
—
6,173
Secured financing arrangements, short-term traded interests and traded derivatives are typically managed under Market risk
management policies described in the Market risk management section which includes an indication of the change of risk measures
compared to last year. For this reason, the total assets of these entities are not considered meaningful for the purposes of
understanding the related risks and so have not been presented. Other interests include conduits and lending where the interest is
driven by normal customer demand. As at 31 December 2024, Barclays entered into transactions with approximately 5,000 (2023:
6,000) structured entities.
Secured financing
The Group routinely enters into reverse repurchase contracts, margin lending, stock borrowing and similar arrangements on normal
commercial terms where the counterparty to the arrangement is a structured entity. Due to the nature of these arrangements,
especially the transfer of collateral and ongoing margining, the Group is able to manage its variable exposure to the performance of the
structured entity counterparty. The counterparties included in secured financing mainly include hedge fund limited structures,
investment companies and special purpose entities.
Short-term traded interests
As part of its market making activities, the Group buys and sells interests in structured vehicles, which are predominantly debt securities
issued by asset securitisation vehicles. Such interests are typically held individually or as part of a larger portfolio for no more than90
days. In such cases, the Group typically has no other involvement with the structured entity other than the securities it holds as part of
trading activities and its maximum exposure to loss is restricted to the carrying value of the asset.
Traded derivatives
The Group enters into a variety of derivative contracts with structured entities which reference market risk variables such as interest
rates, equities, foreign exchange rates and credit indices among other things. The main derivative types which are considered interests
in structured entities include equity options, index-based and entity-specific credit default swaps, and total return swaps. Interest rate
swaps and foreign exchange derivatives that are not complex and which expose the Group to insignificant credit risk by being senior in
the payment waterfall of a securitisation and derivatives that are determined to introduce risk or variability to a structured entity are not
considered to be an interest in an entity and have been excluded from the disclosures.
Strategy
Shareholder
information
Climate and
sustainability report
Governance
Risk
review
Financial
review
Financial
statements
Barclays PLC 2024
Annual Report
on Form 20-F
434
Notes to the financial statements (continued)
Scope of consolidation
A description of the types of derivatives and the risk management practices are detailed in Note 14. The risk of loss may be mitigated
through ongoing margining requirements as well as a right to cash flows from the structured entity which are senior in the payment
waterfall. Such margining requirements are consistent with market practice for many derivative arrangements and in line with the
Group’s normal credit policies.
Derivative transactions require the counterparty to provide cash or other collateral under margining agreements to mitigate
counterparty credit risk. The Group is mainly exposed to settlement risk on these derivatives which is mitigated through daily margining.
Total notional contract amounts were £712,793m (2023: £335,552m).
Except for credit default swaps where the maximum exposure to loss is the swap notional amount, it is not possible to estimate the
maximum exposure to loss in respect of derivative positions as the fair value of derivatives is subject to changes in market rates of
interest, exchange rates and credit indices which by their nature are uncertain. In addition, the Group’s losses would be subject to
mitigating action under its traded market risk and credit risk policies that require the counterparty to provide collateral in cash or other
assets in most cases.
Other interests in unconsolidated structured entities
The Group’s interests in structured entities not held for the purposes of short-term trading activities are set out below, summarised by
the nature of the interest and limited to significant categories, based on maximum exposure to loss.
Nature of interest
Multi-seller
conduit
programme
Lending
Other
Total
Of which: Barclays
owned, not
consolidated
entities1
£m
£m
£m
£m
£m
As at 31 December 2024
Financial assets at fair value through the income statement
—
27
1,268
1,295
—
Financial assets at fair value through other comprehensive
income
—
3,206
2,365
5,571
—
Loans and advances at amortised cost
11,103
36,048
—
47,151
—
Debt securities at amortised cost
—
—
24,331
24,331
—
Other assets
—
—
—
—
—
Total on-balance sheet exposures
11,103
39,281
27,964
78,348
—
Total off-balance sheet notional amounts
11,530
25,737
—
37,267
—
Maximum exposure to loss
22,633
65,018
27,964
115,615
—
Total assets of the entity
41,431
203,723
75,284
320,438
As at 31 December 2023
Financial assets at fair value through the income statement
—
38
1,103
1,141
907
Financial assets at fair value through other comprehensive
income
—
638
200
838
—
Loans and advances at amortised cost
8,903
25,413
—
34,316
—
Debt securities at amortised cost
—
—
18,487
18,487
—
Other assets
38
88
4
130
—
Total on-balance sheet exposures
8,941
26,177
19,794
54,912
907
Total off-balance sheet notional amounts
11,947
12,600
—
24,547
—
Maximum exposure to loss
20,888
38,777
19,794
79,459
907
Total assets of the entity
35,439
165,319
108,751
309,509
8,704
Note:
1Comprises of Barclays owned, not consolidated structured entities per IFRS 10 Consolidated Financial Statements, and Barclays sponsored entities, Refer to Note 33 Principal
subsidiaries for more details on consolidation.
Maximum exposure to loss
Unless specified otherwise below, the Group’s maximum exposure to loss is the total of its on-balance sheet positions and its off-
balance sheet arrangements, being loan commitments and financial guarantees. Exposure to loss is mitigated through collateral,
financial guarantees, the availability of netting and credit protection held.
Multi-seller conduit programme
Barclays' multi-seller conduit programme engages in providing financing to various clients and holds whole or partial interests in pools of
receivables or similar obligations. These instruments are protected from loss through over-collateralisation, seller guarantees, or other
credit enhancements provided to the conduit entities. The Group’s off-balance sheet exposure included in the table above represents
liquidity facilities that are provided to the conduit for the benefit of the holders of the commercial paper issued by the conduit and will
only be drawn where the conduit is unable to access the commercial paper market. If these liquidity facilities are drawn, the Group is
protected from loss through over-collateralisation, seller guarantees, or other credit enhancements provided to the conduit.
Lending
The portfolio includes lending provided by the Group to unconsolidated structured entities in the normal course of its lending business
to earn income in the form of interest and lending fees and includes loans to structured entities that are generally collateralised by
Strategy
Shareholder
information
Climate and
sustainability report
Governance
Risk
review
Financial
review
Financial
statements
Barclays PLC 2024
Annual Report
on Form 20-F
435
Notes to the financial statements (continued)
Scope of consolidation
property, equipment or other assets. All loans are subject to the Group’s credit sanctioning process. Collateral arrangements are
specific to the circumstances of each loan with additional guarantees and collateral sought from the sponsor of the structured entity
for certain arrangements. During the period the Group incurred immaterial impairment against such facilities.
Other
This includes fair value loans with structured entities where the market risk is materially hedged with corresponding derivative contracts,
interests in debt securities issued by securitisation vehicles and drawn and undrawn loan facilities to these entities. In addition, other
includes investment funds with interests restricted to management fees based on performance of the fund and trusts held on behalf of
beneficiaries with interests restricted to unpaid fees.
Assets transferred to sponsored unconsolidated structured entities
Barclays is considered to sponsor another entity if: it had a key role in establishing that entity, it transferred assets to the entity, the
Barclays name appears in the name of the entity or it provides guarantees on the entity’s performance. As at 31 December 2024,
assets transferred to sponsored unconsolidated structured entities were £890m (2023: £1,420m).
Strategy
Shareholder
information
Climate and
sustainability report
Governance
Risk
review
Financial
review
Financial
statements
Barclays PLC 2024
Annual Report
on Form 20-F
436
Notes to the financial statements (continued)
Scope of consolidation
35Investments in associates and joint ventures
Accounting for associates and joint ventures
The equity accounted associates include the Group's investment in the Business Growth Fund £678m 2023: £648m) which has
increased due to a fair value gain in its investments by £30m (2023: £(10)m). The joint ventures held at fair value through profit or loss
has decreased to £171m (2023: £516m) majorly due to disposal of holdings.
2024
2023
Associates
Joint ventures
Total
Associates
Joint ventures
Total
£m
£m
£m
£m
£m
£m
Equity accounted
692
199
891
670
209
879
Held at fair value through profit or loss
—
171
171
—
516
516
Total
692
370
1,062
670
725
1,395
Summarised financial information for the Group’s equity accounted associates and joint ventures is set out below. The amounts shown
are the Group’s share of the net income of the investees for the year ended 31 December 2024, with the exception of certain
undertakings for which the amounts are based on accounts made up to dates not earlier than three months before the balance sheet
date.
Associates
Joint ventures
2024
2023
2022
2024
2023
2022
£m
£m
£m
£m
£m
£m
Profit/(loss) from continuing operations
30
(10)
(21)
8
1
26
Other comprehensive income/(loss)
—
—
—
(1)
(3)
1
Total comprehensive income/(loss) from continuing operations
30
(10)
(21)
7
(2)
27
Unrecognised shares of the losses of individually immaterial associates and joint ventures were£nil (2023: £nil).
The Group has provided guarantees amounted to £nil (2023: £nil) to its joint ventures and associates. The Barclays drawn
commitments to finance or otherwise provide resources to its joint ventures and associates are £474m (2023: £474m) The Barclays
share of the associates and joint ventures unutilised credit facilities commitments amounted to £1,389m (2023: £1,695m).
36 Securitisations
Accounting for securitisations
The Group uses securitisations as a source of finance and a means of risk transfer. Such transactions generally result in the transfer of
contractual cash flows from portfolios of financial assets to holders of issued debt securities.
Securitisations may, depending on the individual arrangement, result in continued recognition of the securitised assets and the
recognition of the debt securities issued in the transaction; lead to partial continued recognition of the assets to the extent of the
Group’s continuing involvement in those assets or lead to derecognition of the assets and the separate recognition, as assets or
liabilities, of any rights and obligations created or retained in the transfer. Full derecognition only occurs when the Group transfers both
its contractual right to receive cash flows from the financial assets, or retains the contractual rights to receive the cash flows, but
assumes a contractual obligation to pay the cash flows to another party without material delay or reinvestment, and also transfers
substantially all the risks and rewards of ownership, including credit risk, prepayment risk and interest rate risk.
In the course of its normal banking activities, the Group makes transfers of financial assets, either where legal rights to the cash flows
from the asset are passed to the counterparty or beneficially, where the Group retains the rights to the cash flows but assumes a
responsibility to transfer them to the counterparty. Depending on the nature of the transaction, this may result in derecognition of the
assets in their entirety, partial derecognition or no derecognition of the assets subject to the transfer.
A summary of the main transactions, and the assets and liabilities and the financial risks arising from these transactions, is set out below:
Transfers of financial assets that do not result in derecognition
Securitisations
The Group was party to securitisation transactions involving its credit card balances, personal and mortgage loans.
In these transactions, the assets, interests in the assets, or beneficial interests in the cash flows arising from the assets, are transferred
to a special purpose entity, which then issues interest bearing debt securities to third-party investors.
Securitisations may, depending on the individual arrangement, result in continued recognition of the securitised assets and the
recognition of the debt securities issued in the transaction. Partial continued recognition of the assets to the extent of the Group’s
continuing involvement in those assets can also occur or derecognition of the assets and the separate recognition, as assets or
liabilities, of any rights and obligations created or retained in the transfer.
Strategy
Shareholder
information
Climate and
sustainability report
Governance
Risk
review
Financial
review
Financial
statements
Barclays PLC 2024
Annual Report
on Form 20-F
437
Notes to the financial statements (continued)
Scope of consolidation
The following table shows the carrying amount of securitised assets that have not resulted in full derecognition, together with the
associated liabilities, for each category of asset on the balance sheet:
2024
2023
Assets
Liabilities
Assets
Liabilities
Carrying
amount
Fair value
Carrying
amount
Fair value
Carrying
amount
Fair value
Carrying
amount
Fair value
£m
£m
£m
£m
£m
£m
£m
£m
Loans and advances at amortised cost
Credit cards, unsecured and other retail
lending
10,115
10,698
(2,130)
(2,134)
6,451
6,996
(2,369)
(2,336)
Mortgage assets
254
263
(21)
(20)
478
499
(21)
(26)
Financial assets at FVTPL
Mortgage assets
576
576
—
—
452
452
—
—
Assets included in disposal group
classified as held for sale
Personal Loans
846
826
—
—
—
—
—
—
Total
11,791
12,363
(2,151)
(2,154)
7,381
7,947
(2,390)
(2,362)
Balances included within loans and advances at amortised cost represent securitisations where substantially all the risks and rewards of
the asset have been retained by the Group and balances included within Financial assets at FVTPL and Assets included in disposal
groups classified as held for sale represent securitisations where the risks and rewards are neither substantially transferred nor
retained.
The relationship between the transferred assets and the associated liabilities is that holders of notes may only look to cash flows from
the securitised assets for payments of principal and interest due to them under the terms of their notes, although the contractual
terms of their notes may be different to the maturity and interest of the transferred assets.
If Barclays transfers a financial asset but does not transfer or retain substantially all the risk and rewards of the asset and retains control
over it, the transferred assets is recognised to the extent of Barclays’ continuing involvement. Total Financial assets of £11,951 (2023:
£3,353m) were originally transferred in this manner and the carrying value of the asset representing continued involvement is included
in the table above.
For transfers of assets in relation to repurchase agreements, refer to Note 37.
Continuing involvement in financial assets that have been derecognised
In some cases, the Group may have transferred a financial asset in its entirety but may have continuing involvement in it. This arises in
asset securitisations where loans and asset backed securities were derecognised as a result of the Group’s involvement with asset
arises from providing financing into these structures in the form of retained notes, which do not bear first losses.
The table below shows the potential financial implications of such continuing involvement:
Continuing involvement1
Gain from continuing involvement
Carrying amount
Fair value
Maximum
exposure to loss2
For the year ended
Cumulative to 31
December
Type of transfer
£m
£m
£m
£m
£m
2024
Asset backed securities
53
53
130
1
1
Residential mortgage backed securities
4,462
4,454
4,462
194
261
Commercial mortgage backed securities
377
334
377
3
21
Total
4,892
4,841
4,969
198
283
2023
Asset backed securities
2
2
2
—
3
Residential mortgage backed securities
1,798
1,796
1,798
49
68
Commercial mortgage backed securities
392
341
392
3
19
Total
2,192
2,139
2,192
52
90
Notes:
1Assets which represent the Group’s continuing involvement in derecognised assets are recorded in Loans and advances at amortised cost and Debt securities at FVTPL.
2Maximum exposure to loss includes notional value of undrawn loan commitment, if any.
Strategy
Shareholder
information
Climate and
sustainability report
Governance
Risk
review
Financial
review
Financial
statements
Barclays PLC 2024
Annual Report
on Form 20-F
438
Notes to the financial statements (continued)
Scope of consolidation
37 Assets pledged, collateral received and assets transferred
Assets are pledged or transferred as collateral to secure liabilities under repurchase agreements, securitisations and stock lending
agreements or as security deposits relating to derivatives. Assets transferred are non-cash assets transferred to a third party that do
not qualify for derecognition from the Group balance sheet, for example because Barclays retains substantially all the exposure to those
assets under an agreement to repurchase them in the future for a fixed price.
Assets pledged or transferred as collateral include all assets categorised as encumbered in the disclosure on pages 199 to 203 of the
Barclays PLC Pillar 3 Report 2024 (unaudited), other than those held in commercial paper conduits. In these transactions, the Group will
be required to step in to provide financing itself under a liquidity facility if the vehicle cannot access the commercial paper market.
Where non-cash assets are pledged or transferred as collateral for cash received, the asset continues to be recognised in full, and a
related liability is also recognised on the balance sheet. Where non-cash assets are pledged or transferred as collateral in an exchange
for non-cash assets, the transferred asset continues to be recognised in full, and there is no associated liability as the non-cash
collateral received is not recognised on the balance sheet. The Group is unable to use, sell or pledge the transferred assets for the
duration of the transaction and remains exposed to interest rate risk and credit risk on these pledged assets. Unless stated, the
counterparty's recourse is not limited to the transferred assets.
Collateralised transactions, such as securities lending and borrowing, repurchase and derivative transactions are conducted in
accordance with standard terms which are customary in the market.
The following table summarises the nature and carrying amount of the assets pledged as security:
2024
2023
£m
£m
Cash collateral
76,401
73,495
Loans and advances at amortised cost
63,531
71,018
Trading portfolio assets
107,368
117,325
Financial assets at fair value through the income statement
5,728
9,847
Financial assets at fair value through other comprehensive income
20,982
23,503
Assets pledged
274,010
295,188
The following table summarises the transferred financial assets and the associated liabilities. The transferred assets represent the
gross carrying value of the assets pledged and the associated liabilities represent the IFRS balance sheet value of the related liability
recorded on the balance sheet:
Transferred assets
Associated
liabilities
£m
£m
As at 31 December 2024
Derivatives
75,157
(75,157)
Repurchase agreements
77,793
(53,481)
Securities lending arrangements
106,106
—
Other
14,954
(13,580)
274,010
(142,218)
As at 31 December 2023
Derivatives
78,390
(78,390)
Repurchase agreements
86,712
(55,006)
Securities lending arrangements
118,632
—
Other
11,454
(10,179)
295,188
(143,575)
For repurchase agreements the difference between transferred assets and the associated liabilities is predominantly due to IFRS
netting. Included within Other are agreements where a counterparty's recourse is limited to the transferred assets. The relationship
between the gross transferred assets and the associated liabilities is that holders of notes may only look to cash flows from the
securitised assets for payments of principal and interest due to them under the terms of their notes.
Carrying value
Fair value
Transferred assets
Associated
liabilities
Transferred assets
Associated
liabilities
Net position
£m
£m
£m
£m
£m
2024
Recourse to transferred assets only
10,369
(2,151)
10,961
(2,154)
8,807
2023
Recourse to transferred assets only
7,381
(2,390)
7,947
(2,362)
5,585
The Group has an additional £9.5bn (2023: £6.4bn) of loans and advances within its asset backed funding programmes that can readily
be used to raise additional secured funding and are available to support future issuances.
Strategy
Shareholder
information
Climate and
sustainability report
Governance
Risk
review
Financial
review
Financial
statements
Barclays PLC 2024
Annual Report
on Form 20-F
439
Notes to the financial statements (continued)
Scope of consolidation
Collateral held as security for assets
Under certain transactions, including reverse repurchase agreements and stock borrowing transactions, the Group is allowed to resell
or re-pledge the collateral held.Collateralised transactions, such as securities lending and borrowing, repurchase and derivative
transactions are conducted in accordance with standard terms which are customary in the market.
The fair value at the balance sheet date of collateral accepted and re-pledged or transferred to others was as follows:
2024
2023
£m
£m
Fair value of securities accepted as collateral
1,318,862
1,207,697
Of which fair value of securities re-pledged/transferred to others
1,191,938
1,105,140
Strategy
Shareholder
information
Climate and
sustainability report
Governance
Risk
review
Financial
review
Financial
statements
Barclays PLC 2024
Annual Report
on Form 20-F
440
Notes to the financial statements (continued)
Other disclosure matters
Other disclosure matters
The notes included in this section focus on related party transactions, Auditor's remuneration, Barclays PLC (the Parent company)
disclosure, Directors’ remuneration and Transition disclosures. Related parties include any subsidiaries, associates, joint ventures and
Key Management Personnel.
38 Related party transactions and Directors’ remuneration
Related party transactions
Parties are considered to be related if one party has the ability to control the other party or exercise significant influence over the other
party in making financial or operational decisions, or one other party controls both.
Subsidiaries
Transactions between Barclays PLC and its subsidiaries meet the definition of related party transactions. Where these are eliminated
on consolidation, they are not disclosed in the Group’s financial statements. Transactions between Barclays PLC and its subsidiaries are
fully disclosed in Barclays PLC’s financial statements. A list of the Group’s principal subsidiaries is shown in Note 33.
Associates, joint ventures and other entities
The Group provides banking services to its associates, joint ventures and the Group pension funds (principally the UK Retirement Fund),
providing loans, overdrafts, interest and non-interest bearing deposits and current accounts to these entities as well as other services.
Group companies also provide investment management and custodian services to the Group pension schemes. All of these
transactions are conducted on the same terms as third-party transactions. Summarised financial information for the Group’s
investments in associates and joint ventures is set out in Note 35.
Amounts included in the Group’s financial statements, in aggregate, by category of related party entity are as follows:
Associates
Joint ventures
Pension funds
£m
£m
£m
For the year ended and as at 31 December 2024
Total income
(2)
56
2
Credit impairment charges
—
—
—
Operating expenses
(21)
—
(1)
Total assets
—
1,104
—
Total liabilities
64
—
176
For the year ended and as at 31 December 2023
Total income
13
70
4
Credit impairment charges
—
—
—
Operating expenses
(20)
—
(1)
Total assets
—
1,254
0
Total liabilities
158
—
144
For the year ended and as at 31 December 2022
Total income
(2)
91
5
Credit impairment charges
—
—
—
Operating expenses
(15)
—
(1)
Total liabilities includes derivatives transacted on behalf of the pension funds of £100m (2023: £77m).
Key Management Personnel
Key Management Personnel are defined as those persons having authority and responsibility for planning, directing and controlling the
activities of Barclays PLC (directly or indirectly) and comprise the Directors and Officers of Barclays PLC, certain direct reports of the
Group Chief Executive and the heads of major business units and functions.
The Group provides banking services to Key Management Personnel and persons connected to them.Transactions during the year and
the balances outstanding were as follows:
Loans outstanding
2024
2023
£m
£m
As at 1 January
8.3
7.5
Loans issued during the year1
11.8
2.5
Loan repayments during the year2
(2.6)
(1.7)
As at 31 December
17.5
8.3
Notes:
1Includes loans issued to existing Key Management Personnel and new or existing loans issued to newly appointed Key Management Personnel.
2Includes loan repayments by existing Key Management Personnel and loans to former Key Management Personnel.
No allowances for impairment were recognised in respect of loans to Key Management Personnel (or any connected person).
Strategy
Shareholder
information
Climate and
sustainability report
Governance
Risk
review
Financial
review
Financial
statements
Barclays PLC 2024
Annual Report
on Form 20-F
441
Notes to the financial statements (continued)
Other disclosure matters
Deposits outstanding
2024
2023
£m
£m
As at 1 January
15.4
15.2
Deposits received during the year1
176.2
105.7
Deposits repaid during the year2
(168.3)
(105.5)
As at 31 December
23.3
15.4
Notes:
1Includes deposits received from existing Key Management Personnel and new or existing deposits received from newly appointed Key Management Personnel.
2Includes deposits repaid by existing Key Management Personnel and deposits of former Key Management Personnel.
Total commitments outstanding
Total commitments outstanding refers to the total of any undrawn amounts on credit cards and/or overdraft facilities provided to Key
Management Personnel. Total commitments outstanding as at 31 December 2024 were £0.6m (2023: £0.5m).
All loans to Key Management Personnel (and persons connected to them) were made in the ordinary course of business; were made on
substantially the same terms, including interest rates and collateral, as those prevailing at the same time for comparable transactions
with other persons; and did not involve more than a normal risk of collectability or present other unfavourable features.
Remuneration of Key Management Personnel
Total remuneration awarded to Key Management Personnel below represents salaries, short-term benefits and pensions contributions
received during the year and awards made as part of the latest remuneration decisions in relation to the year. Costs recognised in the
income statement reflect the accounting charge for the year included within operating expenses. The difference between the values
awarded and the recognised income statement charge principally relates to the recognition of costs for deferred awards. Figures are
provided for the period that individuals met the definition of Key Management Personnel.
2024
2023
2022
£m
£m
£m
Salaries and other short-term benefits
45.0
33.3
32.4
Pension costs
0.1
—
—
Other long-term benefits
10.5
7.2
7.8
Share-based payments
18.1
10.2
9.8
Employer social security charges on emoluments
8.7
6.3
6.7
Costs recognised for accounting purposes
82.4
57.0
56.7
Employer social security charges on emoluments
(8.7)
(6.3)
(6.7)
Other long-term benefits – difference between awards granted and costs recognised
6.6
1.1
—
Share-based payments – difference between awards granted and costs recognised
7.4
6.0
6.5
Total remuneration awarded
87.7
57.8
56.5
Disclosure required by the Companies Act 2006
The following information regarding the Barclays PLC Board of Directors is presented in accordance with the Companies Act 2006:
2024
2023
2022
£m
£m
£m
Aggregate emoluments1
10.9
9.8
9.3
Amounts paid under LTIPs2
—
—
0.4
10.9
9.8
9.7
Notes:
1The aggregate emoluments include amounts paid for the 2024 year. In addition, deferred share awards for 2024 with a total value at grant of £1.8m (2023: £1.5m, 2022: £2.3m) will be
made to Directors which will only vest subject to meeting certain conditions.
2The figure above for "Amounts paid under LTIPs" relates to tranches of prior year LTIP awards that were released to Directors during the year. The LTIP figure in the single total figure
table for Executive Directors' 2024 remuneration in the Directors' Remuneration report relates to the 2022-2024 LTIP cycle, the first tranche of which is scheduled to be released
following the performance period ending on 31 December 2024.
There were no pension contributions paid to defined contribution schemes on behalf of Directors (2023: £nil, 2022:£nil). There were no
notional pension contributions to defined contribution schemes.
As at 31 December 2024, there were no Directors accruing benefits under a defined benefit scheme (2023: nil, 2022: nil).
Directors’ and Officers’ shareholdings and options
The beneficial ownership of ordinary share capital of Barclays PLC by all Directors and Officers of Barclays PLC (involving 29 persons) at
31 December 2024 amounted to 20,479,846 (2023: 14,833,002) ordinary shares of 25p each (0.14% of the ordinary share capital
outstanding).
As at 31 December 2024, Executive Directors and Officers of Barclays PLC (involving 17 persons) held options to purchase a total of
49,911 (2023: 67,319) Barclays PLC ordinary shares of 25p each at a weighted average price of 119p under Sharesave.
Strategy
Shareholder
information
Climate and
sustainability report
Governance
Risk
review
Financial
review
Financial
statements
Barclays PLC 2024
Annual Report
on Form 20-F
442
Notes to the financial statements (continued)
Other disclosure matters
Advances and credit to Directors and guarantees on behalf of Directors
In accordance with Section 413 of the Companies Act 2006, the total amount of advances and credits made available in 2024 to
persons who served as Directors during the year was £0.6m (2023: £0.3m). The total value of guarantees entered into on behalf of
Directors during 2024 was £nil (2023: £nil).
39Auditor’s remuneration
Auditor’s remuneration is included within consultancy, legal and professional fees in administration and general expenses and
comprises:
2024
2023
2022
£m
£m
£m
Audit of the Barclays Group's annual accounts
13
11
10
Other services:
Audit of the Company's subsidiaries1
58
53
48
Other audit related fees2
14
12
11
Other services
6
2
2
Total auditor's remuneration
91
78
71
Notes:
1Comprises the fees for the statutory audit of subsidiaries both inside and outside the UK and fees for work performed by associates of KPMG in respect of the consolidated financial
statements of the Company.
2Comprises services in relation to statutory and regulatory filings. These include audit services for the review of the interim financial information under the Listing Rules of the UK listing
authority.
Audit scope changes are finalised following the completion of the audit and recognised when agreed. The 2024 audit fee includes £2m
(2023:£1m,2022: £2m ) relating to the previous year’s audit.
2024
2023
2022
Barclays associated pension schemes
£m
£m
£m
Audit fee
0.3
0.3
0.3
Under SEC regulations the remuneration of our auditors is required to be presented as follows: audit fees £77m (2023: £70m, 2022:
£64m), audit-related fees £9m (2023: £6m, 2022: £6m), tax fees £nil (2023: £nil, 2022: £nil), and all other fees £5m (2023: £2m, 2022:
£1m).
40Assets and liabilities included in disposal group classified as held for sale
Accounting for Non-current assets held for sale and associated liabilities
The Group applies IFRS 5 Non-current Assets Held for Sale and Discontinued Operations. Non-current assets (or disposal groups) are
classified as held for sale when their carrying amount is to be recovered principally through a sale transaction rather than continuing use.
In order to be classified as held for sale, the asset must be available for immediate sale in its present condition subject only to terms that
are usual and customary, and the sale must be highly probable. Non-current assets (or disposal groups) held for sale are measured at
the lower of carrying amount and fair value less cost to sell. Assets and liabilities classified as held for sale are presented separately in
the consolidated balance sheet.
Management judgement is required in determining whether the IFRS 5 held for sale classification criteria are met, in particular whether
the sale is highly probable and expected to qualify for recognition as a completed sale within 12 months of classification. This
assessment requires consideration of how committed management is to the sales plan, the likelihood of obtaining regulatory or other
external approvals which is often required for sales of banking operations and how committed the buyer is to complete the sales
transaction within the agreed timelines.
Barclays Bank Ireland PLC agreed the sale of its German consumer finance business (comprising credit cards, unsecured personal loans
and deposits), currently within Head Office. Barclays has recorded a £9m loss for the disposal group within Head Office for FY24. After
the balance sheet date, Barclays announced it had completed the sale as part of our ambition to simplify Barclays and support our focus
our key businesses.
Barclays has decided not to bid to become the sole issuer for a co-branded card portfolio in USCB, leading to its transfer in H1 2026.
This portfolio held within USCB is expected to be sold at a premium. The extension to the 1 year sale period is aligned to the signed
contractual arrangements in place to allow the transition of the portfolio in a controlled and effective manner.
Strategy
Shareholder
information
Climate and
sustainability report
Governance
Risk
review
Financial
review
Financial
statements
Barclays PLC 2024
Annual Report
on Form 20-F
443
Notes to the financial statements (continued)
Other disclosure matters
The perimeter of the disposal group has been accounted for in line with the requirements of IFRS5 as at 31 December 2024. A detailed
analysis of the disposal group is presented below. The 2024 disposal group includes the German Consumer Finance Business within
Head Office and the US Cards portfolio within USCB. The 2023 Disposal Group includes the German Consumer Finance Business:
As at 31 December
2024
2023
£m
£m
Assets included in disposal groups classified as held for sale
Loans and advances to customers
9,544
3,855
Intangible assets
25
15
Property, plant and equipment
24
24
Other assets
260
22
Total assets classified as held for sale
9,854
3,916
Liabilities included in disposal groups classified as held for sale
Deposits from customers
3,647
3,077
Other liabilities
77
83
Provisions
2
4
Total liabilities classified as held for sale
3,726
3,164
Net assets classified as held for sale
6,128
752
41Business acquisitions
Accounting for business acquisitions
IFRS 3 establishes principles and requirements for how an acquirer in a business combination:
•recognises and measures in its financial statements the assets and liabilities acquired, and any interest in the acquiree held by other
parties;
•recognises and measures the goodwill acquired in the business combination or a gain from a bargain purchase; and
•determines what information to disclose to enable users of the financial statements to evaluate the nature and financial effects of
the business combination.
In accordance with IFRS 3, a business consists of inputs and processes applied to those inputs that have the ability to contribute to the
creation of outputs.
The core principles in IFRS 3 are that an acquirer measures the cost of the acquisition at the fair value of the consideration paid;
allocates that cost to the acquired identifiable assets and liabilities on the basis of their fair values; allocates the rest of the cost to
goodwill; and recognises any excess of acquired assets and liabilities over the consideration paid (a ‘bargain purchase’) in profit or loss
immediately. The acquirer discloses information that enables users to evaluate the nature and financial effects of the acquisition.
Acquisition
On 1 November 2024, Barclays Bank UK PLC completed the acquisition of Tesco Bank. The acquired business includes credit cards,
unsecured personal loans, deposits and the operating infrastructure (Retail Bank Assets and Liabilities), along with the transfer of
c.2,600 employees. The acquisition also includes assets, liabilities, and responsibilities related to a credit card securitisation originated
under the Tesco Bank brand. The acquisition of Tesco Bank by Barclays Bank UK PLC did not involve the acquisition of any equity
interests.
In addition to the business acquisition, Barclays Bank UK has entered into a long-term, exclusive strategic partnership with Tesco Stores
Limited for an initial period of 10 years to market and distribute credit cards, unsecured personal loans and deposits using the Tesco
PLC ("Tesco") brand, as well as explore other opportunities to offer financial services to Tesco customers. Partnering with Tesco, the
UK's largest retailer which also operates the UK's largest loyalty scheme, represents a key opportunity to further our UK retail banking
strategic ambitions. The acquired customer base complements Barclays Bank UK's current business, as well as buildings on its existing
UK strategic partnerships with other leading retail, consumer electronics and loyalty programme brands. As costs are incurred under
this partnership agreement, these are accounted for in line with Barclays relevant accounting policy for such costs.
The acquisition consisted of £4,051m of gross credit card receivables, £4,034m of gross unsecured personal loans, £6,923m of
customer deposits and certain other assets and liabilities for total consideration of £617m in cash. Net assets acquired at completion of
the transaction were £1,173m and a gain on acquisition of £556m (£2m in additional costs recognised in Barclays PLC compared with
Barclays Bank UK PLC) has been recognised in the income statement. After acquisition, an expected credit loss allowance of £209m
has been recognised on credit cards and loan receivables along with the associated impairment expense.
Barclays Bank UK PLC will, in the 12 months following the acquisition, continue to assess the fair values of the acquired balances for any
impact of new information regarding conditions that existed as at the acquisition date that would result in a measurement period
adjustment.
Strategy
Shareholder
information
Climate and
sustainability report
Governance
Risk
review
Financial
review
Financial
statements
Barclays PLC 2024
Annual Report
on Form 20-F
444
Notes to the financial statements (continued)
Other disclosure matters
Acquisition of
Tesco Bank Retail
Bank Assets and
Liabilities1
Barclays Group
As at acquisition date
£m
Assets
Cash and balances at central banks
337
Cash and collateral and settlement balances
50
Loans and advances at amortised cost to customers2
8,085
Of which:
Credit card receivables
4,051
Unsecured loan receivables
4,034
Loans and advances at amortised cost to banks
70
Derivative financial instruments
20
Goodwill and intangible assets3
83
Property, plant and equipment
21
Other assets
132
Total assets
8,798
—
Liabilities
Deposits at amortised cost from customers
(6,923)
Debt securities in issue
(554)
Other liabilities
(83)
Provisions
(65)
Total liabilities
(7,625)
Notes:
1This financial information represents the acquisition of the retail banking business of Tesco Bank by the Barclays Bank UK Group as at the acquisition date
1 November 2024.
2Loans and advances at amortised cost acquired includes total credit cards and unsecured loan receivables of £8,085m, recognised initially at fair value at the point of acquisition and
subsequently measured at amortised cost. This represents a gross contractual amount receivable of £8,634m comprising credit cards receivables of £4,323m and unsecured loan
receivables of £4,311m. After acquisition an expected credit loss allowance of £209m has been recognised, comprising £133m on credit cards receivables and £76m on unsecured loan
receivables along with the associated impairment expense.
3Intangible assets include £66m of Purchased Credit Cards Receivables (PCCR) and £17m of Core Deposit Intangibles (CDI).
The Barclays Bank UK Group has accounted for the acquisition of Tesco Bank as a business combination using the acquisition method.
Consequently, the Barclays Bank UK Group recognised at fair value all identifiable assets, including those not currently on the Tesco
Bank balance sheet, and assumed liabilities of Tesco Bank, and the Retail Bank Assets and Liabilities on its consolidated balance sheet.
There was no contingent consideration payable in connection with the acquisition. The Barclays Bank UK Group recognised the Retail
Bank Assets and Liabilities as financial assets and liabilities, initially at fair value at the point of acquisition and subsequently at amortised
cost. Fair valuation was performed based on the discounting of future expected cash flows.
In connection with the acquisition of Tesco Bank, Tesco Personal Finance plc agreed to indemnify Barclays Bank UK PLC for certain
matters. An indemnification asset of £91m has been recorded at the acquisition date for this arrangement. Of the £91m balance, £60m
relates to exposures transferred to Barclays Bank UK PLC where there is a present obligation, and it is probable there will be an outflow
of resources. £31m relates to exposures where there is a present obligation, however, it is not probable an outflow of resources will
result. The maximum reimbursement under the indemnity excluding claims relating to PPI is capped at £350m expiring after four years
and including claims related to PPI is capped at £600m.
Since the acquisition date, total operating income of £105m and profit before tax of £37m from the retail banking business of Tesco
Bank have been recognised within the consolidated income statement and the consolidated statement of comprehensive income for
the year ended 31 December 2024. This excludes the gain recognised on acquisition of £556m and expected credit loss allowance of
£209m recognised subsequently along with the associated impairment expense on credit cards receivables and unsecured loan
receivables.
Had the retail banking business of Tesco Bank been acquired from 1 January 2024, additional income of £420m and profit before tax of
£118m would have been recognised. Acquisition-related costs of £18m, mainly attributable to professional and legal fees, have been
recognised as an expense in the consolidated income statement mainly within Administrative and general expenses in the year ended
31 December 2024 (2023: £2m, 2022: £nil).
Strategy
Shareholder
information
Climate and
sustainability report
Governance
Risk
review
Financial
review
Financial
statements
Barclays PLC 2024
Annual Report
on Form 20-F
445
Notes to the financial statements (continued)
Other disclosure matters
42Barclays PLC (the Parent company)
Total income
Dividend received from subsidiaries
Dividends received from subsidiaries of £3,087m (2023: £2,818m, 2022: £2,797m) relates to dividends received from Barclays
Execution Services Limited £115m, Barclays Principal Investments Limited £215m, Barclays Bank UK PLC £975m and Barclays Bank
PLC £1,782m.
Other income
Other income of £1,183m (2023: £1,174m, 2022: £(654)m expense) includes £990m (2023: £985m, 2022: £905m) of income received
from gross coupon payments on Barclays Bank PLC and Barclays Bank UK PLC-issued AT1 securities, net fee and commission income
from subsidiaries £135m (2023: £139m, 2022: £114m) and foreign exchange and fair value gains of £58m (2023: £50m, 2022:
£(1,673)m loss).
Total assets and liabilities
Investment in subsidiaries
The investment in subsidiaries of £63,315m (2023: £64,461m) predominantly relates to investments in the ordinary shares of Barclays
Bank PLC of £36,340m (2023: £36,340m) and their AT1 securities of £9,616m (2023: £10,757m), as well as investments in the ordinary
shares of Barclays Bank UK PLC of £14,245m (2023: £14,245m) and their AT1 securities of £2,435m (2023: £2,439m). The decrease of
£1,146m during the year resulted from net redemptions of AT1 holdings.
Impairment in subsidiaries
At the end of each reporting period an impairment review is undertaken in respect of investment in the ordinary shares of subsidiaries.
Where impairment may be indicated a test of the carrying value against the recoverable value is performed; impairment being indicated
where the investment exceeds the recoverable amount. The recoverable amount is calculated as a value in use (VIU) which is derived
from the present value of future cash flows expected to be received from the investment. The VIU calculations use forecast profits
based on financial budgets approved by management, covering a five year period as an approximation of future cash flows discounted
using a pre-tax discount rate appropriate to the subsidiary being tested. A terminal growth rate has then been applied to the cash flows
thereafter which is based upon expectations of future inflation rates. The 2024 review did not identify any subsidiaries with indicators of
impairment.
Loans and advances to subsidiaries
During the year, loans and advances to subsidiaries decreased by £519m to £18,407m (2023: £18,926m). The decrease was largely due
to maturities of £416m intra-group loans to Barclays PLC subsidiaries and £172m Nostro positions.This was partially offset by the share
allotment receipts in relation to employee share schemes of £104m.
Subordinated liabilities and debt securities in issue
During the year, subordinated liabilities decreased to £9,706m (2023: £10,018m) due to the maturity of USD 487m of Tier 2 Notes.
Debt securities in issue of £16,337m (2023: £18,308m) have reduced during the year primarily due to redemption of £1,200m Fixed
Rate Senior Notes and EUR 750m Fixed Rate Senior Notes.
Financial assets and liabilities designated at fair value
Financial liabilities designated at fair value of £42,324m (2023: £31,832m) primarily included new senior issuances of £11,632m during
the year with principal amounts of EUR 3,250m Fixed Rate Resetting Senior Callable Notes, EUR 750m Floating Rate Senior Notes,
£1,000m Fixed-to-Floating Rate Senior Callable Notes and USD 8,250m Floating Rate Senior Notes. Barclays PLC also issued £1,788m
of Subordinated Debt in the year with principal amounts of EUR 1,500mof Fixed-to-Floating Rate Resetting Subordinated Callable
Notes, AUD 500m of Fixed-to-Floating Subordinated Callable Notes and AUD 500m of Floating Subordinated Callable Notes. The
proceeds raised through these transactions were used to invest in subsidiaries of Barclays PLC and are included within the financial
assets designated at fair value through the income statement balance of £44,435m (2023: £35,787m). The effect of changes in the
liabilities at fair value, including those due to credit risk, is expected to offset the changes in the fair value of the related financial asset in
the income statement. The difference between the financial liabilities carrying amount and the contractual amount on maturity is
£195m (2023: £1,838m).
Derivative financial instruments
During the year derivative financial liabilities decreased by £57m to £654m (2023: £711m). This is primarily driven by the gain in
derivatives due to a mark to market movement.
Total equity
Called up share capital and share premium
Called up share capital and share premium of Barclays PLC is £4,186m (2023: £4,288m). The decrease in the year is primarily due to
818m shares repurchased with a total nominal value of £205m. This decrease was partially offset by shares issued under employee
share schemes.
Other equity instruments
Other equity instruments of £12,033m (2023: £13,198m) comprises AT1 securities issued by Barclays PLC. The AT1 securities are
perpetual securities with no fixed maturity and are structured to qualify as AT1 instruments under prevailing capital rules applicable as at
the relevant issue date. During the year there were two AT1 issuances with principal amounts totalling £1,604m (£1,250m and SGD 600m)
and redemptions with principal amounts totalling £2,765m (USD 2,000m and £1,250m). For further details, please refer to Note 27.
The Parent company financials on pages362 to 364 form part of this note.
Strategy
Shareholder
information
Climate and
sustainability report
Governance
Risk
review
Financial
review
Financial
statements
Barclays PLC 2024
Annual Report
on Form 20-F
446
Notes to the financial statements (continued)
Other disclosure matters
43Related undertakings
The Group’s corporate structure consists
of a number of related undertakings,
comprising subsidiary undertakings, joint
ventures, associated undertakings and
significant holdings. A full list of these
related undertakings is set out below,
together with the country of incorporation,
registered office (or principal place of
business) and the identity and percentage
of each share class held by the Group.
The information is provided as at
31 December 2024.
The entities are grouped by the countries
in which they are incorporated. The profits
earned by the activities of these entities
are in some cases taxed in countries other
than the country of incorporation, for
example where the entity carries on
business through a branch in a territory
outside of its country of incorporation .
Barclays PLC Country Snapshot provides
details of where the Group carries on its
business, where its profits are subject to
tax and the taxes it pays in each country it
operates in.
Wholly owned subsidiaries
Unless otherwise stated the undertakings
below are wholly owned and included in the
consolidation and the share capital held by
the Group comprises ordinary and/or
common shares, which are held by
subsidiaries of Barclays PLC. Unless
otherwise stated, the Group holds 100%
of the nominal value of each share class.
Notes
A
Directly held by Barclays PLC
B
Partnership Interest
C
Membership Interest
D
Guarantor
E
Preference Shares
F
A Preference Shares
G
B Preference Shares
H
Ordinary/Common Shares in addition to
other shares
I
A Ordinary Shares
J
B Ordinary Shares
K
C Ordinary Shares
L
F Ordinary Shares
M
First Preference Shares, Second
Preference Shares
N
Registered Address not in country of
Incorporation
O
Core Shares, Insurance (Classified)
Shares
P
Class B, C, D, E, F, G, H, I , J and K
Q
Non-Redeemable Ordinary Shares
Notes
R
Class A, B and C Shares
S
Class A and Class B Shares
T
PEF Carry Shares
U
Not Consolidated (see Note 34 IFRS12
Structured entities)
V
USD Linked Ordinary Shares
W
Redeemable Class B Shares
X
Capital Contribution Shares
Y
Class A Redeemable Preference Shares
Z
Class B Redeemable Preference Shares
AA
First Class Common Shares, Second
Class Common Shares
BB
GBP Tracker 1, USD Tracker 1, Euro
Tracker 1 Shares
CC
Non-Voting Redeemable Preference
Shares
DD
Ordinary "F" Shares - Variable
EE
Class C Preferred Shares and Class D
Preferred Shares
FF
Trust Interest
GG
A1 Ordinary Shares (42.85%) and A2
Preference Shares (45.18%)
HH
A2 Ordinary Shares (14.14%) and A3
Ordinary Shares(68.10%)
Wholly owned subsidiaries
Note
United Kingdom
1 Churchill Place, London, E14 5HP
Aequor Investments Limited
Alynore Investments Limited Partnership
B
Ardencroft Investments Limited
B D & B Investments Limited
B.P.B. (Holdings) Limited
Barclay Leasing Limited
Barclays Aldersgate Investments Limited
Barclays Asset Management Limited
Barclays Bank PLC
A, H
Barclays Bank UK PLC
A
Barclays Capital Asia Holdings Limited
Barclays Capital Nominees (No.2) Limited
Barclays Capital Nominees (No.3) Limited
Barclays Capital Nominees Limited
Barclays Capital Securities Client Nominee Limited
Barclays Capital Securities Limited
E, H
Barclays CCP Funding LLP
B
Barclays Converted Investments (No.2) Limited
Barclays Direct Investing Nominees Limited
Barclays Directors Limited
Barclays Equity Holdings Limited
Barclays Execution Services Limited
A
Barclays Executive Schemes Trustees Limited
Barclays Financial Planning Nominee Company
Limited
Barclays Funds Investments Limited
Barclays Group Holdings Limited
Barclays Industrial Development Limited
Barclays Industrial Investments Limited
Barclays Insurance Services Company Limited
Barclays International Holdings Limited
Barclays Investment Management Limited
Barclays Investment Solutions Limited
Barclays Leasing (No.9) Limited
Barclays Long Island Limited
Wholly owned subsidiaries
Note
Barclays Nominees (George Yard) Limited
U
Barclays OCIO Services Limited
Barclays Pension Funds Trustees Limited
Barclays Principal Investments Limited
A, I, J
Barclays Private Bank
Barclays SAMS Limited
Barclays Security Trustee Limited
A
Barclays Services (Japan) Limited
Barclays Shea Limited
Barclays Term Funding Limited Liability
Partnership
B
Barclays UK Investments Limited
Barclays Unquoted Investments Limited
Barclays Wealth Nominees Limited
Barclayshare Nominees Limited
Barcosec Limited
Barsec Nominees Limited
BB Client Nominees Limited
BMI (No.9) Limited
BNRI ENG 2014 Limited Partnership
B
BNRI ENG GP LLP
B
BNRI England 2012 Limited Partnership
B
Carnegie Holdings Limited
H, I, J
Chapelcrest Investments Limited
Clydesdale Financial Services Limited
Cornwall Home Loans Limited
CPIA England 2009 Limited Partnership
B
CPIA England No.2 Limited Partnership
B
Dorset Home Loans Limited
Durlacher Nominees Limited
Eagle Financial and Leasing Services (UK)
Limited
Finpart Nominees Limited
FIRSTPLUS Financial Group Limited
Foltus Investments Limited
Global Dynasty Natural Resource Private Equity
Limited Partnership
B
Globe Nominees Limited
Hawkins Funding Limited
Heraldglen Limited
H, M
Isle of Wight Home Loans Limited
J.V. Estates Limited
Kirsche Investments Limited
Leonis Investments LLP
B
Long Island Assets Limited
Maloney Investments Limited
Menlo Investments Limited
Mercantile Credit Company Limited
Mercantile Leasing Company (No.132) Limited
MK Opportunities LP
B
Naxos Investments Limited
North Colonnade Investments Limited
Northwharf Investments Limited
T
Northwharf Nominees Limited
Oak Pension Asset Management Limited
U
Radbroke Mortgages UK Limited
Real Estate Participation Management Limited
Real Estate Participation Services Limited
Relative Value Investments UK Limited Liability
Partnership
B
Relative Value Trading Limited
Strategy
Shareholder
information
Climate and
sustainability report
Governance
Risk
review
Financial
review
Financial
statements
Barclays PLC 2024
Annual Report
on Form 20-F
447
Notes to the financial statements (continued)
Other disclosure matters
Wholly owned subsidiaries
Note
Roder Investments No. 1 Limited
H, BB
Roder Investments No. 2 Limited
H, BB
RVT CLO Investments LLP
B
Surety Trust Limited
Sustainable Impact Capital Limited
Swan Lane Investments Limited
US Real Estate Holdings No.1 Limited
US Real Estate Holdings No.2 Limited
US Real Estate Holdings No.3 Limited
US Real Estate Holdings No.4 Limited
US Real Estate Holdings No.5 Limited
US Real Estate Holdings No.6 Limited
Water Street Investments Limited
U
Wedd Jefferson (Nominees) Limited
Westferry Investments Limited
Woolwich Homes Limited
Woolwich Qualifying Employee Share Ownership
Trustee Limited
Zeban Nominees Limited
C/O Teneo Financial Advisory Limited, 3rd
Floor, The Colmore Building, 20 Colmore Circus
Queensway, Birmingham, West Midlands, B4
6AT
Barclays Capital Finance Limited (Dissolved 5
January 2025)
Barclays Unquoted Property Investments Limited
(In Liquidation)
Barclays Nominees (Branches) Limited (In
Liquidation)
Ascot House, Maidenhead Office Park,
Maidenhead, SL6 3QQ
Kensington Mortgage Company Limited
Kensington Mortgage Services Limited
1-4, Clyde Place Lane, Glasgow, G5 8DP
R.C. Greig Nominees Limited
50 Lothian Road, Festival Square, Edinburgh,
EH3 9WJ
BNRI PIA Scot GP Limited
BNRI Scots GP, LLP
B
Pecan Aggregator LP
B
Logic House, Waterfront Business Park, Park,
Fleet Road, Fleet, GU51 3SB
The Logic Group Enterprises Limited
The Logic Group Holdings Limited
I
9, allée Scheffer, L-2520, Luxembourg
Barclays Claudas Investments Partnership
B, N
Barclays Pelleas Investments Limited Partnership
B, N
Barclays Blossom Finance Limited Partnership
B, N
Wholly owned subsidiaries
Note
Argentina
Marval, O’Farrell & Mairal, Av. Leandro N.
Alem 882, Buenos Aires, C1001AAQ
Compañia Regional del Sur S.A.
Brazil
Av. Brigadeiro Faria Lima, No.4.440, 12th Floor,
Bairro Itaim Bibi, Sao Paulo, CEP, 04538-132
Barclays Brasil Assessoria Financeira Ltda
BNC Brazil Consultoria Empresarial Ltda
Canada
333 Bay Street, Suite 4910, Toronto ON M5H
2R2
Barclays Capital Canada Inc.
B, N
Stikeman Elliot LLP, 199 Bay Street, 5300
Commerce Court West, Toronto ON M5L 1B9
Barclays Corporation Limited
1 Churchill Place, London, E14 5HP
CPIA Canada Holdings
B, N
Cayman Islands
PO Box 309, Ugland House, George Town,
Grand Cayman, KY1-1104
Alymere Investments Limited
F, G,
H
Analytical Trade UK Limited
Barclays Capital (Cayman) Limited
Barclays Securities Financing Limited
F,
G ,H
Barclays US Holdings Limited
E, I
Braven Investments No.1 Limited
Calthorpe Investments Limited
Capton Investments Limited
Claudas Investments Limited
H, Y,
Z
Claudas Investments Two Limited
CPIA Investments No.2 Limited
E,H
Gallen Investments Limited
Hornbeam Limited
U
Mintaka Investments No. 4 Limited
Palomino Limited
Pelleas Investments Limited
Pippin Island Investments Limited
Razzoli Investments Limited
E, H
RVH Limited
E, H
France
34-36 avenue de Friedland, 75008, Paris
Barclays ADF SA
Germany
Stuttgarter Straße 55-57, 73033 Göppingen
Holding Stuttgarter Straße GmbH
(In Liquidation)
Wholly owned subsidiaries
Note
Guernsey
P.O. Box 33, Dorey Court, Admiral Park, St.
Peter Port, GY1 4AT
Barclays Insurance Guernsey PCC Limited
O
Barclays UKRF No.1 IC Limited
U
Barclays UKRF ICC Limited
U
Barclays UKRF No.2 IC Ltd
U
Hong Kong
Level 41, Cheung Kong Center, 2 Queen's Road
Central
Barclays Capital Asia Limited
India
Nirlon Knowledge Park, Level 9, Block B-6, Off
Western Express Highway, Goregaon (East),
Mumbai, 400063
Barclays Securities (India) Private Limited
Barclays Wealth Trustees (India) Private Limited
Barclays Investments & Loans (India) Private
Limited
E, H
5th to 12th Floor (Part), Building G2, Gera
Commerzone SEZ, Survey No.65, Kharadi,
Pune, 411014
Barclays Global Service Centre Private Limited
Ireland
One Molesworth Street, Dublin 2, D02 RF29
Barclays Administration Germany Limited
Barclaycard International Payments Limited
Barclays Bank Ireland Public Limited Company
Barclays Europe Client Nominees Designated
Activity Company
Barclays Europe Firm Nominees Designated
Activity Company
Barclays Europe Nominees Designated Activity
Company
25-28 North Wall Quay, Dublin1, D01 H104
Erimon Home Loans Ireland Limited
70 Sir John Rogerson’s Quay, Dublin 2, D02
R296
Barclays Finance Ireland Limited
Isle of Man
Eagle Court, Circular Road, Douglas, IM1 1AD
Barclays Nominees (Manx) Limited
U
Barclays Private Clients International Limited
I, J
2nd Floor, St Georges Court, Upper Church
Street, Douglas, IM1 1EE
Barclays Holdings (Isle of Man) Limited (In
Liquidation)
Strategy
Shareholder
information
Climate and
sustainability report
Governance
Risk
review
Financial
review
Financial
statements
Barclays PLC 2024
Annual Report
on Form 20-F
448
Notes to the financial statements (continued)
Other disclosure matters
Wholly owned subsidiaries
Note
Japan
10-1, Roppongi 6-chome, Minato-ku, Tokyo
Barclays Funds and Advisory Japan Limited
Barclays Securities Japan Limited
F, H
Jersey
28 Esplanade, St Helier, JE2 3QA
Barclays Services Jersey Limited
5 Espalanade, St Helier, JE2 3QA
Barclays Wealth Management Jersey Limited
13 Library Place, St Helier, JE4 8NE
Barclays Nominees (Jersey) Limited
U
Barclaytrust Channel Islands Limited
U
Estera Trust (Jersey) Limited, 13-14
Esplanade, St Helier, JE1 1EE
MK Opportunities GP Ltd
Luxembourg
9, allée Scheffer, L-2520
Barclays Bedivere Investments S.à r.l.
Barclays Cantal Investments S.à r.l.
Barclays Capital Luxembourg S.à r.l.
S
Barclays Treasury Luxembourg S.à r.l.
Barclays Claudas Investments S.à r.l.
Barclays International Luxembourg Dollar
Holdings S.à r.l.
Barclays Luxembourg GBP Holdings S.à r.l.
Q
Barclays Luxembourg Global Funding S.à r.l.
Barclays Luxembourg Holdings S.à r.l.
H, V
Barclays Luxembourg Holdings SSC
B
68-70 Boulevard de la Petrusse, L-2320
Adler Toy Holding Sarl
10 rue du Château d’Eau, Leudelange, Grand
Duchy of Luxembourg L-3364
BPM Management GP SARL
Mauritius
C/O Rogers Capital Corporate Services
Limited, 3rd Floor, Rogers House, No.5
President John Kennedy Street, Port Louis
Barclays Capital Mauritius Limited (In Liquidation)
Barclays Capital Securities Mauritius Limited
Fifth Floor Ebene Esplanade,
24 Bank Street, Cybercity
72201 Ebene
Barclays Mauritius Overseas Holdings Limited
Wholly owned subsidiaries
Note
Mexico
Paseo de la Reforma 505, Torre Mayor Floor 41,
Colona Cuauhtémoc, 06500, Mexico City
Barclays Bank Mexico, S.A.
J, L
Barclays Capital Casa de Bolsa, S.A. de C.V.
J, L
Grupo Financiero Barclays Mexico, S.A. de C.V.
J, L
Monaco
31 Avenue de la Costa, Monte Carlo BP 339
Barclays Private Asset Management (Monaco)
S.A.M
Saudi Arabia
3rd Floor Al Dahna Center, 114 Al-Ahsa Street,
PO Box 1454, Riyadh 11431
Barclays Saudi Arabia (In Liquidation)
Singapore
10 Marina Boulevard, #25-01 Marina Bay
Financial Centre, Tower 2, 018983
Barclays Merchant Bank (Singapore) Ltd.
Spain
Calle Jose, Abascal 51, 28003, Madrid
Barclays Tenedora De Inmuebles SL.
BVP Galvani Global, S.A.U. (In Liquidation)
Switzerland
Chemin de Grange Canal 18-20, PO Box 3941,
1211, Geneva
Barclays Bank (Suisse) SA
Barclays Switzerland Services SA
BPB Holdings SA
Taiwan
19F-1, No. 7, Xinyi Road, Sec. 5, Taipei, A322,
Taiwan
Barclays Securities Taiwan Limited
United States
Corporation Service Company, 251 Little Falls
Drive, Wilmington, DE 19808
Analytical Trade Holdings LLC
Barclays Asset Backed Depositor LLC
Barclays Bank Delaware
Barclays Capital Derivatives Funding LLC
Barclays STBT Inc.
Barclays Capital Equities Trading GP
Barclays Capital Holdings Inc.
Barclays Capital Real Estate Finance Inc.
Barclays Capital Real Estate Holdings Inc.
Barclays Capital Real Estate Inc.
Barclays Commercial Mortgage Securities LLC
Barclays Dryrock Funding LLC
Barclays Financial LLC
Barclays Group US Inc.
C
Barclays Lifestyles LLC
E, H
Barclays Oversight Management Inc.
C
Barclays Receivables LLC
Barclays Services Corporation
B
Wholly owned subsidiaries
Note
Barclays Services LLC
F, G,
H
Barclays US CCP Funding LLC
Barclays US Investments Inc.
Barclays US LLC
BCAP LLC
C
Gracechurch Services Corporation
C
Lagalla Investments LLC
C
Long Island Holding A LLC
F, H
Marbury Holdings LLC
C
Preferred Liquidity, LLC
Procella Investments No.2 LLC
C
Procella Investments No.3 LLC
Relative Value Holdings, LLC
C
Surrey Funding Corporation
C
Sussex Purchasing Corporation
Sutton Funding LLC
H, EE
US Secured Investments LLC
C
Verain Investments LLC
Wilmington Riverfront LLC
C
100 Bank Street, Suite 630, Burlington,
Vermont 05401
Barclays Insurance U.S. Inc.
I
C
Corporation Service Company, 80 State
Street, Albany, NY, 12207-2543
C
Barclays Equity Holdings Inc.
Corporation Service Company. Goodwin
Square, 225 Asylum Street, 20th Floor Hartford
CT 06103
Barclays Capital Inc.
C
X
Corporation Service Company, 2626,
Glenwood Ave, Suite 550, Raleigh, NC, 27608
Barclays US GPF Inc.
C
Equifirst Corporation (In Liquidation, Dissolved
with State of North Carolina)
125 S West Street, Wilmington, Delaware 9801
Curve Investments GP
B
Rodney Square North, 1100, North Market
Street, Wilmington, Delaware, 19890
Barclays Dryrock Issuance Trust
FF
Strategy
Shareholder
information
Climate and
sustainability report
Governance
Risk
review
Financial
review
Financial
statements
Barclays PLC 2024
Annual Report
on Form 20-F
449
Notes to the financial statements (continued)
Other disclosure matters
Other Related Undertakings
Unless otherwise stated, the undertakings
below are included in the consolidation and
the share capital held by the Group
comprises ordinary and/or common
shares, which are held by subsidiaries of
Barclays PLC. The percentage of the
nominal value of each share class held by
the Group is provided below.
Other Related Undertakings
%
Note
United Kingdom
1 Churchill Place, London, E14 5HP
Barclaycard Funding PLC
100.00
I
PSA Credit Company Limited
(In Liquidation)
100.00
I, U
100.00
K
Barclays Covered Bonds Limited
Liability Partnership
50.00
B
Barclays Secured Funding (LM)
Limited
20.00
BNRI England 2010 Limited
Partnership
50.00
B
80 Fenchurch Street, London
EC3M 4AE
Igloo Regeneration (General
Partner) Limited
25.00
K, U
3-5 London Road, Rainham,
Gillingham, Kent ME8 7RG
Trade Ideas Limited
20.00
U
50 Lothian Road, Festival Square,
Edinburgh, EH3 9WJ
Equistone Founder Partner III L.P.
20.00
B, U
Enigma, Wavendon Business Park
Milton Keynes, MK17 8LX
Intelligent Processing Solutions
Limited
19.50
U
180 Borough High Street, London
SE1 1LB
Protium Green Solutions Limited
U
42.85
GG
45.18
GG
13-15 York Buildings, London,
WC2N 6JU
BGF Group PLC
24.62
I, U
Unit 9 Westbrook Court,
Sharrowvale Road, Sheffield,
S11 8YZ
Palms Row Healthcare Holdings
Limited
100.00
U, CC
3rd Floor 19-20 Berners Street,
London, W1T 3NW
AVFI TIDE I LP
41.30
B, U
Parker Andrew Ltd, 5th Floor, The
Union Building, 51-59 Rose Lane,
Norwich NR1 1BY
Fintech for International
Development Limited (In
Liquidation)
26.37
I, U
Other Related Undertakings
%
Note
100.00
J
3rd Floor, 19-20 Berners Street,
London W1T 3NW
Female Innovators Lab L.P.
60.00
B
6th Floor 60 Gracechurch Street,
London, EC3V 0HR
BMC (UK) Ltd
49.95
E, I, U
1301 K Street Nw, Washington DC
20005, United States
Barclays Black Formation
Investments I LP
100.00
B, N, U
Barclays Black Formation
Investments II LP
100.00
B, N, U
1-4 Clyde Place, Glasgow, G5 8DP
Buchanan Wharf (Glasgow)
Management Limited
78.00
D
The White House, High Street,
Dereham, Norfolk, NR19 1DR
Naked Energy Limited
25.80
G, U
Office 1 Izabella House, 24-26
Regent Place, Birmingham, B1 3NJ
Outspoken Logistics Ltd
14.14
HH, U
68.10
HH
C/O A&L Goodbody, 42-46
Fountain Street, Belfast, BT1 5EF
Reform Clothing Limited
21.40
E, U
Belgium
Klipperstraat 15 2030 Antwerp
Euphony Benelux NV (In
Administration)
20.00
U
Cayman Islands
Maples Corporate Services
Limited, PO Box 309GT, Ugland
House, South Church Street,
Grand Cayman, KY1-1104
Cupric Canyon Capital GP Limited
50.00
U
Newman Holdings Limited (In
Liquidation)
96.49
E, U
Southern Peaks Mining LP
54.40
B, U
SPM GP Limited
90.00
U
Korea, Republic of
18th Floor, Daishin Finance
Centre, 343, Samil-daero, Jung-
go, Seoul
Woori BC Pegasus Securitization
Specialty Co. Ltd
70.00
AA
Luxembourg
9, allée Scheffer, L-2520,
Luxembourg
Barclays Alzin Investments S.à r.l.
100.00
R
Barclays Bordang Investments S.à r.l.
100.00
S
Other Related Undertakings
%
Note
Barclays Lamorak Investments S.à
r.l.
27.18
Q
BNRI Limehouse No.1 S.à r.l.
51.84
P
Preferred Funding S.à r.l.
100.00
W
Preferred Investments S.à r.l.
33.00
W
Netherlands
Alexanderstraat 18, The Hague,
2514 JM, Zuid-Holland
Tulip Oil Holding BV
34.47
I, U
22.98
K
Sweden
c/o ForeningsSparbanken AB 105
34 Stockholm
EnterCard Group AB
100.00
J, U
United States
1415 Louisiana Street, Suite 1600,
Houston, Texas 77002
Sabine Oil & Gas Holdings, Inc.(In
Liquidation)
22.12
U
Joint Ventures
The related undertaking below is dealt with
as a Joint Venture1 in accordance with
s.18, Schedule 4, The Large and Medium-
sized Companies and Groups (Accounts
and Reports) Regulations 2008 and is
proportionally consolidated. The
proportion of the capital of the related
undertaking held by the Group is stated
below.
Joint Venture
%
Note
United Kingdom
All Saints Triangle, Caledonian Road,
London, N1 9UT
Vaultex UK Limited
50.00
Joint management factors
The Board of Directors of the above Joint
Venture comprises two Barclays
representative Directors, two JV partner
Directors and two non-JV partner
Directors. The Board of Directors are
responsible for setting the Company
strategy and budgets.
The last financial year of the above JV
ended on 6 October 2024 and the average
number of monthly employees reported in
the accounts was 1,216.
Notes:
1This is distinct to how the term “joint venture” may be used for the purposes of IFRS.
Strategy
Shareholder
information
Climate and
sustainability report
Governance
Risk
review
Financial
review
Financial
statements
Barclays PLC 2024
Annual Report
on Form 20-F
450
Additional unaudited information - Shareholder information
Shareholderinformation
Annual General Meeting (AGM)
Annual General Meeting (AGM)
The Barclays PLC 2025 AGM will be held on Wednesday 7 May at 11:00 (UK time) at QEII Centre Broad Sanctuary,
Westminster London SW1P 3EE as described in the Notice of Meeting, to be published on the Company's website (home.barclays/
agm).
Keep your personal details up to date
Please remember to tell Equiniti if:
▪you move
▪you need to update your bank or building society details.
If you are a Shareview member, you can update your bank or building society account or address details online. If you are not a
Shareview member you can update details quickly and easily over the telephone using the Equiniti contact details on the next page.
Key dates
4 April 2025
Full year dividend payment date
30 April 2025
Q1 Results Announcement
7 May 2025
Annual General Meeting at 11.00am
Dividends
The Barclays PLC 2024 full year dividend for the year ended 31 December 2024 will be 5.5p per share, making the 2024 total dividend
8.4p per share.
Dividend Reinvestment Plan
Barclays offers a share alternative in the form of a dividend reinvestment plan (DRIP) for those shareholders who wish to elect to use
their dividend payments to purchase additional ordinary shares, rather than receive a cash payment. The DRIP is provided and
administered by Barclays’ registrar, Equiniti .
Share Price
Share price Information on the Barclays share price and other share price tools are available at: home.barclays/investorrelations
Further details regarding the DRIP can be found at home.barclays/dividends and www.shareview.co.uk/info/drip.
Share Dealing Services, donations to charity and returns to shareholders
During 2024, approximately £109,000 was donated to ShareGift, an option open to shareholders as part of the Share Dealing Service
launched in 2017. The initiative is aimed at shareholders with relatively small shareholdings for whom it might otherwise be
uneconomical to deal. The total donated since 2017in Share Dealing programs is over £445,000.
In addition, as part of the Share Dealing Service,some shareholders opted to sell their holding, as is their right to. This resulted in
£21.03m being returned to shareholders in 2024, with a total of £70.86m returned since 2017 via this service.
Returning Shares Not Taken Up to shareholders
In 2024, we have continued the tracing process to reunite over 60,000 shareholders who have not cashed their Shares Not Taken Up
(SNTU) cheque following the Rights Issue in September 2013. In 2024 we returned over £78,000 to our shareholders via the tracing
process.
Strategy
Shareholder
information
Climate and
sustainability report
Governance
Risk
review
Financial
review
Financial
statements
Barclays PLC 2024
Annual Report
on Form 20-F
451
Additional unaudited information - Shareholder information (continued)
Shareholder security
Shareholders should be wary of any cold calls with an offer to buy or sell shares. Fraudsters use persuasive and high pressure techniques
to lure shareholders into high-risk investments or scams. You should treat any unsolicited calls with caution.
Please keep in mind that firms authorised by the Financial Conduct Authority (FCA) are unlikely to contact you out of the blue. You
should consider getting independent financial or professional advice from someone unconnected to the respective firm before you
hand over any money.
Report a scam
If you suspect that you have been approached by fraudsters please tell the FCA using the share fraud reporting form at fca.org.uk/
scams. You can also call the FCA Helpline on 0800 111 6768 or through Action Fraud on 0300 123 2040.
Managing your shares online
Shareview
Barclays shareholders can go online to manage their shareholding and find out about Barclays performance by joining Shareview.
Through Shareview, you:
▪will receive the latest updates from Barclays direct to your email;
▪can update your address and bank details online;
▪can vote in advance of general meetings.
To join Shareview, please follow these two easy steps:
Step 1 Go to portfolio.shareview.co.uk
Step 2Register for electronic communications by following the instructions on screen
Useful contact details
Equiniti
The Barclays share register is maintained by Equiniti. If you have any questions about your Barclays shares, please contact Equiniti by
visiting shareview.co.uk
+44 (0)371 384 2055a
(UK & International telephone number)
For the hearing and speech impaired Equiniti welcome calls via Relay UK. Please see relayuk.bt.com for more information.
Aspect House, Spencer Road, Lancing, West Sussex BN99 6DA
To find out more, contact Equiniti or visit: home.barclays/dividends
American Depositary Receipts (ADRs)
ADRs represent the ownership of Barclays PLC shares which are traded on the New York Stock Exchange. ADRs carry prices, and pay
dividends, in US dollars.
If you have any questions about ADRs, please contact Shareowner Services:
shareowneronline.com/informational/contact-us/
+1 800 990 1135
(toll free in the US and Canada)
+1 651 453 2128
(outside the US and Canada)
Shareowner Services, PO Box 64504, St Paul, MN 55164-0504, USA
Delivery of ADR certificates and overnight mail
Shareowner Services, 1110 Centre Pointe Curve, Suite 101, Mendota Heights, MN 55120-4100, USA
Qualifying US and Canadian resident ADR holders should contact Shareowner Services for further details regarding the DRIP
Strategy
Shareholder
information
Climate and
sustainability report
Governance
Risk
review
Financial
review
Financial
statements
Barclays PLC 2024
Annual Report
on Form 20-F
452
Shareholder information (continued)
Shareholder Relations
To give us your feedback or if you have any questions, please contact:
privateshareholderrelations@barclays.com
Shareholder Relations, Barclays PLC, 1 Churchill Place, London E14 5HP
Alternative formats
Shareholder documents can be provided in large print, audio CD or Braille free of charge by calling Equiniti.
+44 (0)371 384 2055a
(UK & International telephone number)
Note
aLines open 8.30am to 5.30pm (UK time) Monday to Friday, excluding public holidays.
Strategy
Shareholder
information
Climate and
sustainability report
Governance
Risk
review
Financial
review
Financial
statements
Barclays PLC 2024
Annual Report
on Form 20-F
453
Additional unaudited information
Additional unaudited information
Additional shareholder information
Articles of Association
Barclays PLC (the “Company”) is a public limited company registered in England and Wales under company number 48839. Barclays,
originally named Barclay & Company Limited, was incorporated in England and Wales on 20 July 1896 under the Companies Acts 1862
to 1890 as a company limited by shares. The company name was changed to Barclays Bank Limited on 17 February 1917 and it was
registered on 15 February 1982 as a public limited company under the Companies Acts 1948 to 1980. On 1 January 1985, the company
changed its name to Barclays PLC. The Objects of the Company are unrestricted.
The current Articles of Association were adopted at the Company's Annual General Meeting ("AGM") on 9 May 2024, in substitution for
and to the exclusion of Articles adopted on 30 April 2010 and amended on 25 April 2013 and further amended on 5 May 2021.
The following is a summary and explanation of the current Articles of Association, which are available for inspection.
Directors
(i)The minimum number of Directors (excluding alternate Directors) is five. There is no maximum limit. There is no age limit for
Directors.
(ii)Excluding executive remuneration and any other entitlement to remuneration for extra services (including service on board
committees) under the Articles, a Director is entitled to a fee at a rate determined by the Board but the aggregate fees paid to all
Directors shall not exceed £3,000,000 per annum or such higher amount as may be approved by an ordinary resolution of the
Company. Each Director is entitled to reimbursement for all reasonable travelling, hotel and other expenses properly incurred by
him/her in or about the performance of his/her duties.
(iii)No Director may act (either himself/herself or through his/her firm) as an auditor of the Company. A Director may hold any other
office of the Company on such terms as the Board shall determine.
(iv)At each AGM of the Company, one third of the Directors (rounded down) are required under the Articles of Association to retire
from office by rotation and may offer themselves for re-election. The Directors so retiring are first, those who wish to retire and
not offer themselves for re-election, and, second those who have been longest in office (and in the case of equality of service
length are selected by lot). Other than a retiring Director, no person shall (unless recommended by the Board) be eligible for
election unless a member notifies the Company Secretary in advance of his/her intention to propose a person for election. It is
Barclays’ practice that all Directors offer themselves for re-election annually in accordance with the UK Corporate Governance
Code.
(v)The Board has the power to appoint additional Directors or to fill a casual vacancy amongst the Directors. Any Director so
appointed holds office until the next AGM, when he/she may offer himself/herself for reappointment. He/she is not taken into
account in determining the number of Directors retiring by rotation.
(vi)The Board may appoint any Director to any executive position or employment in the Company on such terms as they determine.
(vii)The Company may by ordinary resolution remove a Director before the expiry of his/her period of office (without prejudice to a
claim for damages for breach of contract or otherwise) and may by ordinary resolution appoint another person who is willing to act
to be a Director in his/her place.
(viii)A Director may appoint either another Director or some other person approved by the Board to act as his/her alternate with power
to attend Board meetings and generally to exercise the functions of the appointing Director in his/her absence (other than the
power to appoint an alternate).
(ix)The Board may authorise any matter in relation to which a Director has, or can have, a direct interest that conflicts, or possibly may
conflict with, the Company’s interests. Only Directors who have no interest in the matter being considered will be able to authorise
the relevant matter and they may impose limits or conditions when giving authorisation if they think this is appropriate.
(x)A Director may hold positions with or be interested in other companies and, subject to legislation applicable to the Company and
the FCA’s requirements, may contract with the Company or any other company in which the Company is interested. A Director
may not vote or count towards the quorum on any resolution concerning any proposal in which he/she (or any person connected
with him/her) has a material interest (other than by virtue of his/her interest in securities of the Company) or if he/she has a duty
which conflicts or may conflict with the interests of the Company, unless the resolution relates to any proposal:
(a)to indemnify a Director or provide him/her with a guarantee or security in respect of money lent by him/her to, or any
obligation incurred by him/her or any other person for the benefit of (or at the request of), the Company (or any other
member of the Group);
(b)to indemnify or give security or a guarantee to a third party in respect of a debt or obligation of the Company (or any other
member of the Group) for which the Director has personally assumed responsibility;
(c)to obtain insurance for the benefit of Directors;
(d)involving the acquisition by a Director of any securities of the Company (or any other member of the Group) pursuant to an
offer to existing holders of securities or to the public;
(e)that the Director underwrite any issue of securities of the Company (or any other member of the Group);
Strategy
Shareholder
information
Climate and
sustainability report
Governance
Risk
review
Financial
review
Financial
statements
Barclays PLC 2024
Annual Report
on Form 20-F
454
Additional unaudited information (continued)
(f)concerning any other company in which the Director is interested as an officer or creditor or Shareholder but, broadly, only if
he/she (together with his/her connected persons) is directly or indirectly interested in less than 1% of either any class of the
issued equity share capital or of the voting rights of that company; and
(g)concerning any other arrangement for the benefit of employees of the Company (or any other member of the Group) under
which the Director benefits or stands to benefit in a similar manner to the employees concerned and which does not give the
Director any advantage which the employees to whom the arrangement relates would not receive.
(i)A Director may not vote or be counted in the quorum on any resolution which concerns his/her own employment or appointment
to any office of the Company or any other company in which the Company is interested.
(ii)Subject to applicable legislation, the provisions described in sub-paragraphs (x) and (xi) may be relaxed or suspended by an ordinary
resolution of the members of the Company or any applicable governmental or other regulatory body.
(iii)The Board may exercise all of the powers of the Company to borrow money, to mortgage or charge its undertaking, property and
uncalled capital and to issue debentures and other securities.
Classes of Shares
The Company only has Ordinary Shares in issue. The Articles of Association also provide for pound sterling preference shares of £100
each, US dollar preference shares of US$100 each, US dollar preference shares of $0.25 each, euro preference shares of €100 each
and yen preference shares of ¥10,000 each (together, the “Preference Shares”). In accordance with the authority granted at the AGM
on 9 May 2024, Preference Shares may be issued by the Board from time to time in one or more series with such rights and subject to
such restrictions and limitations as the Board may determine. No Preference Shares have been issued to date.
Dividends
Subject to the provisions of the Articles and applicable legislation, the Company in general meeting may declare dividends on the
Ordinary Shares by ordinary resolution, but any such dividend may not exceed the amount recommended by the Board. The Board may
also pay interim or final dividends if it appears they are justified by the Company’s financial position.
Each Preference Share confers the right to a preferential dividend (“Preference Dividend”) payable in such currency at such rates
(whether fixed or calculated by reference to or in accordance with a specified procedure or mechanism), on such dates and on such
other terms as may be determined by the Board prior to allotment thereof.
The Preference Shares rank in regard to payment of dividends in priority to the holders of Ordinary Shares and any other class of shares
in the Company ranking junior to the Preference Shares.
Dividends may be paid on the Preference Shares if, in the opinion of the Board, the Company has sufficient distributable profits, after
payment in full or the setting aside of a sum to provide for all dividends payable on (or in the case of shares carrying a cumulative right to
dividends, before) the relevant dividend payment date on any class of shares in the Company ranking pari passu with or in priority to the
relevant series of Preference Shares as regards participation in the profits of the Company.
If the Board considers that the distributable profits of the Company available for distribution are insufficient to cover the payment in full
of Preference Dividends, Preference Dividends shall be paid to the extent of the distributable profits on a pro rata basis.
Notwithstanding the above, the Board may, at its absolute discretion, determine that any Preference Dividend which would otherwise
be payable may either not be payable at all or only payable in part.
If any Preference Dividend on a series of Preference Shares is not paid, or is only paid in part, for the reasons described above, holders of
Preference Shares will not have a claim in respect of such non-payment.
If any dividend on a series of Preference Shares is not paid in full on the relevant dividend payment date, a dividend restriction shall apply.
The dividend restriction means that, subject to certain exceptions, neither the Company nor Barclays Bank may (a) pay a dividend on, or
(b) redeem, purchase, reduce or otherwise acquire, any of their respective ordinary shares, other preference shares or other share
capital ranking equal or junior to the relevant series of Preference Shares until the earlier of such time as the Company next pays in full a
dividend on the relevant series of Preference Shares or the date on which all of the relevant series of Preference Shares are redeemed.
All unclaimed dividends payable in respect of any share may be invested or otherwise made use of by the Board for the benefit of the
Company until claimed. If a dividend is not claimed after six years of it becoming payable, it is forfeited and reverts to the Company. The
net proceeds from the sale of shares owned by untraced Shareholders, as well as any unclaimed dividend or other sum in respect of
such shares, shall be forfeited by the relevant untraced Shareholder and shall belong to the Company to use as the Board thinks fit.
The Board may, with the approval of an ordinary resolution of the Company, offer Shareholders the right to choose to receive an
allotment of additional fully paid Ordinary Shares instead of cash in respect of all or part of any dividend. The Company currently
provides a dividend reinvestment programme.
Redemption and Purchase
Subject to applicable legislation and the rights of the other shareholders, any share may be issued on terms that it is, at the option of the
Company or the holder of such share, redeemable. The Directors are authorised to determine the terms, conditions and manner of
redemption of any such shares under the Articles of Association.
Calls on capital
The Directors may make calls upon the members in respect of any monies unpaid on their shares. A person upon whom a call is made
remains liable even if the shares in respect of which the call is made have been transferred. Interest will be chargeable on any unpaid
amount called at a rate determined by the Board (of not more than 20% per annum).
Strategy
Shareholder
information
Climate and
sustainability report
Governance
Risk
review
Financial
review
Financial
statements
Barclays PLC 2024
Annual Report
on Form 20-F
455
Additional unaudited information (continued)
If a member fails to pay any call in full (following notice from the Board that such failure will result in forfeiture of the relevant shares),
such shares (including any dividends declared but not paid) may be forfeited by a resolution of the Board, and will become the property
of the Company. Forfeiture shall not absolve a previous member for amounts payable by him/her (which may continue to accrue
interest).
The Company also has a lien over all partly paid shares of the Company for all monies payable or called on that share and over the debts
and liabilities of a member to the Company. If any monies which are the subject of the lien remain unpaid after a notice from the Board
demanding payment, the Company may sell such shares.
Annual and other general meetings
The Company is required to hold an AGM in addition to such other general meetings as the Directors think fit. The type of the meeting
will be specified in the notice calling it. Under the Companies Act 2006, the AGM must be held within six months of the financial year end.
A general meeting may be convened by the Board on requisition in accordance with the applicable legislation.
In the case of an AGM, a minimum of 21 clear days’ notice is required. The notice must be in writing and must specify the place, the day
and the hour of the meeting, and the general nature of the business to be transacted. A notice convening a meeting to pass a special
resolution shall specify the intention to propose the resolution as such. The accidental failure to give notice of a general meeting or the
non-receipt of such notice will not invalidate the proceedings at such meeting.
Subject as noted above, all Shareholders are entitled to attend and vote at general meetings. The Articles do, however, provide that
arrangements may be made for simultaneous attendance at a satellite meeting place or, if the meeting place is inadequate to
accommodate all members and proxies entitled to attend, another meeting place may be arranged to accommodate such persons
other than that specified in the notice of meeting, in which case Shareholders may be excluded from the principal place. The Articles
also allow for a hybrid meeting, whereby Shareholders may attend by electronic means or physically.
Holders of Preference Shares have no right to receive notice of, attend or vote at, any general meetings of the Company as a result of
holding Preference Shares.
Notices
A document or information may be sent by the Company in hard copy form, electronic form, by being made available on a website, or by
another means agreed with the recipient, in accordance with the provisions set out in the Companies Act 2006. Accordingly, a
document or information may only be sent in electronic form to a person who has agreed to receive it in that form or, in the case of a
company, who has been deemed to have so agreed pursuant to applicable legislation. A document or information may only be sent by
being made available on a website if the recipient has agreed to receive it in that form or has been deemed to have so agreed pursuant
to applicable legislation, and has not revoked that agreement.
In respect of joint holdings, documents or information shall be sent to the joint holder whose name stands first in the register.
A member who (having no registered address within the UK) has not supplied an address in the UK at which documents or information
may be sent in hard copy form, or an address to which notices, documents or information may be sent or supplied by electronic means,
is not entitled to have documents or information sent to him/her.
The Company may choose to send notice in hard copy form alone to some or all members and/or choose not to send notice to a
particular member where it considers this necessary or appropriate to deal with legal, regulatory or practical problems in, or under the
laws of, any territory. In addition, the Company may cease to send notices to any member who has been sent documents on two
consecutive occasions over a period of at least 12 months and when each of those documents is returned undelivered or notification is
received that they have not been delivered.
Capitalisation of profits
The Company may, by ordinary resolution, upon the recommendation of the Board capitalise all or any part of an amount standing to
the credit of a reserve or fund to be set free for distribution provided that amounts from the share premium account, capital
redemption reserve or any profits not available for distribution should be applied only in paying up unissued shares to be allotted to
members credited as fully paid and no unrealised profits shall be applied in paying up debentures of the Company or any amount unpaid
on any share in the capital of the Company.
Indemnity
Subject to applicable legislation, every current and former Director or other officer of the Company (other than any person engaged by
the company as auditor) shall be indemnified by the Company against any liability in relation to the Company, other than (broadly) any
liability to the Company or a member of the Group, or any criminal or regulatory fine.
Strategy
Shareholder
information
Climate and
sustainability report
Governance
Risk
review
Financial
review
Financial
statements
Barclays PLC 2024
Annual Report
on Form 20-F
456
Additional unaudited information (continued)
Dividends on the ordinary shares of Barclays PLC
The dividends declared for each of the last five years were:
Pence per 25p ordinary share
2024
2023
2022
2021
2020
Half year
2.90
2.70
2.25
2.00
—
Full year
5.50
5.30
5.00
4.00
1.00
Total
8.40
8.00
7.25
6.00
1.00
US Dollars per 25p ordinary share
2024
2023
2022
2021
2020
Half year
0.04
0.03
0.03
0.03
—
Full year
0.07
0.07
0.06
0.05
0.01
Total
0.11
0.10
0.09
0.08
0.01
The gross dividends applicable to an American Depositary Share (ADS) representing four ordinary shares, before deduction of
withholding tax, are as follows:
US Dollars per American Depositary Share
2024
2023
2022
2021
2020
Half year
0.15
0.13
0.10
0.11
—
Full year
0.27
0.27
0.24
0.22
0.06
Total
0.42
0.40
0.34
0.33
0.06
The final dividends shown above are expressed in Dollars translated at the closing spot rate for Pounds Sterling as determined by
Bloomberg at 5pm in New York City (the ‘Closing Spot Rate’) on the latest practicable date for inclusion in this report. No representation
is made that Pounds Sterling amounts have been, or could have been, or could be, converted into Dollars at these rates.
Trading market for ordinary shares of Barclays PLC
The principal trading market for Barclays PLC ordinary shares is the London Stock Exchange. At the close of business on 31 December
2024, 14,419,599,565ordinary shares were in issue.
Ordinary share listings were also obtained on the New York Stock Exchange (NYSE) with effect from 9 September 1986. Trading on the
NYSE is in the form of ADSs under the symbol ‘BCS’. Each ADS represents four ordinary shares and is evidenced by an American
Depositary Receipt (ADR). The ADR depositary is JP Morgan Chase Bank, N.A. Details of trading activity are published in the stock tables
of leading daily newspapers in the US.
There were 364 ADR holders and 1,600 recorded holders of ordinary shares with US addresses at 31 December 2024, whose
shareholdings represented approximately 6.5% of total outstanding ordinary shares on that date. Since a certain number of the
ordinary shares and ADRs were held by brokers or other nominees, the number of recorded holders in the US may not be
representative of the number of beneficial holders or of their country of residence.
Shareholdings at 31 December 20241
Number of
shareholders
Percentage of holders
Shares held
Percentage of capital
%
%
Classification of shareholders
Personal Holders
193,338
98.83
330,089,879
2.29
Banks and Nominees
1,535
0.78
11,700,811,777
81.15
Other Companies
757
0.39
2,388,686,009
16.56
Insurance Companies
1
—
208
—
Pension Funds
5
—
11,692
—
Total
195,636
100
14,419,599,565
100
Shareholding range
1 - 100
15,759
8.06
570,381
—
101 - 250
43,345
22.16
8,812,104
0.06
251 - 500
52,634
26.90
18,399,964
0.13
501 - 1,000
30,463
15.57
21,471,914
0.15
1,001 - 5,000
37,062
18.94
81,888,285
0.57
5,001 - 10,000
8,356
4.27
58,928,957
0.41
10,001 - 25,000
5,084
2.60
76,675,592
0.53
25,001 - 50,000
1,245
0.64
42,430,680
0.29
50,001 and over
1,688
0.86
14,110,421,688
97.86
Total
195,636
100.00
14,419,599,565
100
United States Holdings
1,600
0.82
6,533,379
0.05
Note:
1 These figures do not include Barclays Sharestore members.
Strategy
Shareholder
information
Climate and
sustainability report
Governance
Risk
review
Financial
review
Financial
statements
Barclays PLC 2024
Annual Report
on Form 20-F
457
Additional unaudited information (continued)
Taxation of UK holders
The following is a summary of certain UK tax issues which are likely to be material to the holding and disposal of Ordinary Shares of
Barclays PLC or ADSs representing such Ordinary Shares (the "Shares").
It is based on the current laws of England and Wales, UK tax law and the practice of His Majesty’s Revenue and Customs ("HMRC"), each
of which may be subject to change, possibly with retrospective effect and in particular it does not contemplate any changes in law
announced, but not yet enacted, as part of the UK government's Autumn Budget on 30 October 2024 (the "Budget"). It is a general
guide for information purposes and should be treated with appropriate caution. It is not intended as tax advice and it does not purport to
describe all of the tax considerations that may be relevant to a prospective purchaser, holder or disposer of Shares. In particular, save
where expressly stated to the contrary, this summary deals with shareholders who are resident and, in the case of individuals, domiciled
in (and only in) the UK for UK tax purposes, who hold their Shares as investments (other than under an individual savings account) and
who are the absolute beneficial owners of their Shares and any dividends paid on them.
The statements are not addressed to: (i) shareholders who own (or are deemed to own) 10% or more of the voting power of Barclays
PLC; (ii) shareholders who hold Shares as part of hedging transactions; (iii) investors who have (or are deemed to have) acquired their
Shares by virtue of an office or employment; and (iv) shareholders who hold Shares in connection with a trade, profession or vocation
carried on in the UK (whether through a branch or agency or, in the case of a corporate shareholder, through a permanent
establishment, or otherwise). It does not discuss the tax treatment of classes of shareholder subject to special rules, such as dealers in
securities.
Persons who are in any doubt as to their tax position should consult their professional advisers. Persons who may be liable to taxation in
jurisdictions other than the UK in respect of their acquisition, holding or disposal of Shares are particularly advised to consult their
professional advisers as to whether they are so liable.
i.Taxation of dividends
In accordance with UK law, Barclays PLC pays dividends on the Shares without any deduction or withholding for or on account of any
taxes imposed by the UK government or any UK taxing authority.
The total dividends (including any dividends paid by Barclays PLC) paid to a UK resident individual shareholder in a tax year (the "Total
DividendIncome") will generally form part of that shareholder’s total income for UK income tax purposes, and will be subject to UK
income tax at the rates discussed below.
For dividends paid on or after 6 April 2016, the rate of UK income tax applicable to the Total Dividend Income will depend on the amount
of the Total Dividend Income and the UK income tax band(s) that the Total Dividend Income falls within when included as part of the
shareholder’s total income for UK income tax purposes for that tax year.
For the tax year from 6 April 2024 to 5 April 2025 (inclusive), a nil rate of UK income tax applies to the first £500 of Total Dividend Income
received by an individual shareholder in that tax year (the "NilRateAmount"). For the 2023-2024 tax year, the Nil Rate Amount was
£1,000. For the 2018-2019, 2019-2020, 2020-2021, 2021-2022 and 2022-2023 tax years, the Nil Rate Amount was £2,000. For the
2016-2017 and 2017-2018 tax years, the Nil Rate Amount was £5,000.
Where the Total Dividend Income received by an individual shareholder in a tax year exceeds the relevant Nil Rate Amount for that tax
year, the excess amount (the "RemainingDividendIncome") will, at the date hereof, be subject to UK income tax at the following current
rates:
(a)at the rate of 8.75% on any portion of the Remaining Dividend Income that falls within the basic tax band;
(b)at the rate of 33.75% on any portion of the Remaining Dividend Income that falls within the higher tax band; and
(c)at the rate of 39.35% on any portion of the Remaining Dividend Income that falls within the additional tax band.
In determining the tax band the Remaining Dividend Income falls within for a tax year, the individual shareholder’s Total Dividend Income
for the tax year in question (including the portion comprising the Nil Rate Amount) will be treated as the top slice of the shareholder’s
total income for UK income tax purposes.
Subject to special rules for small companies, UK resident shareholders within the charge to UK corporation tax will not generally be
subject to UK corporation tax on the dividends paid on the Shares, provided the dividend falls within an exempt class and certain
conditions are met.
ii.Taxation of shares under the Dividend Re-Investment Plan
Where a shareholder elects to purchase Shares using their cash dividend as part of the Dividend Re-Investment Plan, such shareholder
will generally be liable for UK tax on the amount of the dividend as described in (i) Taxation of dividends above, in the same way as the
shareholder would have been on the receipt of a cash dividend. For capital gains purposes, the base cost of Shares purchased under the
Dividend Re-Investment Plan will be the amount of the cash dividend used to purchase such Shares.
iii.Taxation of capital gains
The disposal of Shares (including, for the avoidance of doubt, any shares purchased as part of the Dividend Re-Investment Plan or
previously purchased as part of the Scrip Dividend Programme) may, depending on the shareholder’s circumstances, give rise to a
liability to UK tax on chargeable capital gains.
Where Shares are sold, a liability to UK tax may result if the proceeds from that sale exceed the sum of the base cost of the Shares sold
and any other allowable deductions such as share dealing costs and, in certain circumstances, indexation relief (discussed further
below). To arrive at the total base cost of any Barclays PLC shares held, in appropriate cases the amount subscribed for rights taken up
in 1985, 1988 and 2013 must be added to the cost of all such shares held. For this purpose, current legislation permits the market
valuation at 31 March 1982 to be substituted for the original cost of shares purchased before that date, subject to certain exceptions
Strategy
Shareholder
information
Climate and
sustainability report
Governance
Risk
review
Financial
review
Financial
statements
Barclays PLC 2024
Annual Report
on Form 20-F
458
Additional unaudited information (continued)
for shareholders within the charge to UK corporation tax. Shareholders other than those within the charge to UK corporation tax should
note that, following the Finance Act 2008, no indexation allowance will be available. Following the Finance Act 2018, shareholders within
the charge to UK corporation tax may be eligible for indexation allowance for the period of ownership of their Shares up to December
2017, but no indexation allowance will be available in respect of the period of ownership starting on or after 1 January 2018.
Chargeable capital gains may also arise from the gifting of Shares to connected parties such as relatives (although not spouses or civil
partners) and family trusts.
The calculations required to compute chargeable capital gains may be complex. Shareholders are advised to consult their personal
financial adviser for further information regarding a possible tax liability in respect of their holdings of shares.
iv.Stamp duty and stamp duty reserve tax
Dealings in Shares (including, for the avoidance of doubt, any Shares purchased as part of the Dividend Re-Investment Plan or
previously purchased as part of the Scrip Dividend Programme) will generally be subject to UK stamp duty or stamp duty reserve tax
(although see the comments below as regards ADSs in the section ‘Taxation of US holders – UK stamp duty and stamp duty reserve
tax’). Any document effecting the transfer on sale of Shares will generally be liable to stamp duty at 0.5% of the consideration paid for
that transfer (rounded up to the next £5). An unconditional agreement to transfer Shares, or any interest therein, will generally be
subject to stamp duty reserve tax at 0.5% of the consideration given. Such liability to stamp duty reserve tax will be cancelled, or a right
to a repayment (generally with interest) in respect of the stamp duty reserve tax liability will arise, if the agreement is completed by a
duly stamped transfer within six years of the agreement having become unconditional. Both stamp duty and stamp duty reserve tax are
normally the liability of the transferee.
Paperless transfers of Shares within CREST are liable to stamp duty reserve tax rather than stamp duty.
Stamp duty reserve tax on transactions settled within the CREST system or reported through it for regulatory purposes will be collected
by CREST.
Special rules apply to certain categories of person, including intermediaries, market makers, brokers, dealers and persons connected
with depositary arrangements and clearance services.
v.Inheritance tax
An individual may be liable to inheritance tax on the transfer of Shares (including, for the avoidance of doubt, any Shares purchased as
part of the Dividend Re-Investment Plan or previously purchased as part of the Scrip Dividend Programme). Where an individual is so
liable, inheritance tax may be charged on the amount by which the value of his or her estate is reduced as a result of any transfer by way
of gift or other gratuitous transaction made by them or treated as made by them.
Taxation of US Holders
The following is a summary of certain US federal income tax considerations and certain UK tax considerations to the purchase,
ownership and disposition of Ordinary Shares of Barclays PLC or ADSs representing such Ordinary Shares (the "Shares") that are likely
to be relevant for US Holders (as defined below) who own the Shares as capital assets for tax purposes. This discussion is not a
comprehensive analysis of all the potential US or UK tax consequences that may be relevant to US Holders and does not discuss
particular tax consequences that may be applicable to US Holders who may be subject to special tax rules, such as banks, brokers or
dealers in securities or currencies, traders in securities that elect to use a mark-to-market method of accounting for securities
holdings, financial institutions, tax-exempt organisations, regulated investment companies, life insurance companies, entities or
arrangements that are treated as partnerships for US federal income tax purposes (or partners therein), holders that own or are treated
as owning 10% or more of the stock of Barclays PLC measured either by voting power or value, holders that hold Shares as part of a
straddle or a hedging or conversion transaction, holders that purchase or sell Shares as part of a wash sale, holders whose functional
currency is not the US Dollar, or holders who are resident, or who are carrying on a trade, in the UK. The summary also does not address
state or local taxes or any aspect of US federal taxation other than US federal income taxation (such as the estate and gift tax, any
alternative minimum tax or the Medicare tax on net investment income). Investors are advised to consult their tax advisers regarding
the tax implications of their particular holdings, including the consequences under applicable state and local law, and in particular
whether they are eligible for the benefits of the Treaty (as defined below).
This discussion is based on the Internal Revenue Code of 1986, as amended (the "IRC"), its legislative history, existing and proposed
regulations, published rulings and court decisions, and on the Double Taxation Convention between the UK and the US as entered into
force in March 2003 (the "Treaty"), and, in respect of UK tax, the Estate and Gift Tax Convention between the UK and the US as entered
into force on 11 November 1979 (the "Estate and Gift Tax Convention"), the current UK tax law and the practice of HMRC, all of which
are subject to change (including as a result of the Budget), possibly on a retroactive basis. This discussion is based in part upon the
representations of the ADR Depositary and the assumption that each obligation of the Deposit Agreement and any related agreement
will be performed in accordance with its terms.
A "US Holder" is a beneficial owner of Shares that is a citizen or resident of the United States or a US domestic corporation or that
otherwise is subject to US federal income taxation on a net income basis in respect of such Shares and that is fully eligible for benefits
under the Treaty.
In general, the holders of ADRs evidencing ADSs will be treated as owners of the underlying Ordinary Shares for the purposes of the
Treaty, the Estate and Gift Tax Convention, and the IRC. Generally, exchanges of shares for ADRs and ADRs for shares will not be
subject to US federal income tax or to UK capital gains tax.
Strategy
Shareholder
information
Climate and
sustainability report
Governance
Risk
review
Financial
review
Financial
statements
Barclays PLC 2024
Annual Report
on Form 20-F
459
Additional unaudited information (continued)
Taxation of dividends
Subject to the PFIC rules discussed below, the gross amount of any distribution of cash or property with respect to the Shares
(including any amount withheld in respect of UK taxes) that is paid out of Barclays PLC’s current or accumulated earnings and profits (as
determined for US federal income tax purposes) will be includible in a US Holder’s taxable income as ordinary dividend income on the
day such US Holder receives the dividend, in the case of Ordinary Shares, or the date the Depositary receives the dividends, in the case
of ADRs, and will not be eligible for the dividends-received deduction allowed to corporations under the IRC.
Dividends paid by Barclays PLC to an individual with respect to the Shares will generally be subject to taxation at a preferential rate if the
dividends are "qualified dividend income". Subject to certain exceptions for short-term positions, dividends paid on the Shares will be
treated as qualified dividend income if (i) the Shares are readily tradable on an established securities market in the United States or
Barclays PLC is eligible for the benefits of a comprehensive tax treaty with the United States that the US Treasury determines is
satisfactory for purposes of this provision and that includes an exchange of information program, and (ii) Barclays PLC was not a PFIC
(as defined below) in the year of the distribution or the immediately preceding taxable year. The ADRs are listed on the New York Stock
Exchange, and will qualify as readily tradable on an established securities market so long as they are so listed. In addition, the US
Treasury has determined that the Treaty meets the requirements for reduced rates of taxation, and Barclays PLC believes that it is
eligible for the benefits of the Treaty. Based on its audited financial statements and relevant market and shareholder data, Barclays PLC
believes that it was not treated as a PFIC for US federal income tax purposes with respect to its 2023 or 2024 taxable years. In addition,
based on its audited financial statements and current expectations regarding the value and nature of its assets, the sources and nature
of its income, and relevant market and shareholder data, Barclays PLC does not anticipate becoming a PFIC for its current taxable year
or in the foreseeable future.
Dividends paid by Barclays PLC to a US Holder with respect to the Shares will not be subject to UK withholding tax. For foreign tax credit
purposes, dividends will generally be income from sources outside the US and will generally be "passive" income for purposes of
computing the foreign tax credit allowable to a US Holder.
The amount of the dividend distribution includable in income will be the US Dollar value of the distribution, determined at the spot
Pound Sterling/US Dollar rate on the date the dividend distribution is includable in income, regardless of whether the payment is in fact
converted into US Dollars. Generally, any gain or loss resulting from currency exchange fluctuations during the period from the date the
dividend payment is includable in income to the date the payment is converted into US Dollars will be treated as ordinary income or loss
and, for foreign tax credit limitation purposes, from sources within the US, and will not be eligible for the special tax rates applicable to
qualified dividend income.
Distributions in excess of current or accumulated earnings and profits, as determined for US federal income tax purposes, will be
treated as a return of capital to the extent of the US Holder’s basis in the Shares and thereafter as capital gain. Because Barclays PLC
does not currently maintain calculations of earnings and profits for US federal income tax purposes, US Holders should expect that
distributions with respect to the Shares will generally be treated as dividends.
US Holders that receive a distribution of additional shares or rights to subscribe for additional shares as part of a pro rata distribution to
all our shareholders generally will not be subject to US federal income tax in respect of the distribution, unless the US Holder has the
right to receive cash or property, in which case the US Holder will be treated as if it received cash equal to the fair market value of the
distribution.
Taxable sale or other disposition of Shares
Subject to the PFIC rules discussed below, upon a sale or other taxable disposition of the Shares, US Holders generally will not be
subject to UK tax, but will realise gain or loss for US federal income tax purposes in an amount equal to the difference between the US
Dollar value of the amount realised on the disposition and the US Holder’s adjusted tax basis in the Shares, as determined in US Dollars.
Such gain or loss will be capital gain or loss, and will generally be long-term capital gain or loss if the Shares have been held for more than
one year. Long-term capital gain of a noncorporate US Holder is generally taxed at preferential rates. The gain or loss will generally be
income or loss from sources within the United States for foreign tax credit limitation purposes. The deductibility of capital losses is
subject to limitations.
Taxation of passive foreign investment companies (PFICs)
Based on its audited financial statements and relevant market and shareholder data, Barclays PLC believes that it was not treated as a
PFIC for US federal income tax purposes with respect to its 2023 or 2024 taxable years. In addition, based on its audited financial
statements and current expectations regarding the value and nature of its assets, the sources and nature of its income, and relevant
market and shareholder data, Barclays PLC does not anticipate becoming a PFIC for its current taxable year or in the foreseeable future.
This conclusion is a factual determination that is made annually and thus may be subject to change. In general, Barclays PLC will be a
PFIC with respect to a US Holder if, for any taxable year in which a US Holder holds the Shares, either (i) at least 75% of the gross income
of Barclays PLC for the taxable year is passive income, or (ii) at least 50% of the value, generally determined on the basis of a quarterly
average, of Barclays PLC’s assets is attributable to assets that produce or are held for the production of passive income (including
cash). With certain exceptions, a US Holder’s Shares will be treated as stock of a PFIC if Barclays PLC was a PFIC at any time during such
holder’s holding period in its Shares.
If Barclays PLC were to be treated as a PFIC with respect to a US Holder, unless such US Holder elected to be taxed annually on a mark-
to-market basis with respect to its Shares, gain and certain "excess distributions" would be treated as having been realised ratably over
a US Holder’s holding period for the Shares and generally would be taxed at the highest tax rate in effect for each such year to which the
gain was allocated, together with an interest charge in respect of the tax attributable to each such year.
Strategy
Shareholder
information
Climate and
sustainability report
Governance
Risk
review
Financial
review
Financial
statements
Barclays PLC 2024
Annual Report
on Form 20-F
460
Additional unaudited information (continued)
UK stamp duty and stamp duty reserve tax
No obligation to pay UK stamp duty will arise on the transfer on sale of an ADS, provided that any instrument of transfer is not executed
in, and remains at all times outside, the UK. No UK stamp duty reserve tax is payable in respect of an agreement to transfer an ADS. For
the UK stamp duty and stamp duty reserve tax implications of dealings in Ordinary Shares, see the section ‘Taxation of UK holders – (iv)
Stamp duty and stamp duty reserve tax’ above.
UK estate and gift tax
Under the Estate and Gift Tax Convention, Shares held by an individual US holder who is US domiciled for the purposes of the Estate
and Gift Tax Convention and who is not for such purposes a UK national generally will not, provided any US federal estate or gift tax
chargeable has been paid, be subject to UK inheritance tax on the individual’s death or on a lifetime transfer of Shares, except in certain
cases where the Shares are comprised in a settlement (unless the settlor was US domiciled and not a UK national at the time of the
settlement), are part of the business property of a UK permanent establishment of an enterprise, or pertain to a UK fixed base of an
individual used for the performance of independent personal services. In cases where the Shares are subject to both UK inheritance tax
and US federal estate or gift tax, the Estate and Gift Tax Convention generally provides a credit against US federal tax liability for the
amount of any inheritance tax paid in the UK.
Foreign Financial Asset Reporting
Certain US Holders that own "specified foreign financial assets" with an aggregate value in excess of US$50,000 on the last day of the
taxable year or US$75,000 at any time during the taxable year are generally required to file an information statement along with their tax
returns, currently on Form 8938, with respect to such assets. "Specified foreign financial assets" include any financial accounts held at a
non-US financial institution, as well as securities issued by a non-US issuer that are not held in accounts maintained by financial
institutions. The understatement of income attributable to "specified foreign financial assets" in excess of US$5,000 extends the
statute of limitations with respect to the tax return to six years after the return was filed. US Holders who fail to report the required
information could be subject to substantial penalties. US Holders are encouraged to consult with their own tax advisors regarding the
possible application of these rules, including the application of the rules to their particular circumstances.
Backup Withholding and Information Reporting
Dividends paid on, and proceeds from the sale or other disposition of, the Shares to a US Holder generally may be subject to the
information reporting requirements of the IRC and may be subject to backup withholding unless the US Holder provides an accurate
taxpayer identification number and makes any other required certification or otherwise establishes an exemption. Backup withholding is
not an additional tax. The amount of any backup withholding from a payment to a US Holder will be allowed as a refund or credit against
the US Holder’s US federal income tax liability, provided the required information is furnished to the US Internal Revenue Service ("IRS")
in a timely manner.
A holder that is not a US Holder may be required to comply with certification and identification procedures in order to establish its
exemption from information reporting and backup withholding.
FATCA Risk Factor
In certain circumstances, payments on shares or ADSs may be subject to US withholding taxes on "passthru payments", starting on the
date that is two years after the date on which final regulations defining this concept are adopted in the United States. Under the
"Foreign Account Tax Compliance Act" (or "FATCA"), as well as intergovernmental agreements between the United States and other
countries and implementing laws in respect of the foregoing, certain US-source payments (including dividends and interest) and certain
payments made by, and financial accounts held with, entities that are classified as financial institutions under FATCA are subject to a
special information reporting and withholding tax regime. Regulations implementing withholding in respect of "passthru payments"
under FATCA have not yet been adopted or proposed. The United States has entered into an intergovernmental agreement regarding
the implementation of FATCA with the UK (the "UK IGA"). Under the UK IGA, as currently drafted, it is not expected that Barclays PLC
will be required to withhold tax under FATCA on payments made with respect to the shares or ADSs. However, significant aspects of
when and how FATCA will apply remain unclear, and no assurance can be given that withholding under FATCA will not become relevant
with respect to payments made on or with respect to the shares or ADSs in the future. Holders should consult their own tax advisers
regarding the potential impact of FATCA.
The Barclays Group has registered with the Internal Revenue Service ("IRS") for FATCA. The Global Intermediary Identification Number
(GIIN) for Barclays PLC in the United Kingdom is E1QAZN.00000.LE.826 and it is a Reporting Model 1 FFI. The GIINs for other parts of
the Barclays Group or Barclays branches outside of the UK may be obtained from your usual Barclays contact on request. The IRS list of
registered Foreign Financial Institutions is publicly available on the IRS website.
Exchange controls and other limitations affecting security holders
Other than certain economic sanctions which may be in force from time to time, there are currently no UK laws, decrees or regulations
which would affect the transfer of capital or remittance of dividends, interest and other payments to holders of Barclays securities who
are not residents of the UK. There are also no restrictions under the Articles of Association of Barclays PLC, or (subject to the effect of
any such economic sanctions) under current UK laws, which relate only to non-residents of the UK, and which limit the right of such
non-residents to hold Barclays securities or, when entitled to vote, to do so.
Documents on display
It is possible to read and copy documents that have been filed by Barclays PLC with the US Securities and Exchange Commission via
commercial document retrieval services, and from the website maintained by the US Securities and Exchange Commission at
www.sec.gov.
Strategy
Shareholder
information
Climate and
sustainability report
Governance
Risk
review
Financial
review
Financial
statements
Barclays PLC 2024
Annual Report
on Form 20-F
461
Additional unaudited information (continued)
Fees and charges payable by a holder of ADSs
The ADR depositary collects fees for delivery and surrender of ADSs directly from investors depositing ordinary shares or surrendering
ADSs for the purpose of withdrawal or from intermediaries acting for them.
The charges of the ADR depositary payable by investors are as follows:
Type of service
ADR depositary actions
Fee
ADR depositary or substituting the
underlying shares
Issuance of ADSs against the deposit of ordinary
shares, including deposits and issuances in respect
of:
–Share distributions, stock splits, rights issues,
mergers
–Exchange of securities or other transactions or
event or other distribution affecting the ADSs or
deposited securities
$5.00 or less per 100 ADSs (or portion thereof)
evidenced by the new ADSs delivered
Receiving or distributing cash dividends
Distribution of cash dividends
$0.05 or less per ADS1
Selling or exercising rights
Distribution or sale of securities, the fee being in an
amount equal to the fee for the execution and
delivery of ADSs which would have been charged as a
result of the deposit of such securities
$5.00 or less per each 100 ADSs (or portion thereof)
Withdrawing an underlying ordinary share
Acceptance of ADSs surrendered for withdrawal of
deposited ordinary shares
$5.00 or less for each 100 ADSs (or portion thereof)
General depositary services, particularly
those charged on an annual basis
Other services performed by the ADR depositary in
administering the ADS program
No fee currently payable
Expenses of the ADR depositary
Expenses incurred on behalf of Holders in
connection with:
–Expenses of the ADR depositary in connection
with the conversion of foreign currency into US
dollars (which are paid out of such foreign
currency)
–Taxes and other governmental charges
–Cable, telex and facsimile transmission/delivery
–Transfer or registration fees, if applicable, for the
registration of transfers or underlying ordinary
shares
–Any other charge payable by ADR depositary or its
agents
Expenses payable at the sole discretion of the ADR
depositary by billing Holders or by deducting charges
from one or more cash dividends or other cash
distributions
Note:
1 The fee in relation to the distribution of cash dividends was 0.010951 per ADS in respect of dividends paid in the year ended 31 December 2024.
Fees and payments made by the ADR depositary to Barclays
The ADR depositary has agreed to provide Barclays with an amount based on any cash dividend, issuance and cancellations fees
charged during each twelve-month period for expenses incurred by Barclays in connection with the ADS program. Barclays is entitled to
$2,446,383 for the year ended 31 December 2024, though such amount has not yet been paid to Barclays by the ADR depositary.
Under certain circumstances, including non-routine corporate actions, removal of the ADR depositary or termination of the ADS
program by Barclays, Barclays may be charged by the ADR depositary certain fees (including in connection with depositary services,
certain expenses paid on behalf of Barclays, an administrative fee, fees for non-routine services and corporate actions and any other
reasonable fees/expenses incurred by the ADR depositary).
Strategy
Shareholder
information
Climate and
sustainability report
Governance
Risk
review
Financial
review
Financial
statements
Barclays PLC 2024
Annual Report
on Form 20-F
462
Additional unaudited information (continued)
NYSE Corporate Governance Statement
As our main listing is on the London Stock Exchange, we follow the UK Corporate Governance Code. However, as Barclays also has
American Depositary Receipts listed on the New York Stock Exchange (NYSE), we are also subject to the NYSE’s Corporate
Governance Rules (NYSE Rules). We are exempt from most of the NYSE Rules, which US domestic companies must follow, because we
are a non-US company listed on the NYSE. However, we are required to provide annual and interim written affirmations to the NYSE of
our compliance with the applicable NYSE Rules and must also disclose any significant differences between our corporate governance
practices and those followed by domestic US companies listed on the NYSE. Key differences between the Code and NYSE Rules are set
out here:
Director Independence
NYSE Rules require the majority of the Board to be independent. The Code requires at least half of the Board (excluding the Chairman)
to be independent. The NYSE Rules contain different tests from the Code for determining whether a Director is independent. We follow
the Code’s recommendations as well as developing best practices among other UK public companies. The independence of our non-
executive Directors is reviewed by the Board on an annual basis and it takes into account the guidance in the Code and the criteria we
have established for determining independence, which are described in the Directors’ Report.
Board Committees
We have a Board Nominations Committee and a Board Remuneration Committee, both of which are broadly similar in purpose and
constitution to the Committees required by the NYSE Rules and whose terms of reference comply with the Code’s requirements. The
NYSE Rules state that both Committees must be composed entirely of independent Directors. As the Group Chairman was
independent on appointment, the Code permits him to chair the Board Nominations Committee. Except for this appointment, both
Committees are composed solely of non-executive Directors, whom the Board has determined to be independent. We comply with the
NYSE Rules requirement that we have a Board Audit Committee comprised solely of independent non-executive Directors as defined in
Rule 10A-3 of the Exchange Act. However, we follow the Code recommendations, rather than the NYSE Rules, regarding the
responsibilities of the Board Audit Committee (except for applicable mandatory responsibilities under the Sarbanes-Oxley Act),
although both are broadly comparable. Although the NYSE Rules state that the Board Audit Committee is to take responsibility for risk
oversight, Barclays has an additional Board Committee which addresses different areas of risk management. To enhance Board
governance of risk, Barclays has the Board Risk Committee. A full description of the Board Risk Committee can be found in the
Directors’ Report.
Corporate Governance Guidelines
The NYSE Rules require domestic US companies to adopt and disclose corporate governance guidelines. There is no equivalent
recommendation in the Code but the Board Nominations Committee has developed corporate governance guidelines, ‘Corporate
Governance in Barclays’, which have been approved and adopted by the Board.
Code of Ethics
The NYSE Rules require that domestic US companies adopt and disclose a code of business conduct and ethics for Directors, officers
and employees. The Barclays Way was introduced in 2013, this is a Code of Conduct which outlines the Values and Behaviours which
govern our way of working across our business globally. The Barclays Way has been adopted on a Group-wide basis by all Directors,
Officers and employees. The Barclays Way is available to view on the Barclays website at https://home.barclays/content/dam/home-
The NYSE listing standards require that shareholders must be given the opportunity to vote on all equity-compensation plans and
material revisions to those plans. We comply with UK requirements, which are similar to the NYSE standards. However, the Board does
not explicitly take into consideration the NYSE’s detailed definition of what are considered ‘material revisions’.
Strategy
Shareholder
information
Climate and
sustainability report
Governance
Risk
review
Financial
review
Financial
statements
Barclays PLC 2024
Annual Report
on Form 20-F
463
Additional unaudited information (continued)
Major shareholders
Major shareholders do not have different voting rights from those of other shareholders. Information provided to the Company by
substantial shareholders pursuant to the FCA’s Disclosure Guidance and Transparency Rules are published via a Regulatory Information
Service and is available on the Company’s website.
Refer to the Directors’ report, Other statutory information section for a breakdown of major shareholders as at 31 December 2024.
Comparatives for 2023 and 2022 are presented below.
As at 31 December 2023, the Company had been notified under Rule 5 of the Disclosure and Transparency Rules of the UKLA of the
following holdings of voting rights in its shares:
2023
Holder
Number of Barclays
shares
% of total voting
rights attached to
issued share capital1
BlackRock Inc2
944,022,209
5.78
Notes:
1 The percentage of voting rights detailed above was calculated at the time of the relevant disclosures made in accordance with Rule 5 of the DTRs.
2Total shown includes 6,687,206 contracts for difference to which voting rights are attached. Part of the holding is held as American Depositary Receipts. On 25 January 2024, BlackRock,
Inc. disclosed by way of a Schedule 13G filed with the SEC beneficial ownership of 1,303,920,163 ordinary shares of the Company as at 31 December 2023, representing 8.6% of that
class of shares.
As at 31 December 2022, the Company had been notified under Rule 5 of the Disclosure and Transparency Rules of the UKLA of the
following holdings of voting rights in its shares:
2022
Person interested
Number of Barclays
Shares
% of total voting rights
attaching to issued
share capital1
BlackRock Inc2
944,022,209
5.78
Qatar Holding LLC3
1,017,455,690
5.99
Notes:
1The percentage of voting rights detailed above was calculated at the time of the relevant disclosures made in accordance with Rule 5 of the DTRs.
2Total shown includes 6,687,206 contracts for difference to which voting rights are attached. Part of the holding is held as American Depositary Receipts. On 7 February 2023, BlackRock,
Inc. disclosed by way of a Schedule 13G filed with the SEC beneficial ownership of 1,383,730,106 ordinary shares of the Company as at 31 December 2022, representing 8.7% of that
class of shares.
3Qatar Holding LLC is wholly owned by Qatar Investment Authority. On 16 January 2023, Qatar Investment Authority disclosed by way of a Schedule 13G filed with the SEC beneficial
ownership of 800,120,690 ordinary shares of the Company as at 31 December 2022, representing 5.04% of that class of shares.
Strategy
Shareholder
information
Climate and
sustainability report
Governance
Risk
review
Financial
review
Financial
statements
Barclays PLC 2024
Annual Report
on Form 20-F
464
Additional unaudited information (continued)
Disclosure controls and procedures
The Chief Executive, C.S. Venkatakrishnan, and the Group Finance Director, Anna Cross, conducted with Group Management an
evaluation of the effectiveness of the design and operation of the Group’s disclosure controls and procedures of Barclays PLC as at 31
December 2024, which are defined as those controls and procedures designed to ensure that information required to be disclosed in
reports filed or submitted under the US Securities Exchange Act of 1934 is recorded, processed, summarised and reported within the
time periods specified in the US Securities and Exchange Commission’s rules and forms. As of the date of the evaluation, the Chief
Executive and Group Finance Director concluded that the design and operation of these disclosure controls and procedures were
effective.
Board of Directors
See the Directors’ report for biographies.
Group Executive Committee
Officers of the Group
Date of Appointment as
Officer
Anna Cross
Group Finance Director
2022
C S Venkatakrishnan
Group Chief Executive
2021
Alistair Currie
Group Chief Operating Officer, Chief Executive Officer, BX
2019
Stephen Dainton
President Barclays Bank PLC and Head of Investment Bank Managment
2024
Cathal Deasy
Global Co-Head of Investment Banking
2024
Matt Fitzwater
Group Chief Compliance Officer
2024
Matt Hammerstein
Chief Executive of UK Corporate Bank and Head of Public Policy and Corporate Responsibility
2019
Adeel Khan
Head of Global Markets
2024
Vim Maru
CEO, Barclays UK
2023/2024
Denny Nealon
CEO, US Consumer Bank and Barclays Bank Delaware
2024
Tristram Roberts
Group HR Director
2015
Taalib Shaah
Group Chief Risk Officer
2020
Stephen Shapiro
Group General Counsel
2017
Sasha Wiggins
CEO, Private Bank and Wealth Management
2020/2024
Taylor Wright
Global Co-Head of Investment Banking
2024
C.S. Venkatakrishnan, Group Chief Executive, Executive Director
See the Directors’ report for biography.
Anna Cross, Group Finance Director, Executive Director
See the Directors’ report for biography.
Alistair Currie, Group Chief Operating Officer and Chief Executive of Barclays Execution Services (BX)
As Group Chief Operating Officer Alistair is responsible for leading an organisation of 60,000 colleagues in delivering excellent customer
outcomes by providing world-class operations and technology services. Alistair joined Barclays in August 2017 as Chief Operating
Officer & Head of Product for Corporate Banking. In October 2017 he became Co-Head of Corporate Banking and in September 2018
was appointed Head of Corporate Banking. In November 2021 Alistair was appointed Global Head of Consumer Banking and Payments
(CB&P). In this role he led the ongoing transformation of the CB&P business as they become more digitally focussed, efficient and
returns driven, whilst delivering excellent customer service. Prior to joining Barclays, Alistair was at the ANZ Banking Group in Australia
where he most recently held the role of Group Chief Operating Officer, responsible for technology, shared services, operations and
property, and played a key role in the ANZ’s digital transformation. Before taking up this role in 2011, he had previously joined ANZ in
2008 as Managing Director, Transaction Banking. Before ANZ, Alistair spent 18 years at HSBC in a variety of international banking roles
in the UK, Middle East and Asia including President and CEO of HSBC, Taiwan, between 2007 and 2008. As Regional Head of Trade
Services, HSBC Asia Office in Hong Kong from 2004 to 2007, Alistair further developed HSBC’s market-leading trade finance position in
the region and from 2001 to 2004, he was COO, Wells Fargo HSBC Trade Bank NA, San Francisco. With more than 30 years as a banking
professional, Alistair has a wealth of experience in institutional, large corporate, mid-corporate and consumer client segments as well as
transaction banking, trade finance, cash management and technology, and a track record in delivering business transformation and high
quality customer outcomes.Alistair was born in Scotland and grew up in Hong Kong. Based in London, his career has taken him all over
the world and he has lived and worked in the UK, several countries in Asia, the UAE, America and Australia. He holds a Master of Science
(Management) from Imperial College, University of London and a Bachelor of Science (Design & Technology) from Brunel University.
Stephen Dainton, President Barclays Bank PLC and Head of Investment Bank Management
Stephen Dainton is President of Barclays Bank PLC and Head of Investment Bank Management, based in London. He is a member of the
Group Executive Committee for Barclays and chairs the Investment Bank Management Team. Stephen is accountable for the
governance and regulatory obligations of Barclays Bank PLC (BBPLC), exercising executive management responsibilities associated
with the operation of the legal entity and the Investment Bank. Stephen has over 30 years of experience in global markets across
trading, sales, risk, capital markets, structuring, and research. He joined Barclays in September 2017 as Global Head of Equities and Co-
Head of Global Markets. Before Barclays, Stephen spent 14 years at Credit Suisse where he served as Co-Head of Global Markets for
the EMEA region. He joined Credit Suisse in 2003 in the Equity Division and went on to become Head of Equities for the region, before
Strategy
Shareholder
information
Climate and
sustainability report
Governance
Risk
review
Financial
review
Financial
statements
Barclays PLC 2024
Annual Report
on Form 20-F
465
Additional unaudited information (continued)
assuming his global markets role. Previously, Stephen worked at Goldman Sachs as Head of US and International Equities, based in New
York. He has also held roles in Equities at Donaldson, Lufkin & Jenrette in both London and New York.
Cathal Deasy , Global Co-Head of Investment Banking
Cathal Deasy is Global Co-Head of Investment Banking and a member of the Group Executive Committee of Barclays, based in London.
He is also a member of the Investment Bank Management Team and is Co-Chair of the Investment Banking Management Team. Cathal
co-leads and sets the strategy for the Investment Banking business across coverage, capital markets origination, and mergers &
acquisitions. With over 20 years of experience in investment banking and mergers & acquisitions, Cathal joined Barclays in 2023. Prior to
that he served as Global Co-Head of Mergers & Acquisitions and Co-Head of EMEA Investment Banking and Capital Markets at Credit
Suisse. He was also a member of their IBCM Management Committee. Before that Cathal held a number of investment banking roles at
Deutsche Bank. During his career, Cathal has advised companies and played key roles in transactions for, among others, Cinven, Rio
Tinto, DuPont, Scout24, and Paysafe. He has deep experience advising boards and senior management teams on strategic matters
such as large-scale acquisitions and mergers; portfolio reshaping including divestments and spin-offs; and public M&A including
strategic shareholder engagement, defense and activism. Cathal received a Masters in Business Studies and a Bachelor of Commerce
from University of Cork, Ireland.
Matt Fitzwater, Group Chief Compliance Officer
Matt is the Group Chief Compliance Officer at Barclays and part of the Group Executive Committee, based in London. He's also the
Group sponsor for Wellbeing. Matt joined Barclays in 2014 and has taken on several roles in the Legal function, including Interim Co
Group General Counsel. Most recently, he was the Group Centre General Counsel, handling litigation, financial crime, employment,
competition, and regulatory matters globally across all business lines. He also served as the Global Head of Litigation, Investigation, and
Enforcement, and was the Interim Group Head of Compliance from late 2022 through June 2023. Before Barclays, Matt was Special
Counsel at Sullivan & Cromwell in New York, representing large financial institutions in criminal and regulatory matters. Originally from
Greenville, Ohio, Matt graduated from The Ohio State University College of Law in 2001 and Miami University (Ohio) in 1998 with a
double major in History and Political Science, summa cum laude and Phi Beta Kappa.
Matt Hammerstein, Chief Executive of UK Corporate Bank and Head of Public Policy and Corporate Responsibility
Matt Hammerstein is Chief Executive of the UK Corporate Bank and is a member of the Group Executive Committee. He is also Head of
Public Policy and Corporate Responsibility. He leads a team that supports the delivery of the bank’s strategy and is focused on helping
Barclays act responsibly for the common good and the long term. He is responsible for the Public Policy agenda, working closely with
governments, regulators, the media and key policymakers to deliver for Barclays customers, clients and stakeholders. Before this role
he was the CEO for Barclays Bank UK, covering Retail Banking, Investments and Wealth UK, Business Banking and Barclaycard UK. Prior
to that, Matt was Head of Retail Lending covering both the secured and unsecured lending businesses. Matt joined Barclays in 2004 as
Director of Group Strategy, later progressing to become the Group Chief of Staff; a key strategic role in which he provided vital support
to the Group CEO during the financial crisis. Matt went on to manage Barclays Group Corporate Strategy and Corporate Relations,
Barclays Customer and Client Experience in Retail and Business Banking and Barclays UK Retail Products and Segments. Before Joining
Barclays, Matt was a Senior Management Consultant at Marakon Associates where he worked for 12 years in the financial services,
consumer products and energy sectors within the Americas and Europe. Matt graduated with a degree in Mechanical Engineering from
Yale University, and an MBA from the University of Chicago. Matt is a member of the Charities Aid Foundation America Board. Matt is
also Chair of the FCA Practitioner Panel and active ambassador in Barclays for inclusion, wellbeing and anything that makes the
workplace more fun.
Adeel Khan, Head of Global Markets
Adeel Khan is Head of Global Markets and a member of the Group Executive Committee for Barclays and the Investment Bank
Management Team. Based in London, Adeel leads our Credit, Macro, Securitised Products and Equities businesses. Adeel has held a
number of leadership roles since joining Barclays in 2008. Prior to assuming his current position in 2024, he served as Co-Head of Global
Markets since 2021, and Global Head of Credit Products since 2014. Prior to Barclays, Adeel worked at BlueBay Asset Management
where he was also a member of the Investment Committee. Adeel graduated from the London School of Economics with a master’s
degree in Finance & Economics and a bachelor’s degree in Econometrics. Adeel serves on the Board of Directors of EMpowerUK.
Vim Maru, CEO Barclays UK
Vim Maru is Chief Executive Officer of Barclays UK. Vim is also a member of the Group Executive Committee. Vim joined Barclays in
February 2023 as Global Head of Consumer Banking and Payments, leading the business portfolio which included Consumer Cards and
Payments ( US Consumer Bank, Barclaycard Payments, Global Private Bank and Consumer Bank Europe) and UK Corporate Banking and
Global Transaction Banking. Vim is also a Non-Executive Director of Barclays US LLC. Prior to Barclays, Vim spent 11 years at Lloyds
Banking Group, latterly as the Group Director for Retail and 12 years at Santander UK in a range of roles, and is a Chartered Accountant,
Denny Nealon, CEO US Consumer Bank and Barclays Bank Delaware
Denny Nealon is the Chief Executive Officer for Barclays US Consumer Bank (USCB) and Barclays Bank Delaware (BBDE) where he is
responsible for the overall leadership and direction of Barclays’ consumer business in the United States, which includes award-winning
credit card programs and retail deposits. He joined Barclays Group Executive Committee in February 2024 and is part of Barclays
America’s management team and serves as a Director on both the BBDE and IHC Boards. Denny has over 25 years of experience in the
U.S. credit card industry and first joined Barclays in 2004. Most recently, Denny served as President of the USCB with responsibility for
the day-to-day management of the consumer business. Prior to this, he was Head of the US Partnership business, where he oversaw
strategic relationships with leading brands across the airline, travel and entertainment, financial institution, and retail segments. Prior to
joining Barclays, Denny worked at Bank One and Chase Card Services, where he held leadership positions in finance, business
development and partnership management. Denny graduated from the U.S. Naval Academy and served seven years as a Logistics and
Supply Corps officer before joining the corporate sector. He also holds an MBA from the University of Maryland, with concentrations in
Finance and International Business.
Strategy
Shareholder
information
Climate and
sustainability report
Governance
Risk
review
Financial
review
Financial
statements
Barclays PLC 2024
Annual Report
on Form 20-F
466
Additional unaudited information (continued)
Tristram Roberts, Group HR Director
Tristram is the Group Human Resources Director and a member of the Group Executive Committee. Tristram joined Barclays in July
2013 as HR Director for the Investment Bank. His remit was expanded in May 2014 to include HR responsibilities for Barclays Non-Core,
and he became the Group HR Director in December 2015. Prior to Barclays, Tristram was Head of Human Resources for Global
Functions and Operations & Technology at HSBC, as well as Group Head of Performance and Reward. Previously, he was Group Reward
and Policy Director for Vodafone Group plc. Tristram began his career in consulting. He became a partner with Arthur Andersen in 2001
and was subsequently a partner with both Deloitte and KPMG.
Taalib Shaah, Group Chief Risk Officer
Taalib Shaah is Group Chief Risk Officer for Barclays, based in London. He is responsible for helping to define, set and manage the risk
profile of the bank and leads the risk management organisation across the group. He is a member of the Group Executive Committee.
Taalib joined Barclays in late 2014 as Chief Risk Officer for the Investment Bank and in 2017 assumed the role of Chief Risk Officer for
Barclays International (BBPLC), responsible for the Corporate and Investment Bank, the Private Bank and the Cards & Payments
business. He assumed his current role in October 2020. Prior to Barclays, Taalib spent four years at Citigroup where he was most
recently Chief Risk Officer for Market Risk, Real Estate Credit, Treasury, Private Equity and Head of Model Validation. Previously, Taalib
spent 17 years at Credit Suisse, working in various areas, including risk and the front office. He began his career at Ernst and Young.
Taalib holds an MA in Engineering Science and Economics from Oxford University and is a Chartered Accountant.
Stephen Shapiro, Group General Counsel
Stephen is an experienced lawyer and company secretary with a deep understanding of legal, corporate governance and regulatory
matters. Holding the role of Group General Counsel, he oversees Barclays’ global Legal function. Stephen is also a member of the
Group Executive Committee (ExCo). Stephen previously served as the Group Company Secretary and Deputy General Counsel of
SABMiller plc. Prior to this, he practised law as a partner in a law firm in South Africa, and subsequently in corporate law and M&A at
Hogan Lovells in the UK. He was appointed as Group Company Secretary of Barclays in November 2017 and was subsequently
appointed Group General Counsel in August 2020. Stephen is an active industry contributor and has served as a member of the
Executive Committee of the GC100, the Association of General Counsel and Company Secretaries working in FTSE100 companies,
and as its Vice-Chair. Stephen also previously served as Chairman of the ICC UK’s Committee on Anti-Corruption.
Sasha Wiggins, CEO, Private Bank and Wealth Management
Sasha Wiggins is Chief Executive of Barclays Private Bank and Wealth Management, and she is a member of the Group Executive
Committee. Sasha joined Barclays in 2002, progressing through a number of roles in the Private Bank. In 2015 she was appointed CEO
of Barclays Bank Ireland and subsequently became the Group Chief of Staff in 2018. Sasha joined the Group Executive Committee as
the Group Head of Public Policy and Corporate Responsibility, accountable for the Bank’s overall sustainability agenda and Barclays
engagement with governments, regulators, the media and key policymakers. She assumed her current role in February 2024. Sasha is a
Fellow of the Chartered Institute of Securities & Investment. She is also Vice Chair of the Royal Marsden Cancer Charity’s Corporate
Partnerships Board and trustee on the Board of Grief Encounter, a national charity supporting bereaved children and young people.
Taylor Wright , Global Co-Head of Investment Banking
Taylor Wright is Global Co-Head of Investment Banking and a member of the Group Executive Committee at Barclays, based in New
York. He is also a member of the Investment Bank Management Team and is Co-Chair of the Investment Banking Management Team.
Appointed to his current role in 2023, Taylor co-leads and sets the strategy for the Investment Banking business across coverage,
capital markets and mergers & acquisitions. He was previously the Global Co-Head of Capital Markets, and prior to that, Co-Head of
Equity Capital Markets for the Americas. Taylor has over 30 years of experience in Investment Banking and Capital Markets. Prior to
joining Barclays, he spent 25 years at Morgan Stanley in New York and Hong Kong, principally in Equity Capital Markets. Over his career,
Taylor has originated and led more than US$250 billion of equity and equity-linked offerings across multiple industries and geographies.
Taylor has played key roles in transactions for, among others, Arm Holdings, AIG, AIB, AXA/Equitable, RBS/Citizens Financial, GE, Korea
Telecom, Moelis & Company, Ryan Specialty, UMC and Tradeweb, has led TARP refinancings for multiple US regional banks, and was an
advisor to the US Department of Treasury during the financial crisis. Taylor received an MBA from the University of Virginia’s Darden
Graduate School of Business Administration and received a BA degree in English from Cornell University.
Strategy
Shareholder
information
Climate and
sustainability report
Governance
Risk
review
Financial
review
Financial
statements
Barclays PLC 2024
Annual Report
on Form 20-F
467
Additional unaudited information (continued)
Service contracts and letters of appointment
Each Executive Director has a service contract, whereas the Chairman and Non-Executive Directors each have a letter of appointment.
Copies of the service contracts and letters of appointment are available for inspection at the Company’s registered office. The
effective dates of the current Directors’ appointments disclosed in their service contracts or letters of appointment are shown in the
table below.
As stated in the letters of appointment, the Chairman and Non-Executive Directors are appointed for an initial term of three years and
are subject to annual re-election by shareholders. On expiry of the initial term and subject to the needs of the Board, Non-Executive
Directors may be invited to serve a further three years. Non-Executive Directors appointed beyond six years will be at the discretion of
the Board Nominations Committee.
The effective dates of appointment of those Directors that stepped down from the Board in 2024 or otherwise prior to the date of this
report are also shown below.
Effective date of appointment
Chairman
Nigel Higgins
1 March 2019 (as a Non-Executive Director)
2 May 2019 (as Chairman)
Executive Directors
C.S. Venkatakrishnan
1 November 2021
Anna Cross
23 April 2022
Non-Executive Directors
Robert Berry
8 February 2022
Tim Breedon
1 November 2012
Dawn Fitzpatrick
25 September 2019
Mary Francis
1 October 2016
Brian Gilvary
1 February 2020
Sir John Kingman
1 June 2023
Marc Moses
23 January 2023
Brian Shea
19 July 2024
Julia Wilson
1 April 2021
Former Non-Executive Directors
Mohamed El-Erian1
1 January 2020
Diane Schueneman2
25 June 2015
Notes:
1Mohamed El- Erian stepped down from the Board on 31 August 2024.
2Diane Schueneman stepped down from the Board with effect from 31 January 2025.
Insider trading policies
The Barclays Group has adopted insider trading policies and procedures governing the purchase, sale, and other dealings in securities
issued by members of the Barclays Group by directors, senior management and certain employees that are designed to promote
compliance with applicable insider trading laws, rules and regulations. These policies and procedures are included in the Barclays Group
Securities Dealing Code, which is filed as Exhibit 11.2 to this annual report on Form 20-F.
The Barclays Group monitors inside information as defined under the Market Abuse Regulation 2014/596 (as it forms part of domestic
law by virtue of the European Union (Withdrawal) Act 2018, as amended) (“MAR”) as part of its compliance with MAR and as part of its
disclosure controls and procedures, and imposes restrictions on trading in its own securities for its own account when it has
undisclosed inside information. The Barclays Group also generally refrains from trading in its own securities for its own account during
its regular closed periods.
Strategy
Shareholder
information
Climate and
sustainability report
Governance
Risk
review
Financial
review
Financial
statements
Barclays PLC 2024
Annual Report
on Form 20-F
468
Additional unaudited information (continued)
Repurchase of Shares by Barclays and Affiliated Purchasers
Month
Period
Total Shares Purchased
Average Price Paid Per Share (pence)
Total Number of Shares Purchased as
Part of Publicly Announced Plans or
Programs
Maximum Number (or Approximate GBP
Value) of Shares that May Yet be
Purchased Under the Plans or Programs
Jan-24
Month 1
Feb-24
Month 2
22,840,737
165.70p
22,840,737
£962,151,834.13
Mar-24
Month 3
93,923,054
176.40p
116,763,791
£796,469,093.52
Apr-24
Month 4
92,878,692
187.99p
209,642,483
£621,866,193.56
May-24
Month 5
94,223,058
213.11p
303,865,541
£421,071,290.68
Jun-24
Month 6
95,135,023
209.35p
399,000,564
£221,909,785.02
Jul-24
Month 7
98,922,574
224.33p
497,923,138
£0.00
Aug-24
Month 8
77,746,722
221.32p
575,669,860
£577,933,120.36
Sep-24
Month 9
86,143,760
223.98p
661,813,620
£384,991,704.83
Oct-24
Month 10
77,484,188
234.81p
739,297,808
£203,047,267.17
Nov-24
Month 11
64,097,120
255.71p
803,394,928
£39,147,287.83
Dec-24
Month 12
14,775,685
264.94p
818,170,613
£0.00
Strategy
Shareholder
information
Climate and
sustainability report
Governance
Risk
review
Financial
review
Financial
statements
Barclays PLC 2024
Annual Report
on Form 20-F
469
Additional unaudited information (continued)
Number of employees split by grade
2024
2023
2022
Senior
8%
8%
8%
Middle
42%
42%
42%
Junior
50%
50%
50%
Senior - Managing Director and Director
Middle - Assistant Vice President and Vice President
Junior - Business Analyst grades
Number of employees split by region (full time equivalent)
2024
2023
2022
UK
45,200
49%
45,000
49%
44,000
50%
APAC
32,300
35%
31,100
34%
28,000
32%
Americas
11,300
12%
12,200
13%
11,400
13%
Europe
4,100
4%
4,100
4%
4,000
5%
Barclays Group
92,900
100%
92,400
100%
87,400
100%
Strategy
Shareholder
information
Climate and
sustainability report
Governance
Risk
review
Financial
review
Financial
statements
Barclays PLC 2024
Annual Report
on Form 20-F
470
Additional unaudited information (continued)
Section 13(r) to the US Securities Exchange Act of 1934 (Iran sanctions and related disclosure)
Section 13(r) of the U.S. Securities Exchange Act of 1934 as amended (the “Exchange Act”) requires each SEC reporting issuer to
disclose in its annual and, if applicable, quarterly reports whether it or any of its affiliates have knowingly engaged in certain activities,
transactions or dealings relating to Iran or with the Government of Iran or certain designated natural persons or entities involved in
terrorism or the proliferation of weapons of mass destruction during the period covered by the report. The requirement includes
disclosure of activities not prohibited by U.S. or other law, even if conducted outside the U.S. by non-U.S. companies or affiliates in
compliance with local law. Pursuant to Section 13(r) of the Exchange Act, we note the following in relation to activity that occurred in
2024, the reporting period covered by this annual report. For completeness, we also include activity that we became aware of in 2024,
even if such activity occurred prior to the reporting period. Except as noted below, Barclays intends to continue the activities described.
Barclays does not allocate profits at the level of these activities, which in any event would not be significant, and we therefore report
only gross revenue where measurable. Barclays attributed revenue of approximately GBP 16,780 in relation to the activities disclosed
below.
Legacy Guarantees
Between 1992 and 2006, Barclays entered into several guarantees for the benefit of Iranian banks in connection with the supply of
goods and services by Barclays customers to Iranian buyers (the “Iranian guarantees”). These were counter guarantees issued to Iranian
banks to support guarantees issued by these banks to the Iranian buyers. The Iranian banks and a number of the Iranian buyers were
either subsequently designated as Specially Designated Nationals and Blocked Persons (“SDNs”) by the U.S. Department of the
Treasury’s Office of Foreign Assets Control (“OFAC”) or are owned by the Government of Iran. In addition, between 1993 and 2005,
Barclays entered into similar guarantees for the benefit of a Syrian bank that was subsequently designated pursuant to the Weapons of
Mass Destruction Proliferators Sanctions Regulations (“WMDPSR”) in August 2011 (the “WMDPSR guarantees”).
These guarantees were issued either on:
(i)an “extend or pay” basis, which means that, although the guarantee is of limited duration on its face, until there is full
performance under the contract to provide goods and services, the terms of the guarantee require Barclays to maintain the guarantee
or pay the beneficiary bank the full amount of the guarantee; or
(ii)the basis that Barclays’ obligations can be discharged only with the consent of the beneficiary counterparty.
Barclays is not able to exit its obligations under the above guarantees unilaterally, and thus it maintains a limited legacy portfolio of these
guarantees, which complied with applicable laws and regulations at the time they were entered into. Barclays intends to terminate the
guarantees where an agreement can be reached with the counterparty, in accordance with applicable laws and regulations. Barclays
attributed no revenue in 2024 in relation to the Iranian guarantees and revenue of approximately GBP 15,330 in 2024 in relation to the
WMDPSR guarantees.
Lease Payments
Barclays is party to a long-term lease, entered in 1979, with the National Iranian Oil Company (“NIOC”), pursuant to which Barclays rents
part of NIOC House in London. The lease is for 60 years, contains no early termination clause, and has 15 years remaining. Barclays
makes lease payments in GBP to the bank account of a solicitor that represents an entity owned by the Government of Iran. The
payments are made in accordance with applicable laws and regulations. Barclays attributed no revenue in 2024 in relation to this activity.
Local Clearing Systems
Banks based in the United Arab Emirates (“UAE”), including certain Iranian banks designated pursuant to the Global Terrorism Sanctions
Regulations (“GTSR”) and/or Government of Iran-owned banks, participate in the various banking payment and settlement systems
used in the UAE (the “UAE Clearing Systems”). Barclays, by virtue of its banking activities in the UAE, participates in the UAE Clearing
Systems, in accordance with applicable laws and regulations. To mitigate the risk of engaging in transactions in which participant Iranian
SDN and/or Government of Iran-owned banks may be involved, Barclays has implemented restrictions relating to its involvement in the
UAE Clearing Systems. Barclays attributed no revenue in 2024 in relation to this activity.
Other Activity
Barclays maintains a customer relationship with a UK-incorporated medical manufacturing company. In 2024, Barclays processed a
payment, for the benefit of our customer, relating to the export of medical devices to privately owned entities in Türkiye. The end users
of these medical devices include hospitals, medical universities, or clinics that may be owned or controlled by, or affiliated with, the
Government of Iran. The payments were made in accordance with applicable laws and regulations, and all payments were received from
the privately owned entities in Türkiye, or their affiliates; no payments were received directly from any SDN or entity owned or controlled
by, or affiliated with, the Government of Iran. Although OFAC has issued general licenses relating to the sale of medical devices to Iran,
Strategy
Shareholder
information
Climate and
sustainability report
Governance
Risk
review
Financial
review
Financial
statements
Barclays PLC 2024
Annual Report
on Form 20-F
471
Additional unaudited information (continued)
including the Government of Iran, these licenses do not apply to sales of non-U.S. origin items by non-U.S. persons. Barclays attributed
revenue of approximately GBP 5 in 2024 in relation to this activity.
In 2024, Barclays processed payments to the embassy of the Government of Iran in the UK in relation to persons paying fees for
renewing or replacing passports, visa applications, and other administrative matters. The payments were processed in accordance with
applicable laws and regulations. Barclays attributed no revenue in 2024 in relation to this activity.
Barclays holds accounts for several UK-resident individuals employed by a UK-based SDN entity that is ultimately owned by the
Government of Iran. Payments are received in GBP from a UK-based payment services company and are credited to the customers’
accounts with Barclays. The payments are processed in accordance with applicable laws and regulations. No payments are received
directly from any entity owned by the Government of Iran or any SDN. Barclays attributed no revenue in 2024 in relation to this activity.
In 2024, on behalf of certain customers in the UK, Barclays processed indirect payments from various UK-based offices of Iranian SDNs,
Government of Iran-owned entities, and SDNs designated pursuant to the GTSR (the “entities”). The payments were for general
business expenses, including rent, salary payments, tax payments, office maintenance, utility payments, and business travel expenses.
A UK accounting firm remitted the payments on behalf of the entities, and all the payments were processed in accordance with
applicable laws and regulations. Barclays attributed revenue of approximately GBP 70 in 2024 in relation to this activity.
In 2023, Barclays exited three customers in the UK. Barclays held the funds from the accounts of these customers in internal accounts
whilst awaiting disposal instructions. However, in 2024, before the former customers provided disposal instructions, two of the former
customers were designated as SDNs pursuant to the GTSR. The third former customer was controlled by one of the SDNs. Barclays
froze these funds in internal accounts in accordance with applicable laws and regulations. Barclays attributed revenue of approximately
GBP 5 in relation to this activity.
In 2024, a Barclays customer who held two credit facilities in Germany was designated as an SDN pursuant to the WMDPSR. Barclays
blocked the credit facilities, exited the relationship, and wrote off the outstanding debt. Barclays attributed no revenue in 2024 in
relation to this activity.
In 2024, a cardholder of a corporate credit card issued by Barclays to a customer in the UK was designated as an SDN pursuant to the
GTSR. Barclays blocked the credit card and exited the customer relationship. Several transactions were processed after the cardholder
was designated, but before Barclays had identified the match. Barclays attributed revenue of approximately GBP 30 in 2024 in relation
to this activity.
In 2024, Barclays identified that a customer in the UK had been designated as an SDN pursuant to the WMDPSR in 2021. The customer
had an account that was closed in July 2021 and a corporate credit card that was closed in July 2022. A number of payments were made
using the credit card, and one payment was made on the account, after the customer was designated, but before Barclays had
identified the match. Barclays attributed revenue of approximately GBP 1,340 in 2021 and 2022 in relation to this activity.
Frozen Accounts
Barclays, and several Barclays customers, continue to hold funds belonging to various SDNs and Government of Iran-owned entities in
internal blocked and sundry accounts, some of which are interest bearing. These accounts are held in accordance with applicable laws
and regulations. Barclays attributed no revenue in 2024 in relation to this activity.
Strategy
Shareholder
information
Climate and
sustainability report
Governance
Risk
review
Financial
review
Financial
statements
Barclays PLC 2024
Annual Report
on Form 20-F
472
Additional unaudited information (continued)
Summary of Barclays Group share and cash plans and long-term incentive plans
Barclays operates a number of share, cash and long-term incentive plans. The principal plans used for awards made in or, in respect of,
the 2024 performance year are shown in the table below. Awards are granted by the Barclays PLC Board Remuneration Committee or a
delegated sub-committee (the “Committee”), and are subject to the applicable plan rules (as amended from time to time). Share
awards are granted over ordinary shares in Barclays PLC (“Shares”). Barclays has a number of employee benefit trusts which operate in
conjunction with these plans. In some cases the trustee purchases Shares in the market to satisfy awards; in others, new issue or
treasury Shares may be used to satisfy awards where the appropriate shareholder approval has been obtained.
Summary of principal share and cash plans and long-term incentive plans
Name of plan
Eligible employees
Executive
Directors
eligible
Delivery
Design details
Share Value Plan
(SVP)
All employees
(including
executive
Directors of
Barclays PLC)
Yes
Deferred Share awards,
typically released in
instalments over a three,
four, five or seven year
period, dependent on
future service and subject
to malus provisions
–The SVP typically used for mandatory deferral of a proportion
of bonus into Shares where bonus is above a threshold (set
annually by the Committee). The SVP is also used to deliver the
upfront portion of a Material Risk Taker’s (“MRT”) variable
remuneration that must be delivered in Shares in line with
regulatory requirements.
–This plan typically works in tandem with the CVP (below).
–SVP awards typically vest over three, four, five or seven years
dependent on future service.
–Vesting is subject to malus terms, suspension provisions and
the other provisions of the rules of the SVP.
–On cessation of employment, eligible leavers (as set out in the
rules of the SVP) normally remain eligible for release (on the
scheduled release dates) subject to the Committee and/or
trustee discretion. For other leavers, , including where the
employee resigns before the third anniversary of grant, awards
will normally lapse.
–On change of control, awards may vest at the Committee’s
and/or trustee’s discretion.
–For SVP awards made to Material Risk Takers (“MRTs”), a
holding period of either 6 or 12 months will apply to Shares
(after tax) on release.
Deferred Share
Value Plan (SVP)
All employees
(excluding
executive
Directors of
Barclays PLC)
No
Deferred Share awards,
typically released in
instalments over a three,
four, five or seven year
period, dependent on
future service and subject
to malus provisions
–The DSVP is in all material respects the same as the SVP
described above. The principle difference is that the DSVP has
not been approved by Barclays Shareholders and therefore the
Executive Directors of Barclays PLC are not eligible to
participate and the plan operates over market purchase Shares
only.
Cash Value Plan
(CVP)
All employees
(including
executive
Directors of
Barclays PLC)
Yes
Deferred cash award
typically released in
instalments over a three,
four, five or seven year
period, dependent on
future service and subject
to malus provisions
–The CVP is typically used for mandatory deferral of a
proportion of bonus where bonus is above a threshold (set
annually by the Committee.
–This plan typically works in tandem with the SVP.
–CVP awards vest over three, four, five or seven years
dependent on future service.
–Vesting is subject to malus terms, suspension provisions and
the other provisions of the rules of the CVP.
–Change of control and leaver provisions are as for SVP.
Strategy
Shareholder
information
Climate and
sustainability report
Governance
Risk
review
Financial
review
Financial
statements
Barclays PLC 2024
Annual Report
on Form 20-F
473
Additional unaudited information (continued)
Barclays Long
Term Incentive
Plan (LTIP)
Selected
employees
(including
executive
Directors of
Barclays PLC)
Yes
Awards over Shares subject
to risk-adjusted
performance conditions
and malus provisions
–Awarded on a discretionary basis with participation reviewed by
the Committee.
–Awards only vest if the forward-looking performance
conditions are satisfied over a three year period.
–LTIP awards vest over seven years dependent on future
service.
–Vesting is subject to malus terms, suspension provisions and
the other provisions of the rules of the LTIP.
–Any Shares released under the LTIP award (after payment of
tax) will be subject to an additional holding period of no less
than the minimum regulatory requirements (currently 12
months).
–On cessation of employment, eligible leavers (as set out in the
rules of the LTIP) normally remain eligible for release (on the
scheduled release dates) pro-rated for time and performance.
For other leavers, awards will normally lapse.
–On change of control, awards may vest at the Committee’s
discretion.
Sharesave
All employees in
the UK and Ireland
(including
executive
Directors of
Barclays PLC)
Yes
Options over Shares at a
discount of 20%, with
Shares delivered or cash
value of savings returned
after three or five years
–HMRC tax advantaged plan in the UK and approved by the
Revenue Commissioners in Ireland.
–Opportunity to purchase Shares at a discount price (currently a
20% discount) set on award date with savings made over three
or five year term.
–Maximum individual savings of £300 per month or the Euro
equivalent in Ireland.
–On cessation of employment, eligible leavers may exercise
options and acquire Shares to the extent of their savings for six
months.
–On change of control, participants may exercise options and
acquire Shares to the extent of their savings for six months.
Sharepurchase
All employees in
the UK (including
executive
Directors of
Barclays PLC)
Yes
Shares purchased from
gross salary deductions and
Dividend/Matching Shares
are held in trust for three to
five years
–HMRC tax advantaged plan in the UK.
–Participants may purchase up to £1,800 of Shares each tax
year (“Partnership Shares”).
–Barclays matches the first £600 of Partnership Shares on a one
for one basis for each tax year (“Matching Shares”).
–Dividends received are awarded as Dividend Shares.
–Partnership Shares may be withdrawn at any time (though if
removed prior to three years from award, the corresponding
Matching Shares are forfeited).
–Depending on reason for and timing of leaving, Matching
Shares may be forfeited.
–On change of control, participants are able to instruct the
Sharepurchase trustee how to act or vote on their behalf in
relation to their Shares.
Global
Sharepurchase
Employees in
certain
jurisdictions other
than the UK
((including
executive
Directors of
Barclays PLC)
Yes
Shares purchased from net
salary deductions and
Dividend/Matching Shares
are held in trust for three to
five years
–Global Sharepurchase is an extension of the Sharepurchase
plan (above).
–Operates in substantially the same way as Sharepurchase but
without the tax advantages.
Strategy
Shareholder
information
Climate and
sustainability report
Governance
Risk
review
Financial
review
Financial
statements
Barclays PLC 2024
Annual Report
on Form 20-F
474
Additional unaudited information (continued)
Average deposits at amortised cost, average interest rate paid - split by type and UK vs Non- UK
The following tables present average deposits at amortised cost and their associated interest expense by deposit type split into UK &
Non-UK, and is based on the location of the customer.
Average deposits at
amortised cost
Interest expense
Average interest
rate
For the year ended 31 December 2024
£m
£m
%
UK
Non- interest bearing current and demand accounts
110,562
—
—
Interest bearing current and demand accounts
65,110
1,250
1.9
Savings and time deposits1
218,228
6,586
3.0
Total UK
393,900
7,836
2.0
Non-UK
Non- interest bearing current and demand accounts
9,881
—
—
Interest bearing current and demand accounts
32,876
914
2.8
Savings and time deposits1,2
121,573
5,342
4.4
Total Non-UK
164,330
6,256
3.8
Total deposits at amortised cost
558,230
14,092
2.5
Average deposits at
amortised cost
Interest expense
Average interest
rate
For the year ended 31 December 2023
£m
£m
%
UK
Non- interest bearing current and demand accounts
124,145
—
—
Interest bearing current and demand accounts
52,005
734
1.4
Savings and time deposits1
224,019
5,358
2.4
Total UK
400,169
6,092
1.5
Non-UK
Non- interest bearing current and demand accounts
16,454
—
—
Interest bearing current and demand accounts
14,938
335
2.2
Savings and time deposits1,2
120,688
4,824
4.0
Total Non-UK
152,080
5,159
3.4
Total Deposits at amortised cost
552,249
11,251
2.0
Average deposits at
amortised cost
Interest expense
Average interest
rate
For the year ended 31 December 2022
£m
£m
%
UK
Non- interest bearing current and demand accounts
142,375
—
—
Interest bearing current and demand accounts
51,771
321
0.6
Savings and time deposits1
221,378
1,364
0.6
Total UK
415,524
1,685
0.4
Non-UK
Non- interest bearing current and demand accounts
19,639
—
—
Interest bearing current and demand accounts
16,223
116
0.7
Savings and time deposits1
104,247
1,772
1.7
Total Non-UK
140,109
1,888
1.3
Total Deposits at amortised cost
555,633
3,573
0.6
Notes:
1 For information on term deposits please refer to the Barclays PLC Annual Report contractual maturity of financial assets and liabilities note.
2Average deposits includes held for sale balances generating interest expense.
As at 31st December 2024, deposits at amortised cost in offices in the United Kingdom received from non-residents amounted to
£43,069m (2023: £49,806m).
Strategy
Shareholder
information
Climate and
sustainability report
Governance
Risk
review
Financial
review
Financial
statements
Barclays PLC 2024
Annual Report
on Form 20-F
475
Additional unaudited information (continued)
Uninsured other time deposits
Uninsured deposits are presented on an approximate basis based on Barclays Group’s deposits less those eligible for the deposit
insurance schemes. The maturity for uninsured deposits is based on the residual maturity.
2024
2023
£m
£m
3 months or less
83,283
126,381
3 to 6 months
27,355
20,599
6 to 12 months
16,003
22,149
12 months and over
4,618
5,200
Total
131,259
174,329
As at 31 December 2024, £433m (2023: £1,134m) of U.S. time deposits were in excess of the Federal Deposit Insurance Corporation
insurance limit.
Of the total deposits at amortised cost, there are uninsured deposits of £327,188m (2023: £315,144m) which are not insured through
the UK Financial Services Compensation Scheme (FSCS) or other similar deposits schemes.
Strategy
Shareholder
information
Climate and
sustainability report
Governance
Risk
review
Financial
review
Financial
statements
Barclays PLC 2024
Annual Report
on Form 20-F
476
Additional unaudited information (continued)
Contractual obligations
Contractual obligations include debt securities and purchase obligations.
Contractual obligations
Payments due by period
Less than one year
Between one to three
years
Between three to
five years
After five years
Total
£m
£m
£m
£m
£m
As at 31 December 2024
Long-term debt1
29,690
20,648
19,340
56,909
126,587
Purchase obligations
920
1,248
563
201
2,932
Total
30,610
21,896
19,903
57,110
129,519
As at 31 December 2023
Long-term debt1
41,012
20,915
15,510
48,748
126,185
Purchase obligations
696
1,261
615
80
2,652
Total
41,708
22,176
16,125
48,828
128,837
Note:
1 Long-term debt has been prepared to reflect cash flows on an undiscounted basis, which includes interest payments.
Net cash flows from derivatives used to hedge long-term debt amount to £(3.2)bn (2023: £(2.7)bn).
Further information on the contractual maturity of the Group’s assets, liabilities, contingent liabilities and commitments is given in the
Liquidity risk section.
Securities
Investment securities include debt securities reported at amortised cost and financial assets at fair value through other comprehensive
income.
Investment in debt securities principally include government securities held as part of the liquidity risk management within the Treasury
and Capital Risk framework. In addition, the Group holds investments in corporate securities.
Maturities and yield of investment debt securities
Maturing within one year
Maturing after one but
within five years
Maturing after five but
within ten years
Maturing after ten years
Total
Amount
Yield
Amount
Yield
Amount
Yield
Amount
Yield
Amount
Yield
As at 31 December 2024
£m
%
£m
%
£m
%
£m
%
£m
%
Debt securities at amortised cost
7,051
1.5%
32,631
3.5%
4,816
3.5%
23,712
4.5%
68,210
3.7%
Financial assets at fair value through
other comprehensive income
3,760
3.4%
35,959
3.3%
25,553
3.2%
9,500
2.7%
74,772
3.2%
Total book value
10,811
68,590
30,369
33,212
142,982
The above table is only for debt securities held at the reporting date and does not include associated hedges.
Strategy
Shareholder
information
Climate and
sustainability report
Governance
Risk
review
Financial
review
Financial
statements
Barclays PLC 2024
Annual Report
on Form 20-F
477
Additional unaudited information (continued)
Average balance sheet
Average balances are based upon monthly averages.UK and Non-UK is based on the location of the office where the transactions are
recorded.
Assets
2024
Average
balance
Net interest1
Rate
£m
£m
%
Cash and balances at central banks
UK
112,440
5,177
4.6
Cash and balances at central banks
Non-UK
120,834
5,899
4.9
Cash and balances at central banks
Total
233,274
11,076
4.7
Loans and advances at amortised cost
UK
266,183
11,695
4.4
Loans and advances at amortised cost
Non-UK
84,146
6,141
7.3
Loans and advances at amortised cost2,5
Total
350,329
17,836
5.1
Debt securities at amortised cost
UK
52,446
2,010
3.8
Debt securities at amortised cost
Non-UK
9,968
435
4.4
Debt securities at amortised cost
Total
62,414
2,445
3.9
Cash collateral
UK
52,889
1,785
3.4
Cash collateral
Non-UK
25,299
623
2.5
Cash collateral
Total
78,188
2,408
3.1
Reverse repurchase agreements
UK
3,421
110
3.2
Reverse repurchase agreements
Non-UK
772
28
3.6
Reverse repurchase agreements
Total
4,193
138
3.3
Fair value through other comprehensive income
UK
74,712
3,558
4.8
Fair value through other comprehensive income
Non-UK
4,817
263
5.5
Fair value through other comprehensive income
Total
79,529
3,821
4.8
Other3
602
Total interest earning assets with interest recognise in interest income
807,927
38,326
4.7
Less: interest and similar expense
(25,390)
Net interest income
12,936
Other assets4
795,976
Total
1,603,903
Percentage of total average interest earning assets with interest recognise in interest
income for offices outside the UK
30%
Notes:
1 Negative interest paid on assets is immaterial for 2024 (2023: £53m, 2022: £416m) which is presented within net interest.
2Loans and advances at amortised cost include all doubtful lending. Interest receivable on such lending has been included to the extent to which either cash payments have been
received or interest has been accrued in accordance with the income recognition policy of the Barclays Group.
3 Other principally includes interest expense relating to hedging activity and interest income on pensions.
4 The interest on Trading portfolio assets, Derivative financial instruments and Financial assets at fair value through the income statement are recognised in net trading income and the
average balances for these assets are included in Other assets.
5 Average loans and advances include held for sale balances generating interest income.
Strategy
Shareholder
information
Climate and
sustainability report
Governance
Risk
review
Financial
review
Financial
statements
Barclays PLC 2024
Annual Report
on Form 20-F
478
Additional unaudited information (continued)
Assets
2023
Average balance
Net interest1
Rate
£m
£m
%
Cash and balances at central banks
UK
121,390
4,979
4.1
Cash and balances at central banks
Non-UK
133,302
5,279
4.0
Cash and balances at central banks
Total
254,692
10,258
4.0
Loans and advances at amortised cost
UK
271,774
9,599
3.5
Loans and advances at amortised cost
Non-UK
84,556
5,143
6.1
Loans and advances at amortised cost2
Total
356,330
14,742
4.1
Debt securities at amortised cost
UK
46,793
2,103
4.4
Debt securities at amortised cost
Non-UK
5,023
234
4.7
Debt securities at amortised cost
Total
51,816
2,337
4.5
Cash collateral
UK
56,030
1,683
3.0
Cash collateral
Non-UK
25,875
692
2.7
Cash collateral
Total
81,905
2,375
2.9
Reverse repurchase agreements
UK
1,504
45
3.0
Reverse repurchase agreements
Non-UK
1,247
55
4.4
Reverse repurchase agreements
Total
2,751
100
3.6
Fair value through other comprehensive income
UK
65,001
4,745
7.3
Fair value through other comprehensive income
Non-UK
3,458
162
4.7
Fair value through other comprehensive income
Total
68,459
4,907
7.2
Other3
303
Total interest earning assets with interest recognise in interest income
815,953
35,022
4.3
Less: interest and similar expense
(22,313)
Net interest income
12,709
Other assets4
779,822
Total
1,595,775
Percentage of total average interest earning assets with interest recognise in interest
income for offices outside the UK
31%
Notes
1 Negative interest paid on assets is immaterial for 2024 (2023: £53m, 2022: £416m) which is presented within net interest.
2 Loans and advances at amortised cost include all doubtful lending. Interest receivable on such lending has been included to the extent to which either cash payments have been
received or interest has been accrued in accordance with the income recognition policy of the Barclays Group.
3 Other principally includes interest expense relating to hedging activity and interest income on pensions.
4The interest on Trading portfolio assets, Derivative financial instruments and Financial assets at fair value through the income statement are recognise principally in net trading income
and the average balances for these assets are included in Other assets.
Strategy
Shareholder
information
Climate and
sustainability report
Governance
Risk
review
Financial
review
Financial
statements
Barclays PLC 2024
Annual Report
on Form 20-F
479
Additional unaudited information (continued)
Assets
2022
Average balance
Net interest1
Rate
£m
£m
%
Cash and balances at central banks
UK
128,793
1,669
1.3
Cash and balances at central banks
Non-UK
137,155
1,057
0.8
Cash and balances at central banks
Total
265,948
2,726
1.0
Loans and advances at amortised cost
UK
273,842
7,834
2.9
Loans and advances at amortised cost
Non-UK
78,303
4,291
5.5
Loans and advances at amortised cost2
Total
352,145
12,125
3.4
Debt securities at amortised cost
UK
40,221
1,147
2.9
Debt securities at amortised cost
Non-UK
3,258
104
2.9
Debt securities at amortised cost
Total
43,479
1,251
2.9
Cash collateral
UK
61,830
420
0.7
Cash collateral
Non-UK
23,592
24
0.1
Cash collateral
Total
85,422
444
0.5
Reverse repurchase agreements
UK
982
29
3.0
Reverse repurchase agreements
Non-UK
2,383
11
0.5
Reverse repurchase agreements
Total
3,365
40
1.2
Fair value through other comprehensive income
UK
58,937
1,862
3.2
Fair value through other comprehensive income
Non-UK
4,474
101
2.3
Fair value through other comprehensive income
Total
63,411
1,963
3.1
Other3
131
Total interest earning assets with interest recognise in interest income
813,770
18,680
2.3
Less: interest and similar expense
(8,108)
Net interest income
10,572
Other assets4
797,386
Total
1,611,156
Percentage of total average interest earning assets with interest recognise in interest
income for offices outside the UK
31%
Notes
1 Negative interest paid on assets is immaterial for 2024 (2023: £53m, 2022: £416m) which is presented within net interest.
2 Loans and advances at amortised cost include all doubtful lending. Interest receivable on such lending has been included to the extent to which either cash payments have been
received or interest has been accrued in accordance with the income recognition policy of the Barclays Group.
3 Other principally includes interest expense relating to hedging activity and interest income on pensions.
4The interest on Trading portfolio assets, Derivative financial instruments and Financial assets at fair value through the income statement are recognise principally in net trading income
and the average balances for these assets are included in Other assets.
Strategy
Shareholder
information
Climate and
sustainability report
Governance
Risk
review
Financial
review
Financial
statements
Barclays PLC 2024
Annual Report
on Form 20-F
480
Additional unaudited information (continued)
Liabilities
2024
Average balance
Net interest1
Rate
£m
£m
%
Interest bearing deposits at amortised cost
UK
324,000
9,215
2.8
Interest bearing deposits at amortised cost
Non-UK
113,787
4,877
4.3
Interest bearing deposits at amortised cost4
Total
437,787
14,092
3.2
Cash collateral
UK
46,875
1,510
3.2
Cash collateral
Non-UK
25,327
766
3.0
Cash collateral
Total
72,202
2,276
3.2
Debt securities in issue
UK
68,578
4,655
6.8
Debt securities in issue
Non-UK
30,457
2,053
6.7
Debt securities in issue
Total
99,035
6,708
6.8
Subordinated liabilities
UK
10,800
895
8.3
Subordinated liabilities
Non-UK
668
50
7.5
Subordinated liabilities
Total
11,468
945
8.2
Repurchase agreements
UK
42,314
1,121
2.6
Repurchase agreements
Non-UK
1,673
123
7.4
Repurchase agreements
Total
43,987
1,244
2.8
Other2
125
Total interest bearing liabilities with interest recognise in interest expense
664,479
25,390
3.8
Other liabilities and Shareholders' equity3
939,424
Total
1,603,903
Percentage of total average interest bearing liabilities with interest recognise in interest
expense for offices outside the UK
26%
Notes
1 Negative interest paid on assets is immaterial for 2024 (2023: £53m, 2022: £416m) which is presented within net interest.
2 Other principally includes lease interest .
3The interest on Trading portfolio liabilities, Derivative financial instruments and Financial liabilities at fair value through the income statement are recognised principally in net trading
income and the average balances for these liabilities are included in Other liabilities and Shareholders' equity.
4Average interest bearing deposits at amortised cost include held for sale balances generating interest expense.
Liabilities
2023
Average balance
Net interest1
Rate
£m
£m
%
Interest bearing deposits at amortised cost
UK
317,497
7,530
2.4
Interest bearing deposits at amortised cost
Non-UK
94,154
3,722
4.0
Interest bearing deposits at amortised cost
Total
411,651
11,252
2.7
Cash collateral
UK
45,188
1,454
3.2
Cash collateral
Non-UK
25,678
800
3.1
Cash collateral
Total
70,866
2,254
3.2
Debt securities in issue
UK
71,956
4,346
6.0
Debt securities in issue
Non-UK
36,272
1,952
5.4
Debt securities in issue
Total
108,228
6,298
5.8
Subordinated liabilities
UK
10,393
811
7.8
Subordinated liabilities
Non-UK
769
55
7.2
Subordinated liabilities
Total
11,162
866
7.8
Repurchase agreements
UK
34,313
1,362
4.0
Repurchase agreements
Non-UK
1,899
73
3.9
Repurchase agreements
Total
36,212
1,435
4.0
Other2
208
Total interest bearing liabilities with interest recognise in interest expense
638,119
22,313
3.5
Other liabilities and Shareholders' equity3
957,656
Total
1,595,775
Percentage of total average interest bearing liabilities with interest recognise in interest
expense for offices outside the UK
25%
Notes
1 Negative interest paid on assets is immaterial for 2024 (2023: £53m, 2022: £416m) which is presented within net interest.
2 Other principally includes interest expense relating to hedging activity.
3The interest on Trading portfolio liabilities, Derivative financial instruments and Financial liabilities at fair value through the income statement are recognise principally in net trading
income and the average balances for these liabilities are included in Other liabilities.
Strategy
Shareholder
information
Climate and
sustainability report
Governance
Risk
review
Financial
review
Financial
statements
Barclays PLC 2024
Annual Report
on Form 20-F
481
Additional unaudited information (continued)
Liabilities
2022
Average balance
Net interest1
Rate
£m
£m
%
Interest bearing deposits at amortised cost
UK
311,353
2,461
0.8
Interest bearing deposits at amortised cost
Non-UK
82,266
1,037
1.3
Interest bearing deposits at amortised cost
Total
393,619
3,498
0.9
Cash collateral
UK
50,977
302
0.6
Cash collateral
Non-UK
22,610
31
0.1
Cash collateral
Total
73,587
333
0.5
Debt securities in issue
UK
75,670
2,388
3.2
Debt securities in issue
Non-UK
37,256
785
2.1
Debt securities in issue
Total
112,926
3,173
2.8
Subordinated liabilities
UK
11,685
507
4.3
Subordinated liabilities
Non-UK
527
23
4.4
Subordinated liabilities
Total
12,212
530
4.3
Repurchase agreements
UK
25,849
306
1.2
Repurchase agreements
Non-UK
2,982
9
0.3
Repurchase agreements
Total
28,831
315
1.1
Other2
259
Total interest bearing liabilities with interest recognise in interest expense
621,175
8,108
1.3
Other liabilities and Shareholders' equity3
989,981
Total
1,611,156
Percentage of total average interest bearing liabilities with interest recognise in interest
expense for offices outside the UK
23%
Notes
1 Negative interest paid on assets is immaterial for 2024 (2023: £53m, 2022: £416m) which is presented within net interest.
2 Other principally includes interest expense relating to hedging activity.
3The interest on Trading portfolio liabilities, Derivative financial instruments and Financial liabilities at fair value through the income statement are recognise principally in net trading
income and the average balances for these liabilities are included in Other liabilities.
Strategy
Shareholder
information
Climate and
sustainability report
Governance
Risk
review
Financial
review
Financial
statements
Barclays PLC 2024
Annual Report
on Form 20-F
482
Additional unaudited information (continued)
Changes in total interest – volume and rate analysis
The following tables allocate changes in interest between changes in volume and changes in interest rates for the last two years.
Volume and rate variances have been calculated on the movement in the average balances and the change in the interest rates on
average interest earning assets and average interest bearing liabilities. Where variances have arisen from changes in both volumes and
interest rates, these have been allocated proportionately between the two.
Interest income
2024/2023 Change due to
increase/(decrease) in:
2023/2022 Change due to
increase/(decrease) in:
Total change
Volume
Rate
Total change
Volume
Rate
£m
£m
£m
£m
£m
£m
Cash and balances at central banks
UK
198
(384)
582
3,310
(101)
3,411
Cash and balances at central banks
Non-UK
620
(527)
1,147
4,222
(31)
4,253
Cash and balances at central banks
Total
818
(911)
1,729
7,532
(132)
7,664
Loans and advances at amortised cost
UK
1,890
(206)
2,096
1,971
(59)
2,030
Loans and advances at amortised cost
Non-UK
1,204
(24)
1,228
646
355
291
Loans and advances at amortised cost
Total
3,094
(230)
3,324
2,617
296
2,321
Debt securities at amortised cost
UK
(93)
237
(330)
956
211
745
Debt securities at amortised cost
Non-UK
201
216
(15)
130
70
60
Debt securities at amortised cost
Total
108
453
(345)
1,086
281
805
Cash collateral
UK
102
(98)
200
1,263
(43)
1,306
Cash collateral
Non-UK
(69)
(15)
(54)
668
2
666
Cash collateral
Total
33
(113)
146
1,931
(41)
1,972
Reverse repurchase agreements
UK
65
61
4
16
15
1
Reverse repurchase agreements
Non-UK
(27)
(18)
(9)
44
(7)
51
Reverse repurchase agreements
Total
38
43
(5)
60
8
52
Fair value through other comprehensive income
UK
(1,187)
635
(1,822)
2,883
210
2,673
Fair value through other comprehensive income
Non-UK
101
72
29
61
(27)
88
Fair value through other comprehensive income
Total
(1,086)
707
(1,793)
2,944
183
2,761
Other interest and similar income
299
—
299
172
—
172
Total interest receivable
3,304
(51)
3,355
16,342
595
15,747
Interest expense
2024/2023 Change due to
increase/(decrease) in:
2023/2022 Change due to
increase/(decrease) in:
Total change
Volume
Rate
Total change
Volume
Rate
£m
£m
£m
£m
£m
£m
Interest bearing deposits at amortised cost
UK
1,684
157
1,527
5,069
50
5,019
Interest bearing deposits at amortised cost
Non-UK
1,155
822
333
2,685
170
2,515
Interest bearing deposits at amortised cost
Total
2,839
979
1,860
7,754
220
7,534
Cash collateral
UK
55
54
1
1,152
(38)
1,190
Cash collateral
Non-UK
(34)
(11)
(23)
769
5
764
Cash collateral
Total
21
43
(22)
1,921
(33)
1,954
Debt securities in issue
UK
309
(211)
520
1,958
(122)
2,080
Debt securities in issue
Non-UK
101
(344)
445
1,167
(22)
1,189
Debt securities in issue
Total
410
(555)
965
3,125
(144)
3,269
Subordinated liabilities
UK
84
33
51
304
(61)
365
Subordinated liabilities
Non-UK
(5)
(7)
2
32
14
18
Subordinated liabilities
Total
79
26
53
336
(47)
383
Repurchase agreements
UK
(239)
275
(514)
1,056
129
927
Repurchase agreements
Non-UK
50
(10)
60
64
(4)
68
Repurchase agreements
Total
(189)
265
(454)
1,120
125
995
Other interest expense
(83)
—
(83)
(51)
—
(51)
Total interest payable
3,077
758
2,319
14,205
121
14,084
Strategy
Shareholder
information
Climate and
sustainability report
Governance
Risk
review
Financial
review
Financial
statements
Barclays PLC 2024
Annual Report
on Form 20-F
483
Additional unaudited information (continued)
Credit risk additional disclosure
This section of the report contains supplementary information that is more detailed or contains longer histories than the data
presented in the Risk review section.
Potential problem loans
Potential problem loans are those loans for which serious doubt exists as to the ability of the borrower to continue to comply with
repayment terms in the near future.
The loans and advances at amortised cost by product disclosure in the credit risk section includes gross exposure and associated
impairment allowance for assets classified as Stage 2, but not past due i.e. assets satisfying the criteria for a significant increase in
Credit Risk, but which are still complying with repayment terms.
A financial asset is subject to forbearance when it is modified due to the credit distress of the borrower. A modification made to the
terms of an asset due to forbearance will typically be assessed as a non-substantial modification that does not result in derecognition of
the original loan, except in circumstances where debt is exchanged for equity. Both performing and non-performing forbearance assets
are classified as Stage 3 except where it is established that the concession granted has not resulted in diminished financial obligation
and that no other regulatory definition of default criteria has been triggered, in which case the asset is classified as Stage 2. The
minimum probationary period for non-performing forbearance is 12 months and for performing forbearance, 24 months. Hence, a
minimum of 36 months is required for non-performing forbearance to move out of a forborne state. Further details can be found in the
credit risk section.
In order to assess asset credit quality, 12-month PDs are used to map assets into strong, satisfactory, higher risk or credit impaired. A
credit risk profile by internal PD grade for gross loans and advances at amortised cost and allowance for ECL is shown in the credit risk
section, analysing each of these categories by stage.
Wholesale accounts that are deemed to contain heightened levels of risk are recorded on graded watchlists comprising four categories,
graded in line with the perceived severity of the risk attached to the lending, and its probability of default. Where a counterparty’s
financial health gives grounds for concern, it is immediately placed into the appropriate category. Once an account has been placed on a
watchlist, the exposure is monitored and, where appropriate, exposure reductions are effected. Further information on monitoring
weaknesses in portfolios can be found in the Barclays PLC Pillar 3 Report 2024 (unaudited).
Strategy
Shareholder
information
Climate and
sustainability report
Governance
Risk
review
Financial
review
Financial
statements
Barclays PLC 2024
Annual Report
on Form 20-F
484
Additional unaudited information (continued)
Impairment
Allocation of the allowance for credit losses
Balance at end of period applicable to:
Amounts
% of loans in each
category to total loans
2024
2023
2024
2023
As at 31 December
£m
£m
Loans and Advances at amortised cost to Banks
9
10
2.4%
2.7%
Loans and Advances at amortised cost to Customers
5,061
5,711
96.7%
97.1%
FVOCI
2
2
0.9%
0.2%
Loans and advances1
5,072
5,723
100.0%
100.0%
Net Charge offs during the period to average loans outstanding2
Balance at end of period applicable to:
Amounts
2024
2023
2022
As at 31 December
£m
£m
£m
Loans and Advances at amortised cost to Banks
Net charge off
—
—
—
Average loans
8,473
10,671
11,153
Ratio %
—%
—%
—%
Loans and Advances at amortised cost to Customers
Net charge off
1,501
1,095
1,357
Average loans
341,856
345,659
340,992
Ratio %
0.4%
0.3%
0.4%
FVOCI
Net charge off
—
—
—
Average loans
1,784
346
221
Ratio %
—%
—%
—%
Consolidated basis
Allowance for credit losses to total loans outstanding during
Amounts
2024
2023
As at 31 December
£m
£m
Allowance for credit losses
5,072
5,723
Total loans outstanding
354,626
349,238
Ratio %
1.4%
1.6%
Notes:
1Total loans outstanding excludes Debt securities at amortized cost.
2Average loans and advances include held for sale balances.
Strategy
Shareholder
information
Climate and
sustainability report
Governance
Risk
review
Financial
review
Financial
statements
Barclays PLC 2024
Annual Report
on Form 20-F
485
Additional unaudited information (continued)
Maturity analysis of gross loans and advances
20 F-Maturity analysis of gross loans and advances
Less than 1
year
One to five
years
Five to
fifteen
years
Over fifteen
years
Total
As at 31st December 2024
£m
£m
£m
£m
£m
Loans and advances at amortised cost to banks
8,336
—
—
—
8,336
Loans and advances at amortised cost to customers
50,338
91,514
69,730
131,425
343,007
FVOCI
74
1,786
1,423
—
3,283
Loans and advances at fair value through profit and loss
38,930
3,105
1,614
1,418
45,067
Traded loans
13,470
—
—
—
13,470
Total gross loans and advances
111,148
96,405
72,767
132,843
413,163
Less than 1
year
One to five
years
Five to
fifteen
years
Over fifteen
years
Total
As at 31 December 2023
£m
£m
£m
£m
£m
Loans and advances at amortised cost to banks
9,469
—
—
—
9,469
Loans and advances at amortised cost to customers
46,727
85,225
70,182
136,865
338,999
FVOCI
78
286
407
—
771
Loans and advances at fair value through profit and loss
39,823
3,712
1,504
1,478
46,517
Traded loans
12,653
—
—
—
12,653
Total gross loans and advances
108,750
89,223
72,093
138,343
408,409
Interest rate sensitivity of gross loans and advances. Maturity > 1 year
2024
2023
Fixed rate
Variable rate
Total
Fixed rate
Variable rate
Total
As at 31 December
£m
£m
£m
£m
£m
£m
Loans and advances at amortised cost to
banks
—
—
—
—
—
—
Loans and advances at amortised cost to
customers
161,647
131,022
292,669
154,531
137,741
292,272
Financial assets at fair value through other
comprehensive income
3,209
3,209
—
693
693
Loans and advances at fair value through
profit and loss
2,504
3,633
6,137
1,833
4,861
6,694
Total loans and advances
164,151
137,864
302,015
156,364
143,295
299,659
Notional principal amounts of credit derivatives
2024
2023
As at 31 December
£m
£m
Credit derivatives held or issued for trading purposes1
1,537,115
1,448,350
Note
1 Includes credit derivatives held as economic hedges which are not designated as hedges for accounting purposes.
Related party transactions additional disclosure
For US disclosure purposes, the aggregate emoluments of all Directors and Officers of Barclays PLC who held office during the year
(2024: 32 persons, 2023: 29 persons, 2022: 25 persons) for the year ended 31 December 2024 amounted to £72.2m (2023: £57m,
2022: £56.7m). In addition, the aggregate amount set aside for the year ended 31 December 2024, to provide pension benefits for the
Directors and Officers amounted to £0.1m (2023: £nil, 2022: £nil).
The expiry dates of the 49,911 options held by Executive Directors and Officers of Barclays PLC as at 31 December 2024 are as follows:
•30 April 2026: 21,428 shares
•30 April 2027: 15,853 shares
•30 April 2028: 2,072 shares.
•30 April 2030: 10,558 shares
Strategy
Shareholder
information
Climate and
sustainability report
Governance
Risk
review
Financial
review
Financial
statements
Barclays PLC 2024
Annual Report
on Form 20-F
486
Glossary of terms
‘Advanced Internal Ratings Based (A-IRB)’ See ‘Internal Ratings Based (IRB)’.
‘Acceptances and endorsements’ Acceptances are an undertaking by a bank to pay a bill of exchange drawn on a customer, for which
reimbursement by the customer is normally immediate. Endorsements are to change the payee of a bill of exchange but with no change
to the bank’s liability.
‘Additional Tier 1 (AT1) capital’ A type of capital as defined in CRR largely comprising eligible non-common equity capital securities and
any related share premium.
‘Additional Tier 1 (AT1) securities’ Non-common equity securities that are eligible as AT1 capital.
‘Advanced Measurement Approach (AMA)’ An approach used to quantify required capital for operational risk. Under the AMA, banks
are allowed to develop their own empirical model to quantify the required capital for operational risk. Banks can only use this approach
subject to approval from their applicable local regulators.
‘Agency Bonds’ Bonds issued by state and / or government agencies or government-sponsored entities.
‘Agency Mortgage-Backed Securities’ Mortgage-Backed Securities issued by government-sponsored entities.
‘All price risk (APR)’ An estimate of all the material market risks, including rating migration and default, for the correlation trading
portfolio.
‘American Depository Receipts (ADR)’ A negotiable certificate that represents the ownership of depository shares in a non-US
company (e.g. Barclays) trading on US financial markets.
‘Americas’ Geographic segment comprising the US, Canada and countries where Barclays operates within Latin America.
‘Annual Earnings at Risk (AEaR)’ A measure of the potential change in Net Interest Income (NII) due to interest rate movement over a
one-year period.
‘Annualised cumulative weighted average lifetime PD’ The Probability of Default (PD) over the remaining life of the asset, expressed
as an annual rate, reflecting a range of possible economic scenarios.
‘Application scorecards’ Algorithm based decision-making tools used to aid business decisions and manage credit risk based on
available customer data at the point of application for a product.
‘Arrears’ Customers are said to be in arrears when they are behind in fulfilling their obligations, with the result that an outstanding loan is
unpaid or overdue. Such customers are also said to be in a state of delinquency. When a customer is in arrears, their entire outstanding
balance is said to be delinquent, meaning that delinquent balances are the total outstanding loans on which payments are overdue.
‘Asia’ Geographic segment comprising countries where Barclays operates within Asia and the Middle East.
‘Asset Backed Commercial Paper (ABCP)’ Typically short-term notes secured on specified assets issued by consolidated special
purpose entities for funding purposes.
‘Asset Backed Securities (ABS)’ Securities that represent an interest in an underlying pool of referenced assets. The referenced pool
can comprise any assets which attract a set of associated cash flows but are commonly pools of residential or commercial mortgages
and, in the case of a Collateralised Debt Obligation (CDO), the referenced pool may be ABS or other classes of assets.
‘Asset swap spreads’ The difference between the yield of the bond and the fixed rate leg of the corresponding interest rate swap.
Primarily used to measure the credit risk associated with a bond.
‘Attributable profit’ Profit after tax that is attributable to ordinary equity holders of Barclays adjusted for the after tax amounts of
capital securities classified as equity.
‘Average allocated tangible equity (for businesses)’ Calculated as the average of the previous month’s period end allocated tangible
equity and the current month’s period end allocated tangible equity. The average allocated tangible equity for the period is the average
of the monthly averages within that period.
‘Average tangible shareholders’ equity’ (for Barclays Group) Calculated as the average of the previous month’s period end tangible
shareholders' equity and the current month’s period end tangible shareholders' equity. The average tangible shareholders’ equity for
the period is the average of the monthly averages within that period.
‘Average UK leverage ratio’ In accordance with the PRA rulebook, calculated as the average capital measure based on the last day of
each month in the quarter divided by the average exposure measure for the quarter, where the average exposure is based on each day
in the quarter.
‘Back testing’ Includes a number of techniques that assess the continued statistical validity of a model by simulating how the model
would have predicted recent experience.
‘Balance weighted Loan to Value (LTV) ratio’ In the context of the credit risk disclosures on secured home loans, a means of
calculating marked to market LTVs derived by calculating individual LTVs at account level, and weighting it by the balances to arrive at
the average position. Balance weighted LTV ratio is calculated using the following formula: LTV = ((loan 1 balance x Marked to market
(MTM) LTV% for loan 1) + (loan 2 balance x MTM LTV% for loan 2) + ...) / total outstanding balances in portfolio.
‘Bank of England (BoE)’ The central bank of the United Kingdom with devolved responsibility for managing monetary policy and to
oversee regulation of the UK’s financial sector. The BoE prudentially regulates and supervises financial services firms through the PRA.
‘Bank of England levy scheme’ a new levy scheme which commenced on 1 March 2024 replacing the Cash Ratio Deposit scheme as a
means of funding the BoE's monetary policy and financial stability operations.
Strategy
Shareholder
information
Climate and
sustainability report
Governance
Risk
review
Financial
review
Financial
statements
Barclays PLC 2024
Annual Report
on Form 20-F
487
Glossary of terms (continued)
'Barclaycard Consumer UK’ One of three segments within Barclays UK comprising the UK Barclaycard business.
‘Barclays’ or ’Barclays' Group’ or 'Group' Barclays PLC, together with its subsidiaries.
‘Barclays Africa’ or ‘Absa’ or ‘Absa Group Limited’ Absa Group Limited (formerly Barclays Africa Group Limited), which was previously
a subsidiary of the Barclays Group. As a consequence of its disposals of shares in April 2022 and September 2022, the Barclays Group
has now exited its shareholding in Absa Group Limited.
‘Barclays Bank Group’ Barclays Bank PLC, together with its subsidiaries.
‘Barclays Bank UK Group’Barclays Bank UK PLC, together with its subsidiaries.
‘Barclays Execution Services’ or ‘BX’ or ‘Group Service Company’ Barclays Execution Services Limited, the Group-wide service
company providing technology, operations and functional services to businesses across the Barclays Group.
‘Barclays Investment Bank (IB)’ The Barclays Group's investment bank which consists of origination led and returns focused Global
Markets and Investment Banking businesses.
‘Barclays Private Bank and Wealth Management (PBWM)’This division serves UK and international private banking clients providing a
range of investment, banking and lending products alongside expert advice. It also serves UK wealth management and UK digital
investing clients offering a range of financial services.
‘Barclays Operating Businesses’ The core Barclays businesses, comprising Barclays UK (which consists of the UK Personal Banking;
UK Business Banking and the Barclaycard Consumer UK businesses), UKCB, PBWM, IB and USCB.
‘Barclays UK’ This segment broadly represents businesses that sit within the UK ring-fenced bank entity, Barclays Bank UK PLC, and
comprises Personal Banking, Business Banking and Barclaycard Consumer UK.
‘Barclays UK Corporate Bank (UKCB)’ This division brings together lending, trade and working capital, liquidity, payments and FX
solutions for UK corporate clients with an annual turnover from £6.5 million and higher, excluding those clients that form part of the
FTSE 350, which are included within the IB.
‘Barclays US Consumer Bank (USCB)’ This is a co-branded credit card issuer and financial services partner in the United States for
travel, entertainment, retail and affinity institutions. It offers co-branded, small business and private label credit cards, installment loans,
online savings accounts and certificates of deposits.
‘Basel 3' or Basel III’ The third of the Basel Accords, setting minimum requirements and standards that apply to internationally active
banks. Basel 3 is a set of measures developed by the BCBS aiming to strengthen the regulation, supervision and risk management of
banks.
‘Basel 3.1' This refers to the revision of BCBS standards to complete the BCBS' post global financial crisis reforms. Basel 3.1 introduces
changes to how to calculate capital requirements for all risk types, for both standardised and internal model approaches.
‘Basel Committee on Banking Supervision (BCBS)’ or ‘The Basel Committee’ A forum for regular cooperation on banking supervisory
matters which develops global supervisory standards for the banking industry. Its 45 members are officials from central banks or
prudential supervisors from 28 jurisdictions.
‘Basic Indicator Approach (BIA)’ An approach used to quantify required capital for operational risk. Under the BIA, banks are required to
hold regulatory capital for operational risk equal to 15% of the annual average, calculated over a rolling three-year period, of the relevant
income indicator for the bank as whole.
‘Basis point(s)’ or ‘bp(s)’ One hundredth of a per cent (0.01%); 100 basis points is 1%. The measure is used for quoting movements in
interest rates, yields on securities and for other purposes.
‘Basis risk’Index/tenor risk that arises when floating rate products are linked to different interest rate indices, which are imperfectly
correlated, especially under stressed market conditions.
‘Behavioural scorecards’ Algorithm-based decision tools used to aid business decisions and manage credit risk based on existing
customer data derived from account usage.
'Board’ The board of directors of the relevant Barclays Group entity.
‘Book quality’ In the context of the Capital Risk section of the Barclays PLC Annual Report (or equivalent section in quarterly or half
yearly results), changes in RWAs caused by factors such as underlying customer behaviour or demographics leading to changes in risk
profile.
‘Book size’ In the context of the Capital Risk section of the Barclays PLC Annual Report (or equivalent section in quarterly or half yearly
results), changes in RWAs driven by business activity, including net originations or repayments.
‘Bounce Back Loan Scheme (BBLS)’ A UK Government (British Business Bank) backed loan scheme which allowed SMEs to borrow
between £2,000 and £50,000. The UK Government guarantees 100% of the loan and pays the first 12 months of interest on behalf of
the borrowers, subject to terms and conditions. The scheme closed on 31 March 2021.
‘Business Banking’ One of three segments within Barclays UK. Includes Business Banking services for UK clients with an annual
turnover of typically up to £6.5 million, as well as the Education, Social Housing and Local Authority (ESHLA) portfolio.
‘Business Growth Fund (BGF)’ An independent company established by the UK’s largest banks, including Barclays, to help young, fast-
growing businesses by providing long-term growth capital. Barclays holds an associate interest in BGF.
Strategy
Shareholder
information
Climate and
sustainability report
Governance
Risk
review
Financial
review
Financial
statements
Barclays PLC 2024
Annual Report
on Form 20-F
488
Glossary of terms (continued)
‘Business scenario stresses’ Multi-asset scenario analysis of extreme, but plausible, events that may impact the market risk exposures
of the IB.
‘Buy to let mortgage’ A mortgage whereby the intention of the customer is to let the property at origination.
‘Capital Conservation Buffer (CCB)’ A capital buffer of 2.5% of a bank’s total exposures that needs to be met with an additional
amount of Common Equity Tier 1 capital above the 4.5% minimum requirement for Common Equity Tier 1 set out in CRR. Its objective
is to conserve a bank’s capital by ensuring that banks build up surplus capital outside periods of stress which can be drawn down if losses
are incurred.
‘Capital ratios’ Key financial ratios measuring the bank's capital adequacy or financial strength expressed as a percentage of RWAs.
‘Capital Requirements Directive (CRD)’ Directive 2013/36/EU (as amended), which accompanies the CRR and which prescribes
further prudential standards including capital buffers and "Pillar 2A" capital requirements. CRD was implemented before Brexit. In the
EU, further amendments to CRD are made by CRD VI, which member states must transpose by January 2026.
‘Capital Requirements Directive IV (CRD IV)’ The Fourth Capital Requirements Directive, comprising an EU amending Directive and an
accompanying Regulation (CRR) that together prescribe EU capital adequacy and liquidity requirements, and which implements Basel 3
in the European Union.
‘Capital Requirements Directive V (CRD V)’ The Fifth Capital Requirements Directive, comprising an EU amending Directive and an
accompanying amending Regulation (CRR II) that together prescribe EU capital adequacy and liquidity requirements, and which
implements enhanced Basel 3 proposals in the European Union.
‘Capital Requirements Directive VI (CRD VI)’ The Sixth Capital Requirements Directive, comprising an EU amending Directive and an
accompanying amending Regulation (CRR III) that together prescribe EU capital adequacy and liquidity requirements, and which
implements enhanced Basel 3 proposals in the European Union
‘Capital Requirements Regulation (CRR)’ Refers to EU CRR and/or UK CRR as the context requires.
‘Capital Requirements Regulation II (CRR II)’ Regulation (EU) 2019/876, amending Regulation (EU) No 575/2013 (CRR). This is a
component of the EU Risk Reduction Measure package. The requirements set out in CRR II were introduced between 27 June 2019 and
28 June 2023. Following a consultation process in 2021 the PRA finalized their implementation of the CRR II package through Policy
Statement 22/21. The finalized requirements were implemented in the UK through the PRA rulebook with effect from 1 January 2022.
‘Capital Requirements Regulation III (CRR III)’ Regulation (EU) 2019/876, amending Regulation (EU) No 575/2013 (CRR). This is a
component of the EU Risk Reduction Measure package. The requirements set out in CRR II were introduced between 27 June 2019 and
28 June 2023. Following a consultation process in 2021 the PRA finalized their implementation of the CRR II package through Policy
Statement 22/21. The finalized requirements were implemented in the UK through the PRA rulebook with effect from 1 January 2022.
‘Capital requirements on the underlying exposures (KIRB)’ An approach available to banks when calculating RWAs for securitisation
exposures. This is based upon the RWA amounts that would be calculated under the IRB approach for the underlying pool of securitised
exposures in the programme, had such exposures not been securitised.
‘Capital resources’ Common Equity Tier 1, Additional Tier 1 capital and Tier 2 capital that are eligible to satisfy regulatory capital
requirements. Referred to as ‘own funds’ within EU and UK regulatory texts.
‘Capital risk’ The risk that the Barclays Group has an insufficient level or composition of capital to support its normal business activities
and to meet its regulatory capital requirements under normal operating environments or stressed conditions (both actual and as
defined for internal planning or regulatory testing purposes). This includes the risk from the Barclays Group’s pension plans.
‘Cash Ratio Deposit scheme’ A scheme that previously funded the BoE's monetary policy and financial stability functions, until it was
replaced with the BoE levy scheme on 1 March 2024.
‘Central Counterparty’ or ‘Central Clearing Counterparties (CCPs)’ A clearing house mediating between the buyer and the seller in a
financial transaction, such as a derivative contract or repurchase agreement (Repo). Where a Central Counterparty is used, a single bi-
lateral contract between the buyer and seller is replaced with two contracts, one between the buyer and the CCP and one between the
CCP and the seller. The use of CCPs allows for greater oversight and improved credit risk mitigation in over-the-counter (OTC)
markets.
‘Charge-off’ In the retail segment this refers to the point in time when collections activity changes from the collection of arrears to the
recovery of the full balance. This is normally when six payments are in arrears.
‘Client Assets’ Assets managed or administered by the Barclays Group on behalf of its clients including assets under management
(AUM), custody assets, assets under administration and client deposits.
‘Client assets and liabilities’ Customer deposits, lending and invested assets.
‘Climate Risk’ The risk of financial loss arising from climate change through, physical risks and risks associated with transitioning to a
lower carbon economy. Climate Risk focuses on the Financial and Operational Risks associated with climate change.
‘CLOs and other insured assets’ Highly-rated CLO positions wrapped by monolines, non-CLOs wrapped by monolines and other
assets wrapped with Credit Support Annex (CSA) protection.
'Clydesdale Financial Services Limited (CFS)' This houses Barclays’ point-of-sale finance business and trades as Barclays Partner
Finance.
Strategy
Shareholder
information
Climate and
sustainability report
Governance
Risk
review
Financial
review
Financial
statements
Barclays PLC 2024
Annual Report
on Form 20-F
489
Glossary of terms (continued)
‘Collateralised Debt Obligation (CDO)’ A security issued by a third party which references Asset Backed Securities and/or certain
other related assets purchased by the issuer. CDOs may feature exposure to sub-prime mortgage assets through the underlying
assets.
‘Collateralised Loan Obligation (CLO)’ A security backed by repayments from a pool of commercial loans.
‘Collateralised Mortgage Obligation (CMO)’ A security backed by mortgages. A special purpose entity receives income from the
mortgages and passes them on to investors in the security.
‘Combined Buffer Requirement (CBR)’ The total Common Equity Tier 1 capital required to meet the combined requirements of the
Capital Conservation Buffer, the GSII Buffer, the counter-cyclical buffer, and the O-SII buffer if applicable to a firm.
‘Commercial paper (CP)’ Typically short-term notes issued by entities, including banks, for funding purposes.
‘Commercial real estate (CRE)’ Commercial real estate includes office buildings, medical centres, hotels, retail stores, shopping
centres, farm land, multifamily housing buildings, warehouses, garages, industrial properties and other similar properties. Commercial
real estate loans are loans backed by a package of commercial real estate. Note: for the purposes of the Credit Risk section, the UK CRE
portfolio includes property investment, development, trading and housebuilders but excludes social housing contractors.
‘Commissions and other incentives’ Includes commission-based arrangements, guaranteed incentives and Long Term Incentive Plan
awards.
‘Committee of Sponsoring Organizations of the Treadway Commission Framework (COSO)’ A joint initiative of five private sector
organisations dedicated to the development of frameworks and providing guidance on enterprise risk management, internal control
and fraud deterrence.
‘Commodity derivatives’ Exchange traded and over-the-counter (OTC) derivatives based on an underlying commodity (e.g. metals,
precious metals, oil and oil related products, power and natural gas).
‘Commodity risk’ Measures the impact of changes in commodity prices and volatilities, including the basis between related
commodities (e.g. Brent vs. WTI crude prices).
‘Common Equity Tier 1 (CET1) capital’ The highest quality form of regulatory capital under CRR that comprises common shares
issued and related share premium, retained earnings and other reserves, less specified regulatory adjustments.
‘Common Equity Tier 1 (CET1) ratio’ A measure of CET1 capital expressed as a percentage of RWAs.
‘Compensation: income ratio’The ratio of compensation expense over total income. Compensation represents total staff costs less
non-compensation items (consisting of outsourcing, staff training, redundancy costs and retirement costs).
‘Compliance Risk’ The risk of poor outcomes for, or harm to, customers, clients and markets, arising from the delivery of the firm’s
products and services (also known as 'Conduct Risk') and the risk to Barclays, its clients, customers or markets from a failure to comply
with the laws, rules and regulations applicable to the firm (also known as Laws, Rules and Regulations Risk 'LRR Risk’).
‘Comprehensive Capital Analysis and Review (CCAR)’ An annual exercise, required by and evaluated by the Federal Reserve, through
which the largest banks' holding companies operating in the US assess whether they have sufficient capital to continue operations
through periods of economic and financial stress and have robust capital-planning processes that account for their unique risks.
‘Comprehensive Risk Capital Charge (CRCC)’ An estimate of all the material market risks, including rating migration and default for the
correlation trading portfolio.
‘Comprehensive Risk Measure (CRM)’ An estimate of all the material market risks, including rating migration and default, for the
correlation trading portfolio. Also referred to as All Price Risk (APR) and Comprehensive Risk Capital Charge (CRCC).
‘Constant Currency Basis’ Excluding the impact of foreign currency conversion to GBP when comparing financial results in two
different financial periods.
‘Coronavirus Business Interruption Loan Scheme (CBILS)’ A loan scheme by the British Business Bank (BBB) to support UK based
small and medium-sized businesses (turnover of up to £45 million) adversely impacted by COVID-19. The CBILS scheme provided
loans of up to £5 million which are backed by an 80% UK Government (BBB) guarantee. The UK Government will pay interest and fees
for the first 12 months on behalf of the borrowers, subject to terms and conditions. This scheme ended on 31 March 2021.
'Coronavirus Large Business Interruption Loan Scheme (CLBILS)’ A loan scheme by the British Business Bank (BBB) to support UK
based medium-sized businesses (turnover above £45 million, but with no access to Covid Corporate Finance Facility (CCFF)) adversely
impacted by COVID-19. The CLBILS scheme provided loans of up to £200 million which are backed by an 80% UK Government (BBB)
guarantee. This scheme ended on 31 March 2021.
‘Correlation risk’ Refers to the change in marked to market value of a security when the correlation between the underlying assets
changes over time.
‘Cost of Equity’ The rate of return targeted by the equity holders of a company.
‘Cost: income jaws’ Relationship between the percentage change movement in operating expenses relative to total income.
‘Cost: income ratio’ Total operating expenses divided by total income.
‘Countercyclical Capital Buffer (CCyB)’ A capital buffer that requires banks to have an additional cushion of Common Equity Tier 1
capital with which to absorb potential losses, enhancing their resilience and contributing to a stable financial system.
Strategy
Shareholder
information
Climate and
sustainability report
Governance
Risk
review
Financial
review
Financial
statements
Barclays PLC 2024
Annual Report
on Form 20-F
490
Glossary of terms (continued)
‘Countercyclical leverage ratio buffer (CCLB)’ A macroprudential capital buffer that has applied to specific PRA regulated institutions
since 2018 and is calculated at 35% of any risk weighted countercyclical capital buffer set by the Financial Policy Committee (FPC). The
CCLB applies in addition to the minimum of 3.25% and any G-SII additional leverage ratio buffer that applies.
‘Counterparty credit risk (CCR)’ The risk that a counterparty to a transaction could default before the final settlement of a
transaction’s cash flows. In the context of RWAs, a component of RWAs that represents the risk of loss from derivatives, repurchase
agreements and similar transactions as a result of the default of the counterparty.
‘Coverage ratio’ This represents the percentage of impairment allowance reserve against the gross exposure.
‘Covered bonds’ Debt securities backed by a portfolio of mortgages that are segregated from the issuer’s other assets solely for the
benefit of the holders of the covered bonds.
‘Covid Corporate Financing Facility (CCFF)’ BoE scheme to support liquidity among larger investment grade firms which make a
material UK contribution, helping to bridge COVID-19 disruption to their cash flows. The BoE provided liquidity by purchasing short-
term debt in the form of commercial paper from corporates. Barclays acted as dealer. This scheme closed for new purchases of
commercial paper with effect from 23 March 2021.
‘Credit conversion factor (CCF)’ A factor used to estimate the risk from off-balance sheet commitments for the purpose of
calculating the total Exposure at Default (EAD) used to calculate RWAs.
‘Credit default swaps (CDS)’ A contract under which the protection seller receives premiums or interest-related payments in return
for contracting to make payments to the protection buyer in the event of a defined credit event. Credit events normally include
bankruptcy, payment default on a reference asset or assets, or downgrades by a rating agency.
‘Credit derivatives (CDs)’ An arrangement whereby the credit risk of an asset (the reference asset) is transferred from the buyer to
the seller of the protection.
‘Credit impairment charges’ Impairment charges on loans and advances to customers and banks and impairment charges on fair value
through other comprehensive income assets and reverse repurchase agreements.
‘Credit market exposures’ Assets and other instruments relating to commercial real estate and leveraged finance businesses that
have been significantly impacted by the deterioration in the global credit markets. The exposures include positions subject to fair value
movements in the Income Statement, positions that are classified as loans and advances, and available for sale and other assets.
‘Credit quality step’ An indicator of credit risk. In the context of the Standardised Approach to calculating credit risk RWAs, a “credit
quality assessment scale” maps the credit assessments of a recognised credit rating agency or export credit agency to certain "credit
quality steps" that determine the risk weight to be applied to an exposure.
‘Credit rating’ An evaluation of the creditworthiness of an entity seeking to enter into a credit agreement.
‘Credit risk’ The risk of loss to Barclays from the failure of clients, customers or counterparties, including sovereigns, to fully honour
their obligations to Barclays, including the whole and timely payment of principal, interest, collateral and other receivables. In the context
of RWAs, it is the component of RWAs that represents the risk of loss in loans and advances and similar transactions resulting from the
default of the counterparty.
‘Credit risk mitigation’ A range of techniques and strategies used to actively mitigate credit risks to which the bank is exposed. These
can be broadly divided into three types: collateral, netting and set-off, and risk transfer.
‘Credit spread’ The premium over the benchmark or risk-free rate required by the market to accept a lower credit quality.
‘Credit Valuation Adjustment (CVA)’ The difference between the risk-free value of a portfolio of trades and the market value which
takes into account the counterparty’s risk of default. The CVA therefore represents an estimate of the adjustment to fair value that a
market participant would make to incorporate the credit risk of the counterparty due to any failure to perform contractual agreements.
‘Customer assets’ Represents loans and advances to customers. Average balances are calculated as the sum of all daily balances for
the year to date divided by number of days in the year to date.
‘Customer deposits’ Money deposited by all individuals and companies that are not credit institutions. Such funds are recorded as
liabilities in the Barclays Group’s balance sheet under “deposits at amortised cost” (Customer liabilities).
‘Customer liabilities’ See ‘Customer deposits’.
‘Daily Value at Risk (DVaR)’ An estimate of the potential loss which might arise from market movements under normal market
conditions, if the current positions were to be held unchanged for one business day, measured to a specified confidence level.
‘Debit Valuation Adjustment (DVA)’ The opposite of Credit Valuation Adjustment (CVA). It is the difference between the risk-free
value of a portfolio of trades and the market value which takes into account the Barclays Group’s risk of default. The DVA, therefore,
represents an estimate of the adjustment to fair value that a market participant would make to incorporate the credit risk of the
Barclays Group due to any failure to perform contractual obligations. The DVA decreases the value of a liability to take into account a
reduction in the remaining balance that would be settled should the Barclays Group default or not perform any contractual obligations.
‘Debt buybacks’ Purchases of the Barclays Group’s issued debt securities, including equity accounted instruments, leading to their de-
recognition from the balance sheet.
‘Debt securities in issue’ Transferable securities evidencing indebtedness of the Barclays Group. These are liabilities of the Barclays
Group and include certificates of deposit and commercial paper.
Strategy
Shareholder
information
Climate and
sustainability report
Governance
Risk
review
Financial
review
Financial
statements
Barclays PLC 2024
Annual Report
on Form 20-F
491
Glossary of terms (continued)
‘Default grades’ The Barclays Group classifies ranges of default probabilities into a set of 21 intervals called default grades, in order to
distinguish differences in the Probability of Default (PD) risk.
‘Default fund contributions’ The contribution made by members of a Central Counterparty (CCP). All members are required to
contribute to this fund in advance of using a CCP. The default fund can be used by the CCP to cover losses incurred by the CCP where
losses are greater than the margins provided by a defaulting member.
‘Delinquency’ See ‘Arrears’.
‘Derivatives netting’ Adjustments applied across asset and liability marked to market derivative positions pursuant to legally
enforceable bilateral netting agreements and eligible cash collateral received in derivative transactions that meet the requirements of
BCBS 270 (Basel III leverage ratio framework and disclosure requirements).
‘Diversification effect’ Reflects the fact that the risk of a diversified portfolio is smaller than the sum of the risks of its constituent
parts. It is measured as the sum of the individual asset class Daily Value at Risk (DVaR) estimates less the total DVaR.
‘Dodd-Frank Act (DFA)’ The US Dodd-Frank Wall Street Reform and Consumer Protection Act of 2010, as amended.
‘Domestic Liquidity Sub-Group Arrangement (DoLSub)’ An intra-group capital and liquidity support agreement that secures certain
regulatory permissions authorised by the PRA.
‘Economic Value of Equity (EVE)’ A measure of the potential change in value of expected future cash flows due to an adverse interest
rate movement, based on existing balance sheet run-off profile.
‘Education, Social Housing and Local Authority (ESHLA) or (ESHLA portfolio)’ A Barclays UK portfolio primarily consisting of long
dated fixed rate loans extended to counterparties in the UK Education, Social Housing and Local Authority sectors.
'Effective Expected Positive Exposure (EEPE)' The weighted average over time of effective expected exposure. The weights are the
proportion that an individual exposure represents of the entire exposure horizon time interval.
‘Effective interest rate (EIR)’ As defined in IFRS 9 Financial Instruments, effective interest rate is the rate that exactly discounts
estimated future cash payments or receipts through the expected life of the financial asset or financial liability to the gross carrying
amount of a financial asset or to the amortised cost of a financial liability.
‘Eligible liabilities’ Liabilities and capital instruments that are eligible to meet MREL that do not already qualify as Own funds.
‘Encumbrance’ The use of assets to secure liabilities, such as by way of a lien or charge.
‘Enterprise Risk Management Framework (ERMF)’ The Barclays Group’s risk management responsibilities are laid out in the Enterprise
Risk Management Framework, which describes how Barclays identifies and manages risk. The framework identifies the principal risks
faced by the Barclays Group, sets out risk appetite requirements, sets out roles and responsibilities for risk management, and sets out
risk committee structure.
‘Equities’ Trading businesses encompassing Cash Equities, Equity Derivatives & Equity Financing, part of IB.
‘Equity and stock index derivatives’ Derivatives whose value is derived from equity securities. This category includes equity and stock
index swaps and options (including warrants, which are equity options listed on an exchange). The Barclays Group also enters into fund-
linked derivatives, being swaps and options whose underlyings include mutual funds, hedge funds, indices and multi-asset portfolios. An
equity swap is an agreement between two parties to exchange periodic payments, based upon a notional principal amount, with one
side paying fixed or floating interest and the other side paying based on the actual return of the stock or stock index. An equity option
provides the buyer with the right, but not the obligation, either to purchase or sell a specified stock, basket of stocks or stock index at a
specified price or level on or before a specified date.
‘Equity risk’ In the context of trading book capital requirements, the risk of change in market value of an equity investment.
‘Equity structural hedge’ An interest rate hedge in place to reduce earnings volatility of the overnight / short term equity investment
and to smooth the income over a medium/long term.
‘EU CRR’ Regulation (EU) No 575/2013 as amended. EU CRR prescribes prudential requirements including minimum capital
requirements, for EU banks and certain other entities. EU CRR was amended by CRR III as part of the EU’s implementation of Basel 3.1.
The amendments entered into force in January 2025, other than those relating to market risk, whose entry into force was delayed until
January 2026 by a Delegated Act of the European Commission.
‘EU Risk Reduction Measure package’ A collection of amending Regulations and Directives that update core EU regulatory texts and
which came into force on 27 June 2019.
‘Euro Interbank Offered Rate (EURIBOR)’ A benchmark interest rate at which banks can borrow funds from other banks in the
European interbank market.
‘Europe’ Geographic segment comprising countries in which Barclays operates within the EU (excluding the UK), Northern Continental
and Eastern Europe.
‘European Banking Authority (EBA)’ The EBA is an independent EU Authority which works to ensure effective and consistent
prudential regulation and supervision across the European banking sector. Its overall objectives are to maintain financial stability in the
EU and to safeguard the integrity, stability, efficiency and orderly functioning of the banking sector.
‘European Securities and Markets Authority (ESMA)’ An independent European Supervisory Authority with the remit of enhancing
the protection of investors and reinforcing stable and well-functioning financial markets in the European Union.
Strategy
Shareholder
information
Climate and
sustainability report
Governance
Risk
review
Financial
review
Financial
statements
Barclays PLC 2024
Annual Report
on Form 20-F
492
Glossary of terms (continued)
‘Eurozone’Represents the 20 European Union countries that have adopted the Euro as their common currency. The 20 countries are
Austria, Belgium, Croatia, Cyprus, Estonia, Finland, France, Germany, Greece, Ireland, Italy, Latvia, Lithuania, Luxembourg, Malta,
Netherlands, Portugal, Slovakia, Slovenia and Spain.
‘Expected Credit Losses (ECL)’ A present value measure of the credit losses expected to result from default events that may occur
during a specified period of time. ECLs must reflect the present value of cash shortfalls, and the unbiased and probability weighted
assessment of a range of outcomes.
‘Expected Losses’ A regulatory measure of anticipated losses for exposures captured under an Internal Ratings Based credit risk
approach for capital adequacy calculations. It is measured as the Barclays Group's modelled view of anticipated losses based on
Probability of Default (PD), Loss Given Default (LGD) and Exposure at Default (EAD), with a one-year time horizon.
’Expert lender models’ Models of risk measures that are used for parts of the portfolio where the risk drivers are specific to a particular
counterparty, but where there is insufficient data to support the construction of a statistical model. These models utilise the knowledge
of credit experts that have in depth experience of the specific customer type being modelled.
‘Exposure’ Generally refers to positions or actions taken by a bank, or consequences thereof, that may put a certain amount of a bank’s
resources at risk.
‘Exposure at Default (EAD)’ The estimation of the extent to which the Barclays Group may be exposed to a customer or counterparty
in the event of, and at the time of, that customer's or counterparty’s default. At default, the customer may not have drawn the loan fully
or may already have repaid some of the principal, so that exposure may be less than the approved loan limit.
‘External Credit Assessment Institutions (ECAI)’ Institutions whose credit assessments may be used by credit institutions for the
determination of risk weight exposures according to UK CRR or EU CRR (as the case may be).
‘External ratings based approach / internal assessment approach (SEC-ERBA / IAA)’ This is a method to calculate risk-weighted
exposure amounts for securitisation positions.Under the SEC-ERBA approach, regulatory capital is assigned to securitisation tranches
on the basis of their external credit rating. The SEC-ERBA approach can also be used for unrated ABCP exposures where the institution
has the regulatory permission to use the Internal Assessment Approach (IAA) to assign a credit rating to the unrated ABCP exposure.
‘Exchange-traded notes (ETNs)’ Unsecured debt securities that track an underlying index of securities and trade on a stock exchange.
‘FVOCI’ Fair value through other comprehensive income.
‘Federal Housing Finance Agency (FHFA)’ An independent federal agency in the United States that oversees the secondary mortgage
market and regulates Fannie Mae and Freddie Mac, as well as 11 Federal Home Loan banks. The FHFA also sets the Housing Price Index
(HPI) in the United States.
‘Federal Reserve Board (FRB)’ The Board of Governors of the Federal Reserve System, commonly known as the Federal Reserve
Board, is responsible for- amongst other things – setting monetary policy in the US.
'FICC' Represents Macro (including rates and currency), Credit and Securitised products, part of IB.
‘Financial crime risk’ The risk that the Group and its associated persons (employees or third parties) commit or facilitate financial
crime, and/or the Group’s products and services are used to facilitate financial crime. Financial crime undermines market integrity and
may result in: harm to clients, customers, counterparties or employees; diminished confidence in financial products and services;
damage to the Group’s reputation; regulatory breaches; and/or financial penalties.
'Financial Policy Committee (FPC)' The BoE's Financial Policy Committee identifies, monitors and takes action to remove or reduce
systemic risks with a view to protecting and enhancing the resilience of the UK financial system. The FPC also has a secondary objective
to support the economic policy of the UK Government.
‘Financial Conduct Authority (FCA)’ The statutory body responsible for conduct of business regulation and supervision of UK
authorised firms. The FCA also has responsibility for the prudential regulation of firms that do not fall within the PRA’s scope.
‘Financial Services Compensation Scheme (FSCS)’ The UK’s scheme for the compensation of customers of authorised financial
services firms that are unable to pay claims.
‘Financial collateral comprehensive method (FCCM)’ A counterparty credit risk exposure calculation approach which applies volatility
adjustments to the market value of exposure and collateral when calculating RWA values.
‘Financial Stability Board (FSB)’ An international body that monitors and makes recommendations about the global financial system. It
promotes international financial stability by coordinating national financial authorities and international standard-setting bodies as they
work toward developing strong regulatory, supervisory and other financial sector policies. It fosters a level playing field by encouraging
coherent implementation of these policies across sectors and jurisdictions.
‘Fitch’ A credit rating agency, including Fitch Ratings Inc. and its affiliated entities.
‘Forbearance Programmes’ Forbearance programmes assist customers in financial difficulty through agreements to accept less than
contractual amounts due where financial distress would otherwise prevent satisfactory repayment within the original terms and
conditions of the contract. These agreements may be initiated by the customer, Barclays or a third party and include approved debt
counselling plans, minimum due reductions, interest rate concessions and switches from capital and interest repayments to interest-
only payments.
‘Foreclosures in Progress’ The process by which a bank initiates legal action against a customer with the intention of terminating a loan
agreement whereby the bank may repossess the property used as collateral for the loan, subject to applicable, law and recover amounts
it is owed.
Strategy
Shareholder
information
Climate and
sustainability report
Governance
Risk
review
Financial
review
Financial
statements
Barclays PLC 2024
Annual Report
on Form 20-F
493
Glossary of terms (continued)
‘Foreign exchange derivatives’ The Barclays Group’s principal exchange rate-related contracts are forward foreign exchange
contracts, currency swaps and currency options. Forward foreign exchange contracts are agreements to buy or sell a specified quantity
of foreign currency, usually on a specified future date at an agreed rate. Currency swaps generally involve the exchange, or notional
exchange, of equivalent amounts of two currencies and a commitment to exchange interest periodically until the principal amounts are
re-exchanged on a future date. Currency options provide the buyer with the right, but not the obligation, either to purchase or sell a
fixed amount of a currency at a specified exchange rate on or before a future date. As compensation for assuming the option risk, the
option writer generally receives a premium at the start of the option period.
‘Foreign exchange risk’ In the context of DVaR, the impact of changes in foreign exchange rates and volatilities.
'Foundation Internal Ratings Based (F-IRB)’See ‘Internal Ratings Based (IRB)’.
'FTSE 350’ The Financial Times Stock Exchange index comprising the 350th largest companies by capitalisation listed on the London
Stock Exchange.
‘Full time equivalent (FTE)’ Full time equivalent units are the on-job hours paid for employee services divided by the number of
ordinary-time hours normally paid for a full-time staff member when on the job (or contract employees where applicable).
‘Fully loaded’ When a measure is presented or described as being on a fully loaded basis, it is calculated without applying the transitional
provisions set out in Part Ten of UK CRR or EU CRR (as the case may be).
‘Funded credit protection’ A technique of credit risk mitigation where the reduction of the credit risk on the exposure of an institution
derives from the right of that institution, in the event of the default of the counterparty or on the occurrence of other specified credit
events relating to the counterparty, to liquidate, or to obtain transfer or appropriation of, or to retain certain assets or amounts, or to
reduce the amount of the exposure to, or to replace it with the amount of the difference between the amount of the exposure and the
amount of a claim on the institution.
‘FY23 Investor Update’ An event held in connection with Barclays resegmentation of businesses which was announced on 20 February
2024 and is part of its strategy to become Simpler, Better and more Balanced. Introducing the new segments of Barclays UK, Barclays
UK Corporate, Barclays Private Bank and Wealth Management, Barclays Investment Bank, Barclays US Consumer Bank and Head Office.
‘Gains on acquisitions’ The amount by which an acquirer’s interest in the net fair value of the identifiable assets, liabilities and
contingent liabilities, recognised in a business combination, exceeds the cost of the combination.
‘General Data Protection Regulation (GDPR)’ GDPR (Regulation (EU) 2016/679) is a regulation intended to strengthen and unify data
protection for all individuals within the European Union. GDPR forms part of UK law pursuant to the European Union (Withdrawal) Act
2018, as amended.
‘General market risk’ The risk of a price change in a financial instrument due to a change in the level of interest rates or owing to a
broad equity market movement unrelated to any specific attributes of individual securities.
‘Global markets’ Offers clients a full range of liquidity, risk management and financing solutions, ideas and content tailored to their
investment and risk management needs, including execution capabilities across the spectrum of financial products.
‘Global Systemically Important Banks (G-SIBs or G-SIIs)’ Global financial institutions whose size, complexity and systemic
interconnectedness, mean that their distress or failure would cause significant disruption to the wider financial system and economic
activity. The Financial Stability Board and the BCBS publish a list of global systemically important banks.
‘G-SII additional leverage ratio buffer (G-SII ALRB)’ A macroprudential buffer that applies to G-SIBs and other major domestic UK
banks and building societies, including banks that are subject to ring-fencing requirements. The G-SII ALRB will be calibrated as 35% (on
a phased basis) of the combined buffers that apply to the bank.
‘G-SII Buffer’ Common Equity Tier 1 capital required to be held to ensure that G-SIBs build up surplus capital to compensate for the
systemic risk that such institutions represent to the financial system.
’Grandfathering’ In the context of capital resources, the phasing in of the application of instrument eligibility rules, which allows
formerly compliant capital instruments to be included in regulatory capital, subject to certain thresholds which decrease over the
transitional period.
‘Gross charge-off rates’ Represents the balances charged-off to recoveries in the reporting period, expressed as a percentage of
average outstanding balances excluding balances in recoveries. Charge-off to recoveries generally occurs when the collections focus
switches from the collection of arrears to the recovery of the entire outstanding balance, and represents a fundamental change in the
relationship between the bank and the customer. This is a measure of the proportion of customers that have gone into default during
the period.
‘Gross Domestic Product (GDP)’ Measures the total value of goods and services produced in a country within a specific time period.
‘Gross write-off rates’ Expressed as a percentage and represent balances written off in the reporting period divided by gross loans and
advances held at amortised cost at the balance sheet date.
‘Gross new lending’ New lending advanced to customers during the period.
‘Guarantee’ Unless otherwise described, an undertaking by a third party to pay a creditor should a debtor fail to do so. It is a form of
credit substitution.
‘Head Office’ Comprises head office, central support, central treasury operations, Barclays Execution Services assets and legacy
businesses. In addition to these existing elements, as part of the resegmentation announced at the FY23 Investor Update on 20
February 2024, Head Office now also includes the German consumer finance business, which is currently accounted for as held for sale,
and the merchant acquiring component of the Payments business.
Strategy
Shareholder
information
Climate and
sustainability report
Governance
Risk
review
Financial
review
Financial
statements
Barclays PLC 2024
Annual Report
on Form 20-F
494
Glossary of terms (continued)
‘High-Net-Worth’ Businesses that provide banking and other services to high net worth customers.
‘High quality liquid assets (HQLA)’ Comprise eligible and unencumbered cash or assets that can be converted into cash at little or no
loss of value in private markets, to meet liquidity needs arising from a liquidity stress scenario or event. Please refer to ‘Level 1 assets’
and ‘Level 2 assets’.
‘High Risk’ In retail banking, ‘High Risk’ is defined as the subset of up-to-date customers who, either through an event or observed
behaviour, exhibit potential financial difficulty. Where appropriate, these customers are proactively contacted to assess whether
assistance is required.
‘Home loan’ A loan to purchase a residential property. The property is then used as collateral to guarantee repayment of the loan. The
borrower gives the lender a lien against the property and the lender can foreclose on the property if the borrower does not repay the
loan per the agreed terms. Also known as a residential mortgage.
‘IHC’ or ‘US IHC’ The intermediate US holding company, Barclays US LLC, which holds most of Barclays’ subsidiaries and assets in the
US.
‘Identified Impairment (II)’ Specific impairment allowances for financial assets, estimated individually.