UNITED STATES
SECURITIES AND EXCHANGE COMMISSION
Washington, D.C. 20549
INFORMATION
Proxy Statement Pursuant to Section 14(a) of the
Securities Exchange Act of 1934
(Amendment No. )
| Filed by the Registrant | ☒ |
| Filed by a party other than the Registrant | ☐ |
| Check the appropriate box: |
| ☐ | Preliminary Proxy Statement |
| ☐ | Confidential, for Use of the Commission Only (as permitted by Rule 14a-6(e)(2)) |
| ☐ | Definitive Proxy Statement |
| ☒ | Definitive Additional Materials |
| ☐ | Soliciting Material pursuant to §240.14a-12 |
(Name of Registrant as Specified in Its Charter)
(Name of Person(s) Filing Proxy Statement, if other than the Registrant)
Payment of Filing Fee (Check all boxes that apply):
| ☒ | No fee required. |
| ☐ | Fee paid previously with preliminary materials. |
| ☐ | Fee computed on table in exhibit required by Item 25(b) per Exchange Act Rules 14a- 6(i)(1) and 0-11. |
EXPLANATORY NOTE
On May 5, 2025, Innovative Food Holdings, Inc. (the “Company”) filed with the Securities and Exchange Commission a definitive proxy statement on Schedule 14A (as amended or supplemented to date, the “Proxy Statement”) relating to the Company’s Annual Meeting of Stockholders (the “Annual Meeting”) to be held on May 28, 2025, at 10:00 a.m. Eastern Time.
This supplement to the Proxy Statement (this “Supplement”) is being filed to correct the following inadvertent errors contained in the Proxy Statement:
| ● | To revise the “Summary Compensation Table” under the subsection “Executive Compensation” of the section “Governance of the Company” on page 21 of the Proxy Statement; and |
| ● | To revise the subsection “Pay versus Performance” under the section “Governance of the Company” on page 25 of the Proxy Statement. |
Except as specifically updated and revised by this Supplement, all information set forth in the Proxy Statement remains unchanged and should be considered in casting your vote by proxy or in person at the Annual Meeting. Capitalized terms not defined in this Supplement have the meanings set forth in the Proxy Statement.
GOVERNANCE OF THE COMPANY
Executive Compensation
The following table sets forth information concerning the compensation for services rendered to us for the two years ended December 31, 2024, of our Chief Executive Officer and our other named executive officers, determined in accordance with SEC rules applicable to smaller reporting companies, our principal financial officer and our highest compensated officer whose annual compensation exceeded $100,000 in the fiscal year ended December 31, 2024, if any. We refer to the Chief Executive Officer and these other officers as the named executive officers.
1
SUMMARY COMPENSATION TABLE
| Name and Principal | Salary | Bonus | Stock Awards | Options Awards | Non-Equity Incentive Plan Compensation | Nonqualified Deferred Compensation Earnings | All Other Compensation | Total | ||||||||||||||||||||||||||
| Position | Year | ($) | ($) | ($) | ($) | ($) | ($) | ($) | ($) | |||||||||||||||||||||||||
| Robert W Bennett, CEO | 2024 | 463,240 | 215,443 | - | - | - | - | 54,163 | (a) | 732,846 | ||||||||||||||||||||||||
| 2023 | 344,712 | 410,128 | 660,541 | - | - | - | 199,791 | 1,615,172 | ||||||||||||||||||||||||||
| Brady L Smallwood, COO | 2024 | 308,827 | 76,602 | - | - | - | - | 53,616 | (b) | 439,045 | ||||||||||||||||||||||||
| 2023 | 184,615 | 117,369 | 199,951 | 9,794 | - | - | 25,461 | 537,190 | ||||||||||||||||||||||||||
| Gary Schubert, CFO | 2024 | 278,935 | 91,886 | 238,747 | - | - | - | 37,457 | (c) | 647,025 | ||||||||||||||||||||||||
| 2023 | - | - | - | - | - | - | 36,000 | 36,000 | ||||||||||||||||||||||||||
| (a) | Amount consists of $40,363 recognized as a period cost for Mr. Bennett’s health insurance premiums and $13,800 401k matching. |
| (b) | Amount consists of $39,816 recognized as a period cost for Mr. Smallwood’s health insurance premiums and $13,800 401k matching. |
| (c) | Amount consists of $30,134 recognized as a period cost for Mr. Schubert’s health insurance premiums and $7,323 401k matching. |
PAY VERSUS PERFORMANCE
As required by Section 953(a) of the Dodd-Frank Wall Street Reform and Consumer Protection Act and Item 402(v) of Regulation S-K, we are providing the following information about the relationship between executive compensation of our Named Executive Officers (“NEOs”) including our Principal Executive Officer (“PEO”) and certain financial performance measures of the Company.
The table below presents information on the compensation of our PEO and our other NEOs in comparison to certain performance metrics for 2024 and 2023. The use of the term “compensation actually paid” (“CAP”) is required by the SEC’s rules. Neither CAP nor the total amount reported in the Summary Compensation Table reflect the amount of compensation actually paid, earned or received during the applicable year. Per SEC rules, CAP was calculated by adjusting the Summary Compensation Table Total values for the applicable year as described in the footnotes to the table.
Pay Versus Performance Table for 2024
| Summary Compensation Table Total for PEO | Compensation Actually Paid to PEO | Summary Compensation Table | Compensation Actually | Average Summary Compensation Table Total for | Average Compensation Actually Paid to | Value of Initial Fixed $100 Investment Based On | Net | ||||||||||||||||||||||||||
| Robert W. (Bill) Bennett | Robert W. (Bill) Bennett | Total for PEO Sam Klepfish | Paid to PEO Sam Klepfish | Non-PEO NEOs | Non-PEO NEOs | Total Shareholder | Income (loss) | ||||||||||||||||||||||||||
| Year | (1)(2) | (1)(3) | (1)(2) | (1)(3) | (1)(2) | (1)(3) | Return | (millions) | |||||||||||||||||||||||||
| 2024 | $ | $ | $ | $ | $ | $ | $ | $ | |||||||||||||||||||||||||
| 2023 | $ | $ | $ | $ | $ | $ | $ | $ | ( | ) | |||||||||||||||||||||||
| 2022 | $ | $ | $ | $ | $ | $ | $ | $ | ( | ) | |||||||||||||||||||||||
In 2024, our PEO was In 2023, we had two CEOs: In 2022, our CEO was | |
| (2) | |
2
The table below reconciles the amount of compensation reported for our PEO Robert W. (Bill) Bennett to the amount of compensation actually paid:
| Year | Reported Summary Compensation Table Total for PEO | Reported Value of Equity Awards (4) | Equity Award Adjustments (5) | Reported Change in the Actuarial Present Value of Pension Benefits | Pension Benefit Adjustments | Compensation Actually Paid to PEO | ||||||||||||||||||
| 2024 | $ | $ | $ | $ | $ | $ | ||||||||||||||||||
| 2023 | $ | $ | ( | ) | $ | $ | $ | $ | ||||||||||||||||
| 2022 | $ | $ | $ | $ | $ | $ | ||||||||||||||||||
The table below reconciles the amount of compensation reported for our PEO Sam Klepfish to the amount of compensation actually paid:
| Year | Reported Summary Compensation Table Total for PEO Sam Klepfish | Reported Value of Equity Awards (4) | Equity Award Adjustments (5) | Reported Change in the Actuarial Present Value of Pension Benefits | Pension Benefit Adjustments | Compensation Actually Paid to PEO Sam Klepfish | ||||||||||||||||||
| 2024 | $ | $ | $ | $ | $ | $ | ||||||||||||||||||
| 2023 | $ | $ | ( | ) | $ | $ | $ | $ | ||||||||||||||||
| 2022 | $ | $ | ( | ) | $ | $ | $ | $ | ||||||||||||||||
| (4) | The grant date fair value of equity awards represents the total of the amounts reported in the “Stock Awards” and “Option Awards” columns in the Summary Compensation Table for the applicable year. |
| (5) | The equity award adjustments for each applicable year include the addition (or subtraction, as applicable) of the following: (i) the year-end fair value of any equity awards granted in the applicable year that are outstanding and unvested as of the end of the year; (ii) the amount of change as of the end of the applicable year (from the end of the prior fiscal year) in fair value of any awards granted in prior years that are outstanding and unvested as of the end of the applicable year; (iii) for awards that are granted and vest in the same applicable year, the fair value as of the vesting date; (iv) for awards granted in prior years that vest in the applicable year, the amount equal to the change as of the vesting date (from the end of the prior fiscal year) in fair value; (v) for awards granted in prior years that are determined to fail to meet the applicable vesting conditions during the applicable year, a deduction for the amount equal to the fair value at the end of the prior fiscal year; and (vi) the dollar value of any dividends or other earnings paid on stock in the applicable year prior to the vesting date that are not otherwise reflected in the fair value of such award or included in any other component of total compensation for the applicable year. The valuation assumptions used to calculate fair values did not materially differ from those disclosed at the time of grant. |
The amounts deducted or added in calculating the equity award adjustments for our PEO Robert W. (Bill) Bennett are as follows:
| Year | Year End Fair Remain Unvested | Year Over Year Change in Fair Value of Outstanding and Unvested Equity Awards That Were Granted in a Prior Fiscal Year | Fair Value as of Vesting Date of Equity Awards Granted and Vested in the Year | Year Over Year Change in Fair Value of Equity Awards Granted in Prior Years that Vested in the Year | Fair Value at the End of the Prior Year of Equity Awards that Failed to Meet Vesting Conditions in the Year | Value of Dividends or other Earnings Paid on Stock or Option Awards not Otherwise Reflected in Fair Value or Total Compensation | Total Equity Award Adjustments | |||||||||||||||||||||
| 2024 | $ | $ | $ | $ | $ | $ | $ | |||||||||||||||||||||
| 2023 | $ | $ | $ | $ | $ | $ | $ | |||||||||||||||||||||
| 2022 | $ | $ | $ | $ | $ | $ | $ | |||||||||||||||||||||
3
The amounts deducted or added in calculating the equity award adjustments for our PEO Sam Klepfish are as follows:
| Year | Year End Fair Value of Equity Awards Granted During Applicable Fiscal Year that Remain Unvested as of Applicable Fiscal Year End | Year over Year Change in Fair Value of Outstanding and Unvested Equity Awards in a Prior Fiscal Year | Fair Value as of Vesting Date of Granted and Vested in the Year | Year Over Year Change in Fair Value of Equity Awards Granted in Prior Years that Vested in the Year | Fair Value at the Awards that Failed to Meet Vesting Conditions in the Year | Value of Dividends or other Earnings Paid on Stock Reflected in Fair Value or Total Compensation | Total Equity Awards Adjustments | |||||||||||||||||||||
| 2024 | $ | $ | $ | $ | $ | $ | $ | |||||||||||||||||||||
| 2023 | $ | $ | $ | $ | $ | $ | $ | |||||||||||||||||||||
| 2022 | $ | $ | $ | $ | $ | $ | $ | |||||||||||||||||||||
The table below reconciles the average amount of compensation reported for our non-PEO NEOs to the average amount of compensation actually paid:
| Year | Average Reported Summary Compensation Table Total for Non-PEO NEOs | Average Reported Value of Equity Awards | Average Equity Award Adjustments | Average Reported Change in the Actuarial Present Value of Pension Benefits | Average Pension Benefit Adjustments | Average Compensation Actually Paid to Non-PEO NEOs | ||||||||||||||||||
| 2024 | $ | $ | ( | ) | $ | $ | $ | $ | ||||||||||||||||
| 2023 | $ | $ | ( | ) | $ | $ | $ | $ | ||||||||||||||||
| 2022 | $ | $ | ( | ) | $ | ( | ) | $ | $ | $ | ||||||||||||||
The amounts deducted or added in calculating the total average equity award adjustments are as follows:
| Year | Average Year End Fair Value of Equity Awards Granted During Applicable Fiscal Year that Remain Unvested as of Applicable Fiscal Year End | Year Over Year Average Change in Fair Value of Outstanding and Unvested Equity Awards That Were Granted In a Prior Fiscal Year | Average Fair Value as of Vesting Date of Equity Awards Granted and Vested in the Year | Year Over Year Average Change in Fair Value of Equity Awards Granted in Prior Years that Vested in the Year | Average Fair Value at the End of the Prior Year of Equity Awards that Failed to Meet Vesting Conditions in the Year | Average Value of Dividends or other Earnings Paid on Stock or Option Awards not Otherwise Reflected in Fair Value or Total Compensation | Total Average Equity Award Adjustments | |||||||||||||||||||||
| 2024 | $ | $ | $ | $ | $ | $ | $ | |||||||||||||||||||||
| 2023 | $ | $ | $ | $ | $ | $ | $ | |||||||||||||||||||||
| 2022 | $ | $ | $ | $ | ( | ) | $ | $ | $ | ( | ) | |||||||||||||||||
4
Analysis of the Information Presented in the Pay versus Performance Table
As described in more detail in the section captioned “Executive Compensation” beginning on page 20 of this Proxy Statement, during the periods presented in the tables above the Company’s executive compensation program included cash compensation and equity-based incentive awards in the form of stock options, stock grants, and stock appreciation rights. While the Company utilizes several performance measures to align executive compensation with Company performance, not all of those Company measures are presented in the “Pay Versus Performance Table for 2024”. The Company seeks to incentivize both short-term and long-term performance, and therefore does not specifically align the Company’s performance measures with compensation that is actually paid (as computed in accordance with Item 402(v) of Regulation S-K) for a particular year. In accordance with Item 402(v) of Regulation S-K, the Company is providing the following descriptions of the relationships between information presented in the “Pay Versus Performance Table for 2024”.
Compensation Actually Paid and Cumulative Total Shareholder Return (“TSR”)
As demonstrated by the following graph, the amount of total compensation actually paid to our CEOs and the average amount of compensation actually paid to the Company’s NEOs as a group (excluding our CEOs) is generally aligned with the Company’s cumulative TSR over the three years presented in the “Pay Versus Performance Table for 2024”. For additional information, see the section captioned “Executive Compensation” beginning on page 20 of this Proxy Statement.
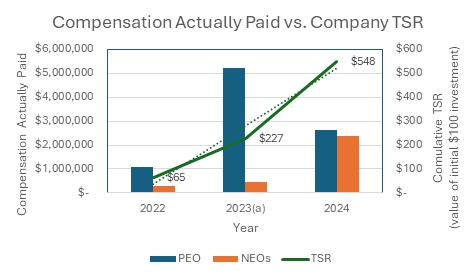
| a. | The 2023 PEO bar includes the combined compensation of the Company’s two CEOs who served during the year. |
Compensation Actually Paid and Net Income
As demonstrated by the following graph, the amount of total compensation actually paid to our CEOs and the average amount of compensation actually paid to the Company’s NEOs as a group (excluding our CEOs) is generally not aligned with the Company’s net income over the three years presented in the “Pay Versus Performance Table for 2024”. The Company uses net income as a specific performance measure in the overall executive compensation program along with gross margin levels, which the Company considers a leading indicator of profitability over the long term. For additional information regarding the performance measures used to determine cash- and equity-based incentive compensation for the Company’s NEOs, see the section captioned “Executive Compensation” beginning on page 20 of this Proxy Statement.
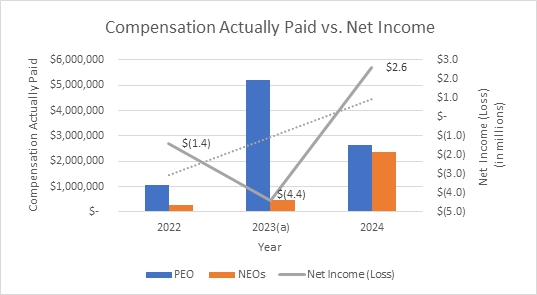
| a. | The 2023 PEO bar includes the combined compensation of the Company’s two CEOs who served during the year. |
5