| Q3 FY2025 Consolidated Financial Results (Three months ended December 31, 2025) Sony Group Corporation February 5, 2026 |
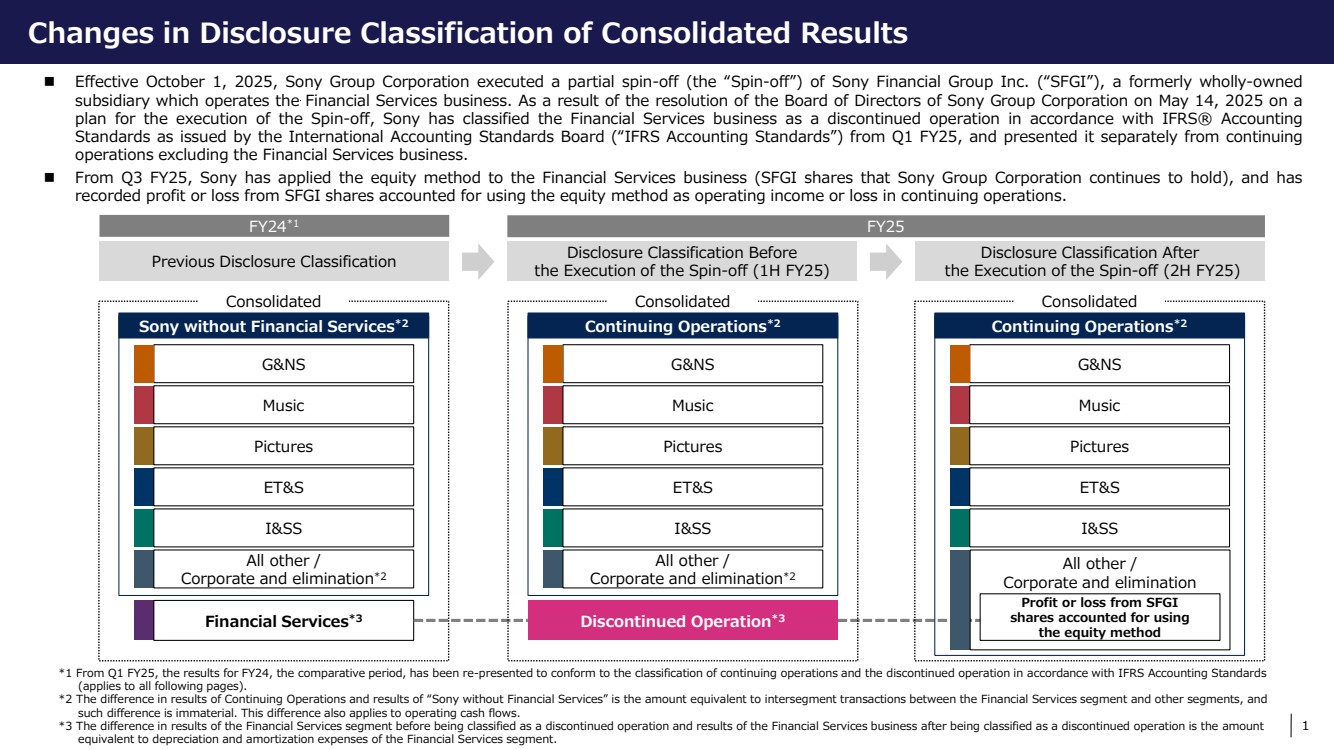
| 1 Changes in Disclosure Classification of Consolidated Results *1 From Q1 FY25, the results for FY24, the comparative period, has been re-presented to conform to the classification of continuing operations and the discontinued operation in accordance with IFRS Accounting Standards (applies to all following pages). *2 The difference in results of Continuing Operations and results of “Sony without Financial Services” is the amount equivalent to intersegment transactions between the Financial Services segment and other segments, and such difference is immaterial. This difference also applies to operating cash flows. *3 The difference in results of the Financial Services segment before being classified as a discontinued operation and results of the Financial Services business after being classified as a discontinued operation is the amount equivalent to depreciation and amortization expenses of the Financial Services segment. Effective October 1, 2025, Sony Group Corporation executed a partial spin-off (the “Spin-off”) of Sony Financial Group Inc. (“SFGI”), a formerly wholly-owned subsidiary which operates the Financial Services business. As a result of the resolution of the Board of Directors of Sony Group Corporation on May 14, 2025 on a plan for the execution of the Spin-off, Sony has classified the Financial Services business as a discontinued operation in accordance with IFRS® Accounting Standards as issued by the International Accounting Standards Board (“IFRS Accounting Standards”) from Q1 FY25, and presented it separately from continuing operations excluding the Financial Services business. From Q3 FY25, Sony has applied the equity method to the Financial Services business (SFGI shares that Sony Group Corporation continues to hold), and has recorded profit or loss from SFGI shares accounted for using the equity method as operating income or loss in continuing operations. Previous Disclosure Classification Disclosure Classification Before the Execution of the Spin-off (1H FY25) Disclosure Classification After the Execution of the Spin-off (2H FY25) FY24*1 FY25 G&NS Music Pictures ET&S I&SS All other / Corporate and elimination*2 Financial Services*3 Consolidated Sony without Financial Services*2 G&NS Music Pictures ET&S I&SS All other / Corporate and elimination*2 Consolidated Continuing Operations*2 Discontinued Operation*3 G&NS Music Pictures ET&S I&SS Consolidated Continuing Operations*2 All other / Corporate and elimination Profit or loss from SFGI shares accounted for using the equity method Changes in Disclosure Classification of Consolidated Results |
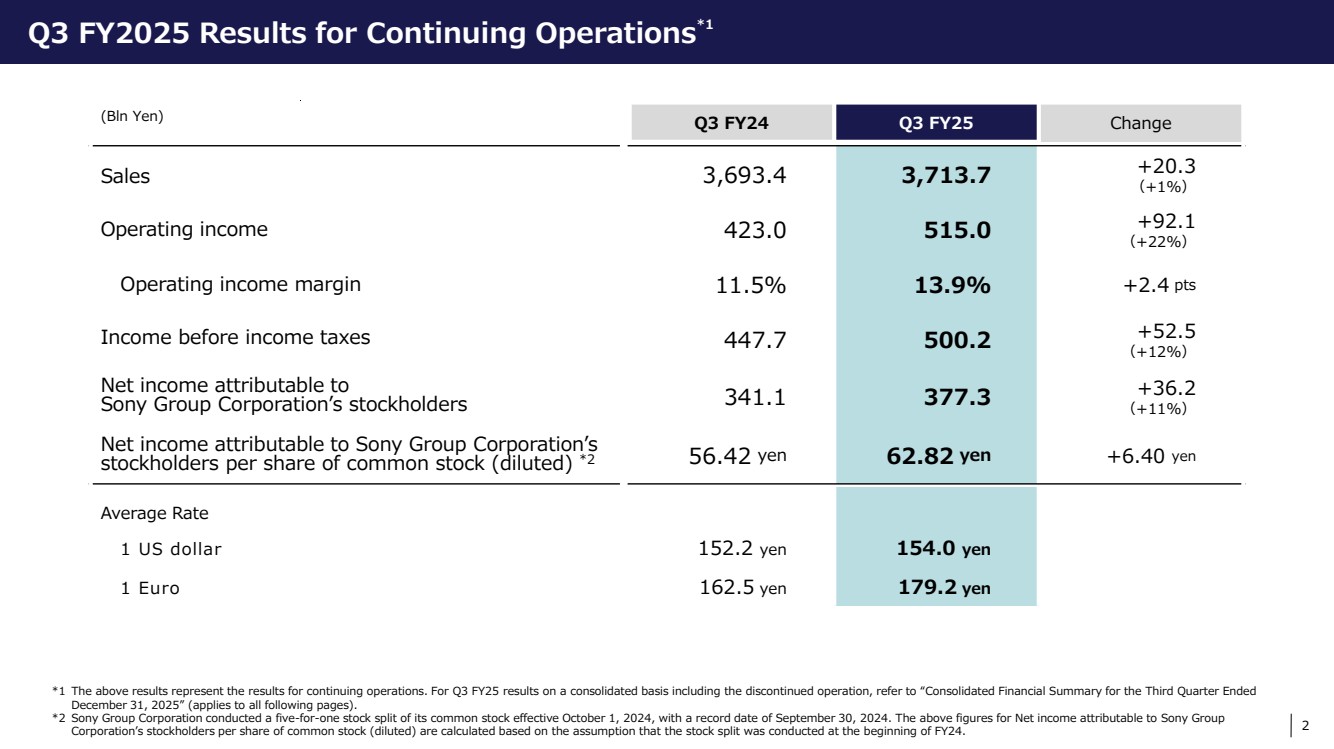
| 2 Q3 FY2025 Results for Continuing Operations*1 (Bln Yen) Q3 FY24 Q3 FY25 Change Sales 3,693.4 3,713.7 +20.3 (+1%) Operating income 423.0 515.0 +92.1 (+22%) Operating income margin 11.5% 13.9% +2.4 pts Income before income taxes 447.7 500.2 +52.5 (+12%) Net income attributable to Sony Group Corporation’s stockholders 341.1 377.3 +36.2 (+11%) Net income attributable to Sony Group Corporation’s stockholders per share of common stock (diluted) *2 56.42 yen 62.82 yen +6.40 yen Average Rate 1 US dollar 152.2 yen 154.0 yen 1 Euro 162.5 yen 179.2 yen *1 The above results represent the results for continuing operations. For Q3 FY25 results on a consolidated basis including the discontinued operation, refer to “Consolidated Financial Summary for the Third Quarter Ended December 31, 2025” (applies to all following pages). *2 Sony Group Corporation conducted a five-for-one stock split of its common stock effective October 1, 2024, with a record date of September 30, 2024. The above figures for Net income attributable to Sony Group Corporation’s stockholders per share of common stock (diluted) are calculated based on the assumption that the stock split was conducted at the beginning of FY24. Q3 FY2025 Results for Continuing Operations*1 |
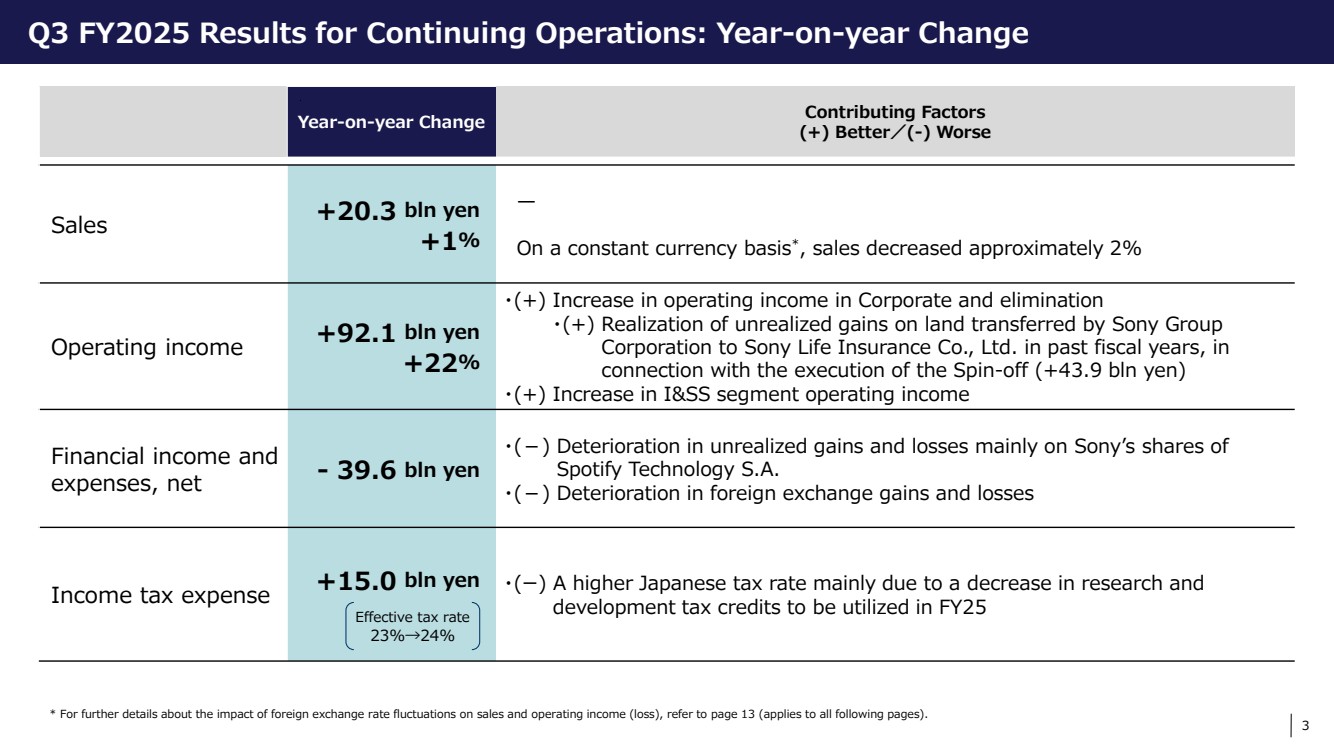
| 3 Q3 FY2025 Results for Continuing Operations: Year-on-year Change Year-on-year Change Contributing Factors (+) Better/(-) Worse Sales +20.3 bln yen +1% — On a constant currency basis*, sales decreased approximately 2% Operating income +92.1 bln yen +22% ・(+) Increase in operating income in Corporate and elimination ・(+) Realization of unrealized gains on land transferred by Sony Group Corporation to Sony Life Insurance Co., Ltd. in past fiscal years, in connection with the execution of the Spin-off (+43.9 bln yen) ・(+) Increase in I&SS segment operating income Financial income and expenses, net - 39.6 bln yen ・(-) Deterioration in unrealized gains and losses mainly on Sony’s shares of Spotify Technology S.A. ・(-) Deterioration in foreign exchange gains and losses Income tax expense +15.0 bln yen ・(ー) A higher Japanese tax rate mainly due to a decrease in research and development tax credits to be utilized in FY25 Effective tax rate 23%→24% * For further details about the impact of foreign exchange rate fluctuations on sales and operating income (loss), refer to page 13 (applies to all following pages). Q3 FY2025 Results for Continuing Operations: Year-on-year Change |
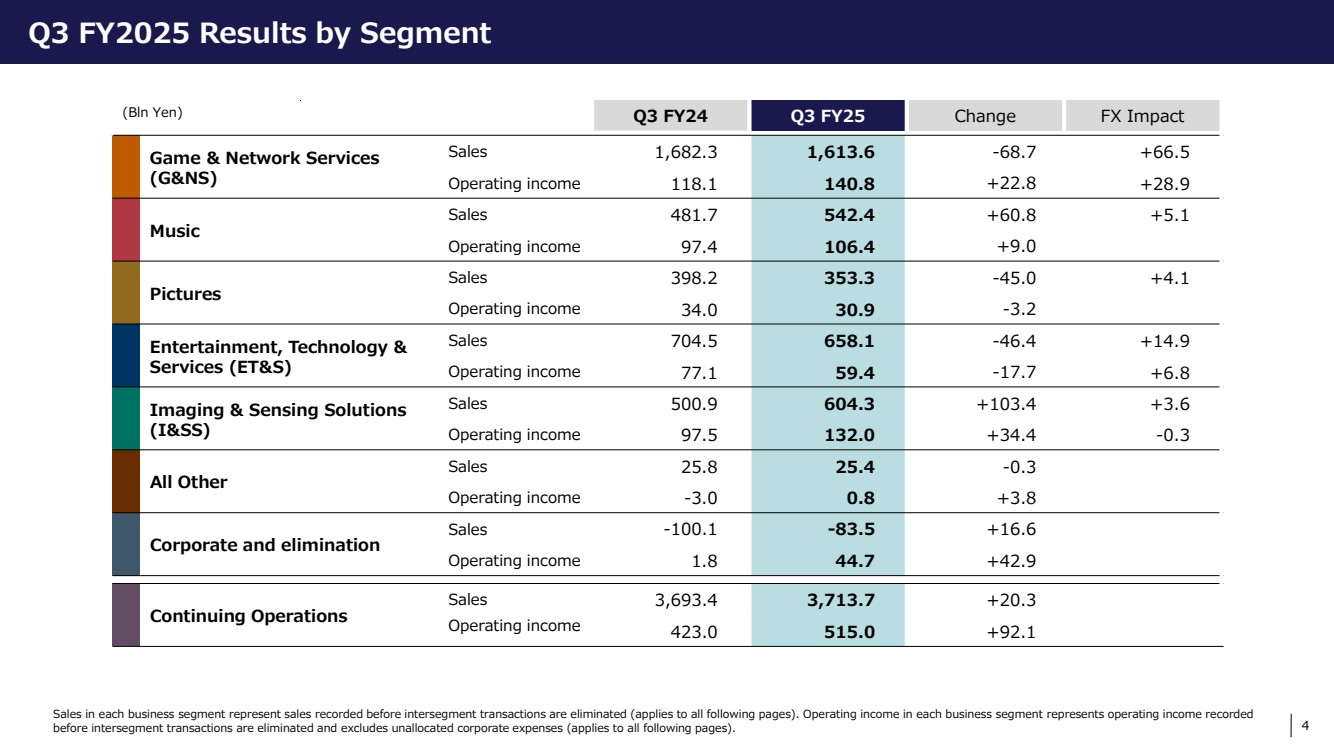
| 4 (Bln Yen) Q3 FY24 Q3 FY25 Change FX Impact Game & Network Services (G&NS) Sales 1,682.3 1,613.6 -68.7 +66.5 Operating income 118.1 140.8 +22.8 +28.9 Music Sales 481.7 542.4 +60.8 +5.1 Operating income 97.4 106.4 +9.0 Pictures Sales 398.2 353.3 -45.0 +4.1 Operating income 34.0 30.9 -3.2 Entertainment, Technology & Services (ET&S) Sales 704.5 658.1 -46.4 +14.9 Operating income 77.1 59.4 -17.7 +6.8 Imaging & Sensing Solutions (I&SS) Sales 500.9 604.3 +103.4 +3.6 Operating income 97.5 132.0 +34.4 -0.3 All Other Sales 25.8 25.4 -0.3 Operating income -3.0 0.8 +3.8 Corporate and elimination Sales -100.1 -83.5 +16.6 Operating income 1.8 44.7 +42.9 Continuing Operations Sales 3,693.4 3,713.7 +20.3 Operating income 423.0 515.0 +92.1 Sales in each business segment represent sales recorded before intersegment transactions are eliminated (applies to all following pages). Operating income in each business segment represents operating income recorded before intersegment transactions are eliminated and excludes unallocated corporate expenses (applies to all following pages). Q3 FY2025 Results by Segment |
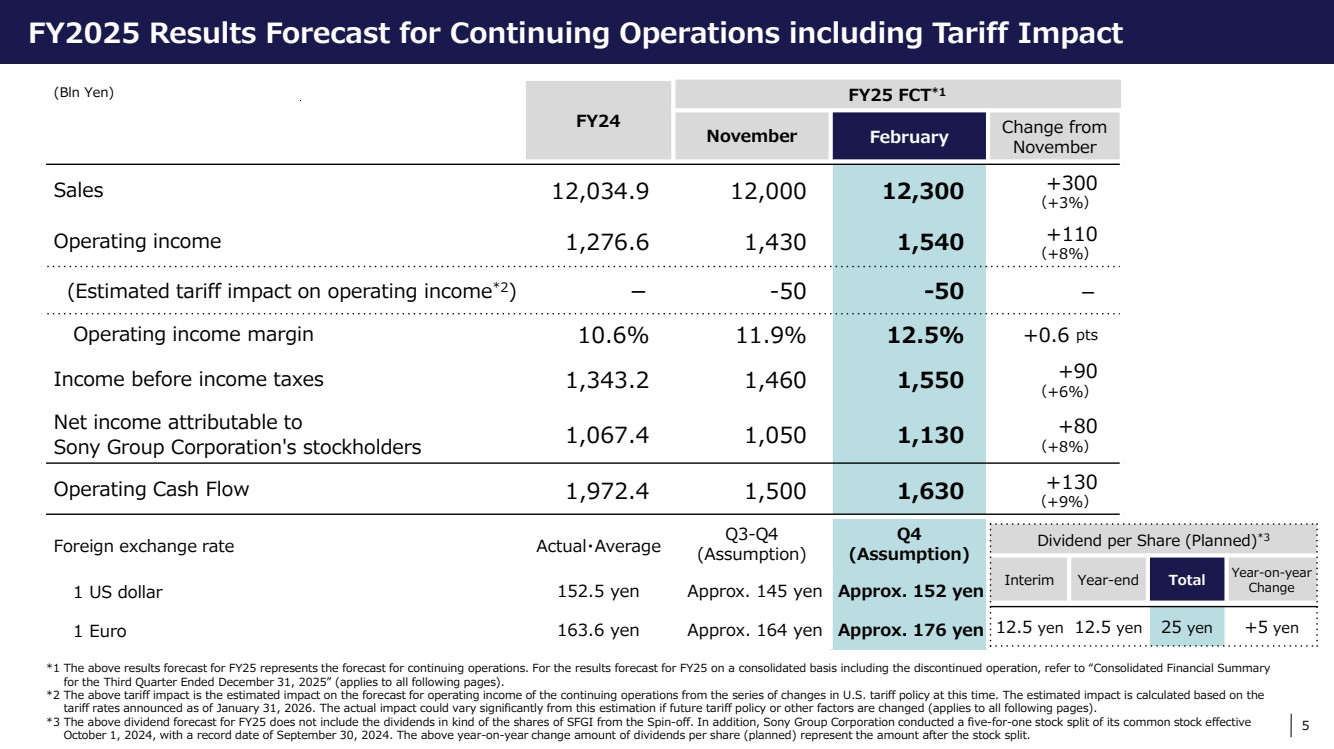
| 5 FY2025 Results Forecast for Continuing Operations including Tariff Impact (Bln Yen) FY24 FY25 FCT*1 November February Change from November Sales 12,034.9 12,000 12,300 +300 (+3%) Operating income 1,276.6 1,430 1,540 +110 (+8%) (Estimated tariff impact on operating income*2) - -50 -50 - Operating income margin 10.6% 11.9% 12.5% +0.6 pts Income before income taxes 1,343.2 1,460 1,550 +90 (+6%) Net income attributable to Sony Group Corporation's stockholders 1,067.4 1,050 1,130 +80 (+8%) Operating Cash Flow 1,972.4 1,500 1,630 +130 (+9%) Foreign exchange rate Actual・Average Q3-Q4 (Assumption) Q4 (Assumption) 1 US dollar 152.5 yen Approx. 145 yen Approx. 152 yen 1 Euro 163.6 yen Approx. 164 yen Approx. 176 yen Dividend per Share (Planned)*3 Interim Year-end Total Year-on-year Change 12.5 yen 12.5 yen 25 yen +5 yen *1 The above results forecast for FY25 represents the forecast for continuing operations. For the results forecast for FY25 on a consolidated basis including the discontinued operation, refer to “Consolidated Financial Summary for the Third Quarter Ended December 31, 2025” (applies to all following pages). *2 The above tariff impact is the estimated impact on the forecast for operating income of the continuing operations from the series of changes in U.S. tariff policy at this time. The estimated impact is calculated based on the tariff rates announced as of January 31, 2026. The actual impact could vary significantly from this estimation if future tariff policy or other factors are changed (applies to all following pages). *3 The above dividend forecast for FY25 does not include the dividends in kind of the shares of SFGI from the Spin-off. In addition, Sony Group Corporation conducted a five-for-one stock split of its common stock effective October 1, 2024, with a record date of September 30, 2024. The above year-on-year change amount of dividends per share (planned) represent the amount after the stock split. FY2025 Results Forecast for Continuing Operations including Tariff Impact |
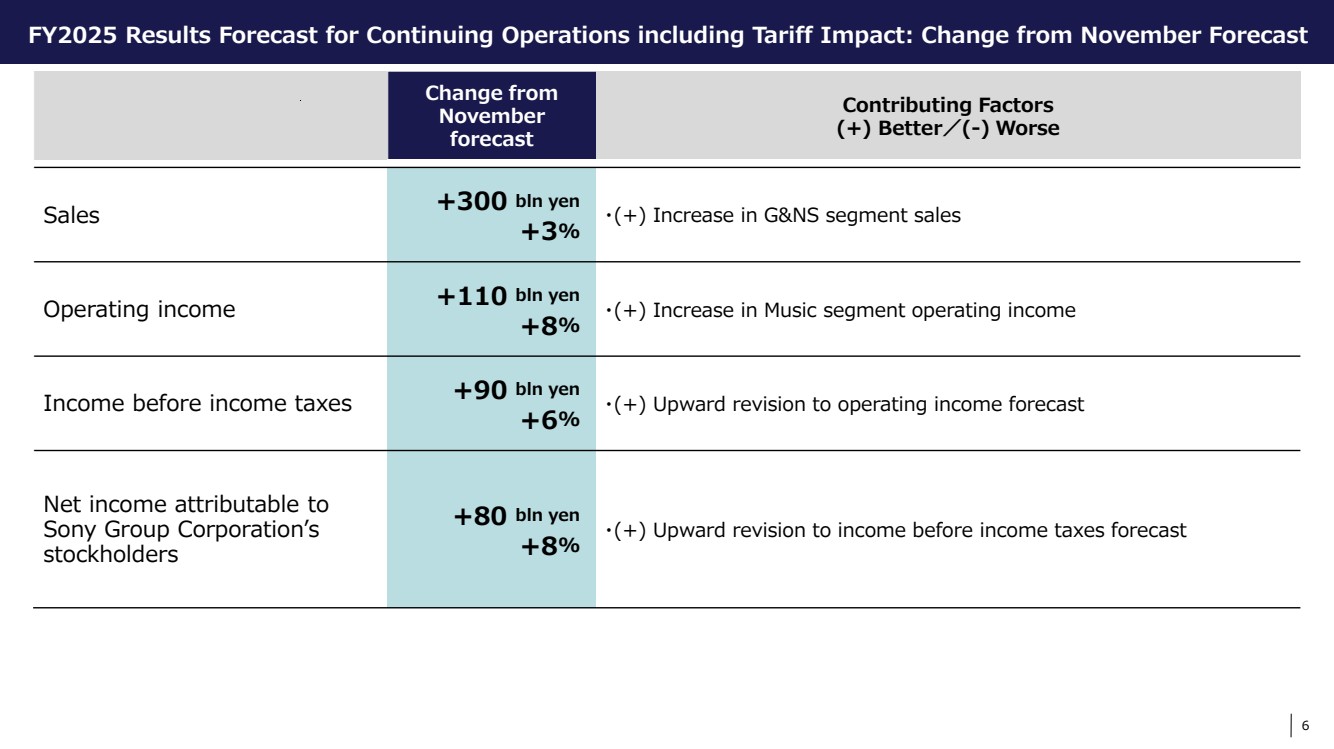
| 6 FY2025 Results Forecast for Continuing Operations including Tariff Impact: Change from November Forecast Change from November forecast Contributing Factors (+) Better/(-) Worse Sales +300 bln yen +3% ・(+) Increase in G&NS segment sales Operating income +110 bln yen +8% ・(+) Increase in Music segment operating income Income before income taxes +90 bln yen +6% ・(+) Upward revision to operating income forecast Net income attributable to Sony Group Corporation’s stockholders +80 bln yen +8% ・(+) Upward revision to income before income taxes forecast FY2025 Results Forecast for Continuing Operations including Tariff Impact: Change from November Forecast |
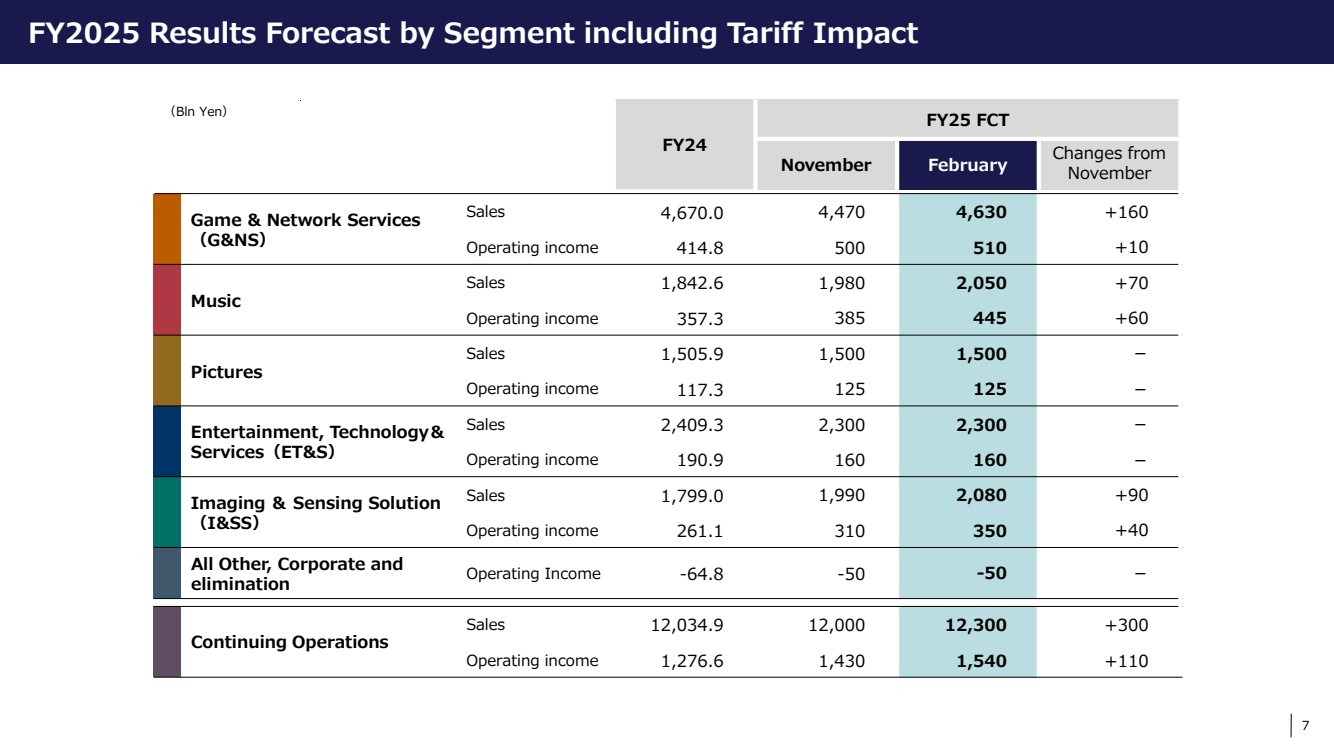
| 7 FY2025 Results Forecast by Segment including Tariff Impact (Bln Yen) FY24 FY25 FCT November February Changes from November Game & Network Services (G&NS) Sales 4,670.0 4,470 4,630 +160 Operating income 414.8 500 510 +10 Music Sales 1,842.6 1,980 2,050 +70 Operating income 357.3 385 445 +60 Pictures Sales 1,505.9 1,500 1,500 - Operating income 117.3 125 125 - Entertainment, Technology& Services(ET&S) Sales 2,409.3 2,300 2,300 - Operating income 190.9 160 160 - Imaging & Sensing Solution (I&SS) Sales 1,799.0 1,990 2,080 +90 Operating income 261.1 310 350 +40 All Other, Corporate and elimination Operating Income -64.8 -50 -50 - Continuing Operations Sales 12,034.9 12,000 12,300 +300 Operating income 1,276.6 1,430 1,540 +110 FY2025 Results Forecast by Segment including Tariff Impact |
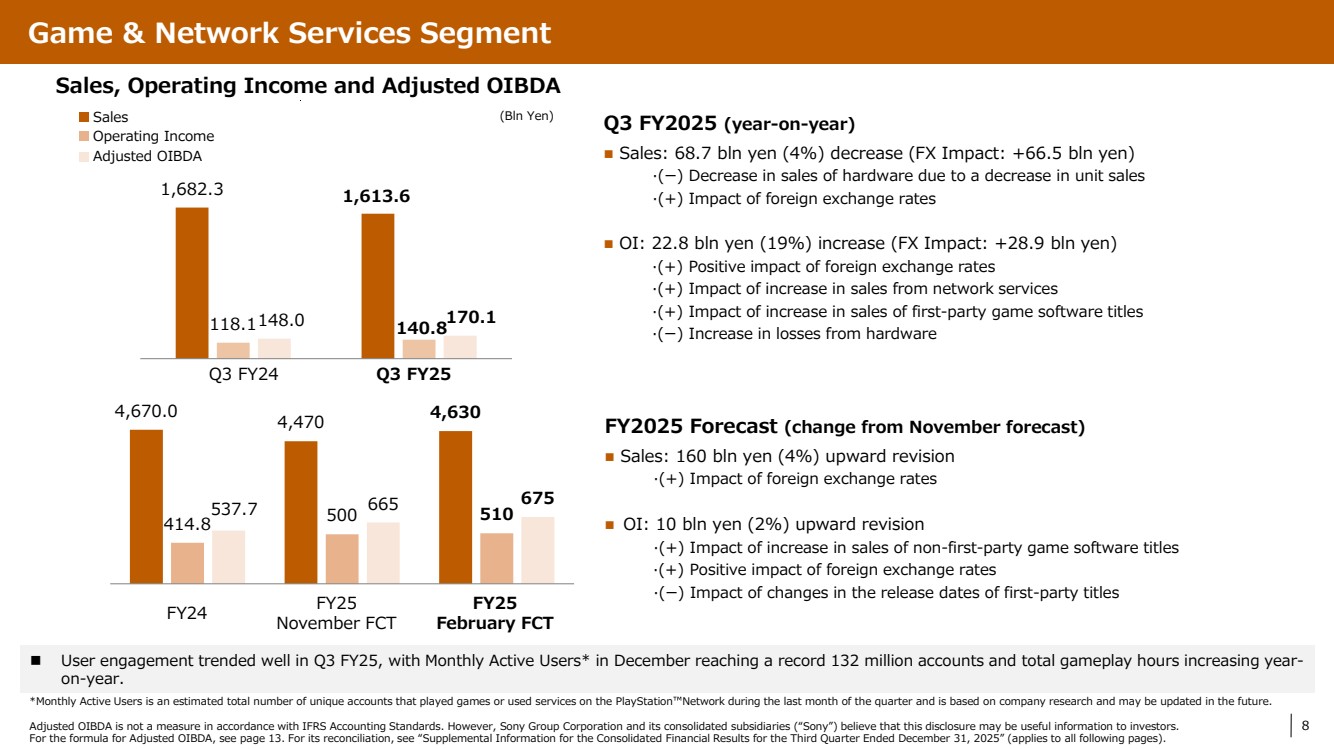
| 8 User engagement trended well in Q3 FY25, with Monthly Active Users* in December reaching a record 132 million accounts and total gameplay hours increasing year-on-year. Q3 FY2025 (year-on-year) Sales: 68.7 bln yen (4%) decrease (FX Impact: +66.5 bln yen) ·(ー) Decrease in sales of hardware due to a decrease in unit sales ·(+) Impact of foreign exchange rates OI: 22.8 bln yen (19%) increase (FX Impact: +28.9 bln yen) ·(+) Positive impact of foreign exchange rates ·(+) Impact of increase in sales from network services ·(+) Impact of increase in sales of first-party game software titles ·(ー) Increase in losses from hardware FY2025 Forecast (change from November forecast) Sales: 160 bln yen (4%) upward revision ·(+) Impact of foreign exchange rates OI: 10 bln yen (2%) upward revision ·(+) Impact of increase in sales of non-first-party game software titles ·(+) Positive impact of foreign exchange rates ·(ー) Impact of changes in the release dates of first-party titles Sales, Operating Income and Adjusted OIBDA Sales (Bln Yen) Operating Income Adjusted OIBDA 4,670.0 4,470 4,630 414.8 537.7 500 510 665 675 FY24 FY25 November FCT FY25 February FCT Q3 FY24 Q3 FY25 1,682.3 1,613.6 118.1 140.8 148.0 170.1 *Monthly Active Users is an estimated total number of unique accounts that played games or used services on the PlayStation Network during the last month of the quarter and is based on company research and may be updated in the future. Adjusted OIBDA is not a measure in accordance with IFRS Accounting Standards. However, Sony Group Corporation and its consolidated subsidiaries (“Sony”) believe that this disclosure may be useful information to investors. For the formula for Adjusted OIBDA, see page 13. For its reconciliation, see “Supplemental Information for the Consolidated Financial Results for the Third Quarter Ended December 31, 2025” (applies to all following pages). Game & Network Services Segment |
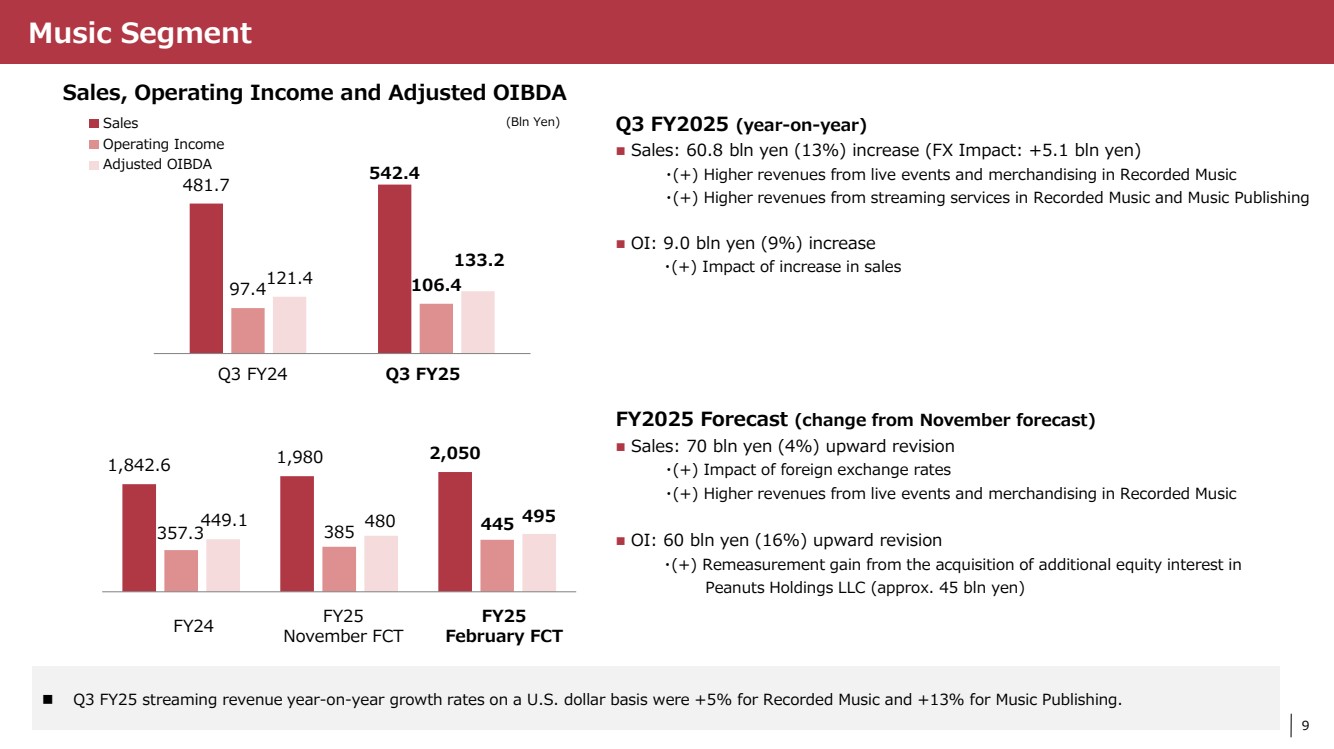
| 9 Q3 FY2025 (year-on-year) Sales: 60.8 bln yen (13%) increase (FX Impact: +5.1 bln yen) ・(+) Higher revenues from live events and merchandising in Recorded Music ・(+) Higher revenues from streaming services in Recorded Music and Music Publishing OI: 9.0 bln yen (9%) increase ・(+) Impact of increase in sales FY2025 Forecast (change from November forecast) Sales: 70 bln yen (4%) upward revision ・(+) Impact of foreign exchange rates ・(+) Higher revenues from live events and merchandising in Recorded Music OI: 60 bln yen (16%) upward revision ・(+) Remeasurement gain from the acquisition of additional equity interest in Peanuts Holdings LLC (approx. 45 bln yen) Sales Adjusted OIBDA Operating Income 1,842.6 1,980 2,050 357.3 385 449.1 480 445 495 Sales, Operating Income and Adjusted OIBDA (Bln Yen) FY24 FY25 November FCT FY25 February FCT Q3 FY25 streaming revenue year-on-year growth rates on a U.S. dollar basis were +5% for Recorded Music and +13% for Music Publishing. Q3 FY24 Q3 FY25 481.7 542.4 97.4 106.4 121.4 133.2 Music Segment |
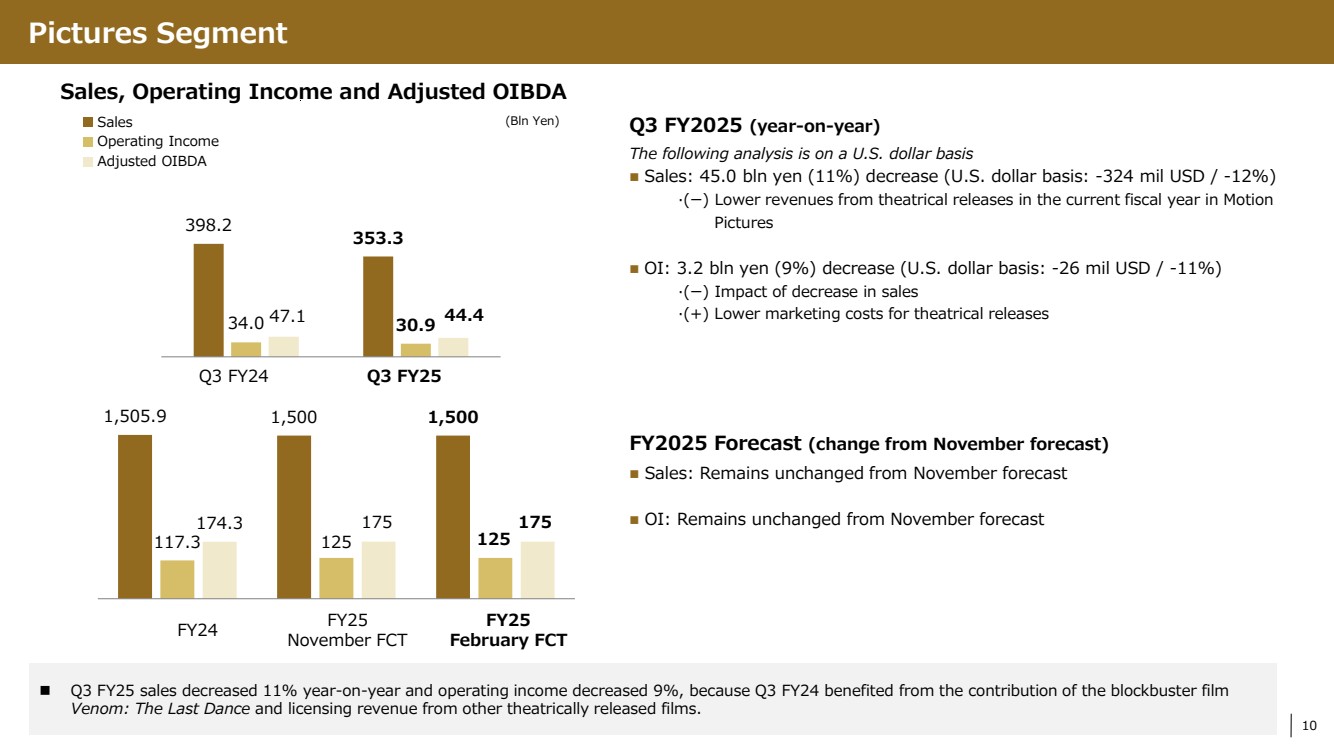
| 10 Q3 FY2025 (year-on-year) The following analysis is on a U.S. dollar basis Sales: 45.0 bln yen (11%) decrease (U.S. dollar basis: -324 mil USD / -12%) ·(ー) Lower revenues from theatrical releases in the current fiscal year in Motion Pictures OI: 3.2 bln yen (9%) decrease (U.S. dollar basis: -26 mil USD / -11%) ·(ー) Impact of decrease in sales ·(+) Lower marketing costs for theatrical releases Sales, Operating Income and Adjusted OIBDA Sales (Bln Yen) Adjusted OIBDA Operating Income FY24 FY25 November FCT FY25 February FCT 1,505.9 1,500 1,500 117.3 125 125 174.3 175 175 FY2025 Forecast (change from November forecast) Sales: Remains unchanged from November forecast OI: Remains unchanged from November forecast Q3 FY25 sales decreased 11% year-on-year and operating income decreased 9%, because Q3 FY24 benefited from the contribution of the blockbuster film Venom: The Last Dance and licensing revenue from other theatrically released films. Q3 FY24 Q3 FY25 398.2 353.3 34.0 30.9 47.1 44.4 Pictures Segment |
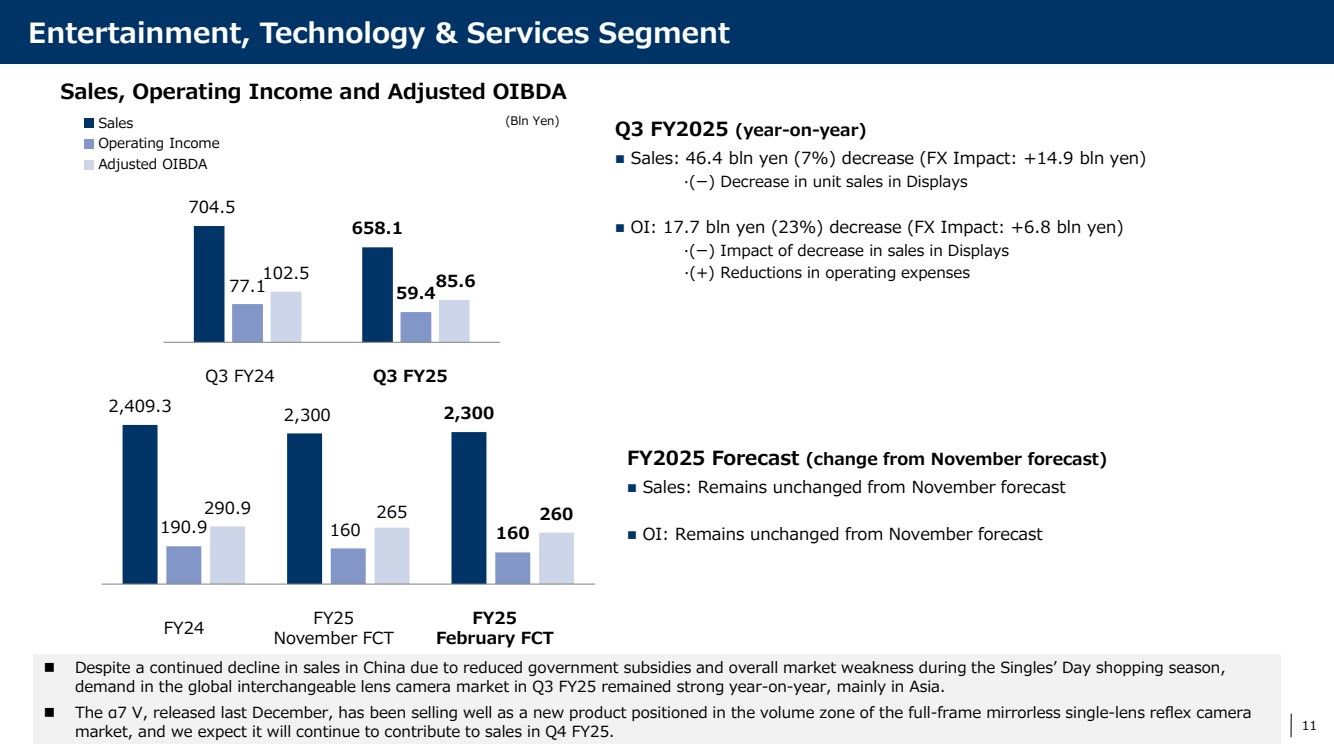
| 11 Entertainment, Technology & Services Segment (ET&S Segment) Q3 FY2025 (year-on-year) Sales: 46.4 bln yen (7%) decrease (FX Impact: +14.9 bln yen) ·(ー) Decrease in unit sales in Displays OI: 17.7 bln yen (23%) decrease (FX Impact: +6.8 bln yen) ·(ー) Impact of decrease in sales in Displays ·(+) Reductions in operating expenses FY2025 Forecast (change from November forecast) Sales: Remains unchanged from November forecast OI: Remains unchanged from November forecast Sales, Operating Income and Adjusted OIBDA Sales (Bln Yen) Adjusted OIBDA Operating Income 2,409.3 2,300 2,300 190.9 160 160 290.9 265 260 FY24 FY25 November FCT FY25 February FCT Despite a continued decline in sales in China due to reduced government subsidies and overall market weakness during the Singles’ Day shopping season, demand in the global interchangeable lens camera market in Q3 FY25 remained strong year-on-year, mainly in Asia. The α7 V, released last December, has been selling well as a new product positioned in the volume zone of the full-frame mirrorless single-lens reflex camera market, and we expect it will continue to contribute to sales in Q4 FY25. Q3 FY24 Q3 FY25 704.5 658.1 77.1 59.4 102.5 85.6 Entertainment, Technology & Services Segment |
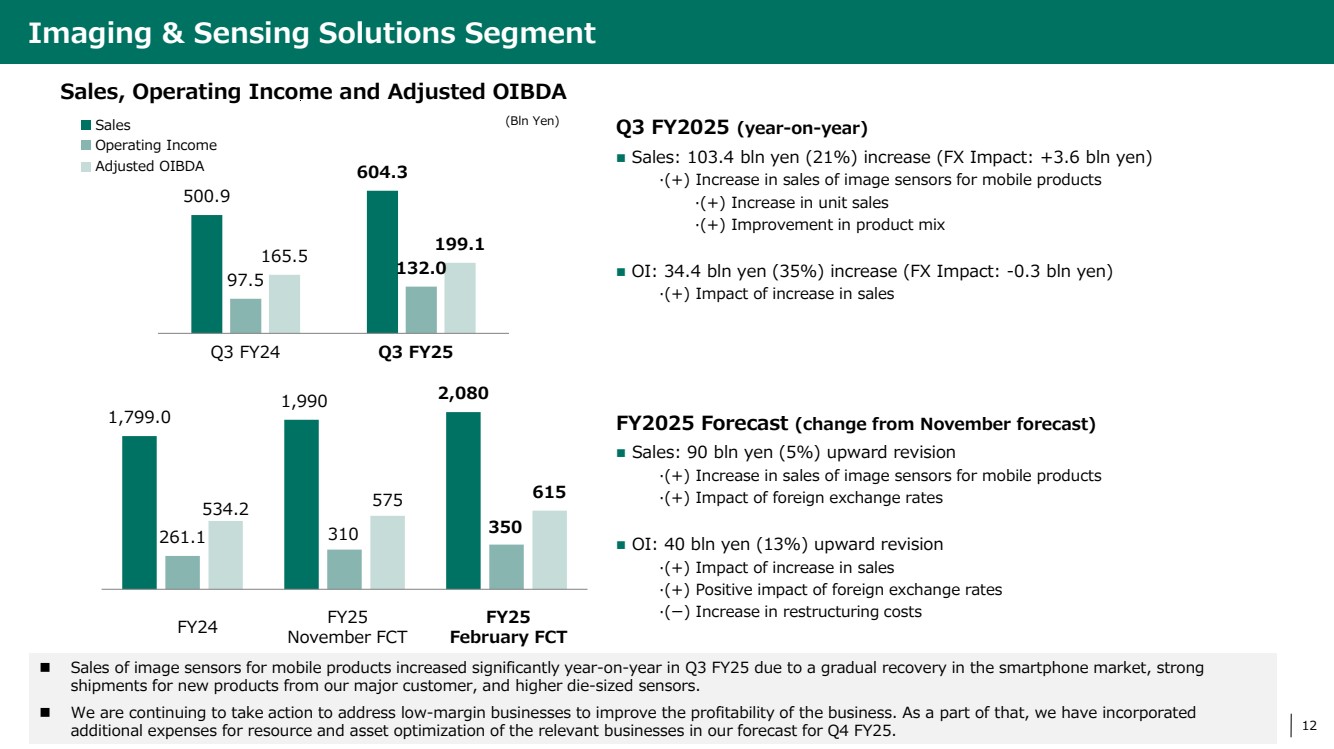
| 12 Imaging & Sensing Solutions Segment Q3 FY2025 (year-on-year) Sales: 103.4 bln yen (21%) increase (FX Impact: +3.6 bln yen) ·(+) Increase in sales of image sensors for mobile products ·(+) Increase in unit sales ·(+) Improvement in product mix OI: 34.4 bln yen (35%) increase (FX Impact: -0.3 bln yen) ·(+) Impact of increase in sales FY2025 Forecast (change from November forecast) Sales: 90 bln yen (5%) upward revision ·(+) Increase in sales of image sensors for mobile products ·(+) Impact of foreign exchange rates OI: 40 bln yen (13%) upward revision ·(+) Impact of increase in sales ·(+) Positive impact of foreign exchange rates ·(ー) Increase in restructuring costs Sales, Operating Income and Adjusted OIBDA (Bln Yen) Sales Adjusted OIBDA Operating Income 1,799.0 1,990 2,080 261.1 310 350 534.2 575 615 FY24 FY25 November FCT FY25 February FCT Sales of image sensors for mobile products increased significantly year-on-year in Q3 FY25 due to a gradual recovery in the smartphone market, strong shipments for new products from our major customer, and higher die-sized sensors. We are continuing to take action to address low-margin businesses to improve the profitability of the business. As a part of that, we have incorporated additional expenses for resource and asset optimization of the relevant businesses in our forecast for Q4 FY25. Q3 FY24 Q3 FY25 500.9 604.3 97.5 132.0 165.5 199.1 |
| 13 Notes Notes about Adjusted OIBDA Adjusted OIBDA (Operating Income Before Depreciation and Amortization) is calculated by the following formula: Adjusted OIBDA = Operating income + Depreciation and amortization expense* - the profit and loss amount that Sony deems non-recurring * In the above formula, depreciation and amortization expense excludes amortization for film costs and broadcasting rights, as well as for internally developed game content and master recordings included in Content assets. Adjusted OIBDA is not a measure in accordance with IFRS Accounting Standards. However, Sony believes that this disclosure may be useful information to investors. Adjusted OIBDA should be considered in addition to, not as a substitute for, Sony’s results in accordance with IFRS Accounting Standards. Sales on a Constant Currency Basis and the Impact of Foreign Exchange Rate Fluctuations The descriptions of sales on a constant currency basis reflect sales calculated by applying the yen’s monthly average exchange rates from the same period of the previous fiscal year to local currency-denominated monthly sales in the relevant period of the current fiscal year. For Sony Music Entertainment (“SME”) and Sony Music Publishing LLC (“SMP”) in the Music segment, and in the Pictures segment, the constant currency amounts are calculated by applying the monthly average U.S. dollar / yen exchange rates after aggregation on a U.S. dollar basis. Results for the Pictures segment are described on a U.S. dollar basis as the Pictures segment reflects the operations of Sony Pictures Entertainment Inc. (“SPE”), a U.S.-based operation that aggregates the results of its worldwide subsidiaries in U.S. dollars. The impact of foreign exchange rate fluctuations on sales is calculated by applying the change in the yen’s periodic weighted average exchange rate for the same period of the previous fiscal year from the relevant period of the current fiscal year to the major transactional currencies in which the sales are denominated. The impact of foreign exchange rate fluctuations on operating income (loss) is calculated by subtracting from the impact on sales the impact on cost of sales and selling, general and administrative expenses calculated by applying the same major transactional currencies calculation process to cost of sales and selling, general and administrative expenses as for the impact on sales. The I&SS segment enters into its own foreign exchange hedging transactions, and the impact of those transactions is included in the impact of foreign exchange rate fluctuations on sales and operating income (loss) for that segment. This information is not a substitute for Sony’s consolidated financial statements and condensed (semi-annual) consolidated financial statements measured in accordance with IFRS Accounting Standards. However, Sony believes that these disclosures provide additional useful analytical information to investors regarding the operating performance of Sony. Notes about Financial Performance of the Music and Pictures segments The Music segment results include the yen-based results of Sony Music Entertainment (Japan) Inc. and the yen-translated results of SME and SMP, which aggregate the results of their worldwide subsidiaries on a U.S. dollar basis. The Pictures segment results are the yen-translated results of SPE, which aggregates the results of its worldwide subsidiaries on a U.S. dollar basis. Management analyzes the results of SPE in U.S. dollars, so discussion of certain portions of its results is specified as being on “a U.S. dollar basis.” Notes |
| 14 Cautionary Statement Statements made in this material with respect to Sony’s current plans, estimates, strategies and beliefs and other statements that are not historical facts are forward-looking statements about the future performance of Sony. Forward-looking statements include, but are not limited to, those statements using words such as “believe,” “expect,” “plans,” “strategy,” “prospects,” “forecast,” “estimate,” “project,” “anticipate,” “aim,” “intend,” “seek,” “may,” “might,” “could” or “should,” and words of similar meaning in connection with a discussion of future operations, financial performance, events or conditions. From time to time, oral or written forward-looking statements may also be included in other materials released to the public. These statements are based on management’s assumptions, judgments and beliefs in light of the information currently available to it. Sony cautions investors that a number of important risks and uncertainties could cause actual results to differ materially from those discussed in the forward-looking statements, and therefore investors should not place undue reliance on them. Investors also should not rely on any obligation of Sony to update or revise any forward-looking statements, whether as a result of new information, future events or otherwise. Sony disclaims any such obligation. Risks and uncertainties that might affect Sony include, but are not limited to: (i) Sony’s ability to maintain product quality and customer satisfaction with its products and services; (ii) Sony’s ability to continue to design and develop and win acceptance of, as well as achieve sufficient cost reductions for, its products and services, including image sensors, game and network platforms, smartphones and televisions, which are offered in highly competitive markets characterized by severe price competition and continual new product and service introductions, rapid development in technology and subjective and changing customer preferences; (iii) Sony’s ability to implement successful hardware, software, and content integration strategies, and to develop and implement successful sales and distribution strategies in light of new technologies and distribution platforms; (iv) the effectiveness of Sony’s strategies and their execution, including but not limited to the success of Sony’s acquisitions, joint ventures, investments, capital expenditures, restructurings and other strategic initiatives; (v) changes in laws, regulations and government policies in the markets in which Sony and its third-party suppliers, service providers and business partners operate, including those related to taxation, as well as growing consumer focus on corporate social responsibility; (vi) Sony’s continued ability to identify the products, services and market trends with significant growth potential, to devote sufficient resources to research and development, to prioritize investments and capital expenditures correctly and to recoup its investments and capital expenditures, including those required for technology development and product capacity; (vii) Sony’s reliance on external business partners, including for the procurement of parts, components, software and network services for its products or services, the manufacturing, marketing and distribution of its products, and its other business operations; (viii) the global economic and political environment in which Sony operates and the economic and political conditions in Sony’s markets, particularly levels of consumer spending; (ix) Sony’s ability to meet operational and liquidity needs as a result of significant volatility and disruption in the global financial markets or a ratings downgrade; (x) Sony’s ability to forecast demands, manage timely procurement and control inventories; (xi) foreign exchange rates, particularly between the yen and the U.S. dollar, the euro and other currencies in which Sony makes significant sales and incurs production costs, or in which Sony’s assets, liabilities and operating results are denominated; (xii) Sony’s ability to recruit, retain and maintain productive relations with highly skilled personnel; (xiii) Sony’s ability to prevent unauthorized use or theft of intellectual property rights, to obtain or renew licenses relating to intellectual property rights and to defend itself against claims that its products or services infringe the intellectual property rights owned by others; (xiv) the impact of changes in interest rates and unfavorable conditions or developments (including market fluctuations or volatility) in the equity and bond markets on the revenue and operating income of the Financial Services business; (xv) shifts in customer demand for financial services such as life insurance and Sony’s ability to conduct successful asset liability management in the Financial Services business; (xvi) risks related to catastrophic disasters, geopolitical conflicts, pandemic disease or similar events; (xvii) the ability of Sony, its third-party service providers or business partners to anticipate and manage cybersecurity risk, including the risk of unauthorized access to Sony’s business information and the personally identifiable information of its employees and customers, potential business disruptions or financial losses; and (xviii) the outcome of pending and/or future legal and/or regulatory proceedings. Risks and uncertainties also include the impact of any future events with material adverse impact. The continued impact of developments relating to the situations in Ukraine and Russia and in the Middle East, as well as the series of changes in U.S. tariff policy, could heighten many of the risks and uncertainties noted above. Important information regarding risks and uncertainties is also set forth in Sony’s most recent Form 20-F, which is on file with the U.S. Securities and Exchange Commission. |