
Q2 2026 EARNINGS INVESTOR PRESENTATION July 28, 2026
22Q26 Earnings Investor Presentation First Busey Corporation | Ticker: BUSE This presentation may contain “forward-looking statements” within the meaning of the Private Securities Litigation Reform Act of 1995, Section 27A of the Securities Act of 1933, as amended, and Section 21E of the Securities Exchange Act of 1934, as amended, with respect to First Busey Corporation’s (“Busey’s”) financial condition, results of operations, plans, objectives, future performance, and business. Forward-looking statements, which may be based upon beliefs, expectations and assumptions of Busey’s management and on information currently available to management, are generally identifiable by the use of words such as “believe,” “expect,” “anticipate,” “plan,” “intend,” “estimate,” “may,” “will,” “would,” “could,” “should,” “position,” or other similar expressions. Additionally, all statements in this document, including forward-looking statements, speak only as of the date they are made, and Busey undertakes no obligation to update any statement in light of new information or future events. A number of factors, many of which are beyond Busey’s ability to control or predict, could cause actual results to differ materially from those in any forward-looking statements. These factors include, among others, the following: (1) the strength of the local, state, national, and international economies and financial markets (including effects of inflationary pressures, the threat or implementation of tariffs, trade wars, and changes to immigration policy); (2) changes in, and the interpretation and prioritization of, local, state, and federal laws, regulations, and governmental policies (including those concerning Busey's general business); (3) the economic impact of any future terrorist threats or attacks, widespread disease or pandemics, military conflicts, acts of war or threats thereof, or other adverse external events that could increase levels of political and economic unpredictability, contribute to rising energy and commodity prices, affect global supply chains, increase the volatility of financial markets, and other matters beyond our control (including the conflicts in the Middle East and Russia’s invasion of Ukraine); (4) unexpected results of acquisitions, including the acquisition of CrossFirst, which may include the failure to realize the anticipated benefits of the acquisitions and the possibility that the transaction and integration costs may be greater than anticipated; (5) the imposition of tariffs or other governmental policies impacting the value of products produced by Busey's commercial borrowers; (6) the impact of bank failures or adverse developments at other banks and related negative publicity about the banking industry, including investor and depositor sentiment regarding bank stability and liquidity; (7) new or revised accounting policies and practices as may be adopted by state and federal regulatory banking agencies, the Financial Accounting Standards Board, the Securities and Exchange Commission, or the Public Company Accounting Oversight Board; (8) changes in interest rates and prepayment rates of Busey’s assets (including the impact of sustained elevated interest rates); (9) increased competition in the financial services sector (including from non-bank competitors such as credit unions, digital asset service providers, private credit, and fintech companies) and the inability to attract new customers; (10) technological changes implemented by us and other parties, including our third-party vendors, which may have unforeseen consequences to us and our customers, including the development and implementation of tools incorporating artificial intelligence; (11) the loss of key executives or associates, talent shortages, and employee turnover; (12) unexpected outcomes and costs of existing or new litigation, investigations, or other legal proceedings, inquiries, and regulatory actions involving Busey (including with respect to Busey’s Illinois franchise taxes); (13) fluctuations in the value of securities held in Busey’s securities portfolio, including as a result of changes in interest rates; (14) credit risk and risk from concentrations (by type of borrower, geographic area, collateral, and industry), within Busey's loan portfolio and large loans to certain borrowers (including commercial real estate loans); (15) the concentration of large deposits from certain clients who have balances above current Federal Deposit Insurance Corporation insurance limits and may withdraw deposits to diversify their exposure; (16) the level of non-performing assets on Busey’s balance sheets; (17) interruptions involving information technology and communications systems or third-party servicers; (18) breaches or failures of information security controls or cybersecurity-related incidents; (19) the availability of future equity and debt issuances and other capital raising opportunities on favorable terms; (20) the economic impact on Busey and its customers of climate change, natural disasters, and exceptional weather occurrences such as tornadoes, hurricanes, floods, blizzards, and droughts; (21) the ability to successfully manage liquidity risk, which may increase dependence on non-core funding sources such as brokered deposits, and may negatively impact Busey's cost of funds; (22) the ability to maintain an adequate level of allowance for credit losses on loans; (23) the effectiveness of Busey’s risk management framework; and (24) the ability of Busey to manage the risks associated with the foregoing. These risks and uncertainties should be considered in evaluating forward-looking statements and undue reliance should not be placed on such statements. Additional information concerning Busey and its business, including additional factors that could materially affect Busey’s financial results, is included in Busey’s filings with the Securities and Exchange Commission. Forward-Looking Statements
32Q26 Earnings Investor Presentation First Busey Corporation | Ticker: BUSE Table of Contents Overview of First Busey Corporation (BUSE) 4 2Q26 Review 5 Investment Highlights 6 Earnings Performance 7 Strategically Configured Regional Operating Model 8 High Quality Loan Portfolio 9 Pristine Credit Quality 10 Top Tier Core Deposit Franchise 11 Net Interest Margin 12 Diversified and Significant Sources of Noninterest Income 13 Wealth Management 14-15 Focused Control on Expenses 16 Robust Capital Foundation 17 Appendix: 18 Seasoned Leadership Team 19 Purchase Accounting Projections 20 Non-GAAP Financial Information 21
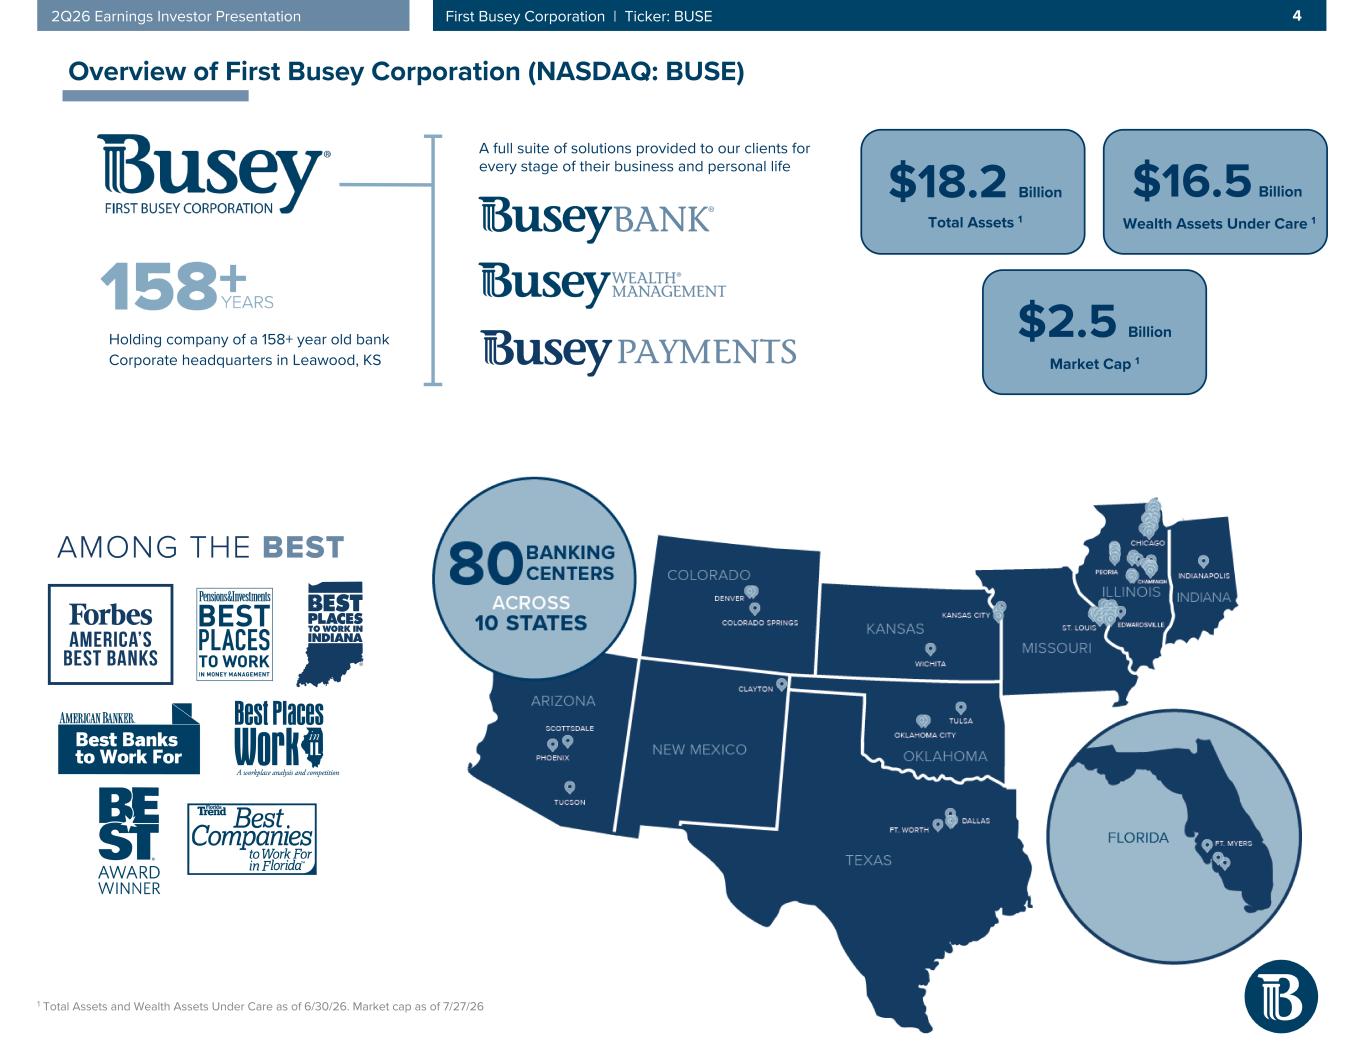
42Q26 Earnings Investor Presentation First Busey Corporation | Ticker: BUSE Overview of First Busey Corporation (NASDAQ: BUSE) Holding company of a 158+ year old bank Corporate headquarters in Leawood, KS $18.2 Billion Total Assets 1 $16.5 Billion Wealth Assets Under Care 1 $2.5 Billion Market Cap 1 1 Total Assets and Wealth Assets Under Care as of 6/30/26. Market cap as of 7/27/26 A full suite of solutions provided to our clients for every stage of their business and personal life
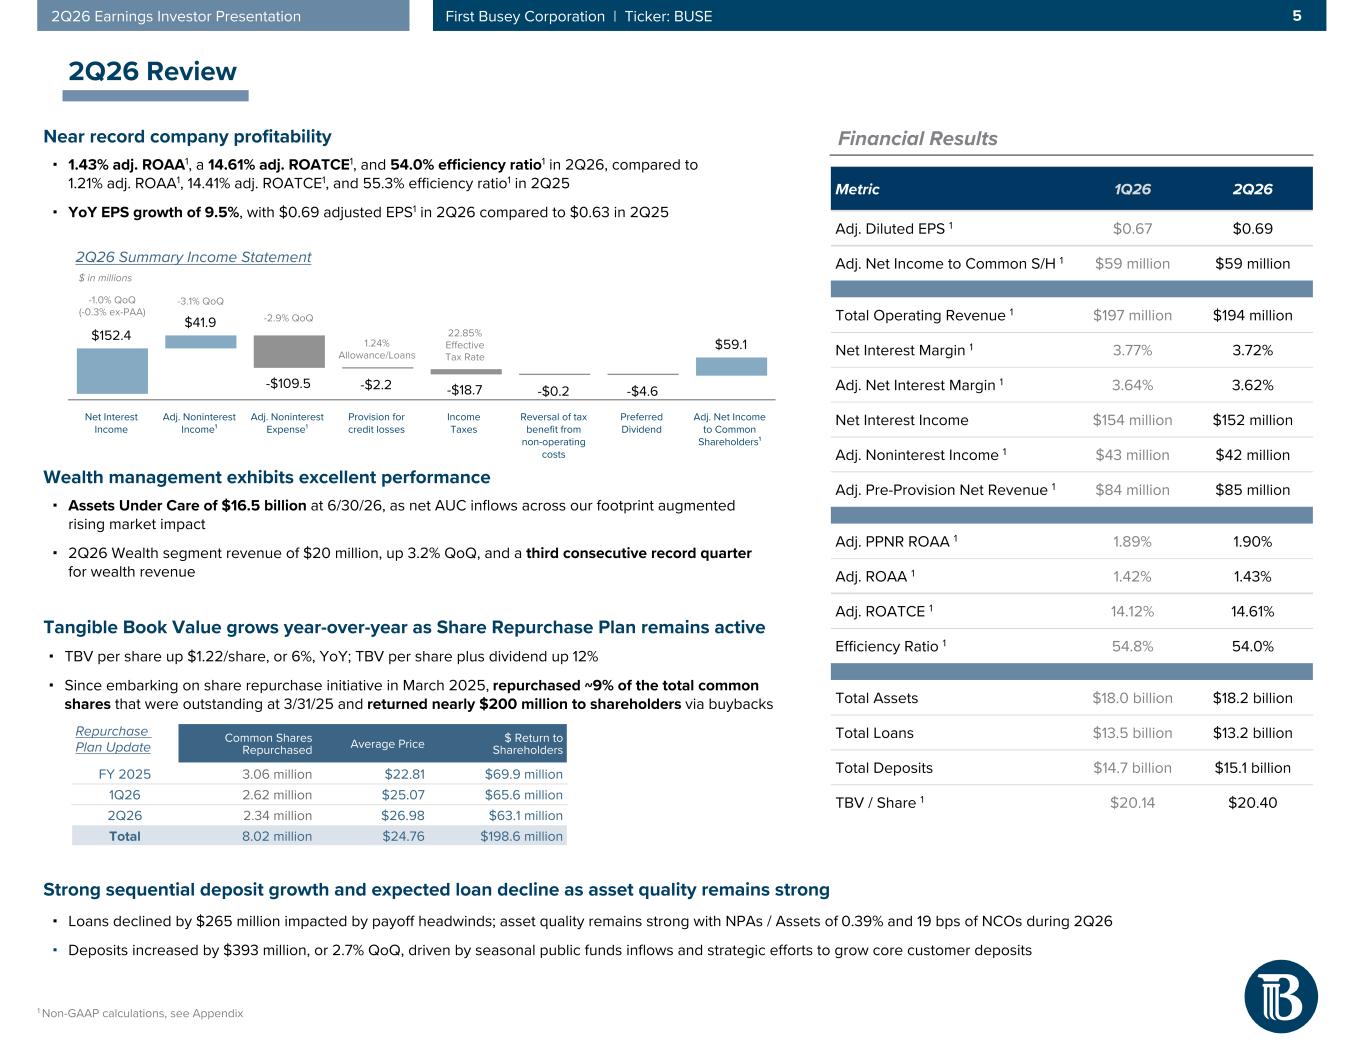
52Q26 Earnings Investor Presentation First Busey Corporation | Ticker: BUSE 1 Non-GAAP calculations, see Appendix 2Q26 Review Financial Results Metric 1Q26 2Q26 Adj. Diluted EPS 1 $0.67 $0.69 Adj. Net Income to Common S/H 1 $59 million $59 million Total Operating Revenue 1 $197 million $194 million Net Interest Margin 1 3.77% 3.72% Adj. Net Interest Margin 1 3.64% 3.62% Net Interest Income $154 million $152 million Adj. Noninterest Income 1 $43 million $42 million Adj. Pre-Provision Net Revenue 1 $84 million $85 million Adj. PPNR ROAA 1 1.89% 1.90% Adj. ROAA 1 1.42% 1.43% Adj. ROATCE 1 14.12% 14.61% Efficiency Ratio 1 54.8% 54.0% Total Assets $18.0 billion $18.2 billion Total Loans $13.5 billion $13.2 billion Total Deposits $14.7 billion $15.1 billion TBV / Share 1 $20.14 $20.40 ▪ Assets Under Care of $16.5 billion at 6/30/26, as net AUC inflows across our footprint augmented rising market impact ▪ 2Q26 Wealth segment revenue of $20 million, up 3.2% QoQ, and a third consecutive record quarter for wealth revenue Wealth management exhibits excellent performance ▪ TBV per share up $1.22/share, or 6%, YoY; TBV per share plus dividend up 12% ▪ Since embarking on share repurchase initiative in March 2025, repurchased ~9% of the total common shares that were outstanding at 3/31/25 and returned nearly $200 million to shareholders via buybacks Tangible Book Value grows year-over-year as Share Repurchase Plan remains active ▪ Loans declined by $265 million impacted by payoff headwinds; asset quality remains strong with NPAs / Assets of 0.39% and 19 bps of NCOs during 2Q26 ▪ Deposits increased by $393 million, or 2.7% QoQ, driven by seasonal public funds inflows and strategic efforts to grow core customer deposits Strong sequential deposit growth and expected loan decline as asset quality remains strong ▪ 1.43% adj. ROAA1, a 14.61% adj. ROATCE1, and 54.0% efficiency ratio1 in 2Q26, compared to 1.21% adj. ROAA1, 14.41% adj. ROATCE1, and 55.3% efficiency ratio1 in 2Q25 ▪ YoY EPS growth of 9.5%, with $0.69 adjusted EPS1 in 2Q26 compared to $0.63 in 2Q25 Near record company profitability $152.4 $41.9 -$109.5 -$2.2 -$18.7 -$0.2 -$4.6 $59.1 Net Interest Income Adj. Noninterest Income¹ Adj. Noninterest Expense¹ Provision for credit losses Income Taxes Reversal of tax benefit from non-operating costs Preferred Dividend Adj. Net Income to Common Shareholders¹ 2Q26 Summary Income Statement 22.85% Effective Tax Rate 1.24% Allowance/Loans $ in millions Common Shares Repurchased Average Price $ Return to Shareholders FY 2025 3.06 million $22.81 $69.9 million 1Q26 2.62 million $25.07 $65.6 million 2Q26 2.34 million $26.98 $63.1 million Total 8.02 million $24.76 $198.6 million Repurchase Plan Update -1.0% QoQ (-0.3% ex-PAA) -3.1% QoQ -2.9% QoQ
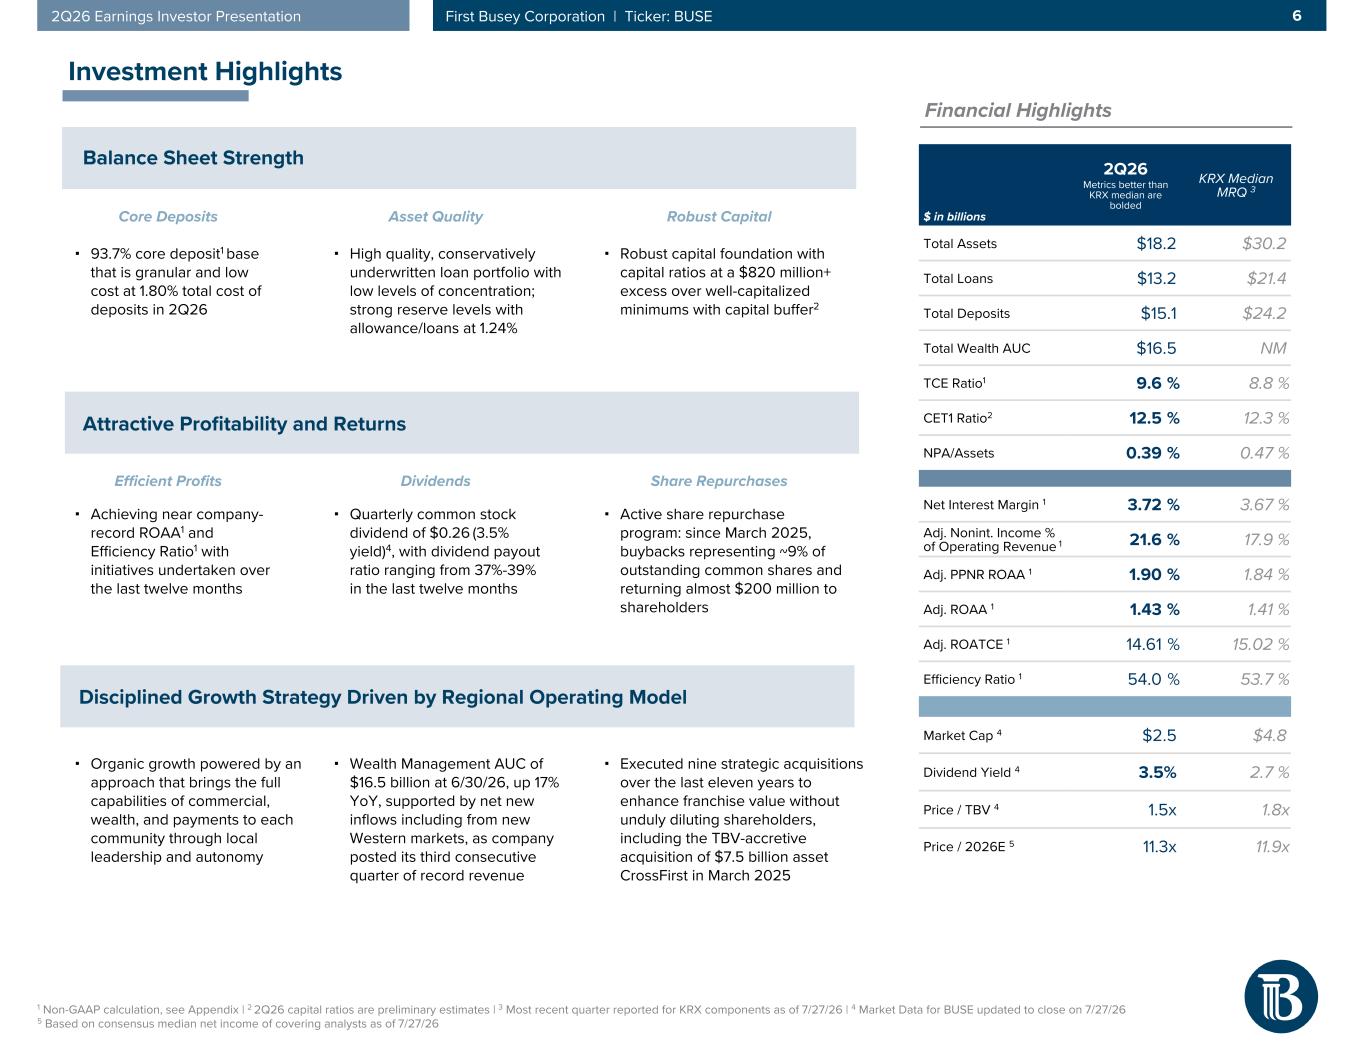
62Q26 Earnings Investor Presentation First Busey Corporation | Ticker: BUSE Attractive Profitability and Returns Disciplined Growth Strategy Driven by Regional Operating Model Balance Sheet Strength 1 Non-GAAP calculation, see Appendix | 2 2Q26 capital ratios are preliminary estimates | 3 Most recent quarter reported for KRX components as of 7/27/26 | 4 Market Data for BUSE updated to close on 7/27/26 5 Based on consensus median net income of covering analysts as of 7/27/26 Investment Highlights ▪ Achieving near company- record ROAA1 and Efficiency Ratio1 with initiatives undertaken over the last twelve months ▪ Organic growth powered by an approach that brings the full capabilities of commercial, wealth, and payments to each community through local leadership and autonomy $ in billions 2Q26 Metrics better than KRX median are bolded KRX Median MRQ 3 Total Assets $18.2 $30.2 Total Loans $13.2 $21.4 Total Deposits $15.1 $24.2 Total Wealth AUC $16.5 NM TCE Ratio1 9.6 % 8.8 % CET1 Ratio2 12.5 % 12.3 % NPA/Assets 0.39 % 0.47 % Net Interest Margin 1 3.72 % 3.67 % Adj. Nonint. Income % of Operating Revenue 1 21.6 % 17.9 % Adj. PPNR ROAA 1 1.90 % 1.84 % Adj. ROAA 1 1.43 % 1.41 % Adj. ROATCE 1 14.61 % 15.02 % Efficiency Ratio 1 54.0 % 53.7 % Market Cap 4 $2.5 $4.8 Dividend Yield 4 3.5% 2.7 % Price / TBV 4 1.5x 1.8x Price / 2026E 5 11.3x 11.9x Financial Highlights Core Deposits Asset Quality Robust Capital Efficient Profits Dividends Share Repurchases ▪ 93.7% core deposit1 base that is granular and low cost at 1.80% total cost of deposits in 2Q26 ▪ Robust capital foundation with capital ratios at a $820 million+ excess over well-capitalized minimums with capital buffer2 ▪ High quality, conservatively underwritten loan portfolio with low levels of concentration; strong reserve levels with allowance/loans at 1.24% ▪ Active share repurchase program: since March 2025, buybacks representing ~9% of outstanding common shares and returning almost $200 million to shareholders ▪ Quarterly common stock dividend of $0.26 (3.5% yield)4, with dividend payout ratio ranging from 37%-39% in the last twelve months ▪ Executed nine strategic acquisitions over the last eleven years to enhance franchise value without unduly diluting shareholders, including the TBV-accretive acquisition of $7.5 billion asset CrossFirst in March 2025 ▪ Wealth Management AUC of $16.5 billion at 6/30/26, up 17% YoY, supported by net new inflows including from new Western markets, as company posted its third consecutive quarter of record revenue
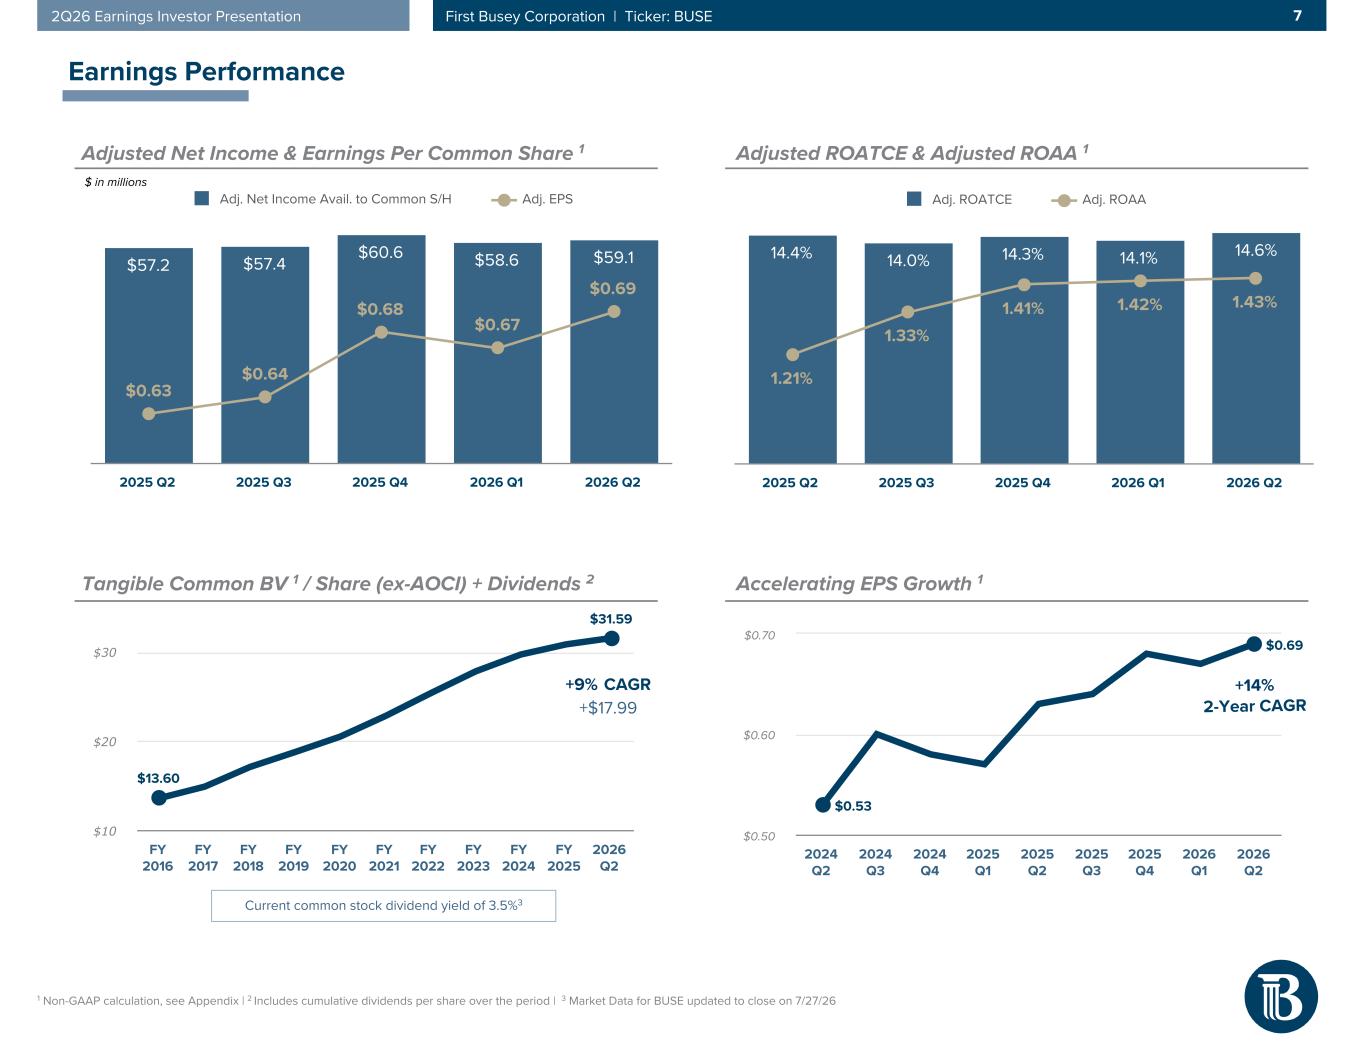
72Q26 Earnings Investor Presentation First Busey Corporation | Ticker: BUSE $13.60 $31.59 FY 2016 FY 2017 FY 2018 FY 2019 FY 2020 FY 2021 FY 2022 FY 2023 FY 2024 FY 2025 2026 Q2 $10 $20 $30 $57.2 $57.4 $60.6 $58.6 $59.1 $0.63 $0.64 $0.68 $0.67 $0.69 Adj. Net Income Avail. to Common S/H Adj. EPS 2025 Q2 2025 Q3 2025 Q4 2026 Q1 2026 Q2 14.4% 14.0% 14.3% 14.1% 14.6% 1.21% 1.33% 1.41% 1.42% 1.43% Adj. ROATCE Adj. ROAA 2025 Q2 2025 Q3 2025 Q4 2026 Q1 2026 Q2 1 Non-GAAP calculation, see Appendix | 2 Includes cumulative dividends per share over the period | 3 Market Data for BUSE updated to close on 7/27/26 Earnings Performance Adjusted Net Income & Earnings Per Common Share 1 Adjusted ROATCE & Adjusted ROAA 1 $ in millions $0.53 $0.69 2024 Q2 2024 Q3 2024 Q4 2025 Q1 2025 Q2 2025 Q3 2025 Q4 2026 Q1 2026 Q2 $0.50 $0.60 $0.70 Accelerating EPS Growth 1 +9% CAGR +$17.99 Current common stock dividend yield of 3.5%3 Tangible Common BV 1 / Share (ex-AOCI) + Dividends 2 +14% 2-Year CAGR
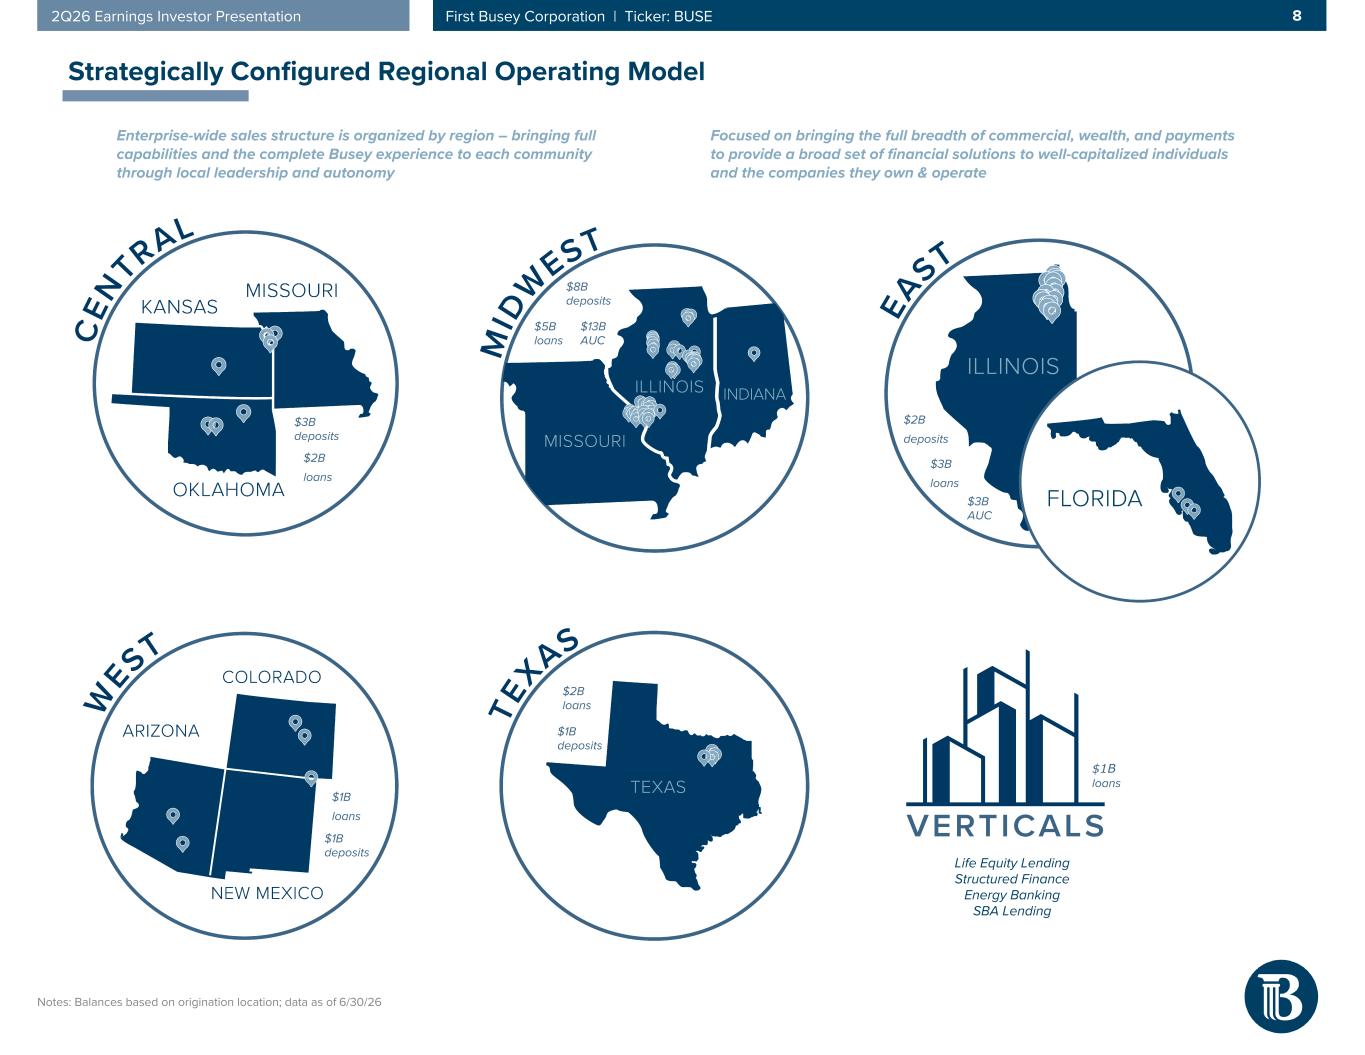
82Q26 Earnings Investor Presentation First Busey Corporation | Ticker: BUSE Strategically Configured Regional Operating Model Focused on bringing the full breadth of commercial, wealth, and payments to provide a broad set of financial solutions to well-capitalized individuals and the companies they own & operate Life Equity Lending Structured Finance Energy Banking SBA Lending $8B deposits $2B deposits $5B loans $13B AUC $3B AUC $3B loans $3B deposits $2B loans $1B deposits $1B loans $1B deposits $2B loans $1B loans Enterprise-wide sales structure is organized by region – bringing full capabilities and the complete Busey experience to each community through local leadership and autonomy Notes: Balances based on origination location; data as of 6/30/26
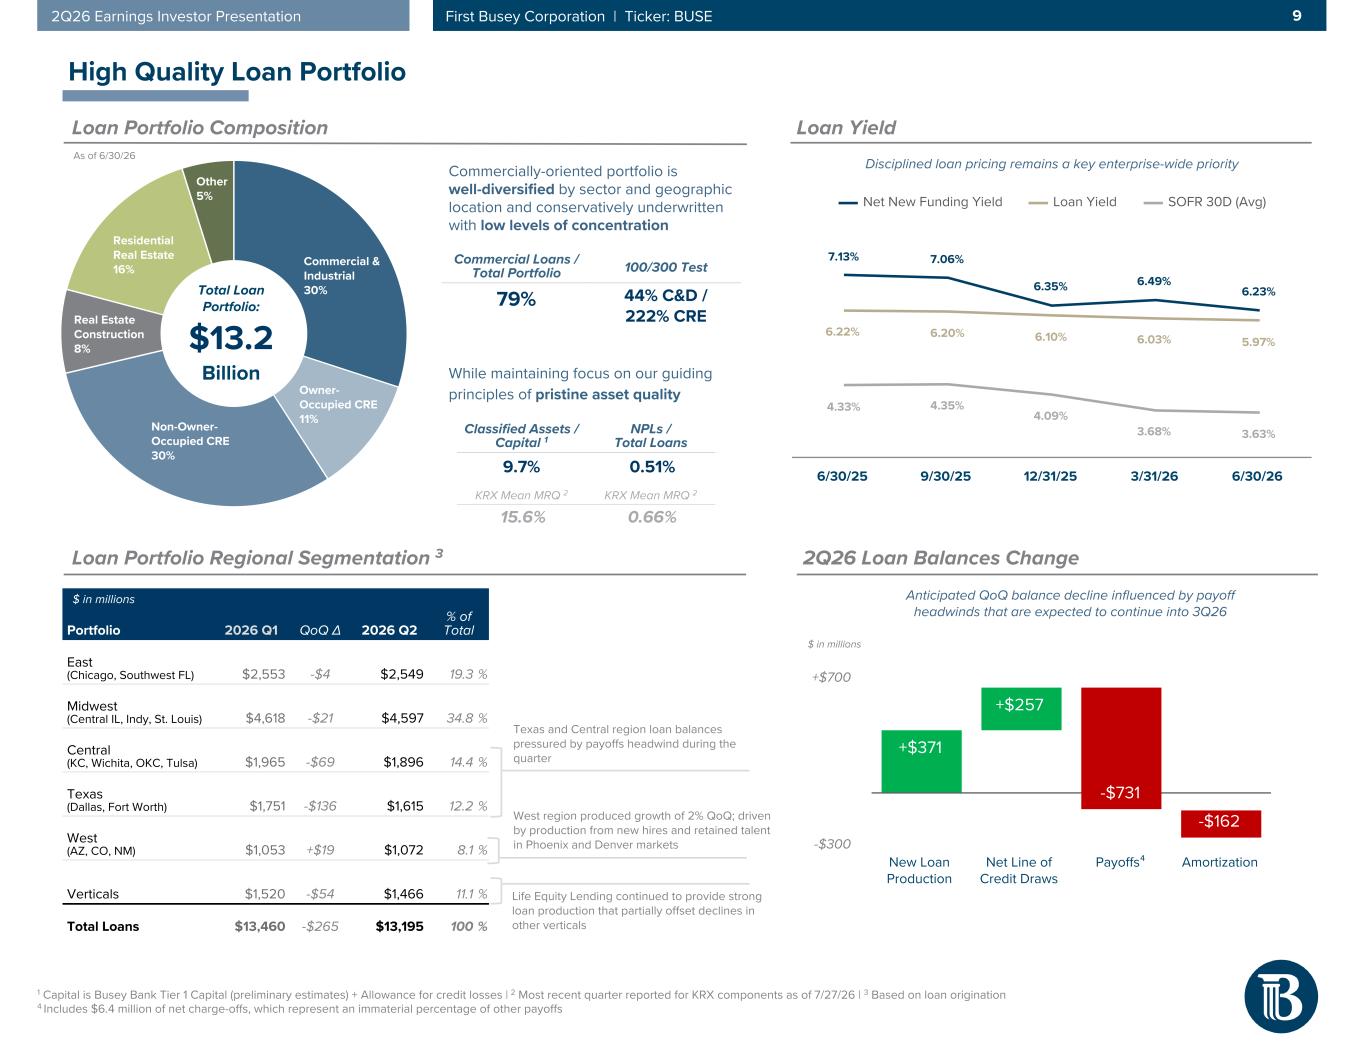
92Q26 Earnings Investor Presentation First Busey Corporation | Ticker: BUSE Commercial & Industrial 30% Owner- Occupied CRE 11%Non-Owner- Occupied CRE 30% Real Estate Construction 8% Residential Real Estate 16% Other 5% 1 Capital is Busey Bank Tier 1 Capital (preliminary estimates) + Allowance for credit losses | 2 Most recent quarter reported for KRX components as of 7/27/26 | 3 Based on loan origination 4 Includes $6.4 million of net charge-offs, which represent an immaterial percentage of other payoffs Classified Assets / Capital 1 NPLs / Total Loans 9.7% 0.51% KRX Mean MRQ 2 KRX Mean MRQ 2 15.6% 0.66% High Quality Loan Portfolio Loan Portfolio Regional Segmentation 3 Loan Portfolio Composition Total Loan Portfolio: $13.2 Billion Commercially-oriented portfolio is well-diversified by sector and geographic location and conservatively underwritten with low levels of concentration Portfolio 2026 Q1 QoQ ∆ 2026 Q2 % of Total East (Chicago, Southwest FL) $2,553 -$4 $2,549 19.3 % Midwest (Central IL, Indy, St. Louis) $4,618 -$21 $4,597 34.8 % Central (KC, Wichita, OKC, Tulsa) $1,965 -$69 $1,896 14.4 % Texas (Dallas, Fort Worth) $1,751 -$136 $1,615 12.2 % West (AZ, CO, NM) $1,053 +$19 $1,072 8.1 % Verticals $1,520 -$54 $1,466 11.1 % Total Loans $13,460 -$265 $13,195 100 % West region produced growth of 2% QoQ; driven by production from new hires and retained talent in Phoenix and Denver markets $ in millions 7.13% 7.06% 6.35% 6.49% 6.23% 6.22% 6.20% 6.10% 6.03% 5.97% 4.33% 4.35% 4.09% 3.68% 3.63% Net New Funding Yield Loan Yield SOFR 30D (Avg) 6/30/25 9/30/25 12/31/25 3/31/26 6/30/26 Loan Yield While maintaining focus on our guiding principles of pristine asset quality +$371 +$257 -$731 -$162 New Loan Production Net Line of Credit Draws Payoffs⁴ Amortization -$300 +$700 Commercial Loans / Total Portfolio 79% 100/300 Test 44% C&D / 222% CRE 2Q26 Loan Balances Change Life Equity Lending continued to provide strong loan production that partially offset declines in other verticals Disciplined loan pricing remains a key enterprise-wide priority Anticipated QoQ balance decline influenced by payoff headwinds that are expected to continue into 3Q26 $ in millions As of 6/30/26 Texas and Central region loan balances pressured by payoffs headwind during the quarter
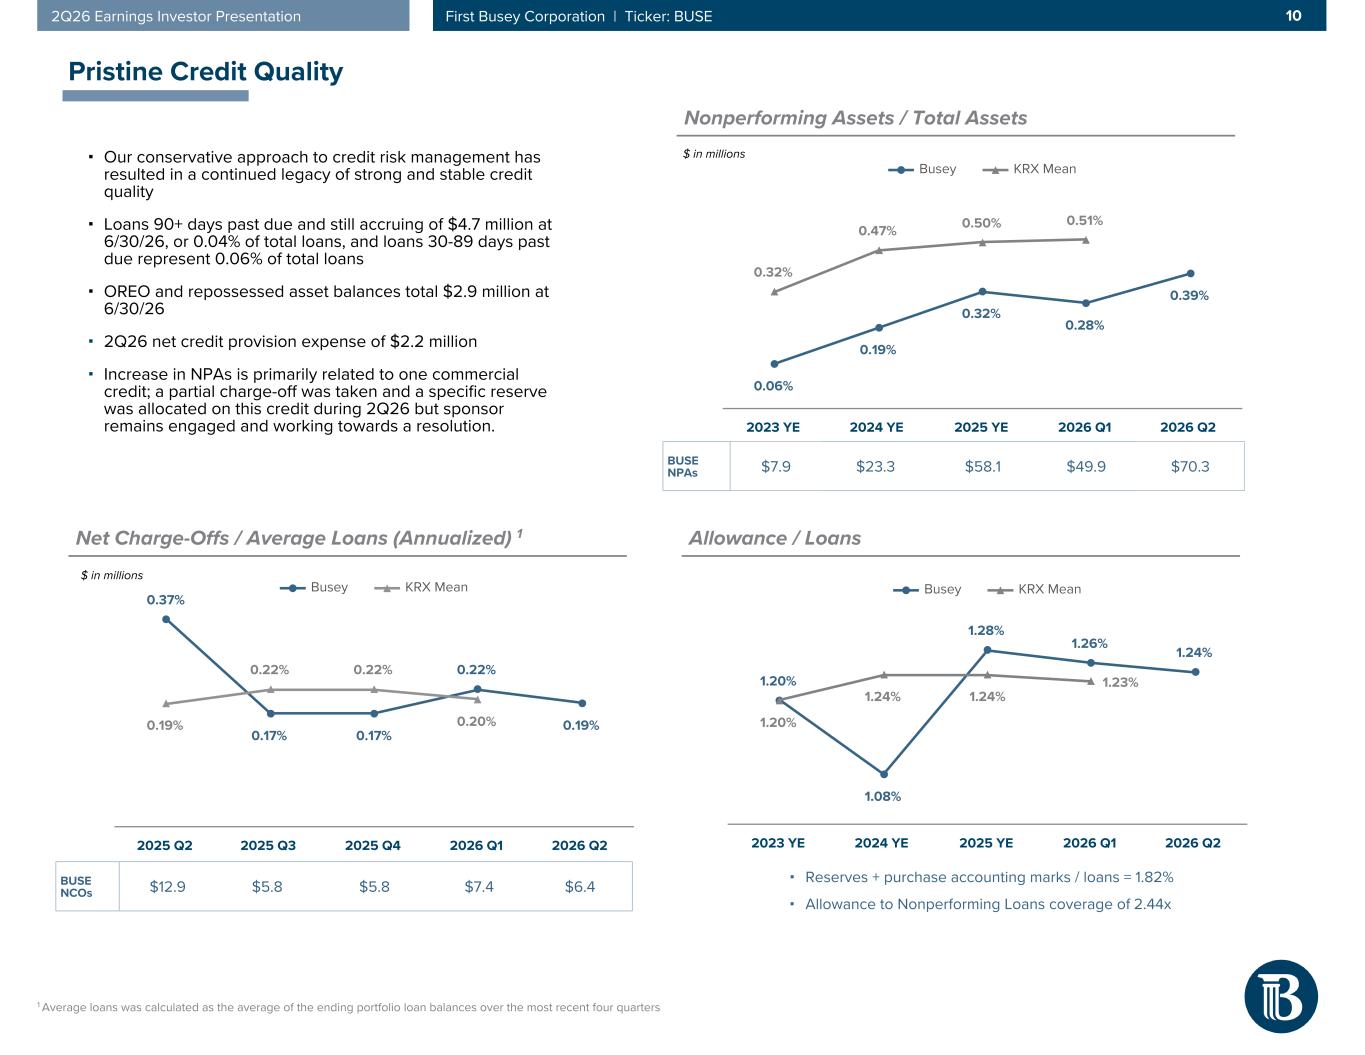
102Q26 Earnings Investor Presentation First Busey Corporation | Ticker: BUSE ▪ Our conservative approach to credit risk management has resulted in a continued legacy of strong and stable credit quality ▪ Loans 90+ days past due and still accruing of $4.7 million at 6/30/26, or 0.04% of total loans, and loans 30-89 days past due represent 0.06% of total loans ▪ OREO and repossessed asset balances total $2.9 million at 6/30/26 ▪ 2Q26 net credit provision expense of $2.2 million ▪ Increase in NPAs is primarily related to one commercial credit; a partial charge-off was taken and a specific reserve was allocated on this credit during 2Q26 but sponsor remains engaged and working towards a resolution. 1 Average loans was calculated as the average of the ending portfolio loan balances over the most recent four quarters Pristine Credit Quality Nonperforming Assets / Total Assets Net Charge-Offs / Average Loans (Annualized) 1 0.06% 0.19% 0.32% 0.28% 0.39% 0.32% 0.47% 0.50% 0.51% Busey KRX Mean 2023 YE 2024 YE 2025 YE 2026 Q1 2026 Q2 $ in millions $ in millions BUSE NPAs $7.9 $23.3 $58.1 $49.9 $70.3 BUSE NCOs $12.9 $5.8 $5.8 $7.4 $6.4 0.37% 0.17% 0.17% 0.22% 0.19%0.19% 0.22% 0.22% 0.20% Busey KRX Mean 2025 Q2 2025 Q3 2025 Q4 2026 Q1 2026 Q2 ▪ Reserves + purchase accounting marks / loans = 1.82% ▪ Allowance to Nonperforming Loans coverage of 2.44x Allowance / Loans 1.20% 1.08% 1.28% 1.26% 1.24% 1.20% 1.24% 1.24% 1.23% Busey KRX Mean 2023 YE 2024 YE 2025 YE 2026 Q1 2026 Q2
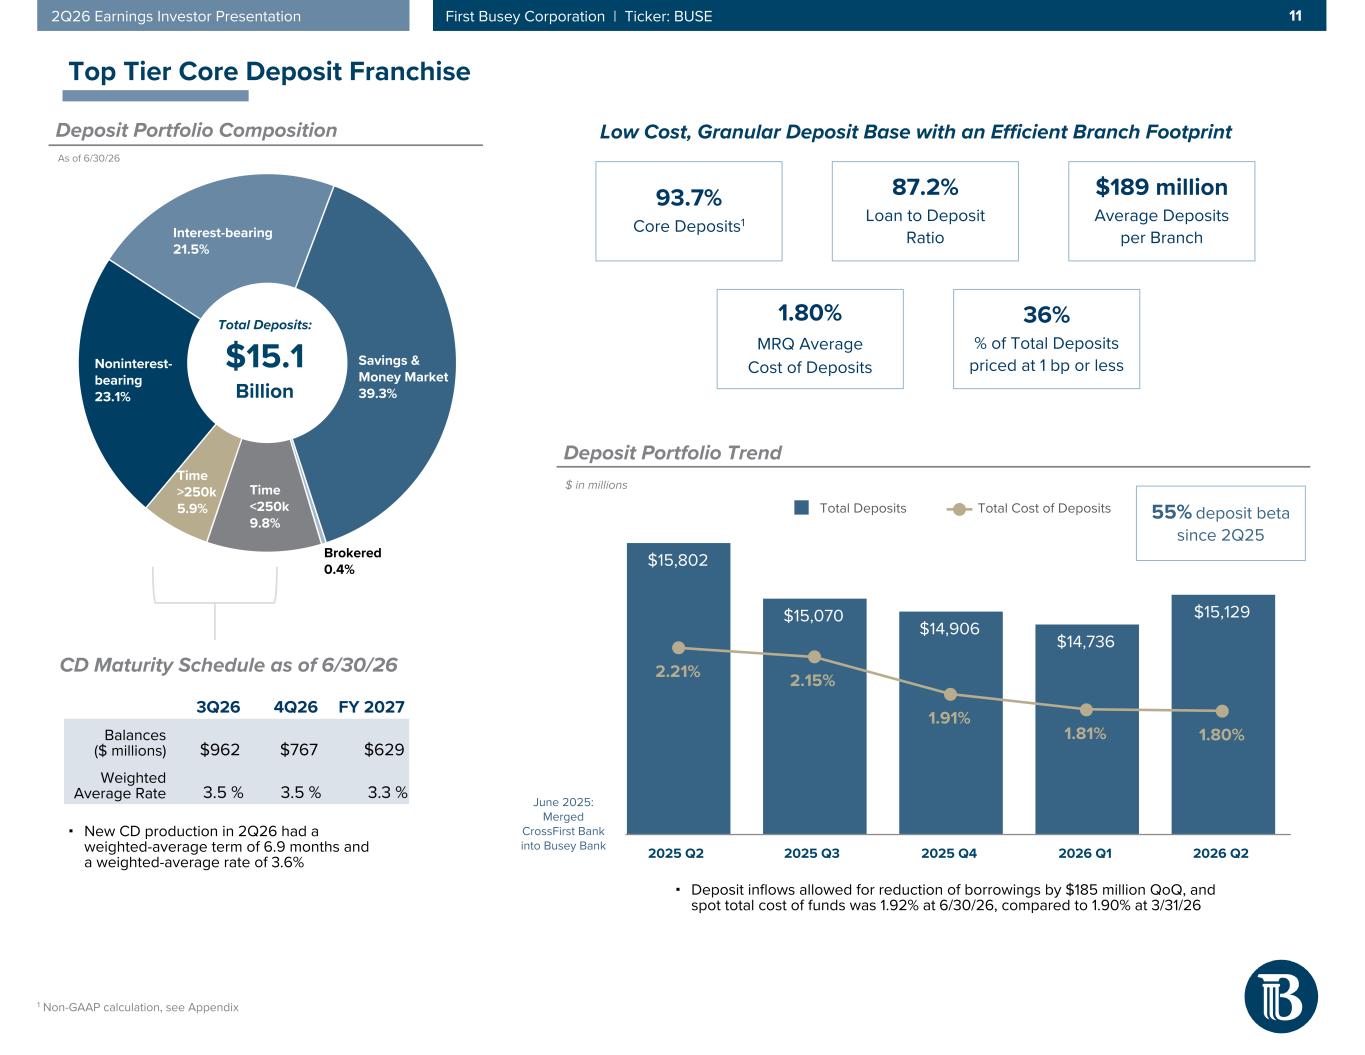
112Q26 Earnings Investor Presentation First Busey Corporation | Ticker: BUSE $15,802 $15,070 $14,906 $14,736 $15,129 2.21% 2.15% 1.91% 1.81% 1.80% Total Deposits Total Cost of Deposits 2025 Q2 2025 Q3 2025 Q4 2026 Q1 2026 Q2 Midwest region, particularly Edwardsville market, impacted positively by seasonal public funds; more than offsetting retail tax outflows Noninterest- bearing 23.1% Interest-bearing 21.5% Savings & Money Market 39.3% Brokered 0.4% Time <250k 9.8% Time >250k 5.9% 1 Non-GAAP calculation, see Appendix Top Tier Core Deposit Franchise Deposit Portfolio Composition Total Deposits: $15.1 Billion Deposit Portfolio Regional Segmentation Portfolio 2026 Q1 QoQ ∆ 2026 Q2 % of Total East (Chicago, Southwest FL)2 $2,410 -$32 $2,378 15.7 % Midwest (Central IL, Indy, St. Louis)2 $7,698 +$143 $7,841 51.8 % Central (KC, Wichita, OKC, Tulsa) $2,965 +$350 $3,315 21.9 % Texas (Dallas, Fort Worth) $698 -$27 $671 4.4 % West (AZ, CO, NM) $803 -$8 $795 5.3 % Verticals $162 -$33 $129 0.9 % Total Deposits $14,736 +$393 $15,129 100 % $ in millions 55% deposit beta since 2Q25 June 2025: Merged CrossFirst Bank into Busey Bank As of 6/30/26 ▪ Deposit inflows allowed for reduction of borrowings by $185 million QoQ, and spot total cost of funds was 1.92% at 6/30/26, compared to 1.90% at 3/31/26 3Q26 4Q26 FY 2027 Balances ($ millions) $962 $767 $629 Weighted Average Rate 3.5 % 3.5 % 3.3 % CD Maturity Schedule as of 6/30/26 Central was the beneficiary of targeted initiatives to bring more deposits on-balance sheet Retail 52% Commercial 41% Public 7% Brokered 0% Average Customer Tenure Retail 11.1 years Commercial 17.0 years Public 20.7 years ▪ New CD production in 2Q26 had a weighted-average term of 6.9 months and a weighted-average rate of 3.6% $189 million Average Deposits per Branch Low Cost, Granular Deposit Base with an Efficient Branch Footprint 87.2% Loan to Deposit Ratio 93.7% Core Deposits1 1.80% MRQ Average Cost of Deposits 36% % of Total Deposits priced at 1 bp or less Deposit Portfolio Trend $ in millions
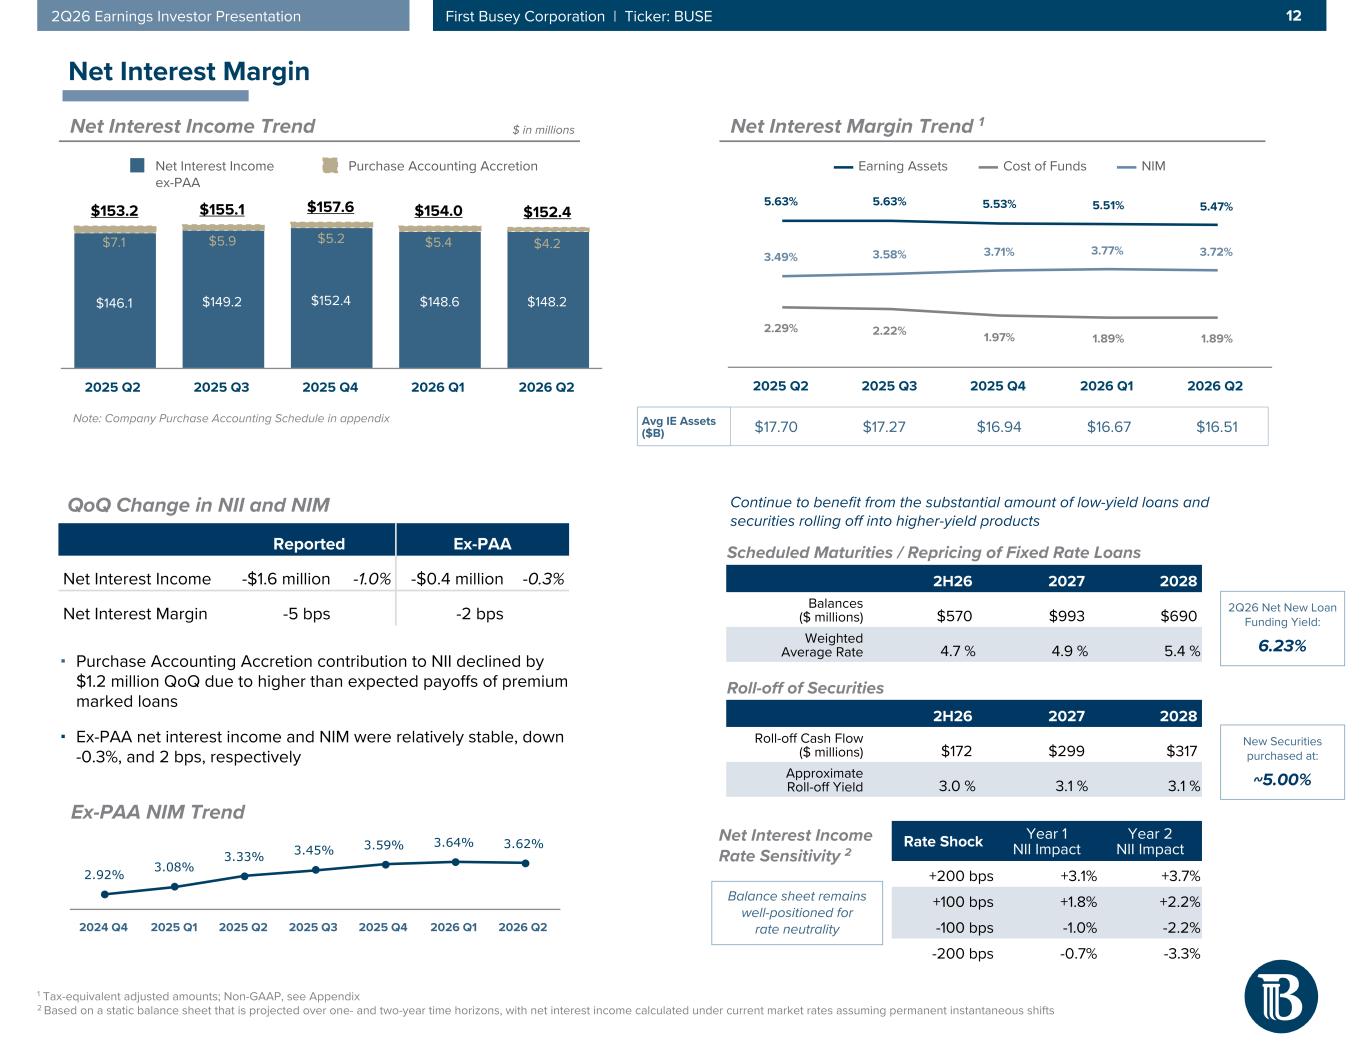
122Q26 Earnings Investor Presentation First Busey Corporation | Ticker: BUSE $153.2 $155.1 $157.6 $154.0 $152.4 $146.1 $149.2 $152.4 $148.6 $148.2 $7.1 $5.9 $5.2 $5.4 $4.2 Net Interest Income ex-PAA Purchase Accounting Accretion 2025 Q2 2025 Q3 2025 Q4 2026 Q1 2026 Q2 5.63% 5.63% 5.53% 5.51% 5.47% 2.29% 2.22% 1.97% 1.89% 1.89% 3.49% 3.58% 3.71% 3.77% 3.72% Earning Assets Cost of Funds NIM 2025 Q2 2025 Q3 2025 Q4 2026 Q1 2026 Q2 1 Tax-equivalent adjusted amounts; Non-GAAP, see Appendix 2 Based on a static balance sheet that is projected over one- and two-year time horizons, with net interest income calculated under current market rates assuming permanent instantaneous shifts $ in millions Net Interest Margin Trend 1Net Interest Income Trend Net Interest Margin Note: Company Purchase Accounting Schedule in appendix Avg IE Assets ($B) $17.70 $17.27 $16.94 $16.67 $16.51 2H26 2027 2028 Roll-off Cash Flow ($ millions) $172 $299 $317 Approximate Roll-off Yield 3.0 % 3.1 % 3.1 % 2H26 2027 2028 Balances ($ millions) $570 $993 $690 Weighted Average Rate 4.7 % 4.9 % 5.4 % Scheduled Maturities / Repricing of Fixed Rate Loans Roll-off of Securities Continue to benefit from the substantial amount of low-yield loans and securities rolling off into higher-yield products 2Q26 Net New Loan Funding Yield: 6.23% New Securities purchased at: ~5.00% Net Interest Income Rate Sensitivity 2 Rate Shock Year 1 NII Impact Year 2 NII Impact +200 bps +3.1 % +3.7 % +100 bps +1.8 % +2.2 % -100 bps -1.0 % -2.2 % -200 bps -0.7 % -3.3 % Balance sheet remains well-positioned for rate neutrality Reported Ex-PAA Net Interest Income -$1.6 million -1.0% -$0.4 million -0.3% Net Interest Margin -5 bps -2 bps ▪ Purchase Accounting Accretion contribution to NII declined by $1.2 million QoQ due to higher than expected payoffs of premium marked loans ▪ Ex-PAA net interest income and NIM were relatively stable, down -0.3%, and 2 bps, respectively QoQ Change in NII and NIM 2.92% 3.08% 3.33% 3.45% 3.59% 3.64% 3.62% 2024 Q4 2025 Q1 2025 Q2 2025 Q3 2025 Q4 2026 Q1 2026 Q2 Ex-PAA NIM Trend
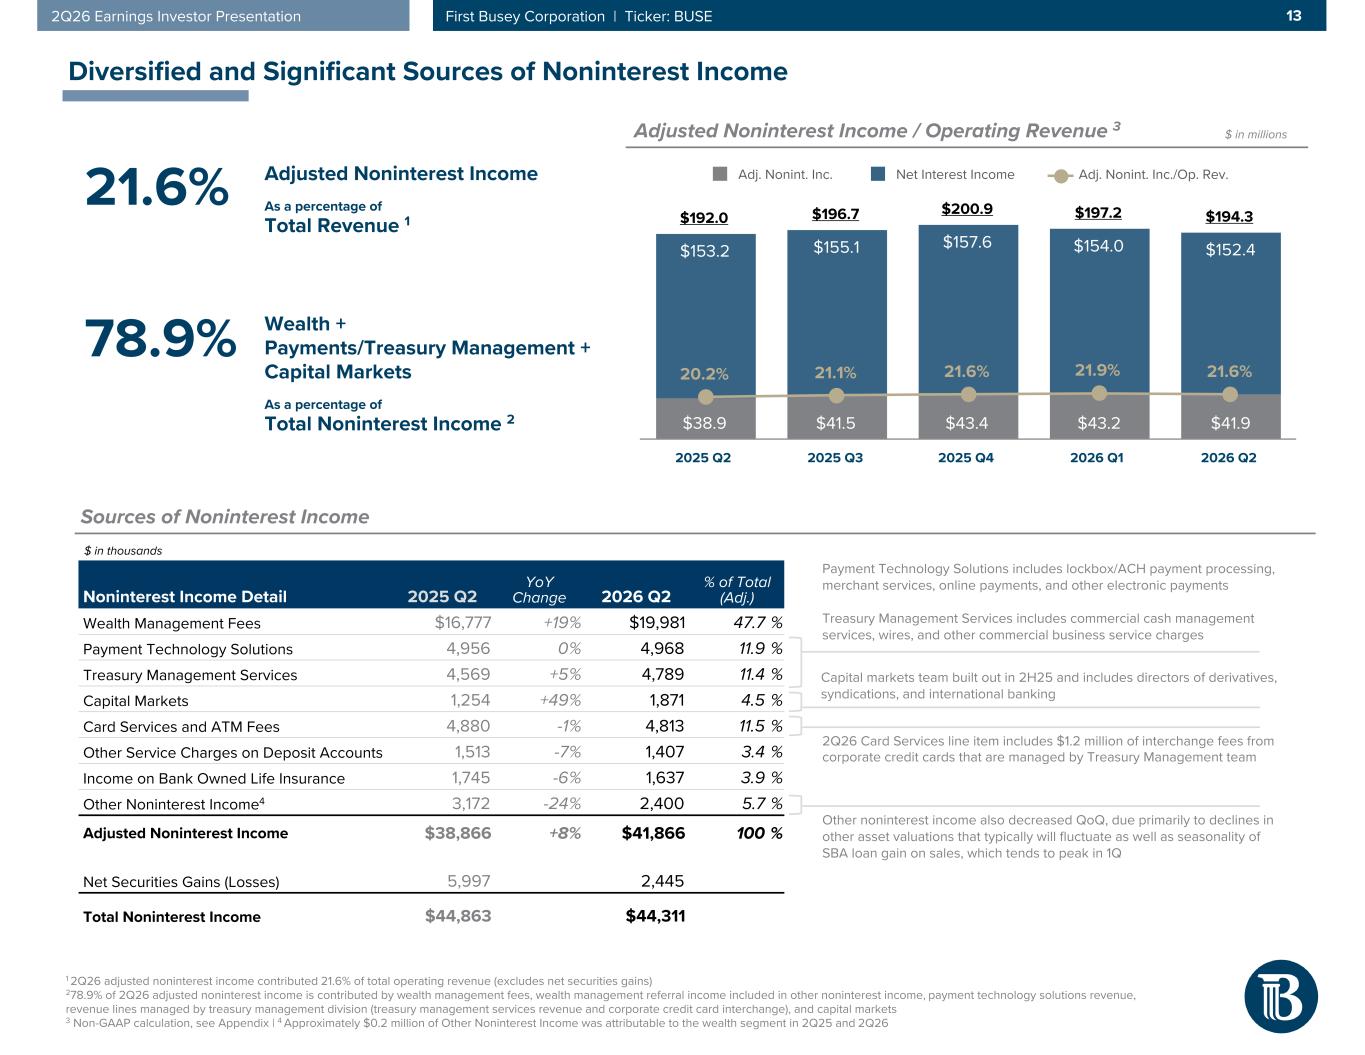
132Q26 Earnings Investor Presentation First Busey Corporation | Ticker: BUSE Payment Technology Solutions includes lockbox/ACH payment processing, merchant services, online payments, and other electronic payments Treasury Management Services includes commercial cash management services, wires, and other commercial business service charges 1 2Q26 adjusted noninterest income contributed 21.6% of total operating revenue (excludes net securities gains) 278.9% of 2Q26 adjusted noninterest income is contributed by wealth management fees, wealth management referral income included in other noninterest income, payment technology solutions revenue, revenue lines managed by treasury management division (treasury management services revenue and corporate credit card interchange), and capital markets 3 Non-GAAP calculation, see Appendix | 4 Approximately $0.2 million of Other Noninterest Income was attributable to the wealth segment in 2Q25 and 2Q26 $192.0 $196.7 $200.9 $197.2 $194.3 $38.9 $41.5 $43.4 $43.2 $41.9 $153.2 $155.1 $157.6 $154.0 $152.4 20.2% 21.1% 21.6% 21.9% 21.6% Adj. Nonint. Inc. Net Interest Income Adj. Nonint. Inc./Op. Rev. 2025 Q2 2025 Q3 2025 Q4 2026 Q1 2026 Q2 $ in millions Noninterest Income Detail 2025 Q2 YoY Change 2026 Q2 % of Total (Adj.) Wealth Management Fees $16,777 +19 % $19,981 47.7 % Payment Technology Solutions 4,956 0 % 4,968 11.9 % Treasury Management Services 4,569 +5 % 4,789 11.4 % Capital Markets 1,254 +49 % 1,871 4.5 % Card Services and ATM Fees 4,880 -1 % 4,813 11.5 % Other Service Charges on Deposit Accounts 1,513 -7 % 1,407 3.4 % Income on Bank Owned Life Insurance 1,745 -6 % 1,637 3.9 % Other Noninterest Income4 3,172 -24 % 2,400 5.7 % Adjusted Noninterest Income $38,866 +8 % $41,866 100 % Net Securities Gains (Losses) 5,997 2,445 Total Noninterest Income $44,863 -1 % $44,311 $ in thousands Adjusted Noninterest Income / Operating Revenue 3 Sources of Noninterest Income Diversified and Significant Sources of Noninterest Income Other noninterest income also decreased QoQ, due primarily to declines in other asset valuations that typically will fluctuate as well as seasonality of SBA loan gain on sales, which tends to peak in 1Q 21.6% 78.9% Wealth + Payments/Treasury Management + Capital Markets As a percentage of Total Noninterest Income 2 2Q26 Card Services line item includes $1.2 million of interchange fees from corporate credit cards that are managed by Treasury Management team Adjusted Noninterest Income As a percentage of Total Revenue 1 Capital markets team built out in 2H25 and includes directors of derivatives, syndications, and international banking
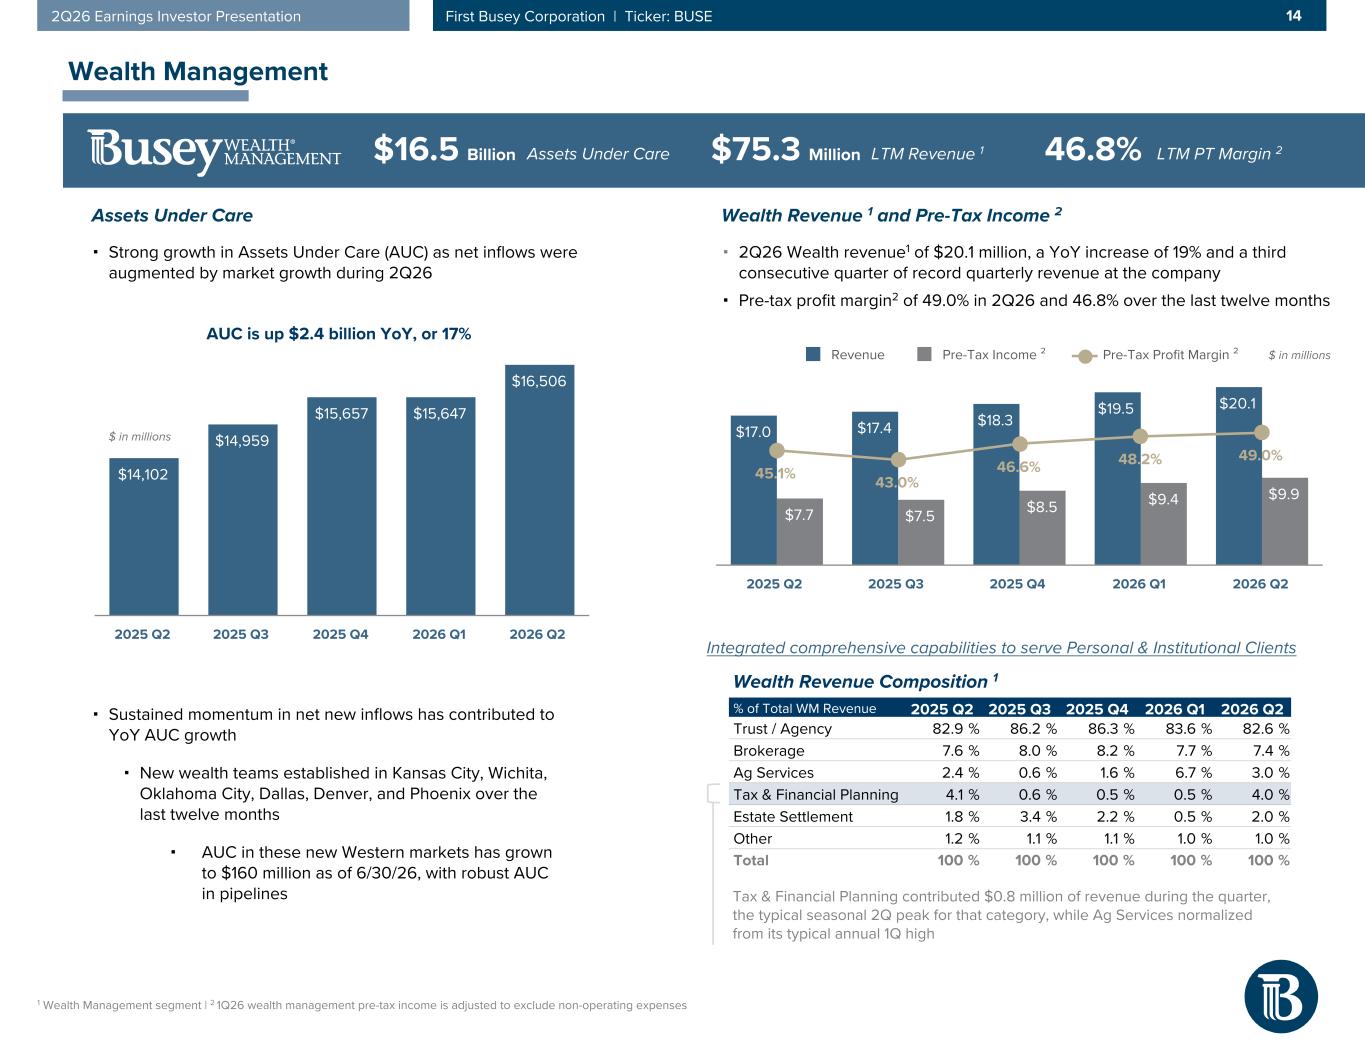
142Q26 Earnings Investor Presentation First Busey Corporation | Ticker: BUSE $17.0 $17.4 $18.3 $19.5 $20.1 $7.7 $7.5 $8.5 $9.4 $9.9 45.1% 43.0% 46.6% 48.2% 49.0% Revenue Pre-Tax Income ² Pre-Tax Profit Margin ² 2025 Q2 2025 Q3 2025 Q4 2026 Q1 2026 Q2 $14,102 $14,959 $15,657 $15,647 $16,506 2025 Q2 2025 Q3 2025 Q4 2026 Q1 2026 Q2 ▪ Strong growth in Assets Under Care (AUC) as net inflows were augmented by market growth during 2Q26 1 Wealth Management segment | 2 1Q26 wealth management pre-tax income is adjusted to exclude non-operating expenses $ in millions $ in millions Wealth Management Wealth Revenue Composition 1 % of Total WM Revenue 2025 Q2 2025 Q3 2025 Q4 2026 Q1 2026 Q2 Trust / Agency 82.9 % 86.2 % 86.3 % 83.6 % 82.6 % Brokerage 7.6 % 8.0 % 8.2 % 7.7 % 7.4 % Ag Services 2.4 % 0.6 % 1.6 % 6.7 % 3.0 % Tax & Financial Planning 4.1 % 0.6 % 0.5 % 0.5 % 4.0 % Estate Settlement 1.8 % 3.4 % 2.2 % 0.5 % 2.0 % Other 1.2 % 1.1 % 1.1 % 1.0 % 1.0 % Total 100 % 100 % 100 % 100 % 100 % $16.5 Billion Assets Under Care LTM Revenue 1$75.3 Million ▪ 2Q26 Wealth revenue1 of $20.1 million, a YoY increase of 19% and a third consecutive quarter of record quarterly revenue at the company ▪ Pre-tax profit margin2 of 49.0% in 2Q26 and 46.8% over the last twelve months Wealth Revenue 1 and Pre-Tax Income 2Assets Under Care Integrated comprehensive capabilities to serve Personal & Institutional Clients ▪ Sustained momentum in net new inflows has contributed to YoY AUC growth ▪ New wealth teams established in Kansas City, Wichita, Oklahoma City, Dallas, Denver, and Phoenix over the last twelve months ▪ AUC in these new Western markets has grown to $160 million as of 6/30/26, with robust AUC in pipelines LTM PT Margin 246.8% Tax & Financial Planning contributed $0.8 million of revenue during the quarter, the typical seasonal 2Q peak for that category, while Ag Services normalized from its typical annual 1Q high AUC is up $2.4 billion YoY, or 17%
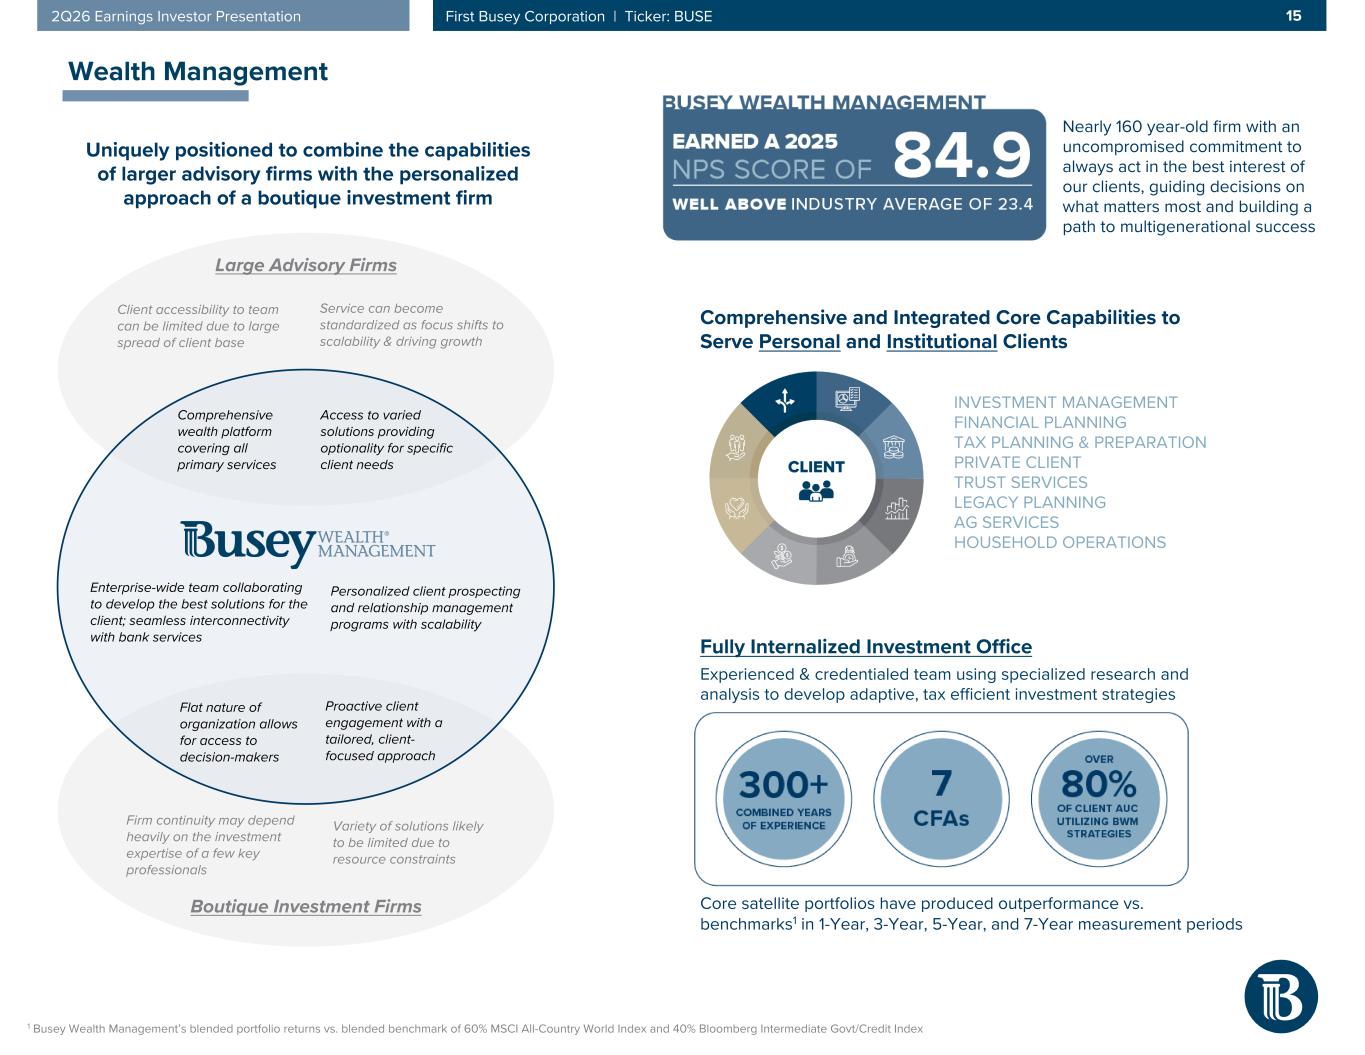
152Q26 Earnings Investor Presentation First Busey Corporation | Ticker: BUSE Wealth Management Comprehensive and Integrated Core Capabilities to Serve Personal and Institutional Clients Firm continuity may depend heavily on the investment expertise of a few key professionals Variety of solutions likely to be limited due to resource constraints Proactive client engagement with a tailored, client- focused approach Flat nature of organization allows for access to decision-makers Client accessibility to team can be limited due to large spread of client base Service can become standardized as focus shifts to scalability & driving growth Access to varied solutions providing optionality for specific client needs Comprehensive wealth platform covering all primary services Enterprise-wide team collaborating to develop the best solutions for the client; seamless interconnectivity with bank services Personalized client prospecting and relationship management programs with scalability Large Advisory Firms Boutique Investment Firms Fully Internalized Investment Office Experienced & credentialed team using specialized research and analysis to develop adaptive, tax efficient investment strategies Uniquely positioned to combine the capabilities of larger advisory firms with the personalized approach of a boutique investment firm INVESTMENT MANAGEMENT FINANCIAL PLANNING TAX PLANNING & PREPARATION PRIVATE CLIENT TRUST SERVICES LEGACY PLANNING AG SERVICES HOUSEHOLD OPERATIONS Nearly 160 year-old firm with an uncompromised commitment to always act in the best interest of our clients, guiding decisions on what matters most and building a path to multigenerational success Core satellite portfolios have produced outperformance vs. benchmarks1 in 1-Year, 3-Year, 5-Year, and 7-Year measurement periods 1 Busey Wealth Management’s blended portfolio returns vs. blended benchmark of 60% MSCI All-Country World Index and 40% Bloomberg Intermediate Govt/Credit Index
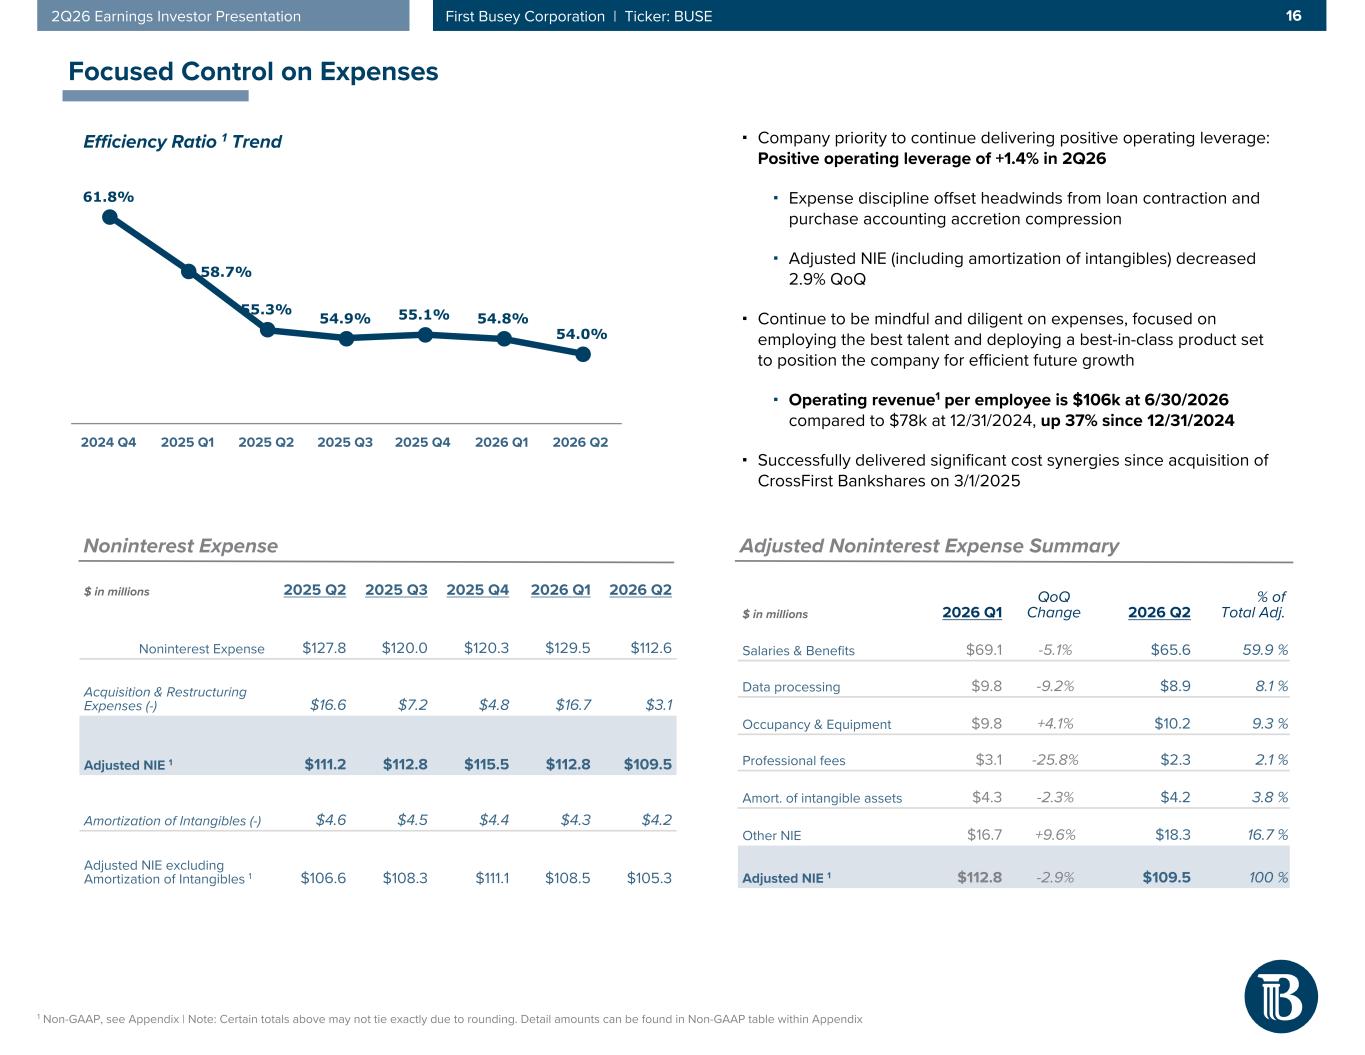
162Q26 Earnings Investor Presentation First Busey Corporation | Ticker: BUSE 61.8% 58.7% 55.3% 54.9% 55.1% 54.8% 54.0% 2024 Q4 2025 Q1 2025 Q2 2025 Q3 2025 Q4 2026 Q1 2026 Q2 $ in millions 2025 Q2 2025 Q3 2025 Q4 2026 Q1 2026 Q2 Noninterest Expense $127.8 $120.0 $120.3 $129.5 $112.6 Acquisition & Restructuring Expenses (-) $16.6 $7.2 $4.8 $16.7 $3.1 Adjusted NIE 1 $111.2 $112.8 $115.5 $112.8 $109.5 Amortization of Intangibles (-) $4.6 $4.5 $4.4 $4.3 $4.2 Adjusted NIE excluding Amortization of Intangibles 1 $106.6 $108.3 $111.1 $108.5 $105.3 1 Non-GAAP, see Appendix | Note: Certain totals above may not tie exactly due to rounding. Detail amounts can be found in Non-GAAP table within Appendix Noninterest Expense Focused Control on Expenses $ in millions 2026 Q1 QoQ Change 2026 Q2 % of Total Adj. Salaries & Benefits $69.1 -5.1% $65.6 59.9 % Data processing $9.8 -9.2% $8.9 8.1 % Occupancy & Equipment $9.8 +4.1% $10.2 9.3 % Professional fees $3.1 -25.8% $2.3 2.1 % Amort. of intangible assets $4.3 -2.3% $4.2 3.8 % Other NIE $16.7 +9.6% $18.3 16.7 % Adjusted NIE 1 $112.8 -2.9% $109.5 100 % ▪ Company priority to continue delivering positive operating leverage: Positive operating leverage of +1.4% in 2Q26 ▪ Expense discipline offset headwinds from loan contraction and purchase accounting accretion compression ▪ Adjusted NIE (including amortization of intangibles) decreased 2.9% QoQ ▪ Continue to be mindful and diligent on expenses, focused on employing the best talent and deploying a best-in-class product set to position the company for efficient future growth ▪ Operating revenue1 per employee is $106k at 6/30/2026 compared to $78k at 12/31/2024, up 37% since 12/31/2024 ▪ Successfully delivered significant cost synergies since acquisition of CrossFirst Bankshares on 3/1/2025 Efficiency Ratio 1 Trend Adjusted Noninterest Expense Summary
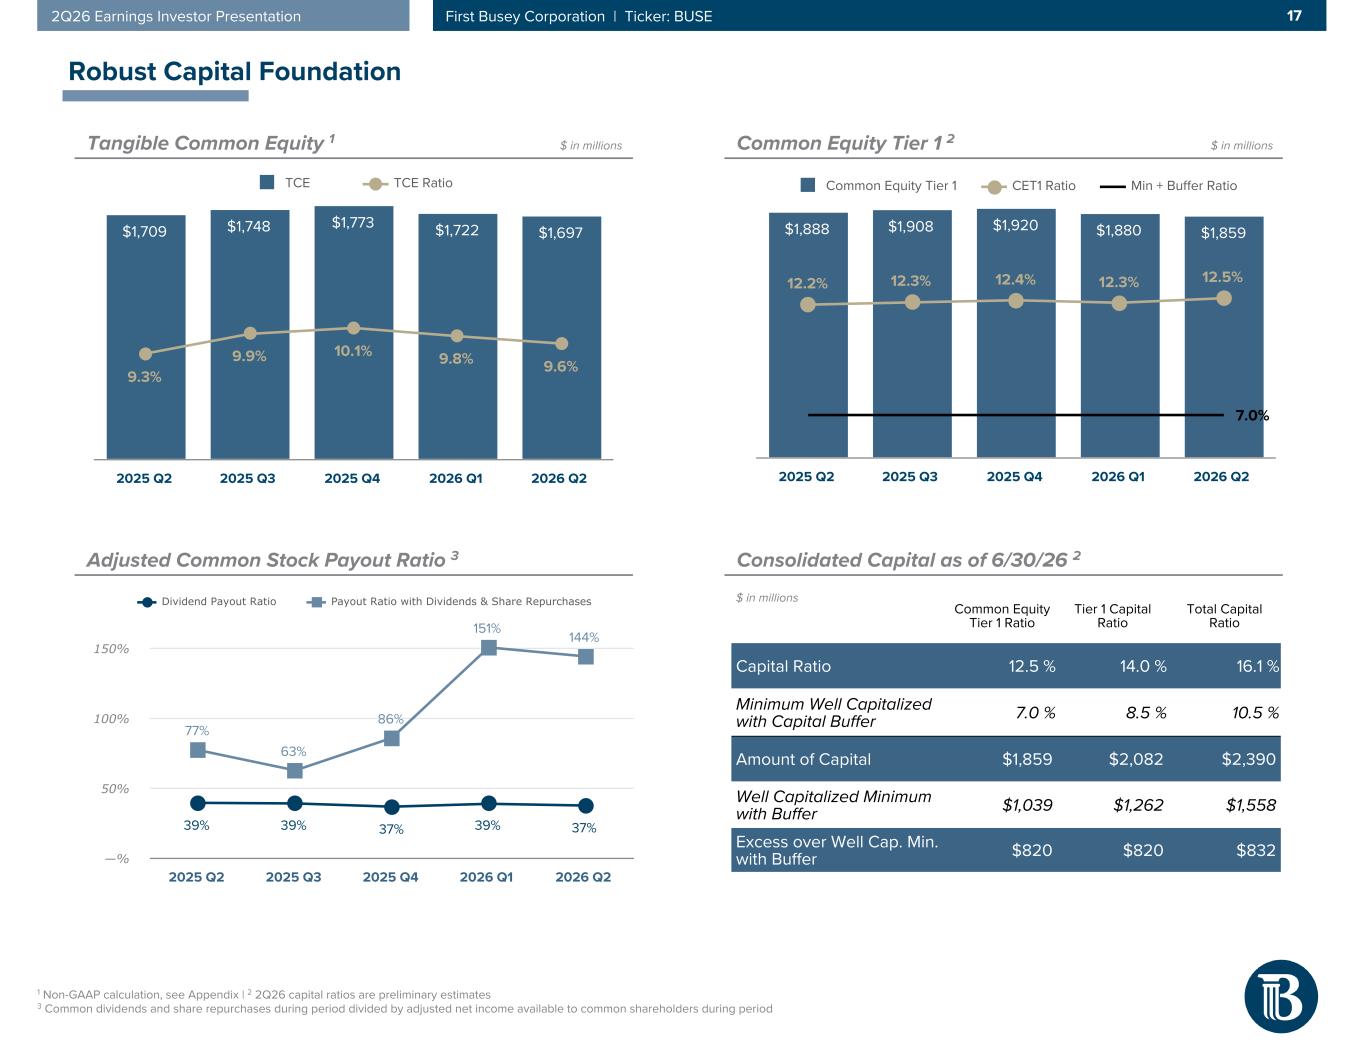
172Q26 Earnings Investor Presentation First Busey Corporation | Ticker: BUSE 39% 39% 37% 39% 37% 77% 63% 86% 151% 144% Dividend Payout Ratio Payout Ratio with Dividends & Share Repurchases 2025 Q2 2025 Q3 2025 Q4 2026 Q1 2026 Q2 —% 50% 100% 150% $1,888 $1,908 $1,920 $1,880 $1,859 12.2% 12.3% 12.4% 12.3% 12.5% 7.0% Common Equity Tier 1 CET1 Ratio Min + Buffer Ratio 2025 Q2 2025 Q3 2025 Q4 2026 Q1 2026 Q2 $1,709 $1,748 $1,773 $1,722 $1,697 9.3% 9.9% 10.1% 9.8% 9.6% TCE TCE Ratio 2025 Q2 2025 Q3 2025 Q4 2026 Q1 2026 Q2 Tangible Common Equity 1 1 Non-GAAP calculation, see Appendix | 2 2Q26 capital ratios are preliminary estimates 3 Common dividends and share repurchases during period divided by adjusted net income available to common shareholders during period $ in millions Common Equity Tier 1 Ratio Tier 1 Capital Ratio Total Capital Ratio Capital Ratio 12.5 % 14.0 % 16.1 % Minimum Well Capitalized with Capital Buffer 7.0 % 8.5 % 10.5 % Amount of Capital $1,859 $2,082 $2,390 Well Capitalized Minimum with Buffer $1,039 $1,262 $1,558 Excess over Well Cap. Min. with Buffer $820 $820 $832 $ in millions $ in millions Robust Capital Foundation Common Equity Tier 1 2 Consolidated Capital as of 6/30/26 2Adjusted Common Stock Payout Ratio 3
Appendix

192Q26 Earnings Investor Presentation First Busey Corporation | Ticker: BUSE Seasoned Leadership Team Has served as Chairman & CEO of First Busey since 2007 and became Chairman of the Board effective July 2020. Offers 40 years of diverse financial services experience and extensive board involvement with a conservative operating philosophy and management style that focuses on Busey’s associates, customers, communities and shareholders. Van A. Dukeman Chairman, President & CEO, First Busey Corp. Chairman & CEO, Busey Bank Tony Hammond President, Busey Bank Joined Busey in 2008 and has nearly 30 years of financial and leadership experience. Oversees various areas at Busey and its subsidiaries, including human resources, corporate communications, executive administration, marketing, the overall Busey experience, enterprise and strategic projects, as well as consumer and digital banking. Prior to Busey, Amy worked for 10+ years with CliftonLarsonAllen LLP. Amy L. Randolph Chief Operating Officer Joined Busey in January 2020 with over 25 years of financial leadership experience, including a 16-year tenure with KeyCorp. Oversees various areas at Busey and its subsidiaries, including enterprise, operational and third-party risk management, compliance, fair and responsible banking, vendor management, model risk, business continuity and information security. Monica L. Bowe Chief Risk Officer Joined Busey in March 2025 with the CrossFirst Bankshares merger and oversees various areas at Busey and its subsidiaries, including all information technology and business services and systems, service support, enterprise lending services, enterprise deposits and payments, and facilities. Previously, Amy held multiple executive leadership roles with CrossFirst Bank, most recently serving as Chief Operating Officer. Amy J. Fauss Chief Information & Technology Officer Joined Busey in 2011 and has over 20 years of experience in the financial services industry. Chip oversees all aspects of credit administration at Busey Bank, including commercial and consumer credit, portfolio monitoring and special assets. Before being named Chief Credit Officer in 2025, he has held the roles of President of Credit and Bank Administration, Co-Chief Banking Officer, and Regional President for Commercial Banking. Chip Jorstad Chief Credit Officer Joined Busey in September 2025. Oversees various areas at Busey and its subsidiaries—including accounting and corporate reporting, financial planning and analysis, budgeting and forecasting, artificial intelligence, capital management, treasury, specialty finance and community investments, corporate development and investor relations. Chris previously served as Chief Strategy Officer at First National Bank, the largest subsidiary of F.N.B. Corporation. Chris H.M. Chan Chief Financial Officer Joined Busey in December 2011 and has over 45 years of legal experience. He oversees all legal matters and leads Busey’s corporate governance efforts. Prior to joining Busey, he was a shareholder in the law firm of Meyer Capel. John J. Powers General Counsel 2026 Executive Compensation Performance-Based Measures Weighting Short-term incentives Operating EPS 40% Asset Quality vs. Proxy Peer Group 25% Fee Revenue from Wealth Mgmt., Payment Technology Solutions, Treasury Mgmt., and Capital Markets 20% Core Deposit Growth 10% Regulatory Ratings 5% Total 100% Long-term incentives Relative Total Shareholder Return vs. KRE constituents 50% Relative Operating ROAA vs. Proxy Peer Group 25% Relative TBV growth ex-AOCI plus cumulative dividends and share repurchases vs. Proxy Peer Group 25% Total 100% Executive compensation reinforces corporate priorities and is aligned with driving long-term shareholder value Joined Busey in May 2025. Oversees Busey’s regional operating sales and revenue model which includes all commercial, wealth, treasury management, payments and specialty business units. Tony has two decades of commercial banking experience—including serving as Head of Commercial and Middle Market Banking at HTLF and senior leadership roles at Arizona Bank & Trust, Johnson Bank and BOK Financial—with a track record of consistently leading high-performing teams, growing market share and attracting top talent across the industry.
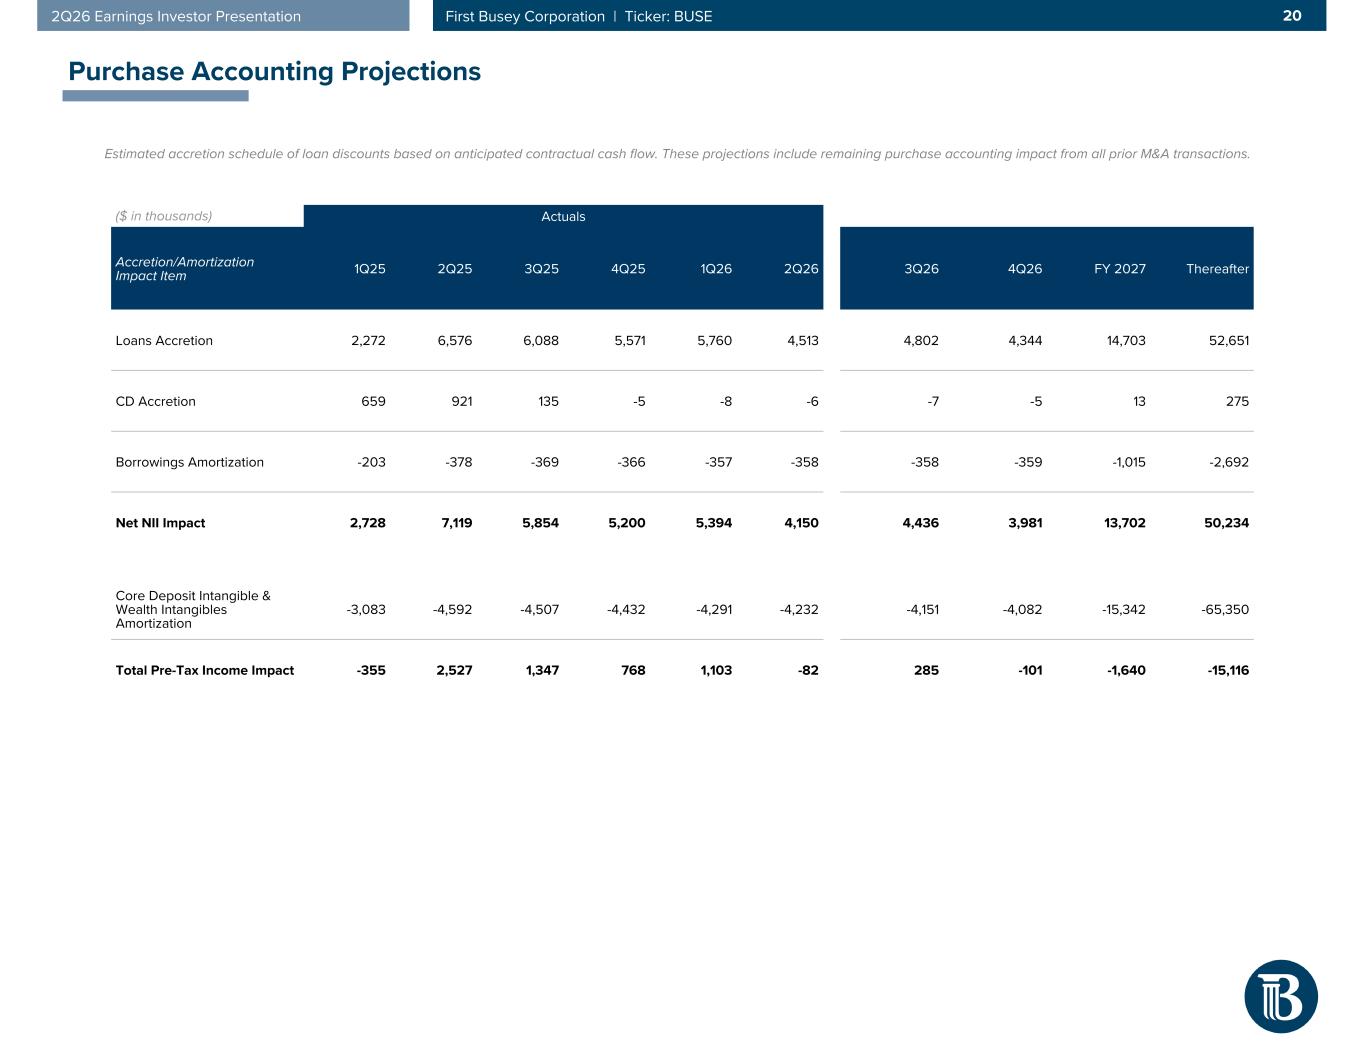
202Q26 Earnings Investor Presentation First Busey Corporation | Ticker: BUSE Estimated accretion schedule of loan discounts based on anticipated contractual cash flow. These projections include remaining purchase accounting impact from all prior M&A transactions. Purchase Accounting Projections ($ in thousands) Actuals Accretion/Amortization Impact Item 1Q25 2Q25 3Q25 4Q25 1Q26 2Q26 3Q26 4Q26 FY 2027 Thereafter Loans Accretion 2,272 6,576 6,088 5,571 5,760 4,513 4,802 4,344 14,703 52,651 CD Accretion 659 921 135 -5 -8 -6 -7 -5 13 275 Borrowings Amortization -203 -378 -369 -366 -357 -358 -358 -359 -1,015 -2,692 Net NII Impact 2,728 7,119 5,854 5,200 5,394 4,150 4,436 3,981 13,702 50,234 Core Deposit Intangible & Wealth Intangibles Amortization -3,083 -4,592 -4,507 -4,432 -4,291 -4,232 -4,151 -4,082 -15,342 -65,350 Total Pre-Tax Income Impact -355 2,527 1,347 768 1,103 -82 285 -101 -1,640 -15,116
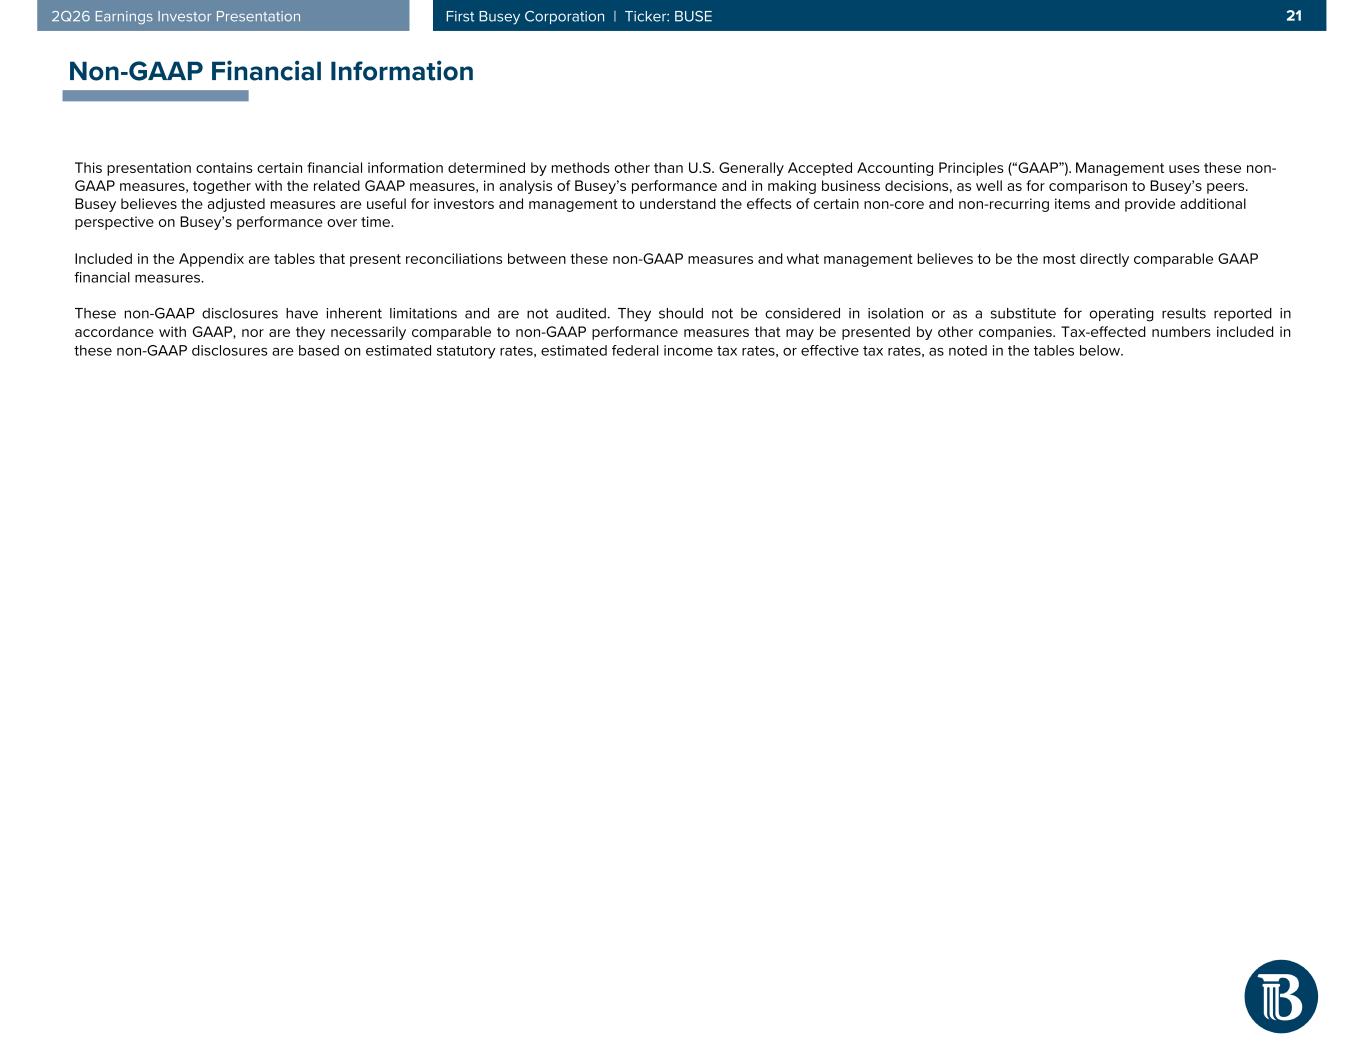
212Q26 Earnings Investor Presentation First Busey Corporation | Ticker: BUSE Non-GAAP Financial Information This presentation contains certain financial information determined by methods other than U.S. Generally Accepted Accounting Principles (“GAAP”). Management uses these non- GAAP measures, together with the related GAAP measures, in analysis of Busey’s performance and in making business decisions, as well as for comparison to Busey’s peers. Busey believes the adjusted measures are useful for investors and management to understand the effects of certain non-core and non-recurring items and provide additional perspective on Busey’s performance over time. Included in the Appendix are tables that present reconciliations between these non-GAAP measures and what management believes to be the most directly comparable GAAP financial measures. These non-GAAP disclosures have inherent limitations and are not audited. They should not be considered in isolation or as a substitute for operating results reported in accordance with GAAP, nor are they necessarily comparable to non-GAAP performance measures that may be presented by other companies. Tax-effected numbers included in these non-GAAP disclosures are based on estimated statutory rates, estimated federal income tax rates, or effective tax rates, as noted in the tables below.
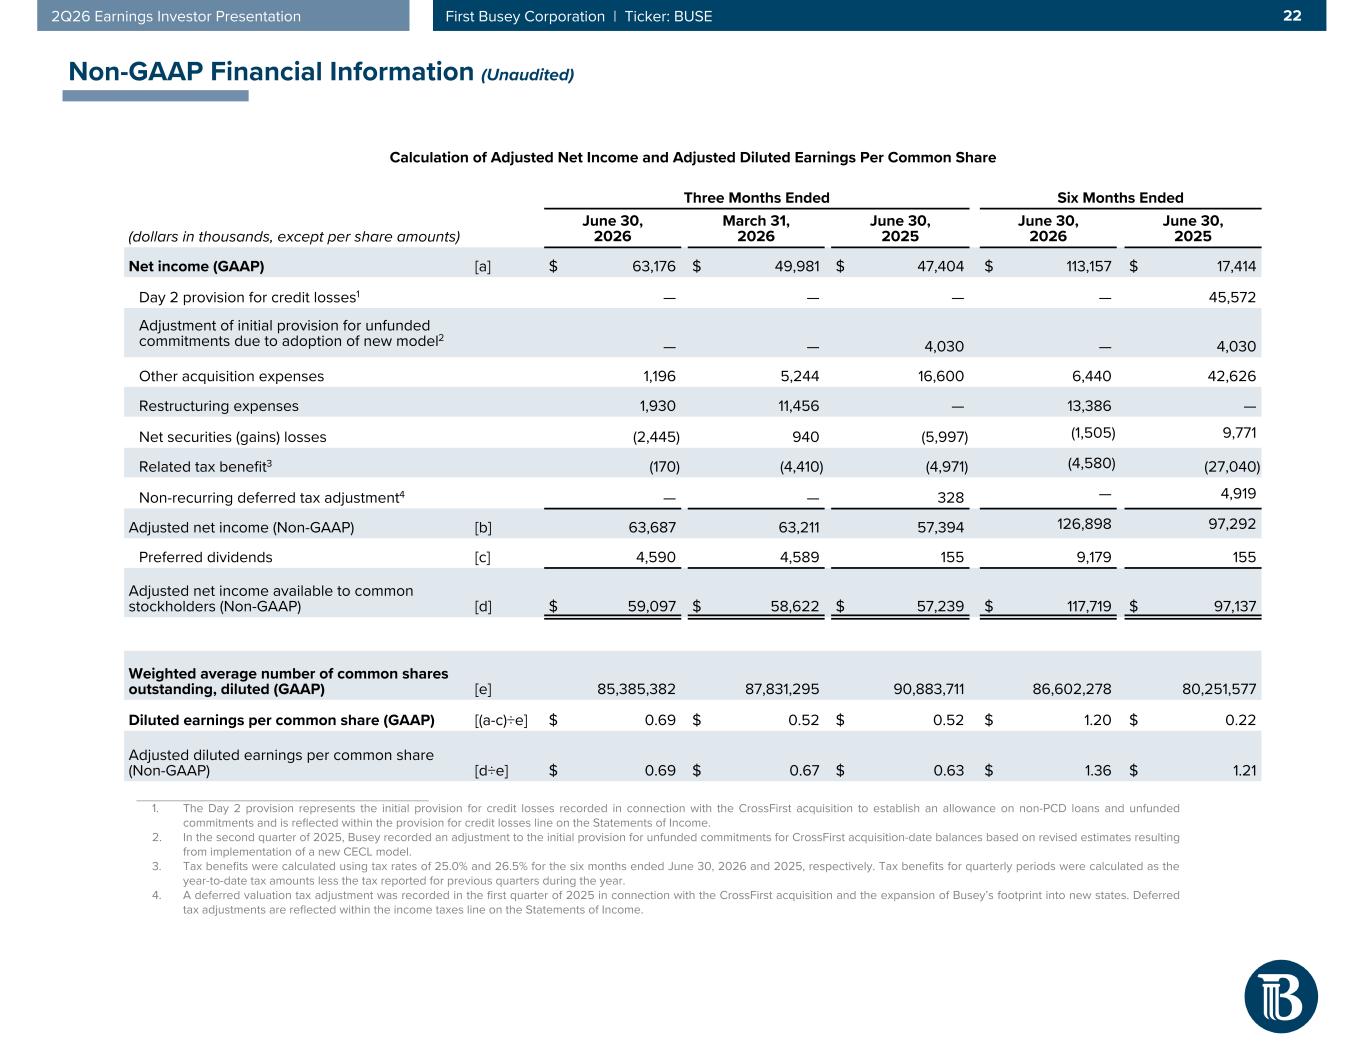
222Q26 Earnings Investor Presentation First Busey Corporation | Ticker: BUSE Non-GAAP Financial Information (Unaudited) Calculation of Adjusted Net Income and Adjusted Diluted Earnings Per Common Share Three Months Ended Six Months Ended (dollars in thousands, except per share amounts) June 30, 2026 March 31, 2026 June 30, 2025 June 30, 2026 June 30, 2025 Net income (GAAP) [a] $ 63,176 $ 49,981 $ 47,404 $ 113,157 $ 17,414 Day 2 provision for credit losses1 — — — — 45,572 Adjustment of initial provision for unfunded commitments due to adoption of new model2 — — 4,030 — 4,030 Other acquisition expenses 1,196 5,244 16,600 6,440 42,626 Restructuring expenses 1,930 11,456 — 13,386 — Net securities (gains) losses (2,445) 940 (5,997) (1,505) 9,771 Related tax benefit3 (170) (4,410) (4,971) (4,580) (27,040) Non-recurring deferred tax adjustment4 — — 328 — 4,919 Adjusted net income (Non-GAAP) [b] 63,687 63,211 57,394 126,898 97,292 Preferred dividends [c] 4,590 4,589 155 9,179 155 Adjusted net income available to common stockholders (Non-GAAP) [d] $ 59,097 $ 58,622 $ 57,239 $ 117,719 $ 97,137 Weighted average number of common shares outstanding, diluted (GAAP) [e] 85,385,382 87,831,295 90,883,711 86,602,278 80,251,577 Diluted earnings per common share (GAAP) [(a-c)÷e] $ 0.69 $ 0.52 $ 0.52 $ 1.20 $ 0.22 Adjusted diluted earnings per common share (Non-GAAP) [d÷e] $ 0.69 $ 0.67 $ 0.63 $ 1.36 $ 1.21 ___________________________________________ 1. The Day 2 provision represents the initial provision for credit losses recorded in connection with the CrossFirst acquisition to establish an allowance on non-PCD loans and unfunded commitments and is reflected within the provision for credit losses line on the Statements of Income. 2. In the second quarter of 2025, Busey recorded an adjustment to the initial provision for unfunded commitments for CrossFirst acquisition-date balances based on revised estimates resulting from implementation of a new CECL model. 3. Tax benefits were calculated using tax rates of 25.0% and 26.5% for the six months ended June 30, 2026 and 2025, respectively. Tax benefits for quarterly periods were calculated as the year-to-date tax amounts less the tax reported for previous quarters during the year. 4. A deferred valuation tax adjustment was recorded in the first quarter of 2025 in connection with the CrossFirst acquisition and the expansion of Busey’s footprint into new states. Deferred tax adjustments are reflected within the income taxes line on the Statements of Income.
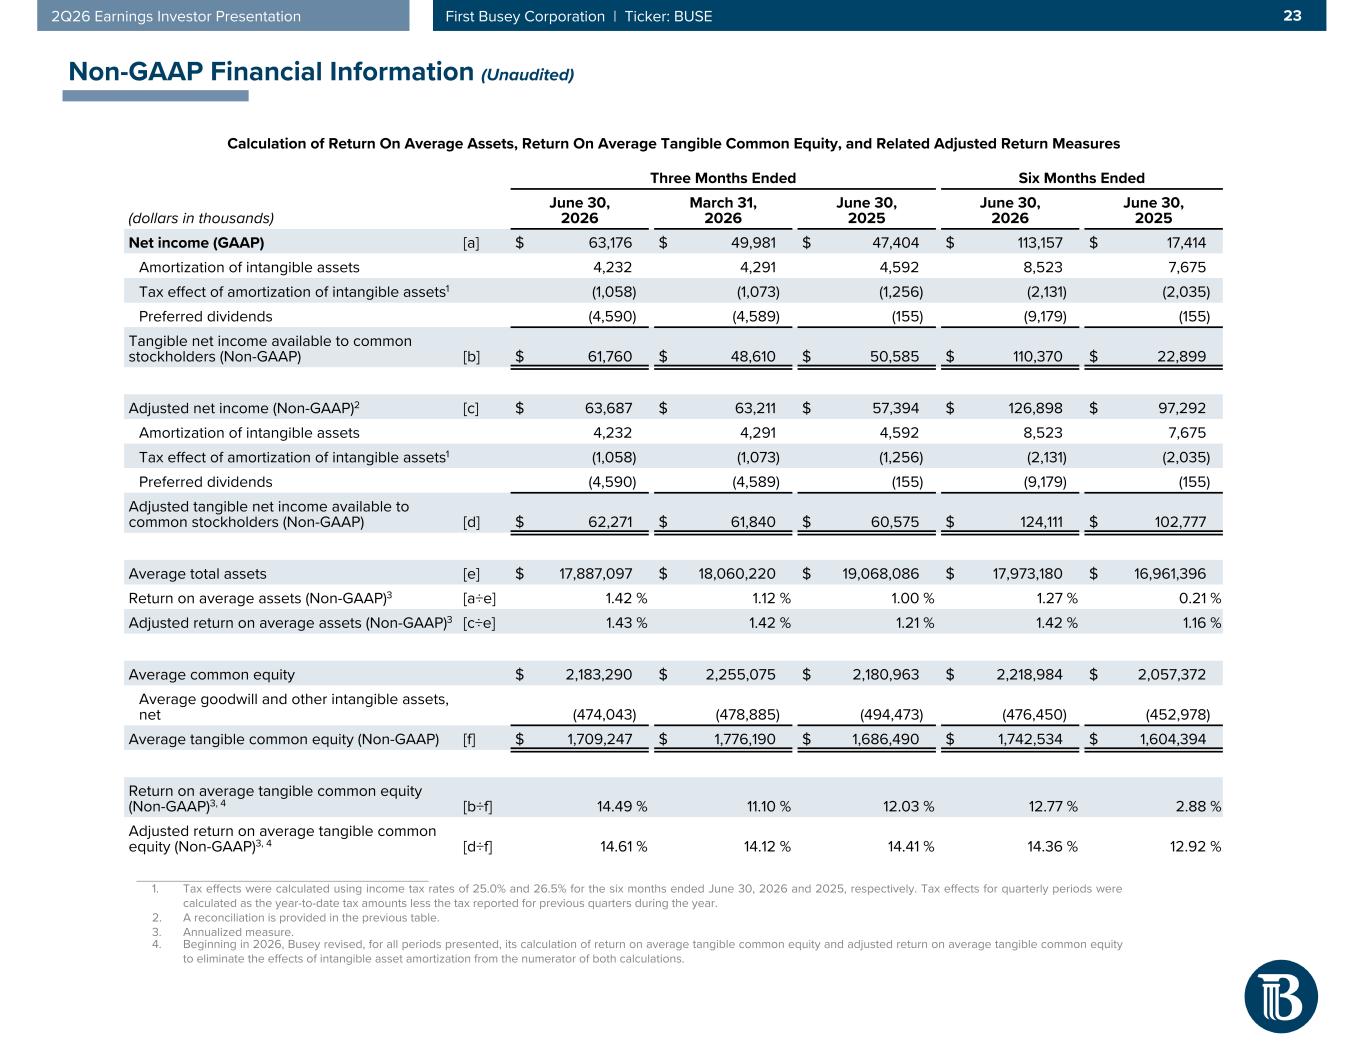
232Q26 Earnings Investor Presentation First Busey Corporation | Ticker: BUSE Non-GAAP Financial Information (Unaudited) ___________________________________________ 1. Tax effects were calculated using income tax rates of 25.0% and 26.5% for the six months ended June 30, 2026 and 2025, respectively. Tax effects for quarterly periods were calculated as the year-to-date tax amounts less the tax reported for previous quarters during the year. 2. A reconciliation is provided in the previous table. 3. Annualized measure. 4. Beginning in 2026, Busey revised, for all periods presented, its calculation of return on average tangible common equity and adjusted return on average tangible common equity to eliminate the effects of intangible asset amortization from the numerator of both calculations. Calculation of Return On Average Assets, Return On Average Tangible Common Equity, and Related Adjusted Return Measures Three Months Ended Six Months Ended (dollars in thousands) June 30, 2026 March 31, 2026 June 30, 2025 June 30, 2026 June 30, 2025 Net income (GAAP) [a] $ 63,176 $ 49,981 $ 47,404 $ 113,157 $ 17,414 Amortization of intangible assets 4,232 4,291 4,592 8,523 7,675 Tax effect of amortization of intangible assets1 (1,058) (1,073) (1,256) (2,131) (2,035) Preferred dividends (4,590) (4,589) (155) (9,179) (155) Tangible net income available to common stockholders (Non-GAAP) [b] $ 61,760 $ 48,610 $ 50,585 $ 110,370 $ 22,899 Adjusted net income (Non-GAAP)2 [c] $ 63,687 $ 63,211 $ 57,394 $ 126,898 $ 97,292 Amortization of intangible assets 4,232 4,291 4,592 8,523 7,675 Tax effect of amortization of intangible assets1 (1,058) (1,073) (1,256) (2,131) (2,035) Preferred dividends (4,590) (4,589) (155) (9,179) (155) Adjusted tangible net income available to common stockholders (Non-GAAP) [d] $ 62,271 $ 61,840 $ 60,575 $ 124,111 $ 102,777 Average total assets [e] $ 17,887,097 $ 18,060,220 $ 19,068,086 $ 17,973,180 $ 16,961,396 Return on average assets (Non-GAAP)3 [a÷e] 1.42 % 1.12 % 1.00 % 1.27 % 0.21 % Adjusted return on average assets (Non-GAAP)3 [c÷e] 1.43 % 1.42 % 1.21 % 1.42 % 1.16 % Average common equity $ 2,183,290 $ 2,255,075 $ 2,180,963 $ 2,218,984 $ 2,057,372 Average goodwill and other intangible assets, net (474,043) (478,885) (494,473) (476,450) (452,978) Average tangible common equity (Non-GAAP) [f] $ 1,709,247 $ 1,776,190 $ 1,686,490 $ 1,742,534 $ 1,604,394 Return on average tangible common equity (Non-GAAP)3, 4 [b÷f] 14.49 % 11.10 % 12.03 % 12.77 % 2.88 % Adjusted return on average tangible common equity (Non-GAAP)3, 4 [d÷f] 14.61 % 14.12 % 14.41 % 14.36 % 12.92 %
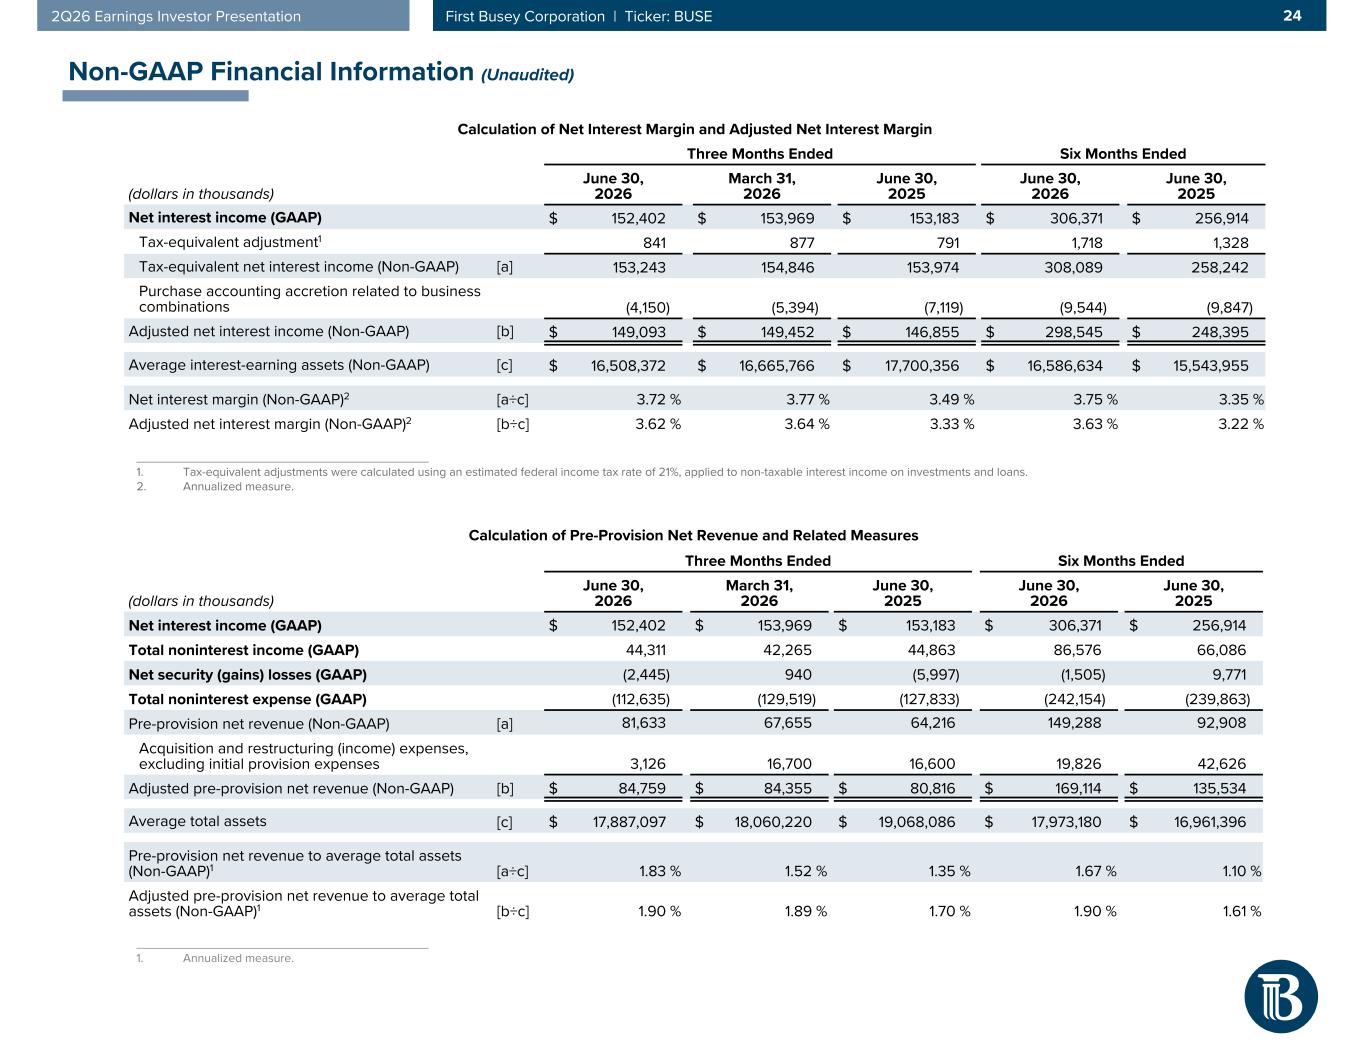
242Q26 Earnings Investor Presentation First Busey Corporation | Ticker: BUSE Non-GAAP Financial Information (Unaudited) Calculation of Net Interest Margin and Adjusted Net Interest Margin Three Months Ended Six Months Ended (dollars in thousands) June 30, 2026 March 31, 2026 June 30, 2025 June 30, 2026 June 30, 2025 Net interest income (GAAP) $ 152,402 $ 153,969 $ 153,183 $ 306,371 $ 256,914 Tax-equivalent adjustment1 841 877 791 1,718 1,328 Tax-equivalent net interest income (Non-GAAP) [a] 153,243 154,846 153,974 308,089 258,242 Purchase accounting accretion related to business combinations (4,150) (5,394) (7,119) (9,544) (9,847) Adjusted net interest income (Non-GAAP) [b] $ 149,093 $ 149,452 $ 146,855 $ 298,545 $ 248,395 Average interest-earning assets (Non-GAAP) [c] $ 16,508,372 $ 16,665,766 $ 17,700,356 $ 16,586,634 $ 15,543,955 Net interest margin (Non-GAAP)2 [a÷c] 3.72 % 3.77 % 3.49 % 3.75 % 3.35 % Adjusted net interest margin (Non-GAAP)2 [b÷c] 3.62 % 3.64 % 3.33 % 3.63 % 3.22 % ___________________________________________ 1. Tax-equivalent adjustments were calculated using an estimated federal income tax rate of 21%, applied to non-taxable interest income on investments and loans. 2. Annualized measure. ___________________________________________ 1. Annualized measure. Calculation of Pre-Provision Net Revenue and Related Measures Three Months Ended Six Months Ended (dollars in thousands) June 30, 2026 March 31, 2026 June 30, 2025 June 30, 2026 June 30, 2025 Net interest income (GAAP) $ 152,402 $ 153,969 $ 153,183 $ 306,371 $ 256,914 Total noninterest income (GAAP) 44,311 42,265 44,863 86,576 66,086 Net security (gains) losses (GAAP) (2,445) 940 (5,997) (1,505) 9,771 Total noninterest expense (GAAP) (112,635) (129,519) (127,833) (242,154) (239,863) Pre-provision net revenue (Non-GAAP) [a] 81,633 67,655 64,216 149,288 92,908 Acquisition and restructuring (income) expenses, excluding initial provision expenses 3,126 16,700 16,600 19,826 42,626 Adjusted pre-provision net revenue (Non-GAAP) [b] $ 84,759 $ 84,355 $ 80,816 $ 169,114 $ 135,534 Average total assets [c] $ 17,887,097 $ 18,060,220 $ 19,068,086 $ 17,973,180 $ 16,961,396 Pre-provision net revenue to average total assets (Non-GAAP)1 [a÷c] 1.83 % 1.52 % 1.35 % 1.67 % 1.10 % Adjusted pre-provision net revenue to average total assets (Non-GAAP)1 [b÷c] 1.90 % 1.89 % 1.70 % 1.90 % 1.61 %
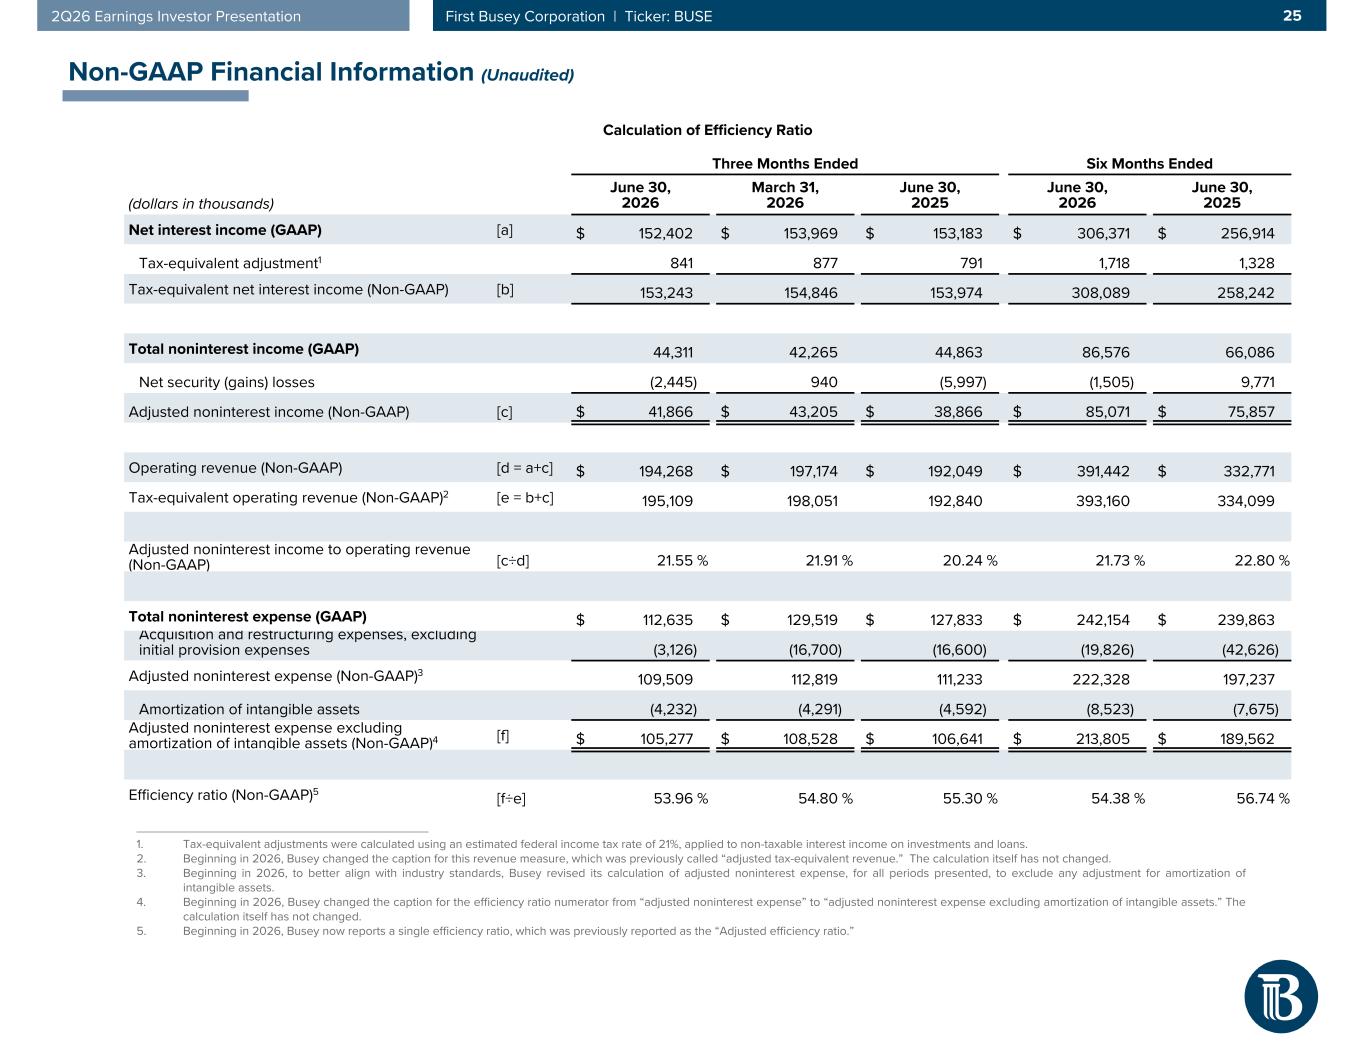
252Q26 Earnings Investor Presentation First Busey Corporation | Ticker: BUSE Non-GAAP Financial Information (Unaudited) ___________________________________________ 1. Tax-equivalent adjustments were calculated using an estimated federal income tax rate of 21%, applied to non-taxable interest income on investments and loans. 2. Beginning in 2026, Busey changed the caption for this revenue measure, which was previously called “adjusted tax-equivalent revenue.” The calculation itself has not changed. 3. Beginning in 2026, to better align with industry standards, Busey revised its calculation of adjusted noninterest expense, for all periods presented, to exclude any adjustment for amortization of intangible assets. 4. Beginning in 2026, Busey changed the caption for the efficiency ratio numerator from “adjusted noninterest expense” to “adjusted noninterest expense excluding amortization of intangible assets.” The calculation itself has not changed. 5. Beginning in 2026, Busey now reports a single efficiency ratio, which was previously reported as the “Adjusted efficiency ratio.” Calculation of Efficiency Ratio Three Months Ended Six Months Ended (dollars in thousands) June 30, 2026 March 31, 2026 June 30, 2025 June 30, 2026 June 30, 2025 Net interest income (GAAP) [a] $ 152,402 $ 153,969 $ 153,183 $ 306,371 $ 256,914 Tax-equivalent adjustment1 841 877 791 1,718 1,328 Tax-equivalent net interest income (Non-GAAP) [b] 153,243 154,846 153,974 308,089 258,242 Total noninterest income (GAAP) 44,311 42,265 44,863 86,576 66,086 Net security (gains) losses (2,445) 940 (5,997) (1,505) 9,771 Adjusted noninterest income (Non-GAAP) [c] $ 41,866 $ 43,205 $ 38,866 $ 85,071 $ 75,857 Operating revenue (Non-GAAP) [d = a+c] $ 194,268 $ 197,174 $ 192,049 $ 391,442 $ 332,771 Tax-equivalent operating revenue (Non-GAAP)2 [e = b+c] 195,109 198,051 192,840 393,160 334,099 Adjusted noninterest income to operating revenue (Non-GAAP) [c÷d] 21.55 % 21.91 % 20.24 % 21.73 % 22.80 % Total noninterest expense (GAAP) $ 112,635 $ 129,519 $ 127,833 $ 242,154 $ 239,863 Acquisition and restructuring expenses, excluding initial provision expenses (3,126) (16,700) (16,600) (19,826) (42,626) Adjusted noninterest expense (Non-GAAP)3 109,509 112,819 111,233 222,328 197,237 Amortization of intangible assets (4,232) (4,291) (4,592) (8,523) (7,675) Adjusted noninterest expense excluding amortization of intangible assets (Non-GAAP)4 [f] $ 105,277 $ 108,528 $ 106,641 $ 213,805 $ 189,562 Efficiency ratio (Non-GAAP)5 [f÷e] 53.96 % 54.80 % 55.30 % 54.38 % 56.74 %
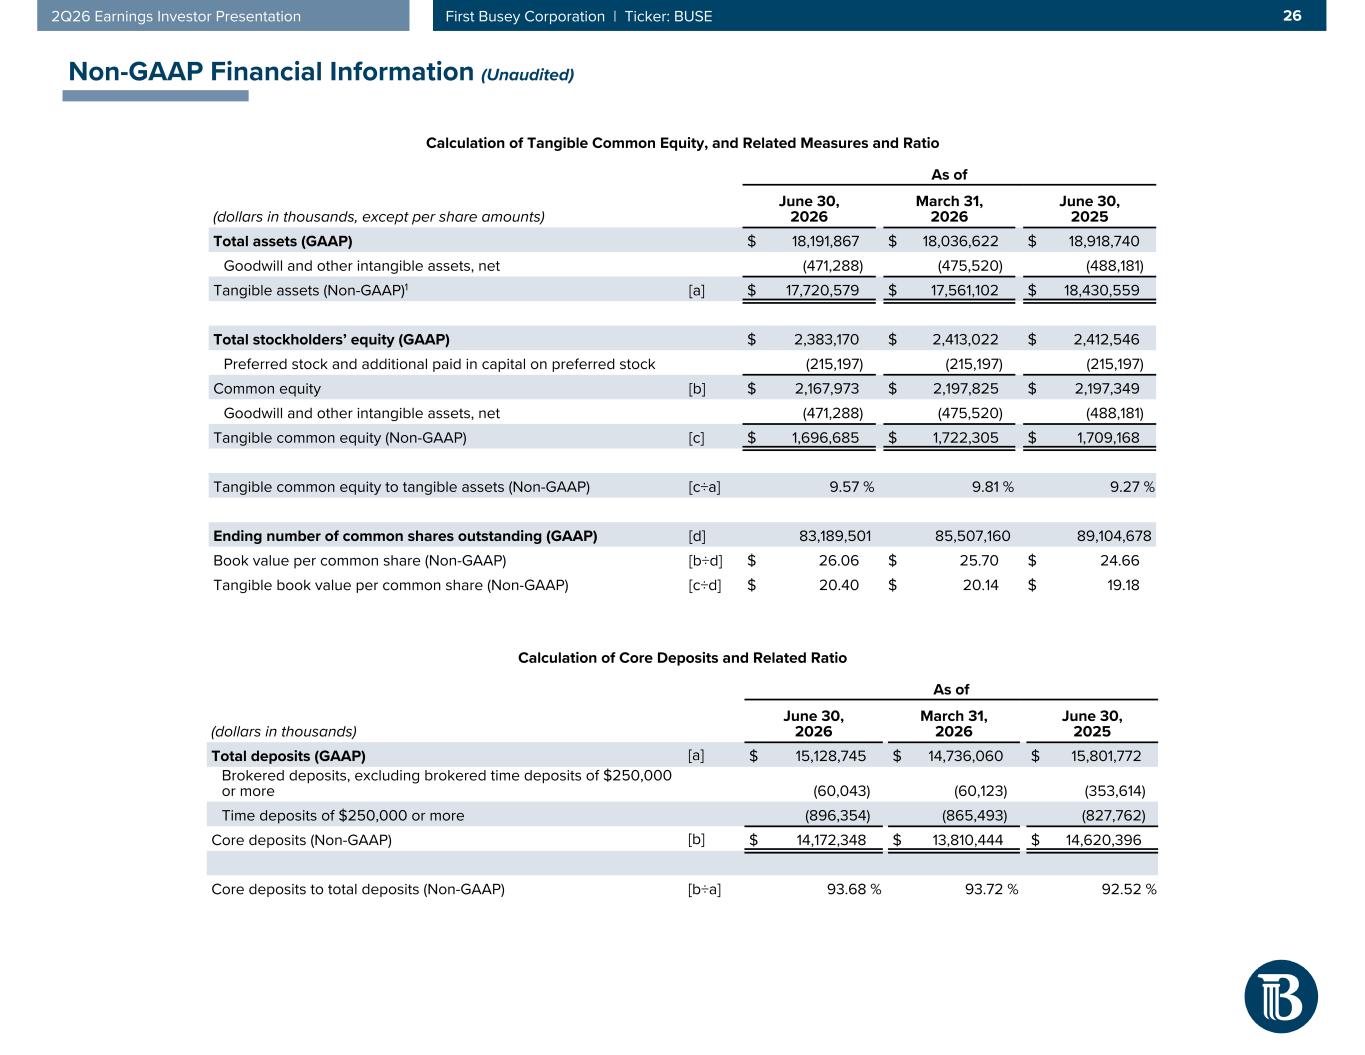
262Q26 Earnings Investor Presentation First Busey Corporation | Ticker: BUSE Non-GAAP Financial Information (Unaudited) Calculation of Tangible Common Equity, and Related Measures and Ratio As of (dollars in thousands, except per share amounts) June 30, 2026 March 31, 2026 June 30, 2025 Total assets (GAAP) $ 18,191,867 $ 18,036,622 $ 18,918,740 Goodwill and other intangible assets, net (471,288) (475,520) (488,181) Tangible assets (Non-GAAP)1 [a] $ 17,720,579 $ 17,561,102 $ 18,430,559 Total stockholders’ equity (GAAP) $ 2,383,170 $ 2,413,022 $ 2,412,546 Preferred stock and additional paid in capital on preferred stock (215,197) (215,197) (215,197) Common equity [b] $ 2,167,973 $ 2,197,825 $ 2,197,349 Goodwill and other intangible assets, net (471,288) (475,520) (488,181) Tangible common equity (Non-GAAP) [c] $ 1,696,685 $ 1,722,305 $ 1,709,168 Tangible common equity to tangible assets (Non-GAAP) [c÷a] 9.57 % 9.81 % 9.27 % Ending number of common shares outstanding (GAAP) [d] 83,189,501 85,507,160 89,104,678 Book value per common share (Non-GAAP) [b÷d] $ 26.06 $ 25.70 $ 24.66 Tangible book value per common share (Non-GAAP) [c÷d] $ 20.40 $ 20.14 $ 19.18 Calculation of Core Deposits and Related Ratio As of (dollars in thousands) June 30, 2026 March 31, 2026 June 30, 2025 Total deposits (GAAP) [a] $ 15,128,745 $ 14,736,060 $ 15,801,772 Brokered deposits, excluding brokered time deposits of $250,000 or more (60,043) (60,123) (353,614) Time deposits of $250,000 or more (896,354) (865,493) (827,762) Core deposits (Non-GAAP) [b] $ 14,172,348 $ 13,810,444 $ 14,620,396 Core deposits to total deposits (Non-GAAP) [b÷a] 93.68 % 93.72 % 92.52 %