Please wait
http://fasb.org/us-gaap/2025#SecuredDebthttp://fasb.org/us-gaap/2025#OtherAssetshttp://fasb.org/us-gaap/2025#OtherAssetshttp://fasb.org/us-gaap/2025#OtherCostAndExpenseOperatinghttp://fasb.org/us-gaap/2025#OtherCostAndExpenseOperatinghttp://fasb.org/us-gaap/2025#OtherCostAndExpenseOperatinghttp://fasb.org/us-gaap/2025#OtherCostAndExpenseOperatinghttp://fasb.org/us-gaap/2025#OtherCostAndExpenseOperatinghttp://fasb.org/us-gaap/2025#OtherCostAndExpenseOperatinghttp://fasb.org/us-gaap/2025#OtherCostAndExpenseOperatinghttp://fasb.org/us-gaap/2025#OtherCostAndExpenseOperatinghttp://fasb.org/us-gaap/2025#OtherCostAndExpenseOperatinghttp://fasb.org/us-gaap/2025#OtherCostAndExpenseOperatinghttp://fasb.org/us-gaap/2025#OtherCostAndExpenseOperatinghttp://fasb.org/us-gaap/2025#OtherCostAndExpenseOperatinghttp://fasb.org/us-gaap/2025#OtherCostAndExpenseOperatinghttp://fasb.org/us-gaap/2025#OtherCostAndExpenseOperatinghttp://fasb.org/us-gaap/2025#OtherCostAndExpenseOperatinghttp://fasb.org/us-gaap/2025#OtherCostAndExpenseOperatinghttp://fasb.org/us-gaap/2025#OtherCostAndExpenseOperatinghttp://fasb.org/us-gaap/2025#OtherCostAndExpenseOperatinghttp://fasb.org/us-gaap/2025#OtherCostAndExpenseOperatinghttp://fasb.org/us-gaap/2025#OtherCostAndExpenseOperatinghttp://fasb.org/us-gaap/2025#SecuredDebthttp://fasb.org/us-gaap/2025#AccountsPayableAndAccruedLiabilitiesCurrentAndNoncurrenthttp://fasb.org/us-gaap/2025#SecuredDebthttp://fasb.org/us-gaap/2025#SecuredDebthttp://fasb.org/us-gaap/2025#SecuredDebthttp://fasb.org/us-gaap/2025#SecuredDebthttp://fasb.org/us-gaap/2025#OtherCostAndExpenseOperatinghttp://fasb.org/us-gaap/2025#OtherCostAndExpenseOperating0000315189false--11-02FYhttp://fasb.org/us-gaap/2025#OtherAssetshttp://fasb.org/us-gaap/2025#AccountsPayableAndAccruedLiabilitiesCurrentAndNoncurrenthttp://www.deere.com/20251102#PropertyPlantAndEquipmentAndFinanceLeaseRightOfUseAssetExcludingLessorAssetUnderOperatingLeaseAfterAccumulatedDepreciationAndAmortizationhttp://fasb.org/us-gaap/2025#DebtCurrenthttp://www.deere.com/20251102#LongTermDebtAndFinanceLeasesNoncurrenthttp://fasb.org/us-gaap/2025#DebtCurrent http://www.deere.com/20251102#LongTermDebtAndFinanceLeasesNoncurrenthttp://fasb.org/us-gaap/2025#OtherAssetshttp://fasb.org/us-gaap/2025#OtherAssetshttp://fasb.org/us-gaap/2025#CostMethodFifoMember http://fasb.org/us-gaap/2025#CostMethodLifoMemberhttp://fasb.org/us-gaap/2025#CostMethodFifoMember http://fasb.org/us-gaap/2025#CostMethodLifoMemberhttp://fasb.org/us-gaap/2025#OtherCostAndExpenseOperatinghttp://fasb.org/us-gaap/2025#OtherCostAndExpenseOperatingDEERE & COhttp://fasb.org/us-gaap/2025#SecuredDebthttp://fasb.org/us-gaap/2025#OtherAssetsP1M18000000http://fasb.org/us-gaap/2025#OtherCostAndExpenseOperating320000002800000059000000http://fasb.org/us-gaap/2025#SellingGeneralAndAdministrativeExpense18000000http://fasb.org/us-gaap/2025#OtherCostAndExpenseOperatinghttp://www.deere.com/20251102#CorrectionOfTimingAndExpenseClassificationForPortionOfFinancialServicesIncentiveProgramsMemberP12MP12MP12MP12MP12MP24Mhttp://fasb.org/us-gaap/2025#OtherCostAndExpenseOperatinghttp://fasb.org/us-gaap/2025#OtherCostAndExpenseOperatinghttp://fasb.org/us-gaap/2025#OtherCostAndExpenseOperatinghttp://fasb.org/us-gaap/2025#OtherCostAndExpenseOperatinghttp://fasb.org/us-gaap/2025#OtherCostAndExpenseOperatinghttp://fasb.org/us-gaap/2025#OtherCostAndExpenseOperatinghttp://fasb.org/us-gaap/2025#OtherCostAndExpenseOperatinghttp://fasb.org/us-gaap/2025#OtherCostAndExpenseOperatinghttp://fasb.org/us-gaap/2025#OtherCostAndExpenseOperatinghttp://fasb.org/us-gaap/2025#OtherCostAndExpenseOperating2034 20352033 2034http://fasb.org/us-gaap/2025#OtherCostAndExpenseOperating60000000http://fasb.org/us-gaap/2025#SecuredDebthttp://fasb.org/us-gaap/2025#OtherAssetshttp://fasb.org/us-gaap/2025#OtherAssetshttp://fasb.org/us-gaap/2025#AccountsPayableAndAccruedLiabilitiesCurrentAndNoncurrentP1YP1Y0.002.00http://fasb.org/us-gaap/2025#MonteCarloModelMemberhttp://fasb.org/us-gaap/2025#BinomialModelMemberhttp://fasb.org/us-gaap/2025#OtherAssetshttp://fasb.org/us-gaap/2025#AccountsPayableAndAccruedLiabilitiesCurrentAndNoncurrenthttp://www.deere.com/20251102#PropertyPlantAndEquipmentAndFinanceLeaseRightOfUseAssetExcludingLessorAssetUnderOperatingLeaseAfterAccumulatedDepreciationAndAmortizationhttp://fasb.org/us-gaap/2025#DebtCurrenthttp://www.deere.com/20251102#LongTermDebtAndFinanceLeasesNoncurrenthttp://fasb.org/us-gaap/2025#DebtCurrent http://www.deere.com/20251102#LongTermDebtAndFinanceLeasesNoncurrentP6YP7YP4YP4Yhttp://fasb.org/us-gaap/2025#AccountsPayableAndAccruedLiabilitiesCurrentAndNoncurrenthttp://fasb.org/us-gaap/2025#DebtCurrent http://www.deere.com/20251102#LongTermDebtAndFinanceLeasesNoncurrenthttp://fasb.org/us-gaap/2025#CostOfRevenuehttp://fasb.org/us-gaap/2025#SellingGeneralAndAdministrativeExpenseP5Yhttp://fasb.org/us-gaap/2025#OtherCostAndExpenseOperating0000315189de:DiscreteTaxItemRealizationOfForeignNetOperatingLossesMember2024-10-282025-01-260000315189de:DiscreteTaxItemAdjustmentsToUncertainTaxPositionsMember2024-10-282025-01-260000315189us-gaap:TreasuryStockCommonMember2025-11-020000315189us-gaap:RetainedEarningsMember2025-11-020000315189us-gaap:NoncontrollingInterestMember2025-11-020000315189us-gaap:CommonStockMember2025-11-020000315189us-gaap:TreasuryStockCommonMember2024-10-270000315189us-gaap:RetainedEarningsMember2024-10-270000315189us-gaap:NoncontrollingInterestMember2024-10-270000315189us-gaap:CommonStockMember2024-10-270000315189us-gaap:TreasuryStockCommonMember2023-10-290000315189us-gaap:RetainedEarningsMember2023-10-290000315189us-gaap:NoncontrollingInterestMember2023-10-290000315189us-gaap:CommonStockMember2023-10-290000315189us-gaap:TreasuryStockCommonMember2022-10-300000315189us-gaap:RetainedEarningsMember2022-10-300000315189us-gaap:NoncontrollingInterestMember2022-10-300000315189us-gaap:CommonStockMember2022-10-300000315189us-gaap:AccumulatedOtherComprehensiveIncomeMember2022-10-300000315189us-gaap:AccumulatedTranslationAdjustmentMember2025-11-020000315189us-gaap:AccumulatedOtherComprehensiveIncomeMember2025-11-020000315189us-gaap:AccumulatedNetUnrealizedInvestmentGainLossMember2025-11-020000315189us-gaap:AccumulatedGainLossNetCashFlowHedgeParentMember2025-11-020000315189us-gaap:AccumulatedDefinedBenefitPlansAdjustmentMember2025-11-020000315189us-gaap:AccumulatedTranslationAdjustmentMember2024-10-270000315189us-gaap:AccumulatedOtherComprehensiveIncomeMember2024-10-270000315189us-gaap:AccumulatedNetUnrealizedInvestmentGainLossMember2024-10-270000315189us-gaap:AccumulatedGainLossNetCashFlowHedgeParentMember2024-10-270000315189us-gaap:AccumulatedDefinedBenefitPlansAdjustmentMember2024-10-270000315189us-gaap:AccumulatedTranslationAdjustmentMember2023-10-290000315189us-gaap:AccumulatedOtherComprehensiveIncomeMember2023-10-290000315189us-gaap:AccumulatedNetUnrealizedInvestmentGainLossMember2023-10-290000315189us-gaap:AccumulatedGainLossNetCashFlowHedgeParentMember2023-10-290000315189us-gaap:AccumulatedDefinedBenefitPlansAdjustmentMember2023-10-290000315189us-gaap:EmployeeStockOptionMember2024-10-270000315189us-gaap:EmployeeStockOptionMember2025-11-020000315189de:RestrictedStockUnitsServiceBasedMember2025-11-020000315189de:RestrictedStockUnitsPerformanceServiceBasedMember2025-11-020000315189de:RestrictedStockUnitsMarketServiceBasedMember2025-11-020000315189de:RestrictedStockUnitsServiceBasedMember2024-10-270000315189de:RestrictedStockUnitsPerformanceServiceBasedMember2024-10-270000315189de:RestrictedStockUnitsMarketServiceBasedMember2024-10-270000315189de:RestrictedStockUnitsServiceBasedMember2023-10-302024-10-270000315189de:RestrictedStockUnitsPerformanceServiceBasedMember2023-10-302024-10-270000315189de:RestrictedStockUnitsMarketServiceBasedMember2023-10-302024-10-270000315189de:RestrictedStockUnitsServiceBasedMember2022-10-312023-10-290000315189de:RestrictedStockUnitsPerformanceServiceBasedMember2022-10-312023-10-290000315189de:RestrictedStockUnitsServiceBasedMember2024-10-282025-11-020000315189srt:MinimumMemberus-gaap:EmployeeStockOptionMember2024-10-282025-11-020000315189srt:MinimumMemberde:RestrictedStockUnitsServiceBasedMember2024-10-282025-11-020000315189srt:MaximumMemberus-gaap:EmployeeStockOptionMember2024-10-282025-11-020000315189srt:MaximumMemberde:RestrictedStockUnitsServiceBasedMember2024-10-282025-11-020000315189de:RestrictedStockUnitsMarketServiceBasedMember2024-10-282025-11-020000315189de:SalesOfEquipmentMemberde:FinanceReceivablesAndNetInvestmentInLeasesMember2024-10-282025-11-020000315189de:FinanceReceivablesAndNetInvestmentInLeasesMember2024-10-282025-11-020000315189us-gaap:OperatingSegmentsMemberus-gaap:FinancialServiceMemberde:SmallAgricultureAndTurfSegmentMember2024-10-282025-11-020000315189us-gaap:OperatingSegmentsMemberus-gaap:FinancialServiceMemberde:ProductionAndPrecisionAgricultureSegmentMember2024-10-282025-11-020000315189us-gaap:OperatingSegmentsMemberus-gaap:FinancialServiceMemberde:FinancialServicesSegmentMember2024-10-282025-11-020000315189us-gaap:OperatingSegmentsMemberus-gaap:FinancialServiceMemberde:ConstructionAndForestrySegmentMember2024-10-282025-11-020000315189us-gaap:OperatingSegmentsMemberde:OtherMemberde:SmallAgricultureAndTurfSegmentMember2024-10-282025-11-020000315189us-gaap:OperatingSegmentsMemberde:OtherMemberde:ProductionAndPrecisionAgricultureSegmentMember2024-10-282025-11-020000315189us-gaap:OperatingSegmentsMemberde:OtherMemberde:FinancialServicesSegmentMember2024-10-282025-11-020000315189us-gaap:OperatingSegmentsMemberde:OtherMemberde:ConstructionAndForestrySegmentMember2024-10-282025-11-020000315189us-gaap:OperatingSegmentsMemberus-gaap:FinancialServiceMember2024-10-282025-11-020000315189us-gaap:OperatingSegmentsMemberde:OtherMember2024-10-282025-11-020000315189us-gaap:CorporateNonSegmentMemberde:OtherMember2024-10-282025-11-020000315189srt:LatinAmericaMemberde:SmallAgricultureAndTurfSegmentMember2024-10-282025-11-020000315189srt:LatinAmericaMemberde:ProductionAndPrecisionAgricultureSegmentMember2024-10-282025-11-020000315189srt:LatinAmericaMemberde:ConstructionAndForestrySegmentMember2024-10-282025-11-020000315189de:WesternEuropeMemberde:SmallAgricultureAndTurfSegmentMember2024-10-282025-11-020000315189de:WesternEuropeMemberde:ProductionAndPrecisionAgricultureSegmentMember2024-10-282025-11-020000315189de:WesternEuropeMemberde:ConstructionAndForestrySegmentMember2024-10-282025-11-020000315189de:SmallAgricultureAndTurfSegmentMemberus-gaap:TransferredOverTimeMember2024-10-282025-11-020000315189de:SmallAgricultureAndTurfSegmentMemberus-gaap:TransferredAtPointInTimeMember2024-10-282025-11-020000315189de:ProductionAndPrecisionAgricultureSegmentMemberus-gaap:TransferredOverTimeMember2024-10-282025-11-020000315189de:ProductionAndPrecisionAgricultureSegmentMemberus-gaap:TransferredAtPointInTimeMember2024-10-282025-11-020000315189de:ConstructionAndForestrySegmentMemberus-gaap:TransferredOverTimeMember2024-10-282025-11-020000315189de:ConstructionAndForestrySegmentMemberus-gaap:TransferredAtPointInTimeMember2024-10-282025-11-020000315189de:CentralEuropeAndCommonwealthOfIndependentStatesMemberde:SmallAgricultureAndTurfSegmentMember2024-10-282025-11-020000315189de:CentralEuropeAndCommonwealthOfIndependentStatesMemberde:ProductionAndPrecisionAgricultureSegmentMember2024-10-282025-11-020000315189de:CentralEuropeAndCommonwealthOfIndependentStatesMemberde:ConstructionAndForestrySegmentMember2024-10-282025-11-020000315189de:AsiaAfricaOceaniaAndMiddleEastMemberde:SmallAgricultureAndTurfSegmentMember2024-10-282025-11-020000315189de:AsiaAfricaOceaniaAndMiddleEastMemberde:ProductionAndPrecisionAgricultureSegmentMember2024-10-282025-11-020000315189de:AsiaAfricaOceaniaAndMiddleEastMemberde:ConstructionAndForestrySegmentMember2024-10-282025-11-020000315189country:USde:SmallAgricultureAndTurfSegmentMember2024-10-282025-11-020000315189country:USde:ProductionAndPrecisionAgricultureSegmentMember2024-10-282025-11-020000315189country:USde:ConstructionAndForestrySegmentMember2024-10-282025-11-020000315189country:CAde:SmallAgricultureAndTurfSegmentMember2024-10-282025-11-020000315189country:CAde:ProductionAndPrecisionAgricultureSegmentMember2024-10-282025-11-020000315189country:CAde:ConstructionAndForestrySegmentMember2024-10-282025-11-020000315189us-gaap:TransferredOverTimeMember2024-10-282025-11-020000315189us-gaap:TransferredAtPointInTimeMember2024-10-282025-11-020000315189us-gaap:FinancialServiceMember2024-10-282025-11-020000315189srt:LatinAmericaMember2024-10-282025-11-020000315189de:WesternEuropeMember2024-10-282025-11-020000315189de:CentralEuropeAndCommonwealthOfIndependentStatesMember2024-10-282025-11-020000315189de:AsiaAfricaOceaniaAndMiddleEastMember2024-10-282025-11-020000315189country:US2024-10-282025-11-020000315189country:CA2024-10-282025-11-020000315189us-gaap:OperatingSegmentsMemberus-gaap:FinancialServiceMemberde:SmallAgricultureAndTurfSegmentMember2023-10-302024-10-270000315189us-gaap:OperatingSegmentsMemberus-gaap:FinancialServiceMemberde:ProductionAndPrecisionAgricultureSegmentMember2023-10-302024-10-270000315189us-gaap:OperatingSegmentsMemberus-gaap:FinancialServiceMemberde:FinancialServicesSegmentMember2023-10-302024-10-270000315189us-gaap:OperatingSegmentsMemberus-gaap:FinancialServiceMemberde:ConstructionAndForestrySegmentMember2023-10-302024-10-270000315189us-gaap:OperatingSegmentsMemberde:OtherMemberde:SmallAgricultureAndTurfSegmentMember2023-10-302024-10-270000315189us-gaap:OperatingSegmentsMemberde:OtherMemberde:ProductionAndPrecisionAgricultureSegmentMember2023-10-302024-10-270000315189us-gaap:OperatingSegmentsMemberde:OtherMemberde:FinancialServicesSegmentMember2023-10-302024-10-270000315189us-gaap:OperatingSegmentsMemberde:OtherMemberde:ConstructionAndForestrySegmentMember2023-10-302024-10-270000315189us-gaap:OperatingSegmentsMemberus-gaap:FinancialServiceMember2023-10-302024-10-270000315189us-gaap:OperatingSegmentsMemberde:OtherMember2023-10-302024-10-270000315189us-gaap:CorporateNonSegmentMemberde:OtherMember2023-10-302024-10-270000315189srt:LatinAmericaMemberde:SmallAgricultureAndTurfSegmentMember2023-10-302024-10-270000315189srt:LatinAmericaMemberde:ProductionAndPrecisionAgricultureSegmentMember2023-10-302024-10-270000315189srt:LatinAmericaMemberde:ConstructionAndForestrySegmentMember2023-10-302024-10-270000315189de:WesternEuropeMemberde:SmallAgricultureAndTurfSegmentMember2023-10-302024-10-270000315189de:WesternEuropeMemberde:ProductionAndPrecisionAgricultureSegmentMember2023-10-302024-10-270000315189de:WesternEuropeMemberde:ConstructionAndForestrySegmentMember2023-10-302024-10-270000315189de:SmallAgricultureAndTurfSegmentMemberus-gaap:TransferredOverTimeMember2023-10-302024-10-270000315189de:SmallAgricultureAndTurfSegmentMemberus-gaap:TransferredAtPointInTimeMember2023-10-302024-10-270000315189de:ProductionAndPrecisionAgricultureSegmentMemberus-gaap:TransferredOverTimeMember2023-10-302024-10-270000315189de:ProductionAndPrecisionAgricultureSegmentMemberus-gaap:TransferredAtPointInTimeMember2023-10-302024-10-270000315189de:ConstructionAndForestrySegmentMemberus-gaap:TransferredOverTimeMember2023-10-302024-10-270000315189de:ConstructionAndForestrySegmentMemberus-gaap:TransferredAtPointInTimeMember2023-10-302024-10-270000315189de:CentralEuropeAndCommonwealthOfIndependentStatesMemberde:SmallAgricultureAndTurfSegmentMember2023-10-302024-10-270000315189de:CentralEuropeAndCommonwealthOfIndependentStatesMemberde:ProductionAndPrecisionAgricultureSegmentMember2023-10-302024-10-270000315189de:CentralEuropeAndCommonwealthOfIndependentStatesMemberde:ConstructionAndForestrySegmentMember2023-10-302024-10-270000315189de:AsiaAfricaOceaniaAndMiddleEastMemberde:SmallAgricultureAndTurfSegmentMember2023-10-302024-10-270000315189de:AsiaAfricaOceaniaAndMiddleEastMemberde:ProductionAndPrecisionAgricultureSegmentMember2023-10-302024-10-270000315189de:AsiaAfricaOceaniaAndMiddleEastMemberde:ConstructionAndForestrySegmentMember2023-10-302024-10-270000315189country:USde:SmallAgricultureAndTurfSegmentMember2023-10-302024-10-270000315189country:USde:ProductionAndPrecisionAgricultureSegmentMember2023-10-302024-10-270000315189country:USde:ConstructionAndForestrySegmentMember2023-10-302024-10-270000315189country:CAde:SmallAgricultureAndTurfSegmentMember2023-10-302024-10-270000315189country:CAde:ProductionAndPrecisionAgricultureSegmentMember2023-10-302024-10-270000315189country:CAde:ConstructionAndForestrySegmentMember2023-10-302024-10-270000315189us-gaap:TransferredOverTimeMember2023-10-302024-10-270000315189us-gaap:TransferredAtPointInTimeMember2023-10-302024-10-270000315189us-gaap:FinancialServiceMember2023-10-302024-10-270000315189srt:LatinAmericaMember2023-10-302024-10-270000315189de:WesternEuropeMember2023-10-302024-10-270000315189de:CentralEuropeAndCommonwealthOfIndependentStatesMember2023-10-302024-10-270000315189de:AsiaAfricaOceaniaAndMiddleEastMember2023-10-302024-10-270000315189country:US2023-10-302024-10-270000315189country:CA2023-10-302024-10-270000315189us-gaap:OperatingSegmentsMemberus-gaap:FinancialServiceMemberde:SmallAgricultureAndTurfSegmentMember2022-10-312023-10-290000315189us-gaap:OperatingSegmentsMemberus-gaap:FinancialServiceMemberde:ProductionAndPrecisionAgricultureSegmentMember2022-10-312023-10-290000315189us-gaap:OperatingSegmentsMemberus-gaap:FinancialServiceMemberde:FinancialServicesSegmentMember2022-10-312023-10-290000315189us-gaap:OperatingSegmentsMemberus-gaap:FinancialServiceMemberde:ConstructionAndForestrySegmentMember2022-10-312023-10-290000315189us-gaap:OperatingSegmentsMemberde:OtherMemberde:SmallAgricultureAndTurfSegmentMember2022-10-312023-10-290000315189us-gaap:OperatingSegmentsMemberde:OtherMemberde:ProductionAndPrecisionAgricultureSegmentMember2022-10-312023-10-290000315189us-gaap:OperatingSegmentsMemberde:OtherMemberde:FinancialServicesSegmentMember2022-10-312023-10-290000315189us-gaap:OperatingSegmentsMemberde:OtherMemberde:ConstructionAndForestrySegmentMember2022-10-312023-10-290000315189us-gaap:OperatingSegmentsMemberus-gaap:FinancialServiceMember2022-10-312023-10-290000315189us-gaap:OperatingSegmentsMemberde:OtherMember2022-10-312023-10-290000315189us-gaap:CorporateNonSegmentMemberde:OtherMember2022-10-312023-10-290000315189srt:LatinAmericaMemberde:SmallAgricultureAndTurfSegmentMember2022-10-312023-10-290000315189srt:LatinAmericaMemberde:ProductionAndPrecisionAgricultureSegmentMember2022-10-312023-10-290000315189srt:LatinAmericaMemberde:ConstructionAndForestrySegmentMember2022-10-312023-10-290000315189de:WesternEuropeMemberde:SmallAgricultureAndTurfSegmentMember2022-10-312023-10-290000315189de:WesternEuropeMemberde:ProductionAndPrecisionAgricultureSegmentMember2022-10-312023-10-290000315189de:WesternEuropeMemberde:ConstructionAndForestrySegmentMember2022-10-312023-10-290000315189de:SmallAgricultureAndTurfSegmentMemberus-gaap:TransferredOverTimeMember2022-10-312023-10-290000315189de:SmallAgricultureAndTurfSegmentMemberus-gaap:TransferredAtPointInTimeMember2022-10-312023-10-290000315189de:ProductionAndPrecisionAgricultureSegmentMemberus-gaap:TransferredOverTimeMember2022-10-312023-10-290000315189de:ProductionAndPrecisionAgricultureSegmentMemberus-gaap:TransferredAtPointInTimeMember2022-10-312023-10-290000315189de:ConstructionAndForestrySegmentMemberus-gaap:TransferredOverTimeMember2022-10-312023-10-290000315189de:ConstructionAndForestrySegmentMemberus-gaap:TransferredAtPointInTimeMember2022-10-312023-10-290000315189de:CentralEuropeAndCommonwealthOfIndependentStatesMemberde:SmallAgricultureAndTurfSegmentMember2022-10-312023-10-290000315189de:CentralEuropeAndCommonwealthOfIndependentStatesMemberde:ProductionAndPrecisionAgricultureSegmentMember2022-10-312023-10-290000315189de:CentralEuropeAndCommonwealthOfIndependentStatesMemberde:ConstructionAndForestrySegmentMember2022-10-312023-10-290000315189de:AsiaAfricaOceaniaAndMiddleEastMemberde:SmallAgricultureAndTurfSegmentMember2022-10-312023-10-290000315189de:AsiaAfricaOceaniaAndMiddleEastMemberde:ProductionAndPrecisionAgricultureSegmentMember2022-10-312023-10-290000315189de:AsiaAfricaOceaniaAndMiddleEastMemberde:ConstructionAndForestrySegmentMember2022-10-312023-10-290000315189country:USde:SmallAgricultureAndTurfSegmentMember2022-10-312023-10-290000315189country:USde:ProductionAndPrecisionAgricultureSegmentMember2022-10-312023-10-290000315189country:USde:ConstructionAndForestrySegmentMember2022-10-312023-10-290000315189country:CAde:SmallAgricultureAndTurfSegmentMember2022-10-312023-10-290000315189country:CAde:ProductionAndPrecisionAgricultureSegmentMember2022-10-312023-10-290000315189country:CAde:ConstructionAndForestrySegmentMember2022-10-312023-10-290000315189us-gaap:TransferredOverTimeMember2022-10-312023-10-290000315189us-gaap:TransferredAtPointInTimeMember2022-10-312023-10-290000315189us-gaap:FinancialServiceMember2022-10-312023-10-290000315189srt:LatinAmericaMember2022-10-312023-10-290000315189de:WesternEuropeMember2022-10-312023-10-290000315189de:SmallAgricultureAndTurfSegmentMember2022-10-312023-10-290000315189de:ProductionAndPrecisionAgricultureSegmentMember2022-10-312023-10-290000315189de:ConstructionAndForestrySegmentMember2022-10-312023-10-290000315189de:CentralEuropeAndCommonwealthOfIndependentStatesMember2022-10-312023-10-290000315189de:AsiaAfricaOceaniaAndMiddleEastMember2022-10-312023-10-290000315189country:US2022-10-312023-10-290000315189country:CA2022-10-312023-10-2900003151892030-10-282025-11-0200003151892029-10-292025-11-0200003151892028-10-302025-11-0200003151892027-11-012025-11-0200003151892026-11-022025-11-0200003151892025-11-032025-11-020000315189srt:LatinAmericaMemberde:FinancialServicesSegmentMember2024-10-282025-11-020000315189de:WesternEuropeMemberde:FinancialServicesSegmentMember2024-10-282025-11-020000315189de:FinancialServicesSegmentMemberus-gaap:TransferredOverTimeMember2024-10-282025-11-020000315189de:FinancialServicesSegmentMemberus-gaap:TransferredAtPointInTimeMember2024-10-282025-11-020000315189de:FinancialProductsMemberde:SmallAgricultureAndTurfSegmentMember2024-10-282025-11-020000315189de:FinancialProductsMemberde:ProductionAndPrecisionAgricultureSegmentMember2024-10-282025-11-020000315189de:FinancialProductsMemberde:FinancialServicesSegmentMember2024-10-282025-11-020000315189de:FinancialProductsMemberde:ConstructionAndForestrySegmentMember2024-10-282025-11-020000315189de:CentralEuropeAndCommonwealthOfIndependentStatesMemberde:FinancialServicesSegmentMember2024-10-282025-11-020000315189de:AsiaAfricaOceaniaAndMiddleEastMemberde:FinancialServicesSegmentMember2024-10-282025-11-020000315189country:USde:FinancialServicesSegmentMember2024-10-282025-11-020000315189country:CAde:FinancialServicesSegmentMember2024-10-282025-11-020000315189de:FinancialServicesSegmentMember2024-10-282025-11-020000315189de:FinancialProductsMember2024-10-282025-11-020000315189srt:LatinAmericaMemberde:FinancialServicesSegmentMember2023-10-302024-10-270000315189de:WesternEuropeMemberde:FinancialServicesSegmentMember2023-10-302024-10-270000315189de:FinancialServicesSegmentMemberus-gaap:TransferredOverTimeMember2023-10-302024-10-270000315189de:FinancialServicesSegmentMemberus-gaap:TransferredAtPointInTimeMember2023-10-302024-10-270000315189de:FinancialProductsMemberde:SmallAgricultureAndTurfSegmentMember2023-10-302024-10-270000315189de:FinancialProductsMemberde:ProductionAndPrecisionAgricultureSegmentMember2023-10-302024-10-270000315189de:FinancialProductsMemberde:FinancialServicesSegmentMember2023-10-302024-10-270000315189de:FinancialProductsMemberde:ConstructionAndForestrySegmentMember2023-10-302024-10-270000315189de:CentralEuropeAndCommonwealthOfIndependentStatesMemberde:FinancialServicesSegmentMember2023-10-302024-10-270000315189de:AsiaAfricaOceaniaAndMiddleEastMemberde:FinancialServicesSegmentMember2023-10-302024-10-270000315189country:USde:FinancialServicesSegmentMember2023-10-302024-10-270000315189country:CAde:FinancialServicesSegmentMember2023-10-302024-10-270000315189de:FinancialServicesSegmentMember2023-10-302024-10-270000315189de:FinancialProductsMember2023-10-302024-10-270000315189srt:LatinAmericaMemberde:FinancialServicesSegmentMember2022-10-312023-10-290000315189de:WesternEuropeMemberde:FinancialServicesSegmentMember2022-10-312023-10-290000315189de:FinancialServicesSegmentMemberus-gaap:TransferredOverTimeMember2022-10-312023-10-290000315189de:FinancialServicesSegmentMemberus-gaap:TransferredAtPointInTimeMember2022-10-312023-10-290000315189de:FinancialProductsMemberde:SmallAgricultureAndTurfSegmentMember2022-10-312023-10-290000315189de:FinancialProductsMemberde:ProductionAndPrecisionAgricultureSegmentMember2022-10-312023-10-290000315189de:FinancialProductsMemberde:FinancialServicesSegmentMember2022-10-312023-10-290000315189de:FinancialProductsMemberde:ConstructionAndForestrySegmentMember2022-10-312023-10-290000315189de:CentralEuropeAndCommonwealthOfIndependentStatesMemberde:FinancialServicesSegmentMember2022-10-312023-10-290000315189de:AsiaAfricaOceaniaAndMiddleEastMemberde:FinancialServicesSegmentMember2022-10-312023-10-290000315189country:USde:FinancialServicesSegmentMember2022-10-312023-10-290000315189country:CAde:FinancialServicesSegmentMember2022-10-312023-10-290000315189de:FinancialServicesSegmentMember2022-10-312023-10-290000315189de:FinancialProductsMember2022-10-312023-10-290000315189de:TurfMemberde:SmallAgricultureAndTurfSegmentMember2024-10-282025-11-020000315189de:SmallAgricultureMemberde:SmallAgricultureAndTurfSegmentMember2024-10-282025-11-020000315189de:RoadbuildingMemberde:ConstructionAndForestrySegmentMember2024-10-282025-11-020000315189de:ProductionAgricultureMemberde:ProductionAndPrecisionAgricultureSegmentMember2024-10-282025-11-020000315189de:ForestryMemberde:ConstructionAndForestrySegmentMember2024-10-282025-11-020000315189de:ConstructionEquipmentMemberde:ConstructionAndForestrySegmentMember2024-10-282025-11-020000315189de:CompactConstructionEquipmentMemberde:ConstructionAndForestrySegmentMember2024-10-282025-11-020000315189de:TurfMember2024-10-282025-11-020000315189de:SmallAgricultureMember2024-10-282025-11-020000315189de:RoadbuildingMember2024-10-282025-11-020000315189de:ProductionAgricultureMember2024-10-282025-11-020000315189de:ForestryMember2024-10-282025-11-020000315189de:ConstructionEquipmentMember2024-10-282025-11-020000315189de:CompactConstructionEquipmentMember2024-10-282025-11-020000315189de:TurfMemberde:SmallAgricultureAndTurfSegmentMember2023-10-302024-10-270000315189de:SmallAgricultureMemberde:SmallAgricultureAndTurfSegmentMember2023-10-302024-10-270000315189de:RoadbuildingMemberde:ConstructionAndForestrySegmentMember2023-10-302024-10-270000315189de:ProductionAgricultureMemberde:ProductionAndPrecisionAgricultureSegmentMember2023-10-302024-10-270000315189de:ForestryMemberde:ConstructionAndForestrySegmentMember2023-10-302024-10-270000315189de:ConstructionEquipmentMemberde:ConstructionAndForestrySegmentMember2023-10-302024-10-270000315189de:CompactConstructionEquipmentMemberde:ConstructionAndForestrySegmentMember2023-10-302024-10-270000315189de:TurfMember2023-10-302024-10-270000315189de:SmallAgricultureMember2023-10-302024-10-270000315189de:RoadbuildingMember2023-10-302024-10-270000315189de:ProductionAgricultureMember2023-10-302024-10-270000315189de:ForestryMember2023-10-302024-10-270000315189de:ConstructionEquipmentMember2023-10-302024-10-270000315189de:CompactConstructionEquipmentMember2023-10-302024-10-270000315189de:TurfMemberde:SmallAgricultureAndTurfSegmentMember2022-10-312023-10-290000315189de:SmallAgricultureMemberde:SmallAgricultureAndTurfSegmentMember2022-10-312023-10-290000315189de:RoadbuildingMemberde:ConstructionAndForestrySegmentMember2022-10-312023-10-290000315189de:ProductionAgricultureMemberde:ProductionAndPrecisionAgricultureSegmentMember2022-10-312023-10-290000315189de:ForestryMemberde:ConstructionAndForestrySegmentMember2022-10-312023-10-290000315189de:ConstructionEquipmentMemberde:ConstructionAndForestrySegmentMember2022-10-312023-10-290000315189de:CompactConstructionEquipmentMemberde:ConstructionAndForestrySegmentMember2022-10-312023-10-290000315189de:TurfMember2022-10-312023-10-290000315189de:SmallAgricultureMember2022-10-312023-10-290000315189de:RoadbuildingMember2022-10-312023-10-290000315189de:ProductionAgricultureMember2022-10-312023-10-290000315189de:ForestryMember2022-10-312023-10-290000315189de:ConstructionEquipmentMember2022-10-312023-10-290000315189de:CompactConstructionEquipmentMember2022-10-312023-10-290000315189us-gaap:SellingGeneralAndAdministrativeExpensesMemberus-gaap:ReclassificationOutOfAccumulatedOtherComprehensiveIncomeMemberus-gaap:AccumulatedTranslationAdjustmentMember2022-10-312023-10-290000315189us-gaap:SecuredDebtMember2024-10-282025-11-020000315189us-gaap:DisposalGroupDisposedOfBySaleNotDiscontinuedOperationsMemberde:SaleOfRoadbuildingBusinessInRussiaMemberde:ConstructionAndForestrySegmentMember2023-09-252023-10-290000315189us-gaap:DisposalGroupDisposedOfBySaleNotDiscontinuedOperationsMemberde:SaleOfFinancialServicesBusinessInRussiaMemberde:FinancialServicesSegmentMember2023-02-272023-03-260000315189de:PensionAndOtherPostretirementBenefitPlansDefinedBenefitMember2025-11-020000315189de:PensionAndOtherPostretirementBenefitPlansDefinedBenefitMember2024-10-270000315189us-gaap:ReclassificationOutOfAccumulatedOtherComprehensiveIncomeMemberus-gaap:AccumulatedNetUnrealizedInvestmentGainLossMember2024-10-282025-11-020000315189us-gaap:ReclassificationOutOfAccumulatedOtherComprehensiveIncomeMemberus-gaap:AccumulatedNetUnrealizedInvestmentGainLossMember2023-10-302024-10-270000315189us-gaap:ReclassificationOutOfAccumulatedOtherComprehensiveIncomeMemberus-gaap:AccumulatedDefinedBenefitPlansAdjustmentNetUnamortizedGainLossMember2024-10-282025-11-020000315189us-gaap:ReclassificationOutOfAccumulatedOtherComprehensiveIncomeMemberus-gaap:AccumulatedDefinedBenefitPlansAdjustmentNetPriorServiceCostCreditMember2024-10-282025-11-020000315189us-gaap:ReclassificationOutOfAccumulatedOtherComprehensiveIncomeMemberde:AccumulatedDefinedBenefitPlansAdjustmentNetSettlementsAndCurtailmentsMember2024-10-282025-11-020000315189us-gaap:ReclassificationOutOfAccumulatedOtherComprehensiveIncomeMemberus-gaap:AccumulatedDefinedBenefitPlansAdjustmentNetUnamortizedGainLossMember2023-10-302024-10-270000315189us-gaap:ReclassificationOutOfAccumulatedOtherComprehensiveIncomeMemberus-gaap:AccumulatedDefinedBenefitPlansAdjustmentNetPriorServiceCostCreditMember2023-10-302024-10-270000315189us-gaap:ReclassificationOutOfAccumulatedOtherComprehensiveIncomeMemberde:AccumulatedDefinedBenefitPlansAdjustmentNetSettlementsAndCurtailmentsMember2023-10-302024-10-270000315189us-gaap:OtherOperatingIncomeExpenseMemberus-gaap:ReclassificationOutOfAccumulatedOtherComprehensiveIncomeMemberus-gaap:AccumulatedTranslationAdjustmentMember2022-10-312023-10-290000315189us-gaap:ReclassificationOutOfAccumulatedOtherComprehensiveIncomeMemberus-gaap:AccumulatedDefinedBenefitPlansAdjustmentNetUnamortizedGainLossMember2022-10-312023-10-290000315189us-gaap:ReclassificationOutOfAccumulatedOtherComprehensiveIncomeMemberus-gaap:AccumulatedDefinedBenefitPlansAdjustmentNetPriorServiceCostCreditMember2022-10-312023-10-290000315189us-gaap:ReclassificationOutOfAccumulatedOtherComprehensiveIncomeMemberde:AccumulatedDefinedBenefitPlansAdjustmentNetSettlementsMember2022-10-312023-10-290000315189us-gaap:InterestRateSwapMember2024-10-282025-11-020000315189us-gaap:InterestRateSwapMember2023-10-302024-10-270000315189us-gaap:InterestRateSwapMember2022-10-312023-10-290000315189us-gaap:AccumulatedTranslationAdjustmentMember2024-10-282025-11-020000315189us-gaap:AccumulatedDefinedBenefitPlansAdjustmentMember2024-10-282025-11-020000315189us-gaap:AccumulatedTranslationAdjustmentMember2023-10-302024-10-270000315189us-gaap:AccumulatedDefinedBenefitPlansAdjustmentMember2023-10-302024-10-270000315189us-gaap:AccumulatedDefinedBenefitPlansAdjustmentMember2022-10-312023-10-290000315189us-gaap:AccumulatedNetUnrealizedInvestmentGainLossMember2024-10-282025-11-020000315189us-gaap:AccumulatedGainLossNetCashFlowHedgeParentMember2024-10-282025-11-020000315189us-gaap:AccumulatedDefinedBenefitPlansAdjustmentNetUnamortizedGainLossMember2024-10-282025-11-020000315189us-gaap:AccumulatedNetUnrealizedInvestmentGainLossMember2023-10-302024-10-270000315189us-gaap:AccumulatedGainLossNetCashFlowHedgeParentMember2023-10-302024-10-270000315189us-gaap:AccumulatedDefinedBenefitPlansAdjustmentNetUnamortizedGainLossMember2023-10-302024-10-270000315189us-gaap:AccumulatedTranslationAdjustmentMember2022-10-312023-10-290000315189us-gaap:AccumulatedNetUnrealizedInvestmentGainLossMember2022-10-312023-10-290000315189us-gaap:AccumulatedGainLossNetCashFlowHedgeParentMember2022-10-312023-10-290000315189us-gaap:AccumulatedDefinedBenefitPlansAdjustmentNetUnamortizedGainLossMember2022-10-312023-10-290000315189us-gaap:FairValueInputsLevel2Memberus-gaap:FairValueMeasurementsRecurringMemberus-gaap:USStatesAndPoliticalSubdivisionsMember2025-11-020000315189us-gaap:FairValueInputsLevel2Memberus-gaap:FairValueMeasurementsRecurringMemberus-gaap:USGovernmentDebtSecuritiesMember2025-11-020000315189us-gaap:FairValueInputsLevel2Memberus-gaap:FairValueMeasurementsRecurringMemberus-gaap:MortgageBackedSecuritiesMember2025-11-020000315189us-gaap:FairValueInputsLevel2Memberus-gaap:FairValueMeasurementsRecurringMemberus-gaap:ForeignGovernmentDebtSecuritiesMember2025-11-020000315189us-gaap:FairValueInputsLevel2Memberus-gaap:FairValueMeasurementsRecurringMemberus-gaap:CorporateDebtSecuritiesMember2025-11-020000315189us-gaap:FairValueInputsLevel2Memberus-gaap:FairValueMeasurementsRecurringMemberde:FixedIncomeFundsNonUSMember2025-11-020000315189us-gaap:FairValueInputsLevel1Memberus-gaap:FairValueMeasurementsRecurringMemberus-gaap:USGovernmentDebtSecuritiesMember2025-11-020000315189us-gaap:FairValueInputsLevel2Memberus-gaap:FairValueMeasurementsRecurringMember2025-11-020000315189us-gaap:FairValueInputsLevel1Memberus-gaap:FairValueMeasurementsRecurringMember2025-11-020000315189us-gaap:FairValueInputsLevel2Memberus-gaap:FairValueMeasurementsRecurringMemberus-gaap:USStatesAndPoliticalSubdivisionsMember2024-10-270000315189us-gaap:FairValueInputsLevel2Memberus-gaap:FairValueMeasurementsRecurringMemberus-gaap:USGovernmentDebtSecuritiesMember2024-10-270000315189us-gaap:FairValueInputsLevel2Memberus-gaap:FairValueMeasurementsRecurringMemberus-gaap:MortgageBackedSecuritiesMember2024-10-270000315189us-gaap:FairValueInputsLevel2Memberus-gaap:FairValueMeasurementsRecurringMemberus-gaap:ForeignGovernmentDebtSecuritiesMember2024-10-270000315189us-gaap:FairValueInputsLevel2Memberus-gaap:FairValueMeasurementsRecurringMemberus-gaap:CorporateDebtSecuritiesMember2024-10-270000315189us-gaap:FairValueInputsLevel1Memberus-gaap:FairValueMeasurementsRecurringMemberus-gaap:USGovernmentDebtSecuritiesMember2024-10-270000315189us-gaap:FairValueInputsLevel2Memberus-gaap:FairValueMeasurementsRecurringMember2024-10-270000315189us-gaap:FairValueInputsLevel1Memberus-gaap:FairValueMeasurementsRecurringMember2024-10-270000315189us-gaap:SellingGeneralAndAdministrativeExpensesMemberde:SmallAgricultureAndTurfSegmentMemberde:ClassActionAntitrustLawsuitMember2025-07-282025-11-020000315189us-gaap:SellingGeneralAndAdministrativeExpensesMemberde:ProductionAndPrecisionAgricultureSegmentMemberde:ClassActionAntitrustLawsuitMember2025-07-282025-11-020000315189us-gaap:SellingGeneralAndAdministrativeExpensesMemberde:ConstructionAndForestrySegmentMemberde:ClassActionAntitrustLawsuitMember2025-07-282025-11-020000315189us-gaap:SellingGeneralAndAdministrativeExpensesMemberde:ClassActionAntitrustLawsuitMember2025-07-282025-11-020000315189srt:MinimumMemberde:AcquisitionOfExcavatorFactoriesMemberus-gaap:InventoriesMember2022-02-282022-03-270000315189srt:MaximumMemberde:AcquisitionOfExcavatorFactoriesMemberus-gaap:InventoriesMember2022-02-282022-03-270000315189us-gaap:FairValueInputsLevel2Member2025-11-020000315189us-gaap:CarryingReportedAmountFairValueDisclosureMember2025-11-020000315189us-gaap:FairValueInputsLevel2Member2024-10-270000315189us-gaap:CarryingReportedAmountFairValueDisclosureMember2024-10-270000315189us-gaap:OtherIncomeMemberde:ProductionAndPrecisionAgricultureSegmentMemberde:LegalSettlementMember2023-10-302024-10-270000315189us-gaap:OtherIncomeMemberde:ConstructionAndForestrySegmentMemberde:LegalSettlementMember2023-10-302024-10-270000315189us-gaap:OtherIncomeMemberde:LegalSettlementMember2023-10-302024-10-270000315189de:LineOfCreditFacilityAgreementExpiringSecondQuarter2030Member2025-11-020000315189de:LineOfCreditFacilityAgreementExpiringSecondQuarter2028Member2025-11-020000315189de:LineOfCreditFacility364DayAgreementExpiringSecondQuarter2026Member2025-11-020000315189us-gaap:InterestRateSwapMemberus-gaap:ReclassificationOutOfAccumulatedOtherComprehensiveIncomeMemberus-gaap:AccumulatedGainLossNetCashFlowHedgeParentMember2024-10-282025-11-020000315189us-gaap:InterestRateSwapMemberus-gaap:ReclassificationOutOfAccumulatedOtherComprehensiveIncomeMemberus-gaap:AccumulatedGainLossNetCashFlowHedgeParentMember2023-10-302024-10-270000315189us-gaap:InterestRateSwapMemberus-gaap:ReclassificationOutOfAccumulatedOtherComprehensiveIncomeMemberus-gaap:AccumulatedGainLossNetCashFlowHedgeParentMember2022-10-312023-10-290000315189us-gaap:FinancialGuaranteeMember2025-11-020000315189de:SmallAgricultureAndTurfSegmentMember2025-11-020000315189de:ProductionAndPrecisionAgricultureSegmentMember2025-11-020000315189de:ConstructionAndForestrySegmentMember2025-11-020000315189de:SmallAgricultureAndTurfSegmentMember2024-10-270000315189de:ProductionAndPrecisionAgricultureSegmentMember2024-10-270000315189de:ConstructionAndForestrySegmentMember2024-10-270000315189de:SmallAgricultureAndTurfSegmentMember2023-10-290000315189de:ProductionAndPrecisionAgricultureSegmentMember2023-10-290000315189de:ConstructionAndForestrySegmentMember2023-10-290000315189us-gaap:FairValueInputsLevel3Memberus-gaap:FairValueMeasurementsNonrecurringMember2025-11-020000315189us-gaap:OtherIntangibleAssetsMember2025-11-020000315189us-gaap:CustomerRelationshipsMember2025-11-020000315189us-gaap:OtherIntangibleAssetsMember2024-10-270000315189us-gaap:CustomerRelationshipsMember2024-10-270000315189de:SalesOfEquipmentMemberus-gaap:ConstructionSectorMemberde:RetailNotesPortfolioSegmentMemberus-gaap:AssetNotPledgedAsCollateralMember2025-11-020000315189de:SalesOfEquipmentMemberus-gaap:AgriculturalSectorMemberde:RetailNotesPortfolioSegmentMemberus-gaap:AssetNotPledgedAsCollateralMember2025-11-020000315189us-gaap:ConstructionSectorMemberde:RetailNotesPortfolioSegmentMemberus-gaap:AssetPledgedAsCollateralWithRightMember2025-11-020000315189us-gaap:ConstructionSectorMemberde:RetailNotesPortfolioSegmentMemberus-gaap:AssetNotPledgedAsCollateralMember2025-11-020000315189us-gaap:AgriculturalSectorMemberde:RetailNotesPortfolioSegmentMemberus-gaap:AssetPledgedAsCollateralWithRightMember2025-11-020000315189us-gaap:AgriculturalSectorMemberde:RetailNotesPortfolioSegmentMemberus-gaap:AssetNotPledgedAsCollateralMember2025-11-020000315189de:SalesOfEquipmentMemberus-gaap:CommercialPortfolioSegmentMemberus-gaap:AssetNotPledgedAsCollateralMember2025-11-020000315189de:SalesOfEquipmentMemberde:RetailNotesPortfolioSegmentMemberus-gaap:AssetNotPledgedAsCollateralMember2025-11-020000315189us-gaap:CommercialPortfolioSegmentMemberus-gaap:AssetNotPledgedAsCollateralMember2025-11-020000315189de:RevolvingChargeAccountsPortfolioSegmentMemberus-gaap:AssetNotPledgedAsCollateralMember2025-11-020000315189de:RetailNotesPortfolioSegmentMemberus-gaap:AssetPledgedAsCollateralWithRightMember2025-11-020000315189de:RetailNotesPortfolioSegmentMemberus-gaap:AssetNotPledgedAsCollateralMember2025-11-020000315189de:SalesOfEquipmentMemberus-gaap:ConstructionSectorMemberde:RetailNotesPortfolioSegmentMemberus-gaap:AssetNotPledgedAsCollateralMember2024-10-270000315189de:SalesOfEquipmentMemberus-gaap:AgriculturalSectorMemberde:RetailNotesPortfolioSegmentMemberus-gaap:AssetNotPledgedAsCollateralMember2024-10-270000315189us-gaap:ConstructionSectorMemberde:RetailNotesPortfolioSegmentMemberus-gaap:AssetPledgedAsCollateralWithRightMember2024-10-270000315189us-gaap:ConstructionSectorMemberde:RetailNotesPortfolioSegmentMemberus-gaap:AssetNotPledgedAsCollateralMember2024-10-270000315189us-gaap:AgriculturalSectorMemberde:RetailNotesPortfolioSegmentMemberus-gaap:AssetPledgedAsCollateralWithRightMember2024-10-270000315189us-gaap:AgriculturalSectorMemberde:RetailNotesPortfolioSegmentMemberus-gaap:AssetNotPledgedAsCollateralMember2024-10-270000315189de:SalesOfEquipmentMemberus-gaap:CommercialPortfolioSegmentMemberus-gaap:AssetNotPledgedAsCollateralMember2024-10-270000315189de:SalesOfEquipmentMemberde:RetailNotesPortfolioSegmentMemberus-gaap:AssetNotPledgedAsCollateralMember2024-10-270000315189us-gaap:CommercialPortfolioSegmentMemberus-gaap:AssetNotPledgedAsCollateralMember2024-10-270000315189de:RevolvingChargeAccountsPortfolioSegmentMemberus-gaap:AssetNotPledgedAsCollateralMember2024-10-270000315189de:RetailNotesPortfolioSegmentMemberus-gaap:AssetPledgedAsCollateralWithRightMember2024-10-270000315189de:RetailNotesPortfolioSegmentMemberus-gaap:AssetNotPledgedAsCollateralMember2024-10-270000315189srt:RevisionOfPriorPeriodErrorCorrectionAdjustmentMemberde:FinancialServicesSegmentMember2023-01-300000315189de:FixedIncomeFundsNonUSMember2025-11-020000315189us-gaap:VariableInterestEntityNotPrimaryBeneficiaryMemberde:BancoJohnDeereSaMemberus-gaap:OtherAssetsMemberde:FinancialServicesSegmentMember2025-11-020000315189de:BancoJohnDeereSaMemberus-gaap:DisposalGroupDisposedOfBySaleNotDiscontinuedOperationsMemberde:FinancialServicesSegmentMember2025-02-230000315189de:IncomeLossFromEquityMethodInvestmentsMemberde:SmallAgricultureAndTurfSegmentMemberde:InvestmentImpairmentOfUnconsolidatedAffiliateMember2024-07-292024-10-270000315189us-gaap:EmployeeStockOptionMember2024-10-282025-11-020000315189us-gaap:EmployeeStockOptionMember2023-10-302024-10-270000315189us-gaap:EmployeeStockOptionMember2022-10-312023-10-290000315189us-gaap:FairValueInputsLevel3Memberus-gaap:FairValueMeasurementsNonrecurringMember2024-10-282025-11-020000315189us-gaap:DisposalGroupHeldforsaleNotDiscontinuedOperationsMemberde:SaleOfBancoJohnDeereSaMemberus-gaap:SellingGeneralAndAdministrativeExpensesMemberde:FinancialServicesSegmentMember2024-10-282025-01-260000315189us-gaap:FairValueInputsLevel3Memberus-gaap:FairValueMeasurementsNonrecurringMember2023-10-302024-10-270000315189us-gaap:OperatingSegmentsMemberus-gaap:DisposalGroupDisposedOfBySaleNotDiscontinuedOperationsMemberde:SaleOfRoadbuildingBusinessInRussiaMemberde:ConstructionAndForestrySegmentMember2023-09-252023-10-290000315189us-gaap:InterestRateSwapMemberus-gaap:FairValueHedgingMemberus-gaap:DesignatedAsHedgingInstrumentMember2025-11-020000315189us-gaap:InterestRateSwapMemberus-gaap:CashFlowHedgingMemberus-gaap:DesignatedAsHedgingInstrumentMember2025-11-020000315189us-gaap:CrossCurrencyInterestRateContractMemberus-gaap:NetInvestmentHedgingMemberus-gaap:DesignatedAsHedgingInstrumentMember2025-11-020000315189us-gaap:CrossCurrencyInterestRateContractMemberus-gaap:FairValueHedgingMemberus-gaap:DesignatedAsHedgingInstrumentMember2025-11-020000315189us-gaap:InterestRateSwapMemberus-gaap:NotDesignatedAsHedgingInstrumentEconomicHedgeMember2025-11-020000315189us-gaap:ForeignExchangeContractMemberus-gaap:NotDesignatedAsHedgingInstrumentEconomicHedgeMember2025-11-020000315189us-gaap:CrossCurrencyInterestRateContractMemberus-gaap:NotDesignatedAsHedgingInstrumentEconomicHedgeMember2025-11-020000315189us-gaap:InterestRateSwapMemberus-gaap:FairValueHedgingMemberus-gaap:DesignatedAsHedgingInstrumentMember2024-10-270000315189us-gaap:InterestRateSwapMemberus-gaap:CashFlowHedgingMemberus-gaap:DesignatedAsHedgingInstrumentMember2024-10-270000315189us-gaap:CrossCurrencyInterestRateContractMemberus-gaap:FairValueHedgingMemberus-gaap:DesignatedAsHedgingInstrumentMember2024-10-270000315189us-gaap:InterestRateSwapMemberus-gaap:NotDesignatedAsHedgingInstrumentEconomicHedgeMember2024-10-270000315189us-gaap:ForeignExchangeContractMemberus-gaap:NotDesignatedAsHedgingInstrumentEconomicHedgeMember2024-10-270000315189us-gaap:CrossCurrencyInterestRateContractMemberus-gaap:NotDesignatedAsHedgingInstrumentEconomicHedgeMember2024-10-270000315189us-gaap:ForeignExchangeContractMemberus-gaap:SalesMember2024-10-282025-11-020000315189us-gaap:ForeignExchangeContractMemberus-gaap:OtherExpenseMember2024-10-282025-11-020000315189us-gaap:ForeignExchangeContractMemberus-gaap:CostOfSalesMember2024-10-282025-11-020000315189us-gaap:InterestRateSwapMemberus-gaap:InterestExpenseMember2023-10-302024-10-270000315189us-gaap:ForeignExchangeContractMemberus-gaap:SalesMember2023-10-302024-10-270000315189us-gaap:ForeignExchangeContractMemberus-gaap:OtherExpenseMember2023-10-302024-10-270000315189us-gaap:ForeignExchangeContractMemberus-gaap:CostOfSalesMember2023-10-302024-10-270000315189us-gaap:InterestRateSwapMemberus-gaap:SalesMember2022-10-312023-10-290000315189us-gaap:InterestRateSwapMemberus-gaap:InterestExpenseMember2022-10-312023-10-290000315189us-gaap:ForeignExchangeContractMemberus-gaap:SalesMember2022-10-312023-10-290000315189us-gaap:ForeignExchangeContractMemberus-gaap:OtherExpenseMember2022-10-312023-10-290000315189us-gaap:ForeignExchangeContractMemberus-gaap:CostOfSalesMember2022-10-312023-10-290000315189us-gaap:AccountsPayableAndAccruedLiabilitiesMemberus-gaap:InterestRateSwapMemberus-gaap:FairValueHedgingMemberus-gaap:DesignatedAsHedgingInstrumentMember2025-11-020000315189us-gaap:AccountsPayableAndAccruedLiabilitiesMemberus-gaap:InterestRateSwapMemberus-gaap:CashFlowHedgingMemberus-gaap:DesignatedAsHedgingInstrumentMember2025-11-020000315189us-gaap:AccountsPayableAndAccruedLiabilitiesMemberus-gaap:CrossCurrencyInterestRateContractMemberus-gaap:NetInvestmentHedgingMemberus-gaap:DesignatedAsHedgingInstrumentMember2025-11-020000315189us-gaap:AccountsPayableAndAccruedLiabilitiesMemberus-gaap:CrossCurrencyInterestRateContractMemberus-gaap:FairValueHedgingMemberus-gaap:DesignatedAsHedgingInstrumentMember2025-11-020000315189us-gaap:AccountsPayableAndAccruedLiabilitiesMemberus-gaap:InterestRateSwapMemberus-gaap:NotDesignatedAsHedgingInstrumentEconomicHedgeMember2025-11-020000315189us-gaap:AccountsPayableAndAccruedLiabilitiesMemberus-gaap:ForeignExchangeContractMemberus-gaap:NotDesignatedAsHedgingInstrumentEconomicHedgeMember2025-11-020000315189us-gaap:AccountsPayableAndAccruedLiabilitiesMemberus-gaap:FairValueInputsLevel2Memberus-gaap:FairValueMeasurementsRecurringMember2025-11-020000315189us-gaap:AccountsPayableAndAccruedLiabilitiesMemberus-gaap:CrossCurrencyInterestRateContractMemberus-gaap:NotDesignatedAsHedgingInstrumentEconomicHedgeMember2025-11-020000315189us-gaap:AccountsPayableAndAccruedLiabilitiesMemberus-gaap:InterestRateSwapMemberus-gaap:FairValueHedgingMemberus-gaap:DesignatedAsHedgingInstrumentMember2024-10-270000315189us-gaap:AccountsPayableAndAccruedLiabilitiesMemberus-gaap:InterestRateSwapMemberus-gaap:CashFlowHedgingMemberus-gaap:DesignatedAsHedgingInstrumentMember2024-10-270000315189us-gaap:AccountsPayableAndAccruedLiabilitiesMemberus-gaap:InterestRateSwapMemberus-gaap:NotDesignatedAsHedgingInstrumentEconomicHedgeMember2024-10-270000315189us-gaap:AccountsPayableAndAccruedLiabilitiesMemberus-gaap:ForeignExchangeContractMemberus-gaap:NotDesignatedAsHedgingInstrumentEconomicHedgeMember2024-10-270000315189us-gaap:AccountsPayableAndAccruedLiabilitiesMemberus-gaap:FairValueInputsLevel2Memberus-gaap:FairValueMeasurementsRecurringMember2024-10-270000315189us-gaap:OtherAssetsMemberus-gaap:InterestRateSwapMemberus-gaap:FairValueHedgingMemberus-gaap:DesignatedAsHedgingInstrumentMember2025-11-020000315189us-gaap:OtherAssetsMemberus-gaap:CrossCurrencyInterestRateContractMemberus-gaap:FairValueHedgingMemberus-gaap:DesignatedAsHedgingInstrumentMember2025-11-020000315189us-gaap:OtherAssetsMemberus-gaap:InterestRateSwapMemberus-gaap:NotDesignatedAsHedgingInstrumentEconomicHedgeMember2025-11-020000315189us-gaap:OtherAssetsMemberus-gaap:ForeignExchangeContractMemberus-gaap:NotDesignatedAsHedgingInstrumentEconomicHedgeMember2025-11-020000315189us-gaap:OtherAssetsMemberus-gaap:FairValueInputsLevel2Memberus-gaap:FairValueMeasurementsRecurringMember2025-11-020000315189us-gaap:OtherAssetsMemberus-gaap:CrossCurrencyInterestRateContractMemberus-gaap:NotDesignatedAsHedgingInstrumentEconomicHedgeMember2025-11-020000315189us-gaap:OtherAssetsMemberus-gaap:InterestRateSwapMemberus-gaap:FairValueHedgingMemberus-gaap:DesignatedAsHedgingInstrumentMember2024-10-270000315189us-gaap:OtherAssetsMemberus-gaap:InterestRateSwapMemberus-gaap:CashFlowHedgingMemberus-gaap:DesignatedAsHedgingInstrumentMember2024-10-270000315189us-gaap:OtherAssetsMemberus-gaap:CrossCurrencyInterestRateContractMemberus-gaap:FairValueHedgingMemberus-gaap:DesignatedAsHedgingInstrumentMember2024-10-270000315189us-gaap:OtherAssetsMemberus-gaap:InterestRateSwapMemberus-gaap:NotDesignatedAsHedgingInstrumentEconomicHedgeMember2024-10-270000315189us-gaap:OtherAssetsMemberus-gaap:ForeignExchangeContractMemberus-gaap:NotDesignatedAsHedgingInstrumentEconomicHedgeMember2024-10-270000315189us-gaap:OtherAssetsMemberus-gaap:FairValueInputsLevel2Memberus-gaap:FairValueMeasurementsRecurringMember2024-10-270000315189us-gaap:OtherAssetsMemberus-gaap:CrossCurrencyInterestRateContractMemberus-gaap:NotDesignatedAsHedgingInstrumentEconomicHedgeMember2024-10-270000315189us-gaap:IntersegmentEliminationMember2024-10-282025-11-020000315189us-gaap:IntersegmentEliminationMember2023-10-302024-10-270000315189us-gaap:IntersegmentEliminationMember2022-10-312023-10-290000315189us-gaap:DefinedBenefitPostretirementHealthCoverageMember2024-10-282025-11-020000315189us-gaap:DefinedBenefitPostretirementHealthCoverageMember2023-10-302024-10-270000315189de:DefinedBenefitPlanRealEstateInvestmentsAndFundsMemberus-gaap:PensionPlansDefinedBenefitMember2025-11-020000315189de:DefinedBenefitPlanRealEstateInvestmentsAndFundsMemberus-gaap:DefinedBenefitPostretirementHealthCoverageMember2025-11-020000315189de:DefinedBenefitPlanOtherInvestmentsMemberus-gaap:PensionPlansDefinedBenefitMember2025-11-020000315189de:DefinedBenefitPlanOtherInvestmentsMemberus-gaap:DefinedBenefitPostretirementHealthCoverageMember2025-11-020000315189de:DefinedBenefitPlanEquityInvestmentsMemberus-gaap:PensionPlansDefinedBenefitMember2025-11-020000315189de:DefinedBenefitPlanEquityInvestmentsMemberus-gaap:DefinedBenefitPostretirementHealthCoverageMember2025-11-020000315189de:DefinedBenefitPlanDebtInvestmentsMemberus-gaap:PensionPlansDefinedBenefitMember2025-11-020000315189de:DefinedBenefitPlanDebtInvestmentsMemberus-gaap:DefinedBenefitPostretirementHealthCoverageMember2025-11-020000315189country:CAus-gaap:PensionPlansDefinedBenefitMember2022-10-312023-10-290000315189us-gaap:VentureCapitalFundsMemberus-gaap:FairValueMeasuredAtNetAssetValuePerShareMemberus-gaap:PensionPlansDefinedBenefitMember2025-11-020000315189us-gaap:VentureCapitalFundsMemberus-gaap:FairValueMeasuredAtNetAssetValuePerShareMemberus-gaap:DefinedBenefitPostretirementHealthCoverageMember2025-11-020000315189us-gaap:USTreasuryAndGovernmentMemberus-gaap:FairValueInputsLevel2Memberus-gaap:PensionPlansDefinedBenefitMember2025-11-020000315189us-gaap:USTreasuryAndGovernmentMemberus-gaap:FairValueInputsLevel2Memberus-gaap:DefinedBenefitPostretirementHealthCoverageMember2025-11-020000315189us-gaap:USTreasuryAndGovernmentMemberus-gaap:FairValueInputsLevel1Memberus-gaap:PensionPlansDefinedBenefitMember2025-11-020000315189us-gaap:USTreasuryAndGovernmentMemberus-gaap:FairValueInputsLevel1Memberus-gaap:DefinedBenefitPostretirementHealthCoverageMember2025-11-020000315189us-gaap:USTreasuryAndGovernmentMemberde:FairValueInputsLevel1AndLevel2Memberus-gaap:PensionPlansDefinedBenefitMember2025-11-020000315189us-gaap:USTreasuryAndGovernmentMemberde:FairValueInputsLevel1AndLevel2Memberus-gaap:DefinedBenefitPostretirementHealthCoverageMember2025-11-020000315189us-gaap:PrivateEquityFundsMemberus-gaap:FairValueMeasuredAtNetAssetValuePerShareMemberus-gaap:PensionPlansDefinedBenefitMember2025-11-020000315189us-gaap:PrivateEquityFundsMemberus-gaap:FairValueMeasuredAtNetAssetValuePerShareMemberus-gaap:DefinedBenefitPostretirementHealthCoverageMember2025-11-020000315189us-gaap:MortgageBackedSecuritiesMemberus-gaap:FairValueInputsLevel2Memberus-gaap:PensionPlansDefinedBenefitMember2025-11-020000315189us-gaap:MortgageBackedSecuritiesMemberus-gaap:FairValueInputsLevel2Memberus-gaap:DefinedBenefitPostretirementHealthCoverageMember2025-11-020000315189us-gaap:MortgageBackedSecuritiesMemberde:FairValueInputsLevel1AndLevel2Memberus-gaap:PensionPlansDefinedBenefitMember2025-11-020000315189us-gaap:MortgageBackedSecuritiesMemberde:FairValueInputsLevel1AndLevel2Memberus-gaap:DefinedBenefitPostretirementHealthCoverageMember2025-11-020000315189us-gaap:MoneyMarketFundsMemberus-gaap:FairValueMeasuredAtNetAssetValuePerShareMemberus-gaap:PensionPlansDefinedBenefitMember2025-11-020000315189us-gaap:HedgeFundsMultistrategyMemberus-gaap:FairValueMeasuredAtNetAssetValuePerShareMemberus-gaap:PensionPlansDefinedBenefitMember2025-11-020000315189us-gaap:HedgeFundsMultistrategyMemberus-gaap:FairValueMeasuredAtNetAssetValuePerShareMemberus-gaap:DefinedBenefitPostretirementHealthCoverageMember2025-11-020000315189us-gaap:FixedIncomeFundsMemberus-gaap:FairValueMeasuredAtNetAssetValuePerShareMemberus-gaap:PensionPlansDefinedBenefitMember2025-11-020000315189us-gaap:FixedIncomeFundsMemberus-gaap:FairValueMeasuredAtNetAssetValuePerShareMemberus-gaap:DefinedBenefitPostretirementHealthCoverageMember2025-11-020000315189us-gaap:DefinedBenefitPlanEquitySecuritiesUsMemberus-gaap:FairValueInputsLevel2Memberus-gaap:PensionPlansDefinedBenefitMember2025-11-020000315189us-gaap:DefinedBenefitPlanEquitySecuritiesUsMemberus-gaap:FairValueInputsLevel1Memberus-gaap:PensionPlansDefinedBenefitMember2025-11-020000315189us-gaap:DefinedBenefitPlanEquitySecuritiesUsMemberde:FairValueInputsLevel1AndLevel2Memberus-gaap:PensionPlansDefinedBenefitMember2025-11-020000315189us-gaap:DefinedBenefitPlanEquitySecuritiesMemberus-gaap:FairValueInputsLevel2Memberus-gaap:DefinedBenefitPostretirementHealthCoverageMember2025-11-020000315189us-gaap:DefinedBenefitPlanEquitySecuritiesMemberus-gaap:FairValueInputsLevel1Memberus-gaap:DefinedBenefitPostretirementHealthCoverageMember2025-11-020000315189us-gaap:DefinedBenefitPlanEquitySecuritiesMemberde:FairValueInputsLevel1AndLevel2Memberus-gaap:DefinedBenefitPostretirementHealthCoverageMember2025-11-020000315189us-gaap:CorporateDebtSecuritiesMemberus-gaap:FairValueInputsLevel2Memberus-gaap:PensionPlansDefinedBenefitMember2025-11-020000315189us-gaap:CorporateDebtSecuritiesMemberus-gaap:FairValueInputsLevel2Memberus-gaap:DefinedBenefitPostretirementHealthCoverageMember2025-11-020000315189us-gaap:CorporateDebtSecuritiesMemberde:FairValueInputsLevel1AndLevel2Memberus-gaap:PensionPlansDefinedBenefitMember2025-11-020000315189us-gaap:CorporateDebtSecuritiesMemberde:FairValueInputsLevel1AndLevel2Memberus-gaap:DefinedBenefitPostretirementHealthCoverageMember2025-11-020000315189de:EquityFundsUSMemberus-gaap:FairValueMeasuredAtNetAssetValuePerShareMemberus-gaap:PensionPlansDefinedBenefitMember2025-11-020000315189de:EquityFundsUSMemberus-gaap:FairValueMeasuredAtNetAssetValuePerShareMemberus-gaap:DefinedBenefitPostretirementHealthCoverageMember2025-11-020000315189de:EquityFundsNonUSMemberus-gaap:FairValueMeasuredAtNetAssetValuePerShareMemberus-gaap:PensionPlansDefinedBenefitMember2025-11-020000315189de:EquityFundsNonUSMemberus-gaap:FairValueMeasuredAtNetAssetValuePerShareMemberus-gaap:DefinedBenefitPostretirementHealthCoverageMember2025-11-020000315189de:DefinedBenefitPlanSecuritiesSoldShortMemberus-gaap:FairValueInputsLevel2Memberus-gaap:PensionPlansDefinedBenefitMember2025-11-020000315189de:DefinedBenefitPlanSecuritiesSoldShortMemberus-gaap:FairValueInputsLevel1Memberus-gaap:PensionPlansDefinedBenefitMember2025-11-020000315189de:DefinedBenefitPlanSecuritiesSoldShortMemberde:FairValueInputsLevel1AndLevel2Memberus-gaap:PensionPlansDefinedBenefitMember2025-11-020000315189de:DefinedBenefitPlanSecuritiesLendingLiabilityMemberus-gaap:FairValueInputsLevel2Memberus-gaap:PensionPlansDefinedBenefitMember2025-11-020000315189de:DefinedBenefitPlanSecuritiesLendingLiabilityMemberus-gaap:FairValueInputsLevel2Memberus-gaap:DefinedBenefitPostretirementHealthCoverageMember2025-11-020000315189de:DefinedBenefitPlanSecuritiesLendingLiabilityMemberde:FairValueInputsLevel1AndLevel2Memberus-gaap:PensionPlansDefinedBenefitMember2025-11-020000315189de:DefinedBenefitPlanSecuritiesLendingLiabilityMemberde:FairValueInputsLevel1AndLevel2Memberus-gaap:DefinedBenefitPostretirementHealthCoverageMember2025-11-020000315189de:DefinedBenefitPlanSecuritiesLendingCollateralMemberus-gaap:FairValueInputsLevel2Memberus-gaap:PensionPlansDefinedBenefitMember2025-11-020000315189de:DefinedBenefitPlanSecuritiesLendingCollateralMemberus-gaap:FairValueInputsLevel2Memberus-gaap:DefinedBenefitPostretirementHealthCoverageMember2025-11-020000315189de:DefinedBenefitPlanSecuritiesLendingCollateralMemberde:FairValueInputsLevel1AndLevel2Memberus-gaap:PensionPlansDefinedBenefitMember2025-11-020000315189de:DefinedBenefitPlanSecuritiesLendingCollateralMemberde:FairValueInputsLevel1AndLevel2Memberus-gaap:DefinedBenefitPostretirementHealthCoverageMember2025-11-020000315189de:DefinedBenefitPlanReceivablesAndPayablesMemberus-gaap:FairValueInputsLevel1Memberus-gaap:PensionPlansDefinedBenefitMember2025-11-020000315189de:DefinedBenefitPlanReceivablesAndPayablesMemberde:FairValueInputsLevel1AndLevel2Memberus-gaap:PensionPlansDefinedBenefitMember2025-11-020000315189de:DefinedBenefitPlanRealEstateFundsMemberus-gaap:FairValueMeasuredAtNetAssetValuePerShareMemberus-gaap:PensionPlansDefinedBenefitMember2025-11-020000315189de:DefinedBenefitPlanRealEstateFundsMemberus-gaap:FairValueMeasuredAtNetAssetValuePerShareMemberus-gaap:DefinedBenefitPostretirementHealthCoverageMember2025-11-020000315189de:DefinedBenefitPlanPensionPlanDerivativeInterestRateContractsLiabilityMemberus-gaap:FairValueInputsLevel2Memberus-gaap:PensionPlansDefinedBenefitMember2025-11-020000315189de:DefinedBenefitPlanPensionPlanDerivativeInterestRateContractsLiabilityMemberus-gaap:FairValueInputsLevel1Memberus-gaap:PensionPlansDefinedBenefitMember2025-11-020000315189de:DefinedBenefitPlanPensionPlanDerivativeInterestRateContractsLiabilityMemberde:FairValueInputsLevel1AndLevel2Memberus-gaap:PensionPlansDefinedBenefitMember2025-11-020000315189de:DefinedBenefitPlanPensionPlanDerivativeAssetMemberus-gaap:FairValueInputsLevel2Memberus-gaap:PensionPlansDefinedBenefitMember2025-11-020000315189de:DefinedBenefitPlanPensionPlanDerivativeAssetMemberus-gaap:FairValueInputsLevel1Memberus-gaap:PensionPlansDefinedBenefitMember2025-11-020000315189de:DefinedBenefitPlanPensionPlanDerivativeAssetMemberde:FairValueInputsLevel1AndLevel2Memberus-gaap:PensionPlansDefinedBenefitMember2025-11-020000315189de:DefinedBenefitPlanOtherMemberus-gaap:FairValueInputsLevel2Memberus-gaap:DefinedBenefitPostretirementHealthCoverageMember2025-11-020000315189de:DefinedBenefitPlanOtherMemberus-gaap:FairValueInputsLevel1Memberus-gaap:DefinedBenefitPostretirementHealthCoverageMember2025-11-020000315189de:DefinedBenefitPlanOtherMemberde:FairValueInputsLevel1AndLevel2Memberus-gaap:DefinedBenefitPostretirementHealthCoverageMember2025-11-020000315189de:DefinedBenefitPlanOtherInvestmentsMemberus-gaap:FairValueMeasuredAtNetAssetValuePerShareMemberus-gaap:PensionPlansDefinedBenefitMember2025-11-020000315189de:DefinedBenefitPlanOtherInvestmentsMemberus-gaap:FairValueMeasuredAtNetAssetValuePerShareMemberus-gaap:DefinedBenefitPostretirementHealthCoverageMember2025-11-020000315189de:DefinedBenefitPlanOtherInvestmentsMemberus-gaap:FairValueInputsLevel2Memberus-gaap:PensionPlansDefinedBenefitMember2025-11-020000315189de:DefinedBenefitPlanOtherInvestmentsMemberus-gaap:FairValueInputsLevel1Memberus-gaap:PensionPlansDefinedBenefitMember2025-11-020000315189de:DefinedBenefitPlanOtherInvestmentsMemberde:FairValueInputsLevel1AndLevel2Memberus-gaap:PensionPlansDefinedBenefitMember2025-11-020000315189de:DefinedBenefitPlanEquitySecuritiesAndFundsNonUsMemberus-gaap:FairValueInputsLevel2Memberus-gaap:PensionPlansDefinedBenefitMember2025-11-020000315189de:DefinedBenefitPlanEquitySecuritiesAndFundsNonUsMemberus-gaap:FairValueInputsLevel1Memberus-gaap:PensionPlansDefinedBenefitMember2025-11-020000315189de:DefinedBenefitPlanEquitySecuritiesAndFundsNonUsMemberde:FairValueInputsLevel1AndLevel2Memberus-gaap:PensionPlansDefinedBenefitMember2025-11-020000315189de:DefinedBenefitPlanCashAndShortTermInvestmentsMemberus-gaap:FairValueInputsLevel2Memberus-gaap:PensionPlansDefinedBenefitMember2025-11-020000315189de:DefinedBenefitPlanCashAndShortTermInvestmentsMemberus-gaap:FairValueInputsLevel1Memberus-gaap:PensionPlansDefinedBenefitMember2025-11-020000315189de:DefinedBenefitPlanCashAndShortTermInvestmentsMemberus-gaap:FairValueInputsLevel1Memberus-gaap:DefinedBenefitPostretirementHealthCoverageMember2025-11-020000315189de:DefinedBenefitPlanCashAndShortTermInvestmentsMemberde:FairValueInputsLevel1AndLevel2Memberus-gaap:PensionPlansDefinedBenefitMember2025-11-020000315189de:DefinedBenefitPlanCashAndShortTermInvestmentsMemberde:FairValueInputsLevel1AndLevel2Memberus-gaap:DefinedBenefitPostretirementHealthCoverageMember2025-11-020000315189us-gaap:FairValueInputsLevel2Memberus-gaap:PensionPlansDefinedBenefitMember2025-11-020000315189us-gaap:FairValueInputsLevel2Memberus-gaap:DefinedBenefitPostretirementHealthCoverageMember2025-11-020000315189us-gaap:FairValueInputsLevel1Memberus-gaap:PensionPlansDefinedBenefitMember2025-11-020000315189us-gaap:FairValueInputsLevel1Memberus-gaap:DefinedBenefitPostretirementHealthCoverageMember2025-11-020000315189de:FairValueInputsLevel1AndLevel2Memberus-gaap:PensionPlansDefinedBenefitMember2025-11-020000315189de:FairValueInputsLevel1AndLevel2Memberus-gaap:DefinedBenefitPostretirementHealthCoverageMember2025-11-020000315189us-gaap:VentureCapitalFundsMemberus-gaap:FairValueMeasuredAtNetAssetValuePerShareMemberus-gaap:PensionPlansDefinedBenefitMember2024-10-270000315189us-gaap:VentureCapitalFundsMemberus-gaap:FairValueMeasuredAtNetAssetValuePerShareMemberus-gaap:DefinedBenefitPostretirementHealthCoverageMember2024-10-270000315189us-gaap:USTreasuryAndGovernmentMemberus-gaap:FairValueInputsLevel2Memberus-gaap:PensionPlansDefinedBenefitMember2024-10-270000315189us-gaap:USTreasuryAndGovernmentMemberus-gaap:FairValueInputsLevel2Memberus-gaap:DefinedBenefitPostretirementHealthCoverageMember2024-10-270000315189us-gaap:USTreasuryAndGovernmentMemberus-gaap:FairValueInputsLevel1Memberus-gaap:PensionPlansDefinedBenefitMember2024-10-270000315189us-gaap:USTreasuryAndGovernmentMemberus-gaap:FairValueInputsLevel1Memberus-gaap:DefinedBenefitPostretirementHealthCoverageMember2024-10-270000315189us-gaap:USTreasuryAndGovernmentMemberde:FairValueInputsLevel1AndLevel2Memberus-gaap:PensionPlansDefinedBenefitMember2024-10-270000315189us-gaap:USTreasuryAndGovernmentMemberde:FairValueInputsLevel1AndLevel2Memberus-gaap:DefinedBenefitPostretirementHealthCoverageMember2024-10-270000315189us-gaap:PrivateEquityFundsMemberus-gaap:FairValueMeasuredAtNetAssetValuePerShareMemberus-gaap:PensionPlansDefinedBenefitMember2024-10-270000315189us-gaap:PrivateEquityFundsMemberus-gaap:FairValueMeasuredAtNetAssetValuePerShareMemberus-gaap:DefinedBenefitPostretirementHealthCoverageMember2024-10-270000315189us-gaap:MortgageBackedSecuritiesMemberus-gaap:FairValueInputsLevel2Memberus-gaap:PensionPlansDefinedBenefitMember2024-10-270000315189us-gaap:MortgageBackedSecuritiesMemberus-gaap:FairValueInputsLevel2Memberus-gaap:DefinedBenefitPostretirementHealthCoverageMember2024-10-270000315189us-gaap:MortgageBackedSecuritiesMemberde:FairValueInputsLevel1AndLevel2Memberus-gaap:PensionPlansDefinedBenefitMember2024-10-270000315189us-gaap:MortgageBackedSecuritiesMemberde:FairValueInputsLevel1AndLevel2Memberus-gaap:DefinedBenefitPostretirementHealthCoverageMember2024-10-270000315189us-gaap:MoneyMarketFundsMemberus-gaap:FairValueMeasuredAtNetAssetValuePerShareMemberus-gaap:PensionPlansDefinedBenefitMember2024-10-270000315189us-gaap:HedgeFundsMultistrategyMemberus-gaap:FairValueMeasuredAtNetAssetValuePerShareMemberus-gaap:PensionPlansDefinedBenefitMember2024-10-270000315189us-gaap:HedgeFundsMultistrategyMemberus-gaap:FairValueMeasuredAtNetAssetValuePerShareMemberus-gaap:DefinedBenefitPostretirementHealthCoverageMember2024-10-270000315189us-gaap:FixedIncomeFundsMemberus-gaap:FairValueMeasuredAtNetAssetValuePerShareMemberus-gaap:PensionPlansDefinedBenefitMember2024-10-270000315189us-gaap:FixedIncomeFundsMemberus-gaap:FairValueMeasuredAtNetAssetValuePerShareMemberus-gaap:DefinedBenefitPostretirementHealthCoverageMember2024-10-270000315189us-gaap:DefinedBenefitPlanEquitySecuritiesUsMemberus-gaap:FairValueInputsLevel2Memberus-gaap:PensionPlansDefinedBenefitMember2024-10-270000315189us-gaap:DefinedBenefitPlanEquitySecuritiesUsMemberus-gaap:FairValueInputsLevel1Memberus-gaap:PensionPlansDefinedBenefitMember2024-10-270000315189us-gaap:DefinedBenefitPlanEquitySecuritiesUsMemberde:FairValueInputsLevel1AndLevel2Memberus-gaap:PensionPlansDefinedBenefitMember2024-10-270000315189us-gaap:CorporateDebtSecuritiesMemberus-gaap:FairValueInputsLevel2Memberus-gaap:PensionPlansDefinedBenefitMember2024-10-270000315189us-gaap:CorporateDebtSecuritiesMemberus-gaap:FairValueInputsLevel2Memberus-gaap:DefinedBenefitPostretirementHealthCoverageMember2024-10-270000315189us-gaap:CorporateDebtSecuritiesMemberde:FairValueInputsLevel1AndLevel2Memberus-gaap:PensionPlansDefinedBenefitMember2024-10-270000315189us-gaap:CorporateDebtSecuritiesMemberde:FairValueInputsLevel1AndLevel2Memberus-gaap:DefinedBenefitPostretirementHealthCoverageMember2024-10-270000315189de:EquityFundsUSMemberus-gaap:FairValueMeasuredAtNetAssetValuePerShareMemberus-gaap:PensionPlansDefinedBenefitMember2024-10-270000315189de:EquityFundsUSMemberus-gaap:FairValueMeasuredAtNetAssetValuePerShareMemberus-gaap:DefinedBenefitPostretirementHealthCoverageMember2024-10-270000315189de:EquityFundsNonUSMemberus-gaap:FairValueMeasuredAtNetAssetValuePerShareMemberus-gaap:PensionPlansDefinedBenefitMember2024-10-270000315189de:EquityFundsNonUSMemberus-gaap:FairValueMeasuredAtNetAssetValuePerShareMemberus-gaap:DefinedBenefitPostretirementHealthCoverageMember2024-10-270000315189de:DefinedBenefitPlanSecuritiesSoldShortMemberus-gaap:FairValueInputsLevel2Memberus-gaap:PensionPlansDefinedBenefitMember2024-10-270000315189de:DefinedBenefitPlanSecuritiesSoldShortMemberus-gaap:FairValueInputsLevel1Memberus-gaap:PensionPlansDefinedBenefitMember2024-10-270000315189de:DefinedBenefitPlanSecuritiesSoldShortMemberde:FairValueInputsLevel1AndLevel2Memberus-gaap:PensionPlansDefinedBenefitMember2024-10-270000315189de:DefinedBenefitPlanSecuritiesLendingLiabilityMemberus-gaap:FairValueInputsLevel2Memberus-gaap:PensionPlansDefinedBenefitMember2024-10-270000315189de:DefinedBenefitPlanSecuritiesLendingLiabilityMemberus-gaap:FairValueInputsLevel2Memberus-gaap:DefinedBenefitPostretirementHealthCoverageMember2024-10-270000315189de:DefinedBenefitPlanSecuritiesLendingLiabilityMemberde:FairValueInputsLevel1AndLevel2Memberus-gaap:PensionPlansDefinedBenefitMember2024-10-270000315189de:DefinedBenefitPlanSecuritiesLendingLiabilityMemberde:FairValueInputsLevel1AndLevel2Memberus-gaap:DefinedBenefitPostretirementHealthCoverageMember2024-10-270000315189de:DefinedBenefitPlanSecuritiesLendingCollateralMemberus-gaap:FairValueInputsLevel2Memberus-gaap:PensionPlansDefinedBenefitMember2024-10-270000315189de:DefinedBenefitPlanSecuritiesLendingCollateralMemberus-gaap:FairValueInputsLevel2Memberus-gaap:DefinedBenefitPostretirementHealthCoverageMember2024-10-270000315189de:DefinedBenefitPlanSecuritiesLendingCollateralMemberde:FairValueInputsLevel1AndLevel2Memberus-gaap:PensionPlansDefinedBenefitMember2024-10-270000315189de:DefinedBenefitPlanSecuritiesLendingCollateralMemberde:FairValueInputsLevel1AndLevel2Memberus-gaap:DefinedBenefitPostretirementHealthCoverageMember2024-10-270000315189de:DefinedBenefitPlanReceivablesPrepaidsAndPayablesMemberus-gaap:FairValueInputsLevel1Memberus-gaap:PensionPlansDefinedBenefitMember2024-10-270000315189de:DefinedBenefitPlanReceivablesPrepaidsAndPayablesMemberde:FairValueInputsLevel1AndLevel2Memberus-gaap:PensionPlansDefinedBenefitMember2024-10-270000315189de:DefinedBenefitPlanRealEstateFundsMemberus-gaap:FairValueMeasuredAtNetAssetValuePerShareMemberus-gaap:PensionPlansDefinedBenefitMember2024-10-270000315189de:DefinedBenefitPlanRealEstateFundsMemberus-gaap:FairValueMeasuredAtNetAssetValuePerShareMemberus-gaap:DefinedBenefitPostretirementHealthCoverageMember2024-10-270000315189de:DefinedBenefitPlanPensionPlanDerivativeInterestRateContractsLiabilityMemberus-gaap:FairValueInputsLevel2Memberus-gaap:PensionPlansDefinedBenefitMember2024-10-270000315189de:DefinedBenefitPlanPensionPlanDerivativeInterestRateContractsLiabilityMemberus-gaap:FairValueInputsLevel1Memberus-gaap:PensionPlansDefinedBenefitMember2024-10-270000315189de:DefinedBenefitPlanPensionPlanDerivativeInterestRateContractsLiabilityMemberde:FairValueInputsLevel1AndLevel2Memberus-gaap:PensionPlansDefinedBenefitMember2024-10-270000315189de:DefinedBenefitPlanPensionPlanDerivativeAssetMemberus-gaap:FairValueInputsLevel2Memberus-gaap:PensionPlansDefinedBenefitMember2024-10-270000315189de:DefinedBenefitPlanPensionPlanDerivativeAssetMemberus-gaap:FairValueInputsLevel1Memberus-gaap:PensionPlansDefinedBenefitMember2024-10-270000315189de:DefinedBenefitPlanPensionPlanDerivativeAssetMemberde:FairValueInputsLevel1AndLevel2Memberus-gaap:PensionPlansDefinedBenefitMember2024-10-270000315189de:DefinedBenefitPlanOtherMemberus-gaap:FairValueInputsLevel2Memberus-gaap:DefinedBenefitPostretirementHealthCoverageMember2024-10-270000315189de:DefinedBenefitPlanOtherMemberus-gaap:FairValueInputsLevel1Memberus-gaap:DefinedBenefitPostretirementHealthCoverageMember2024-10-270000315189de:DefinedBenefitPlanOtherMemberde:FairValueInputsLevel1AndLevel2Memberus-gaap:DefinedBenefitPostretirementHealthCoverageMember2024-10-270000315189de:DefinedBenefitPlanOtherInvestmentsMemberus-gaap:FairValueMeasuredAtNetAssetValuePerShareMemberus-gaap:PensionPlansDefinedBenefitMember2024-10-270000315189de:DefinedBenefitPlanOtherInvestmentsMemberus-gaap:FairValueMeasuredAtNetAssetValuePerShareMemberus-gaap:DefinedBenefitPostretirementHealthCoverageMember2024-10-270000315189de:DefinedBenefitPlanOtherInvestmentsMemberus-gaap:FairValueInputsLevel2Memberus-gaap:PensionPlansDefinedBenefitMember2024-10-270000315189de:DefinedBenefitPlanOtherInvestmentsMemberus-gaap:FairValueInputsLevel1Memberus-gaap:PensionPlansDefinedBenefitMember2024-10-270000315189de:DefinedBenefitPlanOtherInvestmentsMemberde:FairValueInputsLevel1AndLevel2Memberus-gaap:PensionPlansDefinedBenefitMember2024-10-270000315189de:DefinedBenefitPlanEquitySecuritiesAndFundsNonUsMemberus-gaap:FairValueInputsLevel2Memberus-gaap:PensionPlansDefinedBenefitMember2024-10-270000315189de:DefinedBenefitPlanEquitySecuritiesAndFundsNonUsMemberus-gaap:FairValueInputsLevel1Memberus-gaap:PensionPlansDefinedBenefitMember2024-10-270000315189de:DefinedBenefitPlanEquitySecuritiesAndFundsNonUsMemberde:FairValueInputsLevel1AndLevel2Memberus-gaap:PensionPlansDefinedBenefitMember2024-10-270000315189de:DefinedBenefitPlanCashAndShortTermInvestmentsMemberus-gaap:FairValueInputsLevel2Memberus-gaap:PensionPlansDefinedBenefitMember2024-10-270000315189de:DefinedBenefitPlanCashAndShortTermInvestmentsMemberus-gaap:FairValueInputsLevel1Memberus-gaap:PensionPlansDefinedBenefitMember2024-10-270000315189de:DefinedBenefitPlanCashAndShortTermInvestmentsMemberus-gaap:FairValueInputsLevel1Memberus-gaap:DefinedBenefitPostretirementHealthCoverageMember2024-10-270000315189de:DefinedBenefitPlanCashAndShortTermInvestmentsMemberde:FairValueInputsLevel1AndLevel2Memberus-gaap:PensionPlansDefinedBenefitMember2024-10-270000315189de:DefinedBenefitPlanCashAndShortTermInvestmentsMemberde:FairValueInputsLevel1AndLevel2Memberus-gaap:DefinedBenefitPostretirementHealthCoverageMember2024-10-270000315189us-gaap:FairValueInputsLevel2Memberus-gaap:PensionPlansDefinedBenefitMember2024-10-270000315189us-gaap:FairValueInputsLevel2Memberus-gaap:DefinedBenefitPostretirementHealthCoverageMember2024-10-270000315189us-gaap:FairValueInputsLevel1Memberus-gaap:PensionPlansDefinedBenefitMember2024-10-270000315189us-gaap:FairValueInputsLevel1Memberus-gaap:DefinedBenefitPostretirementHealthCoverageMember2024-10-270000315189de:FairValueInputsLevel1AndLevel2Memberus-gaap:PensionPlansDefinedBenefitMember2024-10-270000315189de:FairValueInputsLevel1AndLevel2Memberus-gaap:DefinedBenefitPostretirementHealthCoverageMember2024-10-270000315189us-gaap:PensionPlansDefinedBenefitMember2023-10-290000315189us-gaap:OtherPostretirementBenefitPlansDefinedBenefitMember2023-10-290000315189country:USus-gaap:PensionPlansDefinedBenefitMember2023-10-302024-10-270000315189country:USus-gaap:PensionPlansDefinedBenefitMember2022-10-312023-10-290000315189country:USus-gaap:PensionPlansDefinedBenefitMember2025-11-020000315189country:USus-gaap:PensionPlansDefinedBenefitMember2024-10-270000315189us-gaap:OtherPostretirementBenefitPlansDefinedBenefitMember2025-11-020000315189us-gaap:OtherPostretirementBenefitPlansDefinedBenefitMember2024-10-270000315189us-gaap:PensionPlansDefinedBenefitMember2025-11-020000315189us-gaap:PensionPlansDefinedBenefitMember2024-10-270000315189us-gaap:ForeignCorporateDebtSecuritiesMember2025-11-020000315189us-gaap:NotesPayableOtherPayablesMember2025-11-020000315189de:Notes7.125PercentDue2031Member2025-11-020000315189de:Notes5.70PercentDue2055Member2025-11-020000315189de:Notes5.45PercentDue2035Member2025-11-020000315189de:Notes5.375PercentDue2029Member2025-11-020000315189de:Notes4.15PercentDue2030Member2025-11-020000315189de:Notes3.90PercentDue2042Member2025-11-020000315189de:Notes3.75PercentDue2050Member2025-11-020000315189de:Notes3.10PercentDue2030Member2025-11-020000315189de:Notes2.875PercentDue2049Member2025-11-020000315189de:MediumTermNotesDueInNextTenYearsMember2025-11-020000315189de:EuroNotes2.20PercentDue2032Member2025-11-020000315189de:EuroNotes1.85PercentDue2028Member2025-11-020000315189de:EuroNotes1.65PercentDue2039Member2025-11-020000315189de:Debentures8.10PercentDue2030Member2025-11-020000315189de:Debentures6.55PercentDue2028Member2025-11-020000315189us-gaap:NotesPayableOtherPayablesMember2024-10-270000315189de:Notes7.125PercentDue2031Member2024-10-270000315189de:Notes5.375PercentDue2029Member2024-10-270000315189de:Notes3.90PercentDue2042Member2024-10-270000315189de:Notes3.75PercentDue2050Member2024-10-270000315189de:Notes3.10PercentDue2030Member2024-10-270000315189de:Notes2.875PercentDue2049Member2024-10-270000315189de:MediumTermNotesDueInNextTenYearsMember2024-10-270000315189de:EuroNotes2.20PercentDue2032Member2024-10-270000315189de:EuroNotes1.85PercentDue2028Member2024-10-270000315189de:EuroNotes1.65PercentDue2039Member2024-10-270000315189de:Debentures8.10PercentDue2030Member2024-10-270000315189de:Debentures6.55PercentDue2028Member2024-10-270000315189us-gaap:ProductFinancingArrangementMember2025-11-020000315189us-gaap:NotesPayableToBanksMember2025-11-020000315189us-gaap:CommercialPaperMember2025-11-020000315189de:LongTermDebtCurrentMember2025-11-020000315189us-gaap:ProductFinancingArrangementMember2024-10-270000315189us-gaap:NotesPayableToBanksMember2024-10-270000315189us-gaap:CommercialPaperMember2024-10-270000315189de:LongTermDebtCurrentMember2024-10-270000315189us-gaap:OperatingSegmentsMemberus-gaap:ProductMemberde:SmallAgricultureAndTurfSegmentMember2024-10-282025-11-020000315189us-gaap:OperatingSegmentsMemberus-gaap:ProductMemberde:ProductionAndPrecisionAgricultureSegmentMember2024-10-282025-11-020000315189us-gaap:OperatingSegmentsMemberus-gaap:ProductMemberde:ConstructionAndForestrySegmentMember2024-10-282025-11-020000315189us-gaap:OperatingSegmentsMemberus-gaap:ProductMember2024-10-282025-11-020000315189us-gaap:ProductMember2024-10-282025-11-020000315189us-gaap:OperatingSegmentsMemberus-gaap:ProductMemberde:SmallAgricultureAndTurfSegmentMember2023-10-302024-10-270000315189us-gaap:OperatingSegmentsMemberus-gaap:ProductMemberde:ProductionAndPrecisionAgricultureSegmentMember2023-10-302024-10-270000315189us-gaap:OperatingSegmentsMemberus-gaap:ProductMemberde:ConstructionAndForestrySegmentMember2023-10-302024-10-270000315189us-gaap:OperatingSegmentsMemberus-gaap:ProductMember2023-10-302024-10-270000315189us-gaap:ProductMember2023-10-302024-10-270000315189us-gaap:OperatingSegmentsMemberus-gaap:ProductMemberde:SmallAgricultureAndTurfSegmentMember2022-10-312023-10-290000315189us-gaap:OperatingSegmentsMemberus-gaap:ProductMemberde:ProductionAndPrecisionAgricultureSegmentMember2022-10-312023-10-290000315189us-gaap:OperatingSegmentsMemberus-gaap:ProductMemberde:ConstructionAndForestrySegmentMember2022-10-312023-10-290000315189us-gaap:OperatingSegmentsMemberus-gaap:ProductMember2022-10-312023-10-290000315189us-gaap:ProductMember2022-10-312023-10-290000315189de:SegmentGeographicalUnitedStatesAndCanadaMemberus-gaap:AccountsReceivableMemberus-gaap:GeographicConcentrationRiskMember2024-10-282025-11-020000315189de:SegmentGeographicalUnitedStatesAndCanadaMemberde:FinancingReceivablesMemberus-gaap:GeographicConcentrationRiskMember2024-10-282025-11-020000315189de:R2025Q4DividendsMemberus-gaap:SubsequentEventMember2025-11-032025-12-030000315189us-gaap:AccountingStandardsUpdate202404Member2025-11-020000315189us-gaap:AccountingStandardsUpdate202403Member2025-11-020000315189us-gaap:AccountingStandardsUpdate202309Member2025-11-020000315189us-gaap:AccountingStandardsUpdate202307Member2025-11-020000315189us-gaap:AccountingStandardsUpdate202306Member2025-11-020000315189us-gaap:AccountingStandardsUpdate202305Member2025-11-020000315189us-gaap:AccountingStandardsUpdate202203Member2025-11-020000315189de:AccountingStandardsUpdate202511Member2025-11-020000315189de:AccountingStandardsUpdate202510Member2025-11-020000315189de:AccountingStandardsUpdate202509Member2025-11-020000315189de:AccountingStandardsUpdate202507Member2025-11-020000315189de:AccountingStandardsUpdate202506Member2025-11-020000315189de:AccountingStandardsUpdate202505Member2025-11-020000315189de:AccountingStandardsUpdate202501Member2025-11-020000315189de:SparkAiAndSmartApplyMember2022-10-312023-10-290000315189us-gaap:USGovernmentDebtSecuritiesMember2024-10-270000315189us-gaap:MortgageBackedSecuritiesMember2024-10-270000315189us-gaap:ForeignGovernmentDebtSecuritiesMember2024-10-270000315189us-gaap:USStatesAndPoliticalSubdivisionsMember2025-11-020000315189us-gaap:USGovernmentDebtSecuritiesMember2025-11-020000315189us-gaap:MortgageBackedSecuritiesMember2025-11-020000315189us-gaap:ForeignGovernmentDebtSecuritiesMember2025-11-020000315189us-gaap:DebtSecuritiesMember2025-11-020000315189us-gaap:CorporateDebtSecuritiesMember2025-11-020000315189us-gaap:USStatesAndPoliticalSubdivisionsMember2024-10-270000315189us-gaap:DebtSecuritiesMember2024-10-270000315189us-gaap:CorporateDebtSecuritiesMember2024-10-270000315189us-gaap:FairValueInputsLevel3Memberus-gaap:FairValueMeasurementsNonrecurringMember2024-10-270000315189us-gaap:OperatingSegmentsMemberde:SmallAgricultureAndTurfSegmentMember2025-11-020000315189us-gaap:OperatingSegmentsMemberde:ProductionAndPrecisionAgricultureSegmentMember2025-11-020000315189us-gaap:OperatingSegmentsMemberde:FinancialServicesSegmentMember2025-11-020000315189us-gaap:OperatingSegmentsMemberde:ConstructionAndForestrySegmentMember2025-11-020000315189us-gaap:CorporateNonSegmentMember2025-11-020000315189us-gaap:OperatingSegmentsMemberde:SmallAgricultureAndTurfSegmentMember2024-10-270000315189us-gaap:OperatingSegmentsMemberde:ProductionAndPrecisionAgricultureSegmentMember2024-10-270000315189us-gaap:OperatingSegmentsMemberde:FinancialServicesSegmentMember2024-10-270000315189us-gaap:OperatingSegmentsMemberde:ConstructionAndForestrySegmentMember2024-10-270000315189us-gaap:CorporateNonSegmentMember2024-10-270000315189us-gaap:OperatingSegmentsMemberde:SmallAgricultureAndTurfSegmentMember2023-10-290000315189us-gaap:OperatingSegmentsMemberde:ProductionAndPrecisionAgricultureSegmentMember2023-10-290000315189us-gaap:OperatingSegmentsMemberde:FinancialServicesSegmentMember2023-10-290000315189us-gaap:OperatingSegmentsMemberde:ConstructionAndForestrySegmentMember2023-10-290000315189us-gaap:CorporateNonSegmentMember2023-10-290000315189de:TradeAccountsAndNotesReceivableMemberde:SmallAgricultureAndTurfSegmentMember2025-11-020000315189de:TradeAccountsAndNotesReceivableMemberde:ProductionAndPrecisionAgricultureSegmentMember2025-11-020000315189de:TradeAccountsAndNotesReceivableMemberde:ConstructionAndForestrySegmentMember2025-11-020000315189de:TradeAccountsAndNotesReceivableMemberde:SmallAgricultureAndTurfSegmentMember2024-10-270000315189de:TradeAccountsAndNotesReceivableMemberde:ProductionAndPrecisionAgricultureSegmentMember2024-10-270000315189de:TradeAccountsAndNotesReceivableMemberde:ConstructionAndForestrySegmentMember2024-10-270000315189de:December2022StockRepurchasePlanMember2025-11-0200003151892025-07-282025-11-020000315189us-gaap:CommonStockMember2024-10-282025-11-020000315189de:Debentures6.55PercentDue2028Member2024-10-282025-11-0200003151892025-04-2500003151892025-11-280000315189us-gaap:VariableInterestEntityNotPrimaryBeneficiaryMemberde:BancoJohnDeereSaMemberde:FinancialServicesSegmentMember2025-11-020000315189srt:MinimumMembercountry:USus-gaap:PensionPlansDefinedBenefitMember2024-10-282025-11-020000315189srt:MaximumMembercountry:USus-gaap:PensionPlansDefinedBenefitMember2024-10-282025-11-020000315189de:SurepointAgSystemsIncMember2024-04-292024-07-280000315189us-gaap:TreasuryStockCommonMember2024-10-282025-11-020000315189us-gaap:TreasuryStockCommonMember2023-10-302024-10-270000315189us-gaap:TreasuryStockCommonMember2022-10-312023-10-290000315189us-gaap:RetainedEarningsMember2024-10-282025-11-020000315189us-gaap:NoncontrollingInterestMember2024-10-282025-11-020000315189us-gaap:CommonStockMember2024-10-282025-11-020000315189us-gaap:RetainedEarningsMember2023-10-302024-10-270000315189us-gaap:NoncontrollingInterestMember2023-10-302024-10-270000315189us-gaap:CommonStockMember2023-10-302024-10-270000315189us-gaap:RetainedEarningsMember2022-10-312023-10-290000315189us-gaap:NoncontrollingInterestMember2022-10-312023-10-290000315189us-gaap:CommonStockMember2022-10-312023-10-290000315189srt:MinimumMemberde:RestrictedStockUnitsPerformanceServiceBasedMember2024-10-282025-11-020000315189srt:MinimumMemberde:RestrictedStockUnitsMarketServiceBasedMember2024-10-282025-11-020000315189srt:MaximumMemberde:RestrictedStockUnitsPerformanceServiceBasedMember2024-10-282025-11-020000315189srt:MaximumMemberde:RestrictedStockUnitsMarketServiceBasedMember2024-10-282025-11-020000315189de:RestrictedStockUnitsPerformanceServiceBasedMember2024-10-282025-11-020000315189us-gaap:SecuredDebtMember2025-11-020000315189us-gaap:ConstructionSectorMember2025-11-020000315189us-gaap:AgriculturalSectorMember2025-11-020000315189us-gaap:ConstructionSectorMember2024-10-270000315189us-gaap:AgriculturalSectorMember2024-10-270000315189de:OtherProductsAndServicesMemberde:SmallAgricultureAndTurfSegmentMember2024-10-282025-11-020000315189de:OtherProductsAndServicesMemberde:ProductionAndPrecisionAgricultureSegmentMember2024-10-282025-11-020000315189de:OtherProductsAndServicesMemberde:ConstructionAndForestrySegmentMember2024-10-282025-11-020000315189de:OtherProductsAndServicesMember2024-10-282025-11-020000315189de:OtherProductsAndServicesMemberde:SmallAgricultureAndTurfSegmentMember2023-10-302024-10-270000315189de:OtherProductsAndServicesMemberde:ProductionAndPrecisionAgricultureSegmentMember2023-10-302024-10-270000315189de:OtherProductsAndServicesMemberde:ConstructionAndForestrySegmentMember2023-10-302024-10-270000315189de:OtherProductsAndServicesMember2023-10-302024-10-270000315189de:OtherProductsAndServicesMemberde:SmallAgricultureAndTurfSegmentMember2022-10-312023-10-290000315189de:OtherProductsAndServicesMemberde:ProductionAndPrecisionAgricultureSegmentMember2022-10-312023-10-290000315189de:OtherProductsAndServicesMemberde:ConstructionAndForestrySegmentMember2022-10-312023-10-290000315189de:OtherProductsAndServicesMember2022-10-312023-10-290000315189de:OtherMember2024-10-282025-11-020000315189de:OtherMember2023-10-302024-10-270000315189de:OtherMember2022-10-312023-10-290000315189us-gaap:ToolsDiesAndMoldsMember2025-11-020000315189us-gaap:PropertyPlantAndEquipmentOtherTypesMember2025-11-020000315189us-gaap:LandMember2025-11-020000315189us-gaap:EquipmentMember2025-11-020000315189us-gaap:ConstructionInProgressMember2025-11-020000315189us-gaap:BuildingAndBuildingImprovementsMember2025-11-020000315189us-gaap:ToolsDiesAndMoldsMember2024-10-270000315189us-gaap:PropertyPlantAndEquipmentOtherTypesMember2024-10-270000315189us-gaap:LandMember2024-10-270000315189us-gaap:EquipmentMember2024-10-270000315189us-gaap:ConstructionInProgressMember2024-10-270000315189us-gaap:BuildingAndBuildingImprovementsMember2024-10-270000315189de:OtherCountriesMember2025-11-020000315189country:US2025-11-020000315189country:DE2025-11-020000315189de:OtherCountriesMember2024-10-270000315189country:US2024-10-270000315189country:DE2024-10-270000315189country:AR2024-10-282025-11-020000315189country:AR2023-10-302024-10-270000315189country:AR2022-10-312023-10-290000315189us-gaap:FairValueInputsLevel3Memberus-gaap:RelatedPartyMember2025-11-020000315189us-gaap:CarryingReportedAmountFairValueDisclosureMemberus-gaap:RelatedPartyMember2025-11-020000315189us-gaap:VariableInterestEntityNotPrimaryBeneficiaryMemberde:BancoJohnDeereSaMemberde:OtherReceivablesMemberus-gaap:RelatedPartyMemberde:FinancialServicesSegmentMember2025-11-020000315189us-gaap:RelatedPartyMember2025-11-020000315189us-gaap:NonrelatedPartyMember2025-11-020000315189us-gaap:RelatedPartyMember2024-10-270000315189us-gaap:NonrelatedPartyMember2024-10-270000315189us-gaap:AccumulatedOtherComprehensiveIncomeMember2024-10-282025-11-020000315189us-gaap:AccumulatedOtherComprehensiveIncomeMember2023-10-302024-10-270000315189us-gaap:AccumulatedOtherComprehensiveIncomeMember2022-10-312023-10-290000315189us-gaap:FairValueInputsLevel3Memberus-gaap:AssetPledgedAsCollateralWithRightMember2025-11-020000315189us-gaap:FairValueInputsLevel3Memberus-gaap:AssetNotPledgedAsCollateralMember2025-11-020000315189us-gaap:CarryingReportedAmountFairValueDisclosureMemberus-gaap:AssetPledgedAsCollateralWithRightMember2025-11-020000315189us-gaap:CarryingReportedAmountFairValueDisclosureMemberus-gaap:AssetNotPledgedAsCollateralMember2025-11-020000315189us-gaap:FairValueInputsLevel3Memberus-gaap:AssetPledgedAsCollateralWithRightMember2024-10-270000315189us-gaap:FairValueInputsLevel3Memberus-gaap:AssetNotPledgedAsCollateralMember2024-10-270000315189us-gaap:CarryingReportedAmountFairValueDisclosureMemberus-gaap:AssetPledgedAsCollateralWithRightMember2024-10-270000315189us-gaap:CarryingReportedAmountFairValueDisclosureMemberus-gaap:AssetNotPledgedAsCollateralMember2024-10-270000315189us-gaap:ConstructionSectorMemberus-gaap:PerformingFinancingReceivableMemberus-gaap:CommercialPortfolioSegmentMember2025-11-020000315189us-gaap:AgriculturalSectorMemberus-gaap:PerformingFinancingReceivableMemberus-gaap:CommercialPortfolioSegmentMember2025-11-020000315189us-gaap:ConstructionSectorMemberus-gaap:PerformingFinancingReceivableMemberus-gaap:CommercialPortfolioSegmentMember2024-10-270000315189us-gaap:AgriculturalSectorMemberus-gaap:PerformingFinancingReceivableMemberus-gaap:CommercialPortfolioSegmentMember2024-10-270000315189us-gaap:AgriculturalSectorMemberus-gaap:NonperformingFinancingReceivableMemberus-gaap:CommercialPortfolioSegmentMember2024-10-270000315189country:AR2025-11-020000315189country:AR2024-10-270000315189de:ClassActionAntitrustLawsuitMember2025-07-282025-11-020000315189de:LegalSettlementMember2023-10-302024-10-270000315189us-gaap:OperatingSegmentsMemberde:SmallAgricultureAndTurfSegmentMember2024-10-282025-11-020000315189us-gaap:OperatingSegmentsMemberde:ProductionAndPrecisionAgricultureSegmentMember2024-10-282025-11-020000315189us-gaap:OperatingSegmentsMemberde:FinancialServicesSegmentMember2024-10-282025-11-020000315189us-gaap:OperatingSegmentsMemberde:ConstructionAndForestrySegmentMember2024-10-282025-11-020000315189us-gaap:OperatingSegmentsMember2024-10-282025-11-020000315189us-gaap:OperatingSegmentsMemberde:SmallAgricultureAndTurfSegmentMember2023-10-302024-10-270000315189us-gaap:OperatingSegmentsMemberde:ProductionAndPrecisionAgricultureSegmentMember2023-10-302024-10-270000315189us-gaap:OperatingSegmentsMemberde:FinancialServicesSegmentMember2023-10-302024-10-270000315189us-gaap:OperatingSegmentsMemberde:ConstructionAndForestrySegmentMember2023-10-302024-10-270000315189us-gaap:OperatingSegmentsMember2023-10-302024-10-270000315189us-gaap:OperatingSegmentsMemberde:SmallAgricultureAndTurfSegmentMember2022-10-312023-10-290000315189us-gaap:OperatingSegmentsMemberde:ProductionAndPrecisionAgricultureSegmentMember2022-10-312023-10-290000315189us-gaap:OperatingSegmentsMemberde:FinancialServicesSegmentMember2022-10-312023-10-290000315189us-gaap:OperatingSegmentsMemberde:ConstructionAndForestrySegmentMember2022-10-312023-10-290000315189us-gaap:OperatingSegmentsMember2022-10-312023-10-290000315189de:MaterialReconcilingItemsIncludingCorporateNonsegmentMember2024-10-282025-11-020000315189de:MaterialReconcilingItemsIncludingCorporateNonsegmentMember2023-10-302024-10-270000315189country:BR2023-05-012023-07-300000315189de:MaterialReconcilingItemsIncludingCorporateNonsegmentMember2022-10-312023-10-290000315189us-gaap:SellingGeneralAndAdministrativeExpensesMemberde:OverseasExternalBatteryOperationsImpairmentMember2025-04-282025-07-270000315189us-gaap:CostOfSalesMemberde:OverseasExternalBatteryOperationsImpairmentMember2025-04-282025-07-270000315189de:SmallAgricultureAndTurfSegmentMemberde:OverseasExternalBatteryOperationsImpairmentMember2025-04-282025-07-270000315189de:ProductionAndPrecisionAgricultureSegmentMemberde:OverseasExternalBatteryOperationsImpairmentMember2025-04-282025-07-270000315189de:ConstructionAndForestrySegmentMemberde:OverseasExternalBatteryOperationsImpairmentMember2025-04-282025-07-270000315189de:OverseasExternalBatteryOperationsImpairmentMember2025-04-282025-07-270000315189de:LongTermDebtAndFinanceLeasesNoncurrentMemberus-gaap:FairValueHedgingMember2025-11-020000315189de:DebtCurrentMemberus-gaap:FairValueHedgingMember2025-11-020000315189de:DebtCurrentMemberus-gaap:FairValueHedgingMember2024-10-270000315189de:LongTermDebtAndFinanceLeasesNoncurrentMemberus-gaap:FairValueHedgingMember2024-10-270000315189de:SmallAgricultureAndTurfSegmentMember2024-10-282025-11-020000315189de:ProductionAndPrecisionAgricultureSegmentMember2024-10-282025-11-020000315189de:ConstructionAndForestrySegmentMember2024-10-282025-11-020000315189de:SmallAgricultureAndTurfSegmentMember2023-10-302024-10-270000315189de:ProductionAndPrecisionAgricultureSegmentMember2023-10-302024-10-270000315189de:ConstructionAndForestrySegmentMember2023-10-302024-10-270000315189us-gaap:InterestRateSwapMemberus-gaap:InterestExpenseMember2024-10-282025-11-020000315189us-gaap:DisposalGroupHeldforsaleNotDiscontinuedOperationsMemberde:SaleOfBancoJohnDeereSaMemberde:FinancialServicesSegmentMember2024-04-292024-07-280000315189country:BRde:RetailNotesAndFinanceLeasesPortfolioSegmentMember2023-10-302024-10-270000315189country:BR2023-10-302024-10-270000315189country:RUde:RetailNotesAndFinanceLeasesPortfolioSegmentMember2022-10-312023-10-290000315189country:RU2022-10-312023-10-290000315189us-gaap:ConstructionSectorMemberus-gaap:ConsumerPortfolioSegmentMemberus-gaap:FinancingReceivablesEqualToGreaterThan90DaysPastDueMember2024-10-270000315189us-gaap:AgriculturalSectorMemberus-gaap:ConsumerPortfolioSegmentMemberus-gaap:FinancingReceivablesEqualToGreaterThan90DaysPastDueMember2024-10-270000315189us-gaap:AgriculturalSectorMemberus-gaap:ConsumerPortfolioSegmentMemberus-gaap:FinancingReceivablesEqualToGreaterThan90DaysPastDueMember2025-11-020000315189us-gaap:ConstructionSectorMemberus-gaap:ConsumerPortfolioSegmentMemberus-gaap:FinancingReceivables60To89DaysPastDueMember2024-10-270000315189us-gaap:ConstructionSectorMemberus-gaap:PerformingFinancingReceivableMemberus-gaap:ConsumerPortfolioSegmentMember2025-11-020000315189us-gaap:ConstructionSectorMemberus-gaap:NonperformingFinancingReceivableMemberus-gaap:ConsumerPortfolioSegmentMember2025-11-020000315189us-gaap:ConstructionSectorMemberus-gaap:ConsumerPortfolioSegmentMemberus-gaap:FinancingReceivablesEqualToGreaterThan90DaysPastDueMember2025-11-020000315189us-gaap:ConstructionSectorMemberus-gaap:ConsumerPortfolioSegmentMemberus-gaap:FinancingReceivables60To89DaysPastDueMember2025-11-020000315189us-gaap:ConstructionSectorMemberus-gaap:ConsumerPortfolioSegmentMemberus-gaap:FinancingReceivables30To59DaysPastDueMember2025-11-020000315189us-gaap:AgriculturalSectorMemberus-gaap:PerformingFinancingReceivableMemberus-gaap:ConsumerPortfolioSegmentMember2025-11-020000315189us-gaap:AgriculturalSectorMemberus-gaap:NonperformingFinancingReceivableMemberus-gaap:ConsumerPortfolioSegmentMember2025-11-020000315189us-gaap:AgriculturalSectorMemberus-gaap:ConsumerPortfolioSegmentMemberus-gaap:FinancingReceivables60To89DaysPastDueMember2025-11-020000315189us-gaap:AgriculturalSectorMemberus-gaap:ConsumerPortfolioSegmentMemberus-gaap:FinancingReceivables30To59DaysPastDueMember2025-11-020000315189us-gaap:ConsumerPortfolioSegmentMember2025-11-020000315189us-gaap:ConstructionSectorMemberus-gaap:PerformingFinancingReceivableMemberus-gaap:ConsumerPortfolioSegmentMember2024-10-270000315189us-gaap:ConstructionSectorMemberus-gaap:NonperformingFinancingReceivableMemberus-gaap:ConsumerPortfolioSegmentMember2024-10-270000315189us-gaap:ConstructionSectorMemberus-gaap:ConsumerPortfolioSegmentMemberus-gaap:FinancingReceivables30To59DaysPastDueMember2024-10-270000315189us-gaap:AgriculturalSectorMemberus-gaap:PerformingFinancingReceivableMemberus-gaap:ConsumerPortfolioSegmentMember2024-10-270000315189us-gaap:AgriculturalSectorMemberus-gaap:NonperformingFinancingReceivableMemberus-gaap:ConsumerPortfolioSegmentMember2024-10-270000315189us-gaap:AgriculturalSectorMemberus-gaap:ConsumerPortfolioSegmentMemberus-gaap:FinancingReceivables60To89DaysPastDueMember2024-10-270000315189us-gaap:AgriculturalSectorMemberus-gaap:ConsumerPortfolioSegmentMemberus-gaap:FinancingReceivables30To59DaysPastDueMember2024-10-270000315189us-gaap:ConsumerPortfolioSegmentMember2024-10-270000315189us-gaap:ExtendedMaturityMember2024-10-282025-11-020000315189us-gaap:ExtendedMaturityMember2023-10-302024-10-270000315189us-gaap:PaymentDeferralMember2024-10-282025-11-020000315189de:ExtendedMaturityAndPaymentDeferralMember2024-10-282025-11-020000315189us-gaap:PaymentDeferralMember2023-10-302024-10-270000315189de:ExtendedMaturityAndPaymentDeferralMember2023-10-302024-10-270000315189us-gaap:PerformingFinancingReceivableMember2024-10-282025-11-020000315189us-gaap:NonperformingFinancingReceivableMember2024-10-282025-11-020000315189us-gaap:FinancingReceivables60To89DaysPastDueMember2024-10-282025-11-020000315189us-gaap:FinancingReceivables30To59DaysPastDueMember2024-10-282025-11-020000315189us-gaap:PerformingFinancingReceivableMember2023-10-302024-10-270000315189us-gaap:NonperformingFinancingReceivableMember2023-10-302024-10-270000315189us-gaap:FinancingReceivables60To89DaysPastDueMember2023-10-302024-10-270000315189us-gaap:FinancingReceivables30To59DaysPastDueMember2023-10-302024-10-270000315189us-gaap:CommercialPortfolioSegmentMember2024-10-282025-11-020000315189de:SalesOfEquipmentMemberus-gaap:AssetNotPledgedAsCollateralMember2025-11-020000315189de:SalesOfEquipmentMemberus-gaap:AssetNotPledgedAsCollateralMember2024-10-270000315189us-gaap:ConstructionSectorMemberus-gaap:ConsumerPortfolioSegmentMember2024-10-282025-11-020000315189us-gaap:AgriculturalSectorMemberus-gaap:ConsumerPortfolioSegmentMember2024-10-282025-11-020000315189us-gaap:ConsumerPortfolioSegmentMember2024-10-282025-11-020000315189us-gaap:ConstructionSectorMemberus-gaap:ConsumerPortfolioSegmentMember2023-10-302024-10-270000315189us-gaap:AgriculturalSectorMemberus-gaap:ConsumerPortfolioSegmentMember2023-10-302024-10-270000315189us-gaap:ConsumerPortfolioSegmentMember2023-10-302024-10-270000315189de:RevolvingChargeAccountsPortfolioSegmentMember2024-10-282025-11-020000315189de:RetailNotesAndFinanceLeasesPortfolioSegmentMember2024-10-282025-11-020000315189de:RevolvingChargeAccountsPortfolioSegmentMember2023-10-302024-10-270000315189de:RevolvingChargeAccountsPortfolioSegmentMember2022-10-312023-10-290000315189us-gaap:CommercialPortfolioSegmentMember2023-10-302024-10-270000315189de:RetailNotesAndFinanceLeasesPortfolioSegmentMember2023-10-302024-10-270000315189de:RetailNotesAndFinanceLeasesPortfolioSegmentMember2022-10-312023-10-290000315189us-gaap:CommercialPortfolioSegmentMember2025-11-020000315189us-gaap:AssetPledgedAsCollateralWithRightMember2025-11-020000315189us-gaap:AssetNotPledgedAsCollateralMember2025-11-020000315189de:RevolvingChargeAccountsPortfolioSegmentMember2025-11-020000315189de:RetailNotesAndFinanceLeasesPortfolioSegmentMember2025-11-020000315189us-gaap:CommercialPortfolioSegmentMember2024-10-270000315189us-gaap:AssetPledgedAsCollateralWithRightMember2024-10-270000315189us-gaap:AssetNotPledgedAsCollateralMember2024-10-270000315189de:RevolvingChargeAccountsPortfolioSegmentMember2024-10-270000315189de:RetailNotesAndFinanceLeasesPortfolioSegmentMember2024-10-270000315189us-gaap:CommercialPortfolioSegmentMember2023-10-290000315189de:RevolvingChargeAccountsPortfolioSegmentMember2023-10-290000315189de:RetailNotesAndFinanceLeasesPortfolioSegmentMember2023-10-2900003151892023-10-290000315189us-gaap:CommercialPortfolioSegmentMember2022-10-300000315189de:RevolvingChargeAccountsPortfolioSegmentMember2022-10-300000315189de:RetailNotesAndFinanceLeasesPortfolioSegmentMember2022-10-3000003151892022-10-300000315189srt:RevisionOfPriorPeriodErrorCorrectionAdjustmentMemberde:FinancialServicesSegmentMember2023-01-302023-01-300000315189currency:ARS2025-11-020000315189currency:ARS2024-10-270000315189us-gaap:ForeignExchangeFutureMember2025-11-020000315189us-gaap:ForeignExchangeFutureMember2024-10-270000315189de:IncomeLossFromEquityMethodInvestmentsMemberde:InvestmentImpairmentOfUnconsolidatedAffiliateMember2024-07-292024-10-270000315189us-gaap:OperatingSegmentsMemberus-gaap:SellingGeneralAndAdministrativeExpensesMemberde:SmallAgricultureAndTurfSegmentMemberde:EmployeeSeparationProgramsMember2023-10-302024-10-270000315189us-gaap:OperatingSegmentsMemberus-gaap:SellingGeneralAndAdministrativeExpensesMemberde:ProductionAndPrecisionAgricultureSegmentMemberde:EmployeeSeparationProgramsMember2023-10-302024-10-270000315189us-gaap:OperatingSegmentsMemberus-gaap:SellingGeneralAndAdministrativeExpensesMemberde:FinancialServicesSegmentMemberde:EmployeeSeparationProgramsMember2023-10-302024-10-270000315189us-gaap:OperatingSegmentsMemberus-gaap:SellingGeneralAndAdministrativeExpensesMemberde:ConstructionAndForestrySegmentMemberde:EmployeeSeparationProgramsMember2023-10-302024-10-270000315189us-gaap:OperatingSegmentsMemberus-gaap:ResearchAndDevelopmentExpenseMemberde:SmallAgricultureAndTurfSegmentMemberde:EmployeeSeparationProgramsMember2023-10-302024-10-270000315189us-gaap:OperatingSegmentsMemberus-gaap:ResearchAndDevelopmentExpenseMemberde:ProductionAndPrecisionAgricultureSegmentMemberde:EmployeeSeparationProgramsMember2023-10-302024-10-270000315189us-gaap:OperatingSegmentsMemberus-gaap:ResearchAndDevelopmentExpenseMemberde:ConstructionAndForestrySegmentMemberde:EmployeeSeparationProgramsMember2023-10-302024-10-270000315189us-gaap:OperatingSegmentsMemberus-gaap:CostOfSalesMemberde:SmallAgricultureAndTurfSegmentMemberde:EmployeeSeparationProgramsMember2023-10-302024-10-270000315189us-gaap:OperatingSegmentsMemberus-gaap:CostOfSalesMemberde:ProductionAndPrecisionAgricultureSegmentMemberde:EmployeeSeparationProgramsMember2023-10-302024-10-270000315189us-gaap:OperatingSegmentsMemberus-gaap:CostOfSalesMemberde:ConstructionAndForestrySegmentMemberde:EmployeeSeparationProgramsMember2023-10-302024-10-270000315189us-gaap:OperatingSegmentsMemberus-gaap:SellingGeneralAndAdministrativeExpensesMemberde:EmployeeSeparationProgramsMember2023-10-302024-10-270000315189us-gaap:OperatingSegmentsMemberus-gaap:ResearchAndDevelopmentExpenseMemberde:EmployeeSeparationProgramsMember2023-10-302024-10-270000315189us-gaap:OperatingSegmentsMemberus-gaap:CostOfSalesMemberde:EmployeeSeparationProgramsMember2023-10-302024-10-270000315189us-gaap:OperatingSegmentsMemberde:SmallAgricultureAndTurfSegmentMemberde:EmployeeSeparationProgramsMember2023-10-302024-10-270000315189us-gaap:OperatingSegmentsMemberde:ProductionAndPrecisionAgricultureSegmentMemberde:EmployeeSeparationProgramsMember2023-10-302024-10-270000315189us-gaap:OperatingSegmentsMemberde:FinancialServicesSegmentMemberde:EmployeeSeparationProgramsMember2023-10-302024-10-270000315189us-gaap:OperatingSegmentsMemberde:ConstructionAndForestrySegmentMemberde:EmployeeSeparationProgramsMember2023-10-302024-10-270000315189us-gaap:OperatingSegmentsMemberde:EmployeeSeparationProgramsMember2023-10-302024-10-270000315189us-gaap:CorporateNonSegmentMemberde:EmployeeSeparationProgramsMember2023-10-302024-10-270000315189de:EmployeeSeparationProgramsMember2023-10-302024-10-270000315189us-gaap:DisposalGroupHeldforsaleNotDiscontinuedOperationsMemberde:SaleOfBancoJohnDeereSaMemberde:FinancialServicesSegmentMember2024-10-282025-01-260000315189us-gaap:DisposalGroupDisposedOfBySaleNotDiscontinuedOperationsMemberde:SaleOfBancoJohnDeereSaMemberus-gaap:RelatedPartyMemberde:FinancialServicesSegmentMember2025-02-230000315189us-gaap:DisposalGroupHeldforsaleNotDiscontinuedOperationsMemberde:SaleOfBancoJohnDeereSaMemberde:FinancialServicesSegmentMember2024-04-292024-10-270000315189us-gaap:DisposalGroupDisposedOfBySaleNotDiscontinuedOperationsMemberde:SaleOfRoadbuildingBusinessInRussiaMember2023-09-252023-10-290000315189srt:ScenarioForecastMemberus-gaap:PensionPlansDefinedBenefitMember2025-11-032026-11-010000315189srt:ScenarioForecastMemberus-gaap:OtherPostretirementBenefitPlansDefinedBenefitMember2025-11-032026-11-010000315189us-gaap:DefinedBenefitPostretirementHealthCoverageMember2025-11-020000315189us-gaap:DefinedBenefitPostretirementHealthCoverageMember2024-10-270000315189country:USus-gaap:OtherPostretirementBenefitPlansDefinedBenefitMember2024-10-282025-11-020000315189country:USus-gaap:PensionPlansDefinedBenefitMember2024-10-282025-11-020000315189us-gaap:PensionPlansDefinedBenefitMember2024-10-282025-11-020000315189us-gaap:OtherPostretirementBenefitPlansDefinedBenefitMember2024-10-282025-11-020000315189us-gaap:PensionPlansDefinedBenefitMember2023-10-302024-10-270000315189us-gaap:OtherPostretirementBenefitPlansDefinedBenefitMember2023-10-302024-10-270000315189us-gaap:PensionPlansDefinedBenefitMember2022-10-312023-10-290000315189us-gaap:OtherPostretirementBenefitPlansDefinedBenefitMember2022-10-312023-10-290000315189us-gaap:AccountsPayableAndAccruedLiabilitiesMemberus-gaap:FairValueInputsLevel3Memberus-gaap:FairValueMeasurementsRecurringMember2025-11-020000315189us-gaap:AccountsPayableAndAccruedLiabilitiesMemberus-gaap:FairValueInputsLevel3Memberus-gaap:FairValueMeasurementsRecurringMember2024-10-270000315189srt:ConsolidationEliminationsMemberde:TradeAccountsAndNotesReceivableMember2025-11-020000315189srt:ConsolidationEliminationsMemberde:TradeAccountsAndNotesReceivableMember2024-10-270000315189us-gaap:DisposalGroupDisposedOfBySaleNotDiscontinuedOperationsMemberde:SaleOfRoadbuildingBusinessInRussiaMemberde:ConstructionAndForestrySegmentMember2023-10-290000315189us-gaap:DisposalGroupDisposedOfBySaleNotDiscontinuedOperationsMemberde:SaleOfFinancialServicesBusinessInRussiaMemberde:FinancialServicesSegmentMember2023-03-260000315189us-gaap:CorporateNonSegmentMember2024-10-282025-11-020000315189us-gaap:CorporateNonSegmentMember2023-10-302024-10-270000315189us-gaap:CorporateNonSegmentMember2022-10-312023-10-2900003151892022-10-312023-10-290000315189us-gaap:SeriesOfIndividuallyImmaterialBusinessAcquisitionsMember2024-10-282025-11-020000315189de:BankConduitFacilitiesRevolvingCreditAgreementMemberus-gaap:SubsequentEventMember2025-11-300000315189de:BankConduitFacilitiesRevolvingCreditAgreementMember2025-11-020000315189us-gaap:OtherAssetsMember2025-11-020000315189us-gaap:DisposalGroupDisposedOfBySaleNotDiscontinuedOperationsMemberde:SaleOfBancoJohnDeereSaMemberde:FinancialServicesSegmentMember2025-02-2300003151892023-10-302024-10-270000315189de:TradeAccountsAndNotesReceivableMember2022-10-312023-10-290000315189de:TradeAccountsAndNotesReceivableMember2025-11-020000315189de:TradeAccountsAndNotesReceivableMember2024-10-270000315189de:TradeAccountsAndNotesReceivableMember2023-10-290000315189de:TradeAccountsAndNotesReceivableMember2022-10-300000315189de:TradeAccountsAndNotesReceivableMember2024-10-282025-11-020000315189de:TradeAccountsAndNotesReceivableMember2023-10-302024-10-2700003151892025-11-0200003151892024-10-270000315189srt:MinimumMember2024-10-282025-11-020000315189srt:MaximumMember2024-10-282025-11-0200003151892024-10-282025-11-02iso4217:USDxbrli:purede:itemxbrli:sharesiso4217:USDxbrli:sharesiso4217:EUR

Table of Contents


UNITED STATES

SECURITIES AND EXCHANGE COMMISSION

WASHINGTON, D.C. 20549

FORM 10-K

(Mark one)

ANNUAL REPORT PURSUANT TO SECTION 13 OR 15(d) OF THE SECURITIES EXCHANGE ACT OF 1934

For the fiscal year ended November 2, 2025

or

TRANSITION REPORT PURSUANT TO SECTION 13 OR 15(d) OF THE SECURITIES EXCHANGE ACT OF 1934

For the transition period from ____ to ____

Commission File Number 1-4121

DEERE & COMPANY

(Exact name of registrant as specified in its charter)

Delaware

36-2382580

(State or other jurisdiction of incorporation or organization)

(IRS Employer Identification No.)

One John Deere Place, MolineIllinois

61265

(309) 765-8000

(Address of principal executive offices)

(Zip Code)

(Registrant’s telephone number, including area code)

SECURITIES REGISTERED PURSUANT TO SECTION 12(b) OF THE ACT

Title of each class

Trading Symbols

Name of each exchange on which registered

Common stock, $1 par value

DE

New York Stock Exchange

6.55% Debentures Due 2028

DE28

New York Stock Exchange

SECURITIES REGISTERED PURSUANT TO SECTION 12(g) OF THE ACT: NONE

Indicate by check mark if the registrant is a well-known seasoned issuer, as defined in Rule 405 of the Securities Act.
Yes No

Indicate by check mark if the registrant is not required to file reports pursuant to Section 13 or Section 15(d) of the Act.
Yes No

Indicate by check mark whether the registrant (1) has filed all reports required to be filed by Section 13 or 15(d) of the Securities Exchange Act of 1934 during the preceding 12 months (or for such shorter period that the registrant was required to file such reports), and (2) has been subject to such filing requirements for the past 90 days.
Yes No

Indicate by check mark whether the registrant has submitted electronically every Interactive Data File required to be submitted pursuant to Rule 405 of Regulation S-T (§232.405 of this chapter) during the preceding 12 months (or for such shorter period that the registrant was required to submit such files).
Yes No

Indicate by check mark whether the registrant is a large accelerated filer, an accelerated filer, a non-accelerated filer, a smaller reporting company, or an emerging growth company. See the definitions of “large accelerated filer,” “accelerated filer,” “smaller reporting company,” and “emerging growth company” in Rule 12b-2 of the Exchange Act.

Large accelerated filer 

Accelerated filer 

Non-accelerated filer 

Smaller reporting company 

Emerging growth company 

If an emerging growth company, indicate by check mark if the registrant has elected not to use the extended transition period for complying with any new or revised financial accounting standards provided pursuant to Section 13(a) of the Exchange Act.

Indicate by check mark whether the registrant has filed a report on and attestation to its management’s assessment of the effectiveness of its internal control over financial reporting under Section 404(b) of the Sarbanes-Oxley Act (15 U.S.C. 7262(b)) by the registered public accounting firm that prepared or issued its audit report.

If securities are registered pursuant to Section 12(b) of the Act, indicate by check mark whether the financial statements of the registrant included in the filing reflect the correction of an error to previously issued financial statements.

Indicate by check mark whether any of those error corrections are restatements that required a recovery analysis of incentive-based compensation received by any of the registrant’s executive officers during the relevant recovery period pursuant to §240.10D-1(b).

Indicate by check mark whether the registrant is a shell company (as defined in Rule 12b-2 of the Act). Yes No

The aggregate quoted market price of voting stock of the registrant held by non-affiliates at April 25, 2025, was $124,313,866,554. At November 28, 2025, 270,445,437 shares of common stock, $1 par value, of the registrant were outstanding.

Documents Incorporated by Reference. Portions of the proxy statement for the annual meeting of stockholders to be held on February 25, 2026 are incorporated by reference into Part III of this Form 10-K.


Table of Contents

TABLE OF CONTENTS

Page

PART I

ITEM 1.

BUSINESS

2

ITEM 1A.

RISK FACTORS

14

ITEM 1B.

UNRESOLVED STAFF COMMENTS

25

ITEM 1C.

CYBERSECURITY

25

ITEM 2.

PROPERTIES

26

ITEM 3.

LEGAL PROCEEDINGS

27

ITEM 4.

MINE SAFETY DISCLOSURES

27

PART II

ITEM 5.

MARKET FOR REGISTRANT’S COMMON EQUITY, RELATED STOCKHOLDER MATTERS AND ISSUER PURCHASES OF EQUITY SECURITIES

27

ITEM 6.

[RESERVED]

29

ITEM 7.

MANAGEMENT’S DISCUSSION AND ANALYSIS OF FINANCIAL CONDITION AND RESULTS OF OPERATIONS

29

ITEM 7A.

QUANTITATIVE AND QUALITATIVE DISCLOSURES ABOUT MARKET RISK

29

ITEM 8.

FINANCIAL STATEMENTS AND SUPPLEMENTARY DATA

29

ITEM 9.

CHANGES IN AND DISAGREEMENTS WITH ACCOUNTANTS ON ACCOUNTING AND FINANCIAL DISCLOSURE

29

ITEM 9A.

CONTROLS AND PROCEDURES

29

ITEM 9B.

OTHER INFORMATION

29

ITEM 9C.

DISCLOSURE REGARDING FOREIGN JURISDICTIONS THAT PREVENT INSPECTIONS

29

PART III

ITEM 10.

DIRECTORS, EXECUTIVE OFFICERS AND CORPORATE GOVERNANCE

30

ITEM 11.

EXECUTIVE COMPENSATION

30

ITEM 12.

SECURITY OWNERSHIP OF CERTAIN BENEFICIAL OWNERS AND MANAGEMENT AND RELATED STOCKHOLDER MATTERS

30

ITEM 13.

CERTAIN RELATIONSHIPS AND RELATED TRANSACTIONS, AND DIRECTOR INDEPENDENCE

30

ITEM 14.

PRINCIPAL ACCOUNTANT FEES AND SERVICES

30

PART IV

ITEM 15.

EXHIBITS AND FINANCIAL STATEMENT SCHEDULES

31

ITEM 16.

FORM 10-K SUMMARY

31

1

Table of Contents

PART I

ITEM 1. BUSINESS.

This Annual Report on Form 10-K contains forward-looking statements that are subject to risks and uncertainties. All statements other than statements of historical fact included in this Annual Report on Form 10-K are forward-looking statements. Forward-looking statements provide our current expectations and projections relating to our financial condition, results of operations, plans, objectives, future performance, and business. You can identify forward-looking statements as they do not relate to historical or current facts and by words such as “believe,” “expect,” “estimate,” “anticipate,” “will,” “aim,” “should,” “plan,” “forecast,” “target,” “guide,” “project,” “intend,” “could,” and similar words or expressions.

All forward-looking statements are subject to risks and uncertainties that may cause actual results to differ materially from those that we expected. Important factors that could cause actual results to differ materially from our expectations, or cautionary statements, and other important information about forward-looking statements are disclosed under Item 1A, “Risk Factors,” and Item 7, “Management’s Discussion and Analysis of Financial Condition and Results of Operations–Forward-Looking Statements,” in this Annual Report on Form 10-K.

As used herein, the terms “John Deere,” “we,” “us,” “our,” or “the Company” refer collectively to Deere & Company and its subsidiaries, unless designated or identified otherwise. All amounts are presented in millions of U.S. dollars, unless otherwise specified.

Products

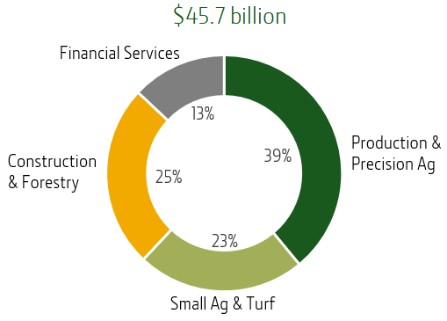
John Deere has manufactured agricultural equipment since 1837. Deere & Company was incorporated under the laws of Delaware in 1958. Our business is managed through the following four business segments: Production & Precision Agriculture (PPA), Small Agriculture & Turf (SAT), Construction & Forestry (CF), and Financial Services (John Deere Financial or FS).

Graphic

Graphic

Graphic

Graphic

BUSINESS SEGMENT

PRODUCTION & PRECISION AGRICULTURE

SMALL AGRICULTURE & TURF

CONSTRUCTION & FORESTRY

FINANCIAL SERVICES

PRODUCTS

4WD/track and row crop tractors
Harvesters
Cotton Pickers and Cotton Strippers
Sugarcane Harvesters
Sugarcane Loaders
Soil Preparation, Tillage, Seeding, Application, and Crop Care Equipment

Specialty, Utility, and Compact Tractors
Self-Propelled Forage Harvesters and Attachments
Hay and Forage Equipment
Rotary Mowers
Utility Vehicles
Riding Lawn Equipment and Commercial Mowing Equipment
Golf Course Equipment

Backhoe Loaders
Crawler Dozers and Loaders
Skid Steers
Four-Wheel-Drive Loaders
Compact Wheel Loaders
Excavators and Compact Excavators
Equipment used in Timber Harvesting
Road Building and Road Rehabilitation Equipment
Articulated Dump Trucks and Motor Graders

Retail Notes
Revolving Charge Accounts
Wholesale Receivables
Leases
Extended Warranties

CROPS/FUNCTION

Corn and Soy
Small Grain
Cotton
Sugarcane

Dairy and Livestock
Lawn and Property Maintenance
Golf Course Maintenance
High-Value Crops and Small Acreage Crops

Earthmoving
Forestry
Roadbuilding

Financial Solutions

2

Table of Contents

Smart Industrial Operating Model and Leap Ambitions

Our Smart Industrial Operating Model aims to deliver greater value for our customers, accelerate our competitive advantage in advanced technologies, build on our fundamental manufacturing strengths and core values, and capitalize on opportunities that lie ahead by leveraging advanced technologies with our operational excellence. To drive these outcomes, we are focused on the following three pillars:

Production Systems. A strategic alignment of products and solutions around our customers’ production systems. Production systems refer to the series of steps our customers take to execute different tasks, operations, and projects to grow an agricultural product or execute a project.

Technology Stack. Investments in technology, as well as research and development, which deliver intelligent solutions to our customers through hardware and devices, embedded software, connectivity, data platforms, and applications. The technology stack leverages these core technologies across the enterprise, including digital capabilities, automation and machine learning, and autonomy. The stack has the potential to unlock economic and sustainable value for customers by optimizing jobs, strengthening decision-making, and better connecting the steps of a production system.

Lifecycle Solutions. The enterprise integration of our aftermarket and support capabilities to more effectively manage customer equipment, service, and technology needs across the full lifetime of a John Deere product, and with a specific lifecycle solution focus on the ownership experience. This integrated support seeks to enhance customer value through proactive and reactive support, easy access to parts, value-add services, and precision upgrades, regardless of when a customer purchases our equipment.

In 2022, we introduced our Leap Ambitions (“Ambitions”), a set of focused goals designed to guide the implementation of our Smart Industrial Operating Model. These Ambitions are built upon a foundation of product quality and manufacturing excellence, supported by a best-in-class dealer channel, and enabled by employees dedicated to solving some of the world’s most important problems. To build on our accomplishments and lay the foundation for sustained growth as we move toward 2030, in December 2025 we refined our Ambitions.

Our refined Ambitions feature long-term financial and operational goals, emphasizing the use of our differentiated equipment and service solutions, including automation, autonomy, digitalization, lifecycle solutions, and Solutions as a Service (SaaS). Utilization of these solutions is currently measured through various performance indicators. Our refined Ambitions and their timelines may be updated from time to time. In addition, we may not be able to achieve these goals for a variety of reasons, some of which may be beyond our control. See Item 1A Risk Factors, “Strategic Risks—We may not realize the anticipated benefits of our Smart Industrial Operating Model and Leap Ambitions.”

Equipment Operations

Our equipment operations consist of three of our business segments: PPA, SAT, and CF. In fiscal year 2025, PPA generated $17,311 net sales, or 45% of equipment operations net sales; SAT generated $10,224 net sales, or 26% of equipment operations net sales; and CF generated $11,382 net sales, or 29% of equipment operations net sales.

Production & Precision Agriculture

The PPA segment is committed to meeting the fundamental needs of our customers through a combination of equipment and technology designed to enable our customers to overcome some of their biggest challenges: doing more with less, labor shortages, volatile input costs, and executing jobs in tighter timeframes. This segment defines, develops, and delivers global equipment and technology solutions for production-scale growers of crops like large grains (such as corn and soy), small grains (such as wheat, oats, and barley), cotton, and sugarcane. Equipment manufactured and distributed by the segment includes four-wheel-drive (4WD)/track and row crop tractors, harvesters, cotton pickers, cotton strippers, sugarcane harvesters, sugarcane loaders, and related harvesting front-end equipment. In addition, the segment includes tillage, seeding, and application equipment, including sprayers and nutrient management, and soil preparation machinery, and related attachments and service parts.

We continue to invest in the development and production of advanced technology through integrated agricultural solutions and precision technologies across our portfolio of equipment. We believe our investments in precision technology will transform our farmers’ equipment into smarter, more efficient machines.

We have developed a production system-level approach that helps us understand how customers operate, focusing on their costs, identifying the opportunities for them to reduce inputs, and to improve productivity, crop yields, and sustainability. Advancements such as precise global navigation satellite systems technology, advanced connectivity and telematics, on-board sensors and computing power, automation software, digital tools, applications, and analytics provide seamless integration of information designed to improve customer decision-making and job execution.

Our advanced telematics systems remotely connect equipment owners, business managers, and dealers to equipment in the field through the John Deere Operations Center ™, our digital management system that allows customers to access farm and jobsite

3

Table of Contents

information through their devices. This connection provides real-time alerts and information about equipment location, utilization, performance, and maintenance to improve productivity and efficiency, as well as to monitor agronomic job execution.

We are beginning to leverage technology from our PPA segment across other business segments. For example, cameras, obstacle detection, radars, and machine learning have been applied to our CF Smart Detect™ tool to identify obstacles on jobsites. In addition, CF roadbuilding customers are now able to access the John Deere Operations Center™, enabling them to view near real-time data and insights to help make informed decisions, streamline maintenance, and track productivity.

In addition to John Deere brand names, the table below provides a list of select PPA products and their associated brand names:

PRODUCT

BRAND NAME

Sprayers

Hagie, Mazzotti

Planters and Cultivators

Monosem

Sprayers and Planters

PLA

Carbon Fiber Sprayer Booms

King Agro

Technology

Harvest Profit, Sentera

Aftermarket and Precision Upgrades

A & I, Unimil by John Deere, Alternatives by John Deere, Frontier, Surepoint

Small Agriculture & Turf

SAT is committed to meeting the needs of our customers through defining, developing, and delivering global equipment and technology solutions for dairy and livestock producers, high-value crop and small acre crop producers, and turf and utility customers. The segment works to provide product leadership while extending integrated agricultural solutions and precision technologies across its portfolio of equipment.

Equipment manufactured and distributed by the segment includes specialty, utility, and compact tractors, hay and forage equipment, including self-propelled forage harvesters and attachments, balers, and mowers; turf and utility equipment, including riding lawn equipment, commercial mowing equipment, golf course equipment, utility vehicles, implements for mowing, tilling, snow and debris handling, aerating, and other residential, commercial, golf, and sports turf care applications; and related attachments and service parts.

SAT equipment is sold primarily through independent retail dealer networks, although the segment also builds turf products for sale by mass retailers, including The Home Depot and Lowe’s. Our turf equipment is sold primarily in North American, Western European, and Australian markets.

In the small agriculture market, we are developing autonomous solutions, connectivity capabilities, and a path to electrifying our future by delivering a portfolio that helps current customers meet sustainability goals while finding innovative ways to serve new customers and unlock new markets for mechanization at scale.

In addition to John Deere brand names, the table below provides a list of select SAT products and their associated brand names:

PRODUCT

BRAND NAME

Equipment Attachments

Frontier, Kemper, GreenSystem, Smart Apply

Sprayers

GUSS

Aftermarket and Precision Updates

A&I, Sunbelt Outdoor Products, Alternatives by John Deere, Frontier

Agriculture and Turf Operations

Business Environment. Sales of agricultural equipment are affected by total farm cash receipts, which reflect levels of farm commodity and protein prices, world grain stocks, acreage available and planted, crop yields, soil conditions, farm input costs, government policies, including global trade policies, and the amount and timing of government support. Sales also are influenced by general economic conditions, farmland prices, farmers’ debt levels and access to financing, interest and exchange rates, labor availability and costs, energy costs and related policies, tax policies, policies related to climate change, and other input costs associated with farming. Other key factors affecting new agricultural equipment sales are the value, age, and level of used equipment, including tractors, harvesting equipment, self-propelled sprayers, hay and forage equipment, and seeding equipment. Weather and climatic conditions also can affect buying decisions of agricultural equipment purchasers.

4

Table of Contents

We believe innovations in machinery and technology may influence purchases of agricultural equipment, especially when the agricultural environment is challenging. For example, larger, more productive equipment is well accepted where farmers are striving for more efficiency in their operations to increase profits. Large, cost-efficient, highly mechanized agricultural operations account for an important share of worldwide farm output. These customers are increasingly adopting and integrating precision agricultural technologies like guidance, telematics, automation, and data-driven management in their operations. The large-size agricultural equipment used on such farms has been particularly important to us. A large proportion of the equipment operations’ total agricultural equipment sales in the U.S. and Canada, as well as in many countries outside the U.S. and Canada, are comprised of (1) tractors over 100 horsepower, (2) self-propelled combines, cotton pickers, forage harvesters, and sprayers, and (3) seeding equipment.

Agricultural trends, including the production of and demand for renewable fuels, including biofuels, can also impact sales. This growing demand has led to a corresponding increase in the need for agriculturally based feedstocks used in their production, such as corn in the U.S. and Europe and sugar cane in Brazil. This increased demand may increase the demand for agricultural equipment to be used in the production of such crops. In addition, policies and market drivers such as federal mandates requiring renewable fuel blending, and global regulations in regions and countries like Europe and Brazil, are expected to increase demand for renewable fuels.

We also rely on the sale of small and mid-size tractors as part of our global business. Customers use these tractors for small and medium-sized farming and in specialty agricultural industries like dairy, livestock, and high value crops (e.g., orchards and vineyards). The majority of our mid-size tractors are manufactured and sold in Europe, while the majority of our small tractors are manufactured and sold in India. Retail sales of lawn and garden tractors, compact utility tractors, residential and commercial mowers, utility vehicles, and golf and turf equipment are influenced by the housing market, weather conditions, consumer spending patterns, and general economic conditions like unemployment, interest rates, and inflation.

Regions. Sales and marketing support for both the PPA and SAT segments is organized around four geographic regions: (1) Africa, Asia, and the Middle East; (2) Europe, and the Commonwealth of Independent States (CIS); (3) Latin America and South America; and (4) U.S., Canada, and Australia.

The majority of our sales occur in the U.S. and Canada; however, we continue to grow our business and invest in other regions. In June of 2025, we celebrated our 25th anniversary of operations in Brazil. In 2024, we built a research and development center in Indaiatuba, Brazil dedicated to tropical agriculture and serving our customers in the region. Our growth in Brazil is just one example of deploying capital to areas where we can unlock the greatest value for our customers—a hallmark of our Smart Industrial Operating Model.

Seasonality. Seasonal patterns in retail demand for agricultural equipment can result in substantial variations in the volume and mix of products sold to retail customers during the year. In general, retail sales to farmers are based on the timing of planting and harvesting seasons around the globe.

Seasonal demand is estimated in advance, and equipment is manufactured in anticipation of such demand to achieve efficient utilization of personnel and facilities throughout the year. The PPA and SAT segments can incur substantial seasonal variations in cash flows to finance production and inventory of agricultural and turf equipment. The segments also incur costs to finance sales to dealers in advance of seasonal demand.

For certain equipment, we offer early order programs, which can include incentives to retail customers who place orders well in advance of the use season. Production schedules are based, in part, on these early order programs; however, during periods of high demand, some factories may still produce after the use season. New combines, cotton harvesting equipment, planters and tillage equipment, and sprayers are sold under early order programs, with waivers of retail finance charges available to customers who take delivery of machines during non-use seasons.

In Australia, Canada, and the U.S., there are typically several used equipment trade-in transactions that take place in connection with most new agricultural equipment sales. To provide support to our dealers in these countries for carrying and ultimately selling this used inventory to retail customers, we provide these dealers with pools of funds awarded as a percentage of the dealer price for eligible new equipment sales at the time of the new equipment settlement.

Retail demand for turf and utility equipment is normally higher in the second and third fiscal quarters based on weather, turf maintenance needs, landscaping projects, and sports and recreational facilities preparation. We have pursued a strategy of building and shipping such equipment as close to retail demand as possible. Consequently, to increase asset turnover and reduce the average level of field inventories throughout the year, production and shipment schedules of these product lines are normally proportionately higher in the second and third fiscal quarters of each year, corresponding closely to the seasonal pattern of retail sales.

5

Table of Contents

Construction & Forestry

Our CF segment is committed to meeting the need for smart and more sustainable solutions to help our customers meet industry challenges, including jobsite safety, a shortage of skilled labor, volatile input costs, reducing rework, maximizing uptime, and minimizing their environmental footprint.

To address these challenges, we have delivered a portfolio of construction, roadbuilding, and forestry products with precision technology solutions. Our smart solutions such as SmartWeigh™, Smart Grade™, machine and system automation, and the John Deere Operations Center™, are designed to allow customers to complete more functions with fewer inputs, reduce rework and guesswork, and transform data into insights to allow for better decisions. Obstacle detection solutions such as SmartDetect™ supplement operator visibility on the jobsite through a combination of cameras, radar, and machine learning. Additionally, we plan to deliver hybrid-electric and battery electric equipment solutions to help customers reduce tailpipe emissions without sacrificing power and performance.

In addition to creating solutions for the challenges mentioned above, our CF training team is providing comprehensive sales, technical, parts, and operator training for dealers and customers so that the features and technologies of our solutions are understood and utilized with the goal of maximizing customer productivity, jobsite safety, and uptime.

Our construction products include excavators, motor graders, crawler dozers and loaders, wheel loaders, backhoes, and articulated dump trucks. Our compact construction products include skid steers, compact excavators, compact wheel loaders, and compact track loaders. Our Wirtgen roadbuilding products include milling machines, recyclers, slipform pavers, surface miners, asphalt pavers, compactors, tandem and static rollers, mobile crushers and screens, and mobile and stationary asphalt plants. The Wirtgen brand also provides a technology stack aimed at allowing customers to make smarter and more sustainable decisions. Technology offerings include Wirtgen Performance Tracker, Mill Assist, Level Pro, Vögele Roadscan, Smart Compact, WITOS Paving, Spective Connect, AutoTrac™, John Deere Connected Support™, and John Deere Operations Center™. The construction, compact construction, and Wirtgen products also include related attachments and service parts.

In forestry, our primary products include skidders, wheeled and tracked feller bunchers, forwarders, knuckleboom loaders, wheeled and tracked harvesters, swing machines, and precision forestry technology solutions such as Intelligent Boom Control, TimberMatic™ maps, and TimberManager™—a web-based solution allowing customers to follow progress on the jobsite. These solutions allow customers to closely track jobsite progress and provide visibility into fleet location, utilization, performance, and maintenance information.

We have a number of initiatives in the rent-to-rent, or short-term rental, market for construction, earthmoving, roadbuilding, and material handling equipment. These include specially designed rental programs for our dealers and expanded cooperation with major national equipment rental companies.

We own retail forestry sales operations in Australia, Brazil, Finland, Ireland, New Zealand, Norway, Sweden, and the United Kingdom. In addition, the Wirtgen Group sells its products primarily through company-owned sales and service subsidiaries in many markets worldwide (most significantly in Europe, India, and Australia). In most other geographies, we sell through an independent dealer channel.

The prevailing levels of residential, commercial, and public construction, investment in infrastructure, and the condition of the forestry products industry influence retail sales of our construction, roadbuilding, and forestry equipment. General economic conditions, interest rates, uncertainty related to trade policies, government spending, the availability of credit, and certain commodity prices, such as those applicable to oil and gas, pulp, paper, and saw logs, also influence sales.

In addition to John Deere brand names, the table below provides a list of CF products and their associated brand names:

PRODUCT

BRAND NAME

Roadbuilding Equipment

Wirtgen, Vögele, Hamm, Kleemann, Benninghoven, Ciber

Forestry Attachments

Waratah

Competition

The equipment operations sell products and services in a variety of competitive global and regional markets. The principal competitive factors in all markets include product performance, technology features, innovation, quality, distribution, sustainability, financing, customer service, and value. John Deere’s brand recognition is a competitive factor in North America and many other parts of the world.

The agricultural equipment industry continues to change and is becoming even more competitive through the emergence and global expansion of many competitors. The competitive environment for the agriculture and turf operations includes some global competitors, such as AGCO Corporation, CLAAS KGaA mbH, CNH Industrial N.V., Kubota Tractor Corporation, and The Toro Company.

6

Table of Contents

These competitors have varying numbers of product lines competing with our products and each has varying degrees of regional focus.

Additional competition within the agricultural equipment industry has come from a variety of short-line and specialty manufacturers, as well as local or regional competitors, with differing manufacturing and marketing methods. As technology increasingly enables enhanced productivity in agriculture, the industry is also attracting non-traditional competitors, including technology-focused companies and start-up ventures.

Our forestry and roadbuilding businesses operate globally. The construction business operates in competitive markets in North and South America, as well as other global markets. Global competitors of the CF segment include Caterpillar Inc., CNH Industrial N.V., Doosan Infracore Co., Ltd. and its subsidiary Doosan Bobcat Inc., Fayat Group, GOMACO Corporation, Hitachi Construction Machinery, Komatsu Ltd., Kubota Tractor Corporation, LGMG, Liugong, Ponsse Plc, SANY Group Co., Ltd., SDLG, Terex, Tigercat Industries Inc., Volvo Construction Equipment (part of Volvo Group AB), and XCMG.

Parts and Services

The quality and timely availability of our parts and services are important for each of our equipment operations, as they are elements to overall customer satisfaction and our customers’ purchasing decisions. We supply parts, many of which are proprietary, to support the current product lines as well as products we have sold in the past. We also offer aftersales customer assistance programs that provide a range of maintenance and repair contracts, as well as warranty extension services, to cover a variety of customer needs and to support the equipment’s value over time.

Our precision technology is integrated into our equipment as well as offered as aftermarket parts of retrofit solutions through our dealer network and owner support tools sold through our e-commerce John Deere Store. We support our connected machines, which integrate technology with our equipment through our John Deere Operations Center™ with service alerts, operator insights, and predictive repairs and maintenance.

Manufacturing and Assembly

Our global manufacturing footprint allows us whenever possible to produce our products close to the markets where they are sold. For example, most of our large agricultural equipment is assembled in the U.S. for our U.S. customers.

Common manufacturing processes and techniques are used in producing components for PPA, SAT, and CF equipment sold by us and our dealers. The equipment operations also pursue external sales of selected parts that can be manufactured and supplied to third parties on a competitive basis, including engines, power train components, and electronic components.

Considerable effort is being dedicated to manufacturing cost optimization through improvements in process, optimization of factories, including product line relocation, product design, advanced manufacturing technology, and supply management and logistics, as well as compensation incentives related to productivity and organizational structure. We are also integrating emerging technologies such as artificial intelligence driven analytics and advanced robotics into our manufacturing processes where appropriate.

Our manufacturing, logistics, and scheduling systems are dependent on forecasts of industry volumes and our anticipated share of industry sales. In addition, based on dealer and customer demand, we can adjust our assembly lines to accommodate a wide product mix.

See Item 2 “Properties” in this Annual Report on Form 10-K for more information about our manufacturing facilities.

Research and Development; Patents, Trademarks, Copyrights, and Trade Secrets

We make substantial investments in research and development to improve the quality and performance of our products, to develop new products and technologies to meet our customers’ needs, to integrate sustainable solutions into our products, and to comply with government, safety, and engine emissions regulations.

Our research and development activities are a vital component in our Smart Industrial Operating Model as customers seek to improve profitability, productivity, and sustainability through technology. Integration of technology into equipment is a persistent market trend, and we continue to capitalize on this market trend.

We own a significant number of patents, trademarks, copyrights, trade secrets, and intellectual property licenses related to our products and services and expect the number to grow as we continue to pursue technological innovations. We further our competitive position by filing patent and trademark applications in the U.S. and internationally to protect technology, improvements considered important to the business, and our brand. We believe that our rights under these patents and licenses are important to our operations and competitive position but do not regard any of our businesses as being dependent upon any single patent or family of patents. See Item 1A Risk Factors, “Legal and Regulatory Compliance RisksOur business could be adversely affected by the infringement or loss of intellectual property rights” for more information.

7

Table of Contents

Sales and Distribution

Through the U.S. and Canada, we market products to approximately 2,050 independent dealer locations. Of these, approximately 1,600 sell agricultural equipment, while approximately 450 sell construction, earthmoving, material handling, roadbuilding, compact construction, and/or forestry equipment. In addition, roadbuilding equipment is sold at approximately 100 roadbuilding-only locations that may carry products that compete with our construction, earthmoving, material handling, and/or forestry equipment. Turf equipment is sold at most John Deere agricultural equipment locations, a few construction and forestry locations, and about 260 turf-only locations. In addition, certain lawn and garden and compact construction products are sold through The Home Depot and Lowe’s.

Outside the U.S. and Canada, our agriculture and turf equipment is sold to distributors and dealers for resale in over 100 countries. Sales and administrative offices are located in Argentina, Australia, Brazil, China, France, Germany, India, Italy, Mexico, Poland, Singapore, South Africa, Spain, Ukraine, and the United Kingdom. Turf equipment sales outside the U.S. and Canada occur primarily in Western Europe and Australia. Construction, earthmoving, material handling, and forestry equipment is sold to distributors and dealers primarily by sales offices located in Australia, Brazil, Finland, Ireland, New Zealand, Norway, Singapore, Sweden, and the United Kingdom. Some of these dealers are independently owned while we own others. Roadbuilding equipment is sold directly to retail customers and independent distributors and dealers for resale.

The Wirtgen Group operates company-owned sales and service subsidiaries in Australia, Austria, Belgium, Brazil, Bulgaria, China, Denmark, Estonia, Finland, France, Georgia, Germany, Hungary, India, Ireland, Italy, Japan, Latvia, Lithuania, Malaysia, the Netherlands, Norway, Poland, Romania, Singapore, South Africa, Sweden, Taiwan, Thailand, Turkey, Ukraine, and the United Kingdom.

The equipment operations operate centralized parts distribution warehouses in the U.S., Brazil, and Germany in coordination with regional parts depots and distribution centers in Argentina, Australia, Canada, China, India, Mexico, South Africa, Sweden, and the United Kingdom.

We market engines, power trains, and electronic components worldwide through select sales branches or directly to regional and global original equipment manufacturers and independently owned engine distributors.

We provide our dealers with volume sales incentives, demonstration programs, and other advertising support to assist sales. We design our sales programs, including retail financing incentives, and our policies for maintaining parts and services availability with product warranties to enhance our dealers’ competitive position.

Raw Materials

We source raw materials, manufactured components, and replacement parts for our equipment, engines, and other products from leading suppliers globally. These materials and components include a variety of steel products, metal castings, forgings, plastics, hydraulics, electronics, and ready-to-assemble components made to certain specifications. We also source various goods and services used for production, logistics, operations, and research and development.

We develop and maintain sourcing strategies for our purchased materials and emphasize long-term supplier relationships at the core of these strategies. We use a variety of agreements with suppliers intended to drive innovation, maximize availability and delivery of raw materials and components, help manage costs on a globally competitive basis, protect our intellectual property, and minimize other supply-related risks.

We are focused on increasing the resiliency of our supply chain and monitoring supply chain risks to minimize the likelihood of business disruptions caused by the supply base, including as a result of supplier financial viability, capacity, business continuity, labor availability, quality, delivery, cybersecurity, weather-related events, natural disasters, geo-political instability, and trade policies.

We have implemented mitigation efforts to minimize the impact of potential and actual supply chain disruptions on our customers. Examples include working with the supply base to prioritize allocations to improve material availability, multi-sourcing selected parts and materials, entering long-term contracts for some critical components, and using alternative freight carriers to expedite delivery.

Backlog Orders

The dollar amount of backlog orders as of November 2, 2025, was approximately $4.0 billion for the PPA segment and $1.9 billion for the SAT segment, compared with $5.2 billion and $2.1 billion, respectively, at October 27, 2024. Backlog orders decreased as demand has declined. The agriculture and turf backlog are generally highest in the second and third quarters due to seasonal buying trends in these industries. The dollar amount of backlog orders for the CF segment was approximately $3.8 billion at November 2, 2025, compared with $2.2 billion at October 27, 2024 as planned production levels increase in line with retail demand. Backlog orders for equipment operations include all orders deemed to be firm as of the referenced date.

8

Table of Contents

Financial Services

U.S. and Canada. The financial services segment primarily provides and administers financing for retail purchases from our dealers of new equipment manufactured by our equipment operations, as well as used equipment taken in trade for this equipment. The Company and John Deere Construction & Forestry Company (a wholly-owned subsidiary of the Company) are referred to as the “sales companies.” John Deere Capital Corporation (Capital Corporation), a U.S. financial services subsidiary, generally purchases retail installment sales and loan contracts (retail notes) from the sales companies. In Canada, John Deere Financial Inc., a Canadian financial services subsidiary, purchases and finances retail notes acquired by John Deere Canada ULC, our Canadian sales company. The terms of retail notes and the basis on which the financial services operations acquire retail notes from the sales companies are governed by agreements with the sales companies. The financial services segment also finances and services revolving charge accounts, in most cases acquired from and offered through third-party merchants in the agricultural and turf markets. Additionally, the financial services operations provide wholesale financing to dealers of our agriculture and turf equipment and construction and forestry equipment (wholesale notes), primarily to finance inventories of equipment for those dealers. The various financing options offered by the financial services operations are designed to enhance sales of our products and generate financing income for the financial services operations. In the U.S. and Canada, certain subsidiaries included in the financial services segment offer extended equipment warranties.

Retail notes acquired by the sales companies are immediately sold to the financial services operations. The equipment operations are the financial services operations’ major source of business, although many retail purchasers of our products finance their purchases outside our organization through a variety of sources, including commercial banks and finance and leasing companies.

The financial services operations offer retail leases to equipment users in the U.S. and a small number of leases are executed with units of local governments. Leases are usually written for periods ranging from less than one year to seven years and typically contain an option permitting the customer to purchase the equipment at the end of the lease term. Retail leases also are offered in a generally similar manner to customers in Canada.

The financial services operations’ terms for financing equipment retail sales (other than smaller items financed with unsecured revolving charge accounts) generally provide for retention of a security interest in the equipment financed. Finance charges are sometimes waived for specified periods or reduced on certain John Deere products sold or leased in advance of the season of use or in other sales promotions. The financial services operations generally receive compensation from the sales companies at approximate market interest rates for periods during which finance charges are waived or reduced on the retail notes or leases. The cost is accounted for as a deduction in arriving at net sales by the equipment operations.

We have an agreement with Capital Corporation to make payments to Capital Corporation such that its consolidated ratio of earnings to fixed charges is not less than 1.05 to 1 for any four consecutive fiscal quarterly period. We also have committed to continuing to own, directly or through one or more wholly-owned subsidiaries, at least 51% of the voting shares of capital stock of Capital Corporation and to maintain Capital Corporation’s consolidated tangible net worth at not less than $50. Our obligations to make payments to Capital Corporation under this agreement are independent of whether Capital Corporation is in default on its indebtedness, obligations, or other liabilities. Further, our obligations under the agreement are not measured by the amount of Capital Corporation’s indebtedness, obligations, or other liabilities. Our obligations to make payments under this agreement are expressly stated not to be a guaranty of any specific indebtedness, obligation, or liability of Capital Corporation and are enforceable only by or in the name of Capital Corporation. As of November 2, 2025, we were in compliance with all of our obligations, and no payments were required under this agreement in fiscal year 2025 or fiscal year 2024. As of November 2, 2025, we indirectly owned 100% of the voting shares of Capital Corporation’s capital stock and Capital Corporation’s consolidated tangible net worth was $5,929.8.

Outside the U.S. and Canada. The financial services operations also offer financing, primarily for our products, in Argentina, Australia, India, Mexico, New Zealand, and in several other countries in Africa, Asia, Europe, and Latin America. In certain markets, financing is offered through cooperation agreements or joint ventures with other financial institutions. For example, in the second quarter of fiscal year 2025, we completed a transaction with a Brazilian bank, Banco Bradesco S.A. (Bradesco), for Bradesco to invest and become 50% owner of our subsidiary in Brazil, Banco John Deere S.A. The way the financial services operations offer financing is affected by a variety of country-specific laws, regulations, and customs, including those governing property rights and debtor obligations, which are subject to change, and which may introduce greater risk to the financial services operations.

The financial services operations also offer to select customers and dealers credit enhanced international export financing primarily for the purchase of our products.

Additional information on the financial services operations is provided in the “Management’s Discussion and Analysis of Financial Condition and Results of Operations” (MD&A) section in this Annual Report on Form 10-K.

9

Table of Contents

Environmental Matters

We are subject to a variety of local, state, and federal environmental laws and regulations in the U.S., as well as the environmental laws and regulations of other countries in which we conduct business. In the event of noncompliance, we could be subject to substantial fines and other penalties. Compliance with these laws and regulations adds to the cost of our production operations and compliance with emissions regulations adds to the cost of our products.

In fiscal year 2025, compliance with environmental controls applicable to us did not have a material effect on our capital expenditures, earnings, or competitive position. At this time, we do not expect to incur material capital expenditures related to environmental controls during fiscal year 2026.

The U.S., the European Union (EU), India, and other governments throughout the world have enacted, and continue to enact, laws and regulations to reduce off-road engine emissions. Compliance with these regulations requires significant investment in the development of new engine technologies and after-treatment systems.

Governments also are implementing laws regulating products across their life cycles, including raw material sourcing and the storage, production, packaging, distribution, sale, use, and disposal of products at their end of life. These laws and regulations include requirements to develop less hazardous chemical substances and products, right-to-know, restriction of hazardous substances, and product take-back laws.

We continually evaluate, clean-up, or conduct corrective action at a limited number of sites. We cannot guarantee that these matters or other expenses or liabilities we may incur in connection with any noncompliance with environmental laws, regulations, or the clean-up of any properties, will not have a material adverse effect on our consolidated financial position, results of operations, cash flows, or competitive position.

We continue to monitor and review developing sustainability frameworks, standards, and global regulations, such as the European Union’s Corporate Sustainability Reporting Directive (CSRD), and California’s SB-253 (Climate Corporate Data Accountability Act) and SB-261 (Climate-Related Financial Risk Act).

With respect to properties and businesses that have been or will be acquired, we conduct due diligence into potential exposure to environmental liabilities but cannot be certain that we have identified, or will identify, all adverse environmental conditions.

Government Regulations

We are subject to a wide variety of local, state, and federal laws and regulations in the countries where we operate. These laws and regulations include a range of trade, antitrust, product, anti-bribery and anti-corruption, data protection and privacy, foreign exchange, tax, labor and employment, environmental, health and safety, telecommunications, intellectual property, human rights, and other laws and regulations.

Compliance with these laws and regulations requires the dedication of time and effort of our employees, as well as financial resources. In fiscal year 2025, compliance with the regulations applicable to us did not have a material effect on our capital expenditures, earnings, or competitive position.

At this time, we do not expect to incur material capital expenditures related to compliance with regulations during fiscal year 2026. Additional information about the impact of government regulations on our business is included in Item 1A, “Risk Factors–Strategic Risks” and “Legal and Regulatory Compliance Risks.”

Human Capital Management

Our employees are guided by a simple principle: We run so life can leap forward. Our approach to human capital management is rooted in our core values: Integrity, Quality, Humanity, Commitment, and Innovation, which serve as the foundation for our workforce’s actions and decisions. These values are embedded within our Global Performance Management (GPM) program. Through GPM we foster a culture of continuous feedback and ongoing improvement.

Employees

At November 2, 2025, we had approximately 73,100 employees, of which approximately 32,500 were full-time production employees. We had 27,000 total employees in the U.S. of which approximately 11,600 were full-time production employees. We also retain consultants, independent contractors, and temporary and part-time workers. We are an equal opportunity employer committed to providing a workplace free of harassment and discrimination.

Unions are certified as bargaining agents for approximately 77% of our U.S. production and maintenance employees. Approximately 7,600 of our active U.S. production and maintenance workers are covered by a collective bargaining agreement with the United Auto Workers (UAW), with an expiration date of November 1, 2027. A small number of U.S. production employees are represented by the

10

Table of Contents

International Association of Machinists and Aerospace Workers (IAM). Collective bargaining agreements covering our employees in the U.S. expire between 2025 and 2027. Unions also represent the majority of employees at our manufacturing facilities outside the U.S.

There is no guarantee that we will be able to renew collective bargaining agreements or whether such agreements will be on terms satisfactory to us. For further discussion, see Item 1A Risk Factors “Talent Risks—Our business may be adversely affected by any disruptions caused by union activities.”

Code of Conduct

We are committed to conducting business in accordance with the highest ethical standards. We require all employees to complete training on our Code of Business Conduct. The Code provides specific guidance to all our employees outlining how they can and must uphold and strengthen the integrity that has defined John Deere since our founding. In addition, we maintain a global compliance hotline to report concerns of potential violations of the Code, global policies, or the law.

Training and Development

As our business segments evolve, we need a workforce equipped to address new opportunities and challenges.

We offer our employees upskill training, career planning, and leadership development to better prepare our employees for future career opportunities at Deere. We have tools and solutions for continuous learning and career development, along with training programs that are tailored to different geographic regions and job functions. Examples of such training include technical operation of equipment, robotics, automation, equipment assembly, and interpersonal skills for establishing relationships with customers and dealers.

Compensation and Benefits

Our total rewards are intended to be competitive, meet the varied needs of our global workforce, and reinforce our values. We are committed to providing comprehensive and competitive pay and benefits to our employees. We continue to invest in employees through growth, development, and well-being initiatives.

Our work environment is designed to promote innovation, well-being, and reward performance. Our total rewards for employees include a variety of components that aim to support our employees in building a strong financial future, including competitive market-based pay and comprehensive benefits. In addition to earning base pay, eligible employees are compensated for their contributions to our goals with both short-term cash incentives and long-term equity-based incentives.

Eligible full-time employees in the U.S. have access to medical, dental, and vision plans; savings and retirement plans; parental leave and paid time off; and mental health and wellness services.

Programs and benefits differ internationally for a variety of reasons, such as local legal requirements, market practices, and negotiations with works councils, trade unions, and other employee representative bodies.

Health and Safety

We strive to achieve safety excellence through increased focus on injury prevention, leading indicators, risk reduction, and health and safety management systems. We have made progress on implementing best practices and leading indicators for enabling employee safety over recent years with our Health and Safety Management System.

We utilize a safety balanced scorecard, which includes leading and lagging indicators, and is designed to enable continuous measurement of safety performance and drive continuous improvement. Leading indicators include completion of risk reduction projects targeting highest factory risks as well as safety engagements with employees. Lagging indicators include total recordable incident rate, number of Potential Serious Injuries or Fatalities (PSIF) or Serious Injuries or Fatalities (SIF) events, and higher order of control corrective actions from PSIF and SIF events. Leading and lagging indicators are tracked by most of our manufacturing facilities and internally reported.

In fiscal year 2025, we reported a total recordable incident rate of 1.45, a safety metric used to measure the number of recordable incidents per 100 full-time employees per year; and a lost time frequency rate of 0.61, a safety metric used to measure the number of lost time incidents per 100 full-time employees.

Employee Engagement

We continue to build and sustain a workplace where all employees feel valued, respected, and inspired to do their best work every day. We gather feedback from our employees through a variety of channels throughout the year, such as surveys, focus groups, and conversations regarding continuous improvement. We build on our higher purpose, our core values, and our business strategy in a way that engages, inspires, and recognizes our workforce so they can support our customers in solving their biggest challenges.

11

Table of Contents

Available Information

Our internet address is http://www.deere.com. We make the following reports filed by us available, free of charge, on our website under the “Investors” section, including any amendments thereto, as soon as reasonably practicable after they are filed or furnished with the United States Securities and Exchange Commission (SEC or Commission):

Annual Report on Form 10-K,
Quarterly Reports on Form 10-Q, and
Current Reports on Form 8-K.

These filings are also available at a website maintained by the SEC at http://www.sec.gov. The information contained on our website is not included in, nor incorporated by reference into this Annual Report on Form 10-K.

12

Table of Contents

INFORMATION ABOUT OUR EXECUTIVE OFFICERS

The following are our executive officers as of December 2, 2025. All executive officers are elected or appointed by the Board of Directors and hold office until the meeting of the Board of Directors following the annual meeting of stockholders each year.

Name (Age)

Present Deere Position (Effective Date)

Business Experience (Effective Date)

John C. May (56)

Chairman, Chief Executive Officer, and President (2020)

-
Chief Executive Officer and President (2019)
-
President and Chief Operating Officer (2019)

Joshua A. Jepsen (48)

Senior Vice President and Chief Financial Officer (2022)

-
Deputy Financial Officer (2022)
-
Director, Investor Relations (2018)

Ryan D. Campbell (51)

President, Worldwide Construction & Forestry and Power Systems (2022)

-
Senior Vice President and Chief Financial Officer (2019)

Jahmy J. Hindman (50)

Senior Vice President and Chief Technology Officer (2023)

-
Chief Technology Officer (2020)

Rajesh Kalathur (57)

President, John Deere Financial, and Chief Information Officer (2022)

-
President, John Deere Financial and Senior Vice President, Global Information Technology and Chief Financial Officer (2022)
-
President, John Deere Financial, and Chief Information Officer (2019)

Deanna M. Kovar (47)

President, Worldwide Agriculture & Turf Division, Production & Precision Ag, Sales and Marketing Regions of the Americas and Australia (2025)

-
President, Worldwide Agriculture & Turf Division, Small Ag & Turf, Sales and Marketing Regions of Europe, CIS, Asia, and Africa (2023)
-
Vice President, Production Systems, Production & Precision Ag (2023)
-
Vice President, Production Systems (2020)

Felecia J. Pryor (51)

Senior Vice President and Chief People Officer (2022)

-
Executive Vice President & Chief Human Resources Officer, BorgWarner Inc. (2022)
-
Global Vice President Human Resources, BorgWarner, Inc. - Morse Systems (2019)

Cory J. Reed (55)

President, Lifecycle Solutions, Supply Management, and Customer Success (2025)

-
President, Worldwide Agriculture & Turf Division, Production & Precision Ag, Sales and Marketing Regions of the Americas and Australia (2020)

Justin R. Rose (46)

President, Worldwide Agriculture & Turf Division, Small Ag & Turf, Sales and Marketing Regions of Europe, CIS, Asia, and Africa (2025)

-
President, Lifecycle Solutions, Supply Management, and Customer Success (2022)
-
Senior Partner and Managing Director, Boston Consulting Group (BCG) (2020)

Kellye L. Walker (59)

Senior Vice President, Corporate Secretary, and Chief Legal Officer, Global Law Services & Regulatory Affairs (2024)

-
Executive Vice President, Chief Legal Officer, and Corporate Secretary, Eastman Chemical Company (2020)

13

Table of Contents

ITEM 1A.

RISK FACTORS.

The following risks are considered material to our business based upon current knowledge, information, and assumptions. This discussion of risk factors should be considered closely in conjunction with the MD&A, including the risks and uncertainties described in the Forward-Looking Statements, and the Notes to Consolidated Financial Statements. These risk factors and other forward-looking statements relate to future events, expectations, trends, and operating periods. They involve factors that are subject to change and important risks and uncertainties that could cause actual results to differ materially. Some of these risks and uncertainties could affect particular lines of business, while others could affect all our businesses. Although the risks are organized by headings and each risk is discussed separately, many are interrelated. The risks described in this Annual Report on Form 10-K and the Forward-Looking Statements are not the only risks we face.

GEOPOLITICAL AND MACROECONOMIC RISKS

Our financial results largely depend upon the agricultural market business cycle, as well as general economic conditions and outlook. Negative conditions in the agricultural industry and general economy cause weakened demand for our equipment and services, limit access to funding, and result in higher funding costs.

Our success largely depends on the vitality of the agricultural industry. Historically, the agricultural industry has been cyclical and subject to a variety of economic and other factors; consequently, sales of agricultural equipment are also cyclical and generally reflect the economic health of the agricultural industry.

The economic health of the agricultural industry is affected by numerous factors, including farm income, international trade, farmland values, debt levels, and financing costs. In addition, farm income is influenced by commodity and protein prices, world grain stocks, acreage available and planted, crop yields, agricultural product demand, soil conditions, farm input costs, government policies and support. Changes in government farm programs and policies can influence demand for agricultural equipment as well as create unequal competition for multinational companies relative to domestic companies. Downturns in the agricultural industry due to these and other factors, which could vary by market, have resulted in decreases in demand for agricultural equipment, adversely affecting our business and financial performance.

The demand for our products and services depends on the fundamentals in the markets in which we operate and can be significantly reduced in an economic environment characterized by high unemployment, high interest rates, cautious consumer spending, inflation, lower corporate earnings, and lower business investment, all of which affect farmers’ income and sentiment. In fiscal year 2025, unfavorable market conditions resulted in lower sales volumes, greater reliance on sales incentives, and elevated receivable write-offs. We expect certain of these conditions to persist in fiscal year 2026. Changes in the economic environment and the agricultural market business cycle are driven by factors outside of our control, and as a result we cannot reasonably foresee when these conditions will fully subside.

Sustained general negative economic conditions and outlook could also affect construction and housing activities, and energy prices and demand, which could decrease demand for construction and turf equipment and could have a material adverse effect on our financial results.

Uncertain or negative outlook with respect to pervasive U.S. fiscal issues as well as general economic conditions and outlook, such as market volatility, inflation, or interest rate changes, have caused and could continue to cause significant changes in market liquidity conditions. Such changes could impact access to funding and associated funding costs, which could reduce our earnings and cash flows.

We face risks associated with international, national, and regional trade laws, regulations, and policies that could materially impair our profitability.

International, national, and regional laws, regulations, and policies directly or indirectly related to or restricting the import and export of our products, services, and technology, or those of our customers or suppliers, or for the benefit of favored industries or sectors, have harmed our global business. We are subject to various trade regulatory risks including, but not limited to, the following:

The imposition of tariffs and retaliatory tariffs has impacted, and we expect will continue to impact, the sourcing of parts and components, the cost and profitability of manufacturing operations, and our ability to ship, import, and export our products. During fiscal year 2025, new tariffs were imposed in the U.S. for imports from a broad range of countries and materials. Several countries also implemented or proposed retaliatory tariffs on imports from the U.S., as well as other barriers to trade. As a net exporter of agriculture and turf equipment from the U.S., these trade policies impact us. Nearly 80% of our domestic sales are assembled in the U.S., with the remaining products imported primarily from Europe, Mexico, India, and Japan. During fiscal year 2025, incremental import tariffs adversely affected the cost of our products and components and may continue to do so in 2026. In addition, retaliatory tariffs by regions outside the U.S., currently in effect or adopted in the future, may impact the prices of our

14

Table of Contents

exported products and the profit realized from these exports. The direct impact of incremental tariffs incurred by us in 2025 was approximately $600, excluding the impact of tariffs on our suppliers and market demand. On November 5, 2025, the United States Supreme Court heard oral arguments on tariffs imposed under the International Emergency Economic Powers Act (IEEPA). The court may provide tariff relief and the potential recovery of amounts previously paid. We are monitoring developments in this case and its impact on our future financial statements and business.
Changing U.S. export controls and sanctions on various foreign countries and on various parties could affect our ability to manufacture our products in foreign jurisdictions, collect receivables, provide aftermarket warranty support for our equipment and sell products, and could otherwise impact our reputation and business.
Restricted access to global markets could impair our ability to export goods and services from various manufacturing locations around the world and limit the ability to access raw materials and high-quality parts and components at competitive prices on a timely basis.
Trade restrictions could impede those in developing countries from achieving a higher standard of living, which could negatively impact our future growth opportunities arising from increasing global demand for food, fuel, and infrastructure.
Policies impacting exchange rates and commodity prices, or those limiting the export or import of commodities, could have a material adverse effect on the international flow of agricultural and other commodities that may result in a corresponding negative effect on the demand for agricultural and forestry equipment in many areas of the world. Our agricultural equipment sales could be harmed by such policies because farm income influences sales of agricultural equipment around the world.
If our business partners were to incur regulatory or judicial action, it could impact our ability to operate certain solutions abroad, or our connectivity to rural farmers.

Our international operations expose us to risks and events beyond our control in countries in which we operate.

Efforts to grow our businesses depend in part upon access to and developing and maintaining market share and profitability in additional geographic markets, including, but not limited to, Argentina, Brazil, CIS, China, India, and South Africa. Particularly, we have invested significant resources to grow our operations in Brazil, and in 2024, we built a research and development center in Indaiatuba. We may not realize the benefits from our investment in Brazil or in other regions and may be unable to grow our market share for a variety of reasons. For example, some countries where we operate have greater political and economic volatility and greater infrastructure vulnerability than others. There are various risks associated with our global footprint, including, but not limited to, the following:

economic and political instability, including war or armed conflict, changes in government policies, expropriation, nationalization, and other political, economic, or social developments,
increased tariffs, trade barriers, trade agreements, and other restrictions on international trade,
supply chain disruptions, including, as a result of natural disasters, transportation disruptions, and geopolitical events,
multiple and potentially conflicting laws, regulations, and policies that are subject to change, along with the complexity and cost of compliance,
currency fluctuations which can affect the value of our foreign currency revenues, expenses, and cash flows,
inadequate intellectual property protections in foreign jurisdictions that could result in the unauthorized use or infringement of our intellectual property,
adverse consumer sentiment for non-local products,
local labor market conditions, and
lack of brand recognition in our emerging markets.

The occurrence of one or more of these events has, from time to time, impacted, and may in the future impact, our business in a variety of ways, including reducing demand for our products, increasing costs, limiting our ability to operate in certain jurisdictions, disrupting our ability to deliver products to customers on time and at competitive prices, subjecting us to fines, penalties, and sanctions, harming our competitive position, devaluation of assets, and impacting our financials.

Please also refer to the risk factors in the “Legal and Regulatory Compliance Risks” section below that address our legal and regulatory risks associated with our international operations.

15

Table of Contents

Changing worldwide demand for food and different forms of renewable energy can impact the price of farm commodities and consequently the demand for our equipment. This could result in higher research and development costs related to changing machine fuel requirements.

Changing worldwide demand for farm outputs to meet the world’s growing food and renewable energy demands, driven in part by government policies, including those related to climate change, and a growing world population, is likely to result in fluctuating agricultural commodity prices, which directly affect sales of agricultural equipment. Lower agricultural commodity prices directly affect farm incomes, which negatively affect sales of agricultural equipment and result in higher credit losses.

While higher commodity prices benefit our crop-producing agricultural equipment customers, they could result in greater feed costs for dairy and livestock producers, which in turn may result in lower levels of equipment purchased by those customers. International buyers can also change the source of imported agricultural products, such as corn and soy, from the U.S. to other countries, impacting the profitability of our customers and demand for our equipment.

In addition, changing energy demand may cause farmers to change the types or quantities of the crops they raise, with corresponding changes in equipment demands. The growing demand for biofuels has led to a corresponding increased demand for agriculturally based feedstocks used in their production, such as corn in the U.S. and Europe and sugar cane in Brazil. This increased demand may increase the demand for agricultural equipment to be used in the production of such crops. However, the economic feasibility of biofuels can be impacted by the price of oil. As the price of oil falls, biofuels become a less attractive alternative energy source, and as a result, there is uncertainty with respect to any benefits we may realize with respect to our investments related to renewable energy.

Furthermore, changes in governmental policies regulating fuel utilization, including biofuel, affect commodity demand and commodity prices, demand for our diesel-fueled equipment, and result in higher research and development costs related to equipment fuel standards.

OPERATIONAL AND MANUFACTURING RISKS

Restructuring, rationalization, and relocation of manufacturing facilities may cause capacity constraints, inventory fluctuations, and other issues.

The rationalization or restructuring of our manufacturing facilities, including relocating production or closing facilities, requires significant investment and places temporary constraints on our ability to produce the quantity of products necessary to fill orders, and thereby complete sales in a timely manner.

In addition, decisions regarding the rationalization, restructuring or relocation of facilities, and any similar actions, could also subject us to additional or new tariffs, reputational risks, and other issues relating to the importation of products. In 2024, we shifted production of small-frame skid steer loaders and compact track loaders to Mexico. As a result, these products became subject to additional tariffs on imports from Mexico in 2025. Even though we are taking actions to qualify for an exemption under the United States-Mexico-Canada Agreement (USMCA) to mitigate the elevated costs, there is no guarantee that we will be able to obtain such qualification.

Furthermore, our manufacturing processes are dependent on water. Increasing competition for water resources, regulatory restrictions on water, and environmental changes can lead to water scarcity. Any significant reduction in water availability could disrupt our manufacturing processes, increase our operational costs, and limit our ability to meet customer demand.

Inability to accurately forecast customer demand for products and services, and to adequately manage inventory, could adversely affect our operating results.

To ensure adequate inventory supply, we must forecast inventory needs and expenses and place orders sufficiently in advance with suppliers and contract manufacturers. These forecasts are based on estimates of future demand for products and services. Failure to accurately forecast our needs results in unmet market demand, parts shortages, manufacturing delays or inefficiencies, increased costs, or excess inventory. Our ability to accurately forecast demand could be affected by many factors, including changes in customer demand for our products and services, used equipment inventory outstanding, changes in demand for the products and services of competitors, unanticipated changes in agricultural and general market conditions, and the weakening of economic conditions or customer confidence in future economic conditions. In 2025, elevated used inventory levels in late model-year machines impacted demand for our products in North America resulting in lower price realization and actions to reduce our inventory level. If the forecasts used to manage inventory are not accurate, we may experience excess inventory levels, shortage of available products, or reduced manufacturing efficiencies.

16

Table of Contents

Changes in the availability and price of certain raw materials, components, and whole goods have resulted and could result in disruptions to the supply chain causing production disruptions, increased costs, and lower profits from sales of our products.

Our business relies on a complex global supply chain, and any disruptions can impact our operations. We have experienced changes in the availability and prices of raw materials, components, whole goods, and freight over the past several years.

Past global logistics network challenges have resulted in delays, shortages of key manufacturing components, increased order backlogs, increased transportation costs, and production inefficiencies from a higher number of partially completed machines in inventory, which in the past have increased our overall production and overhead costs. Increases in such costs have adversely affected our business operations.

We anticipate fluctuations in our supply chain due to ongoing geopolitical and economic uncertainty, and regulatory and policy instability, including import tariffs and trade agreements. For example, certain of our products, including motors, batteries, and other components, rely on rare earth minerals for their manufacturing, of which a significant majority are sourced from China. The inability to obtain export permits for rare earth minerals could have a detrimental effect on our business. These complications have the potential to significantly increase production and logistics costs, including additional research and development costs for designing alternative solutions, and therefore would have a detrimental effect on the profitability of the business. Rapid changes and growing complexity in trade policies may also affect the ability of customs brokers and logistics providers to timely process imported products, which could result in delays, higher logistics costs, and production disruptions.

The financial stability of our suppliers can also impact the continuity of our supply chain. A number of our suppliers are facing higher prices due to inflation, increased tariffs or otherwise. If one or more of our suppliers continue to encounter financial hardships, delivery setbacks, or other performance-related difficulties, we may be unable to fulfill our obligations to customers. Furthermore, if any of the raw materials critical to our manufacturing become unavailable to our suppliers, or are only accessible at significantly higher costs, including due to increased tariffs or trade restrictions, or are affected by quality problems or defects, our ability to deliver certain products on schedule or within budget could be compromised.

Significant disruptions to the supply chain resulting from shortages of raw materials, components, and whole goods have and could continue to adversely affect our ability to meet commitments to our customers. Examples of such disruptions include:

work interruption or union strikes by employees of suppliers,
reliance on single source suppliers, or suppliers that are proprietary in nature that cannot be replaced expeditiously, and
natural disasters, pandemics, or other unforeseen events can disrupt the flow of materials.

Furthermore, if our customers are unwilling to accept price increases for our products, or if we are unable to offset the increases in costs, raw material costs or shortages could have a material adverse effect on our operational or financial results.

Failure by our supply base to use ethical business practices and comply with applicable laws and regulations may adversely affect our business, financial condition, and operational results.

While we conduct due diligence on our suppliers and require their compliance with various policies and contractual covenants, we do not control our suppliers’ business practices. Accordingly, we cannot guarantee that our due diligence efforts will reveal that they follow ethical business practices such as fair wage practices and compliance with environmental, safety, labor, human rights, material sourcing, and other laws.

Failure to comply could lead us to seek alternative suppliers, which could increase our costs and result in delayed delivery of our products, product shortages, or other disruptions in operations. If our suppliers fail to comply with ethical standards and applicable laws, regulations, safety codes, employment practices, human rights standards, quality standards, environmental standards, production practices, or other obligations, norms, identification and reporting requirements, our reputation and brand could be harmed, and we could be exposed to litigation, investigations, enforcement actions, monetary liability and additional costs that could have a material adverse effect on our business, financial condition, and results of operations.

Unexpected events have increased and may in the future increase our cost of doing business or disrupt our operations.

The occurrence of one or more unexpected events, including war, lack of available natural resources, acts of terrorism, epidemics and pandemics, civil unrest, fires, tornadoes, tsunamis, hurricanes, earthquakes, temperatures outside of normal ranges, floods, and other forms of severe or unusual weather in countries in which we operate, or in which our suppliers are located, have adversely affected and could in the future adversely affect our operations and financial performance. Such events have caused and could cause complete or partial closure of one or more of our manufacturing facilities or distribution centers, temporary or long-term disruptions in the supply of component products from some local and international suppliers, and disruption and delay in the transport of products to dealers,

17

Table of Contents

end-users, and distribution centers. Existing insurance coverage may not provide protection from all the costs that may arise from such events.

The potential physical impacts of weather conditions or climate change on our facilities, suppliers, and customers, and therefore on our business, are uncertain and will be specific to the circumstances developing in various geographic regions. These potential physical effects may adversely affect the demand for our products and the cost, production, sales, and financial performance of our operations.

FINANCIAL RISKS

Changes in interest rates or market liquidity conditions, as well as changes in government banking, monetary and fiscal policies, could adversely affect our financials and our earnings and/or cash flows.

High interest rates can dampen overall economic activity and/or the financial condition of our customers, either or both of which can negatively affect customer demand for our equipment and our customers’ ability to repay us. High interest rates also increase the cost of carrying inventory for our dealers and the cost of financing for end customers. Interest rates in the U.S. have decreased and Brazil remained elevated in 2025. Higher rates and volatility in rates impact us in several ways, primarily affecting the demand for our products, financing spreads for the financial services operations, the value of our investments, and the financial health of our dealers. The markets for our agriculture, turf, and construction products were negatively impacted in 2025 by elevated interest rates and their effect on borrowing costs for our customers.

While we strive to match the interest rate characteristics of our financial assets and liabilities, changing interest rates have affected our financing spreads—the difference between the yield we earn on our assets and the interest rates we pay for funding—which have affected our earnings.

In addition, actions by credit rating agencies, such as downgrades or negative changes to ratings outlooks, can affect the availability and cost of funding for us and can increase our costs of capital and hurt our competitive position.

Moreover, policies of the U.S. and other governments regarding banking, monetary, and fiscal policies intended to promote or maintain liquidity, stabilize financial markets, and/or address local deficit or structural economic issues have a material impact on our customers and markets.

Our operations and results could also be affected by financial regulatory reform that could, among other things, have an adverse effect on the financial services segment and on our customers by limiting their ability to enter hedging transactions or to finance purchases of our products. Government policies on spending can also affect us, especially the CF segment, due to the impact of government spending on infrastructure development. Our operations, including those outside of the U.S., may also be affected by non-U.S. regulatory reforms being implemented to further regulate non-U.S. financial institutions and markets.

Because the financial services segment provides financing for a significant portion of our sales worldwide, negative economic conditions in the financial industry could materially impact our operations and financial results.

Negative economic conditions have an adverse effect on the financial industry in which the financial services segment operates. The financial services segment provides financing for a significant portion of our sales worldwide. The financial services segment is vulnerable to customers and others defaulting on contractual obligations, and has experienced, and may continue to experience write-offs and credit losses that, in some cases, exceed our expectations and adversely affect our financial condition and results of operations as a result of elevated delinquencies. The allowance for credit losses on retail notes and financing lease receivables increased in 2025 primarily due to higher expected losses on agriculture and turf customer accounts as a result of elevated delinquencies and a decline in market conditions. We occasionally grant contractual modifications to customers experiencing financial difficulties. There is no guarantee that customers experiencing financial difficulty will be able to satisfy their obligations in accordance with original or modified terms. As a result, our allowance for credit losses may continue to increase in future periods.

The financial services segment’s inability to access funds at cost-effective rates to support our financing activities could have a material adverse effect on our business. The financial services segment’s liquidity and ongoing profitability depend largely on timely access to capital to meet future cash flow requirements and to fund operations and costs associated with engaging in diversified funding activities. The financial services segment may also experience residual value losses that exceed our expectations caused by lower pricing for used equipment and higher-than-expected equipment returns at lease maturity.

Changes in tax rates, tax legislation, or exposure to additional tax liabilities could have a negative effect on our business.

We are subject to income taxes in the U.S. and numerous foreign jurisdictions. Our domestic and international tax liabilities are dependent upon the location of earnings among these different jurisdictions. Tax rates in various jurisdictions may be subject to significant change. Our effective tax rates could be affected by changes in the mix of earnings in countries with differing statutory tax

18

Table of Contents

rates, changes in the valuation of deferred tax assets and liabilities, or changes in tax laws or their interpretations. If our effective tax rates were to increase, or if the ultimate determination of taxes owed is for an amount more than amounts previously accrued, our operating results, cash flows, and financial condition could be adversely affected.

STRATEGIC RISKS

We may not realize the anticipated benefits of our Smart Industrial Operating Model and Leap Ambitions.

Failure to realize the anticipated benefits of our Smart Industrial Operating Model and related business strategies in production systems, precision technologies, and aftermarket support, as well as failure to have selected a business strategy that aligns with our customers’ needs and market trends, could have an adverse effect on our operational and financial results.

Several factors could impact our ability to successfully execute, and to benefit from, our Smart Industrial Operating Model, including, among other things:

our inability to accurately assess market opportunities and the technology required to address such opportunities,
falling behind in developing and introducing new technologies,
customers not seeing the value proposition of the technologies and deciding not to adopt them,
our inability to holistically provide lifecycle solutions,
inability to fully monetize technology-based solutions,
being unable to optimize our capital allocation in connection with the Smart Industrial Operating Model, and
the adoption of new regulations or policies supporting and/or subsidizing outputs that are inconsistent with our strategy, such as policies that have the effect of encouraging or supporting the use of conventional sources of energy.

Similarly, we may not realize the anticipated benefits of our Leap Ambitions and related goals within the expected timelines, or at all. As part of our Leap Ambitions, we adopted certain financial and operational goals, which were refined in December 2025. In the future, we may again modify these goals, abandon them or be unable to achieve them for a variety of reasons, some of which may be beyond our control. Examples of such reasons include:

the evolution of our business strategy, our business model, and our business needs;
our estimates and assumptions related to efficiency of our products and the adoption of precision technology may not be accurate; in particular, we have experienced slower than expected customer adoption of some of our precision technology solutions, and SaaS subscription services;
customers may not understand the value proposition of the various SaaS subscription models;
the time required to build the capabilities and infrastructure to support our SaaS business, which has delayed the timing of realization of the expected benefits; and
dealers may not be able to effectively establish relationships with customers, maintain those customer relationships, and provide SaaS solutions and support to our customers.

The introduction of new products and technologies involves risk, and, from time to time, we may fail to realize their anticipated benefits.

We design and manufacture products that incorporate advanced technologies. Many of our products and services are highly engineered and involve sophisticated technologies with related complex manufacturing and systems integration processes. We invest substantial amounts in research and development efforts to pursue advancements in a wide range of technologies, products, and services aimed at meeting the ever-evolving product, and service needs of our customers.

Our ability to realize the anticipated benefits of our investments in technology and product design depends on a variety of factors, including:

the usefulness and competitiveness of our offerings relative to our peers,
access to radio frequency (RF) spectrum and satellite functionality which enables connectivity for equipment, operations, owners, dealers, and technicians,
meeting development, production, certification, and regulatory approval schedules,
adequate intellectual property protections in relevant jurisdictions and our ability to protect our intellectual property,
achieving cost and production efficiencies,
availability and quality of product parts and materials, both from our suppliers and internally produced,

19

Table of Contents

availability of test equipment,
development of complex software,
hiring and training of qualified personnel,
training our dealers and their technicians,
identification of emerging technological trends,
compliance requirements regarding data privacy and artificial intelligence, and
customer acceptance and the pace of adoption of our products and technologies, which with respect to some of our solutions and subscription models, has been slower than we expected.

We compete on product performance, innovation, quality, distribution, sustainability, customer service, and price. Aggressive pricing or other strategies of competitors, unanticipated product or manufacturing delays, our failure to deliver quality products that meet customer needs, or our failure to price products competitively, adversely affect our business, results of operations, and financial condition.

To remain competitive, we need to have a thorough understanding of our existing and potential customers on a global basis, particularly in growth markets such as Argentina and Brazil. If we are unable to effectively develop and deliver technology that customers can easily adopt and utilize, customers may not adopt our technology which would adversely impact our business operations and future financial performance. Therefore, our ability to deliver precision technology and expand value-driven solutions is critical to our business success.

In addition, artificial intelligence technologies have rapidly developed, and our business may be adversely affected if we cannot successfully integrate the technology into our internal business processes, products, and services in a timely, cost-effective, compliant, and responsible manner.

These investments may not produce solutions that provide the desired results for customers’ profitability or sustainability outcomes, impacting our competitive position.

From time to time our equipment fails to perform as expected and we have experienced, and may in the future experience, warranty claims, post-sale repairs and recalls, and other consequences.

From time to time, we have received warranty claims and have had to perform post-sales repairs or recalls due to our equipment not performing as expected. In such cases, we may also face regulatory requirements and penalties that can impact our ability to develop, market, and sell equipment. These circumstances may result in product delivery delays and claims related to product liability, breach of warranty, and consumer protection. The costs associated with these claims and warranty expenses could be significant. We must manage the cost and risk associated with product warranties, post-sale repairs and recalls, regulatory penalties, and product liability, breach of warranty, and consumer protection claims with respect to our products. We may also be subject to investigations relating to our products by government regulators which may compel us to initiate product recalls or may result in negative public perceptions about the safety of our products, even if we disagree with the regulator’s determination. Such post-sale repairs or recalls, whether voluntary or involuntary, could result in significant expense, supply chain complications, and may harm our brand, business, prospects, financial condition, and operating results.

We rely on a network of independent dealers to manage the distribution of our products and services. If our dealers are unsuccessful with their sales and business operations, it could have an adverse effect on our overall sales and revenue.

We rely on the capability of our dealers to develop and implement effective sales plans to create demand among purchasers for the equipment and related products and services they purchase from us. If our dealers are unsuccessful in these endeavors, we will be unable to increase our sales and revenue, which would have an adverse effect on our financial condition.

Our dealers carry inventories of finished products as part of their operations and adjust those inventories based on future needs and market conditions, including the level of used equipment inventory. When the total inventory levels of our dealers are higher than they desire, dealers have postponed equipment purchases from us, and could continue to postpone purchases in the future, which could cause our sales to be lower and negatively impact our results. Similarly, our results could be negatively impacted through the loss of time-sensitive sales if our dealers do not maintain inventory levels sufficient to meet customer demand.

In addition, the dealer channel’s ability to support and service new technologies may affect customers’ acceptance and adoption rates of these products. The unavailability of specialized technicians to service our equipment may result in overburdening dealers’ servicing capacity.

20

Table of Contents

Furthermore, dealers may exit, or we may seek to terminate relationships with certain dealers if they are unable to meet customer needs. The unplanned loss of any of our dealers could lead to inadequate market coverage or negative customer impressions and may adversely impact our ability to collect receivables and generate new sales that are associated with that dealer. Dealers could also have trouble funding their day-to-day cash flow needs and paying their obligations due to adverse business conditions resulting from negative economic effects or other factors.

We may not realize the anticipated benefits of acquisitions, joint ventures, and divestitures, or these benefits may take longer to realize than expected.

From time to time, we make strategic acquisitions and divestitures and participate in joint ventures. Acquisitions and joint ventures we have entered into, or may enter into in the future, may involve significant challenges and risks, including that the acquisitions or joint ventures do not advance our business strategy, or fail to produce satisfactory returns on investment. Other risks include:

difficulties integrating acquisitions with our operations, applying internal control processes to these acquisitions (including those related to cybersecurity), managing strategic investments, assimilating new capabilities to meet the future needs of our businesses, and/or combining business cultures;
regulatory or compliance exposure until appropriate processes and controls are implemented;
integration costs and significant attention from management and personnel;
failing to realize the anticipated benefits of acquisitions or joint ventures, or realized benefits being significantly delayed, including because the technologies or products acquired may not be complementary or compatible with our business strategy or product portfolio, may not broaden our market position, product portfolio or footprint, or enhance our ability to deliver value to our customers; and
due diligence evaluations of potential transactions not identifying all of the business, legal, compliance, and financial risks to accurately estimate the impact of a particular acquisition or joint venture, including potential exposure to regulatory sanctions resulting from an acquisition target’s previous activities or costs associated with any quality issues with an acquisition target’s products or services.

Our reputation and brand could be damaged by negative publicity.

Our brand has worldwide recognition and contributes to the success of our business. Our reputation is critical for growing our customer base. Our brand depends on the ability to maintain a positive customer perception of the business. Negative claims or publicity across media channels involving us, our products or services, our culture and values, our stance on environmental, social, and governance topics, customer data, or any of our key employees or suppliers, may damage our reputation and brand image, regardless of whether such claims are accurate. Furthermore, our shareholders, customers, and other stakeholders have evolving, varied and often conflicting expectations regarding our culture, values, and our business, which makes it difficult to achieve a uniform positive perception amongst all stakeholders.

Additionally, negative or inaccurate postings, articles, or comments on social media, the internet, or the press about us have generated, and could continue to generate negative publicity that damages the reputation of our brand. For example, we have experienced negative social media campaigns related to our approach to diversity and inclusion, our customers’ right to maintain and safely repair their equipment, including with respect to our Memorandum of Understanding with the American Farm Bureau Federation, reductions in workforce, and production relocation. Further, adverse publicity about regulatory or legal action against us, or legal proceedings initiated by us, also damages our reputation and brand image, undermining customer confidence, and reducing long-term demand for equipment, even if the regulatory or legal action is unfounded or not material to our operations. If the reputation, culture, or image of our brands are damaged, or we receive negative publicity, then our sales and financial condition, and results of operations could be materially and adversely affected.

TALENT RISKS

Our ability to attract, develop, engage, and retain qualified employees could affect our ability to execute our strategy.

Our continued success depends, in part, on our ability to identify and attract qualified candidates with the requisite education, background, and experience, as well as our ability to develop, engage, and retain qualified employees. Failure to attract, develop, engage, and retain qualified employees, difficulty in recruiting new employees, perceived or actual erosion of our culture, or inadequate resources to train, integrate, and retain qualified employees, could impair our ability to execute our business strategy and could adversely affect our business, results of operations, and financial condition.

In addition, our culture and our values have been important contributors to our success to date and we believe promote a sense of pride and fulfillment in our employees. Failure to preserve our culture or focus on our values could negatively affect our ability to retain and recruit talent.

21

Table of Contents

While we strive to reduce the impact of the departure of employees, our operations or ability to execute our business strategy may be affected by the loss of employees, including in connection with reductions in workforce. Reductions may adversely affect us as a result of decreased employee morale, the loss of institutional knowledge, the allocation of resources to reorganize and reassign job roles and responsibilities, and the increased risk of litigation from former employees.

Our business may be adversely affected by any disruptions caused by union activities.

Many of our production and maintenance employees are represented by labor unions under various collective bargaining agreements with different expiration dates. There is no certainty that we will successfully negotiate new agreements with these unions that extend beyond the current expiration dates, or that these new agreements will be on terms that will allow us to be competitive.

Our failure to successfully renegotiate labor agreements as they expire has, from time to time led, and could in the future lead, to work stoppages or other disputes with labor unions. Any strike, work stoppage, or other dispute with a labor union distracts management from operating the business, may displace employees from ordinary job positions to fill in vacant positions, may affect our reputation, and could adversely affect our business, results of operations, and financial condition.

In addition, additional employees may choose to join or seek recognition for forming a labor union. If additional employees organize in the future, such employees may threaten and/or engage in work stoppages or organize campaigns. The outcomes from such actions may affect our reputation, and could adversely affect our business, results of operations, and financial condition.

CYBERSECURITY AND DIGITAL RISKS

Security breaches and other disruptions to our information technology infrastructure could interfere with our operations and could compromise our information as well as information about our employees, customers, suppliers, and/or dealers, exposing us to liability that could cause our business and reputation to suffer.

We rely upon information technology networks and systems, some of which are managed by third parties, to process, transmit, and store electronic information and to manage or support a variety of products within our portfolio, business processes and activities, including supporting our customers’ operations, products and solutions, supply chain, manufacturing, distribution, invoicing, and collection of payments from customers and dealers. We use information technology systems to record, process, and summarize financial information and results of operations for internal reporting purposes and to comply with regulatory financial reporting, legal, and tax requirements.

Additionally, we collect and store confidential data, including intellectual property, proprietary business information, and the proprietary business information of our customers, suppliers, and dealers, as well as personal data of our customers and employees in data centers, which are often owned by third parties and maintained on their information technology networks. In particular, the John Deere Operations Center™, our digital management system that allows customers to access farm and jobsite information through their devices, stores substantial volumes of data at the edge and within cloud environments. This data is used to assist and support our customers’ operations and machines, and to enhance and develop our product offerings, including the development of machine learning, large language models and SaaS products. The secure operation of these information technology networks, and the processing and maintenance of this information, are critical to our business operations and strategy.

Despite security measures designed to discover and address potential vulnerabilities, our information technology networks and infrastructure have been and may continue to be vulnerable to: (i) intrusion, (ii) exfiltration of data, (iii) damage, (iv) disruptions or shutdowns due to attacks by cyber criminals or foreign state actors, (v) employees’, suppliers’, or dealers’ error or malfeasance, (vi) supply chain compromise, (vii) disruptions during the process of upgrading or replacing computer software or hardware, (viii) power and systems outages, (ix) computer viruses, (x) ransomware or other malware, (xi) telecommunication or utility failures, (xii) terrorist acts, (xiii) natural disasters, (xiv) and other events.

Our reliance on cloud-based systems owned by third parties creates particular risks. Because we do not control the underlying infrastructure, we depend on the security and reliability of third-party providers, and any outage, misconfiguration, or loss of data could compromise the integrity of our and our customers’ operations and impair the execution of our business strategy and the achievement of our goals.

Although we have not suffered any significant cyber incidents that have resulted in material business impact, we have from time to time been, and expect to continue to be, the target of malicious cyber threat actors. The occurrence of any significant event could compromise our networks, and the information stored there could be accessed, obtained, publicly disclosed, lost, altered, misused, or stolen. Any such access, acquisition, disclosure, alteration, misuse, or other loss of information could result in legal claims or proceedings, government investigations, liability or regulatory penalties, disruption or shut down of our operations, disruption or shut down of our dealers’ and customers’ operations, and damage to our reputation, which could adversely affect our business, results of

22

Table of Contents

operations, and financial condition. Furthermore, as security threats continue to evolve and increase in frequency and sophistication, we may need to invest additional resources to enhance information security.

Any unauthorized control or manipulation of our products’ systems could result in a loss of confidence in us and our products.

Some of our products include connectivity hardware and software typically used for remote system updates. While we have implemented security measures intended to protect against unauthorized remote access to these products, malicious threat actors have attempted, and may attempt in the future, to gain unauthorized access to such products in order to gain control of the products, change the products’ functionality, user interface, or performance characteristics, interfere with the products’ operations, or gain access to data stored in or generated by the products or to systems to which they connect.

In addition, reports of unauthorized access to our products, systems, and data, regardless of their accuracy or reliability, have resulted, and may in the future result, in the perception that the products, systems, or data are vulnerable to malicious or unauthorized modifications. Any unauthorized access to or control of our products or systems, any loss of data, or any perception that products, systems, or data are vulnerable could result in loss of sales based on customers’ loss of confidence in our products, legal claims or proceedings against us, government investigation, liability, or regulatory penalties, which could adversely affect our business, results of operations, and financial condition.

Technical or regulatory limitations may impact our ability to effectively implement automation, autonomy, and artificial intelligence solutions.

We utilize and intend to expand our use of automation and machine learning in many of our products, including consumer-facing features, and we leverage generative artificial intelligence in our business processes. For example, we use automation software, digital tools, applications, and analytics on the S7 Series Combines and our See & Spray™ targeted spraying solution. In addition, we maintain the John Deere Operations Center™, which stores substantial volumes of data with respect to our customers’ operations and that we use to support our customers and to develop or enhance our product offerings.

While we believe the use of these emerging technologies can present significant benefits, they also create risks and challenges. Data sourcing, technology, integration and process issues, bias in decision-making algorithms, concerns over intellectual property, reputational implications if use becomes controversial, system security concerns, or the protection of privacy could impair the adoption and acceptance of autonomous machine solutions. Additionally, if we are unable to match or surpass the advances of artificial intelligence that our competitors implement for their products or for internal operations, our competitive position could be impacted.

Furthermore, any confidential information that is disclosed to a third-party generative artificial intelligence platform could be leaked or disclosed to others, including sensitive information that is used to train the third parties’ model. Additionally, if the data used to train the solution or the content, analyses, or recommendations that the machine learning and intelligence applications assist in producing is deemed to be inaccurate, incomplete, biased or questionable, our brand and reputation may be harmed, and we may be subject to legal liability claims. The development of our own artificial intelligence applications will require additional investment in the development of proprietary systems, models, or datasets, which are complex, costly and could impact the results of our operations. Developing, testing, and deploying these technologies may also increase the cost profile of our products due to the level of investment needed to enable such initiatives. In addition, there is no guarantee that we will be able to develop such applications and execute on the longer-term aspects of our business strategy.

Disruption of our technology systems or unexpected network interruption could disrupt our business.

We are increasingly dependent on technology systems to operate on a day-to-day basis. The failure of our technology systems, including the John Deere Operations Center™, to operate properly or effectively, problems with transitioning to upgraded or replacement systems, or difficulty in integrating new systems, could adversely affect our business. These disruptions could result in delays, which could reduce demand for our products and cause our sales to decline. In addition, if changes in technology cause our information systems to become obsolete, or if our information systems are inadequate to manage our growth and new technologies, we could lose customers. Any significant disruption in our technology systems could harm our reputation and credibility and could have a material adverse effect on our business, financial condition, and results of operations.

LEGAL AND REGULATORY COMPLIANCE RISKS

Our global operations are subject to complex and changing laws and regulations, the violation of which could expose us to potential liabilities, increased costs, and other adverse effects.

We are subject to numerous international, federal, state, and local laws, regulations, and executive orders; many of which are complex, frequently changing, and subject to varying interpretations.

23

Table of Contents

These laws, regulations, and executive orders cover a variety of subjects, including advertising, anti-money laundering, antitrust, autonomy systems, consumer finance, environmental, climate-related, health and safety, foreign exchange controls and cash repatriation restrictions, foreign ownership and investment, import/export and trade, human rights, labor and employment, product liability reporting, cybersecurity, data privacy, encryption, artificial intelligence, telecommunications, and drones. Changes to existing laws, regulations, executive orders, and enforcement priorities, changes to how they are interpreted, or the implementation of new, more stringent laws, regulations, and executive orders, could adversely affect our business by increasing compliance costs, limiting our ability to offer a product or service, requiring changes to our business practices, or otherwise making our products and services less attractive to customers. Failure to comply with these laws, regulations, and executive orders could result in fines and penalties. For example, in the U.S., we could lose government contracts and be subject to penalties if we fail to comply with executive orders. In addition, we must comply with the U.S. Foreign Corrupt Practices Act (FCPA) and all applicable foreign anti-bribery and anti-corruption laws. These laws generally prohibit companies and their intermediaries from making improper payments or providing anything of value to improperly influence government officials or private individuals for the purpose of obtaining or retaining a business advantage, regardless of whether those practices are culturally expected in a particular jurisdiction. Although we have a compliance program in place designed to reduce the likelihood of potential violations of these laws and regulations, our employees, contractors, or agents have violated, and in the future could violate such laws and regulations or our policies and procedures. Violations of these laws and regulations have resulted, and could result in the future, in criminal or civil sanctions and may have a material adverse effect on our reputation, business, results of operations, and financial condition.

Governmental actions designed to address climate change based on the emergence of new technologies and business models in connection with the transition to a lower-carbon economy could adversely affect John Deere and our customers.

Climate change considerations have led to new international, national, regional, and local legislative and regulatory responses. Various stakeholders, including legislators and regulators, shareholders, and non-governmental organizations, as well as companies in many business sectors, including us, are continuing to look for ways to reduce greenhouse gas (GHG) emissions. The regulation of GHG emissions from certain stationary or mobile sources or the imposition of carbon pricing mechanisms could result in additional costs to us in the form of taxes or emission allowances, required facilities improvements, research and development investments, and increased energy costs. These results would increase our operating costs through higher utility, transportation, and material costs and could prevent us from selling products into certain markets. Increased input costs, such as fuel and fertilizer, and compliance-related costs could also affect customer operations and demand for our equipment.

Regulators in Europe and the U.S. have also focused efforts on increasing disclosures by companies related to climate change and mitigation efforts. These disclosure rules increase compliance burdens and associated regulatory costs. On the other hand, conflicting views on environmental topics, including GHG emissions reduction goals or other commitments addressing certain climate issues, are becoming increasingly subject to scrutiny from private sectors and governmental authorities. These conflicting views may impact our business and reputation. Further, our financial services segment is subject to additional international and national regulations relating to climate and environmental risk, which are continually evolving and could affect the financing operations and climate-risk processes developed by the segment.

Legal proceedings, disputes and government inquiries and investigations could harm our business, financial condition, reputation, and brand.

We routinely are a party to claims and legal actions and the subject of government inquiries and investigations, the most prevalent of which relate to antitrust (including class action litigation), product liability (including asbestos-related liability), employment, patent, and trademark. The defense of lawsuits and government inquiries and investigations have resulted and will continue to result in expenditures of significant financial resources and the diversion of management’s time and attention away from business operations. Adverse decisions in one or more of these claims, actions, inquiries, or investigations could require us to pay substantial damages, fines, or sanctions, undertake actions to modify our business model or services, initiate recall campaigns, or take other costly actions. It is therefore possible that legal judgments or investigations could give rise to expenses that are not covered, or not fully covered, by our insurance programs and could affect our financial position and results.

We are currently subject to a consolidated multidistrict class action lawsuit in the Northern District of Illinois alleging that we have engaged in attempted monopolization, exclusionary conduct, and restraint of the market for repair services for John Deere brand agricultural equipment by limiting repair resources only to our authorized technicians or independent authorized John Deere dealers. In addition, the Federal Trade Commission (FTC) and the Attorneys General of the States of Arizona, Illinois, Michigan, Minnesota, and Wisconsin filed a lawsuit against us in the United States District Court for the Northern District of Illinois Western Division alleging similar claims. See Item 3 Legal Proceedings. The development and resolution of these matters could have a material adverse effect on our business, operations, and financial results.

24

Table of Contents

Our business could be adversely affected by the infringement or loss of intellectual property rights.

We protect our intellectual property with a combination of patents, trademarks, copyrights, trade secret laws, and legal agreements. We heavily rely on certain trademarks to protect our identity and customer recognition of our products and services, including, but not limited to, the “John Deere” mark, the leaping deer logo, the “Nothing Runs Like a Deere” slogan, and the green and yellow color combination. These trademarks, as well as the many patents that protect innovations used in our products, are integral to our business, and their loss could have a material adverse effect on us. Additionally, from time to time, third parties initiate legal proceedings to challenge the validity of our intellectual property or allege that we infringe on their intellectual property. We may incur substantial costs related to such legal proceedings. If the outcome of any such legal proceedings is unfavorable to us, our business could be adversely affected.

ITEM 1B.

UNRESOLVED STAFF COMMENTS.

None.

ITEM 1C.

CYBERSECURITY.

Cybersecurity is an integral part of our overall risk management program. We take a comprehensive approach by incorporating industry best practices to guide and evaluate our cybersecurity strategy and posture, involving key stakeholders in oversight and decision making, and assessing the program regularly within a dynamically changing environment. We leverage a multifaceted approach to cybersecurity including measures designed to prevent, detect, and respond to cyberthreats while monitoring and adapting to the evolving threat and technology landscapes.

Governance

At the management level, we maintain a dedicated global team of cybersecurity professionals (Cybersecurity Team) led and managed by the Chief Information Security Officer (CISO). The Cybersecurity Team has members with experience in governance, risk management and compliance, threat monitoring, threat emulation, penetration testing, and cyber incident management. Our CISO holds a degree in Management Information Systems and has been with the Company for over ten years. He has over two decades of extensive experience in information technology and cybersecurity and reports directly to the Chief Information Officer.

In addition, a cross-functional team of senior executives from across the enterprise known as the Digital Risk Governance Council (DRGC) provides oversight at the management level of the Company’s structures for managing digital risk, including the Cybersecurity Team. The Audit Review Committee (ARC) of the Board of Directors (Board) shares oversight responsibilities of our cybersecurity program, including oversight of related risks, with the full Board. Information on trends, strategic initiatives, and metrics is presented quarterly to the ARC by the CISO and/or members of the Cybersecurity Team. The ARC also receives periodic updates and information from subject matter experts in areas such as risk management, identity and access management, product security, and information technology.

Risk Management and Strategy

Our cybersecurity program is designed to identify, protect, detect, respond to, and recover from cybersecurity threats and incidents with the goal of protecting the confidentiality, integrity, and availability of our critical systems and information. We use a risk-based, multi-layered information security strategy to assess, identify, and manage risks from cybersecurity threats. Our Cybersecurity Team meets frequently to monitor, assess, and address cybersecurity threats and incidents. We also work with third parties to assess the maturity of our cybersecurity program, leveraging the National Institute of Standards and Technology (NIST) Cybersecurity Framework (CSF).

We also utilize third-party service providers as a normal part of our business operations. We have established processes to support the Company in identifying and managing cybersecurity risks associated with the use of third parties, which include the completion of due diligence before engaging with a third-party, controls for response to mitigate any significant risks, and assessments and reviews throughout the relationship. Monitoring such risks and threats is integrated into our overall risk management program.

Also, as part of the program, we periodically conduct cybersecurity awareness training including phishing simulations as well as e-learning for employees. We maintain cybersecurity policies, standards, and procedures, which include a cyber incident response plan. These policies and procedures are regularly evaluated and refined with strategies and protocols designed to adapt to changing regulations and emerging security risks. Regular exercises, tests, incident simulations, and system assessments are conducted to discover and address potential vulnerabilities and improve decision-making, prioritization, monitoring, and overall response effectiveness. As part of our incident response plan, the Cybersecurity Team uses an established protocol to assess the severity of cybersecurity incidents. In addition, a cross-functional Cybersecurity Incident Response Team is responsible for cybersecurity incident oversight and response, as needed, depending on incident severity. Our cyber incident response plan also includes an escalation process to relevant senior management and/or members of the Board if a cybersecurity incident meets specific rating criteria to prompt response to attempt to minimize potential disruptions and protect the integrity of our operations.

25

Table of Contents

Based on the information available as of the date of this Annual Report on Form 10-K, cybersecurity risks, including as a result of any previous cybersecurity incident, have not materially affected, and are not reasonably likely to materially affect, our business strategy, results of operations, or financial condition. However, we have seen an increase in cyberattack volume, frequency, and sophistication in the digital environment and future incidents could have a material impact on our business, operations, or financial condition.

ITEM 2.

PROPERTIES.

We own and lease properties throughout the world. Our properties are primarily used for manufacturing, marketing, parts distribution and warehousing, research and development, and administration. We consider each of our properties to be in good condition and adequate for its present use. We believe that we have sufficient capacity to meet our current and anticipated manufacturing requirements.

In the U.S. and Canada, the equipment operations own and operate 23 factory locations and lease and operate four locations for manufacturing purposes, as well as own and lease 12 facilities for distribution purposes. Outside the U.S. and Canada, the equipment operations own or lease and operate 45 factory locations for manufacturing purposes and 13 facilities for distribution purposes in various countries. Certain manufacturing facilities focus on manufacturing for one business segment and others for multiple business segments. We have parts distribution depots in our four geographic regions with the largest distribution depots located in the U.S.

The following table provides an overview of our significant manufacturing properties and the related business segment as of November 2, 2025.

Location

Facility

Business Segment

Augusta, Georgia

John Deere Augusta Works Factory

SAT

Catalão, Brazil

John Deere Brasil Ltda (Catalão) Factory

PPA

Davenport, Iowa

John Deere Davenport Works Factory

CF

Des Moines, Iowa

John Deere Des Moines Works Factory

PPA

Dubuque, Iowa

John Deere Dubuque Works Factory

CF

East Moline, Illinois

John Deere Harvester Works Factory

PPA

Joensuu, Finland

Finland Forestry Factory

CF

Fuquay, North Carolina

John Deere Turf Care Factory

SAT

Getafae, Spain

John Deere Iberica, S.A.

PPA, CF, SAT

Göppingen, Germany

Kleemann GmbH

CF

Greeneville, Tennessee

John Deere Greeneville Factory

SAT

Horicon, Wisconsin

John Deere Horicon Works Factory

SAT

Horizontina, Brazil

John Deere Brazil SA Factory

PPA

Indaiatuba, Brazil

Brazil Construction Factory

CF

Kernersville, North Carolina

John Deere Kernersville Factory

CF

Ludwigshafen am Rhein, Germany

Vögele AG

CF

Mannheim, Germany

John Deere Werke Mannheim Factory

SAT, PPA

Montenegro, Brazil

John Deere Brazil Ltda Factory

PPA

26

Table of Contents

Monterrey, Mexico

Industrias John Deere SA de CV Factory

SAT, PPA, CF

Pune, India

John Deere Pune Works Factory

SAT

Saran, France

Saran Engine Factory

SAT, PPA, CF

Tirschenreuth, Germany

Hamm AG

CF

Torréon, Mexico

Torréon Engine Factory

PPA, SAT, CF

Waterloo, Iowa

John Deere Engine Works 
John Deere Waterloo Foundry
John Deere Waterloo Works

PPA, CF

Windhagen, Germany

Wirtgen GmbH

CF

Zweibrücken, Germany

John Deere Werke Zweibrücken Factory

PPA, SAT

ITEM 3.

LEGAL PROCEEDINGS.

On January 15, 2025, the Federal Trade Commission (FTC), along with the Attorneys General of the States of Illinois and Minnesota, filed a lawsuit against us in the United States District Court for the Northern District of Illinois Western Division. The Attorneys General of the States of Arizona, Michigan, and Wisconsin then joined the lawsuit. The lawsuit alleges monopolization and unfair competition in violation of federal and state antitrust laws. Plaintiffs seek a permanent injunction and other equitable relief to allow owners of our equipment, as well as independent repair providers, access to our repair tools and any other repair resources available to authorized John Deere dealers. On March 17, 2025, we filed a motion to dismiss the lawsuit, the FTC filed a response on April 28, 2025, and we filed a reply on May 28, 2025. A hearing was held on the motion to dismiss, and the court denied the motion. We are in preliminary discussions with the FTC with respect to a potential resolution. At this stage we are unable to predict the outcome or impact of this matter on our business.

In addition to the above, we are subject to various unresolved legal actions and investigations, the most prevalent of which relate to product liability (including asbestos related liability), employment, patent, trademark, and antitrust matters (including class action litigation). Currently we believe the reasonably possible range of losses for unresolved legal actions would not have a material effect on our financial statements; however, the outcome of any current or future proceedings, claims, or investigations cannot be predicted with certainty. Adverse decisions in one or more of these proceedings, claims, or investigations could require us to pay substantial damages or fines, undertake service actions, initiate recall campaigns, or take other costly actions. It is therefore possible that legal judgments or investigations could give rise to expenses that are not covered or not fully covered by our insurance programs and could affect our financial position and results.

ITEM 4.

MINE SAFETY DISCLOSURES.

Not applicable.

PART II

ITEM 5.

MARKET FOR REGISTRANT’S COMMON EQUITY, RELATED STOCKHOLDER MATTERS AND ISSUER PURCHASES OF EQUITY SECURITIES.

Market Information

Our common stock is listed on the New York Stock Exchange (NYSE) under the symbol “DE.”

Number of Shareholders

At November 28, 2025, we had 15,503 holders of record of our common stock.

Dividends

We have a history of paying quarterly cash dividends. While we currently expect a cash dividend to be paid in the future, future dividend payments will depend on our earnings, capital requirements, financial condition, and other factors considered relevant by our Board.

27

Table of Contents

Issuer Purchases of Equity Securities

We have a share repurchase plan that was announced in December 2022 to purchase up to $18.0 billion of shares of our common stock. Shares may be repurchased through various means, including on the open market or in private transactions, under accelerated share repurchase programs, or under plans complying with rules 10b5-1 and 10b-18 under the Securities Exchange Act of 1934. The maximum number of shares that may yet be repurchased under this plan was 17.1 million based on the closing price of our common stock on the NYSE as of the end of the fourth quarter of 2025 of $461.63 per share. At the end of the fourth quarter of 2025, $7.9 billion of common stock remained to be purchased under this plan. There were no repurchases made during the three months ended November 2, 2025, pursuant to the share repurchase plan. In the fourth quarter of 2025, four thousand shares were acquired from plan participants at a weighted-average market price of $469.58 to pay payroll taxes on the vesting of a restricted stock award.

Sale of Unregistered Equity Securities

On August 5, 2025, we distributed 13,656 shares of common stock under the Deere & Company Nonemployee Director Stock Ownership Plan (“NEDSOP”). Under the terms of the NEDSOP, deferred stock units issued to nonemployee directors convert to shares of common stock on a one-for-one basis. Common stock issued under the NEDSOP are exempt from registration pursuant to Section 4(a)(2) of the Securities Act of 1933, as amended, and Rule 506 of the SEC’s Regulation D thereunder.

Stock Performance Graph

The following graph compares the yearly percentage change of Deere & Company’s cumulative total shareholder returns (TSR) for the last five years to that of the S&P 500 Index and the S&P 500 Industrials Index. The S&P 500 Industrials Index represents a focus group of companies across major industrial manufacturing categories that carry similar operational characteristics to us. The graph assumes $100 was invested on October 30, 2020, and that dividends were reinvested. The stock performance shown in the graph is not intended to forecast and does not necessarily indicate future price performance.

Comparison of 5 Year Total Cumulative Return*

Graphic

Total Shareholder Returns (TSR) Performance

2020

2021

2022

2023

2024

2025

Company / Index

Deere & Company

$

100.00

$

153.27

$

179.84

$

165.72

$

189.96

$

217.99

S&P 500

100.00

142.91

122.94

131.94

188.83

225.31

S&P 500 Industrials

100.00

139.83

128.81

133.62

190.66

221.76

28

Table of Contents

ITEM 6.

[RESERVED]

ITEM 7.

MANAGEMENT’S DISCUSSION AND ANALYSIS OF FINANCIAL CONDITION AND RESULTS OF OPERATIONS.

See the information under the caption “Management’s Discussion and Analysis.”

ITEM 7A.

QUANTITATIVE AND QUALITATIVE DISCLOSURES ABOUT MARKET RISK.

We are exposed to a variety of market risks, including interest rates and currency exchange rates. We attempt to actively manage these risks. See the information under “Management’s Discussion and Analysis,” under “Financial Instrument Market Risk Information” and in Note 26 to the Consolidated Financial Statements.

ITEM 8.

FINANCIAL STATEMENTS AND SUPPLEMENTARY DATA.

See the Consolidated Financial Statements and notes thereto and supplementary data.

ITEM 9.

CHANGES IN AND DISAGREEMENTS WITH ACCOUNTANTS ON ACCOUNTING AND FINANCIAL DISCLOSURE.

Not applicable.

ITEM 9A.

CONTROLS AND PROCEDURES.

Disclosure Controls and Procedures

Our principal executive officer and our principal financial officer have concluded that our disclosure controls and procedures (as defined in Rules 13a-15(e) and 15d-15(e) of the Securities Exchange Act of 1934, as amended (the Exchange Act)) were effective as of November 2, 2025, based on the evaluation of these controls and procedures required by Rule 13a-15(b) or 15d-15(b) of the Exchange Act.

Management’s Report on Internal Control Over Financial Reporting

Management is responsible for establishing and maintaining adequate internal control over financial reporting. Our internal control system was designed to provide reasonable assurance regarding the preparation and fair presentation of published financial statements in accordance with U.S. generally accepted accounting principles.

All internal control systems, no matter how well designed, have inherent limitations. Therefore, even those systems determined to be effective can provide only reasonable assurance with respect to financial statement preparation and presentation in accordance with generally accepted accounting principles.

Management assessed the effectiveness of our internal control over financial reporting as of November 2, 2025, using the criteria set forth in Internal Control – Integrated Framework (2013) issued by the Committee of Sponsoring Organizations of the Treadway Commission. Based on that assessment, management concluded that, as of November 2, 2025, our internal control over financial reporting was effective.

Our independent registered public accounting firm has issued an audit report on the effectiveness of our internal control over financial reporting. That report is included herein.

Changes in Internal Control Over Financial Reporting

During the fourth quarter of 2025, there were no changes that have materially affected or are reasonably likely to materially affect our internal control over financial reporting.

ITEM 9B.

OTHER INFORMATION.

Director and Executive Officer Trading Arrangements

None.

ITEM 9C.

DISCLOSURE REGARDING FOREIGN JURISDICTIONS THAT PREVENT INSPECTIONS.

Not applicable.

29

Table of Contents

PART III

ITEM 10.

DIRECTORS, EXECUTIVE OFFICERS AND CORPORATE GOVERNANCE.

The information regarding directors required by this Item 10 will be set forth in the definitive proxy statement for our 2026 annual meeting of stockholders (proxy statement) to be filed with the Commission in advance of such meeting. Information regarding executive officers is presented in Item 1 of this report under the caption "Information about our Executive Officers."

We have adopted a code of ethics that applies to our executives, including our principal executive officer, principal financial officer, and principal accounting officer. This code of ethics and our corporate governance policies are posted on our website at http://www.deere.com/governance. We intend to satisfy disclosure requirements regarding amendments to or waivers from our code of ethics by posting such information on this website. The charters of the Audit Review, Corporate Governance, Compensation, and Finance committees of our Board are available on our website as well. This information is also available in print free of charge to any person who requests it.

ITEM 11.

EXECUTIVE COMPENSATION.

The information required by this Item 11 will be set forth in the proxy statement to be filed with the Commission.

ITEM 12.

SECURITY OWNERSHIP OF CERTAIN BENEFICIAL OWNERS AND MANAGEMENT AND RELATED STOCKHOLDER MATTERS.

The information required by this Item 12 will be set forth in the proxy statement to be filed with the Commission.

ITEM 13.

CERTAIN RELATIONSHIPS AND RELATED TRANSACTIONS, AND DIRECTOR INDEPENDENCE.

The information required by this Item 13 will be set forth in the proxy statement to be filed with the Commission.

ITEM 14.

PRINCIPAL ACCOUNTANT FEES AND SERVICES.

Information required by this Item 14, including aggregate fees billed to us by our principal accountant, Deloitte & Touche LLP (PCAOB ID No. 34), will be set forth in the proxy statement to be filed with the Commission.

30

Table of Contents

PART IV

ITEM 15.

EXHIBITS AND FINANCIAL STATEMENT SCHEDULES.

Page

(1) 

Financial Statements

Statements of Consolidated Income for the years ended November 2, 2025, October 27, 2024, and October 29, 2023

47

Statements of Consolidated Comprehensive Income for the years ended November 2, 2025, October 27, 2024, and October 29, 2023

48

Consolidated Balance Sheets as of November 2, 2025 and October 27, 2024

49

Statements of Consolidated Cash Flows for the years ended November 2, 2025, October 27, 2024, and October 29, 2023

50

Statements of Changes in Consolidated Stockholders’ Equity for the years ended October 29, 2023, October 27, 2024, and November 2, 2025

51

Notes to Consolidated Financial Statements

52

(2) 

Exhibits

See the “Index to Exhibits” on pages 87 89 of this report

Certain instruments relating to long-term borrowings constituting less than 10% of registrant’s total assets are not filed as exhibits herewith pursuant to Item 601(b)4(iii)(A) of Regulation S-K. The registrant agrees to file copies of such instruments upon request of the Commission.

Financial Statement Schedules Omitted

The following schedules for the Company and consolidated subsidiaries are omitted because of the absence of the conditions under which they are required: I, II, III, IV, and V.

ITEM 16.FORM 10-K SUMMARY.

None.

31

Table of Contents

MANAGEMENT’S DISCUSSION AND ANALYSIS

Management’s Discussion and Analysis of Financial Condition and Results of Operations (MD&A) is intended to promote understanding of our financial condition and results of operations. The MD&A is provided as a supplement to, and should be read in conjunction with, the consolidated financial statements and the accompanying Notes to Consolidated Financial Statements. All amounts are presented in millions of U.S. dollars, unless otherwise specified. For comparison of 2024 to 2023 results, refer to the “Management’s Discussion and Analysis” section of our 2024 Form 10-K, which is hereby incorporated by reference.

OVERVIEW

Deere & Company is a global leader in the production of agricultural, turf, construction, and forestry equipment and solutions. John Deere Financial provides financing for John Deere equipment, parts, services, and other inputs customers need to run their operations. Our operations are managed through the Production & Precision Agriculture (PPA), Small Agriculture & Turf (SAT), Construction & Forestry (CF), and Financial Services (FS) operating segments. References to “equipment operations” include PPA, SAT, and CF, while references to “agriculture and turf” include both PPA and SAT.

Net Sales and Revenues by Segment in 2025

Graphic

TRENDS & ECONOMIC CONDITIONS

Industry Sales Outlook for Fiscal 2026

Agriculture and Turf

Graphic

Graphic Graphic

Graphic

Construction and Forestry

Graphic

Graphic

Company Trends

In 2022, we introduced our Leap Ambitions, a set of focused goals designed to guide the implementation of our Smart Industrial Operating Model. These Ambitions are built upon a foundation of product quality and manufacturing excellence, supported by a best-in-class dealer channel, and enabled by employees dedicated to solving some of the world’s most important problems. To build on our accomplishments and lay the foundation for sustained growth as we move toward 2030, in December 2025 we refined our Ambitions. Our refined Ambitions feature multi-year financial and operational goals, emphasizing the use of our differentiated equipment and service solutions, including automation, autonomy, digitalization, lifecycle solutions, and Solutions as a Service (SaaS).

Deeper integration of technology into equipment to enable customers to do more with less remains a persistent market trend. Customers seek to improve profitability, productivity, and sustainability by selecting our equipment and technology solutions. These technologies are incorporated into customer operations across the varied production systems in which we serve. While we continue to benefit from the adoption of these technologies, revenue from SaaS products did not represent a significant percentage of our revenues in 2025.

32

Table of Contents

Company Outlook for 2026

Large agriculture sales in North America are expected to remain subdued.
Small agriculture & turf and construction & forestry sales are expected to improve in 2026.

Agriculture and Turf Outlook for 2026

Demand in the U.S. and Canada for large agriculture equipment is expected to decrease further amidst challenging farm fundamentals for row crop farmers, which pressures short-term liquidity. Although the used equipment market is improving, it continues to constrain investments in new machines. These factors are partially offset by strong crop yields and consumption, recent U.S. trade agreements, growing demand for biofuels, and supportive government subsidies.
We expect small agricultural and turf equipment sales to be flat to up slightly from 2025 levels in the U.S. and Canada. The dairy and livestock segment continues to generate profits driven by solid beef prices. A modest recovery is anticipated in the turf sector following an inflection in the housing market and growth in the overall economy.
In Europe, the industry is forecasted to be flat to up slightly supported by strong dairy margins, a stabilizing interest rate environment, and improving crop yields.
Demand in South America is expected to be flat. In Brazil, while soybean and corn acreage is expected to grow, demand is projected to be tempered by high interest rates, strong global crop yields weighing on prices, and uncertainty over global trade policies. In Argentina, equipment demand is anticipated to moderate after robust growth in 2025.
Industry sales in Asia are forecasted to be down slightly.

Construction and Forestry Outlook for 2026

Industry sales in the U.S. and Canada for earthmoving and compact construction equipment are projected to remain flat to slightly higher, supported by modest growth in construction markets. Record employment levels, strong construction backlogs, and U.S. government infrastructure spending continue to provide a solid foundation for the industry. Moreover, declining interest rates, increased investment in rental fleets, and surging data center construction starts are adding further momentum. These positive drivers are expected to be partially tempered by restrained investments in the private commercial sector.
Global forestry markets are expected to be flat.
Global roadbuilding markets are forecasted to remain flat at strong levels.

Financial Services Outlook for 2026

Net Income

Down

(-) Average portfolio

Unfavorable

(-) Prior period special items

Unfavorable

+ Financing spreads

Favorable

Additional Trends

Agricultural Market Business Cycle The agricultural market is affected by various factors including commodity prices, acreage planted, crop yields, government policies, and uncertainty in macroeconomic trends. These factors affect farmers’ income and sentiment which may result in varying demand for our equipment. In 2025, we experienced the following effects due to unfavorable market conditions: lower sales volumes, greater reliance on sales incentives, and elevated receivable write-offs.

Global Trade Policies During 2025, new tariffs were imposed in the U.S. for imports from a broad range of countries and on certain materials. Several countries also implemented or proposed retaliatory tariffs on imports from the U.S. and introduced additional trade barriers. Trade policies impact us in various ways. We are a net exporter of agriculture and turf equipment from the U.S. Nearly 80% of our domestic sales are assembled in the U.S., with the remaining products imported primarily from Europe, Mexico, India, and Japan. During 2025, incremental import tariffs adversely affected the cost of our products and components and may continue to do so in 2026. In addition, retaliatory tariffs by regions outside the U.S., currently in effect or adopted in the future, may impact the prices and profitability of our exported products. In 2025, the direct impact of incremental tariffs incurred by us was approximately $600, excluding the impact of tariffs on our suppliers and market demand. Trade policies are evolving, causing uncertainty in the agriculture and construction industries. We are actively taking steps to mitigate potential impacts on our business, to the extent possible.

On November 5, 2025, the United States Supreme Court heard oral arguments on tariffs imposed under the International Emergency Economic Powers Act (IEEPA). The court may provide tariff relief and the potential recovery of amounts previously paid. We are monitoring developments in this case and its impact on our future financial statements and business.

Changes in the agricultural market business cycle and global trade policies are driven by factors outside of our control, and as a result we cannot reasonably foresee when these conditions will fully subside.

Legal Proceeding On January 15, 2025, the Federal Trade Commission (FTC), along with the Attorneys General of the States of Illinois and Minnesota filed a lawsuit against us in the United States District Court for the Northern District of Illinois Western Division. The Attorneys General of the States of Arizona, Michigan, and Wisconsin joined the lawsuit. The lawsuit alleges monopolization and unfair competition in violation of the federal and state antitrust laws. Plaintiffs seek a permanent injunction and other equitable relief to allow owners of our equipment, as

33

Table of Contents

well as independent repair providers, access to our repair tools and any other repair resources available to authorized John Deere dealers. We are in preliminary discussions with the FTC with respect to a potential resolution. At this stage, we are unable to estimate the potential impact on our business.

Other Items of Concern and Uncertainties Other items that could impact our results are:

global and regional political conditions, including the ongoing war between Russia and Ukraine and the conflicts in the Middle East
shifts in energy, including positions with respect to biofuels, economic, and positions on government subsidies of farming
capital market disruptions
foreign currency and capital control policies
right to repair regulations and legislation
weather conditions
marketplace pace of adoption and monetization of technologies we have invested in
our ability to strengthen our digital capabilities, artificial intelligence, automation, and autonomy
changes in demand and pricing for new and used equipment
delays or disruptions in our supply chain
significant fluctuations in foreign currency exchange rates
volatility in the prices of many commodities
slower economic growth

CONSOLIDATED RESULTS

2025 compared to 2024

Highlights

Net income declined in 2025 compared to 2024, driven by declining market conditions.
We continue to focus on structural profitability and strategically investing in solutions that deliver value to our customers.

Net Sales and Revenues

Graphic

Net Sales (Equipment Operations)

Graphic

Net sales decreased in 2025 primarily due to lower sales volumes driven by declining market conditions (see Business Segment Results).

Net Income (Attributable to Deere & Company)

Graphic

Diluted Earnings Per Share (EPS) ($ per share)

Graphic

Net income and diluted EPS decreased driven by lower sales.

Other Significant Statement of Consolidated Income Changes

An explanation of the cost of sales to net sales ratio and other significant statements of consolidated income changes follows:

Deere & Company

2025

2024

% Change

Cost of sales to net sales

72.4%

68.8%

+5

(-) Tariffs

Unfavorable

(-) Lower volumes

Unfavorable

+ Material costs

Favorable

Increased due to higher tariffs and higher overhead costs from production inefficiencies associated with lower volumes, partially offset by reduced material costs and lower employee profit-sharing incentives.

Other income

1,019

1,198

-15

Lower due to a decrease in revenues from certain licenses, reduced investment income, and prior year legal settlements (see Note 4). These items were partially offset by increased extended warranty premiums earned.

Selling, administrative and general expenses

4,663

4,840

-4

Decreased due to lower employee profit-sharing incentives, the favorable impact from Banco John Deere S.A. (BJD) deconsolidation (see Note 4), and prior year employee separation programs' expenses (see Note 4). These items were partially offset by an increase in accrued losses on unresolved legal matters (see Note 4).

Interest expense

3,170

3,348

-5

Decreased due to lower average borrowing rates and lower average borrowings.

Other operating expenses

1,124

1,257

-11

Lower due to higher pension benefits (see Note 9) and foreign exchange gains, partially offset by increased depreciation of equipment on operating leases.

Provision for income taxes

1,259

2,094

-40

Decreased as a result of lower pretax income and the favorable impact of tax special items (see Note 4).

BUSINESS SEGMENT RESULTS

2025 compared to 2024

The equipment operations segment results were impacted by incremental tariffs in 2025. The cost of additional tariffs was included in the “Production Costs” and “Other” categories. Each equipment operations segment experienced lower shipment volumes during 2025. Economic uncertainty, low commodity prices, elevated interest rates in the first half of the year, and higher used inventory levels contributed to lower shipment volumes for large and small agriculture. Decreases in rental purchases, lower levels of multi-family and commercial real estate construction, trade uncertainty, and elevated interest rates in the first half of the year

34

Table of Contents

contributed to lower shipment volumes for construction equipment. Current period results were impacted by special items (see Note 4).

Production & Precision Agriculture Operations

2025

2024

% Change

Net sales

$

17,311

$

20,834

-17

Sales volume and other

-17

Price realization

+1

Currency translation

-1

Operating profit

2,671

4,514

-41

Operating margin

15.4%

21.7%

Sales volumes decreased 30% in the U.S. and Canada, partially offset by an increase of 22% in Brazil. Price realization was up 1% in the U.S. and Canada. In Brazil, price realization was up 4% as demand was strong due to higher grower production. Price realization in the rest of the world was down slightly due to moderating market conditions.

Operating profit decreased primarily due to lower sales volumes/ sales mix, partially offset by price realization.

Production & Precision Agriculture Operating Profit

2025 compared to 2024

Graphic

Small Agriculture & Turf Operations

2025

2024

% Change

Net sales

$

10,224

$

10,969

-7

Sales volume and other

-8

Price realization

+1

Currency translation

Operating profit

1,207

1,627

-26

Operating margin

11.8%

14.8%

Sales volumes decreased 17% in the U.S. and Canada, partially offset by an increase of 26% in India and 5% in Europe. Price realization was 1% in the U.S. and Canada and roughly flat outside the U.S. and Canada driven by moderating market conditions.

Operating profit decreased primarily due to lower sales volumes/ sales mix and higher tariffs, partially offset by price realization.

Small Agriculture & Turf Operating Profit

2025 compared to 2024

Graphic

Construction & Forestry Operations

2025

2024

% Change

Net sales

$

11,382

$

12,956

-12

Sales volume and other

-10

Price realization

-2

Currency translation

Operating profit

1,028

2,009

-49

Operating margin

9.0%

15.5%

Sales volumes decreased 15% in the U.S. and Canada and were roughly flat outside the U.S. and Canada. Price realization decreased 3% in the U.S. and Canada due to incremental incentive programs deployed to address pressures from the competitive environment and was flat outside the U.S. and Canada.

Operating profit decreased primarily due to lower sales volumes/ sales mix, unfavorable price realization, and higher tariffs.

Construction & Forestry Operating Profit

2025 compared to 2024

Graphic

35

Table of Contents

Financial Services Operations

2025

2024

% Change

Revenue (including intercompany)

$

6,289

$

6,493

-3

Average balance of receivables and leases excluding BJD

-1

Interest expense

2,923

3,182

-8

Average borrowings

-3

Average borrowing rates

-5

Net income

890

696

+28

The average balance of receivables and leases financed was 5% lower compared to the prior year, primarily due to the deconsolidation of BJD (see Note 4). Revenue also decreased due to a lower average portfolio. Net income increased as a result of special items (see Note 4), lower selling, administrative and general expenses, favorable financing spreads, and a lower provision for credit losses.

Financial Services Net Income

2025 compared to 2024

Graphic

Special Items

The impact of special items on the segments’ operating profit in 2025 and 2024 is presented below (see Note 4).

PPA

SAT

CF

FS

Total

2025 Expense (benefit)

Litigation accrual

$

47

$

24

$

24

$

95

Impairment

28

17

16

61

BJD measurement

$

(32)

(32)

Total expense (benefit)

75

41

40

(32)

124

2024 Expense (benefit)

Legal settlements

(17)

(40)

(57)

Impairment

28

28

Employee-separation programs

77

43

22

10

152

BJD measurement

59

59

Total expense (benefit)

60

71

(18)

69

182

Year over year change

$

15

$

(30)

$

58

$

(101)

$

(58)

BUSINESS SEGMENT RESULTS

2024 compared to 2023

Please refer to the “Management’s Discussion and Analysis” section of our 2024 Form 10-K.

CAPITAL RESOURCES AND LIQUIDITY

2025 compared to 2024

We have access to global markets at a reasonable cost. Sources of liquidity include:

cash, cash equivalents, and marketable securities on hand
funds from operations
the issuance of commercial paper and term debt
the securitization of retail notes
bank lines of credit

We closely monitor our cash requirements. Based on the available sources of liquidity, we expect to meet our funding needs in the short term (next 12 months) and long term (beyond 12 months). We are forecasting lower operating cash flows from equipment operations in 2026 compared with 2025, driven by a decrease in net income adjusted for non-cash provisions, partially offset by higher cash flows generated from inventory reductions.

We operate in multiple industries, which have unique funding requirements. The equipment operations are capital intensive. Historically, these operations have been subject to seasonal variations in financing requirements for inventories and receivables from dealers. The financial services operations rely on their ability to raise substantial amounts of funds to finance their receivable and lease portfolios.

Key Metrics and Balance Sheet Changes

Cash, Cash Equivalents, and Marketable Securities

Graphic

Cash, cash equivalents, and marketable securities increased to maintain liquidity and improve leverage.
See the detailed cash flow discussion in the next section.

Trade Accounts and Notes Receivable Net

Graphic

Receivables are generated from the sales of goods and services to customers.
Limited change driven by flat sales in the second half of the year compared to prior period.
3% of receivables were outstanding for periods exceeding 12 months, reflecting a decrease from the prior year.

Financing Receivables and Equipment on Operating Leases

Graphic

The decrease is primarily due to lower retail sales.
Acquisition volumes were down 13% compared to the prior period.

36

Table of Contents

Inventories

Graphic

Inventories increased primarily due to higher CF inventory driven by reduced demand.

Property and Equipment

Graphic

Cash expenditures were $1.3 billion in 2025.
Capital expenditures are forecasted to be $1.4 billion in 2026.

Accounts Payable and Accrued Expenses

Graphic

Accounts payable increased due to higher trade payables.
Accrued expenses decreased primarily due to lower accrued taxes, employee benefits, and derivative liabilities.

Borrowings

Graphic

Borrowings decreased corresponding with the level of financing receivable and lease portfolios.

Unused Credit Lines

Graphic

The increase in unused credit lines was due to an increase in bank lines of credit.

Financial Services Ratio of Interest-Bearing Debt to Stockholder’s Equity

Graphic

CASH FLOWS

2025, 2024, and 2023

2025

2024

2023

Net cash provided by operating activities

$

7,459

$

9,231

$

8,589

Net cash used for investing activities

(2,057)

(6,464)

(8,749)

Net cash provided by (used for) financing activities

(4,579)

(2,717)

2,808

Effect of exchange rate changes on cash, cash equivalents, and restricted cash

77

(37)

31

Net increase in cash, cash equivalents, and restricted cash

$

900

$

13

$

2,679

Cash inflows from operating activities were $7.5 billion in 2025, driven by net income adjusted for non-cash provisions and a decrease in receivables related to sales, partially offset by an other postretirement benefit (OPEB) contribution.

Cash outflows from investing activities were $2.1 billion in 2025. The primary drivers were purchases of property and equipment and investments in equipment on operating leases, partially offset by collections of receivables from unconsolidated affiliates.

Cash outflows from financing activities were $4.6 billion in 2025, due to dividends paid, lower borrowings, and repurchases of common stock.

Cash Returned to Shareholders

Graphic

Cash returned to shareholders decreased $2.8 billion in 2025 as we managed cash flows through the declining business cycle in accordance with our use-of-cash priorities by decreasing share repurchases.

DEBT RATINGS

To access public debt capital markets, we rely on credit rating agencies to assign short-term and long-term credit ratings to our debt securities as an indicator of credit quality for fixed income investors. A security rating is not a recommendation by the rating agency to buy, sell, or hold our securities. A credit rating agency may change or withdraw ratings based on its assessment of our current and future ability to meet interest and principal repayment obligations. Each agency’s rating should be evaluated independently of any other rating. Lower credit ratings generally result in higher borrowing costs, including costs of derivative transactions, reduced access to debt capital markets, and may adversely impact our liquidity.

37

Table of Contents

The senior long-term and short-term debt ratings and outlook currently assigned to unsecured company securities by the rating agencies engaged by us are as follows:

  ​ ​

Senior

  ​ ​

  ​ ​ ​


Long-Term

Short-Term

Outlook

Fitch Ratings

A+

F1

Stable

Moody’s Investors Service, Inc.


A1


Prime-1


Stable

Standard & Poor’s


A


A-1


Stable

CONTRACTUAL OBLIGATIONS AND CASH REQUIREMENTS

2026 and Beyond

Our material cash requirements include the following:

Borrowings – As of November 2, 2025, we had $17.2 billion of payments due on borrowings and securitization borrowings in the next year, along with interest payments of $2.3 billion. The securitization borrowing payments are based on the expected liquidation of the retail notes. See Notes 12 and 19 for additional borrowing details. These payments will likely be replaced with new borrowings to finance the receivable and lease portfolio, which is expected to be lower in 2026.

Purchase Obligations – As of November 2, 2025, our outstanding purchase obligations were $6.1 billion, with $4.5 billion payable within one year. These purchase obligations are noncancelable.

Other Cash Requirements In addition to our contractual obligations, we have the following commitments:

capital expenditures of $1.4 billion are planned for 2026
expected quarterly cash dividends throughout 2026 (subject to change at the discretion of our Board of Directors)
total pension and OPEB contributions in 2026 are expected to be approximately $250

Share repurchases will be considered as a means of deploying excess cash to shareholders once the previously mentioned requirements are met.

CRITICAL ACCOUNTING ESTIMATES

The timely preparation of financial statements requires management to make estimates and assumptions. Those estimates affect reported amounts in these financial statements. Changes in those estimates and assumptions could have a significant effect. The following estimates are the most critical to our financial statements:

sales incentives
product warranties
postretirement benefit obligations
allowance for credit losses
operating lease residual values
income taxes

These items require the most difficult, subjective, or complex judgments. Our accounting policies are described primarily in Note 2 of our consolidated financial statements.

Sales Incentives

We provide sales incentives to dealers. These incentives are offered in two forms:

volume bonuses – awarded based on a dealer’s sales volume and performance
retail sales incentive programs – discounts or financing programs that are due when the dealer sells the equipment to a retail customer

The estimated cost of these programs is based on:

historical data
announced and expected incentive programs
field inventory levels
forecasted sales volumes

At the time a sale is recognized, we record an estimate of the sales incentive costs. The final cost is determined at the end of the volume bonus measurement period or at the time of the retail sale.

There are numerous programs available at any time, and new programs may be announced after we record the equipment sale to the dealer. Changes in the mix and types of sales incentive programs affect these estimates, which are reviewed quarterly. Actual cost differences from the original cost estimate are recognized in “Net sales.”

Sales Incentive Accruals

Graphic

The accruals recorded against receivables relate to programs where we have the contractual right and the intent to offset against existing receivables. The decrease in 2025 resulted from lower sales.

A key assumption of the retail sales incentive accrual is the predictive value of the historical percentage of retail sales incentive costs to retail sales. Over the last five fiscal years, this percent has varied by an average of 1.0%. Holding other assumptions constant, a 1.0% change would have modified the sales incentive accrual by about $106.

Product Warranties

A standard warranty is provided as an assurance that our equipment will function as intended. The standard warranty period varies by product, region, and component.

At the time a sale is recognized, we record an estimate of future warranty costs, based on the following calculation:

historical claims rate experience – multiplied by –
the estimated population

The historical claims rate is determined by a review of five-year claims costs. The estimated population is based on dealer

38

Table of Contents

inventories and retail sales. These estimates are reviewed quarterly. Adjustments are also made for current quality developments.

Product Warranty Accruals

Graphic

The decrease in 2025 is the result of lower sales volumes.

Product warranty accrual estimates are affected by the historical percent of warranty claims costs as a percentage of gross sales. Over the last five fiscal years, the percent has varied plus or minus 0.14%. Holding all other assumptions constant, if this estimated cost experience percent would have increased or decreased 0.14%, the warranty accrual at November 2, 2025, would have changed by approximately $70.

Postretirement Benefit Obligations

The pension and OPEB defined benefit plan obligations and expenses require the use of estimates. The main estimate is the present value of the projected future benefit payments. These future benefit payments extend several decades.

The estimates are based on existing retirement plan provisions. No assumption is made regarding any potential changes to benefit provisions beyond those to which we are presently committed (e.g., in existing labor contracts).

The key assumptions used by our actuaries to calculate the estimates include:

discount rates
health care cost trend rates
expected long-term return on plan assets
compensation increases
retirement rates
mortality rates
expected contributions

Assumptions are set each year-end. These assumptions are not changed during the year unless there is a significant plan event. Actual results that differ from the assumptions affect future expenses and obligations.

The key pension and OPEB amounts follow:


2025


2024


2023


Pension and OPEB net benefit

$

(153)

$

(86)

$

(13)

Long-term expected return on pension and OPEB plan assets (as a percent)


6.9

6.8

6.2

Long-term expected return on pension and OPEB plan assets

1,118

1,075


995

Actual return (loss) on pension and OPEB plan assets

1,052

1,962

(395)

Pension assets, net of pension liabilities


2,362


2,003


2,076

OPEB liabilities, net of OPEB assets


541


1,191


1,001

The increase in the 2025 pension and OPEB net benefit was due to an increase in the expected long-term rates of return on pension plan assets.

The effect of hypothetical changes to selected assumptions on our major U.S. retirement benefit plans would be as follows:

November 2, 2025

2026

Increase

Increase

Percentage

(Decrease)

(Decrease)

Assumptions


Change

  ​

PBO/APBO*

  ​

Expense


Pensions:

Discount rate**


+/-.5

$

(474)/524

$

8/20

Expected return on assets

+/-.5


(63)/63

OPEB:

Discount rate**


+/-.5


(134)/145


(5)/1

Expected return on assets


+/-.5


(14)/14

Health care cost
trend rate**


+/-1.0


255/(223)


31/(36)

*    Projected benefit obligation (PBO) for pension plans and accumulated postretirement benefit obligation (APBO) for OPEB plans.

**  Pretax impact on service cost, interest cost, and amortization of gains or losses.

Allowance for Credit Losses

The allowance for credit losses is an estimate of the credit losses expected over the life of the receivable portfolio. The allowance is measured on a collective basis for receivables with similar risk characteristics. Receivables that do not share risk characteristics are evaluated on an individual basis. Risk characteristics include:

finance product category
market
geography
credit risk
remaining balance

We utilize the following loss forecast models to estimate expected credit losses:

Linear regression models are used for large and complex retail customer receivable pools, which represent more than 90% of retail customer receivables. These statistical models utilize independent variables, or predictive features, to estimate lifetime default rates, which are subsequently adjusted for expected recoveries to arrive at lifetime credit loss estimates. Independent variables include credit quality at time of application, remaining account balance, delinquency status, and various economic factors, such as commodity prices, employment levels, and housing data. The economic factors include forward-looking conditions over our reasonable and supportable forecast period.
Weighted average remaining maturity (WARM) models are used for smaller and less complex retail customer receivable pools.
Historical loss rate models are used on wholesale receivables, with consideration of current economic conditions and dealer financial risk.

39

Table of Contents

Management reviews each model’s output quarterly, and qualitative adjustments are incorporated as necessary to arrive at management’s best estimate of expected credit losses.

Allowance for Credit Losses

Graphic

During 2025, the allowance for credit losses increased, primarily due to higher expected losses on agriculture and turf customer accounts as a result of elevated delinquencies and a decline in market conditions.

While we believe our allowance is sufficient to provide for losses over the life of our existing receivable portfolio, different assumptions would result in changes to the allowance for credit losses. Within the retail customer receivable portfolio, credit loss estimates are dependent on a number of factors, including credit quality at time of application, remaining account balances, current delinquency levels, various economic factors, and estimated recoveries on defaulted accounts. Changes in any of these factors could impact our credit losses. Conversely, within the wholesale receivable portfolio, changes in economic conditions have historically had limited impact on credit losses.

Holding all other factors constant, a 10% increase in the linear regression models’ forecasted defaults and a simultaneous 10% decrease in recovery rates would have resulted in a $60 increase to the allowance for credit losses at November 2, 2025.

Operating Lease Residual Values

Equipment on operating leases is depreciated to the estimated residual value over the lease term. The residual values are based on several factors, including:

lease term
expected hours of usage
historical wholesale sales prices
return experience
intended equipment use
market dynamics and trends
dealer residual value guarantees

We review residual value estimates during the lease term. Depreciation is adjusted over the remaining lease term if residual estimates are revised. Impairments are recorded when events or circumstances necessitate.

At the end of the majority of leases, the equipment is disposed in the following sequence:

The lessee has the option to purchase the equipment for the contractual residual value.
The dealer has the option to purchase the equipment.
The equipment is sold to a third party at the equipment’s fair value. In this situation, we may record a gain or a loss for the difference between the residual value and the sale price.

Operating Lease Residual Values

Graphic

Hypothetically, if (a) future market values for this equipment were to decrease 10% from our present estimates, and (b) all the equipment on operating leases were returned to us for remarketing at the end of the lease term, the total unfavorable impact after consideration of dealer residual value guarantees would be approximately $65. This amount would be recognized as higher depreciation expense over the remaining term of the operating leases, or potentially as an impairment.

Income Taxes

We are subject to federal, state, and foreign income taxes, which can be complex. Implementing these tax laws requires significant judgment and interpretation. Changes in tax laws could materially affect our consolidated financial statements. We record our tax positions in the following categories:

current taxes
deferred taxes
uncertain tax positions

Deferred income taxes represent temporary differences between the tax and the financial reporting basis of assets and liabilities. This will result in taxable or deductible amounts in the future. Loss carryforwards and tax credits are significant components of deferred tax asset balances. These assets are reviewed regularly for the following:

the likelihood of recoverability from future taxable income
reversal of deferred tax liabilities
tax planning strategies

Valuation allowances are established when we determine that the deferred tax benefit may not be realized. The recoverability analysis requires significant judgment and relies on estimates. The valuation allowance as of November 2, 2025, was $1.6 billion. Changes in foreign income tax laws, income for certain jurisdictions, or our tax structure could impact the valuation allowance balance.

Some tax positions contain significant uncertainties. These positions may be challenged or disallowed by taxing authorities. If it is likely the position will be disallowed, no tax benefit is recorded. If it is likely the position will be sustained, a tax benefit is recognized. The ultimate resolution could take many years. This may result in a payment that is significantly different from the original estimate.

See Note 8 for further information on income taxes.

FORWARD-LOOKING STATEMENTS

Certain statements contained herein, including in the section entitled “Overview,” “Trends and Economic Conditions,” and “Notes to Consolidated Financial Statements” relating to future events, expectations, and trends constitute “forward-looking

40

Table of Contents

statements” as defined in the Private Securities Litigation Reform Act of 1995 and involve factors that are subject to change, assumptions, risks, and uncertainties that could cause actual results to differ materially. Some of these risks and uncertainties could affect all lines of our operations generally while others could more heavily affect a particular line of business.

Forward-looking statements are based on currently available information and current assumptions, expectations, and projections about future events and should not be relied upon. Except as required by law, we expressly disclaim any obligation to update or revise our forward-looking statements. Many factors, risks, and uncertainties could cause actual results to differ materially from these forward-looking statements. Among these factors are risks related to:

the agricultural business cycle, which can be unpredictable and is affected by factors such as farm income, international trade, world grain stocks, crop yields, available farm acres, soil conditions, prices for commodities and livestock, input costs, government farm programs, availability of transport for crops, as well as adverse macroeconomic conditions, including unemployment, inflation, interest rate volatility, changes in consumer practices due to slower economic growth or a recession, and regional or global liquidity constraints
the uncertainty of government policies and actions with respect to the global trade environment including increased and proposed tariffs announced by the U.S. government and retaliatory trade regulations
political, economic, and social instability in the geographies in which we operate, including the ongoing war between Russia and Ukraine and the conflicts in the Middle East
worldwide demand for food and different forms of renewable energy impacting the price of farm commodities and consequently the demand for our equipment
rationalization, restructuring, relocation, expansion, and/or reconfiguration of manufacturing and warehouse facilities
accurately forecasting customer demand for products and services, and adequately managing inventory
uncertainty of our ability to sell products domestically or internationally, manage increased costs of production, absorb or pass on increased pricing, and accurately predict financial results and industry trends
availability and price of raw materials, components, and whole goods
delays or disruptions in our supply chain
changes in climate patterns, unfavorable weather events, and natural disasters
suppliers’ and manufacturers’ business practices and compliance with laws applicable to topics such as human rights, safety, environmental, and fair wages
higher interest rates and currency fluctuations which could adversely affect the U.S. dollar, customer confidence, access to capital, and demand for our products and solutions
ability to adapt in highly competitive markets, including understanding and meeting customers’ changing expectations
for products and solutions, including delivery and utilization of precision technology
the ability to execute business strategies, including our Smart Industrial Operating Model and refined Leap Ambitions
dealer practices and their ability to manage new and used inventory, distribute our products, and to provide support and service for precision technology solutions
the ability to realize anticipated benefits of acquisitions and joint ventures, including challenges with successfully integrating operations and internal control processes
negative claims or publicity that damage our reputation or brand
the ability to attract, develop, engage, and retain qualified employees
the impact of workforce reductions on company culture, employee retention and morale, and institutional knowledge
labor relations and contracts, including work stoppages and other disruptions
security breaches, cybersecurity attacks, technology failures, and other disruptions to our information technology infrastructure and products
leveraging artificial intelligence and machine learning within our business processes
changes to existing laws and regulations, including the implementation of new, more stringent laws, as well as compliance with a variety of U.S., foreign, and international laws, regulations, and policies relating to, but not limited to the following: advertising, anti-bribery and anti-corruption, anti-money laundering, antitrust, consumer finance, cybersecurity, data privacy, encryption, environmental (including climate change and engine emissions), farming, foreign exchange controls and cash repatriation restrictions, foreign ownership and investment, health and safety, human rights, import / export and trade, labor and employment, product liability, tariffs, tax, telematics, and telecommunications
governmental and other actions designed to address climate change in connection with a transition to a lower-carbon economy
warranty claims, post-sales repairs or recalls, product liability litigation, and regulatory investigations because of the deficient operation of our products
investigations, claims, lawsuits, or other legal proceedings, including the lawsuit filed by the Federal Trade Commission (FTC) and the Attorneys General of the States of Arizona, Illinois, Michigan, Minnesota, and Wisconsin alleging that we unlawfully withheld self-repair capabilities from farmers and independent repair providers
loss of or challenges to intellectual property rights

Further information concerning us and our businesses, including factors that could materially affect our financial results, is included in our other filings with the SEC (including, but not limited to, the factors discussed in Item 1A. “Risk Factors” of this Annual Report on Form 10-K). There also may be other factors that we cannot anticipate or that are not described herein because we do not currently perceive them to be material.

41

Table of Contents

SUPPLEMENTAL CONSOLIDATING DATA

The supplemental consolidating data presented on the subsequent pages is presented for informational purposes. Equipment operations represent the enterprise without Financial Services. Equipment operations include Production & Precision Agriculture operations, Small Agriculture & Turf operations, Construction & Forestry operations, and other corporate assets, liabilities, revenues, and expenses not reflected within Financial Services. Transactions between the equipment operations and Financial Services have been eliminated to arrive at the consolidated financial statements.

Equipment operations and Financial Services participate in different industries. Equipment operations primarily generate earnings and cash flows by manufacturing and selling equipment, service parts, and technology solutions to dealers and retail customers. Financial Services finance sales and leases by dealers of new and used equipment that is largely manufactured by equipment operations. Those earnings and cash flows generally are the difference between the finance income received from customer payments less interest expense, and depreciation on equipment subject to an operating lease. The two businesses are capitalized differently and have separate performance metrics. The supplemental consolidating data is also used by management due to these differences.

INCOME STATEMENTS

For the Years Ended November 2, 2025, October 27, 2024, and October 29, 2023

Unaudited

EQUIPMENT

FINANCIAL

OPERATIONS

SERVICES

ELIMINATIONS

CONSOLIDATED

2025

2024

2023

2025

2024

2023

2025

2024

2023

2025

2024

2023

Net Sales and Revenues


  ​ ​


  ​ ​


  ​ ​


Net sales

$

38,917

$

44,759

$

55,565

$

38,917

$

44,759

$

55,565

Finance and interest income

521

596

636

$

5,768

$

6,035

$

5,055

$

(541)

$

(872)

$

(1,008)

5,748

5,759

4,683

1

Other income

821

1,006

858

521

458

499

(323)

(266)

(354)

1,019

1,198

1,003

2, 3, 4

Total

40,259

46,361

57,059

6,289

6,493

5,554

(864)

(1,138)

(1,362)

45,684

51,716

61,251

Costs and Expenses

Cost of sales

28,190

30,803

37,739

(31)

(28)

(24)

28,159

30,775

37,715

4

Research and development expenses

2,311

2,290

2,177

2,311

2,290

2,177

Selling, administrative and general expenses

3,856

3,791

3,611

815

1,059

994

(8)

(10)

(10)

4,663

4,840

4,595

4

Interest expense

372

396

411

2,923

3,182

2,362

(125)

(230)

(320)

3,170

3,348

2,453

1

Interest compensation to Financial Services

414

640

687

(414)

(640)

(687)

1

Other operating expenses

(29)

133

217

1,439

1,354

1,396

(286)

(230)

(321)

1,124

1,257

1,292

3, 4, 5

Total

35,114

38,053

44,842

5,177

5,595

4,752

(864)

(1,138)

(1,362)

39,427

42,510

48,232

Income before Income Taxes

5,145

8,308

12,217

1,112

898

802

6,257

9,206

13,019

Provision for income taxes

1,020

1,887

2,685

239

207

186

1,259

2,094

2,871

Income after Income Taxes

4,125

6,421

9,532

873

691

616

4,998

7,112

10,148

Equity in income (loss) of unconsolidated affiliates

(17)

(29)

4

17

5

3

(24)

7

Net Income

4,108

6,392

9,536

890

696

619

4,998

7,088

10,155

Less: Net loss attributable to noncontrolling interests

(29)

(12)

(11)

(29)

(12)

(11)

Net Income Attributable to Deere & Company

$

4,137

$

6,404

$

9,547

$

890

$

696

$

619

$

5,027

$

7,100

$

10,166

1 Elimination of intercompany interest income and expense.

2 Elimination of equipment operations’ margin from inventory transferred to equipment on operating leases (see Note 6).

3 Elimination of income and expenses between equipment operations and Financial Services related to intercompany guarantees of investments in certain international markets.

4 Elimination of intercompany service revenues and fees.

5 Elimination of Financial Services’ lease depreciation expense related to inventory transferred to equipment on operating leases.

42

Table of Contents

SUPPLEMENTAL CONSOLIDATING DATA (continued)

CONDENSED BALANCE SHEETS

As of November 2, 2025 and October 27, 2024

Unaudited

EQUIPMENT

FINANCIAL

OPERATIONS

SERVICES

ELIMINATIONS

CONSOLIDATED

  ​ ​ ​

2025

  ​ ​ ​

2024

2025

  ​ ​ ​

2024

2025

  ​ ​ ​

2024

2025

  ​ ​ ​

2024

ASSETS

  ​ ​ ​ ​ ​ ​ ​ ​ ​ ​ ​ ​ ​ ​ ​ ​ ​

  ​ ​ ​ ​ ​ ​ ​ ​ ​ ​ ​ ​ ​ ​ ​ ​ ​

  ​ ​ ​ ​ ​ ​ ​ ​ ​ ​ ​ ​ ​ ​ ​ ​ ​

  ​ ​ ​ ​ ​ ​ ​ ​ ​ ​ ​ ​ ​ ​ ​ ​ ​

Cash and cash equivalents

$

6,340

$

5,615

$

1,936

$

1,709

$

8,276

$

7,324

Marketable securities


217


125


1,194


1,029


1,411


1,154

Receivables from Financial Services


4,649


3,043


$

(4,649)

$

(3,043)


6

Trade accounts and notes receivable – net


1,316


1,257


5,900


6,225


(1,899)


(2,156)


5,317


5,326

7

Financing receivables – net


88


78


44,487


44,231


44,575


44,309

Financing receivables securitized – net

1

2

6,830

8,721

6,831

8,723

Other receivables


1,809


2,193


658


427


(64)


(75)


2,403


2,545

7

Equipment on operating leases – net

7,600

7,451

7,600

7,451

Inventories


7,406


7,093


7,406


7,093

Property and equipment – net


8,047


7,546


32


34


8,079


7,580

Goodwill


4,188


3,959


4,188


3,959

Other intangible assets – net


892


999


892


999

Retirement benefits


3,181


2,839


94


83


(2)


(1)


3,273


2,921

8

Deferred income taxes


2,507


2,262


46


43


(269)


(219)


2,284


2,086

9

Other assets


2,218


2,194


1,244


715


(1)


(3)


3,461


2,906

Assets held for sale


2,944


2,944

Total Assets

$

42,859

$

39,205

$

70,021

$

73,612

$

(6,884)

$

(5,497)

$

105,996

$

107,320

LIABILITIES AND STOCKHOLDERS’ EQUITY

LIABILITIES

Short-term borrowings

$

414

$

911

$

13,382

$

12,622

$

13,796

$

13,533

Short-term securitization borrowings

1

2

6,595

8,429

6,596

8,431

Payables to Equipment Operations


4,649


3,043

$

(4,649)

$

(3,043)


6

Accounts payable and accrued expenses


12,757


13,534


3,116


3,243


(1,964)


(2,234)


13,909


14,543

7

Deferred income taxes


347


434


356


263


(269)


(219)


434


478

9

Long-term borrowings


8,756


6,603


34,788


36,626


43,544


43,229

Retirement benefits and other liabilities


1,646


2,250


66


105


(2)


(1)


1,710


2,354

8

Liabilities held for sale


1,827


1,827

Total liabilities


23,921


23,734


62,952


66,158


(6,884)


(5,497)


79,989


84,395

Commitments and contingencies (Note 20)

Redeemable noncontrolling interest (Note 2)

51

82

51

82

STOCKHOLDERS’ EQUITY

Total Deere & Company stockholders’ equity


25,950


22,836


7,069


7,454


(7,069)


(7,454)


25,950


22,836

10

Noncontrolling interests


6


7


6


7

Financial Services' equity

(7,069)

(7,454)

7,069

7,454

10

Adjusted total stockholders' equity


18,887


15,389


7,069


7,454


25,956


22,843

Total Liabilities and Stockholders’ Equity

$

42,859

$

39,205

$

70,021

$

73,612

$

(6,884)

$

(5,497)

$

105,996

$

107,320

6 Elimination of receivables / payables between equipment operations and Financial Services.

7 Primarily reclassification of sales incentive accruals on receivables sold to Financial Services.

8 Reclassification of net pension assets / liabilities.

9 Reclassification of deferred tax assets / liabilities in the same taxing jurisdictions.

10 Elimination of Financial Services’ equity.

43

Table of Contents

SUPPLEMENTAL CONSOLIDATING DATA (continued)

STATEMENTS OF CASH FLOWS

For the Years Ended November 2, 2025, October 27, 2024, and October 29, 2023

Unaudited

EQUIPMENT

FINANCIAL

OPERATIONS

SERVICES

ELIMINATIONS

CONSOLIDATED

2025

2024

2023

2025

2024

2023

2025

2024

2023

2025

2024

2023

Cash Flows from Operating Activities


  ​


  ​


  ​


Net income

$

4,108

$

6,392

$

9,536

$

890

$

696

$

619

$

4,998

$

7,088

$

10,155

Adjustments to reconcile net income to net cash provided by operating activities:

Provision (credit) for credit losses

18

14

7

278

296

(23)

296

310

(16)

Depreciation and amortization

1,280

1,220

1,123

1,082

1,040

1,016

$

(133)

$

(142)

$

(135)

2,229

2,118

2,004

11

Impairments and other adjustments

73

28

18

(32)

97

173

41

125

191

Share-based compensation expense

151

208

130

151

208

130

12

Distributed earnings of Financial Services

1,368

250

215

(1,368)

(250)

(215)

13

Provision (credit) for deferred income taxes

(369)

(97)

(959)

81

(197)

169

(288)

(294)

(790)

Changes in assets and liabilities:

Receivables related to sales

(91)

(13)

(58)

1,175

434

(4,195)

1,084

421

(4,253)

14, 16

Inventories

(138)

1,011

474

(137)

(223)

(195)

(275)

788

279

15

Accounts payable and accrued expenses

(617)

(1,429)

1,352

109

277

449

257

112

(971)

(251)

(1,040)

830

16

Accrued income taxes payable/receivable

(112)

(218)

8

(24)

95

(31)

(136)

(123)

(23)

Retirement benefits

(814)

(215)

(164)

(51)

(12)

(6)

(865)

(227)

(170)

Other

394

(38)

367

147

40

(51)

(66)

(145)

(64)

475

(143)

252

11, 12, 15

Net cash provided by operating activities

5,100

6,905

11,919

2,480

2,332

2,315

(121)

(6)

(5,645)

7,459

9,231

8,589

Cash Flows from Investing Activities

Collections of receivables (excluding receivables related to sales)

27,037

26,029

24,128

(557)

(867)

(1,077)

26,480

25,162

23,051

14

Proceeds from maturities and sales of marketable securities

46

99

59

440

733

127

486

832

186

Proceeds from sales of equipment on operating leases

1,917

1,929

1,981

1,917

1,929

1,981

Cost of receivables acquired (excluding receivables related to sales)

(26,623)

(29,152)

(29,229)

283

336

457

(26,340)

(28,816)

(28,772)

14

Acquisitions of businesses, net of cash acquired

(101)

(82)

(101)

(82)

Purchases of marketable securities

(125)

(209)

(173)

(578)

(846)

(318)

(703)

(1,055)

(491)

Purchases of property and equipment

(1,358)

(1,636)

(1,494)

(2)

(4)

(4)

(1,360)

(1,640)

(1,498)

Cost of equipment on operating leases acquired

(3,053)

(3,464)

(3,234)

185

302

264

(2,868)

(3,162)

(2,970)

15

Decrease (increase) in investment in Financial Services

(10)

4

(870)

10

(4)

870

17

Decrease (increase) in trade and wholesale receivables

1,161

21

(5,783)

(1,161)

(21)

5,783

14

Collections of receivables from unconsolidated affiliates

190

317

507

Loans to unconsolidated affiliates

(109)

(109)

Collateral on derivatives – net

(1)

(1)

183

413

(11)

182

413

(12)

Other

(90)

(125)

(176)

(61)

(8)

31

3

6

3

(148)

(127)

(142)

Net cash provided by (used for) investing activities

(1,449)

(1,867)

(2,737)

629

(4,349)

(12,312)

(1,237)

(248)

6,300

(2,057)

(6,464)

(8,749)

Cash Flows from Financing Activities

Net proceeds (payments) in short-term borrowings (original maturities three months or less)

144

28

(113)

(2,683)

(1,884)

4,121

(2,539)

(1,856)

4,008

Change in intercompany receivables/payables

(1,695)

1,459

2,090

1,695

(1,459)

(2,090)

Proceeds from borrowings issued (original maturities greater than three months)

2,369

159

342

10,792

17,937

15,087

13,161

18,096

15,429

Payments of borrowings (original maturities greater than three months)

(923)

(1,123)

(901)

(11,341)

(12,109)

(7,012)

(12,264)

(13,232)

(7,913)

Repurchases of common stock

(1,138)

(4,007)

(7,216)

(1,138)

(4,007)

(7,216)

Capital investment from (returned to) Equipment Operations

10

(4)

870

(10)

4

(870)

17

Dividends paid

(1,720)

(1,605)

(1,427)

(1,368)

(250)

(215)

1,368

250

215

(1,720)

(1,605)

(1,427)

13

Other

(53)

(46)

(7)

(26)

(67)

(66)

(79)

(113)

(73)

Net cash provided by (used for) financing activities

(3,016)

(5,135)

(7,232)

(2,921)

2,164

10,695

1,358

254

(655)

(4,579)

(2,717)

2,808

Effect of Exchange Rate Changes on Cash, Cash Equivalents, and Restricted Cash

86

(15)

24

(9)

(22)

7

77

(37)

31

Net Increase (Decrease) in Cash, Cash Equivalents, and Restricted Cash

721

(112)

1,974

179

125

705

900

13

2,679

Cash, Cash Equivalents, and Restricted Cash at Beginning of Year

5,643

5,755

3,781

1,990

1,865

1,160

7,633

7,620

4,941

Cash, Cash Equivalents, and Restricted Cash at End of Year

$

6,364

$

5,643

$

5,755

$

2,169

$

1,990

$

1,865

$

8,533

$

7,633

$

7,620

11 Elimination of depreciation on leases related to inventory transferred to equipment on operating leases (see Note 6).

12 Reclassification of share-based compensation expense.

13 Elimination of dividends from Financial Services to the equipment operations, which are included in the equipment operations operating activities.

14 Primarily reclassification of receivables related to the sale of equipment.

15 Reclassification of direct lease agreements with retail customers.

16 Reclassification of sales incentive accruals on receivables sold to Financial Services.

17 Elimination of change in investment from equipment operations to Financial Services.

44

Table of Contents

SELECTED FINANCIAL DATA


  ​ ​ ​2025    

2024

2023

2022

2021

2020

2019

2018

2017

2016


Net sales and revenues

$

45,684

$

51,716

$

61,251

$

52,577

$

44,024

$

35,540

$

39,258

$

37,358

$

29,738

$

26,644

Net sales


38,917


44,759


55,565


47,917


39,737


31,272


34,886


33,351


25,885


23,387

Finance and interest income


5,748


5,759


4,683


3,365


3,296


3,450


3,493


3,107


2,732


2,511

Research and development expenses


2,311


2,290


2,177


1,912


1,587


1,644


1,783


1,658


1,373


1,394

Selling, administrative and general expenses


4,663


4,840


4,595


3,863


3,383


3,477


3,551


3,455


3,098


2,791

Interest expense


3,170


3,348


2,453


1,062


993


1,247


1,466


1,204


899


764

Net income*


5,027


7,100


10,166


7,131


5,963


2,751


3,253


2,368


2,159


1,524

Return on net sales

12.9%

15.9%

18.3%

14.9%

15.0%

8.8%

9.3%

7.1%

8.3%

6.5%

Return on beginning Deere & Company stockholders’ equity

22.0%

32.6%

50.2%

38.7%

46.1%

24.1%

28.8%

24.8%

33.1%

22.6%

Comprehensive income*


5,701


6,508


10,099


6,629


8,963


2,819


2,081


3,222


3,221


627


Net income per share – basic*

$

18.55

$

25.73

$

34.80

$

23.42

$

19.14

$

8.77

$

10.28

$

7.34

$

6.76

$

4.83

  ​– diluted*


18.50


25.62


34.63


23.28


18.99


8.69


10.15


7.24


6.68


4.81

Dividends declared per share


6.48


5.88


5.05


4.36


3.61


3.04


3.04


2.58


2.40


2.40

Dividends paid per share


6.33


5.76


4.83


4.28


3.32


3.04


2.97


2.49


2.40


2.40

Average number of common shares outstanding (in millions) – basic

270.9


276.0


292.2


304.5


311.6


313.5


316.5


322.6


319.5


315.2

  ​– diluted


271.7


277.1


293.6


306.3


314.0


316.6


320.6


327.3


323.3


316.6


Total assets

$

105,996

$

107,320

$

104,087

$

90,030

$

84,114

$

75,091

$

73,011

$

70,108

$

65,786

$

57,918

Trade accounts and notes receivable – net


5,317


5,326


7,739


6,410


4,208


4,171


5,230


5,004


3,925


3,011

Financing receivables – net


44,575


44,309


43,673


36,634


33,799


29,750


29,195


27,054


25,104


23,702

Financing receivables securitized – net


6,831


8,723


7,335


5,936


4,659


4,703


4,383


4,022


4,159


5,127

Equipment on operating leases – net


7,600


7,451


6,917


6,623


6,988


7,298


7,567


7,165


6,594


5,902

Inventories


7,406


7,093


8,160


8,495


6,781


4,999


5,975


6,149


3,904


3,341

Property and equipment – net


8,079


7,580


6,879


6,056


5,820


5,817


5,973


5,868


5,068


5,171

Short-term borrowings

13,796

13,533


17,939


12,592


10,919


8,582


10,784


11,062


10,035


6,911

Short-term securitization borrowings

6,596

8,431

6,995

5,711

4,605

4,682

4,321

3,957

4,119

4,998

Long-term borrowings

43,544

43,229


38,477


33,596


32,888


32,734


30,229


27,237


25,891


23,703

Total Deere & Company stockholders’ equity


25,950


22,836


21,785


20,262


18,431


12,937


11,413


11,288


9,557


6,520


Book value per share*

$

95.99

$

84.03

$

77.37

$

67.82

$

59.83

$

41.25

$

36.45

$

35.45

$

29.70

$

20.71

Capital expenditures

$

1,304

$

1,624

$

1,537

$

1,176

$

867

$

762

$

1,084

$

969

$

586

$

668

Number of employees (at year-end)


73,146


75,847


82,956


82,239


75,550


69,634


73,489


74,413


60,476


56,767

*    Attributable to Deere & Company.

45

Table of Contents

FINANCIAL INSTRUMENT MARKET RISK INFORMATION

We are naturally exposed to various interest rate and foreign currency risks. As a result, we enter into derivative transactions to manage this exposure and not for speculative purposes.

From time to time, we enter into interest rate swap agreements to manage our interest rate exposure. We also have entered into derivative agreements related to the management of foreign currency transaction risks.

Interest Rate Risk

Results of Operations – Interest rates volatility impacts us in several ways, primarily affecting the demand for our products, financing spreads for the financial services operations, and the value of our investments.

Fair Value Measurement – Quarterly, we use a combination of cash flow models to assess the sensitivity of our financial instruments with interest rate exposure to changes in market interest rates. The models calculate the effect of adjusting interest rates as follows:

cash flows for financing receivables are discounted at the current prevailing rate for each receivable portfolio
cash flows for marketable securities are discounted at the applicable benchmark yield curve plus market credit spreads
cash flows for unsecured borrowings are discounted at the applicable benchmark yield curve plus market credit spreads for similarly rated borrowers
cash flows for securitized borrowings are discounted at the swap yield curve plus a market credit spread for similarly rated borrowers
cash flows for interest rate swaps are projected and discounted using forward rates from the swap yield curve at the repricing dates

The net impact on these financial instruments’ fair values, which would be caused by decreasing or increasing the interest rates by 10% from the market rates at November 2, 2025, and October 27, 2024, would have been approximately $150 and $75, respectively.

Foreign Currency Risk

We have foreign currency exposures at some of our foreign and domestic operations related to buying, selling, and financing in currencies other than the functional currencies. We hedge significant currency exposures for our equipment operations. Worldwide foreign currency exposures are reviewed quarterly. Based on the anticipated and committed foreign currency cash inflows, outflows, and hedging policy for the next twelve months, we estimate that a hypothetical 10% strengthening of the U.S. dollar relative to other currencies through 2026 would decrease the 2026 expected net cash inflows by approximately $100. At October 27, 2024, a hypothetical 10% strengthening of the U.S. dollar under similar assumptions and calculations indicated a potential $25 increase in the 2025 net cash inflows. The estimated impacts on net cash outflows and inflows by currency follow:

2026

2025

Australian dollar

$

(75)

$

(75)

Brazilian real

(50)

25

British pound

(50)

(50)

Canadian dollar

25

Euro

50

100

Indian rupee

25

Japanese yen

50

50

Mexican peso

50

25

Polish zloty

(25)

(25)

Swedish krona

(25)

All other

(50)

(50)

Total increase (decrease)

$

(100)

$

25

In addition, in 2025 we entered into a cross-currency interest rate swap designated as a net investment hedge of foreign currency exposure from investments in foreign subsidiaries.

In the financial services operations, our policy is to manage foreign currency risk through hedging strategies if the currency of the borrowing does not match the currency of the receivable portfolio. As a result, a hypothetical 10% adverse change in the value of the U.S. dollar relative to all other foreign currencies would not have a material effect on the financial services cash flows.

46

Table of Contents

DEERE & COMPANY

STATEMENTS OF CONSOLIDATED INCOME

For the Years Ended November 2, 2025, October 27, 2024, and October 29, 2023

  ​ ​ ​

2025

  ​ ​ ​ ​ ​ ​ ​ ​ ​ ​ ​

2024

  ​ ​ ​ ​ ​ ​ ​ ​ ​ ​ ​

2023


Net Sales and Revenues

Net sales

$

38,917

$

44,759

$

55,565

Finance and interest income


5,748


5,759


4,683

Other income


1,019


1,198


1,003

Total


45,684


51,716


61,251

Costs and Expenses

Cost of sales


28,159


30,775


37,715

Research and development expenses


2,311


2,290


2,177

Selling, administrative and general expenses


4,663


4,840


4,595

Interest expense


3,170


3,348


2,453

Other operating expenses


1,124


1,257


1,292

Total


39,427


42,510


48,232

Income of Consolidated Group before Income Taxes


6,257


9,206


13,019

Provision for income taxes


1,259


2,094


2,871

Income of Consolidated Group


4,998


7,112


10,148

Equity in income (loss) of unconsolidated affiliates


(24)


7

Net Income


4,998


7,088


10,155

Less: Net loss attributable to noncontrolling interests


(29)


(12)


(11)

Net Income Attributable to Deere & Company

$

5,027

$

7,100

$

10,166

Per Share Data

Basic

$

18.55

$

25.73

$

34.80

Diluted

18.50

25.62

34.63

Dividends declared

6.48

5.88

5.05

Dividends paid

6.33

5.76

4.83

Average Shares Outstanding (in millions of shares)

Basic


270.9


276.0


292.2

Diluted


271.7


277.1


293.6

The notes to consolidated financial statements are an integral part of this statement.

47

Table of Contents

DEERE & COMPANY

STATEMENTS OF CONSOLIDATED COMPREHENSIVE INCOME

For the Years Ended November 2, 2025, October 27, 2024, and October 29, 2023

  ​ ​ ​

2025

  ​ ​ ​ ​ ​ ​ ​ ​ ​ ​ ​

2024

  ​ ​ ​ ​ ​ ​ ​ ​ ​ ​ ​

2023


Net Income

$

4,998

$

7,088

$

10,155

Other Comprehensive Income (Loss), Net of Income Taxes

Retirement benefits adjustment


92


(429)


(456)

Cumulative translation adjustment


538


(134)


443

Unrealized gain (loss) on derivatives


18


(64)


(29)

Unrealized gain (loss) on debt securities


31


36


(16)

Other Comprehensive Income (Loss), Net of Income Taxes


679


(591)


(58)

Comprehensive Income


5,677


6,497


10,097

Less: Comprehensive loss attributable to noncontrolling interests


(24)


(11)


(2)

Comprehensive Income Attributable to Deere & Company

$

5,701

$

6,508

$

10,099

The notes to consolidated financial statements are an integral part of this statement.

48

Table of Contents

DEERE & COMPANY

CONSOLIDATED BALANCE SHEETS

As of November 2, 2025 and October 27, 2024

  ​ ​ ​

2025

  ​ ​ ​ ​ ​ ​ ​ ​ ​ ​ ​ ​ ​ ​ ​ ​ ​ ​ ​ ​ ​ ​ ​

2024


ASSETS

Cash and cash equivalents

$

8,276

$

7,324

Marketable securities


1,411


1,154

Trade accounts and notes receivable – net


5,317


5,326

Financing receivables – net


44,575


44,309

Financing receivables securitized – net


6,831


8,723

Other receivables


2,403


2,545

Equipment on operating leases – net


7,600


7,451

Inventories


7,406


7,093

Property and equipment – net


8,079


7,580

Goodwill


4,188


3,959

Other intangible assets – net


892


999

Retirement benefits


3,273


2,921

Deferred income taxes


2,284


2,086

Other assets


3,461


2,906

Assets held for sale


2,944

Total Assets

$

105,996

$

107,320

LIABILITIES AND STOCKHOLDERS’ EQUITY

LIABILITIES

Short-term borrowings

$

13,796

$

13,533

Short-term securitization borrowings


6,596


8,431

Accounts payable and accrued expenses


13,909


14,543

Deferred income taxes


434


478

Long-term borrowings


43,544


43,229

Retirement benefits and other liabilities


1,710


2,354

Liabilities held for sale


1,827

Total liabilities


79,989


84,395

Commitments and contingencies (Note 20)

Redeemable noncontrolling interest (Note 2)

51

82

STOCKHOLDERS’ EQUITY

Common stock, $1 par value (authorized – 1,200,000,000 shares;

issued – 536,431,204 shares in 2025 and 2024), at paid-in amount


5,668


5,489

Common stock in treasury, 266,079,164 shares in 2025 and 264,678,912 shares in 2024, at cost


(36,362)


(35,349)

Retained earnings


59,676


56,402

Accumulated other comprehensive income (loss)


(3,032)


(3,706)

Total Deere & Company stockholders’ equity


25,950


22,836

Noncontrolling interests


6


7

Total stockholders’ equity


25,956


22,843

Total Liabilities and Stockholders’ Equity

$

105,996

$

107,320

The notes to consolidated financial statements are an integral part of this statement.

49

Table of Contents

DEERE & COMPANY

STATEMENTS OF CONSOLIDATED CASH FLOWS

For the Years Ended November 2, 2025, October 27, 2024, and October 29, 2023

  ​ ​ ​

2025

  ​ ​ ​

2024

  ​ ​ ​

2023


Cash Flows from Operating Activities

Net income

$

4,998

$

7,088

$

10,155

Adjustments to reconcile net income to net cash provided by operating activities:

Provision (credit) for credit losses


296


310


(16)

Depreciation and amortization


2,229


2,118


2,004

Impairments and other adjustments


41


125


191

Share-based compensation expense


151


208


130

Credit for deferred income taxes


(288)


(294)


(790)

Changes in assets and liabilities:

Receivables related to sales


1,084


421


(4,253)

Inventories


(275)


788


279

Accounts payable and accrued expenses


(251)


(1,040)


830

Accrued income taxes payable/receivable


(136)


(123)


(23)

Retirement benefits


(865)


(227)


(170)

Other


475


(143)


252

Net cash provided by operating activities


7,459


9,231


8,589

Cash Flows from Investing Activities

Collections of receivables (excluding receivables related to sales)


26,480


25,162


23,051

Proceeds from maturities and sales of marketable securities


486


832


186

Proceeds from sales of equipment on operating leases


1,917


1,929


1,981

Cost of receivables acquired (excluding receivables related to sales)


(26,340)


(28,816)


(28,772)

Acquisitions of businesses, net of cash acquired

(101)


(82)

Purchases of marketable securities


(703)


(1,055)


(491)

Purchases of property and equipment


(1,360)


(1,640)


(1,498)

Cost of equipment on operating leases acquired


(2,868)


(3,162)


(2,970)

Collections of receivables from unconsolidated affiliates

507

Loans to unconsolidated affiliates

(109)

Collateral on derivatives – net

182

413

(12)

Other


(148)


(127)


(142)

Net cash used for investing activities


(2,057)


(6,464)


(8,749)

Cash Flows from Financing Activities

Net proceeds (payments) in short-term borrowings (original maturities three months or less)


(2,539)


(1,856)


4,008

Proceeds from borrowings issued (original maturities greater than three months)


13,161


18,096


15,429

Payments of borrowings (original maturities greater than three months)


(12,264)


(13,232)


(7,913)

Repurchases of common stock


(1,138)


(4,007)


(7,216)

Dividends paid


(1,720)


(1,605)


(1,427)

Other


(79)


(113)


(73)

Net cash provided by (used for) financing activities


(4,579)


(2,717)


2,808

Effect of Exchange Rate Changes on Cash, Cash Equivalents, and Restricted Cash


77


(37)


31

Net Increase in Cash, Cash Equivalents, and Restricted Cash


900


13


2,679

Cash, Cash Equivalents, and Restricted Cash at Beginning of Year


7,633


7,620


4,941

Cash, Cash Equivalents, and Restricted Cash at End of Year

$

8,533

$

7,633

$

7,620

Components of Cash, Cash Equivalents, and Restricted Cash

Cash and cash equivalents

$

8,276

$

7,324

$

7,458

Cash, cash equivalents, and restricted cash (Assets held for sale – Note 4)

116

Restricted cash (Other assets)

257

193

162

Total Cash, Cash Equivalents, and Restricted Cash

$

8,533

$

7,633

$

7,620

The notes to consolidated financial statements are an integral part of this statement.

50

Table of Contents

DEERE & COMPANY

STATEMENTS OF CHANGES IN CONSOLIDATED STOCKHOLDERS EQUITY

For the Years Ended October 29, 2023, October 27, 2024, and November 2, 2025

Total Stockholders’ Equity

Deere & Company Stockholders

  ​ ​

  ​

  ​

  ​

  ​

Accumulated

  ​

  ​

  ​

Total

Other

Redeemable


Stockholders’

Common

Treasury

Retained

Comprehensive

Noncontrolling

Noncontrolling

Equity

Stock

Stock

Earnings

Income (Loss)

Interests

Interest

Balance October 30, 2022

$

20,265

$

5,165

$

(24,094)

$

42,247

$

(3,056)

$

3

$

92

Net income (loss)


10,168

10,166

2

(13)

Other comprehensive income (loss)


(58)

(58)


9

Repurchases of common stock


(7,274)

(7,274)

Treasury shares reissued


33

33

Dividends declared


(1,477)

(1,472)

(5)


Share based awards and other


132

138

(10)

4

9

Balance October 29, 2023


21,789


5,303


(31,335)


50,931


(3,114)


4


97

Net income (loss)


7,102

7,100

2

(14)

Other comprehensive income (loss)


(592)

(592)


1

Repurchases of common stock


(4,044)

(4,044)

Treasury shares reissued


30

30

Dividends declared


(1,624)

(1,622)

(2)


Noncontrolling interest redemption (Note 4)

(10)

Share based awards and other


182

186

(7)

3

8

Balance October 27, 2024


22,843


5,489


(35,349)


56,402


(3,706)


7


82

Net income (loss)


5,029

5,027

2

(31)

Other comprehensive income


674

674


5

Repurchases of common stock


(1,049)

(1,049)

Treasury shares reissued


36

36

Dividends declared


(1,758)

(1,758)


Share based awards and other


181

179

5

(3)

(5)

Balance November 2, 2025

$

25,956

$

5,668

$

(36,362)

$

59,676

$

(3,032)

$

6

$

51

The notes to consolidated financial statements are an integral part of this statement.

51

Table of Contents

NOTES TO CONSOLIDATED FINANCIAL STATEMENTS

Note Listing

Page

1.

Organization and Consolidation

52

2.

Summary of Significant Accounting Policies and New Accounting Pronouncements

53

3.

Acquisitions and Dispositions

56

4.

Special Items

57

5.

Revenue Recognition

59

6.

Supplemental Cash Flow Information

60

7.

Pension and Other Postretirement Benefits

60

8.

Income Taxes

64

9.

Other Income and Other Operating Expenses

65

10.

Marketable Securities

65

11.

Receivables

66

12.

Securitization of Financing Receivables

70

13.

Inventories

71

14.

Property and Depreciation

71

15.

Goodwill and Other Intangible Assets Net

71

16.

Other Assets

71

17.

Short-Term Borrowings

72

18.

Accounts Payable and Accrued Expenses

72

19.

Long-Term Borrowings

72

20.

Commitments and Contingencies

73

21.

Capital Stock and Net Income per Share

73

22.

Share-Based Compensation

74

23.

Other Comprehensive Income Items

75

24.

Leases

76

25.

Fair Value Measurements

78

26.

Derivative Instruments

79

27.

Segment Data

81

28.

Subsequent Event

82

1. ORGANIZATION AND CONSOLIDATION

References to “Deere & Company,” “John Deere,” “Deere,” “we,” “us,” or “our” include our consolidated subsidiaries, unless otherwise stated. We manage our business through the following operating segments: Production & Precision Agriculture (PPA), Small Agriculture & Turf (SAT), Construction & Forestry (CF), and Financial Services (John Deere Financial or FS). References to “equipment operations” include PPA, SAT, and CF, while references to “agriculture and turf” include both PPA and SAT.

Principles of Consolidation

The consolidated financial statements represent the consolidation of all companies in which Deere & Company has a controlling interest. Certain variable interest entities (VIEs) are consolidated since we are the primary beneficiary. The primary beneficiary has both the power to direct the activities that most significantly impact the VIEs’ economic performance and the obligation to absorb losses or the right to receive benefits that could potentially be significant to the VIEs. When we have significant influence in an unconsolidated affiliated company (generally 20% to 50% ownership), we record our investment at cost, adjusted for our share of profit or loss after acquisition, and further reduced for any dividends (equity method of accounting). Other investments (generally less than 20% ownership) are recorded at cost.

Fiscal Year

We use a 52/53 week fiscal year ending on the last Sunday in the reporting period, which generally occurs near the end of October. An additional week is included in the fourth fiscal quarter every five or six years to realign our fiscal quarters with the calendar. Fiscal year 2025 contained 53 weeks compared to 52 weeks in fiscal years 2024 and 2023. The fiscal year ends for 2025, 2024, and 2023 were November 2, 2025, October 27, 2024, and October 29, 2023, respectively. Unless otherwise stated, references to particular years, quarters, or months refer to our fiscal years and the associated periods in those fiscal years.

Presentation of Amounts

All amounts are presented in millions of U.S. dollars, unless otherwise specified. Certain prior period amounts have been reclassified to conform to current period presentation.

Variable Interest Entities

We consolidate certain VIEs related to retail note securitizations (see Note 12).

We have a 50% ownership interest in Banco John Deere S.A. (BJD), an equity method investment that finances retail and wholesale loans for agricultural, construction, and forestry equipment in Brazil. This investment was established in February 2025 through the sale of 50% ownership of a former subsidiary (see Note 3). BJD is a VIE as we provide funding and are exposed to losses that are disproportionate to our voting rights. However, we are not the primary beneficiary of the VIE because the power over significant activities, including the strategic plan, budget, credit policies, and funding guidelines, is shared among equity holders through an equally represented board of directors.

Financial results of BJD are reported in “Equity in income (loss) of unconsolidated affiliates.” The related investment in unconsolidated affiliates is included in “Other assets” on the consolidated balance sheets, while short-term and long-term funding is recorded in receivables from unconsolidated affiliates and included in “Other receivables.”

Our carrying value of receivables from and investments in BJD and maximum exposure to loss at November 2, 2025, follow:

2025

Receivables from unconsolidated affiliates – “Other receivables”

$

394

Investments in unconsolidated affiliates – “Other assets”

405

Carrying value of assets related to VIE

799

Guarantees

157

Maximum exposure to loss

$

956

Guarantees primarily include BJD debt related to government funding that existed prior to the deconsolidation of BJD. We did not record a contractual liability related to these guarantees on our consolidated balance sheets.

52

Table of Contents

Argentina

We have equipment operations and financial services operations in Argentina. The U.S. dollar has historically been the functional currency for our Argentina operations, as our business is indexed to the U.S. dollar due to the highly inflationary conditions. Argentine peso-denominated monetary assets and liabilities are remeasured at each balance sheet date using the official currency exchange rate. The Argentine government has currency controls that restrict our ability to pay certain outstanding intercompany payables. As of November 2, 2025, and October 27, 2024, our net investment in Argentina was $833 and $826, respectively. Net sales and revenues from our Argentine operations represented approximately 2% of consolidated net sales and revenues for 2025 and 1% for 2024 and 2023. As of November 2, 2025, and October 27, 2024, the gross peso exposure was $110 and $69, respectively, while the net peso exposure (after considering the impact of short-term hedges) was $40 and $14, respectively. In 2025 and 2024, we invested in U.S. dollar denominated bonds issued by the central bank of Argentina. The bonds are recorded in “Marketable securities” and classified as “International debt securities.” These bonds can be held until maturity or sold in secondary markets outside of Argentina to settle intercompany debt.

2. SUMMARY OF SIGNIFICANT ACCOUNTING POLICIES AND NEW ACCOUNTING PRONOUNCEMENTS

The following are significant accounting policies in addition to those included in other notes to the consolidated financial statements.

Use of Estimates in Financial Statements

Certain accounting policies require management to make estimates and assumptions in determining the amounts reflected in the financial statements and related disclosures. Actual results could differ from those estimates.

Revenue Recognition

General

Sales of equipment and service parts are recognized when we transfer control of the good to the independent customer, which generally occurs upon shipment. In most situations, the independent customer is a dealer, which subsequently sells the equipment and service parts purchased from us to a retail customer, who can finance the equipment with the financial services segment or another source of financing. In some situations, we sell directly to a retail customer. The term “customer” includes both dealers and retail customers to whom we make direct sales.

Interest-Free Periods and Past-Due Interest

We charge dealers interest on outstanding balances from the earlier of when goods are sold to a retail customer by the dealer or the expiration of the interest-free period granted at the time of the sale to the dealer. Interest-free periods are determined based on the type of equipment sold and the time of year of the sale. These periods range from one to twelve months for most equipment. Interest-free periods may not be extended. Interest charged may

not be forgiven, and past due interest rates are charged at higher rates. If the interest-free or below market interest rate period exceeds one year, we adjust the expected sales revenue for the effects of the time value of money using a current market interest rate. The revenue related to the financing component is recognized in “Finance and interest income” using the interest method. We do not adjust the sales price to account for a financing component if the expected interest-free or below market period is one year or less.

Right of Return

Generally, no right of return exists on sales of equipment. Dealers cannot cancel purchases after we recognize a sale and are responsible for payment even if the equipment is not sold to a retail customer. Service parts and certain attachment returns are estimable and accrued at the time a sale is recognized. The estimated returns are based on historical return rates, current dealer inventory levels, and current economic conditions. The estimated returns are recorded in “Other assets” for the inventory value of estimated returns, adjusted for restocking fees. The estimated dealer refund liability, adjusted for restocking fees, is recorded in “Accounts payable and accrued expenses.”

Remanufacturing

We remanufacture used engines and components (cores) that are sold to dealers and retail customers for maintenance and repair parts. Revenue for remanufactured components is recognized using the same criteria as other parts sales. When a remanufactured part is sold, we collect a deposit that is repaid if the customer returns a core that meets certain specifications within a defined time period. The deposit received from the customer is recognized as a liability in “Accounts payable and accrued expenses” and the used component that is expected to be returned is recognized in “Other assets.” When a customer returns a core, the deposit is repaid, the liability reversed, and the returned core is recorded in inventory to be remanufactured and sold to another customer. If a core is not returned within the required time, the deposit is recognized as revenue in “Net sales,” and the cost of the core is recorded as an expense in “Cost of sales.”

Bundled Technology

Certain equipment is sold with precision guidance, telematics, and other information gathering and analyzing capabilities. These technology solutions require hardware, software, and may include an obligation to provide services for a period of time. These solutions are mostly bundled with the sale of the equipment but can also be purchased or renewed separately. The revenue related to the hardware and embedded software is recognized at the time of the equipment sale and recorded in “Net sales.” The revenue for the future services and usage-based software is deferred and recognized over the service period. The deferred revenue is recorded as a contract liability in “Accounts payable and accrued expenses.”

Financing Revenue and Origination Costs

Financing revenue and deferred costs on the origination of financing receivables are recorded over the lives of the related receivables using the interest method. Deferred costs are

53

Table of Contents

recognized as a reduction to “Finance and interest income.” Income and deferred costs on the origination of operating leases are recognized on a straight-line basis over the scheduled lease terms in “Finance and interest income.”

Sales Incentives

We offer sales incentive programs to promote the sale of our products from the dealer to the retail customer. At the time of the sale to a dealer, we record an estimated cost for the sales incentive programs as a reduction to the sales price. The estimated cost is based on historical data, announced and expected incentive programs, field inventory levels, and forecasted sales volumes. The final cost of these programs is determined at the end of the measurement period for volume-based incentives or when the dealer sells the equipment to a retail customer. One type of sales incentive program offered to dealers is pool funds in which we award dealers funds based on new equipment sales. Dealers can use these funds to incentivize sales from the dealer to the end customer. Pool funds, as well as some other incentive programs, are recorded in “Trade accounts and notes receivable – net” when we have the contractual right and the intent to offset against the existing dealer receivables. Actual cost differences from the original cost estimate are recognized in “Net sales.”

Product Warranties

For equipment and service parts sales, we provide a standard warranty. At the time a sale is recognized, the estimated future warranty costs are recorded. The warranty liability is estimated based on historical warranty claims rate experience and the estimated amount of equipment still under warranty. The historical claims rate is primarily determined by a review of five-year claims costs while also taking into consideration current quality developments. The amount of equipment still under warranty is estimated based on dealer inventories and retail sales.

We also offer extended warranty arrangements for purchase at the customer’s option. The premiums for extended warranties are recognized in “Other income” primarily in proportion to the costs expected to be incurred over the contract period. The unamortized extended warranty premiums (deferred revenue) are recorded in “Accounts payable and accrued expenses” (see Note 18).

Sales and Transaction Taxes

We collect and remit taxes for revenue producing transactions as necessary based on various tax laws. These taxes include sales, use, value-added, and some excise taxes. We elected to exclude these taxes from the determination of the sales price. These taxes are not included in revenues.

Contract Costs

Incremental costs of obtaining an equipment revenue contract are recognized as an expense when incurred since the amortization period would be one year or less.

Advertising Costs

Advertising costs are charged to “Selling, administrative and general expenses” as incurred. Advertising costs were $235 in 2025, $230 in 2024, and $244 in 2023.

Depreciation and Amortization

Property and equipment, capitalized software, and other intangible assets are stated at cost less accumulated depreciation or amortization. These assets are depreciated over their estimated useful lives using the straight-line method. Equipment on operating leases is depreciated over the terms of the leases using the straight-line method. Property and equipment expenditures for new and upgraded products, increased capacity, and the replacement or major renewal of significant items are capitalized. Expenditures for maintenance, repairs, and minor renewals are charged to expense as incurred.

Cash and Cash Equivalents

We consider investments with purchased maturities of three months or less to be cash equivalents.

Restricted Cash

Restricted cash includes cash and cash equivalents that are restricted from withdrawal or use under the terms of securitization agreements (see Note 12) and cash held to meet governmental and legal requirements. Restricted cash is recorded in “Other assets.”

Marketable Securities

We have investments in debt and equity securities that are recorded in “Marketable securities,” which include investments in debt securities that are more than three months to maturity at the date of purchase. Debt securities are classified as held-to-maturity or available-for-sale at the time of purchase and at each balance sheet date. Most of our debt securities are classified as available-for-sale and are carried at fair value with unrealized gains or losses, net of tax, reported in other comprehensive income. Held-to-maturity securities are carried at amortized cost. Equity securities are carried at fair value with changes in fair value recorded in “Other income.” We generally determine realized gains or losses on sales of investments based on specific identification and include them in “Other income” on the statements of consolidated income (see Notes 10 and 25).

Receivables and Allowances

All financing and trade receivables are reported on the balance sheet at outstanding principal and accrued interest, adjusted for:

write-offs
allowance for credit losses
unamortized deferred fees or costs on originated financing receivables

The allowance is a reduction to the receivable balances, and the provision is recorded in “Selling, administrative and general expenses.” The allowance for credit losses is an estimate of the credit losses expected over the life of our receivable portfolio. Non-performing receivables are included in the estimate of expected credit losses. The allowance is measured on a collective basis for receivables with similar risk characteristics. Receivables that do not share risk characteristics are evaluated on an individual basis. Risk characteristics include:

finance product category
market

54

Table of Contents

geography
credit risk
remaining balance

We utilize the following loss forecast models to estimate expected credit losses:

Linear regression models are used for large and complex retail customer receivable pools, which represent more than 90% of retail customer receivables. These statistical models utilize independent variables, or predictive features, to estimate lifetime default rates, which are subsequently adjusted for expected recoveries to arrive at lifetime credit loss estimates. Independent variables included in the models vary by product, but can include credit quality at time of application, remaining account balance, delinquency status, and various economic factors, such as commodity prices, employment levels, and housing data. The economic factors include forward-looking conditions over our reasonable and supportable forecast period. In the fourth quarter of 2024, we transitioned from the use of transition matrix models to linear regression models to estimate expected credit losses. This change in methodology did not have a material impact on our consolidated financial statements.
Weighted average remaining maturity (WARM) models are used for smaller and less complex retail customer receivable pools.
Historical loss rate models are used on wholesale receivables, with consideration of current economic conditions and dealer financial risk.

Management reviews each model’s output quarterly, and qualitative adjustments are incorporated as necessary (see Note 11).

Long-Lived Assets, Goodwill, and Other Intangible Asset Impairment

We evaluate the carrying value of long-lived assets (including equipment on operating leases, property and equipment, goodwill, and other intangible assets) when events or circumstances warrant such a review. If the carrying value of the long-lived asset is considered impaired, the long-lived asset is written down to its fair value (see Notes 4 and 25).

Goodwill and unamortized intangible assets are tested for impairment annually at the end of the third quarter of each fiscal year, and more often if events or circumstances may have caused the fair value to fall below the carrying value. Goodwill is allocated and reviewed for impairment by reporting unit. Goodwill is allocated to the reporting unit in which the business that created the goodwill resides. To test for goodwill impairment, the carrying value of each reporting unit is compared with its fair value. If the carrying value of the goodwill is considered impaired, the impairment is measured as the reporting unit’s carrying value minus the fair value. We determined that there was no impairment to goodwill during the annual goodwill impairment review.

Derivative Financial Instruments

It is our policy to use derivative transactions only to manage exposures from the normal course of business. We do not execute derivative transactions for the purpose of creating speculative positions or trading. Our financial services operations have interest rate and foreign currency exposure between (a) the receivable or lease portfolio and (b) how those portfolios are funded. We also have foreign currency exposures at some of our foreign and domestic operations related to buying, selling, and financing in currencies other than the functional currencies. In addition, we have interest rate and foreign currency exposure at certain equipment operations units for sales incentive programs.

All derivatives are recorded at fair value on the consolidated balance sheets. Cash collateral received or paid is not offset against the derivative fair values on the balance sheets. The cash flows from the derivative contracts are recorded in operating activities in the statements of consolidated cash flows. Each derivative is designated as a cash flow hedge, fair value hedge, net investment hedge, or remains undesignated.

Changes in the fair value of derivatives are recorded as follows:

Cash flow hedges: Recorded in other comprehensive income (OCI) and reclassified to the income statement when the effects of the item being hedged are recognized in the income statement. These amounts offset the effects of interest rate changes on the related borrowings in interest expense.
Fair value hedges: Recorded in interest expense, and the gains or losses are offset by the fair value gains or losses on the hedged items (fixed-rate borrowings), which are also recorded in interest expense.
Net investment hedges: Changes attributable to spot rate changes are recorded in OCI within “Cumulative translation adjustment” to offset the effects of foreign currency changes on the related net investments in foreign subsidiaries. This amount is reclassified to the income statement when the net investment in the foreign subsidiary is sold or substantially liquidated. The interest accrual for periodic cash settlements of cross-currency swaps is recorded in interest expense.
Derivatives not designated as hedging instruments: Changes in the fair value of undesignated hedges are recognized as they occur in the income statement.

All designated hedges are formally documented as to the relationship with the hedged item as well as the risk-management strategy. Both at inception and on an ongoing basis, the hedging instrument is assessed for its effectiveness. Net investment hedge effectiveness is assessed using the spot method. If and when a derivative is determined not to be highly effective as a hedge, the underlying hedged transaction is no longer likely to occur, the hedge designation is removed, or the derivative is terminated, hedge accounting is discontinued (see Note 26).

Redeemable Noncontrolling Interest

We record redeemable noncontrolling interest at the greater of the redemption fair value or the carrying value of the noncontrolling interest adjusted for income or loss and changes in other

55

Table of Contents

comprehensive income components. We have a redeemable noncontrolling interest related to the acquisition of Kreisel Electric Inc. (Kreisel) in 2022. The transaction included a call option to purchase the remaining ownership interest in Kreisel in 2027. The minority interest holders also have a put option that would require us to purchase the holders’ ownership interest in 2027. The put and call options cannot be separated from the noncontrolling interest. Due to the redemption features, the minority interest is classified as redeemable noncontrolling interest in our consolidated balance sheets.

Foreign Currency Translation

The functional currencies for most of our foreign operations are their respective local currencies. The assets and liabilities of these operations are translated into U.S. dollars using the exchange rates at the end of the period. The revenues and expenses are translated at weighted-average rates for the period. The gains or losses from these translations are recorded in OCI.

Foreign currency gains or losses and foreign exchange components of derivative contracts are included in net income, with trade flow activity recorded in “Cost of sales,” sales incentive activity recorded in “Net sales,” and all other activity recorded in “Other operating expenses.” The pretax net loss for foreign exchange in 2025, 2024, and 2023 was $60, $63, and $159, respectively. Foreign exchange components of net investment derivative contracts are included in OCI within “Cumulative translation adjustment.”

New Accounting Pronouncements Adopted

We closely monitor all Accounting Standard Updates (ASUs) issued by the Financial Accounting Standards Board (FASB) and other authoritative guidance. We adopted the following standards in 2025, none of which had a material effect on our consolidated financial statements:

No. 2023-07 — Segment Reporting (Topic 280): Improvements to Reportable Segment Disclosures

No. 2023-05 — Business Combinations – Joint Venture Formations (Subtopic 805-60): Recognition and Initial Measurement

No. 2022-03 — Fair Value Measurement (Topic 820): Fair Value Measurement of Equity Securities Subject to Contractual Sale Restrictions

Accounting Pronouncements to be Adopted

In December 2025, the FASB issued ASU 2025-10, Government Grants (Topic 832): Accounting for Government Grants Received by Business Entities, which provides updated guidance on how to recognize, measure, and present government grants. The ASU will be effective for us beginning with our interim reporting for fiscal year 2030, with early adoption permitted. We are assessing the effect of this update on our consolidated financial statements.

In September 2025, the FASB issued ASU 2025-06, Intangibles – Goodwill and Other – Internal-Use Software (Subtopic 350-40): Targeted Improvements to the Accounting for Internal-Use Software, which provides updated guidance for the capitalization of internal-use software. The ASU will be effective for us beginning with our interim reporting for fiscal year 2029, with early adoption

permitted. We are assessing the effect of this update on our consolidated financial statements.

In November 2024, the FASB issued ASU 2024-03, Income Statement – Reporting Comprehensive Income – Expense Disaggregation Disclosures (Subtopic 220-40): Disaggregation of Income Statement Expenses, which expands disclosures about specific expense categories presented on the face of the income statement. In January 2025, the FASB issued ASU 2025-01, Income Statement – Reporting Comprehensive Income – Expense Disaggregation Disclosures (Subtopic 220-40), which clarifies the effective date of ASU 2024-03. The ASU will be effective for us beginning with our annual reporting for fiscal year 2028 and interim periods thereafter. We are assessing the effect of ASU 2024-03 on our related disclosures.

In December 2023, the FASB issued ASU 2023-09, Income Taxes (Topic 740): Improvements to Income Tax Disclosures, which expands disclosures in an entity’s income tax rate reconciliation table and cash taxes paid both in the U.S. and foreign jurisdictions. The ASU will be effective for us beginning with our annual reporting for fiscal year 2026. We are assessing the effect of this update on our related disclosures.

We will also adopt the following standards in future periods, none of which are expected to have a material effect on our consolidated financial statements. All other accounting standards issued but not yet adopted were not applicable to us.

No. 2025-11 — Interim Reporting (Topic 270): Narrow-Scope Improvements

No. 2025-09 — Derivatives and Hedging (Topic 815): Hedge Accounting Improvements

No. 2025-07 — Derivatives and Hedging (Topic 815) and Revenue from Contracts with Customers (Topic 606): Derivatives Scope Refinements and Scope Clarification for Share-Based Noncash Consideration from a Customer in a Revenue Contract

No. 2025-05 — Financial Instruments – Credit Losses (Topic 326): Measurement of Credit Losses for Accounts Receivable and Contract Assets

No. 2024-04 — Debt – Debt with Conversion and Other Options (Subtopic 470-20): Induced Conversions of Convertible Debt Instruments

No. 2023-06 — Disclosure Improvements: Codification Amendments in Response to the SEC’s Disclosure Update and Simplification Initiative

3. ACQUISITIONS AND DISPOSITIONS

During the presented periods, we completed acquisitions to support our Smart Industrial Operating Model and Leap Ambitions, which focus on advancing our capabilities in technology.

Acquisitions

2025 Acquisitions

In 2025, we acquired several small-scale businesses to advance the capabilities of our existing technology offerings, providing customers with a more comprehensive set of tools to generate and use data to make decisions that aim at improving profitability, efficiency, and sustainability. In addition, we acquired the remaining ownership interest of an equity method investment (see Note 25 for fair value measurement information). The combined

56

Table of Contents

purchase price consideration for these acquisitions was $115, consisting of $101 cash, net of cash acquired, and $14 loan forgiven. The businesses were assigned to the PPA, SAT, and CF segments. Most of the purchase price for these acquisitions was allocated to goodwill and intangible assets.

2023 Acquisitions

In 2023, we acquired SparkAI Inc. (Spark AI) and Smart Apply, Inc. (Smart Apply) to accelerate the integration of smart technology innovation in our products. The combined cost of these acquisitions was $82, net of cash acquired of $2. Spark AI was assigned to the PPA segment, while Smart Apply was assigned to the SAT segment. Most of the purchase price for these acquisitions was allocated to goodwill.

Dispositions

2025 Disposition

In February 2025, we completed a transaction with Banco Bradesco S.A. (Bradesco), for Bradesco to invest and become a 50% owner of our wholly-owned subsidiary in Brazil, BJD. Bradesco contributed capital directly to BJD. The transaction resulted in the deconsolidation of BJD in the second quarter of 2025. BJD finances retail and wholesale loans for agricultural, construction, and forestry equipment and was included in our financial services segment. BJD was a part of our Brazil operations which is considered an integrated single foreign entity.

We retained a 50% equity interest in BJD, which was valued at the deconsolidation date at $362 based on the completed transaction with Bradesco and its amount of contributed capital. We are accounting for our investment in BJD using the equity method of accounting and results of its operations are reported in “Equity in income (loss) of unconsolidated affiliates” (see Note 1). The related investments in unconsolidated affiliates and receivables from unconsolidated affiliates are reported in “Other assets” and “Other receivables,” respectively, on the consolidated balance sheets.

The major classes of the total assets and liabilities of BJD at the time of deconsolidation were as follows:

February 2025

Cash and cash equivalents

$

110

Trade accounts and notes receivable – net

119

Financing receivables – net

2,787

Deferred income taxes

33

Other miscellaneous assets

23

Valuation allowance

(65)

Total assets

$

3,007

Short-term borrowings

$

495

Accounts payable and accrued expenses

124

Long-term borrowings

1,241

Retirement benefits and other liabilities

1

Total liabilities

$

1,861

Total intercompany payables

$

781

At the time of deconsolidation, the additional gain or loss was not significant. BJD was reclassified as held for sale in the third quarter of 2024 prior to its deconsolidation.

The decrease in cash and cash equivalents resulting from deconsolidation of BJD was recorded in other investing activities in the statements of consolidated cash flows. See Note 6 for information on non-cash transactions.

2023 Dispositions

In October 2023, we sold our roadbuilding business in Russia. At the time of the sale, total assets were $32, consisting primarily of restricted cash, total liabilities were $1, and the cumulative translation loss was $11. Total proceeds from the sale include $16 of cash and $8 of deferred consideration. A pretax and after-tax loss of $18 was recorded in “Other operating expenses” in the CF segment. As of November 2, 2025, our remaining investments in Russia were not material.

In March 2023, we sold our financial services business in Russia (registered in Russia as a leasing company) to Insight Investment Group. The total proceeds, net of restricted cash sold, were $36. The operations were included in the financial services operating segment through the date of sale. At the disposal date, the total assets were $31, consisting primarily of financing receivables, the total liabilities were $5, and the cumulative translation loss was $10. In the first quarter of 2023, we reversed the allowance for credit losses and recorded a valuation allowance on the assets held for sale in “Selling, administrative and general expenses.” We did not incur additional gains or losses upon disposition.

4. SPECIAL ITEMS

2025 Special Items

Litigation Accrual

In the fourth quarter of 2025, we have increased our total accrued losses on unresolved legal matters in connection with a consolidated multidistrict class action antitrust lawsuit by $95 pretax ($75 after-tax) which was included in “Selling, administrative and general expenses” (see Note 20). The expense was allocated $47 to PPA, $24 to SAT, and $24 to CF.

Impairment

In the third quarter of 2025, we recorded a non-cash impairment charge of $61 pretax ($49 after-tax), primarily related to the trade name and customer relationship assets of our external overseas battery operations. Of this amount, $53 was recorded in “Selling, administrative and general expenses” and $8 in “Cost of sales.” This is presented in “Impairments and other adjustments” in the statements of consolidated cash flows. The loss was allocated $28 to PPA, $17 to SAT, and $16 to CF. The impairment resulted from slowing external demand for batteries, which indicated that it is probable future cash flows would not cover the carrying value of the assets (see Note 25).

57

Table of Contents

Banco John Deere S.A.

In February 2025, we completed the transaction with Bradesco (see Note 3) for the sale of 50% ownership in BJD. In the first quarter of 2025, a pretax and after-tax gain (reversal of previous losses) of $32 was recorded in “Selling, administrative and general expenses” and presented in “Impairments and other adjustments” in the statements of consolidated income and consolidated cash flows, respectively, related to a decrease in valuation allowance.

Tax Items

In the first quarter of 2025, we recorded favorable net discrete tax items primarily due to tax benefits of $110 related to the realization of foreign net operating losses from the consolidation of certain subsidiaries and $53 from an adjustment to an uncertain tax position of a foreign subsidiary.

2024 Special Items

Legal Settlements

In 2024, we reached legal settlements concerning patent infringement claims. As a result of these settlements, we recognized a total of $57 pretax gain ($45 after-tax) in "Other income," providing a benefit of $17 to PPA and $40 to CF. These settlements resolve the disputes without any admission of liability by the parties involved. We believe that these settlements enhance our ability to protect our intellectual property and reinforce our commitment to innovation and technological advancement.

Impairment

In the fourth quarter of 2024, we recorded a non-cash impairment charge of $28 pretax and after-tax in “Equity in income (loss) of unconsolidated affiliates” for an other than temporary decline in value of an investment recorded in SAT. See Note 25 for fair value measurement information.

Employee-Separation Programs

In the third quarter of 2024, we implemented employee-separation programs for our salaried workforce in several geographic areas, including the United States, Europe, Asia, and Latin America. The programs’ main purpose was to help meet our strategic priorities while reducing overlap and redundancy in roles and responsibilities. The programs were largely involuntary in nature with the expense recorded when management committed to a plan, the plan was communicated to the employees, and the employees were not required to provide service beyond the legal notification period. For the limited voluntary employee-separation programs, the expense was recorded in the period in which the employee irrevocably accepted a separation offer.

In 2024, we recorded $157 pretax expenses ($124 after-tax) related to the programs. The programs’ pretax expenses were as follows:

PPA

SAT

CF

FS

Total

Employee-Separation Programs:

Cost of sales

$

21

$

11

$

8

$

40

Research and development expenses

22

9

2

33

Selling, administrative and general expenses

34

23

12

$

10

79

Total operating profit decrease

$

77

$

43

$

22

$

10

152

Non-operating profit expenses*

5

Total

$

157

*    Relates primarily to corporate expenses.

Banco John Deere S.A.

In the third quarter of 2024, we reclassified the BJD business as held for sale, including a reversal of $38 in allowance for credit losses. At October 27, 2024, a $97 valuation allowance was recorded on the assets held for sale, which was presented in “Impairments and other adjustments” in the statements of consolidated cash flows. The net impact of these entries was a pretax and after-tax loss of $59 recorded in “Selling, administrative and general expenses.” See Note 25 for fair value measurement information.

Redeemable Noncontrolling Interest

In the third quarter of 2024, we exercised our right to purchase the remaining 20% interest in SurePoint. The arrangement was accounted for as an equity transaction with no gain or loss recorded in the statements of consolidated income.

2023 Special Items

Sale of Russian Roadbuilding Business

In October 2023, we sold our Russian roadbuilding business, recognizing a loss of $18 (pretax and after-tax). The loss was recorded in “Other operating expenses” in the CF segment.

Brazil Tax Ruling

In the third quarter of 2023, the Brazil Superior Court of Justice published a favorable tax ruling regarding taxability of local incentives, which allowed us to record a $243 reduction in the provision for income taxes and $47 of interest income.

Financial Services Financing Incentives Correction

In the second quarter of 2023, we corrected the accounting treatment for financing incentives offered to John Deere dealers, which impacted the timing of expense recognition and the presentation of incentive costs in the consolidated financial statements. The cumulative effect of this correction, $173 pretax ($135 after-tax), was recorded in “Selling, administrative and general expenses” in the second quarter of 2023. Prior period results for Deere & Company were not restated, as the adjustment was considered immaterial to our financial statements.

58

Table of Contents

5. REVENUE RECOGNITION

Our net sales and revenues by primary geographic market, major product line, and timing of revenue recognition follow:

PPA

SAT

CF

FS

Total

2025

Primary geographic markets:

United States

$

7,753

$

5,282

$

6,489

$

4,450

$

23,974

Canada

1,735

496

743

761

3,735

Western Europe

2,070

2,340

1,955

185

6,550

Central Europe and CIS

832

359

373

11

1,575

Latin America

4,021

453

936

197

5,607

Asia, Africa, Oceania, and Middle East

1,338

1,534

1,154

217

4,243

Total

$

17,749

$

10,464

$

11,650

$

5,821

$

45,684

Major product lines:

Production agriculture

$

16,960

$

16,960

Small agriculture

$

7,215

7,215

Turf

2,731

2,731

Construction

$

4,570

4,570

Compact construction

1,922

1,922

Roadbuilding

3,552

3,552

Forestry

1,124

1,124

Financial products

257

134

84

$

5,821

6,296

Other

532

384

398

1,314

Total

$

17,749

$

10,464

$

11,650

$

5,821

$

45,684

Revenue recognized:

At a point in time

$

17,311

$

10,249

$

11,494

$

139

$

39,193

Over time

438

215

156

5,682

6,491

Total

$

17,749

$

10,464

$

11,650

$

5,821

$

45,684

PPA

SAT

CF

FS

Total

2024

Primary geographic markets:

United States

$

11,741

$

6,249

$

8,086

$

4,166

$

30,242

Canada

1,818

605

760

717

3,900

Western Europe

2,068

2,203

1,729

189

6,189

Central Europe and CIS

787

284

381

36

1,488

Latin America

3,482

433

1,170

453

5,538

Asia, Africa, Oceania, and Middle East

1,530

1,480

1,128

221

4,359

Total

$

21,426

$

11,254

$

13,254

$

5,782

$

51,716

Major product lines:

Production agriculture

$

20,574

$

20,574

Small agriculture

$

7,693

7,693

Turf

3,023

3,023

Construction

$

5,523

5,523

Compact construction

2,459

2,459

Roadbuilding

3,641

3,641

Forestry

1,108

1,108

Financial products

240

131

67

$

5,782

6,220

Other

612

407

456

1,475

Total

$

21,426

$

11,254

$

13,254

$

5,782

$

51,716

Revenue recognized:

At a point in time

$

21,059

$

11,084

$

13,137

$

133

$

45,413

Over time

367

170

117

5,649

6,303

Total

$

21,426

$

11,254

$

13,254

$

5,782

$

51,716

PPA

SAT

CF

FS

Total

2023

Primary geographic markets:

United States

$

13,917

$

7,796

$

9,109

$

3,283

$

34,105

Canada

1,738

687

1,221

641

4,287

Western Europe

2,640

2,824

1,725

132

7,321

Central Europe and CIS

1,218

530

353

36

2,137

Latin America

5,608

707

1,429

453

8,197

Asia, Africa, Oceania, and Middle East

2,166

1,679

1,183

176

5,204

Total

$

27,287

$

14,223

$

15,020

$

4,721

$

61,251

Major product lines:

Production agriculture

$

26,450

$

26,450

Small agriculture

$

10,122

10,122

Turf

3,505

3,505

Construction

$

6,842

6,842

Compact construction

2,451

2,451

Roadbuilding

3,794

3,794

Forestry

1,429

1,429

Financial products

219

96

58

$

4,721

5,094

Other

618

500

446

1,564

Total

$

27,287

$

14,223

$

15,020

$

4,721

$

61,251

Revenue recognized:

At a point in time

$

26,969

$

14,092

$

14,915

$

111

$

56,087

Over time

318

131

105

4,610

5,164

Total

$

27,287

$

14,223

$

15,020

$

4,721

$

61,251

The “Financial products” category above includes finance and interest income from retail notes related to sales of John Deere equipment to retail customers, wholesale financing to dealers of John Deere equipment, and revolving charge accounts; lease income from retail leases of John Deere equipment; and revenue from extended warranties.

The ”Other” category includes sales of components to other equipment manufacturers that are included in “Net sales;” revenue earned over time from precision guidance, telematics, and other information enabled solutions; revenue from service performed at company owned dealerships and service centers; gains on disposition of property and businesses; trademark licensing revenue; and other miscellaneous revenue items that are included in “Other income.”

Revenues are assigned to the geographic market based on customer location.

We invoice in advance of recognizing the revenue of certain products and services. These relate to extended warranty premiums, advance payments for future equipment sales, and subscription and service revenue related to precision guidance, telematic services, and other information enabled solutions. These advanced customer payments are presented as deferred revenue, a contract liability, in “Accounts payable and accrued expenses.” The deferred revenue received but not recognized in revenue was $2,039 and $1,923 at November 2, 2025, and October 27, 2024, respectively. The contract liability is reduced as the revenue is recognized. Revenue recognized from deferred revenue that was

59

Table of Contents

recorded as a contract liability at the beginning of the fiscal year was $654 in 2025, $553 in 2024, and $547 in 2023.

The amount of unsatisfied performance obligations for contracts with an original duration greater than one year and the estimated revenue to be recognized by fiscal year at November 2, 2025, follows:

Year

Net Sales and Revenues

2026

$

502

2027

463

2028

353

2029

227

2030

167

Later years

98

Total

$

1,810

As permitted, we elected only to disclose remaining performance obligations with an original contract duration greater than one year. The contracts with an expected duration of one year or less are for sales to dealers and retail customers for equipment, service parts, repair services, and certain telematics services.

6. SUPPLEMENTAL CASH FLOW INFORMATION

All cash flows from receivables related to sales are included in operating activities. This includes all changes in trade accounts and notes receivables, as well as some financing receivables (see Note 11). Financing receivables that are related to loans on equipment sold by independent dealers are included in investing activities.

During 2025, we issued $2.6 billion and retired $4.4 billion of retail note securitization borrowings, which are presented in “Net proceeds (payments) in short-term borrowings (original maturities three months or less).”

Our noncash transactions as a result of the BJD deconsolidation in February 2025 (see Note 3) include the derecognition of total assets (excluding cash and cash equivalents) of $2,897 and total liabilities of $1,861, and the recognition of the investments in unconsolidated affiliates of $362 and receivables from unconsolidated affiliates (BJD intercompany payables) of $781. The decrease in cash and cash equivalents resulting from the deconsolidation of BJD was recorded in other investing activities in the statements of consolidated cash flows. We also had noncash consideration of a loan forgiven related to a 2025 acquisition of the remaining ownership interest of an equity method investment (see Note 3).

Supplemental cash flow information follows:

2025

2024

2023

Cash paid for interest

$

3,080

$

3,298

$

2,227

Cash paid for income taxes

1,647

2,518

3,578

Inventory transferred to equipment on operating leases

137

223

195

Accounts payable related to purchases of property and equipment

167

208

211

7. PENSION AND OTHER POSTRETIREMENT BENEFITS

We have several funded and unfunded defined benefit pension plans and other postretirement benefit (OPEB) plans. These plans cover U.S. employees and certain foreign employees. The measurement date of our plans is October 31. The U.S. salaried qualified pension plan and U.S. salaried and hourly OPEB health care plans are closed to new participants.

The components of net periodic pension and OPEB (benefit) cost excluding the service cost component are included in the line item “Other operating expenses.”

The components of net periodic pension benefit and the related assumptions consisted of the following:


2025

  ​ ​ ​

2024

  ​ ​ ​

2023


Pensions:

Service cost


$

252

$

230

$

246

Interest cost


517


545


533

Expected return on plan assets


(1,005)


(967)


(878)

Amortization of actuarial (gain) loss


5


3


(13)

Amortization of prior service cost


39


40


38

Settlements/curtailments


25


38


37

Net benefit

$

(167)

$

(111)

$

(37)

Weighted-average assumptions:

Discount rates – service cost

4.9%

5.8%

5.2%

Discount rates – interest cost

4.9%

5.7%

5.1%

Rate of compensation increase

4.3%

3.8%

3.8%

Expected long-term rates of return

7.2%

7.0%

6.3%

Interest crediting rate – U.S. cash balance plans

4.2%

4.8%

4.3%

During 2025 and 2024, curtailment expense of $18 and $35, respectively, was recognized related to U.S. hourly employee layoffs. During 2023, a settlement expense of $36 was recognized for the acceleration of actuarial losses related to the transfer of the Canadian pension plan’s defined benefit obligations and related plan assets to an insurance company.

The 2026 net periodic pension benefit is expected to increase by $60 due to changes in discount rates, decreases in amortization of actuarial losses, and the U.S. hourly pension curtailment recognized in 2025, described above.

The components of net periodic OPEB cost and the assumptions related to the cost consisted of the following:


2025

  ​ ​ ​

2024

  ​ ​ ​

2023


OPEB:

Service cost

$

17

$

17

$

27

Interest cost


158


174


176

Expected return on plan assets


(113)


(108)


(117)

Amortization of actuarial gain


(44)


(54)


(59)

Amortization of prior service credit


(4)


(4)


(3)

Net cost

$

14

$

25

$

24

Weighted-average assumptions:

Discount rates – service cost

5.7%

6.7%

6.1%

Discount rates – interest cost

5.0%

5.9%

5.4%

Expected long-term rates of return

5.3%

5.6%

5.7%

60

Table of Contents

The OPEB net periodic cost is expected to decrease by $50 due to an increase in the expected return related to the 2025 U.S. voluntary contribution.

The benefit plan obligations, funded status, and the assumptions related to the obligations at November 2, 2025, and October 27, 2024, follow:

Pensions

OPEB

2025

2024

2025

2024

Change in benefit obligations:

  ​ ​ ​ ​ ​ ​ ​ ​ ​ ​ ​ ​ ​ ​ ​


  ​ ​ ​ ​ ​ ​ ​ ​ ​ ​ ​ ​ ​ ​ ​


  ​ ​ ​ ​ ​ ​ ​ ​ ​ ​ ​ ​ ​


  ​ ​ ​ ​ ​ ​ ​ ​ ​ ​ ​ ​ ​ ​

Beginning of year balance

$

(11,077)

$

(9,928)

$

(3,362)

$

(3,029)

Service cost


(252)


(230)


(17)


(17)

Interest cost


(517)


(545)


(158)


(174)

Actuarial gain (loss)


197


(1,097)


(25)


(385)

Benefits paid


752


746


280


263

Health care subsidies


(24)


(22)

Foreign exchange and other


(99)


(23)


(2)


2

End of year balance


(10,996)


(11,077)


(3,308)


(3,362)

Change in plan assets (fair value):

Beginning of year balance


13,080


12,004


2,171


2,028

Plan assets actual gain (loss)


849


1,703


203


259

Employer contribution


107


96


671


145

Benefits paid


(752)


(746)


(280)


(263)

Foreign exchange and other


74


23


2


2

End of year balance


13,358


13,080


2,767


2,171

Funded status

$

2,362

$

2,003

$

(541)

$

(1,191)

Weighted-average assumptions:

Discount rates

5.2%

5.1%

5.1%

5.2%

Rate of compensation increase

3.9%

4.3%

Interest crediting rate – U.S. cash balance plans

4.2%

4.1%

The actuarial gain for pension for 2025 was due to increases in discount rates. The actuarial losses for pension and OPEB for 2024 were due to decreases in discount rates. The actuarial loss for OPEB for 2024 was also impacted by changes to health care assumptions.

The discount rate assumptions used to determine the pension and OPEB obligations for all periods presented were based on hypothetical AA yield curves represented by a series of annualized individual discount rates. These discount rates represent the rates at which our benefit obligations could effectively be settled at the October 31 measurement dates.

The mortality assumptions for the 2025 and 2024 U.S. benefit plan obligations used the tables based on the plan’s mortality experience and the most recent scales issued by the Society of Actuaries. The 2025 and 2024 mortality assumptions included an adjustment to the scale related to COVID for some plans.

The weighted-average annual rates of increase in the per capita cost of covered health care benefits (the health care cost trend rates) for medical and prescription drug claims for pre- and post-65 age groups used to determine the November 2, 2025, and

October 27, 2024, accumulated postretirement benefit obligations were as follows:

2025

2024

Initial year

18.1% (2025 to 2026)

16.9% (2024 to 2025)

Second year

9.9% (2026 to 2027)

11.5% (2025 to 2026)

Ultimate

4.7% (2034 to 2035)

4.7% (2033 to 2034)

An increase in Medicare Advantage premiums impacted the weighted-average annual rates of increase for the initial year in 2025 and 2024.

Information related to pension plans benefit obligations at November 2, 2025, and October 27, 2024, follows:

2025

2024

Total accumulated benefit obligations for all plans

$

10,424

$

10,441

Plans with accumulated benefit obligation exceeding fair value of plan assets:

Accumulated benefit obligations

1,405

1,405

Fair value of plan assets

983

920

Plans with projected benefit obligation exceeding fair value of plan assets:

Projected benefit obligations

1,542

1,541

Fair value of plan assets

1,021

951

The pension and OPEB amounts recognized in the balance sheet at November 2, 2025, and October 27, 2024, consisted of the following:

Pensions

OPEB

2025

2024

2025

2024

Noncurrent asset

$

2,883

  ​

$

2,593

$

390

  ​

$

328

Less: Current liability


56


66

41

39

Less: Noncurrent liability


465


524


890


1,480

Total

$

2,362

$

2,003

$

(541)

$

(1,191)

The retirement benefits and other liabilities recognized in the balance sheet at November 2, 2025, and October 27, 2024, consisted of the following:

2025

2024

Deferred compensation – current

$

23

$

28

Deferred compensation and other – noncurrent

235

217

Pensions and OPEB – current

97

105

Pensions and OPEB – noncurrent

1,355

2,004

Total

$

1,710

$

2,354

The amounts recognized in accumulated other comprehensive income pretax at November 2, 2025, and October 27, 2024, consisted of the following:

Pensions

OPEB

2025

2024

2025

2024

Net actuarial (gain) loss

$

1,953

$

2,011

$

(653)

$

(632)

Prior service cost


272


329


8


2

Total

$

2,225

$

2,340

$

(645)

$

(630)

61

Table of Contents

Actuarial gains and losses are recorded in accumulated other comprehensive income (loss). To the extent unamortized gains and losses exceed 10% of the higher of the market-related value of assets or the benefit obligation, the excess is amortized as a component of net periodic (benefit) cost over the remaining service period of the active participants. For plans in which all or almost all of the plan’s participants are inactive, the amortization period is the remaining life expectancy of the inactive participants.

Contributions

We make any required contributions to the plan assets under applicable regulations and voluntary contributions after evaluating our liquidity position and ability to make tax-deductible contributions. Total contributions to the plans were $778 in 2025 and $241 in 2024, which included both required and voluntary contributions and direct benefit payments. The 2025 contributions include a $520 voluntary contribution to a U.S. OPEB plan. This contribution increased plan assets.

We expect to contribute approximately $100 to our pension plans and approximately $150 to our OPEB plans in 2026. The contributions include voluntary contributions and direct benefit payments from company funds. We have no required contributions to U.S. pension plan assets in 2026 under applicable funding regulations.

Expected Future Benefit Payments

The expected future benefit payments at November 2, 2025, were as follows:


  ​ ​Pensions   

  ​

  ​ ​ ​ ​ ​OPEB*      


2026

$

750

$

256

2027


727


262

2028


725


267

2029


724


269

2030


718


275

2031 to 2035


3,585


1,321

*    Net of prescription drug group benefit subsidy under Medicare Part D.

Plan Asset Information

The fair values of the pension plan assets at November 2, 2025, follow:


Total


Level 1


Level 2


Cash and short-term investments

$

275

$

272

$

3

Equity:

U.S. equity securities


479


468

11

International equity securities and funds


249


241

8

Fixed Income:

Government and agency securities


1,279


860


419

Corporate debt securities


5,543


5,543

Mortgage-backed securities


254


254

Other investments


55


31


24

Derivative contracts – assets


95


57


38

Derivative interest rate contracts – liabilities


(75)


(3)


(72)

Receivables and payables


(264)


(264)

Securities lending collateral


507


507

Securities lending liability


(507)


(507)

Securities sold short


(107)


(105)

(2)

Total of Level 1 and Level 2 assets

7,783

$

1,557

$

6,226

Investments at net asset value:

Short-term investments

503

U.S. equity funds

211

International equity funds

259

Fixed income funds

1,593

Real estate funds

316

Hedge funds

481

Private equity

1,037

Venture capital

1,121

Other investments

54

Total net assets

$

13,358

The fair values of the OPEB health care assets at November 2, 2025, follow:


Total


Level 1


Level 2


Cash and short-term investments

$

104

$

104

Equity securities

73

67

$

6

Fixed Income:

Government and agency securities


673


621

52

Corporate debt securities


658


658

Mortgage-backed securities


110


110

Other


(28)


(30)

2

Securities lending collateral


105


105

Securities lending liability


(105)


(105)

Total of Level 1 and Level 2 assets

1,590

$

762

$

828

Investments at net asset value:

U.S. equity funds

115

International equity funds

75

Fixed income funds

436

Real estate funds

106

Hedge funds

104

Private equity

153

Venture capital

165

Other investments

23

Total net assets

$

2,767

62

Table of Contents

The fair values of the pension plan assets at October 27, 2024, follow:


Total


Level 1


Level 2


Cash and short-term investments

$

411

$

399

$

12

Equity:

U.S. equity securities


451


440

11

International equity securities and funds


238


232

6

Fixed Income:

Government and agency securities


1,250


932


318

Corporate debt securities


4,956


4,956

Mortgage-backed securities


177


177

Other investments


57


36


21

Derivative contracts – assets


130


7


123

Derivative interest rate contracts – liabilities


(161)


(119)


(42)

Receivables, prepaids, and payables


(171)


(171)

Securities lending collateral


662


662

Securities lending liability


(662)


(662)

Securities sold short


(94)


(92)

(2)

Total of Level 1 and Level 2 assets

7,244

$

1,664

$

5,580

Investments at net asset value:

Short-term investments

492

U.S. equity funds

174

International equity funds

194

Fixed income funds

1,649

Real estate funds

385

Hedge funds

457

Private equity

1,219

Venture capital

1,219

Other investments

47

Total net assets

$

13,080

The fair values of the OPEB health care assets at October 27, 2024, follow:


Total


Level 1


Level 2


Cash and short-term investments

$

77

$

77

Fixed Income:

Government and agency securities


606


561

$

45

Corporate debt securities


551


551

Mortgage-backed securities


92


92

Other

11


7

4

Securities lending collateral


167


167

Securities lending liability


(167)


(167)

Total of Level 1 and Level 2 assets

1,337

$

645

$

692

Investments at net asset value:

U.S. equity funds

163

International equity funds

84

Fixed income funds

348

Real estate funds

77

Hedge funds

71

Private equity

41

Venture capital

41

Other investments

9

Total net assets

$

2,171

Investments at net asset value in the preceding tables are measured at fair value using the net asset value per share practical expedient and are not classified in the fair value hierarchy. Fair value measurement levels in the preceding tables are defined in Note 25.

Fair values are determined as follows:

Cash and Short-Term Investments – The investments include (1) cash accounts that are valued based on the account value, which approximates fair value; (2) investments that are valued at quoted prices in the active markets in which the investment trades or using a market approach (matrix pricing model) in which all significant inputs are observable or can be derived from or corroborated by observable market data; and (3) investment funds that are valued based on a constant fund net asset value, which is based on quoted prices in the active market in which the investment fund trades, or the fund’s net asset value using the net asset value per share practical expedient (NAV), which is based on the fair value of the underlying securities.

Equity Securities and Funds The Level 1 investments are determined using quoted prices in the active market in which the equity investment trades. Equity funds are valued using the fund’s NAV, which is based on the fair value of the underlying securities.

Fixed Income Securities and Funds and Other FundsThe securities are valued using either a market approach (matrix pricing model) in which all significant inputs are observable or can be derived from or corroborated by observable market data such as interest rates, yield curves, volatilities, credit risk, and prepayment speeds, or they are valued using the quoted prices in the active market in which the fixed income investment trades. Fixed income and other funds are valued using the fund’s NAV, which is based on the fair value of the underlying securities.

Real Estate, Venture Capital, Private Equity, and Hedge Funds The investments that are structured as limited partnerships are valued at estimated fair value based on their proportionate share of the limited partnership’s fair value that is determined by the respective general partner. These investments are valued using the fund’s NAV, which is based on the fair value of the underlying investments. Valuations may be lagged up to six months. The NAV is adjusted for cash flows (additional investments or contributions, and distributions) and any known substantive valuation changes through year end.

Derivative InstrumentsThe derivatives are valued using either an income approach (discounted cash flow) using market observable inputs, including swap curves and both forward and spot exchange rates, or a market approach (quoted prices in the active market in which the derivative instrument trades).

The investment objective for the pension and health care plan assets is to fulfill the projected obligations to the beneficiaries over a long period of time, while meeting our fiduciary responsibilities. The asset allocation policy is the most important decision in managing the assets, and it is reviewed regularly. The asset allocation policy considers our long-term asset class risk/return expectations for each plan since the obligations are long-term in

63

Table of Contents

nature. The target asset allocations as of November 2, 2025, are as follows:

Pension

Health Care


  ​ ​ ​

Assets

  ​ ​ ​

Assets


Equity

8%

10%

Debt

66%

70%

Real estate

3%

3%

Other investments

23%

17%

The assets are diversified and are managed by professional investment firms as well as by investment professionals who are company employees. As a result of our diversified investment policy, there were no significant concentrations of risk.

A market related value of plan assets is used to calculate the expected return on assets. The market related value recognizes changes in the fair value of pension plan assets systematically over a five-year period. The market related value of the health care plan assets equals fair value.

The expected long-term rate of return on plan assets reflects management’s expectations of long-term average rates of return on funds invested to provide for benefits included in the projected benefit obligations. The expected return is based on the outlook for inflation and for returns in multiple asset classes, while also considering historical returns, asset allocation, and investment strategy. Our approach has emphasized the long-term nature of the return estimate such that the return assumption is not changed significantly unless there are fundamental changes in capital markets that affect our expectations for returns over an extended period of time (i.e., 10 to 20 years). The average annual return of our U.S. pension fund was approximately 7.4% during the past 10 years and approximately 7.7% during the past 20 years.

We have Voluntary Employees’ Beneficiary Association trusts (VEBAs) for the funding of hourly and salary postretirement health care benefits. The future expected asset returns for the VEBAs are lower than the expected return on the other pension and health care plan assets due to investment in a higher proportion of liquid securities. These assets are in addition to the other postretirement health care plan assets that have been funded under Section 401(h) of the U.S. Internal Revenue Code and maintained in a separate account in the John Deere Pension Trust.

Defined Contribution Plans

We maintain separate defined contribution plans, primarily in the U.S. Under the plans, we contribute a percentage of each eligible employee’s compensation. Our contributions and costs under these plans were $333 in 2025, $326 in 2024, and $288 in 2023.


8. INCOME TAXES

We are subject to income taxes in a number of jurisdictions. We determine our income tax provision using the asset and liability method. The provision for income taxes by taxing jurisdiction and by significant component consisted of the following:


2025

  ​

2024

  ​

2023


Current:

  ​ ​ ​ ​ ​ ​ ​ ​ ​ ​ ​ ​

  ​ ​ ​ ​ ​ ​ ​ ​ ​ ​ ​ ​

  ​ ​ ​ ​ ​ ​ ​ ​ ​ ​ ​ ​

U.S.:

Federal

$

400

$

1,253

$

1,803

State


103


257


386

Foreign


1,044


878


1,472

Total current


1,547


2,388


3,661

Deferred:

U.S.:

Federal


(107)


(326)


(485)

State


(10)


(29)


(65)

Foreign


(171)


61


(240)

Total deferred


(288)


(294)


(790)

Provision for income taxes

$

1,259

$

2,094

$

2,871

Based upon the location of our operations, the consolidated income before income taxes in the U.S. in 2025, 2024, and 2023 was $2.7 billion, $5.9 billion, and $7.8 billion, respectively, and in foreign countries was $3.6 billion, $3.3 billion, and $5.2 billion, respectively. Certain foreign operations are branches or partnerships of Deere & Company and are subject to U.S. as well as foreign income tax regulations. The pretax income by location and the preceding analysis of the income tax provision by taxing jurisdiction are not directly related.

A comparison of the statutory and effective income tax provision and reasons for related differences follow:

  ​

2025

  ​

2024

  ​

2023


U.S. federal income tax provision at the U.S. statutory rate (21%)

$

1,314

$

1,933

$

2,734

State and local taxes, net of federal effect

76

179

266

Other impacts of Tax Cuts and Jobs Act of 2017

41

(60)

(58)

Rate differential on foreign subsidiaries


238


89


142

Research and business tax credits


(131)


(99)


(107)

Excess tax benefits on equity compensation

(37)

(35)

(49)

Valuation allowances


12


(46)


9

Unrecognized tax benefits

(34)


70


4

Differences in taxability of foreign earnings

(93)

(43)

(85)

Other – net


(127)

106

15

Provision for income taxes

$

1,259

$

2,094

$

2,871

At November 2, 2025, undistributed profits of subsidiaries outside the U.S. of approximately $8.2 billion are considered indefinitely reinvested. Determination of the amount of a foreign withholding tax liability on these unremitted earnings is not practicable.

Deferred income taxes arise because there are certain items that are treated differently for financial accounting than for income tax

64

Table of Contents

reporting purposes. An analysis of the deferred income tax assets and liabilities at November 2, 2025, and October 27, 2024, follows:

2025

2024

 Deferred

 Deferred

 Deferred

 Deferred

Tax

Tax

Tax

Tax


Assets


Liabilities


Assets


Liabilities


Accrual for employee benefits

$

300

$

362

Accrual for sales allowances


773


847

Allowance for credit losses


108


93

Amortization of R&D expenditures

1,287

925

Deferred compensation


56


52

Goodwill and other intangible assets

$

132

$

107

Lessee lease transactions

82

75

73

69

Lessor lease transactions

545

449

OPEB – net

190

256

Pension – net


493


394

Share-based compensation


52


50

Tax loss and tax credit carryforwards


1,700


1,564

Tax over book depreciation

171

195

Unearned revenue

151


174


Other items


496


291


337


313

Less: valuation allowances


(1,638)


(1,598)

Total

$

3,557

$

1,707

$

3,135

$

1,527

Deere & Company files a consolidated federal income tax return in the U.S., which includes the wholly-owned financial services subsidiaries. These subsidiaries account for income taxes as if they filed separate income tax returns, with a modification for realizability of certain tax benefits.

At November 2, 2025, tax loss and tax credit carryforwards of $1,700 were available with $1,164 expiring from 2026 through 2045 and $536 with an indefinite carryforward period.

A reconciliation of unrecognized tax benefits at November 2, 2025, October 27, 2024, and October 29, 2023, follows:


2025

  ​

2024

  ​

2023


Beginning of year balance

$

928

$

907

$

891

Increases to tax positions taken during the current year


57


59


68

Increases to tax positions taken during prior years


62


68


164

Decreases to tax positions taken during the current year

(5)

(2)

(3)

Decreases to tax positions taken during prior years


(202)


(99)


(209)

Decreases due to lapse of statute of limitations


(3)


(7)


(10)

Other

(17)

(1)

(4)

Foreign exchange


3


3


10

End of year balance

$

823

$

928

$

907

The amount of unrecognized tax benefits at November 2, 2025, and October 27, 2024, that would impact the effective tax rate if the tax benefits were recognized was $322 and $410, respectively. The remaining liability was related to tax positions for which there are offsetting tax receivables, or the uncertainty was only related

to timing. We expect that any reasonably possible change in the amounts of unrecognized tax benefits in the next twelve months would not be significant.

We file our tax returns according to the tax laws of the jurisdictions in which we operate, which includes the U.S. federal jurisdiction and various state and foreign jurisdictions. The U.S. Internal Revenue Service (IRS) has completed the examination of our federal income tax returns for periods prior to 2015. The federal income tax returns for years 2015 to 2020 are currently under examination. Various state and foreign income tax returns also remain subject to examination by taxing authorities.

It is our policy to recognize interest related to income taxes in “Interest expense” and “Finance and interest income” and recognize penalties related to income taxes in “Selling, administrative and general expenses.” Income tax related interest and penalties were not significant in 2025, 2024, or 2023. At November 2, 2025, and October 27, 2024, liabilities for income tax related interest and penalties were not significant.

9. OTHER INCOME AND OTHER OPERATING EXPENSES

The major components of other income and other operating expenses consisted of the following:

  ​

2025

  ​

2024

  ​

2023


Other income:

  ​ ​ ​ ​ ​ ​ ​ ​ ​ ​ ​

  ​ ​ ​ ​ ​ ​ ​ ​ ​ ​ ​

  ​ ​ ​ ​ ​ ​ ​ ​ ​ ​ ​

Revenues from services

$

238

$

367

$

312

Extended warranty premiums earned

433

310

312

Trademark licensing income

92

88

95

Operating lease disposition gains


9


19


33

Investment income


56


127


29

Other


191


287


222

Total

$

1,019

$

1,198

$

1,003

Other operating expenses:

Depreciation of equipment on operating leases

$

925

$

874

$

853

Extended warranty claims


320


340


309

Cost of services


211


248


227

Pension and OPEB benefit, excluding the service cost component

(422)

(333)

(286)

Foreign exchange loss

8

71

122

Other


82


57


67

Total

$

1,124

$

1,257

$

1,292


10. MARKETABLE SECURITIES

We have investments in debt securities classified as held-to-maturity or available-for-sale and equity securities, recorded in “Marketable securities” on the consolidated balance sheets. The purchases, maturities, and sale proceeds for all debt and equity marketable securities during 2025, 2024, and 2023 follow:

  ​ ​2025   

  ​

  ​ ​2024   

  ​

  ​ ​2023   

Purchases

$

703

$

1,055

$

491

Maturities and sale proceeds

486

832

186

65

Table of Contents

Debt Securities

The amortized cost and fair value of available-for-sale debt securities at the end of 2025 and 2024 follow:


Gross


Gross


Amortized

Unrealized

Unrealized

Fair


Cost

Gains

Losses

  ​ ​Value   


2025

Corporate debt securities

$

521

$

6

$

17

$

510

International debt securities

176

1

3

174

Mortgage-backed securities*


257

1


24


234

Municipal debt securities


115

1

3


113

U.S. government debt securities

330

3

20


313

Total

$

1,399

$

12

$

67

$

1,344

2024

Corporate debt securities

$

445

$

1

$

23

$

423

International debt securities

169

26

143

Mortgage-backed securities*


193


28


165

Municipal debt securities


78

1

5


74

U.S. government debt securities

377

28


349

Total

$

1,262

$

2

$

110

$

1,154

*    Primarily issued by U.S. government-sponsored enterprises.

The contractual maturities of available-for-sale debt securities at November 2, 2025, follow:


Amortized


Fair


Cost


  ​ ​Value   

Due in one year or less

$

71

$

72

Due after one through five years


381


376

Due after five through 10 years


472


465

Due after 10 years


218


197

Mortgage-backed securities


257


234

Debt securities

$

1,399

$

1,344

Actual maturities may differ from contractual maturities because some securities may be called or prepaid. Mortgage-backed securities contain prepayment provisions and are not categorized by contractual maturity.

Proceeds of available-for-sale debt securities sold or matured during 2025, 2024, and 2023 were $486, $619, and $37, respectively. Realized gains, realized losses, and unrealized losses that have been continuous for over twelve months on debt securities were not material in 2025, 2024, and 2023.

Unrealized losses were not recognized in income due to the ability and intent to hold to maturity and recover the unrealized losses. We evaluate investments quarterly for impairment and determine credit losses on available-for-sale debt securities using the specific identification method. There were no allowances for credit losses nor impairment write-downs in the periods presented. The unrealized losses on securities are due to changes in interest rates and market liquidity.

At November 2, 2025, we also had $60 marketable securities classified as held-to-maturity international corporate debt securities that mature in less than one year. We record held-to-

maturity marketable securities at amortized cost, which approximates fair value.

Equity Securities

At November 2, 2025, we also had a $7 investment in an international fixed income fund equity security.

Unrealized gain on equity securities during 2025 and 2024 follows:

  ​ ​ ​2025    

  ​

  ​ ​ ​2024    

Net gain recognized on equity securities

$

88

Less: Net gain on equity securities sold

88

Unrealized gain on equity securities

$


11. RECEIVABLES

Trade Accounts and Notes Receivable

Trade accounts and notes receivable arise from sales of goods and services to dealers. See Note 2 for our revenue recognition policy. We evaluate and assess customers’ creditworthiness on an ongoing basis. Receivables are secured with collateral or other credit enhancements. Trade accounts and notes receivable at the end of 2025 and 2024 follow:


  ​ ​ ​2025    


  ​ ​ ​2024    


Trade accounts and notes receivable:

Production & Precision Agriculture

$

1,673

$

1,532

Small Agriculture & Turf

1,967

1,657

Construction & Forestry


1,677


2,137

Trade accounts and notes receivable – net

$

5,317

$

5,326

These receivables have significant concentrations of credit risk in the agriculture and turf and construction and forestry markets. Historically, credit losses have been low. There is not a disproportionate concentration of credit risk with any single customer. On a geographic basis, 48% of our trade accounts and notes receivable are located in the U.S. and Canada at November 2, 2025.

At November 2, 2025, and October 27, 2024, trade accounts and notes receivable balances outstanding greater than 12 months were $172 and $298, respectively.

The allowance for credit losses on trade accounts and notes receivable at November 2, 2025, October 27, 2024, and October 29, 2023, as well as the related activity, follow:

2025

2024

2023

Beginning of year balance

$

66

$

35

$

36

Provision

10

34

7

Write-offs

(8)

(5)

(8)

Translation adjustments

1

2

End of year balance*

$

69

$

66

$

35

*    Individual allowances were not significant.

The equipment operations sell a significant portion of their trade receivables to financial services. Compensation is provided to financial services at market interest rates.

66

Table of Contents

Financing Receivables Overall

Financing receivables originate under the following circumstances:

Retail customers purchase (or lease) equipment from a dealer and finance the equipment through John Deere Financial.
We sell the equipment to a dealer under trade terms. Trade terms end and the dealer finances the equipment on a wholesale receivable. Shown as wholesale notes in “Financing Receivables – Related to the Sale of Equipment.”
A dealer finances the purchase of used equipment through John Deere Financial.
We sell (or lease) the equipment directly to a retail customer with terms typically greater than 12 months. Shown as retail notes or sales-type leases in the “Financing Receivables –Related to the Sale of Equipment.”
The retail customer utilizes a revolving credit product to finance parts, service, or input costs.

Financing receivables at the end of 2025 and 2024 follow:

2025

2024


Unrestricted/Securitized


Unrestricted/Securitized

Retail notes:

  ​ ​ ​ ​ ​ ​ ​ ​ ​ ​ ​ ​ ​ ​ ​


  ​ ​ ​ ​ ​ ​ ​ ​ ​ ​ ​ ​ ​ ​ ​

  ​ ​ ​ ​ ​ ​ ​ ​ ​ ​ ​ ​ ​ ​ ​


  ​ ​ ​ ​ ​ ​ ​ ​ ​ ​ ​ ​ ​ ​ ​

Agriculture and turf

$

25,356

$

5,805

$

25,102

$

7,203

Construction and forestry


5,454


1,216


4,550


1,754

Total


30,810


7,021


29,652


8,957

Wholesale notes


8,274


8,951

Revolving charge accounts


4,872


4,730

Financing leases (direct
and sales-type)


2,923


3,032

Total financing receivables


46,879


7,021


46,365


8,957

Less:

Unearned finance income:

Retail notes


1,667


149


1,467


187

Wholesale notes

19

24

Revolving charge accounts

71

76

Financing leases


330


307

Total


2,087


149


1,874


187

Allowance for credit losses


217


41


182


47

Financing receivables net

$

44,575

$

6,831

$

44,309

$

8,723

Credit risk continues to be evaluated by market, rather than by operating segment. Financing receivables have significant concentrations of credit risk in the agriculture and turf and construction and forestry markets. On a geographic basis, 89% of our financing receivables were located in the U.S. and Canada at November 2, 2025. There is no disproportionate concentration of credit risk with any single customer or dealer. We retain as collateral security in the equipment associated with most financing receivables. Theft and physical damage insurance are required for this equipment.

Financing Receivables Related to the Sale of Equipment

Financing receivables related to the sale of equipment are presented in the operating section of the cash flow statement. The balances at the end of 2025 and 2024 were as follows:

2025

2024


Retail notes*:

Agriculture and turf

$

174

$

376

Construction and forestry

238


271

Total

412


647

Wholesale notes

8,274


8,951

Direct financing and sales-type leases*

228


295

Total financing receivables

8,914

9,893

Less:

Unearned finance income:

Retail notes

27

37

Wholesale notes

19

24

Direct financing and sales-type leases

60


47

Total


106


108

Financing receivables related to our sales of equipment

$

8,808

$

9,785

*    These balances arise from sales and direct financing leases of equipment by company-owned dealers or through direct sales.

Financing Receivables Contractual Installment Payments

Financing receivable installments, including unearned finance income, at November 2, 2025, and October 27, 2024, were scheduled as follows:

2025

2024


Unrestricted/Securitized

  ​

Unrestricted/Securitized


Due in months:


  ​ ​ ​ ​ ​ ​ ​ ​ ​ ​ ​ ​ ​ ​ ​


  ​ ​ ​ ​ ​ ​ ​ ​ ​ ​ ​ ​ ​ ​ ​


  ​ ​ ​ ​ ​ ​ ​ ​ ​ ​ ​ ​ ​ ​ ​


  ​ ​ ​ ​ ​ ​ ​ ​ ​ ​ ​ ​ ​ ​ ​

0 – 12

$

21,667

$

3,107

$

23,872

$

3,555

13 – 24


9,667


2,043


8,187


2,507

25 – 36


7,313


1,262


6,356


1,702

37 – 48


4,950


529


4,509


918

49 – 60


2,591


75


2,660


266

Thereafter


691


5


781


9

Total

$

46,879

$

7,021

$

46,365

$

8,957

Financing Receivables Credit Quality Analysis

We monitor the credit quality of financing receivables based on delinquency status, defined as follows:

Past due balances represent any payments 30 days or more past the due date.
Non-performing financing receivables represent receivables for which we have stopped accruing finance income. This generally occurs when receivables are 90 days delinquent.
Write-offs generally occur when receivables are 120 days delinquent. In these situations, the estimated uncollectible amount is written off to the allowance for credit losses.

Finance income for non-performing receivables is recognized on a cash basis. Accrual of finance income is resumed when the receivable becomes contractually current and collections are reasonably assured.

67

Table of Contents

The credit quality and aging analysis of retail notes, financing leases, and revolving charge accounts (collectively, retail customer receivables) by year of origination was as follows:

November 2, 2025

2025

2024

2023

2022

Retail customer receivables:


  ​

  ​ ​ ​


  ​

  ​ ​ ​


  ​

  ​ ​ ​


  ​

  ​ ​ ​


Agriculture and turf:

Current

$

12,380

$

8,389

$

5,228

$

3,003

30-59 days past due

36

73

59

38

60-89 days past due

14

37

28

13

90+ days past due

1

2

1

Non-performing

41

109

98

57

Construction and forestry:

Current

3,175

2,038

1,034

463

30-59 days past due

42

47

31

12

60-89 days past due

21

17

12

8

90+ days past due

1

6

3

2

Non-performing

31

94

78

38

Total

$

15,742

$

10,812

$

6,571

$

3,635

Write-offs for the period ended November 2, 2025:

Agriculture and turf

$

6

$

32

$

34

$

21

Construction and forestry

9

38

29

12

Total

$

15

$

70

$

63

$

33

November 2, 2025

2021

Prior Years

Revolving Charge Accounts

Total

Retail customer receivables:

Agriculture and turf:

Current

$

1,310

$

281

$

4,608

$

35,199

30-59 days past due

15

7

37

265

60-89 days past due

8

2

10

112

90+ days past due

2

6

Non-performing

30

17

14

366

Construction and forestry:

Current

130

12

124

6,976

30-59 days past due

4

1

5

142

60-89 days past due

1

1

2

62

90+ days past due

1

13

Non-performing

19

7

1

268

Total

$

1,519

$

329

$

4,801

$

43,409

Write-offs for the period ended November 2, 2025:

Agriculture and turf

$

9

$

7

$

102

$

211

Construction and forestry

3

3

7

101

Total

$

12

$

10

$

109

$

312

October 27, 2024

2024

2023

2022

2021

Retail customer receivables:


  ​

  ​ ​ ​


  ​

  ​ ​ ​


  ​

  ​ ​ ​


  ​

  ​ ​ ​


Agriculture and turf:

Current

$

14,394

$

8,305

$

5,191

$

2,833

30-59 days past due

44

101

55

27

60-89 days past due

22

50

21

10

90+ days past due

1

1

1

2

Non-performing

23

91

76

50

Construction and forestry:

Current

3,100

1,841

1,064

458

30-59 days past due

54

47

25

10

60-89 days past due

25

28

10

7

90+ days past due

1

4

3

1

Non-performing

40

94

67

32

Total

$

17,704

$

10,562

$

6,513

$

3,430

Write-offs for the period ended October 27, 2024:

Agriculture and turf

$

5

$

33

$

25

$

11

Construction and forestry

9

38

30

11

Total

$

14

$

71

$

55

$

22

October 27, 2024

2020

Prior Years

Revolving Charge Accounts

Total

Retail customer receivables:

Agriculture and turf:

Current

$

992

$

253

$

4,465

$

36,433

30-59 days past due

11

4

40

282

60-89 days past due

8

2

13

126

90+ days past due

5

Non-performing

20

13

15

288

Construction and forestry:

Current

102

45

114

6,724

30-59 days past due

3

2

4

145

60-89 days past due

2

2

74

90+ days past due

9

Non-performing

9

5

1

248

Total

$

1,147

$

324

$

4,654

$

44,334

Write-offs for the period ended October 27, 2024:

Agriculture and turf

$

11

$

5

$

87

$

177

Construction and forestry

5

3

8

104

Total

$

16

$

8

$

95

$

281

68

Table of Contents

The credit quality and aging analysis of wholesale receivables was as follows:

2025

2024

Wholesale receivables:

  ​

  ​ ​ ​

Agriculture and turf:

Current

$

6,731

$

7,568

30+ days past due

Non-performing

1

Construction and forestry:

Current

1,524

1,358

30+ days past due

Non-performing

Total

$

8,255

$

8,927

Financing Receivables Allowance for Credit Losses

An analysis of the allowance for credit losses and investment in financing receivables follows:

Retail Notes

Revolving


& Financing

Charge

Wholesale


Leases


Accounts


Receivables

  ​ ​ ​Total   


2025


  ​ ​ ​ ​ ​ ​ ​ ​ ​ ​ ​ ​ ​ ​


Allowance:

Beginning of year balance

$

219

$

8

$

2

$

229

Provision

217

67

284

Write-offs


(202)


(110)


(312)

Recoveries


15


42


57

End of year balance*

$

249

$

7

$

2

$

258

Financing receivables:

End of year balance

$

38,608

$

4,801

$

8,255

$

51,664

2024


  ​ ​ ​ ​ ​ ​ ​ ​ ​ ​ ​ ​ ​ ​


Allowance:

Beginning of year balance

$

172

$

21

$

4

$

197

Provision

262

52

314

Provision reversal for assets held for sale

(38)

(38)

Provision subtotal


224


52


276

Write-offs


(186)


(95)


(281)

Recoveries


13


30


43

Translation adjustments


(4)


(2)


(6)

End of year balance*

$

219

$

8

$

2

$

229

Financing receivables:

End of year balance

$

39,680

$

4,654

$

8,927

$

53,261

2023

Allowance:

Beginning of year balance

$

299

$

22

$

4

$

325

Provision

97

22

119

Provision reversal for assets held for sale


(142)


(142)

Provision (credit) subtotal


(45)


22


(23)

Write-offs


(84)


(45)


(129)

Recoveries


21


22


43

Translation adjustments


(19)


(19)

End of year balance*

$

172

$

21

$

4

$

197

Financing receivables:

End of year balance

$

39,585

$

4,698

$

6,922

$

51,205

*    Individual allowances were not significant.

We monitor the economy as part of the allowance setting process, including potential impacts of the agricultural market business cycle, global trade policies, and interest rates. Adjustments to the allowance are incorporated, as necessary.

The allowance for credit losses on retail notes and financing lease receivables increased in 2025, primarily due to higher expected losses on agriculture and turf customer accounts as a result of elevated delinquencies and a decline in market conditions.

During 2024, the financial services business in Brazil met the held for sale criteria, therefore the receivables were reclassified to “Assets held for sale” and the associated allowance for credit losses was reversed. These operations were deconsolidated in the second quarter of 2025 (see Note 3). Excluding the impact of BJD, the allowance for credit losses on retail notes and financing lease receivables increased in 2024, primarily due to higher expected losses on agriculture customer accounts as a result of elevated delinquencies and a decline in market conditions, partially offset by a decrease in the allowance on revolving charge accounts due to write-offs of seasonal financing program accounts and future recoveries expected.

During 2023, the financial services business in Russia met the held for sale criteria. The financing receivables in Russia were reclassified to “Other assets” and the associated allowance for credit losses was reversed. These operations were sold in the second quarter of 2023 (see Note 3). Excluding the portfolio in Russia, the allowance increased in 2023, primarily driven by growth in the retail notes and financing lease portfolios and higher expected losses on turf and construction customer accounts.

Financing receivables analysis metrics follow:

2025

2024

Percent of financing receivables portfolio:

Past-due amounts

1.16%

1.20%

Non-performing

1.23%

1.01%

Allowance for credit losses

0.50%

0.43%

Deposits held as credit enhancements

$

134

$

142

Financing Receivables Modifications

We occasionally grant contractual modifications to customers experiencing financial difficulties. Before offering a modification, we evaluate the ability of the customer to meet the modified payment terms. Finance charges continue to accrue during the deferral or extension period except for modifications related to bankruptcy proceedings. Our allowance for credit losses incorporates historical loss information, including the effects of loan modifications with customers. Therefore, additional adjustments to the allowance are generally not recorded upon modification of a loan.

We continue to monitor the performance of financing receivables that are modified with borrowers experiencing financial difficulty.

69

Table of Contents

The ending amortized cost and performance of financing receivables modified in 2025 and 2024 were as follows:

2025

2024

Current


$

160

$

78

30-59 days past due

7

1

60-89 days past due

3

2

Non-performing

16

13

Total

$

186

$

94

Percent of financing receivables portfolio

0.36%

0.18%

Modifications offered include payment deferrals, term extensions, or a combination thereof. The weighted-average effects for contract modifications were as follows in months:

2025

2024

Payment deferral

7

8

Term extension

10

10

Combination modifications

Payment deferral

5

4

Term extension

8

7

Defaults and subsequent write-offs of loans modified in the prior twelve months were not significant during 2025 and 2024. At November 2, 2025, commitments to provide additional financing to these customers were $23.

Financing Receivables Troubled Debt Restructurings

Prior to adopting ASU 2022-02, modifications of loans to borrowers experiencing financial difficulty were considered troubled debt restructurings when the significant modification of the receivable resulted in a concession we would not otherwise consider.

The following table quantifies troubled debt restructurings:

  ​ ​ ​

2023

Number of receivable contracts

209

Pre-modification balance

$

10

Post modification balance

9

Troubled debt restructurings related to retail notes. In 2023, there were no significant troubled debt restructurings that subsequently defaulted and were written off.

Other Receivables

Other receivables at the end of 2025 and 2024 consisted of:


2025


2024


Taxes receivable

$

1,554

$

1,874


Collateral on derivatives

72

254

Receivables from unconsolidated affiliates

396

3

Other


381


414

Other receivables


$

2,403


$

2,545

12. SECURITIZATION OF FINANCING RECEIVABLES

Our funding strategy includes receivable securitizations, which allows us to receive cash for financing receivables immediately. While these securitization programs are administered in various forms, they are accomplished in the following basic steps:

1.We transfer financing receivables into a bankruptcy-remote special purpose entity (SPE).
2.The SPE issues debt to investors. The debt is secured by the financing receivables.
3.Investors are paid back based on cash receipts from the financing receivables.

As part of Step 1, these receivables are legally isolated from the claims of our general creditors. This ensures cash receipts from the financing receivables are accessible to pay back securitization program investors. The structure of these transactions does not meet the accounting criteria for a sale of receivables. As a result, they are accounted for as secured borrowings. The receivables and borrowings remain on our balance sheet and are separately reported as “Financing receivables securitized – net” and “Short-term securitization borrowings,” respectively. SPEs are consolidated as VIEs when we have the power to direct the activities that most significantly impact the SPEs’ economic performance and the obligation to absorb losses or the right to receive benefits that could potentially be significant to the SPEs.

We offer securitization programs to institutional investors and other financial institutions through public issuances or privately through a revolving credit agreement. At November 2, 2025, the revolving agreement had a financing limit of up to $2,500. At November 2, 2025, $1,563 of securitization borrowings were outstanding under the revolving agreement. In November 2025, the agreement was renewed for one year with a capacity of $2,500.

Restricted cash held by the SPE serves as a credit enhancement. It would be used to satisfy receivable payment deficiencies, if any. The cash restriction is removed either after all secured borrowing payments are made or proportionally as the secured receivables are collected and the borrowing obligations are reduced.

The components of securitization programs were as follows at the end of 2025 and 2024:


  ​ ​ ​2025    


  ​ ​ ​2024    


Financing receivables securitized (retail notes)

$

6,872

$

8,770


Allowance for credit losses


(41)


(47)

Other assets (primarily restricted cash)


171


187

Total restricted securitized assets


$

7,002


$

8,910

Short-term securitization borrowings

$

6,596

$

8,431

Accrued interest on borrowings


15


14

Total liabilities related to restricted securitized assets


$

6,611


$

8,445

The weighted-average interest rates on short-term securitization borrowings at November 2, 2025, and October 27, 2024, were 4.8% and 5.0%, respectively.

70

Table of Contents

Although these securitization borrowings are classified as short-term since payment is required if the financing receivables are liquidated early, the payment schedule for these borrowings at November 2, 2025, based on the expected liquidation of the retail notes is as follows: 2026 – $3,428, 2027 – $1,942, 2028 – $1,005, 2029 – $198, 2030 – $29, and later years – $3.

13. INVENTORIES

A majority of inventories owned by us are valued at cost on the “last-in, first-out” (LIFO) basis. If all inventories valued on a LIFO basis had been valued on a “first-in, first-out” (FIFO) basis, the estimated inventories by major classification would have been as follows at the end of 2025 and 2024:


2025


2024


Raw materials and supplies


$

3,402


$

3,486


Work-in-process


956


930

Finished goods and parts


5,769


5,364

Total FIFO value


10,127


9,780

Excess of FIFO over LIFO


2,721


2,687

Inventories


$

7,406


$

7,093

Percent valued on LIFO basis


53%

54%

14. PROPERTY AND DEPRECIATION

A summary of property and equipment at November 2, 2025, and October 27, 2024, follows:

Useful Lives*


(Years)


  ​ ​2025   


  ​ ​2024   


Land

$

464

$

390


Buildings and building equipment


22


5,679


5,168

Machinery and equipment


11


7,684


7,125

Dies, patterns, tools, etc.


8


1,995


1,797

All other


5


1,411


1,382

Construction in progress


1,187


1,313

Total at cost


18,420


17,175

Less: accumulated depreciation


(10,341)


(9,595)

Property and equipment net


$

8,079


$

7,580

*    Weighted-averages

Property and equipment depreciation during 2025, 2024, and 2023 was $934, $898, and $838, respectively.

Property and equipment by geographic location follows:


2025


2024

U.S.

$

4,198

$

4,132

Germany


1,435


1,271

Other countries


2,446


2,177

Total

$

8,079

$

7,580


15. GOODWILL AND OTHER INTANGIBLE ASSETS NET

The changes in amounts of goodwill by operating segments were as follows.

  ​

PPA

  ​

SAT

  ​

CF

  ​

  ​ ​Total   


October 29, 2023

$

702

$

363

$

2,835

$

3,900


Translation adjustments and other

(1)

2

58


59

October 27, 2024

701

365

2,893


3,959

Acquisitions (Note 3)

30

24

11

65

Translation adjustments and other

13

4

147


164

November 2, 2025

$

744

$

393

$

3,051

$

4,188

The components of other intangible assets were as follows:


 2025 

  ​

 2024 


Customer lists and relationships

$

482

$

508


Technology, patents, trademarks, and other


1,518


1,423

Total at cost


2,000


1,931

Less accumulated amortization:


Customer lists and relationships

(260)

(231)

Technology, patents, trademarks, and other

(848)

(701)

Total accumulated amortization

(1,108)

(932)

Other intangible assets net


$

892


$

999

Actual amortization expense for the past three years and the estimated amortization expense for the next five years follows:

Year

Amortization

2023

$

169

2024

166

2025

143

Estimated –

2026

140

2027

133

2028

97

2029

80

2030

72

16. OTHER ASSETS

Other assets at November 2, 2025, and October 27, 2024, consisted of the following:


2025


2024

Operating lease asset (Note 24)

$

317

$

274

Capitalized software, net

470


504

Investments in unconsolidated affiliates

510


122

Deferred charges (including prepaids)

417

412

Derivative assets (Note 26)

393

357

Prepaid taxes

259

238

Parts return asset

156

141

Restricted cash

257

193

Matured lease & repossessed inventory

102

106

Other

580

559

Other Assets

$

3,461

$

2,906

Capitalized software has an estimated useful life of three years. Amortization of these software costs in 2025, 2024, and 2023 was $227, $180, and $144, respectively.

71

Table of Contents

17. SHORT-TERM BORROWINGS

Short-term borrowings at the end of 2025 and 2024 consisted of:


2025


2024


Commercial paper


$

4,218


$

4,008


Notes payable to banks

651


377

Finance lease obligations due within one year

39

33

Long-term borrowings due within one year


8,888


9,115

Short-term borrowings

$

13,796

$

13,533

The weighted-average interest rates at the end of 2025 and 2024 were:

  ​ ​ ​

2025

  ​ ​ ​

2024


Short-term borrowings:

Commercial paper

  ​ ​ ​

4.1%

4.8%


Notes payable to banks

6.9%

11.0%

The decrease in the weighted-average interest rates of notes payable to banks is primarily the result of lower borrowing rates on funding in Argentina.

Worldwide lines of credit totaled $12.2 billion at November 2, 2025, consisting primarily of:

a 364-day credit facility agreement of $5.0 billion, expiring in the second quarter of 2026
a credit facility agreement of $3.25 billion, expiring in the second quarter of 2028
a credit facility agreement of $3.25 billion, expiring in the second quarter of 2030

At November 2, 2025, $7.3 billion of these worldwide lines of credit were unused. For the purpose of computing the unused credit lines, commercial paper and short-term bank borrowings were considered to constitute utilization. These credit agreements require Capital Corporation and other parts of our business to maintain certain performance metrics and liquidity targets. All requirements in the credit agreements have been met during the periods included in the consolidated financial statements.


18. ACCOUNTS PAYABLE AND ACCRUED EXPENSES

Accounts payable and accrued expenses at the end of 2025 and 2024 consisted of the following:

  ​

2025

  ​

2024


Accounts payable:

Trade payables

  ​

$

2,985

  ​

$

2,698


Dividends payable


443


405

Operating lease liabilities

314

270

Deposits withheld from dealers and merchants

143

152

Payables to unconsolidated affiliates

10

6

Other


191


204

Accrued expenses:

Employee benefits


1,577


1,925

Product warranties

1,259

1,426

Accrued taxes


1,155


1,509

Extended warranty premium


1,202


1,179

Dealer sales incentives

828

996

Unearned revenue (contractual liability)

837

744

Unearned operating lease revenue


534


495

Accrued interest

524

455

Derivative liabilities

389

582

Parts return liability

445

420

Other


1,073


1,077

Accounts payable and accrued expenses


$

13,909


$

14,543

Amounts are presented net of eliminations, which primarily consist of dealer sales incentives with a right of set-off against trade receivables of $1,892 at November 2, 2025, and $2,121 at October 27, 2024. Other eliminations were made for accrued taxes and other accrued expenses.


19. LONG-TERM BORROWINGS

Long-term borrowings at the end of 2025 and 2024 consisted of:

  ​

2025

  ​

2024


Underwritten term debt:

  ​ ​ ​ ​ ​ ​ ​ ​ ​ ​ ​ ​ ​ ​

  ​ ​ ​ ​ ​ ​ ​ ​ ​ ​ ​ ​ ​ ​

U.S. dollar notes and debentures:

6.55% debentures due 2028

$

200

$

200

5.375% notes due 2029


500


500

3.10% notes due 2030

700

700

8.10% debentures due 2030


250


250

4.15% notes due 2030*


498


7.125% notes due 2031


300


300

5.45% notes due 2035


1,250


3.90% notes due 2042


1,250


1,250

2.875% notes due 2049

500

500

3.75% notes due 2050

850

850

5.70% notes due 2055

750

Euro notes:

1.85% notes due 2028 (€600 principal)

694

650

2.20% notes due 2032 (€600 principal)

694

650

1.65% notes due 2039 (€650 principal)

752

704

Serial issuances:

Medium-term notes*


34,041

36,566

Other notes and finance lease obligations


470


265

Less: debt issuance costs and debt discounts

(155)

(156)

Long-term borrowings


$

43,544

$

43,229

*    Includes fair value hedge adjustments related to derivatives.

72

Table of Contents

The 4.15% notes due 2030 listed above were issued on October 9, 2025, by Deere Funding Canada Corporation (DFCC), an indirect wholly-owned subsidiary. These notes are fully and unconditionally guaranteed on a senior unsecured basis by Deere & Company and, therefore, rank equally with all our outstanding notes and debentures. DFCC financial results were not material to our consolidated financial statements or consolidated results of operations, and as a result, we have elected to exclude summarized financial information.

Medium-term notes due through 2034 are offered by prospectus and issued at fixed and variable rates. All outstanding notes and debentures are senior unsecured borrowings and rank equally with each other.

The principal balances and weighted-average interest rates of the 4.15% notes due 2030 and the medium-term notes at the end of 2025 and 2024 follow:

  ​

2025

  ​

2024


4.15% notes due 2030:

  ​ ​ ​ ​ ​ ​ ​ ​ ​ ​ ​ ​ ​ ​

  ​ ​ ​ ​ ​ ​ ​ ​ ​ ​ ​ ​ ​ ​

Principal

$

500

Weighted-average interest rate

3.4%

Medium-term notes:

  ​ ​ ​ ​ ​ ​ ​ ​ ​ ​ ​ ​ ​ ​

  ​ ​ ​ ​ ​ ​ ​ ​ ​ ​ ​ ​ ​ ​

Principal

34,241

$

37,141

Weighted-average interest rates

4.8%

5.2%

The principal amounts of our long-term borrowings maturing in each of the next five years are as follows: 2026 – $8,921, 2027 – $8,935, 2028 – $9,220, 2029 – $6,556, and 2030 – $4,615. 

20. COMMITMENTS AND CONTINGENCIES

A standard warranty is provided as assurance that the equipment will function as intended. The standard warranty period varies by product and region. At the time a sale is recognized, we record an estimate of future warranty costs based on historical claims rate experience and estimated population under warranty. The reconciliation of the changes in the warranty liability follows:


  ​ ​ ​2025    


  ​ ​ ​2024    


Beginning of year balance


$

1,426


$

1,610


Warranty claims paid


(1,330)


(1,327)

New product warranty accruals


1,148


1,157

Foreign exchange


15


(14)

End of year balance


$

1,259


$

1,426

The costs for extended warranty programs are recognized as incurred. See Note 9 for extended warranty claim costs.

In certain international markets, we provide guarantees to banks for the retail financing of John Deere equipment. At the end of 2025, the notional value of these guarantees was $135. We may repossess the equipment collateralizing the receivables. At November 2, 2025, the accrued losses under these agreements were not material. We also had guarantees to a VIE (see Note 1) totaling $157 at the end of 2025.

We also had other miscellaneous contingent liabilities and guarantees totaling approximately $100 at November 2, 2025. The accrued liability for these contingencies was $25 at November 2, 2025.

At November 2, 2025, we had commitments of approximately $415 for the construction and acquisition of property and equipment. Also, at November 2, 2025, we had restricted assets of $323, classified as “Other assets,” which includes restricted cash.

We have commitments to extend credit to customers. The commitments are in the form of lines of credit and other pre-approved credit arrangements. We have the right to cancel or amend the terms of these commitments at any time. These commitments are not expected to be fully drawn upon; therefore, the total commitment amounts likely do not represent a future cash requirement. The commitments to extend credit at November 2, 2025, were:

$13.3 billion to John Deere dealers
$34.2 billion to retail customers

We are subject to various unresolved legal actions. The total accrued losses on unresolved legal matters were approximately $175 as of November 2, 2025 (see Note 4 “Litigation Accrual” item). The accrual is based on management’s best estimate of probable losses as the outcome of litigation is inherently uncertain. We believe the reasonably possible range of losses in excess of the recorded accruals for these unresolved legal actions would not have a material effect on our consolidated financial statements. The most prevalent legal claims relate to:

antitrust matters (including class action litigation)
product liability (including asbestos-related liability)
employment
patent
trademark

21. CAPITAL STOCK AND NET INCOME PER SHARE

The number of common shares we are authorized to issue is 1.2 billion. The common shares issued at November 2, 2025, October 27, 2024, and October 29, 2023, were 536.4 million. 270.4 million common shares were outstanding at November 2, 2025, with the remainder held in treasury stock.

The number of authorized preferred shares is 9 million. No preferred shares have been issued.

In December 2022, the Board of Directors authorized the repurchase of up to $18.0 billion of common stock. At the end of fiscal year 2025, this repurchase program had $7.9 billion (17.1 million shares based on our fiscal year-end closing NYSE common stock price of $461.63 per share) remaining to be repurchased. Repurchases of our common stock under this plan are made from time to time, at our discretion, and may be made in the open market or in private transactions, under accelerated share repurchase plans or programs pursuant to agreements with third-party financial institutions.

73

Table of Contents

A reconciliation of basic and diluted net income per share attributable to Deere & Company follows in millions, except per share amounts:


2025


2024


2023


Net income attributable to Deere & Company


$

5,027


$

7,100


$

10,166

Average shares outstanding


270.9


276.0


292.2

Basic per share


$

18.55


$

25.73


$

34.80

Average shares outstanding


270.9


276.0


292.2

Effect of dilutive stock options and unvested restricted stock units


.8


1.1


1.4

Total potential shares outstanding


271.7


277.1


293.6

Diluted per share


$

18.50


$

25.62


$

34.63

Shares excluded as antidilutive


.2


.3


.1

Diluted net income per share reflects the potential dilution that could occur from share-based compensation. The effect of dilutive shares is calculated using the treasury stock method. Potentially dilutive shares are excluded from the calculation if they have an anti-dilutive effect in the period.

22. SHARE-BASED COMPENSATION

We grant restricted stock units (RSU) and stock options (collectively, equity incentive awards) to certain employees. RSUs are also granted to nonemployee directors for their services as directors. RSUs consist of service-based, performance/service-based, and market/service-based awards.

The Long-Term Incentive Cash granted to certain employees is accounted for as share-based compensation. This incentive includes a performance metric based, in part, on the price of our shares.

We are authorized to grant shares for equity incentive awards. The outstanding shares authorized were 13.7 million at November 2, 2025. We currently use shares that have been repurchased through our stock repurchase program to satisfy share option exercises and RSU conversions. The stock awards vesting periods and the dividend equivalents earned during the vesting period follow:

Vesting

Dividend

Period

Equivalents

Stock options

1-3 years

Not included

Service-based RSUs

1-3 years

Included

Performance/service-based RSUs

3 years

Not included

Market/service-based RSUs

3 years

Not included

Stock options expire ten years from the grant date. Performance/service-based awards are subject to a performance metric based on our compound annual revenue growth rate, compared to a benchmark group of companies. Market/service-based awards are subject to a market related metric based on total shareholder return, compared to a benchmark group of companies. The performance/service-based units and market/service-based units award common stock in a range of zero to 200% for each unit granted based on the level of the metric achieved.

The fair value of stock options and RSUs is determined using our closing price on the grant date. The fair value of the

market/service-based RSUs is determined using a Monte Carlo model. Awards are expensed over the shorter of the award vesting period or the employee’s retirement eligibility period. The performance/service-based units’ expense is adjusted quarterly for the probable number of shares to be awarded. We recognize the effect of award forfeitures as an adjustment to compensation expense in the period the forfeiture occurs.

The assumptions used in determining the fair value of the market/service-based RSUs granted in 2025 and 2024 using the Monte Carlo valuation model follow:

2025

2024

Expected volatility of the Company's stock

28.22%

27.93%

Risk-free interest rate

4.05%

4.17%

The total share-based compensation expense, recognized income tax benefits, and total grant-date fair values of stock options and restricted stock units vested consisted of the following:

2025

2024

2023

Share-based compensation expense

$

151

$

208

$

130

Income tax benefits

34

34

21

Stock options and restricted stock units vested

174

110

84

At November 2, 2025, there was $89 of total unrecognized compensation cost from share-based compensation arrangements. This compensation is expected to be recognized over a weighted-average period of approximately 1.75 years.

Stock Options

The fair value of each stock option award was estimated on the date of grant using a binomial lattice option valuation model. The assumptions used for the binomial lattice model to determine the fair value of options follow:


2025


2024


2023


Risk-free interest rate*


4.09%


3.96%


2.68%

Expected dividends

1.4%

1.6%

1.1%

Volatility*

26.0%

27.0%

33.0%

Expected term (in years)*


5.2


5.1


5.1

*    Weighted-averages

The risk-free interest rates are based on U.S. Treasury security yields at the time of grant. Expected volatilities are based on implied volatilities from traded call options on our stock. We use historical data to estimate option exercise behavior representing the weighted-average period that options granted are expected to be outstanding.

74

Table of Contents

The activity for outstanding stock options at November 2, 2025, and changes during 2025 follow:

  ​

Remaining

Aggregate


Exercise

Contractual

Intrinsic


Shares

Price*

Term

Value


(thousands)


(per share)


(years)


(millions)


Outstanding at beginning of year


1,476

$

242.41

Granted


169


448.18

Exercised


(530)


145.40

Forfeited


(3)


428.60

Outstanding at end of year


1,112


319.44


5.75


$

158.1

Exercisable at end of year


789


277.80


4.50


145.1

*    Weighted-averages

The amounts related to stock options were as follows in millions of U.S. dollars unless otherwise noted:

2025

2024

2023

Weighted-average grant date fair value (per share)

$

116.35

$

98.04

$

136.46

Intrinsic value of options exercised

165

125

153

Cash received from exercises

77

44

60

Tax benefit from exercises

35

27

34

Restricted Stock Units

The weighted-average grant date fair values were as follows:

2025

2024

2023

Service-based

$

448.69

$

377.72

$

428.35

Performance/service-based

429.77

360.53

424.93

Market/service-based

591.13

370.87

Our nonvested RSUs at November 2, 2025, and changes during 2025 follow:

Grant-Date


Shares

(thousands)

Fair Value*

(per share)


Service-based:

Nonvested at beginning of year


471

$

378.39

Granted


308


448.69

Vested


(351)


389.61

Forfeited

(15)

418.74

Nonvested at end of year


413


419.87

Performance/service-based:

Nonvested at beginning of year


126


373.35

Granted


40


429.77

Vested


(26)


331.47

Performance change


(9)


331.47

Forfeited


(1)


401.55

Nonvested at end of year


130


401.48

Market/service-based:

Nonvested at beginning of year


51


370.87

Granted


40


591.13

Forfeited


(1)


501.36

Nonvested at end of year


90


467.46

*    Weighted-averages

23. OTHER COMPREHENSIVE INCOME ITEMS

The after-tax components of accumulated other comprehensive income (loss) follow:

2025

2024

2023

Retirement benefits adjustment

$

(1,182)

$

(1,274)

$

(845)

Cumulative translation adjustment

(1,753)

(2,286)

(2,151)

Unrealized loss on derivatives

(54)

(72)

(8)

Unrealized loss on debt securities

(43)

(74)

(110)

Accumulated other comprehensive income (loss)

$

(3,032)

$

(3,706)

$

(3,114)

The following tables reflect amounts recorded in other comprehensive income (loss), as well as reclassifications out of other comprehensive income (loss).

Before

Tax

After


Tax

(Expense)

Tax


Amount


Credit


Amount


2025

Cumulative translation adjustment


$

539

$

(6)

$

533

Unrealized gain (loss) on derivatives:

Unrealized hedging gain (loss)


1


1

Reclassification of realized (gain) loss to Interest expense

21


(4)

17

Net unrealized gain (loss) on derivatives


22


(4)


18

Unrealized gain (loss) on debt securities:

Unrealized holding gain (loss)


39


(10)


29

Reclassification of realized (gain) loss to Other income

3


(1)


2

Net unrealized gain (loss) on debt securities


42


(11)


31

Retirement benefits adjustment:

Net actuarial gain (loss)


120


(35)


85

Reclassification to Other operating expenses through amortization of:

Actuarial (gain) loss


(50)


11


(39)

Prior service (credit) cost


35


(8)


27

Settlements/curtailment


25


(6)


19

Net unrealized gain (loss) on retirement benefits adjustment


130


(38)


92

Total other comprehensive income (loss)


$

733


$

(59)


$

674

75

Table of Contents

Before

Tax

After


Tax

(Expense)

Tax


Amount


Credit


Amount


2024


Cumulative translation adjustment

$

(147)

$

12

$

(135)

Unrealized gain (loss) on derivatives:

Unrealized hedging gain (loss)


(10)

2


(8)

Reclassification of realized (gain) loss to Interest expense

(71)


15

(56)

Net unrealized gain (loss) on derivatives


(81)


17


(64)

Unrealized gain (loss) on debt securities:

Unrealized holding gain (loss)


45


(8)


37

Reclassification of realized (gain) loss to Other income

(1)


(1)

Net unrealized gain (loss) on debt securities


44


(8)


36

Retirement benefits adjustment:

Net actuarial gain (loss)


(568)


136


(432)

Reclassification to Other operating expenses through amortization of:

Actuarial (gain) loss


(72)


19


(53)

Prior service (credit) cost


36


(9)


27

Settlements/curtailments


38


(9)


29

Net unrealized gain (loss) on retirement benefits adjustment


(566)


137


(429)

Total other comprehensive income (loss)


$

(750)


$

158


$

(592)

Before

Tax

After


Tax

(Expense)

Tax


Amount


Credit


Amount


2023

Cumulative translation adjustment:


Unrealized translation gain (loss)

$

424

$

(2)

$

422

Reclassification of realized (gain) loss to:

Selling, administrative and general expenses

10

10

Other operating expenses

11

11

Net unrealized translation gain (loss)

445

(2)

443

Unrealized gain (loss) on derivatives:

Unrealized hedging gain (loss)


25

(5)


20

Reclassification of realized (gain) loss to Interest expense

(62)

13

(49)

Net unrealized gain (loss) on derivatives


(37)


8


(29)

Unrealized gain (loss) on debt securities:

Unrealized holding gain (loss)


(20)


4


(16)

Net unrealized gain (loss) on debt securities


(20)


4


(16)

Retirement benefits adjustment:

Net actuarial gain (loss)


(589)


139


(450)

Reclassification to Other operating expenses through amortization of:

Actuarial (gain) loss


(81)


20


(61)

Prior service (credit) cost


37


(9)


28

Settlements


37


(10)


27

Net unrealized gain (loss) on retirement benefits adjustment


(596)


140


(456)

Total other comprehensive income (loss)


$

(208)


$

150


$

(58)

24. LEASES

We are both a lessee and a lessor. We lease for our own use warehouse facilities, office space, production equipment, information technology equipment, and vehicles. The financial services operations lease equipment produced or sold by us and a limited amount of other equipment to retail customers. We determine if an arrangement is or contains a lease at the contract inception.

Lessee

The amounts of the lease liability and right of use asset are determined at lease commencement and are based on the present value of the lease payments over the lease term. The lease payments are discounted using our incremental borrowing rate since the rate implicit in the lease is not readily determinable. We determine the incremental borrowing rate for each lease based on the lease term and the economic environment of the country where the asset will be used, adjusted as if the borrowings were collateralized. Leases with contractual periods greater than one year and that do not meet the finance lease criteria are classified as operating leases.

We have elected to combine lease and nonlease components, such as maintenance and utilities costs included in a lease contract, for all asset classes. Leases with an initial term of one year or less are expensed on a straight-line basis over the lease term and recorded in short-term lease expense. Variable lease expense includes warehouse facilities leases with payments based on utilization exceeding contractual minimum amounts and leases with payments indexed to inflation when the index changes after lease commencement.

The lease expense by type consisted of the following:

2025

2024

2023

Operating lease expense

$

144

$

133

$

129

Short-term lease expense

29

38

49

Variable lease expense

65

72

80

Finance lease:

Depreciation expense

40

34

28

Interest on lease liabilities

5

4

2

Total lease expense

$

283

$

281

$

288

Operating and finance lease right of use assets and lease liabilities follow:

2025

2024

Operating leases:

Other assets

$

317

$

274

Accounts payable and accrued expenses

314

270

Finance leases:

Property and equipment — net

$

96

$

89

Short-term borrowings

39

33

Long-term borrowings

73

72

Total finance lease liabilities

$

112

$

105

76

Table of Contents

The weighted-average remaining lease terms in years and discount rates follow:

2025

2024

Weighted-average remaining lease terms:

Operating leases

6

7

Finance leases

4

4

Weighted-average discount rates:

Operating leases

4.2%

3.5%

Finance leases

4.3%

4.3%

Lease payment amounts in each of the next five years at November 2, 2025, follow:

Operating

Finance

Due in:

Leases

Leases

2026

$

110

$

44

2027

72

32

2028

57

22

2029

41

12

2030

28

5

Later years

37

6

Total lease payments

345

121

Less: imputed interest

(31)

(9)

Total lease liabilities

$

314

$

112

Cash paid for amounts included in the measurement of lease liabilities follows:

2025

2024

2023

Operating cash flows for operating leases

$

138

$

129

$

132

Operating cash flows for finance leases

5

4

2

Financing cash flows for finance leases

40

36

31

Right of use assets obtained in exchange for lease liabilities follow:

2025

2024

Operating leases

$

168

$

75

Finance leases

47

67

Lessor

We lease equipment manufactured or sold by us through John Deere Financial. Sales-type and direct financing leases are reported in “Financing receivables net.” Operating leases are reported in “Equipment on operating leases net.”

At the end of the majority of leases, the lessee has the option to purchase the underlying equipment for the contractual residual value or return it to the dealer. If the equipment is returned to the dealer, the dealer also has the option to purchase the equipment or return it to us for remarketing.

We estimate the residual values for operating leases at lease inception based on several factors, including lease term, expected hours of usage, historical wholesale sale prices, return experience, intended use of the equipment, market dynamics and trends, and dealer residual guarantees. We review residual value estimates during the lease term and test the carrying value of our operating lease assets for impairment when events or circumstances necessitate. The depreciation is adjusted on a straight-line basis over the remaining lease term if residual value estimates change.

Lease agreements include usage limits and specifications on machine condition, which allow us to assess lessees for excess use or damages to the underlying equipment.

We have elected to combine lease and nonlease components. The nonlease components relate to preventative maintenance and extended warranty agreements financed by the retail customer. We have also elected to report consideration related to sales and value added taxes net of the related tax expense. Property taxes on leased assets are recorded on a gross basis in “Finance and interest income” and “Other operating expenses.” Variable lease revenues relate to property taxes on leased assets in certain markets and late fees.

Lease revenues earned by us follow:

2025

2024

2023

Sales-type and direct finance lease revenues

$

184

$

190

$

165

Operating lease revenues

1,472

1,403

1,312

Variable lease revenues

20

17

16

Total lease revenues

$

1,676

$

1,610

$

1,493

At the time of accepting a lease that qualifies as a sales-type or direct financing lease, we record the gross amount of lease payments receivable, estimated residual value of the leased equipment, and unearned finance income. The unearned finance income is recognized as revenue over the lease term using the interest method.

Sales-type and direct financing lease receivables by market follow:

2025

2024

Agriculture and turf

$

1,020

$

1,022

Construction and forestry

996

1,034

Total

2,016

2,056

Guaranteed residual values

867

921

Unguaranteed residual values

40

55

Less: unearned finance income

(330)

(307)

Financing lease receivables

$

2,593

$

2,725

Scheduled payments, including guaranteed residual values, on sales-type and direct financing lease receivables at November 2, 2025, follow:

Due in:

2025

2026

$

1,385

2027

628

2028

424

2029

230

2030

176

Later years

40

Total

$

2,883

Lease payments from operating leases are recorded as income on a straight-line method over the lease terms. Operating lease assets are recorded at cost and depreciated to their estimated residual value on a straight-line method over the terms of the leases. The corresponding depreciation expense was $925 in 2025, $874 in 2024, and $853 in 2023.

77

Table of Contents

The cost of equipment on operating leases by market and residual values follows:

2025

2024

Agriculture and turf

$

8,177

$

7,875

Construction and forestry

1,093

1,142

Total

9,270

9,017

Less: accumulated depreciation

(1,670)

(1,566)

Equipment on operating leases net

$

7,600

$

7,451

Operating lease residual values

$

5,339

$

5,227

First-loss residual value guarantees

1,443

1,393

Lease payments for operating leases are scheduled as follows:

Due in:

2025

2026

$

1,155

2027

867

2028

527

2029

255

2030

62

Later years

7

Total

$

2,873

25. FAIR VALUE MEASUREMENTS

Fair value is defined as the price that would be received to sell an asset or paid to transfer a liability in an orderly transaction between market participants at the measurement date. To determine fair value, we use various methods including market and income approaches. We utilize valuation models and techniques that maximize the use of observable inputs. The models are industry-standard models that consider various assumptions including time values and yield curves as well as other economic measures. These valuation techniques are consistently applied.

Level 1 measurements consist of quoted prices in active markets for identical assets or liabilities. Level 2 measurements include significant other observable inputs such as quoted prices for similar assets or liabilities in active markets; identical assets or liabilities in inactive markets; observable inputs such as interest rates and yield curves; and other market-corroborated inputs. Level 3 measurements include significant unobservable inputs.

Fair values of the financing receivables and receivables from unconsolidated affiliates that were issued long-term were based on the discounted values of their related cash flows at interest rates currently being offered by us for similar financing receivables or at current market interest rates. The fair values of the remaining receivables approximated the carrying amounts.

Fair values of long-term borrowings and short-term securitization borrowings were based on current market quotes for identical or similar borrowings and credit risk, or on the discounted values of their related cash flows at current market interest rates. Certain long-term borrowings have been swapped to current variable interest rates. The carrying values of these long-term borrowings include adjustments related to fair value hedges.

The fair values of financial instruments that do not approximate the carrying values at November 2, 2025, and October 27, 2024, follow:

2025

2024

Carrying

  ​ ​ ​ ​Fair     

Carrying

  ​ ​ ​ ​Fair     


Value


Value*


Value


Value*


Financing receivables – net

$

44,575

$

44,779

$

44,309

$

44,336

Financing receivables securitized – net

6,831

6,855

8,723

8,654

Receivables from unconsolidated affiliates


392


400


Short-term securitization borrowings

6,596

6,631

8,431

8,453

Long-term borrowings due within one year**


8,888


8,911


9,115


9,079

Long-term borrowings**


43,471


43,527


43,157


42,804

*    Fair value measurements were Level 3 for receivables and Level 2 for all borrowings.

**  Values exclude finance lease liabilities that are presented as borrowings (see Note 24).

Assets and liabilities measured at November 2, 2025, and October 27, 2024, at fair value on a recurring basis follow, excluding items which were carried at a cost that approximates fair value, consisting of our cash equivalents, money market funds and time deposits, and held-to-maturity debt securities (see Note 10):

  ​ ​ ​

2025

  ​ ​ ​

2024


Level 1:

Marketable securities

U.S. government debt securities

$

196

$

239

Total Level 1 marketable securities

196

239

Level 2:

Marketable securities

International fixed income fund


7


Corporate debt securities


510


423

International debt securities

174

143

Mortgage-backed securities*


234


165

Municipal debt securities


113


74

U.S. government debt securities

117

110

Total Level 2 marketable securities


1,155


915

Other assets – Derivatives

393

357

Accounts payable and accrued expenses – Derivatives

389

582

Level 3:

Accounts payable and accrued expenses – Deferred consideration

113

147

*    Primarily issued by U.S. government sponsored enterprises.

78

Table of Contents

Fair value, nonrecurring Level 3 measurements from impairments and other adjustments at November 2, 2025, and October 27, 2024, follow:

Fair Value

Losses (Gains)

  ​

2025

  ​

2024

  ​

 2025

  ​

2024

  ​

2023

Property and equipment – net


$

1


$

8


Other intangible assets – net

3

53


Other assets


8

$

23


12

$

28

Assets held for sale

2,944

(32)

97

The following is a description of the valuation methodologies we use to measure certain financial instruments on the balance sheets at fair value. For more information on asset impairments, see Notes 3 and 4.

Marketable securities – The portfolio of investments is valued on a market approach (matrix pricing model) in which all significant inputs are observable or can be derived from or corroborated by observable market data such as interest rates, yield curves, volatilities, credit risk, and prepayment speeds. Funds are valued using the fund’s net asset value, based on the fair value of the underlying securities.

Derivatives Our derivative financial instruments consist of interest rate contracts (swaps), foreign currency exchange contracts (futures, forwards, and swaps), and cross-currency interest rate contracts (swaps). The portfolio is valued based on an income approach (discounted cash flow) using market observable inputs, including swap curves and both forward and spot exchange rates for currencies.

Deferred consideration – The total purchase price consideration for three former Deere-Hitachi joint venture factories acquired in 2022 included supply agreement price increases beyond inflation adjustments. This deferred consideration will be paid as we purchase Deere-branded excavators, components, and service parts from Hitachi under the agreement with a duration that ranges from 5 to 30 years after the acquisition date. The deferred consideration balance is reduced as purchases are made and valued on a discounted cash flow approach using market rates.

Property and equipment – net – The valuations were based on the cost approach. The inputs include reproduction cost estimates adjusted for physical deterioration and functional obsolescence (see Note 4).

Other intangible assets – net – The impairment of customer relationships and tradename of our external overseas battery operations was measured using an income approach (see Note 4).

Other assets (Investments in unconsolidated affiliates) – Other than temporary impairments of investments are measured as the difference between the implied fair value and the carrying value of the investments. The estimated fair value for privately held entities is determined by an income approach (discounted cash flows), which includes inputs such as interest rates and margins (see Note 4).

Assets held for sale The disposal group was measured at the lower of the carrying amount or fair value less costs to sell. Fair value was based on the probable sale price. The inputs included estimates of the final sale price (see Note 4). The gain recorded in 2025 represents a reversal of the prior period valuation allowance, not in excess of the cumulative valuation allowance recorded on “Assets held for sale.”


26. DERIVATIVE INSTRUMENTS

Fair values of our derivative instruments and the associated notional amounts at the end of 2025 and 2024 are presented below. Assets are recorded in “Other assets,” while liabilities are recorded in “Accounts payable and accrued expenses.”

Fair Value

Notional

Assets

Liabilities

2025

Cash flow hedges:


  ​ ​ ​

  ​

  ​

  ​

Interest rate contracts


$

2,675

$

21


Fair value hedges:

Interest rate contracts

11,465

$

160

228

Cross-currency interest rate contracts

2,058

91

11


Net investment hedges:

Cross-currency interest rate contracts

1,131

9

Not designated as hedging instruments:

Interest rate contracts

14,084

94

81

Foreign exchange contracts

7,372

46

33

Cross-currency interest rate contracts

132

2

6

2024

Cash flow hedges:


  ​ ​ ​

  ​

  ​

  ​

Interest rate contracts


$

2,875

$

3

$

20


Fair value hedges:

Interest rate contracts

15,864

115

467

Cross-currency interest rate contracts

975

31


Not designated as hedging instruments:

Interest rate contracts

12,518

97

75

Foreign exchange contracts

7,533

95

20

Cross-currency interest rate contracts

158

16

79

Table of Contents

The amounts recorded in the consolidated balance sheets at November 2, 2025, and October 27, 2024, related to borrowings and fair value hedges are presented in the table below. Fair value hedging adjustments are included in the carrying amount of hedged items.

Carrying

Cumulative

Amount of

Fair Value

Hedged

Hedging

Items

Amounts

2025

Short-term borrowings

$

2,998

$

(30)

Long-term borrowings

25,013

(203)

2024

Short-term borrowings

$

2,069

$

6

Long-term borrowings

24,751

(575)

The table above includes carrying amounts of short-term borrowings of $2,544 and $1,782 and of long-term borrowings of $11,963 and $8,626 at November 2, 2025, and October 27, 2024, respectively, for hedged items that are in discontinued hedge relationships. Also included are cumulative fair value hedging amounts on discontinued hedge relationships of short-term borrowings of $(30) and $7 and of long-term borrowings of $(185) and $(228) at November 2, 2025, and October 27, 2024, respectively. At October 27, 2024, long-term borrowings with a carrying amount of $598 were in both active and discontinued hedging relationships as a result of hedging activities associated with reference rate reform.

The classification and gains (losses), including accrued interest expense, related to derivative instruments on the statements of consolidated income consisted of the following:

  ​

  ​2025  

  ​

  ​2024  

  ​

  ​2023  


Fair value hedges

Interest rate contracts – Interest expense


$

103


$

226


$

(542)

Cash flow hedges

Recognized in OCI:

Interest rate contracts – OCI (pretax)

$

1

$

(10)

$

25

Reclassified from OCI:

Interest rate contracts – Interest expense


(21)


71


62

Net investment hedges

Interest rate contracts – Interest expense

$

10

Recognized in OCI:

Interest rate contracts – OCI (pretax)

(9)

Not designated as hedges

Interest rate contracts – Net sales

$

1

Interest rate contracts – Interest expense


$

(11)


$

(4)


40

Foreign exchange contracts – Net sales

(6)

(2)

(6)

Foreign exchange contracts – Cost of sales


(5)


10


8

Foreign exchange contracts – Other operating expenses


147


(135)


100

Total not designated


$

125


$

(131)


$

143

The amount of loss recorded in OCI at November 2, 2025, that is expected to be reclassified to “Interest expense” in the next twelve months if interest rates remain unchanged is $9 after-tax. There

were no gains or losses reclassified from OCI to earnings based on the probability that the original forecasted transaction would not occur.

Counterparty Risk and Collateral

Derivative instruments are subject to significant concentrations of credit risk to the banking sector. We manage individual counterparty exposure by setting limits that consider the credit rating of the counterparty, the credit default swap spread of the counterparty, and other financial commitments and exposures between us and the counterparty banks. All interest rate derivatives are transacted under International Swaps and Derivatives Association (ISDA) documentation. Some of these agreements include credit support provisions. Each master agreement permits the net settlement of amounts owed in the event of default or termination.

Certain of our derivative agreements contain credit support provisions that may require us to post collateral based on the size of the net liability positions and credit ratings. The aggregate fair value of all derivatives with credit-risk-related contingent features that were in a net liability position at November 2, 2025, and October 27, 2024, was $356 and $562, respectively. In accordance with the limits established in these agreements, we posted $62 and $245 of cash collateral at November 2, 2025, and October 27, 2024, respectively. In addition, we paid $8 of collateral that was outstanding at both November 2, 2025, and October 27, 2024, to participate in an international futures market to hedge currency exposure, not included in the following table.

Derivatives are recorded without offsetting for netting arrangements or collateral. The impact on the derivative assets and liabilities related to netting arrangements and collateral at November 2, 2025, and October 27, 2024, follows:

Gross Amounts

Netting

Net

  ​

Recognized

  ​

 Arrangements 

  ​

Collateral

  ​

Amount


2025

Assets


$

393


$

(202)


$

191

Liabilities


389


(202)

$

(64)

123

2024

Assets


$

357


$

(142)


$

215

Liabilities


582


(142)

$

(246)

194


80

Table of Contents

27. SEGMENT DATA

Our operations are organized and reported in four business segments: Production & Precision Agriculture, Small Agriculture & Turf, Construction & Forestry, and Financial Services. This presentation is consistent with how the chief operating decision maker, our Chief Executive Officer (CEO), who also serves as the Chairman of the Board, assesses the performance of the segments and makes decisions regarding resource allocations. Each segment has a group president responsible for managing financial performance and executing strategic initiatives.

Production & Precision Agriculture – PPA segment defines, develops, and delivers global equipment and technology solutions to unlock customer value for production-scale growers of large grains, small grains, cotton, and sugarcane. The segment’s primary products include four-wheel-drive (4WD), track, and row crop tractors; harvesters; cotton pickers and strippers; sugarcane harvesters and loaders; soil preparation, tillage, seeding, application, crop care equipment; and related attachments and service parts.
Small Agriculture & Turf – SAT segment defines, develops, and delivers global equipment and technology solutions to unlock customer value for dairy and livestock producers, high-value and small acreage crop producers, and turf and utility customers. The segment’s primary products include specialty, utility, and compact tractors; as well as self-propelled forage harvesters and attachments; hay and forage equipment; rotary mowers; utility vehicles; riding and commercial lawn equipment; golf course equipment; utility vehicles; and related attachments and service parts.
Construction & Forestry – CF segment defines, develops, and delivers a broad range of machines and technology solutions organized along the earthmoving, forestry, and roadbuilding production systems. The segment’s primary products include backhoe loaders, crawler dozers and loaders, four-wheel-drive and compact wheel loaders, excavators, skid-steer loaders, motor graders, milling machines, pavers, rollers, log harvesters, and related attachments and service parts.

The products and services produced by the segments above are primarily marketed through independent retail dealer networks and major retail outlets. For roadbuilding products in certain markets outside the U.S. and Canada, the products are sold through company-owned sales and service subsidiaries.

Financial Services – FS segment finances sales and leases by John Deere dealers of new and used production and precision agriculture equipment, small agriculture and turf equipment, and construction and forestry equipment. In addition, the FS segment provides wholesale financing to dealers of the foregoing equipment, finances retail revolving charge accounts, and offers extended equipment warranties.

The CEO evaluates the performance of the business segments based on operating profit, which for FS includes interest income and expense, and on identifiable segment operating assets. Segment operating profit and operating assets are measured using

accounting policies consistent with those applied in the consolidated financial statements. Because of integrated manufacturing operations and common administrative and marketing support, a substantial number of allocations must be made to determine operating segment data. Intersegment transactions are primarily made between the FS segment and PPA, SAT, and CF segments, and are recognized at current market prices. See Notes 5 and 14 for geographic information.

Total identifiable assets assigned to the equipment operations operating segments are those the segments actively manage, consisting of trade receivables, inventories, property and equipment, intangible assets, and certain other assets. Corporate assets are managed on a consolidated basis, including cash and cash equivalents, retirement benefit net assets, goodwill, and deferred income tax assets. Financial services assets include cash and cash equivalents, retirement benefits, and deferred income tax assets that are managed by the segment.

Segment operating profit and identifiable operating assets are the key metrics used by the CEO to monitor results against forecast and prior period results, and to determine variable compensation for employees at all levels. To manage operations and allocate human and capital resources, the CEO receives monthly reports including sales and revenues, operating profit, and assets by operating segment. Interest income and expenses are significant to the FS operations.

Information relating to operations by operating segment follows for the years ended November 2, 2025, October 27, 2024, and October 29, 2023.


PPA


SAT


CF


FS


Total


2025


External net sales

$

17,311

$

10,224

$

11,382

$

38,917

External finance and interest income

43

45

12

$

5,351

5,451

External other income


211


133


192


470


1,006

Intersegment income


188

30

56


468


742

Total segment net sales and revenues


17,753


10,432


11,642


6,289


46,116

Cost of sales

(11,919)

(7,422)

(8,849)

(28,190)

Interest expense

(2,923)

(2,923)

Other segment items1

(3,163)

(1,803)

(1,765)

(2,252)

(8,983)

Segment operating profit

$

2,671

$

1,207

$

1,028

$

1,114

$

6,020

2024

External net sales

$

20,834

$

10,969

$

12,956

$

44,759

External finance and interest income

46

42

14

$

5,392

5,494

External other income


329


173


238


390


1,130

Intersegment income


171

31

(2)


711


911

Total segment net sales and revenues


21,380


11,215


13,206


6,493


52,294

Cost of sales

(13,621)

(7,753)

(9,429)

(30,803)

Interest expense

(3,182)

(3,182)

Other segment items1

(3,245)

(1,835)

(1,768)

(2,422)

(9,270)

Segment operating profit

$

4,514

$

1,627

$

2,009

$

889

$

9,039

81

Table of Contents


PPA

SAT

CF

FS

Total

2023

External net sales

$

26,790

$

13,980

$

14,795

$

55,565

External finance and interest income

28

35

12

$

4,366

4,441

External other income


302


169


175


355


1,001

Intersegment income


169

41

3


833


1,046

Total segment net sales and revenues


27,289


14,225


14,985


5,554


62,053

Cost of sales

(17,143)

(9,976)

(10,620)

(37,739)

Interest expense

(2,362)

(2,362)

Other segment items1

(3,150)

(1,777)

(1,670)

(2,397)

(8,994)

Segment operating profit

$

6,996

$

2,472

$

2,695

$

795

$

12,958

1 Other segment items for PPA, SAT, and CF include selling, administrative and general expenses; advertising; engineering; research and development; certain special items (see Note 4); equity in income (loss) of unconsolidated affiliates; and other miscellaneous operating expenses. Financial Services other segment items include the effect of its selling, administrative and general expenses; foreign exchange gains and losses; equity in income (loss) of unconsolidated affiliates; and other miscellaneous operating expenses.


2025


2024


2023


Reconciliation of net sales and revenues


  ​ ​ ​ ​ ​ ​ ​ ​ ​ ​ ​ ​ ​ ​

  ​ ​ ​ ​ ​ ​ ​ ​ ​ ​ ​ ​ ​ ​

  ​ ​ ​ ​ ​ ​ ​ ​ ​ ​ ​ ​ ​ ​

Segment net sales and revenues

$

46,116

$

52,294

$

62,053

External other income2

310

333

244

Elimination of intersegment revenues


(742)


(911)


(1,046)

Net sales and revenues

$

45,684

$

51,716

$

61,251

Reconciliation of net income


Segment operating profit

$

6,020

$

9,039

$

12,958

Interest income – excluding FS

420

492

559

Interest expense – excluding FS


(372)


(396)


(411)

Pension and OPEB benefit, excluding service cost component


422


333


286

Corporate other – net3


(233)


(286)


(366)

Income taxes


(1,259)

(2,094)

(2,871)

Net income

$

4,998

$

7,088

$

10,155

2 External other income includes corporate investment income, corporate interest income, and other miscellaneous revenue items that are included in “Other income” on the statements of consolidated income.

3 Corporate other - net includes certain foreign exchange gains and losses, certain investment income, and certain corporate administrative and general expenses.

OPERATING SEGMENTS

  ​

2025

  ​

2024

  ​

2023


Depreciation4 and amortization expense

PPA

$

654

$

643

$

581

SAT

261

246

241

CF


365


331


301

FS


1,082


1,040


1,016

Intersegment

(133)

(142)

(135)

Total

$

2,229

$

2,118

$

2,004

Total Assets


  ​ ​ ​ ​ ​ ​ ​ ​ ​ ​ ​ ​ ​ ​

  ​ ​ ​ ​ ​ ​ ​ ​ ​ ​ ​ ​ ​ ​

  ​ ​ ​ ​ ​ ​ ​ ​ ​ ​ ​ ​ ​ ​

PPA

$

8,787

$

8,696

$

8,734

SAT

3,987

4,130

4,348

CF


7,792


7,137


7,139

FS


70,021


73,612


70,732

Corporate5


15,409


13,745


13,134

Total Assets

$

105,996

$

107,320

$

104,087

Capital additions


  ​ ​ ​ ​ ​ ​ ​ ​ ​ ​ ​ ​ ​

  ​ ​ ​ ​ ​ ​ ​ ​ ​ ​ ​

  ​ ​ ​ ​ ​ ​ ​ ​ ​ ​ ​

PPA

$

716

$

1,025

$

896

SAT

301

327

386

CF


345


352


311

FS


2


3


4

Total

$

1,364

$

1,707

$

1,597

Equity investment in unconsolidated affiliates

PPA

$

11

$

12

$

10

SAT

37

61

87

CF


1

FS


462


49


28

Total

$

510

$

122

$

126

4 Depreciation includes depreciation for equipment on operating leases.

5 Corporate assets are managed on a consolidated basis, including cash and cash equivalents, retirement benefit net assets, goodwill, and deferred income tax assets.

28. SUBSEQUENT EVENT

On December 3, 2025, a quarterly dividend of $1.62 per share was declared at the Board of Directors meeting, payable on February 9, 2026, to stockholders of record on December 31, 2025.

82

Table of Contents

REPORT OF INDEPENDENT REGISTERED PUBLIC ACCOUNTING FIRM

To the stockholders and the Board of Directors of Deere & Company:

Opinion on the Financial Statements

We have audited the accompanying consolidated balance sheets of Deere & Company and subsidiaries (the "Company") as of November 2, 2025 and October 27, 2024, the related statements of consolidated income, consolidated comprehensive income, changes in consolidated stockholders’ equity and consolidated cash flows for each of the three years in the period ended November 2, 2025, and the related notes (collectively referred to as the "financial statements"). In our opinion, the financial statements present fairly, in all material respects, the financial position of the Company as of November 2, 2025 and October 27, 2024, and the results of its operations and its cash flows for each of the three years in the period ended November 2, 2025, in conformity with accounting principles generally accepted in the United States of America.

We have also audited, in accordance with the standards of the Public Company Accounting Oversight Board (United States) (PCAOB), the Company's internal control over financial reporting as of November 2, 2025, based on criteria established in Internal Control — Integrated Framework (2013) issued by the Committee of Sponsoring Organizations of the Treadway Commission and our report dated December 18, 2025, expressed an unqualified opinion on the Company's internal control over financial reporting.

Basis for Opinion

These financial statements are the responsibility of the Company's management. Our responsibility is to express an opinion on the Company's financial statements based on our audits. We are a public accounting firm registered with the PCAOB and are required to be independent with respect to the Company in accordance with the U.S. federal securities laws and the applicable rules and regulations of the Securities and Exchange Commission and the PCAOB.

We conducted our audits in accordance with the standards of the PCAOB. Those standards require that we plan and perform the audit to obtain reasonable assurance about whether the financial statements are free of material misstatement, whether due to error or fraud. Our audits included performing procedures to assess the risks of material misstatement of the financial statements, whether due to error or fraud, and performing procedures that respond to those risks. Such procedures included examining, on a test basis, evidence regarding the amounts and disclosures in the financial statements. Our audits also included evaluating the accounting principles used and significant estimates made by management, as well as evaluating the overall presentation of the financial statements. We believe that our audits provide a reasonable basis for our opinion.

Critical Audit Matters

The critical audit matters communicated below are matters arising from the current-period audit of the financial statements that were communicated or required to be communicated to the audit committee and that (1) relate to accounts or disclosures that are material to the financial statements and (2) involved our especially challenging, subjective, or complex judgments. The communication of critical audit matters does not alter in any way our opinion on the financial statements, taken as a whole, and we are not, by communicating the critical audit matters below, providing separate opinions on the critical audit matters or on the accounts or disclosures to which they relate.

Sales Incentives Refer to Note 2 to the financial statements

Critical Audit Matter Description

The Company offers sales incentive programs to promote the sale of products from the dealer to the retail customer. At the time of the sale to a dealer, the Company records an estimated cost for the sales incentive programs as a reduction to the sales price. The estimated cost of these programs is based on:

historical data,
announced and expected incentive programs,
field inventory levels, and
forecasted sales volumes.

The final cost of these programs is determined when the dealer sells the equipment to a retail customer. A key assumption is the predictive value of the historical percentage of retail sales incentive costs to retail sales.

The predictive value of the historical percentage for the United States and Canada is a critical audit matter because differences from the historical percentage to current conditions could have a material impact on the sales incentive accrual. Auditing management’s assumptions about the predictive nature of historical sales incentive costs requires a high degree of auditor judgment and an increased extent of effort to evaluate the reasonableness of management’s estimates.

83

Table of Contents

How the Critical Audit Matter Was Addressed in the Audit

Our audit procedures related to testing management’s assumption that historical sales incentive costs are predictive of future incentive costs included the following, among others:

We tested the effectiveness of management’s controls over the assumptions used to estimate the sales incentive accrual.
We evaluated management’s ability to accurately forecast future incentive costs by performing a retrospective review that involved comparing actual incentive costs to management’s historical forecasts.
We tested the completeness of the population used in the accrual calculation by inspecting incentive program communications to dealers to ensure programs offered were appropriately included in the calculation.
We tested the accuracy of sales incentive transactions by recalculating the incentives based on the applicable incentive program terms and comparing these amounts to those settled with dealers.
We evaluated the reasonableness of management’s assumption that historical sales incentive costs are predictive of future incentive costs by:
oConsidering the impact of changes in the current economic conditions and competitive environment.
oComparing historical and current sales incentive data for eligible products in the following manner:
Type and number of programs
Geography
Program size and duration.

Allowance for Credit Losses Refer to Notes 2 and 11 to the financial statements

Critical Audit Matter Description

The allowance for credit losses is an estimate of the credit losses expected over the life of the Company’s receivable portfolio. Non-performing receivables are included in the estimate of expected credit losses. The allowance is measured on a collective basis for receivables with similar risk characteristics. Receivables that do not share risk characteristics are evaluated on an individual basis. Risk characteristics include:

finance product category
market
geography
credit risk
remaining balance

The Company utilizes linear regression models to estimate the expected credit losses for large and complex retail customer receivable pools, which represent more than 90 percent of retail customer receivables. These statistical models utilize independent variables, or predictive features, to estimate lifetime default rates, which are subsequently adjusted for expected recoveries to arrive at lifetime credit loss estimates. Independent variables included in the models vary by product, but can include credit quality at time of application, remaining account balance, delinquency status, and various economic factors, such as commodity prices, employment levels, and housing data. The economic factors include forward-looking conditions over the reasonable and supportable forecast period.

Management reviews each model’s output quarterly, and qualitative adjustments are incorporated as necessary.

We identified the allowance for credit losses estimated by the linear regression models and related independent variables and qualitative adjustments used in determining the Company’s United States and Canada retail customer receivable portfolios as a critical audit matter because determining the appropriate methodology and assumptions used in the estimate requires significant judgment by management.

Given the subjective nature and judgment applied by management to determine the allowance for credit losses, auditing the methodology and assumptions requires a high degree of auditor judgment and an increased extent of effort, including the need to involve credit specialists.

How the Critical Audit Matter Was Addressed in the Audit

Our audit procedures to test the allowance for credit losses estimated for the Company’s United States and Canada retail customer receivable portfolio by the linear regression models and related independent variables and qualitative adjustments included the following, among others:

We tested the effectiveness of management’s controls over the methodology, data and assumptions used to estimate the allowance for credit losses estimated by the linear regression models.

84

Table of Contents

We tested the accuracy and evaluated the relevance of the underlying historical data used in the Company’s linear regression models.
With the assistance of our credit specialists, we evaluated the reasonableness and accuracy of the linear regression models used to estimate the allowance for credit losses, including model assumptions and the selection and application of relevant risk characteristics and use of qualitative adjustments.
We evaluated management’s ability to accurately forecast credit losses by performing a retrospective review, which involved comparing actual credit losses to historical estimates.

/s/ DELOITTE & TOUCHE LLP

Chicago, Illinois

December 18, 2025

We have served as the Company’s auditor since 1910.

85

Table of Contents

REPORT OF INDEPENDENT REGISTERED PUBLIC ACCOUNTING FIRM

To the stockholders and the Board of Directors of Deere & Company:

Opinion on Internal Control over Financial Reporting

We have audited the internal control over financial reporting of Deere & Company and subsidiaries (the “Company”) as of November 2, 2025, based on criteria established in Internal Control — Integrated Framework (2013) issued by the Committee of Sponsoring Organizations of the Treadway Commission (COSO). In our opinion, the Company maintained, in all material respects, effective internal control over financial reporting as of November 2, 2025, based on criteria established in Internal Control — Integrated Framework (2013) issued by COSO.

We have also audited, in accordance with the standards of the Public Company Accounting Oversight Board (United States) (PCAOB), the consolidated financial statements as of and for the year ended November 2, 2025, of the Company and our report dated December 18, 2025, expressed an unqualified opinion on those financial statements.

Basis for Opinion

The Company’s management is responsible for maintaining effective internal control over financial reporting and for its assessment of the effectiveness of internal control over financial reporting, included in Management’s Report on Internal Control over Financial Reporting appearing under Item 9A. Our responsibility is to express an opinion on the Company’s internal control over financial reporting based on our audit. We are a public accounting firm registered with the PCAOB and are required to be independent with respect to the Company in accordance with the U.S. federal securities laws and the applicable rules and regulations of the Securities and Exchange Commission and the PCAOB.

We conducted our audit in accordance with the standards of the PCAOB. Those standards require that we plan and perform the audit to obtain reasonable assurance about whether effective internal control over financial reporting was maintained in all material respects. Our audit included obtaining an understanding of internal control over financial reporting, assessing the risk that a material weakness exists, testing and evaluating the design and operating effectiveness of internal control based on the assessed risk, and performing such other procedures as we considered necessary in the circumstances. We believe that our audit provides a reasonable basis for our opinion.

Definition and Limitations of Internal Control over Financial Reporting

A company’s internal control over financial reporting is a process designed to provide reasonable assurance regarding the reliability of financial reporting and the preparation of financial statements for external purposes in accordance with generally accepted accounting principles. A company’s internal control over financial reporting includes those policies and procedures that (1) pertain to the maintenance of records that, in reasonable detail, accurately and fairly reflect the transactions and dispositions of the assets of the company; (2) provide reasonable assurance that transactions are recorded as necessary to permit preparation of financial statements in accordance with generally accepted accounting principles, and that receipts and expenditures of the company are being made only in accordance with authorizations of management and directors of the company; and (3) provide reasonable assurance regarding prevention or timely detection of unauthorized acquisition, use, or disposition of the company’s assets that could have a material effect on the financial statements.

Because of its inherent limitations, internal control over financial reporting may not prevent or detect misstatements. Also, projections of any evaluation of effectiveness to future periods are subject to the risk that controls may become inadequate because of changes in conditions, or that the degree of compliance with the policies or procedures may deteriorate.

/s/ DELOITTE & TOUCHE LLP
Chicago, Illinois

December 18, 2025

86

Table of Contents

Index to Exhibits

Exhibit Number

Description of Exhibit

The Filings Referenced for

Incorporation are Deere & Company

3.1

Restated Certificate of Incorporation*

Exhibit 3.1 to Form 10-Q of registrant for the quarter ended July 28, 2019

3.2

Certificate of Designation Preferences and Rights of Series A Participating Preferred Stock*

Exhibit 3.2 to Form 10-K of registrant for the year ended October 31, 1998

3.3

Bylaws, as amended*

Exhibit 3.2 to Form 10-Q of registrant for the quarter ended July 30, 2023

4.1

Form of common stock certificate*

Exhibit 4.6 to Form 10-K of registrant for the year ended October 31, 1998

4.2

Indenture, dated September 25, 2008 between the registrant and The Bank of New York Mellon as Trustee*

Exhibit 4.1 to the registration statement on Form S-3ASR no, 333-153704 filed September 26, 2008

4.3

Indenture, dated June 15, 2020, among Deere Funding Canada Corporation, as issuer, the registrant, as guarantor, and The Bank of New York Mellon, as Trustee*

Exhibit 4.3 to the registration statement on Form S-3ASR no 333-239165 filed June 15, 2020

4.4

Terms and Conditions of the Euro Medium Term Notes, published June 11, 2025, applicable to the U.S. $9,000,000,000 Euro Medium Term Note Programme of the registrant, John Deere Capital Corporation, John Deere Bank S.A., and John Deere Cash Management.

Filed herewith

4.5

Description of Deere & Company’s Common Stock*

Exhibit 4.4 to Form 10-K of the registrant for the year ended November 3, 2019

4.6

Description of Deere & Company’s 6.55% Debentures Due 2028*

Exhibit 4.6 to Form 10-K of registrant for the year ended November 3, 2019

Certain instruments relating to long-term debt constituting less than 10% of the registrant’s total assets are not filed as exhibits herewith pursuant to Item 601(b)(4)(iii)(A) of Regulation S-K. The registrant will furnish copies of such instrument to the Commission upon request.

10.1

Agreement, as amended November 1, 1994, between the registrant and John Deere Capital Corporation concerning agricultural retail notes*

Exhibit 10.1 to Form 10-K of registrant for the year ended October 31, 1998

10.2

Agreement, as amended November 1, 1994, between the registrant and John Deere Capital Corporation concerning lawn and grounds care retail notes*

Exhibit 10.2 to Form 10-K of registrant for the year ended October 31, 1998

10.3

Agreement, as amended November 1, 1994, between John Deere Construction Equipment Company and John Deere Capital Corporation concerning construction retail notes*

Exhibit 10.3 to Form 10-K of registrant for the year ended October 31, 1998

10.4

Agreement, dated July 14, 1997, between John Deere Construction Equipment Company and John Deere Capital Corporation concerning construction retail notes*

Exhibit 10.4 to Form 10-K of registrant for the year ended October 31, 2003

10.5

Second Amended Agreement, dated March 27, 2023, between the registrant and John Deere Capital Corporation relating to fixed charges ratio, ownership, and minimum net worth of John Deere Capital Corporation*

Exhibit 10.4 to Form 10-Q of registrant for the quarter ended April 30, 2023

10.6†

Deere & Company Voluntary Deferred Compensation Plan, as amended October 31, 2024*

Exhibit 10.6 to Form 10-K of registrant of the year ended October 27, 2024

10.7†

John Deere Short-Term Incentive Bonus Plan, as amended October 27, 2023*

Exhibit 10.1 to Form 8-K of registrant filed October 30, 2023

10.8†

John Deere Long-Term Incentive Cash Plan*

Appendix C to Proxy Statement of registrant filed January 12, 2018

10.9†

John Deere Omnibus Equity and Incentive Plan, as amended February 25, 2015*

Appendix D to Proxy Statement of registrant filed January 14, 2015

10.10†

Form of Terms and Conditions for John Deere Nonqualified Stock Options granted fiscal 2025*

Exhibit 10.4 to Form 10-Q of registrant for the quarter ended April 27, 2025

10.11†

Form of Terms and Conditions for John Deere Restricted Stock Units granted fiscal 2025*

Exhibit 10.5 to Form 10-Q of registrant for the quarter ended April 27, 2025

10.12†

Form of Terms and Conditions for John Deere Performance Stock Options granted fiscal 2025*

Exhibit 10.6 to Form 10-Q of registrant for the quarter ended April 27, 2025

10.13†

Form of Terms and Conditions for John Deere Nonqualified Stock Options granted fiscal 2024*

Exhibit 10.10 to Form 10-K of registrant for the year ended October 27, 2024

87

Table of Contents

Exhibit Number

Description of Exhibit

The Filings Referenced for

Incorporation are Deere & Company

10.14†

Form of Terms and Conditions for John Deere Restricted Stock Units granted fiscal 2024*

Exhibit 10.11 to Form 10-K of registrant for the year ended October 27, 2024

10.15†

Form of Terms and Conditions for John Deere Performance Stock Options granted fiscal 2024*

Exhibit 10.12 to Form 10-K of registrant for the year ended October 27, 2024

10.16†

Form of Terms and Conditions for John Deere Nonqualified Stock Options granted fiscal 2023*

Exhibit 10.10 to Form 10-K of registrant for the year ended October 29, 2023

10.17†

Form of Terms and Conditions for John Deere Restricted Stock Units and Performance Stock Units granted fiscal 2023*

Exhibit 10.11 to Form 10-K of registrant for the year ended October 29, 2023

10.18†

Form of Terms and Conditions for John Deere Nonqualified Stock Options granted fiscal 2022*

Exhibit 10.10 to Form 10-K of registrant for the year ended October 30, 2022

10.19†

Form of Terms and Conditions for John Deere Nonqualified Stock Options granted fiscal 2021*

Exhibit 10.10 to Form 10-K of registrant for the year ended October 31, 2021

10.20†

Form of John Deere Restricted Stock Unit Grant for Directors*

Exhibit 10.16 to Form 10-K of registrant for the year ended October 29, 2023

10.21†

Form of John Deere Restricted Stock Unit Grant for Directors*

Exhibit 10.13 to Form 10-K of registrant for the year ended October 31, 2008

10.22†

Form of Terms and Conditions for Deere & Company Nonemployee Director Stock Ownership Plan*

Exhibit 10.13 to Form 10-K of registrant for the year ended October 31, 2021

10.23†

John Deere Defined Contribution Restoration Plan, as amended October 31, 2024*

Exhibit 10.21 to Form 10-K of registrant for the year ended October 27, 2024

10.24†

John Deere Supplemental Pension Benefit Plan, as amended December 31, 2020*

Exhibit 10.15 to Form 10-K of registrant for the year ended October 31, 2021

10.25†

John Deere Senior Supplementary Pension Benefit Plan, as amended October 31, 2022*

Exhibit 10.23 to Form 10-K of registrant for the year ended October 27, 2024

10.26†

John Deere ERISA Supplementary Pension Benefit Plan, as amended October 31, 2022*

Exhibit 10.1 to Form 10-Q of registrant for the quarter ended January 29, 2023

10.27†

Deere & Company Nonemployee Director Stock Ownership Plan, as amended February 29, 2012*

Appendix A to Proxy Statement of registrant filed on January 13, 2012

10.28†

Deere & Company Nonemployee Director Stock Ownership Plan, as amended February 23, 2022*

Appendix C to Proxy Statement of registrant filed on January 7, 2022

10.29†

Deere & Company Nonemployee Director Deferred Compensation Plan, as amended October 31, 2024

Filed herewith

10.30†

Amended and Restated Change in Control Severance Program of Deere & Company, effective August 29, 2023*

Exhibit 10.1 to Form 10-Q of registrant for the quarter ended July 30, 2023

10.31†

John Deere 2020 Equity and Incentive Plan*

Appendix C to Proxy Statement of registrant filed January 10, 2020

10.32

Asset Purchase Agreement, dated October 29, 2001, between the registrant and Deere Capital, Inc. concerning the sale of trade receivables*

Exhibit 10.19 to Form 10-K of registrant for the year ended October 31, 2001

10.33

Second Amendment, dated February 21, 2020, to the Asset Purchase Agreement dated October 29, 2001, between the registrant and Deere Capital, Inc. (including conformed copy of the Asset Purchase Agreement as Exhibit A thereto) *

Exhibit 10.1 to Form 10-Q of the registrant for the quarter ended February 2, 2020

10.34

Asset Purchase Agreement, dated October 29, 2001, between John Deere Construction & Forestry Company and Deere Capital, Inc. concerning the sale of trade receivables*

Exhibit 10.20 to Form 10-K registrant for the year ended October 31, 2001

10.35

Second Amendment, dated February 21, 2020, to the Asset Purchase Agreement dated October 29, 2001, between John Deere Construction & Forestry Company and Deere Capital, Inc. (including conformed copy of the Asset Purchase Agreement as Exhibit A thereto) *

Exhibit 10.2 to Form 10-Q of registrant for the quarter ended February 2, 2020

10.36

2028 Credit Agreement, dated March 24, 2025, among the registrant John Deere Capital Corporation, John Deere Bank S.A., various financial institutions, JPMorgan Chase Bank, N.A., as Administrative Agent, Bank of America, N.A., and Citibank, N.A., as Co-Syndication Agents, and J.P. Morgan Securities LLC, as Sustainability Structuring Agent*

Exhibit 10.2 to Form 10-Q of registrant for the quarter ended April 27, 2025

88

Table of Contents

Exhibit Number

Description of Exhibit

The Filings Referenced for

Incorporation are Deere & Company

10.37

2030 Credit Agreement, dated March 24, 2025, among the registrant, John Deere Capital Corporation, John Deere Bank, S.A., various financial institutions, JPMorgan Chase Bank, N.A., as Administrative Agent, Bank of America, N.A., and Citibank, N.A., as Co-Syndication Agents, and J.P. Morgan Securities LLC, as Sustainability Structuring Agent*

Exhibit 10.3 to Form 10-Q of registrant for the quarter ended April 27, 2025

10.38

364-Day Credit Agreement, dated March 24, 2025, among the registrant, John Deere Capital Corporation, John Deere Bank S.A., various financial institutions, JPMorgan Chase Bank, N.A., as Administrative Agent, Bank of America, N.A., and Citibank, N.A., as Co-Syndication Agents, and J.P. Morgan Securities LLC, as Sustainability Structuring Agent*

Exhibit 10.1 to Form 10-Q of registrant for the quarter ended April 27, 2025

19

Global Insider Trader Policy*

Exhibit 19 to Form 10-K of registrant for the year ended October 27, 2024

21

Subsidiaries

Filed herewith

22

List of Guarantors and Subsidiary Issuers of Guaranteed Securities

Filed herewith

23

Consent of Deloitte & Touche

Filed herewith

24

Power of Attorney (included on signature page)

Filed herewith

31.1

Rule 13a-14(a)/15d-14(a) Certification

Filed herewith

31.2

Rule 13a-14(a)/15d-14(a) Certification

Filed herewith

32

Section 1350 Certifications

Furnished herewith

97

Incentive Compensation Recovery Policy effective August 29, 2023*

Exhibit 10.27 to Form 10-K of registrant for the year ended October 29, 2023

101.INS

Inline XBRL Instance Document (the instance document does not appear in the Interactive Date File because its XBRL tags are embedded within the Inline XBRL document)

101.SCH

Inline XBRL Taxonomy Extension Schema Document

101.CAL

Inline XBRL Taxonomy Extension Calculation Linkbase Document

101.DEF

Inline XBRL Taxonomy Extension Definition Linkbase Document

101. LAB

Inline XBRL Taxonomy Extension Label Linkbase Document

101.PRE

Inline XBRL Taxonomy Extension Presentation Linkbase Document

104

Cover Page Interactive Data File (formatted as Inline XBRL and contained in Exhibit 101)

* Incorporated by reference.

† Management contract or compensatory plan or arrangement

89

Table of Contents

SIGNATURES

Pursuant to the requirements of Section 13 or 15(d) of the Securities Exchange Act of 1934, the registrant has duly caused this report to be signed on its behalf by the undersigned, thereunto duly authorized.

DEERE & COMPANY

By:

/s/ John C. May

John C. May

Chairman and Chief Executive Officer

(Principal Executive Officer)

Date: December 18, 2025

Pursuant to the requirements of the Securities Exchange Act of 1934, this report has been signed below by the following persons on behalf of the registrant and in the capacities and on the date indicated.

Each person signing below also hereby appoints John C. May, Joshua A. Jepsen, and Kellye L. Walker, and each of them singly, his or her lawful attorney-in-fact with full power to execute and file any and all amendments to this report together with exhibits thereto and generally to do all such things as such attorney-in-fact may deem appropriate to enable Deere & Company to comply with the provisions of the Securities Exchange Act of 1934 and all requirements of the Securities and Exchange Commission.

Signature

Title

Date

/s/ Leanne G. Caret

Director

)

December 18, 2025

Leanne G. Caret

)

)

)

/s/ Tamra A. Erwin

Director

)

Tamra A. Erwin

)

)

)

/s/ R. Preston Feight

Director

)

R. Preston Feight

)

)

)

/s/ Alan C. Heuberger

Director

)

Alan C. Heuberger

)

)

)

/s/ L. Neil Hunn

Director

)

L. Neil Hunn

)

)

)

/s/ Joshua A. Jepsen

Senior Vice President and

)

Joshua A. Jepsen

Chief Financial Officer

)

(Principal Financial Officer and Principal

)

Accounting Officer)

)

)

)

/s/ Michael O. Johanns

Director

)

Michael O. Johanns

)

)

)

/s/ John C. May

Chairman and Chief Executive Officer

)

John C. May

(Principal Executive Officer)

)

)

)

90

Table of Contents

/s/ Gregory R. Page

Director

)

Gregory R. Page

)

)

)

/s/ Dmitri L. Stockton

Director

)

Dmitri L. Stockton

)

)

)

/s/ Sheila G. Talton

Director

)

Sheila G. Talton

)

91