(Furnished herewith)
News Release |
|
| |
Contact:
Jen Hartmann
Director, Public Relations
HartmannJenniferA@JohnDeere.com
Deere Reports First Quarter Net Income of $869 Million
| ● | Full-year net income forecast remains steady despite currency fluctuations. |
| ● | Results reflect progress in streamlining field inventory amidst uncertain market conditions. |
| ● | Continued value delivery as customers navigate a challenging environment. |
MOLINE, Illinois (February 13, 2025) — Deere & Company reported net income of $869 million for the first quarter ended January 26, 2025, or $3.19 per share, compared with net income of $1,751 million, or $6.23 per share, for the quarter ended January 28, 2024.
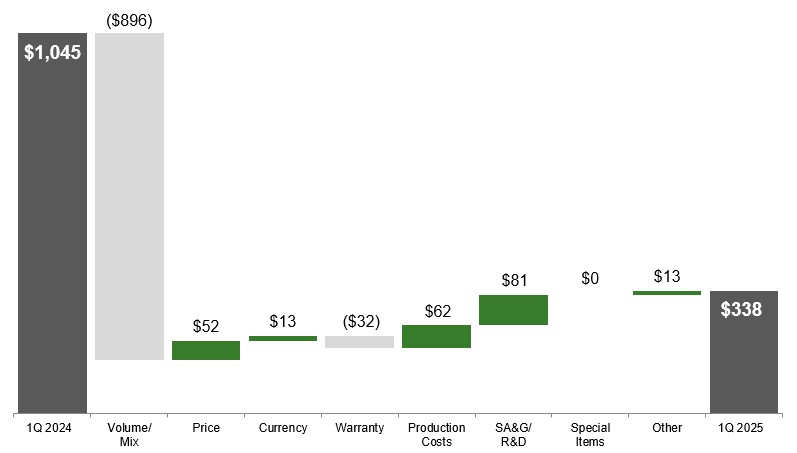
Worldwide net sales and revenues decreased 30 percent, to $8.508 billion, in the most recent quarter. Net sales were $6.809 billion for the quarter, compared with $10.486 billion in 2024.
“Deere’s performance in the first quarter highlights our continued focus on optimizing inventory levels of both new and used equipment amidst the uncertain market conditions our customers are facing,” said John C. May, chairman and chief executive officer. “We’re seeing compelling evidence that our efforts are positioning the company to successfully navigate the current environment.”
Company Outlook & Summary
Net income attributable to Deere & Company for fiscal 2025 is forecasted to remain in a range of $5.0 billion to $5.5 billion.
“The stability of our net income guidance not only reflects our resilience in a challenging market but also enables our sustained strategic investments to provide better outcomes for our customers,” May added.
Deere & Company | | First Quarter | | ||||||
$ in millions, except per share amounts | | 2025 | | 2024 | | % Change | | ||
Net sales and revenues | | $ | 8,508 | | $ | 12,185 | | -30% | |
Net income | | $ | 869 | | $ | 1,751 | | -50% | |
Fully diluted EPS | | $ | 3.19 | | $ | 6.23 | | | |
Results for the current period were affected by special items. See Note 1 of the financial statements for further details.
4
Production & Precision Agriculture | | First Quarter | | ||||||
$ in millions | | 2025 | | 2024 | | % Change | | ||
Net sales | | $ | 3,067 | | $ | 4,849 | | -37% | |
Operating profit | | $ | 338 | | $ | 1,045 | | -68% | |
Operating margin | | | 11.0% | | | 21.6% | | | |
Production and precision agriculture sales decreased for the quarter as a result of lower shipment volumes. Operating profit decreased primarily due to lower shipment volumes / sales mix, partially offset by lower SA&G and R&D expenses and lower production costs.
Production & Precision Agriculture Operating Profit
First Quarter 2025 Compared to First Quarter 2024
$ in millions

5
Small Agriculture & Turf | | First Quarter | | ||||||
$ in millions | | 2025 | | 2024 | | % Change | | ||
Net sales | | $ | 1,748 | | $ | 2,425 | | -28% | |
Operating profit | | $ | 124 | | $ | 326 | | -62% | |
Operating margin | | | 7.1% | | | 13.4% | | | |
Small agriculture and turf sales decreased for the quarter as a result of lower shipment volumes. Operating profit decreased primarily due to lower shipment volumes / sales mix, partially offset by lower production costs.
Small Agriculture & Turf Operating Profit
First Quarter 2025 Compared to First Quarter 2024
$ in millions

6
Construction & Forestry | | First Quarter | | ||||||
$ in millions | | 2025 | | 2024 | | % Change | | ||
Net sales | | $ | 1,994 | | $ | 3,212 | | -38% | |
Operating profit | | $ | 65 | | $ | 566 | | -89% | |
Operating margin | | | 3.3% | | | 17.6% | | | |
Construction and forestry sales decreased for the quarter as a result of lower shipment volumes. Operating profit decreased primarily due to lower shipment volumes / sales mix, unfavorable price realization, and higher SA&G and R&D expenses.
Construction & Forestry Operating Profit
First Quarter 2025 Compared to First Quarter 2024
$ in millions

Financial Services | | First Quarter | | ||||||
$ in millions | | 2025 | | 2024 | | % Change | | ||
Net income | | $ | 230 | | $ | 207 | | 11% | |
Financial services net income for the current quarter was affected by a decreased valuation allowance on assets held for sale of Banco John Deere S.A. See Note 1 of the financial statements for further details. Excluding the impact of this special item, net income decreased due to a higher provision for credit losses, partially offset by lower SA&G expenses.
7
Industry Outlook for Fiscal 2025 | | | | | | ||
Agriculture & Turf | | | | | | | |
U.S. & Canada: | | | | | | | |
Large Ag | | | | | | Down ~ 30% | |
Small Ag & Turf | | | | | | Down ~ 10% | |
Europe | | | | | | Down ~ 5% | |
South America (Tractors & Combines) | | | | | | Flat | |
Asia | | | | | | Down slightly | |
| | | | | | | |
Construction & Forestry | | | | | | | |
U.S. & Canada: | | | | | | | |
Construction Equipment | | | | | | Down ~ 10% | |
Compact Construction Equipment | | | | | | Down ~ 5% | |
Global Forestry | | | | | | Flat to down 5% | |
Global Roadbuilding | | | | | | Flat | |
Deere Segment Outlook for Fiscal 2025
This outlook does not reflect the impacts of potential import tariffs by the U.S. and retaliatory actions taken by other countries given the uncertain and rapidly evolving environment.
| | Currency | | Price | | ||
$ in millions | | Net Sales | | Translation | | Realization | |
Production & Precision Ag | | Down 15 to 20% | | -2.5% | | +1.0% | |
Small Ag & Turf | | Down ~ 10% | | -1.5% | | +0.5% | |
Construction & Forestry | | Down 10 to 15% | | -1.5% | | Flat | |
| | | | | | | |
Financial Services | | Net Income | | ~ $750 | | | |
FORWARD-LOOKING STATEMENTS
Certain statements contained herein, including in the section entitled “Company Outlook & Summary,” “Industry Outlook,” “Deere Segment Outlook,” and “Condensed Notes to Interim Consolidated Financial Statements” relating to future events, expectations, and trends constitute “forward-looking statements” as defined in the Private Securities Litigation Reform Act of 1995 and involve factors that are subject to change, assumptions, risks, and uncertainties that could cause actual results to differ materially. Some of these risks and uncertainties could affect all lines of the company’s operations generally while others could more heavily affect a particular line of business.
Forward-looking statements are based on currently available information and current assumptions, expectations, and projections about future events and should not be relied upon. Except as required by law, the company expressly disclaims any obligation to update or revise its forward-looking statements. Many factors, risks, and uncertainties could cause actual results to differ materially from these forward-looking statements. Among these factors are risks related to:
| ● | the agricultural business cycle, which can be unpredictable and is affected by factors such as world grain stocks, harvest yields, available farm acres, acreage planted, soil conditions, prices for commodities and livestock, input costs, availability of transport for crops as well as adverse macroeconomic conditions, including unemployment, inflation, interest rate volatility, changes in consumer practices due to slower economic growth, and regional or global liquidity constraints; |
| ● | government policies and actions in respect to global trade, tariffs, and trade agreements, and the uncertainty of the company’s ability to sell products domestically or internationally, continue production at certain international facilities, procure raw materials and components, accurately forecast demand and inventory, manage increased costs of production, absorb or pass on increased pricing, predict financial results, and remain competitive based on these actions and policies; |
| ● | higher interest rates and currency fluctuations which could adversely affect the U.S. dollar, customer confidence, access to capital, and demand for the company’s products and solutions; |
8
| ● | the company’s ability to adapt in highly competitive markets, including understanding and meeting customers’ changing expectations for products and solutions, including delivery and utilization of precision technology; |
| ● | housing starts and supply, real estate and housing prices, levels of public and non-residential construction, and infrastructure investment; |
| ● | political, economic, and social instability of the geographies in which the company operates, including the ongoing war between Russia and Ukraine and the conflicts in the Middle East; |
| ● | worldwide demand for food and different forms of renewable energy impacting the price of farm commodities and consequently the demand for the company’s equipment; |
| ● | investigations, claims, lawsuits, or other legal proceedings, including the recent lawsuit filed by the Federal Trade Commission (FTC) and the Attorneys General of the States of Arizona, Illinois, Michigan, Minnesota, and Wisconsin alleging that the company unlawfully withheld self-repair capabilities from farmers and independent repair providers; |
| ● | changes in climate patterns, unfavorable weather events, and natural disasters, including potential consequences from the recent California wildfires; |
| ● | availability and price of raw materials, components, and whole goods; |
| ● | delays or disruptions in the company’s supply chain; |
| ● | suppliers’ and manufacturers’ business practices and compliance with applicable laws such as human rights, safety, environmental, and fair wages; |
| ● | loss of or challenges to intellectual property rights; |
| ● | rationalization, restructuring, relocation, expansion and/or reconfiguration of manufacturing and warehouse facilities; |
| ● | the ability to execute business strategies, including the company’s Smart Industrial Operating Model and Leap Ambitions; |
| ● | accurately forecasting customer demand for products and services and adequately managing inventory; |
| ● | dealer practices and their ability to manage inventory and distribution of the company’s products and to provide support and service for precision technology solutions; |
| ● | the ability to realize anticipated benefits of acquisitions and joint ventures, including challenges with successfully integrating operations and internal control processes; |
| ● | negative claims or publicity that damage the company’s reputation or brand; |
| ● | the ability to attract, develop, engage, and retain qualified employees; |
| ● | the impact of workforce reductions on company culture, employee retention and morale, and institutional knowledge; |
| ● | labor relations and contracts, including work stoppages and other disruptions; |
| ● | security breaches, cybersecurity attacks, technology failures, and other disruptions to the company’s information technology infrastructure and products; |
| ● | leveraging artificial intelligence and machine learning within the company’s business processes; |
| ● | changes to governmental communications channels (radio frequency technology); |
| ● | changes to existing laws and regulations, including the implementation of new, more stringent laws, as well as compliance with a variety of U.S., foreign and international laws, regulations, and policies relating to, but not limited to the following: advertising, anti-bribery and anti-corruption, anti-money laundering, antitrust, consumer finance, cybersecurity, data privacy, encryption, environmental (including climate change and engine emissions), farming, health and safety, foreign exchange controls and cash repatriation restrictions, foreign ownership and investment, human rights, import / export and trade, labor and employment, product liability, telematics, and telecommunications; |
| ● | governmental and other actions designed to address climate change in connection with a transition to a lower-carbon economy; and |
| ● | warranty claims, post-sales repairs or recalls, product liability litigation, and regulatory investigations as a result of the deficient operation of the company’s products. |
Further information concerning the company or its businesses, including factors that could materially affect the company’s financial results, is included in the company’s filings with the SEC (including, but not limited to, the factors discussed in Item 1A. “Risk Factors” of the company’s most recent Annual Report on Form 10-K and subsequent Quarterly Reports on Form 10-Q). There also may be other factors that the company cannot anticipate or that are not described herein because the company does not currently perceive them to be material.
9
DEERE & COMPANY
FIRST QUARTER 2025 PRESS RELEASE
(In millions of dollars) Unaudited
| | Three Months Ended | | ||||||
|
| January 26 |
| January 28 |
| % |
| ||
|
| 2025 |
| 2024 |
| Change | | ||
Net sales and revenues: | | | | | | | | | |
Production & precision ag net sales | | $ | 3,067 | | $ | 4,849 |
| -37 | |
Small ag & turf net sales | | | 1,748 | | | 2,425 | | -28 | |
Construction & forestry net sales | |
| 1,994 | |
| 3,212 |
| -38 | |
Financial services revenues | |
| 1,470 | |
| 1,376 |
| +7 | |
Other revenues | |
| 229 | |
| 323 |
| -29 | |
Total net sales and revenues | | $ | 8,508 | | $ | 12,185 |
| -30 | |
| | | | | | | | | |
Operating profit: * | | | | | | | | | |
Production & precision ag | | $ | 338 | | $ | 1,045 |
| -68 | |
Small ag & turf | | | 124 | | | 326 | | -62 | |
Construction & forestry | |
| 65 | |
| 566 |
| -89 | |
Financial services | |
| 266 | |
| 257 |
| +4 | |
Total operating profit | |
| 793 | |
| 2,194 |
| -64 | |
Reconciling items ** | |
| 103 | |
| 26 |
| +296 | |
Income taxes | |
| (27) | |
| (469) |
| -94 | |
Net income attributable to Deere & Company | | $ | 869 | | $ | 1,751 |
| -50 | |
* Operating profit is income from continuing operations before corporate expenses, certain external interest expenses, certain foreign exchange gains and losses, and income taxes. Operating profit for financial services includes the effect of interest expense and foreign exchange gains or losses.
** Reconciling items are primarily corporate expenses, certain interest income and expenses, certain foreign exchange gains and losses, pension and postretirement benefit costs excluding the service cost component, and net income attributable to noncontrolling interests.
10
DEERE & COMPANY
STATEMENTS OF CONSOLIDATED INCOME
For the Three Months Ended January 26, 2025 and January 28, 2024
(In millions of dollars and shares except per share amounts) Unaudited
|
| 2025 |
| 2024 | ||
Net Sales and Revenues | | | | | | |
Net sales | | $ | 6,809 | | $ | 10,486 |
Finance and interest income | |
| 1,453 | |
| 1,360 |
Other income | |
| 246 | |
| 339 |
Total | |
| 8,508 | |
| 12,185 |
| | | | | | |
Costs and Expenses | | | | | | |
Cost of sales | |
| 5,037 | |
| 7,200 |
Research and development expenses | |
| 526 | |
| 533 |
Selling, administrative and general expenses | |
| 972 | |
| 1,066 |
Interest expense | |
| 829 | |
| 802 |
Other operating expenses | |
| 249 | |
| 369 |
Total | |
| 7,613 | |
| 9,970 |
| | | | | | |
Income of Consolidated Group before Income Taxes | |
| 895 | |
| 2,215 |
Provision for income taxes | |
| 27 | |
| 469 |
| | | | | | |
Income of Consolidated Group | |
| 868 | |
| 1,746 |
Equity in income (loss) of unconsolidated affiliates | |
| (1) | |
| 2 |
| | | | | | |
Net Income | |
| 867 | |
| 1,748 |
Less: Net loss attributable to noncontrolling interests | |
| (2) | |
| (3) |
Net Income Attributable to Deere & Company | | $ | 869 | | $ | 1,751 |
| | | | | | |
Per Share Data | | | | | | |
Basic | | $ | 3.20 | | $ | 6.25 |
Diluted | | | 3.19 | | | 6.23 |
Dividends declared | | | 1.62 | | | 1.47 |
Dividends paid | | | 1.47 | | | 1.35 |
| | | | | | |
Average Shares Outstanding | | | | | | |
Basic | |
| 271.6 | |
| 279.9 |
Diluted | |
| 272.3 | |
| 281.1 |
See Condensed Notes to Interim Consolidated Financial Statements.
11
DEERE & COMPANY
CONDENSED CONSOLIDATED BALANCE SHEETS
(In millions of dollars) Unaudited
| | January 26 | | October 27 | | January 28 | |||
|
| 2025 |
| 2024 |
| 2024 | |||
Assets | | | | | | | | | |
Cash and cash equivalents | | $ | 6,601 | | $ | 7,324 | | $ | 5,137 |
Marketable securities | |
| 1,214 | |
| 1,154 | |
| 1,136 |
Trade accounts and notes receivable – net | |
| 4,931 | |
| 5,326 | |
| 7,795 |
Financing receivables – net | |
| 41,396 | |
| 44,309 | |
| 43,708 |
Financing receivables securitized – net | |
| 8,257 | |
| 8,723 | |
| 6,400 |
Other receivables | |
| 2,979 | |
| 2,545 | |
| 2,017 |
Equipment on operating leases – net | |
| 7,157 | |
| 7,451 | |
| 6,751 |
Inventories | |
| 7,744 | |
| 7,093 | |
| 8,937 |
Property and equipment – net | |
| 7,425 | |
| 7,580 | |
| 6,914 |
Goodwill | |
| 3,872 | |
| 3,959 | |
| 3,966 |
Other intangible assets – net | |
| 937 | |
| 999 | |
| 1,112 |
Retirement benefits | |
| 3,018 | |
| 2,921 | |
| 3,087 |
Deferred income taxes | |
| 1,852 | |
| 2,086 | |
| 1,833 |
Other assets | |
| 2,807 | |
| 2,906 | |
| 2,578 |
Assets held for sale | | | 2,929 | | | 2,944 | |
| |
Total Assets | | $ | 103,119 | | $ | 107,320 | | $ | 101,371 |
| | | | | | | | | |
Liabilities and Stockholders’ Equity | | | | | | | | | |
| | | | | | | | | |
Liabilities | | | | | | | | | |
Short-term borrowings | | $ | 12,811 | | $ | 13,533 | | $ | 17,117 |
Short-term securitization borrowings | |
| 8,014 | |
| 8,431 | |
| 6,116 |
Accounts payable and accrued expenses | |
| 12,162 | |
| 14,543 | |
| 13,361 |
Deferred income taxes | |
| 448 | |
| 478 | |
| 550 |
Long-term borrowings | |
| 43,556 | |
| 43,229 | |
| 39,933 |
Retirement benefits and other liabilities | |
| 1,734 | |
| 2,354 | |
| 2,115 |
Liabilities held for sale | | | 1,830 | | | 1,827 | |
| |
Total liabilities | |
| 80,555 | |
| 84,395 | |
| 79,192 |
| | | | | | | | | |
Redeemable noncontrolling interest | | | 78 | | | 82 | | | 100 |
| | | | | | | | | |
Stockholders’ Equity | | | | | | | | | |
Total Deere & Company stockholders’ equity | |
| 22,479 | |
| 22,836 | |
| 22,075 |
Noncontrolling interests | |
| 7 | |
| 7 | |
| 4 |
Total stockholders’ equity | |
| 22,486 | |
| 22,843 | |
| 22,079 |
Total Liabilities and Stockholders’ Equity | | $ | 103,119 | | $ | 107,320 | | $ | 101,371 |
See Condensed Notes to Interim Consolidated Financial Statements.
12
DEERE & COMPANY
STATEMENTS OF CONSOLIDATED CASH FLOWS
For the Three Months Ended January 26, 2025 and January 28, 2024
(In millions of dollars) Unaudited
|
| 2025 |
| 2024 | ||
Cash Flows from Operating Activities | | | | | | |
Net income | | $ | 867 | | $ | 1,748 |
Adjustments to reconcile net income to net cash used for operating activities: | | | | | | |
Provision for credit losses | |
| 69 | |
| 31 |
Provision for depreciation and amortization | |
| 549 | |
| 520 |
Impairments and other adjustments | | | (32) | |
| |
Share-based compensation expense | |
| 28 | |
| 46 |
Provision for deferred income taxes | |
| 208 | |
| 27 |
Changes in assets and liabilities: | | | | | | |
Receivables related to sales | |
| 1,063 | |
| (277) |
Inventories | |
| (795) | |
| (723) |
Accounts payable and accrued expenses | |
| (1,845) | |
| (2,327) |
Accrued income taxes payable/receivable | |
| (540) | |
| 183 |
Retirement benefits | |
| (688) | |
| (129) |
Other | |
| (16) | |
| (7) |
Net cash used for operating activities | |
| (1,132) | |
| (908) |
| | | | | | |
Cash Flows from Investing Activities | | | | | | |
Collections of receivables (excluding receivables related to sales) | |
| 8,137 | |
| 7,752 |
Proceeds from maturities and sales of marketable securities | |
| 61 | |
| 184 |
Proceeds from sales of equipment on operating leases | |
| 433 | | | 506 |
Cost of receivables acquired (excluding receivables related to sales) | |
| (6,045) | |
| (6,447) |
Purchases of marketable securities | | | (141) | | | (229) |
Purchases of property and equipment | |
| (352) | |
| (362) |
Cost of equipment on operating leases acquired | |
| (439) | |
| (454) |
Collateral on derivatives – net | | | (191) | | | 310 |
Other | |
| (47) | |
| (43) |
Net cash provided by investing activities | |
| 1,416 | |
| 1,217 |
| | | | | | |
Cash Flows from Financing Activities | | | | | | |
Net payments in short-term borrowings (original maturities three months or less) | |
| (1,484) | |
| (2,951) |
Proceeds from borrowings issued (original maturities greater than three months) | |
| 3,168 | |
| 5,287 |
Payments of borrowings (original maturities greater than three months) | |
| (1,753) | |
| (3,237) |
Repurchases of common stock | |
| (441) | |
| (1,328) |
Dividends paid | |
| (403) | |
| (386) |
Other | |
| (10) | |
| (30) |
Net cash used for financing activities | |
| (923) | |
| (2,645) |
| | | | | | |
Effect of Exchange Rate Changes on Cash, Cash Equivalents, and Restricted Cash | |
| (87) | |
| 16 |
| | | | | | |
Net Decrease in Cash, Cash Equivalents, and Restricted Cash | |
| (726) | |
| (2,320) |
Cash, Cash Equivalents, and Restricted Cash at Beginning of Period | |
| 7,633 | |
| 7,620 |
Cash, Cash Equivalents, and Restricted Cash at End of Period | | $ | 6,907 | | $ | 5,300 |
See Condensed Notes to Interim Consolidated Financial Statements.
13
DEERE & COMPANY | |
Condensed Notes to Interim Consolidated Financial Statements | |
(In millions of dollars) Unaudited | |
| (1) | Special Items |
Discrete Tax Items
In the first quarter of 2025, we recorded favorable net discrete tax items primarily due to tax benefits of $110 million related to the realization of foreign net operating losses from the consolidation of certain subsidiaries and $53 million from an adjustment to an uncertain tax position of a foreign subsidiary.
Banco John Deere S.A.
In 2024, the company entered into a joint venture agreement with a Brazilian bank, Banco Bradesco S.A. (Bradesco), for Bradesco to invest and become 50 percent owner of the company’s wholly-owned subsidiary in Brazil, Banco John Deere S.A. (BJD). BJD is included in the company’s financial services segment and finances retail and wholesale loans for agricultural, construction, and forestry equipment. The transaction is intended to reduce the company’s incremental risk as it continues to grow in the Brazilian market.
The BJD business was reclassified as held for sale in 2024. In January 2025, the valuation allowance on assets held for sale decreased to $65 million, resulting in a pretax and after-tax gain (reversal of previous losses) of $32 million recorded in “Selling, administrative and general expenses” in the three months ended January 26, 2025.
In February 2025, the company completed the transaction with Bradesco for the sale of 50 percent ownership in BJD. Bradesco contributed capital equal to the company’s equity investment in BJD. The company retained a 50 percent equity interest in BJD and will report the results of the joint venture as an equity investment in unconsolidated affiliates.
| (2) | The consolidated financial statements represent the consolidation of all the company’s subsidiaries. The supplemental consolidating data in Note 3 to the financial statements is presented for informational purposes. Equipment operations represent the enterprise without financial services. Equipment operations include the company’s production and precision agriculture operations, small agriculture and turf operations, and construction and forestry operations, and other corporate assets, liabilities, revenues, and expenses not reflected within financial services. Transactions between the equipment operations and financial services have been eliminated to arrive at the consolidated financial statements. |
14
DEERE & COMPANY
(3) SUPPLEMENTAL CONSOLIDATING DATA
STATEMENTS OF INCOME
For the Three Months Ended January 26, 2025 and January 28, 2024
(In millions of dollars) Unaudited
| | EQUIPMENT | | FINANCIAL | | | | | | | ||||||||||||||||
| | OPERATIONS | | SERVICES | | ELIMINATIONS | | CONSOLIDATED | | | ||||||||||||||||
|
| 2025 |
| 2024 |
| 2025 |
| 2024 |
| 2025 |
| 2024 |
| 2025 |
| 2024 | | | ||||||||
Net Sales and Revenues | | | | | | | | | | | | | | | | | | | | | | | | | | |
Net sales | | $ | 6,809 | | $ | 10,486 | | | | | | | | | | | | | | $ | 6,809 | | $ | 10,486 | | |
Finance and interest income | |
| 110 | |
| 157 | | $ | 1,455 | | $ | 1,433 | | $ | (112) | | $ | (230) | | | 1,453 | | | 1,360 | 1 | |
Other income | |
| 202 | |
| 289 | |
| 118 | |
| 119 | |
| (74) | |
| (69) | |
| 246 | |
| 339 | 2, 3, 4 | |
Total | |
| 7,121 | |
| 10,932 | |
| 1,573 | |
| 1,552 | |
| (186) | |
| (299) | |
| 8,508 | |
| 12,185 | | |
| | | | | | | | | | | | | | | | | | | | | | | | | | |
Costs and Expenses | | | | | | | | | | | | | | | | | | | | | | | | | | |
Cost of sales | |
| 5,045 | |
| 7,207 | | | | | | | | | (8) | | | (7) | | | 5,037 | | | 7,200 | 4 | |
Research and development expenses | |
| 526 | |
| 533 | | | | | | | | | | | | | | | 526 | | | 533 | | |
Selling, administrative and general expenses | |
| 800 | |
| 876 | |
| 174 | |
| 192 | |
| (2) | |
| (2) | |
| 972 | |
| 1,066 | 4 | |
Interest expense | |
| 84 | |
| 108 | |
| 766 | |
| 762 | |
| (21) | |
| (68) | |
| 829 | |
| 802 | 1 | |
Interest compensation to Financial Services | |
| 91 | |
| 162 | | | | | | | | | (91) | | | (162) | | | | |
| | 1 | |
Other operating expenses | |
| (51) | |
| 90 | |
| 364 | |
| 339 | |
| (64) | |
| (60) | |
| 249 | |
| 369 | 3, 4, 5 | |
Total | |
| 6,495 | |
| 8,976 | |
| 1,304 | |
| 1,293 | |
| (186) | |
| (299) | |
| 7,613 | |
| 9,970 | | |
| | | | | | | | | | | | | | | | | | | | | | | | | | |
Income before Income Taxes | |
| 626 | |
| 1,956 | |
| 269 | |
| 259 | |
| | |
| | |
| 895 | |
| 2,215 | | |
Provision (credit) for income taxes | |
| (13) | |
| 416 | |
| 40 | |
| 53 | |
| | |
| | |
| 27 | |
| 469 | | |
| | | | | | | | | | | | | | | | | | | | | | | | | | |
Income after Income Taxes | |
| 639 | |
| 1,540 | |
| 229 | |
| 206 | |
| | |
| | |
| 868 | |
| 1,746 | | |
Equity in income (loss) of unconsolidated affiliates | |
| (2) | |
| 1 | | | 1 | | | 1 | | | | | | | | | (1) | | | 2 | | |
| | | | | | | | | | | | | | | | | | | | | | | | | | |
Net Income | |
| 637 | |
| 1,541 | |
| 230 | |
| 207 | |
| | |
| | |
| 867 | |
| 1,748 | | |
Less: Net loss attributable to noncontrolling interests | |
| (2) | |
| (3) | | | | | | | | | | | | | | | (2) | | | (3) | | |
Net Income Attributable to Deere & Company | | $ | 639 | | $ | 1,544 | | $ | 230 | | $ | 207 | | | | | | | | $ | 869 | | $ | 1,751 | | |
1 Elimination of intercompany interest income and expense.
2 Elimination of equipment operations’ margin from inventory transferred to equipment on operating leases.
3 Elimination of income and expenses between equipment operations and financial services related to intercompany guarantees of investments in certain international markets.
4 Elimination of intercompany service revenues and fees.
5 Elimination of financial services’ lease depreciation expense related to inventory transferred to equipment on operating leases.
15
DEERE & COMPANY
SUPPLEMENTAL CONSOLIDATING DATA (Continued)
CONDENSED BALANCE SHEETS
(In millions of dollars) Unaudited
| | EQUIPMENT | | FINANCIAL | | | | | | | ||||||||||||||||||||||||||||
| | OPERATIONS | | SERVICES | | ELIMINATIONS | | CONSOLIDATED | | | ||||||||||||||||||||||||||||
|
| Jan 26 |
| Oct 27 |
| Jan 28 |
| Jan 26 |
| Oct 27 |
| Jan 28 |
| Jan 26 |
| Oct 27 |
| Jan 28 |
| Jan 26 |
| Oct 27 |
| Jan 28 | | | ||||||||||||
|
| 2025 |
| 2024 |
| 2024 |
| 2025 |
| 2024 |
| 2024 |
| 2025 |
| 2024 |
| 2024 |
| 2025 |
| 2024 |
| 2024 |
| | ||||||||||||
Assets | | | | | | | | | | | | | | | | | | | | | | | | | | | | | | | | | | | | | | |
Cash and cash equivalents | | $ | 4,840 | | $ | 5,615 | | $ | 3,467 | | $ | 1,761 | | $ | 1,709 | | $ | 1,670 | | | | | | | | | | | $ | 6,601 | | $ | 7,324 | | $ | 5,137 | | |
Marketable securities | | | 114 | |
| 125 | |
| 147 | |
| 1,100 | |
| 1,029 | |
| 989 | |
| | |
| | |
| | |
| 1,214 | |
| 1,154 | |
| 1,136 | | |
Receivables from Financial Services | |
| 1,826 | |
| 3,043 | |
| 4,296 | | | | | | | | | | | $ | (1,826) | | $ | (3,043) | | $ | (4,296) | | | | | | | | | | 6 | |
Trade accounts and notes receivable – net | |
| 1,053 | |
| 1,257 | |
| 1,093 | |
| 5,812 | |
| 6,225 | |
| 9,167 | |
| (1,934) | |
| (2,156) | |
| (2,465) | |
| 4,931 | |
| 5,326 | |
| 7,795 | 7 | |
Financing receivables – net | |
| 78 | |
| 78 | |
| 72 | |
| 41,318 | |
| 44,231 | |
| 43,636 | |
| | |
| | |
| | |
| 41,396 | |
| 44,309 | |
| 43,708 | | |
Financing receivables securitized – net | | | 2 | | | 2 | | | | |
| 8,255 | |
| 8,721 | |
| 6,400 | |
| | |
| | |
| | |
| 8,257 | |
| 8,723 | |
| 6,400 | | |
Other receivables | |
| 2,367 | |
| 2,193 | |
| 1,515 | |
| 654 | |
| 427 | |
| 559 | |
| (42) | |
| (75) | |
| (57) | |
| 2,979 | |
| 2,545 | |
| 2,017 | 7 | |
Equipment on operating leases – net | | | | | | | | | | |
| 7,157 | |
| 7,451 | |
| 6,751 | |
| | |
| | |
| | |
| 7,157 | |
| 7,451 | |
| 6,751 | | |
Inventories | |
| 7,744 | |
| 7,093 | |
| 8,937 | | | | | | | | | | | | | | | | | | | | | 7,744 | | | 7,093 | | | 8,937 | | |
Property and equipment – net | |
| 7,392 | |
| 7,546 | |
| 6,879 | |
| 33 | |
| 34 | |
| 35 | |
| | |
| | |
| | |
| 7,425 | |
| 7,580 | |
| 6,914 | | |
Goodwill | |
| 3,872 | |
| 3,959 | |
| 3,966 | | | | | | | | | | | | | | | | | | | | | 3,872 | | | 3,959 | | | 3,966 | | |
Other intangible assets – net | |
| 937 | |
| 999 | |
| 1,112 | | | | |
| | |
| | | | | |
| | |
| | | | 937 | |
| 999 | |
| 1,112 | | |
Retirement benefits | |
| 2,933 | |
| 2,839 | |
| 3,013 | |
| 86 | |
| 83 | |
| 75 | |
| (1) | |
| (1) | |
| (1) | |
| 3,018 | |
| 2,921 | |
| 3,087 | 8 | |
Deferred income taxes | |
| 2,247 | |
| 2,262 | |
| 2,133 | |
| 42 | |
| 43 | |
| 72 | |
| (437) | |
| (219) | |
| (372) | |
| 1,852 | |
| 2,086 | |
| 1,833 | 9 | |
Other assets | |
| 2,295 | |
| 2,194 | |
| 2,058 | |
| 539 | |
| 715 | |
| 546 | |
| (27) | |
| (3) | |
| (26) | |
| 2,807 | |
| 2,906 | |
| 2,578 | | |
Assets held for sale | | | | | | | |
| | | | 2,929 | | | 2,944 | | | | | | | | | | | | | | | 2,929 | |
| 2,944 | |
| | | |
Total Assets | | $ | 37,700 | | $ | 39,205 | | $ | 38,688 | | $ | 69,686 | | $ | 73,612 | | $ | 69,900 | | $ | (4,267) | | $ | (5,497) | | $ | (7,217) | | $ | 103,119 | | $ | 107,320 | | $ | 101,371 | | |
| | | | | | | | | | | | | | | | | | | | | | | | | | | | | | | | | | | | | | |
Liabilities and Stockholders’ Equity | | | | | | | | | | | | | | | | | | | | | | | | | | | | | | | | | | | | | | |
| | | | | | | | | | | | | | | | | | | | | | | | | | | | | | | | | | | | | | |
Liabilities | | | | | | | | | | | | | | | | | | | | | | | | | | | | | | | | | | | | | | |
Short-term borrowings | | $ | 1,101 | | $ | 911 | | $ | 1,203 | | $ | 11,710 | | $ | 12,622 | | $ | 15,914 | | | | | | | | | | | $ | 12,811 | | $ | 13,533 | | $ | 17,117 | | |
Short-term securitization borrowings | | | 1 | | | 2 | | | | |
| 8,013 | |
| 8,429 | |
| 6,116 | |
| | |
| | |
| | |
| 8,014 | |
| 8,431 | |
| 6,116 | | |
Payables to Equipment Operations | |
| | |
| | |
| | |
| 1,826 | |
| 3,043 | |
| 4,296 | | $ | (1,826) | | $ | (3,043) | | $ | (4,296) | |
| | |
| | |
| | 6 | |
Accounts payable and accrued expenses | |
| 10,869 | |
| 13,534 | |
| 12,677 | |
| 3,296 | |
| 3,243 | |
| 3,232 | |
| (2,003) | |
| (2,234) | |
| (2,548) | |
| 12,162 | |
| 14,543 | |
| 13,361 | 7 | |
Deferred income taxes | |
| 405 | |
| 434 | |
| 478 | |
| 480 | |
| 263 | |
| 444 | |
| (437) | |
| (219) | |
| (372) | |
| 448 | |
| 478 | |
| 550 | 9 | |
Long-term borrowings | |
| 8,507 | |
| 6,603 | |
| 7,270 | |
| 35,049 | |
| 36,626 | |
| 32,663 | |
| | |
| | |
| | |
| 43,556 | |
| 43,229 | |
| 39,933 | | |
Retirement benefits and other liabilities | |
| 1,668 | |
| 2,250 | |
| 2,006 | |
| 67 | |
| 105 | |
| 110 | |
| (1) | |
| (1) | |
| (1) | |
| 1,734 | |
| 2,354 | |
| 2,115 | 8 | |
Liabilities held for sale | | | | | | | |
| | | | 1,830 | | | 1,827 | | | | | | | | | | | | | | | 1,830 | |
| 1,827 | |
| | | |
Total liabilities | |
| 22,551 | |
| 23,734 | |
| 23,634 | |
| 62,271 | |
| 66,158 | |
| 62,775 | |
| (4,267) | |
| (5,497) | |
| (7,217) | |
| 80,555 | |
| 84,395 | |
| 79,192 | | |
| | | | | | | | | | | | | | | | | | | | | | | | | | | | | | | | | | | | | | |
Redeemable noncontrolling interest | | | 78 | | | 82 | | | 100 | | | | | | | | | | | | | | | | | | | | | 78 | | | 82 | | | 100 | | |
| | | | | | | | | | | | | | | | | | | | | | | | | | | | | | | | | | | | | | |
Stockholders’ Equity | | | | | | | | | | | | | | | | | | | | | | | | | | | | | | | | | | | | | | |
Total Deere & Company stockholders’ equity | |
| 22,479 | |
| 22,836 | |
| 22,075 | |
| 7,415 | |
| 7,454 | |
| 7,125 | |
| (7,415) | |
| (7,454) | |
| (7,125) | |
| 22,479 | |
| 22,836 | |
| 22,075 | 10 | |
Noncontrolling interests | |
| 7 | |
| 7 | |
| 4 | | | | | | | | | | | | | | | | | | | | | 7 | | | 7 | | | 4 | | |
Financial Services' equity | | | (7,415) | | | (7,454) | | | (7,125) | | | | | | | | | | | | 7,415 | | | 7,454 | | | 7,125 | | | | | | | | | | 10 | |
Adjusted total stockholders' equity | |
| 15,071 | |
| 15,389 | |
| 14,954 | |
| 7,415 | |
| 7,454 | |
| 7,125 | |
| | |
| | |
| | |
| 22,486 | |
| 22,843 | |
| 22,079 | | |
Total Liabilities and Stockholders’ Equity | | $ | 37,700 | | $ | 39,205 | | $ | 38,688 | | $ | 69,686 | | $ | 73,612 | | $ | 69,900 | | $ | (4,267) | | $ | (5,497) | | $ | (7,217) | | $ | 103,119 | | $ | 107,320 | | $ | 101,371 | | |
6 Elimination of receivables / payables between equipment operations and financial services.
7 Primarily reclassification of sales incentive accruals on receivables sold to financial services.
8 Reclassification of net pension assets / liabilities.
9 Reclassification of deferred tax assets / liabilities in the same taxing jurisdictions.
10 Elimination of financial services’ equity.
16
DEERE & COMPANY
SUPPLEMENTAL CONSOLIDATING DATA (Continued)
STATEMENTS OF CASH FLOWS
For the Three Months Ended January 26, 2025 and January 28, 2024
(In millions of dollars) Unaudited
| | EQUIPMENT | | FINANCIAL | | | | | | | ||||||||||||||||
| | OPERATIONS | | SERVICES | | ELIMINATIONS | | CONSOLIDATED | | | ||||||||||||||||
|
| 2025 |
| 2024 |
| 2025 |
| 2024 |
| 2025 |
| 2024 |
| 2025 |
| 2024 |
| | ||||||||
Cash Flows from Operating Activities | | | | | | | | | | | | | | | | | | | | | | | | | | |
Net income | | $ | 637 | | $ | 1,541 | | $ | 230 | | $ | 207 | | | | | | | | $ | 867 | | $ | 1,748 | | |
Adjustments to reconcile net income to net cash provided by (used for) operating activities: | | | | | | | | | | | | | | | | | | | | | | | | | | |
Provision (credit) for credit losses | |
| 3 | |
| (2) | |
| 66 | |
| 33 | |
| | |
| | |
| 69 | |
| 31 | | |
Provision for depreciation and amortization | |
| 319 | |
| 302 | |
| 265 | |
| 254 | | $ | (35) | | $ | (36) | |
| 549 | |
| 520 | 11 | |
Impairments and other adjustments | | | | |
| | | | (32) | | | | | | | | | | | | (32) | | | | | |
Share-based compensation expense | | | | | | | | | | | | | | | 28 | | | 46 | | | 28 | | | 46 | 12 | |
Distributed earnings of Financial Services | |
| 162 | |
| 233 | |
| | |
| | |
| (162) | |
| (233) | |
| | |
| | 13 | |
Provision (credit) for deferred income taxes | |
| (17) | |
| 48 | |
| 225 | |
| (21) | |
| | |
| | |
| 208 | |
| 27 | | |
Changes in assets and liabilities: | | | | | | | | | | | | | | | | | | | | | | | | | | |
Receivables related to sales | |
| 140 | |
| 209 | | | | | | | | | 923 | | | (486) | | | 1,063 | | | (277) | 14, 16 | |
Inventories | |
| (784) | |
| (687) | | | | | | | | | (11) | | | (36) | | | (795) | | | (723) | 15 | |
Accounts payable and accrued expenses | |
| (2,073) | |
| (2,155) | |
| 6 | |
| 25 | |
| 222 | |
| (197) | |
| (1,845) | |
| (2,327) | 16 | |
Accrued income taxes payable/receivable | |
| (479) | |
| 165 | |
| (61) | |
| 18 | |
| | |
| | |
| (540) | |
| 183 | | |
Retirement benefits | |
| (647) | |
| (127) | |
| (41) | |
| (2) | |
| | |
| | |
| (688) | |
| (129) | | |
Other | |
| (136) | |
| (46) | |
| 117 | |
| 61 | |
| 3 | |
| (22) | |
| (16) | |
| (7) | 11, 12, 15 | |
Net cash provided by (used for) operating activities | |
| (2,875) | |
| (519) | |
| 775 | |
| 575 | |
| 968 | |
| (964) | |
| (1,132) | |
| (908) | | |
| | | | | | | | | | | | | | | | | | | | | | | | | | |
Cash Flows from Investing Activities | | | | | | | | | | | | | | | | | | | | | | | | | | |
Collections of receivables (excluding receivables related to sales) | | | | | | | |
| 8,345 | |
| 8,007 | |
| (208) | |
| (255) | |
| 8,137 | |
| 7,752 | 14 | |
Proceeds from maturities and sales of marketable securities | | | 9 | | | 72 | |
| 52 | |
| 112 | |
| | |
| | |
| 61 | |
| 184 | | |
Proceeds from sales of equipment on operating leases | | | | | | | | | 433 | | | 506 | | | | | | | | | 433 | | | 506 | | |
Cost of receivables acquired (excluding receivables related to sales) | | | | | | | |
| (6,093) | |
| (6,513) | |
| 48 | |
| 66 | |
| (6,045) | |
| (6,447) | 14 | |
Purchases of marketable securities | | | | | | (29) | | | (141) | | | (200) | | | | | | | | | (141) | | | (229) | | |
Purchases of property and equipment | |
| (352) | |
| (362) | |
| | |
| | |
| | |
| | |
| (352) | |
| (362) | | |
Cost of equipment on operating leases acquired | | | | | | | |
| (454) | |
| (503) | |
| 15 | |
| 49 | |
| (439) | |
| (454) | 15 | |
Decrease in investment in Financial Services | | | | | | 10 | |
| | |
| | |
| | |
| (10) | |
| | |
| | 17 | |
Decrease (increase) in trade and wholesale receivables | | | | | | | |
| 985 | |
| (871) | |
| (985) | |
| 871 | |
| | |
| | 14 | |
Collateral on derivatives – net | | | | | | | | | (191) | | | 310 | | | | | | | | | (191) | | | 310 | | |
Other | |
| (51) | |
| (33) | |
| 4 | |
| (10) | |
| | |
| | |
| (47) | |
| (43) | | |
Net cash provided by (used for) investing activities | |
| (394) | |
| (342) | |
| 2,940 | |
| 838 | |
| (1,130) | |
| 721 | |
| 1,416 | |
| 1,217 | | |
| | | | | | | | | | | | | | | | | | | | | | | | | | |
Cash Flows from Financing Activities | | | | | | | | | | | | | | | | | | | | | | | | | | |
Net proceeds (payments) in short-term borrowings (original maturities three months or less) | |
| 176 | |
| 78 | |
| (1,660) | |
| (3,029) | |
| | |
| | |
| (1,484) | |
| (2,951) | | |
Change in intercompany receivables/payables | |
| 1,222 | |
| 288 | |
| (1,222) | |
| (288) | |
| | |
| | |
| | |
| | | |
Proceeds from borrowings issued (original maturities greater than three months) | |
| 2,032 | |
| 11 | |
| 1,136 | |
| 5,276 | |
| | |
| | |
| 3,168 | |
| 5,287 | | |
Payments of borrowings (original maturities greater than three months) | |
| (12) | |
| (40) | |
| (1,741) | |
| (3,197) | |
| | |
| | |
| (1,753) | |
| (3,237) | | |
Repurchases of common stock | |
| (441) | |
| (1,328) | | | | | | | | | | | | | | | (441) | | | (1,328) | | |
Capital returned to Equipment Operations | | | | |
| | | | | | | (10) | | | | | | 10 | | | | | | | 17 | |
Dividends paid | |
| (403) | |
| (386) | |
| (162) | |
| (233) | |
| 162 | |
| 233 | |
| (403) | |
| (386) | 13 | |
Other | |
| (7) | |
| (22) | |
| (3) | |
| (8) | |
| | |
| | |
| (10) | |
| (30) | | |
Net cash provided by (used for) financing activities | |
| 2,567 | |
| (1,399) | |
| (3,652) | |
| (1,489) | |
| 162 | |
| 243 | |
| (923) | |
| (2,645) | | |
| | | | | | | | | | | | | | | | | | | | | | | | | | |
Effect of Exchange Rate Changes on Cash, Cash Equivalents, and Restricted Cash | |
| (74) | |
| 11 | |
| (13) | |
| 5 | |
| | |
| | |
| (87) | |
| 16 | | |
| | | | | | | | | | | | | | | | | | | | | | | | | | |
Net Increase (Decrease) in Cash, Cash Equivalents, and Restricted Cash | |
| (776) | |
| (2,249) | |
| 50 | |
| (71) | |
| | |
| | |
| (726) | |
| (2,320) | | |
Cash, Cash Equivalents, and Restricted Cash at Beginning of Period | |
| 5,643 | |
| 5,755 | |
| 1,990 | |
| 1,865 | |
| | |
| | |
| 7,633 | |
| 7,620 | | |
Cash, Cash Equivalents, and Restricted Cash at End of Period | | $ | 4,867 | | $ | 3,506 | | $ | 2,040 | | $ | 1,794 | | | | | | | | $ | 6,907 | | $ | 5,300 | | |
11 Elimination of depreciation on leases related to inventory transferred to equipment on operating leases.
12 Reclassification of share-based compensation expense.
13 Elimination of dividends from financial services to the equipment operations, which are included in the equipment operations operating activities.
14 Primarily reclassification of receivables related to the sale of equipment.
15 Reclassification of direct lease agreements with retail customers.
16 Reclassification of sales incentive accruals on receivables sold to financial services.
17 Elimination of change in investment from equipment operations to financial services.
17