
1 Third Quarter 2026 Earnings Conference Call October 20, 2026
1 Statements in this presentation which are not historical facts are “forward-looking statements” within the meaning of Section 27A of the Securities Act of 1933, as amended, Section 21E of the Securities Exchange Act of 1934, as amended, and the Private Securities Litigation Reform Act of 1995. These forward-looking statements may include discussions of the financial condition, results of operations, future performance and/or business of Peoples Bancorp Inc. (“Peoples”). The information contained in this presentation should be read in conjunction with Peoples’ Annual Report on Form 10-K for the fiscal year ended December 31, 2025 (the “2025 Form 10-K”), Peoples’ Quarterly Reports on Form 10-Q for the quarters ended June 30, 2026 (the “Second Quarter Form 10-Q”) and March 31, 2026 (the “First Quarter Form 10-Q”), and Peoples’ earnings release for the quarter ended September 30, 2026 (the “Third Quarter Earnings Release”), included in Peoples’ Current Report on Form 8-K furnished to the Securities and Exchange Commission (“SEC”) on October 20, 2026, each of which is available on the SEC’s website (sec.gov) or at Peoples’ website (peoplesbancorp.com). Peoples expects to file its Quarterly Report on Form 10-Q for the quarter ended September 30, 2026 (the “Third Quarter Form 10-Q”) with the SEC on or about October 29, 2026. As required by U.S. generally accepted accounting principles, Peoples is required to evaluate the impact of subsequent events through the issuance date of its September 30, 2026, consolidated financial statements as part of its Third Quarter Form 10-Q. Accordingly, subsequent events could occur that may cause Peoples to update its critical accounting estimates and/or to revise its financial information from that which is contained in this presentation. Investors are cautioned that forward-looking statements, which are not historical fact, involve risks and uncertainties, including those detailed in the 2025 Form 10-K under the section “Risk Factors” in Part I, Item 1A, as supplemented by the disclosures in the First Quarter Form 10- Q under the section “Risk Factors”, in Part II, Item 1A, as well as in the Third Quarter Earnings Release. As such, actual results could differ materially from those contemplated by forward-looking statements made in this presentation. Management believes that the expectations in these forward-looking statements are based upon reasonable assumptions within the bounds of management’s knowledge of Peoples’ business and operations. Peoples disclaims any responsibility to update these forward-looking statements to reflect events or circumstances after the date of this presentation or to reflect the occurrence of unanticipated events, except as required by applicable legal requirements. Safe Harbor Statement
2 In connection with the proposed merger with Capital Bancorp, Inc. (“Capital”), Peoples intends to file with the SEC a Registration Statement on Form S-4 to register the shares of Peoples common stock to be issued in connection with the proposed transaction. The Registration Statement will include a joint proxy statement/prospectus, and Peoples and Capital may file with the SEC other relevant documents concerning the proposed transaction. The information contained herein does not constitute an offer to sell or a solicitation of an offer to buy any securities or a solicitation of any vote or approval, nor shall there be any sale of securities in any jurisdiction in which such offer, solicitation or sale would be unlawful prior to registration or qualification under the securities laws of any such jurisdiction. BEFORE MAKING ANY VOTING OR INVESTMENT DECISION, INVESTORS AND SECURITY HOLDERS ARE URGED TO READ THE REGISTRATION STATEMENT AND JOINT PROXY STATEMENT/ PROSPECTUS REGARDING THE PROPOSED TRANSACTION WHEN THEY BECOME AVAILABLE AND ANY OTHER RELEVANT DOCUMENTS FILED WITH THE SEC, AS WELL AS ANY AMENDMENTS OR SUPPLEMENTS TO THOSE DOCUMENTS, BECAUSE THEY WILL CONTAIN IMPORTANT INFORMATION ABOUT PEOPLES, CAPITAL, AND THE PROPOSED TRANSACTION AND RELATED MATTERS. Investors and security holders will be able to obtain a free copy of the registration statement, including the joint proxy statement/prospectus, as well as other relevant documents filed with the SEC containing information about Peoples and Capital, without charge, at the SEC’s website (https:// www.sec.gov). Peoples and Capital, along with their respective directors, executive officers, management, and employees may be deemed participants in the solicitation of proxies in connection with the proposed Merger. Information concerning Peoples’ participants is set forth in the Proxy Statement, dated March 6, 2026, for Peoples’ 2026 annual meeting of stockholders as filed with the SEC on Schedule 14A. Information concerning Capital’s participants is set forth in the Proxy Statement, dated April 7, 2026, for Capital’s 2026 annual meeting of stockholders as filed with the SEC on Schedule 14A. Additional information regarding the participants in the solicitation of proxies in respect of the proposed transaction and interests of participants of Peoples and Capital in the solicitation of proxies in respect of the proposed Merger will be included in the registration statement and joint proxy statement/prospectus to be filed with the SEC. Free copies of these documents, when available, may be obtained as described in the preceding paragraph. Important Information for Investors and Shareholders
3 This presentation contains financial information and performance measures determined by methods other than those in accordance with accounting principles generally accepted in the United States of America (“US GAAP”). Management uses these “non-US GAAP” financial measures in its analysis of Peoples’ performance and the efficiency of its operations. Management believes that these non-US GAAP financial measures provide a greater understanding of ongoing operations and enhance comparability of results with prior periods and peers. These disclosures should not be viewed as substitutes for financial measures determined in accordance with US GAAP, nor are they necessarily comparable to non-US GAAP performance measures that may be presented by other companies. A reconciliation of these non-US GAAP financial measures to the most directly comparable US GAAP financial measures is included under the caption “Non-US GAAP Financial Measures (Unaudited)” at the end of the Third Quarter Earnings Release. Use of Non-US GAAP Financial Measures
4 • Net interest income increased 1%, while net interest margin expanded 8 basis points • Growth of 5% in fee-based income • Provision for credit losses declined 24% • Reduction in our efficiency ratio, adjusted for one- time items • Higher return on average assets of 1.36% • Increased return on average stockholders’ equity of 10.44% • Declines of 11% in our nonperforming loans • Growth in our lower-cost interest-bearing demand and money market accounts of nearly $100 million combined • Improvement in all regulatory capital ratios Net income was $32.6 million, or $0.91 of diluted EPS • Recorded losses of $4.5 million on sales of investment securities in connection with the pending Citizens merger and our strategic plan to stay below $10 billion in assets, which negatively impacted diluted EPS by $0.10 • Recorded $1.5 million of acquisition-related expenses, reducing diluted EPS by $0.03 • Adjusted for one-time losses and acquisition-related expenses of $0.13, diluted earnings per share (“EPS”) of $1.04 exceeded consensus analyst estimates of $0.93 for the quarter Third Quarter 2026 Financial Highlights
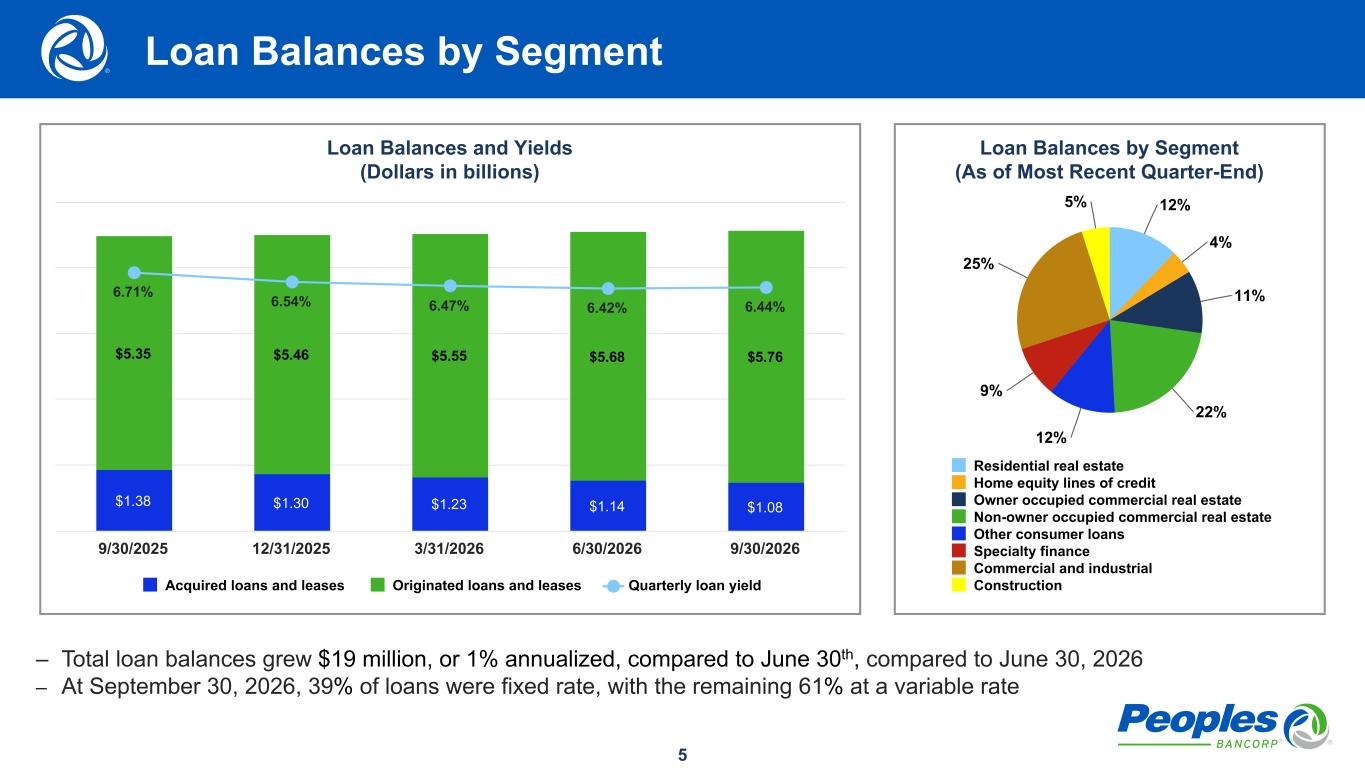
5 Loan Balances by Segment (As of Most Recent Quarter-End) 12% 4% 11% 22% 12% 9% 25% 5% Residential real estate Home equity lines of credit Owner occupied commercial real estate Non-owner occupied commercial real estate Other consumer loans Specialty finance Commercial and industrial Construction Loan Balances and Yields (Dollars in billions) $1.38 $1.30 $1.23 $1.14 $1.08 $5.35 $5.46 $5.55 $5.68 $5.76 6.71% 6.54% 6.47% 6.42% 6.44% Acquired loans and leases Originated loans and leases Quarterly loan yield 9/30/2025 12/31/2025 3/31/2026 6/30/2026 9/30/2026 – Total loan balances grew $19 million, or 1% annualized, compared to June 30th, compared to June 30, 2026 – At September 30, 2026, 39% of loans were fixed rate, with the remaining 61% at a variable rate Loan Balances by Segment
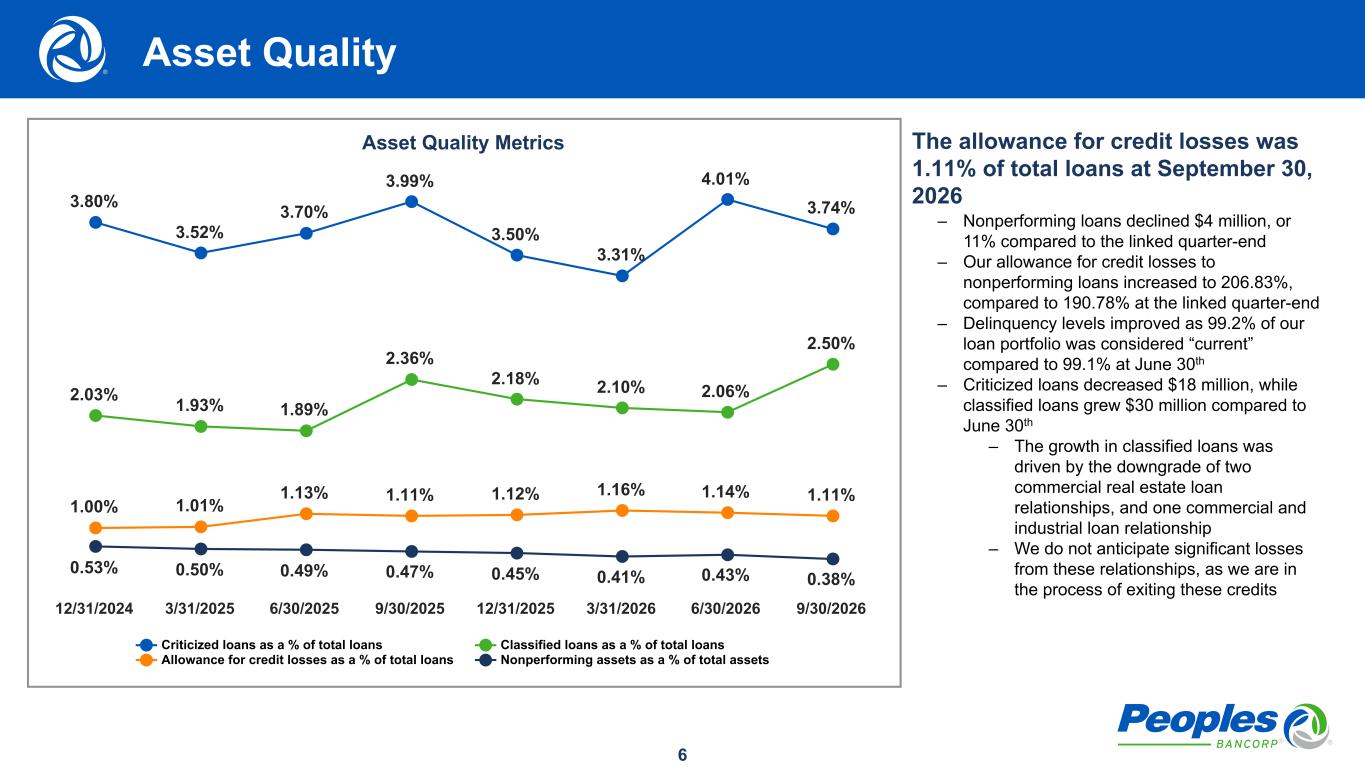
6 Asset Quality Metrics 3.80% 3.52% 3.70% 3.99% 3.50% 3.31% 4.01% 3.74% 2.03% 1.93% 1.89% 2.36% 2.18% 2.10% 2.06% 2.50% 1.00% 1.01% 1.13% 1.11% 1.12% 1.16% 1.14% 1.11% 0.53% 0.50% 0.49% 0.47% 0.45% 0.41% 0.43% 0.38% Criticized loans as a % of total loans Classified loans as a % of total loans Allowance for credit losses as a % of total loans Nonperforming assets as a % of total assets 12/31/2024 3/31/2025 6/30/2025 9/30/2025 12/31/2025 3/31/2026 6/30/2026 9/30/2026 The allowance for credit losses was 1.11% of total loans at September 30, 2026 – Nonperforming loans declined $4 million, or 11% compared to the linked quarter-end – Our allowance for credit losses to nonperforming loans increased to 206.83%, compared to 190.78% at the linked quarter-end – Delinquency levels improved as 99.2% of our loan portfolio was considered “current” compared to 99.1% at June 30th – Criticized loans decreased $18 million, while classified loans grew $30 million compared to June 30th – The growth in classified loans was driven by the downgrade of two commercial real estate loan relationships, and one commercial and industrial loan relationship – We do not anticipate significant losses from these relationships, as we are in the process of exiting these credits Asset Quality
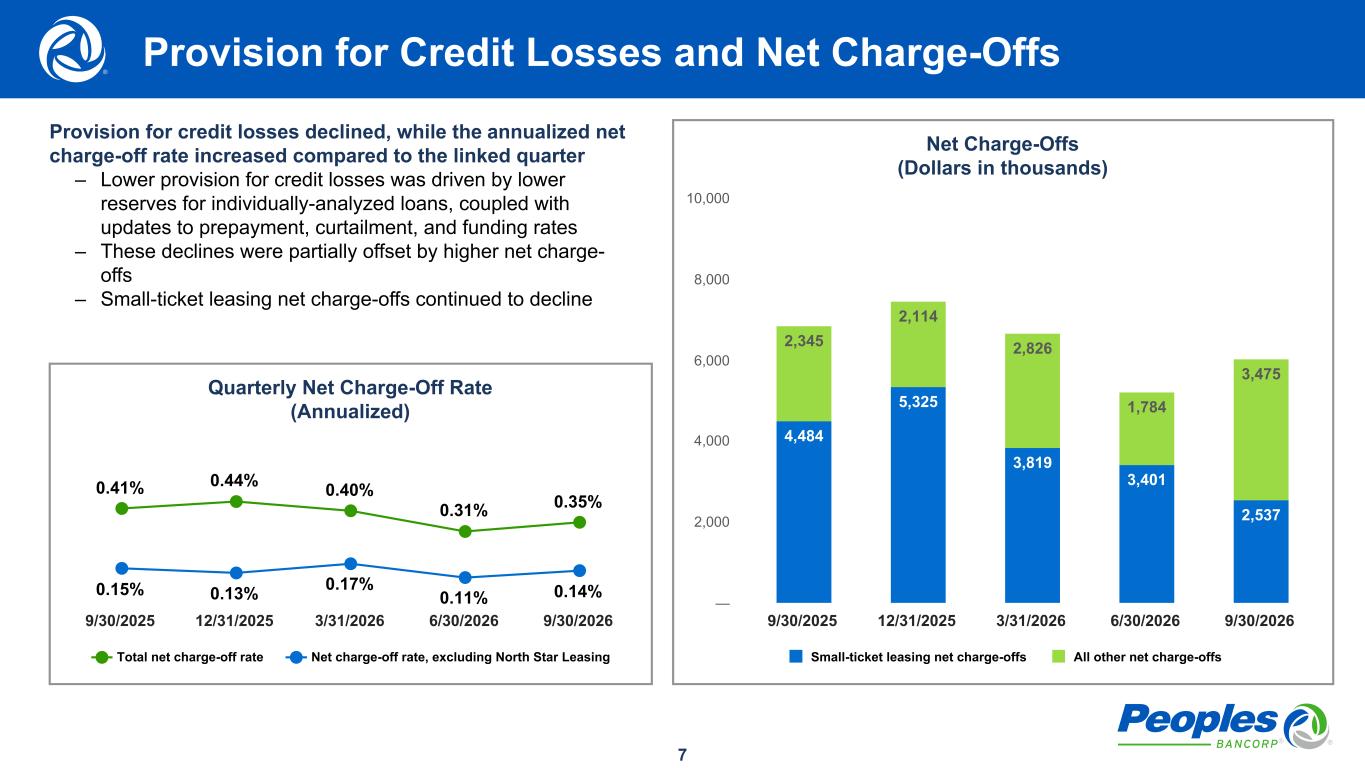
7 Net Charge-Offs (Dollars in thousands) 4,484 5,325 3,819 3,401 2,537 2,345 2,114 2,826 1,784 3,475 Small-ticket leasing net charge-offs All other net charge-offs 9/30/2025 12/31/2025 3/31/2026 6/30/2026 9/30/2026 — 2,000 4,000 6,000 8,000 10,000 Provision for Credit Losses and Net Charge-Offs Provision for credit losses declined, while the annualized net charge-off rate increased compared to the linked quarter – Lower provision for credit losses was driven by lower reserves for individually-analyzed loans, coupled with updates to prepayment, curtailment, and funding rates – These declines were partially offset by higher net charge- offs – Small-ticket leasing net charge-offs continued to decline Quarterly Net Charge-Off Rate (Annualized) 0.41% 0.44% 0.40% 0.31% 0.35% 0.15% 0.13% 0.17% 0.11% 0.14% Total net charge-off rate Net charge-off rate, excluding North Star Leasing 9/30/2025 12/31/2025 3/31/2026 6/30/2026 9/30/2026
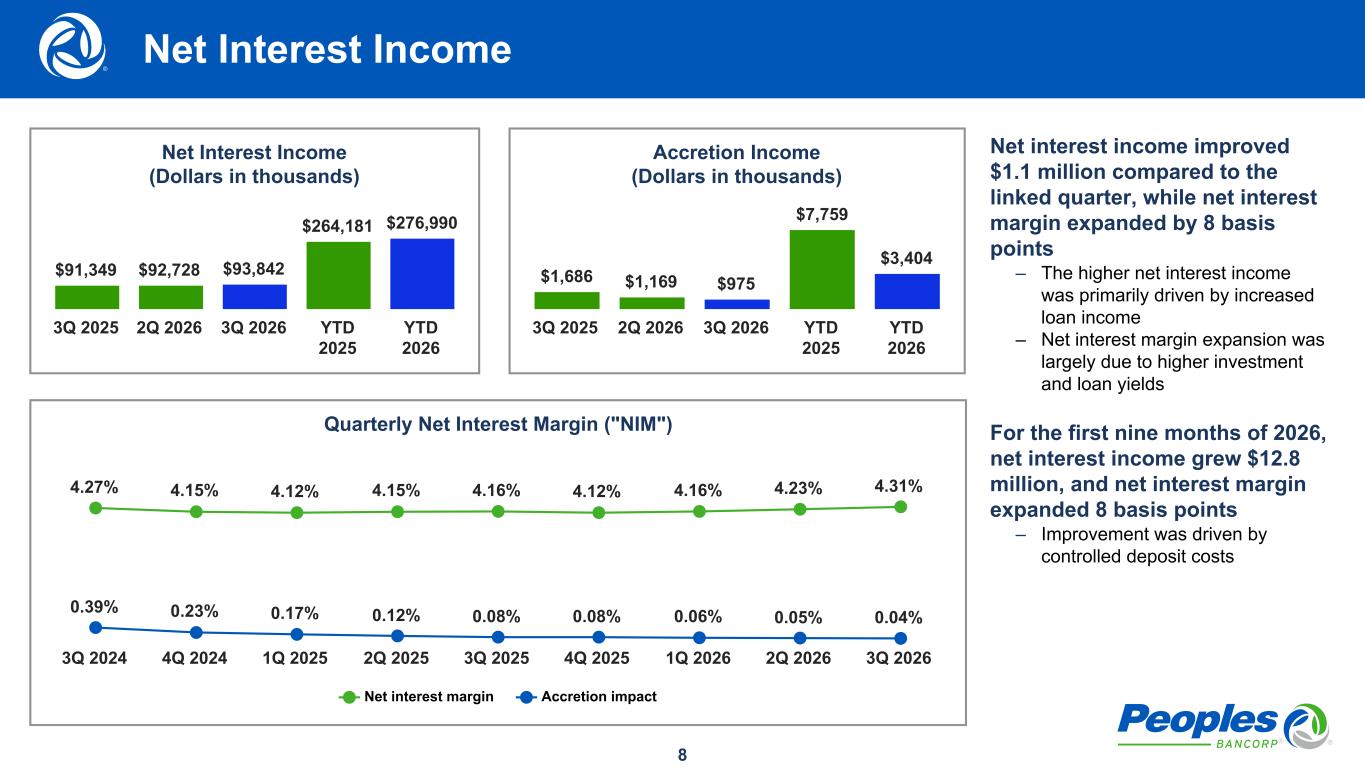
8 Net interest income improved $1.1 million compared to the linked quarter, while net interest margin expanded by 8 basis points – The higher net interest income was primarily driven by increased loan income – Net interest margin expansion was largely due to higher investment and loan yields For the first nine months of 2026, net interest income grew $12.8 million, and net interest margin expanded 8 basis points – Improvement was driven by controlled deposit costs Net Interest Income (Dollars in thousands) $91,349 $92,728 $93,842 $264,181 $276,990 3Q 2025 2Q 2026 3Q 2026 YTD 2025 YTD 2026 Quarterly Net Interest Margin ("NIM") 4.27% 4.15% 4.12% 4.15% 4.16% 4.12% 4.16% 4.23% 4.31% 0.39% 0.23% 0.17% 0.12% 0.08% 0.08% 0.06% 0.05% 0.04% Net interest margin Accretion impact 3Q 2024 4Q 2024 1Q 2025 2Q 2025 3Q 2025 4Q 2025 1Q 2026 2Q 2026 3Q 2026 Accretion Income (Dollars in thousands) $1,686 $1,169 $975 $7,759 $3,404 3Q 2025 2Q 2026 3Q 2026 YTD 2025 YTD 2026 Net Interest Income
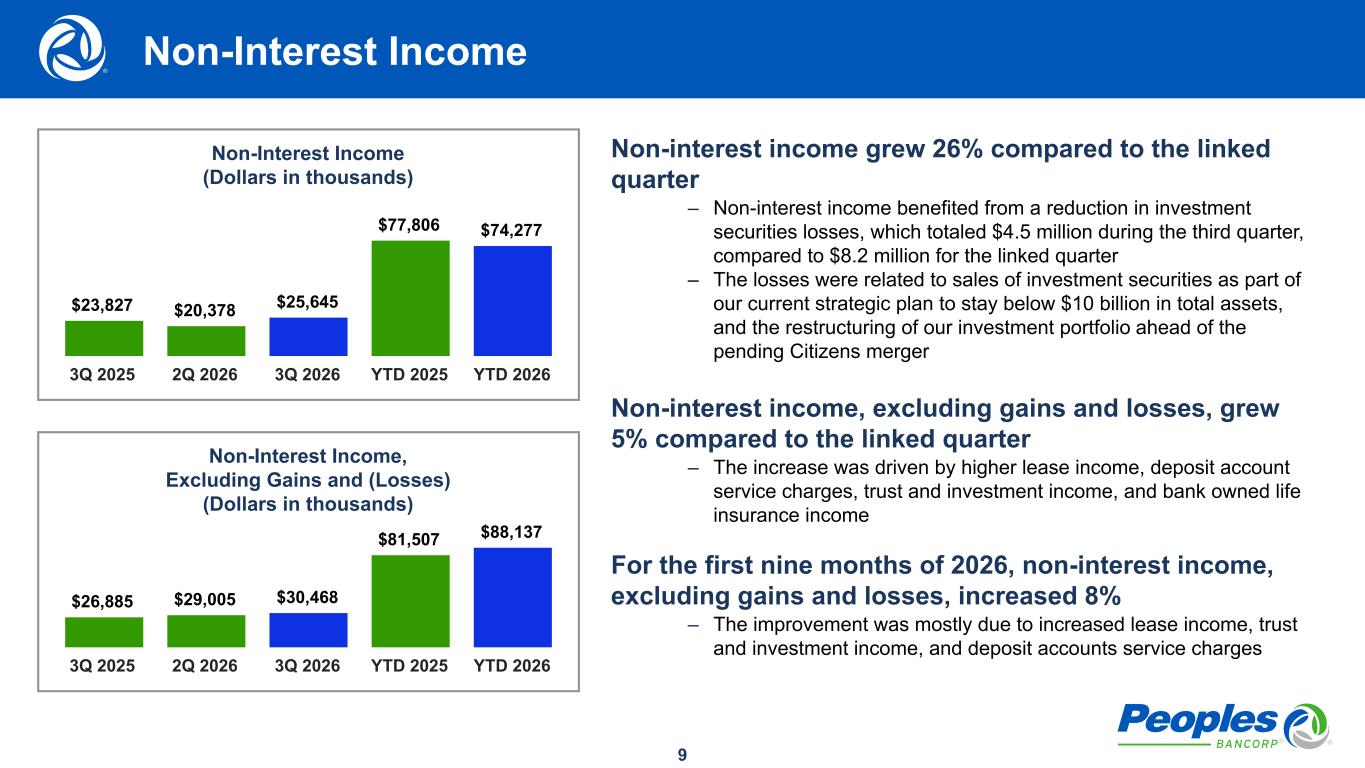
9 Non-interest income grew 26% compared to the linked quarter – Non-interest income benefited from a reduction in investment securities losses, which totaled $4.5 million during the third quarter, compared to $8.2 million for the linked quarter – The losses were related to sales of investment securities as part of our current strategic plan to stay below $10 billion in total assets, and the restructuring of our investment portfolio ahead of the pending Citizens merger Non-interest income, excluding gains and losses, grew 5% compared to the linked quarter – The increase was driven by higher lease income, deposit account service charges, trust and investment income, and bank owned life insurance income For the first nine months of 2026, non-interest income, excluding gains and losses, increased 8% – The improvement was mostly due to increased lease income, trust and investment income, and deposit accounts service charges Non-Interest Income (Dollars in thousands) $23,827 $20,378 $25,645 $77,806 $74,277 3Q 2025 2Q 2026 3Q 2026 YTD 2025 YTD 2026 Non-Interest Income Non-Interest Income, Excluding Gains and (Losses) (Dollars in thousands) $26,885 $29,005 $30,468 $81,507 $88,137 3Q 2025 2Q 2026 3Q 2026 YTD 2025 YTD 2026
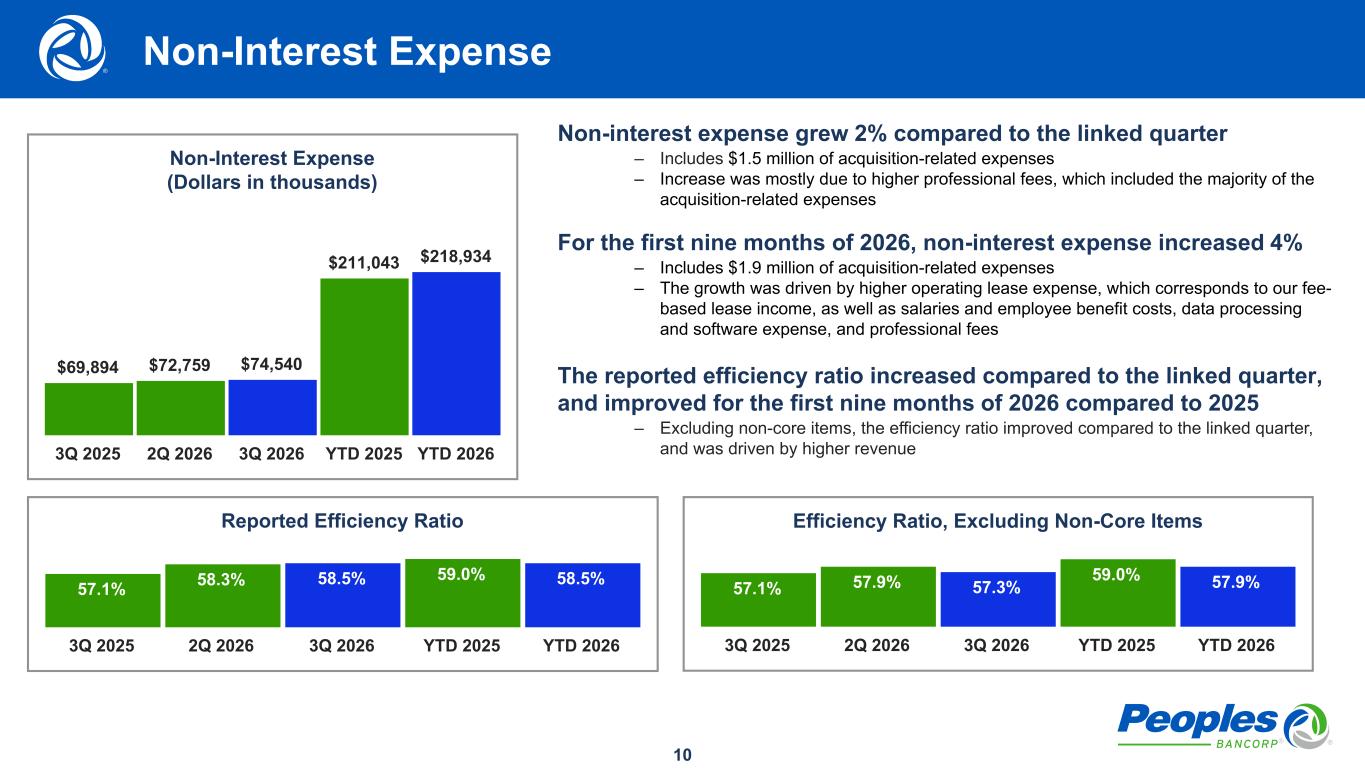
10 Non-interest expense grew 2% compared to the linked quarter – Includes $1.5 million of acquisition-related expenses – Increase was mostly due to higher professional fees, which included the majority of the acquisition-related expenses For the first nine months of 2026, non-interest expense increased 4% – Includes $1.9 million of acquisition-related expenses – The growth was driven by higher operating lease expense, which corresponds to our fee- based lease income, as well as salaries and employee benefit costs, data processing and software expense, and professional fees The reported efficiency ratio increased compared to the linked quarter, and improved for the first nine months of 2026 compared to 2025 – Excluding non-core items, the efficiency ratio improved compared to the linked quarter, and was driven by higher revenue Non-Interest Expense (Dollars in thousands) $69,894 $72,759 $74,540 $211,043 $218,934 3Q 2025 2Q 2026 3Q 2026 YTD 2025 YTD 2026 Non-Interest Expense Reported Efficiency Ratio 57.1% 58.3% 58.5% 59.0% 58.5% 3Q 2025 2Q 2026 3Q 2026 YTD 2025 YTD 2026 Efficiency Ratio, Excluding Non-Core Items 57.1% 57.9% 57.3% 59.0% 57.9% 3Q 2025 2Q 2026 3Q 2026 YTD 2025 YTD 2026
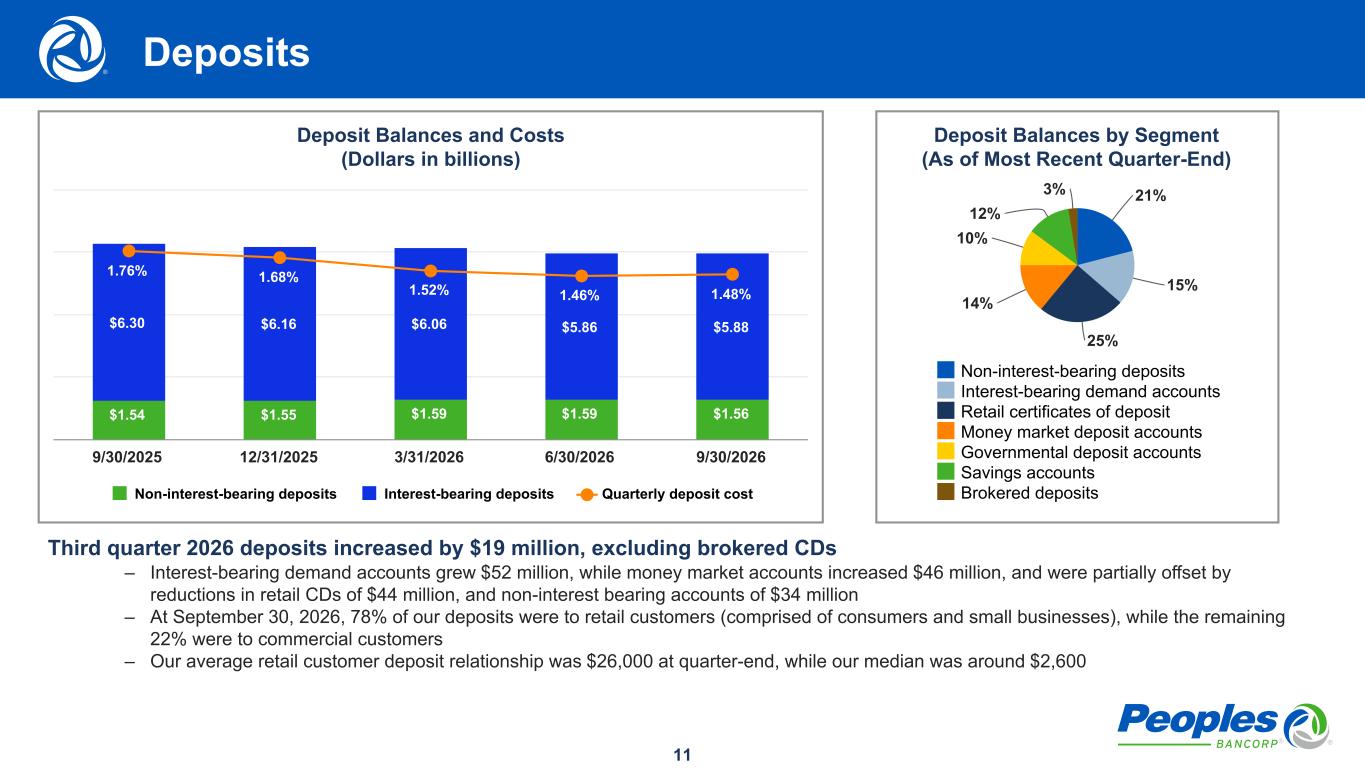
11 Deposit Balances by Segment (As of Most Recent Quarter-End) 21% 15% 25% 14% 10% 12% 3% Non-interest-bearing deposits Interest-bearing demand accounts Retail certificates of deposit Money market deposit accounts Governmental deposit accounts Savings accounts Brokered deposits Deposit Balances and Costs (Dollars in billions) $1.54 $1.55 $1.59 $1.59 $1.56 $6.30 $6.16 $6.06 $5.86 $5.88 1.76% 1.68% 1.52% 1.46% 1.48% Non-interest-bearing deposits Interest-bearing deposits Quarterly deposit cost 9/30/2025 12/31/2025 3/31/2026 6/30/2026 9/30/2026 Third quarter 2026 deposits increased by $19 million, excluding brokered CDs – Interest-bearing demand accounts grew $52 million, while money market accounts increased $46 million, and were partially offset by reductions in retail CDs of $44 million, and non-interest bearing accounts of $34 million – At September 30, 2026, 78% of our deposits were to retail customers (comprised of consumers and small businesses), while the remaining 22% were to commercial customers – Our average retail customer deposit relationship was $26,000 at quarter-end, while our median was around $2,600 Deposits
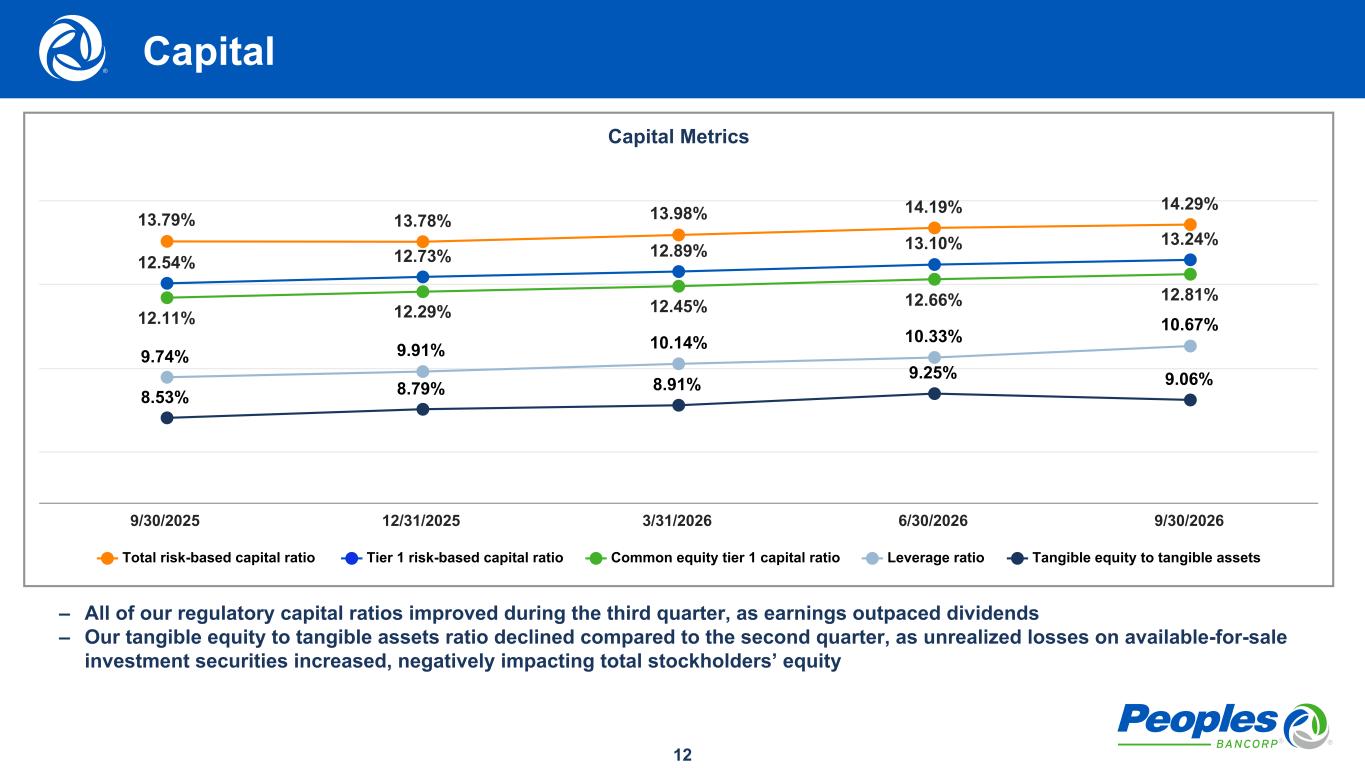
12 Capital Metrics 13.79% 13.78% 13.98% 14.19% 14.29% 12.54% 12.73% 12.89% 13.10% 13.24% 12.11% 12.29% 12.45% 12.66% 12.81% 9.74% 9.91% 10.14% 10.33% 10.67% 8.53% 8.79% 8.91% 9.25% 9.06% Total risk-based capital ratio Tier 1 risk-based capital ratio Common equity tier 1 capital ratio Leverage ratio Tangible equity to tangible assets 9/30/2025 12/31/2025 3/31/2026 6/30/2026 9/30/2026 – All of our regulatory capital ratios improved during the third quarter, as earnings outpaced dividends – Our tangible equity to tangible assets ratio declined compared to the second quarter, as unrealized losses on available-for-sale investment securities increased, negatively impacting total stockholders’ equity Capital
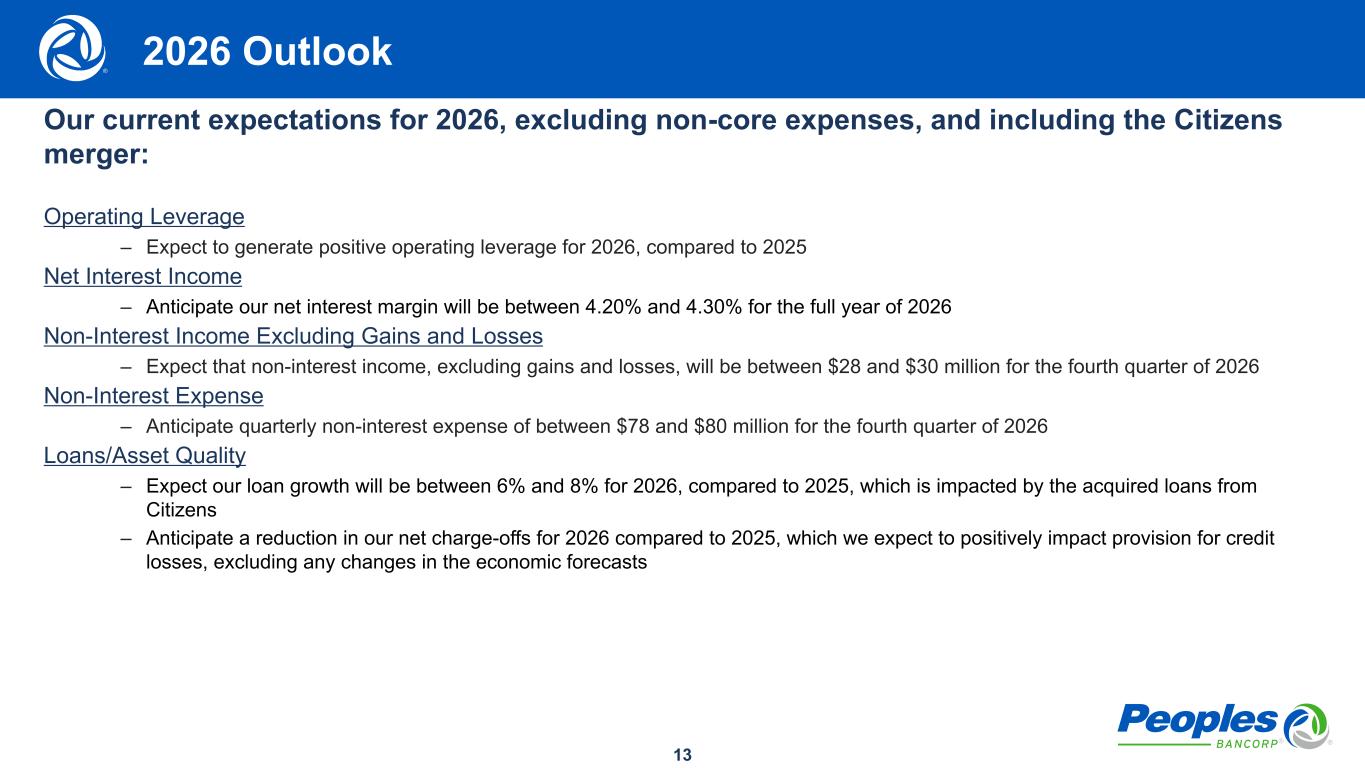
13 Our current expectations for 2026, excluding non-core expenses, and including the Citizens merger: Operating Leverage – Expect to generate positive operating leverage for 2026, compared to 2025 Net Interest Income – Anticipate our net interest margin will be between 4.20% and 4.30% for the full year of 2026 Non-Interest Income Excluding Gains and Losses – Expect that non-interest income, excluding gains and losses, will be between $28 and $30 million for the fourth quarter of 2026 Non-Interest Expense – Anticipate quarterly non-interest expense of between $78 and $80 million for the fourth quarter of 2026 Loans/Asset Quality – Expect our loan growth will be between 6% and 8% for 2026, compared to 2025, which is impacted by the acquired loans from Citizens – Anticipate a reduction in our net charge-offs for 2026 compared to 2025, which we expect to positively impact provision for credit losses, excluding any changes in the economic forecasts 2026 Outlook
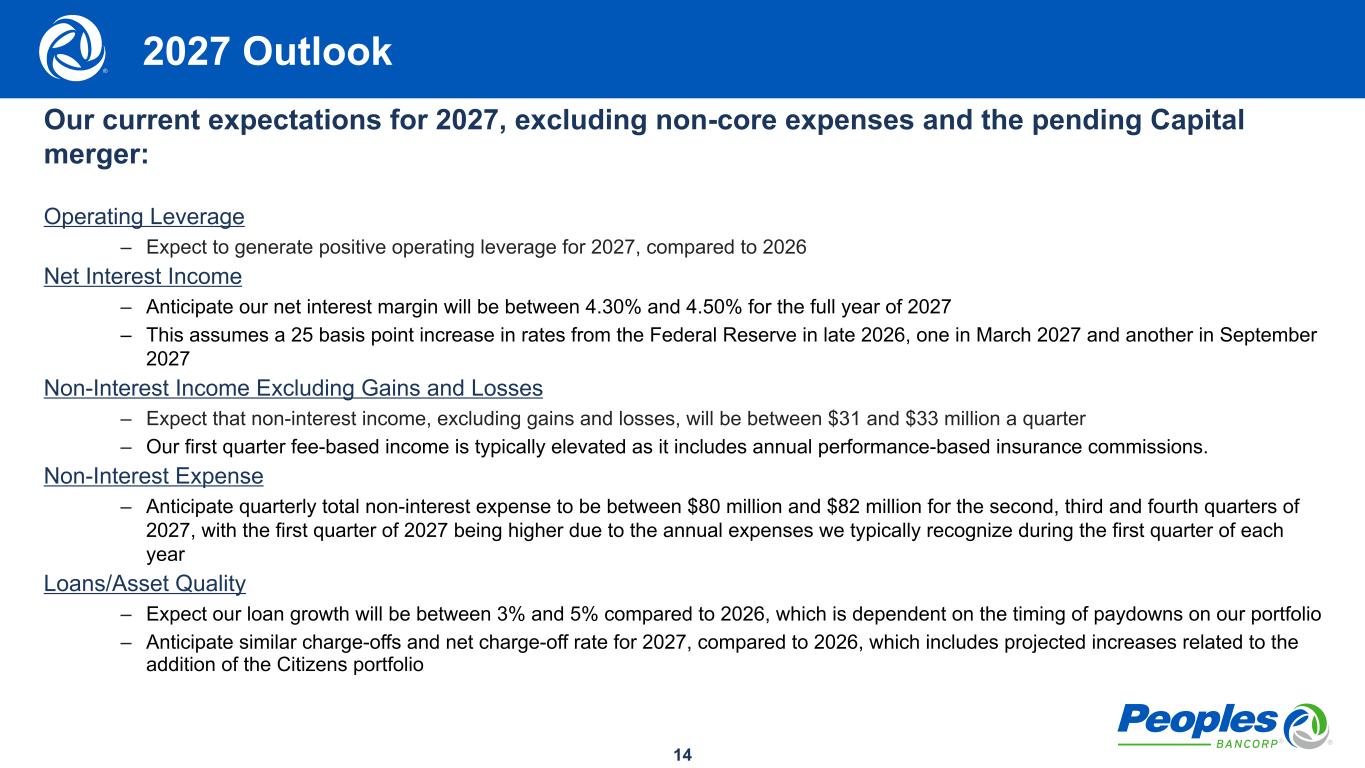
14 Our current expectations for 2027, excluding non-core expenses and the pending Capital merger: Operating Leverage – Expect to generate positive operating leverage for 2027, compared to 2026 Net Interest Income – Anticipate our net interest margin will be between 4.30% and 4.50% for the full year of 2027 – This assumes a 25 basis point increase in rates from the Federal Reserve in late 2026, one in March 2027 and another in September 2027 Non-Interest Income Excluding Gains and Losses – Expect that non-interest income, excluding gains and losses, will be between $31 and $33 million a quarter – Our first quarter fee-based income is typically elevated as it includes annual performance-based insurance commissions. Non-Interest Expense – Anticipate quarterly total non-interest expense to be between $80 million and $82 million for the second, third and fourth quarters of 2027, with the first quarter of 2027 being higher due to the annual expenses we typically recognize during the first quarter of each year Loans/Asset Quality – Expect our loan growth will be between 3% and 5% compared to 2026, which is dependent on the timing of paydowns on our portfolio – Anticipate similar charge-offs and net charge-off rate for 2027, compared to 2026, which includes projected increases related to the addition of the Citizens portfolio 2027 Outlook
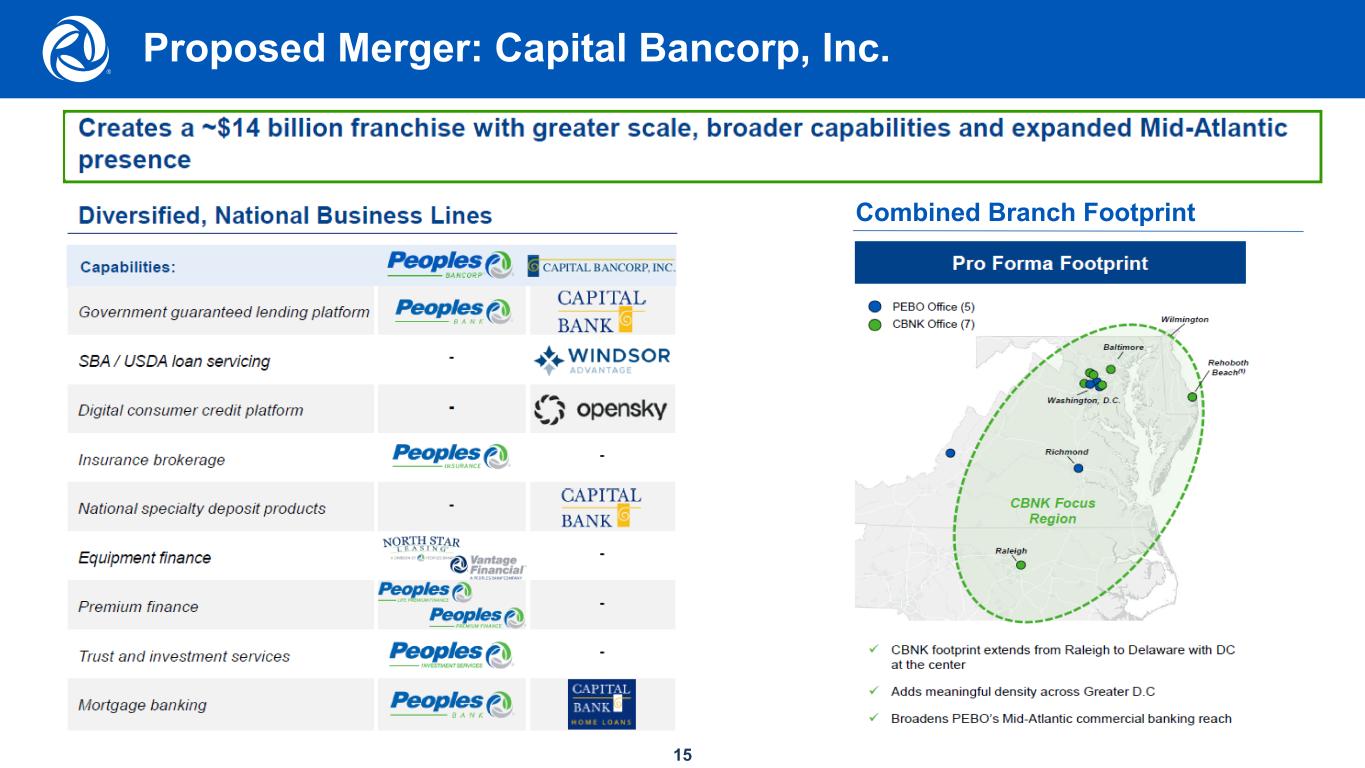
15 Proposed Merger: Capital Bancorp, Inc. Combined Branch Footprint