☒ QUARTERLY REPORT PURSUANT TO SECTION 13 OR 15(d) OF THESECURITIES EXCHANGE ACT OF 1934
For the quarterly period ended March 31, 2024
or
☐ TRANSITION REPORT PURSUANT TO SECTION 13 OR 15(d) OF THE SECURITIES EXCHANGE ACT OF 1934
For the transition period from _____ to ________
Commission File Number: 001-08052
GLOBE LIFE INC.
(Exact name of registrant as specified in its charter)
Delaware
63-0780404
(State or other jurisdiction of incorporation or organization)
(I.R.S. Employer Identification No.)
3700 South Stonebridge Drive, McKinney, Texas75070
(Address of principal executive offices) (Zip Code)
(972) 569-4000
(Registrant’s telephone number, including area code)
NONE
(Former name, former address and former fiscal year, if changed since last report)
Securities registered pursuant to Section 12(b) of the Act:
Title of each class
Trading Symbol(s)
Name of each exchange on which registered
Common Stock, $1.00 par value per share
GL
New York Stock Exchange
4.250% Junior Subordinated Debentures
GL PRD
New York Stock Exchange
Indicate by check mark whether the registrant (1) has filed all reports required to be filed by Section 13 or 15(d) of the Securities Exchange Act of 1934 during the preceding 12 months (or for such shorter period that the registrant was required to file such reports), and (2) has been subject to such filing requirements for the past 90 days. Yes☒ No ☐
Indicate by check mark whether the registrant has submitted electronically every Interactive Data File required to be submitted pursuant to Rule 405 of Regulation S-T (§232.405 of this chapter) during the preceding 12 months (or for such shorter period that the registrant was required to submit such files). Yes☒ No ☐
Indicate by check mark whether the registrant is a large accelerated filer, an accelerated filer, a non-accelerated filer, a smaller reporting company, or an emerging growth company. See the definitions of “large accelerated filer,” “accelerated filer,” “smaller reporting company,” and "emerging growth company" in Rule 12b-2 of the Exchange Act.
Large accelerated filer
☒
Accelerated filer
☐
Non-accelerated filer
☐
Smaller reporting company
☐
Emerging growth company
☐
If an emerging growth company, indicate by check mark if the registrant has elected not to use the extended transition period for complying with any new or revised financial accounting standards provided pursuant to Section 13(a) of the Exchange Act.
☐
Indicate by check mark whether the registrant is a shell company (as defined in Rule 12b-2 of the Exchange Act). Yes ☐ No ☒
Indicate the number of shares outstanding of each of the issuer’s classes of common stock, as of the latest practicable date.
As used in this Form 10-Q, “Globe Life,” the “Company,” “we,” “our” and “us” refer to Globe Life Inc., a Delaware corporation incorporated in 1979, its subsidiaries and affiliates.
(Dollar amounts in thousands, except per share data)
Three Months Ended March 31,
2024
2023
Revenue:
Life premium
$
804,265
$
772,597
Health premium
341,019
322,493
Other premium
—
—
Total premium
1,145,284
1,095,090
Net investment income
282,578
257,105
Realized gains (losses)
(11,799)
(30,927)
Other income
76
50
Total revenue
1,416,139
1,321,318
Benefits and expenses:
Life policyholder benefits(1)
519,871
507,977
Health policyholder benefits(2)
202,327
190,962
Other policyholder benefits
9,595
8,988
Total policyholder benefits
731,793
707,927
Amortization of deferred acquisition costs
99,478
92,322
Commissions, premium taxes, and non-deferred acquisition costs
148,110
137,797
Other operating expense
93,214
84,171
Interest expense
28,621
24,867
Total benefits and expenses
1,101,216
1,047,084
Income before income taxes
314,923
274,234
Income tax benefit (expense)
(60,706)
(50,624)
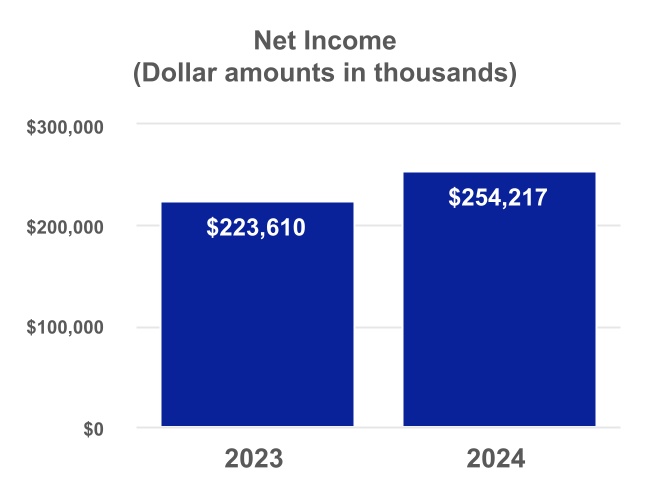
Net income
$
254,217
$
223,610
Basic net income per common share
$
2.71
$
2.32
Diluted net income per common share
$
2.67
$
2.28
(1)Net of a remeasurement gain of $4.9 million for the three months ended March 31, 2024, and a remeasurement gain of $2.7 million for the same period in 2023.
(2)Net of a remeasurement gain of $3.2 million for the three months ended March 31, 2024, and a remeasurement loss of $2.0 million for the same period in 2023.
See accompanying Notes to Condensed Consolidated Financial Statements.
Notes to Condensed Consolidated Financial Statements
(Dollar amounts in thousands, except per share data)
Note 1—Significant Accounting Policies
Business: (Globe Life), (the Company), refers to Globe Life Inc., an insurance holding company incorporated in Delaware in 1979, and Globe Life Inc. subsidiaries and affiliates. Globe Life Inc.'s direct or indirect primary subsidiaries are Globe Life And Accident Insurance Company, American Income Life Insurance Company, Liberty National Life Insurance Company, Family Heritage Life Insurance Company of America, and United American Insurance Company. The underwriting companies are owned by their ultimate corporate parent, Globe Life Inc. (Parent Company).
Globe Life provides a variety of life and supplemental health insurance products and annuities to a broad base of customers. The Company is organized into four reportable segments: life insurance, supplemental health insurance, annuities, and investments.
Globe Life markets its insurance products through a number of distribution channels, each of which sells the products of one or more of Globe Life's insurance segments. Our distribution channels consist of the following exclusive agencies: American Income Life Division (American Income), Liberty National Division (Liberty National) and Family Heritage Division (Family Heritage); an independent agency, United American Division (United American); and our Direct to Consumer Division (DTC).
Basis of Presentation: The accompanying condensed consolidated financial statements of Globe Life have been prepared in accordance with the instructions to Form 10-Q. Therefore, they do not include all of the disclosures required by accounting principles generally accepted in the United States of America (GAAP) for annual financial statements. However, in the opinion of management, these statements include all adjustments, consisting of normal recurring adjustments, which are necessary for a fair presentation of the condensed consolidated financial position at March 31, 2024, and the condensed consolidated results of operations, comprehensive income, and cash flows for the periods ended March 31, 2024 and 2023. The interim period condensed consolidated financial statements should be read in conjunction with the Consolidated Financial Statements that are included in the Form 10-K filed with the Securities Exchange Commission (SEC) on February 28, 2024.
Use of Estimates: The preparation of the condensed consolidated financial statements in conformity with GAAP requires management to make estimates and assumptions that affect the reported amounts of assets and liabilities and disclosure of contingent liabilities at the date of the condensed consolidated financial statements and the reported amounts of revenues and expenses during the reporting period. Actual results could differ from those estimates. See further documentation in the significant accounting policies or the accompanying notes.
Notes to Condensed Consolidated Financial Statements
(Dollar amounts in thousands, except per share data)
Note 2—New Accounting Standards
Accounting Pronouncements Adopted in the Current Year
Standard
Description
Effective Date
Effect on the Condensed Consolidated Financial Statements
ASU No. 2022-03,Fair Value Measurement (Topic 820): Fair Value Measurement of Equity Securities Subject to Contractual Sale Restrictions
ASU 2022-03 adds disclosure requirements specific to equity securities subject to contractual sale restrictions. The disclosures clarify the nature of the contractual sale as well as the duration of the restriction and the circumstances that could cause a lapse in the restriction.
This standard is effective for the Company for fiscal years beginning on January 1, 2024 and interim periods within those fiscal years.
The adoption of this standard did not have a material impact on the Condensed Consolidated Financial Statements.
Accounting Pronouncements Yet to be Adopted
Standard
Description
Effective Date
Effect on the Condensed Consolidated Financial Statements
ASU 2023-07 adds disclosure requirements to segment expenses, improving the financial reporting of the entity’s overall performance and assessment of future cash flows. The disclosures will require more detailed information related to the entity’s reportable segments.
This standard is effective for the Company for annual periods beginning on January 1, 2024 and for interim periods beginning on January 1, 2025, and will be implemented on a retrospective basis.
The Company does not expect the standard will have a material impact on the Condensed Consolidated Financial Statements.
ASU No. 2023-09,Income Taxes (Topic 740): Improvements to Income Tax Disclosures
ASU 2023-09 adds disclosure requirements to disaggregated information related to the effective tax rate reconciliation and information on income taxes paid. The disclosures will enhance the assessment of the entity’s operations and related tax risks.
This standard is effective for the Company for annual periods beginning on January 1, 2025, and will be implemented on a prospective basis.
The Company does not expect the standard will have a material impact on the Condensed Consolidated Financial Statements.
Notes to Condensed Consolidated Financial Statements
(Dollar amounts in thousands, except per share data)
Note 3—Supplemental Information about Changes to Accumulated Other Comprehensive Income
Components of Accumulated Other Comprehensive Income: An analysis of the change in balance by component of Accumulated Other Comprehensive Income is as follows for the three month periods ended March 31, 2024 and 2023:
Three Months Ended March 31, 2024
Available for Sale Assets
Future Policy Benefits
Foreign Exchange
Pension Adjustments
Total
Balance at January 1, 2024
$
(827,596)
$
(1,947,391)
$
4,719
$
(2,151)
$
(2,772,419)
Other comprehensive income (loss) before reclassifications, net of tax
(239,684)
556,632
(9,951)
—
306,997
Reclassifications, net of tax
(1,905)
—
—
91
(1,814)
Other comprehensive income (loss)
(241,589)
556,632
(9,951)
91
305,183
Balance at March 31, 2024
$
(1,069,185)
$
(1,390,759)
$
(5,232)
$
(2,060)
$
(2,467,236)
Three Months Ended March 31, 2023
Available for Sale Assets
Future Policy Benefits
Foreign Exchange
Pension Adjustments
Total
Balance at January 1, 2023
$
(1,420,672)
$
(1,369,204)
$
(1,681)
$
1,244
$
(2,790,313)
Other comprehensive income (loss) before reclassifications, net of tax
378,162
(569,503)
(5,148)
—
(196,489)
Reclassifications, net of tax
25,746
—
—
(37)
25,709
Other comprehensive income (loss)
403,908
(569,503)
(5,148)
(37)
(170,780)
Balance at March 31, 2023
$
(1,016,764)
$
(1,938,707)
$
(6,829)
$
1,207
$
(2,961,093)
Reclassification Adjustments: Reclassification adjustments out of Accumulated Other Comprehensive Income are presented below for the three month periods ended March 31, 2024 and 2023.
Three Months Ended March 31,
Affected line items in the Statements of Operations
Component Line Item
2024
2023
Unrealized investment (gains) losses on available for sale assets:
Notes to Condensed Consolidated Financial Statements
(Dollar amounts in thousands, except per share data)
Note 4—Investments
Portfolio Composition: Summaries of fixed maturities available for sale by amortized cost, fair value, and allowance for credit losses at March 31, 2024 and December 31, 2023, and the corresponding amounts of gross unrealized gains and losses recognized in accumulated other comprehensive income (loss) are as follows. Redeemable preferred stock is included within "Corporates, by sector."
At March 31, 2024
Amortized Cost
Allowance for Credit Losses
Gross Unrealized Gains
Gross Unrealized Losses
Fair
Value(1)
% of Total
Fixed
Maturities(2)
Fixed maturities available for sale:
U.S. Government direct, guaranteed, and government-sponsored enterprises
$
401,859
$
—
$
1
$
(39,039)
$
362,821
2
States, municipalities, and political subdivisions
3,301,276
—
38,251
(454,605)
2,884,922
16
Foreign governments
39,558
—
—
(10,227)
29,331
—
Corporates, by sector:
Industrials
8,297,566
(7,027)
161,482
(667,927)
7,784,094
43
Financial
5,213,973
—
89,584
(416,724)
4,886,833
27
Utilities
2,127,792
—
51,901
(105,623)
2,074,070
11
Total corporates
15,639,331
(7,027)
302,967
(1,190,274)
14,744,997
81
Collateralized debt obligations
36,730
—
3,001
—
39,731
—
Other asset-backed securities
86,030
—
2
(3,481)
82,551
1
Total fixed maturities
$
19,504,784
$
(7,027)
$
344,222
$
(1,697,626)
$
18,144,353
100
(1)Amount reported in the balance sheet.
(2)At fair value.
At December 31, 2023
Amortized Cost
Allowance for Credit Losses
Gross Unrealized Gains
Gross Unrealized Losses
Fair
Value(1)
% of Total
Fixed
Maturities(2)
Fixed maturities available for sale:
U.S. Government direct, guaranteed, and government-sponsored enterprises
$
398,450
$
—
$
7
$
(32,306)
$
366,151
2
States, municipalities, and political subdivisions
Notes to Condensed Consolidated Financial Statements
(Dollar amounts in thousands, except per share data)
The Company has exposure to real estate investment trusts with an average rating of BBB+, which had a fair value of $415 million (2% of the total fixed maturity portfolio) and $425 million (2% of the total fixed maturity portfolio) at March 31, 2024 and December 31, 2023, respectively.
A schedule of fixed maturities available for sale by contractual maturity date at March 31, 2024, is shown below on an amortized cost basis, net of allowance for credit losses, and on a fair value basis. Actual disposition dates could differ from contractual maturities due to call or prepayment provisions.
At March 31, 2024
Amortized Cost, net
Fair Value
Fixed maturities available for sale:
Due in one year or less
$
86,769
$
86,518
Due after one year through five years
857,913
862,187
Due after five years through ten years
2,034,083
2,040,670
Due after ten years through twenty years
8,712,181
8,331,022
Due after twenty years
7,684,013
6,701,637
Mortgage-backed and asset-backed securities
122,798
122,319
$
19,497,757
$
18,144,353
Analysis of Investment Operations:"Net investment income" for the three month periods ended March 31, 2024 and 2023 is summarized as follows:
Three Months Ended March 31,
2024
2023
% Change
Fixed maturities available for sale
$
246,098
$
232,299
6
Policy loans
12,816
11,755
9
Mortgage loans
6,760
4,003
69
Other long-term investments(1)
19,663
11,740
67
Short-term investments
1,688
1,595
287,025
261,392
10
Less investment expense
(4,447)
(4,287)
4
Net investment income
$
282,578
$
257,105
10
(1)For the three months ended March 31, 2024 and 2023, the investment funds, accounted for under the fair value option method, recorded $18.9 million and $11.3 million, respectively, in net investment income. Refer to Other Long-Term Investmentsbelowfor further discussion on the investment funds.
Notes to Condensed Consolidated Financial Statements
(Dollar amounts in thousands, except per share data)
Selected information about sales of fixed maturities available for sale is as follows:
Three Months Ended March 31,
2024
2023
Fixed maturities available for sale:
Proceeds from sales(1)
$
27,853
$
15,705
Gross realized gains
175
—
Gross realized losses
(35)
(358)
(1)There were no unsettled sales in the periods ended March 31, 2024 and 2023.
An analysis of "Realized gains (losses)" is as follows:
Three Months Ended March 31,
2024
2023
Realized investment gains (losses):
Fixed maturities available for sale:
Sales and other(1)
$
140
$
(357)
Provision for credit losses
88
(32,767)
Fair value option—change in fair value
(15,403)
1,858
Mortgage loans
(874)
(1,280)
Other investments
314
(214)
Realized gains (losses) from investments
(15,735)
(32,760)
Other gains (losses)
3,936
1,833
Total realized gains (losses)
(11,799)
(30,927)
Applicable tax
2,478
6,495
Realized gains (losses), net of tax
$
(9,321)
$
(24,432)
(1)During the three months ended March 31, 2024 and 2023, the Company recorded $66.9 million and $0 of issuer-initiated exchanges of fixed maturities (noncash transactions) that resulted in no realized gains (losses) in either period.
Notes to Condensed Consolidated Financial Statements
(Dollar amounts in thousands, except per share data)
Fair Value Measurements:The following tables represent the fair value of fixed maturities measured on a recurring basis at March 31, 2024 and December 31, 2023:
Fair Value Measurement at March 31, 2024:
Quoted Prices in Active Markets for Identical Assets (Level 1)
Significant Other Observable Inputs (Level 2)
Significant Unobservable Inputs (Level 3)
Total Fair Value
Fixed maturities available for sale
U.S. Government direct, guaranteed, and government-sponsored enterprises
$
—
$
362,821
$
—
$
362,821
States, municipalities, and political subdivisions
—
2,884,922
—
2,884,922
Foreign governments
—
29,331
—
29,331
Corporates, by sector:
Industrials
—
7,584,006
200,088
7,784,094
Financial
—
4,756,052
130,781
4,886,833
Utilities
—
1,967,375
106,695
2,074,070
Total corporates
—
14,307,433
437,564
14,744,997
Collateralized debt obligations
—
—
39,731
39,731
Other asset-backed securities
—
82,551
—
82,551
Total fixed maturities
$
—
$
17,667,058
$
477,295
$
18,144,353
Percentage of total
—
%
97
%
3
%
100
%
Fair Value Measurement at December 31, 2023:
Quoted Prices in Active Markets for Identical Assets (Level 1)
Significant Other Observable Inputs (Level 2)
Significant Unobservable Inputs (Level 3)
Total Fair Value
Fixed maturities available for sale
U.S. Government direct, guaranteed, and government-sponsored enterprises
$
—
$
366,151
$
—
$
366,151
States, municipalities, and political subdivisions
Notes to Condensed Consolidated Financial Statements
(Dollar amounts in thousands, except per share data)
The following tables represent changes in fixed maturities measured at fair value on a recurring basis using significant unobservable inputs (Level 3):
Analysis of Changes in Fair Value Measurements Using Significant Unobservable Inputs (Level 3)
Asset-
backed Securities
Collateralized Debt Obligations
Corporates
Total
Balance at January 1, 2024
$
—
$
42,146
$
454,733
$
496,879
Included in realized gains / losses
—
—
—
—
Included in other comprehensive income
—
(2,035)
(5,996)
(8,031)
Acquisitions
—
—
7,800
7,800
Sales
—
—
—
—
Amortization
—
1,141
(4)
1,137
Other(1)
—
(1,521)
(18,969)
(20,490)
Transfers into Level 3(2)
—
—
—
—
Transfers out of Level 3(2)
—
—
—
—
Balance at March 31, 2024
$
—
$
39,731
$
437,564
$
477,295
Percent of total fixed maturities
—
%
—
%
3
%
3
%
(1)Includes capitalized interest, foreign exchange adjustments, and principal repayments.
(2)Considered to be transferred at the end of the period. Transfers into Level 3 occur when observable inputs are no longer available. Transfers out of Level 3 occur when observable inputs become available.
Analysis of Changes in Fair Value Measurements Using Significant Unobservable Inputs (Level 3)
Asset-
backed Securities
Collateralized Debt Obligations
Corporates
Total
Balance at January 1, 2023
$
—
$
50,364
$
478,083
$
528,447
Included in realized gains / losses
—
—
—
—
Included in other comprehensive income
—
(4,542)
5,370
828
Acquisitions
—
—
—
—
Sales
—
—
—
—
Amortization
—
1,141
2
1,143
Other(1)
—
(1,461)
(11,816)
(13,277)
Transfers into Level 3(2)
—
—
—
—
Transfers out of Level 3(2)
—
—
—
—
Balance at March 31, 2023
$
—
$
45,502
$
471,639
$
517,141
Percent of total fixed maturities
—
%
—
%
3
%
3
%
(1)Includes capitalized interest, foreign exchange adjustments, and principal repayments.
(2)Considered to be transferred at the end of the period. Transfers into Level 3 occur when observable inputs are no longer available. Transfers out of Level 3 occur when observable inputs become available.
Notes to Condensed Consolidated Financial Statements
(Dollar amounts in thousands, except per share data)
The following table presents changes in unrealized gains and losses for the period included in accumulated other comprehensive income for assets held at the end of the reporting period for Level 3 classification:
Changes in Unrealized Gains (Losses) included in Accumulated Other Comprehensive Income for Assets Held at the End of the Period
Asset- backed Securities
Collateralized Debt Obligations
Corporates
Total
At March 31, 2024
$
—
$
(2,035)
$
(5,996)
$
(8,031)
At March 31, 2023
—
(4,542)
5,370
828
Unrealized Loss Analysis: The following table discloses information about fixed maturities available for sale in an unrealized loss position.
Less than Twelve Months
Twelve Months or Longer
Total
Number of issues (CUSIPs) held:
As of March 31, 2024
350
1,654
2,004
As of December 31, 2023
151
1,614
1,765
Globe Life's entire fixed maturity portfolio consisted of 2,551 issues by 991 different issuers at March 31, 2024 and 2,473 issues by 980 different issuers at December 31, 2023. The increase in the number of securities in an unrealized loss position during the period ended March 31, 2024 is due to the increase in interest rates. The weighted-average quality rating of all unrealized loss positions at amortized cost was A- as of March 31, 2024 and December 31, 2023.
Notes to Condensed Consolidated Financial Statements
(Dollar amounts in thousands, except per share data)
The following tables disclose unrealized investment losses by class and major sector of fixed maturities available for sale at March 31, 2024 and December 31, 2023.
Analysis of Gross Unrealized Investment Losses
At March 31, 2024
Less than Twelve Months
Twelve Months or Longer
Total
Fair Value
Unrealized Loss
Fair Value
Unrealized Loss
Fair Value
Unrealized Loss
Fixed maturities available for sale:
Investment grade securities:
U.S. Government direct, guaranteed, and government-sponsored enterprises
$
2,033
$
(66)
$
360,438
$
(38,973)
$
362,471
$
(39,039)
States, municipalities, and political subdivisions
479,111
(7,440)
1,648,303
(447,165)
2,127,414
(454,605)
Foreign governments
1,469
(5)
27,862
(10,222)
29,331
(10,227)
Corporates, by sector:
Industrials
692,151
(25,399)
4,221,438
(613,109)
4,913,589
(638,508)
Financial
361,061
(3,813)
2,419,494
(369,671)
2,780,555
(373,484)
Utilities
284,655
(3,438)
681,618
(100,695)
966,273
(104,133)
Total corporates
1,337,867
(32,650)
7,322,550
(1,083,475)
8,660,417
(1,116,125)
Collateralized debt obligations
—
—
—
—
—
—
Other asset-backed securities
—
—
71,424
(2,980)
71,424
(2,980)
Total investment grade securities
1,820,480
(40,161)
9,430,577
(1,582,815)
11,251,057
(1,622,976)
Below investment grade securities:
Corporates, by sector:
Industrials
—
—
146,466
(29,419)
146,466
(29,419)
Financial
8,704
(1,403)
166,838
(41,837)
175,542
(43,240)
Utilities
8,902
(27)
19,713
(1,463)
28,615
(1,490)
Total corporates
17,606
(1,430)
333,017
(72,719)
350,623
(74,149)
Collateralized debt obligations
—
—
—
—
—
—
Other asset-backed securities
—
—
11,079
(501)
11,079
(501)
Total below investment grade securities
17,606
(1,430)
344,096
(73,220)
361,702
(74,650)
Total fixed maturities
$
1,838,086
$
(41,591)
$
9,774,673
$
(1,656,035)
$
11,612,759
$
(1,697,626)
Gross unrealized losses may fluctuate quarter over quarter due to adverse factors in the market that affect our holdings, such as changes in interest rates or credit spreads. The Company considers many factors when determining whether an allowance for a credit loss should be recorded. While the Company holds securities that may be in an unrealized loss position from time to time, Globe Life does not generally intend to sell and it is unlikely that the Company will be required to sell the fixed maturities prior to their anticipated recovery or maturity due to the strong cash flows generated by its insurance operations.
Notes to Condensed Consolidated Financial Statements
(Dollar amounts in thousands, except per share data)
Fixed Maturities, Allowance for Credit Losses: A summary of the activity in the allowance for credit losses is as follows.
Three Months Ended March 31,
2024
2023
Allowance for credit losses beginning balance
$
7,115
$
—
Additions to allowance for which credit losses were not previously recorded
—
32,767
Additions (reductions) to allowance for fixed maturities that previously had an allowance
(88)
—
Reduction of allowance for which the Company intends to sell or more likely than not will be required to sell or sold during the period
—
—
Allowance for credit losses ending balance
$
7,027
$
32,767
As of March 31, 2024 and December 31, 2023, the Company did not have any fixed maturities in non-accrual status.
Mortgage Loans (commercial mortgage loans):Summaries of commercial mortgage loans by property type and geographical location at March 31, 2024 and December 31, 2023 are as follows:
March 31, 2024
December 31, 2023
Carrying Value
% of Total
Carrying Value
% of Total
Property type:
Multi-family
$
117,147
36
$
116,299
42
Industrial
81,975
25
57,267
20
Retail
46,822
14
23,925
9
Hospitality
43,634
13
43,897
16
Mixed use
37,267
11
34,749
12
Office
6,734
2
6,734
2
Total recorded investment
333,579
101
282,871
101
Less allowance for credit losses
(4,546)
(1)
(3,672)
(1)
Carrying value, net of allowance for credit losses
$
329,033
100
$
279,199
100
March 31, 2024
December 31, 2023
Carrying Value
% of Total
Carrying Value
% of Total
Geographic location:
Florida
$
60,587
18
$
48,233
17
California
57,093
17
54,721
20
Texas
53,399
16
45,111
16
New Jersey
44,592
14
44,574
16
New York
35,142
11
20,284
7
Washington
14,978
4
14,969
5
Other
67,788
21
54,979
20
Total recorded investment
333,579
101
282,871
101
Less allowance for credit losses
(4,546)
(1)
(3,672)
(1)
Carrying value, net of allowance for credit losses
Notes to Condensed Consolidated Financial Statements
(Dollar amounts in thousands, except per share data)
The following tables are reflective of the key factors, debt service coverage ratios, and loan-to-value (LTV) ratios that are utilized by management to monitor the performance of the portfolios. The Company only makes new investments in commercial mortgage loans that have a LTV ratio less than 80%. LTV's that exceed 80% are generally as a result of decreases in the valuation of the underlying property. Generally, a higher LTV ratio and a lower debt service coverage ratio equates to higher risk of loss.
March 31, 2024
Recorded Investment
Debt Service Coverage Ratios(1)
<1.00x
1.00x—1.20x
>1.20x
Total
% of Gross Total
Loan-to-value ratio(2):
Less than 70%
$
35,492
$
155,974
$
125,457
$
316,923
95
70% to 80%
—
—
—
—
—
81% to 90%
9,621
—
—
9,621
3
Greater than 90%
7,035
—
—
7,035
2
Total
$
52,148
$
155,974
$
125,457
333,579
100
Less allowance for credit losses
(4,546)
Total, net of allowance for credit losses
$
329,033
(1)Annual net operating income divided by annual mortgage debt service (principal and interest).
(2)Loan balance divided by appraised value at origination, including planned renovations and stabilized occupancy. Updated internal valuations are used when a loan is materially underperforming.
December 31, 2023
Recorded Investment
Debt Service Coverage Ratios(1)
<1.00x
1.00x—1.20x
>1.20x
Total
% of Gross Total
Loan-to-value ratio(2):
Less than 70%
$
27,091
$
180,761
$
58,364
$
266,216
94
70% to 80%
—
—
—
—
—
81% to 90%
8,468
—
1,153
9,621
3
Greater than 90%
7,034
—
—
7,034
3
Total
$
42,593
$
180,761
$
59,517
282,871
100
Less allowance for credit losses
(3,672)
Total, net of allowance for credit losses
$
279,199
(1)Annual net operating income divided by annual mortgage debt service (principal and interest).
(2)Loan balance divided by appraised value at origination, including planned renovations and stabilized occupancy. Updated internal valuations are used when a loan is materially underperforming.
As of March 31, 2024, the Company evaluated the commercial mortgage loan portfolio on a pool basis to determine the allowance for credit losses. At the end of the period, the Company had 32 loans in the portfolio. For the three months ended March 31, 2024, the allowance for credit losses increased by $874 thousand to $4.5 million. The provision for credit losses is included in "Realized gains (losses)" in the Condensed Consolidated Statements of Operations.
Notes to Condensed Consolidated Financial Statements
(Dollar amounts in thousands, except per share data)
There was one delinquent commercial mortgage loan, with an outstanding par value of $3.7 million and outstanding interest due of $116 thousand, as of March 31, 2024. The underlying collateral for this loan is in the process of being sold and the Company expects to recover all interest and principal due as of March 31, 2024. There were no delinquent commercial mortgage loans as of December 31, 2023. As of March 31, 2024, the Company had one commercial mortgage loan in non-accrual status with a principal balance of $4.4 million. As of December 31, 2023, the Company had no commercial mortgage loans in non-accrual status. The Company's unfunded commitment balance to commercial loan borrowers was $29 million as of March 31, 2024.
Other Long-Term Investments: Other long-term investments consist of the following assets:
March 31, 2024
December 31, 2023
Investment funds
$
844,916
$
795,583
Other
54,169
40,295
Total
$
899,085
$
835,878
The following table presents additional information about the Company's investment funds as of March 31, 2024 and December 31, 2023 at fair value:
Fair Value
Unfunded Commitments
Investment Category
March 31, 2024
December 31, 2023
March 31, 2024
Redemption Term/Notice(1)
Commercial mortgage loans
$
459,549
$
411,315
$
489,617
Fully redeemable and non-redeemable with varying terms.
Opportunistic and private credit
180,019
181,410
125,844
Fully redeemable and non-redeemable with varying terms.
Infrastructure
165,441
165,887
16,706
Fully redeemable and non-redeemable with varying terms.
Other
39,907
36,971
53,752
Non-redeemable with varying terms
Total investment funds
$
844,916
$
795,583
$
685,919
(1)Non-redeemable funds generally have an expected life of 7 to 12 years from fund closing with extension options of 1 to 4 years. Redemptions are paid out throughout the life of the funds at the General Partner's discretion. Redeemable funds can generally be redeemed over 6 to 36 months upon request from limited partners.
The Company had $67 million of capital called during the period from existing investment funds. The Company's unfunded commitments were $686 million as of March 31, 2024.
Note 5—Commitments and Contingencies
Guarantees: The Parent Company has guaranteed letters of credit in connection with its credit facility with a group of banks. The letters of credit were issued by TMK Re, Ltd., a wholly-owned subsidiary, to secure TMK Re, Ltd.’s obligation for claims on certain policies reinsured by TMK Re, Ltd. that were sold by other Globe Life insurance subsidiaries. These letters of credit facilitate TMK Re, Ltd.’s ability to reinsure the business of Globe Life's insurance carriers. The agreement was amended on March 29, 2024 and now expires in 2029. The maximum amount of letters of credit available is $250 million. The Parent Company would be liable to the extent that TMK Re, Ltd. does not pay the reinsured party. The amount of letters of credit outstanding at March 31, 2024 was $115 million.
Litigation: Globe Life Inc. and its subsidiaries, in common with the insurance industry in general, are subject to litigation, including: putative class action litigation; alleged breaches of contract; torts, including bad faith and fraud claims based on alleged wrongful or fraudulent acts of agents of the Parent Company's insurance subsidiaries; alleged employment discrimination; alleged worker misclassification; and miscellaneous other causes of action. Based upon information presently available, and in light of legal and other factual defenses available to the Parent Company and its subsidiaries, management does not believe that it is reasonably possible that such litigation will
Notes to Condensed Consolidated Financial Statements
(Dollar amounts in thousands, except per share data)
have a material adverse effect on Globe Life's financial condition, future operating results or liquidity; however, assessing the eventual outcome of litigation necessarily involves forward-looking speculation as to judgments to be made by judges, juries and appellate courts in the future. This bespeaks caution, particularly in states with reputations for high punitive damage verdicts.
On September 30, 2022, putative class action litigation was filed against American Income, Giglione-Ackerman Agency, LLC, Eric Giglione and David Ackerman (collectively, “Defendants”) in New Jersey Superior Court (Atiya Bell, et al. v. American Income Life Insurance Company, et al., Case No. MID-L-004928-22). American Income subsequently removed the case to United States District Court for the District of New Jersey (Case No. 2:22-cv-06913-CCC-MAH). Plaintiffs Atiya Bell and Abel Flores (“Plaintiffs”) are former New Jersey independent sales agents who alleged they should have been classified as employees, and asserted claims under New Jersey state law on behalf of (i) a putative class of registered agents in New Jersey who have worked remotely for at least one week since March 9, 2020, and (ii) a putative class of registered agents in New Jersey who trained for at least one week to become sales agents for American Income in New Jersey during the six years prior to September 30, 2022. Plaintiffs made claims under the New Jersey Wage and Hour Law and the New Jersey Wage Payment Law for the alleged failure to pay minimum wages and overtime pay, including for time spent in training, liquidated damages and attorney’s fees and costs. American Income filed a motion to compel this matter to arbitration pursuant to the arbitration clauses found in the agent contracts executed by the claimants. In September 2023, the court denied American Income’s motion, but did so without prejudice, and invited the parties to “conduct limited discovery on the issue of arbitrability,” after which discovery the court would hear a renewed motion from American Income. However, in November 2023, prior to American Income’s filing such motion, the parties agreed in principle to settle the claimants’ claims for a non-material amount.
On September 1, 2023, plaintiff Miné Caglar Cost (“Plaintiff) filed a complaint against American Income Life Insurance Company (“American Income”) in the Superior Court of the State of California for the County of Los Angeles, asserting a single claim for violation of the Private Attorneys General Act (“PAGA”) (Cost v. American Income Life Insurance Company, et al., Case No. 23SMCV04113). Plaintiff is a former California independent insurance sales agent who alleges one cause of action for civil penalties under PAGA arising out of alleged violations of the wage-and-hour provisions of the California Labor Code stemming from American Income’s alleged misclassification of Plaintiff and other California-based sales agents as independent contractors. American Income filed a motion to compel arbitration on an individual basis and stay the representative component of Plaintiff’s claims, to which Plaintiff stipulated. On December 12, 2023, the Court approved the parties’ stipulation to compel the matter to individual arbitration and stayed the case pending the completion of the individual arbitration.
On April 4, 2023, putative class action litigation was filed against National Income Life Insurance Company (“National Income”) in New York Supreme Court by plaintiffs Melissa K. Goppert, Sarah Valente, James O’Neill, Jennifer Abe, and Emily Herendeen (“Plaintiffs”) (Goppert, et al. v. National Income Life Insurance Company, Index No. 153096/2023). Plaintiffs are former National Income independent sales agents who allege they should have been classified as employees and assert claims under New York state law on behalf of a putative class of former independent sales agents and individuals who trained to become independent sale agents since March 2017. Plaintiffs make claims under New York’s Minimum Wage Law (NYLL § 633 and 12 NYCRR § 142-2.1); Overtime Compensation Law (NYLL § 633 and 12 NYCRR § 142-2.2); and “Spread of Hours” Law (12 NYCRR § 142-2.4) for the alleged failure to pay minimum wages and overtime pay, including for time spent in training, and attorney’s fees and costs. National Income filed a motion to compel arbitration of each Plaintiff’s claims on an individual basis, which the Court granted in full on January 11, 2024, and on February 7, 2024, Plaintiffs filed a notice of appeal of the Court’s order.
On November 30, 2023, the Company and our subsidiary, American Income Life Insurance Company, received subpoenas from the U.S. Attorney’s Office for the Western District of Pennsylvania, seeking documents relating to sales practices by certain of our independent sales agents contracted to sell American Income Life Insurance Company policies. The Company and American Income Life Insurance Company are in the preliminary stages of responding to these subpoenas and have been cooperating with the Department of Justice’s investigation. The Department of Justice has not asserted any claims or made allegations against the Company and American Income Life Insurance Company with respect to the foregoing inquiry, and the Company currently is not aware that any legal
Notes to Condensed Consolidated Financial Statements
(Dollar amounts in thousands, except per share data)
proceedings are contemplated by governmental authorities. While no assurances can be made, at present management does not believe that it is reasonably possible or probable that this matter will result in a material loss.
A putative securities class action was filed on April 30, 2024 against the Company and six of its current/former senior executives in the United States District Court for the Eastern District of Texas. The case, which is captioned City of Miami Gen. Emp. & Sanitation Emp. Ret. Trust, et al. v. Globe Life Inc., et al., Case No. 4:24-cv-00376, asserts claims under §§ 10(b) and 20(a) of the Securities Exchange Act of 1934 on behalf of a putative class of purchasers of the Company’s securities from May 8, 2019 through April 10, 2024. The Complaint alleges that certain of the Company’s disclosures about financial performance and certain other public statements during the putative class period were materially false or misleading. The Company plans to vigorously defend against the lawsuit.
Pursuant to the Company’s governing documents and indemnification agreements with the named defendants, the Company has agreed to indemnify those defendants for all expenses and losses related to the litigation subject to the terms of those indemnification agreements. The outcome of litigation of this type is inherently uncertain, and there is always the possibility that a court rules in a manner that is adverse to the interests of the Company and the individual defendants. However, the amount of any such loss in that scenario cannot be reasonably estimated at this time. Further, management cannot reasonably estimate whether an outcome on the class action will be resolved in the near term.
Notes to Condensed Consolidated Financial Statements
(Dollar amounts in thousands, except per share data)
Note 6—Policy Liabilities
The liability for future policy benefits is determined based on the net level premium method, which requires the liability be calculated as the present value of estimated future policyholder benefits and the related termination expenses, less the present value of estimated future net premiums to be collected from policyholders. The following tables summarize balances and changes in the net liability for future policy benefits, before reinsurance, for traditional life long-duration contracts for the three month periods ended March 31, 2024 and 2023:
Life
Present value of expected future net premiums
American Income
DTC
Liberty National
Other
Total
Balance at January 1, 2023
$
4,273,156
$
5,910,224
$
1,094,407
$
470,741
$
11,748,528
Beginning balance at original discount rates
4,246,723
5,680,864
1,066,123
449,209
11,442,919
Effect of changes in assumptions on future cash flows
—
—
—
—
—
Effect of actual variances from expected experience
(29,981)
(47,988)
(5,590)
(1,886)
(85,445)
Adjusted balance at January 1, 2023
4,216,742
5,632,876
1,060,533
447,323
11,357,474
Issuances(1)
192,555
168,952
30,142
7,241
398,890
Interest accrual(2)
47,898
70,991
13,288
5,670
137,847
Net premiums collected(3)
(127,239)
(153,919)
(33,188)
(11,557)
(325,903)
Effect of changes in the foreign exchange rate
(3,999)
—
—
—
(3,999)
Ending balance at original discount rates
4,325,957
5,718,900
1,070,775
448,677
11,564,309
Effect of change from original to current discount rates
141,680
391,650
57,308
34,379
625,017
Balance at March 31, 2023
$
4,467,637
$
6,110,550
$
1,128,083
$
483,056
$
12,189,326
Balance at January 1, 2024
$
4,681,888
$
6,052,651
$
1,129,716
$
478,052
$
12,342,307
Beginning balance at original discount rates
4,523,329
5,664,259
1,077,831
443,949
11,709,368
Effect of changes in assumptions on future cash flows
—
—
—
—
—
Effect of actual variances from expected experience
(48,248)
(36,229)
(10,448)
(1,851)
(96,776)
Adjusted balance at January 1, 2024
4,475,081
5,628,030
1,067,383
442,098
11,612,592
Issuances(1)
211,847
149,231
26,164
5,931
393,173
Interest accrual(2)
53,823
73,420
13,839
5,764
146,846
Net premiums collected(3)
(135,686)
(152,631)
(33,901)
(11,401)
(333,619)
Effect of changes in the foreign exchange rate
(8,927)
—
—
—
(8,927)
Ending balance at original discount rates
4,596,138
5,698,050
1,073,485
442,392
11,810,065
Effect of change from original to current discount rates
56,533
247,209
28,724
21,777
354,243
Balance at March 31, 2024
$
4,652,671
$
5,945,259
$
1,102,209
$
464,169
$
12,164,308
(1)Issuances represent the present value, using the original discount rate, of the expected net premiums related to new policies issued during each respective period.
(2)The interest accrual is the interest earned on the beginning present value of the expected net premiums, as well as the interest on actual net premiums earned during the period, using the original interest rate.
(3)Net premiums collected represent the product of the current period net premium ratio and the gross premiums collected during the period on the in-force business.
Notes to Condensed Consolidated Financial Statements
(Dollar amounts in thousands, except per share data)
Life
Present value of expected future policy benefits
American Income
DTC
Liberty National
Other
Total
Balance at January 1, 2023
$
9,119,104
$
9,225,451
$
3,429,256
$
3,976,150
$
25,749,961
Beginning balance at original discount rates
8,409,761
8,477,892
3,272,980
3,403,704
23,564,337
Effect of changes in assumptions on future cash flows
—
—
—
—
—
Effect of actual variances from expected experience
(31,526)
(48,947)
(7,054)
(2,896)
(90,423)
Adjusted balance at January 1, 2023
8,378,235
8,428,945
3,265,926
3,400,808
23,473,914
Issuances(1)
192,555
168,952
30,142
7,241
398,890
Interest accrual(2)
109,329
112,768
43,256
50,378
315,731
Benefit payments(3)
(96,674)
(147,061)
(54,730)
(30,892)
(329,357)
Effect of changes in the foreign exchange rate
(9,711)
—
—
—
(9,711)
Ending balance at original discount rates
8,573,734
8,563,604
3,284,594
3,427,535
23,849,467
Effect of change from original to current discount rates
1,063,729
1,061,076
274,418
738,992
3,138,215
Balance at March 31, 2023
$
9,637,463
$
9,624,680
$
3,559,012
$
4,166,527
$
26,987,682
Balance at January 1, 2024
$
10,163,627
$
9,714,516
$
3,605,392
$
4,239,623
$
27,723,158
Beginning balance at original discount rates
9,061,833
8,656,752
3,338,252
3,506,859
24,563,696
Effect of changes in assumptions on future cash flows
—
—
—
—
—
Effect of actual variances from expected experience
(52,221)
(36,444)
(10,449)
(2,867)
(101,981)
Adjusted balance at January 1, 2024
9,009,612
8,620,308
3,327,803
3,503,992
24,461,715
Issuances(1)
211,847
149,231
26,164
5,931
393,173
Interest accrual(2)
120,201
117,925
44,554
52,136
334,816
Benefit payments(3)
(104,758)
(159,061)
(58,109)
(34,177)
(356,105)
Effect of changes in the foreign exchange rate
(20,637)
—
—
—
(20,637)
Ending balance at original discount rates
9,216,265
8,728,403
3,340,412
3,527,882
24,812,962
Effect of change from original to current discount rates
741,828
771,812
159,330
576,010
2,248,980
Balance at March 31, 2024
$
9,958,093
$
9,500,215
$
3,499,742
$
4,103,892
$
27,061,942
(1)Issuances represent the present value, using the original discount rate, of the expected future policy benefits related to new policies issued during each respective period.
(2)The interest accrual is the interest earned on the beginning present value of the expected future policy benefits, as well as the interest on actual benefits and expenses paid during the period, using the original interest rate.
(3)Benefit payments represent the release of the present value, using the original discount rate, of the actual future policy benefits incurred during the period due to death, lapse, and maturity benefit payments based on the revised expected assumptions.
Notes to Condensed Consolidated Financial Statements
(Dollar amounts in thousands, except per share data)
The following tables summarize balances and changes in the net liability for future policy benefits for long-duration health contracts for the three month periods ended March 31, 2024 and 2023:
Health
Present value of expected future net premiums
United American
Family Heritage
Liberty National
American Income
DTC
Total
Balance at January 1, 2023
$
2,908,501
$
1,594,992
$
423,490
$
190,296
$
90,143
$
5,207,422
Beginning balance at original discount rates
2,941,261
1,729,219
415,442
192,631
87,751
5,366,304
Effect of changes in assumptions on future cash flows
—
—
—
—
—
—
Effect of actual variances from expected experience
(34,132)
(18,758)
(16,585)
(1,621)
(2,573)
(73,669)
Adjusted balance at January 1, 2023
2,907,129
1,710,461
398,857
191,010
85,178
5,292,635
Issuances(1)
75,839
67,787
13,303
10,212
2,392
169,533
Interest accrual(2)
31,587
16,199
4,890
2,036
1,057
55,769
Net premiums collected(3)
(65,914)
(43,979)
(12,403)
(5,424)
(2,661)
(130,381)
Effect of changes in the foreign exchange rate
—
—
—
(388)
—
(388)
Ending balance at original discount rates
2,948,641
1,750,468
404,647
197,446
85,966
5,387,168
Effect of change from original to current discount rates
49,082
(86,054)
16,800
3,220
4,277
(12,675)
Balance at March 31, 2023
$
2,997,723
$
1,664,414
$
421,447
$
200,666
$
90,243
$
5,374,493
Balance at January 1, 2024
$
3,697,771
$
1,711,741
$
358,472
$
206,381
$
115,363
$
6,089,728
Beginning balance at original discount rates
3,625,803
1,783,173
348,570
201,869
109,880
6,069,295
Effect of changes in assumptions on future cash flows
—
—
—
—
—
—
Effect of actual variances from expected experience
(40,531)
(17,092)
(11,410)
(3,550)
(2,316)
(74,899)
Adjusted balance at January 1, 2024
3,585,272
1,766,081
337,160
198,319
107,564
5,994,396
Issuances(1)
104,603
64,008
13,558
9,949
4,609
196,727
Interest accrual(2)
41,822
18,103
4,227
2,283
1,368
67,803
Net premiums collected(3)
(70,249)
(46,400)
(12,780)
(5,839)
(2,678)
(137,946)
Effect of changes in the foreign exchange rate
—
—
—
(862)
—
(862)
Ending balance at original discount rates
3,661,448
1,801,792
342,165
203,850
110,863
6,120,118
Effect of change from original to current discount rates
(8,053)
(107,766)
3,276
(55)
3,016
(109,582)
Balance at March 31, 2024
$
3,653,395
$
1,694,026
$
345,441
$
203,795
$
113,879
$
6,010,536
(1)Issuances represent the present value, using the original discount rate, of the expected net premiums related to new policies issued during each respective period.
(2)The interest accrual is the interest earned on the beginning present value of the expected net premiums, as well as the interest on actual net premiums earned during the period, using the original interest rate.
(3)Net premiums collected represent the product of the current period net premium ratio and the gross premiums collected during the period on the in-force business.
Notes to Condensed Consolidated Financial Statements
(Dollar amounts in thousands, except per share data)
Health
Present value of expected future policy benefits
United American
Family Heritage
Liberty National
American Income
DTC
Total
Balance at January 1, 2023
$
3,046,829
$
3,005,664
$
941,574
$
312,750
$
87,532
$
7,394,349
Beginning balance at original discount rates
3,080,633
3,336,344
904,865
303,713
85,212
7,710,767
Effect of changes in assumptions on future cash flows
—
—
—
—
—
—
Effect of actual variances from expected experience
(31,443)
(19,779)
(15,995)
(1,578)
(2,302)
(71,097)
Adjusted balance at January 1, 2023
3,049,190
3,316,565
888,870
302,135
82,910
7,639,670
Issuances(1)
75,683
67,787
13,285
10,212
2,388
169,355
Interest accrual(2)
33,480
32,289
11,840
3,668
1,057
82,334
Benefit payments(3)
(78,563)
(29,261)
(23,976)
(7,137)
(3,354)
(142,291)
Effect of changes in the foreign exchange rate
—
—
—
(708)
—
(708)
Ending balance at original discount rates
3,079,790
3,387,380
890,019
308,170
83,001
7,748,360
Effect of change from original to current discount rates
52,672
(212,708)
59,977
18,363
4,089
(77,607)
Balance at March 31, 2023
$
3,132,462
$
3,174,672
$
949,996
$
326,533
$
87,090
$
7,670,753
Balance at January 1, 2024
$
3,814,328
$
3,315,880
$
865,808
$
335,504
$
109,482
$
8,441,002
Beginning balance at original discount rates
3,741,530
3,506,689
816,819
315,431
104,501
8,484,970
Effect of changes in assumptions on future cash flows
—
—
—
—
—
—
Effect of actual variances from expected experience
(40,325)
(19,049)
(12,821)
(4,002)
(2,321)
(78,518)
Adjusted balance at January 1, 2024
3,701,205
3,487,640
803,998
311,429
102,180
8,406,452
Issuances(1)
104,431
64,008
13,349
9,949
4,598
196,335
Interest accrual(2)
43,444
35,663
10,833
3,937
1,368
95,245
Benefit payments(3)
(82,085)
(33,037)
(23,864)
(6,402)
(3,096)
(148,484)
Effect of changes in the foreign exchange rate
—
—
—
(1,548)
—
(1,548)
Ending balance at original discount rates
3,766,995
3,554,274
804,316
317,365
105,050
8,548,000
Effect of change from original to current discount rates
(10,461)
(282,670)
29,690
11,418
2,725
(249,298)
Balance at March 31, 2024
$
3,756,534
$
3,271,604
$
834,006
$
328,783
$
107,775
$
8,298,702
(1)Issuances represent the present value, using the original discount rate, of the expected future policy benefits related to new policies issued during each respective period.
(2)The interest accrual is the interest earned on the beginning present value of the expected future policy benefits, as well as the interest on actual benefits and expenses paid during the period, using the original interest rate.
(3)Benefit payments represent the release of the present value, using the original discount rate, of the actual future policy benefits incurred during the period due to death, lapse, and maturity benefit payments based on the revised expected assumptions.
Notes to Condensed Consolidated Financial Statements
(Dollar amounts in thousands, except per share data)
Health(2)
Net liability for future policy benefits as of March 31, 2023
United American
Family Heritage
Liberty National
American Income
Direct to Consumer
Total
Net liability for future policy benefits at original discount rates
$
131,149
$
1,636,912
$
485,372
$
110,724
$
(2,965)
$
2,361,192
Effect of changes in discount rate assumptions
3,590
(126,654)
43,177
15,143
(188)
(64,932)
Other Adjustments(1)
5,380
490
5,776
333
4,162
16,141
Net liability for future policy benefits, after other adjustments, at current discount rates
140,119
1,510,748
534,325
126,200
1,009
2,312,401
Reinsurance recoverable
(3,609)
(9,852)
(1,428)
—
—
(14,889)
Net liability for future policy benefits, after reinsurance recoverable, at current discount rates
$
136,510
$
1,500,896
$
532,897
$
126,200
$
1,009
$
2,297,512
(1)Other adjustments include the effects of capping and flooring the liability.
(2)Includes the immaterial error correction noted below.
Health
Net liability for future policy benefits as of March 31, 2024
United American
Family Heritage
Liberty National
American Income
Direct to Consumer
Total
Net liability for future policy benefits at original discount rates
105,547
1,752,482
462,151
113,515
(5,813)
2,427,882
Effect of changes in discount rate assumptions
(2,408)
(174,904)
26,414
11,473
(291)
(139,716)
Other Adjustments(1)
14,449
444
11,254
749
6,838
33,734
Net liability for future policy benefits, after other adjustments, at current discount rates
117,588
1,578,022
499,819
125,737
734
2,321,900
Reinsurance recoverable
(3,096)
(10,577)
(1,224)
—
—
(14,897)
Net liability for future policy benefits, after reinsurance recoverable, at current discount rates
$
114,492
$
1,567,445
$
498,595
$
125,737
$
734
$
2,307,003
(1)Other adjustments include the effects of capping and flooring the liability.
Immaterial Correction of Previously Issued Financial Statements—The Company previously presented reinsurance recoverable on a net basis as a component of future policy benefits. In the fourth quarter of 2023, the Company corrected its presentation of reinsurance recoverable to a gross basis as a component of other assets, which resulted in the reclassification of $60 million of reinsurance recoverable at current discount rates from liabilities to assets ($49 million at original discount rates) as of March 31, 2023, with no change to equity, and the related tables in the footnote have been adjusted to reflect such changes.
Remeasurement Gain or Loss—During the three months ended March 31, 2024 and 2023, the Company's results for actual variances from expected experience produced a net reserve remeasurement gain of $8.1 million and a net reserve remeasurement gain of $659 thousand, respectively, in the Condensed Consolidated Statements of Operations. The variance of actual experience from expected experience during the first three months of 2024 was primarily due to favorable variances from our assumptions as compared to actual experience in our life insurance segment (a $4.9 million gain), and favorable variances from our assumptions as compared to actual experience in our health insurance segment (a $3.2 million gain). The variance of actual experience from expected experience during the three months ended 2023 was primarily due to favorable variances from assumptions as compared to actual experience in our life insurance segment (a $2.7 million gain), and unfavorable variances from assumptions as compared to actual experience in our health insurance segment (a $2.0 million loss).
There were no changes to the judgments, assumptions, and methods used in measuring the liability for future policy benefits during the three months ended March 31, 2024 and 2023.
Notes to Condensed Consolidated Financial Statements
(Dollar amounts in thousands, except per share data)
The following tables provide the weighted-average original and current discount rates for the liability for future policy benefits and the additional insurance liabilities as of March 31, 2024 and 2023:
As of March 31,
2024
2023
Original discount rate
Current discount rate
Original discount rate
Current discount rate
Life
American Income
5.7
%
5.2
%
5.8
%
4.9
%
Direct to Consumer
6.0
%
5.2
%
6.0
%
5.0
%
Liberty National
5.6
%
5.2
%
5.6
%
5.0
%
Other
6.2
%
5.2
%
6.2
%
5.0
%
Health
United American
5.1
%
5.0
%
5.2
%
4.8
%
Family Heritage
4.2
%
5.1
%
4.3
%
4.9
%
Liberty National
5.8
%
5.2
%
5.8
%
4.9
%
American Income
5.8
%
5.0
%
5.9
%
4.8
%
Direct to Consumer
5.1
%
5.0
%
5.2
%
4.8
%
The following table provides the weighted-average durations of the liability for future policy benefits and the additional insurance liabilities as of March 31, 2024 and 2023:
Notes to Condensed Consolidated Financial Statements
(Dollar amounts in thousands, except per share data)
The following tables summarize the amount of gross premiums and interest related to long duration life and health contracts that are recognized in the Condensed Consolidated Statements of Operationsfor the three month periods ended March 31, 2024 and 2023:
Life
Three Months Ended March 31, 2024
Three Months Ended March 31, 2023
Gross Premiums
Interest expense
Gross Premiums
Interest expense
American Income
$
413,759
$
66,379
$
387,145
$
61,431
Direct to Consumer
245,194
44,460
244,707
41,714
Liberty National
89,871
30,542
84,072
29,769
Other
51,069
45,917
51,835
44,275
Total
$
799,893
$
187,298
$
767,759
$
177,189
Health
Three Months Ended March 31, 2024
Three Months Ended March 31, 2023
Gross Premiums
Interest expense
Gross Premiums
Interest expense
United American
$
104,097
$
1,567
$
97,833
$
1,822
Family Heritage
103,391
17,431
96,090
15,977
Liberty National
47,434
6,583
46,745
6,920
American Income
28,919
1,655
28,096
1,632
Direct to Consumer
3,657
—
3,542
—
Total
$
287,498
$
27,236
$
272,306
$
26,351
Gross premiums are included within life and health premium on the Condensed Consolidated Statements of Operations, while the related interest expense is included in life and health policyholder benefits.
Notes to Condensed Consolidated Financial Statements
(Dollar amounts in thousands, except per share data)
The following tables provide the undiscounted and discounted expected future net premiums, expected future gross premiums, and expected future policy benefits, at both original and current discount rates, for life and health contracts as of March 31, 2024 and 2023:
Life
As of March 31, 2024
As of March 31, 2023
Not discounted
At original discount rates
At current discount rates
Not discounted
At original discount rates
At current discount rates
American Income
PV of expected future gross premiums
$
24,668,992
$
13,924,819
$
14,181,177
$
23,041,514
$
13,054,486
$
13,575,751
PV of expected future net premiums
8,131,005
4,596,138
4,652,671
7,617,532
4,325,957
4,467,637
PV of expected future policy benefits
31,114,756
9,216,265
9,958,093
28,821,998
8,573,734
9,637,463
DTC
PV of expected future gross premiums
$
17,617,001
$
9,214,360
$
9,597,417
$
17,479,516
$
9,165,113
$
9,773,835
PV of expected future net premiums
10,831,408
5,698,050
5,945,259
10,832,386
5,718,900
6,110,550
PV of expected future policy benefits
25,909,464
8,728,403
9,500,215
25,582,750
8,563,604
9,624,680
Liberty National
PV of expected future gross premiums
$
4,667,397
$
2,725,502
$
2,739,275
$
4,453,139
$
2,599,082
$
2,667,795
PV of expected future net premiums
1,888,084
1,073,485
1,102,209
1,889,419
1,070,775
1,128,083
PV of expected future policy benefits
8,916,134
3,340,412
3,499,742
8,658,766
3,284,594
3,559,012
Other
PV of expected future gross premiums
$
3,701,248
$
1,879,815
$
2,027,187
$
3,798,669
$
1,920,302
$
2,126,949
PV of expected future net premiums
906,921
442,392
464,169
919,924
448,677
483,056
PV of expected future policy benefits
12,437,133
3,527,882
4,103,892
12,392,224
3,427,535
4,166,527
Total
PV of expected future gross premiums
$
50,654,638
$
27,744,496
$
28,545,056
$
48,772,838
$
26,738,983
$
28,144,330
PV of expected future net premiums
21,757,418
11,810,065
12,164,308
21,259,261
11,564,309
12,189,326
PV of expected future policy benefits
78,377,487
24,812,962
27,061,942
75,455,738
23,849,467
26,987,682
As of March 31, 2024, for the life segment using current discount rates, the Company anticipates $28.5 billion of expected future gross premiums and $12.2 billion of expected future net premiums. As of March 31, 2023, using current discount rates, the Company anticipated $28.1 billion of expected future gross premiums and $12.2 billion in expected future net premiums. For each respective period, only expected future net premiums are included in the determination of the liability for future policy benefits on the balance sheet, while the difference between the expected future gross premiums and the expected future net premiums is not.
Notes to Condensed Consolidated Financial Statements
(Dollar amounts in thousands, except per share data)
Health
As of March 31, 2024
As of March 31, 2023
Not discounted
At original discount rates
At current discount rates
Not discounted
At original discount rates
At current discount rates
United American
PV of expected future gross premiums
$
8,757,778
$
5,349,917
$
5,334,881
$
6,783,819
$
4,279,547
$
4,346,007
PV of expected future net premiums
6,002,434
3,661,448
3,653,395
4,685,306
2,948,641
2,997,723
PV of expected future policy benefits
6,186,167
3,766,995
3,756,534
4,909,212
3,079,790
3,132,462
Family Heritage
PV of expected future gross premiums
$
6,854,106
$
4,037,762
$
3,816,256
$
6,442,316
$
3,846,392
$
3,682,300
PV of expected future net premiums
3,039,406
1,801,792
1,694,026
2,908,079
1,750,468
1,664,414
PV of expected future policy benefits
6,769,500
3,554,274
3,271,604
6,358,594
3,387,380
3,174,672
Liberty National
PV of expected future gross premiums
$
2,073,015
$
1,315,879
$
1,353,262
$
2,232,290
$
1,396,334
$
1,468,763
PV of expected future net premiums
509,069
342,165
345,441
634,061
404,647
421,447
PV of expected future policy benefits
1,395,561
804,316
834,006
1,575,745
890,019
949,996
American Income
PV of expected future gross premiums
$
1,768,477
$
991,946
$
1,024,262
$
1,760,671
$
984,216
$
1,037,339
PV of expected future net premiums
362,982
203,850
203,795
351,655
197,446
200,666
PV of expected future policy benefits
644,293
317,365
328,783
626,151
308,170
326,533
Direct to Consumer
PV of expected future gross premiums
$
238,499
$
150,065
$
154,223
$
171,266
$
112,442
$
118,105
PV of expected future net premiums
176,500
110,863
113,879
131,187
85,966
90,243
PV of expected future policy benefits
164,347
105,050
107,775
124,597
83,001
87,090
Total
PV of expected future gross premiums
$
19,691,875
$
11,845,569
$
11,682,884
$
17,390,362
$
10,618,931
$
10,652,514
PV of expected future net premiums
10,090,391
6,120,118
6,010,536
8,710,288
5,387,168
5,374,493
PV of expected future policy benefits
15,159,868
8,548,000
8,298,702
13,594,299
7,748,360
7,670,753
As of March 31, 2024, for the health segment using current discount rates, the Company anticipates $11.7 billion of expected future gross premiums and $6.0 billion of expected future net premiums. As of March 31, 2023, using current discount rates, the Company anticipated $10.6 billion of expected future gross premiums and $5.4 billion in expected future net premiums. For each respective period, only expected future net premiums are included in the determination of the liability for future policy benefits on the balance sheet, while the difference between the expected future gross premiums and the expected future net premiums is not.
Notes to Condensed Consolidated Financial Statements
(Dollar amounts in thousands, except per share data)
The following table summarizes the balances of, and changes in, policyholders’ account balances as of March 31, 2024 and 2023:
Policyholders' Account Balances
As of March 31, 2024
As of March 31, 2023
Interest Sensitive Life
Deferred Annuity
Other Policy-holders' Funds
Interest Sensitive Life
Deferred Annuity
Other Policy-holders' Funds
Balance at January 1,
$
732,948
$
773,039
$
236,958
$
739,105
$
954,318
$
123,236
Issuances
—
198
—
—
202
—
Premiums received
5,624
3,573
166,700
6,030
4,776
21,662
Policy charges
(3,111)
—
—
(3,319)
—
—
Surrenders and withdrawals
(6,309)
(31,563)
(3,517)
(5,384)
(43,533)
(3,303)
Benefit payments
(9,140)
(12,771)
—
(7,844)
(15,784)
—
Interest credited
7,016
6,243
3,521
7,135
7,560
1,238
Other
2,693
300
(2,393)
2,177
258
(147)
Balance at March 31,
$
729,721
$
739,019
$
401,269
$
737,900
$
907,797
$
142,686
Weighted-average credit rate
3.89
%
3.34
%
4.49
%
3.92
%
3.29
%
3.78
%
Net amount at risk
$
1,740,325
N/A
N/A
$
1,847,128
N/A
N/A
Cash surrender value
$
669,721
$
739,019
$
401,269
$
676,247
$
907,797
$
142,686
The following tables present the policyholders' account balances by range of guaranteed minimum crediting rates and the related range of difference, if any, in basis points between rates being credited to policy holders and the respective guaranteed minimums as of March 31, 2024 and 2023:
Notes to Condensed Consolidated Financial Statements
(Dollar amounts in thousands, except per share data)
Note 9—Postretirement Benefits
Globe Life has qualified noncontributory defined benefit pension plans (Pension Plans) and contributory savings plans that cover substantially all employees. There is also a nonqualified noncontributory supplemental executive retirement plan (SERP) that covers a limited number of officers. The tables included herein will focus on the Pension Plans and SERP.
Pension Assets: The following table presents the assets of the Company's Pension Plans at March 31, 2024 and December 31, 2023.
Pension Assets by Component at March 31, 2024
Fair Value Determined by:
Quoted Prices in
Active Markets
for Identical
Assets (Level 1)
Significant
Observable
Inputs (Level 2)
Significant Unobservable Inputs (Level 3)
Total
Amount
% of Total
Exchange traded fund(4)
$
26,481
$
—
$
—
$
26,481
5
Equity exchange traded fund(1)
330,810
—
—
330,810
56
U.S. Government and Agency
—
159,108
—
159,108
27
Other bonds
—
4
—
4
—
Guaranteed annuity contract(2)
—
43,602
—
43,602
7
Short-term investments
3,016
—
—
3,016
1
Other
1,487
—
—
1,487
—
$
361,794
$
202,714
$
—
564,508
96
Other long-term investments(3)
23,670
4
Total pension assets
$
588,178
100
(1)A fund including marketable securities that mirror the S&P 500 index.
(2)Representing a guaranteed annuity contract issued by Globe Life Inc.'s subsidiary, American Income Life Insurance Company, to fund the obligations of the American Income Life Insurance Company Collective Bargaining Agreement Employees Pension Plan.
(3)Includes non-redeemable investment funds that report the Globe Life Inc. Pension Plan's pro-rata share of the limited partnership's net asset value (NAV) per share, or its equivalent, as a practical expedient for fair value. As of March 31, 2024, the Globe Life Inc. Pension Plan owned less than 1% of two long-term investment funds.
(4)A fund including U.S. dollar-denominated investment-grade securities issued by industrial, utility, and financial companies with maturities greater than 10 years.
Notes to Condensed Consolidated Financial Statements
(Dollar amounts in thousands, except per share data)
Pension Assets by Component at December 31, 2023
Fair Value Determined by:
Quoted Prices in
Active Markets
for Identical
Assets (Level 1)
Significant
Observable
Inputs (Level 2)
Significant
Unobservable
Inputs (Level 3)
Total
Amount
% of Total
Exchange traded fund(4)
$
18,715
$
—
$
—
$
18,715
3
Equity exchange traded fund(1)
315,886
—
—
315,886
55
U.S. Government and Agency
—
167,450
—
167,450
30
Other bonds
—
5
—
5
—
Guaranteed annuity contract(2)
—
43,428
—
43,428
8
Short-term investments
6,506
—
—
6,506
1
Other
463
—
—
463
—
$
341,570
$
210,883
$
—
552,453
97
Other long-term investments(3)
18,314
3
Total pension assets
$
570,767
100
(1)A fund including marketable securities that mirror the S&P 500 index.
(2)Representing a guaranteed annuity contract issued by Globe Life Inc.'s subsidiary, American Income Life Insurance Company, to fund the obligations of the American Income Life Insurance Company Collective Bargaining Agreement Employees Pension Plan.
(3)Includes non-redeemable investment funds that report the Globe Life Inc. Pension Plan's pro-rata share of the limited partnership's net asset value (NAV) per share, or its equivalent, as a practical expedient for fair value. As of December 31, 2023, the Globe Life Inc. Pension Plan owned less than 1% of two long-term investment funds.
(4)A fund including U.S. dollar-denominated investment-grade securities issued by industrial, utility, and financial companies with maturities greater than 10 years.
SERP: The following tables include premiums paid for the company owned life insurance (COLI) at March 31, 2024 and 2023 and investments of the Rabbi Trust at March 31, 2024 and December 31, 2023.
Three Months Ended March 31,
2024
2023
Premiums paid for insurance coverage
$
443
$
443
March 31, 2024
December 31, 2023
Total investments:
COLI
$
55,974
$
55,185
Exchange traded funds
90,514
86,156
$
146,488
$
141,341
Pension Plans and SERP Liabilities: The following table presents liabilities for the defined benefit pension plans and SERP at March 31, 2024 and December 31, 2023.
Notes to Condensed Consolidated Financial Statements
(Dollar amounts in thousands, except per share data)
Net Periodic Benefit Cost:The following table presents the net periodic benefit costs for the defined benefit pension plans and SERP by expense components for the three month periods ended March 31, 2024 and 2023.
Components of Net Periodic Benefit Cost
Three Months Ended March 31,
2024
2023
Service cost—benefits earned during the period
$
6,221
$
5,392
Interest cost on projected benefit obligation
8,267
7,834
Expected return on assets
(10,646)
(9,656)
Amortization:
Prior service cost
269
269
Actuarial (gain) loss
6
(52)
Net periodic benefit cost
$
4,117
$
3,787
Note 10—Earnings Per Share
Earnings per Share: A reconciliation of basic and diluted weighted-average shares outstanding used in the computation of basic and diluted earnings per share is as follows:
Three Months Ended March 31,
2024
2023
Basic weighted average shares outstanding
93,865,606
96,388,211
Weighted average dilutive options outstanding
1,248,909
1,522,889
Diluted weighted average shares outstanding
95,114,515
97,911,100
Antidilutive shares
186,359
209,870
Antidilutive shares are excluded from the calculation of diluted earnings per share. All antidilutive shares noted above result from outstanding out of the money employee and Director stock options.
Notes to Condensed Consolidated Financial Statements
(Dollar amounts in thousands, except per share data)
Note 11—Debt
The following table presents information about the terms and outstanding balances of Globe Life's debt.
Selected Information about Debt Issues
As of
March 31, 2024
December 31, 2023
Instrument
Issue Date
Maturity Date
Coupon Rate
Par Value
Unamortized Discount & Issuance Costs
Book Value
Fair Value
Book Value
Senior notes
09/27/2018
09/15/2028
4.550%
$
550,000
$
(3,538)
$
546,462
$
539,198
$
546,283
Senior notes
08/21/2020
08/15/2030
2.150%
400,000
(3,214)
396,786
334,816
396,670
Senior notes(1)
05/19/2022
06/15/2032
4.800%
250,000
(4,028)
245,972
242,950
245,873
Junior subordinated debentures
11/17/2017
11/17/2057
5.275%
125,000
(1,569)
123,431
123,538
123,427
Junior subordinated debentures
06/14/2021
06/15/2061
4.250%
325,000
(7,673)
317,327
270,010
317,306
Total long-term debt
1,650,000
(20,022)
1,629,978
1,510,512
1,629,559
Term loan(2)
05/11/2023
11/11/2024
6.680%
170,000
(324)
169,676
169,676
169,549
FHLB borrowings
242,000
—
242,000
242,000
—
Commercial paper
324,000
(2,132)
321,868
321,868
316,564
Total short-term debt
736,000
(2,456)
733,544
733,544
486,113
Total debt
$
2,386,000
$
(22,478)
$
2,363,522
$
2,244,056
$
2,115,672
(1)An additional $150 million par value and book value is held by insurance subsidiaries that eliminates in consolidation.
(2)Interest calculated quarterly using Secured Overnight Financing Rate (SOFR) plus 135 basis points.
The commercial paper has the highest priority of all unsecured debt, followed by senior notes then junior subordinated debentures. The senior notes are callable under a make-whole provision, and the junior subordinated debentures are subject to an optional redemption five years from issuance. Interest on the 4.25% junior subordinated debentures is payable quarterly while all other long-term debt is payable semi-annually.
Credit facility: On March 29, 2024, Globe Life amended the credit agreement dated September 30, 2021, which provides for a $1 billion revolving credit facility that may be increased to $1.25 billion. The amended credit facility matures March 29, 2029 and may be extended up to twoone-year periods upon the Company's request. Pursuant to this agreement, the participating lenders have agreed to make revolving loans to Globe Life and to issue secured or unsecured letters of credit. The Company has not drawn on any of the credit to date.
The facility is further designated as a back-up credit line for a commercial paper program under which the Company may either borrow from the credit line or issue commercial paper at any time, with total commercial paper outstanding not to exceed the facility maximum of $1 billion, less any letters of credit issued. Interest is charged at variable rates. In accordance with the agreement, Globe Life is subject to certain covenants regarding capitalization. As of March 31, 2024, the Company was in full compliance with these covenants.
Notes to Condensed Consolidated Financial Statements
(Dollar amounts in thousands, except per share data)
The following tables present certain information about our commercial paper borrowings.
Credit Facility—Commercial Paper
(Dollar amounts in thousands)
At
March 31, 2024
December 31, 2023
March 31, 2023
Balance of commercial paper at end of period (par value)
$
324,000
$
319,000
$
305,000
Annualized interest rate
5.63
%
5.71
%
5.28
%
Letters of credit outstanding
$
115,000
$
115,000
$
115,000
Remaining amount available under credit line
561,000
316,000
330,000
Credit Facility—Commercial Paper Activity
(Dollar amounts in thousands)
Three Months Ended March 31,
2024
2023
Average balance of commercial paper outstanding during period (par value)
$
346,088
$
293,892
Daily-weighted average interest rate (annualized)
5.68
%
4.95
%
Maximum daily amount outstanding during period (par value)
$
384,000
$
477,700
Commercial paper issued during period (par value)
404,000
545,000
Commercial paper matured during period (par value)
(399,000)
(525,000)
Net commercial paper issued (matured) during period (par value)
5,000
20,000
Federal Home Loan Bank (FHLB): FHLB membership provides our insurance subsidiaries with access to various low-cost collateralized borrowings and funding agreements. The membership requires ownership of FHLB common stock, as well as the purchase of activity-based common stock equal to approximately 4.1% of outstanding borrowings.
Globe Life owned $34.3 million in FHLB common stock as of March 31, 2024 and $22.3 million as of December 31, 2023. The FHLB stock is restricted for the duration of the membership and recorded at cost (par) as required by applicable guidance. The FHLB stock is included in "Other long-term investments" in theCondensed Consolidated Balance Sheets.Borrowings with the FHLB are subject to the availability of pledged assets at the insurance subsidiaries of Globe Life. As of March 31, 2024, Globe Life's insurance subsidiaries maximum borrowing capacity under the FHLB facility was approximately $589 million, net of outstanding funding agreements and short-term borrowings, on pledged assets with a fair value of $1.4 billion. As of March 31, 2024, $303 million in funding agreements were outstanding with the FHLB, compared to $138 million as of December 31, 2023. This amount is included in "Other policyholders' funds" in the Condensed Consolidated Balance Sheets. In addition, the Company had $242 million in short-term borrowings from the FHLB as of March 31, 2024, compared to $0 as of December 31, 2023, this amount is recorded in "Short-term debt".
Note 12—Business Segments
Globe Life is organized into four segments: life insurance, supplemental health insurance, annuities, and investments. In addition, other expenses not included in these segments are reported in "Corporate & Other."
Globe Life's reportable insurance segments are based on the insurance product lines it markets and administers: life insurance, supplemental health insurance, and annuities. These major product lines are set out as reportable segments because of the common characteristics of products within these categories, comparability of margins, and
Notes to Condensed Consolidated Financial Statements
(Dollar amounts in thousands, except per share data)
the similarity in regulatory environment and management techniques. There is also an investment segment that manages the investment portfolio and cash flow for the insurance segments and the corporate function, which excludes the interest on deferred acquisition costs. The Company's chief operating decision makers evaluate the overall performance of the operations of the Company in accordance with these segments.
Life insurance products marketed by Globe Life include traditional whole life and term life insurance. An immaterial amount of annuities sold as companion products are included in the life segment. Health insurance products are generally guaranteed renewable and include Medicare Supplement, cancer, critical illness, accident, and other limited-benefit supplemental hospital and surgical products. Annuities include fixed-benefit contracts.
The following tables present segment premium revenue by each of Globe Life's distribution channels.
Premium Income by Distribution Channel
Three Months Ended March 31, 2024
Life
Health
Annuity
Total
Distribution Channel
Amount
% of Total
Amount
% of Total
Amount
% of Total
Amount
% of Total
American Income
$
414,044
52
$
30,497
9
$
—
—
$
444,541
39
Direct to Consumer
248,040
31
17,866
5
—
—
265,906
23
Liberty National
90,777
11
47,630
14
—
—
138,407
12
United American
1,843
—
141,635
42
—
—
143,478
13
Family Heritage
1,616
—
103,391
30
—
—
105,007
9
Other
47,945
6
—
—
—
—
47,945
4
$
804,265
100
$
341,019
100
$
—
—
$
1,145,284
100
Three Months Ended March 31, 2023
Life
Health
Annuity
Total
Distribution Channel
Amount
% of
Total
Amount
% of
Total
Amount
% of
Total
Amount
% of
Total
American Income
$
387,512
50
$
29,594
9
$
—
—
$
417,106
38
Direct to Consumer
247,667
32
17,248
5
—
—
264,915
24
Liberty National
85,203
11
46,972
15
—
—
132,175
12
United American
1,882
—
132,607
41
—
—
134,489
12
Family Heritage
1,480
—
96,072
30
—
—
97,552
9
Other
48,853
7
—
—
—
—
48,853
5
$
772,597
100
$
322,493
100
$
—
—
$
1,095,090
100
Due to the nature of the life insurance industry, Globe Life has no individual or group that would be considered a major customer. Substantially all of Globe Life's business is conducted in the United States.
The measure of profitability established by the chief operating decision makers for the insurance segments is underwriting margin before other income and administrative expenses, in accordance with the manner in which the segments are managed. It essentially represents gross profit margin on insurance products before insurance administrative expenses and consists primarily of premium less net policy benefits, acquisition expenses, and commissions. Required interest on policy liabilities is reflected as a component of the Investment segment (rather than as a component of underwriting margin in the insurance and annuity segments) in order to match this cost with the investment income earned on the assets supporting the policy liabilities.
Notes to Condensed Consolidated Financial Statements
(Dollar amounts in thousands, except per share data)
The measure of profitability for the Investment segment is excess investment income, representing the income earned on the investment portfolio in excess of policy requirements. Other than the required interest on the insurance segments, no other intersegment revenues or expenses are recognized. Expenses directly attributable to corporate operations are included in the “Corporate & Other” category. Stock-based compensation expense is considered a corporate expense by Globe Life management and is included in this category. All other unallocated revenues and expenses on a pretax basis, including insurance administrative expense and interest on debt, are also included in the “Corporate & Other” segment category.
Globe Life holds a sizable investment portfolio to support its insurance liabilities, the yield from which is used to offset policy benefit, acquisition, administrative, and tax expenses. This yield or investment income is taken into account when establishing premium rates and profitability expectations for its insurance products. From time to time, investments are sold or called, or experience a credit loss event, each of which are reflected by the Company as realized gain (loss)—investments. These gains or losses generally occur as a result of disposition due to issuer calls, compliance with Company investment policies, or other reasons often beyond management’s control. Unlike investment income, realized gains and losses are incidental to insurance operations, and only overall yields are considered when setting premium rates or insurance product profitability expectations. While these gains and losses are not relevant to segment profitability or core operating results, they can have a material positive or negative result on net income. For these reasons, management removes realized investment gains and losses when it views its segment operations.
Management also removes non-operating items unrelated to the Company's core insurance activities when evaluating those results. Therefore, these items are excluded in its presentation of segment results because accounting guidance requires that operating segment results be presented as management views its business. All of these items are included in “Other operating expense” in the Condensed Consolidated Statements of Operations for the appropriate year. See additional detail below in the tables.
Notes to Condensed Consolidated Financial Statements
(Dollar amounts in thousands, except per share data)
The following tables set forth a reconciliation of Globe Life's revenues and operations by segment to its major income statement line items. See Note 1—Significant Accounting Policies for additional information concerning reconciling items of segment profits to pretax income.
Three Months Ended March 31, 2024
Life
Health
Annuity
Investment
Corporate & Other
Adjustments
Consolidated
Revenue:
Premium
$
804,265
$
341,019
$
—
$
—
$
—
$
—
$
1,145,284
Net investment income
—
—
—
282,578
—
—
282,578
Other income
—
—
—
—
76
—
76
Total revenue
804,265
341,019
—
282,578
76
—
1,427,938
Expenses:
Policy benefits
519,871
202,327
6,127
3,468
—
—
731,793
Required interest on reserves
(199,707)
(27,173)
(8,445)
235,325
—
—
—
Amortization of acquisition costs
85,768
13,311
399
—
—
—
99,478
Commissions, premium taxes, and non-deferred acquisition costs
We caution readers regarding certain forward-looking statements contained in the foregoing discussion and elsewhere in this document, and in any other statements made by, or on behalf of Globe Life whether or not in future filings with the Securities and Exchange Commission. Any statement that is not a historical fact, or that might otherwise be considered an opinion or projection concerning the Company or its business, whether express or implied, is meant as and should be considered a forward-looking statement. Such statements represent management's opinions concerning future operations, strategies, financial results or other developments. We specifically disclaim any obligation to update or revise any forward-looking statement because of new information, future developments, or otherwise.
Forward-looking statements are based upon estimates and assumptions that are subject to significant business, economic and competitive uncertainties, many of which are beyond our control, including uncertainties related to the impact of the recent pandemic and associated direct and indirect effects on our business operations, financial results, and financial condition. If these estimates or assumptions prove to be incorrect, the actual results of Globe Life may differ materially from the forward-looking statements made on the basis of such estimates or assumptions. Whether or not actual results differ materially from forward-looking statements may depend on numerous foreseeable and unforeseeable events or developments, which may be national in scope, related to the insurance industry generally, or applicable to the Company specifically. Such events or developments could include, but are not necessarily limited to:
1.Economic and other conditions, including the continued impact of inflation, geopolitical events, and the recent pandemic on the U.S. economy, leading to unexpected changes in lapse rates and/or sales of our policies, as well as levels of mortality, morbidity, and utilization of health care services that differ from Globe Life's assumptions;
2.Regulatory developments, including changes in accounting standards or governmental regulations (particularly those impacting taxes and changes to the Federal Medicare program that would affect Medicare Supplement);
3.Market trends in the senior-aged health care industry that provide alternatives to traditional Medicare (such as Health Maintenance Organizations and other managed care or private plans) and that could affect the sales of traditional Medicare Supplement insurance;
5.General economic, industry sector or individual debt issuers’ financial conditions (including developments and volatility arising from geopolitical events, particularly in certain industries that may comprise part of our investment portfolio) that may affect the current market value of securities we own, or that may impair an issuer’s ability to make principal and/or interest payments due on those securities;
6.Changes in the competitiveness of the Company's products and pricing;
7.Litigation results;
8.Levels of administrative and operational efficiencies that differ from our assumptions (including any reduction in efficiencies resulting from increased costs arising from the impact of higher than anticipated inflation);
9.The ability to obtain timely and appropriate premium rate increases for health insurance policies from our regulators;
10.The customer response to new products and marketing initiatives;
11.Reported amounts in the consolidated financial statements which are based on management estimates and judgments which may differ from the actual amounts ultimately realized;
12.Compromise by a malicious actor or other event that causes a loss of secure data from, or inaccessibility to, our computer and other information technology systems;
13.The impact of reputational damage on the Company's ability to attract and retain agents;
14.The severity, magnitude, and impact of natural or man-made catastrophic events, including but not limited to pandemics, tornadoes, hurricanes, earthquakes, war and terrorism, on our operations and personnel, commercial activity, level of claims, and demand for our products; and
15.Globe Life's ability to access the commercial paper and debt markets, particularly if such markets become unpredictable or unstable for a certain period.
Readers are also directed to consider other risks and uncertainties described in other documents on file with the Securities and Exchange Commission.
Item 2. Management's Discussion and Analysis of Financial Condition and Results of Operations
The following discussion should be read in conjunction with Globe Life's Condensed Consolidated Financial Statements and Notes thereto appearing elsewhere in this report. The following management discussion will only include comparison to prior year.
"Globe Life" and the "Company" refer to Globe Life Inc. and its subsidiaries and affiliates.
Results of Operations
How Globe Life Views Its Operations. Globe Life Inc. is the holding company for a group of insurance companies that market primarily individual life and supplemental health insurance to lower middle to middle-income households throughout the United States. We view our operations by segments, which are the insurance product lines of life, supplemental health, and annuities, and the investment segment that supports the product lines. Segments are aligned based on their common characteristics, comparability of the profit margins, and management techniques used to operate each segment.
Insurance Product Line Segments. The insurance product line segments involve the marketing, underwriting, and administration of policies. Each product line is further segmented by the various distribution channels that market the insurance policies. Each distribution channel operates in a niche market offering insurance products designed for that particular market. Whether analyzing profitability of a segment as a whole, or the individual distribution channels within the segment, the measure of profitability used by management is the underwriting margin, as seen below:
Premium revenue
(Policy obligations)
(Policy acquisition costs and commissions)
Underwriting margin
Investment Segment.The investment segment involves the management of our capital resources, including investments and the management of liquidity. Our measure of profitability for the investment segment is excess investment income, as seen below:
•Net income as a return on equity (ROE) for the three months ended March 31, 2024 was 21.3% and net operating income as an ROE, excluding accumulated other comprehensive income(1) was 14.3%.
•Total premium increased 5% over the same period in the prior year. Life premium increased 4% for the period from $773 million in 2023 to $804 million in 2024.
•Net investment income increased 10% over the same period in the prior year.
•Total net sales increased 7% over the same period in the prior year from $190 million in 2023 to $204 million in 2024. The average producing agent count across all of the exclusive agencies increased 13% over the prior year.
•Book value per share increased 33% over the same period in the prior year from $39.74 to $53.03. Book value per share, excluding accumulated other comprehensive income(1), increased 12% over the prior year from $70.34 in 2023 to $79.00 in 2024.
The following graphs represent net income and net operating income for the three month periods ended March 31, 2024 and 2023.
(1)As shown in the charts above, net operating income is the consolidated total of segment profits after tax and as such is considered a non-GAAP measure. It has been used consistently by Globe Life's management for many years to evaluate the operating performance of the Company. It differs from net income primarily because it excludes certain non-operating items such as realized gains and losses and certain significant and unusual items included in net income. Net income is the most directly comparable GAAP measure.
Net operating income as an ROE, excluding accumulated other comprehensive income (AOCI), is considered a non-GAAP measure. Management utilizes this measure to view the business without the effect of changes in AOCI, which are primarily attributable to fluctuation in interest rates. The impact of the adjustment to exclude AOCI is $(2.47) billion and $(2.96) billion for the three months ended March 31, 2024 and 2023, respectively.
Book value per share, excluding AOCI, is also considered a non-GAAP measure. Management utilizes this measure to view the book value of the business without the effect of changes in AOCI, which are primarily attributable to fluctuation in interest rates. The impact of the adjustment to exclude AOCI is $(25.97) and $(30.60) for the three months ended March 31, 2024 and 2023, respectively.
Summary of Operations. Net income increased 14% to $254 million during the three months ended March 31, 2024, compared with $224 million in the same period in 2023. On a diluted per common share basis, net income per common share for the three months ended March 31, 2024 increased 17% from $2.28 to $2.67.
Net operating income increased 6% to $264 million for the three months ended March 31, 2024, compared with $248 million for the same period in 2023, primarily due to a 50% increase in excess investment income as well as a 6% increase in life underwriting margin. On a diluted per common share basis, net operating income per common share for the three months ended March 31, 2024 increased from $2.53 to $2.78, a 10% increase. Net operating income is the consolidated total of segment profits after tax and as such is considered a non-GAAP measure. Net income is the most directly comparable GAAP measure. We do not consider realized gains and losses to be a component of our core insurance operations or operating segments. Additionally, net income was affected by certain non-operating items. We do not view these items as components of core operating results because they are not indicative of past performance or future prospects of the insurance operations. We remove items such as these that relate to prior periods or are non-operating items when evaluating the results of current operations, and therefore exclude such items from our segment analysis for current periods.
The liability for future policy benefits is determined each reporting period based on the net level premium method. Net level premiums reflect a recomputed net premium ratio using actual experience since the issue date, and expected future experience based on future cash-flow assumptions. See Note 6—Policy Liabilities for additional information. The policy liability is accrued as premium revenue is recognized and adjusted for differences between actual and expected experience in the form of remeasurement gains and losses during the period.
The Company continues to see positive signs in its core operations, including sales and premium growth, and a strong ROE, excluding accumulated other comprehensive income.
Globe Life's operations on a segment-by-segment basis are discussed in depth below. Net operating income has been used consistently by management for many years to evaluate the operating performance of the Company and is a measure commonly used in the life insurance industry. It differs from GAAP net income primarily because it excludes certain non-operating items such as realized gains and losses and other significant and unusual items included in net income. Management believes an analysis of net operating income is important in understanding the profitability and operating trends of the Company’s business. Net income is the most directly comparable GAAP measure.
Analysis of Profitability by Segment
(Dollar amounts in thousands)
Three Months Ended March 31,
2024
2023
Change
%
Life insurance underwriting margin
$
309,011
$
291,274
$
17,737
6
Health insurance underwriting margin
93,770
91,332
2,438
3
Annuity underwriting margin
1,915
2,288
(373)
(16)
Excess investment income
43,785
29,255
14,530
50
Other insurance:
Other income
76
50
26
52
Administrative expense
(80,411)
(73,907)
(6,504)
9
Corporate and other
(40,714)
(35,131)
(5,583)
16
Pre-tax total
327,432
305,161
22,271
7
Applicable taxes
(63,333)
(57,119)
(6,214)
11
Net operating income
264,099
248,042
16,057
6
Reconciling items, net of tax:
Realized gains (losses)
(9,321)
(24,432)
15,111
Non-operating expenses
(561)
—
(561)
Net income
$
254,217
$
223,610
$
30,607
14
The life insurance segment is our primary segment and is the largest contributor to earnings in each period presented. The life insurance segment underwriting margin increased $18 million compared with the prior period, primarily a result of increased premiums and favorable policy obligations as a percent of premium. Excess investment income increased $15 million compared with the prior period, resulting from growth in our invested assets and increased yields due to higher interest rates. The health segment contributed to the growth in income as well, contributing $94 million of underwriting margin in the first three months of 2024 compared with $91 million in the first three months of 2023.
In 2024, the largest contributor of total underwriting margin was the life insurance segment and the primary distribution channel was the American Income Life Division (American Income). The following charts represent the breakdown of total underwriting margin by operating segment and distribution channel for the three months ended March 31, 2024.
Total premium income rose 5% for the three months ended March 31, 2024 to $1.15 billion. Total net sales increased 7% to $204 million, when compared with 2023. Total first-year collected premium (defined in the following section) increased 10% to $161 million for 2024 compared to $146 million in 2023.
Life insurance premium income increased 4% to $804 million over the prior-year total of $773 million. Life net sales rose 7% to $149 million for the first three months of 2024. First-year collected life premium increased 8% to $111 million. Life underwriting margin, as a percent of premium, was flat at 38% for 2024 and 2023. Underwriting margin increased to $309 million in 2024, compared to $291 million for the same period in 2023.
Health insurance premium income increased 6% to $341 million over the prior-year total of $322 million. Health net sales rose 9% to $54 million for the first three months of 2024. First-year collected health premium rose 17% to $51 million. Health underwriting margin, as a percent of premium, was 27% in 2024, compared to 28% for the same period in 2023. Health underwriting margin increased 3% to $94 million for the first three months of 2024, compared to the same period in 2023.
Excess investment income, the measure of profitability of our investment segment, increased 50% during the first three months of 2024 to $43.8 million from $29.3 million in the same period in 2023. Excess investment income per common share, reflecting the impact of our share repurchase program and increased net investment income, increased 53% to $0.46 from $0.30 when compared with the same period in 2023.
Insurance administrative expenses increased 9% in 2024 when compared with the prior-year period. These expenses were 7.0% as a percent of premium during 2024 compared to 6.7% in 2023.
For the three months ended March 31, 2024, the Company repurchased 128 thousand Globe Life Inc. shares at a total cost of $15.6 million for an average share price of $122.13.
The discussions of our segments are presented in the manner we view our operations, as described in Note 12—Business Segments.
We use three measures as indicators of premium growth and sales over the near term: “annualized premium in force,” “net sales,” and “first-year collected premium.”
•Annualized premium in force is defined as the premium income that would be received over the following twelve months at any given date on all active policies if those policies remain in force throughout the twelve-month period.
•Net sales are calculated as annualized premium issued, net of cancellations in the first thirty days after issue, except in the case of Direct to Consumer, where net sales is annualized premium issued at the time the first full premium is paid after any introductory offer period has expired. Management considers net sales to be a better indicator of the rate of premium growth than annualized premium issued.
•First-year collected premium is defined as the premium collected during the reporting period for all policies in their first policy year. First-year collected premium takes lapses into account in the first year when lapses are more likely to occur, and thus is a useful indicator of how much new premium is expected to be added to premium income in the future.
See further discussion of the distribution channels below for Life and Health.
Life insurance is the Company's predominant segment. During 2024, life premium represented 70% of total premium and life underwriting margin represented 76% of the total underwriting margin. Additionally, investments supporting the reserves for life products produce the majority of excess investment income attributable to the investment segment.
The following table presents the summary of results of life insurance. Further discussion of the results by distribution channel is included below.
Life Insurance
Summary of Results
(Dollar amounts in thousands)
Three Months Ended March 31,
Change
2024
2023
Amount
% of Premium
Amount
% of Premium
Amount
%
Premium and policy charges
$
804,265
100
$
772,597
100
$
31,668
4
Policy obligations
519,871
65
507,977
66
11,894
2
Required interest on reserves
(199,707)
(25)
(189,821)
(25)
(9,886)
5
Net policy obligations
320,164
40
318,156
41
2,008
1
Commissions, premium taxes, and non-deferred acquisition expenses
89,322
11
83,578
11
5,744
7
Amortization of acquisition costs
85,768
11
79,589
10
6,179
8
Total expense
495,254
62
481,323
62
13,931
3
Insurance underwriting margin
$
309,011
38
$
291,274
38
$
17,737
6
Net policy obligations amounted to 40% of premium for the three months ended March 31, 2024 compared to 41% in the year ago period.
The table below summarizes life underwriting margin by distribution channel.
A discussion of life operations by distribution channel follows.
The American Income Life Division markets to members of labor unions and other affinity groups and continues to diversify its lead sources, utilizing third-party internet vendor leads and obtaining referrals to facilitate sustainable growth. This division is Globe Life's largest contributor of life premium of any distribution channel at 52% of the Company's March 31, 2024 total life premium. For the three months ended March 31, 2024, the average monthly life premium issued per policy was $58 as compared to $53 for the same period in the prior year. Net sales were $97 million for the three months ended March 31, 2024, up from $83 million in the year-ago period. The underwriting margin, as a percent of premium, was 45% for the three months ended March 31, 2024 and 2023.
Below is the average producing agent count for the three months ended for the American Income Life Division. The average producing agent count is based on the actual count at the beginning and end of each week during the year. The average producing agent count increased 15% over the year-ago period, and over 65% of the division's net sales are driven by agents that have been producing for the division for 6 months or more. The increase in average producing agent count was driven by an increase in new agent recruiting. Sales growth in this division, as well as within our other exclusive agencies, is generally dependent on growth in the size of the agency force.
At March 31,
Change
2024
2023
Amount
%
American Income
11,139
9,714
1,425
15
American Income Life continues to focus on growing and strengthening the agency force, specifically through emphasis on agency middle-management growth and additional agency office openings. In addition to offering financial incentives and training opportunities, the agency has made considerable investments in information technology, including a customer relationship management (CRM) tool for the agency force. This tool is designed to drive productivity in lead distribution, conservation of business, manager dashboards and new agent recruiting. Additionally, this division has invested in and successfully implemented technology that allows the agency force to engage in virtual recruiting, training, and sales activity. The agents have shifted to primarily a virtual experience with the customers and have generated a vast majority of sales through virtual presentations. We find this flexibility to be enticing for new recruits as well as a driver of sustainability for our agency force.
The Direct to Consumer Division (DTC) offers adult and juvenile life insurance through a variety of marketing approaches, including direct mailings, insert media, and electronic media. In recent years, production from electronic media, which is comprised of sales through both the internet and inbound phone calls to our call center, continue to be the customer preference when compared to direct mail. The proportion of sales from the internet and inbound phone calls continue to outpace the activity from the direct mailings, but all three channels continue to work in an omnichannel approach. The different media channels support and complement one another in the division's efforts to reach the consumer. Additionally, this channel provides critical support to our agency business through brand impressions and the generation of sales leads. The DTC's long-term growth has been fueled by constant innovation and name recognition. We continually introduce new initiatives in this division in an attempt to increase response rates and create a seamless customer experience.
The juvenile market is an important source of sales, it is also a vehicle to reach the parents and grandparents of juvenile policyholders, who are more likely to respond favorably to a DTC solicitation for life coverage on themselves in comparison to the general adult population. Also, future offerings to juvenile policyholders and their parents are sources of lower acquisition-cost life insurance sales in the future.
DTC net sales declined 12% to $29 million for the three months ended March 31, 2024 compared with $32 million for the same period in the prior year. This decline is due primarily to reductions in direct mail and mailing insert marketing activity resulting from the impact of inflation on postage, paper and online advertising costs. While total sales have declined, the focus has been on improving profitability and improving the underwriting margin. DTC’s underwriting margin, as a percent of premium, was 24% for the three months ended March 31, 2024 compared with 23% for the same period in 2023.
The Liberty National Division markets individual life insurance to middle-income household and worksite customers. Recent investments in new sales technologies as well as recent growth in middle management within
the agency are expected to help continue this growth. The underwriting margin as a percent of premium was 34% for the three months ended March 31, 2024, up from 32% during the same period a year ago. The increase is primarily attributable to increased premiums and lower policy obligations as a percent of premium, during the current quarter of 2024 as compared to same period in 2023. For the three months ended March 31, 2024, the average monthly life premium per policy issued was $44 compared with $43 for the same period in the prior year.
Net sales fell 2% in the three months ended March 31, 2024 over the same period in 2023. In the first quarter, a new underwriting and new-business platform was implemented, which resulted in a temporary slowdown in the time to issue policies.
Below is the average producing agent count for the three months ended for the Liberty National Division. The average producing agent count is based on the actual count at the beginning and end of each week during the year.
At March 31,
Change
2024
2023
Amount
%
Liberty National
3,419
3,011
408
14
The Liberty National Division average producing agent count increased significantly compared with the prior-year comparable period. We continue to execute our long-term plan to grow this agency through expansion from small-town markets in the Southeast to more densely populated areas with larger pools of potential agent recruits and customers. Continued expansion of this agency's presence into more heavily populated, less-penetrated areas will help create long-term agency growth. In addition to the aforementioned geographic expansion, we have also started a campaign of market expansion to increase our agency presence in cities where we currently have offices, but not enough to properly serve the community, region, area and city. These tend to be larger geographic cities which will help create long-term sustainable agency growth. Additionally, the agency continues to help improve the ability of agents to develop new worksite marketing business. Systems that have been put in place, including the addition of a CRM platform and enhanced analytical capabilities, have helped the agents develop additional worksite marketing opportunities as well as improve the productivity of agents selling in the individual life market. As the division continues to gain momentum in its sales and recruiting initiatives, as well as advances in its technology and CRM platform, the agency anticipates continued growth in recruiting activity and average producing agent count and projects sales growth for the full year.
The Other Agencies distribution channels primarily include non-exclusive independent agencies selling primarily life insurance. The other distribution channels contributed $51 million of life premium income, or 6% of Globe Life's total life premium income in the three months ended March 31, 2024, and contributed 1% of net sales for the period.
HEALTH INSURANCE
Health insurance sold by the Company primarily includes Medicare Supplement insurance including Retiree Health Insurance business, accident coverage, and other limited-benefit supplemental health products including accident, cancer, critical illness, heart, and intensive care products.
Health premium accounted for 30% of our total premium in 2024, while the health underwriting margin accounted for 23% of total underwriting margin. Health underwriting margin increased 3% to $94 million compared to $91 million in the prior year. The Company continues to emphasize life insurance sales relative to health due to life’s superior long-term profitability and its greater contribution to excess investment income.
Globe Life markets supplemental health insurance products through a number of distribution channels. The following table is an analysis of our health premium by distribution channel.
Health Insurance
Premium by Distribution Channel
(Dollar amounts in thousands)
Three Months Ended March 31,
Increase (Decrease)
2024
2023
Amount
% of Total
Amount
% of Total
Amount
%
United American
$
141,635
42
$
132,607
41
$
9,028
7
Family Heritage
103,391
30
96,072
30
7,319
8
Liberty National
47,630
14
46,972
15
658
1
American Income
30,497
9
29,594
9
903
3
Direct to Consumer
17,866
5
17,248
5
618
4
Total
$
341,019
100
$
322,493
100
$
18,526
6
Premium related to limited-benefit supplemental health products comprise $192 million, or 56%, of the total health premiums for the three months ended March 31, 2024, compared with $180 million, or 56%, in the same period in the prior year. Premium from Medicare Supplement products comprises the remaining $149 million, or 44%, for the three months ended March 31, 2024, compared with $142 million, or 44%, in the same period in the prior year.
Annualized health premium in force was $1.40 billion at March 31, 2024, an increase of 5% over $1.33 billion a year earlier.
Presented below is a table of health net sales by distribution channel.
Health Insurance
Net Sales by Distribution Channel
(Dollar amounts in thousands)
Three Months Ended March 31,
Increase (Decrease)
2024
2023
Amount
% of Total
Amount
% of Total
Amount
%
United American
$
16,423
30
$
15,380
31
$
1,043
7
Family Heritage
24,966
46
22,543
45
2,423
11
Liberty National
7,613
14
7,096
14
517
7
American Income
4,594
8
4,504
9
90
2
Direct to Consumer
804
2
550
1
254
46
Total
$
54,400
100
$
50,073
100
$
4,327
9
Health net sales related to limited-benefit supplemental health products comprise $40 million, or 73%, of the total health net sales for the three months ended March 31, 2024, compared with $38 million, or 77%, in the same period in the prior year. Medicare Supplement sales make up the remaining $14 million, or 27%, for 2024 compared with $12 million, or 23%, in the same period in the prior year.
The following table presents health insurance first-year collected premium by distribution channel.
Health Insurance
First-Year Collected Premium by Distribution Channel
(Dollar amounts in thousands)
Three Months Ended March 31,
Increase (Decrease)
2024
2023
Amount
% of Total
Amount
% of Total
Amount
%
United American
$
19,181
38
$
15,096
35
$
4,085
27
Family Heritage
18,983
37
17,200
40
1,783
10
Liberty National
6,895
14
6,111
14
784
13
American Income
4,590
9
4,117
9
473
11
Direct to Consumer
884
2
814
2
70
9
Total
$
50,533
100
$
43,338
100
$
7,195
17
First-year collected premium related to limited-benefit supplemental health products is $37 million, or 73%, of total first-year collected premium for the three months ended March 31, 2024 compared with $30 million, or 70%, in the same period in the prior year. First-year collected premium from Medicare Supplement policies makes up the remaining $14 million, or 27%, for the three months ended March 31, 2024 compared with $13 million, or 30%, in the same period in the prior year.
A discussion of health operations by distribution channel follows.
The United American Division consists of non-exclusive independent agencies who may also sell for other companies. The United American Division was Globe Life's largest health agency in terms of health premium income, with sales up 7% from the same period in the prior-year period.
This division includes three different units:
•UA General Agency, which primarily sells individual Medicare Supplement insurance through independent agents;
•Special Markets, which markets retiree health insurance to employer and union groups through brokers; and
•Globe Life Benefits, which offers group worksite supplemental health insurance through brokers.
The majority of the premium revenue comes from Medicare Supplement. Underwriting margin as a percent of premium for the division for the three months ended March 31, 2024 was 8% compared with 10% in the same period in 2023.
The Family Heritage Division primarily markets limited-benefit supplemental health insurance in non-urban areas. Most of its policies include a cash-back feature, such as a return of premium, where any excess of premiums over claims paid is returned to the policyholder at the end of a specified period stated within the insurance policy. Underwriting margin as a percent of premium was 35% for the three months ended March 31, 2024 compared with 33% in 2023.
The division experienced a 11% rise in health net sales as compared with the three-month period a year ago, primarily due to improved agent productivity and training. The division will continue to implement incentive and retention programs to further these increases in the number of producing agents.
Below is the average producing agent count at the end of the period for the Family Heritage Division. The average producing agent count is based on the actual count at the beginning and end of each week during the year. The average producing agent count was approximately flat compared with the same period a year ago; however, the division has recently increased efforts to grow agent count and middle management. While growth in net sales and earned premium is impacted by agent productivity, growth in the number of average producing agents is what will ultimately be the primary driver of future growth in sales, similar to our other exclusive agencies.
At March 31,
Change
2024
2023
Amount
%
Family Heritage
1,295
1,298
(3)
—
The Liberty National Division represented 14% of all Globe Life health premium income for the three months ended March 31, 2024. The Liberty National Division markets limited-benefit supplemental health products, consisting primarily of cancer and critical illness insurance. Much of Liberty National's health business is generated through worksite marketing targeting small businesses. Health premium at the Liberty National Division was $48 million for the three months ended March 31, 2024 up from $47 million for the same period in 2023. Liberty National's first-year collected premium rose 13% to $7 million in the three months ended March 31, 2024 compared with $6 million for the same period in 2023. Health net sales for the three months ended March 31, 2024 rose 7% from the comparable period in 2023, a result of the continued impact of the division's return to face-to-face customer interaction, and the option of virtual sales. For the three months ended March 31, 2024 and 2023, underwriting margin as a percent of premium was 56% and 57%, respectively.
The Company's other distribution channels, while primarily focused on selling life insurance, also market health products. The American Income Life Division primarily markets accident plans. The Direct to Consumer Division primarily markets Medicare Supplements to employer or union-sponsored groups. On a combined basis, these other channels accounted for 14% of health premium for the three months ended March 31, 2024 and 2023.
ANNUITIES
Annuities represent an insignificant part of our business. We do not currently market stand-alone fixed or deferred annuity products, favoring instead protection-oriented life and supplemental health insurance products.
INVESTMENTS
We manage our capital resources, including investments and cash flow, through the investment segment. Excess investment income represents the profit margin attributable to investment operations and is the measure that we use to evaluate the performance of the investment segment as described in Note 12—Business Segments. It is defined as net investment income less the required interest attributable to policy liabilities.
Management also views excess investment income per diluted common share as an important and useful measure to evaluate the performance of the investment segment. It is defined as excess investment income divided by the total diluted weighted average shares outstanding, representing the contribution by the investment segment to the consolidated earnings per share of the Company. As excess investment income per diluted common share incorporates all invested assets and insurance liabilities, we view excess investment income per diluted common share as a useful measure to evaluate the investment segment.
Excess Investment Income. The following table summarizes Globe Life's investment income, excess investment income, and excess investment income per diluted common share.
Analysis of Excess Investment Income
(Dollar amounts in thousands, except for per share data)
Three Months Ended March 31,
Change
2024
2023
Amount
%
Net investment income
$
282,578
$
257,105
$
25,473
10
Interest on policy liabilities(1)
(238,793)
(227,850)
(10,943)
5
Excess investment income
$
43,785
$
29,255
$
14,530
50
Excess investment income per diluted share
$
0.46
$
0.30
$
0.16
53
Mean invested assets (at amortized cost)
$
21,156,813
$
20,147,812
$
1,009,001
5
Average insurance policy liabilities
17,275,395
16,487,932
787,463
5
(1)Interest on policy liabilities is a component of total policyholder benefits, a GAAP measure.
Excess investment income increased $14.5 million, or 50%, compared with the year-ago period. Excess investment income per diluted common share was $0.46 for the three months ended March 31, 2024, an increase of 53% over the prior-year period. Excess investment income per diluted common share generally increases at a faster pace than excess investment income because the number of diluted shares outstanding generally decreases from year to year as a result of our share repurchase program.
Net investment income for the three months ended March 31, 2024 was $283 million or 10% greater than the year-ago period. Mean invested assets increased 5% during the first three months of 2024 over the same period last year. The effective annual yield rate earned on the fixed maturity portfolio was 5.24% in the first three months of 2024, compared with 5.18% a year earlier. Investment income grew in the current period primarily due to the growth in invested assets and higher interest rates compared to the prior year. In addition to fixed maturities, the Company has also invested in commercial mortgage loans and limited partnerships with debt like characteristics that diversify risk and enhance risk-adjusted, capital-adjusted returns on the portfolio. The earned yield on these investments for the three months ended March 31, 2024 was 9.50%. The earned yield on the Company's commercial mortgage loans for the three months ended March 31, 2024 was 8.70%. See additional information in Note 4—Investments.
Globe Life's net investment income benefits from higher interest rates on new investments. While increasing interest rates have resulted in a net unrealized loss from our available for sale debt securities included in accumulated other comprehensive income (loss) as of March 31, 2024, we are not concerned because we do not generally intend to sell, nor is it likely that we will be required to sell, the fixed maturities prior to their anticipated recovery.
Required interest on insurance policy liabilities reduces excess investment income, as it is the amount of net investment income considered by management necessary to “fund” required interest on insurance policy liabilities. As such, it is reclassified from the insurance segment to the investment segment. As discussed in Note 12—Business Segments, management regards this as a more meaningful analysis of the investment and insurance segments. Required interest is based on the original discount rate assumptions for our insurance policies in force.
The vast majority of our life and health insurance policies are fixed interest rate protection policies, not investment products, and are accounted for under current GAAP accounting guidance for long-duration insurance products which mandate that interest rate assumptions for a particular block of business be “locked in” for the life of that block of business. Each calendar year, we set the original discount rate to be used to calculate the benefit reserve liability for all insurance policies issued that year. The liability reported on the balance sheet is updated in subsequent periods using current discount rates as of the end of the relevant reporting period with a corresponding adjustment to Other Comprehensive Income.
The discount rate used for policies issued in the current year has no impact on the in-force policies issued in prior years as the rates of all prior issue years are also locked in for purposes of recognizing income. As such, the overall original discount rate for the entire in-force block of 5.5% is a weighted average of the discount rates being used from all issue years. Changes in the overall weighted-average discount rate over time are caused by changes in the mix of the reserves on the entire block of in force business. Business issued in the current year has little impact on the overall weighted-average original discount rate due to the size of our in-force business.
In comparison to the year-ago period, required interest on insurance policy liabilities increased $11 million, or 5%, to $239 million, compared with the 5% growth in average interest-bearing insurance policy liabilities.
Realized Gains and Losses.Our life and health insurance companies collect premium income from policyholders for the eventual payment of policyholder benefits, sometimes paid many years or even decades in the future. Since benefits are expected to be paid in future periods, premium receipts in excess of current expenses are invested to provide for these obligations. For this reason, we hold a significant investment portfolio as a part of our core insurance operations. This portfolio consists primarily of high-quality fixed maturities containing an adequate yield to provide for the cost of carrying these long-term insurance product obligations. As a result, fixed maturities are generally held for long periods to support these obligations. Expected yields on these investments are taken into account when setting insurance premium rates and product profitability expectations.
Despite our intent to hold fixed maturity investments for a long period of time, investments are occasionally sold, exchanged, called, or experience a credit loss event, resulting in a realized gain or loss. Gains or losses are only secondary to our core insurance operations of providing insurance coverage to policyholders. In a bond exchange offer, bondholders may consent to exchange their existing bonds for another class of debt securities. The Company also has investments in certain limited partnerships, held under the fair value option, with fair value changes recognized in Realized gains (losses) in the Condensed Consolidated Statements of Operations.
Realized gains and losses can be significant in relation to the earnings from core insurance operations, and as a result, can have a material positive or negative impact on net income. The significant fluctuations caused by gains and losses can cause period-to-period trends of net income that are not indicative of historical core operating results or predictive of the future trends of core operations. Accordingly, they have no bearing on core insurance operations or segment results as we view operations. For these reasons, and in line with industry practice, we remove the effects of realized gains and losses when evaluating overall insurance operating results.
The following table summarizes our tax-effected realized gains (losses) by component.
Analysis of Realized Gains (Losses), Net of Tax
(Dollar amounts in thousands, except for per share data)
Three Months Ended March 31,
2024
2023
Amount
Per Share
Amount
Per Share
Fixed maturities:
Sales
$
111
$
—
$
(283)
$
—
Matured or other redemptions(1)
—
—
1
—
Provision for credit losses
70
—
(25,884)
(0.26)
Fair value option—change in fair value
(12,168)
(0.13)
1,468
0.01
Mortgages
(691)
—
(1,012)
(0.01)
Other investments
248
—
(170)
—
Total realized gains (losses)—investments
(12,430)
(0.13)
(25,880)
(0.26)
Other gains (losses)(2)
3,109
0.03
1,448
0.01
Total realized gains (losses)
$
(9,321)
$
(0.10)
$
(24,432)
$
(0.25)
(1)During the three months ended March 31, 2024 and 2023, the Company recorded $66.9 million and $0, respectively, of exchanges of fixed maturity securities (noncash transactions) that resulted in no realized gains (losses), net of tax in either period.
(2)Other realized gains (losses) are primarily a result of changes in the fair value for assets held in rabbi trust.
Investment Acquisitions. Globe Life's investment policy calls for investing primarily in investment grade fixed maturities that meet our quality and yield objectives. We generally invest in securities with longer-term maturities because they more closely match the long-term nature of our life and health policy liabilities. We believe this strategy is appropriate since our expected future cash flows are generally stable and predictable and the likelihood that we will need to sell invested assets to raise cash is low.
The following table summarizes selected information for fixed maturity investments. The effective annual yield shown is based on the acquisition price and call features, if any, of the securities. For non-callable bonds, the yield is calculated to maturity date. For callable bonds acquired at a premium, the yield is calculated to the earliest known call date and call price after acquisition ("first call date"). For all other callable bonds, the yield is calculated to maturity date.
Fixed Maturity Acquisitions Selected Information
(Dollar amounts in thousands)
Three Months Ended March 31,
2024
2023
Cost of acquisitions:
Investment-grade corporate securities
$
678,795
$
208,117
Investment-grade municipal securities
3,320
102,387
Other investment-grade securities
312
—
Total fixed maturity acquisitions(1)
$
682,427
$
310,504
Effective annual yield (one year compounded)(2)
5.86
%
5.84
%
Average life (in years, to next call)
30.4
19.7
Average life (in years, to maturity)
32.3
24.9
Average rating
A-
A
(1)Fixed maturity acquisitions included unsettled trades of $0 in 2024 and $25 million in 2023.
(2)Tax-equivalent basis, where the yield on tax-exempt securities is adjusted to produce a yield equivalent to the pretax yield on taxable securities.
For investments in callable bonds, the actual life of the investment will depend on whether the issuer calls the investment prior to the maturity date. Given our investments in callable bonds, the actual average life of our investments cannot be known at the time of the investment. Absent sales and "make-whole calls," however, the average life will not be less than the average life to next call and will not exceed the average life to maturity. Data for both of these average life measures is provided in the above chart.
Acquisitions in 2023 and 2024 consisted primarily of corporate and municipal bonds with securities spanning a diversified range of issuers, industry sectors, and geographical regions. In the first three months of 2024, we invested primarily in the municipal, financial, and industrial sectors. For the entire portfolio, the taxable equivalent effective yield earned was 5.24%, up approximately 6 basis points from the yield in the first three months of 2023. The increase in taxable equivalent effective yield was primarily due to new purchase yields exceeding the yield on dispositions and the average portfolio yield. For the remainder of 2024, the Company will continue to execute on its existing strategy by seeking to invest in assets that satisfy our quality and other objectives, while maximizing the highest risk-adjusted, capital-adjusted return.
Since fixed maturities represent such a significant portion of our investment portfolio, the remainder of the discussion of portfolio composition will focus on fixed maturities. See a breakdown of the Company's Other long-term investments in Note 4—Investments.
Selected information concerning the fixed maturity portfolio is as follows:
Fixed Maturity Portfolio Selected Information
At
March 31, 2024
December 31, 2023
March 31, 2023
Average annual effective yield(1)
5.25%
5.23%
5.20%
Average life, in years, to:
Next call(2)
14.9
14.6
14.6
Maturity(2)
18.9
18.6
18.4
Effective duration to:
Next call(2,3)
8.9
9.0
8.9
Maturity(2,3)
10.7
10.7
10.5
(1)Tax-equivalent basis. The yield on tax-exempt securities is adjusted to produce a yield equivalent to the pretax yield on taxable securities.
(2)Globe Life calculates the average life and duration of the fixed maturity portfolio two ways:
(a) based on the next call date which is the next call date for callable bonds and the maturity date for noncallable bonds, and
(b) based on the maturity date of all bonds, whether callable or not.
(3)Effective duration is a measure of the price sensitivity of a fixed-income security to a 1% change in interest rates.
Credit Risk Sensitivity. The following tables summarize certain information about the major corporate sectors and security types held in our fixed maturity portfolio at March 31, 2024 and December 31, 2023.
Fixed Maturities by Sector
March 31, 2024
(Dollar amounts in thousands)
Below Investment Grade
Total Fixed Maturities
% of Total Fixed Maturities
Amortized Cost, net
Gross Unrealized Gains
Gross Unrealized Losses
Fair Value
Amortized Cost, net
Gross Unrealized Gains
Gross Unrealized Losses
Fair Value
At Amortized Cost, net
At Fair Value
Corporates:
Financial
Insurance - life, health, P&C
$
106,920
$
—
$
(12,907)
$
94,013
$
2,586,145
$
48,195
$
(179,156)
$
2,455,184
13
14
Banks
36,896
—
(4,836)
32,060
1,323,380
19,804
(74,616)
1,268,568
7
7
Other financial
74,966
—
(25,497)
49,469
1,304,448
21,585
(162,952)
1,163,081
7
6
Total financial
218,782
—
(43,240)
175,542
5,213,973
89,584
(416,724)
4,886,833
27
27
Industrial
Energy
44,634
—
(6,191)
38,443
1,458,409
46,924
(67,261)
1,438,072
7
8
Basic materials
—
—
—
—
1,176,895
28,539
(76,196)
1,129,238
6
6
Consumer, non-cyclical
—
—
—
—
2,160,594
22,909
(200,442)
1,983,061
11
11
Other industrials
5,181
23
—
5,204
1,141,232
24,434
(93,193)
1,072,473
6
6
Communications
—
—
—
—
910,801
15,857
(88,842)
837,816
4
4
Transportation
8,403
—
(390)
8,013
549,406
14,833
(30,911)
533,328
3
3
Consumer. cyclical
136,327
180
(22,838)
113,669
538,264
5,077
(59,180)
484,161
3
3
Technology
50,280
841
—
51,121
354,938
2,909
(51,902)
305,945
2
2
Total industrial
244,825
1,044
(29,419)
216,450
8,290,539
161,482
(667,927)
7,784,094
42
43
Utilities
30,106
—
(1,490)
28,616
2,127,792
51,901
(105,623)
2,074,070
11
11
Total corporates
493,713
1,044
(74,149)
420,608
15,632,304
302,967
(1,190,274)
14,744,997
80
81
States, municipalities, and political divisions:
General obligations
—
—
—
—
890,336
6,135
(150,384)
746,087
5
4
Revenues
—
—
—
—
2,410,940
32,116
(304,221)
2,138,835
12
12
Total states, municipalities, and political divisions
Corporate securities, which consist of bonds and redeemable preferred stocks, were the largest component of the fixed maturity portfolio as of March 31, 2024, representing 80% of amortized cost, net, and 81% of fair value. The remainder of the portfolio is invested primarily in securities issued by the U.S. government and U.S. municipalities. The Company holds insignificant amounts in foreign government bonds, collateralized debt obligations, asset-backed securities, and mortgage-backed securities. Corporate securities are diversified over a variety of industry sectors and issuers. At March 31, 2024, the total fixed maturity portfolio consisted of 991 issuers.
Fixed maturities had a fair value of $18.1 billion at March 31, 2024, compared with $17.9 billion at December 31, 2023. The net unrealized loss position in the fixed-maturity portfolio increased from $1.0 billion at December 31, 2023 to $1.4 billion at March 31, 2024 due to an increase in market rates during the period.
For more information about our fixed maturity portfolio by component at March 31, 2024 and December 31, 2023, including a discussion of allowance for credit losses, an analysis of unrealized investment losses, and a schedule of maturities, see Note 4—Investments.
An analysis of the fixed maturity portfolio by composite quality rating at March 31, 2024 and December 31, 2023, is shown in the following tables. The composite rating for each security, other than private-placement securities managed by third parties, is the average of the security’s available ratings as assigned by Moody’s Investor Service, Standard & Poor’s, Fitch Ratings, and Dominion Bond Rating Service, LTD. The ratings assigned by these four nationally recognized statistical rating organizations are evenly weighted when calculating the average. The composite quality rating is created utilizing a methodology developed by Globe Life using ratings from the various rating agencies noted above. The composite quality rating is not a Standard & Poor's credit rating. Standard & Poor's does not sponsor, endorse, or promote the composite quality rating and shall not be liable for any use of the composite quality rating. Included in the following chart are private placement fixed maturity holdings at amortized cost, net of allowance for credit losses, of $420 million ($379 million at fair value) for which the ratings were assigned by the third-party managers.
Fixed Maturities by Rating
At March 31, 2024
(Dollar amounts in thousands)
Amortized Cost, net
% of Total
Fair Value
% of Total
Average Composite Quality Rating on Amortized Cost, net
Average Composite Quality Rating on Amortized Cost
Investment grade:
AAA
$
952,822
5
$
880,729
5
AA
3,179,618
17
2,789,626
15
A
5,118,085
27
4,976,280
28
BBB+
3,615,102
19
3,495,898
19
BBB
4,278,786
23
4,056,833
23
BBB-
1,243,875
6
1,211,851
7
Total investment grade
18,388,288
97
17,411,217
97
A-
Below investment grade:
BB
450,503
3
376,912
3
B
37,896
—
35,929
—
Below B
41,112
—
46,148
—
Total below investment grade
529,511
3
458,989
3
BB
$
18,917,799
100
$
17,870,206
100
Weighted average composite quality rating
A-
The overall quality rating of the portfolio is A-, the same as of year-end 2023. Fixed maturities rated BBB are 47% of the total portfolio at March 31, 2024, down from 48% at December 31, 2023. While this ratio is high relative to our peers, it is at its lowest level in over 10 years and we have limited exposure to higher-risk assets such as derivatives, equities, and asset-backed securities. Additionally, the Company does not participate in securities lending and has no off-balance sheet investments as of March 31, 2024. Of our fixed maturity purchases, BBB securities generally provide the Company with the best risk-adjusted, capital-adjusted returns largely due to our ability to hold securities to maturity regardless of fluctuations in interest rates or equity markets.
An analysis of changes in our portfolio of below-investment grade fixed maturities at amortized cost, net of allowance for credit losses is as follows:
Below-Investment Grade Fixed Maturities
(Dollar amounts in thousands)
Three Months Ended March 31,
2024
2023
Balance at beginning of period
$
529,511
$
542,497
Downgrades by rating agencies
—
98,658
Upgrades by rating agencies
(4,592)
—
Acquisitions (Dispositions)
17,462
(13,675)
Provision for credit losses
88
(32,767)
Amortization and other
(447)
886
Balance at end of period
$
542,022
$
595,599
Our investment policy calls for investing primarily in fixed maturities that are investment grade and meet our quality and yield objectives. Thus, the balance of below-investment grade issues is primarily the result of ratings downgrades of existing holdings. Below-investment grade bonds at amortized cost, net of allowance for credit
losses, were 7% of our shareholders’ equity excluding accumulated other comprehensive income as of March 31, 2024. Globe Life invests long term and as such, one of our key criterion in our investment process is to select issuers that are anticipated to weather multiple financial cycles.
OPERATING EXPENSES
Operating expenses are included in the "Corporate and Other" segment and are classified into two categories: insurance administrative expenses and expenses of the Parent Company. Insurance administrative expenses generally include expenses incurred after a policy has been issued. As these expenses relate to premium for a given period, management measures the expenses as a percentage of premium income. The Company also views stock-based compensation expense as a Parent Company expense. Expenses associated with the issuance of our insurance policies are reflected as acquisition expenses and included in the determination of underwriting margin.
Total operating expenses for March 31, 2024 increased in comparison with the prior year primarily due to increases in insurance administrative expenses as well as stock compensation expense. Insurance administrative expenses increased $6.5 million primarily due to higher information technology costs, legal costs and salaries. Insurance administrative expenses as a percent of premium were 7.0% for the three months ended March 31, 2024 compared to 6.7% for the same period in 2023.
Globe Life has an ongoing share repurchase program that began in 1986. The share repurchase program is reviewed with the Board of Directors by management quarterly, and continues indefinitely unless and until the Board of Directors decides to suspend, terminate or modify the program. On April 25, 2024, the Board of Directors authorized the repurchase of up to $1.3 billion for the two-year period ended December 31, 2025. Management generally determines the amount of repurchases based on the amount of the excess cash flows and other available sources after the payment of dividends to the Parent Company shareholders, general market conditions, and other alternative uses. Since implementing our share repurchase program in 1986, we have used $9.4 billion of excess cash flow at the Parent Company to repurchase Globe Life Inc. common shares after determining that the repurchases provide a greater risk-adjusted after-tax return than other investment alternatives.
Excess cash flow at the Parent Company is primarily comprised of dividends received from the insurance subsidiaries less interest expense paid on its debt and other limited operating activities. Additionally, when stock options are exercised, proceeds from these exercises and the resulting tax benefit are used to repurchase additional shares on the open market to minimize dilution as a result of the option exercises.
The following chart summarizes share repurchases for the three month periods ended March 31, 2024 and 2023.
Analysis of Share Repurchases
(Amounts in thousands, except per share data)
Three Months Ended March 31,
2024
2023
Shares
Amount
Average Price
Shares
Amount
Average Price
Purchases with:
Excess cash flow at the Parent Company(1)
128
$
15,602
$
122.13
1,176
$
135,321
$
115.04
Option exercise proceeds
63
7,927
126.20
368
42,754
116.27
Total
191
$
23,529
$
123.47
1,544
$
178,075
$
115.33
(1)Excludes excise tax on the repurchase of treasury stock of $(60) thousand and $1.2 million for the three months ended March 31, 2024 and 2023, respectively.
The amount of share repurchases during the quarter were lower than anticipated solely due to the evaluation of a potential acquisition wherein we paused share repurchases until a conclusion on the acquisition was reached. Globe Life Inc. ultimately decided not to pursue the acquisition. Throughout the remainder of this discussion, share repurchases will only refer to those made from excess cash flow at the Parent Company.
FINANCIAL CONDITION
Liquidity. Liquidity provides Globe Life with the ability to meet on demand the cash commitments required to support our business operations and meet our financial obligations. Our liquidity is primarily derived from multiple sources: positive cash flow from operations, a portfolio of marketable securities, a revolving credit facility, commercial paper, and advances from the Federal Home Loan Bank.
Insurance Subsidiary Liquidity. The operations of our insurance subsidiaries have historically generated substantial cash inflows in excess of immediate cash needs. Cash inflows for the insurance subsidiaries primarily include premium and investment income. In addition to investment income, maturities and scheduled repayments in the investment portfolio are cash inflows. Cash outflows from operations include policy benefit payments, commissions, administrative expenses, and taxes. A portion of the excess cash inflows in the current year will provide for the payment of future policy benefits and are invested primarily in long-term fixed maturities as they better match the long-term nature of these obligations. Excess cash available from the insurance subsidiaries’ operations is generally distributed as a dividend to the Parent Company, subject to regulatory restrictions. The dividends are generally paid in amounts equal to the subsidiaries’ prior year statutory net income excluding realized capital gains. While the leading source of the excess cash is investment income, a significant portion of the excess cash also comes from underwriting income due to our high underwriting margins and effective expense control.
While the insurance subsidiaries annually generate more operating cash inflows than cash outflows, the companies also have the entire available-for-sale fixed maturity investment portfolio available to create additional cash flows if required.
Four of our insurance subsidiaries are members of the FHLB of Dallas. FHLB membership provides the insurance subsidiaries with access to various low-cost collateralized borrowings and funding agreements. While not the only source of liquidity, the FHLB could provide the insurance subsidiaries with an additional source of liquidity, if needed. Refer to Note 11—Debt for further details.
Parent Company Liquidity. An important source of Parent Company liquidity is the dividends from its insurance subsidiaries. These dividends are received throughout the year and are used by the Parent Company to pay dividends on common and preferred stock, interest and principal repayment requirements on Parent Company debt, and operating expenses of the Parent Company.
Three Months Ended March 31,
Twelve Months Ended December 31,
2024
2023
Projected 2024
2023
Liquidity Sources:
Dividends from Subsidiaries
$
52,046
$
129,725
$490,000—510,000
$
459,535
Excess Cash Flows(1)
62,118
124,510
450,000—470,000
416,081
(1)Excess cash flows are reported gross of shareholder dividends. For the three months ended March 31, 2024 and 2023, shareholder dividends were $21 million and $20 million, respectively. For the twelve months ended December 31, 2024, we project approximately $88 million in shareholder dividends, compared to the $84 million paid in 2023.
Dividends from subsidiaries and excess cash flows are projected to be higher in 2024 than in 2023 primarily due to lower life obligations and the growth in our underwriting margins in 2023, both of which resulted in higher statutory earnings generated by the affiliates. Additional sources of liquidity for the Parent Company are cash, intercompany receivables, intercompany borrowings, debt markets, term loans, and a revolving credit facility.
Short-Term Borrowings. An additional source of Parent Company liquidity is a credit facility with a group of lenders. The facility was amended on March 29, 2024, resulting in an increased capacity of $250 million. The facility allows for unsecured borrowings and stand-by letters of credit up to $1 billion, which could be increased up to $1.25 billion. While the Parent Company may request the increase, it is not guaranteed. The updated five-year credit agreement will mature on March 29, 2029. Up to $250 million in letters of credit can be issued against the facility. The facility serves as a back-up line of credit for a commercial paper program under which commercial paper may be issued at any time, with total commercial paper outstanding not to exceed the facility maximum, less any letters of credit issued. Interest charged on the commercial paper program resembles variable rate debt due to its short term nature. As of March 31, 2024, we had available $561 million of additional borrowing capacity under this facility, compared to $330 million a year earlier. As of March 31, 2024, the Parent Company was in full compliance with all covenants related to the aforementioned debt.
As a part of the credit facility, Globe Life has stand-by letters of credits. These letters of credit are issued on behalf of our insurance subsidiaries.
The following tables present certain information about our commercial paper borrowings.
Credit Facility—Commercial Paper
(Dollar amounts in thousands)
At
March 31, 2024
December 31, 2023
March 31, 2023
Balance of commercial paper at end of period (par value)
$
324,000
$
319,000
$
305,000
Annualized interest rate
5.63
%
5.71
%
5.28
%
Letters of credit outstanding
$
115,000
$
115,000
$
115,000
Remaining amount available under credit line
561,000
316,000
330,000
Credit Facility—Commercial Paper Activity
(Dollar amounts in thousands)
Three Months Ended March 31,
2024
2023
Average balance of commercial paper outstanding during period (par value)
$
346,088
$
293,892
Daily-weighted average interest rate (annualized)
5.68
%
4.95
%
Maximum daily amount outstanding during period (par value)
$
384,000
$
477,700
The Company increased the commercial paper borrowings by $5 million since year-end. The Company was able to issue commercial paper as needed under this facility during the three months ended March 31, 2024 and 2023.
Globe Life expects to have readily available funds for 2024 and the foreseeable future to conduct its operations and to maintain target capital ratios in the insurance subsidiaries through liquid assets currently available, internally-generated cash flow and the credit facility. In the event that more liquidity is needed, the Parent Company could generate additional funds through multiple sources including, but not limited to, the issuance of debt, an additional short-term credit facility or term loan, and intercompany borrowing.
Consolidated Liquidity. Consolidated net cash inflows from operations were $351 million in the first three months of 2024, compared with $477 million in the same period of 2023. The decrease is primarily attributable to fluctuations in the settlement of certain amounts included in other liabilities. In addition to cash inflows from operations, our insurance companies received proceeds from dispositions of fixed maturities available for sale, mortgage loans, and other long-term investments in the amount of $96 million during the first three months of 2024. As previously noted under the caption Short-Term Borrowings, the Parent Company has in place a revolving credit facility. The insurance companies have no additional outstanding credit facilities.
Cash and short-term investments were $142 million at March 31, 2024, compared with $185 million at December 31, 2023. In addition to these liquid assets, $18 billion (fair value at March 31, 2024) of fixed income securities are available for sale in the event of an unexpected need. Approximately $1.4 billion, at fair value, are pledged for outstanding FHLB advances and reinsurance. Further, approximately 97% of our fixed income securities are publicly traded, freely tradable under SEC Rule 144, or qualified for resale under SEC Rule 144A. While our fixed income securities are classified as available for sale, we have the ability and general intent to hold any securities to recovery or maturity. Our strong cash flows from operations, on-going investment maturities, and available liquidity under our credit facility make any need to sell securities for liquidity highly unlikely.
Capital Resources.The Parent Company's capital structure consists of short-term debt (the commercial paper facility and current maturities of long-term debt), long-term debt, and shareholders’ equity. It does not include short-term FHLB borrowings, which are obligations of the insurance subsidiaries and typically repaid over the course of the year.
Long-Term Borrowings. The outstanding long-term debt at book value was $1.6 billion at March 31, 2024 and $1.6 billion at December 31, 2023.
Selected Information about Debt Issues
As of March 31, 2024
(Dollar amounts in thousands)
Instrument
Issue Date
Maturity Date
Coupon Rate
Interest Payment Dates
Par Value
Book Value
Fair Value
Senior notes
09/27/2018
09/15/2028
4.550%
semiannual
$
550,000
$
546,462
$
539,198
Senior notes
08/21/2020
08/15/2030
2.150%
semiannual
400,000
396,786
334,816
Senior notes(1)
05/19/2022
06/15/2032
4.800%
semiannual
250,000
245,972
242,950
Junior subordinated debentures
11/17/2017
11/17/2057
5.275%
semiannual
125,000
123,431
123,538
Junior subordinated debentures
06/14/2021
06/15/2061
4.250%
quarterly
325,000
317,327
270,010
Total long-term debt
1,650,000
1,629,978
1,510,512
Term loan(2)
05/11/2023
11/11/2024
6.680%
quarterly
170,000
169,676
169,676
FHLB borrowings
242,000
242,000
242,000
Commercial paper
324,000
321,868
321,868
Total short-term debt
736,000
733,544
733,544
Total debt
$
2,386,000
$
2,363,522
$
2,244,056
(1)An additional $150 million par value and book value is held by insurance subsidiaries that eliminates in consolidation.
(2)Interest calculated quarterly using Secured Overnight Financing Rate (SOFR) plus 135 basis points.
Financing costs for the corporate and other segment consist primarily of interest on our various debt instruments. The table below presents the components of financing costs and reconciles interest expense per the Condensed Consolidated Statements of Operations.
Analysis of Financing Costs
(Dollar amounts in thousands)
Three Months Ended March 31,
Increase (Decrease)
2024
2023
Amount
%
Interest on funded debt
$
16,926
$
20,244
$
(3,318)
(16)
Interest on term loans
2,999
—
2,999
—
Interest on short-term debt
8,683
4,623
4,060
88
Other
13
—
13
—
Financing costs
$
28,621
$
24,867
$
3,754
15
During the first three months of 2024, financing costs increased 15% compared with the prior year. The increase in financing costs is primarily due to higher short-term interest rates. More information on our debt transactions is disclosed in the Financial Condition section of this report.
Subsidiary Capital: The National Association of Insurance Commissioners (NAIC) has established a risk-based factor approach for determining threshold risk-based capital levels for all insurance companies. This approach was designed to assist the regulatory bodies in identifying companies that may require regulatory attention. A Risk-Based Capital (RBC) ratio is typically determined by dividing adjusted total statutory capital by the amount of risk-based capital determined using the NAIC’s factors. If a company’s RBC ratio approaches two times the RBC amount, the company must file a plan with the NAIC for improving its capital levels (this level is commonly referred
to as “Company Action Level” RBC). Companies typically hold a multiple of the Company Action Level RBC depending on their particular business needs and risk profile.
Our goal is to maintain statutory capital within our insurance subsidiaries at levels necessary to support our current ratings. For 2024, Globe Life has targeted a consolidated Company Action Level RBC ratio of 300% to 320%. The Company has concluded that this capital level is more than adequate and sufficient to support its current ratings, given the nature of its business and its risk profile. For 2023, our consolidated Company Action Level RBC ratio was 314%. The Parent Company is committed to maintaining the targeted consolidated RBC ratio at its insurance subsidiaries and has sufficient liquidity available to provide additional capital if necessary.
Shareholders' Equity: Shareholders’ equity was $5.0 billion at March 31, 2024. This compares with $4.5 billion at December 31, 2023 and $3.8 billion at March 31, 2023. During the three months since December 31, 2023, shareholders’ equity increased as a result of net income of $254 million during the first three months of 2024, but was offset by share repurchases of $16 million and an additional $8 million in share repurchases to offset the dilution from stock option exercises. Additionally, the balance of AOCI increased $305 million primarily due to increased interest rates and discount rates over the period.
On March 18, 2024, the Parent Company announced that it had declared a quarterly dividend of $0.24 per share. This dividend was paid on May 1, 2024.
We plan to use excess cash available at the Parent Company as efficiently as possible in the future. Possible uses of excess cash flow include, but are not limited to, share repurchases, acquisitions, shareholder dividend payments, investments in securities, or repayment of short-term debt. We will determine the best use of excess cash after ensuring that targeted capital levels are maintained in our insurance subsidiaries. If market conditions are favorable, we currently expect that share repurchases will continue to be a primary use of those funds.
Future policy benefits are computed using current discount rates with the impact of changes in discount rates included in accumulated other comprehensive income. Additionally, the liability for future policy benefits is calculated using net premiums rather than gross premiums. Given that gross premiums are considerably higher than net premiums for our business, as seen in Note 6—Policy Liabilities, the measurement of the liability is higher than what it would be had it been computed using gross premiums. This is an important consideration when analyzing shareholders' equity.
Globe Life is required under GAAP to revalue its available for sale fixed maturity portfolio to fair market value at the end of each accounting period. These changes, net of their associated impact on income tax, are reflected directly in shareholders’ equity. Fluctuations in interest rates cause undue volatility in the period-to-period presentation of our shareholders’ equity, capital structure, and financial ratios. Due to the long-term nature of our fixed maturity investments and policy liabilities and the strong cash flows consistently generated by our insurance subsidiaries, we have the ability to hold our securities to maturity. As such, we do not expect to incur losses due to fluctuations in market value of fixed maturities caused by market rate changes and temporarily illiquid markets. Accordingly, our management, credit rating agencies, lenders, many industry analysts, and certain other financial statement users prefer to remove the effect of this accounting rule when analyzing our balance sheet, capital structure, and financial ratios.
Item 3. Quantitative and Qualitative Disclosures About Market Risk
There have been no quantitative or qualitative changes with respect to market risk exposure during the three months ended March 31, 2024.
Item 4. Controls and Procedures
Evaluation of Disclosure Controls and Procedures: Globe Life Inc., under the direction of the Co-Chairmen and Chief Executive Officers and the Executive Vice President and Chief Financial Officer, has established disclosure controls and procedures that are designed to ensure that information required to be disclosed by Globe Life in the reports that it files or submits under the Securities Exchange Act of 1934 is recorded, processed, summarized and reported within the time periods specified in the SEC’s rules and forms. The disclosure controls and procedures are also intended to ensure that such information is accumulated and communicated to Globe Life's management, including the Co-Chairmen and Chief Executive Officers and the Executive Vice President and Chief Financial Officer, as appropriate to allow timely decisions regarding required disclosures.
As of the end of the fiscal quarter completed March 31, 2024, an evaluation was performed under the supervision and with the participation of Globe Life management, including the Co-Chairmen and Chief Executive Officers and the Executive Vice President and Chief Financial Officer, of the disclosure controls and procedures (as those terms are defined in Rule 13a-15(e) under the Securities Exchange Act of 1934). Based upon their evaluation, the Co-Chairmen and Chief Executive Officers and the Executive Vice President and Chief Financial Officer have concluded that disclosure controls and procedures are effective as of the date of this Form 10-Q. In compliance with Section 302 of the Sarbanes Oxley Act of 2002 (18 U.S.C. § 1350), each of these officers executed a Certification included as an exhibit to this Form 10-Q.
Changes in Internal Control over Financial Reporting: During the period ended March 31, 2024, there were no changes to Globe Life Inc.'s internal control over financial reporting or in other factors that could significantly affect the internal control over financial reporting subsequent to the date of their evaluation which have materially affected, or are reasonably likely to materially affect, internal control over financial reporting.
The following is an update to the material risks previously disclosed in the Company's December 31, 2023 Form 10-K. There are no other material changes to the Company's risk factors.
Our businesses are heavily regulated and changes in regulation or regulatory scrutiny may have a material adverse impact on our business, financial condition or results of operation.
Insurance companies, including our insurance subsidiaries, are subject to extensive supervision and regulation in the states in which they conduct business. The primary purpose of this supervision and regulation is the protection of policyholders, not investors. Regulatory agencies have broad administrative power over numerous aspects of our business, including premium rates for our life, Medicare Supplement and other supplement health products, as well as other terms and conditions included in the insurance policies offered by our insurance subsidiaries, marketing practices, advertising, agent licensing, independent agent practices, policy forms, capital adequacy, solvency, reserves and permitted investments.
Regulatory authorities also have the power to conduct investigations, and to bring administrative or judicial proceedings against us, which could result in suspension or revocation of our licenses, cease and desist orders, fines, civil penalties, disgorgement, criminal penalties or other disciplinary action that could have a material adverse impact on our business, financial condition or results of operation. Press coverage and other public statements that allege wrongdoing, even if untrue, can lead to increased regulatory inquiries or investigations including any that may arise in connection with the subpoenas we recently received from U.S. Attorney’s Office for the Western District of Pennsylvania seeking documents related to sales practices by certain of our independent sales agents contracted to sell American Income Life Insurance Company policies. Additionally, any violation or alleged violation of law or regulations could result in significant legal costs or in legal proceedings that may result in monetary and legal remedies being imposed against the Company, which could have a material adverse effect on our business, financial condition or results of operations.
The insurance laws, regulations and policies currently affecting our companies may change at any time, possibly having an adverse effect on our business. Should regulatory changes occur, we may be unable to maintain all required licenses and approvals, or fully comply with the wide variety of applicable laws and regulations or the relevant authority’s interpretation of such laws and regulations. If we do not have the requisite licenses and approvals or do not comply with applicable regulatory requirements, the insurance regulatory authorities could preclude or temporarily suspend some or all of our business activities and/or impose substantial fines.
The use of third-party vendors, including independent sales agents, to support the Company's operations makes the Company susceptible to the operational risk of those third parties, which could lower revenues, increase costs, reduce profits, disrupt business, or damage the Company’s reputation.
The Company utilizes third-party vendors, including independent sales agents, to provide certain business services and functions, which exposes the Company to risks outside the control of the Company. The reliance on these third-party vendors creates a number of business risks, such as the risk that the Company may not maintain service quality, control or effective management of the outsourced business operations and that the Company cannot control the information systems, facilities or networks of such third-party vendors. We employ controls and procedures designed to facilitate service quality of our third party vendors; however, such controls and procedures cannot be 100% effective in all cases. The Company may be adversely affected by a third-party vendor who operates in a poorly controlled manner or fails to deliver contracted services, which could lower revenues, increase costs, reduce profits, disrupt business, or damage the Company’s reputation.
Extensive federal and state laws regulate our business, imposing certain requirements that independent sales agents must follow in dealing with clients. Misconduct of our independent sales agents could result in violations of law by, or claims against, us or our subsidiaries. From time to time, we are subject to private litigation as a result of alleged misconduct by independent agents. We employ controls and procedures designed to prevent and detect agent misconduct; however, such controls and procedures cannot be 100% effective in all cases. Instances of misconduct or non-compliance or violations of laws or regulations by our independent sales agents could result in adverse findings in either examinations or litigation and subject us to sanctions, monetary liabilities, restrictions on or loss of the operation of our business or reputational harm, any of which could have a material adverse effect on our business, financial condition or results of operations.
Additionally, the Company is at risk of being unable to meet legal, regulatory, financial or customer obligations if the information systems, facilities or networks of a third-party vendor are disrupted, damaged or fail, whether due to physical disruptions, such as fire, natural disaster, pandemic or power outage, or due to cybersecurity incidents, ransomware or other impacts to vendors, including labor strikes, political unrest and terrorist attacks.
We have become subject to, and may in the future be subject to, short selling strategies driving down the market price of our common stock.
Short selling is the practice of selling securities that the seller does not own but may have borrowed with the intention of buying identical securities back at a later date. A short seller hopes to profit from a decline in the value of the securities between the sale of the borrowed securities and the purchase of the replacement shares, as the short seller expects to pay less in that purchase than it received in the sale. Because it is in the short seller’s best interests for the price of the securities to decline, some short sellers publish, or arrange for the publication of, opinions or characterizations regarding the relevant issuer, its business prospects and similar matters calculated to or which may create negative market momentum, which may permit them to obtain profits for themselves as a result of selling the stock short. Companies, like us, that are subject to unfavorable allegations, even if untrue, may have to expend a significant amount of resources to investigate such allegations and/or defend themselves, including in connection with securityholder litigation against the Company or investigations by regulators related to or prompted by such allegations.
In April 2024, we were the target of several short sellers who published reports making allegations about the Company, which resulted in a significant decline in the price of our common stock. In addition, these reports resulted in significant negative publicity against us, damaged our reputation, and exposed us to securities class action litigation. We have already expended significant resources to defend and repair our reputation. We will continue to defend against any unfounded and unsubstantiated claims about our business, our disclosures and the integrity of our financial statements, which may require us to expend significant resources.
We may be subject to additional short seller reports and activity in the future. The publication of any such commentary regarding us may bring about a temporary, or long term, decline in the market price of our common stock. No assurances can be made that similar declines in the market price of our common stock or negative publicity will not occur in the future, in connection with such commentary by short sellers or otherwise.
Damage to the brand and reputation of Globe Life or its subsidiaries could affect our ability to conduct business.
Negative publicity through traditional media, internet, social media, and other public forums, including short seller reports and allegations of independent agent misconduct could damage our brand or reputation, which could adversely impact our ability to recruit and retain agents, our ability to market our products, and the persistency of in-force policies. A reduction in the number of agents selling our products, or the rate of growth of the number of agents selling our products may have an adverse impact on product sales and profit, and such impact may be material.
Recent volatility in the trading price of our common stock has and can be expected to result in securities class action litigation.
In April 2024, the trading price of our common stock dropped following the publication of certain short seller reports. As of the date of this Report, one putative securities class action has been filed against Globe Life Inc. and we expect that other putative class action claims may be filed as well. While we intend to defend such actions vigorously, any judgment against us or any future stockholder litigation could have a material adverse effect on our business, financial condition or results of operations.
Item 2. Unregistered Sales of Equity Securities and Use of Proceeds
Purchases of Certain Equity Securities by the Issuer and Others for the First Quarter of 2024
Period
(a) Total Number
of Shares
Purchased
(b) Average
Price Paid
Per Share
(c) Total Number of Shares Purchased as Part of Publicly Announced Plans or Programs
(d) Maximum Number
of Shares (or
Approximate Dollar
Amount) that May
Yet Be Purchased
Under the Plans or
Programs
January 1-31, 2024
150,000
$
122.14
150,000
—
February 1-29, 2024
40,557
128.40
40,557
—
March 1-31, 2024
—
—
—
—
Item 5. Other Information
(c) Trading arrangements
During the three months ended March 31, 2024, none of our directors or officers adopted or terminated a Rule 10b5-1 trading arrangement or a Non-Rule 10b5-1 trading arrangement, as each term is defined under Item 408(a) of Regulation S-K.
XBRL Instance Document- the instance document does not appear in the Interactive Data file because the XBRL tags are embedded within the Inline XBRL document.
Pursuant to the requirements of the Securities Exchange Act of 1934, the registrant has duly caused this report to be signed on its behalf by the undersigned thereunto duly authorized.
GLOBE LIFE INC.
Date: May 8, 2024
/s/ J. Matthew Darden
J. Matthew Darden
Co-Chairman and Chief Executive Officer
Date: May 8, 2024
/s/ Frank M. Svoboda
Frank M. Svoboda
Co-Chairman and Chief Executive Officer
Date: May 8, 2024
/s/ Thomas P. Kalmbach
Thomas P. Kalmbach
Executive Vice President and Chief Financial Officer