☒ QUARTERLY REPORT PURSUANT TO SECTION 13 OR 15(d) OF THESECURITIES EXCHANGE ACT OF 1934
For the quarterly period ended September 30, 2025
or
☐ TRANSITION REPORT PURSUANT TO SECTION 13 OR 15(d) OF THE SECURITIES EXCHANGE ACT OF 1934
For the transition period from _____ to ________
Commission File Number: 001-08052
GLOBE LIFE INC.
(Exact name of registrant as specified in its charter)
Delaware
63-0780404
(State or other jurisdiction of incorporation or organization)
(I.R.S. Employer Identification No.)
3700 South Stonebridge Drive, McKinney, Texas75070
(Address of principal executive offices) (Zip Code)
(972) 569-4000
(Registrant’s telephone number, including area code)
NONE
(Former name, former address and former fiscal year, if changed since last report)
Securities registered pursuant to Section 12(b) of the Act:
Title of each class
Trading Symbol(s)
Name of each exchange on which registered
Common Stock, $1.00 par value per share
GL
New York Stock Exchange
Common Stock, $1.00 par value per share
GL
NYSE Texas, Inc.
4.250% Junior Subordinated Debentures
GL PRD
New York Stock Exchange
Indicate by check mark whether the registrant (1) has filed all reports required to be filed by Section 13 or 15(d) of the Securities Exchange Act of 1934 during the preceding 12 months (or for such shorter period that the registrant was required to file such reports), and (2) has been subject to such filing requirements for the past 90 days. Yes☒ No ☐
Indicate by check mark whether the registrant has submitted electronically every Interactive Data File required to be submitted pursuant to Rule 405 of Regulation S-T (§232.405 of this chapter) during the preceding 12 months (or for such shorter period that the registrant was required to submit such files). Yes☒ No ☐
Indicate by check mark whether the registrant is a large accelerated filer, an accelerated filer, a non-accelerated filer, a smaller reporting company, or an emerging growth company. See the definitions of “large accelerated filer,” “accelerated filer,” “smaller reporting company,” and "emerging growth company" in Rule 12b-2 of the Exchange Act.
Large accelerated filer
☒
Accelerated filer
☐
Non-accelerated filer
☐
Smaller reporting company
☐
Emerging growth company
☐
If an emerging growth company, indicate by check mark if the registrant has elected not to use the extended transition period for complying with any new or revised financial accounting standards provided pursuant to Section 13(a) of the Exchange Act.
☐
Indicate by check mark whether the registrant is a shell company (as defined in Rule 12b-2 of the Exchange Act). Yes ☐ No ☒
Indicate the number of shares outstanding of each of the issuer’s classes of common stock, as of the latest practicable date.
As used in this Form 10-Q, “Globe Life,” the “Company,” “we,” “our” and “us” refer to Globe Life Inc., a Delaware corporation incorporated in 1979, its subsidiaries and affiliates.
(Dollar amounts in thousands, except share and per share data)
Three Months Ended September 30,
Nine Months Ended September 30,
2025
2024
2025
2024
Revenue:
Life premium
$
844,483
$
818,638
$
2,513,890
$
2,438,385
Health premium
386,524
353,955
1,134,414
1,046,617
Total premium
1,231,007
1,172,593
3,648,304
3,485,002
Net investment income
286,013
284,964
848,796
853,178
Realized gains (losses)
(4,987)
(2,192)
(23,476)
(26,580)
Other income
955
42
1,073
192
Total revenue
1,512,988
1,455,407
4,474,697
4,311,792
Benefits and expenses:
Life policyholder benefits(1)
381,511
454,502
1,410,622
1,493,165
Health policyholder benefits(2)
227,940
221,926
691,793
629,676
Other policyholder benefits
7,171
11,756
20,970
32,830
Total policyholder benefits
616,622
688,184
2,123,385
2,155,671
Amortization of deferred acquisition costs
114,074
104,310
330,990
305,703
Commissions, premium taxes, and non-deferred acquisition costs
157,494
149,693
479,228
447,605
Other operating expense
111,562
104,874
328,601
297,196
Interest expense
36,134
31,388
106,011
91,413
Total benefits and expenses
1,035,886
1,078,449
3,368,215
3,297,588
Income before income taxes
477,102
376,958
1,106,482
1,014,204
Income tax benefit (expense)
(89,259)
(73,964)
(211,327)
(198,638)
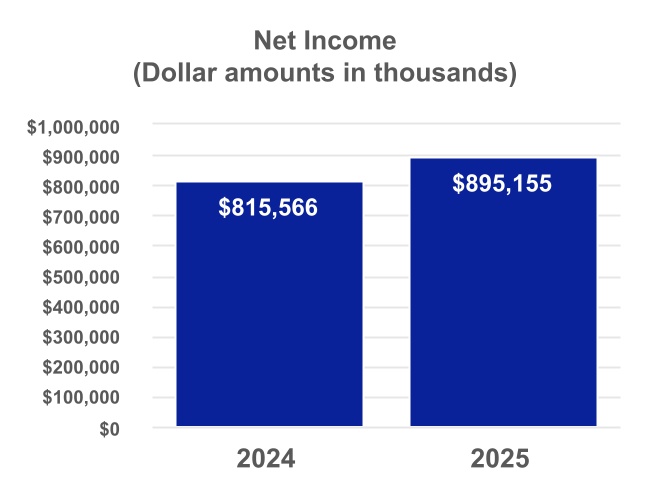
Net income
$
387,843
$
302,994
$
895,155
$
815,566
Basic net income per common share
$
4.81
$
3.45
$
10.91
$
8.96
Diluted net income per common share
$
4.73
$
3.44
$
10.77
$
8.93
(1)Net of a remeasurement, including both the impact of assumption changes and the effect of actual to expected experience adjustments, resulting in a gain of $149.5 million before tax for the three months ended September 30, 2025 and a remeasurement gain of $70.6 million before tax for the same period in 2024. Net of a remeasurement gain of $174.7 million before tax for the nine months ended September 30, 2025 and a remeasurement gain of $87.8 million before tax for the same period in 2024.
(2)Net of a remeasurement, including both the impact of assumption changes and the effect of actual to expected experience adjustments, resulting in a gain of $8.8 million before tax for the three months ended September 30, 2025 and a remeasurement loss of $9.6 million before tax for the same period in 2024. Net of a remeasurement gain of $13.2 million before tax for the nine months ended September 30, 2025 and a remeasurement loss of $3.1 million before tax for the same period in 2024.
See accompanying Notes to Condensed Consolidated Financial Statements.
Notes to Condensed Consolidated Financial Statements
(Dollar amounts in thousands, except per share data)
Note 1—Significant Accounting Policies
Business: (Globe Life), (the Company), refers to Globe Life Inc., an insurance holding company incorporated in Delaware in 1979, and Globe Life Inc. subsidiaries and affiliates. Globe Life Inc.'s direct or indirect primary subsidiaries are Globe Life And Accident Insurance Company, American Income Life Insurance Company, Liberty National Life Insurance Company, Family Heritage Life Insurance Company of America, and United American Insurance Company. The underwriting companies are owned by their ultimate corporate parent, Globe Life Inc. (Parent Company).
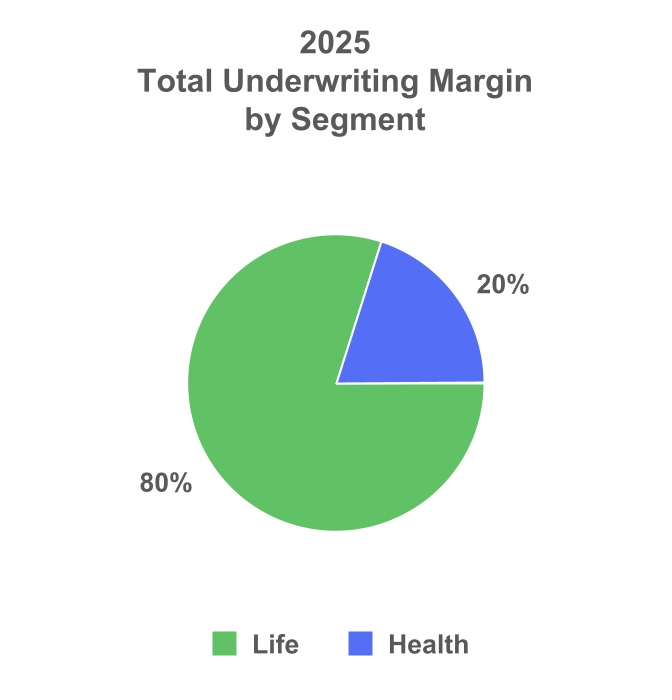
Globe Life provides a variety of life and supplemental health insurance products to a broad base of customers. The Company is organized into three reportable segments: life insurance, supplemental health insurance, and investments.
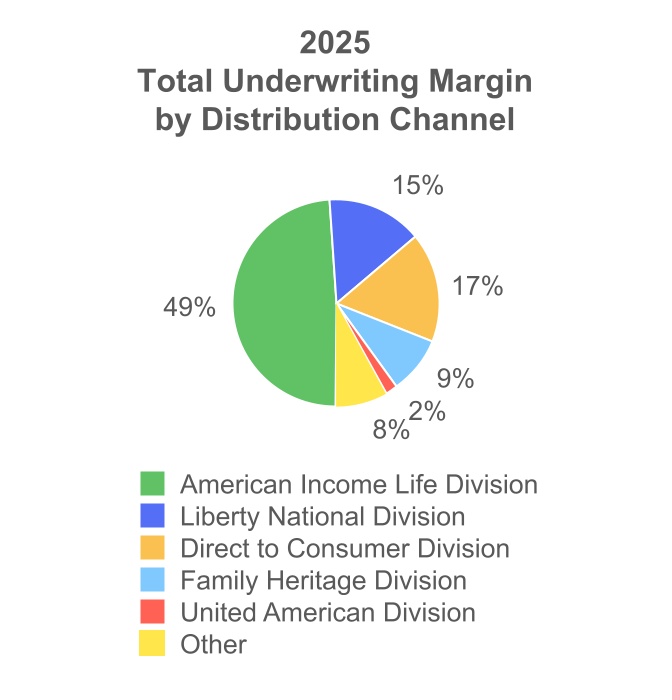
Globe Life markets its insurance products through a number of distribution channels, each of which sells the products of one or more of Globe Life's insurance segments. Our distribution channels consist of the following exclusive agencies: American Income Life Division (American Income), Liberty National Division (Liberty National) and Family Heritage Division (Family Heritage); an independent agency, United American Division (United American); and our Direct to Consumer Division (DTC).
Basis of Presentation: The accompanying condensed consolidated financial statements of Globe Life have been prepared in accordance with the instructions to Form 10-Q. Therefore, they do not include all of the disclosures required by accounting principles generally accepted in the United States of America (GAAP) for annual financial statements. However, in the opinion of management, these statements include all adjustments, consisting of normal recurring adjustments, which are necessary for a fair presentation of the condensed consolidated financial position at September 30, 2025, and the condensed consolidated results of operations, comprehensive income, and cash flows for the periods ended September 30, 2025 and 2024. The interim period condensed consolidated financial statements should be read in conjunction with the Consolidated Financial Statementsthat were included in the Form 10-K filed with the Securities Exchange Commission (SEC) on February 26, 2025.
Use of Estimates: The preparation of the condensed consolidated financial statements in conformity with GAAP requires management to make estimates and assumptions that affect the reported amounts of assets and liabilities and disclosure of contingent liabilities at the date of the condensed consolidated financial statements and the reported amounts of revenues and expenses during the reporting period. Actual results could differ from those estimates. See further documentation in the significant accounting policies or the accompanying notes.
Reinsurance and Recapture: In the normal course of business, Globe Life insurance subsidiaries enter into reinsurance agreements to limit their exposure to the risk of loss as well as enhance their capital position. The Company entered into a coinsurance transaction with funds withheld agreement with a third-party reinsurer on March 6, 2025, with an agreement effective date of January 1, 2025. Under the terms of the agreement Globe Life ceded 100% of the liabilities, net of existing reinsurance, associated with certain term and whole life insurance policies. The contract is accounted for under deposit accounting as it did not pass the risk transfer requirements for reinsurance treatment on a GAAP basis. Since the agreement is subject to deposit accounting and meets the right of offset conditions outlined in the accounting policy the Company recorded the initial coinsurance, ceding commission and funds withheld balance on a net basis. At inception, no cash was exchanged between the parties and subsequently, a risk charge was recorded as a component of net investment income in the Condensed Consolidated Statement of Operations, with net cash settlements occurring quarterly between the parties.
On March 31, 2025, the Company entered into a recapture and termination agreement with a third-party reinsurer to recapture certain policies that had previously been ceded under a reinsurance agreement dated November 12, 2001. The recapture was executed to accomplish common objectives between the Company and the reinsurer. As a result of the transaction, the Company received net proceeds of $39 million, which are reflected as operating cash flows in the Condensed Consolidated Statement of Cash Flows. The Company also recognized a gain of approximately $14 million in policyholder benefits in the Condensed Consolidated Statement of Operations.
Notes to Condensed Consolidated Financial Statements
(Dollar amounts in thousands, except per share data)
Building Acquisition: On July 3, 2025, Globe Life Inc. completed the acquisition of real estate located in McKinney, Texas for total consideration of $80 million. The acquisition was executed in order to support Company growth and efficiency through modern technological infrastructure and centralized operations. The acquisition includes land, a building structure and building improvements. The transaction was executed pursuant to a purchase agreement and is accounted for as an asset acquisition. The purchase price was allocated based upon the relative fair value of land, building and building improvements. The building is being depreciated over its estimated useful life of 40 years on a straight-line basis and recorded as part of other operating expense on the Condensed Consolidated Statement of Operations. For additional information regarding our property, plant and equipment accounting policy, please refer to our 2024 Form 10-K. The Company expects to utilize the facility for its own operational needs.
As of the date of this filing, the current facility does not qualify for held for sale classification and no impairment indicators have been identified.
Note 2—New Accounting Standards
Accounting Pronouncements Yet to be Adopted:ASU No. 2023-09, Income Taxes (Topic 740): Improvements to Income Tax Disclosures, adds disclosure requirements to disaggregate information related to the effective tax rate reconciliation and information on income taxes paid. The disclosures will enhance the assessment of an entity’s operations and related tax risks.
This standard is effective for the Company for annual periods beginning on January 1, 2025, and will be implemented on a prospective basis. The Company does not expect the standard will have a material impact on the condensed consolidated financial statements. The guidance requires only additional disclosure, as a result there will be no effects on our financial position, results of operations or cash flows.
ASU No. 2024-03, Income Statement—Reporting Comprehensive Income—Expense Disaggregation Disclosures (Subtopic 220-40): Disaggregation of Income Statement Expenses, adds disclosure requirements to disaggregate information related to an entity's income statement. The disclosures will allow for enhanced transparency of an entity's expenses.
This standard is effective for the Company for annual periods beginning on January 1, 2027. The Company is evaluating the standard.
ASU No. 2025-06, Intangibles—Goodwill and Other—Internal-Use Software (Subtopic 350-40): Targeted Improvements to the Accounting for Internal-Use Software, provides guidance for the evaluation of determining whether criteria is met to begin the capitalization of internal-use software costs. ASC 350 (Intangibles—Goodwill and Other) requires the capitalization of internal-use software costs begin when both of the following criteria are met: (1) when management has authorized and committed to funding the software project and (2) the probability that the project will be completed and will be used to perform the function intended. If uncertainty exists under the guidance issued in Subtopic 350-40 then a probable to complete threshold will not exist and any costs would be expensed until uncertainties are resolved.
The updated guidance also requires the application of disclosure requirements in ASC 360 (Plant, Property, and Equipment) for all capitalized costs regardless of presentation in the financial statements. This standard is effective for the Company for annual periods beginning on January 1, 2028. The Company is evaluating the standard.
Notes to Condensed Consolidated Financial Statements
(Dollar amounts in thousands, except per share data)
Note 3—Supplemental Information about Changes to Accumulated Other Comprehensive Income
Components of Accumulated Other Comprehensive Income: An analysis of the change in balance by component of Accumulated Other Comprehensive Income is as follows for the three and nine month periods ended September 30, 2025 and 2024:
Three Months Ended September 30, 2025
Available for Sale Assets
Future Policy Benefits
Foreign Exchange
Pension Adjustments
Total
Balance at July 1, 2025
$
(1,251,427)
$
(746,269)
$
(6,969)
$
20,797
$
(1,983,868)
Other comprehensive income (loss) before reclassifications, net of tax
342,044
(334,519)
(4,445)
—
3,080
Reclassifications, net of tax
7,847
—
—
50
7,897
Other comprehensive income (loss)
349,891
(334,519)
(4,445)
50
10,977
Balance at September 30, 2025
$
(901,536)
$
(1,080,788)
$
(11,414)
$
20,847
$
(1,972,891)
Three Months Ended September 30, 2024
Available for Sale Assets
Future Policy Benefits
Foreign Exchange
Pension Adjustments
Total
Balance at July 1, 2024
$
(1,271,213)
$
(911,717)
$
(4,726)
$
(1,964)
$
(2,189,620)
Other comprehensive income (loss) before reclassifications, net of tax
686,343
(985,420)
5,764
—
(293,313)
Reclassifications, net of tax
(1,903)
—
—
93
(1,810)
Other comprehensive income (loss)
684,440
(985,420)
5,764
93
(295,123)
Balance at September 30, 2024
$
(586,773)
$
(1,897,137)
$
1,038
$
(1,871)
$
(2,484,743)
Nine Months Ended September 30, 2025
Available for Sale Assets
Future Policy Benefits
Foreign Exchange
Pension Adjustments
Total
Balance at January 1, 2025
$
(1,319,618)
$
(709,042)
$
(21,757)
$
20,697
$
(2,029,720)
Other comprehensive income (loss) before reclassifications, net of tax
404,498
(371,746)
10,343
—
43,095
Reclassifications, net of tax
13,584
—
—
150
13,734
Other comprehensive income (loss)
418,082
(371,746)
10,343
150
56,829
Balance at September 30, 2025
$
(901,536)
$
(1,080,788)
$
(11,414)
$
20,847
$
(1,972,891)
Nine Months Ended September 30, 2024
Available for Sale Assets
Future Policy Benefits
Foreign Exchange
Pension Adjustments
Total
Balance at January 1, 2024
$
(827,596)
$
(1,947,391)
$
4,719
$
(2,151)
$
(2,772,419)
Other comprehensive income (loss) before reclassifications, net of tax
Notes to Condensed Consolidated Financial Statements
(Dollar amounts in thousands, except per share data)
Reclassification Adjustments: Reclassification adjustments out of accumulated other comprehensive income are presented below for the three and nine month periods ended September 30, 2025 and 2024.
Three Months Ended September 30,
Nine Months Ended September 30,
Affected line items in the Statements of Operations
Component Line Item
2025
2024
2025
2024
Unrealized investment (gains) losses on available for sale assets:
Notes to Condensed Consolidated Financial Statements
(Dollar amounts in thousands, except per share data)
Note 4—Investments
Portfolio Composition: Summaries of fixed maturities available for sale by amortized cost, fair value, and allowance for credit losses at September 30, 2025 and December 31, 2024, and the corresponding amounts of gross unrealized gains and losses recognized in accumulated other comprehensive income (loss) are as follows. Redeemable preferred stock is included within "Corporates, by sector."
At September 30, 2025
Amortized Cost
Allowance for Credit Losses
Gross Unrealized Gains
Gross Unrealized Losses
Fair
Value(1)
% of Total
Fixed
Maturities(2)
Fixed maturities available for sale:
U.S. Government direct, guaranteed, and government-sponsored enterprises
$
405,807
$
—
$
147
$
(26,787)
$
379,167
2
States, municipalities, and political subdivisions
3,390,124
—
28,759
(545,729)
2,873,154
16
Foreign governments
47,915
—
291
(8,195)
40,011
—
Corporates, by sector:
Industrials
7,891,877
(7,118)
193,171
(601,835)
7,476,095
42
Financial
5,018,604
—
146,863
(318,860)
4,846,607
27
Utilities
2,100,517
—
78,904
(87,347)
2,092,074
12
Total corporates
15,010,998
(7,118)
418,938
(1,008,042)
14,414,776
81
Collateralized debt obligations
—
—
—
—
—
—
Other asset-backed securities
93,513
(3,297)
383
(953)
89,646
1
Total fixed maturities
$
18,948,357
$
(10,415)
$
448,518
$
(1,589,706)
$
17,796,754
100
(1)Amount reported in the balance sheet.
(2)At fair value.
At December 31, 2024
Amortized Cost
Allowance for Credit Losses
Gross Unrealized Gains
Gross Unrealized Losses
Fair
Value(1)
% of Total
Fixed
Maturities(2)
Fixed maturities available for sale:
U.S. Government direct, guaranteed, and government-sponsored enterprises
$
401,753
$
—
$
1
$
(42,794)
$
358,960
2
States, municipalities, and political subdivisions
3,300,901
—
20,662
(534,759)
2,786,804
16
Foreign governments
36,883
—
18
(8,870)
28,031
—
Corporates, by sector:
Industrials
7,889,074
(7,098)
105,610
(805,330)
7,182,256
42
Financial
5,006,375
—
82,598
(413,043)
4,675,930
27
Utilities
2,081,366
—
39,716
(118,007)
2,003,075
12
Total corporates
14,976,815
(7,098)
227,924
(1,336,380)
13,861,261
81
Collateralized debt obligations
36,923
—
5,943
—
42,866
—
Other asset-backed securities
82,534
(3,297)
39
(2,186)
77,090
1
Total fixed maturities
$
18,835,809
$
(10,395)
$
254,587
$
(1,924,989)
$
17,155,012
100
(1)Amount reported in the balance sheet.
(2)At fair value.
The Company had unfunded commitments of $263 million and $167 million in fixed maturities at September 30, 2025 and December 31, 2024, respectively.
Notes to Condensed Consolidated Financial Statements
(Dollar amounts in thousands, except per share data)
A schedule of fixed maturities available for sale by contractual maturity date at September 30, 2025, is shown below on an amortized cost basis, net of allowance for credit losses, and on a fair value basis. Actual disposition dates could differ from contractual maturities due to call or prepayment provisions.
At September 30, 2025
Amortized Cost, net
Fair Value
Fixed maturities available for sale:
Due in one year or less
$
111,404
$
111,847
Due after one year through five years
788,630
815,353
Due after five years through ten years
1,878,317
1,947,313
Due after ten years through twenty years
8,998,125
8,593,860
Due after twenty years
7,071,236
6,238,721
Mortgage-backed and asset-backed securities
90,230
89,660
$
18,937,942
$
17,796,754
Analysis of Investment Operations:"Net investment income" for the three and nine month periods ended September 30, 2025 and 2024 is summarized as follows:
Three Months Ended September 30,
Nine Months Ended September 30,
2025
2024
% Change
2025
2024
% Change
Fixed maturities available for sale
$
243,444
$
245,313
(1)
$
730,859
$
738,626
(1)
Policy loans
14,123
13,296
6
41,631
39,196
6
Mortgage loans
7,960
7,668
4
19,978
21,337
(6)
Other long-term investments(1)
24,417
19,992
22
68,934
58,608
18
Short-term investments
2,611
3,083
7,146
8,396
292,555
289,352
1
868,548
866,163
—
Less investment expense
(6,542)
(4,388)
49
(19,752)
(12,985)
52
Net investment income
$
286,013
$
284,964
—
$
848,796
$
853,178
(1)
(1)For the three months ended September 30, 2025 and September 30, 2024 the investment funds, accounted for under the fair value option method, recorded $21.6 million and $19.1 millionin net investment income respectively. For the nine months ended September 30, 2025 and 2024, the investment funds, accounted for under the fair value option method, recorded $58.9 million and $56.1 million, respectively, in net investment income. Refer to Other Long-Term Investmentsbelowfor further discussion on the investment funds.
Selected information about sales of fixed maturities available for sale is as follows:
Three Months Ended September 30,
Nine Months Ended September 30,
2025
2024
2025
2024
Fixed maturities available for sale:
Proceeds from sales(1)
$
184,500
$
163,221
$
456,567
$
674,125
Gross realized gains
916
2,042
4,011
6,086
Gross realized losses
(7,761)
(1,856)
(16,251)
(15,824)
(1)During the three and nine months ended September 30, 2025 the Company had $3.2 million unsettled trades. There were $0 unsettled trades for the same periods in 2024.
Notes to Condensed Consolidated Financial Statements
(Dollar amounts in thousands, except per share data)
An analysis of "realized gains (losses)" is as follows:
Three Months Ended September 30,
Nine Months Ended September 30,
2025
2024
2025
2024
Realized investment gains (losses):
Fixed maturities available for sale:
Sales and other(1)
$
(11,686)
$
257
$
(23,735)
$
(9,716)
Provision for credit losses
(60)
—
(20)
(16)
Fair value option—change in fair value
5,958
(3,683)
(147)
(22,777)
Mortgage loans
(4,526)
(1,376)
(4,219)
(3,530)
Other investments
(1,131)
(16)
(2,473)
1,135
Realized gains (losses) from investments
(11,445)
(4,818)
(30,594)
(34,904)
Other gains (losses)
6,458
2,626
7,118
8,324
Total realized gains (losses)
(4,987)
(2,192)
(23,476)
(26,580)
Applicable tax
1,048
460
4,930
5,582
Realized gains (losses), net of tax
$
(3,939)
$
(1,732)
$
(18,546)
$
(20,998)
(1)During the three months ended September 30, 2025 and 2024, the Company recorded $176 thousand and $3.4 million of issuer-initiated exchanges of fixed maturities (noncash transactions) that resulted in $176 thousand and $0 realized gains (losses) respectively. During the nine months ended September 30, 2025 and 2024, the Company recorded $128.5 million and $82.2 million of issuer-initiated exchanges of fixed maturities (noncash transactions) that resulted in $(3.0) million and $0 realized gains (losses) respectively.
Notes to Condensed Consolidated Financial Statements
(Dollar amounts in thousands, except per share data)
Fair Value Measurements:The following tables represent the fair value of fixed maturities measured on a recurring basis at September 30, 2025 and December 31, 2024:
Fair Value Measurement at September 30, 2025:
Quoted Prices in Active Markets for Identical Assets (Level 1)
Significant Other Observable Inputs (Level 2)
Significant Unobservable Inputs (Level 3)
Total Fair Value
Fixed maturities available for sale
U.S. Government direct, guaranteed, and government-sponsored enterprises
$
—
$
379,167
$
—
$
379,167
States, municipalities, and political subdivisions
—
2,873,154
—
2,873,154
Foreign governments
—
40,011
—
40,011
Corporates, by sector:
Industrials
—
7,369,953
106,142
7,476,095
Financial
—
4,724,499
122,108
4,846,607
Utilities
—
2,004,049
88,025
2,092,074
Total corporates
—
14,098,501
316,275
14,414,776
Collateralized debt obligations
—
—
—
—
Other asset-backed securities
—
25,737
63,909
89,646
Total fixed maturities
$
—
$
17,416,570
$
380,184
$
17,796,754
Percentage of total
—
%
98
%
2
%
100
%
Fair Value Measurement at December 31, 2024:
Quoted Prices in Active Markets for Identical Assets (Level 1)
Significant Other Observable Inputs (Level 2)
Significant Unobservable Inputs (Level 3)
Total Fair Value
Fixed maturities available for sale
U.S. Government direct, guaranteed, and government-sponsored enterprises
$
—
$
358,960
$
—
$
358,960
States, municipalities, and political subdivisions
Notes to Condensed Consolidated Financial Statements
(Dollar amounts in thousands, except per share data)
The following tables represent changes in fixed maturities measured at fair value on a recurring basis using significant unobservable inputs (Level 3):
Analysis of Changes in Fair Value Measurements Using Significant Unobservable Inputs (Level 3)
Asset-
backed Securities
Collateralized Debt Obligations
Corporates
Total
Balance at January 1, 2025
$
11,183
$
42,866
$
420,065
$
474,114
Included in realized gains / losses
—
(588)
(2,593)
(3,181)
Included in other comprehensive income
320
—
9,661
9,981
Acquisitions
52,406
—
30,015
82,421
Sales
—
(36,398)
(118,379)
(154,777)
Amortization
—
1,893
(205)
1,688
Other(1)
—
(7,773)
(22,289)
(30,062)
Transfers into Level 3(2)
—
—
—
—
Transfers out of Level 3(2)
—
—
—
—
Balance at September 30, 2025
$
63,909
$
—
$
316,275
$
380,184
Percent of total fixed maturities
—
%
—
%
2
%
2
%
(1)Includes capitalized interest, foreign exchange adjustments, and principal repayments.
(2)Considered to be transferred at the end of the period. Transfers into Level 3 occur when observable inputs are no longer available. Transfers out of Level 3 occur when observable inputs become available.
Analysis of Changes in Fair Value Measurements Using Significant Unobservable Inputs (Level 3)
Asset-
backed Securities
Collateralized Debt Obligations
Corporates
Total
Balance at January 1, 2024
$
—
$
42,146
$
454,733
$
496,879
Included in realized gains / losses
—
—
—
—
Included in other comprehensive income
—
762
5,448
6,210
Acquisitions
7,876
—
14,800
22,676
Sales
—
—
—
—
Amortization
—
3,414
(38)
3,376
Other(1)
—
(3,839)
(29,132)
(32,971)
Transfers into Level 3(2)
—
—
—
—
Transfers out of Level 3(2)
—
—
—
—
Balance at September 30, 2024
$
7,876
$
42,483
$
445,811
$
496,170
Percent of total fixed maturities
—
%
—
%
3
%
3
%
(1)Includes capitalized interest, foreign exchange adjustments, and principal repayments.
(2)Considered to be transferred at the end of the period. Transfers into Level 3 occur when observable inputs are no longer available. Transfers out of Level 3 occur when observable inputs become available.
Notes to Condensed Consolidated Financial Statements
(Dollar amounts in thousands, except per share data)
The following table presents changes in unrealized gains and losses for the period included in accumulated other comprehensive income for assets held at the end of the reporting period for Level 3 classification:
Changes in Unrealized Gains (Losses) included in Accumulated Other Comprehensive Income for Assets Held at the End of the Period
Asset- backed Securities
Collateralized Debt Obligations
Corporates
Total
At September 30, 2025
$
320
$
—
$
9,661
$
9,981
At September 30, 2024
—
762
5,448
6,210
Transfers between levels within the hierarchy occur when there are changes in the observability of the inputs and market data. Transfers into Level 3 occur when there is little unobservable market activity for the asset/liability as of the measurement date and the Company is required to rely upon internally-developed assumptions or third parties. Transfers out of Level 3 occur when quoted prices in active markets becomes available for identical assets/ liabilities or the ability to corroborate by observable market data.
The following table represents quantitative information about Level 3 fair value measurements:
Quantitative Information about Level 3 Fair Value Measurements
September 30, 2025
Fair Value
Valuation Techniques
Significant Unobservable Input
Range
Weighted-
Average(1)
Private placement fixed maturities
$
316,275
Determination of credit spread
Credit rating
B to AAA
BBB+
Asset-backed securities
63,909
Determination of credit spread
Credit rating
CC to A-
BB+
$
380,184
(1)Unobservable inputs were weighted by the relative fair value of the instruments.
Private placement fixed maturities and asset-backed securities are valued based on the contractual cash flows discounted by a yield determined as a treasury benchmark rate adjusted for a credit spread. The credit spread is developed from observable indices for similar securities and unobservable indices for private securities or private comparable securities for corresponding credit ratings. The credit ratings for the securities may be considered unobservable inputs, as they are private letter ratings issued by a nationally recognized statistical rating organization or are assigned by the third-party investment manager based on a quantitative and qualitative assessment of the credit underwritten. A higher (lower) credit rating would result in a higher (lower) valuation. For more information regarding valuation procedures, please refer to Note 1—Significant Accounting Policies under the caption Fair Value Measurements, Investments in Securities disclosed in the Form 10-K.
Unrealized Loss Analysis: The following table discloses information about fixed maturities available for sale in an unrealized loss position.
Less than Twelve Months
Twelve Months or Longer
Total
Number of issues (CUSIPs) held:
As of September 30, 2025
454
1,484
1,938
As of December 31, 2024
705
1,498
2,203
Globe Life's entire fixed maturity portfolio consisted of 2,584 issues by 1,012 different issuers at September 30, 2025 and 2,552 issues by 1,014 different issuers at December 31, 2024. The weighted-average quality rating of all unrealized loss positions at amortized cost was A as of September 30, 2025 and A- as of December 31, 2024.
Notes to Condensed Consolidated Financial Statements
(Dollar amounts in thousands, except per share data)
The following tables disclose unrealized investment losses by class and major sector of fixed maturities available for sale at September 30, 2025 and December 31, 2024.
Analysis of Gross Unrealized Investment Losses
At September 30, 2025
Less than Twelve Months
Twelve Months or Longer
Total
Fair Value
Unrealized Loss
Fair Value
Unrealized Loss
Fair Value
Unrealized Loss
Fixed maturities available for sale:
Investment grade securities:
U.S. Government direct, guaranteed, and government-sponsored enterprises
$
4,965
$
(427)
$
364,054
$
(26,360)
$
369,019
$
(26,787)
States, municipalities, and political subdivisions
Notes to Condensed Consolidated Financial Statements
(Dollar amounts in thousands, except per share data)
At December 31, 2024
Less than Twelve Months
Twelve Months or Longer
Total
Fair Value
Unrealized Loss
Fair Value
Unrealized Loss
Fair Value
Unrealized Loss
Fixed maturities available for sale:
Investment grade securities:
U.S. Government direct, guaranteed, and government-sponsored enterprises
$
11,268
$
(290)
$
347,527
$
(42,504)
$
358,795
$
(42,794)
States, municipalities, and political subdivisions
778,244
(32,894)
1,532,264
(501,865)
2,310,508
(534,759)
Foreign governments
—
—
24,925
(8,870)
24,925
(8,870)
Corporates, by sector:
Industrials
1,487,940
(73,404)
3,433,034
(690,920)
4,920,974
(764,324)
Financial
961,932
(52,946)
1,785,130
(333,873)
2,747,062
(386,819)
Utilities
546,965
(20,214)
540,077
(90,996)
1,087,042
(111,210)
Total corporates
2,996,837
(146,564)
5,758,241
(1,115,789)
8,755,078
(1,262,353)
Other asset-backed securities
23,231
(95)
42,639
(2,091)
65,870
(2,186)
Total investment grade securities
3,809,580
(179,843)
7,705,596
(1,671,119)
11,515,176
(1,850,962)
Below investment grade securities:
Corporates, by sector:
Industrials
54,199
(2,656)
142,638
(38,350)
196,837
(41,006)
Financial
2,990
(53)
126,811
(26,171)
129,801
(26,224)
Utilities
19,263
(1,113)
24,003
(5,684)
43,266
(6,797)
Total corporates
76,452
(3,822)
293,452
(70,205)
369,904
(74,027)
Other asset-backed securities
—
—
2,198
—
2,198
—
Total below investment grade securities
76,452
(3,822)
295,650
(70,205)
372,102
(74,027)
Total fixed maturities
$
3,886,032
$
(183,665)
$
8,001,246
$
(1,741,324)
$
11,887,278
$
(1,924,989)
Gross unrealized losses may fluctuate quarter over quarter due to factors in the market that affect the holdings, such as changes in interest rates or credit spreads. The Company considers many factors when determining whether an allowance for a credit loss should be recorded. While the Company holds securities that may be in an unrealized loss position, Globe Life does not generally intend to sell and it is unlikely that the Company will be required to sell the fixed maturities prior to their anticipated recovery or maturity due to the strong cash flows generated by its insurance operations.
Notes to Condensed Consolidated Financial Statements
(Dollar amounts in thousands, except per share data)
Fixed Maturities, Allowance for Credit Losses: A summary of the activity in the allowance for credit losses is as follows.
Three Months Ended September 30,
Nine Months Ended September 30,
2025
2024
2025
2024
Allowance for credit losses beginning balance
$
10,355
$
7,132
$
10,395
$
7,115
Additions to allowance for which credit losses were not previously recorded
—
—
—
—
Additions (reductions) to allowance for fixed maturities that previously had an allowance
60
—
20
17
Reduction of allowance for which the Company intends to sell or more likely than not will be required to sell or sold during the period
—
—
—
—
Allowance for credit losses ending balance
$
10,415
$
7,132
$
10,415
$
7,132
As of September 30, 2025, the Company had two fixed maturity securities in non-accrual status at amortized cost of $16 million with an allowance of $10 million. The Company had no fixed maturity securities in non-accrual status as of September 30, 2024.
Notes to Condensed Consolidated Financial Statements
(Dollar amounts in thousands, except per share data)
Mortgage Loans (commercial mortgage loans): Summaries of commercial mortgage loans by property type and geographical location at September 30, 2025 and December 31, 2024 are as follows:
September 30, 2025
December 31, 2024
Carrying Value
% of Total
Carrying Value
% of Total
Property type:
Industrial
$
154,625
34
$
110,456
28
Hospitality
114,945
25
73,931
19
Multi-family
108,876
24
111,234
28
Retail
76,024
17
65,612
16
Office
3,061
1
6,539
2
Mixed use
—
—
35,960
9
Total recorded investment
457,531
101
403,732
102
Less allowance for credit losses
(5,633)
(1)
(7,644)
(2)
Carrying value, net of allowance for credit losses
$
451,898
100
$
396,088
100
September 30, 2025
December 31, 2024
Carrying Value
% of Total
Carrying Value
% of Total
Geographic location:
Florida
$
87,753
19
$
63,308
16
Texas
82,661
18
75,131
19
New Jersey
56,158
13
51,744
13
North Carolina
42,172
9
23,253
6
Alabama
36,735
8
35,850
9
New York
31,927
7
34,975
9
Other
120,125
27
119,471
30
Total recorded investment
457,531
101
403,732
102
Less allowance for credit losses
(5,633)
(1)
(7,644)
(2)
Carrying value, net of allowance for credit losses
Notes to Condensed Consolidated Financial Statements
(Dollar amounts in thousands, except per share data)
The following tables are reflective of the key factors, debt service coverage ratios, and loan-to-value (LTV) ratios that are utilized by management to monitor the performance of the portfolios. The Company only makes new investments in commercial mortgage loans that have a LTV ratio less than 80%. LTV ratios that exceed 80% are generally a result of decreases in the valuation of the underlying property. Generally, a higher LTV ratio and a lower debt service coverage ratio equates to higher risk of loss.
September 30, 2025
Recorded Investment
Debt Service Coverage Ratios(1)
<1.00x
1.00x—1.20x
>1.20x
Total
% of Gross Total
Loan-to-value ratio(2):
Less than 70%
$
60,870
$
83,634
$
304,797
$
449,301
98
70% to 80%
—
—
—
—
—
81% to 90%
—
—
—
—
—
Greater than 90%
8,230
—
—
8,230
2
Total
$
69,100
$
83,634
$
304,797
457,531
100
Less allowance for credit losses
(5,633)
Total, net of allowance for credit losses
$
451,898
(1)Annual net operating income divided by annual mortgage debt service (principal and interest).
(2)Loan balance divided by stabilized appraised value at origination, including planned renovations and stabilized occupancy. Updated internal valuations are used when a loan is materially underperforming.
December 31, 2024
Recorded Investment
Debt Service Coverage Ratios(1)
<1.00x
1.00x—1.20x
>1.20x
Total
% of Gross Total
Loan-to-value ratio(2):
Less than 70%
$
88,507
$
64,494
$
196,867
$
349,868
87
70% to 80%
—
—
—
—
—
81% to 90%
—
—
—
—
—
Greater than 90%
16,136
37,728
—
53,864
13
Total
$
104,643
$
102,222
$
196,867
403,732
100
Less allowance for credit losses
(7,644)
Total, net of allowance for credit losses
$
396,088
(1)Annual net operating income divided by annual mortgage debt service (principal and interest).
(2)Loan balance divided by stabilized appraised value at origination, including planned renovations and stabilized occupancy. Updated internal valuations are used when a loan is materially underperforming.
As of September 30, 2025, the Company had 36 loans in the portfolio. During the quarter, the Company evaluated the commercial mortgage loan portfolio on both an individual and pooling basis to determine the allowance for credit losses and determined two loans were collateral dependent or likely to foreclose. The allowance for credit losses on these loans was determined using the practical expedient which was based on an estimate of fair value of the underlying collateral plus costs to sell the asset. The total principal balance of the two loans was $8.2 million and the allowance, determined using the practical expedient, was $1.6 million as of September 30, 2025. For the three months ended September 30, 2025, two loans with an outstanding principal value of $40.6 million were removed from the evaluation as a result of foreclosure. For the nine months ended September 30, 2025, four loans with an outstanding principal value of $45.8 million were removed from the evaluation as a result of foreclosure and were transferred into limited partnerships, held under the fair value option, in other long-term investments. As of September 30, 2025, there were no commercial mortgage loans in the process of foreclosure.
Notes to Condensed Consolidated Financial Statements
(Dollar amounts in thousands, except per share data)
For the nine months ended September 30, 2025, the allowance for credit losses decreased by $2.0 million to $5.6 million. The provision for credit losses is included in "Realized gains (losses)" in the Condensed Consolidated Statements of Operations.
Three Months Ended September 30,
Nine Months Ended September 30,
2025
2024
2025
2024
Allowance for credit losses beginning balance
$
6,629
$
5,826
$
7,644
$
3,672
Provision (reversal) for credit losses
404
1,376
266
3,530
Reduction in allowance due to dispositions
(1,400)
—
(2,277)
—
Allowance for credit losses ending balance
$
5,633
$
7,202
$
5,633
$
7,202
As of September 30, 2025, the Company had one commercial mortgage loan in non-accrual status with a principal balance of $7 million. As of December 31, 2024, the Company had five commercial mortgage loans in non-accrual status with a principal balance of $53 million. The Company's unfunded commitment balance to commercial loan borrowers was $23 million as of September 30, 2025.
Other Long-Term Investments: Other long-term investments consist of the following assets:
September 30,
September 30, 2025
December 31, 2024
Investment funds
$
1,037,447
$
986,766
Company-owned life insurance(1)
205,284
202,734
Other
42,966
46,259
Total
$
1,285,697
$
1,235,759
(1) Company-owned life insurance (COLI) is reported at cash surrender value.
The following table presents additional information about the Company's investment funds as of September 30, 2025 and December 31, 2024 at fair value:
Fair Value
Unfunded Commitments(2)
Investment Category
September 30, 2025
December 31, 2024
September 30, 2025
Redemption Term/Notice(1)
Commercial mortgage loans
$
547,663
$
566,142
$
190,366
Fully redeemable and non-redeemable with varying terms.
Opportunistic and private credit
216,659
202,008
204,013
Fully redeemable and non-redeemable with varying terms.
Infrastructure
188,605
179,627
21,662
Fully redeemable and non-redeemable with varying terms.
Other
84,520
38,989
54,793
Non-redeemable with varying terms
Total investment funds
$
1,037,447
$
986,766
$
470,834
(1)Non-redeemable funds generally have an expected life of 7 to 12 years from fund closing with extension options of 1 to 4 years. Redemptions are paid out throughout the life of the funds at the General Partner's discretion. Redeemable funds can generally be redeemed over 6 to 36 months upon request from limited partners.
(2) Unfunded commitments include unfunded balances during the investment period. After an investment period ends, the fund can call capital based on limited and specified reasons. As of September 30, 2025, unfunded commitments totaled $628 million, including funds past the investment period.
The Company had $127 million of capital called during the period from existing investment funds. The Company's unfunded commitments were $471 million as of September 30, 2025.
Notes to Condensed Consolidated Financial Statements
(Dollar amounts in thousands, except per share data)
Note 5—Commitments and Contingencies
Guarantees: At September 30, 2025, The Company has one performance guarantee in effect. Per the Pre-capitalized Trust Securities agreement signed on July 1, 2025, Globe Life Inc. is required to purchase any treasury securities in default. Management believes it is unlikely the Company will have to make any material payments under this agreement due to default.
Letters of credit—The Parent Company has guaranteed letters of credit with a group of banks in connection with its credit facility. The letters of credit were issued by TMK Re, Ltd., a wholly-owned subsidiary, to secure TMK Re, Ltd.’s obligation for claims on certain policies reinsured by TMK Re, Ltd. that were sold by other Globe Life insurance subsidiaries. These letters of credit facilitate TMK Re, Ltd.’s ability to reinsure the business of Globe Life's insurance carriers. The credit facility was amended on March 29, 2024 and now expires in 2029. The maximum amount of letters of credit available is $250 million. The Parent Company would be liable to the extent that TMK Re, Ltd. does not pay the reinsured party. The amount of letters of credit outstanding at September 30, 2025 was $115 million.
Litigation: Globe Life Inc. and its subsidiaries, in common with the insurance industry in general, are subject to litigation, including: putative class action litigation; alleged breaches of contract; torts, including bad faith and fraud claims based on alleged wrongful or fraudulent acts of agents of Globe Life Inc.'s insurance subsidiaries; alleged employment discrimination; alleged worker misclassification; and miscellaneous other causes of action. Based upon information presently available, and in light of legal and other factual defenses available to Globe Life Inc. and its subsidiaries, management does not believe that it is reasonably possible that such litigation will have a material adverse effect on Globe Life Inc.'s financial condition, future operating results or liquidity; however, assessing the eventual outcome of litigation necessarily involves forward-looking speculation as to judgments to be made by judges, juries and appellate courts in the future. This bespeaks caution, particularly in states with reputations for high punitive damage verdicts.
On April 30, 2024, a putative securities class action was filed against Globe Life Inc. and six of its current/former executives and directors in the United States District Court for the Eastern District of Texas (City of Miami Gen. Emp. & Sanitation Emp. Ret. Trust, et al. v. Globe Life Inc., et al., Case No. 4:24-cv-00376). On July 24, 2024, the Court appointed Lead Plaintiffs and Lead Counsel for the putative class of shareholders. The Lead Plaintiffs filed a Consolidated Complaint on October 4, 2024 that asserts claims under §§ 10(b), 20(a), and 20(A) of the Securities Exchange Act of 1934 and SEC Rules 10b-5(a), 10b-5(b), and 10b-5(c) promulgated thereunder, on behalf of a putative class of purchasers of Globe Life Inc.'s securities from May 8, 2019 through April 10, 2024. The Consolidated Complaint adds four additional executives as defendants and alleges that certain of Globe Life Inc.'s disclosures about financial performance and certain other public statements during the putative class period were materially false or misleading. Pursuant to Globe Life Inc.'s Restated Certificate of Incorporation and indemnification agreements with the individual defendants, Globe Life Inc. has agreed to indemnify the defendants for all expenses and losses related to the litigation, subject to the terms of those indemnification agreements. Defendants filed a motion to dismiss the litigation on December 3, 2024, which motion was denied on September 29, 2025. Globe Life Inc. plans to vigorously defend against the lawsuit. The outcome of litigation of this type is inherently uncertain, and there is always the possibility that a Court rules in a manner that is adverse to the interests of Globe Life Inc. and the individual defendants. However, the amount of any such loss in that outcome cannot be reasonably estimated at this time.
Also pending in the Eastern District of Texas is a consolidated shareholder derivative suit that is closely related to the putative securities class action disclosed above (the “City of Miami Matter”). On November 7, 2024, Globe Life Inc. shareholder Jui Cheng Hsiao filed a shareholder derivative complaint against Globe Life Inc. as a nominal defendant, as well as certain current and former Globe Life Inc. executives and members of its Board of Directors. Pursuant to Globe Life Inc.'s Restated Certificate of Incorporation and indemnification agreements with the individual defendants, Globe Life Inc. has agreed to indemnify them for all expenses and losses related to the litigation, subject to the terms of those indemnification agreements. On November 14, 2024, Globe Life Inc. shareholder Gautam Jadhav filed a shareholder derivative complaint against the same set of defendants.
Notes to Condensed Consolidated Financial Statements
(Dollar amounts in thousands, except per share data)
Each shareholder derivative complaint asserts one claim for breach of fiduciary duty against the individual defendants and alleges that the individual defendants breached their fiduciary duties to Globe Life Inc. by causing or permitting Globe Life Inc. to make misleading statements about its performance and financial results. The allegations are substantially similar to the allegations made in the City of Miami Matter and derive from a short seller report. On November 25, 2024, the two shareholder plaintiffs moved to consolidate the two actions into one action and the Court granted the motion on January 3, 2025 (In re Globe Life Inc. Stockholder Derivative Litigation, Lead Case No. 4:24-cv-00993-ALM (E.D. Tex.)). The case is before the same Court as the City of Miami Matter. On January 16, 2025, the parties filed a joint motion to stay such proceedings pending the Court’s resolution of the motion to dismiss filed by Globe Life Inc. in the City of Miami Matter. The Court granted such joint motion to stay the proceedings on January 25, 2025.
On September 19, 2025, an additional shareholder filed a separate derivative lawsuit in the Business Court for Dallas County, Texas, against Globe Life Inc. as a nominal defendant, as well as certain current and former Globe Life Inc. executives and members of its Board of Directors (James E. Walker v. Gary L. Coleman, et al., Case No. 25-BC01B-0041). Pursuant to Globe Life Inc.'s Restated Certificate of Incorporation and indemnification agreements with the individual defendants, Globe Life Inc. has agreed to indemnify them for all expenses and losses related to the litigation, subject to the terms of those indemnification agreements. Like the consolidated shareholder derivative lawsuit disclosed above, this litigation is largely similar to the City of Miami Matter and derives in part from a short seller report. The petition asserts three causes of action relating to the 2019 through 2024 time period, including: (i) a breach of fiduciary duty claim for failing to provide adequate oversight to prevent purportedly widespread corporate misconduct including fraud, discrimination and harassment; (ii) a breach of fiduciary duty claim against certain individual defendants who allegedly engaged in insider trading; and (iii) a claim for wasting corporate assets by paying excessive compensation and/or bonuses to certain of its executive officers. The petition alleges that Globe Life Inc. was thus exposed to potential legal liability and costs, and that Globe Life Inc. repurchased shares at an artificially inflated price. The petition seeks monetary damages as well as restitution, governance reforms, and accountability for executives and board members. Globe Life Inc. intends to mount a robust defense against the litigation.
On September 26, 2024, Globe Life Inc. and its subsidiary, American Income Life Insurance Company, were notified by the Equal Employment Opportunity Commission (EEOC) that the EEOC conducted an investigation of charges filed against Globe Life Inc. and/or American Income Life Insurance Company by five former sales agents and one then-current sales agent. The EEOC asserts that there is reasonable cause to believe the six complainants were employees, not independent contractors, of Globe Life Inc. and/or American Income Life Insurance Company and were discriminated against on the basis of sex, and that one complainant was also discriminated against on the basis of race. In addition, the EEOC asserts that there is reasonable cause to believe that a class of female workers were employees, not independent contractors, and were subject to unlawful conduct which also constitutes a pattern-or-practice of discrimination. The EEOC’s investigative findings are not binding on Globe Life Inc. The EEOC’s procedures provide for a conciliation process that has concluded without achieving a resolution. The EEOC may elect to file a lawsuit in federal court on behalf of the workers based on the alleged statutory violations. The EEOC has not filed any legal proceedings at this time. In the event the EEOC elects to pursue any claims in court, Globe Life Inc. intends to defend against any such lawsuit vigorously. The outcome of litigation of this type would be inherently uncertain and cannot be reasonably estimated or determined at this time. There is always the possibility that a Court rules in a manner that is adverse to the interests of Globe Life Inc.
Notes to Condensed Consolidated Financial Statements
(Dollar amounts in thousands, except per share data)
Note 6—Policy Liabilities
The liability for future policy benefits is determined based on the net level premium method, which requires the liability be calculated as the present value of estimated future policyholder benefits and the related termination expenses, less the present value of estimated future net premiums to be collected from policyholders.
The following tables summarize balances and changes in the net liability for future policy benefits, before reinsurance, for traditional life long-duration contracts for the three and nine month periods ended September 30, 2025 and 2024:
Life
Present value of expected future net premiums
American Income
DTC
Liberty National
Other
Total
Balance at January 1, 2024
$
4,681,888
$
6,052,651
$
1,129,716
$
478,052
$
12,342,307
Beginning balance at original discount rates
4,523,329
5,664,259
1,077,831
443,949
11,709,368
Effect of changes in assumptions on future cash flows
(82,348)
(28,366)
(29,292)
(982)
(140,988)
Effect of actual variances from expected experience
(173,180)
(226,062)
(29,381)
(9,292)
(437,915)
Adjusted balance at January 1, 2024
4,267,801
5,409,831
1,019,158
433,675
11,130,465
Issuances(1)
616,527
398,034
90,517
18,126
1,123,204
Interest accrual(2)
164,917
220,485
41,610
17,213
444,225
Net premiums collected(3)
(412,717)
(455,625)
(101,687)
(33,960)
(1,003,989)
Effect of changes in the foreign exchange rate
(4,101)
—
—
—
(4,101)
Ending balance at original discount rates
4,632,427
5,572,725
1,049,598
435,054
11,689,804
Effect of change from original to current discount rates
204,567
421,888
54,498
35,513
716,466
Balance at September 30, 2024
$
4,836,994
$
5,994,613
$
1,104,096
$
470,567
$
12,406,270
Balance at January 1, 2025
$
4,645,917
$
5,622,906
$
1,048,447
$
440,047
$
11,757,317
Beginning balance at original discount rates
4,656,710
5,504,912
1,047,020
430,276
11,638,918
Effect of changes in assumptions on future cash flows
(136,473)
(89,711)
(52,204)
(5,160)
(283,548)
Effect of actual variances from expected experience
(166,114)
(203,565)
(24,106)
(14,207)
(407,992)
Adjusted balance at January 1, 2025
4,354,123
5,211,636
970,710
410,909
10,947,378
Issuances(1)
554,627
384,426
81,718
18,588
1,039,359
Interest accrual(2)
169,466
215,586
40,194
16,683
441,929
Net premiums collected(3)
(421,703)
(440,708)
(99,565)
(32,654)
(994,630)
Effect of changes in the foreign exchange rate
10,349
—
—
—
10,349
Ending balance at original discount rates
4,666,862
5,370,940
993,057
413,526
11,444,385
Effect of change from original to current discount rates
106,621
259,166
26,011
19,941
411,739
Balance at September 30, 2025
$
4,773,483
$
5,630,106
$
1,019,068
$
433,467
$
11,856,124
(1)Issuances represent the present value, using the original discount rate, of the expected net premiums related to new policies issued during each respective period.
(2)The interest accrual is the interest earned on the beginning present value of the expected net premiums, as well as the interest on actual net premiums earned during the period, using the original interest rate.
(3)Net premiums collected represent the product of the current period net premium ratio and the gross premiums collected during the period on the in force business.
Notes to Condensed Consolidated Financial Statements
(Dollar amounts in thousands, except per share data)
Life
Present value of expected future net premiums
American Income
DTC
Liberty National
Other
Total
Balance at July 1, 2024
$
4,635,903
$
5,810,518
$
1,085,233
$
449,883
$
11,981,537
Beginning balance at original discount rates
4,648,111
5,670,288
1,080,642
437,551
11,836,592
Effect of changes in assumptions on future cash flows
(82,348)
(28,366)
(29,292)
(982)
(140,988)
Effect of actual variances from expected experience
(59,483)
(103,089)
(12,113)
(1,970)
(176,655)
Adjusted balance at July 1, 2024
4,506,280
5,538,833
1,039,237
434,599
11,518,949
Issuances(1)
203,828
110,993
30,298
5,969
351,088
Interest accrual(2)
55,750
73,134
13,836
5,709
148,429
Net premiums collected(3)
(138,552)
(150,235)
(33,773)
(11,223)
(333,783)
Effect of changes in the foreign exchange rate
5,121
—
—
—
5,121
Ending balance at original discount rates
4,632,427
5,572,725
1,049,598
435,054
11,689,804
Effect of change from original to current discount rates
204,567
421,888
54,498
35,513
716,466
Balance at September 30, 2024
$
4,836,994
$
5,994,613
$
1,104,096
$
470,567
$
12,406,270
Balance at July 1, 2025
$
4,818,081
$
5,682,370
$
1,063,162
$
436,784
$
12,000,397
Beginning balance at original discount rates
4,771,460
5,498,605
1,047,994
422,810
11,740,869
Effect of changes in assumptions on future cash flows
(136,473)
(89,711)
(52,204)
(5,160)
(283,548)
Effect of actual variances from expected experience
(53,404)
(90,898)
(10,330)
(5,320)
(159,952)
Adjusted balance at July 1, 2025
4,581,583
5,317,996
985,460
412,330
11,297,369
Issuances(1)
174,415
127,328
27,325
6,475
335,543
Interest accrual(2)
55,825
71,053
13,138
5,472
145,488
Net premiums collected(3)
(140,680)
(145,437)
(32,866)
(10,751)
(329,734)
Effect of changes in the foreign exchange rate
(4,281)
—
—
—
(4,281)
Ending balance at original discount rates
4,666,862
5,370,940
993,057
413,526
11,444,385
Effect of change from original to current discount rates
106,621
259,166
26,011
19,941
411,739
Balance at September 30, 2025
$
4,773,483
$
5,630,106
$
1,019,068
$
433,467
$
11,856,124
(1)Issuances represent the present value, using the original discount rate, of the expected net premiums related to new policies issued during each respective period.
(2)The interest accrual is the interest earned on the beginning present value of the expected net premiums, as well as the interest on actual net premiums earned during the period, using the original interest rate.
(3)Net premiums collected represent the product of the current period net premium ratio and the gross premiums collected during the period on the in force business.
Notes to Condensed Consolidated Financial Statements
(Dollar amounts in thousands, except per share data)
Life
Present value of expected future policy benefits
American Income
DTC
Liberty National
Other
Total
Balance at January 1, 2024
$
10,163,627
$
9,714,516
$
3,605,392
$
4,239,623
$
27,723,158
Beginning balance at original discount rates
9,061,833
8,656,752
3,338,252
3,506,859
24,563,696
Effect of changes in assumptions on future cash flows
(104,498)
(50,106)
(41,836)
(2,027)
(198,467)
Effect of actual variances from expected experience
(187,711)
(241,231)
(34,722)
(12,841)
(476,505)
Adjusted balance at January 1, 2024
8,769,624
8,365,415
3,261,694
3,491,991
23,888,724
Issuances(1)
611,802
398,032
90,518
18,127
1,118,479
Interest accrual(2)
367,403
355,850
134,020
157,318
1,014,591
Benefit payments(3)
(326,318)
(439,992)
(159,219)
(103,998)
(1,029,527)
Effect of changes in the foreign exchange rate
(8,768)
—
—
—
(8,768)
Ending balance at original discount rates
9,413,743
8,679,305
3,327,013
3,563,438
24,983,499
Effect of change from original to current discount rates
1,091,042
1,082,717
275,358
717,751
3,166,868
Balance at September 30, 2024
$
10,504,785
$
9,762,022
$
3,602,371
$
4,281,189
$
28,150,367
Balance at January 1, 2025
$
9,870,692
$
9,125,112
$
3,377,517
$
3,960,963
$
26,334,284
Beginning balance at original discount rates
9,508,588
8,660,948
3,340,219
3,582,068
25,091,823
Effect of changes in assumptions on future cash flows
(189,172)
(129,189)
(89,154)
(9,081)
(416,596)
Effect of actual variances from expected experience
(184,713)
(223,416)
(32,071)
(21,159)
(461,359)
Adjusted balance at January 1, 2025
9,134,703
8,308,343
3,218,994
3,551,828
24,213,868
Issuances(1)
554,627
384,425
81,716
18,588
1,039,356
Interest accrual(2)
385,316
358,173
133,963
160,848
1,038,300
Benefit payments(3)
(340,667)
(428,849)
(153,840)
(105,916)
(1,029,272)
Effect of changes in the foreign exchange rate
24,400
—
—
—
24,400
Ending balance at original discount rates
9,758,379
8,622,092
3,280,833
3,625,348
25,286,652
Effect of change from original to current discount rates
607,423
695,305
121,891
479,664
1,904,283
Balance at September 30, 2025
$
10,365,802
$
9,317,397
$
3,402,724
$
4,105,012
$
27,190,935
(1)Issuances represent the present value, using the original discount rate, of the expected future policy benefits related to new policies issued during each respective period.
(2)The interest accrual is the interest earned on the beginning present value of the expected future policy benefits, as well as the interest on actual benefits and expenses paid during the period, using the original interest rate.
(3)Benefit payments represent the release of the present value, using the original discount rate, of the actual future policy benefits incurred during the period due to death, surrender, and maturity benefit payments based on the revised expected assumptions.
Notes to Condensed Consolidated Financial Statements
(Dollar amounts in thousands, except per share data)
Life
Present value of expected future policy benefits
American Income
DTC
Liberty National
Other
Total
Balance at July 1, 2024
$
9,811,407
$
9,289,834
$
3,424,768
$
3,981,898
$
26,507,907
Beginning balance at original discount rates
9,353,526
8,748,900
3,356,531
3,545,323
25,004,280
Effect of changes in assumptions on future cash flows
(104,498)
(50,106)
(41,836)
(2,027)
(198,467)
Effect of actual variances from expected experience
(65,766)
(111,255)
(15,385)
(2,629)
(195,035)
Adjusted balance at July 1, 2024
9,183,262
8,587,539
3,299,310
3,540,667
24,610,778
Issuances(1)
199,097
110,991
30,298
5,970
346,356
Interest accrual(2)
124,308
118,873
44,743
52,747
340,671
Benefit payments(3)
(105,757)
(138,098)
(47,338)
(35,946)
(327,139)
Effect of changes in the foreign exchange rate
12,833
—
—
—
12,833
Ending balance at original discount rates
9,413,743
8,679,305
3,327,013
3,563,438
24,983,499
Effect of change from original to current discount rates
1,091,042
1,082,717
275,358
717,751
3,166,868
Balance at September 30, 2024
$
10,504,785
$
9,762,022
$
3,602,371
$
4,281,189
$
28,150,367
Balance at July 1, 2025
$
10,234,154
$
9,278,145
$
3,421,818
$
4,008,385
$
26,942,502
Beginning balance at original discount rates
9,829,535
8,742,750
3,358,803
3,617,306
25,548,394
Effect of changes in assumptions on future cash flows
(189,172)
(129,189)
(89,154)
(9,081)
(416,596)
Effect of actual variances from expected experience
(60,805)
(100,922)
(14,354)
(8,215)
(184,296)
Adjusted balance at July 1, 2025
9,579,558
8,512,639
3,255,295
3,600,010
24,947,502
Issuances(1)
174,414
127,326
27,324
6,475
335,539
Interest accrual(2)
128,559
119,076
44,398
53,827
345,860
Benefit payments(3)
(113,819)
(136,949)
(46,184)
(34,964)
(331,916)
Effect of changes in the foreign exchange rate
(10,333)
—
—
—
(10,333)
Ending balance at original discount rates
9,758,379
8,622,092
3,280,833
3,625,348
25,286,652
Effect of change from original to current discount rates
607,423
695,305
121,891
479,664
1,904,283
Balance at September 30, 2025
$
10,365,802
$
9,317,397
$
3,402,724
$
4,105,012
$
27,190,935
(1)Issuances represent the present value, using the original discount rate, of the expected future policy benefits related to new policies issued during each respective period.
(2)The interest accrual is the interest earned on the beginning present value of the expected future policy benefits, as well as the interest on actual benefits and expenses paid during the period, using the original interest rate.
(3)Benefit payments represent the release of the present value, using the original discount rate, of the actual future policy benefits incurred during the period due to death, surrender, and maturity benefit payments based on the expected assumptions.
Notes to Condensed Consolidated Financial Statements
(Dollar amounts in thousands, except per share data)
Life
Net liability for future policy benefits as of September 30, 2024
American Income
DTC
Liberty National
Other
Total
Net liability for future policy benefits at original discount rates
$
4,781,316
$
3,106,580
$
2,277,415
$
3,128,384
$
13,293,695
Effect of changes in discount rate assumptions
886,475
660,829
220,860
682,238
2,450,402
Other adjustments(1)
150
—
—
37
187
Net liability for future policy benefits, after other adjustments, at current discount rates
5,667,941
3,767,409
2,498,275
3,810,659
15,744,284
Reinsurance recoverable
(170)
—
(7,885)
(38,506)
(46,561)
Net liability for future policy benefits, after reinsurance recoverable, at current discount rates
$
5,667,771
$
3,767,409
$
2,490,390
$
3,772,153
$
15,697,723
(1)Other adjustments include the effects of capping and flooring the liability (guidance requires an amount not less than zero at the calculation level of the liability for future policy benefits).
Life
Net liability for future policy benefits as of September 30, 2025
American Income
DTC
Liberty National
Other
Total
Net liability for future policy benefits at original discount rates
$
5,091,517
$
3,251,152
$
2,287,776
$
3,211,822
$
13,842,267
Effect of changes in discount rate assumptions
500,802
436,139
95,880
459,723
1,492,544
Other adjustments(1)
146
—
—
30
176
Net liability for future policy benefits, after other adjustments, at current discount rates
5,592,465
3,687,291
2,383,656
3,671,575
15,334,987
Reinsurance recoverable
(176)
—
(8,049)
(14)
(8,239)
Net liability for future policy benefits, after reinsurance recoverable, at current discount rates
$
5,592,289
$
3,687,291
$
2,375,607
$
3,671,561
$
15,326,748
(1)Other adjustments include the effects of flooring the liability (guidance requires an amount not less than zero at the calculation level of the liability for future policy benefits).
Notes to Condensed Consolidated Financial Statements
(Dollar amounts in thousands, except per share data)
The following tables summarize balances and changes in the net liability for future policy benefits for long-duration health contracts for the three and nine month periods ended September 30, 2025 and 2024:
Health
Present value of expected future net premiums
United American
Family Heritage
Liberty National
American Income
DTC
Total
Balance at January 1, 2024
$
3,697,771
$
1,711,741
$
358,472
$
206,381
$
115,363
$
6,089,728
Beginning balance at original discount rates
3,625,803
1,783,173
348,570
201,869
109,880
6,069,295
Effect of changes in assumptions on future cash flows
9,892
(8,117)
(3,463)
12,207
4,449
14,968
Effect of actual variances from expected experience
(18,894)
(43,359)
(26,123)
(11,168)
(1,818)
(101,362)
Adjusted balance at January 1, 2024
3,616,801
1,731,697
318,984
202,908
112,511
5,982,901
Issuances(1)
287,072
200,220
43,367
34,121
12,325
577,105
Interest accrual(2)
128,533
55,733
12,450
7,135
4,221
208,072
Net premiums collected(3)
(220,380)
(141,735)
(39,223)
(18,171)
(8,338)
(427,847)
Effect of changes in the foreign exchange rate
—
—
—
(377)
—
(377)
Ending balance at original discount rates
3,812,026
1,845,915
335,578
225,616
120,719
6,339,854
Effect of change from original to current discount rates
130,218
(44,372)
11,529
8,173
7,153
112,701
Balance at September 30, 2024
$
3,942,244
$
1,801,543
$
347,107
$
233,789
$
127,872
$
6,452,555
Balance at January 1, 2025
$
3,885,530
$
1,734,875
$
337,119
$
223,247
$
133,377
$
6,314,148
Beginning balance at original discount rates
3,948,856
1,867,873
338,275
225,141
131,919
6,512,064
Effect of changes in assumptions on future cash flows
625,460
(72,130)
29
12,588
25,985
591,932
Effect of actual variances from expected experience
22,236
(40,873)
(20,200)
(13,357)
618
(51,576)
Adjusted balance at January 1, 2025
4,596,552
1,754,870
318,104
224,372
158,522
7,052,420
Issuances(1)
378,649
210,220
41,777
30,425
18,983
680,054
Interest accrual(2)
148,586
59,364
11,959
8,071
5,307
233,287
Net premiums collected(3)
(249,382)
(151,585)
(40,275)
(20,362)
(10,442)
(472,046)
Effect of changes in the foreign exchange rate
—
—
—
991
—
991
Ending balance at original discount rates
4,874,405
1,872,869
331,565
243,497
172,370
7,494,706
Effect of change from original to current discount rates
72,577
(66,388)
6,332
4,731
6,388
23,640
Balance at September 30, 2025
$
4,946,982
$
1,806,481
$
337,897
$
248,228
$
178,758
$
7,518,346
(1)Issuances represent the present value, using the original discount rate, of the expected net premiums related to new policies issued during each respective period.
(2)The interest accrual is the interest earned on the beginning present value of the expected net premiums, as well as the interest on actual net premiums earned during the period, using the original interest rate.
(3)Net premiums collected represent the product of the current period net premium ratio and the gross premiums collected during the period on the in force business.
Notes to Condensed Consolidated Financial Statements
(Dollar amounts in thousands, except per share data)
Health
Present value of expected future net premiums
United American
Family Heritage
Liberty National
American Income
DTC
Total
Balance at July 1, 2024
$
3,658,491
$
1,690,797
$
337,741
$
205,889
$
114,876
$
6,007,794
Beginning balance at original discount rates
3,720,108
1,823,728
338,934
208,867
113,247
6,204,884
Effect of changes in assumptions on future cash flows
9,892
(8,117)
(3,463)
12,207
4,449
14,968
Effect of actual variances from expected experience
18,179
(12,068)
(4,959)
(4,110)
644
(2,314)
Adjusted balance at July 1, 2024
3,748,179
1,803,543
330,512
216,964
118,340
6,217,538
Issuances(1)
95,279
71,345
14,352
11,997
3,823
196,796
Interest accrual(2)
43,903
19,016
4,104
2,493
1,460
70,976
Net premiums collected(3)
(75,335)
(47,989)
(13,390)
(6,300)
(2,904)
(145,918)
Effect of changes in the foreign exchange rate
—
—
—
462
—
462
Ending balance at original discount rates
3,812,026
1,845,915
335,578
225,616
120,719
6,339,854
Effect of change from original to current discount rates
130,218
(44,372)
11,529
8,173
7,153
112,701
Balance at September 30, 2024
$
3,942,244
$
1,801,543
$
347,107
$
233,789
$
127,872
$
6,452,555
Balance at July 1, 2025
$
4,112,123
$
1,810,846
$
331,851
$
229,830
$
143,068
$
6,627,718
Beginning balance at original discount rates
4,106,142
1,915,617
329,179
229,169
139,486
6,719,593
Effect of changes in assumptions on future cash flows
625,460
(72,130)
29
12,588
25,985
591,932
Effect of actual variances from expected experience
25,322
(13,649)
(2,893)
(3,613)
917
6,084
Adjusted balance at July 1, 2025
4,756,924
1,829,838
326,315
238,144
166,388
7,317,609
Issuances(1)
149,755
74,742
14,888
9,774
7,549
256,708
Interest accrual(2)
53,507
19,669
3,907
2,766
1,904
81,753
Net premiums collected(3)
(85,781)
(51,380)
(13,545)
(6,904)
(3,471)
(161,081)
Effect of changes in the foreign exchange rate
—
—
—
(283)
—
(283)
Ending balance at original discount rates
4,874,405
1,872,869
331,565
243,497
172,370
7,494,706
Effect of change from original to current discount rates
72,577
(66,388)
6,332
4,731
6,388
23,640
Balance at September 30, 2025
$
4,946,982
$
1,806,481
$
337,897
$
248,228
$
178,758
$
7,518,346
(1)Issuances represent the present value, using the original discount rate, of the expected net premiums related to new policies issued during each respective period.
(2)The interest accrual is the interest earned on the beginning present value of the expected net premiums, as well as the interest on actual net premiums earned during the period, using the original interest rate.
(3)Net premiums collected represent the product of the current period net premium ratio and the gross premiums collected during the period on the in force business.
Notes to Condensed Consolidated Financial Statements
(Dollar amounts in thousands, except per share data)
Health
Present value of expected future policy benefits
United American
Family Heritage
Liberty National
American Income
DTC
Total
Balance at January 1, 2024
$
3,814,328
$
3,315,880
$
865,808
$
335,504
$
109,482
$
8,441,002
Beginning balance at original discount rates
3,741,530
3,506,689
816,819
315,431
104,501
8,484,970
Effect of changes in assumptions on future cash flows
10,680
(5,054)
(2,775)
20,293
7,733
30,877
Effect of actual variances from expected experience
(15,162)
(48,407)
(26,421)
(12,611)
(1,509)
(104,110)
Adjusted balance at January 1, 2024
3,737,048
3,453,228
787,623
323,113
110,725
8,411,737
Issuances(1)
286,358
200,219
42,780
34,123
12,296
575,776
Interest accrual(2)
133,143
109,479
32,202
12,145
4,220
291,189
Benefit payments(3)
(248,769)
(103,070)
(69,649)
(19,574)
(9,655)
(450,717)
Effect of changes in the foreign exchange rate
—
—
—
(646)
—
(646)
Ending balance at original discount rates
3,907,780
3,659,856
792,956
349,161
117,586
8,827,339
Effect of change from original to current discount rates
131,531
(144,821)
52,819
24,383
6,871
70,783
Balance at September 30, 2024
$
4,039,311
$
3,515,035
$
845,775
$
373,544
$
124,457
$
8,898,122
Balance at January 1, 2025
$
3,960,432
$
3,336,546
$
804,695
$
355,303
$
129,277
$
8,586,253
Beginning balance at original discount rates
4,026,860
3,712,044
791,141
348,711
127,975
9,006,731
Effect of changes in assumptions on future cash flows
622,917
(79,615)
210
16,611
22,160
582,283
Effect of actual variances from expected experience
16,726
(46,994)
(19,140)
(16,697)
672
(65,433)
Adjusted balance at January 1, 2025
4,666,503
3,585,435
772,211
348,625
150,807
9,523,581
Issuances(1)
377,636
210,219
41,259
30,423
18,932
678,469
Interest accrual(2)
151,323
117,696
30,993
13,607
5,307
318,926
Benefit payments(3)
(284,450)
(121,671)
(73,919)
(17,710)
(12,216)
(509,966)
Effect of changes in the foreign exchange rate
—
—
—
1,822
—
1,822
Ending balance at original discount rates
4,911,012
3,791,679
770,544
376,767
162,830
10,012,832
Effect of change from original to current discount rates
66,338
(230,187)
32,570
16,990
5,871
(108,418)
Balance at September 30, 2025
$
4,977,350
$
3,561,492
$
803,114
$
393,757
$
168,701
$
9,904,414
(1)Issuances represent the present value, using the original discount rate, of the expected future policy benefits related to new policies issued during each respective period.
(2)The interest accrual is the interest earned on the beginning present value of the expected future policy benefits, as well as the interest on actual benefits and expenses paid during the period, using the original interest rate.
(3)Benefit payments represent the release of the present value, using the original discount rate, of the actual future policy benefits incurred during the period based on the revised expected assumptions.
Notes to Condensed Consolidated Financial Statements
(Dollar amounts in thousands, except per share data)
Health
Present value of expected future policy benefits
United American
Family Heritage
Liberty National
American Income
DTC
Total
Balance at July 1, 2024
$
3,758,487
$
3,249,466
$
815,778
$
328,436
$
108,617
$
8,260,784
Beginning balance at original discount rates
3,823,510
3,605,315
799,316
322,706
107,143
8,657,990
Effect of changes in assumptions on future cash flows
10,680
(5,054)
(2,775)
20,293
7,733
30,877
Effect of actual variances from expected experience
21,522
(13,407)
(4,998)
(4,432)
817
(498)
Adjusted balance at July 1, 2024
3,855,712
3,586,854
791,543
338,567
115,693
8,688,369
Issuances(1)
95,126
71,345
14,177
11,997
3,811
196,456
Interest accrual(2)
45,365
37,299
10,653
4,189
1,460
98,966
Benefit payments(3)
(88,423)
(35,642)
(23,417)
(6,502)
(3,378)
(157,362)
Effect of changes in the foreign exchange rate
—
—
—
910
—
910
Ending balance at original discount rates
3,907,780
3,659,856
792,956
349,161
117,586
8,827,339
Effect of change from original to current discount rates
131,531
(144,821)
52,819
24,383
6,871
70,783
Balance at September 30, 2024
$
4,039,311
$
3,515,035
$
845,775
$
373,544
$
124,457
$
8,898,122
Balance at July 1, 2025
$
4,154,306
$
3,491,041
$
795,244
$
367,366
$
137,532
$
8,945,489
Beginning balance at original discount rates
4,153,056
3,815,188
772,935
357,412
134,276
9,232,867
Effect of changes in assumptions on future cash flows
622,917
(79,615)
210
16,611
22,160
582,283
Effect of actual variances from expected experience
23,354
(16,123)
(3,885)
(4,492)
796
(350)
Adjusted balance at July 1, 2025
4,799,327
3,719,450
769,260
369,531
157,232
9,814,800
Issuances(1)
149,526
74,742
14,728
9,773
7,540
256,309
Interest accrual(2)
54,254
39,426
10,197
4,656
1,904
110,437
Benefit payments(3)
(92,095)
(41,939)
(23,641)
(6,584)
(3,846)
(168,105)
Effect of changes in the foreign exchange rate
—
—
—
(609)
—
(609)
Ending balance at original discount rates
4,911,012
3,791,679
770,544
376,767
162,830
10,012,832
Effect of change from original to current discount rates
66,338
(230,187)
32,570
16,990
5,871
(108,418)
Balance at September 30, 2025
$
4,977,350
$
3,561,492
$
803,114
$
393,757
$
168,701
$
9,904,414
(1)Issuances represent the present value, using the original discount rate, of the expected future policy benefits related to new policies issued during each respective period.
(2)The interest accrual is the interest earned on the beginning present value of the expected future policy benefits, as well as the interest on actual benefits and expenses paid during the period, using the original interest rate.
(3)Benefit payments represent the release of the present value, using the original discount rate, of the actual future policy benefits incurred during the period based on the expected assumptions.
Notes to Condensed Consolidated Financial Statements
(Dollar amounts in thousands, except per share data)
Health
Net liability for future policy benefits as of September 30, 2024
United American
Family Heritage
Liberty National
American Income
Direct to Consumer
Total
Net liability for future policy benefits at original discount rates
$
95,754
$
1,813,941
$
457,378
$
123,545
$
(3,133)
$
2,487,485
Effect of changes in discount rate assumptions
1,313
(100,449)
41,290
16,210
(282)
(41,918)
Other adjustments(1)
17,014
38
9,964
926
4,326
32,268
Net liability for future policy benefits, after other adjustments, at current discount rates
114,081
1,713,530
508,632
140,681
911
2,477,835
Reinsurance recoverable
(2,868)
(11,613)
(1,096)
—
—
(15,577)
Net liability for future policy benefits, after reinsurance recoverable, at current discount rates
$
111,213
$
1,701,917
$
507,536
$
140,681
$
911
$
2,462,258
(1)Other adjustments include the effects of capping and flooring the liability (guidance requires an amount not less than zero at the calculation level of the liability for future policy benefits).
Health
Net liability for future policy benefits as of September 30, 2025
United American
Family Heritage
Liberty National
American Income
Direct to Consumer
Total
Net liability for future policy benefits at original discount rates
36,607
1,918,810
438,979
133,270
(9,540)
2,518,126
Effect of changes in discount rate assumptions
(6,239)
(163,799)
26,238
12,259
(517)
(132,058)
Other adjustments(1)
53,954
44
12,362
848
10,753
77,961
Net liability for future policy benefits, after other adjustments, at current discount rates
84,322
1,755,055
477,579
146,377
696
2,464,029
Reinsurance recoverable
(2,288)
—
(711)
—
—
(2,999)
Net liability for future policy benefits, after reinsurance recoverable, at current discount rates
$
82,034
$
1,755,055
$
476,868
$
146,377
$
696
$
2,461,030
(1)Other adjustments include the effects of flooring the liability (guidance requires an amount not less than zero at the calculation level of the liability for future policy benefits).
Remeasurement Gain or Loss—In accordance with the accounting guidance, the Company reviews, and updates as necessary, its assumptions utilized in the calculation of the liability for future benefits annually in the third quarter and recalculates the net premium ratio. The revised net premium ratio is used to update the liability for future policy benefits as of the beginning of the current reporting period, and is compared to the liability using the prior cash flow assumptions. The difference is recorded as a component of the remeasurement gain or loss for the current period, along with the effect of the difference between actual and expected experience for the period. The total remeasurement gain or loss is within life and heath policyholder benefits included in the Condensed Consolidated Statements of Operations.
Notes to Condensed Consolidated Financial Statements
(Dollar amounts in thousands, except per share data)
The following tables include the total remeasurement gain or loss, bifurcated between the gain or loss due to differences between actual and expected experience and the amount due to assumption updates, for the three and nine month periods ended September 30, 2025 and 2024:
Three Months Ended September 30,
Nine Months Ended September 30,
2025
2024
2025
2024
Life Remeasurement Gain (Loss)—Experience:
American Income
$
6,322
$
4,771
$
17,173
$
12,619
Direct to Consumer
8,200
6,913
17,789
13,640
Liberty National
1,854
1,537
3,468
2,187
Other
2,173
508
5,389
2,533
Total Life Remeasurement Gain (Loss)—Experience
18,549
13,729
43,819
30,979
Life Remeasurement Gain (Loss)—Assumption Updates:
American Income
52,731
21,974
52,731
21,974
Direct to Consumer
39,480
21,744
39,480
21,744
Liberty National
35,068
12,224
35,068
12,224
Other
3,647
904
3,647
904
Total Life Remeasurement Gain (Loss)—Assumption Updates
130,926
56,846
130,926
56,846
Total Life Remeasurement Gain (Loss)
149,475
70,575
174,745
87,825
Health Remeasurement Gain (Loss)—Experience:
United American
1,073
(2,100)
(809)
(1,423)
Family Heritage
2,252
1,420
5,728
4,972
Liberty National
1,171
874
1,533
2,015
American Income
962
729
3,300
1,769
Direct to Consumer
25
28
53
74
Total Health Remeasurement Gain (Loss)—Experience
5,483
951
9,805
7,407
Health Remeasurement Gain (Loss)—Assumption Updates:
United American
279
1,205
279
1,205
Family Heritage
7,492
(3,063)
7,492
(3,063)
Liberty National
(339)
(234)
(339)
(234)
American Income
(4,094)
(8,036)
(4,094)
(8,036)
Direct to Consumer
19
(373)
19
(373)
Health Remeasurement Gain (Loss)—Assumption Updates
3,357
(10,501)
3,357
(10,501)
Total Health Remeasurement Gain (Loss)
$
8,840
$
(9,550)
$
13,162
$
(3,094)
The Company performed its annual review of assumptions during the third quarter. The assumption review process of the life and health segments resulted in a $134.3 million net remeasurement gain ($130.9 million and $3.4 million gains related to life and health, respectively) before tax as compared to a $46.3 million net remeasurement gain ($56.8 million gain and $10.5 million loss related to life and health, respectively) before tax in the year-ago quarter. This review process resulted in favorable changes to its mortality and lapse assumptions on life and health. Life assumption changes reflect continued favorable mortality experience along with slightly higher lapse rates which resulted in lower life policy obligations compared to our previous assumptions anticipated. Health assumption changes reflect slightly higher lapse rates and benefit enhancements implemented last year.
Excluding the impact of assumption changes, the Company's results for actual variances from expected experience for both life and health produced a $24.0 million net remeasurement gain ($18.5 million and $5.5 million gains related to life and health, respectively) before tax and a $14.7 million net remeasurement gain ($13.7 million and $1.0 million gains related to life and health, respectively) before tax for the three months ended September 30, 2025 and 2024, respectively. For the nine months ended September 30, 2025 and 2024, the Company's results for actual variances from expected experience for both life and health produced a $53.6 million net remeasurement gain before tax and a $38.4 million net remeasurement gain before tax, respectively.
Notes to Condensed Consolidated Financial Statements
(Dollar amounts in thousands, except per share data)
The following table reconciles the liability for future policy benefits to the Condensed Consolidated Balance Sheets as of September 30, 2025 and 2024:
At Original Discount Rates
At Current Discount Rates
As of September 30,
As of September 30,
2025
2024
2025
2024
Life(1):
American Income
$
5,091,655
$
4,781,464
$
5,592,465
$
5,667,941
Direct to Consumer
3,251,154
3,106,582
3,687,291
3,767,409
Liberty National
2,287,776
2,277,415
2,383,656
2,498,275
Other
3,211,850
3,128,419
3,671,575
3,810,659
Net liability for future policy benefits—long duration life
13,842,435
13,293,880
15,334,987
15,744,284
Health(1):
United American
84,212
110,384
84,322
114,081
Family Heritage
1,918,844
1,813,971
1,755,055
1,713,530
Liberty National
450,490
466,474
477,579
508,632
American Income
134,125
124,534
146,377
140,681
Direct to Consumer
669
877
696
911
Net liability for future policy benefits—long duration health
2,588,340
2,516,240
2,464,029
2,477,835
Deferred profit liability
184,563
177,108
184,563
177,108
Deferred annuity
595,506
680,849
595,506
680,849
Interest sensitive life
714,012
725,857
714,012
725,857
Other
8,870
8,983
8,868
8,980
Total future policy benefits
$
17,933,726
$
17,402,917
$
19,301,965
$
19,814,913
(1)Balances are presented net of the effects of capping and flooring the liability (guidance requires an amount not less than zero at the calculation level of the liability for future policy benefits).
Notes to Condensed Consolidated Financial Statements
(Dollar amounts in thousands, except per share data)
The following tables provide the weighted-average original and current discount rates for the liability for future policy benefits and the additional insurance liabilities as of September 30, 2025 and 2024:
As of September 30,
2025
2024
Original discount rate
Current discount rate
Original discount rate
Current discount rate
Life
American Income
5.7
%
5.3
%
5.7
%
5.0
%
Direct to Consumer
6.0
%
5.3
%
6.0
%
5.0
%
Liberty National
5.6
%
5.3
%
5.6
%
5.0
%
Other
6.2
%
5.4
%
6.2
%
5.0
%
Health
United American
5.1
%
5.1
%
5.1
%
4.8
%
Family Heritage
4.2
%
5.2
%
4.2
%
4.9
%
Liberty National
5.8
%
5.1
%
5.8
%
4.8
%
American Income
5.8
%
5.1
%
5.8
%
4.8
%
Direct to Consumer
5.1
%
5.1
%
5.1
%
4.8
%
The following table provides the weighted-average durations of the liability for future policy benefits and the additional insurance liabilities as of September 30, 2025 and 2024:
Notes to Condensed Consolidated Financial Statements
(Dollar amounts in thousands, except per share data)
The following tables summarize the amount of gross premiums and interest related to long duration life and health contracts that are recognized in the Condensed Consolidated Statements of Operationsfor the three and nine month periods ended September 30, 2025 and 2024:
Life
Nine Months Ended September 30, 2025
Nine Months Ended September 30, 2024
Gross Premiums
Required Interest
Expense
Gross Premiums
Required Interest
Expense
American Income
$
1,333,578
$
215,850
$
1,264,474
$
202,486
Direct to Consumer
728,565
142,531
734,860
135,249
Liberty National
288,920
93,372
273,746
91,890
Other
150,017
143,689
152,065
138,724
Total
$
2,501,080
$
595,442
$
2,425,145
$
568,349
Life
Three Months Ended September 30, 2025
Three Months Ended September 30, 2024
Gross Premiums
Interest
Expense
Gross Premiums
Interest
Expense
American Income
$
450,840
$
72,734
$
427,543
$
68,558
Direct to Consumer
242,123
48,005
243,625
45,708
Liberty National
97,289
31,148
92,636
30,737
Other
49,909
48,356
50,413
46,573
Total
$
840,161
$
200,243
$
814,217
$
191,576
Health
Nine Months Ended September 30, 2025
Nine Months Ended September 30, 2024
Gross Premiums
Required Interest
Expense
Gross Premiums
Required Interest
Expense
United American
$
364,762
$
2,567
$
325,415
$
4,449
Family Heritage
346,850
58,331
317,065
53,357
Liberty National
142,340
18,954
142,051
19,679
American Income
89,394
5,536
88,017
5,010
Direct to Consumer
12,671
—
11,196
—
Total
$
956,017
$
85,388
$
883,744
$
82,495
Health
Three Months Ended September 30, 2025
Three Months Ended September 30, 2024
Gross Premiums
Interest
Expense
Gross Premiums
Interest
Expense
United American
$
125,340
$
700
$
110,565
$
1,408
Family Heritage
118,640
19,757
107,819
18,150
Liberty National
47,119
6,264
47,099
6,524
American Income
29,851
1,890
29,628
1,696
Direct to Consumer
4,321
—
3,806
—
Total
$
325,271
$
28,611
$
298,917
$
27,778
Gross premiums are included within life and health premium on the Condensed Consolidated Statements of Operations, while the related interest expense is included in life and health policyholder benefits.
Notes to Condensed Consolidated Financial Statements
(Dollar amounts in thousands, except per share data)
The following tables provide the undiscounted and discounted expected future net premiums, expected future gross premiums, and expected future policy benefits, at both original and current discount rates, for life and health contracts as of September 30, 2025 and 2024:
Life
As of September 30, 2025
As of September 30, 2024
Not discounted
At original discount rates
At current discount rates
Not discounted
At original discount rates
At current discount rates
American Income
PV of expected future gross premiums
$
26,374,505
$
14,878,294
$
15,314,060
$
25,300,910
$
14,305,914
$
15,028,140
PV of expected future net premiums
8,272,473
4,666,862
4,773,483
8,185,825
4,632,427
4,836,994
PV of expected future policy benefits
32,774,486
9,758,379
10,365,802
31,554,905
9,413,743
10,504,785
DTC
PV of expected future gross premiums
$
17,362,014
$
9,081,677
$
9,507,072
$
17,506,090
$
9,144,676
$
9,825,694
PV of expected future net premiums
10,211,558
5,370,940
5,630,106
10,614,237
5,572,725
5,994,613
PV of expected future policy benefits
25,655,289
8,622,092
9,317,397
25,907,169
8,679,305
9,762,022
Liberty National
PV of expected future gross premiums
$
4,948,417
$
2,880,523
$
2,914,411
$
4,797,146
$
2,792,129
$
2,886,943
PV of expected future net premiums
1,753,665
993,057
1,019,068
1,855,536
1,049,598
1,104,096
PV of expected future policy benefits
8,975,235
3,280,833
3,402,724
9,028,196
3,327,013
3,602,371
Other
PV of expected future gross premiums
$
3,508,043
$
1,799,893
$
1,942,685
$
3,657,885
$
1,857,769
$
2,063,274
PV of expected future net premiums
847,850
413,526
433,467
894,843
435,054
470,567
PV of expected future policy benefits
12,306,339
3,625,348
4,105,012
12,471,336
3,563,438
4,281,189
Total
PV of expected future gross premiums
$
52,192,979
$
28,640,387
$
29,678,228
$
51,262,031
$
28,100,488
$
29,804,051
PV of expected future net premiums
21,085,546
11,444,385
11,856,124
21,550,441
11,689,804
12,406,270
PV of expected future policy benefits
79,711,349
25,286,652
27,190,935
78,961,606
24,983,499
28,150,367
As of September 30, 2025, for the life segment using current discount rates, the Company anticipates $29.7 billion of expected future gross premiums and $11.9 billion of expected future net premiums. As of September 30, 2024, using current discount rates, the Company anticipated $29.8 billion of expected future gross premiums and $12.4 billion in expected future net premiums. The determination of the liability for future policy benefits on the balance sheet does not include the difference between the expected future gross premiums and the expected future net premiums of $17.8 billion and $17.4 billion, as of September 30, 2025 and 2024, respectively, and rather only includes the expected future net premiums.
Notes to Condensed Consolidated Financial Statements
(Dollar amounts in thousands, except per share data)
Health
As of September 30, 2025
As of September 30, 2024
Not discounted
At original discount rates
At current discount rates
Not discounted
At original discount rates
At current discount rates
United American
PV of expected future gross premiums
$
11,818,419
$
7,092,508
$
7,196,611
$
9,068,701
$
5,556,347
$
5,742,668
PV of expected future net premiums
8,133,104
4,874,405
4,946,982
6,229,763
3,812,026
3,942,244
PV of expected future policy benefits
8,216,151
4,911,012
4,977,350
6,390,307
3,907,780
4,039,311
Family Heritage
PV of expected future gross premiums
$
7,399,117
$
4,325,529
$
4,188,178
$
7,107,124
$
4,155,037
$
4,074,915
PV of expected future net premiums
3,189,479
1,872,869
1,806,481
3,139,624
1,845,915
1,801,543
PV of expected future policy benefits
7,398,497
3,791,679
3,561,492
7,043,880
3,659,856
3,515,035
Liberty National
PV of expected future gross premiums
$
2,007,219
$
1,278,863
$
1,326,836
$
2,037,319
$
1,297,318
$
1,370,521
PV of expected future net premiums
491,892
331,565
337,897
495,616
335,578
347,107
PV of expected future policy benefits
1,350,299
770,544
803,114
1,375,759
792,956
845,775
American Income
PV of expected future gross premiums
$
1,994,296
$
1,055,588
$
1,104,323
$
1,781,677
$
999,161
$
1,063,740
PV of expected future net premiums
458,318
243,497
248,228
400,683
225,616
233,789
PV of expected future policy benefits
813,952
376,767
393,757
710,352
349,161
373,544
Direct to Consumer
PV of expected future gross premiums
$
365,728
$
216,063
$
224,492
$
232,805
$
147,193
$
156,142
PV of expected future net premiums
293,021
172,370
178,758
191,566
120,719
127,872
PV of expected future policy benefits
268,352
162,830
168,701
187,260
117,586
124,457
Total
PV of expected future gross premiums
$
23,584,779
$
13,968,551
$
14,040,440
$
20,227,626
$
12,155,056
$
12,407,986
PV of expected future net premiums
12,565,814
7,494,706
7,518,346
10,457,252
6,339,854
6,452,555
PV of expected future policy benefits
18,047,251
10,012,832
9,904,414
15,707,558
8,827,339
8,898,122
As of September 30, 2025, for the health segment using current discount rates, the Company anticipates $14.0 billion of expected future gross premiums and $7.5 billion of expected future net premiums. As of September 30, 2024, using current discount rates, the Company anticipated $12.4 billion of expected future gross premiums and $6.5 billion in expected future net premiums. The determination of the liability for future policy benefits on the balance sheet does not include the difference between the expected future gross premiums and the expected future net premiums of $6.5 billion and $5.9 billion as of September 30, 2025 and 2024, respectively, and rather only includes the expected future net premiums.
Notes to Condensed Consolidated Financial Statements
(Dollar amounts in thousands, except per share data)
The following tables present the policyholders' account balances by range of guaranteed minimum crediting rates and the related range of difference, if any, in basis points between rates being credited to policyholders and the respective guaranteed minimums as of September 30, 2025 and 2024:
At September 30, 2025
Range of guaranteed minimum crediting rates
Interest Sensitive Life
Deferred Annuity(1)
Other Policyholders' Funds
At guaranteed minimum:
Less than 3.00%
$
—
$
2,181
$
428,558
3.00%-3.99%
29,433
419,069
3,100
4.00%-4.99%
595,212
174,256
55,168
Greater than 5.00%
89,367
—
35,307
Total
714,012
595,506
522,133
1-50 basis points above:
Less than 3.00%
—
—
—
3.00%-3.99%
—
—
—
4.00%-4.99%
—
—
—
Greater than 5.00%
—
—
—
Total
—
—
—
51-150 basis points above:
Less than 3.00%
—
—
—
3.00%-3.99%
—
—
—
4.00%-4.99%
—
—
—
Greater than 5.00%
—
—
—
Total
—
—
—
Grand Total
$
714,012
$
595,506
$
522,133
(1) At September 30, 2025, $411 million has been reinsured with third-party reinsurers under existing reinsurance agreements.
Notes to Condensed Consolidated Financial Statements
(Dollar amounts in thousands, except per share data)
The following table presents a reconciliation of deferred policy acquisition costs to the Condensed Consolidated Balance Sheets as of September 30, 2025 and 2024:
Notes to Condensed Consolidated Financial Statements
(Dollar amounts in thousands, except per share data)
Note 9—Postretirement Benefits
Globe Life has qualified noncontributory defined benefit pension plans (Pension Plans) and contributory savings plans that cover substantially all employees. There is also a nonqualified noncontributory supplemental executive retirement plan (SERP) that covers a limited number of officers. The tables included herein will focus on the Pension Plans and SERP.
Pension Assets:The following table presents the assets of the Company's Pension Plans at September 30, 2025 and December 31, 2024.
Pension Assets by Component at September 30, 2025
Fair Value Determined by:
Quoted Prices in
Active Markets
for Identical
Assets (Level 1)
Significant
Observable
Inputs (Level 2)
Significant Unobservable Inputs (Level 3)
Total
Amount
% of Total
Exchange traded fund(4)
$
54,705
$
—
$
—
$
54,705
8
Equity exchange traded fund(1)
345,494
—
—
345,494
51
U.S. Government and Agency
—
185,818
—
185,818
27
Other bonds
—
3
—
3
—
Guaranteed annuity contract(2)
—
46,245
—
46,245
7
Short-term investments
3,322
—
—
3,322
1
Other
341
—
—
341
—
$
403,862
$
232,066
$
—
635,928
94
Other long-term investments(3)
41,869
6
Total pension assets
$
677,797
100
(1)A fund including marketable securities that mirror the S&P 500 index.
(2)Representing a guaranteed annuity contract issued by Globe Life Inc.'s subsidiary, American Income Life Insurance Company, to fund the obligations of the American Income Life Insurance Company Collective Bargaining Agreement Employees Pension Plan.
(3)Includes non-redeemable investment funds that report the Globe Life Inc. Pension Plan's pro-rata share of the limited partnership's net asset value (NAV) per share, or its equivalent, as a practical expedient for fair value. As of September 30, 2025, the Globe Life Inc. Pension Plan owned less than 1% of two long-term investment funds.
(4)A fund including U.S. dollar-denominated investment-grade securities issued by industrial, utility, and financial companies with maturities greater than 10 years.
Notes to Condensed Consolidated Financial Statements
(Dollar amounts in thousands, except per share data)
Pension Assets by Component at December 31, 2024
Fair Value Determined by:
Quoted Prices in
Active Markets
for Identical
Assets (Level 1)
Significant
Observable
Inputs (Level 2)
Significant
Unobservable
Inputs (Level 3)
Total
Amount
% of Total
Exchange traded fund(4)
$
35,483
$
—
$
—
$
35,483
6
Equity exchange traded fund(1)
322,846
—
—
322,846
53
U.S. Government and Agency
—
179,418
—
179,418
29
Other bonds
—
4
—
4
—
Guaranteed annuity contract(2)
—
43,893
—
43,893
7
Short-term investments
1,235
—
—
1,235
—
Other
1,420
—
—
1,420
—
$
360,984
$
223,315
$
—
584,299
95
Other long-term investments(3)
30,546
5
Total pension assets
$
614,845
100
(1)A fund including marketable securities that mirror the S&P 500 index.
(2)Representing a guaranteed annuity contract issued by Globe Life Inc.'s subsidiary, American Income Life Insurance Company, to fund the obligations of the American Income Life Insurance Company Collective Bargaining Agreement Employees Pension Plan.
(3)Includes non-redeemable investment funds that report the Globe Life Inc. Pension Plan's pro-rata share of the limited partnership's net asset value (NAV) per share, or its equivalent, as a practical expedient for fair value. As of December 31, 2024, the Globe Life Inc. Pension Plan owned less than 1% of two long-term investment funds.
(4)A fund including U.S. dollar-denominated investment-grade securities issued by industrial, utility, and financial companies with maturities greater than 10 years.
SERP: The following tables include premiums paid for COLI at September 30, 2025 and 2024 and investments of the Rabbi Trust at September 30, 2025 and December 31, 2024.
Nine Months Ended September 30,
2025
2024
Premiums paid for insurance coverage
$
—
$
443
September 30, 2025
December 31, 2024
Total investments:
COLI
$
58,505
$
57,210
Exchange traded funds
107,804
98,314
$
166,309
$
155,524
Pension Plans and SERP Liabilities: The following table presents liabilities for the defined benefit pension plans and SERP at September 30, 2025 and December 31, 2024.
Notes to Condensed Consolidated Financial Statements
(Dollar amounts in thousands, except per share data)
Net Periodic Benefit Cost:The following table presents the net periodic benefit costs for the defined benefit pension plans and SERP by expense components for the three and nine month periods ended September 30, 2025 and 2024.
Components of Net Periodic Benefit Cost
Three Months Ended September 30,
Nine Months Ended September 30,
2025
2024
2025
2024
Service cost—benefits earned during the period
$
6,245
$
6,224
$
18,730
$
18,673
Interest cost on projected benefit obligation
9,024
8,287
27,073
24,862
Expected return on assets
(11,563)
(10,645)
(34,689)
(31,938)
Amortization:
Prior service cost
292
265
876
803
Actuarial (gain) loss
—
6
—
18
Net periodic benefit cost
$
3,998
$
4,137
$
11,990
$
12,418
Note 10—Earnings Per Share
Earnings per Share: A reconciliation of basic and diluted weighted-average shares outstanding used in the computation of basic and diluted earnings per share is as follows:
Three Months Ended September 30,
Nine Months Ended September 30,
2025
2024
2025
2024
Basic weighted average shares outstanding
80,692,558
87,874,488
82,019,029
91,048,853
Weighted average dilutive options outstanding
1,322,888
212,553
1,078,133
273,666
Diluted weighted average shares outstanding
82,015,446
88,087,041
83,097,162
91,322,519
Antidilutive shares
—
4,234,326
783,124
3,090,848
Antidilutive shares are excluded from the calculation of diluted earnings per share. All antidilutive shares noted above result from outstanding out-of-the-money employee and Director stock options.
Notes to Condensed Consolidated Financial Statements
(Dollar amounts in thousands, except per share data)
Note 11—Debt
The following table presents information about the terms and outstanding balances of Globe Life's debt.
Selected Information about Debt Issues
As of
September 30, 2025
December 31, 2024
Instrument
Issue Date
Maturity Date
Coupon Rate
Par Value
Unamortized Discount & Issuance Costs
Book Value
Fair Value
Book Value
$
—
Senior notes
09/27/2018
09/15/2028
4.550%
$
550,000
$
(2,439)
$
547,561
$
554,846
$
546,999
Senior notes
08/21/2020
08/15/2030
2.150%
400,000
(2,514)
397,486
359,436
397,132
Senior notes(1)
05/19/2022
06/15/2032
4.800%
250,000
(3,413)
246,587
251,192
246,272
Senior notes
08/23/2024
09/15/2034
5.850%
450,000
(4,883)
445,117
472,325
444,814
Junior subordinated debentures
Junior subordinated debentures
11/17/2017
11/17/2057
5.275%
125,000
(1,543)
123,457
100,389
123,443
Junior subordinated debentures
06/14/2021
06/15/2061
4.250%
325,000
(7,549)
317,451
215,800
317,387
Term loan(2)
05/11/2023
08/15/2027
5.670%
250,000
(1,300)
248,700
248,700
248,204
Subtotal
2,350,000
(23,641)
2,326,359
2,202,688
2,324,251
Unamortized issuance costs(3)
—
(6,346)
(6,346)
(6,346)
—
Total long-term debt
2,350,000
(29,987)
2,320,013
2,196,342
2,324,251
Current maturity of long-term debt
Term loan(2)
—
—
—
—
—
FHLB borrowings
65,000
—
65,000
65,000
—
Commercial paper
331,000
(1,651)
329,349
329,349
415,401
Total short-term debt
396,000
(1,651)
394,349
394,349
415,401
Total debt
$
2,746,000
$
(31,638)
$
2,714,362
$
2,590,691
$
2,739,652
(1)An additional $150 million par value and book value is held by insurance subsidiaries that eliminates in consolidation.
(2)Interest calculated quarterly using Secured Overnight Financing Rate (SOFR) plus 135 basis points.
(3)Unamortized issuance costs for P-CAPS facility agreement.
The commercial paper has the highest priority of all unsecured debt, followed by senior notes then junior subordinated debentures. The senior notes are callable under a make-whole provision, and the junior subordinated debentures are subject to an optional redemption five years from issuance. Interest on the 4.25% junior subordinated debentures and the term loan are payable quarterly while all other long-term debt is payable semi-annually.
Notes to Condensed Consolidated Financial Statements
(Dollar amounts in thousands, except per share data)
Credit facility: Globe Life has in place a credit facility which provides for a $1 billion revolving credit facility that may be increased to $1.25 billion. The credit facility matures March 29, 2029 and may be extended up to twoone-year periods upon the Company's request. Pursuant to this agreement, the participating lenders have agreed to make revolving loans to Globe Life and to issue secured or unsecured letters of credit. The Company has not drawn on any of the credit to date.
The facility is further designated as a back-up credit line for a commercial paper program under which the Company may either borrow from the credit line or issue commercial paper at any time, with total commercial paper outstanding not to exceed the facility maximum of $1 billion, less any letters of credit issued. Interest is charged at variable rates. In accordance with the agreement, Globe Life is subject to certain covenants regarding capitalization.
As of September 30, 2025, the Company was in full compliance with these covenants.
Pre-capitalized Trust Securities: On July 1, 2025, the Company entered into a 30-year Facility Agreement with a Delaware trust (the "Trust") following the completion of a private placement of Trust securities for $500 million of Pre-Capitalized Trust Securities (the "P-CAPS"), conducted pursuant to Rule 144A under the Securities Act. The Trust invested the proceeds from this offering in a portfolio of U.S. Treasury principal and interest strips ("Treasury securities"). P-CAPS provide the Company with a source of liquidity, the proceeds of which, if drawn, would be used for general corporate purposes.
Under the Facility Agreement, the Company has the right, on one or more occasions, to issue and sell up to $500 million of its 6.580% Senior Notes to the Trust in exchange for a corresponding amount of Treasury securities held by the Trust. In consideration for this right, the Company pays the Trust a semi-annual facility fee at a rate of 1.789% per annum on the unexercised portion of the facility. These fees are recorded in Interest Expense in the Condensed Consolidated Statements of Operations. The Company also reimburses the Trust for its administrative expenses. As of September 30, 2025, the Company had no senior note issuances under the Facility Agreement.
Commercial paper: The following tables present certain information about our commercial paper borrowings.
Credit Facility—Commercial Paper
As of
September 30, 2025
December 31, 2024
September 30, 2024
Balance of commercial paper at end of period (par value)
$
331,000
$
419,000
$
426,908
Annualized interest rate
4.60
%
5.22
%
5.56
%
Letters of credit outstanding
$
115,000
$
115,000
$
115,000
Remaining amount available under credit line
554,000
466,000
458,092
Credit Facility—Commercial Paper Activity
Nine Months Ended September 30,
2025
2024
Average balance of commercial paper outstanding during period (par value)
$
430,732
$
375,851
Daily-weighted average interest rate (annualized)
4.90
%
5.80
%
Maximum daily amount outstanding during period (par value)
$
605,500
$
633,425
Commercial paper issued during period (par value)
1,678,250
1,482,556
Commercial paper matured during period (par value)
(1,766,250)
(1,374,648)
Net commercial paper issued (matured) during period (par value)
Notes to Condensed Consolidated Financial Statements
(Dollar amounts in thousands, except per share data)
Federal Home Loan Bank: FHLB membership provides certain of our insurance subsidiaries with access to various low-cost collateralized borrowings and funding agreements. The membership requires ownership of FHLB common stock, as well as the purchase of activity-based common stock equal to approximately 4.1% of outstanding borrowings.
Globe Life owned $33.7 million in FHLB common stock as of September 30, 2025 and $34.5 million as of December 31, 2024. The FHLB stock is restricted from redemption or repurchases for the duration of the membership and recorded at cost (par) as required by applicable guidance. The FHLB stock is included in "Other long-term investments" in theCondensed Consolidated Balance Sheets.Borrowings with the FHLB are subject to the availability of pledged assets at the insurance subsidiaries of Globe Life. As of September 30, 2025, Globe Life's insurance subsidiaries' maximum borrowing capacity under the FHLB facility was approximately $648 million, net of outstanding funding agreements and short-term borrowings, on pledged assets with a fair value of $1.3 billion. As of September 30, 2025, $427 million in funding agreements were outstanding with the FHLB, compared to $372 million as of December 31, 2024. This amount is included in "Other policyholders' funds" in the Condensed Consolidated Balance Sheets. The Company had $65 million and $17 million in short-term borrowings from the FHLB as of September 30, 2025 and 2024, respectively.
Notes to Condensed Consolidated Financial Statements
(Dollar amounts in thousands, except per share data)
Note 12—Business Segments
Globe Life is organized into three operating segments: life, health, and investments.
Globe Life's reportable insurance segments are based on the insurance product lines it markets and administers: life insurance and supplemental health insurance. There is also an investment segment that manages the investment portfolio and cash flow for the insurance segments. The Company's chief operating decision makers ("CODM"), our Co-CEOs, evaluate the overall performance of the operations of the Company in accordance with these segments.
During the fourth quarter of 2024 we entered into a coinsurance agreement to cede a majority of the annuity business to a third-party insurer. This impacted a significant portion of our annuities which had previously been classified as one of our reportable segments. The annuity segment has historically represented less than 1% of revenue and has not been core to the Company's business. We adjusted our segments from four down to three at December 31, 2024. All quarterly presentations of segment information related to prior year have been recast for the periods presented to reflect this change in segments.
Life insurance products marketed by Globe Life include traditional whole life and term life insurance. Health insurance products are generally guaranteed renewable and include Medicare Supplement, cancer, critical illness, accident, and other limited-benefit supplemental hospital and surgical products.
The Company adopted ASU No. 2023-07, Segment Reporting (Topic 280): Improvements to Reportable Segment Disclosures, in 2024 which added disclosure requirements to segment expenses, improving the financial reporting of the entity’s overall performance and assessment of future cash flows. The disclosures required more detailed information related to the entity’s reportable segments and the new disclosures are also required prospectively on a quarterly basis. The prior-year presentation has been recast to reflect the new disclosures in accordance with this adopted accounting standard.
The following tables present segment premium revenue by each of Globe Life's distribution channels.
Notes to Condensed Consolidated Financial Statements
(Dollar amounts in thousands, except per share data)
Premium Income by Distribution Channel
Three Months Ended September 30, 2024
Life
Health
Total
Distribution Channel
Amount
% of
Total
Amount
% of
Total
Amount
% of
Total
American Income
$
427,839
52
$
31,277
9
$
459,116
39
Direct to Consumer
246,425
30
18,072
5
264,497
23
Liberty National
93,625
12
47,277
13
140,902
12
United American
1,608
—
149,510
42
151,118
13
Family Heritage
1,684
—
107,819
31
109,503
9
Other
47,457
6
—
—
47,457
4
Total
$
818,638
100
$
353,955
100
$
1,172,593
100
Nine Months Ended September 30, 2025
Life
Health
Total
Distribution Channel
Amount
% of Total
Amount
% of Total
Amount
% of Total
American Income
$
1,334,591
53
$
93,806
8
$
1,428,397
39
Direct to Consumer
736,651
29
57,374
5
794,025
22
Liberty National
291,635
12
142,823
13
434,458
12
United American
4,704
—
493,561
43
498,265
14
Family Heritage
5,418
—
346,850
31
352,268
9
Other
140,891
6
—
—
140,891
4
Total
$
2,513,890
100
$
1,134,414
100
$
3,648,304
100
Nine Months Ended September 30, 2024
Life
Health
Total
Distribution Channel
Amount
% of
Total
Amount
% of
Total
Amount
% of
Total
American Income
$
1,265,417
52
$
92,495
9
$
1,357,912
39
Direct to Consumer
743,304
31
54,070
5
797,374
23
Liberty National
276,599
11
142,612
14
419,211
12
United American
5,009
—
440,375
42
445,384
13
Family Heritage
4,945
—
317,065
30
322,010
9
Other
143,111
6
—
—
143,111
4
Total
$
2,438,385
100
$
1,046,617
100
$
3,485,002
100
Due to the nature of the life insurance industry, Globe Life has no individual or group that would be considered a major customer. Substantially all of Globe Life's business is conducted in the United States.
The measure of profitability established by the CODM for the insurance segments is underwriting margin before other income and administrative expenses, in accordance with the manner in which the segments are managed. It essentially represents gross profit margin on insurance products before insurance administrative expenses and consists primarily of premium less net policy benefits, acquisition expenses, and commissions. Required interest on policy liabilities is reflected as a component of the Investment segment (rather than as a component of underwriting margin in the insurance segment) in order to match this cost with the investment income earned on the assets supporting the policy liabilities.
Notes to Condensed Consolidated Financial Statements
(Dollar amounts in thousands, except per share data)
The measure of profitability for the Investment segment is excess investment income, representing the net income earned on the investment portfolio in excess of policy requirements. Other than the required interest on the insurance segments, no other intersegment revenues or expenses are recognized. Expenses directly attributable to corporate operations are included in the “Corporate & Other” category. Stock-based compensation expense is considered a corporate expense by Globe Life management and is included in this category. All other unallocated revenues and expenses on a pretax basis, including insurance administrative expense and interest on debt, are also included in the “Corporate & Other” segment category.
Globe Life holds a sizable investment portfolio to support its insurance liabilities, the yield from which is used to offset policy benefit, acquisition, administrative, and tax expenses. This yield or investment income is taken into account when establishing premium rates and profitability expectations for its insurance products. From time to time, investments are sold or called, or experience a credit loss event, each of which are reflected by the Company as realized gain (loss)—investments. These gains or losses generally occur as a result of disposition due to issuer calls, compliance with Company investment policies, or other reasons often beyond management’s control. Unlike investment income, realized gains and losses are incidental to insurance operations, and only overall yields are considered when setting premium rates or insurance product profitability expectations. While these gains and losses are not relevant to segment profitability or core operating results, they can have a material positive or negative result on net income. For these reasons, management removes realized investment gains and losses when it views its segment operations.
Management also removes non-operating items unrelated to the Company's core insurance activities when evaluating those results. Therefore, these items are excluded in its presentation of segment results because accounting guidance requires that operating segment results be presented as management views its business. All of these items are included in “Other operating expense” in the Condensed Consolidated Statements of Operations for the appropriate year. See additional detail below in the tables.
Notes to Condensed Consolidated Financial Statements
(Dollar amounts in thousands, except per share data)
The following tables set forth a reconciliation of Globe Life's revenues and operations by segment to its major income statement line items. See Note 1—Significant Accounting Policies for additional information concerning reconciling items of segment profits to pretax income.
(1)Policy obligations are based upon policyholder behavior and impacts related to lapses, mortality, and morbidity. For detailed information, including remeasurement gains and losses, see Note 6—Policy Liabilities.
(1)Policy obligations are based upon policyholder behavior and impacts related to lapses, mortality, and morbidity. For detailed information, including remeasurement gains and losses, see Note 6—Policy Liabilities.
(1)Policy obligations are based upon policyholder behavior and impacts related to lapses, mortality, and morbidity. For detailed information, including remeasurement gains and losses, see Note 6—Policy Liabilities.
(1)Policy obligations are based upon policyholder behavior and impacts related to lapses, mortality, and morbidity. For detailed information, including remeasurement gains and losses, see Note 6—Policy Liabilities.
Notes to Condensed Consolidated Financial Statements
(Dollar amounts in thousands, except per share data)
Assets for each segment are reported based on a specific identification basis. The insurance segments’ assets contain DAC. The investment segment includes the investment portfolio, cash, and accrued investment income. Goodwill is assigned to the insurance segments at the time of purchase. All other assets are included in the annuity and other corporate category. The tables below reconcile segment assets to total assets as reported on the Condensed Consolidated Balance Sheets.
We caution readers regarding certain forward-looking statements contained in the foregoing discussion and elsewhere in this document, and in any other statements made by, or on behalf of Globe Life whether or not in future filings with the Securities and Exchange Commission. Any statement that is not a historical fact, or that might otherwise be considered an opinion or projection concerning the Company or its business, whether express or implied, is meant as and should be considered a forward-looking statement. Such statements represent management's opinions concerning future operations, strategies, financial results or other developments. We specifically disclaim any obligation to update or revise any forward-looking statement because of new information, future developments, or otherwise.
Forward-looking statements are based upon estimates and assumptions that are subject to significant business, economic and competitive uncertainties, many of which are beyond our control. If these estimates or assumptions prove to be incorrect, the actual results of Globe Life may differ materially from the forward-looking statements made on the basis of such estimates or assumptions. Whether or not actual results differ materially from forward-looking statements may depend on numerous foreseeable and unforeseeable events or developments, which may be national in scope, related to the insurance industry generally, or applicable to the Company specifically. Such events or developments could include, but are not necessarily limited to:
1.Economic and other conditions, including the impact of inflation, immigration, geopolitical events, escalating tariff and non-tariff trade measures imposed by the U.S. and other countries, a prolonged government shutdown, and other governmental actions which affect the U.S. economy and/or U.S. consumer confidence, leading to unexpected changes in lapse rates and/or sales of our policies, as well as levels of mortality, morbidity, and/or utilization of health care services that differ from Globe Life's assumptions;
2.Regulatory developments, including changes in accounting standards or governmental regulations (particularly those impacting taxes and changes to the Federal Medicare program that affect Medicare Supplement insurance sales, claims utilization or use);
3.Market trends in the senior-aged health care industry that provide alternatives to traditional Medicare (such as Health Maintenance Organizations and other managed care or private plans) and that affect the sales of traditional Medicare Supplement insurance;
5.General economic, industry sector or individual debt issuers’ financial conditions (including developments and volatility arising from geopolitical events, particularly in certain industries that may comprise part of our investment portfolio) that affect the current market value of securities we own, or that may impair an issuer’s ability to make principal and/or interest payments due on those securities;
6.Changes in the competitiveness of the Company's products and pricing;
7.Litigation or regulatory actions against the Company;
8.Levels of administrative and operational efficiencies that differ from our assumptions (including any reduction in efficiencies resulting from increased costs arising from the impact of higher than anticipated inflation);
9.The ability to obtain timely and appropriate premium rate increases for health insurance policies from our regulators;
10.The customer response to new products and marketing initiatives;
11.Reported amounts in the consolidated financial statements which are based on management estimates and judgments which may differ from the actual amounts ultimately realized;
12.Compromise by a malicious actor or other event that causes a loss of secure data from, or inaccessibility to, our computer and other information technology systems;
13.The Company's ability to attract and retain agents;
14.The severity, magnitude, and impact of natural or man-made catastrophic events, including but not limited to pandemics, tornadoes, hurricanes, earthquakes, war and terrorism, on our operations and personnel, commercial activity, level of claims, and demand for our products; and
15.Globe Life's ability to access the commercial paper and debt markets, particularly if such markets become unpredictable or unstable for a certain period.
Readers are also directed to consider other risks and uncertainties described in other documents on file with the Securities and Exchange Commission, including those described in the "Risk Factors" section of our most recent Annual Report on Form 10-K.
Item 2. Management's Discussion and Analysis of Financial Condition and Results of Operations
The following discussion should be read in conjunction with Globe Life's Condensed Consolidated Financial Statements and Notes thereto appearing elsewhere in this report. The following management discussion will only include comparison to prior year.
"Globe Life" and the "Company" refer to Globe Life Inc. and its subsidiaries and affiliates.
Results of Operations
How Globe Life Views Its Operations. Globe Life Inc. is the holding company for a group of insurance companies that market through exclusive, direct-to-consumer and independent distribution channels primarily individual life and supplemental health insurance to lower middle to middle-income households throughout the United States. We view our operations by segments, which are the insurance product lines of life and supplemental health, and the investment segment that supports the product lines.
Insurance Product Line Segments. The insurance product line segments involve the marketing, underwriting, and administration of policies. Each product line is further subdivided by the various distribution channels that market the insurance policies. Each distribution channel operates in a niche market offering insurance products designed for that particular market. Whether analyzing profitability of a segment as a whole, or the individual distribution channels within the segment, the measure of profitability used by management is the underwriting margin, as seen below:
Premium revenue
(Policy obligations)
(Policy acquisition costs and commissions)
Underwriting margin
Investment Segment.The investment segment involves the management of our capital resources, including investments and the management of liquidity. Our measure of profitability for the investment segment is excess investment income, as seen below:
Globe Life serves the lower-middle to middle-income market. We believe this market is underserved, has significant growth potential, and provides us with a distinct competitive advantage. This advantage is protected due not only to our ability to efficiently reach this market through both exclusive and direct to consumer distribution channels, but also due to the amount of data and experience we possess, as we have been in this same market for over 60 years with essentially the same products. The basic protection life and health insurance products we offer are specifically designed to help provide financial security to consumers in this market.
Current Highlights.
•Net income as a return on equity (ROE) for the nine months ended September 30, 2025 was 21.9% and net operating income as an ROE, excluding accumulated other comprehensive income(1) was 16.6%.
•Total premium increased 5% over the same period in the prior year. Life premium increased 3% for the period from $2.4 billion in 2024 to $2.5 billion in 2025. Health premium increased 8% to $1.1 billion over the prior-year period of $1.0 billion.
•Total net sales increased 6% over the same period in the prior year from $622 million in 2024 to $661 million in 2025. The average producing agent count across all of the exclusive agencies increased 4% over the prior year.
•Book value per share increased 27% over the same period in the prior year from $54.65 to $69.52. Book value per share, excluding accumulated other comprehensive income(1), increased 12% over the prior year from $83.92 in 2024 to $93.63 in 2025.
•For the nine months ended September 30, 2025, the Company repurchased 4.2 million shares of Globe Life Inc. common stock at a total cost of $515 million for an average share price of $123.97.
The following graphs represent net income and net operating income for the nine month periods ended September 30, 2025 and 2024.
(1)As shown in the charts above, net operating income is primarily comprised of insurance underwriting margin plus excess investment income and annuity and other income, offset by operating expenses after tax and, as such, is considered a non-GAAP measure. It has been used consistently by Globe Life's management for many years to evaluate the operating performance of the Company. It differs from net income primarily because it excludes certain non-operating items such as realized gains and losses and certain significant and unusual items included in net income. Net income is the most directly comparable GAAP measure.
Net operating income as an ROE, excluding accumulated other comprehensive income ("AOCI"), is considered a non-GAAP measure. Management utilizes this measure to view the business without the effect of changes in AOCI, which are primarily attributable to fluctuation in interest rates. The impact of the adjustment to exclude AOCI is $(2.0) billion and $(2.5) billion for the nine months ended September 30, 2025 and 2024, respectively.
Book value per share, excluding AOCI, is also considered a non-GAAP measure. Management utilizes this measure to view the book value of the business without the effect of changes in AOCI, which are primarily attributable to fluctuation in interest rates. The impact of the adjustment to exclude AOCI is $(24.11) and $(29.27) for the nine months ended September 30, 2025 and 2024, respectively.
•Net income totaled $895 million during the nine months ended September 30, 2025, compared with $816 million in the same period in 2024.
•On a diluted per common share basis, net income per common share for the nine months ended September 30, 2025 increased 21% from $8.93 to $10.77.
•Net operating income was $925 million for the nine months ended September 30, 2025, compared with $843 million for the same period in 2024.
•On a diluted per common share basis, net operating income per common share for the nine months ended September 30, 2025 increased from $9.23 to $11.13, a 21% increase.
Net operating income is primarily comprised of insurance underwriting margin plus excess investment income and annuity and other income, offset by operating expenses, after tax and, as such, is considered a non-GAAP measure. Net income is the most directly comparable GAAP measure. We do not consider realized gains and losses to be a component of our core insurance operations or operating segments. Additionally, net income was affected by certain non-operating items. We do not view these items as components of core operating results because they are not indicative of past performance or future prospects of the insurance operations. We remove items such as these that relate to prior periods or are non-operating items when evaluating the results of current operations, and therefore exclude such items from our segment analysis for current periods.
During the third quarter of 2025, the Company performed its annual assumptions review and updated both its life and health assumptions of lapses, mortality, and morbidity resulting in a $134.3 million net remeasurement gain as compared to a $46.3 million net remeasurement gain in the year-ago quarter. Excluding the impact of assumption changes, the Company's results for actual variances from expected experience for both life and health produced a $24.0 million net remeasurement gain and a $14.7 million net remeasurement gain for the three months ended September 30, 2025 and 2024, respectively. During nine months ended September 30, 2025 and 2024, the Company's results for actual variances from expected experience for both life and health produced a $53.6 million net remeasurement gain and a $38.4 million net remeasurement gain, respectively.
As previously noted, a component of insurance underwriting margin is policy obligations, which includes for each reporting period the change in the liability for future policy benefits ("LFPB"). The LFPB is determined each reporting period based on the net level premium method. Net level premiums reflect a recomputed net premium ratio using actual experience since the issue date, and expected future experience based on future cash-flow assumptions See Note 6—Policy Liabilities for additional information.
Overall, the Company continues to see positive signs in its core operations, including sales and premium growth, and continues to achieve an operating ROE (excluding accumulated other comprehensive income) generally in the mid-teens.
Globe Life's operations on a segment-by-segment basis are discussed in depth below. Net operating income has been used consistently by management for many years to evaluate the operating performance of the Company and is a measure commonly used in the life insurance industry. It differs from GAAP net income primarily because it excludes certain non-operating items such as realized gains and losses and other significant and unusual items included in net income. Management believes an analysis of net operating income is important in understanding the profitability and operating trends of the Company’s business. Net income is the most directly comparable GAAP measure.
Analysis of Profitability by Segment
(Dollar amounts in thousands)
Nine Months Ended September 30,
2025
2024
Change
%
Life insurance underwriting margin
$
1,158,946
$
1,016,517
$
142,429
14
Health insurance underwriting margin
291,152
281,221
9,931
4
Excess investment income
107,581
126,079
(18,498)
(15)
Segment profit or (loss)
1,557,679
1,423,817
133,862
9
Annuity and other income
6,891
5,576
1,315
24
Administrative expense
(263,363)
(251,072)
(12,291)
5
Other corporate expense
(157,386)
(129,169)
(28,217)
22
Pre-tax total
1,143,821
1,049,152
94,669
9
Applicable taxes
(219,169)
(205,977)
(13,192)
6
Net operating income
924,652
843,175
81,477
10
Reconciling items, net of tax:
Realized gains (losses)
(18,546)
(20,998)
2,452
Other expenses
(393)
(2,057)
1,664
Legal proceedings
(10,558)
(4,554)
(6,004)
Net income
$
895,155
$
815,566
$
79,589
10
The life insurance segment is our primary segment and is the largest contributor to earnings in each period presented. The life insurance segment underwriting margin increased $142 million compared with the prior period, driven by premium growth in addition to remeasurement gains from the updating of assumptions, including updates to mortality, morbidity, and lapse assumptions. The updates to mortality were the most significant as life segment claims continued to improve adding credibility to the favorable trend. Excess investment income declined $18 million compared with the prior period, as assets grew slightly less than liabilities primarily due to the impact of reinsurance transactions, as well as higher dividend distributions from the insurance companies to the Parent. In addition, we had lower earned yields on commercial mortgage loans, limited partnerships and short term investments The health segment experienced favorable underwriting margin as a result of higher premiums.
In 2025, the largest contributor of total underwriting margin was the life insurance segment and the primary distribution channel was the American Income Life Division (American Income). The following charts represent the breakdown of total underwriting margin by operating segment and distribution channel for the nine months ended September 30, 2025.
Total premium income rose 5% for the nine months ended September 30, 2025 to $3.6 billion. Total net sales increased 6% to $661 million, when compared with 2024. Total first-year collected premium (defined in the following section) increased 3% to $520 million for 2025, compared to $507 million in 2024.
Life insurance premium income increased 3% to $2.51 billion over the prior-year total of $2.44 billion. Life net sales increased by $454 million for the first nine months of 2025 as compared to the year ago period. First-year collected life premium increased 1% to $347 million. Life underwriting margin, as a percent of premium, increased to 46% for 2025 from 42% in 2024. Underwriting margin increased to $1.2 billion in 2025, compared to $1.0 billion in 2024.
Health insurance premium income increased 8% to $1.1 billion over the prior-year total of $1.0 billion. Health net sales rose 21% to $207 million for the first nine months of 2025. First-year collected health premium rose 5% to $173 million. Health underwriting margin, as a percent of premium, was 26% for 2025 down from 27% in 2024. Health underwriting margin increased to $291 million for the first nine months of 2025, compared to $281 million in 2024.
Excess investment income, the measure of profitability of our investment segment, declined 15% during the first nine months of 2025 to $108 million from $126 million in 2024. Excess investment income per common share, reflecting the impact of our share repurchase program, declined 7% to $1.29 from $1.38 when compared with the same period in 2024.
Insurance administrative expenses increased 5% primarily due to higher employee costs, which include salaries and other costs in addition to higher information technology expenses in 2025 when compared with the prior-year period. These expenses were 7.2% as a percent of premium for 2025 unchanged from 2024.
For the nine months ended September 30, 2025, the Company repurchased 4.2 million shares of Globe Life Inc. common stock at a total cost of $515 million for an average share price of $123.97.
The discussions of our segments are presented in the manner we view our operations, as described in Note 12—Business Segments.
We use three measures as indicators of premium growth and sales over the near term: “annualized premium in force”, "net sales,” and “first-year collected premium.”
•Annualized premium in force is defined as the premium income that would be received over the following twelve months at any given date on all active policies if those policies remain in force throughout the 12-month period.
•Net sales is calculated as annualized premium issued, net of cancellations in the first 30 days after issue, except in the case of Direct to Consumer, where net sales is annualized premium issued at the time the first full premium is paid after any introductory offer period (typically one month) has expired. Management considers net sales to be a better indicator of the rate of premium growth than annualized premium issued since annualized premium issued is before cancellations, as cancellations do not contribute to premium income.
•First-year collected premium is defined as the premium collected during the reporting period for all policies in their first policy year. First-year collected premium takes lapses into account in the first year when lapses are more likely to occur, and thus is a useful indicator of how much new premium is expected to be added to premium income in the future. First-year collected premiums are lower than net sales over the prior 12 months because premiums are not collected on lapsed policies after the date of lapse.
Cancellations are not included in lapses.
See further discussion of the distribution channels below for Life and Health.
Life insurance is the Company's predominant segment. During 2025, life premium represented 69% of total premium and life underwriting margin represented 80% of the total underwriting margin. Additionally, investments supporting the reserves for life products produce the majority of income attributable to the investment segment.
The following table presents the summary of results of life insurance. Further discussion of the results by distribution channel is included below.
Life Insurance
Summary of Results
(Dollar amounts in thousands)
Nine Months Ended September 30,
Change
2025
2024
Amount
% of Premium
Amount
% of Premium
Amount
%
Premium and policy charges
$
2,513,890
100
$
2,438,385
100
$
75,505
3
Policy obligations
1,410,622
56
1,493,165
61
(82,543)
(6)
Required interest on reserves
(632,150)
(25)
(605,397)
(25)
(26,753)
4
Net policy obligations
778,472
31
887,768
36
(109,296)
(12)
Amortization of acquisition costs
285,417
12
263,753
11
21,664
8
Commission expense
130,848
5
118,480
5
12,368
10
Premium taxes
51,621
2
51,254
2
367
1
Non-deferred acquisition costs
108,586
4
100,613
4
7,973
8
Total expense
1,354,944
54
1,421,868
58
(66,924)
(5)
Insurance underwriting margin
$
1,158,946
46
$
1,016,517
42
$
142,429
14
Net policy obligations amounted to 31% of premium for the nine months ended September 30, 2025 compared to 36% in the year-ago period.
The table below summarizes life underwriting margin by distribution channel.
Life Insurance
Underwriting Margin by Distribution Channel
(Dollar amounts in thousands)
Nine Months Ended September 30,
2025
2024
Change
Amount
% of Premium
Amount
% of Premium
Amount
%
American Income
$
661,825
50
$
600,976
47
$
60,849
10
Direct to Consumer
246,903
34
210,712
28
36,191
17
Liberty National
135,508
46
106,486
38
29,022
27
Other(1)
114,710
76
98,343
64
16,367
17
Total
$
1,158,946
46
$
1,016,517
42
$
142,429
14
(1) Includes a gain of $14 million related to the recapture of reinsurance for nine months ended September 30, 2025 as disclosed in Note 1 - Significant Accounting Policies.
A discussion of life operations by distribution channel follows.
The American Income Life Division is an exclusive agency that markets to members of labor unions and other affinity groups and continues to diversify its lead sources, utilizing internally generated leads, third-party internet vendor leads and referrals to facilitate sustainable growth. This Division is Globe Life's largest contributor of life premium of any distribution channel at 53% of the Company's September 30, 2025 total life premium. For the nine months ended September 30, 2025, the average monthly life premium issued per policy was $59 as compared to $56 for the same period in the prior year. Net sales were $291 million for the nine months ended September 30, 2025, up from $289 million in the year-ago period. The underwriting margin, as a percent of premium, was 50% for the nine months ended September 30, 2025 and 47% for the same period in the prior year.
The average producing agent count increased 3% over the year-ago period. The increase in average producing agent count was driven by an increase in new agent recruiting along with continued improvement in new agent retention. Sales growth in this Division, as well as within our other exclusive agencies, is generally dependent on growth in the size of the agency force.
Below is the average producing agent count as of the indicated periods for the American Income Life Division. The average producing agent count is based on the actual count at the beginning and end of each week during the year.
At September 30,
Change
2025
2024
Amount
%
American Income
11,994
11,680
314
3
American Income Life continues to focus on growing and strengthening the agency force, specifically through emphasis on agency middle-management growth and additional agency openings. In addition to offering financial incentives and training opportunities, the Division has made considerable investments in information technology, including a customer relationship management (CRM) tool for the agency force. This tool is designed to provide dashboards and drive productivity in lead distribution, conservation of business, and new agent recruiting. Additionally, this Division has invested in and successfully implemented technology that allows the agency force to engage in virtual recruiting, training, and sales activity. The agents have shifted to primarily a virtual experience with the customers and have generated a vast majority of sales through virtual presentations. We find this flexibility to be enticing for new recruits as well as a driver of retention in our agency force.
The Direct to Consumer Division (DTC) markets adult and juvenile life insurance through a variety of channels, including direct mail, insert media, and digital marketing. The different media channels support and complement one another in the Division's efforts to provide consumer outreach. All three channels work as part of an omnichannel approach. Sales from the internet and inbound phone calls continue to outpace the activity from direct mail. DTC's long-term growth has been fueled by consistent innovation and brand awareness. Additionally, the DTC Division provides valuable support to our agency business through brand impressions and inquiries that lead to sales in our exclusive agency channels. We have implemented new technology to enhance our underwriting process, this has improved the conversion of customer inquiries into sales. New initiatives are continuously introduced to help increase response rates, issue rates, and create a seamless customer experience. The juvenile insurance market is an important source of sales as well as a vehicle to reach the parents and grandparents of existing juvenile insureds, who are more likely to respond favorably to a direct to consumer solicitation for life coverage on themselves in comparison to the general adult population. Additionally, future offerings to parents and grandparents for adult and juvenile insurance are sources of lower acquisition-cost life insurance sales in the future.
DTC net sales were flat at $83 million for the nine months ended September 30, 2025, compared to the year-ago period. We have seen net sales trending up the last two quarters and noted a 13% increase for the three months ended September 30, 2025 compared to the prior year three months ended. We have been focused on improving profitability and improving underwriting margin in this division. DTC’s underwriting margin was $246.9 million and 34% as a percent of premium for the nine months ended September 30, 2025 compared to $210.7 million and 28% as a percent of premium for the same period in 2024. For the nine months ended September 30, 2025, the average monthly life premium issued for DTC adults was $17 as compared to $15 for the same period in the prior year.
The Liberty National Division is an exclusive agency that markets individual life insurance to middle-income household and worksite customers. Recent investments in new sales technologies as well as recent growth in agency middle management within the Division are expected to support increased sales. Underwriting margin rose 27% from the year ago period to $136 million and premium increased 5% to $292 million. The underwriting margin as a percent of premium increased for the nine months ended September 30, 2025, to 46% compared to 38% in year-ago period. For the nine months ended September 30, 2025, the average monthly life premium per policy issued rose slightly compared to the prior year to $44 from $43.
Below is the average producing agent count for the nine months ended September 30, 2025 and 2024 for the Liberty National Division. The average producing agent count is based on the actual count at the beginning and end of each week during the year.
At September 30,
Change
2025
2024
Amount
%
Liberty National
3,806
3,638
168
5
The Liberty National Division's average producing agent count increased when compared with the prior-year comparable period. This Division continues to execute a long-term plan to grow through expansion from small-town markets in the Southeast to more densely populated areas with larger pools of potential agent recruits and customers. Expansion of this Division’s presence in larger geographic cities, with less penetrated areas will help create long-term sustainable agency growth. Additionally, the Division continues to help improve the ability of agents to develop new worksite business. A CRM platform and enhanced analytical capabilities have helped the agents develop additional worksite marketing opportunities and improve the productivity of agents selling in the individual life market. As the Division gains momentum in its sales and recruiting initiatives, advances in technology and use of the CRM platform, it anticipates continued growth in recruiting activity, average producing agent count, and net sales.
The Other agency distribution channels primarily include non-exclusive independent agencies selling primarily life insurance. The Other distribution channels contributed $151 million of life premium income, or 6% of Globe Life's total life premium income in the nine months ended September 30, 2025, and contributed 2% of net sales for the period.
HEALTH INSURANCE
Health insurance sold by the Company primarily includes Medicare Supplement insurance as well as retiree health insurance, accident coverage, and other limited-benefit supplemental health products such as cancer, critical illness, heart disease, accident, intensive care, and other health products.
Health premium accounted for 31% of our total premium in 2025, while the health underwriting margin accounted for 20% of total underwriting margin. Health underwriting margin increased to $291 million compared to $281 million in the prior year. While the Company continues to emphasize life insurance sales relative to health, due to life’s long-term profitability and its greater contribution to excess investment income, the health business provides a significant contribution to return on equity as it does not require a substantial amount of up-front capital.
Globe Life markets supplemental health insurance products through a number of distribution channels. The following table is an analysis of our health premium by distribution channel.
Health Insurance
Premium by Distribution Channel
(Dollar amounts in thousands)
Nine Months Ended September 30,
Increase (Decrease)
2025
2024
Amount
% of Total
Amount
% of Total
Amount
%
United American
$
493,561
43
$
440,375
42
$
53,186
12
Family Heritage
346,850
31
317,065
30
29,785
9
Liberty National
142,823
13
142,612
14
211
—
American Income
93,806
8
92,495
9
1,311
1
Direct to Consumer
57,374
5
54,070
5
3,304
6
Total
$
1,134,414
100
$
1,046,617
100
$
87,797
8
Premiums related to limited-benefit supplemental health products comprise $632 million, or 56%, of the total health premiums for the nine months ended September 30, 2025, compared with $586 million, or 56%, in the same period in the prior year. Premium from Medicare Supplement products comprises the remaining $502 million, or 44%, for the nine months ended September 30, 2025, compared to $461 million, or 44%, in the same period in the prior year.
Annualized health premium in force was $1.58 billion at September 30, 2025, an increase of 8% over $1.45 billion a year earlier.
Presented below is a table of health net sales by distribution channel.
Health Insurance
Net Sales by Distribution Channel
(Dollar amounts in thousands)
Nine Months Ended September 30,
Increase (Decrease)
2025
2024
Amount
% of Total
Amount
% of Total
Amount
%
United American
$
77,666
37
$
50,180
29
$
27,486
55
Family Heritage
89,440
43
78,862
46
10,578
13
Liberty National
23,862
12
24,091
14
(229)
(1)
American Income
14,242
7
15,952
9
(1,710)
(11)
Direct to Consumer
2,176
1
2,306
2
(130)
(6)
Total
$
207,386
100
$
171,391
100
$
35,995
21
Health net sales related to limited-benefit supplemental health products comprise $155 million, or 75%, of the total health net sales for the nine months ended September 30, 2025, compared with $130 million, or 76%, in the same period in the prior year. Medicare Supplement sales make up the remaining $52 million, or 25%, for 2025 compared to $41 million, or 24%, in the same period in the prior year.
The following table presents health insurance first-year collected premium by distribution channel.
Health Insurance
First-Year Collected Premium by Distribution Channel
(Dollar amounts in thousands)
Nine Months Ended September 30,
Increase (Decrease)
2025
2024
Amount
% of Total
Amount
% of Total
Amount
%
United American
$
66,863
39
$
66,944
40
$
(81)
—
Family Heritage
66,954
39
58,878
36
8,076
14
Liberty National
20,900
12
21,272
13
(372)
(2)
American Income
14,386
8
14,740
9
(354)
(2)
Direct to Consumer
3,551
2
2,891
2
660
23
Total
$
172,654
100
$
164,725
100
$
7,929
5
First-year collected premium related to limited-benefit supplemental health products is $118.3 million, or 69%, of total first-year collected premium for the nine months ended September 30, 2025 compared with $118.6 million, or 72%, in the same period in the prior year. First-year collected premium from Medicare Supplement policies make up the remaining $54.4 million, or 31%, for the nine months ended September 30, 2025 compared to $46.1 million, or 28%, in the same period in the prior year.
A discussion of health operations by distribution channel follows.
The United American Division consists of non-exclusive independent agencies who may also sell for other companies. The United American Division was Globe Life's largest health agency in terms of health premium income, with net sales up 55% from the same period in the prior year.
This Division includes different units:
•UA General Agency, which primarily sells individual Medicare Supplement insurance through independent agents;
•Special Markets, which markets retiree health insurance to employer and union groups through brokers; and
•Globe Life Group Benefits, which offers group worksite supplemental health insurance through brokers.
The majority of the premium revenue comes from Medicare Supplement. Underwriting margin as a percent of premium for the Division was 6% for the nine months ended September 30, 2025 and 10% for the same period in 2024. The decline in underwriting margin as a percent of premium when compared to prior year is primarily attributable to increased claims utilization during the current year from Medicare Supplement. We adjust premium rates based upon an annual review of utilization and claim cost trends and submit revisions for approval to the insurance department regulators and the new premium rates generally become effective in the following year.
The Family Heritage Division is an exclusive agency that primarily markets individual limited-benefit supplemental health insurance to small- to medium-sized businesses. Most of its policies include a return of premium feature, where premium paid is returned less any claims paid to the policyholder at the end of a specified period stated within the insurance policy. Underwriting margin as a percent of premium was 38% for the nine months ended September 30, 2025 and 34% for the same period in the prior year.
The Division experienced a 13% rise in health net sales as compared with the same nine-month period a year ago, primarily due to increased agent count and increased agent productivity. The Division will continue to implement incentive and retention programs to further these increases in the number of producing agents.
Below is the average producing agent count at the end of the period for the Family Heritage Division. The average producing agent count is based on the actual count at the beginning and end of each week during the year. The average producing agent count increased 9% compared with the same period a year ago. Along with the Division's increased efforts to grow agent count, it is also focused on the further training and development of its agency middle management. While growth in net sales and earned premium is impacted by agent productivity, growth in the number of producing agents will be the primary driver of future growth in sales, similar to our other exclusive agencies.
At September 30,
Change
2025
2024
Amount
%
Family Heritage
1,489
1,362
127
9
The Liberty National Division represented 13% of all Globe Life health premium income for the nine months ended September 30, 2025. The Liberty National Division markets limited-benefit supplemental health products, consisting primarily of cancer, critical illness, and accident insurance. Much of Liberty National's health business is generated through worksite marketing targeting small businesses. Health premium at the Liberty National Division was $142.8 million for the nine months ended September 30, 2025 up slightly from $142.6 million for the same period in 2024. Liberty National's first-year collected premium fell 2% to $20.9 million in the nine months ended September 30, 2025 compared with $21.3 million for the same period in 2024. Health net sales for the nine months ended September 30, 2025 fell 1% from the comparable period in 2024. For the nine months ended September 30, 2025, underwriting margin as a percent of premium was 53%, compared with 56% in the same period in the prior year primarily due to an increase in policy obligations in the current period.
While both the American Income Life Division and the Direct to Consumer Division sell life insurance, they also market health products. The American Income Life Division primarily markets accident plans. The Direct to Consumer Division primarily markets Medicare Supplement insurance to employer or union-sponsored groups. On a combined basis, these other channels accounted for 13% of health premium for the nine months ended September 30, 2025 and 14% for the same period in 2024.
INVESTMENTS
We manage our capital resources, including investments and cash flow, through the investment segment. Excess investment income represents the profit margin attributable to investment operations and is the measure that we use to evaluate the performance of the investment segment as described in Note 12—Business Segments. It is defined as net investment income less the required interest attributable to policy liabilities.
Management views excess investment income per diluted common share as an important and useful measure to evaluate the performance of the investment segment. It is defined as excess investment income divided by the total diluted weighted-average shares outstanding, representing the contribution by the investment segment to the consolidated earnings per share of the Company.
Excess Investment Income. The following table summarizes Globe Life's investment income, excess investment income, and excess investment income per diluted common share.
Analysis of Excess Investment Income
(Dollar amounts in thousands, except for per share data)
Nine Months Ended September 30,
Change
2025
2024
Amount
%
Net investment income
$
848,796
$
853,178
$
(4,382)
(1)
Interest on policy liabilities(1)
(741,215)
(727,099)
(14,116)
2
Excess investment income
$
107,581
$
126,079
$
(18,498)
(15)
Excess investment income per diluted share
$
1.29
$
1.38
$
(0.09)
(7)
Mean invested assets (at amortized cost)
$
21,507,145
$
21,359,702
$
147,443
1
Average insurance policy liabilities
17,807,273
17,501,496
305,777
2
(1)Interest on policy liabilities, at original rates, is a component of total policyholder benefits, a GAAP measure.
Excess investment income declined $18 million, or 15%, compared with the year-ago period. Excess investment income per diluted common share was $1.29 for the nine months ended September 30, 2025, a decrease of 7% from the prior-year period. Excess investment income per diluted common share generally increases or decreases at a different pace than excess investment income because the number of diluted shares outstanding generally decreases from year to year as a result of our share repurchase program.
Net investment income for the nine months ended September 30, 2025 was $849 million, or 1% less than the year-ago period. Mean invested assets increased 1% during the first nine months of 2025 over the same period last year. Net investment income declined in the current period due to low growth in invested assets as a result of the impact of reinsurance transactions as well as higher dividend distributions from the insurance companies to the Parent. In addition, the Company reported lower earned yields on short-term investments, commercial mortgage loans and limited partnerships compared to the prior year. The effective annual yield rate earned on the fixed maturity portfolio was 5.27% in the first nine months of 2025, compared to 5.26% a year earlier. In addition to fixed maturities, the Company has also invested in commercial mortgage loans and limited partnerships with debt-like characteristics that diversify risk and enhance risk-adjusted, capital-adjusted returns on the portfolio. The earned yield on the Company's commercial mortgage loans for the nine months ended September 30, 2025 was 6.11% compared with 8.47% in the prior year period. The lower earned yield on commercial mortgage loans is partly due to lower floating rates in addition to loans in non-accrual status. The earned yield on limited partnership investments for the nine months ended September 30, 2025 was 7.99% and 8.64% in the comparable prior-year period. See additional information in Note 4—Investments.
Globe Life's net investment income benefits from higher interest rates on new investments. While increasing interest rates have resulted in a net unrealized loss from our available-for-sale debt securities included in accumulated other comprehensive income (loss) as of September 30, 2025, we are not concerned because we do not generally intend to sell, nor is it likely that we will be required to sell, the fixed maturities prior to their anticipated recovery.
Required interest on insurance policy liabilities reduces excess investment income, as it is the amount of net investment income necessary to cover the interest-related growth on insurance policy liabilities. As such, it is reclassified from the insurance segment to the investment segment. As discussed in Note 12—Business Segments, management regards this as a more meaningful analysis of the investment and insurance segments. Required interest is based on the original discount rate assumptions for our insurance policies in force.
The vast majority of our life and health insurance policies are fixed interest rate protection policies, not investment products, and are accounted for under current GAAP accounting guidance for long-duration insurance products which mandates that interest rate assumptions for a particular block of business be “locked in” for the life of that block of business. Each calendar year, we set the original discount rate to be used to calculate the benefit reserve liability for all insurance policies issued that year. The liability reported on the balance sheet is updated in
subsequent periods using current discount rates as of the end of the relevant reporting period with a corresponding adjustment to other comprehensive income.
The discount rate used for policies issued in the current year has no impact on the in force policies issued in prior years, as the rates of all prior issue years are also locked in for purposes of recognizing income. As such, the overall original discount rate for the entire in force block of 5.5% is a weighted average of the discount rates being used from all issue years. Changes in the overall weighted-average discount rate over time are caused by changes in the mix of the reserves on the entire block of in force business. Business issued in the current year has little impact on the overall weighted-average original discount rate due to the size of our in force business.
In comparison to the year-ago period, required interest on insurance policy liabilities increased $14 million, or 2%, to $741 million, consistent with the 2% growth in average interest-bearing insurance policy liabilities.
Realized Gains and Losses.Our life and health insurance companies collect premium income from policyholders for the eventual payment of policyholder benefits, sometimes paid for many years or even decades in the future. Since benefits are expected to be paid in future periods, premium receipts in excess of current expenses are invested to provide for these obligations. For this reason, we hold a significant investment portfolio as a part of our core insurance operations. This portfolio consists primarily of high-quality fixed maturities containing an adequate yield to provide for the cost of carrying these long-term insurance product obligations. As a result, fixed maturities are generally held for long periods to support these obligations. Expected yields on these investments are taken into account when setting insurance premium rates and product profitability expectations.
Despite our intent to hold fixed maturity investments for a long period of time, investments are occasionally sold, exchanged, called, or experience a credit loss event, resulting in a realized gain or loss. Gains or losses are only secondary to our core insurance operations of providing insurance coverage to policyholders. The Company also has investments in certain limited partnerships, held under the fair value option, with fair value changes recognized in Realized gains (losses) in the Condensed Consolidated Statements of Operations.
Realized gains and losses can be significant in relation to the earnings from core insurance operations, and as a result, can have a material positive or negative impact on net income. The significant fluctuations caused by gains and losses can cause period-to-period trends of net income that are not indicative of historical core operating results or predictive of the future trends of core operations. Accordingly, they have no bearing on core insurance operations or segment results as we view operations. For these reasons, and in line with industry practice, we remove the effects of realized gains and losses when evaluating overall insurance operating results.
The following table summarizes our tax-effected realized gains (losses) by component.
Analysis of Realized Gains (Losses), Net of Tax
(Dollar amounts in thousands, except for per share data)
Nine Months Ended September 30,
2025
2024
Amount
Per Share
Amount
Per Share
Fixed maturities:
Sales
$
(9,670)
$
(0.12)
$
(7,693)
$
(0.08)
Matured or other redemptions(1)
(9,080)
(0.11)
17
—
Provision for credit losses
(17)
—
(13)
—
Fair value option—change in fair value
(116)
—
(17,994)
(0.20)
Mortgages
(3,333)
(0.04)
(2,788)
(0.03)
Other investments
(1,953)
(0.02)
897
0.01
Total realized gains (losses)—investments
(24,169)
(0.29)
(27,574)
(0.30)
Other gains (losses)(2)
5,623
0.07
6,576
0.07
Total realized gains (losses)
$
(18,546)
$
(0.22)
$
(20,998)
$
(0.23)
(1)During the nine months ended September 30, 2025 and 2024, the Company recorded $128.5 million and $82.2 million, respectively, of exchanges of fixed maturity securities (noncash transactions) that resulted in a realized losses of $(2.3) million and $0 net of tax, respectively.
(2)Other realized gains (losses) are primarily a result of changes in the fair value for assets held in rabbi trust.
Investment Acquisitions. Globe Life's investment policy calls for investing primarily in investment grade fixed maturities that meet our quality and yield objectives. We generally invest in securities with longer-term maturities because they more closely match the long-term nature of our life and health policy liabilities. We believe this strategy is appropriate since our expected future cash flows are generally stable and predictable and the likelihood that we will need to sell invested assets to raise cash is low.
The following table summarizes selected information for fixed maturity investments. The effective annual yield shown is based on the acquisition price and call features, if any, of the securities. For non-callable bonds, the yield is calculated to maturity date. For callable bonds acquired at a premium, the yield is calculated to the earliest known call date and call price after acquisition ("first call date"). For all other callable bonds, the yield is calculated to maturity date.
Fixed Maturity Acquisitions Selected Information
(Dollar amounts in thousands)
Nine Months Ended September 30,
2025
2024
Cost of acquisitions:
Investment-grade corporate securities
$
617,929
$
967,372
Investment-grade municipal securities
113,496
11,231
Other securities
56,005
26,062
Total fixed maturity acquisitions(1)
$
787,430
$
1,004,665
Effective annual yield (one year compounded)(2)
6.39
%
5.96
%
Average life (in years, to next call)
30.8
29.9
Average life (in years, to maturity)
35.1
32.7
Average rating
A
A-
(1)Fixed maturity acquisitions included unsettled trades of $15 million in 2025 and $4 million in 2024.
(2)Tax-equivalent basis, where the yield on tax-exempt securities is adjusted to produce a yield equivalent to the pretax yield on taxable securities.
For investments in callable bonds, the actual life of the investment will depend on whether the issuer calls the investment prior to the maturity date. Given our investments in callable bonds, the actual average life of our investments cannot be known at the time of the investment. Absent sales and "make-whole calls," however, the average life will not be less than the average life to next call and will not exceed the average life to maturity. Data for both of these average life measures is provided in the above chart.
Acquisitions in 2025 and 2024 consisted primarily of corporate and municipal bonds with securities spanning a diversified range of issuers, industry sectors, and geographical regions. In the first nine months of 2025, we invested primarily in the industrial, financial, and utility sectors. For the entire portfolio, the taxable equivalent effective yield earned was 5.27%, up approximately 1 basis point from the yield in the first nine months of 2024. The increase in taxable equivalent effective yield was primarily due to new purchases at yields exceeding the yield on dispositions and the average portfolio yield. For the remainder of 2025, the Company will continue to execute on its existing strategy by seeking to invest in assets that satisfy our quality and other objectives, while maximizing the highest risk-adjusted, capital-adjusted return.
In addition to the fixed maturity acquisitions, Globe Life invested in commercial mortgage loans and in other long-term investments. Other long-term investments primarily consist of investment funds. See Note—4 Investments for further discussion.
The following table summarizes Globe Life's other investment acquisitions of the following assets.
Other Investment Acquisitions
(Dollar amounts in thousands)
Nine Months Ended September 30,
2025
2024
Limited partnerships
$
86,959
$
226,448
Commercial mortgage loans
118,722
134,667
Common stock
2,596
17,788
Convertible notes
—
2,850
Company-owned life insurance
—
200,000
Total
$
208,277
$
581,753
Since fixed maturities represent such a significant portion of our investment portfolio, 88% of total amortized cost net of allowance for credit losses at September 30, 2025, the remainder of the discussion of portfolio composition will focus on fixed maturities. Selected information concerning the fixed maturity portfolio is as follows:
Fixed Maturity Portfolio Selected Information
At
September 30, 2025
December 31, 2024
September 30, 2024
Average annual effective yield(1)
5.28%
5.25%
5.24%
Average life, in years, to:
Next call(2)
15.3
15.1
14.9
Maturity(2)
19.5
19.3
19.0
Effective duration to:
Next call(2,3)
8.8
8.8
9.1
Maturity(2,3)
10.6
10.6
10.9
(1)Tax-equivalent basis. The yield on tax-exempt securities is adjusted to produce a yield equivalent to the pretax yield on taxable securities.
(2)Globe Life calculates the average life and duration of the fixed maturity portfolio two ways:
(a) based on the next call date which is the next call date for callable bonds and the maturity date for non-callable bonds; and
(b) based on the maturity date of all bonds, whether callable or not.
(3)Effective duration is a measure of the price sensitivity of a fixed-income security to a 1% change in interest rates.
Credit Risk Sensitivity. The following tables summarize certain information about the major corporate sectors and security types held in our fixed maturity portfolio at September 30, 2025 and December 31, 2024.
Fixed Maturities by Sector
September 30, 2025
(Dollar amounts in thousands)
Below Investment Grade
Total Fixed Maturities
% of Total
Fixed Maturities
Amortized Cost, net
Gross Unrealized Gains
Gross Unrealized Losses
Fair Value
Amortized Cost, net
Gross Unrealized Gains
Gross Unrealized Losses
Fair Value
At Amortized Cost, net
At Fair Value
Corporates:
Financial
Insurance - life, health, P&C
$
7,989
$
116
$
—
$
8,105
$
2,905,046
$
88,349
$
(161,472)
$
2,831,923
15
16
Banks
60,306
565
(3,066)
57,805
933,166
32,968
(36,508)
929,626
5
5
Other financial
74,974
—
(12,412)
62,562
1,180,392
25,546
(120,880)
1,085,058
6
6
Total financial
143,269
681
(15,478)
128,472
5,018,604
146,863
(318,860)
4,846,607
26
27
Industrial
Energy
44,521
22
(3,224)
41,319
1,319,445
52,817
(58,254)
1,314,008
7
7
Basic materials
—
—
—
—
1,136,724
34,181
(76,247)
1,094,658
6
6
Consumer, non-cyclical
—
—
—
—
2,156,862
26,117
(191,371)
1,991,608
12
11
Other industrials
25,000
—
(4,595)
20,405
1,100,678
30,405
(74,613)
1,056,470
6
6
Communications
2,722
293
—
3,015
801,936
20,071
(70,652)
751,355
4
4
Transportation
—
—
—
—
615,839
18,112
(29,520)
604,431
3
4
Consumer, cyclical
106,455
114
(17,671)
88,898
411,222
6,510
(43,606)
374,126
2
2
Technology
50,272
3,326
—
53,598
342,053
4,958
(57,572)
289,439
2
2
Total industrial
228,970
3,755
(25,490)
207,235
7,884,759
193,171
(601,835)
7,476,095
42
42
Utilities
58,197
32
(4,891)
53,338
2,100,517
78,904
(87,347)
2,092,074
11
12
Total corporates
430,436
4,468
(45,859)
389,045
15,003,880
418,938
(1,008,042)
14,414,776
79
81
States, municipalities, and political divisions:
General obligations
—
—
—
—
914,956
5,436
(188,757)
731,635
5
4
Revenues
—
—
—
—
2,475,168
23,323
(356,972)
2,141,519
13
12
Total states, municipalities, and political divisions
Corporate securities, which consist of bonds and redeemable preferred stocks, were the largest component of the fixed-maturity portfolio as of September 30, 2025, representing 79% of amortized cost, net, and 81% of fair value. The remainder of the portfolio is invested primarily in securities issued by the U.S. government and U.S. municipalities. The Company holds insignificant amounts in foreign government bonds, asset-backed securities, and mortgage-backed securities. Corporate securities are diversified over a variety of industry sectors and issuers. At September 30, 2025, the total fixed maturity portfolio consisted of 1,012 issuers.
Fixed maturities had a fair value of $17.8 billion at September 30, 2025, compared to $17.2 billion at December 31, 2024. The net unrealized loss position in the fixed-maturity portfolio decreased from $1.7 billion at December 31, 2024 to $1.1 billion at September 30, 2025 due to a change in market rates during the period.
For more information about our fixed-maturity portfolio by component at September 30, 2025 and December 31, 2024, including a discussion of allowance for credit losses, an analysis of unrealized investment losses, and a schedule of maturities, see Note 4—Investments.
An analysis of the fixed-maturity portfolio by composite quality rating at September 30, 2025 and December 31, 2024, is shown in the following tables. The company uses the NAIC designation for credit quality ratings. The NAIC designation is generally determined using the second lowest rating available from nationally recognized statistical rating organizations (“NRSRO”) when three or more ratings are available and the lowest rating when two or fewer rating are available. When NRSRO ratings are unavailable the rating may be assigned by the Securities Valuation Office (“SVO”) of the NAIC.
Fixed Maturities by Rating
At September 30, 2025
(Dollar amounts in thousands)
Amortized Cost, net
% of Total
Fair Value
% of Total
Average Composite Quality Rating on Amortized Cost, net
Average Composite Quality Rating on Amortized Cost
Investment grade:
AAA
$
968,220
5
$
855,165
5
AA
3,225,044
17
2,691,908
15
A
5,508,446
29
5,147,203
30
BBB+
3,267,101
17
3,040,313
18
BBB
4,087,323
22
3,799,696
22
BBB-
1,240,160
7
1,159,042
7
Total investment grade
18,296,294
97
16,693,327
97
A-
Below investment grade:
BB
397,823
2
349,028
2
B
92,176
1
67,593
1
Below B
39,121
—
45,064
—
Total below investment grade
529,120
3
461,685
3
BB-
$
18,825,414
100
$
17,155,012
100
Weighted average composite quality rating
A-
The overall quality rating of the portfolio is A-, the same as of year-end 2024. Fixed maturities rated BBB are 43% of the total portfolio at September 30, 2025, down from 46% at December 31, 2024. While this ratio is high relative to our peers, it is at its lowest level since 2006 and we have limited exposure to higher-risk assets such as derivatives, equities, and asset-backed securities. Additionally, the Company does not participate in securities lending and has no off-balance sheet investments as of September 30, 2025. Of our fixed maturity purchases, BBB securities generally provide the Company with the best risk-adjusted, capital-adjusted returns largely due to our ability to hold securities to maturity regardless of fluctuations in interest rates or equity markets.
An analysis of changes in our portfolio of below-investment grade fixed maturities at amortized cost, net of allowance for credit losses is as follows:
Our investment policy calls for investing primarily in fixed maturities that are investment grade and meet our quality and yield objectives. Thus, the balance of below-investment grade issues is primarily the result of ratings downgrades of existing holdings. Below-investment grade bonds at amortized cost, net of allowance for credit losses, were 2% of total fixed maturities at amortized cost as of September 30, 2025.
OPERATING EXPENSES
Operating expenses are classified into two categories: insurance administrative expenses and expenses of the Parent Company. Insurance administrative expenses generally include expenses incurred after a policy has been issued. As these expenses relate to premium for a given period, management measures the expenses as a percentage of premium income. The Company also views stock-based compensation expense as a Parent Company expense. Expenses associated with the issuance of our insurance policies are reflected as acquisition expenses and included in the determination of underwriting margin.
Total operating expenses for September 30, 2025 increased in comparison with the prior year primarily due to increases in insurance administrative expenses as well as stock compensation and legal proceedings. Insurance administrative expenses increased $12 million primarily due to higher employee costs, which include salaries and other costs. Insurance administrative expenses as a percent of premium were 7.2% for the nine months ended September 30, 2025 compared to 7.2% for the same period in 2024. Stock compensation expense increased primarily due to changes in the mix of awards and increase in award values.
Globe Life has an ongoing share repurchase program that began in 1986. The share repurchase program is reviewed with the Board of Directors quarterly, and continues indefinitely unless and until the Board of Directors decides to suspend, terminate or modify the program. On November 18, 2024, the Board of Directors authorized the repurchase of up to $1.8 billion under the Company's existing share repurchase program. Management generally determines the amount of repurchases based on the amount of excess cash flows and other available sources after the payment of dividends to the Parent Company shareholders, general market conditions, and other alternative uses. At September 30, 2025, we had slightly more than $1.2 billion remaining under the authorization to repurchase. Since implementing our share repurchase program in 1986, we have used $10.8 billion to repurchase Globe Life Inc. common shares, after determining that the repurchases provide a greater risk-adjusted after-tax return than other investment alternatives.
Excess cash flow at the Parent Company is primarily comprised of dividends received from the insurance subsidiaries less interest expense paid on its debt and other limited operating activities. Additionally, when stock options are exercised, proceeds from these exercises and the resulting tax benefit are used to repurchase additional shares on the open market to minimize dilution as a result of the option exercises.
The following table summarizes share repurchases for the nine month periods ended September 30, 2025 and 2024.
Analysis of Share Repurchases
(Amounts in thousands, except per share data)
Nine Months Ended September 30,
2025
2024
Purchases with:
Shares
Amount
Average Price
Shares
Amount
Average Price
Excess cash flow at the Parent Company(1)
4,157
$
515,340
$
123.97
9,748
$
910,040
$
93.36
Option exercise proceeds
1,316
168,818
128.34
348
31,454
90.30
Total
5,473
$
684,158
$
125.02
10,096
$
941,494
$
93.25
(1)Excludes excise tax on the repurchase of treasury stock of $4.6 million and $9.0 million for the nine months ended September 30, 2025 and 2024, respectively.
FINANCIAL CONDITION
Liquidity. Liquidity provides Globe Life with the ability to meet on demand the cash commitments required to support our business operations and meet our financial obligations. Our liquidity is primarily derived from multiple sources: positive cash flow from operations, a portfolio of marketable securities, a revolving credit facility, commercial paper, and advances from the Federal Home Loan Bank.
Insurance Subsidiary Liquidity. The operations of our insurance subsidiaries have historically generated substantial cash inflows in excess of immediate cash needs. Cash inflows for the insurance subsidiaries primarily include premium and investment income. In addition to investment income, maturities and scheduled repayments in the investment portfolio are cash inflows. Cash outflows from operations include policy benefit payments, commissions, administrative expenses, and taxes. A portion of cash inflows in the current year will provide for the payment of future policy benefits and are invested primarily in long-term fixed maturities as they better match the long-term nature of these obligations. The subsidiary dividends are generally paid in amounts equal to the subsidiaries’ prior year statutory net income excluding realized capital gains. While the insurance subsidiaries annually generate more operating cash inflows than cash outflows, the companies also have the entire available-for-sale fixed-maturity investment portfolio available to create additional cash flows if required.
Four of our insurance subsidiaries are members of the FHLB of Dallas. FHLB membership provides the insurance subsidiaries with access to various low-cost collateralized borrowings and funding agreements. While not the only
source of liquidity, the FHLB could provide the insurance subsidiaries with an additional source of liquidity, if needed. Refer to Note 11—Debt for further details.
Parent Company Liquidity. An important source of Parent Company liquidity is the dividends from its insurance subsidiaries. These dividends are received throughout the year and are used by the Parent Company to pay dividends on common and preferred stock, interest and principal repayment requirements on Parent Company debt, and operating expenses of the Parent Company.
Nine Months Ended September 30,
Twelve Months Ended December 31,
2025
2024
Projected 2025
2024
Liquidity Sources:
Dividends from Subsidiaries
$
482,091
$
451,416
$780,000—$830,000
$
692,690
Excess Cash Flows(1)
$
590,006
$
412,626
$860,000—$920,000
$
455,013
(1)Excess cash flows are reported gross of shareholder dividends. For the nine months ended September 30, 2025 and 2024, shareholder dividends were $64 million and $65 million, respectively. For the twelve months ended December 31, 2025, we project approximately $85 million in shareholder dividends, compared to the $85 million paid in 2024.
Dividends from subsidiaries and excess cash flows are projected to be higher in 2025 than in 2024 primarily due to improved earnings from favorable mortality trends and growth in business, as well as positive impacts from lower reserve increases under statutory accounting impacting the 2024 statutory earnings that derive the 2025 dividends. The excess cash flows in 2025 include the extraordinary dividends approved in the latter part of 2024 of $192 million. Additional sources of liquidity for the Parent Company are cash, intercompany receivables, intercompany borrowings, debt markets, term loans, and a revolving credit facility.
On July 1, 2025, we entered into a 30-year facility agreement (“Facility Agreement”) with a Delaware Trust (the “Trust”) formed by us in connection with the sale by the trust of $500 million pre-capitalized trust securities redeemable May 15, 2055 in a Rule 144A private placement. The Trust invested the proceeds from the sale of its securities in a portfolio of principal and interest strips of U.S. Treasury securities (the “Strips”).
The Facility Agreement provides us with the right to sell at any time to the Trust up to $500 million of our 6.580% Senior Notes due 2055 (the “6.580% Senior Notes”) in exchange for a corresponding amount of the Strips held by the Trust (the “Issuance Right”). We agreed to pay a semi-annual facility fee of 1.789% per annum on the unexercised portion of the Issuance
The Issuance Right will be exercised automatically in full upon (i) our failure to pay the facility fee or to purchase any Strips required to be purchased under the Facility, if the failure to pay is not cured within 30 days, or (ii) certain bankruptcy events involving the Company. We are also required to exercise the Issuance Right in full if our consolidated stockholders’ equity (excluding AOCI) falls below $1.85 billion, subject to certain adjustments.
The Company can redeem the 6.580% Senior Notes at any time, in whole or in part, at a price equal to the greater of par or a make-whole redemption price. At September 30, 2025, the Company had no senior note issuances under the Facility Agreement.
Short-Term Borrowings. An additional source of Parent Company liquidity is a credit facility with a group of lenders. The facility was amended on March 29, 2024, resulting in an increased capacity of $250 million. The facility allows for unsecured borrowings and stand-by letters of credit up to $1 billion, which could be increased up to $1.25 billion. While the Parent Company may request the increase, it is not guaranteed. The updated five-year credit agreement will mature on March 29, 2029. Up to $250 million in letters of credit can be issued against the facility. The facility serves as a backup line of credit for a commercial paper program under which commercial paper may be issued at any time, with total commercial paper outstanding not to exceed the facility maximum less any letters of credit issued. Interest charged on the commercial paper program resembles variable rate debt due to its short term nature.
As of September 30, 2025, we had available $554 million of additional borrowing capacity under this facility, compared to $458 million a year earlier. As of September 30, 2025, the Parent Company was in full compliance with all covenants related to the aforementioned debt.
As a part of the credit facility, Globe Life has stand-by letters of credits. These letters of credit are issued on behalf of our insurance subsidiaries.
The following tables present certain information about our commercial paper borrowings.
Credit Facility—Commercial Paper
(Dollar amounts in thousands)
At
September 30, 2025
December 31, 2024
September 30, 2024
Balance of commercial paper at end of period (par value)
$
331,000
$
419,000
$
426,908
Annualized interest rate
4.60
%
5.22
%
5.56
%
Letters of credit outstanding
$
115,000
$
115,000
$
115,000
Remaining amount available under credit line
554,000
466,000
458,092
Credit Facility—Commercial Paper Activity
(Dollar amounts in thousands)
Nine Months Ended September 30,
2025
2024
Average balance of commercial paper outstanding during period (par value)
$
430,732
$
375,851
Daily-weighted average interest rate (annualized)
4.90
%
5.80
%
Maximum daily amount outstanding during period (par value)
$
605,500
$
633,425
The Company reduced commercial paper borrowings by $88 million since year end. The Company was able to issue commercial paper as needed under this facility during the nine months ended September 30, 2025 and 2024.
Globe Life expects to have readily available funds for 2025 and the foreseeable future to conduct its operations and to maintain target capital ratios in the insurance subsidiaries through liquid assets currently available, internally-generated cash flow and the credit facility. In the event more liquidity is needed, the Parent Company could generate additional funds through multiple sources including, but not limited to, the issuance of debt, an additional short-term credit facility or term loan, and intercompany borrowing.
Consolidated Liquidity. Consolidated net cash inflows from operations were $1.05 billion in the first nine months of 2025, compared with $1.07 billion in the same period of 2024. The decrease is attributable to routine fluctuations in the settlement of operating activities. In addition to cash inflows from operations, our insurance companies received proceeds from dispositions of fixed maturities available for sale, mortgage loans, and other long-term investments in the amount of $776 million during the first nine months of 2025. The Parent Company has in place a revolving credit facility and a P-CAPS facility. See Note 11—Debt for further details. The insurance companies have no additional outstanding credit facilities.
Cash and short-term investments were $366 million at September 30, 2025, compared with $250 million at December 31, 2024. In addition to these liquid assets, $18 billion (fair value at September 30, 2025) of fixed income securities are available for sale in the event of an unexpected need. Approximately $1.3 billion, at fair value, are pledged for outstanding FHLB advances and reinsurance. Further, approximately 98% of our fixed income securities are publicly traded, freely tradable under SEC Rule 144, or qualified for resale under SEC Rule 144A. While our fixed income securities are classified as available for sale, we have the ability and general intent to hold any securities to recovery or maturity. Our strong cash flows from operations, on-going investment maturities, and available liquidity under our credit facility make any need to sell securities for liquidity highly unlikely.
Capital Resources.The Parent Company's capital structure consists of short-term debt (the commercial paper facility and current maturities of long-term debt), long-term debt, and shareholders’ equity. It does not include short-
term FHLB borrowings, which are obligations of the insurance subsidiaries and typically repaid over the course of the year.
Long-Term Borrowings. At September 30, 2025, the outstanding long-term debt at book value was $2.3 billion unchanged from December 31, 2024.
Selected Information about Debt Issues
As of September 30, 2025
(Dollar amounts in thousands)
Instrument
Issue Date
Maturity Date
Coupon Rate
Interest Payment Dates
Par Value
Book Value
Fair Value
Senior notes
09/27/2018
09/15/2028
4.550%
semiannual
$
550,000
$
547,561
$
554,846
Senior notes
08/21/2020
08/15/2030
2.150%
semiannual
400,000
397,486
359,436
Senior notes(1)
05/19/2022
06/15/2032
4.800%
semiannual
250,000
246,587
251,192
Senior notes
08/23/2024
09/15/2034
5.850%
semiannual
450,000
445,117
472,325
Junior subordinated debentures
11/17/2017
11/17/2057
5.275%
semiannual
125,000
123,457
100,389
Junior subordinated debentures
06/14/2021
06/15/2061
4.250%
quarterly
325,000
317,451
215,800
Term loan(2)
05/11/2023
08/15/2027
5.670%
quarterly
250,000
248,700
248,700
Subtotal
2,350,000
2,326,359
2,202,688
Unamortized issuance costs(3)
—
(6,346)
(6,346)
Total long-term debt
2,350,000
2,320,013
2,196,342
FHLB borrowings
65,000
65,000
65,000
Commercial paper
331,000
329,349
329,349
Total short-term debt
396,000
394,349
394,349
Total debt
$
2,746,000
$
2,714,362
$
2,590,691
(1)An additional $150 million par value and book value is held by insurance subsidiaries that eliminates in consolidation.
(2)Interest calculated quarterly using Secured Overnight Financing Rate (SOFR) plus 135 basis points. The term loan was amended on August 15, 2024 extending the maturity date from November 11, 2024 to August 15, 2027 and increasing the principal amount from $170 million to $250 million.
(3)Unamortized issuance costs for P-CAPS facility agreement.
Financing costs consist primarily of interest on our various debt instruments. The table below presents the components of financing costs and reconciles interest expense per the Condensed Consolidated Statements of Operations.
Analysis of Financing Costs
(Dollar amounts in thousands)
Nine Months Ended September 30,
Increase (Decrease)
2025
2024
Amount
%
Interest on funded debt
$
70,805
$
53,633
$
17,172
32
Interest on term loans
11,520
9,646
1,874
19
Interest on short-term debt
21,335
28,115
(6,780)
(24)
Other
2,351
19
2,332
Financing costs
$
106,011
$
91,413
$
14,598
16
During the first nine months of 2025, financing costs increased 16% compared to the prior year. The increase in financing costs is primarily due to higher average balances in the current year compared to the prior year due to the
issuance of debt in the third quarter of 2024. Other financing costs increased due to the P-CAPS facility fee. More information on our debt transactions is disclosed in the Financial Condition section of this report.
Subsidiary Capital: The National Association of Insurance Commissioners (NAIC) has established a risk-based factor approach for determining threshold risk-based capital levels for all insurance companies. This approach was designed to assist the regulatory bodies in identifying companies that may require regulatory attention. A Risk-Based Capital (RBC) ratio is typically determined by dividing adjusted total statutory capital by the amount of RBC determined using the NAIC’s factors. If a company’s RBC ratio approaches two times the RBC amount, the company must file a plan with the NAIC for improving its capital levels (this level is commonly referred to as “Company Action Level” RBC). Companies typically hold a multiple of the Company Action Level RBC depending on their particular business needs and risk profile.
Our goal is to maintain statutory capital within our insurance subsidiaries at levels necessary to support our current ratings. For 2025, Globe Life has targeted a consolidated Company Action Level RBC ratio of 300% to 320%. The Company has concluded that this capital level is more than adequate and sufficient to support its current ratings, given the nature of its business and its risk profile. For 2024, our consolidated Company Action Level RBC ratio was 316%. The Parent Company is committed to maintaining the targeted consolidated RBC ratio at its insurance subsidiaries and has sufficient liquidity available to provide additional capital if necessary.
Shareholders' Equity: Shareholders’ equity was $5.7 billion at September 30, 2025. This compares with $5.3 billion at December 31, 2024 and $4.6 billion at September 30, 2024. During the nine months since December 31, 2024, shareholders’ equity increased as a result of net income of $895 million during the first nine months of 2025, but was offset by share repurchases of $515 million and an additional $169 million in share repurchases to offset the dilution from stock option exercises. Additionally, the change in the balance of AOCI increased shareholders' equity $57 million primarily due to changes in interest rates and discount rates over the period.
On August 7, 2025, the Parent Company announced that it had declared a quarterly dividend of $0.27 per share. This dividend was paid on October 31, 2025.
We plan to use excess cash available at the Parent Company as efficiently as possible in the future. Excess cash flow, as we define it, results primarily from the dividends received by the Parent Company from its insurance subsidiaries less the interest paid on debt. The cash received by the Parent Company from our insurance subsidiaries is after they have made substantial investments during the year to grow the business. Possible uses of excess cash flow include, but are not limited to, share repurchases, acquisitions, shareholder dividend payments, investments in securities, or repayment of short-term debt. We will determine the best use of excess cash after ensuring that targeted capital levels are maintained in our insurance subsidiaries. If market conditions are favorable, we currently expect that share repurchases will continue to be a primary use of those funds.
Future policy benefits are computed using current discount rates with the impact of changes in discount rates included in accumulated other comprehensive income. Additionally, the liability for future policy benefits is calculated using net premiums rather than gross premiums. Given that gross premiums are considerably higher than net premiums for our business, as seen in Note 6—Policy Liabilities, the measurement of the liability is higher than what it would be had it been computed using gross premiums. This is an important consideration when analyzing shareholders' equity.
We maintain a significant available-for-sale fixed maturity portfolio to support our insurance policy liabilities. Current accounting guidance requires that we revalue our portfolio to fair market value at the end of each accounting period. The period-to-period changes in fair value, net of their associated impact on income tax, are reflected directly in shareholders’ equity. Changes in the fair value of the portfolio can result from changes in market rates.
While a majority of invested assets are revalued, accounting rules do not permit interest-bearing insurance policy liabilities to be valued at fair value in a consistent manner as that of assets, with changes in value applied directly to shareholders’ equity. Due to the size of our policy liabilities in relation to our shareholders’ equity, an inconsistency exists in measurement, which may have a material impact on the reported value of shareholders’ equity. Fluctuations in interest rates cause undue volatility in the period-to-period presentation of our shareholders’ equity, capital structure, and financial ratios. Due to the long-term nature of our fixed-maturity investments and liabilities
and the strong cash flows consistently generated by our insurance subsidiaries, we have the ability to hold our securities to maturity. As such, we do not expect to incur losses due to fluctuations in market value of fixed maturities caused by market rate changes and temporarily illiquid markets. Accordingly, our management, credit rating agencies, lenders, many industry analysts, and certain other financial statement users prefer to remove the effect of this accounting rule when analyzing our balance sheet, capital structure, and financial ratios.
Item 3. Quantitative and Qualitative Disclosures About Market Risk
There have been no quantitative or qualitative changes with respect to market risk exposure during the nine months ended September 30, 2025.
Item 4. Controls and Procedures
Evaluation of Disclosure Controls and Procedures: Globe Life Inc., under the direction of the Co-Chairmen and Chief Executive Officers and the Executive Vice President and Chief Financial Officer, has established disclosure controls and procedures that are designed to ensure that information required to be disclosed by Globe Life in the reports that it files or submits under the Securities Exchange Act of 1934 is recorded, processed, summarized and reported within the time periods specified in the SEC’s rules and forms. The disclosure controls and procedures are also intended to ensure that such information is accumulated and communicated to Globe Life's management, including the Co-Chairmen and Chief Executive Officers and the Executive Vice President and Chief Financial Officer, as appropriate to allow timely decisions regarding required disclosures.
As of the end of the fiscal period completed September 30, 2025, an evaluation was performed under the supervision and with the participation of Globe Life management, including the Co-Chairmen and Chief Executive Officers and the Executive Vice President and Chief Financial Officer, of the disclosure controls and procedures (as those terms are defined in Rule 13a-15(e) under the Securities Exchange Act of 1934). Based upon their evaluation, the Co-Chairmen and Chief Executive Officers and the Executive Vice President and Chief Financial Officer have concluded that disclosure controls and procedures are effective as of the date of this Form 10-Q. In compliance with Section 302 of the Sarbanes Oxley Act of 2002 (18 U.S.C. § 1350), each of these officers executed a Certification included as an exhibit to this Form 10-Q.
Changes in Internal Control over Financial Reporting: During the period ended September 30, 2025, there were no changes to Globe Life Inc.'s internal control over financial reporting or in other factors that could significantly affect the internal control over financial reporting subsequent to the date of their evaluation which have materially affected, or are reasonably likely to materially affect, internal control over financial reporting.
During the nine months ended September 30, 2025, none of our directors or officers adopted or terminated a Rule 10b5-1 trading arrangement or a Non-Rule 10b5-1 trading arrangement, as each term is defined under Item 408(a) of Regulation S-K.
XBRL Instance Document- the instance document does not appear in the Interactive Data file because the XBRL tags are embedded within the Inline XBRL document.
Pursuant to the requirements of the Securities Exchange Act of 1934, the registrant has duly caused this report to be signed on its behalf by the undersigned thereunto duly authorized.
GLOBE LIFE INC.
Date: November 5, 2025
/s/ J. Matthew Darden
J. Matthew Darden
Co-Chairman and Chief Executive Officer
Date: November 5, 2025
/s/ Frank M. Svoboda
Frank M. Svoboda
Co-Chairman and Chief Executive Officer
Date: November 5, 2025
/s/ Thomas P. Kalmbach
Thomas P. Kalmbach
Executive Vice President and Chief Financial Officer