Supreme Acquisition: Delivering on Our Strategic Plan August 9 , 2017 Dick Giromini, CEO Brent Yeagy, President & COO
2 No Offer or Solicitation The tender offer for Supreme Industries, Inc.’s outstanding common stock described in this presentation has not commenced, an d t his presentation is neither an offer to purchase nor a solicitation of an offer to sell shares of Supreme Industries, Inc.’s comm on stock. At the time the tender offer is commenced, Wabash National Corporation and Redhawk Acquisition Corporation will file a tender offer statement on Schedule TO and related materials (including an offer to purchase, a letter of transmittal and other offer documents) with th e U .S. Securities and Exchange Commission (SEC) and Supreme Industries, Inc. will file with the SEC a tender offer solicitation/ recommendation st atement on Schedule 14D - 9 with respect to the tender offer. INVESTORS AND SECURITY HOLDERS ARE URGED TO READ BOTH THE TENDER OFFER STATEMENT AND RELATED MATERIALS (INCLUDING THE OFFER TO PURCHASE AND THE LETTER OF TRANSMITTAL) AND THE SOLICITATION/RECOMMENDATION STATEMENT REGARDING THE TENDER OFFER WHEN THEY BECOME AVAILABLE BECAUSE THEY WILL CONTAIN IMPORTANT INFORMATION. These documents (once they become available) will be available to all stockholders of Supreme Industries, Inc. free of charge on the SEC’s web site at http://www.sec.gov. This presentation contains certain forward - looking statements as defined by the Private Securities Litigation Reform Act of 1995, inc luding statements about the Company’s proposed acquisition of Supreme Industries, Inc., the anticipated financial results for Surpeme , the timing and financing of the anticipated transaction and the potential benefits of the anticipated transaction, including that Wabash ex pects the transaction to be accretive to net income, to result in growth opportunities and to lead to cost, operations and purchasing power synergies. Forward - looking statements convey the Company’s current beliefs, expectations or forecasts of future events but are subject to a number of risks, uncertainties and changes in circumstances, which may cause actual results or actions to differ materially from what i s e xpressed or implied by these statements. All statements made in this presentation other than statements of historical fact are forward - looki ng statements. The factors that could cause actual future results to differ materially from current expectations include, but ar e n ot limited to, the satisfaction of conditions to closing the transaction, the ability to successfully integrate Supreme Industries, Inc. operations and programs with the Company’s and the time and resources required to do so, the uncertainties inherent in commercial, manufacturing and pro duction activities, decisions by regulatory authorities regarding whether and when to approve the transaction or any applications, un cer tainties inherent in the completion of the necessary financing agreements, slow or negative growth in each of the companies industries , c ompetitive developments, reliance on certain customers and corporate partnerships, shortages of raw materials, acceptance of new technol ogy and products, and government regulation. Listeners should review and consider the various disclosures made by the Company in thi s presentation, in the Company’s reports to its stockholders and periodic reports on Forms 10 - K and the risk factors discussed in the Company’s filings with the Securities and Exchange Commission. We cannot give assurance that the expectations reflected in our forward - l ooking statements will prove to be correct, and we undertake no obligations to update these statements. I MPORTANT I NFORMATION AND S AFE H ARBOR S TATEMENT © 201 7 Waba s h National, L.P . Al l ri g hts r e s e r v ed . Wabash®, Wabash National®, D uraPlat e ®, D uraPlate Ae ro Skir t®, Walker, Br enne r® a nd B e all® are marks o w ned by Wabash National, L.P. T ran s craft® an d B e nson® are m arks o w ned by T ran s craft Cor poration.
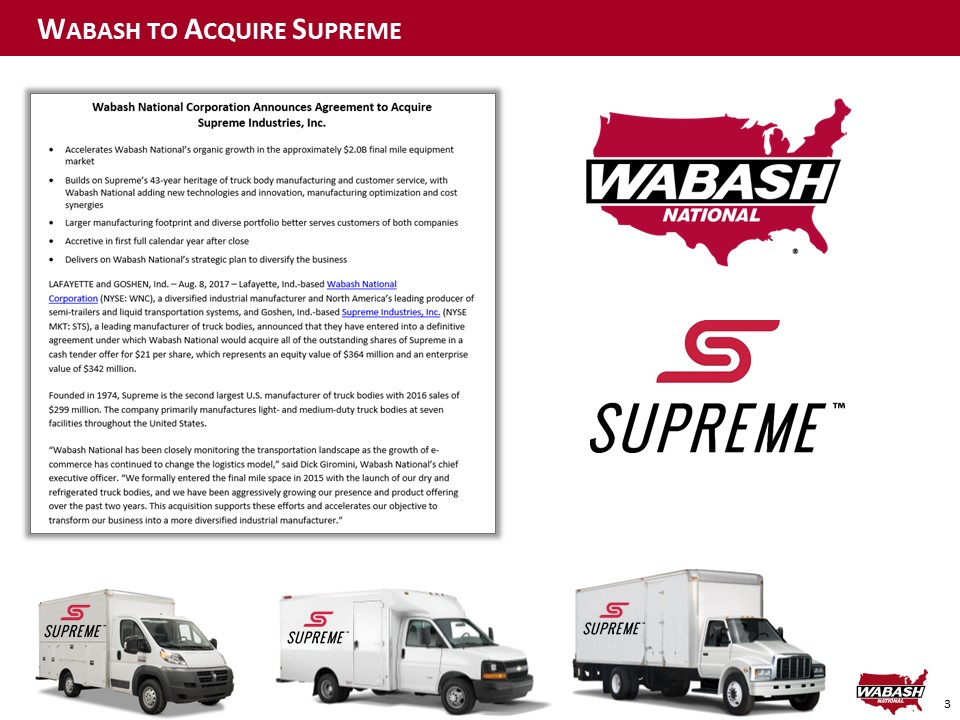
3 W ABASH TO A CQUIRE S UPREME
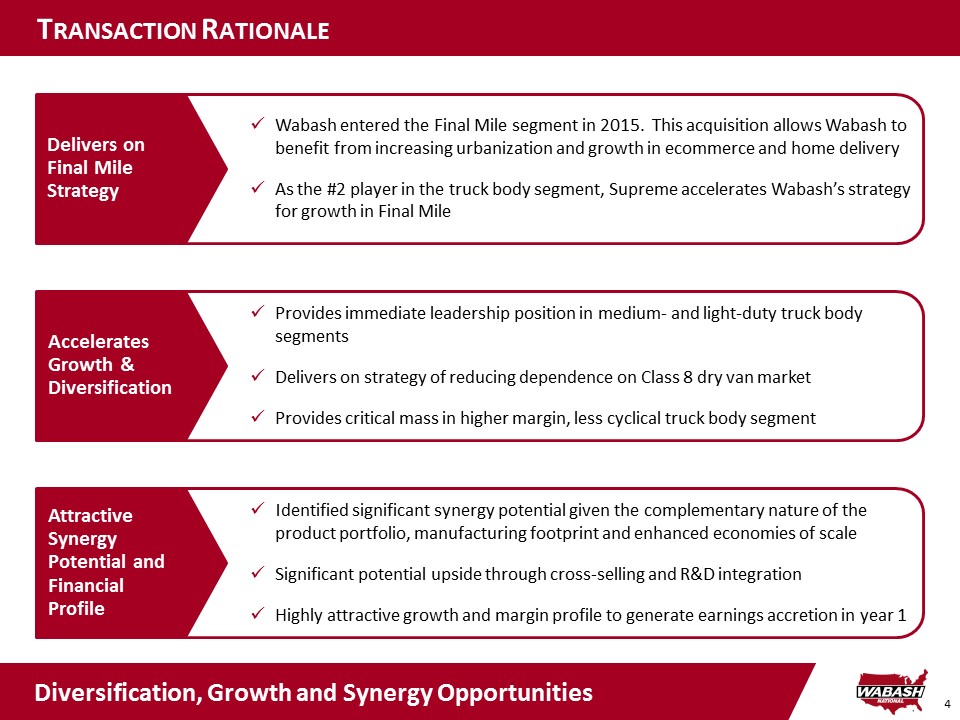
4 x Provides immediate leadership position in medium - and light - duty truck body segments x Delivers on strategy of reducing dependence on Class 8 dry van market x Provides critical mass in higher margin, less cyclical truck body segment Accelerates Growth & Diversification x Wabash entered the Final Mile segment in 2015. This acquisition allows Wabash to benefit from increasing urbanization and growth in ecommerce and home delivery x As the #2 player in the truck body segment, Supreme accelerates Wabash’s strategy for growth in Final M ile Delivers on Final Mile Strategy x x Identified s ignificant synergy potential given the complementary nature of the product portfolio, manufacturing footprint and enhanced economies of scale x Significant potential upside through cross - selling and R&D integration x Highly attractive growth and margin profile to generate earnings accretion in year 1 Attractive Synergy Potential and Financial Profile T RANSACTION R ATIONALE Diversification, Growth and Synergy Opportunities
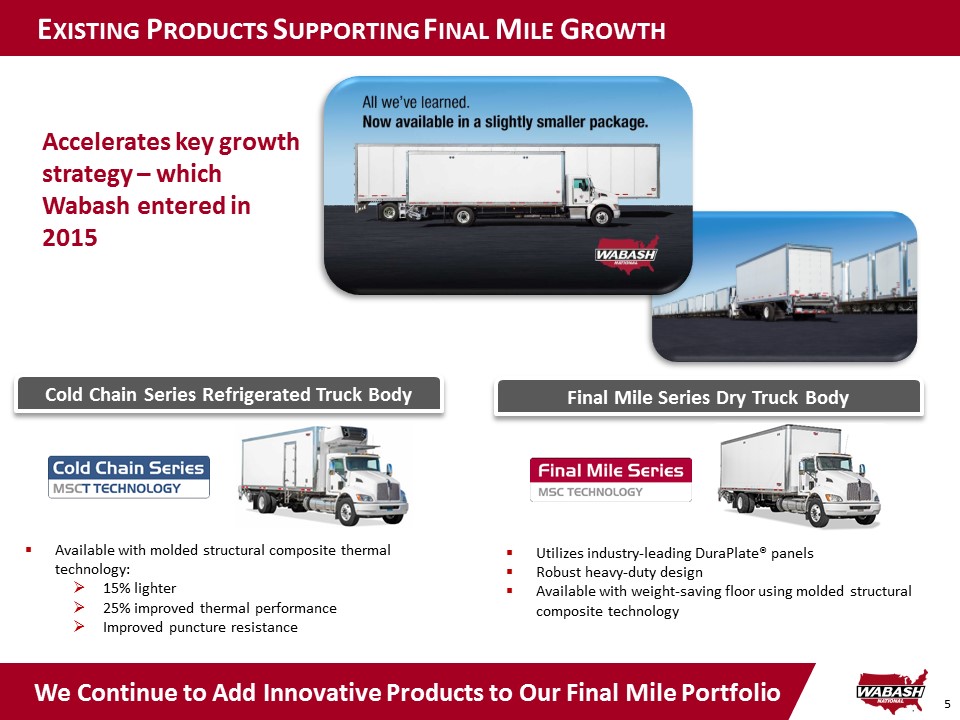
5 E XISTING P RODUCTS S UPPORTING F INAL M ILE G ROWTH Final Mile Series Dry Truck Body ▪ Utilizes industry - leading DuraPlate® panels ▪ Robust heavy - duty design ▪ Available with weight - saving floor using molded structural composite technology Cold Chain Series Refrigerated Truck Body ▪ Available with molded structural composite thermal technology: » 15 % lighter » 25% improved thermal performance » Improved puncture resistance Accelerates key growth strategy – which Wabash entered in 2015 We Continue to Add Innovative Products to Our Final Mile Portfolio
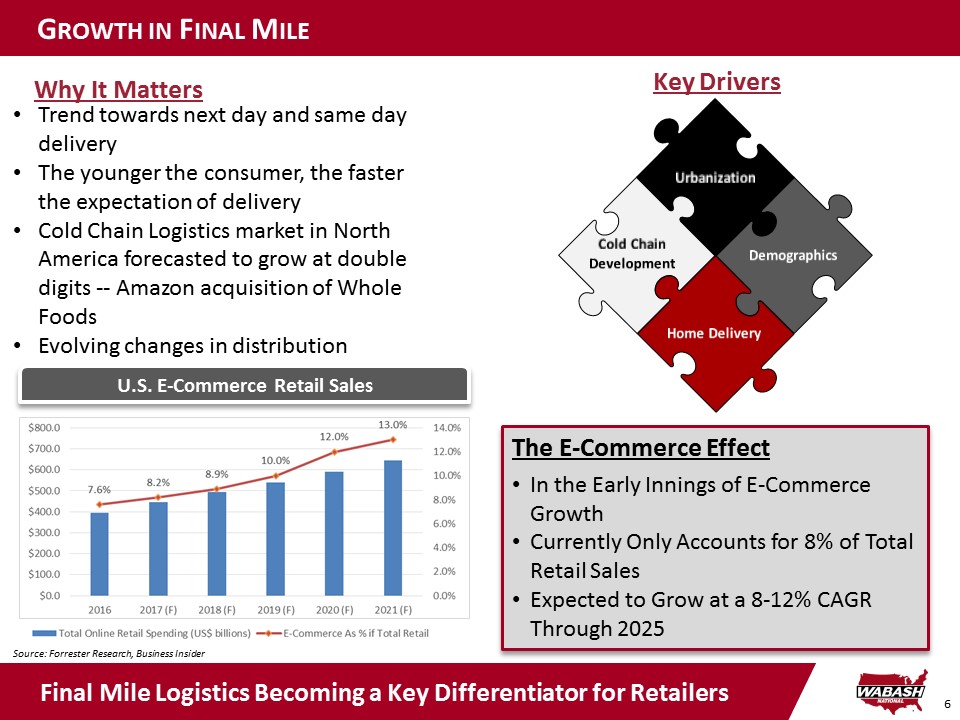
6 G ROWTH IN F INAL M ILE • Trend towards next day and s ame day delivery • The younger the consumer, the faster the expectation of delivery • Cold Chain Logistics market in North America forecasted to grow at double digits -- Amazon acquisition of Whole Foods • Evolving changes in distribution Source: Forrester Research, Business Insider The E - Commerce Effect • In the Early Innings of E - Commerce Growth • Currently Only Accounts for 8% of Total Retail Sales • Expected to Grow at a 8 - 12% CAGR Through 2025 Why It Matters Key Drivers U.S. E - Commerce Retail Sales Final Mile Logistics Becoming a Key Differentiator for Retailers
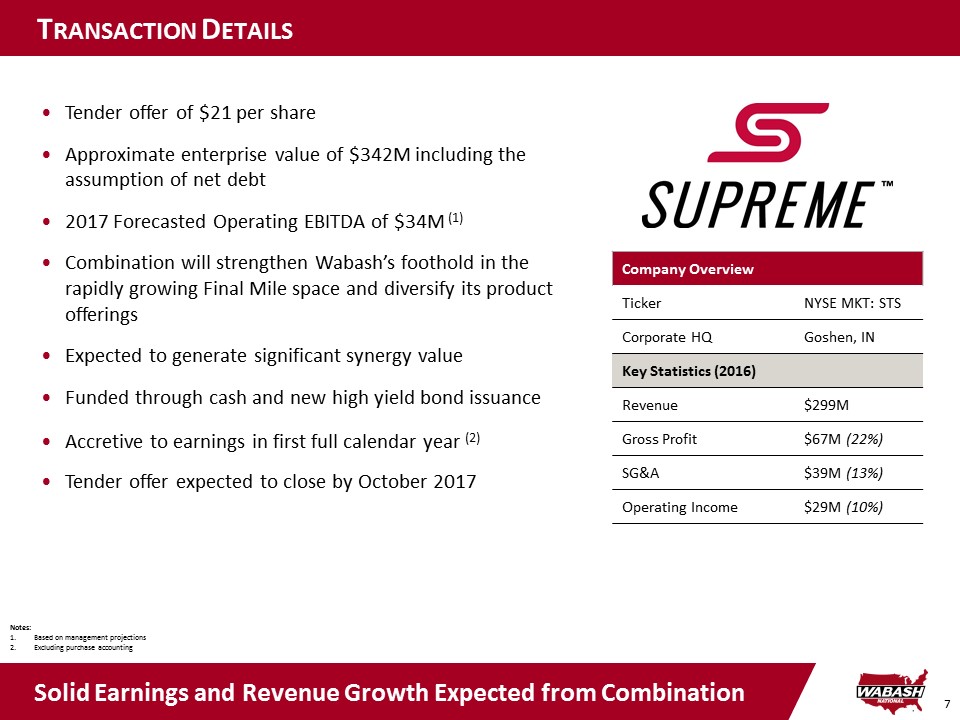
7 • Tender offer of $21 per share • Approximate enterprise value of $342M including the assumption of net debt • 2017 Forecasted Operating EBITDA of $34M (1) • Combination will strengthen Wabash’s foothold in the rapidly growing Final Mile space and diversify its product offerings • Expected to generate significant synergy value • Funded through cash and new high yield bond issuance • Accretive to earnings in first full calendar year (2) • Tender offer expected to close by October 2017 T RANSACTION D ETAILS Notes: 1. Based on management projections 2. Excluding purchase accounting Company Overview Ticker NYSE MKT: STS Corporate HQ Goshen, IN Key Statistics (2016) Revenue $299M Gross Profit $67M (22%) SG&A $39M (13%) Operating Income $29M (10%) Solid Earnings and Revenue Growth Expected from Combination
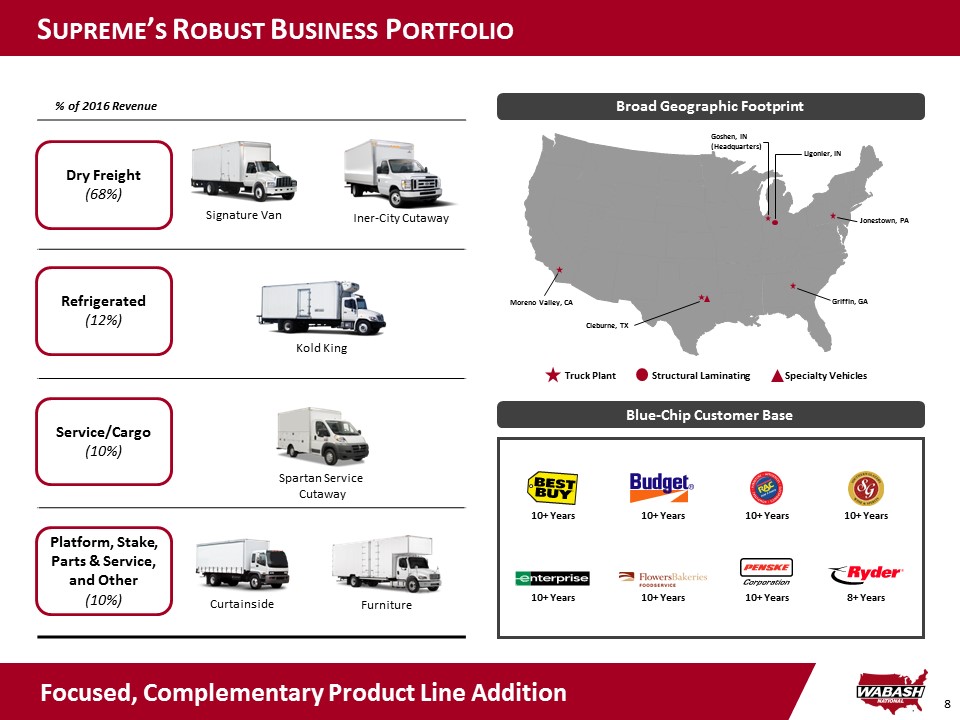
8 Dry Freight (68%) Iner - City Cutaway Signature Van Service/Cargo (10%) Spartan Service Cutaway Refrigerated (12%) Kold King Platform, Stake, Parts & Service, and Other (10%) Curtainside Furniture % of 2016 Revenue Blue - Chip Customer Base 10+ Years 10+ Years 10+ Years 10+ Years 10+ Years 10+ Years 10+ Years 8 + Years Goshen, IN (Headquarters) Ligonier, IN Jonestown, PA Griffin, GA Structural Laminating Specialty Vehicles Truck Plant Cleburne, TX Moreno Valley, CA Broad Geographic Footprint S UPREME ’ S R OBUST B USINESS P ORTFOLIO Focused, Complementary Product Line Addition
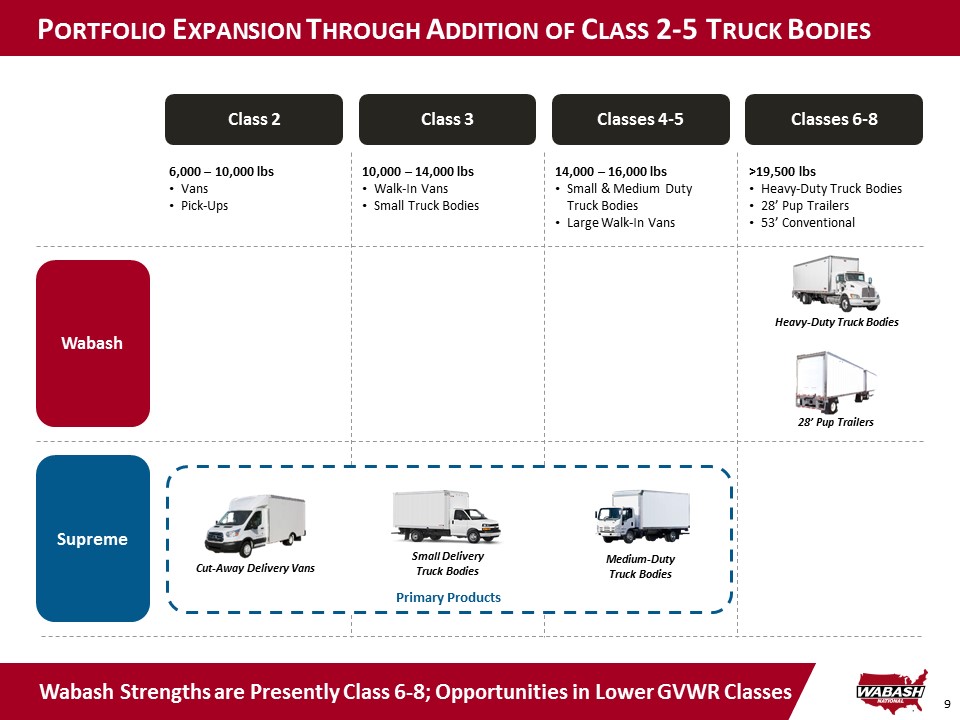
9 Wabash Class 2 Class 3 Classes 4 - 5 Classes 6 - 8 Supreme 6,000 – 10,000 lbs • Vans • Pick - Ups 10,000 – 14,000 lbs • Walk - In Vans • Small Truck Bodies 14,000 – 16,000 lbs • Small & Medium Duty Truck Bodies • Large Walk - In Vans >19,500 lbs • Heavy - Duty Truck Bodies • 28’ Pup Trailers • 53’ Conventional Primary Products 28’ Pup Trailers Heavy - Duty Truck Bodies Small Delivery Truck Bodies Medium - Duty Truck Bodies Cut - Away Delivery Vans P ORTFOLIO E XPANSION T HROUGH A DDITION OF C LASS 2 - 5 T RUCK B ODIES Wabash Strengths are Presently Class 6 - 8; Opportunities in Lower GVWR Classes
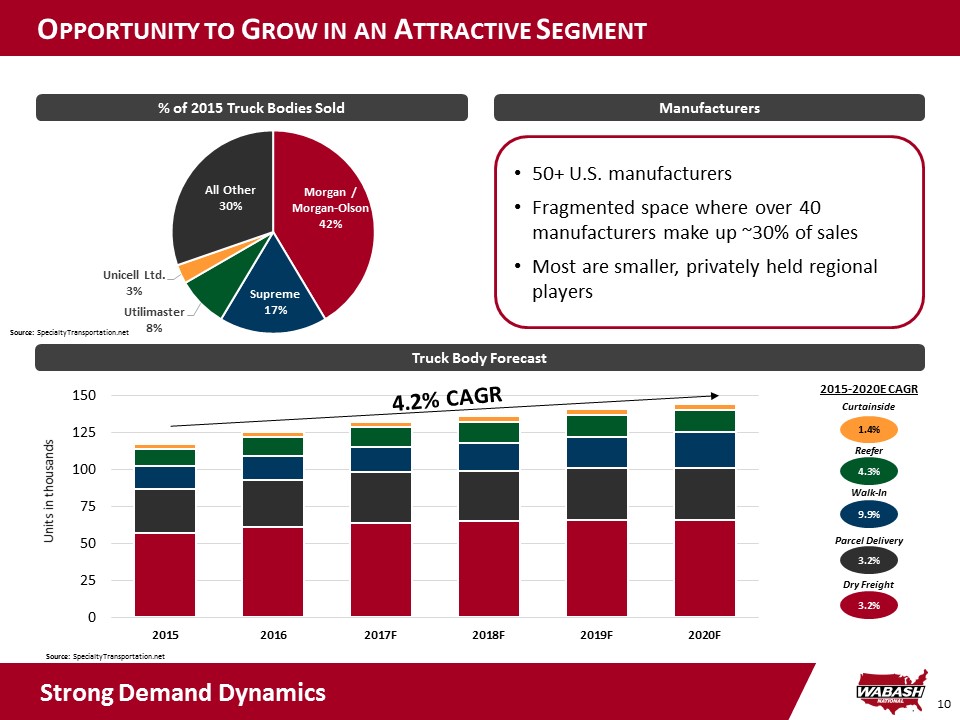
10 O PPORTUNITY TO G ROW IN AN A TTRACTIVE S EGMENT Source: SpecialtyTransportation.net Morgan / Morgan - Olson 42% Supreme 17% Utilimaster 8% Unicell Ltd. 3% All Other 30% Units in thousands 0 25 50 75 100 125 150 2015 2016 2017F 2018F 2019F 2020F Truck Body Forecast 2015 - 2020E CAGR 1.4 % Curtainside 4.3% Reefer 9.9% Walk - In 3.2% Parcel Delivery 3.2% Dry Freight % of 2015 Truck Bodies Sold • 50+ U.S. manufacturers • Fragmented space where over 40 manufacturers make up ~30% of sales • Most are smaller, privately held regional players Manufacturers Source: SpecialtyTransportation.net Strong Demand Dynamics
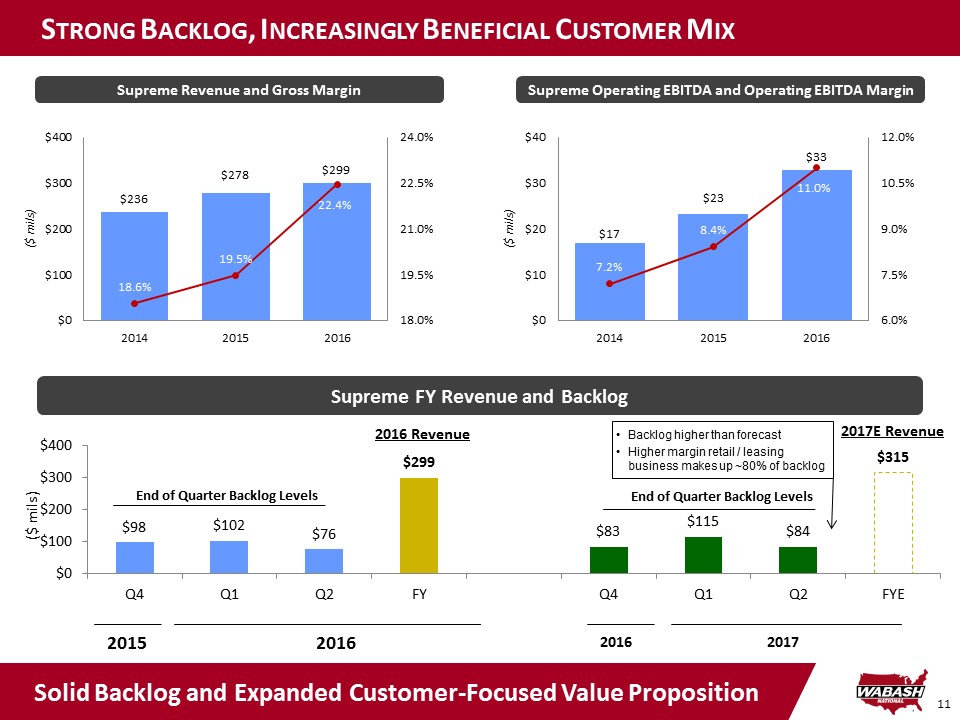
11 $98 $102 $76 $299 $83 $115 $84 $315 $0 $100 $200 $300 $400 Q4 Q1 Q2 FY Q4 Q1 Q2 FYE End of Quarter Backlog Levels End of Quarter Backlog Levels Supreme FY Revenue and Backlog 2016 2017 2015 2016 ($ mils) • Backlog higher than forecast • Higher margin retail / leasing business makes up ~80% of backlog S TRONG B ACKLOG , I NCREASINGLY B ENEFICIAL C USTOMER M IX 2016 Revenue 2017E Revenue jj $236 $278 $299 18.6% 19.5% 22.4% 18.0% 19.5% 21.0% 22.5% 24.0% $0 $100 $200 $300 $400 2014 2015 2016 $17 $23 $33 7.2% 8.4% 11.0% 6.0% 7.5% 9.0% 10.5% 12.0% $0 $10 $20 $30 $40 2014 2015 2016 ($ mils) Supreme Operating EBITDA and Operating EBITDA Margin Supreme Revenue and Gross Margin ($ mils) Solid Backlog and Expanded Customer - Focused Value Proposition
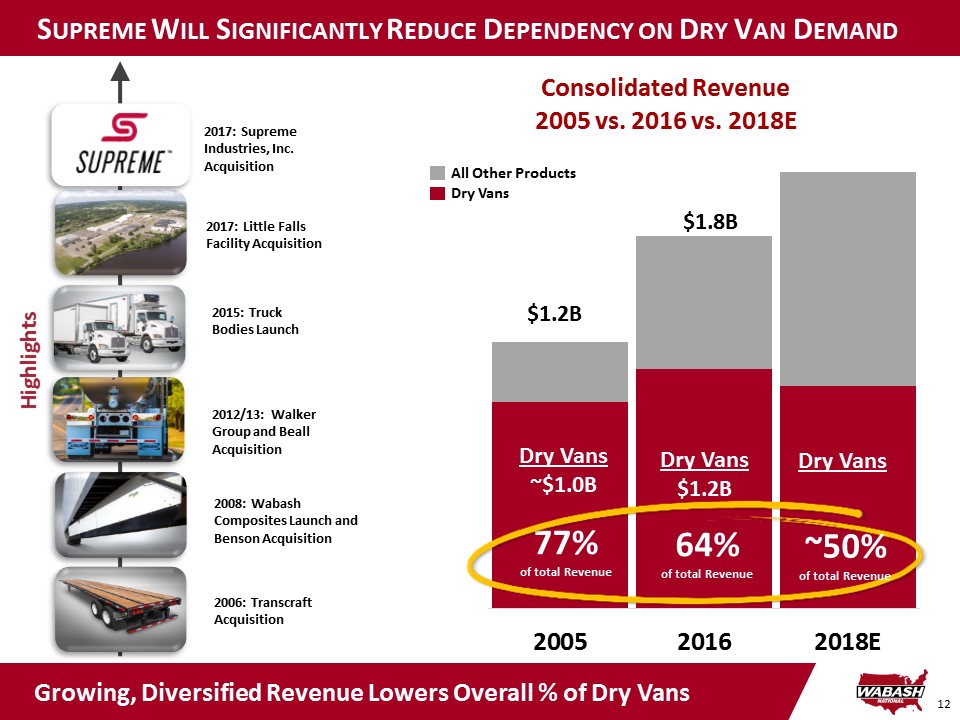
12 S UPREME W ILL S IGNIFICANTLY R EDUCE D EPENDENCY ON D RY V AN D EMAND $1.8B $ 1.2B Dry Vans $1.0B Dry Vans $1.2B 2006: Transcraft Acquisition 2012/13: Walker Group and Beall Acquisition 2008: Wabash Composites Launch and Benson Acquisition 2015: Truck Bodies Launch Highlights 2017: Little Falls Facility Acquisition 2017: Supreme Industries, Inc. Acquisition 77% of total revenue 64% of total revenue ~50% of total revenue Growing, Diversified Revenue Lowers Overall % of Dry Vans All Other Products Dry Vans 2005 2016 2018E Consolidated Revenue 2005 vs. 2016 vs. 2018E Dry Vans ~$ 1.0B Dry Vans $1.2B 77% of total Revenue Dry Vans 64% of total Revenue ~50% of total Revenue
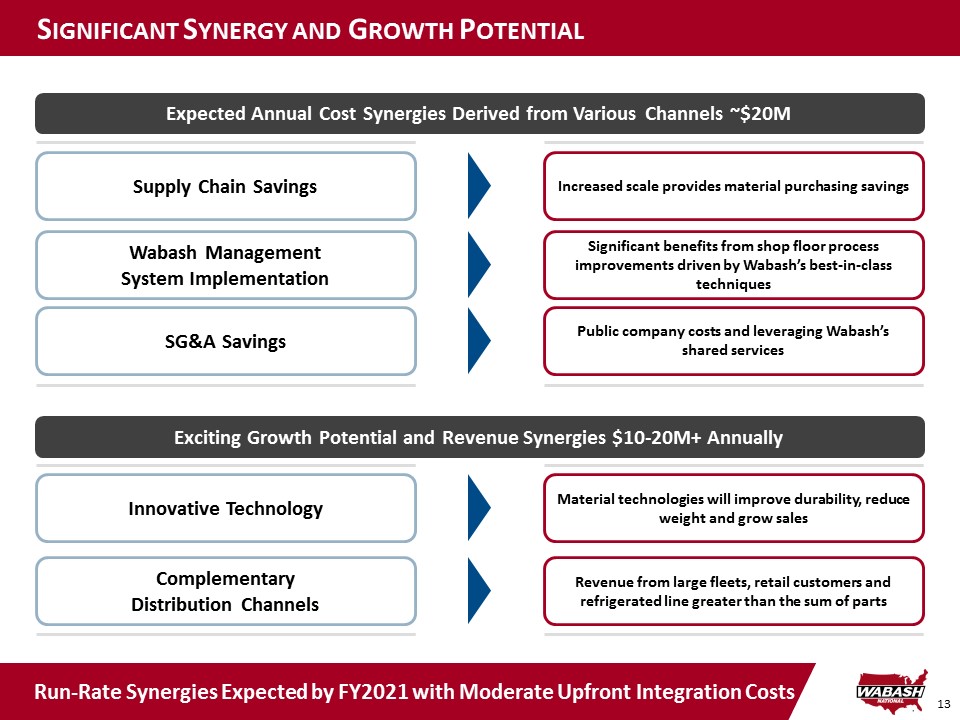
13 Supply Chain Savings Increased scale provides material purchasing savings Wabash Management System Implementation Significant benefits from shop floor process improvements driven by Wabash’s best - in - class techniques Complementary Distribution Channels Revenue from large fleets, retail customers and refrigerated line greater than the sum of parts SG&A Savings Public company costs and leveraging Wabash’s shared services Innovative Technology Material technologies will improve durability , reduce weight and grow sales S IGNIFICANT S YNERGY AND G ROWTH P OTENTIAL Expected Annual Cost Synergies Derived from Various Channels ~$20M Run - Rate Synergies Expected by FY2021 with Moderate Upfront Integration Costs Exciting Growth Potential and Revenue Synergies $ 10 - 20M+ Annually
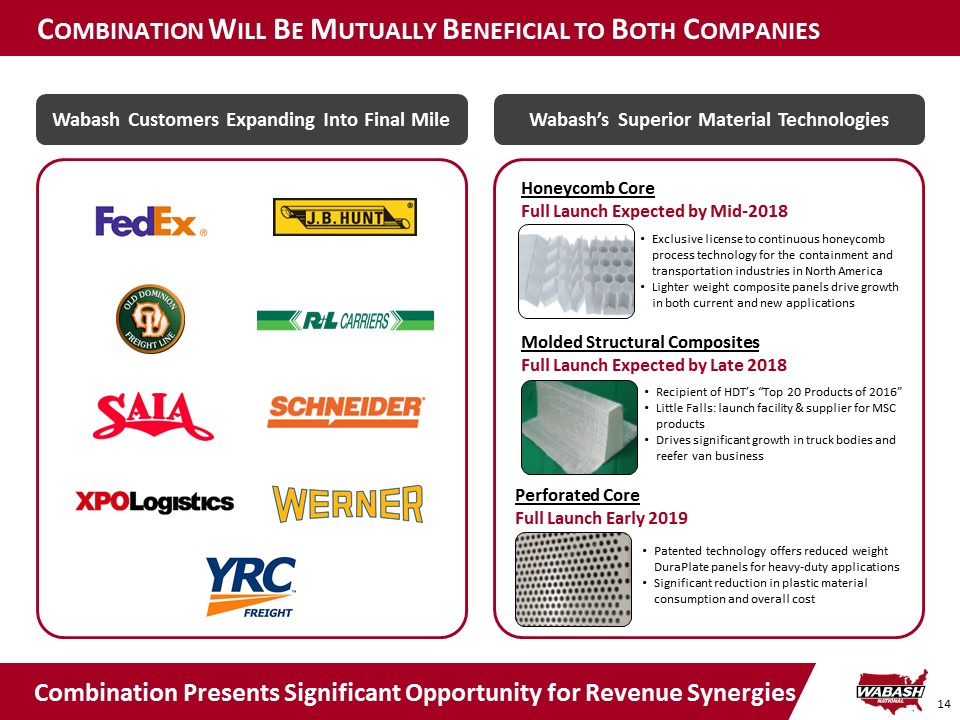
14 C OMBINATION W ILL B E M UTUALLY B ENEFICIAL TO B OTH C OMPANIES Combination Presents Significant Opportunity for Revenue Synergies Wabash Customers Expanding Into Final Mile Wabash’s Superior Material Technologies • Exclusive license to continuous honeycomb process technology for the containment and transportation industries in North America • Lighter weight composite panels drive growth in both current and new applications Honeycomb Core Full Launch Expected by Mid - 2018 • Recipient of HDT’s “Top 20 Products of 2016” • Little Falls: launch facility & supplier for MSC products • Drives significant growth in truck bodies and reefer van business Molded Structural Composites Full Launch Expected by Late 2018 • Patented technology offers reduced weight DuraPlate panels for heavy - duty applications • Significant reduction in plastic material consumption and overall cost Perforated Core Full Launch Early 2019
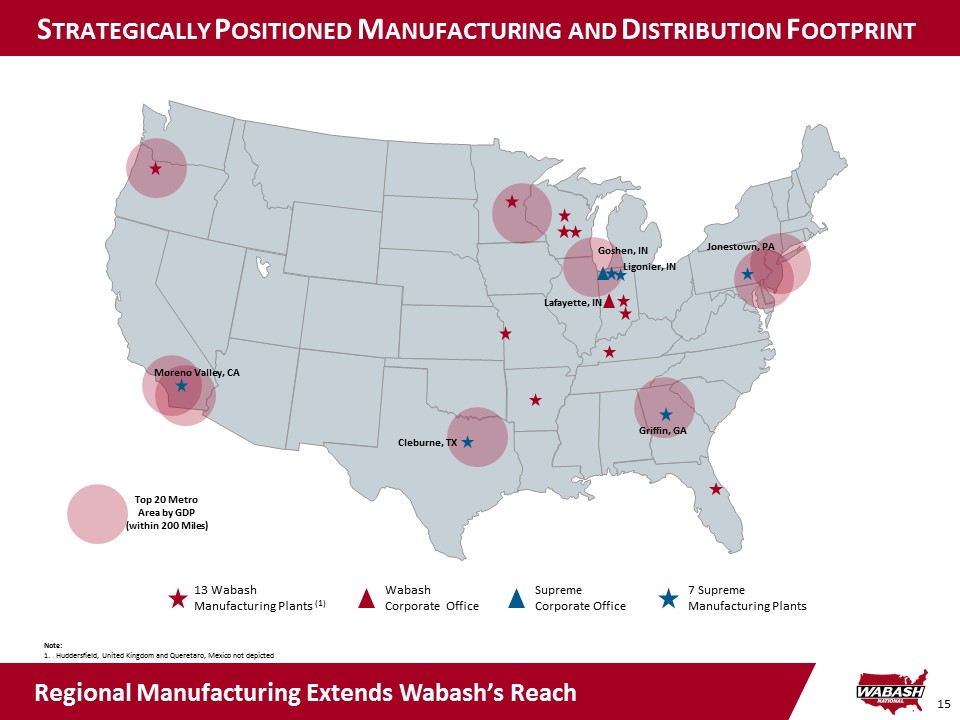
15 Top 20 Metro Area by GDP (within 200 Miles) S TRATEGICALLY P OSITIONED M ANUFACTURING AND D ISTRIBUTION F OOTPRINT 13 Wabash Manufacturing Plants (1) Wabash Corporate Office Supreme Corporate Office 7 Supreme Manufacturing Plants Note: 1. Huddersfield, United Kingdom and Queretaro, Mexico not depicted Lafayette, IN Goshen, IN Cleburne, TX Jonestown, PA Moreno Valley, CA Griffin, GA Ligonier, IN Regional Manufacturing Extends Wabash’s Reach
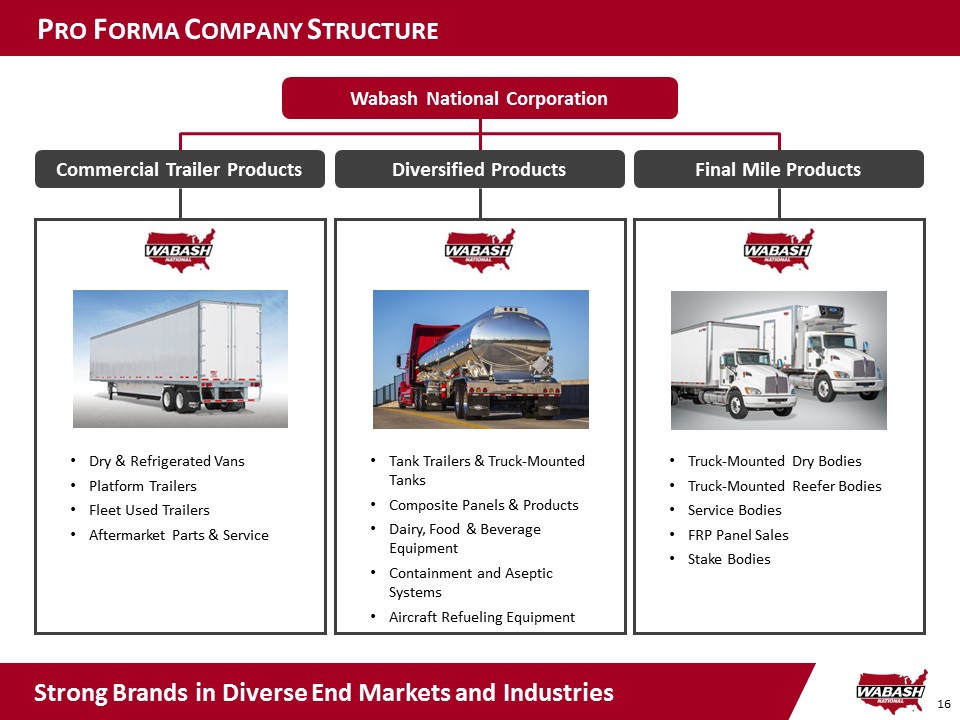
16 Wabash National Corporation • Dry & Refrigerated Vans • Platform Trailers • Fleet Used Trailers • Aftermarket Parts & Service • Tank Trailers & Truck - Mounted Tanks • Composite Panels & Products • Dairy, Food & Beverage Equipment • Containment and Aseptic Systems • Aircraft Refueling Equipment • Truck - Mounted Dry Bodies • Truck - Mounted Reefer Bodies • Service Bodies • FRP Panel Sales • Stake Bodies Commercial Trailer Products Diversified Products Final Mile Products P RO F ORMA C OMPANY S TRUCTURE Strong Brands in Diverse End Markets and Industries
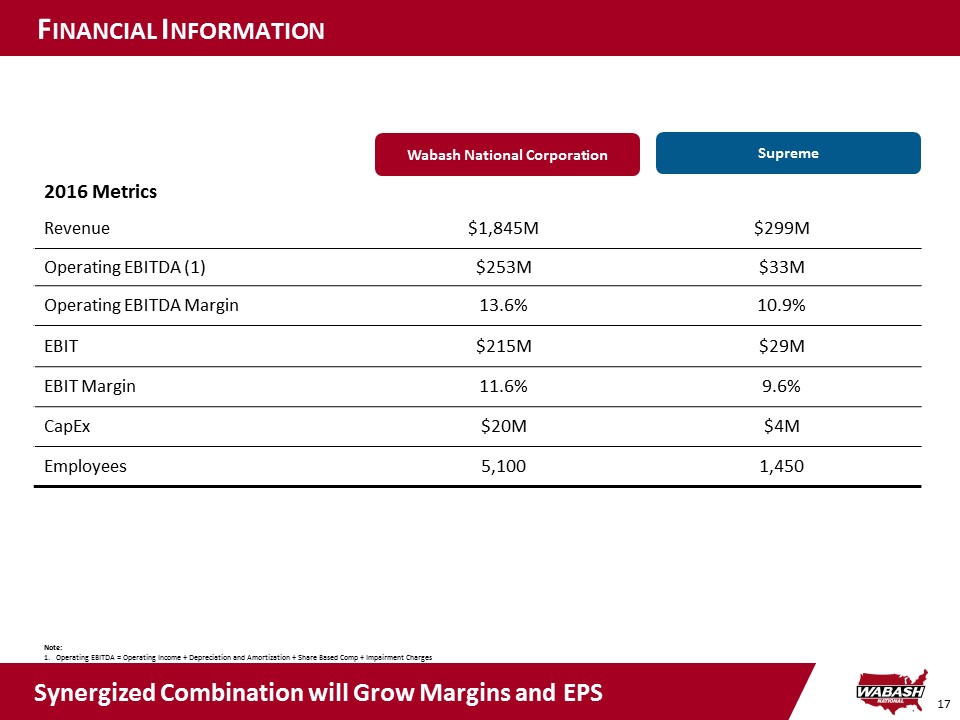
17 F INANCIAL I NFORMATION Note: 1. Operating EBITDA = Operating Income + Depreciation and Amortization + Share Based Comp + Impairment Charges 2016 Metrics Revenue $1,845M $299M Operating EBITDA (1) $253M $33M Operating EBITDA Margin 13.6% 10.9% EBIT $215M $29M EBIT Margin 11.6% 9.6% CapEx $20M $4M Employees 5,100 1,450 Supreme Wabash National Corporation Synergized Combination will Grow Margins and EPS
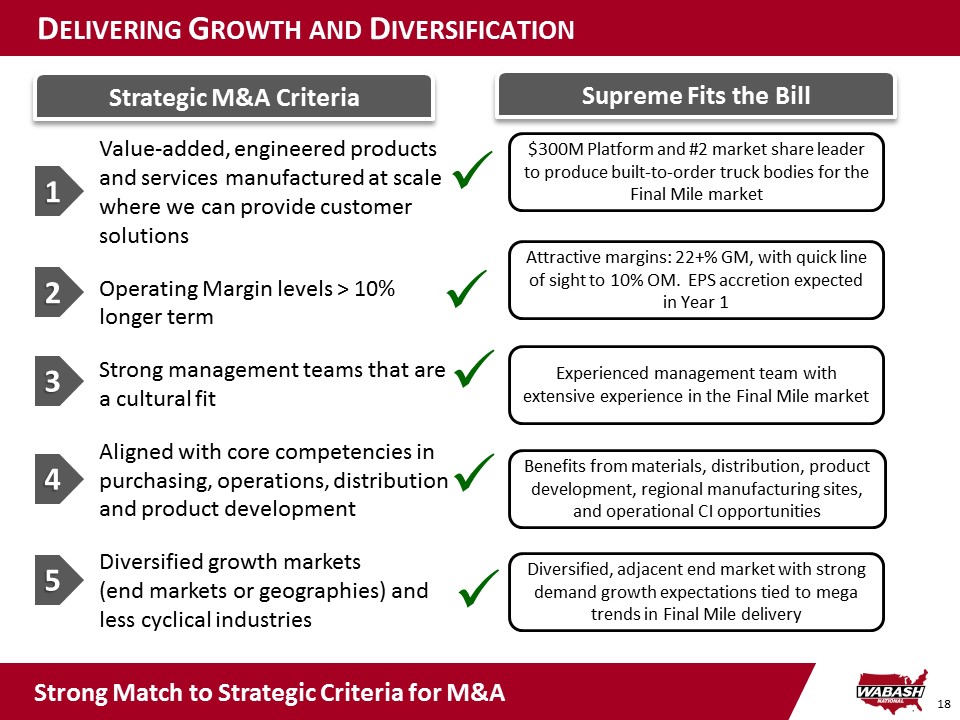
18 D ELIVERING G ROWTH AND D IVERSIFICATION Strategic M&A Criteria Value - added, engineered products and services manufactured at scale where we can provide customer solutions Operating Margin levels > 10 % longer term Strong management teams that are a cultural fit Aligned with core competencies in purchasing, operations, distribution and product development Diversified growth markets (end markets or geographies) and less cyclical industries 1 2 3 4 5 $300M Platform and #2 market share l eader to produce built - to - order t ruck bodies for the Final Mile market Diversified, adjacent end market with strong demand g rowth e xpectations t ied to mega t rends in Final Mile delivery Attractive margins: 22+% GM, with quick line of sight to 10% OM. EPS accretion expected in Year 1 Benefits from materials, distribution, product development, regional m anufacturing s ites , and operational CI opportunities Experienced management t eam with extensive experience in the Final Mile market x x x x x Supreme Fits the Bill Strong Match to Strategic Criteria for M&A
WABASH NATIONAL CORPORATION Appendix
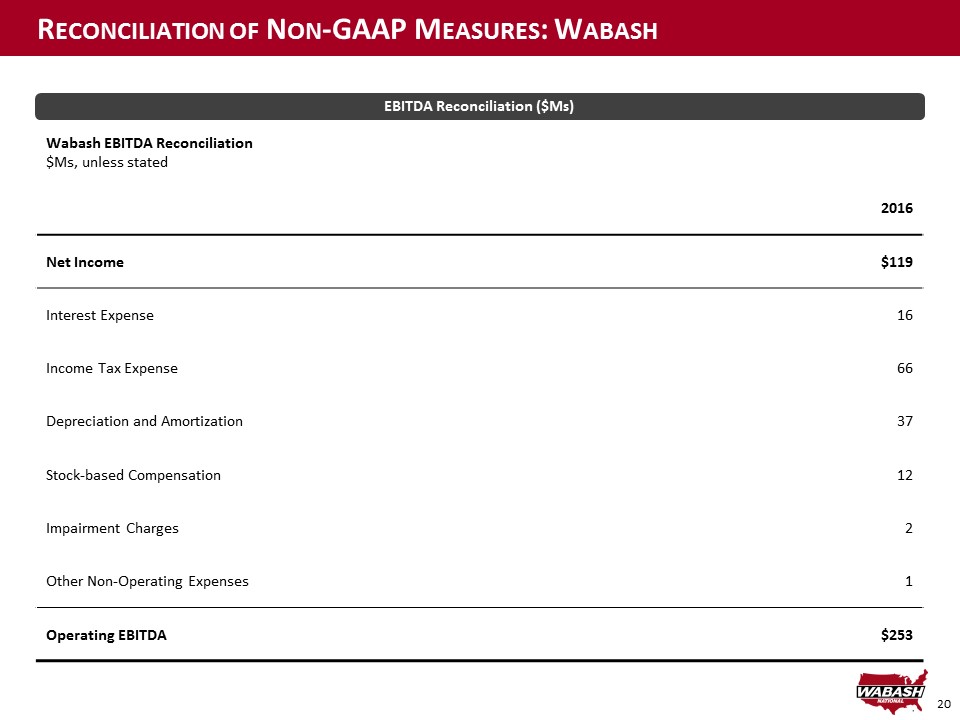
20 R ECONCILIATION OF N ON - GAAP M EASURES : W ABASH Wabash EBITDA Reconciliation $ Ms , unless stated 2016 Net I ncome $119 Interest Expense 16 Income Tax Expense 66 Depreciation and Amortization 37 Stock - based Compensation 12 Impairment Charges 2 Other Non - Operating Expenses 1 Operating EBITDA $253 EBITDA Reconciliation ($ Ms )
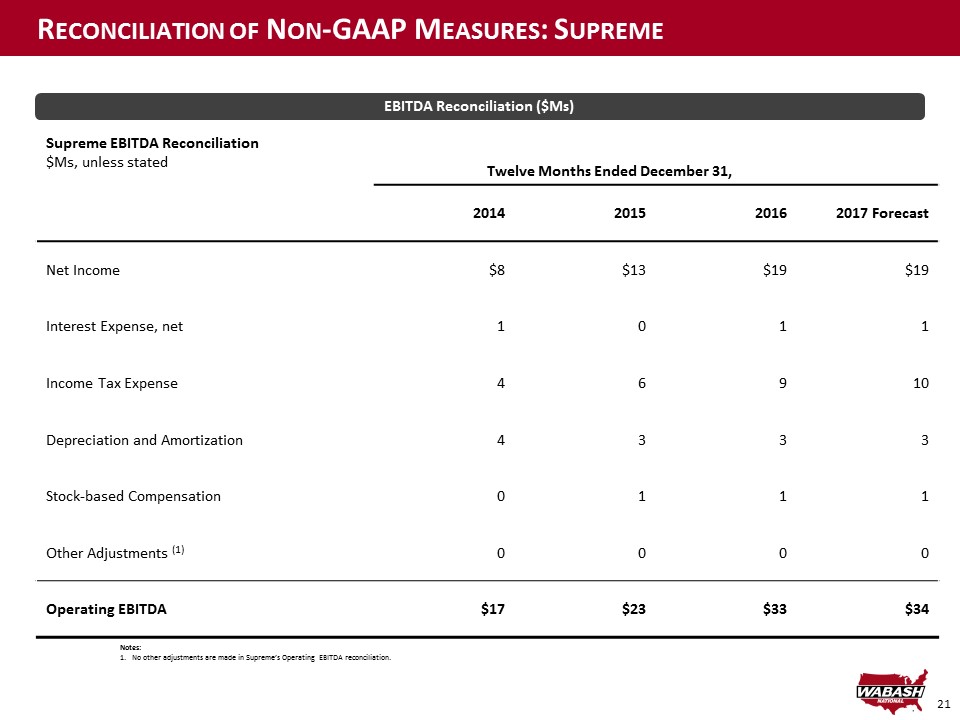
21 R ECONCILIATION OF N ON - GAAP M EASURES : S UPREME Supreme EBITDA Reconciliation $ Ms , unless stated Twelve Months Ended December 31, 2014 2015 2016 2017 Forecast Net Income $8 $13 $19 $19 Interest Expense, net 1 0 1 1 Income Tax Expense 4 6 9 10 Depreciation and Amortization 4 3 3 3 Stock - based Compensation 0 1 1 1 Other Adjustments (1) 0 0 0 0 Operating EBITDA $17 $23 $33 $34 EBITDA Reconciliation ($ Ms ) Notes: 1. No other adjustments are made in Supreme’s Operatin g EBITDA reconciliation .
22 We have prepared this document solely for informational purposes. You should not definitively rely upon it or use it to form the definitive basis for any decision, contract, commitment or action whatsoever, with respect to any proposed transaction or otherwise. You and your directors, officers, emp loy ees, agents and affiliates must hold this document and any oral information provided in connection with this document in strict confidence and may not communicate, rep rod uce, distribute or disclose it to any other person, or refer to it publicly, in whole or in part at any time except with our prior written consent. If you are not the in ten ded recipient of this document, please delete and destroy all copies immediately. We have prepared this document and the analyses contained in it based, in part, on certain assumptions and information obtain ed by us from the recipient, its directors, officers, employees, agents, affiliates and/or from other sources. Our use of such assumptions and information does not imply that we h ave independently verified or necessarily agree with any of such assumptions or information, and we have assumed and relied upon the accuracy and completeness of such assump tio ns and information for purposes of this document. Neither we nor any of our affiliates, or our or their respective officers, employees or agents, make any representa tio n or warranty, express or implied, in relation to the accuracy or completeness of the information contained in this document or any oral information provided in connection her ewi th, or any data it generates and accept no responsibility, obligation or liability (whether direct or indirect, in contract, tort or otherwise) in relation to any of su ch information. We and our affiliates and our and their respective officers, employees and agents expressly disclaim any and all liability which may be based on this document and an y e rrors therein or omissions therefrom. Neither we nor any of our affiliates, or our or their respective officers, employees or agents, make any representation or warranty, exp res s or implied, that any transaction has been or may be effected on the terms or in the manner stated in this document, or as to the achievement or reasonableness of future proje cti ons, management targets, estimates, prospects or returns, if any. Any views or terms contained herein are preliminary only, and are based on financial, economic, market an d o ther conditions prevailing as of the date of this document and are therefore subject to change. We undertake no obligation or responsibility to update any of the information c ont ained in this document. Past performance does not guarantee or predict future performance. This document and the information contained herein do not constitute an offer to sell or the solicitation of an offer to buy any security, commodity or instrument or related derivative, nor do they constitute an offer or commitment to lend, syndicate or arrange a financing, underwrite or purchase o r a ct as an agent or advisor or in any other capacity with respect to any transaction, or commit capital, or to participate in any trading strategies, and do not constitute legal, re gulatory, accounting or tax advice to the recipient. We recommend that the recipient seek independent third party legal, regulatory, accounting and tax advice regarding the contents of this document. This document does not constitute and should not be considered as any form of financial opinion or recommendation by us or any of our affiliates. Th is document is not a research report and was not prepared by the research department of Morgan Stanley or any of its affiliates. Notwithstanding anything herein to the contrary, each recipient hereof (and their employees, representatives, and other agent s) may disclose to any and all persons, without limitation of any kind from the commencement of discussions, the U.S. federal and state income tax treatment and tax structur e o f the proposed transaction and all materials of any kind (including opinions or other tax analyses) that are provided relating to the tax treatment and tax structure. For th is purpose, "tax structure" is limited to facts relevant to the U.S. federal and state income tax treatment of the proposed transaction and does not include information relating to the ide ntity of the parties, their affiliates, agents or advisors. This document is provided by Morgan Stanley & Co. LLC and/or certain of its affiliates or other applicable entities, which ma y i nclude Morgan Stanley Realty Incorporated, Morgan Stanley Senior Funding, Inc., Morgan Stanley Bank, N.A., Morgan Stanley & Co. International plc, Morgan Stanley Securi tie s Limited, Morgan Stanley Bank AG, Morgan Stanley MUFG Securities Co., Ltd., Mitsubishi UFJ Morgan Stanley Securities Co., Ltd., Morgan Stanley Asia Limited, Morgan St anl ey Australia Securities Limited, Morgan Stanley Australia Limited, Morgan Stanley Asia (Singapore) Pte., Morgan Stanley Services Limited, Morgan Stanley & Co. International plc Seoul Branch and/or Morgan Stanley Canada Limited Unless governing law permits otherwise, you must contact an authorized Morgan Stanley entity in your jurisdiction reg ard ing this document or any of the information contained herein. D ISCLAIMER