SEI Investments Company (NASDAQ: SEIC) Q3 2025 Earnings Presentation
This presentation contains forward-looking statements within the meaning or the rules and regulations of the Securities and Exchange Commission. In some cases you can identify forward-looking statements by terminology, such as "may," "will," "expect," "believe," ”remain” and "continue" or "appear." Our forward-looking statements include our current expectations as to: • our opportunities; • the strength of our pipelines; • our momentum and the benefits of this momentum; • our commitment to disciplined execution, transparent communication, and creating long-term value for our clients and shareholders; • the level of demand for outsourcing and client expansions; • our investment priorities; • the durability of our growth strategy; • the work that new clients will generate to retire legacy systems, execute complex data conversions, and integrate new platforms; • the incremental opportunities for our professional services offerings; • the financial impact of the loss of a previously disclosed at risk client in our Private Banking business and the duration of related deconversions; • the benefits that we and our stakeholders will receive as a consequence of our partnership with Stratos Wealth Management; • the degree to which our AI and tokenization efforts will support efficiency and scalability; • the ability of our integrated approach to break down silos and enable us to scale across segments, capture wallet share, and deliver consistent, repeatable growth; • our commitment to long-term growth, innovation and accountability; • our focus on execution and the benefits of this focus: • when we will receive the benefits, if at all, of the investments we make; • our potential, both short and long-term; • the pace of our sales events in the second half of 2025; • the timing of the closing of our partnership with Stratos Wealth Management and the source of funds for this closing; • our strategic priorities and our ability to execute against these priorities; • the demand for our products and services; • the headwinds that may affect our businesses; • the performance of our various businesses, including the margins and profitability of such businesses and the events that may affect the margins, profitability and growth prospects of these businesses; • the drivers of future revenue, margin and earnings growth; • the benefits, if any, that we or our clients may derive from acquired assets; • our run rate and the stability of the elements of that run rate; • the resiliency of our business; and • the market dynamics affecting our businesses. You should not place undue reliance on our forward-looking statements, as they are based on the current beliefs and expectations of our management and subject to significant risks and uncertainties, many of which are beyond our control or are subject to change. Although we believe the assumptions upon which we base our forward-looking statements are reasonable, they could be inaccurate. Some of the risks and important factors that could cause actual results to differ from those described in our forward-looking statements can be found in the "Risk Factors" section of our Annual Report on Form 10-K for the year ended Dec. 31, 2024, filed with the Securities and Exchange Commission. Past performance does not guarantee future results. Safe Harbor Statement 2 SEI Earnings PresentationQ3 2025
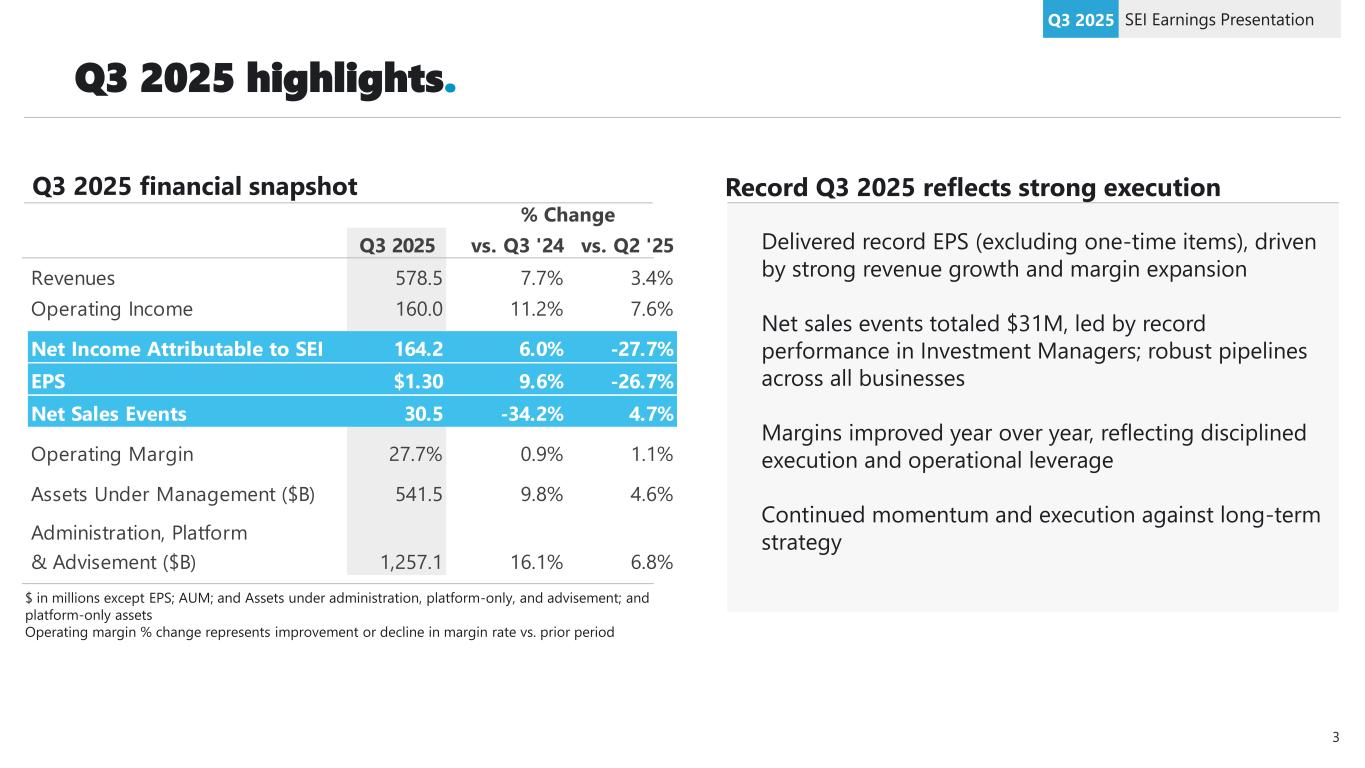
Q3 2025 vs. Q3 '24 vs. Q2 '25 Revenues 578.5 7.7% 3.4% Operating Income 160.0 11.2% 7.6% Net Income Attributable to SEI 164.2 6.0% -27.7% EPS $1.30 9.6% -26.7% Net Sales Events 30.5 -34.2% 4.7% Operating Margin 27.7% 0.9% 1.1% Assets Under Management ($B) 541.5 9.8% 4.6% Administration, Platform & Advisement ($B) 1,257.1 16.1% 6.8% % Change Q3 2025 highlights. SEI Earnings PresentationQ3 2025 Delivered record EPS (excluding one-time items), driven by strong revenue growth and margin expansion Net sales events totaled $31M, led by record performance in Investment Managers; robust pipelines across all businesses Margins improved year over year, reflecting disciplined execution and operational leverage Continued momentum and execution against long-term strategy $ in millions except EPS; AUM; and Assets under administration, platform-only, and advisement; and platform-only assets Operating margin % change represents improvement or decline in margin rate vs. prior period Record Q3 2025 reflects strong executionQ3 2025 financial snapshot 3
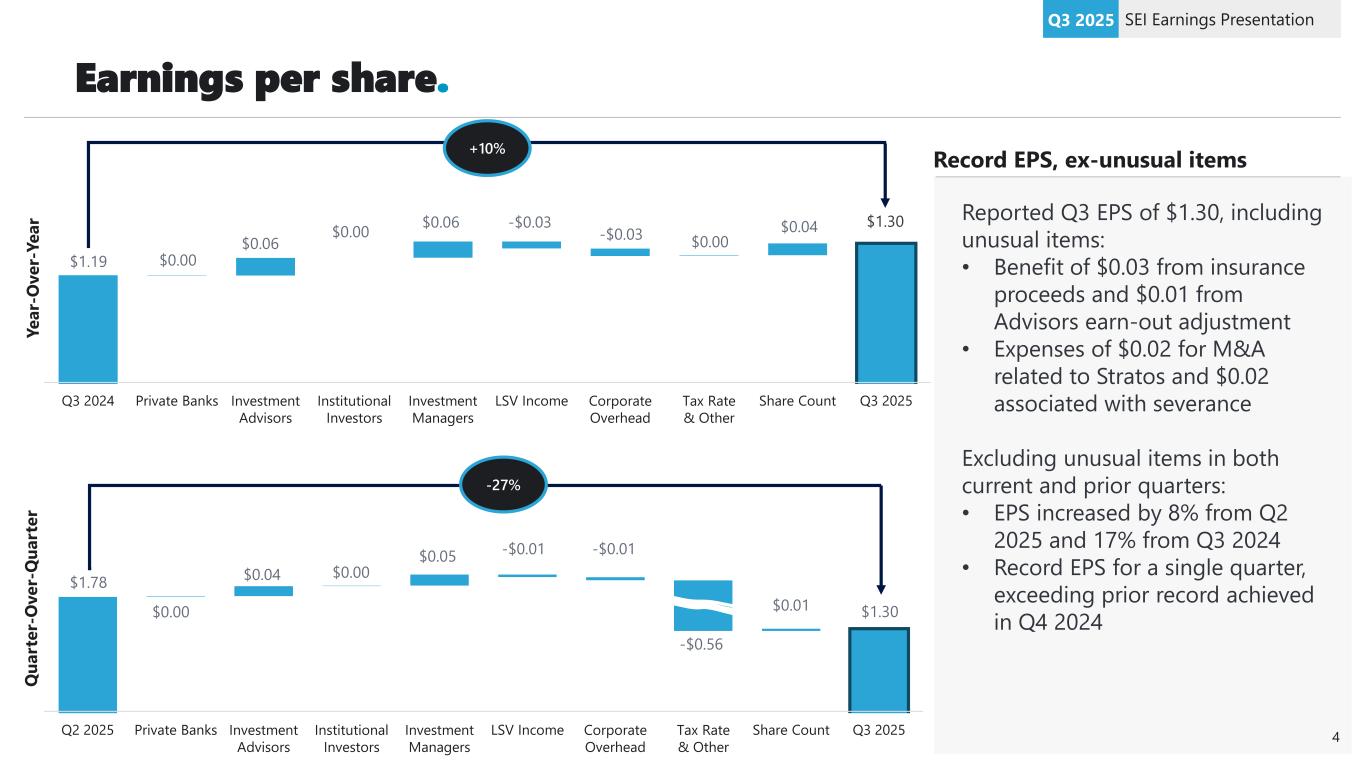
Earnings per share. SEI Earnings PresentationQ3 2025 Reported Q3 EPS of $1.30, including unusual items: • Benefit of $0.03 from insurance proceeds and $0.01 from Advisors earn-out adjustment • Expenses of $0.02 for M&A related to Stratos and $0.02 associated with severance Excluding unusual items in both current and prior quarters: • EPS increased by 8% from Q2 2025 and 17% from Q3 2024 • Record EPS for a single quarter, exceeding prior record achieved in Q4 2024 Record EPS, ex-unusual items Q3 2024 Private Banks Investment Advisors Institutional Investors Investment Managers LSV Income Corporate Overhead Tax Rate & Other Share Count Q3 2025 +10% Q2 2025 Private Banks Investment Advisors Institutional Investors Investment Managers LSV Income Corporate Overhead Tax Rate & Other Share Count Q3 2025 -27% Y e a r- O v e r- Y e a r Q u a rt e r- O v e r- Q u a rt e r 4 $1.19 $0.00 $0.06 $0.00 $0.06 -$0.03 -$0.03 $0.00 $0.04 $1.30 $1.78 $0.00 $0.04 $0.00 $0.05 -$0.01 -$0.01 -$0.56 $0.01 $1.30
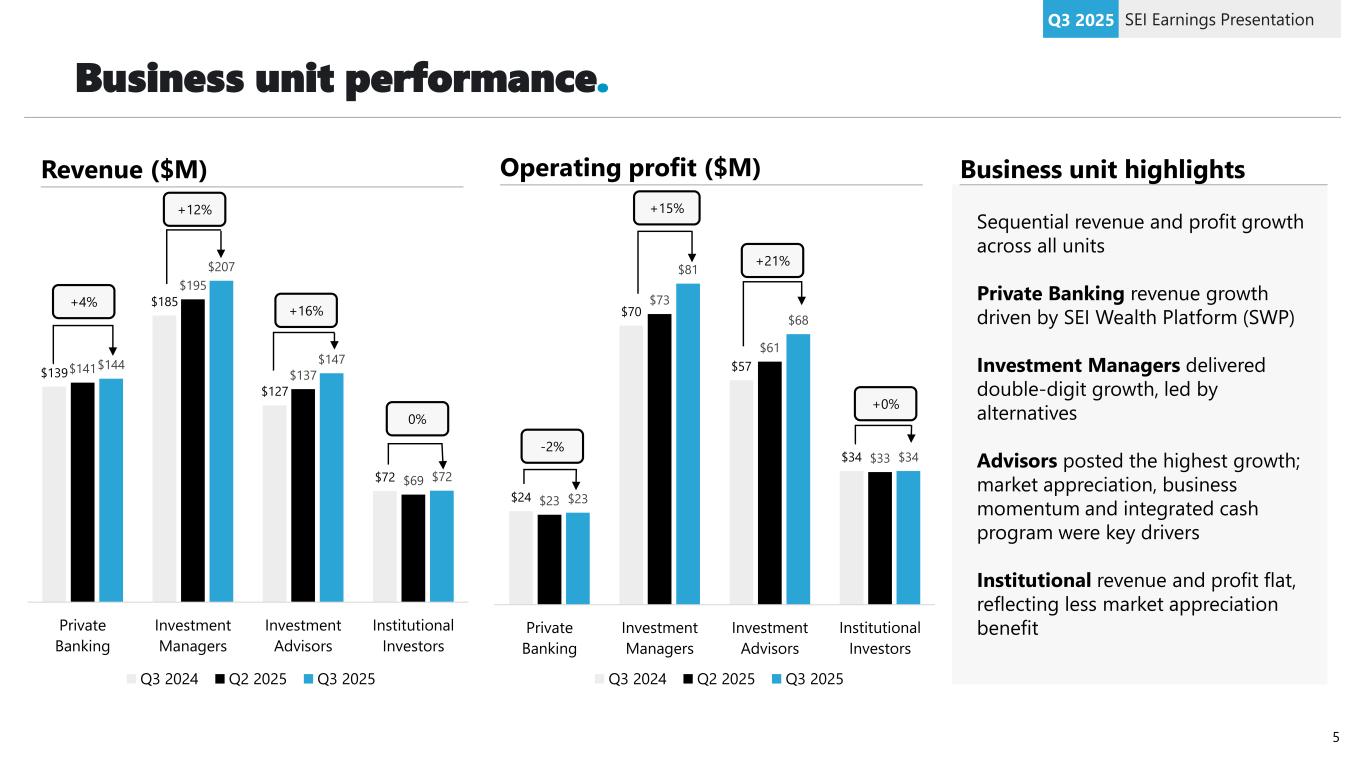
Business unit performance. SEI Earnings PresentationQ3 2025 Revenue ($M) Sequential revenue and profit growth across all units Private Banking revenue growth driven by SEI Wealth Platform (SWP) Investment Managers delivered double-digit growth, led by alternatives Advisors posted the highest growth; market appreciation, business momentum and integrated cash program were key drivers Institutional revenue and profit flat, reflecting less market appreciation benefit Business unit highlightsOperating profit ($M) $139 $185 $127 $72 $141 $195 $137 $69 $144 $207 $147 $72 Private Banking Investment Managers Investment Advisors Institutional Investors Q3 2024 Q2 2025 Q3 2025 $24 $70 $57 $34 $23 $73 $61 $33 $23 $81 $68 $34 Private Banking Investment Managers Investment Advisors Institutional Investors Q3 2024 Q2 2025 Q3 2025 +4% +12% +16% 0% -2% +15% +21% +0% 5
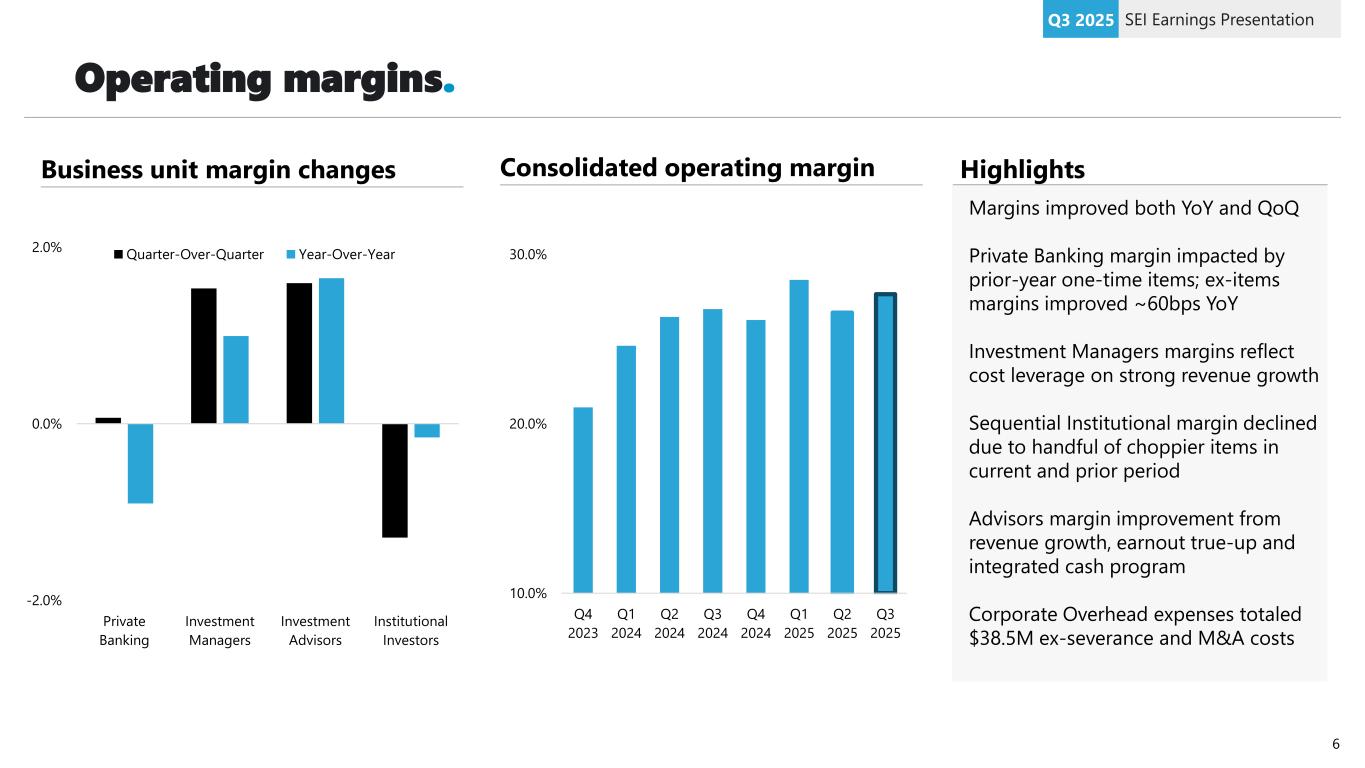
Operating margins. SEI Earnings PresentationQ3 2025 -2.0% 0.0% 2.0% Private Banking Investment Managers Investment Advisors Institutional Investors Quarter-Over-Quarter Year-Over-Year Business unit margin changes HighlightsConsolidated operating margin 10.0% 20.0% 30.0% Q4 2023 Q1 2024 Q2 2024 Q3 2024 Q4 2024 Q1 2025 Q2 2025 Q3 2025 Margins improved both YoY and QoQ Private Banking margin impacted by prior-year one-time items; ex-items margins improved ~60bps YoY Investment Managers margins reflect cost leverage on strong revenue growth Sequential Institutional margin declined due to handful of choppier items in current and prior period Advisors margin improvement from revenue growth, earnout true-up and integrated cash program Corporate Overhead expenses totaled $38.5M ex-severance and M&A costs 6
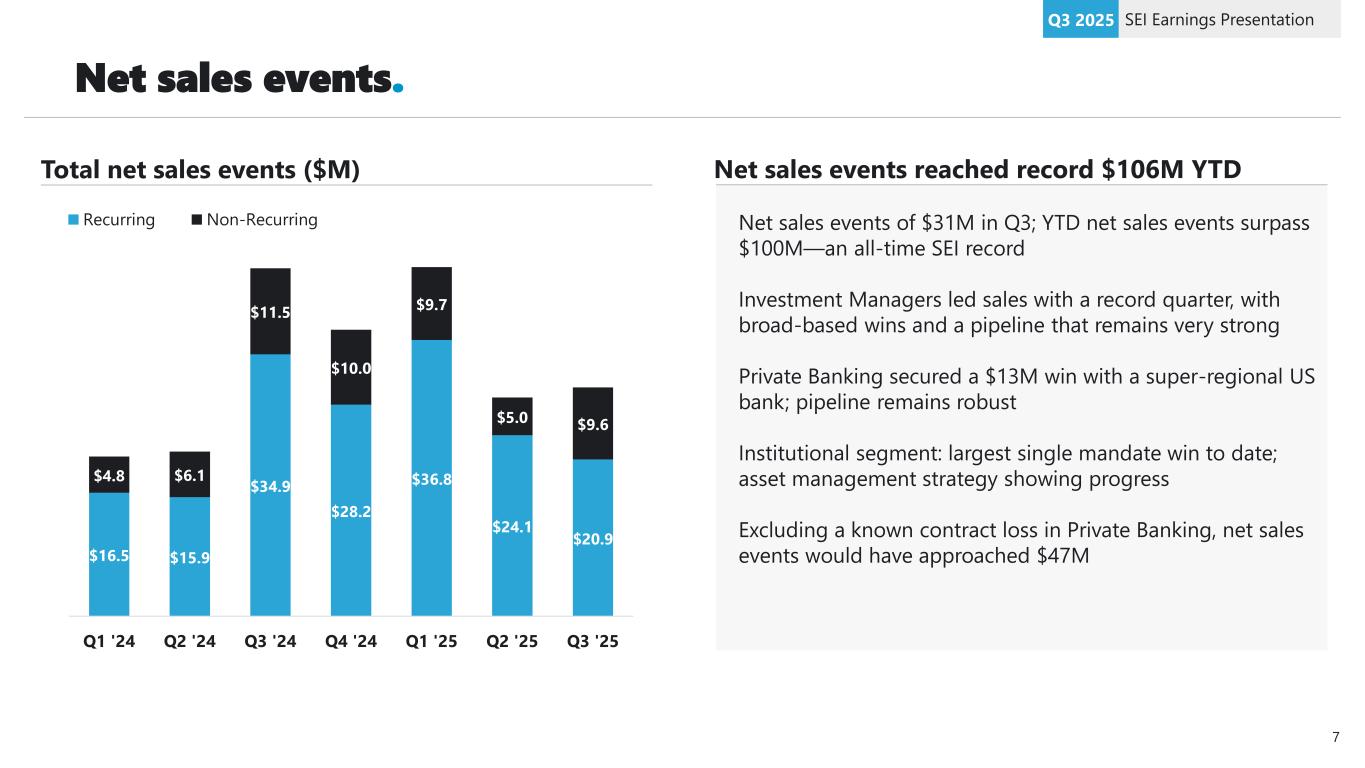
Net sales events. SEI Earnings PresentationQ3 2025 $16.5 $15.9 $34.9 $28.2 $36.8 $24.1 $20.9 $4.8 $6.1 $11.5 $10.0 $9.7 $5.0 $9.6 Q1 '24 Q2 '24 Q3 '24 Q4 '24 Q1 '25 Q2 '25 Q3 '25 Recurring Non-Recurring Total net sales events ($M) Net sales events of $31M in Q3; YTD net sales events surpass $100M—an all-time SEI record Investment Managers led sales with a record quarter, with broad-based wins and a pipeline that remains very strong Private Banking secured a $13M win with a super-regional US bank; pipeline remains robust Institutional segment: largest single mandate win to date; asset management strategy showing progress Excluding a known contract loss in Private Banking, net sales events would have approached $47M Net sales events reached record $106M YTD 7
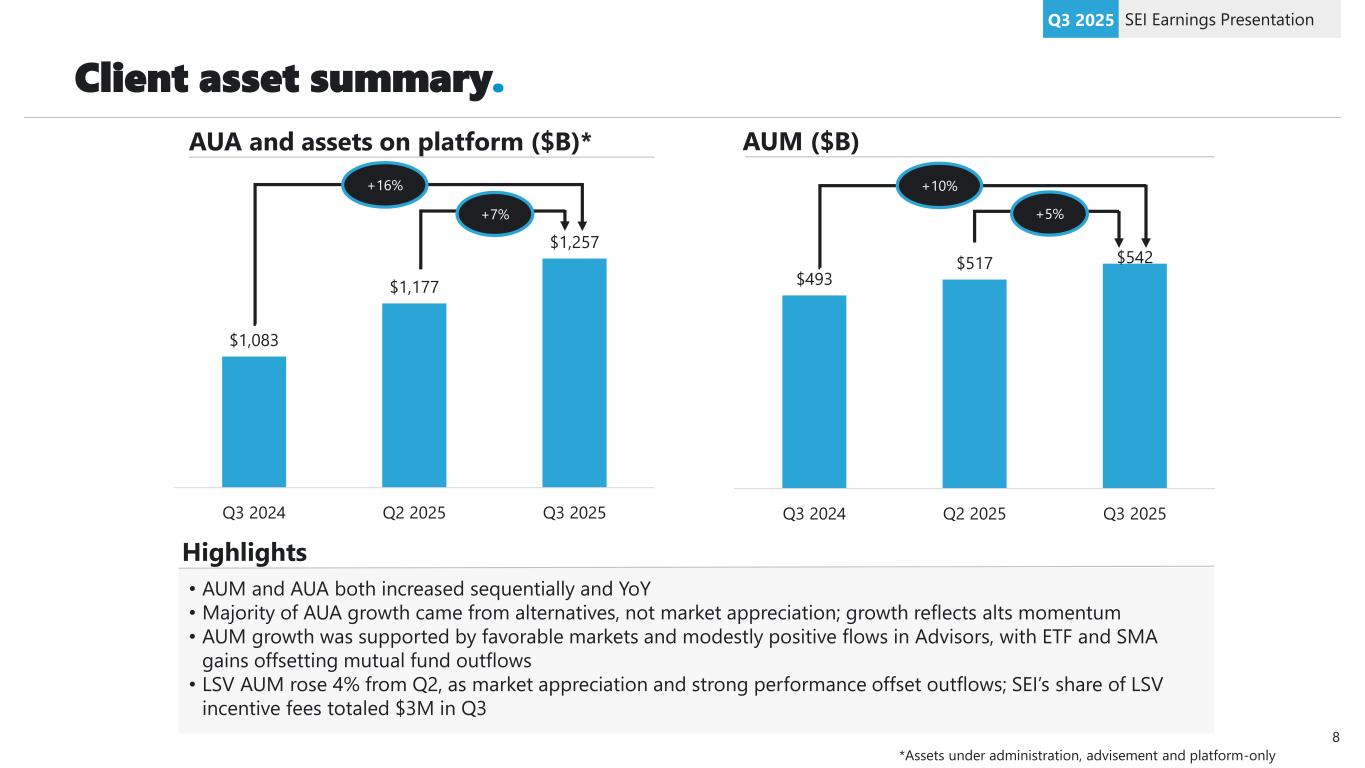
Client asset summary. SEI Earnings PresentationQ3 2025 AUA and assets on platform ($B)* AUM ($B) $1,083 $1,177 $1,257 Q3 2024 Q2 2025 Q3 2025 +16% +7% $493 $517 $542 Q3 2024 Q2 2025 Q3 2025 +10% +5% Highlights • AUM and AUA both increased sequentially and YoY • Majority of AUA growth came from alternatives, not market appreciation; growth reflects alts momentum • AUM growth was supported by favorable markets and modestly positive flows in Advisors, with ETF and SMA gains offsetting mutual fund outflows • LSV AUM rose 4% from Q2, as market appreciation and strong performance offset outflows; SEI’s share of LSV incentive fees totaled $3M in Q3 *Assets under administration, advisement and platform-only 8
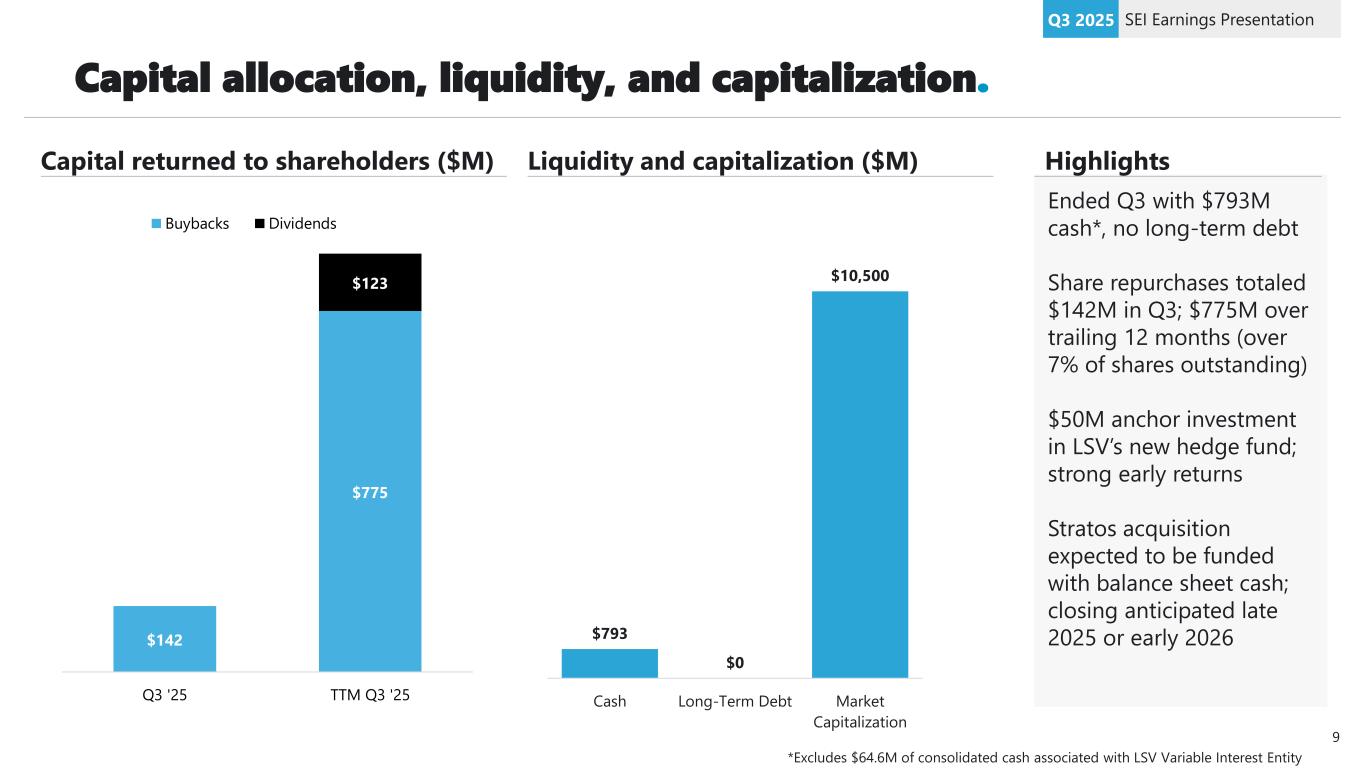
Capital allocation, liquidity, and capitalization. SEI Earnings PresentationQ3 2025 Capital returned to shareholders ($M) Liquidity and capitalization ($M) $793 $0 $10,500 Cash Long-Term Debt Market Capitalization Ended Q3 with $793M cash*, no long-term debt Share repurchases totaled $142M in Q3; $775M over trailing 12 months (over 7% of shares outstanding) $50M anchor investment in LSV’s new hedge fund; strong early returns Stratos acquisition expected to be funded with balance sheet cash; closing anticipated late 2025 or early 2026 Highlights 9 $142 $775 $123 Q3 '25 TTM Q3 '25 Buybacks Dividends *Excludes $64.6M of consolidated cash associated with LSV Variable Interest Entity

For institutional investor and financial advisor use only. Not for distribution to general public. Thank you. 10