CVB financial corp. January 2026 cbbank.com
CVB financial corp. January 2026 cbbank.com
Forward Looking Statements CAUTIONARY NOTE REGARDING FORWARD-LOOKING STATEMENTS This communication may contain certain forward-looking statements, including, but not limited to, certain plans, expectations, goals, projections, and statements about the benefits of the proposed transaction (including statements about the future financial and operating results and impact on CVBF’s earnings and tangible book value per share), the plans, objectives, expectations and intentions of CVB Financial Corp. (“CVBF”) and Heritage Commerce Corp (“Heritage”), the expected timing of completion of the transaction, and other statements that are not historical facts. Such statements are subject to numerous assumptions, risks, estimates, uncertainties and other important factors that may change over time and could cause actual results to differ materially from any results, performance, or events expressed or implied by such forward-looking statements, including as a result of the factors referenced below. Statements that do not describe historical or current facts, including statements about beliefs and expectations, are forward-looking statements. Forward-looking statements may be identified by words such as expect, anticipate, project, continue, believe, intend, estimate, plan, trend, objective, target, goal, or similar expressions, or future or conditional verbs such as will, may, might, should, would, could, or similar variations. The forward-looking statements are intended to be subject to the safe harbor provided by Section 27A of the Securities Act of 1933, Section 21E of the Securities Exchange Act of 1934, and the Private Securities Litigation Reform Act of 1995.
Although there is no assurance that any list of risks and uncertainties or risk factors is complete, below are certain factors which could cause actual results to differ materially from those contained or implied in the forward-looking statements or historical performance: difficulties and delays in integrating Heritage’s business, key personnel and customers into CVBF’s business and operations, and achieving anticipated synergies, cost savings and other benefits from the transaction; higher than anticipated transaction costs; deposit attrition, operating costs, customer loss and other business disruption following the merger, including difficulties in maintaining relationships with employees; supply and demand for commercial or residential real estate and periodic deterioration in real estate prices and/or values in California or other states where CVBF and Heritage lend; a sharp or prolonged slowdown or decline in real estate construction, sales or leasing activities; CVBF’s or Heritage’s ability to retain and increase market share, to retain and grow customers and to control expenses; the costs or effects of mergers, acquisitions or dispositions CVBF may make, whether CVBF and Heritage are able to obtain any required governmental approvals in connection with any such mergers, acquisitions or dispositions, and/or CVBF’s ability to realize the contemplated financial or business benefits associated with any such mergers, acquisitions or dispositions; CVBF’s or Heritage’s relationships with and reliance upon outside vendors with respect to certain of CVBF’s or Heritage’s key internal and external systems, applications and controls; the occurrence of any event, change or other circumstances that could give rise to the right of one or both of the parties to terminate the Agreement and Plan of Reorganization and Merger to which CVBF and Heritage are parties; changes in the financial performance and/or condition of CVBF’s or Heritage’s borrowers or depositors; fluctuations in CVBF’s or Heritage’s share price before closing, and the resulting impact on CVBF’s ability to raise capital or to make acquisitions, including as a result of the financial performance of the other party prior to closing, or more generally due to broader stock market movements, and the performance of financial companies and peer group companies; CVBF’s ability to recruit and retain key executives, board members and other employees; the failure of CVBF or Heritage to obtain regulatory or shareholder approvals, as applicable, or to satisfy any of the other conditions to the closing of the proposed merger on a timely basis or at all, and the risk that such approvals may result in the imposition of conditions that could adversely affect the combined company after the closing of the proposed transaction or adversely affect the expected benefits of the proposed transaction; the dilution caused by the issuance of shares of CVBF’s common stock in the transaction; possible impairment charges to goodwill, including any impairment that may result from increased volatility in CVBF’s or Heritage’s stock price; possible credit-related impairments or declines in the fair value of loans and securities held by CVBF or Heritage; volatility in the credit and equity markets and its effect on the general economy, and local, regional, national and international economic and market conditions, political events and public health developments and the impact they may have on CVBF or Heritage, their customers and their capital, deposits, assets and liabilities; CVBF’s or Heritage’s ability to attract deposits and other sources of funding or liquidity; changes in general economic, political, or industry conditions, and in conditions impacting the banking industry specifically; catastrophic events or natural disasters, including earthquakes, drought, climate change or extreme weather events that may affect CVBF’s or Heritage’s assets, communications or computer services, customers, employees or third-party vendors; public health crises and pandemics, and their effects on the economic and business environments in which CVBF and Heritage operate; the strength of the United States economy and the strength of the local economies in which we conduct business; the effects of, and changes in, immigration, trade, tariff, monetary, and fiscal policies and laws, including interest rate policies of the Board of Governors of the Federal Reserve System; the impact of changes in financial services policies, laws, regulations, and ongoing or unanticipated regulatory or legal proceedings or outcomes, including those concerning banking, taxes, securities, and insurance, and the application thereof by regulatory agencies; the effectiveness of CVBF’s or Heritage’s risk management framework, quantitative models and ability to manage the risks involved in regulatory, legal or policy changes; the risks associated with CVBF’s or Heritage’s loan portfolios, including the risks of any geographic and industry concentrations; the impact of systemic or non-systemic failures, crisis or adverse developments at other banks on general investor sentiment regarding the stability and liquidity of banks; regulatory or other governmental inquiries or investigations, and/or the results of regulatory examinations or reviews; CVBF’s or Heritage’s ongoing relations with various federal and state regulators, including, but not limited to, the SEC, Federal Reserve Board, FDIC, Office of the Comptroller of the Currency, and California DFPI; and other factors that may affect the future results of CVBF and Heritage. Additional factors that could cause results to differ materially from those described above can be found in CVBF’s Annual Report on Form 10-K for the year ended December 31, 2024 (available here) and subsequently filed Quarterly Reports on Form 10-Q, which are on file with the SEC and available on CVBF’s website at http://www.cbbank.com under the “Investors” tab, and in other documents CVBF files with the SEC, and in Heritage’s Annual Report on Form 10-K for the year ended December 31, 2024 (available here) and subsequently filed Quarterly Reports on Form 10-Q, which are on file with the SEC and available on Heritage’s website, https://www.heritagecommercecorp.com, under the “Investor Relations” tab and in other documents Heritage files with the SEC, and in each case, in particular, the discussion of “Risk Factors” set forth in such filings. All forward-looking statements are expressly qualified in their entirety by the cautionary statements set forth above. Forward-looking statements speak only as of the date they are made and are based on information available at that time. Neither CVBF nor Heritage assumes any obligation to update forward-looking statements to reflect actual results, new information or future events, changes in assumptions or changes in circumstances or other factors affecting forward-looking statements that occur after the date the forward-looking statements were made or to reflect the occurrence of unanticipated events except as required by federal securities laws. If CVBF or Heritage updates one or more forward-looking statements, no inference should be drawn that CVBF or Heritage will make additional updates with respect to those or other forward-looking statements. As forward-looking statements involve significant risks and uncertainties, caution should be exercised against placing undue reliance on such statements. Non-GAAP Financial Measures—Certain financial information provided in this presentation has not been prepared in accordance with U.S. generally accepted accounting principles (“GAAP”) and is presented on a non-GAAP basis. Investors and analysts should refer to the reconciliations included in this presentation and should consider the Company’s non-GAAP measures in addition to, not as a substitute for or as superior to, measures prepared in accordance with GAAP. These non-GAAP measures may or may not be comparable to similarly titled measures used by other companies. cbbank.com 2
Forward Looking Statements ADDITIONAL INFORMATION ABOUT THE PROPOSED MERGER AND WHERE TO FIND IT In connection with the proposed merger, CVBF will file with the SEC a Registration Statement on Form S-4 that will include a Joint Proxy Statement of CVBF and Heritage and a Prospectus of CVBF (the “Joint Proxy Statement/Prospectus”), as well as other relevant documents concerning the Mergers. Certain matters in respect of the proposed merger involving CVBF and Heritage will be submitted to CVBF’s shareholders or Heritage’s shareholders, as applicable, for their consideration. This communication does not constitute an offer to sell or the solicitation of an offer to buy any securities or a solicitation of any vote or approval, nor shall there be any sale of securities, in any jurisdiction in which such offer, solicitation or sale would be unlawful prior to registration or qualification under the securities laws of any such jurisdiction. Before making any voting or investment decision, security holders of CVBF and security holders of Heritage are urged to carefully read the entire registration statement and the Joint Proxy Statement/Prospectus, when they become available, as well as any amendments or supplements to these documents, because they will contain important information about the proposed merger. The documents filed by CVBF and Heritage with the SEC may be obtained free of charge at the SEC’s website at www.sec.gov. In addition, the documents filed by CVBF may be obtained free of charge at CVBF’s website at http://www.cbbank.com under the “Investors” tab or at Heritage’s website at http://www.heritagecommercecorp.com under the “Investor Relations” tab. Alternatively, these documents, when available, can be obtained free of charge by directing a written request to CVBF, Attention: Investor Relations, 701 North Haven Avenue, Ontario, CA 91764, or by calling (909) 980-4030, or to Heritage Commerce Corp, Attention: Investor Relations, 224 Airport Parkway, San Jose, CA 95110, or by calling (408) 947-6900. PARTICIPANTS IN THE SOLICITATION CVBF, Heritage, and certain of their respective directors and executive officers may be deemed to be participants in the solicitation of proxies from CVBF’s shareholders or Heritage’s shareholders in connection with the proposed merger under the rules of the SEC. Information regarding CVBF’s directors and executive officers is available in the sections entitled “Directors, Executive Officers and Corporate Governance” and “Security Ownership of Certain Beneficial Owners and Management and Related Stockholder Matters” in CVBF’s Annual Report on Form 10-K for the fiscal year ended December 31, 2024, which was filed with the SEC on February 28, 2025 (available here); in the sections entitled “Board Oversight and Structure,” “Our Executive Officers,” “The Nominees” “Certain Relationships and Related Person Transactions,” “Director Compensation,” “Compensation Arrangements with our President and Chief Executive Officer,” “Compensation Arrangements with our Other Named Executive Officers,” “Summary of Compensation Table” and “How Much Stock Do CVB Financial Corp.’s Directors and Executive Officers Own” in CVBF’s definitive proxy statement relating to its 2025 Annual Meeting of Shareholders, which was filed with the SEC on April 8, 2025 (available here); in the Form 8-K filed with the SEC on October 23, 2025 regarding the election of a new director (available here); and in other documents filed by CVBF with the SEC. Information regarding Heritage’s directors and executive officers is available in the sections entitled “Directors, Executive Officers and Corporate Governance” and “Security Ownership of Certain Beneficial Owners and Management and Related Stockholder Matters” in Heritage’s Annual Report on Form 10-K for the fiscal year ended December 31, 2024, which was filed with the SEC on March 10, 2025 (available here); in the sections entitled “The Board and Corporate Governance,” “Director Compensation,” “Our Executive Officers,” “Executive Compensation,” “Beneficial Ownership of Common Stock,” and “Transactions with Management” in Heritage’s definitive proxy statement relating to its 2025 Annual Meeting of Shareholders, which was filed with the SEC on April 7, 2025 (available here); and in other documents filed by Heritage with the SEC. To the extent holdings of CVBF’s common stock by the CVBF directors and executive officers, or holdings of Heritage’s common stock by the Heritage directors and executive officers, have changed from the amounts held by such persons as reflected in the documents described above, such changes have been or will be reflected on Statements of Change in Ownership on Form 4 filed with the SEC (available at https://www.sec.gov/edgar/browse/?CIK=354647&owner=exclude, in the case of CVBF, and available at https://www.sec.gov/edgar/browse/?CIK=1053352&owner=exclude, in the case of Heritage). Other information regarding the participants in the proxy solicitation and a description of their direct and indirect interests, by security holdings or otherwise, will be contained in the Joint Proxy Statement/Prospectus relating to the proposed merger. Free copies of this document and the above-mentioned Joint Proxy Statement/Prospectus when it becomes available, may be obtained as described in the preceding section titled “Additional Information About the Proposed Merger and Where to Find It.” cbbank.com 3
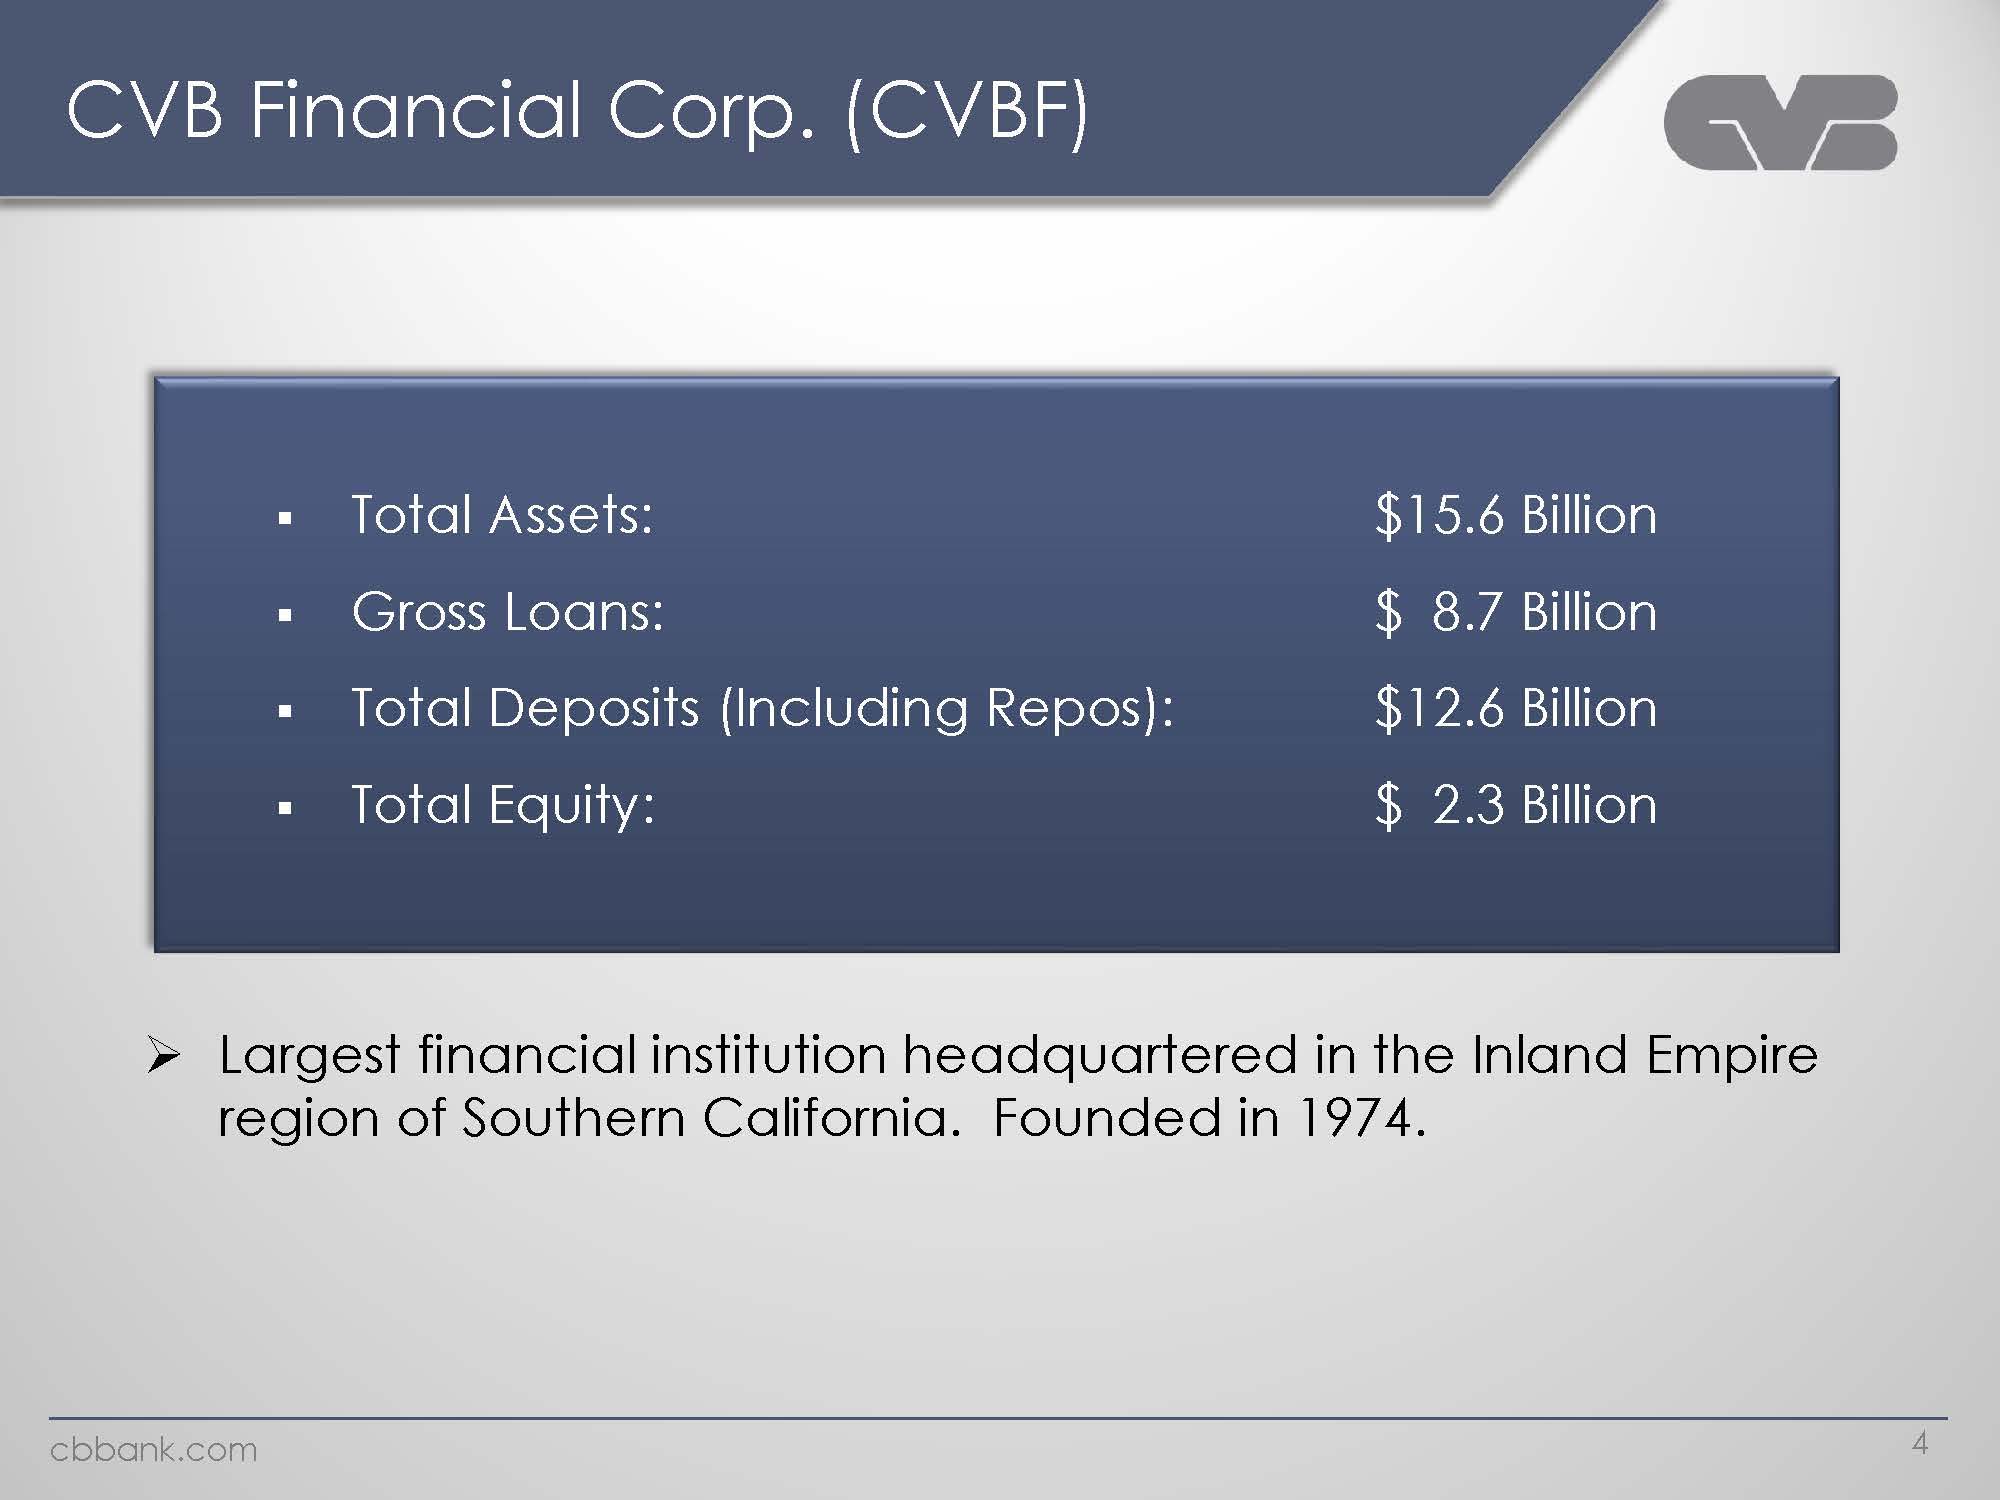
CVB Financial Corp. (CVBF) Total Assets: $ 15.6 Billion Gross Loans: $ 8.7 Billion Total Deposits (Including Repos): $ 12.6 Billion Total Equity: $ 2.3 Billion Largest financial institution headquartered in the Inland Empire region of Southern California. Founded in 1974. cbbank.com 4
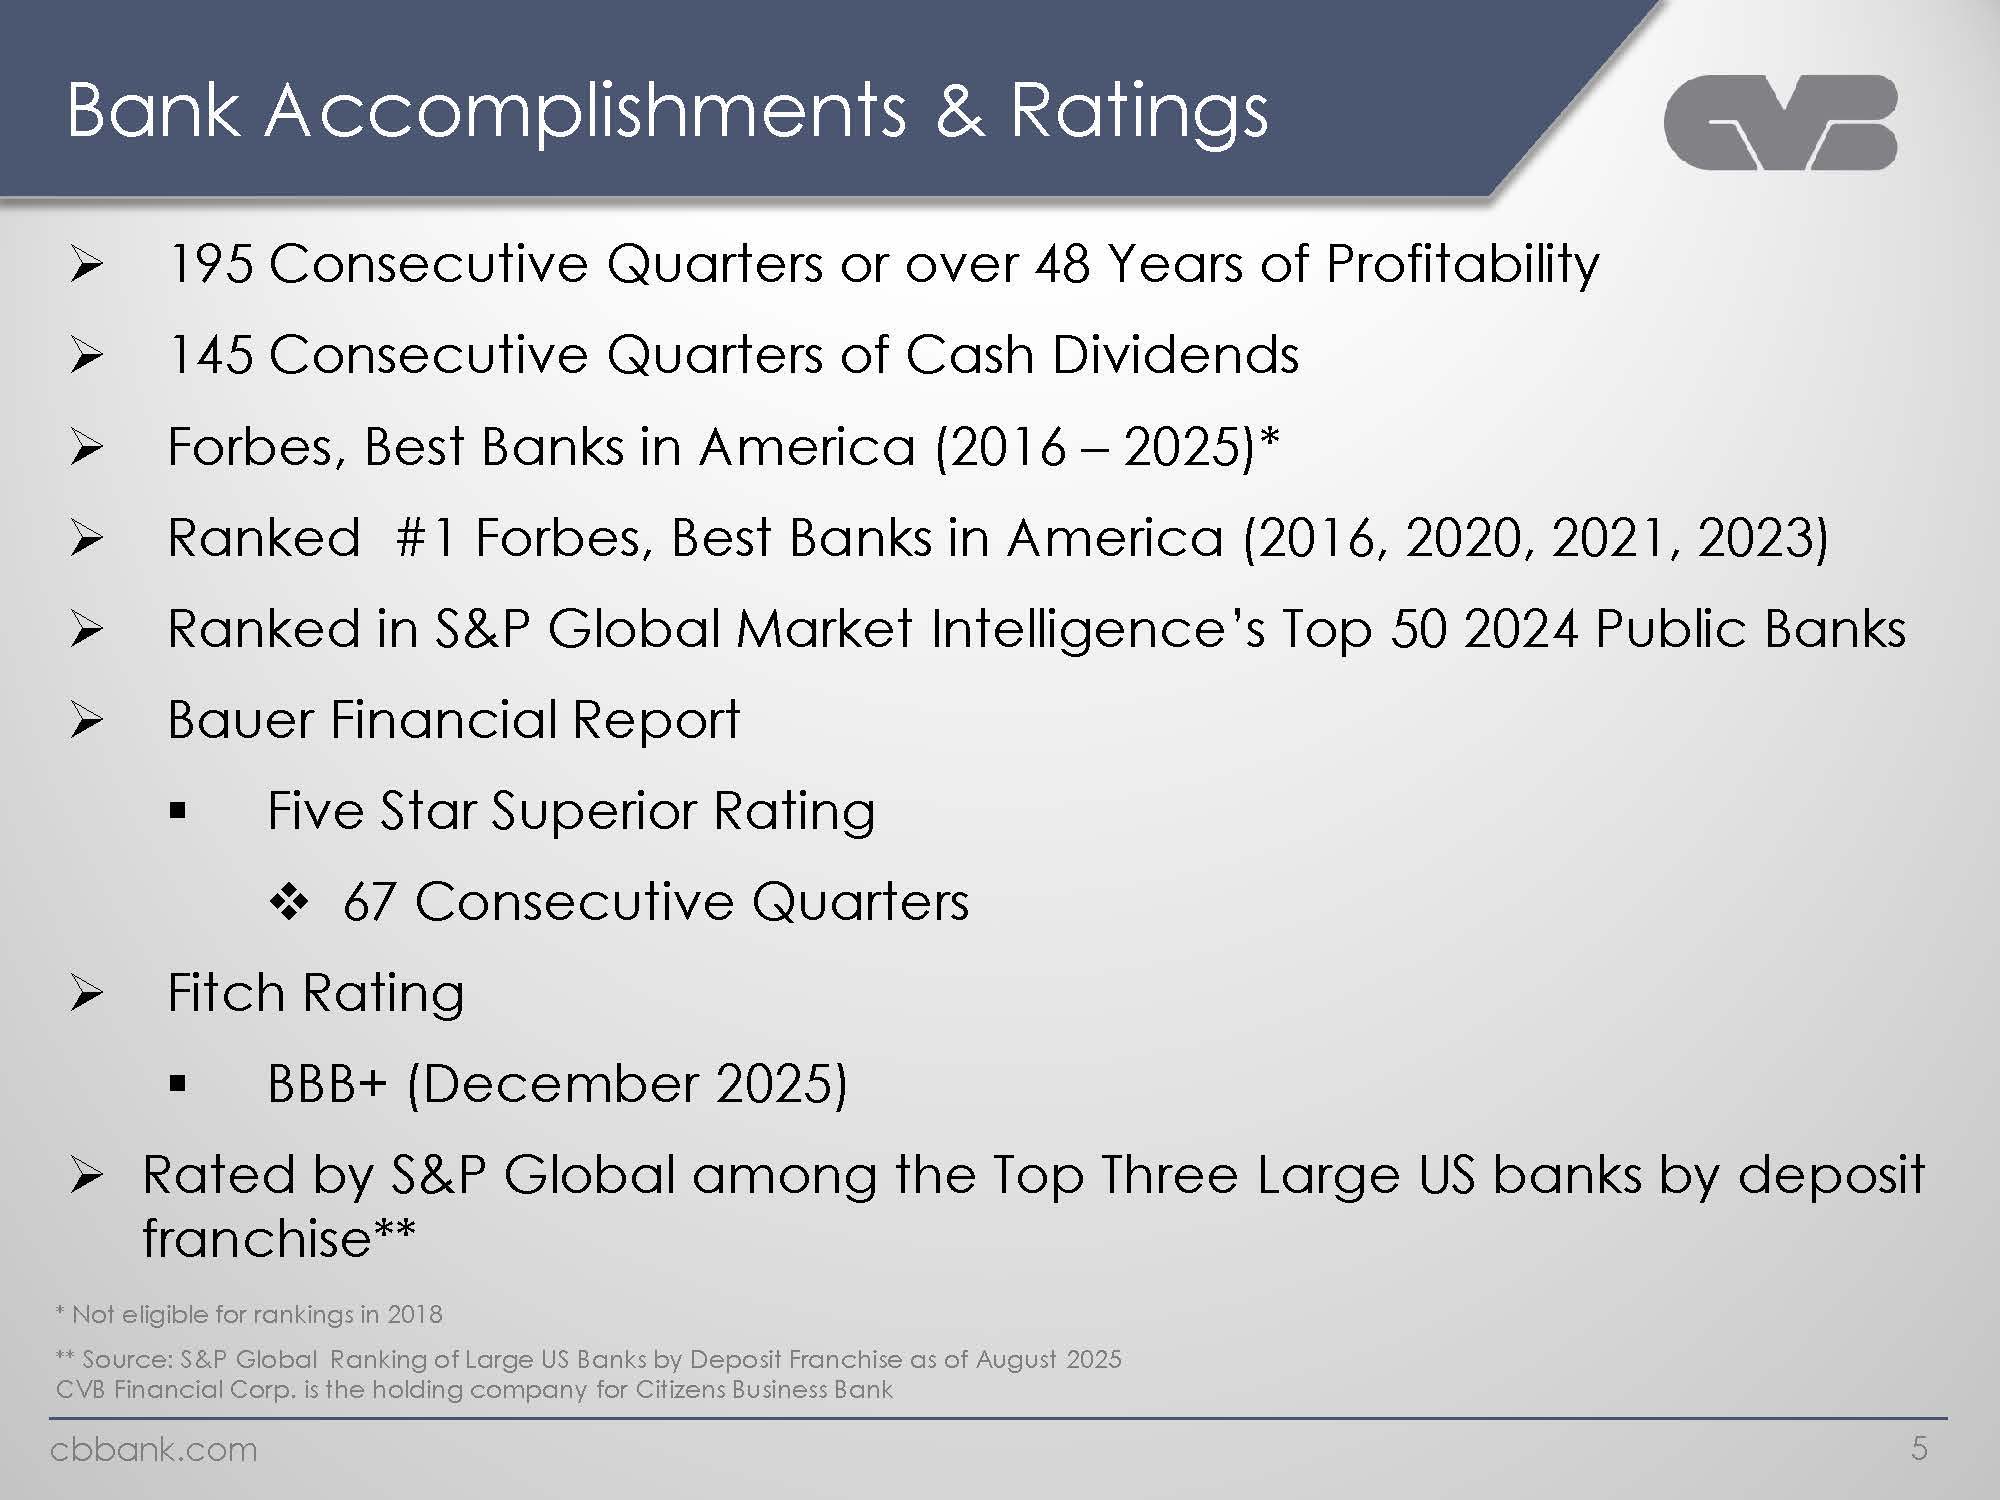
Bank Accomplishments & Ratings 195 Consecutive Quarters or over 48 Years of Profitability 145 Consecutive Quarters of Cash Dividends Forbes, Best Banks in America (2016 – 2025)* Ranked #1 Forbes, Best Banks in America (2016, 2020, 2021, 2023) Ranked in S&P Global Market Intelligence’s Top 50 2024 Public Banks Bauer Financial Report Five Star Superior Rating 67 Consecutive Quarters Fitch Rating BBB+ (December 2025) Rated by S&P Global among the Top Three Large US banks by deposit franchise** * Not eligible for rankings in 2018 ** Source: S&P Global Ranking of Large US Banks by Deposit Franchise as of August 2025 CVB Financial Corp. is the holding company for Citizens Business Bank cbbank.com 5
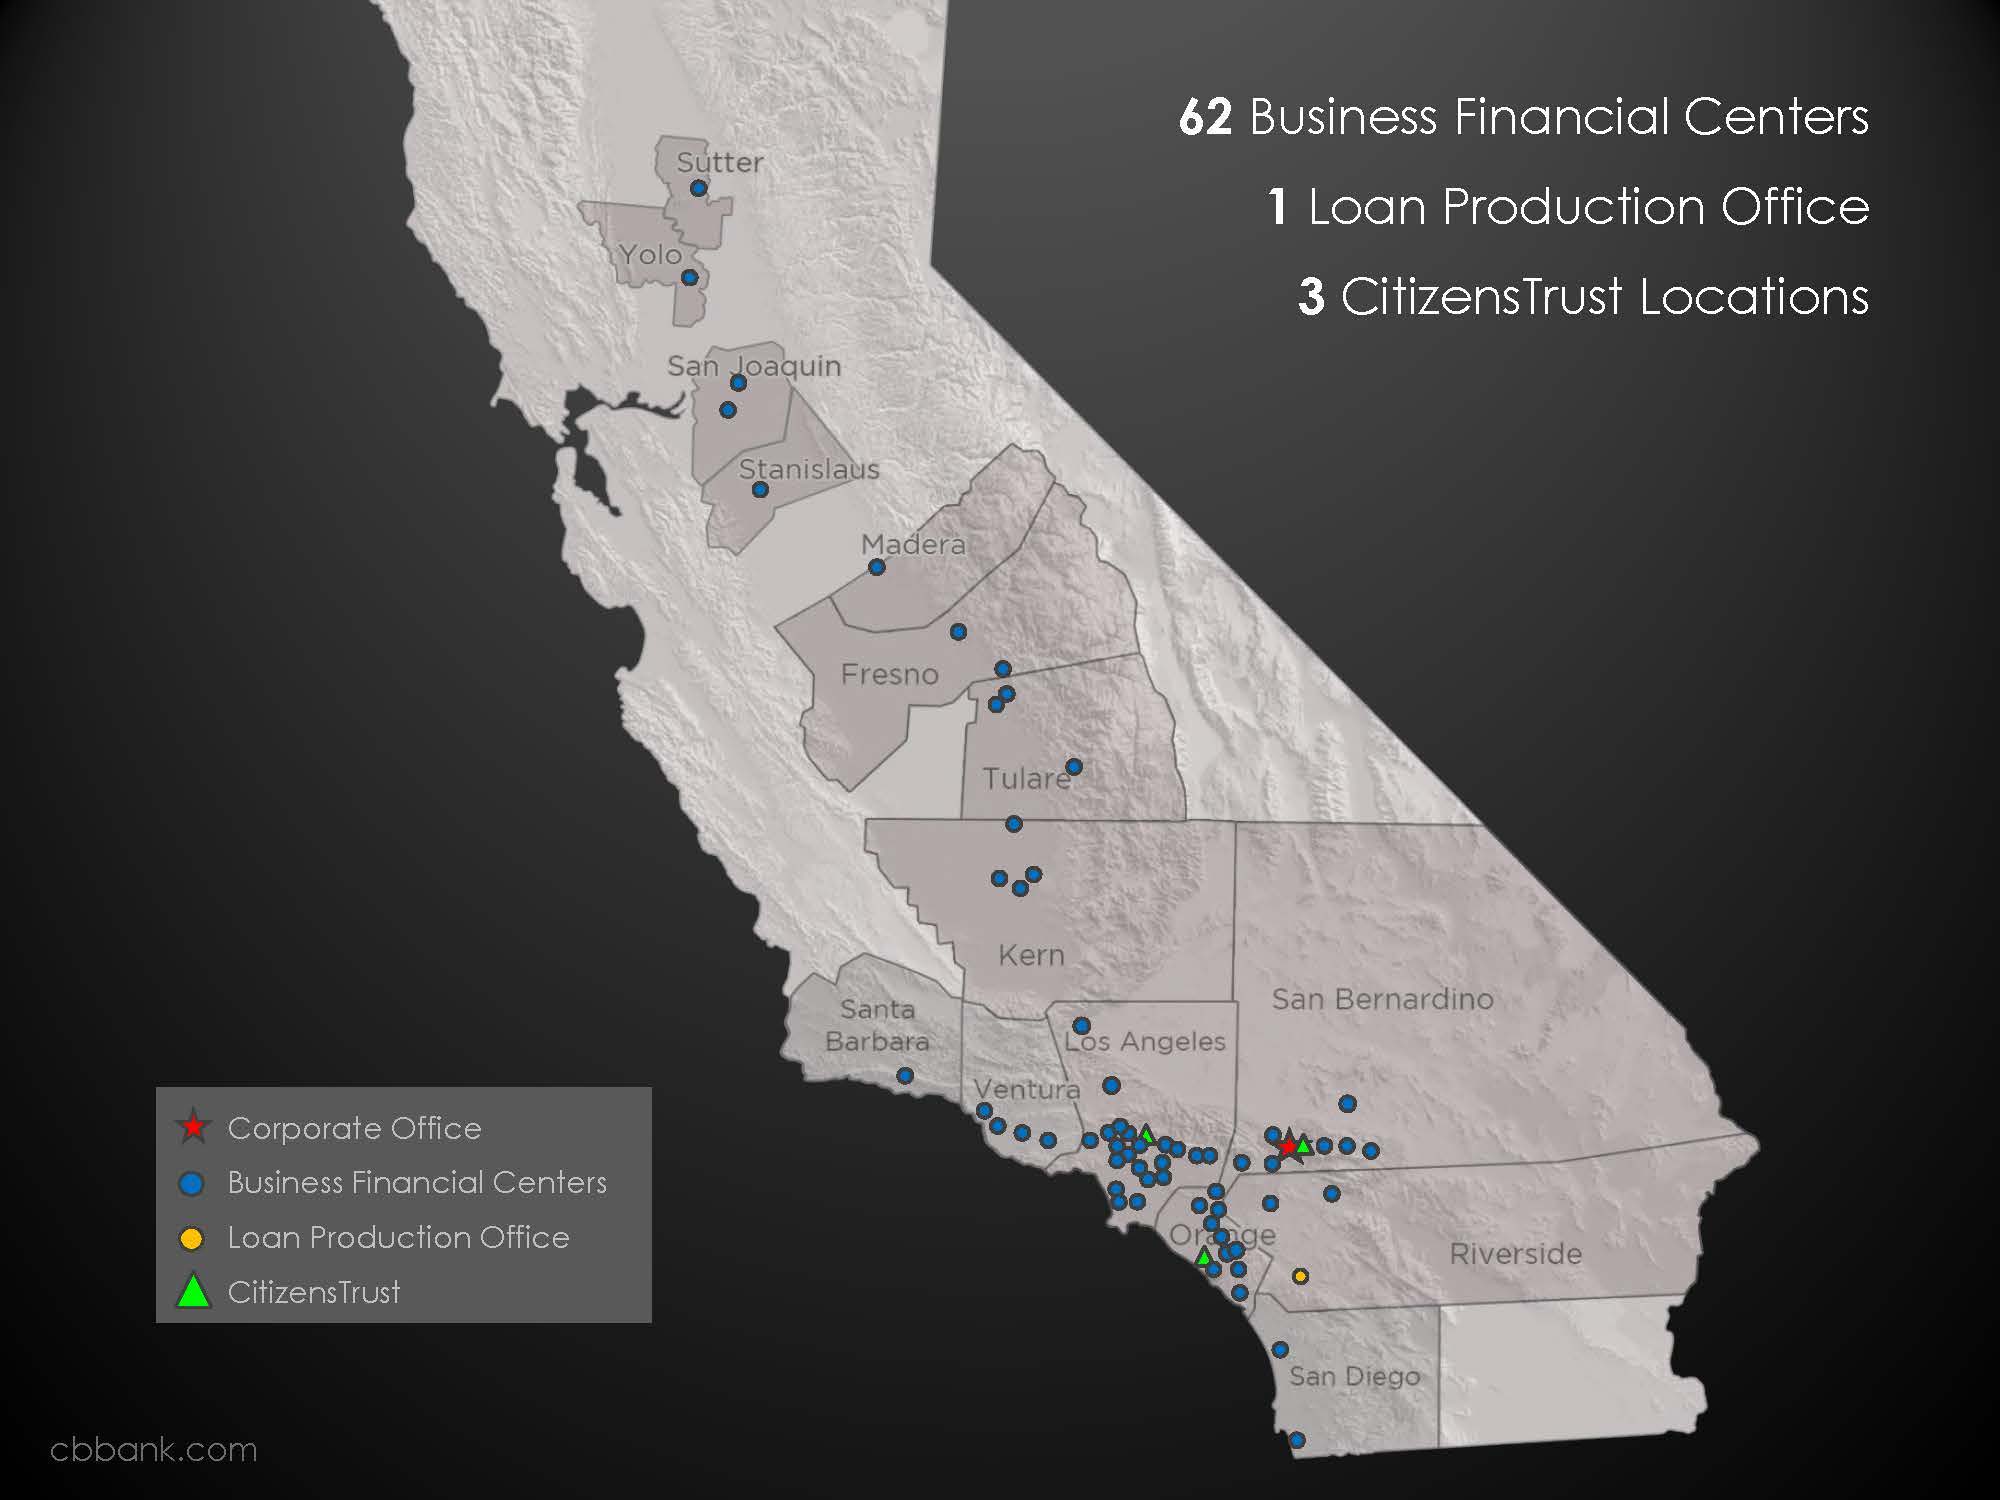
62 Business Financial Centers 1 Loan Production Office 3 CitizensTrust Locations Corporate Office Business Financial Centers Loan Production Office CitizensTrust cbbank.com Sutter Yolo San Joaquin Stanislaus Madera Fresno Tulare Kern Santa Barbara Ventura Los Angeles San Bernardino Riverside San Diego Orange cbbank.com
Our Vision Citizens Business Bank will strive to become the premierfinancial services company operating throughout the state of California, servicing the comprehensive financial needs of successful small to medium sized businesses and their owners.cbbank.com 7
Target Customer The best privately-held and/or family-owned businesses throughout California Annual revenues of $1-300 million Top 25% in their respective industry Full relationship banking Build long-term relationships cbbank.com 8
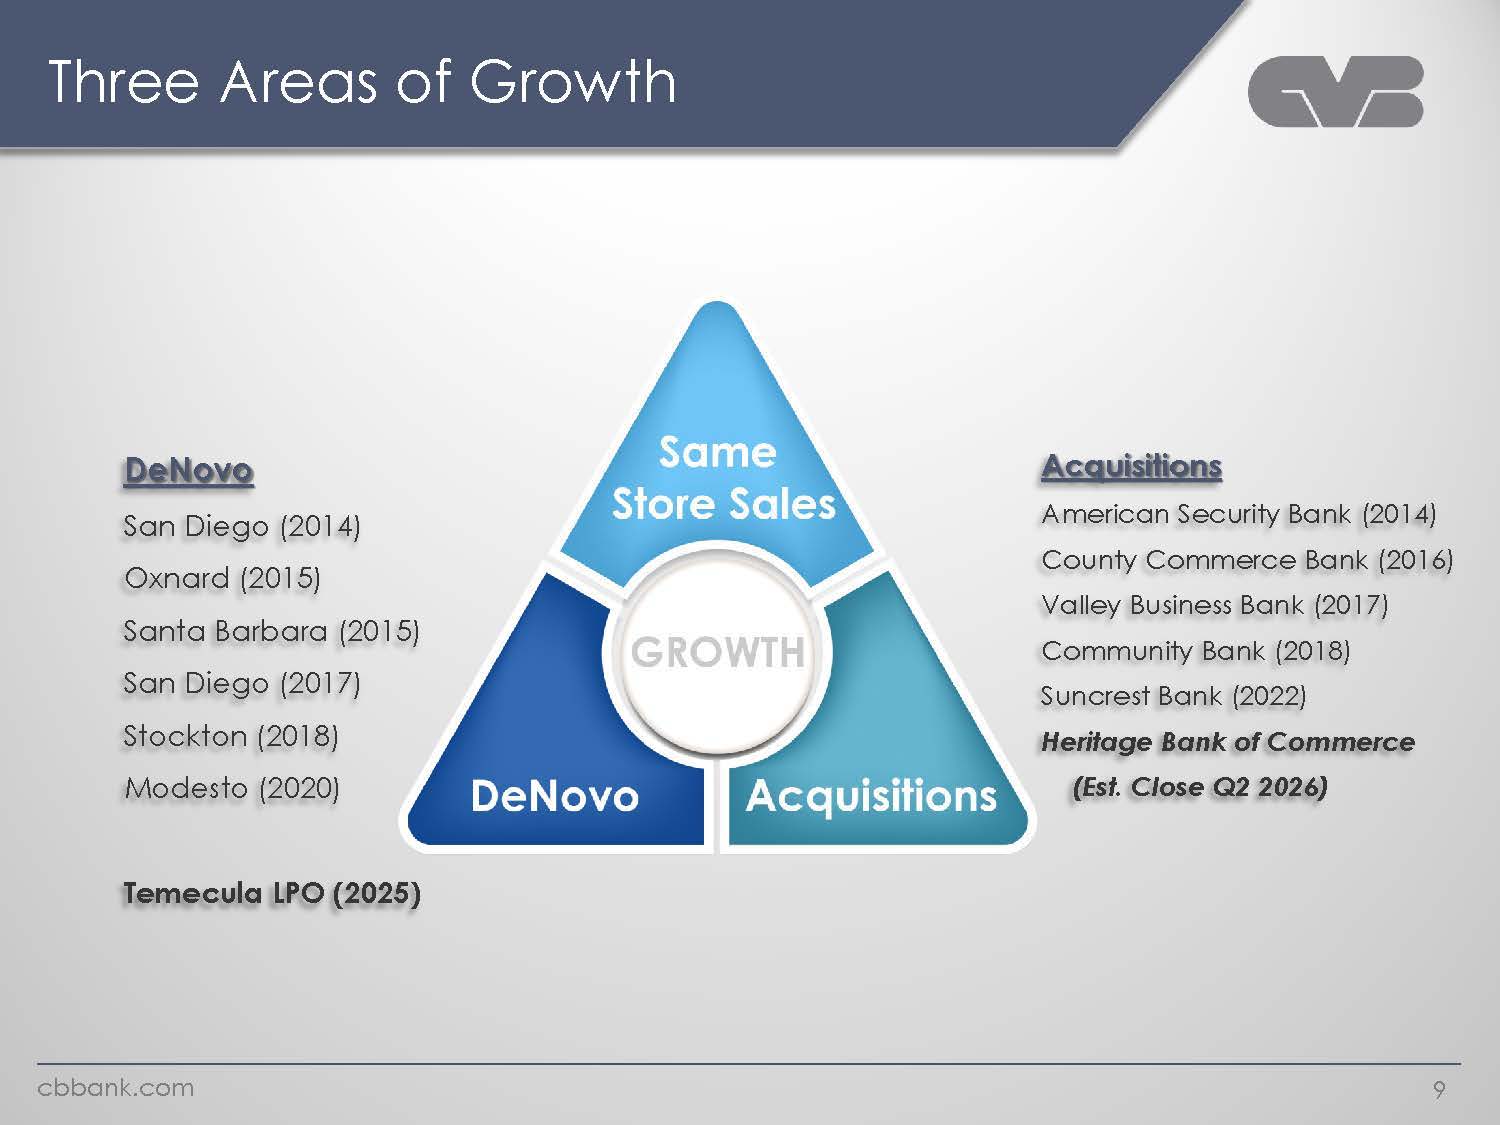
Three Areas of Growth DeNovo San Diego (2014) Oxnard (2015) Santa Barbara (2015) San Diego (2017) Stockton (2018) Modesto (2020) Temecula LPO (2025) Acquisitions American Security Bank (2014) County Commerce Bank (2016) Valley Business Bank (2017) Community Bank (2018) Suncrest Bank (2022) Heritage Bank of Commerce (Est. Close Q2 2026) Same Store Sales Growth DeNovo Acquisitions cbbank.com 9
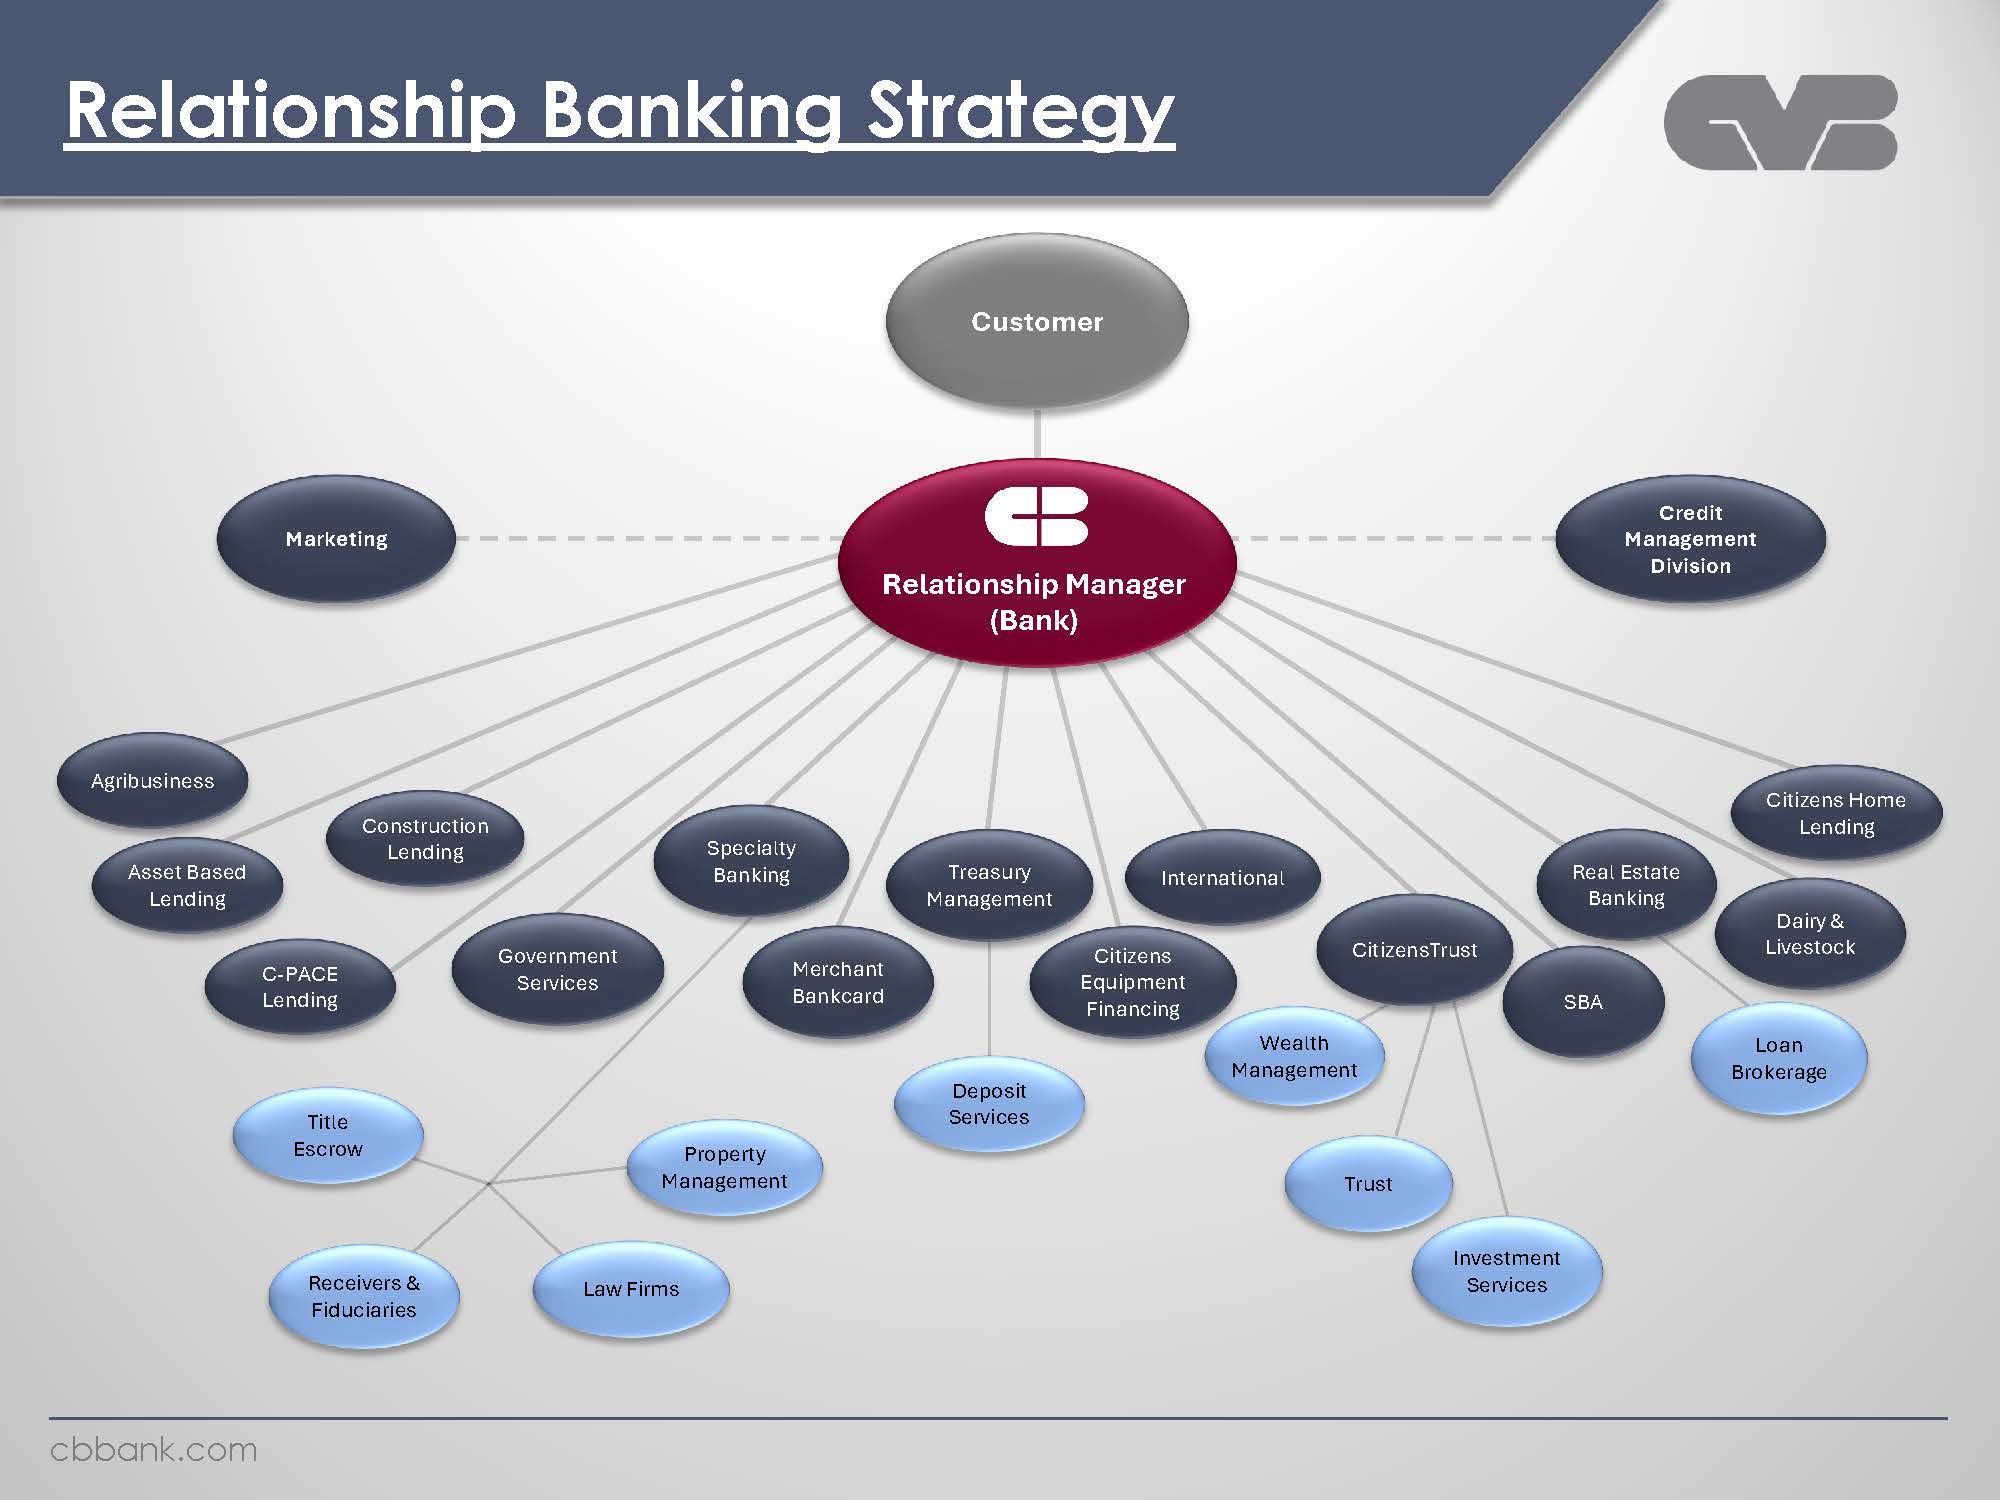
Relationship Banking Strategy Customer Marketing Relationship Manager (Bank) Credit Management Division Agribusiness Asset Based Lending Construction Lending Specialty Banking Treasury Management International CitizensTrust Real Estate Banking Citizens Home Lending C-PACE Lending Government Services Merchant Bankcard Citizens Equipment Financing SBA Dairy & Livestock Title Escrow Property Management Deposit Services Wealth Management Loan Brokerage Receivers & Fiduciaries Law Firms Trust Investment Services cbbank.com
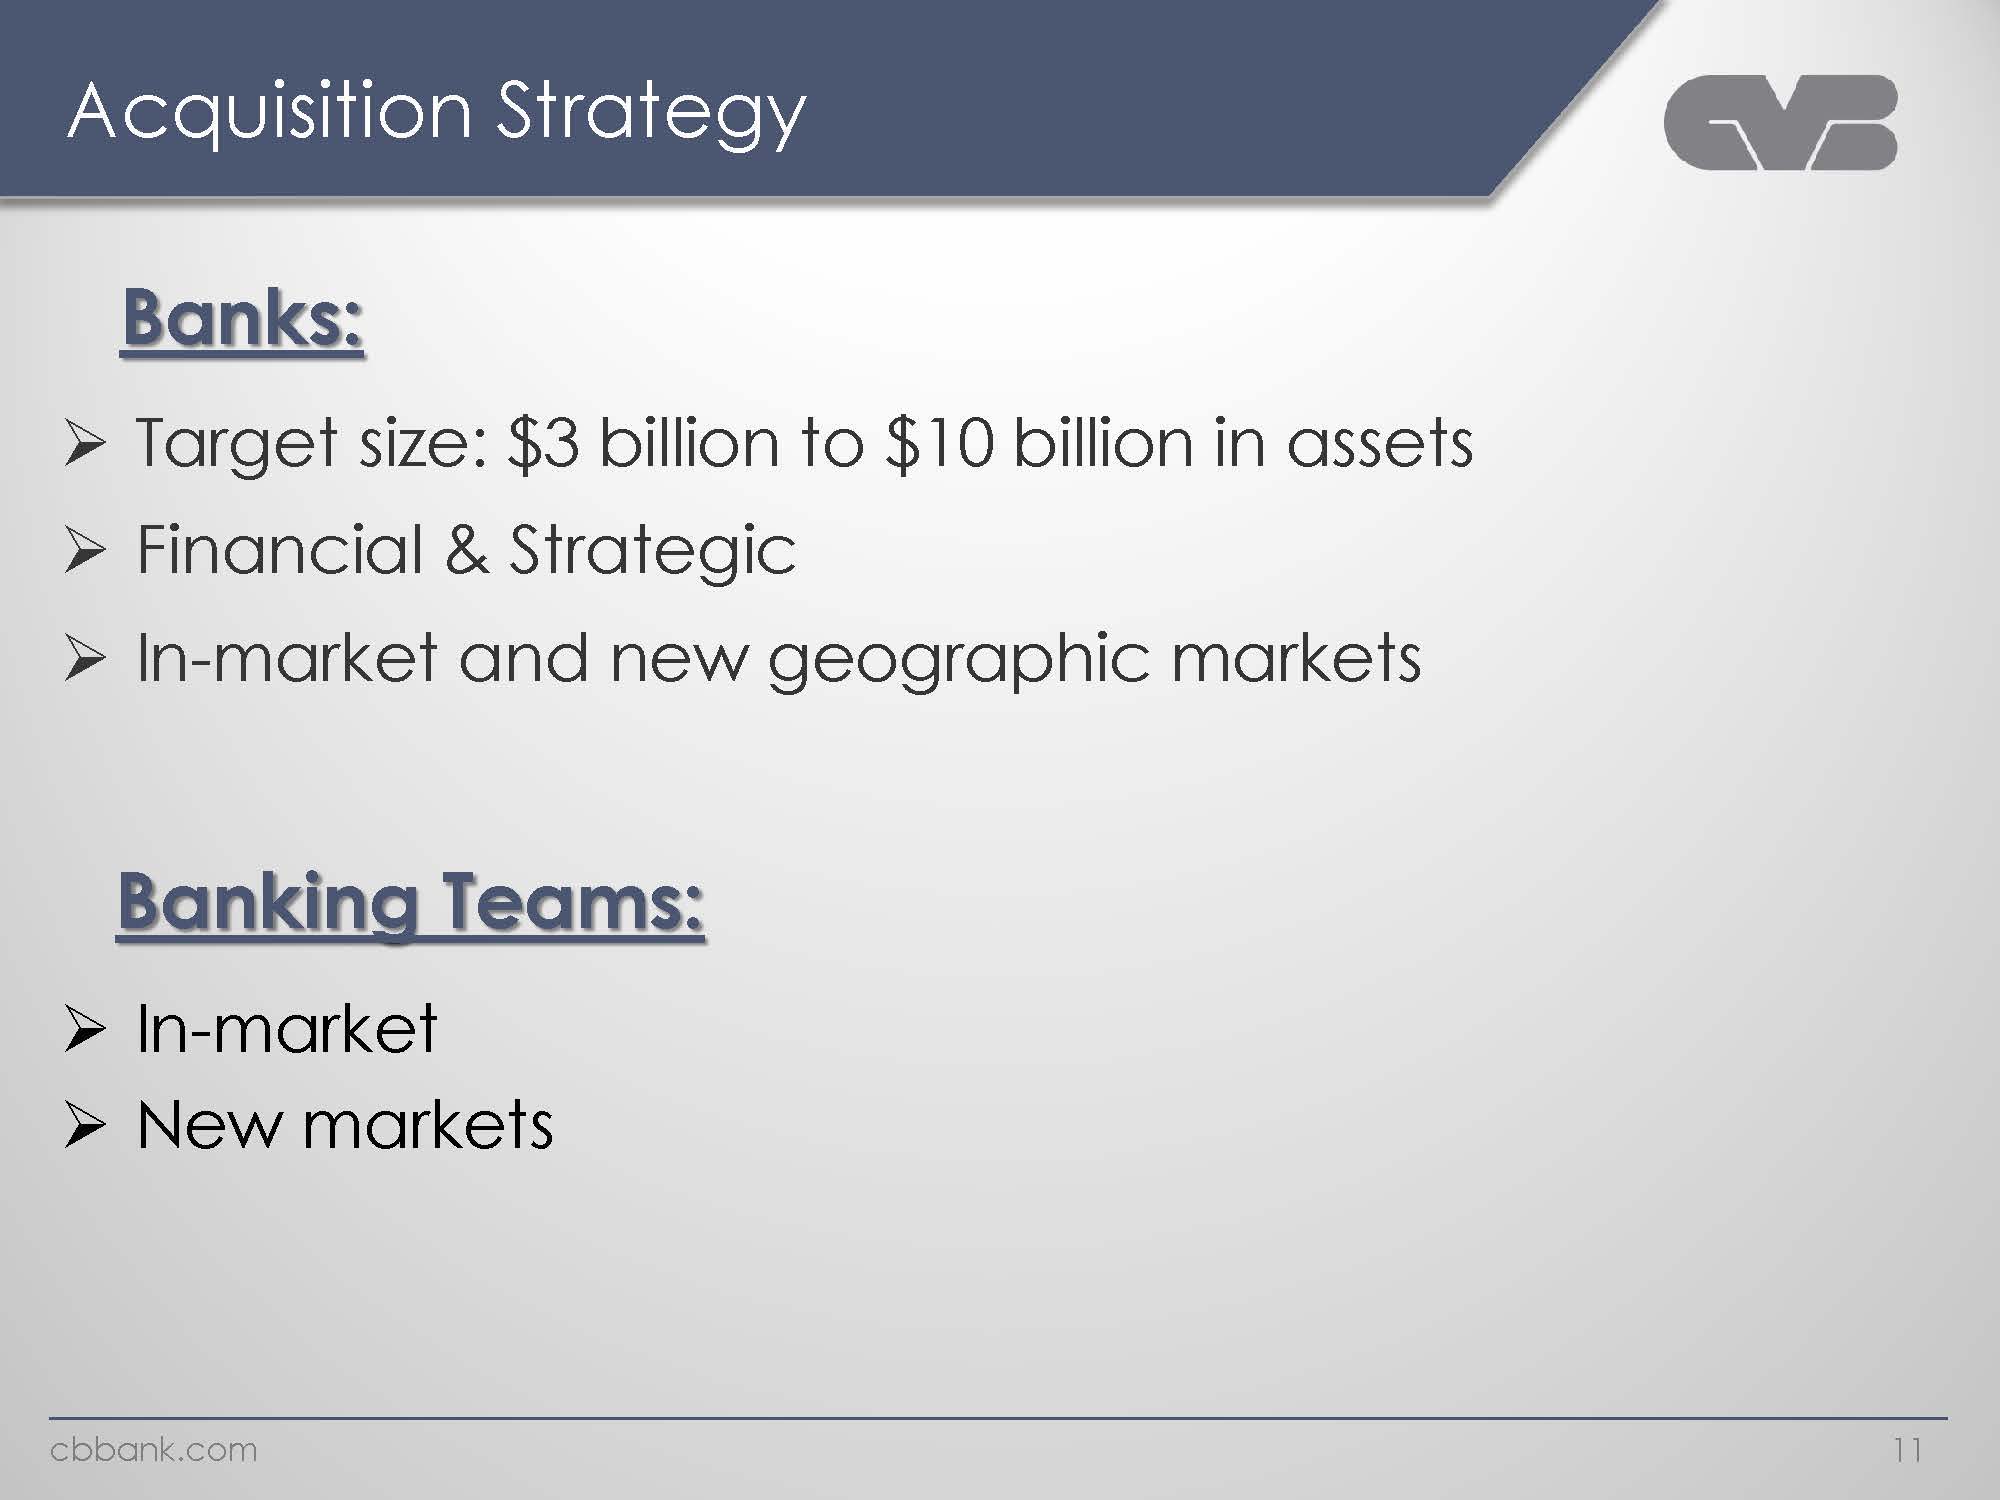
Acquisition Strategy Banks: Target size: $3 billion to $10 billion in assets Financial & Strategic In-market and new geographic markets Banking Teams: In-market New markets cbbank.com.11
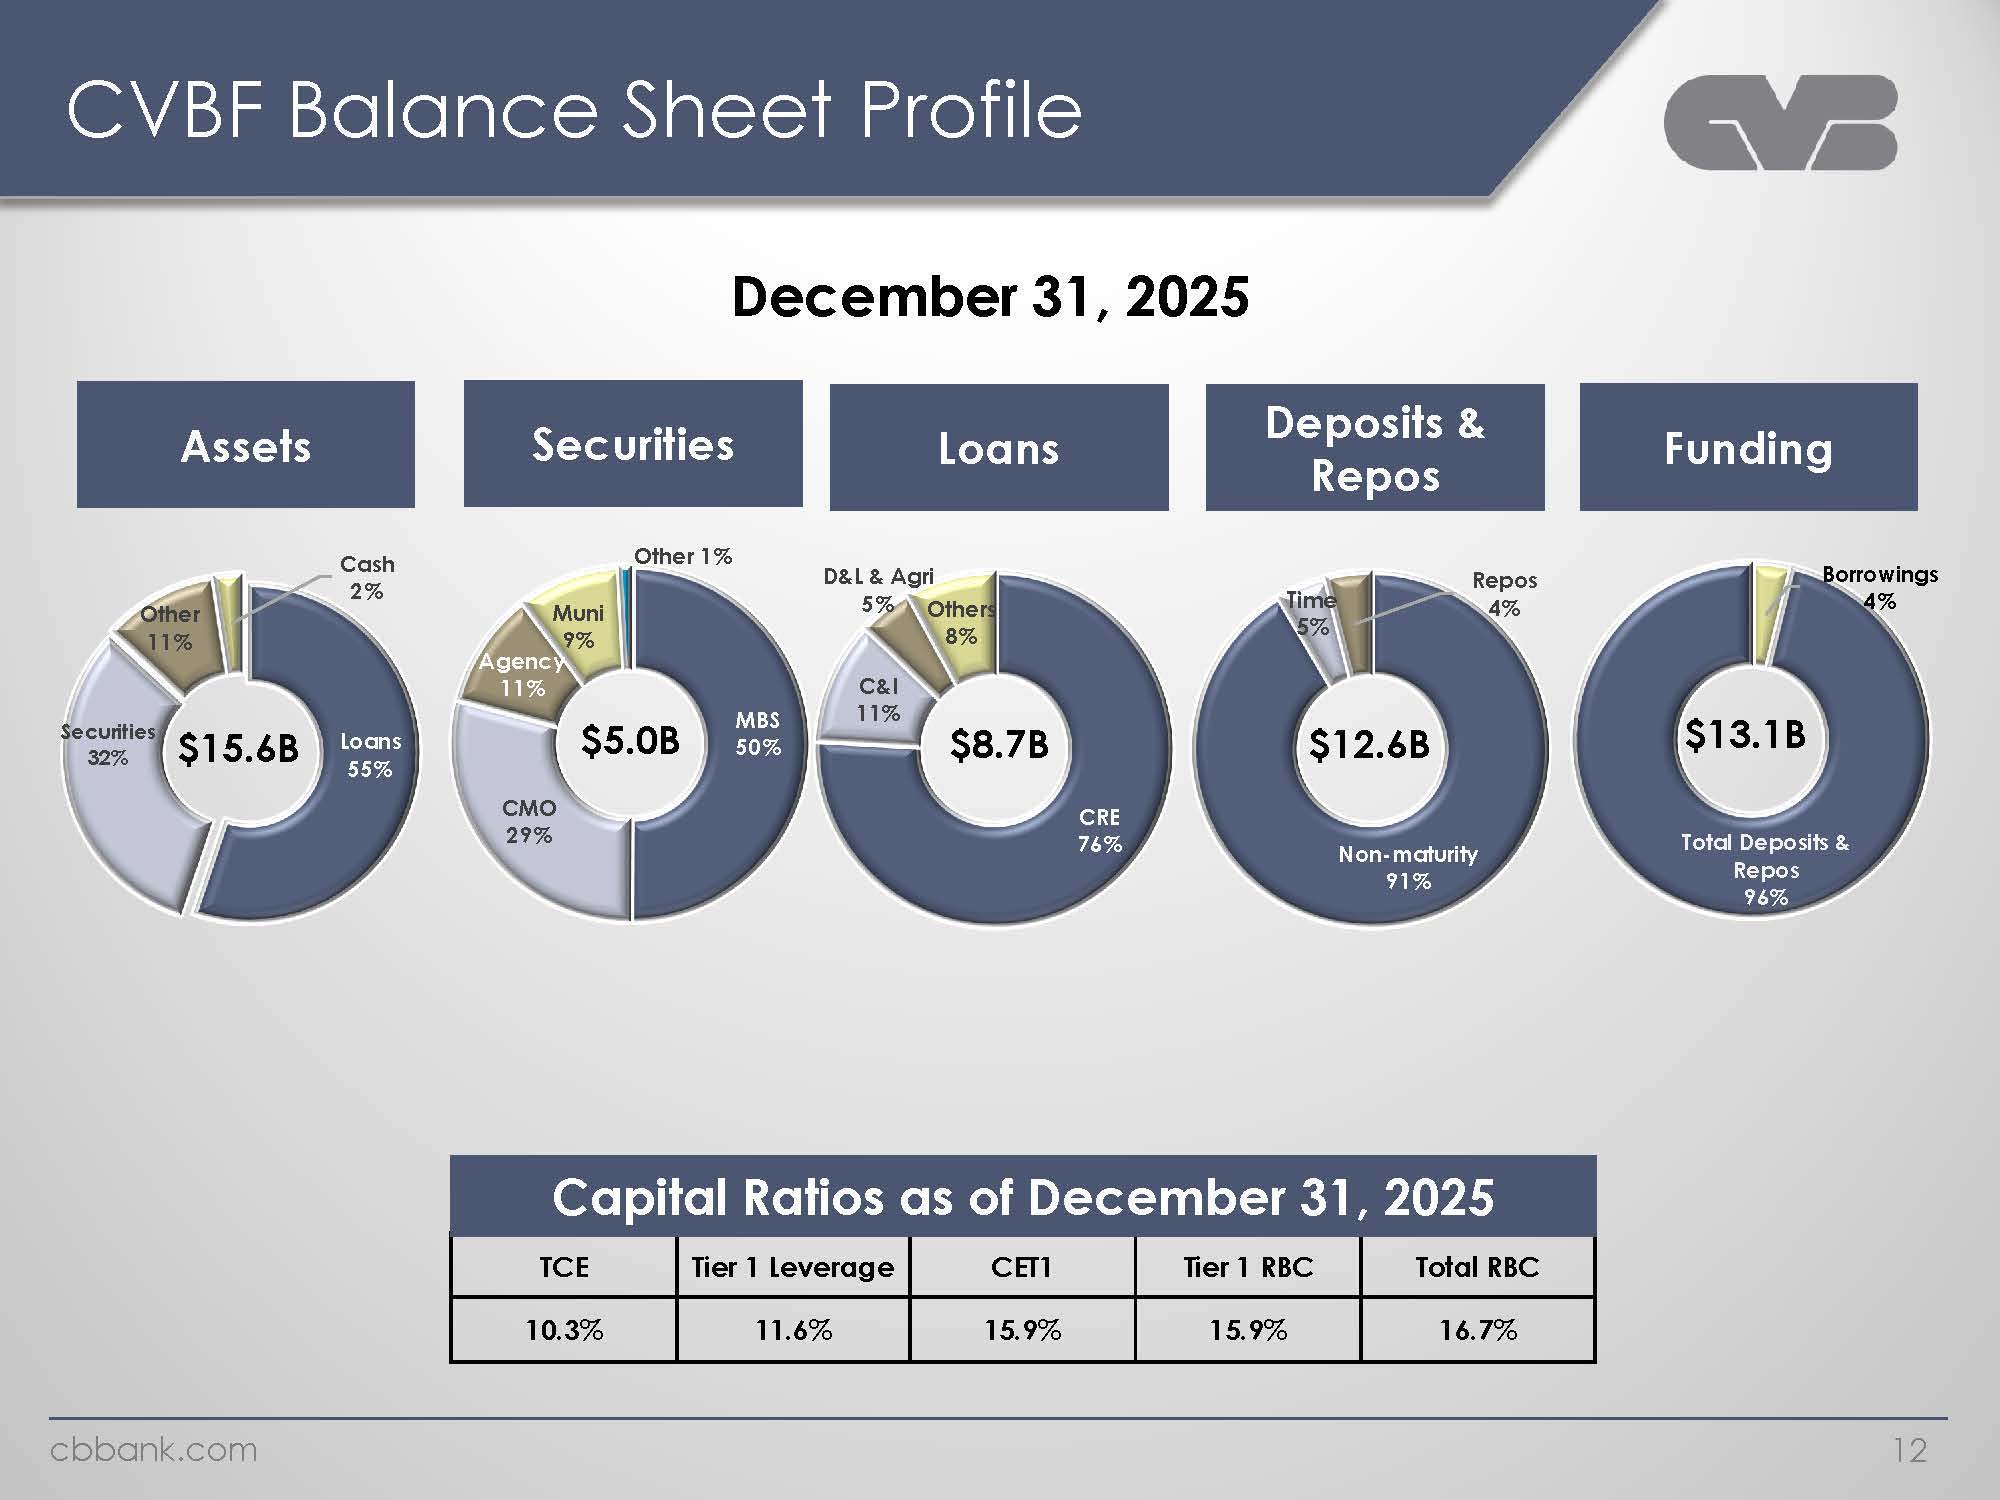
CVBF Balance Sheet Profile December 31, 2025 Assets.Securitites.Loans. Deposits & Repos Funding Other 11% Cash 2% Loans 55% Securitites 32% $15.6B Muni 9% Other 1% MBS 50% CMO 29% Agency 11% $5.0B D & l & Agri 5% Others 8% CRE 76% C & I 11% $8.7B Time 5% Repos 4% Non-maturity 91% $12.6B Borrowings 4% Total Deposits & Repos 96%.$13.1B Capital Ratios as of December 31,2025 TCE10.3% Tire 1 Leverage 11.6% CET 115.9% Tire 1 RBC 15.9% Total RBC 16.7% cbbank.com 12
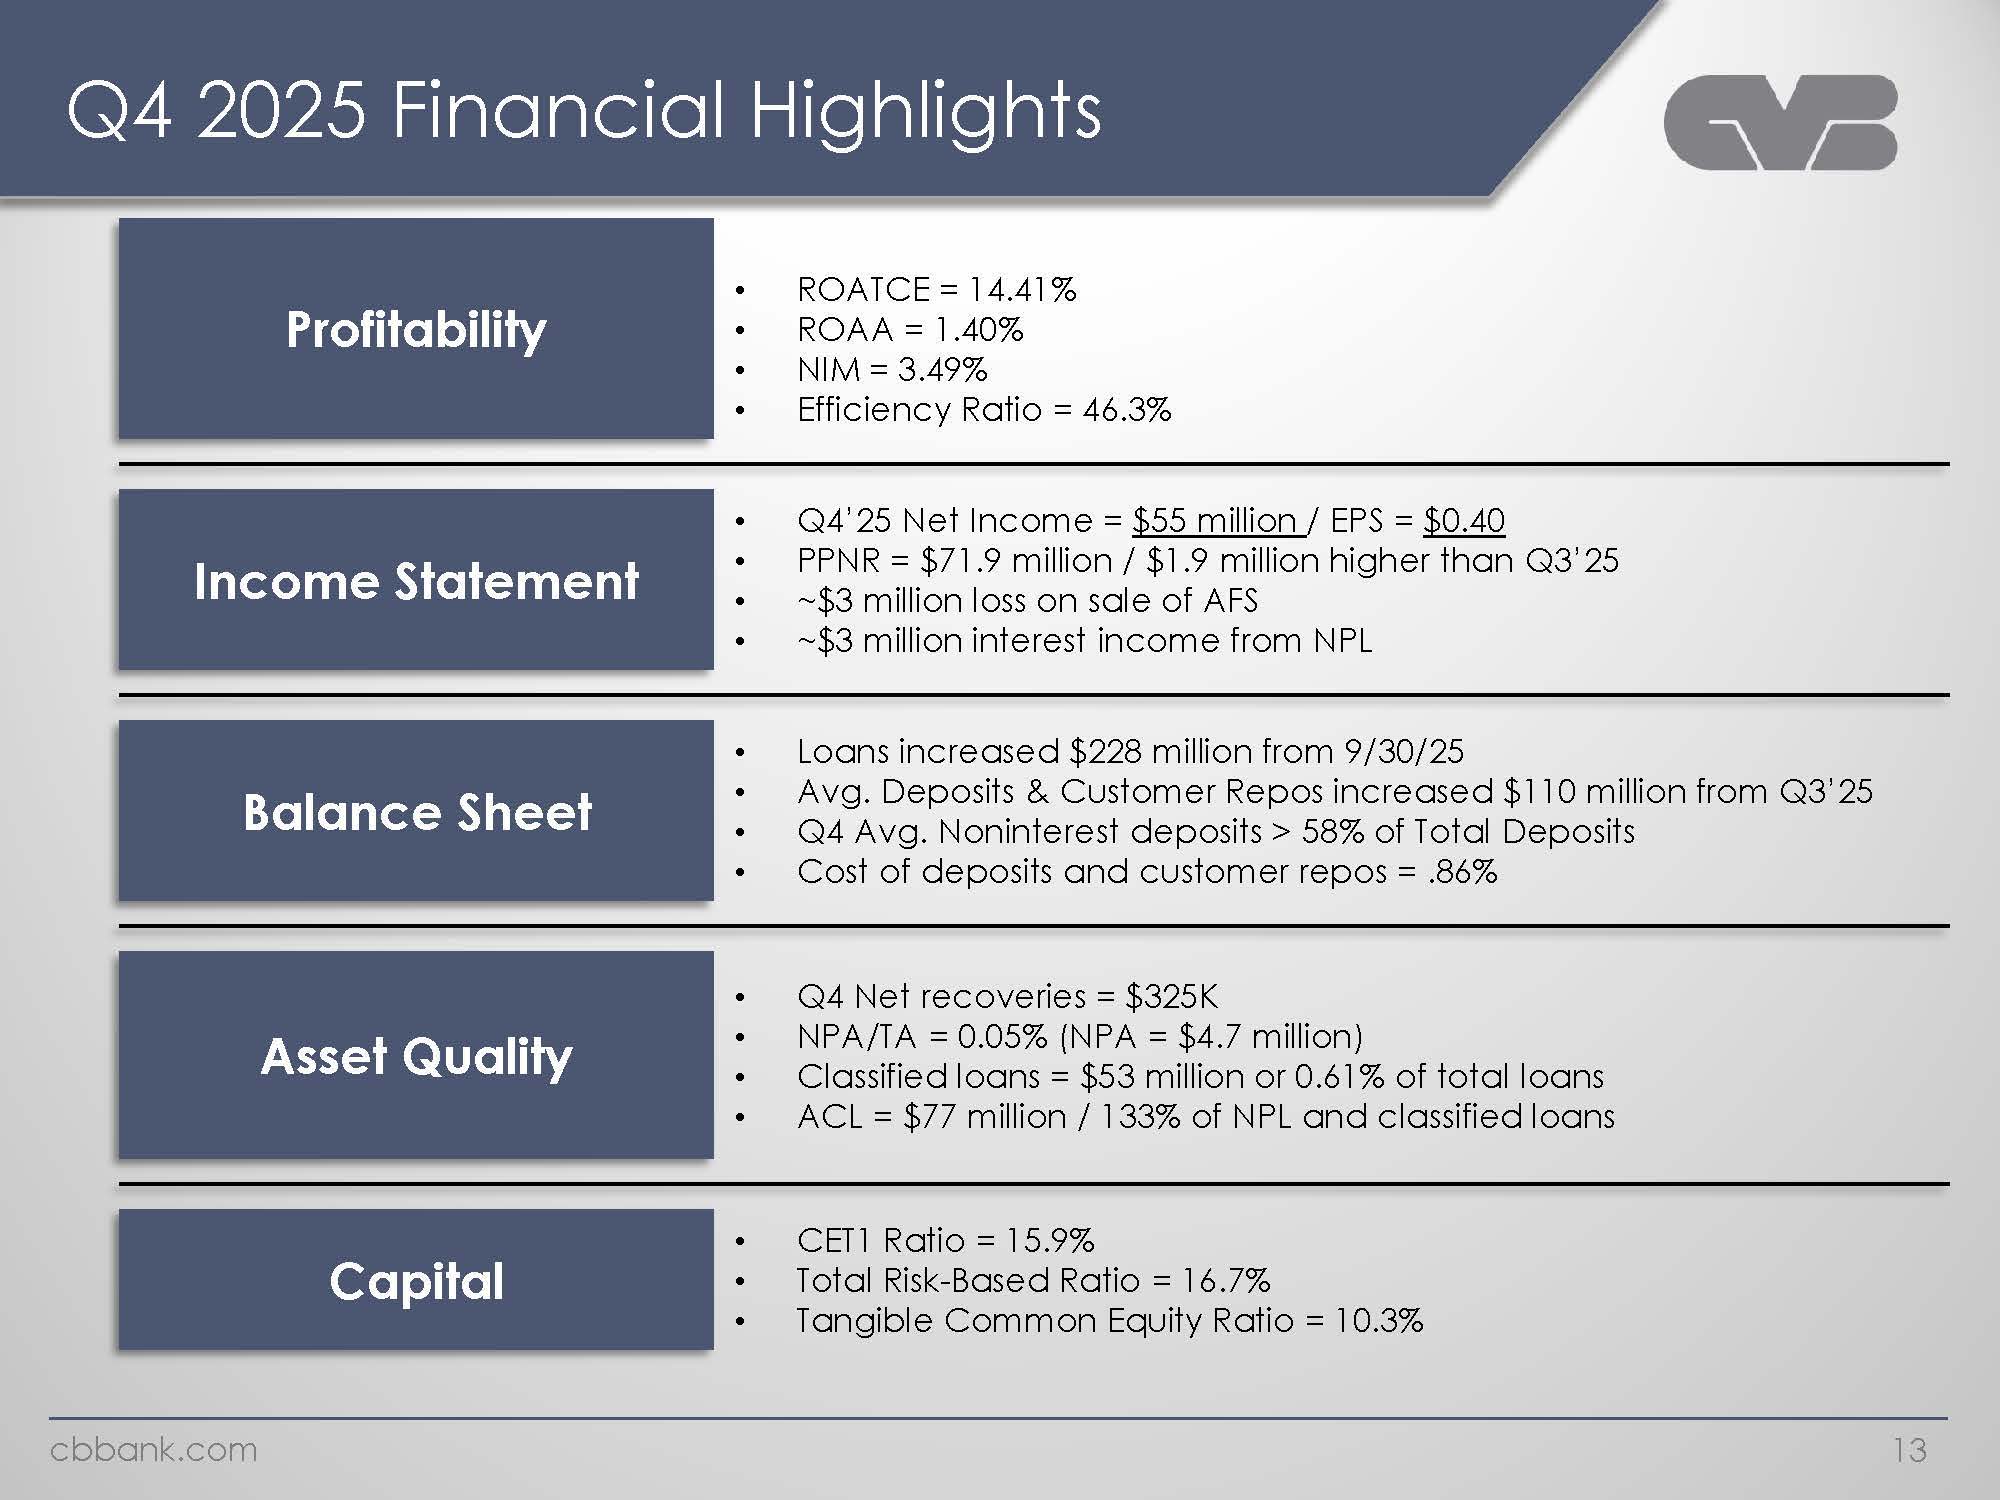
Q4 2025 Financial Highlights Protitability ROATC=14.4% ROAA=1.40% NIM=3.49% Efficiency Ratio=46.3% Income Statement Q4’25 Net Income = $55 million / EPS = $0.40 PPNR=$71.9 million /$1.9million higher than Q3’25 ~$ 3 million loss on sale of AFS ~$ 3 million interest from NPL Balance sheet Loans increased $228 million from 9/30/25 Avg. Deposits & Customer Repos increased $110 million from Q3’25 Q4 Avg. Noninterest deposits > 58% of Total Deposits Cost of deposits and customer repos = .86% Asset Quality Q4 Net recoveries = $325K • NPA/TA = 0.05% (NPA =$4.7 million) • Classified loans = $53 million or 0.61% of total loans • ACL = $77 million / 133% of NPL and classified loans Capital CET1 Ratio = 15.9% Total Risk-Based Ratio = 16.7% • Tangible Common Equity Ratio = 10.3% cbbank.com.13
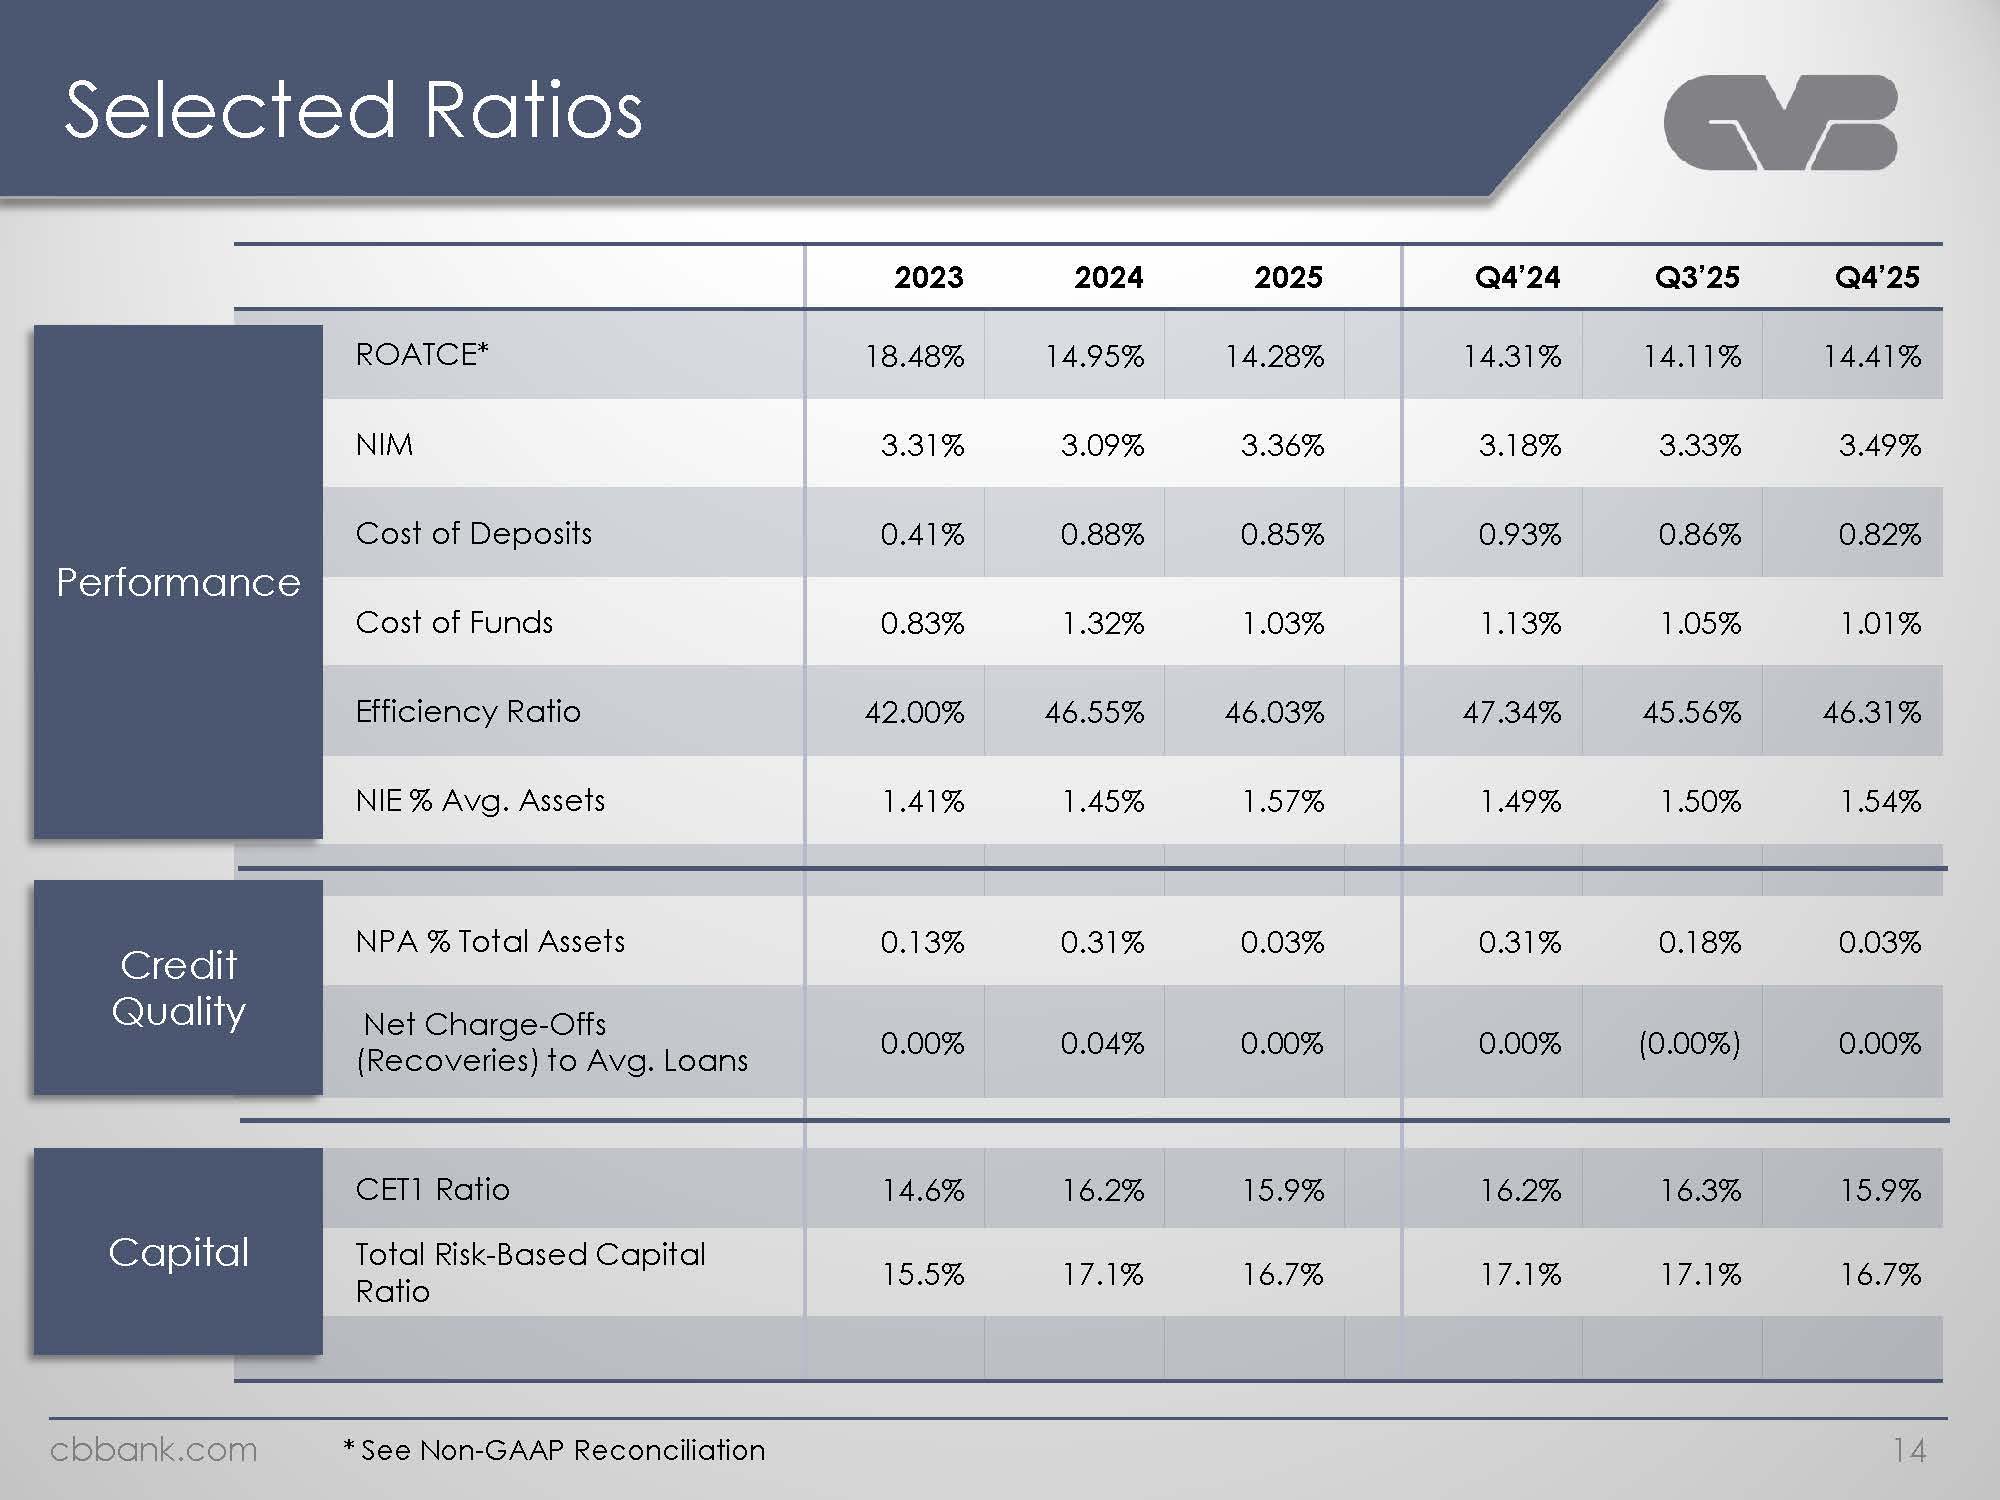
Selected Ratios ROATCE* 2023 18.48% 2024 2025 Q4’24 14.95% NIM Cost of Deposits 3.31% 0.41% 3.09% 14.28% 3.36% 14.31% Performance Credit Quality Credit Quality Capital 0.88% Cost of Funds Efficiency Ratio NIE % Avg. Assets NPA % Total Assets Net Charge-Offs (Recoveries) to Avg. Loans 0.83% 42.00% 1.41% 1.32% 0.85% Q3’25 14.11% 3.18% 0.93% 1.03% 1.13% 3.33% 0.86% 1.05% Q4’25 14.41% 3.49% 0.82% 1.01% 46.55% 1.45% 46.03% 1.57% 47.34% 1.49% 45.56% 1.50% 46.31% 1.54% 0.13% 0.00% 0.31% 0.04% 0.03% 0.00% 0.31% 0.00% 0.18% 0.03% CET1 Ratio Total Risk-Based Capital Ratio 14.6% (0.00%) 16.2% 15.5% 17.1% 15.9% 16.7% 16.2% 17.1% 16.3% 17.1% 0.00% 15.9% 16.7% cbbank.com.*SeeNon-GAAPReconciliation.14
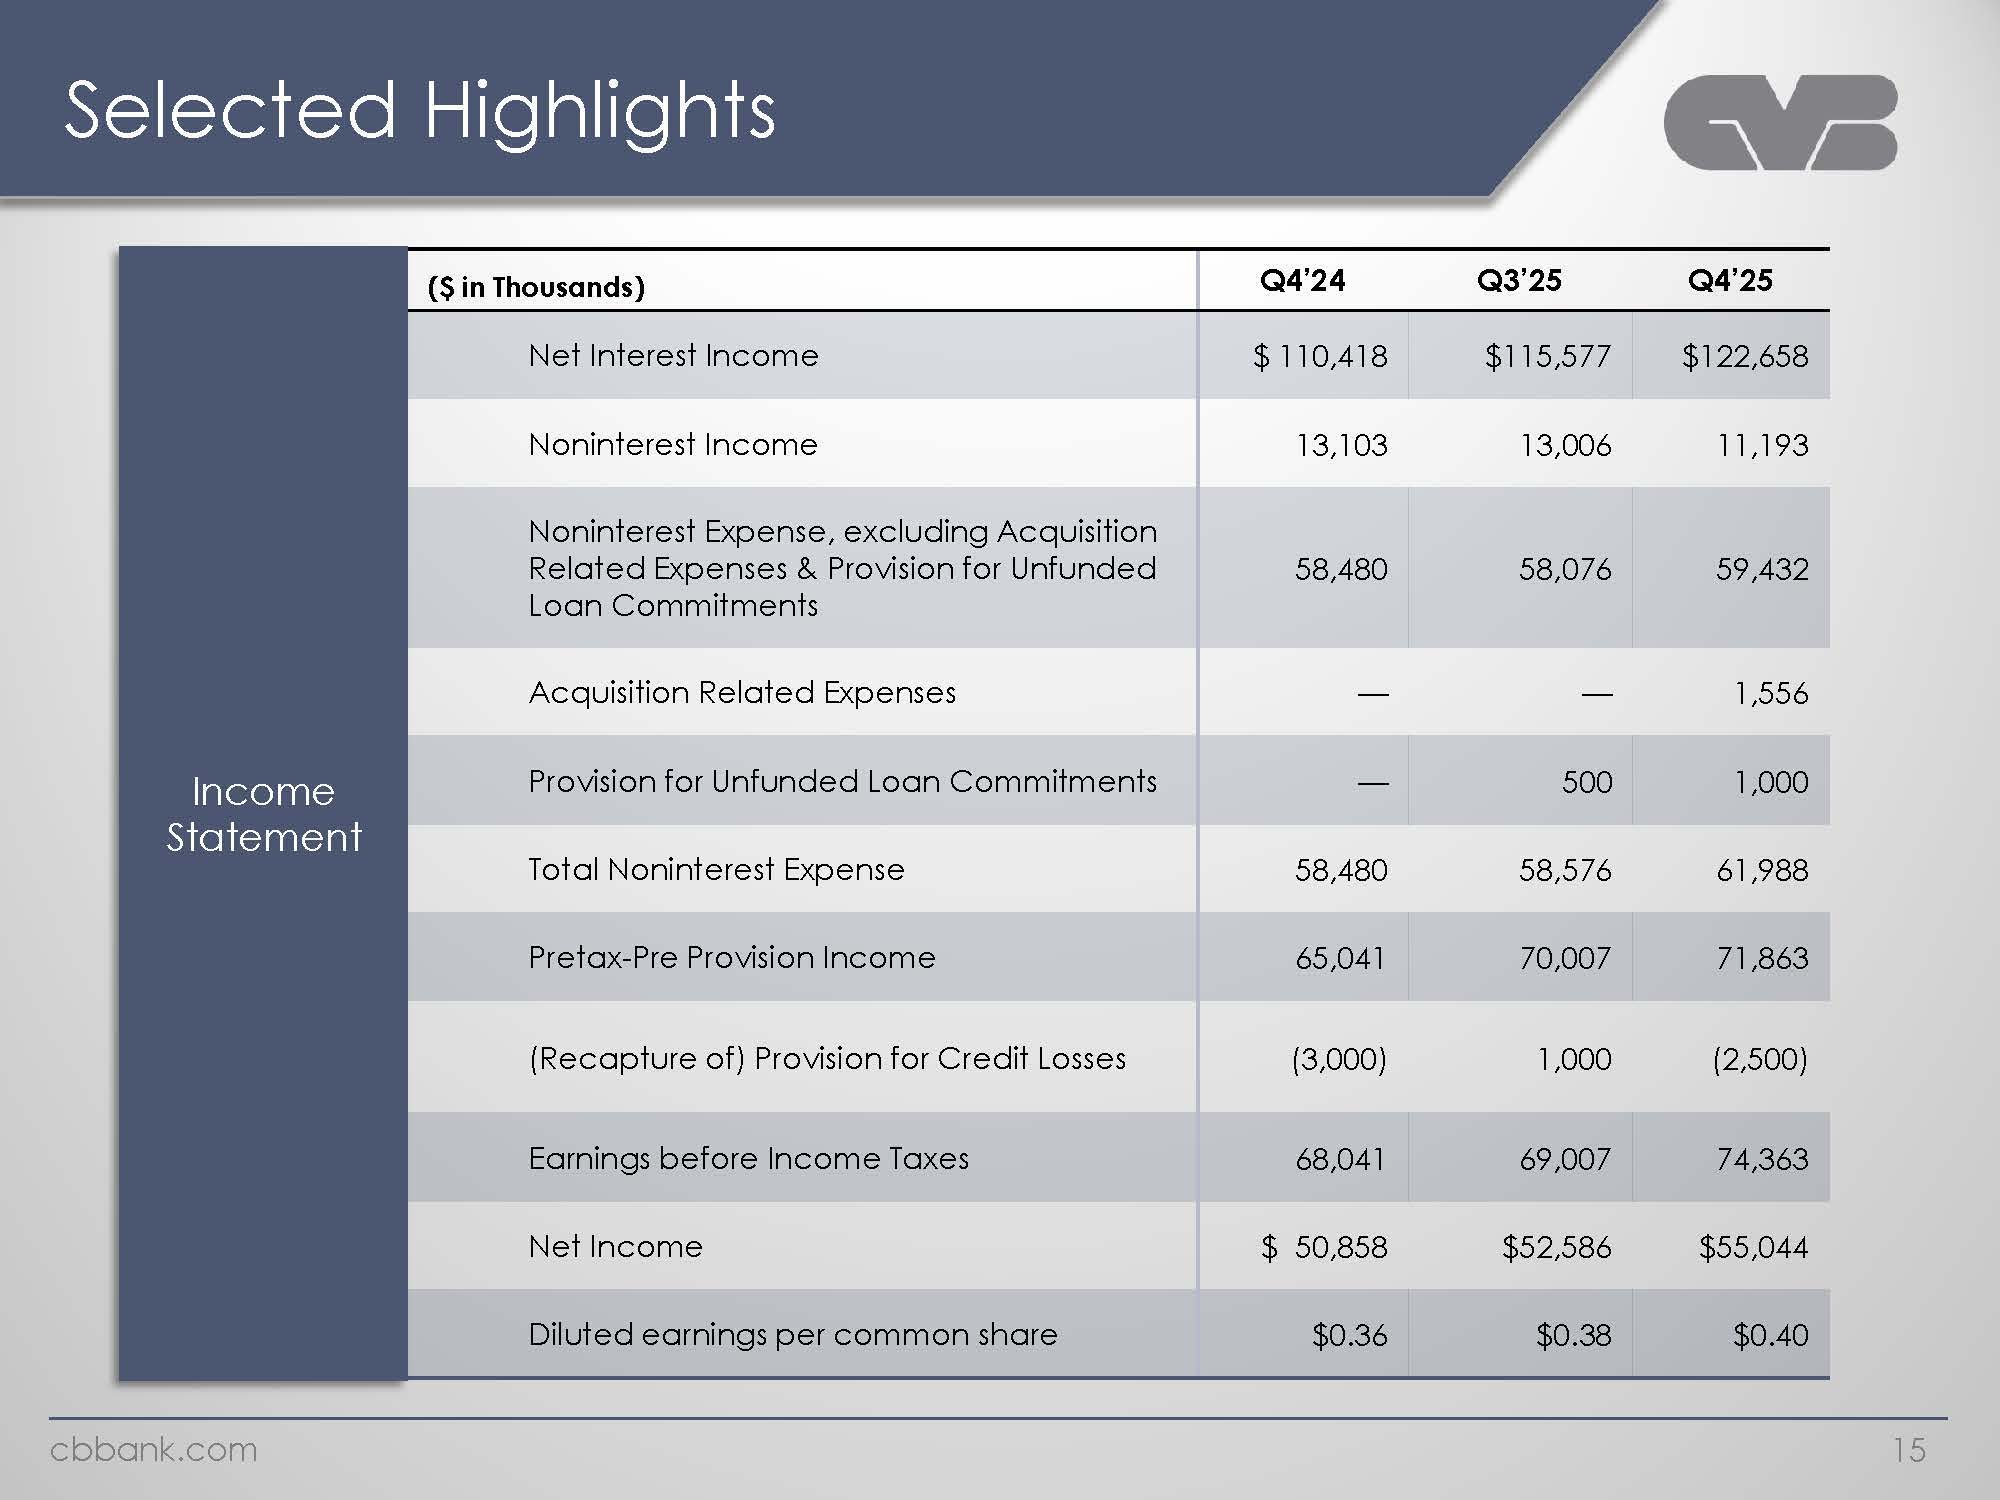
Selected Highlights. Income Statement. ($ in Thousands). Q4’24. Q3’25. Q4’25. Net Interest Income. $ 110,418. $115,577. $122,658. Noninterest Income. 13,103. 13,006 . 11,193. Noninterest Expense, excluding Acquisition Related Expenses & Provision for Unfunded Loan Commitments. 58,480. 58,076. 59,432. Acquisition Related Expenses. —.—.1,556. Provision for Unfunded Loan Commitments. —. 500. 1,000. Total Noninterest Expense58,480. 58,576. 61,988. Pretax-Pre Provision Income. 65,041. 70,007. 71,863. (Recapture of) Provision for Credit Losses. (3,000). 1,000. (2,500). Earnings before Income Taxes. 68,041. 69,007. 74,363. Net Income. $ 50,858. $52,586. $55,044. Diluted earnings per common share. $0.36. $0.38. $0.38.cbbank.com.15
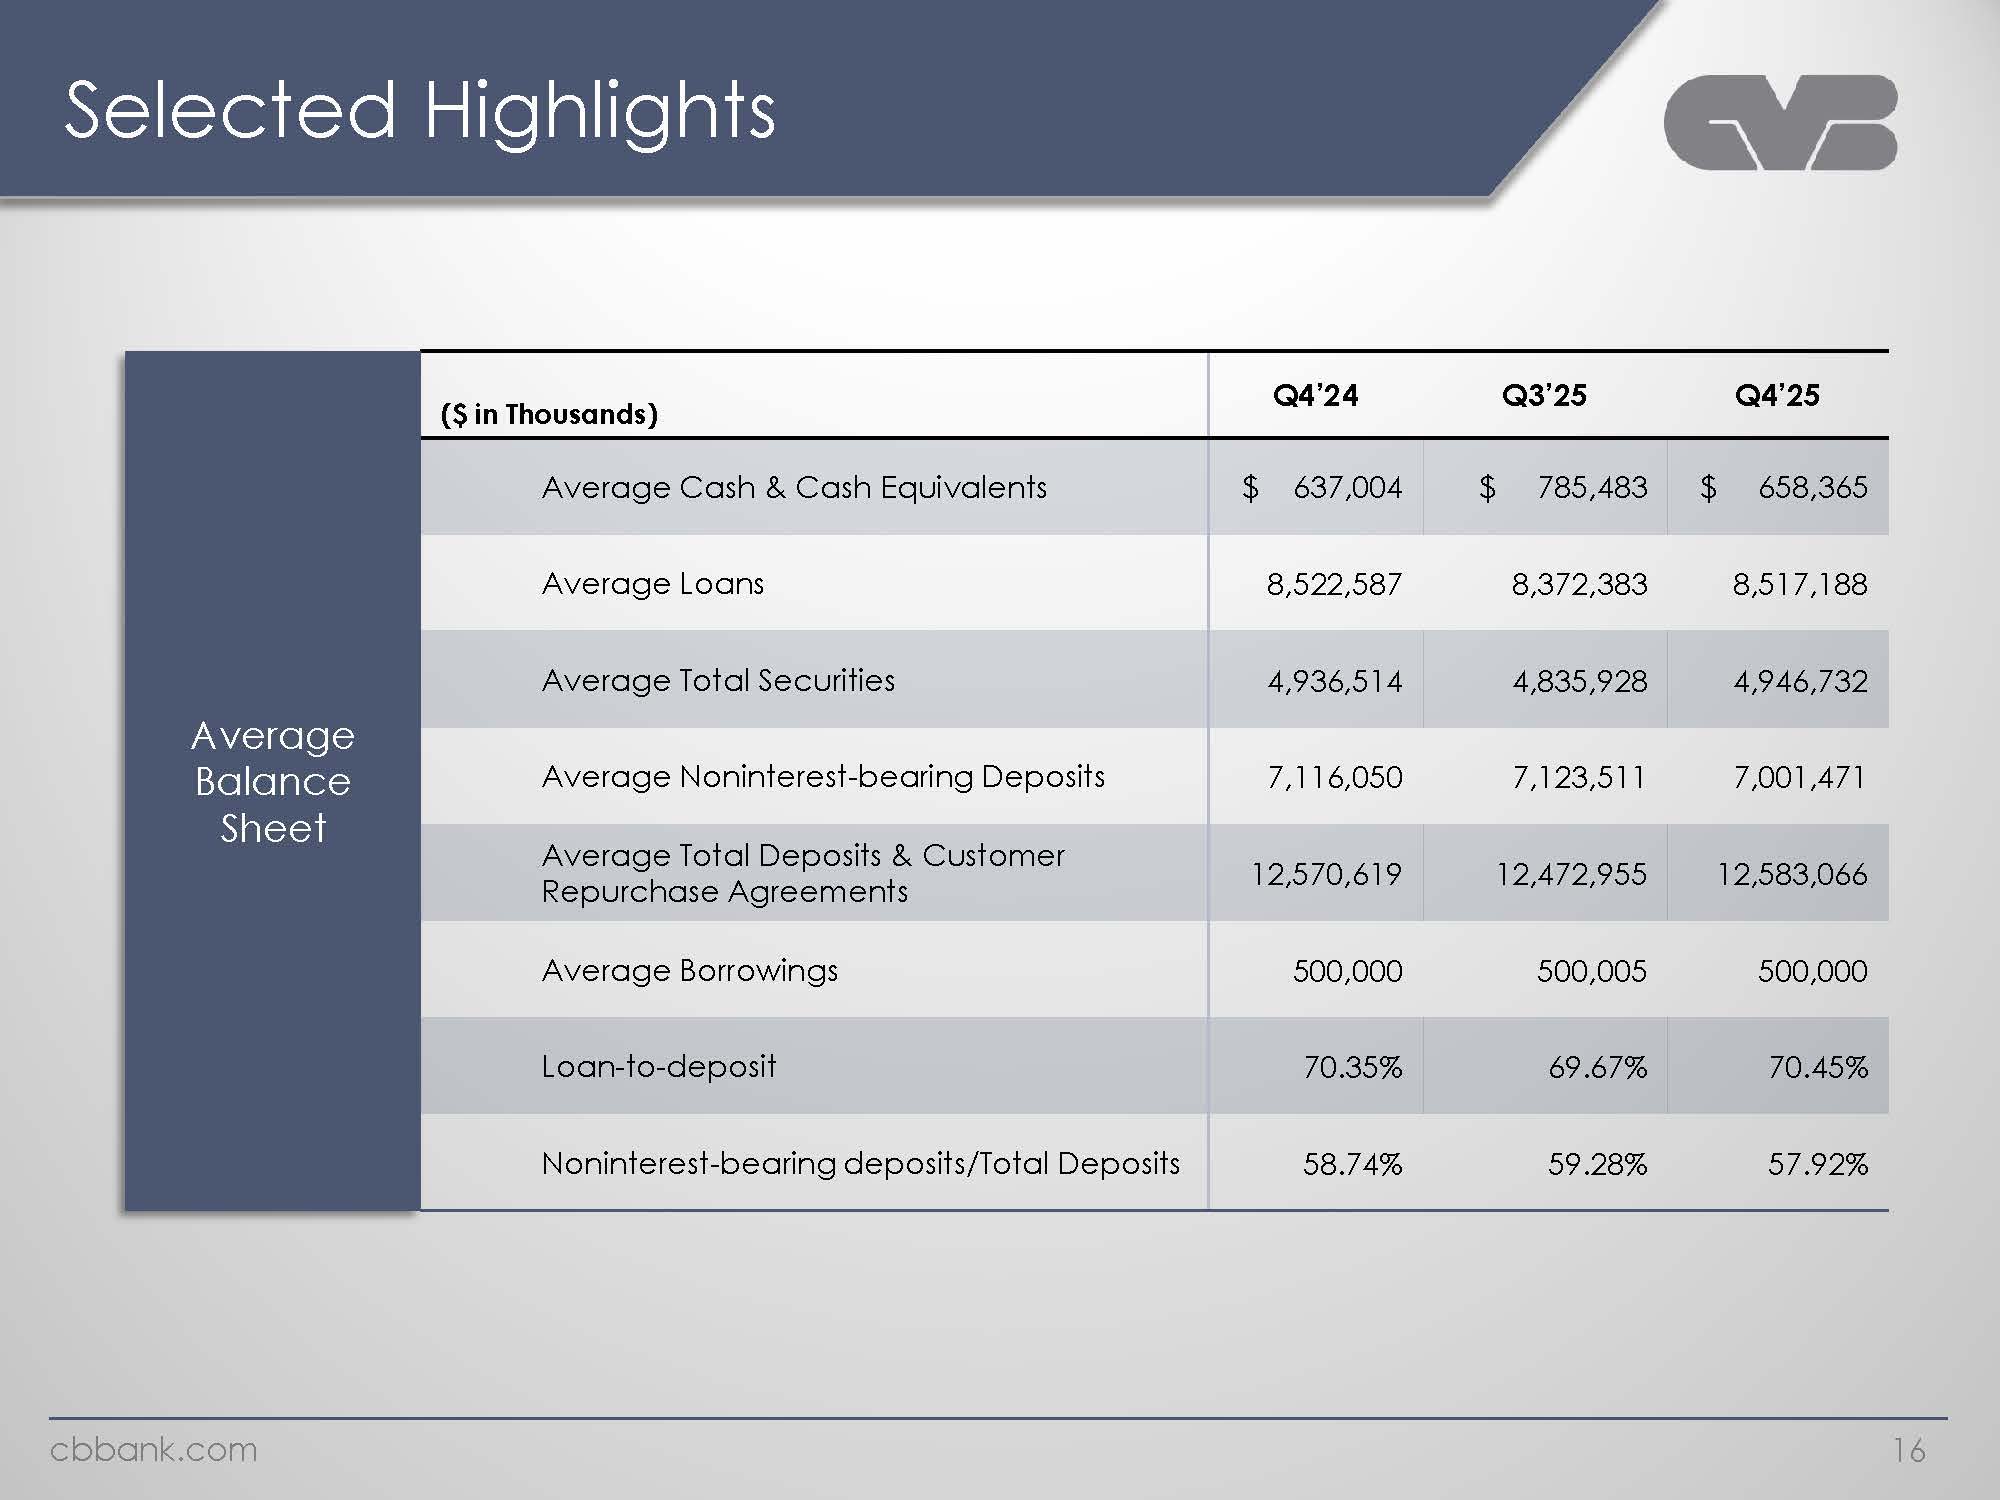
Selected Highlights Average Balance Sheet ($ in Thousands). Q4’24. Q3’25 Q4’25. Average Cash & Cash Equivalents. $ 637,004 . $ 785,483 . $ 658,365 . Average Loans 8,522,587 8,372,383 8,517,188 Average Total Securities 4,936,514 4,835,928 4,946,732 Average Noninterest-bearing Deposits. 7,116,050 7,123,511 7,001,471 Average Total Deposits & Customer Repurchase Agreements 12,570,619 12,472,955 12,583,066 Average Borrowings. 500,000 500,005 500,000 Loan-to-deposit 70.35% 69.67% 70.45% Noninterest-bearing deposits/Total Deposits 58.74% 59.28% 57.92% cbbank.com 16
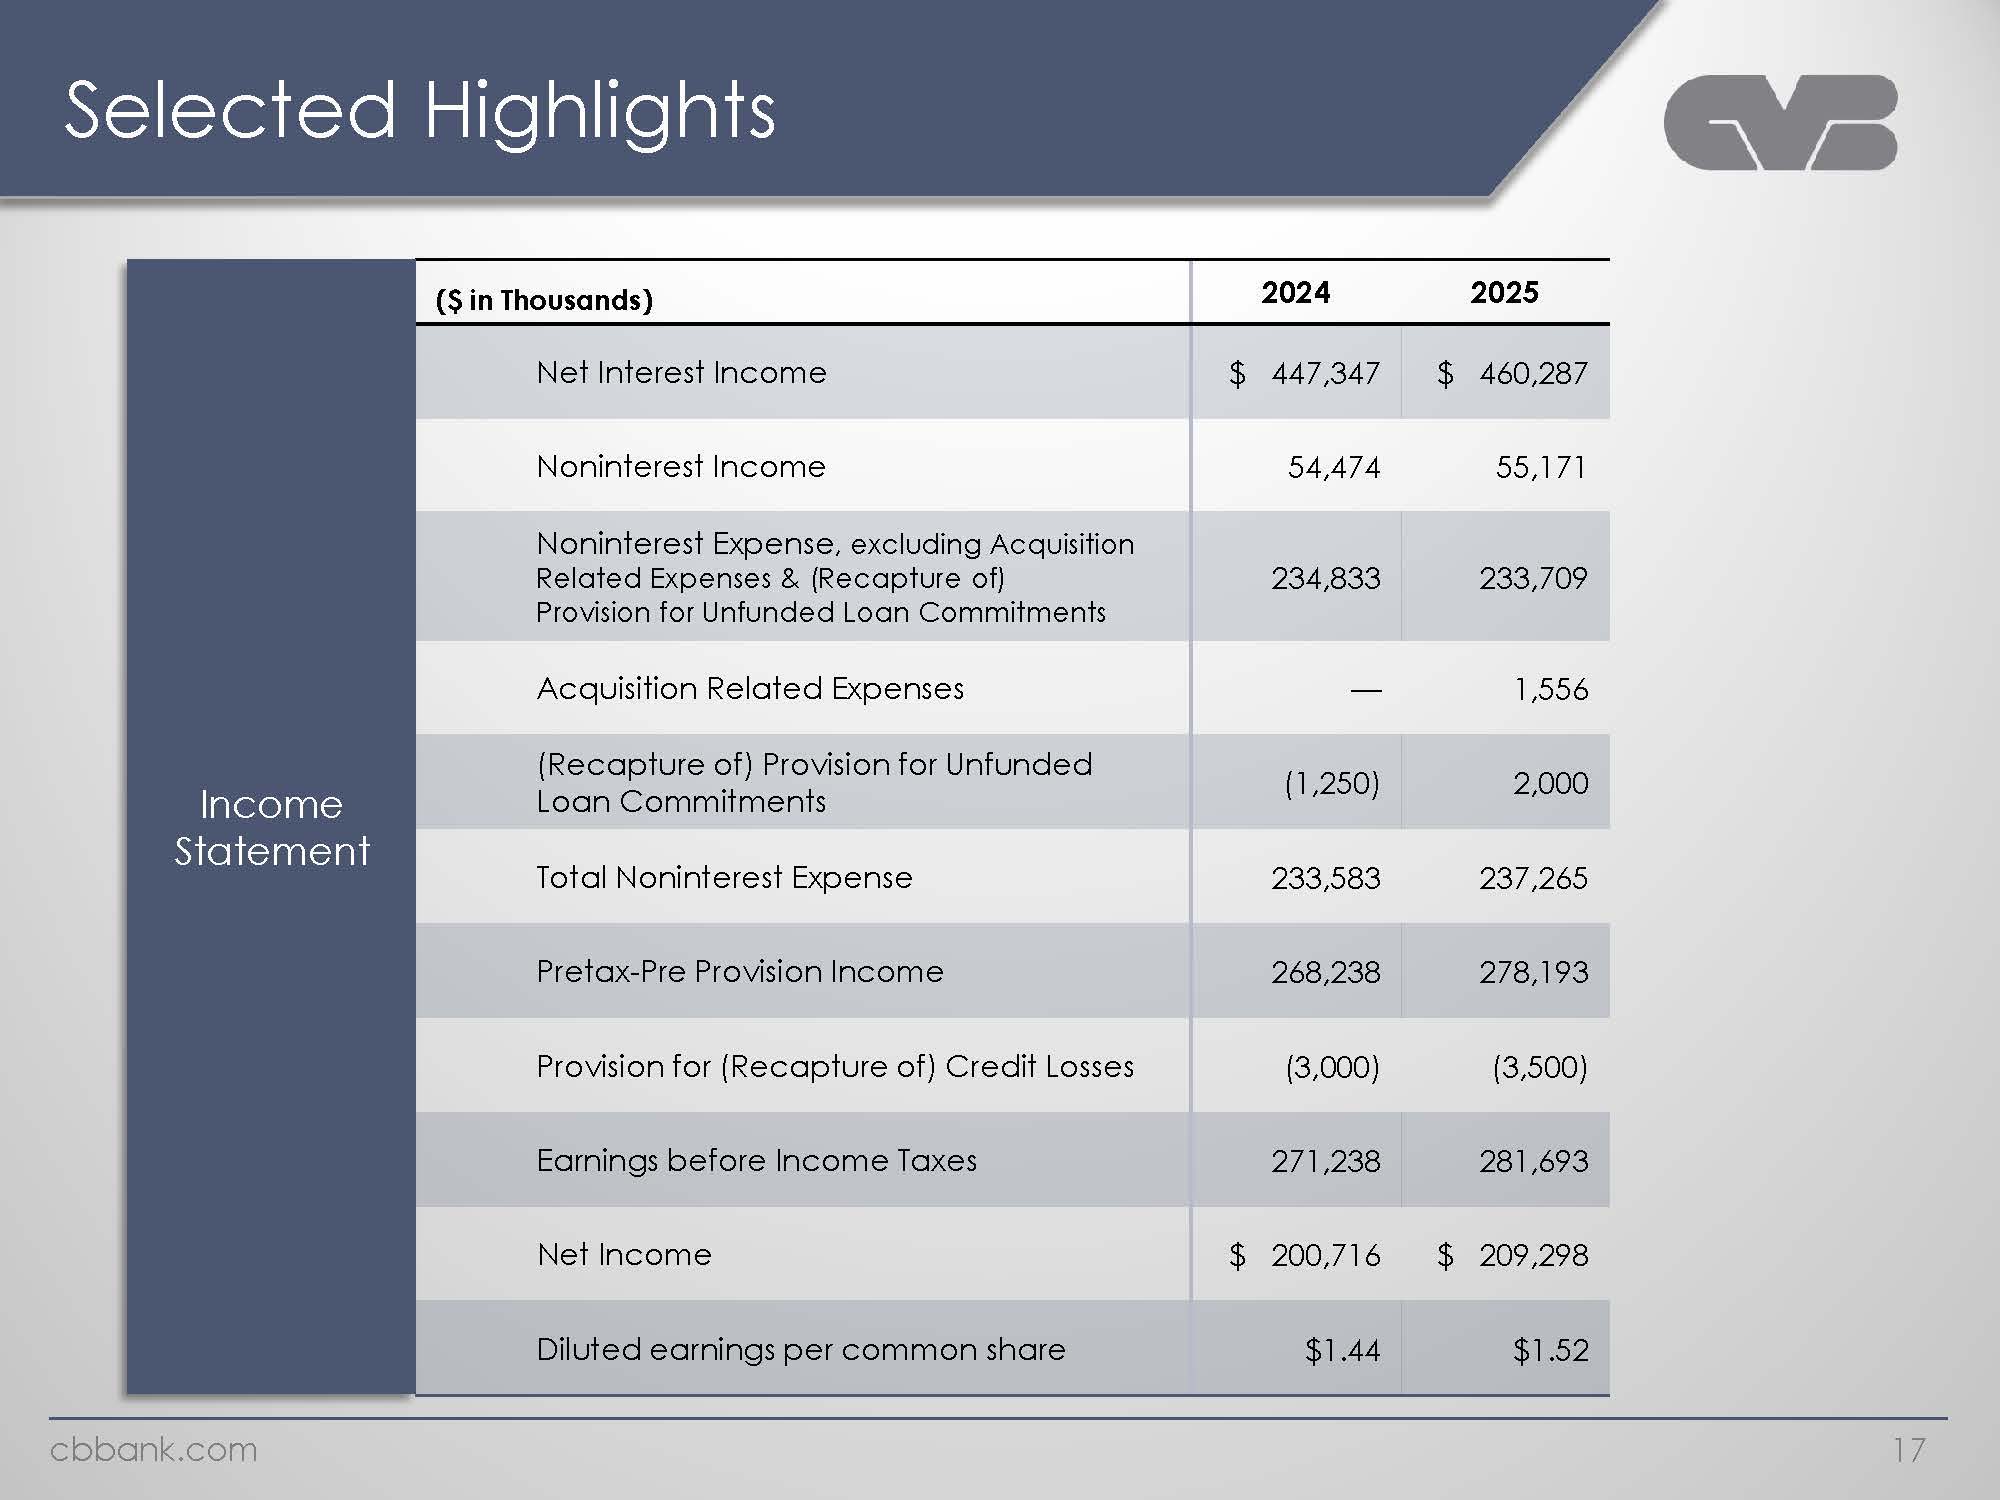
Selected Highlights ($ in Thousands) 2024 2025 Income Statement Net Interest Income $ 447,347 $ 460,287 Noninterest Income 54,474 55,171 Noninterest Expense , excluding Acquisition Related Expenses & (Recapture of) Provision for Unfunded Loan Commitments 234,833 233,709 Acquisition Related Expenses 1,556 (Recapture of) Provision for Unfunded Loan Commitments (1,250) (1,250) Total Noninterest Expense 233,583 237,265 Pretax-Pre Provision Income 268,238 278,193 Provision for (Recapture of) Credit Losses (3,000) (3,500) Earnings before Income Taxes 271,238 281,693 Net Income $ 200,716 $ 209,298 Diluted earnings per common share $1.44 $1.52 cbbank.com17
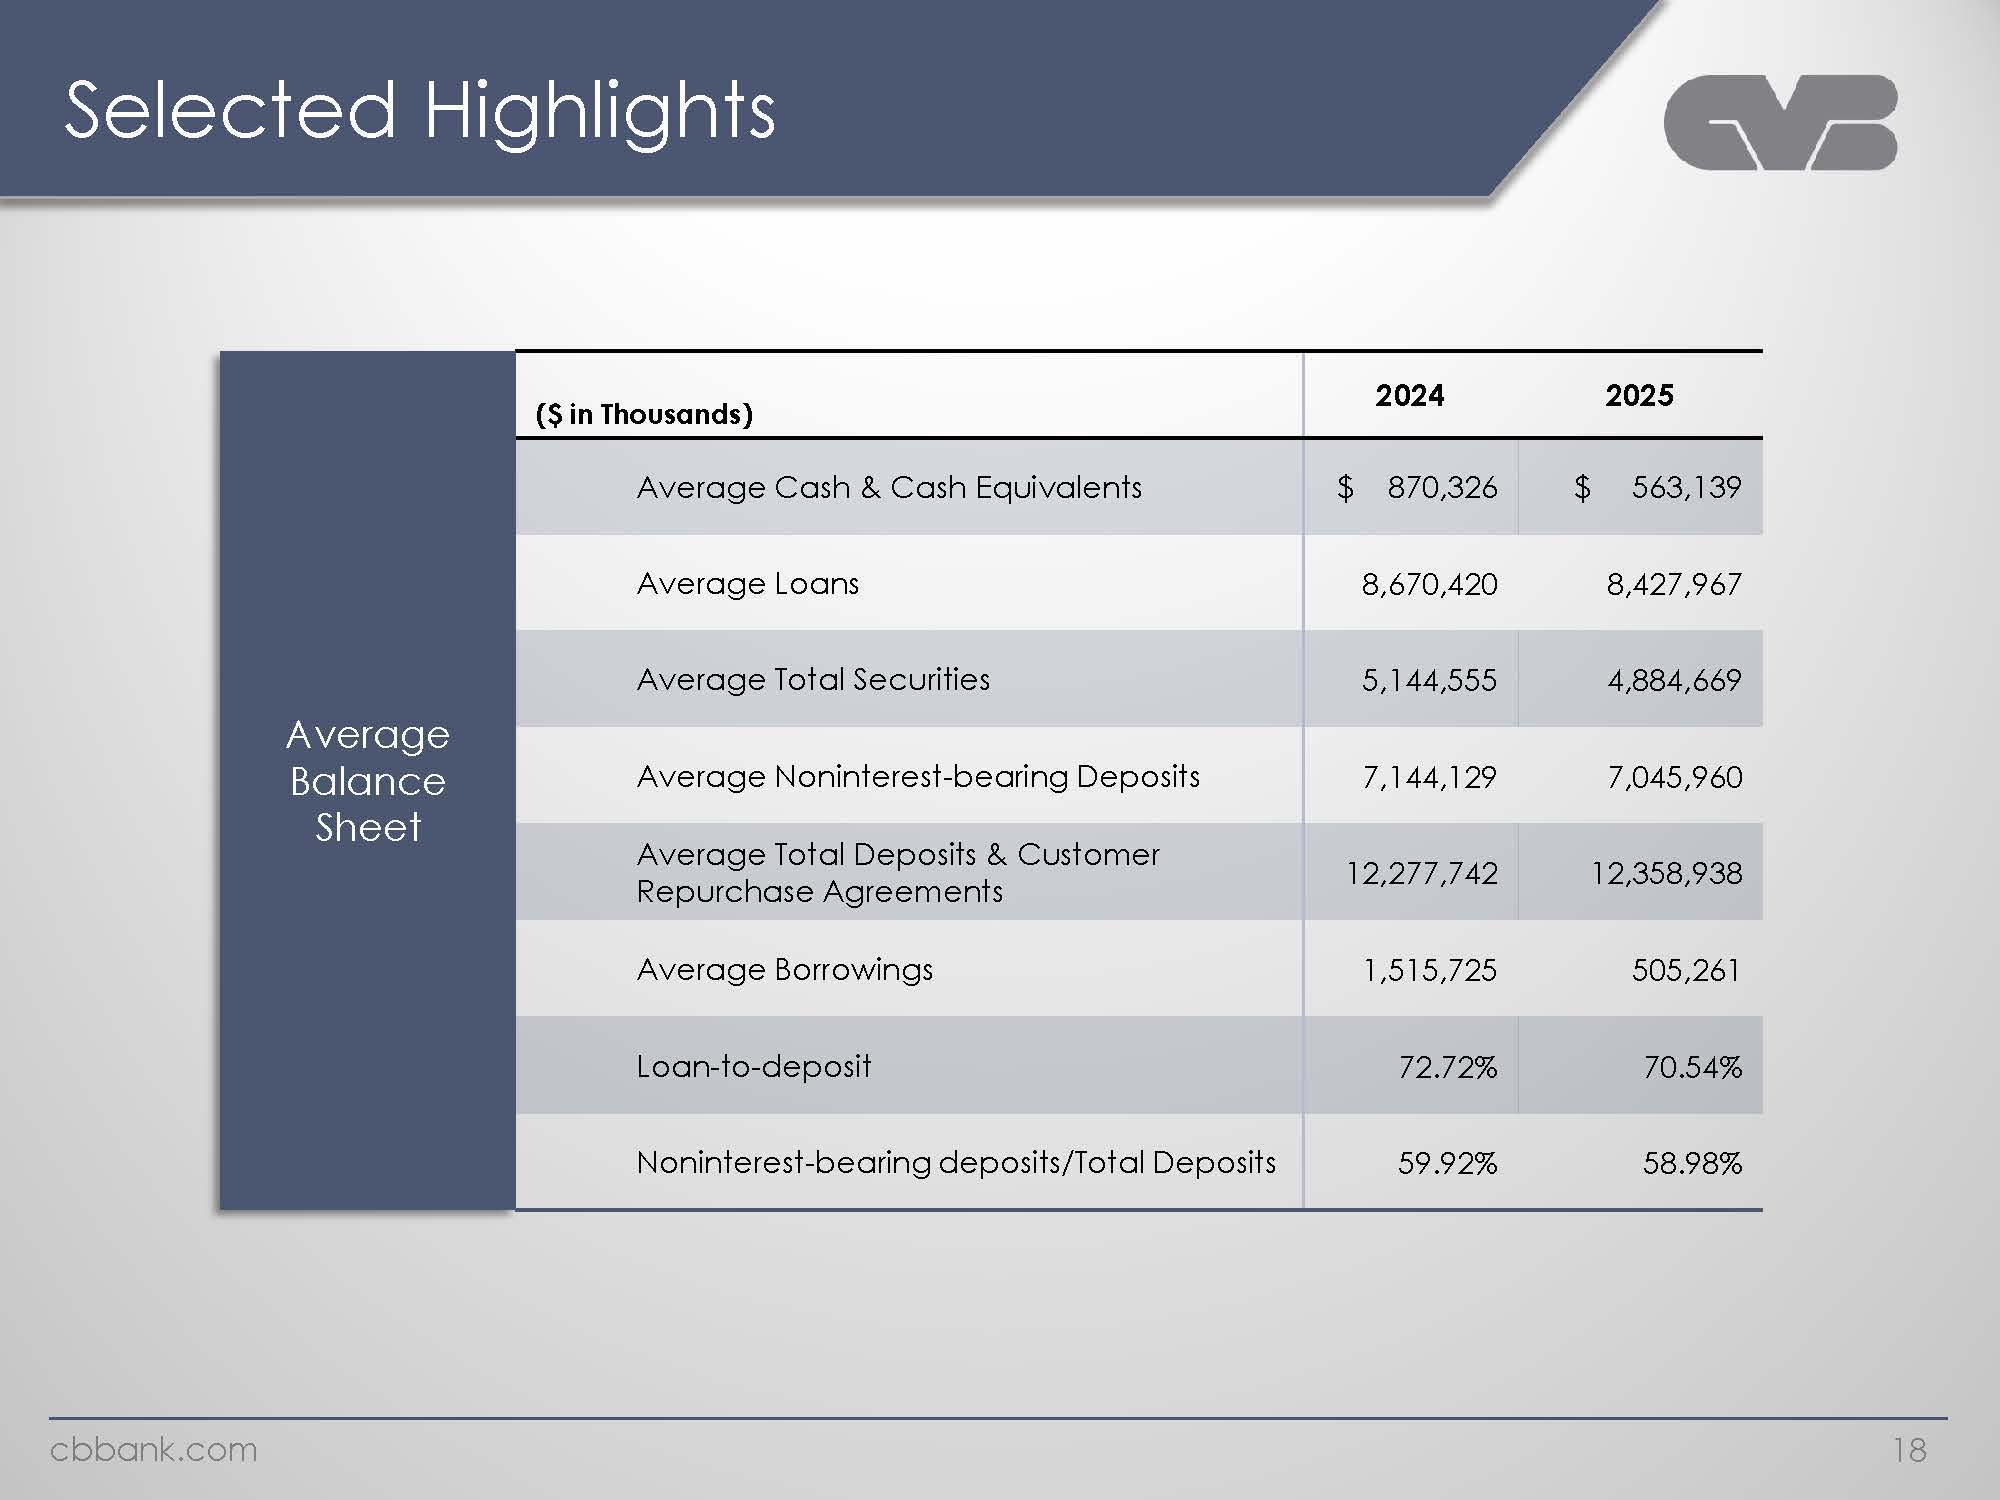
Selected Highlights ($ in Thousands)2024 2025 Average Cash & Cash Equivalents $ 870,326 $ 563,139 Average Loans 8,670,420 8,427,967 Average Total Securities 5,144,555 4,884,669 Average Noninterest-bearing Deposits 7,144,129 7,045,960 Average Total Deposits & Customer Repurchase Agreements 12,277,742 12,358,938 Average Borrowings 1,515,725 505,261 Loan-to-deposit 72.72% 70.54% Noninterest-bearing deposits/Total Deposits 59.92% 58.98% cbbank.com18
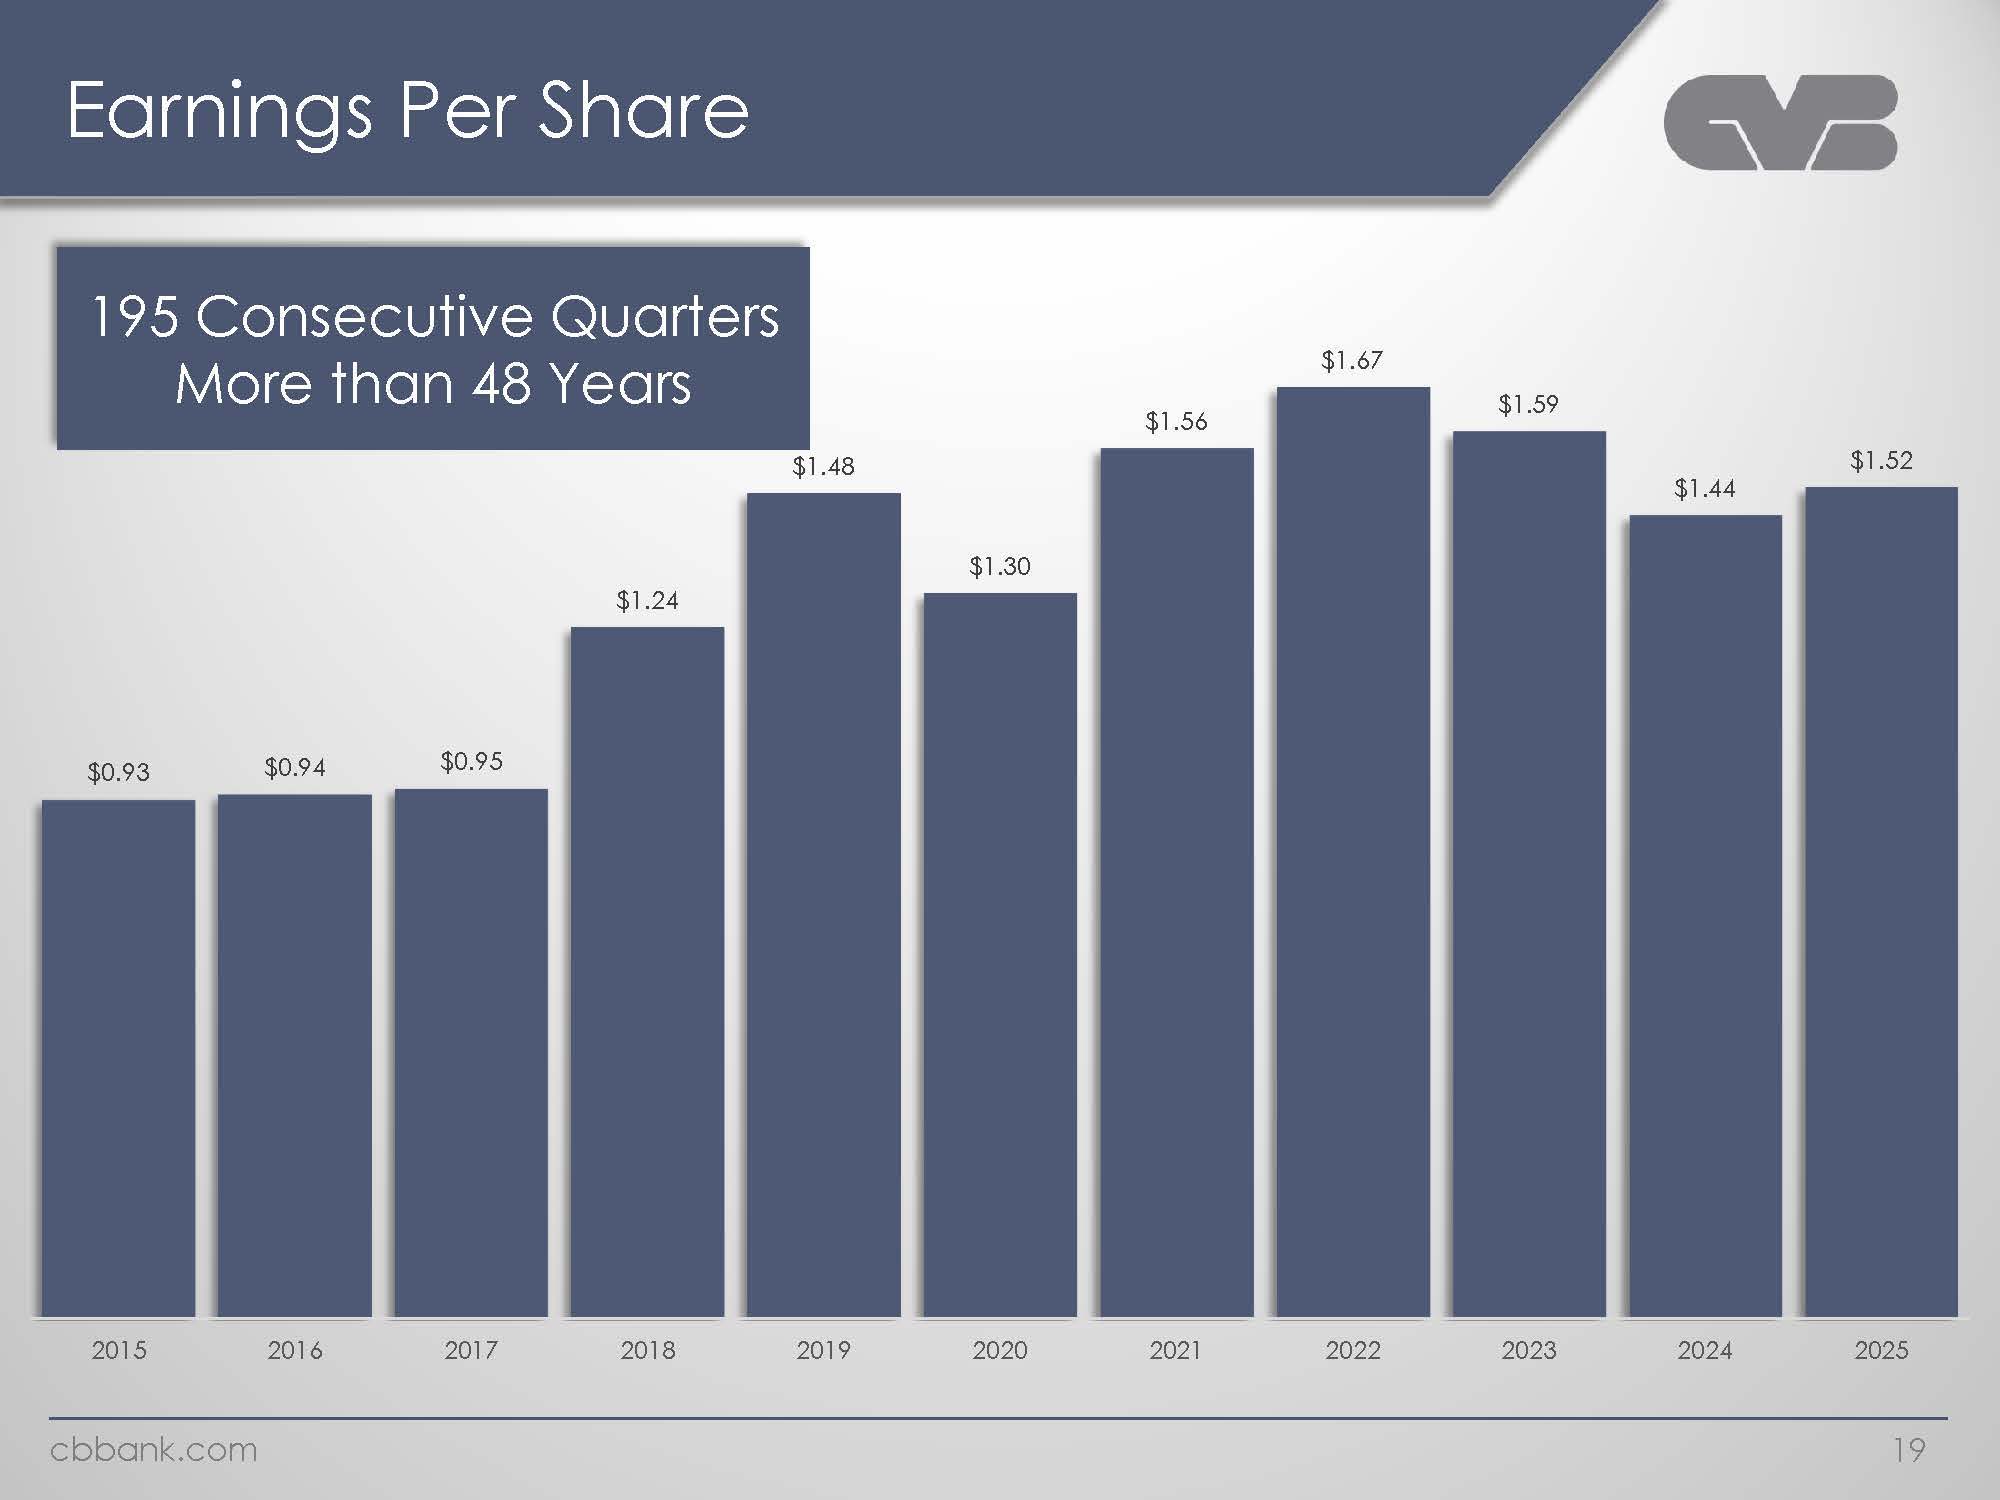
Earnings Per Share 195 Consecutive Quarters More than 48 Years $0.93 $0.94 $0.95 $1.24 $1.48 $1.67 $1.56 $1.30 $1.59 $1.44 $1.52$1.24 2016 2017 2018 2019 2020 2021 2022 2023 2024 2025 cbbank.com19
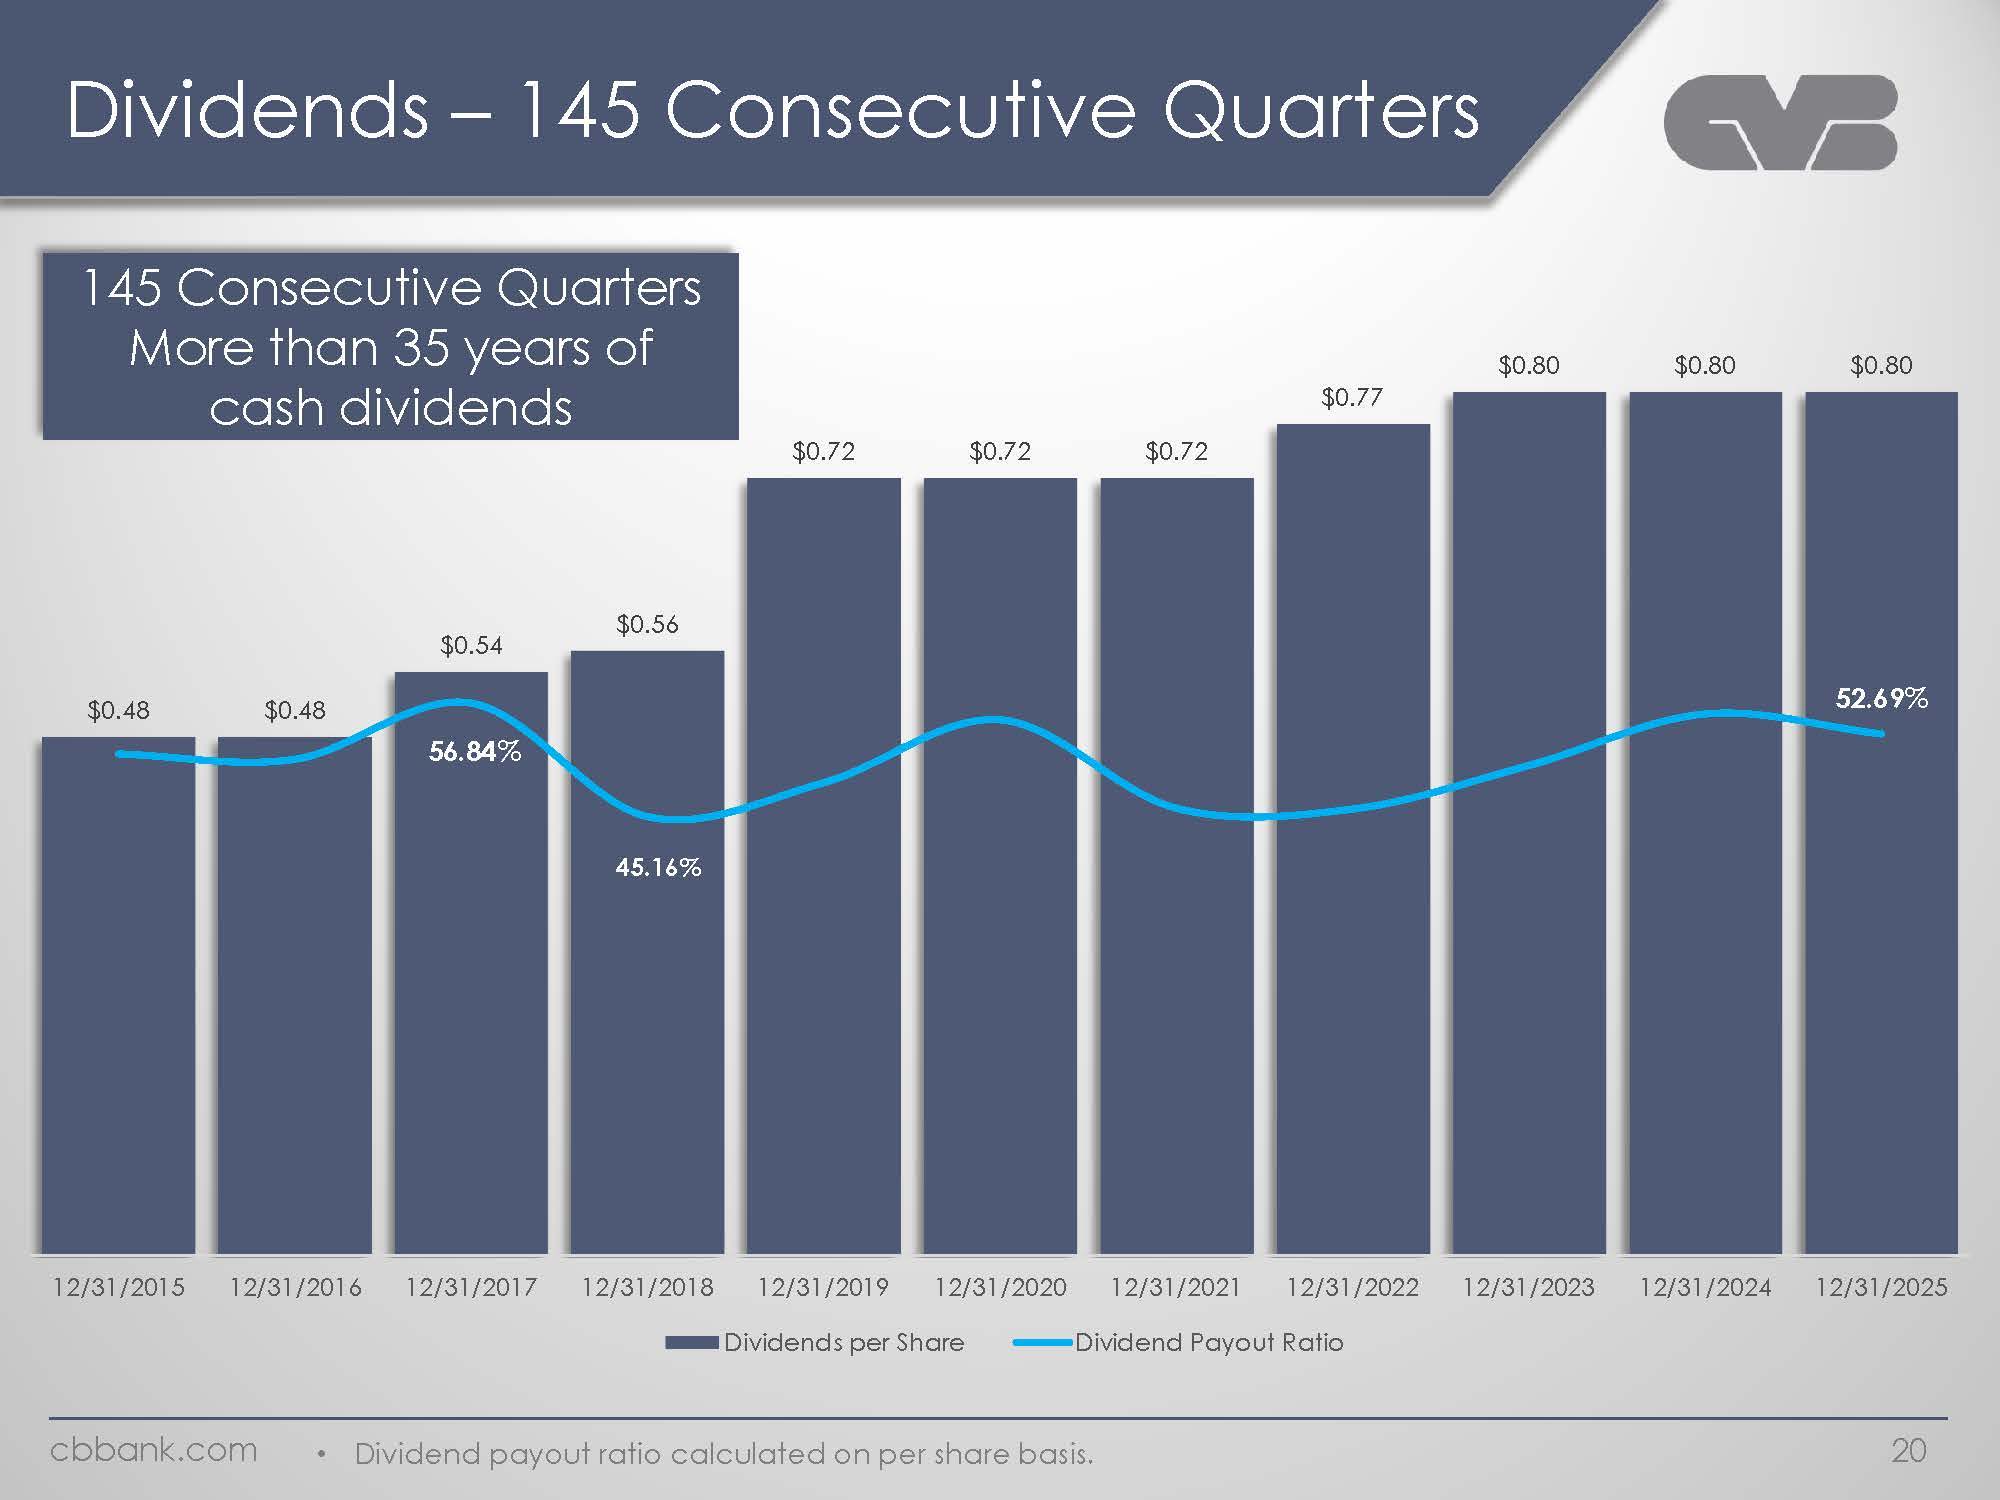
Dividends – 145 Consecutive Quarters 145 Consecutive Quarters More than 35 years of cash dividends $0.48 $0.48$0.54$0.56 56.84% 45.16% $0.77 $0.72 $0.72 $0.72 $0.80 $0.80 $0.80 52.69% 12/31/2016 12/31/2017 12/31/2018 12/31/2019 12/31/2020 12/31/2021 12/31/2022 12/31/2023 12/31/2024 12/31/2025 Dividend Payout Ratio Dividends per Share cbbank.com Dividend payout ratio calculated on per share basis.20
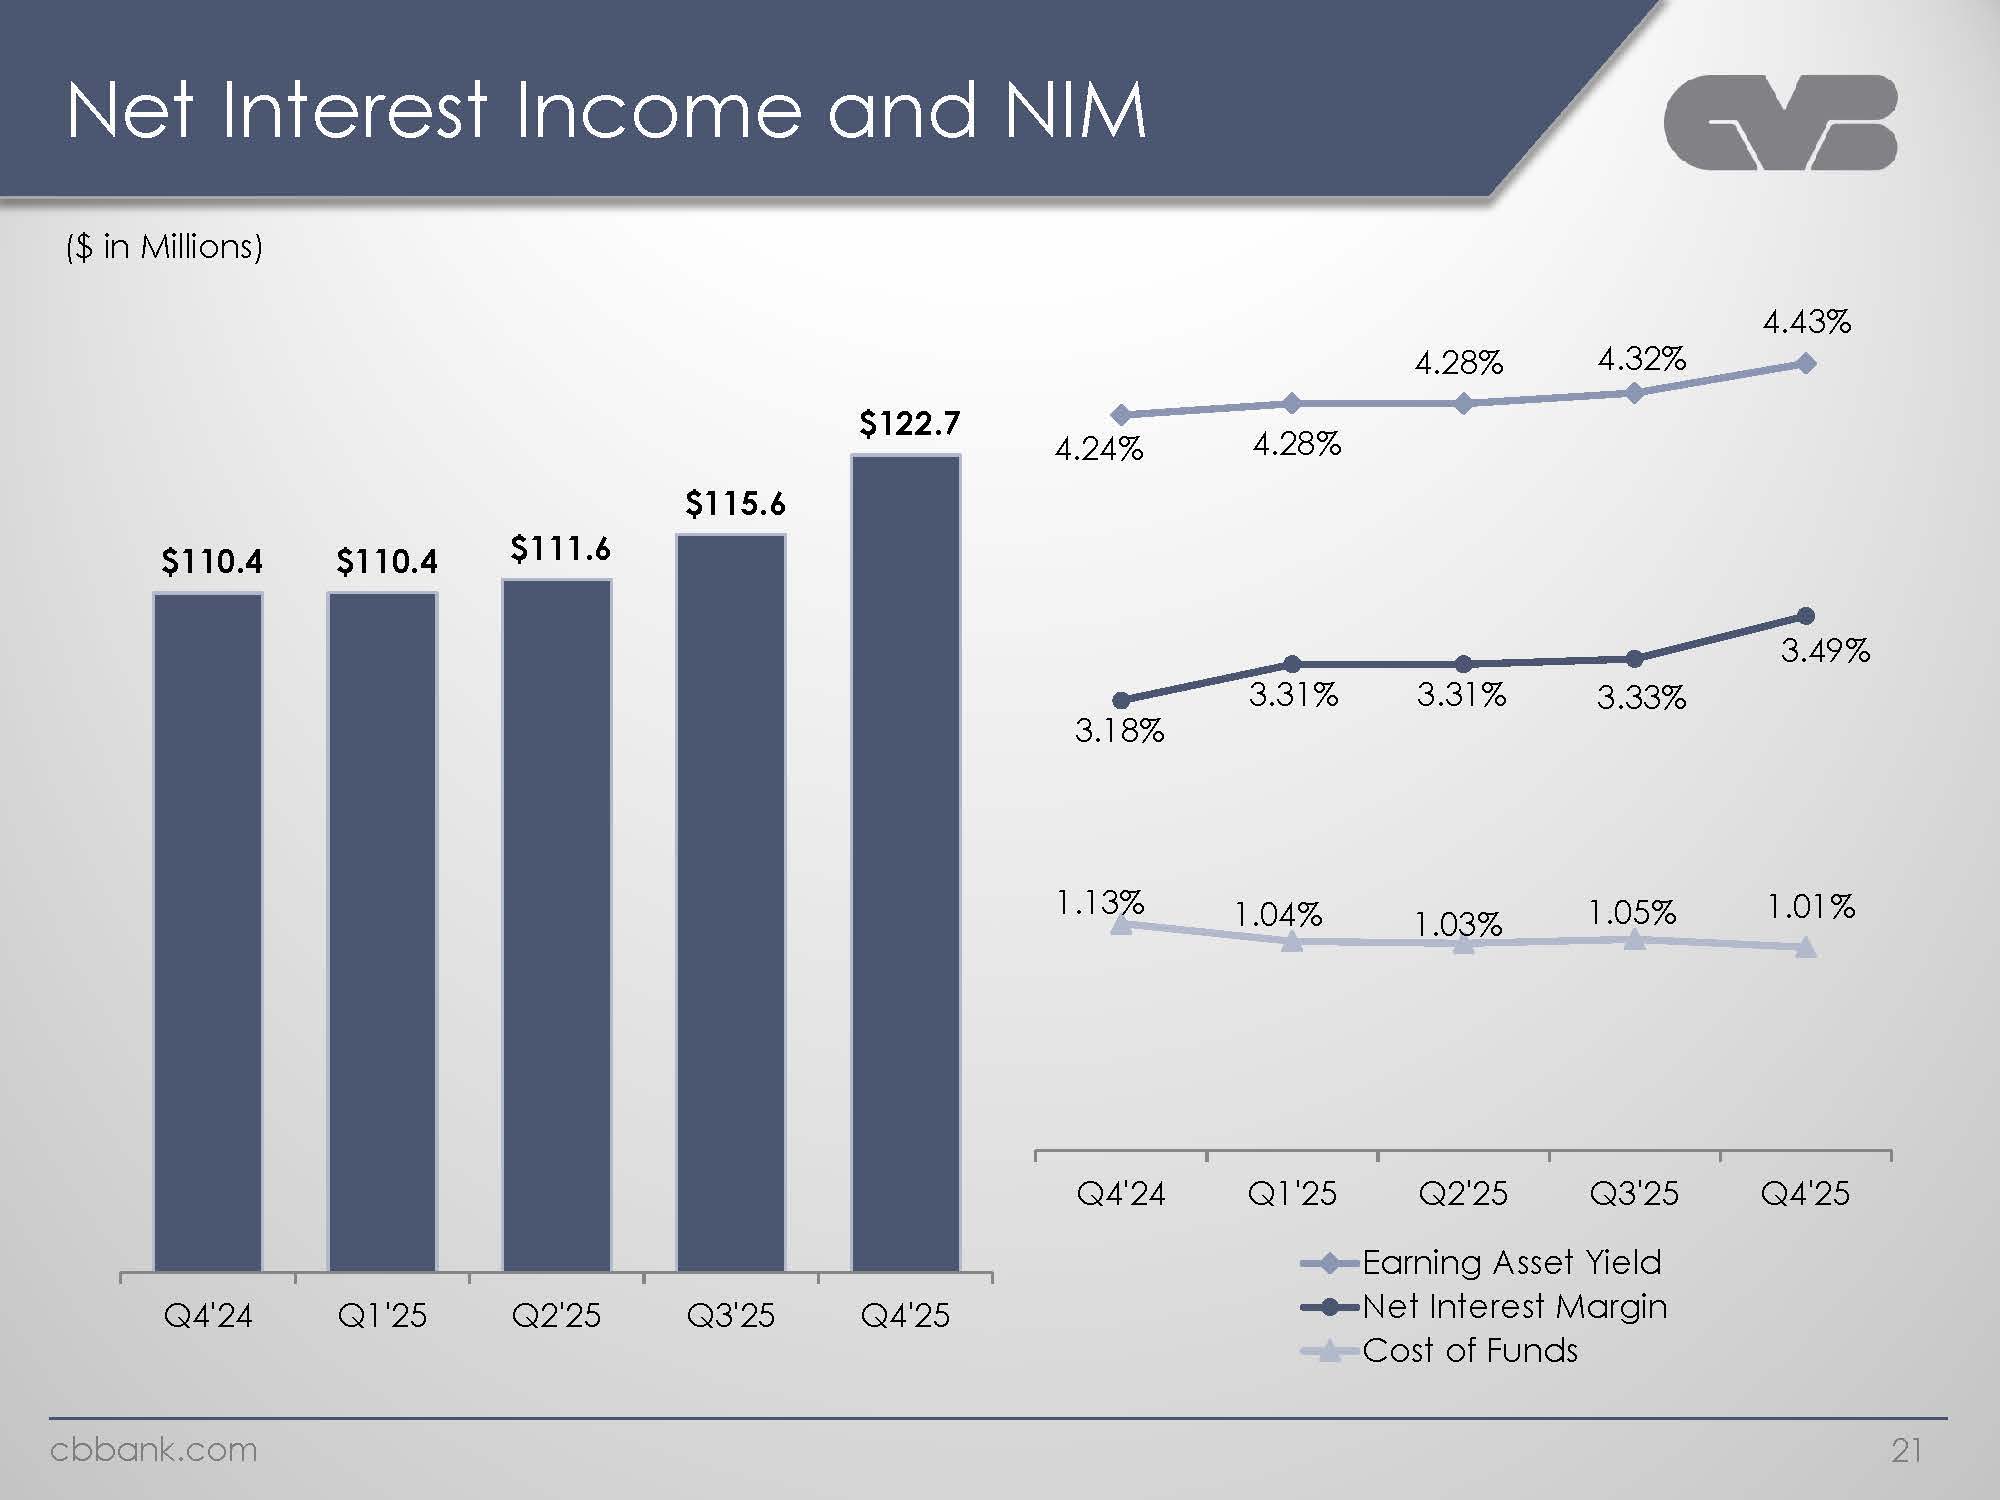
Net Interest Income and NIM ($ in Millions) $110.4 $110.4 $111.6 $115.6 $122.7 4.24% 4.28% 4.28% 4.32% 4.43% 3.18% 3.31% 3.31% 3.33% 3.49% 1.13% 1.04% 1.03% 1.05% 1.01% Q4'24 Q1'25 Q2'25 Q3'25 Q4'25 Q4'24 Q1'25 Q2'25 Q3'25 Q4'25 Q4'24 Q1'25 Q2'25 Q3'25 Q4'25 Earning Asset Yield Net Interest Margin Cost of Funds cbbank.com21
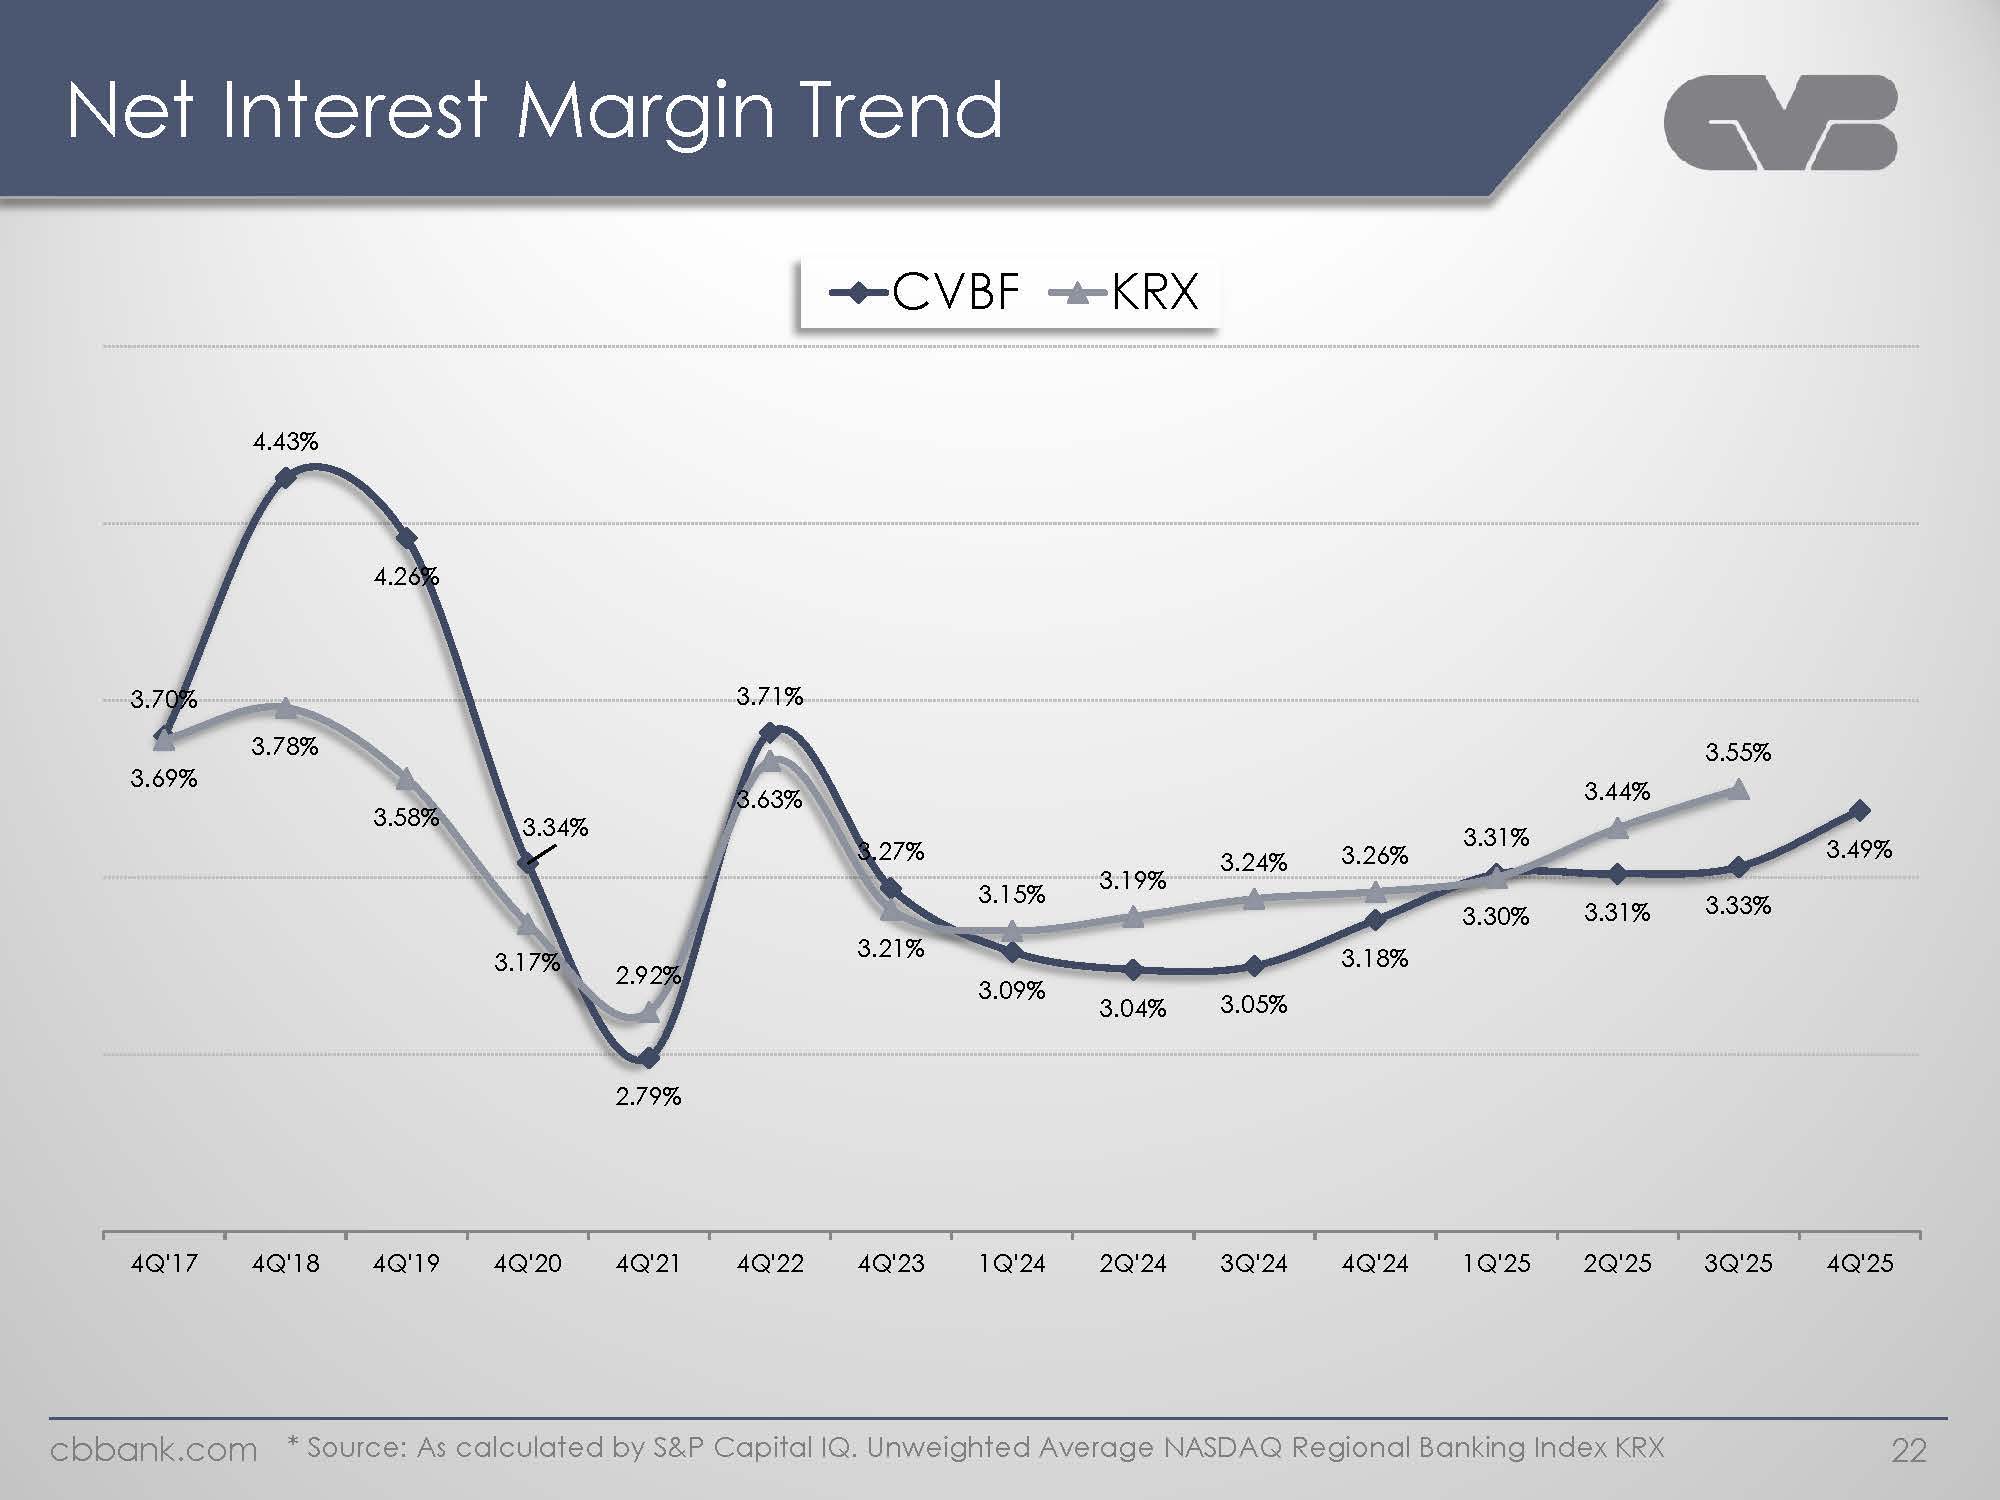
Net Interest Margin Trend CVBF KRX 3.70% 4.43% 4.26% 3.34% 2.79% 3.71% 3.27% 3.09% 3.04% 3.05% 3.18% 3.31% 3.31% 3.33% 3.49% 3.69% 3.78% 3.58% 3.17% 2.92% 3.63% 3.21% 3.15% 3.19% 3.24% 3.26% 3.30% 3.44% 3.55% 4Q'17 4Q'18 4Q'19 4Q'20 4Q'21 4Q'22 4Q'23 1Q'24 2Q'24 3Q'24 4Q'24 1Q'25 2Q'25 3Q'25 4Q'25 cbbank.com * Source: As calculated by S&P Capital IQ. Unweighted Average NASDAQ Regional Banking Index KRX 22
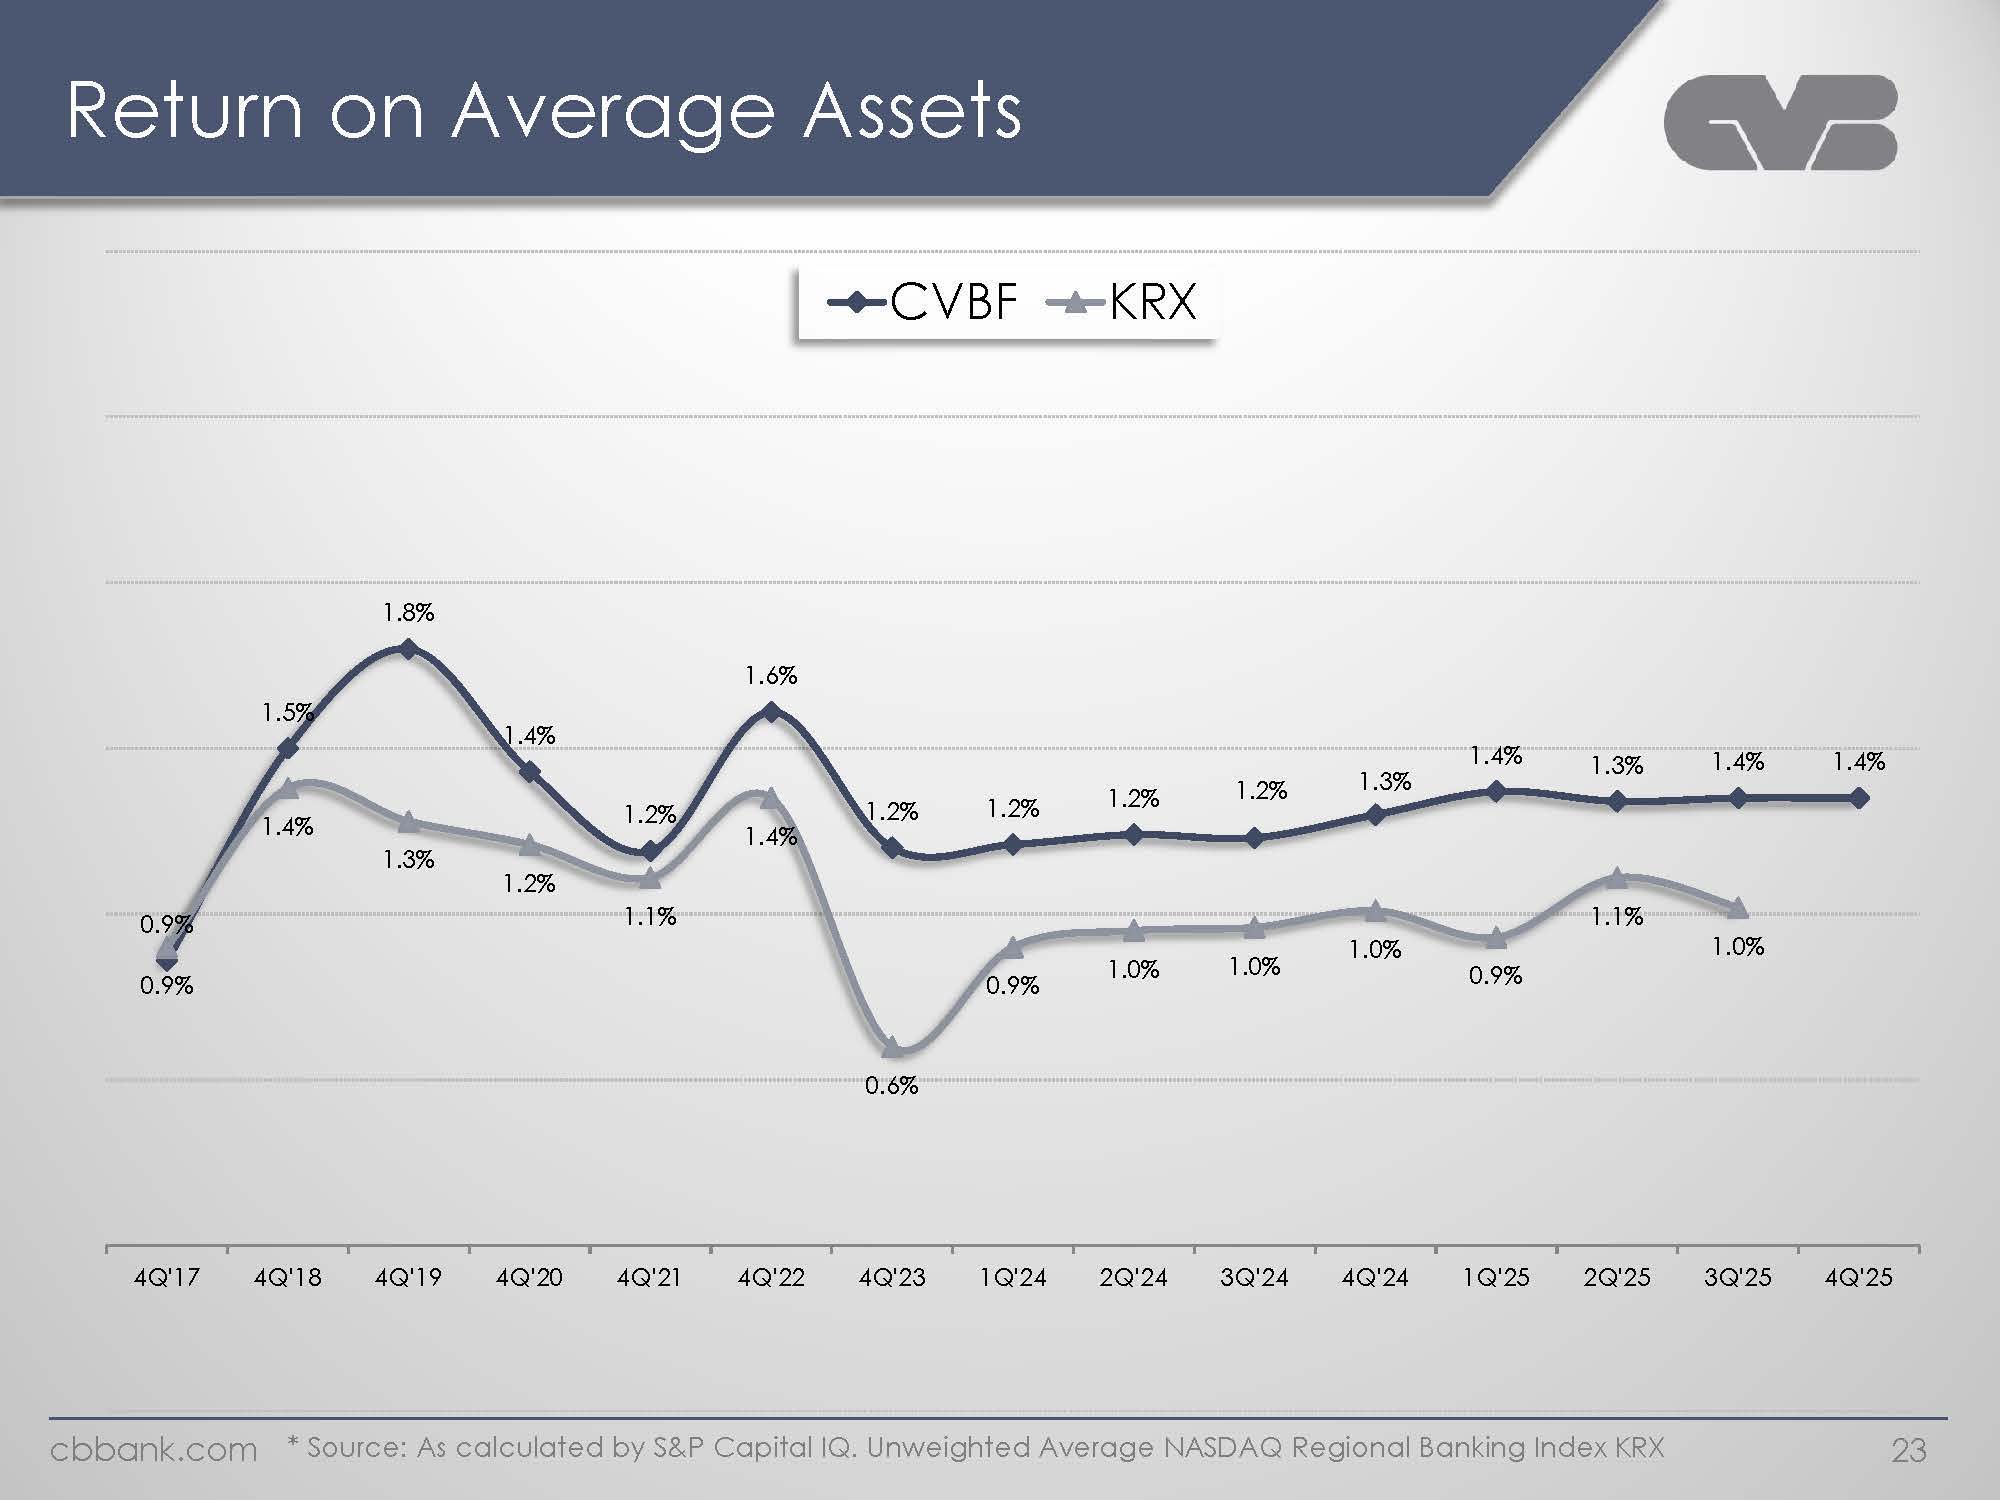
Return on Average Assets CVBF KRX 0.9% 1.5% 1.8% 1.4% 1.2% 1.6% 1.2% 1.2% 1.2% 1.2% 1.3% 1.4% 1.3% 1.4% 1.4% 0.9% 1.4% 1.3% 1.2% 1.1% 1.4% 0.6% 0.9% 1.0% 1.0% 1.0% 0.9% 1.1% 1.04 Q'17 4Q'18 4Q'19 4Q'20 4Q'21 4Q'22 4Q'23 1Q'24 2Q'24 3Q'24 4Q'24 1Q'25 2Q'25 3Q'25 4Q'25 cbbank.com * Source: As calculated by S&P Capital IQ. Unweighted Average NASDAQ Regional Banking Index KRX 23
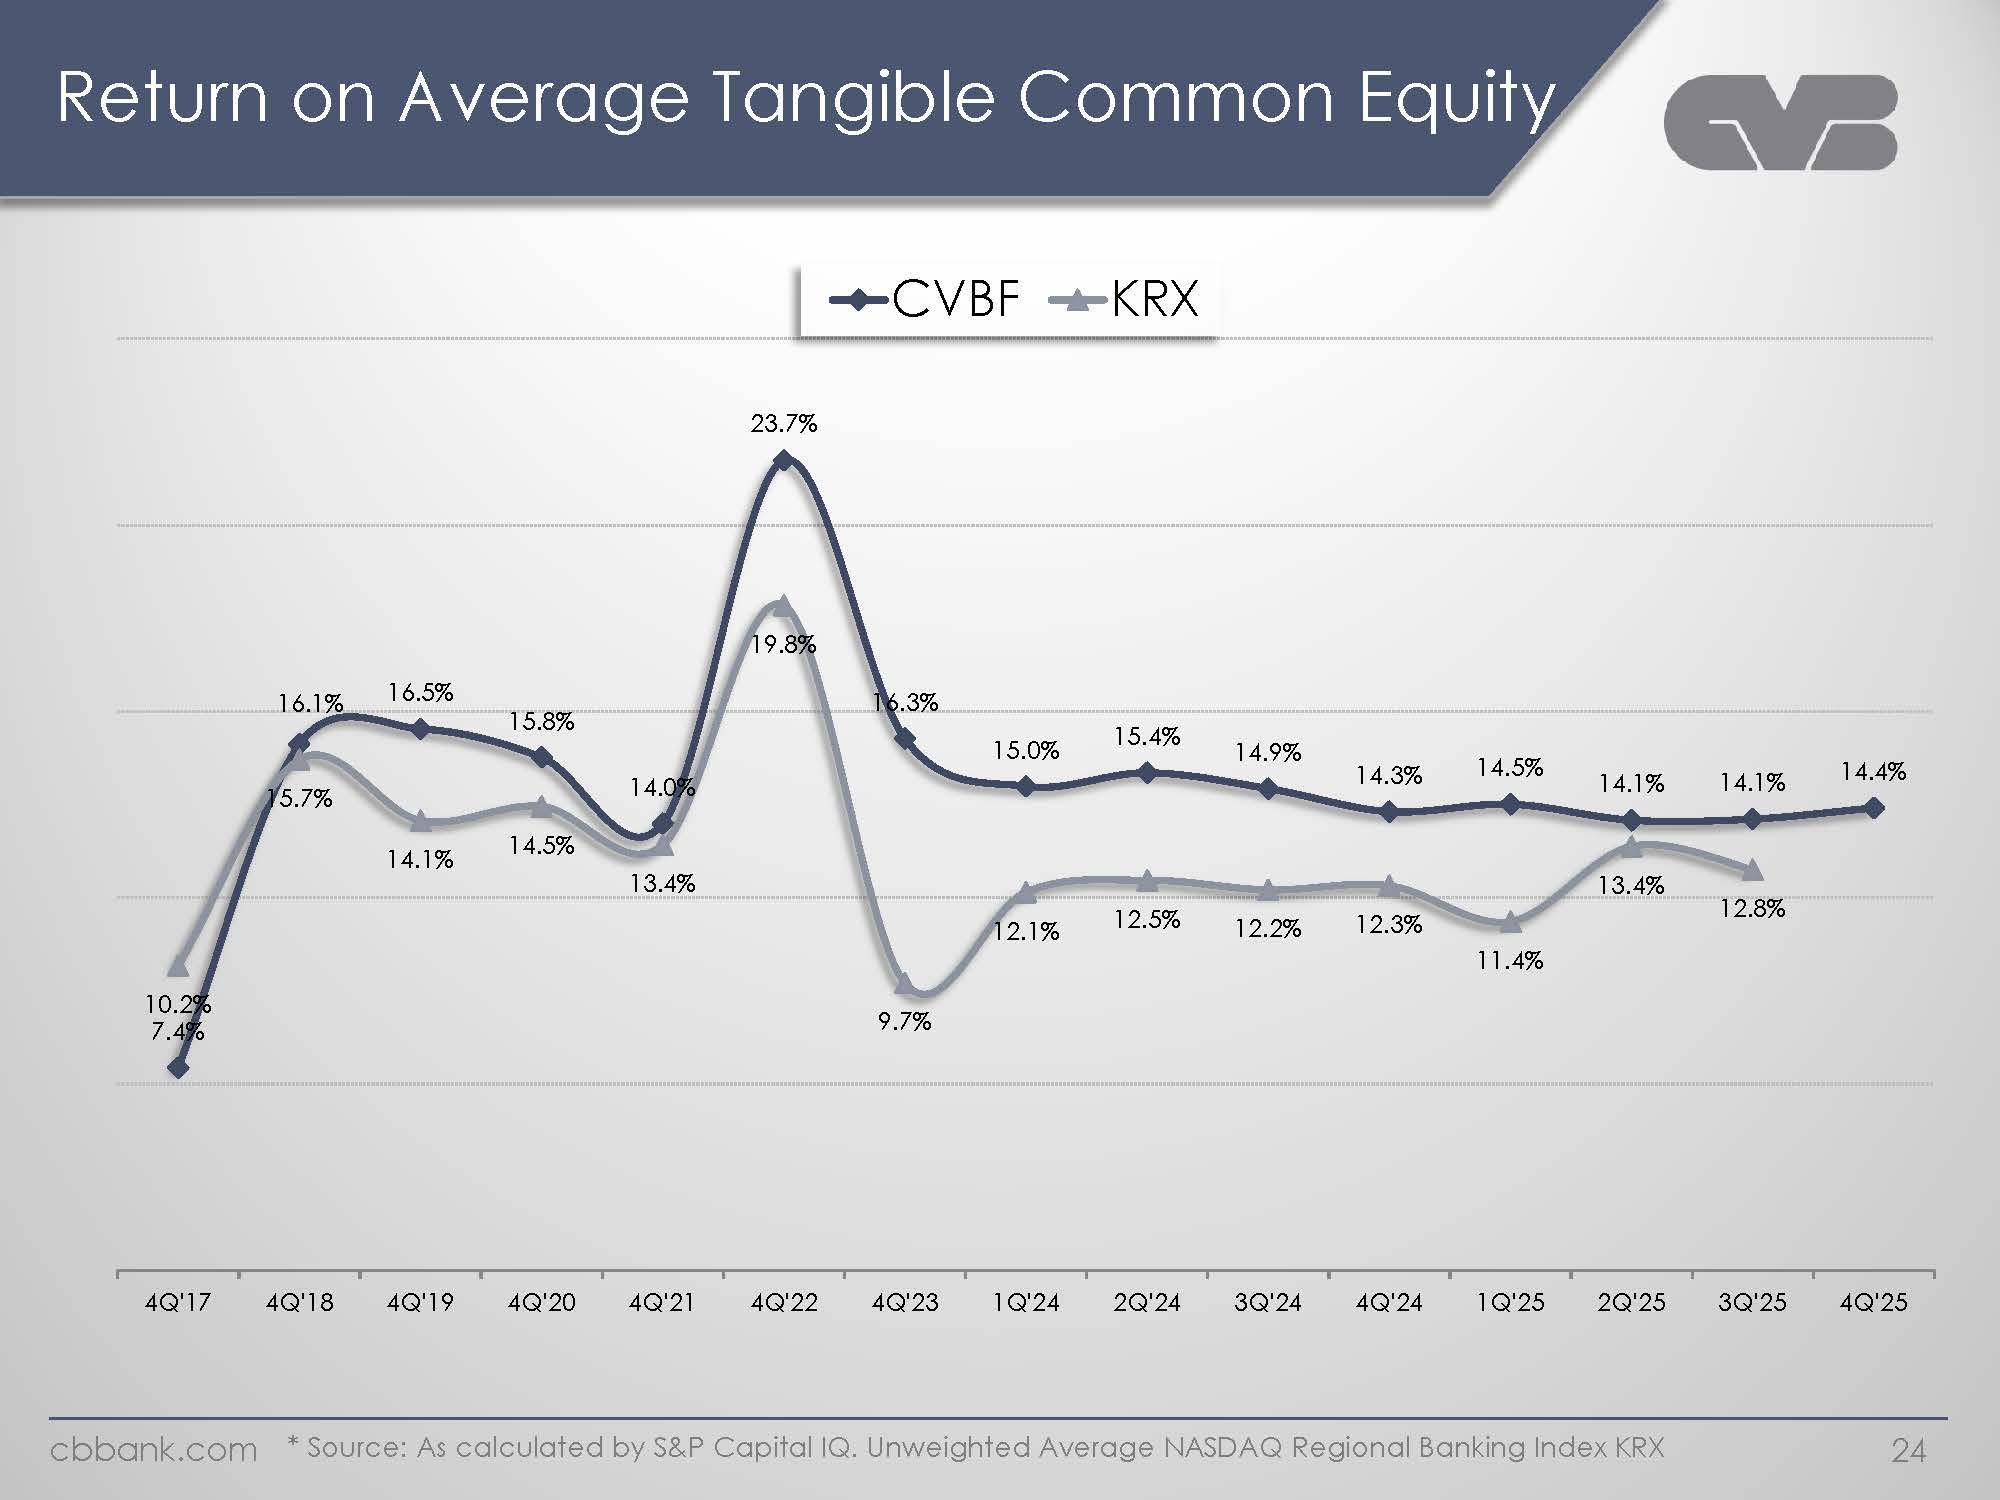
Return on Average Tangible Common Equity CVBF KRX 7.4% 16.1% 16.5% 15.8% 14.0% 23.7% 16.3% 15.0% 15.4% 14.9% 14.3% 14.5% 14.1% 14.1% 14.4% 10.2% 15.7% 14.1% 14.5% 13.4% 19.8% 9.7% 12.1% 12.5% 12.2% 12.3% 11.4% 13.4% 12.8% 4Q'17 4Q'18 4Q'19 4Q'20 4Q'21 4Q'22 4Q'23 1Q'24 2Q'24 3Q'24 4Q'24 1Q'25 2Q'25 3Q'25 4Q'25 cbbank.com * Source: As calculated by S&P Capital IQ. Unweighted Average NASDAQ Regional Banking Index KRX 24

CET1 Ratio Trend (%) CVBF KRX CB Acquisition ASR / Suncrest Acquisition 16.4% 13.0% 14.8% 14.8% 14.9% 13.6% 14.7% 15.0% 15.3% 15.8% 16.2% 16.5% 16.5% 16.3% 15.9% 11.8% 12.0% 12.1% 12.5% 12.5% 11.8% 12.2% 12.2% 12.3% 12.6% 12.8% 12.8% 12.7% 12.8% 4Q'17 4Q'18 4Q'19 4Q'20 4Q'21 4Q'22 4Q'23 1Q'24 2Q'24 3Q'24 4Q'24 1Q'25 2Q'25 3Q'25 4Q'25 cbbank.com * Source: S&P Capital IQ. Unweighted Average NASDAQ Regional Banking Index KRX 25
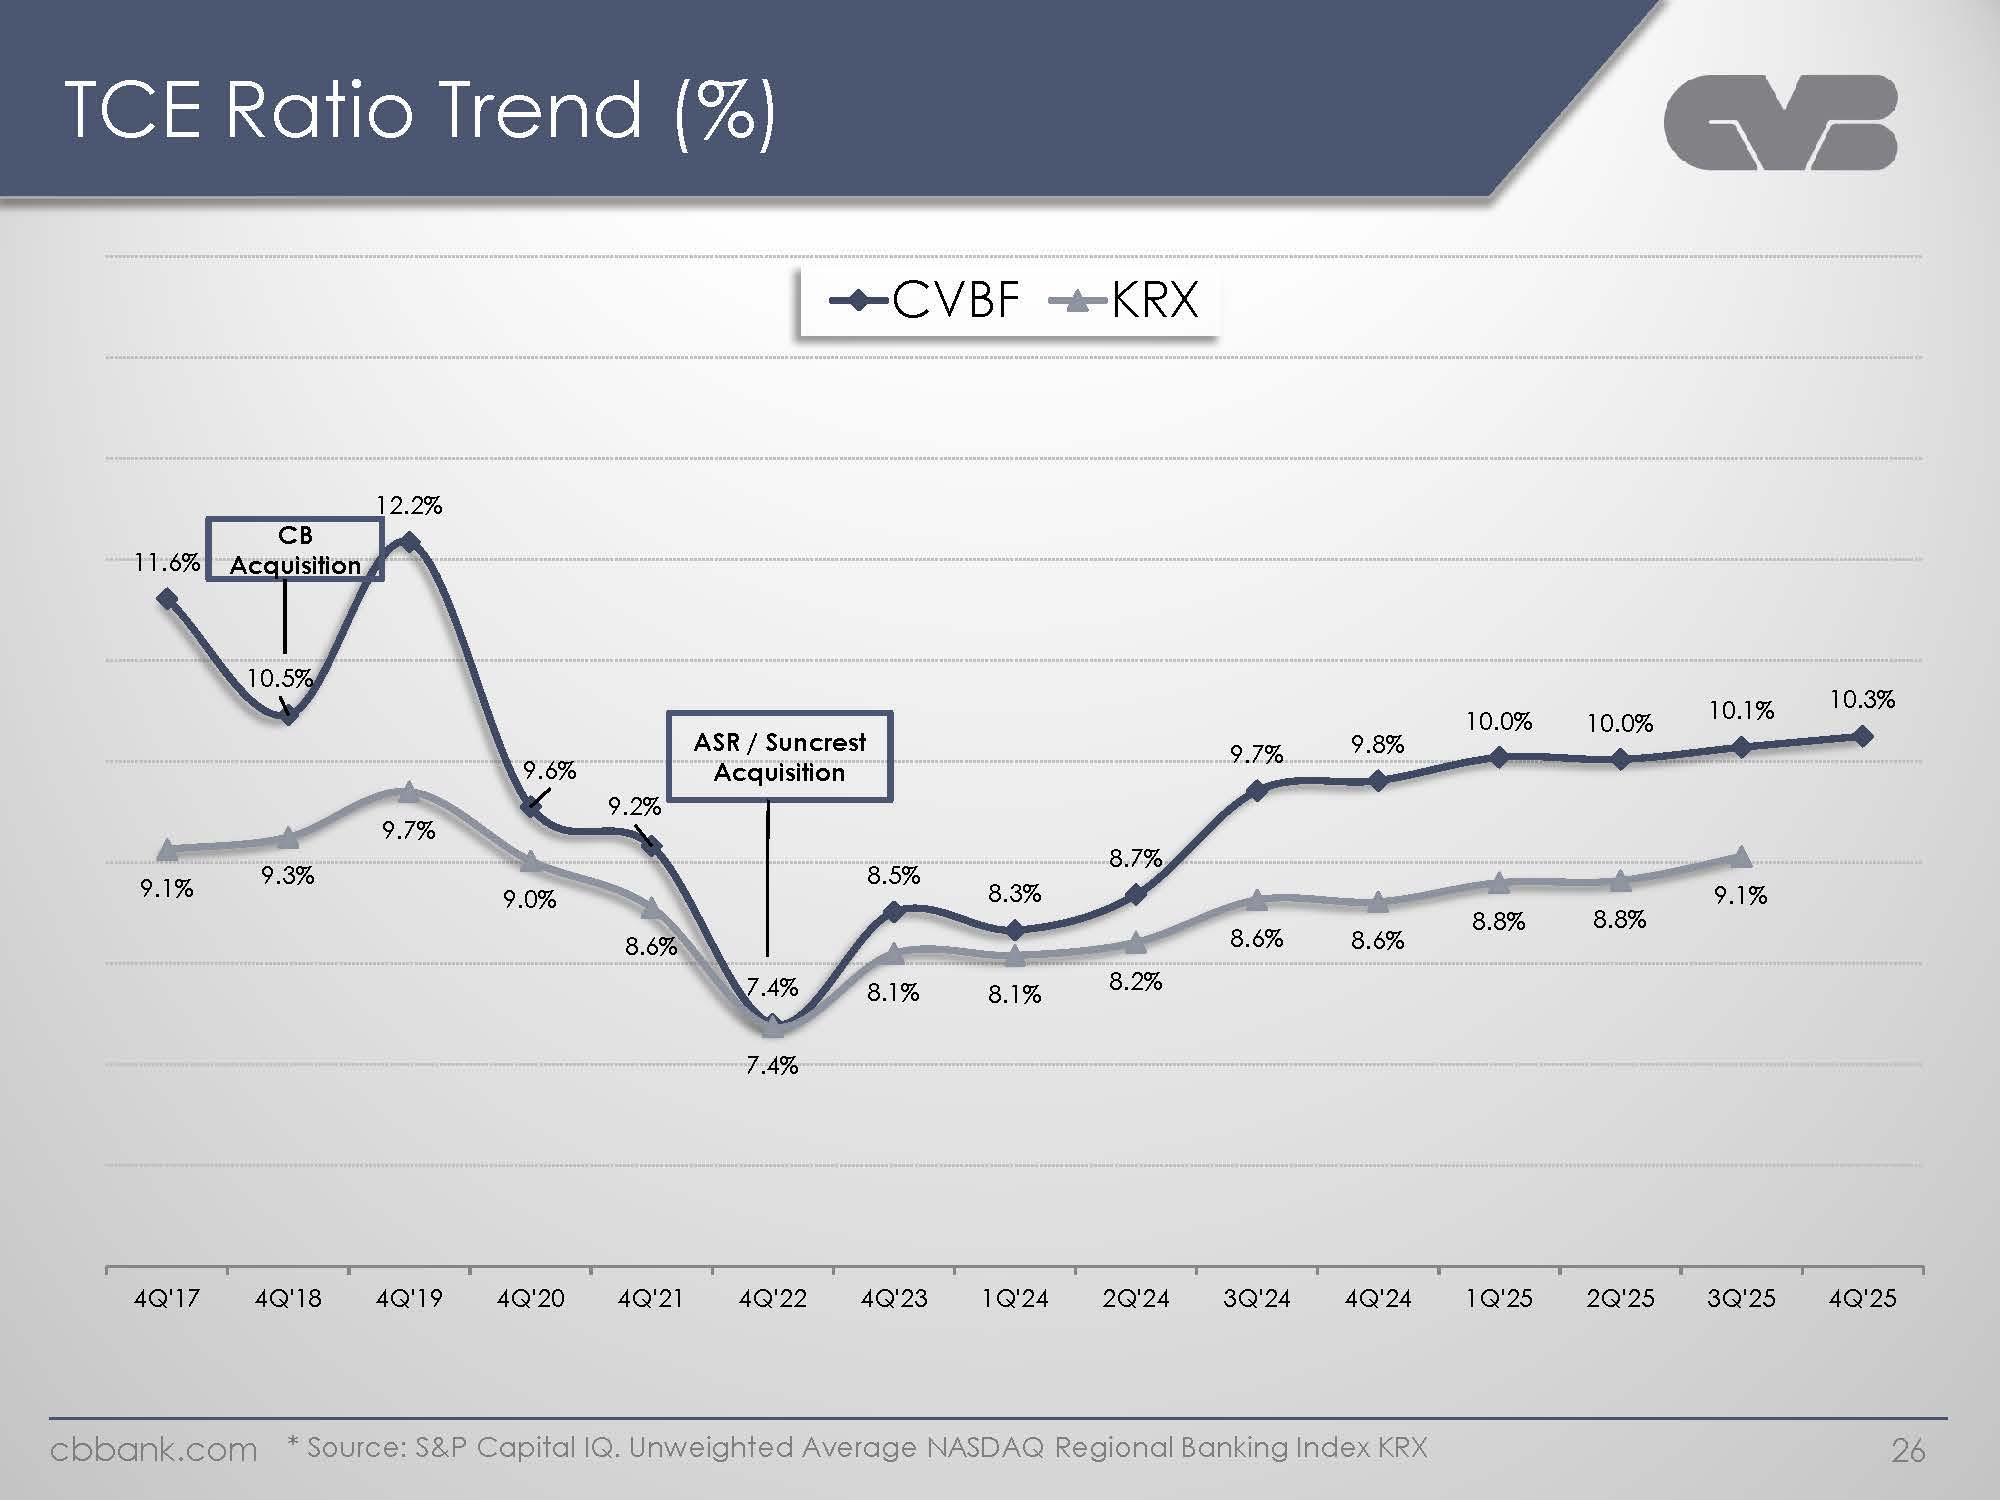
TCE Ratio Trend (%) CVBF KRX CB Acquisition ASR / Suncrest Acquisition 11.6% 10.5% 12.2% 9.6% 9.2% 7.4% 8.5% 8.3% 8.7% 9.7% 9.8% 10.0% 10.0% 10.1% 10.3% 9.1% 9.3% 9.7% 9.0% 8.6% 7.4% 8.1% 8.1% 8.2% 8.6% 8.6% 8.8% 8.8% 9.1% 4Q'17 4Q'18 4Q'19 4Q'20 4Q'21 4Q'22 4Q'23 1Q'24 2Q'24 3Q'24 4Q'24 1Q'25 2Q'25 3Q'25 4Q'25 cbbank.com * Source: S&P Capital IQ. Unweighted Average NASDAQ Regional Banking Index KRX 26
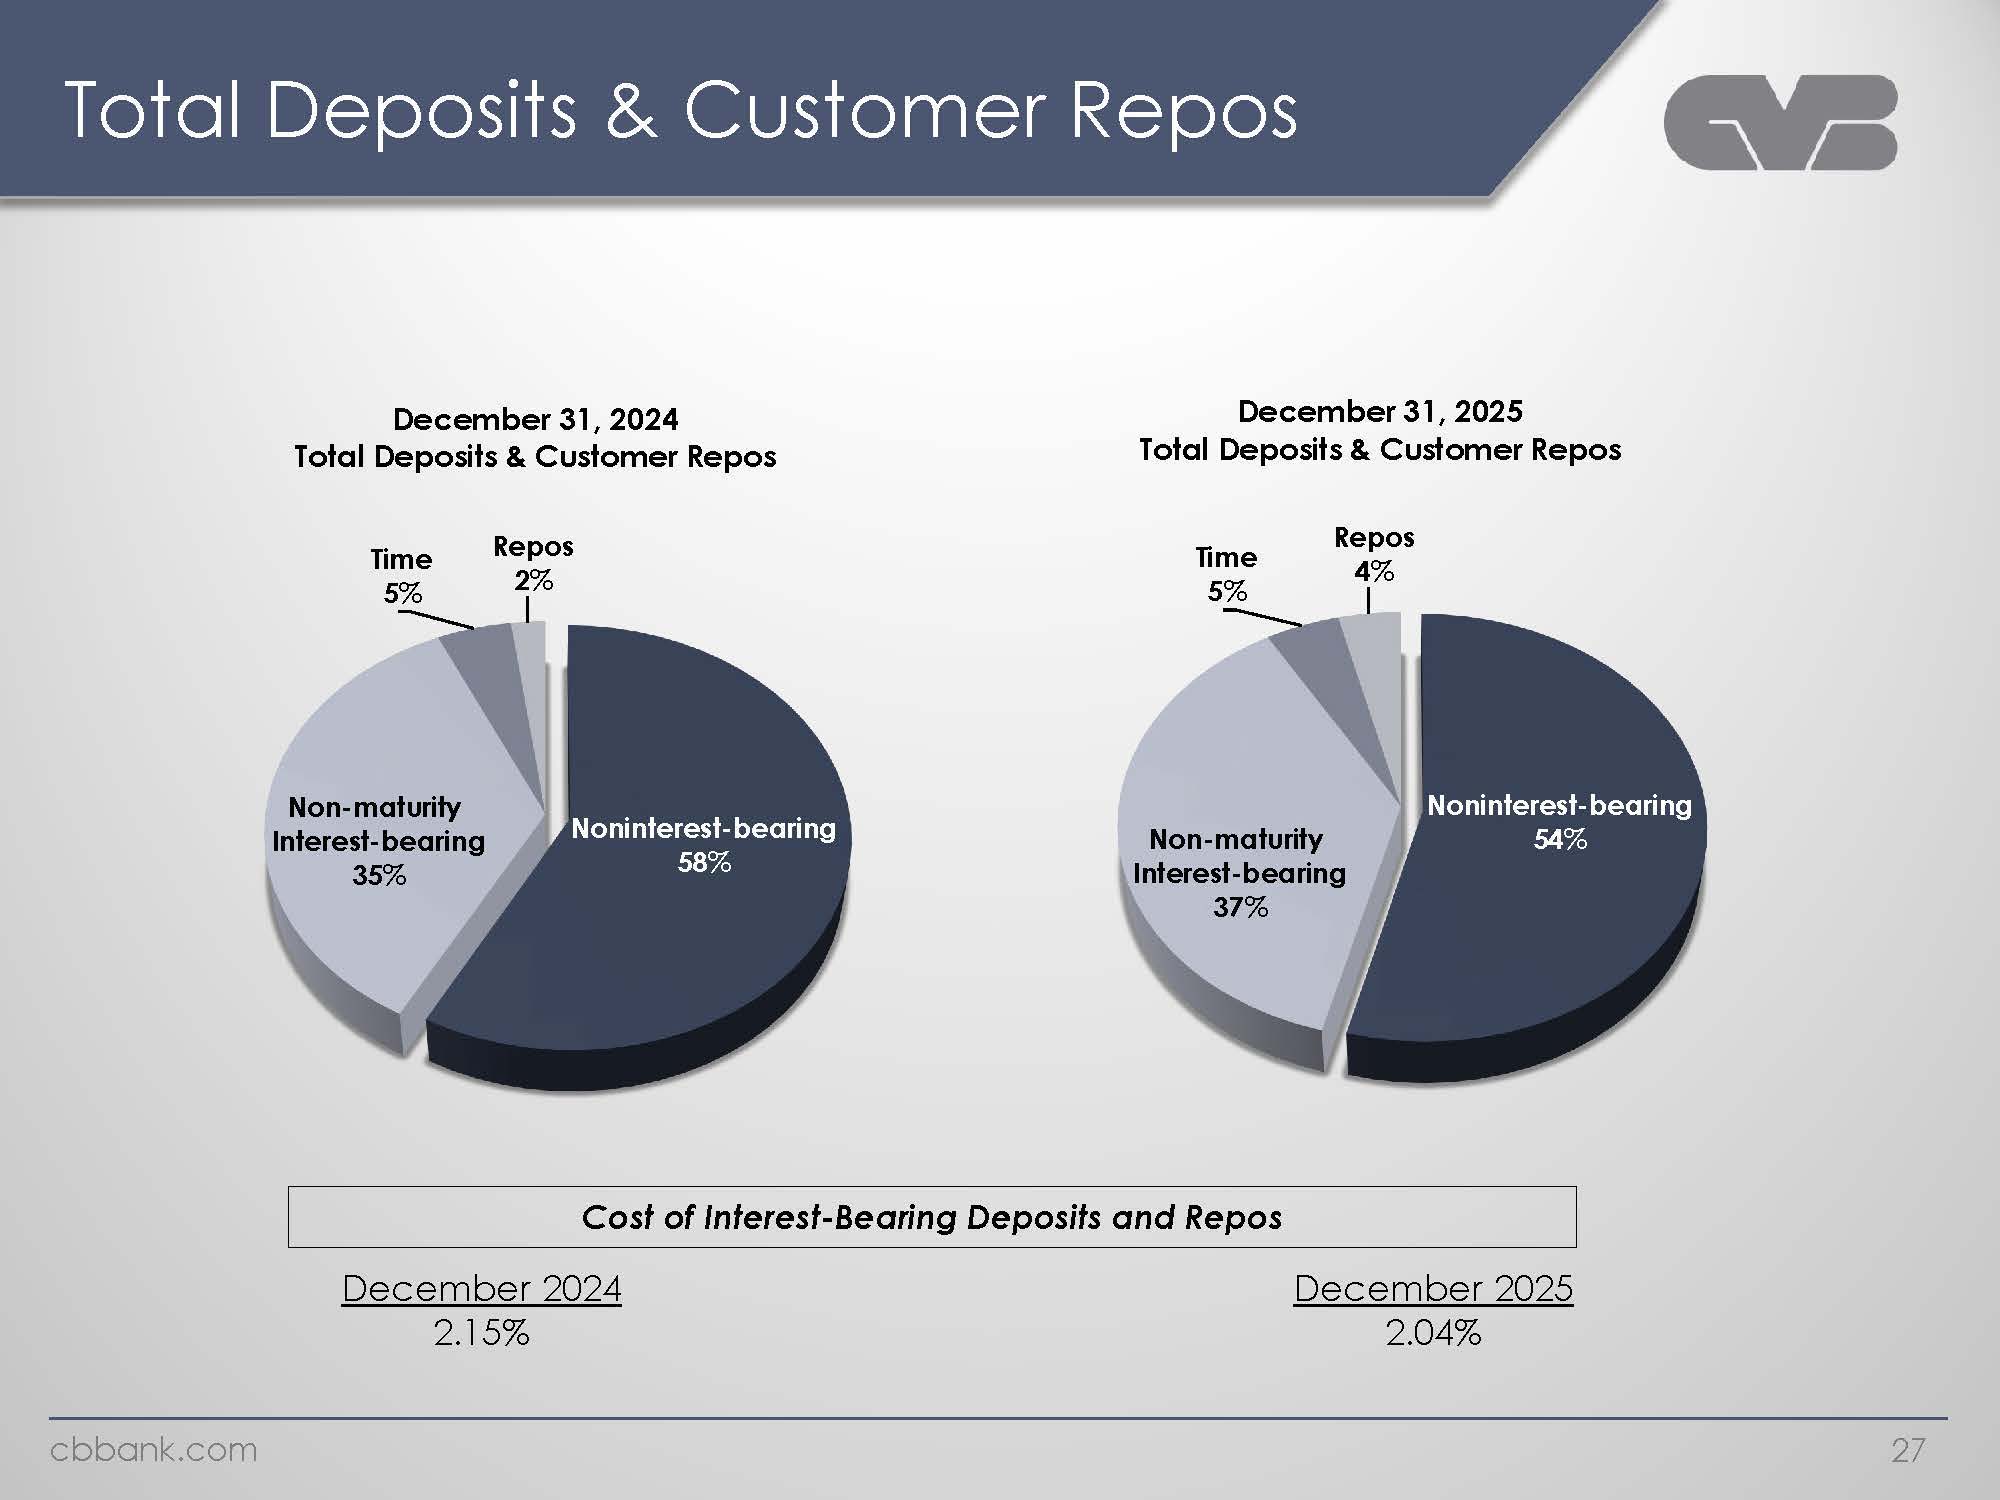
Total Deposits & Customer Repos December 31, 2024 Total Deposits & Customer Time 5% Repos 2% Non-maturity Interest-bearing 35% Noninterest-bearing 58% Repos December 31, 2025 Total Deposits & Customer Repos Time 5% Repos 4% Non-maturity Interest-bearing 37% Noninterest-bearing 54% Cost of Interest-Bearing Deposits and Repos December 2024 2.15% December 2025 2.04% cbbank.com 27
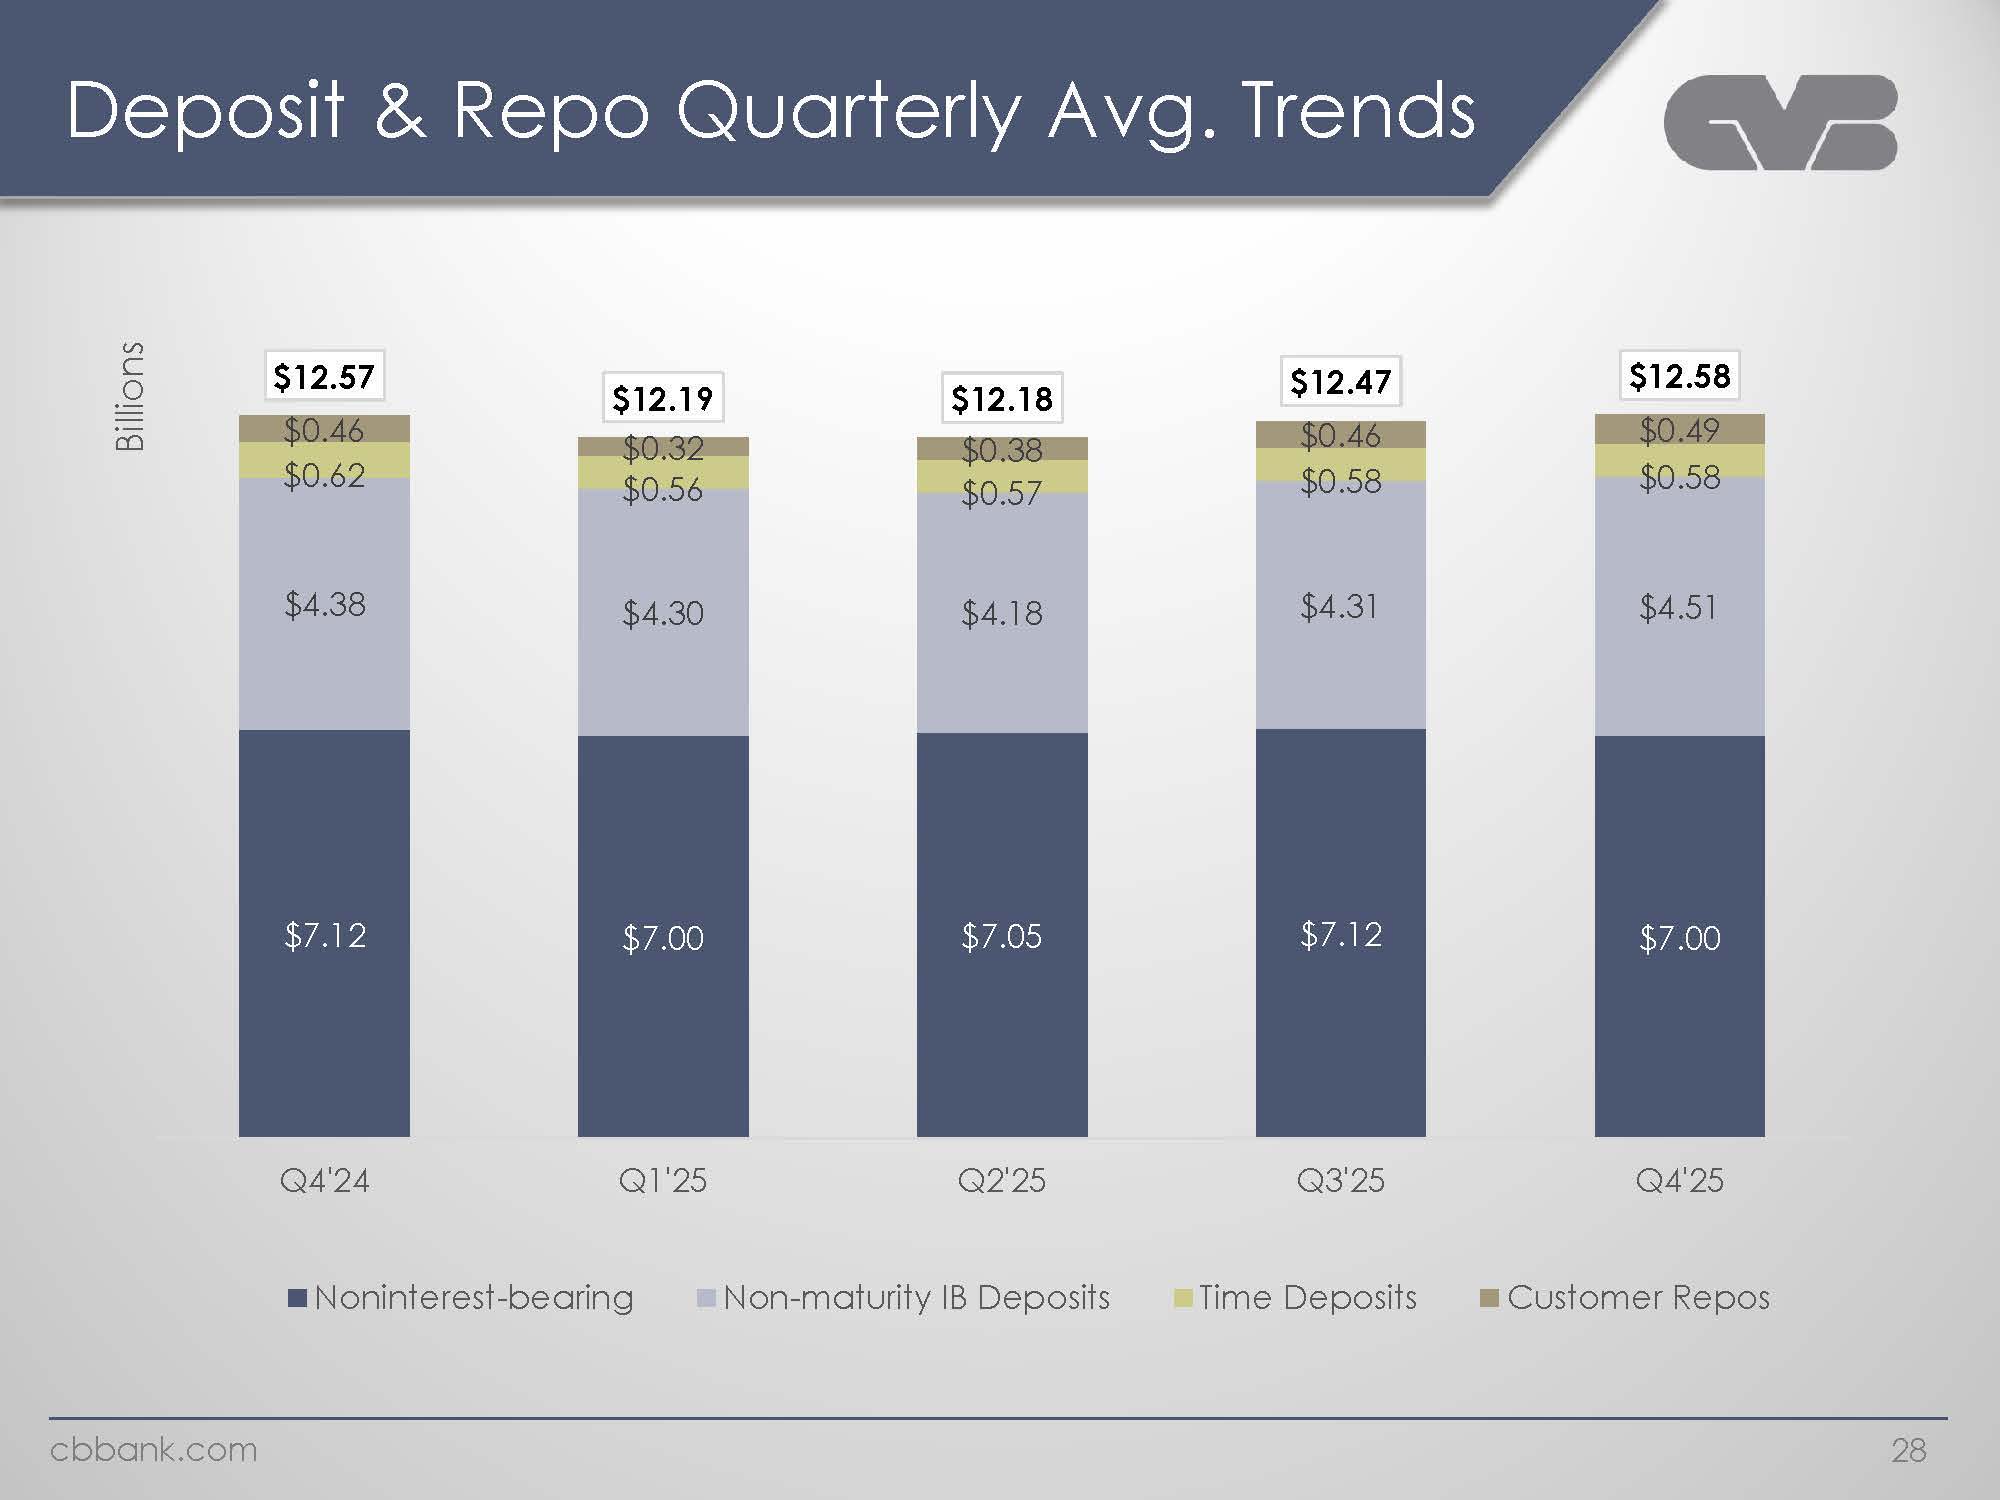
Deposit & Repo Quarterly Avg. Trends Billions $12.57 $12.19 $12.18 $12.47 $12.58 $0.46 $0.32 $0.38 $0.46 $0.49 $0.62 $0.56 $0.57 $0.58 $0.58 $4.38 $4.30 $4.18 $4.31 $4.51 $7.12 $7.00 $7.05 $7.12 $7.00 Q4'24 Q1'25 Q2'25 Q3'25 Q4'25 Noninterest-bearing Non-maturity IB Deposits Time Deposits Customer Repos cbbank.com 28
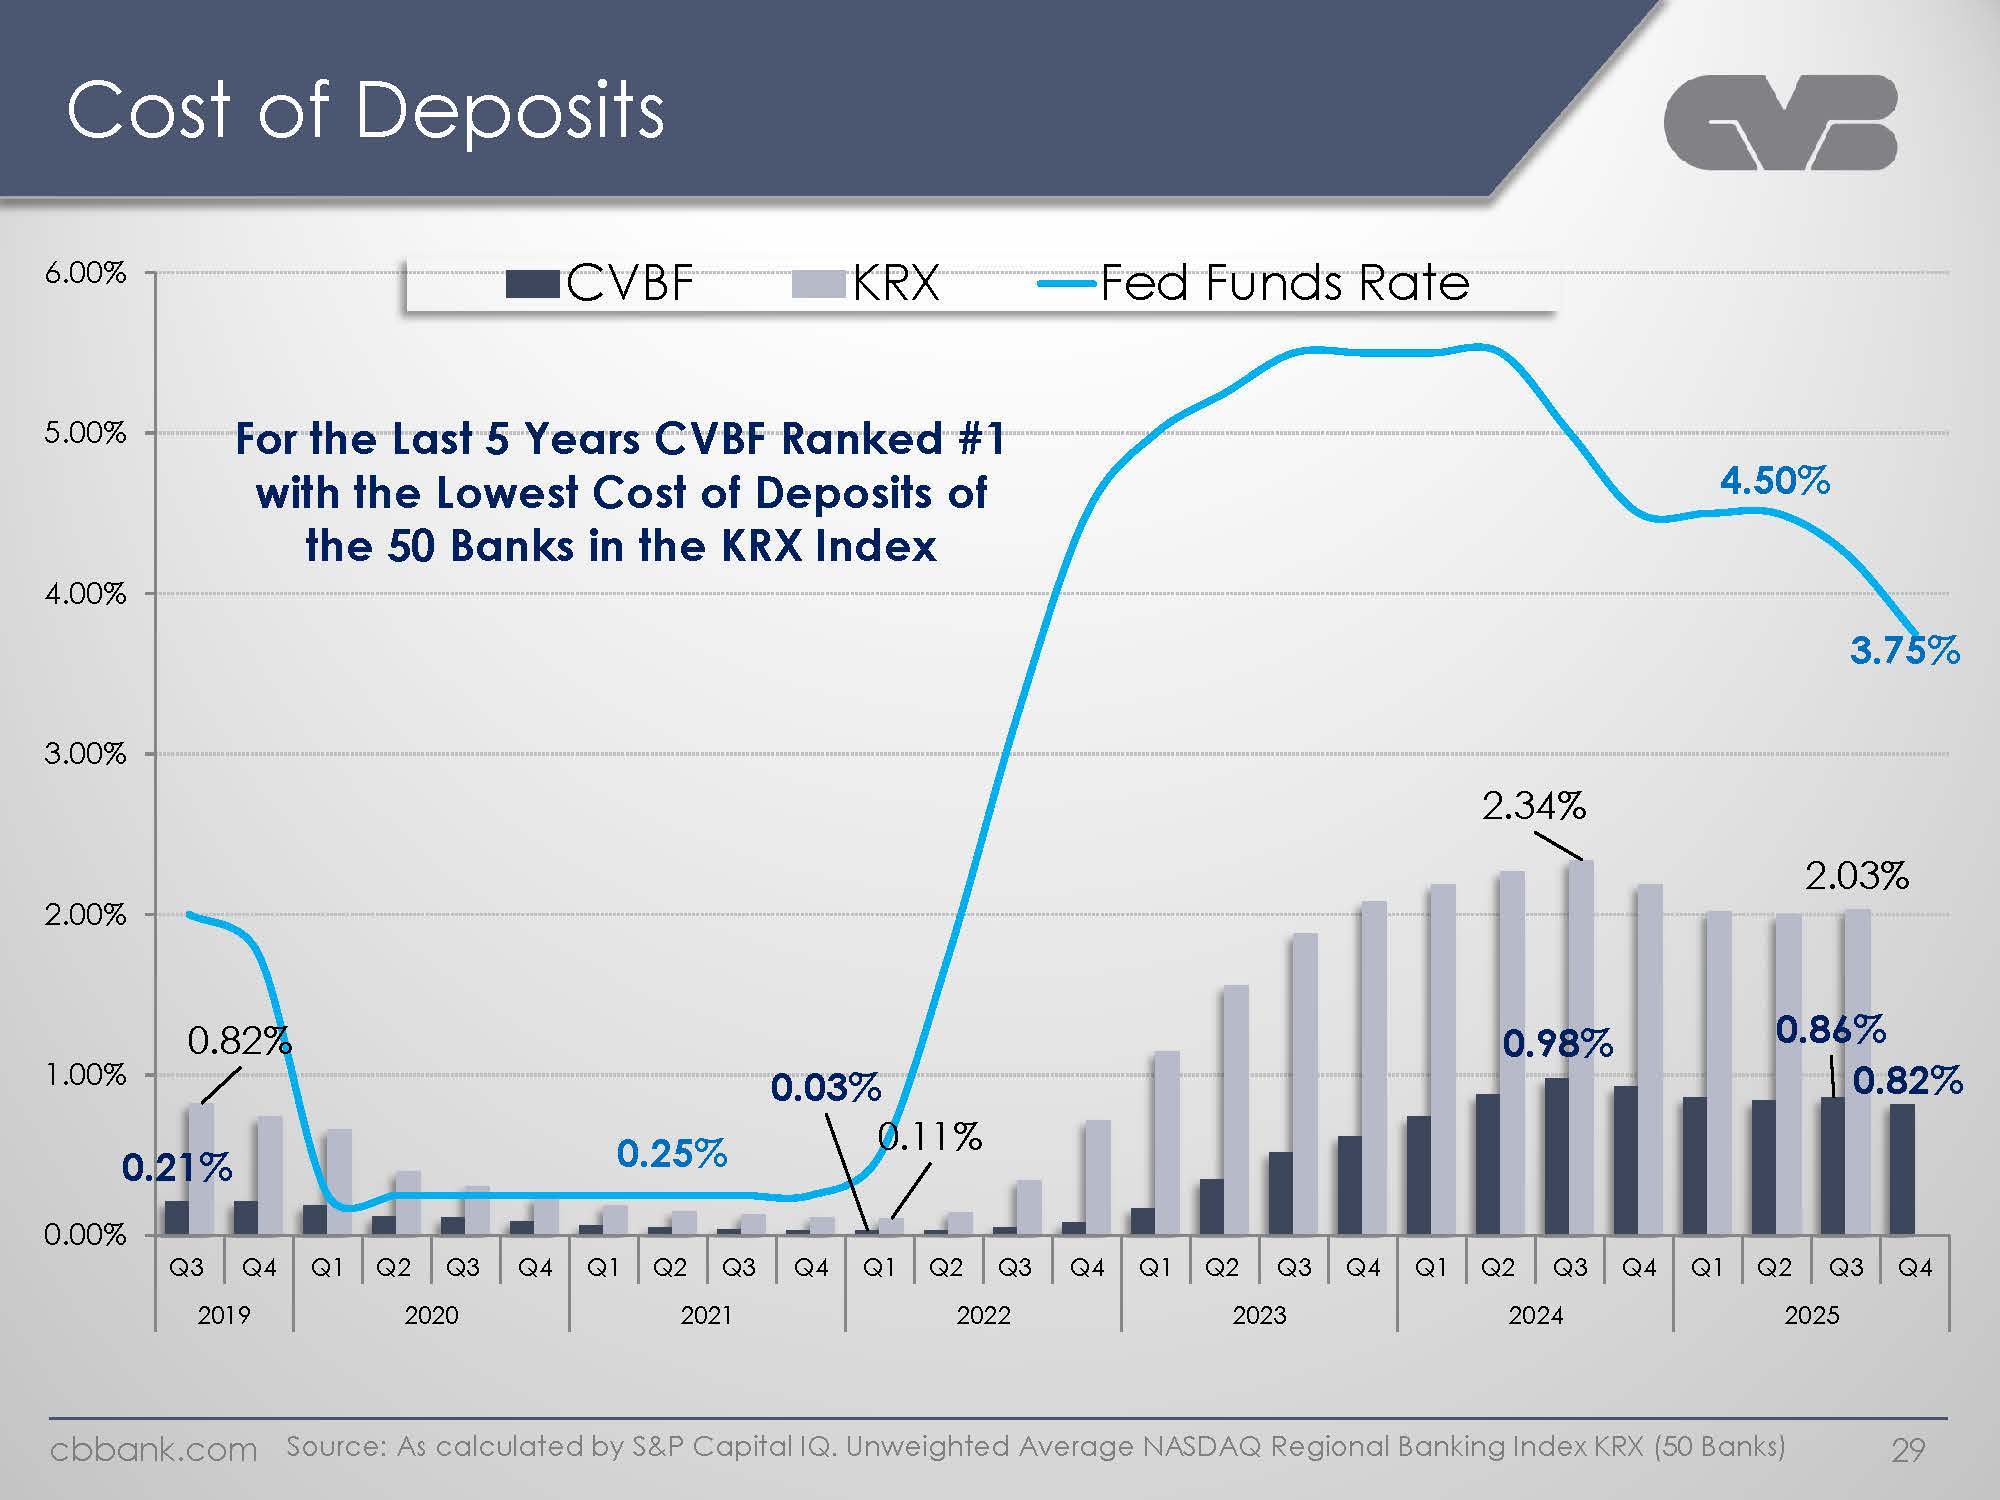
Cost of Deposits CVBF KRX Fed Funds Rate For the Last 5 Years CVBF Ranked #1 with the Lowest Cost of Deposits of the 50 Banks in the KRX Index 6.00% 5.00% 4.00% 3.00% 2.00% 1.00% 0.00% 0.25% 4.50% 3.75% 0.82% 0.11% 2.34% 2.03% 0.21% 0.03% 0.98% 0.86% 0.82% Q3 Q4 Q1 Q2 Q3 Q4 Q1 Q2 Q3 Q4 Q1 Q2 Q3 Q4 Q1 Q2 Q3 Q4 Q1 Q2 Q3 Q4 Q1 Q2 Q3 Q4 2019 2020 2021 2022 2023 2024 2025 cbbank.com Source: As calculated by S&P Capital IQ. Unweighted Average NASDAQ Regional Banking Index KRX (50 Banks) 29
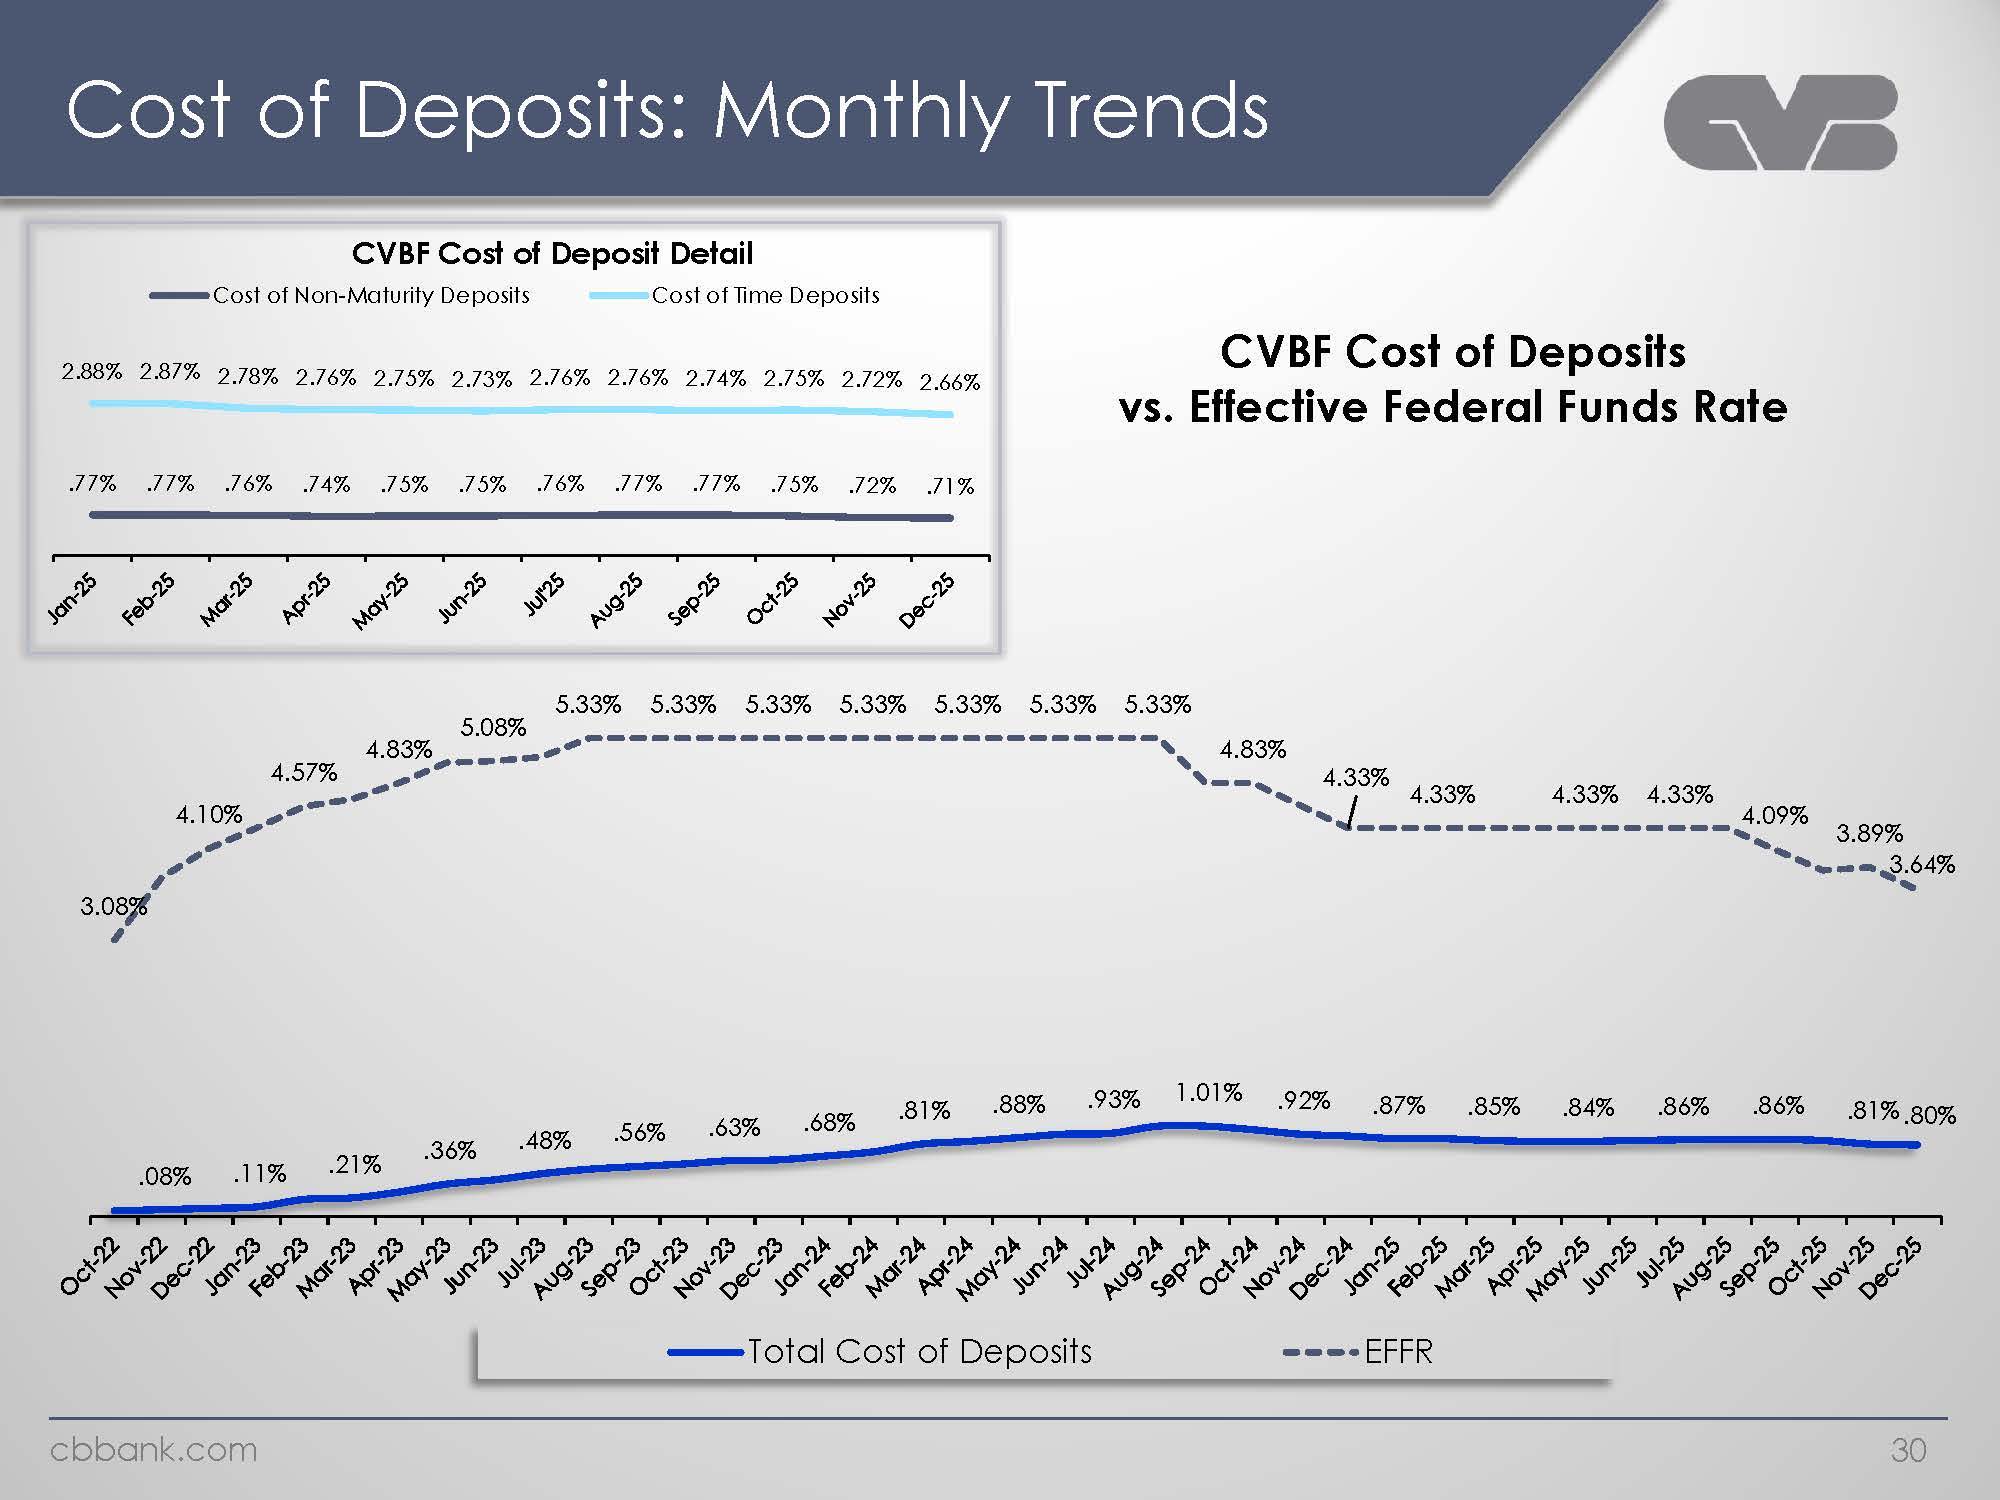
Cost of Deposits: Monthly Trends CVBF Cost of Deposit Detail Cost of Non-Maturity Deposits Cost of Time Deposits 2.88% 2.87% 2.78% 2.76% 2.75% 2.73% 2.76% 2.76% 2.74% 2.75% 2.72% 2.66% .77% .77% .76% .74% .75% .75% .76% .77% .77% .75% .72 .71% Jan-25 Feb-25 Mar-25 Apr-25 May-25 Jun-25 Jul-25 Aug-25 Sep-25 Oct-25 Nov-25 Dec-25 CVBF Cost of Deposits vs. Effective Federal Funds Rate 3.08% 4.10% 4.57% 4.83% 5.08% 5.33% 5.33% 5.33% 5.33% 5.33% 5.33% 5.33% 4.83% 4.33% 4.33% 4.33% 4.33% 4.09% 3.89% 3.64% .08% .11% .21% .36% .48% .56% .63% .68% .81% .88% .93% 1.01% .92% .87% .85% .84% .86% .86% .81% .80% Oct-22 Nov-22 Dec-22 Jan-23 Feb-23 Mar-23 Apr-23 May-23 Jun-23 Jul-23 Aug-23 Sep-23 Oct-23 Nov-23 Dec-23 Jan-24 Feb-24 Mar-24 Apr-24 May-24 Jun-24 Jul-24 Aug-24 Sep-24 Oct-24 Nov-24 Dec-24 Jan-25 Feb-25 Mar-25 Apr-25 May-25 Jun-25 Jul-25 Aug-25 Sep-25 Oct-25 Nov-25 Dec-25 Total Cost of Deposits EFFR cbbank.com 30
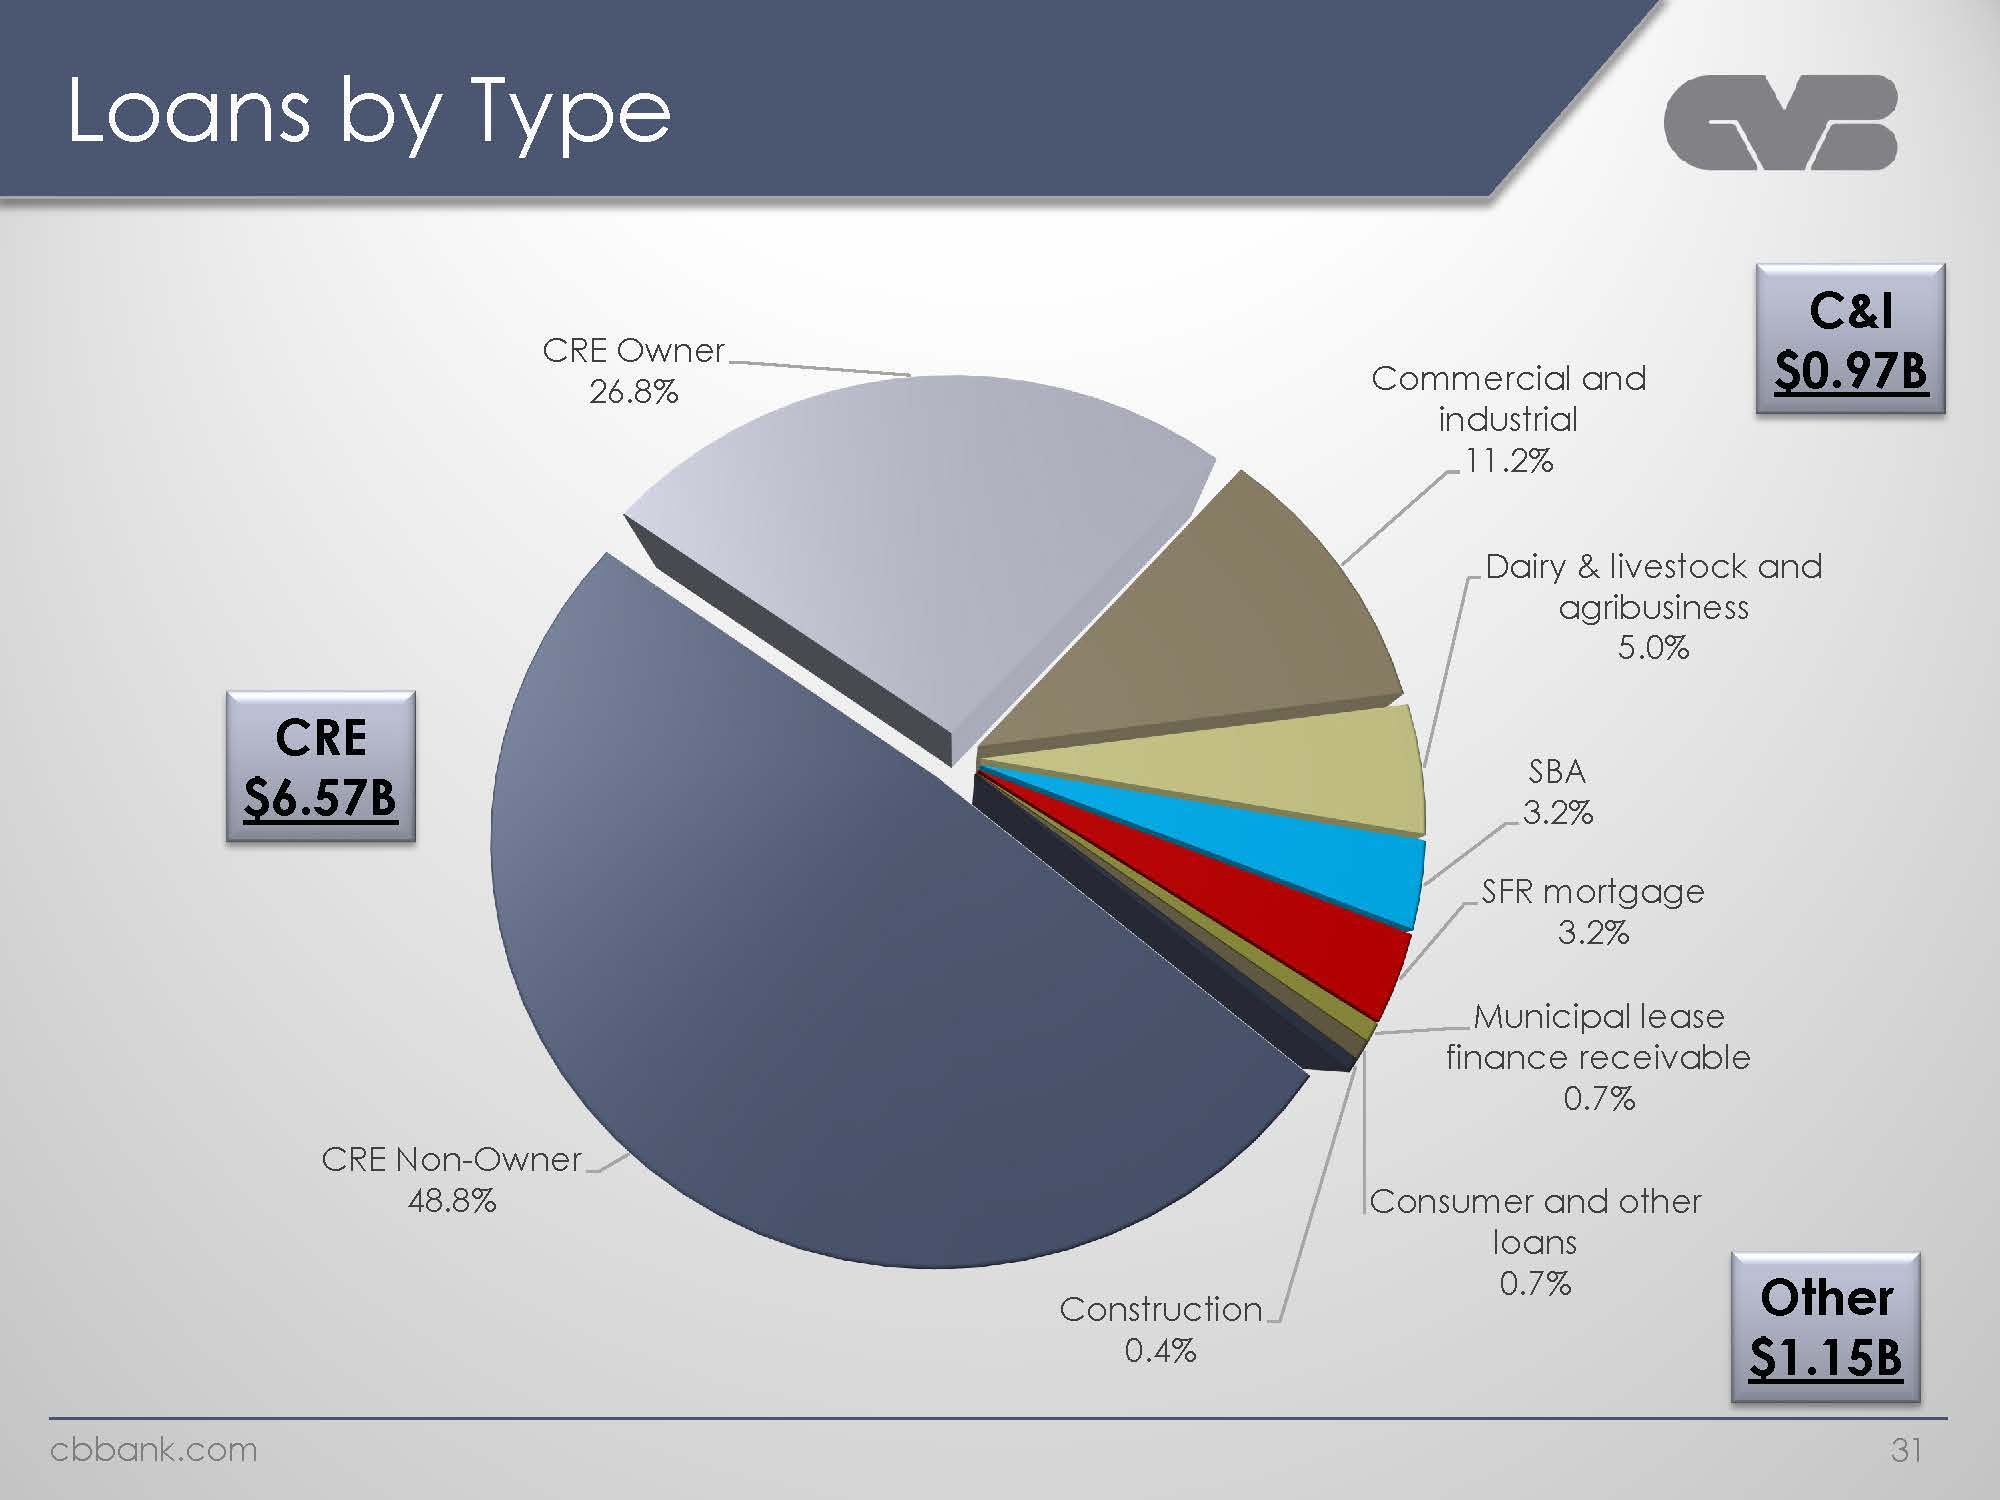
Loans by Type CRE Owner 26.8% Commercial and industrial 11.2% Dairy & livestock and agribusiness 5.0% SBA 3.2% SFR mortgage 3.2% Municipal lease finance receivable 0.7% Consumer and other loans 0.7% Construction 0.4% CRE Non-Owner 48.8%CRE $6.57B C&I $0.97B Other $1.15B cbbank.com 31
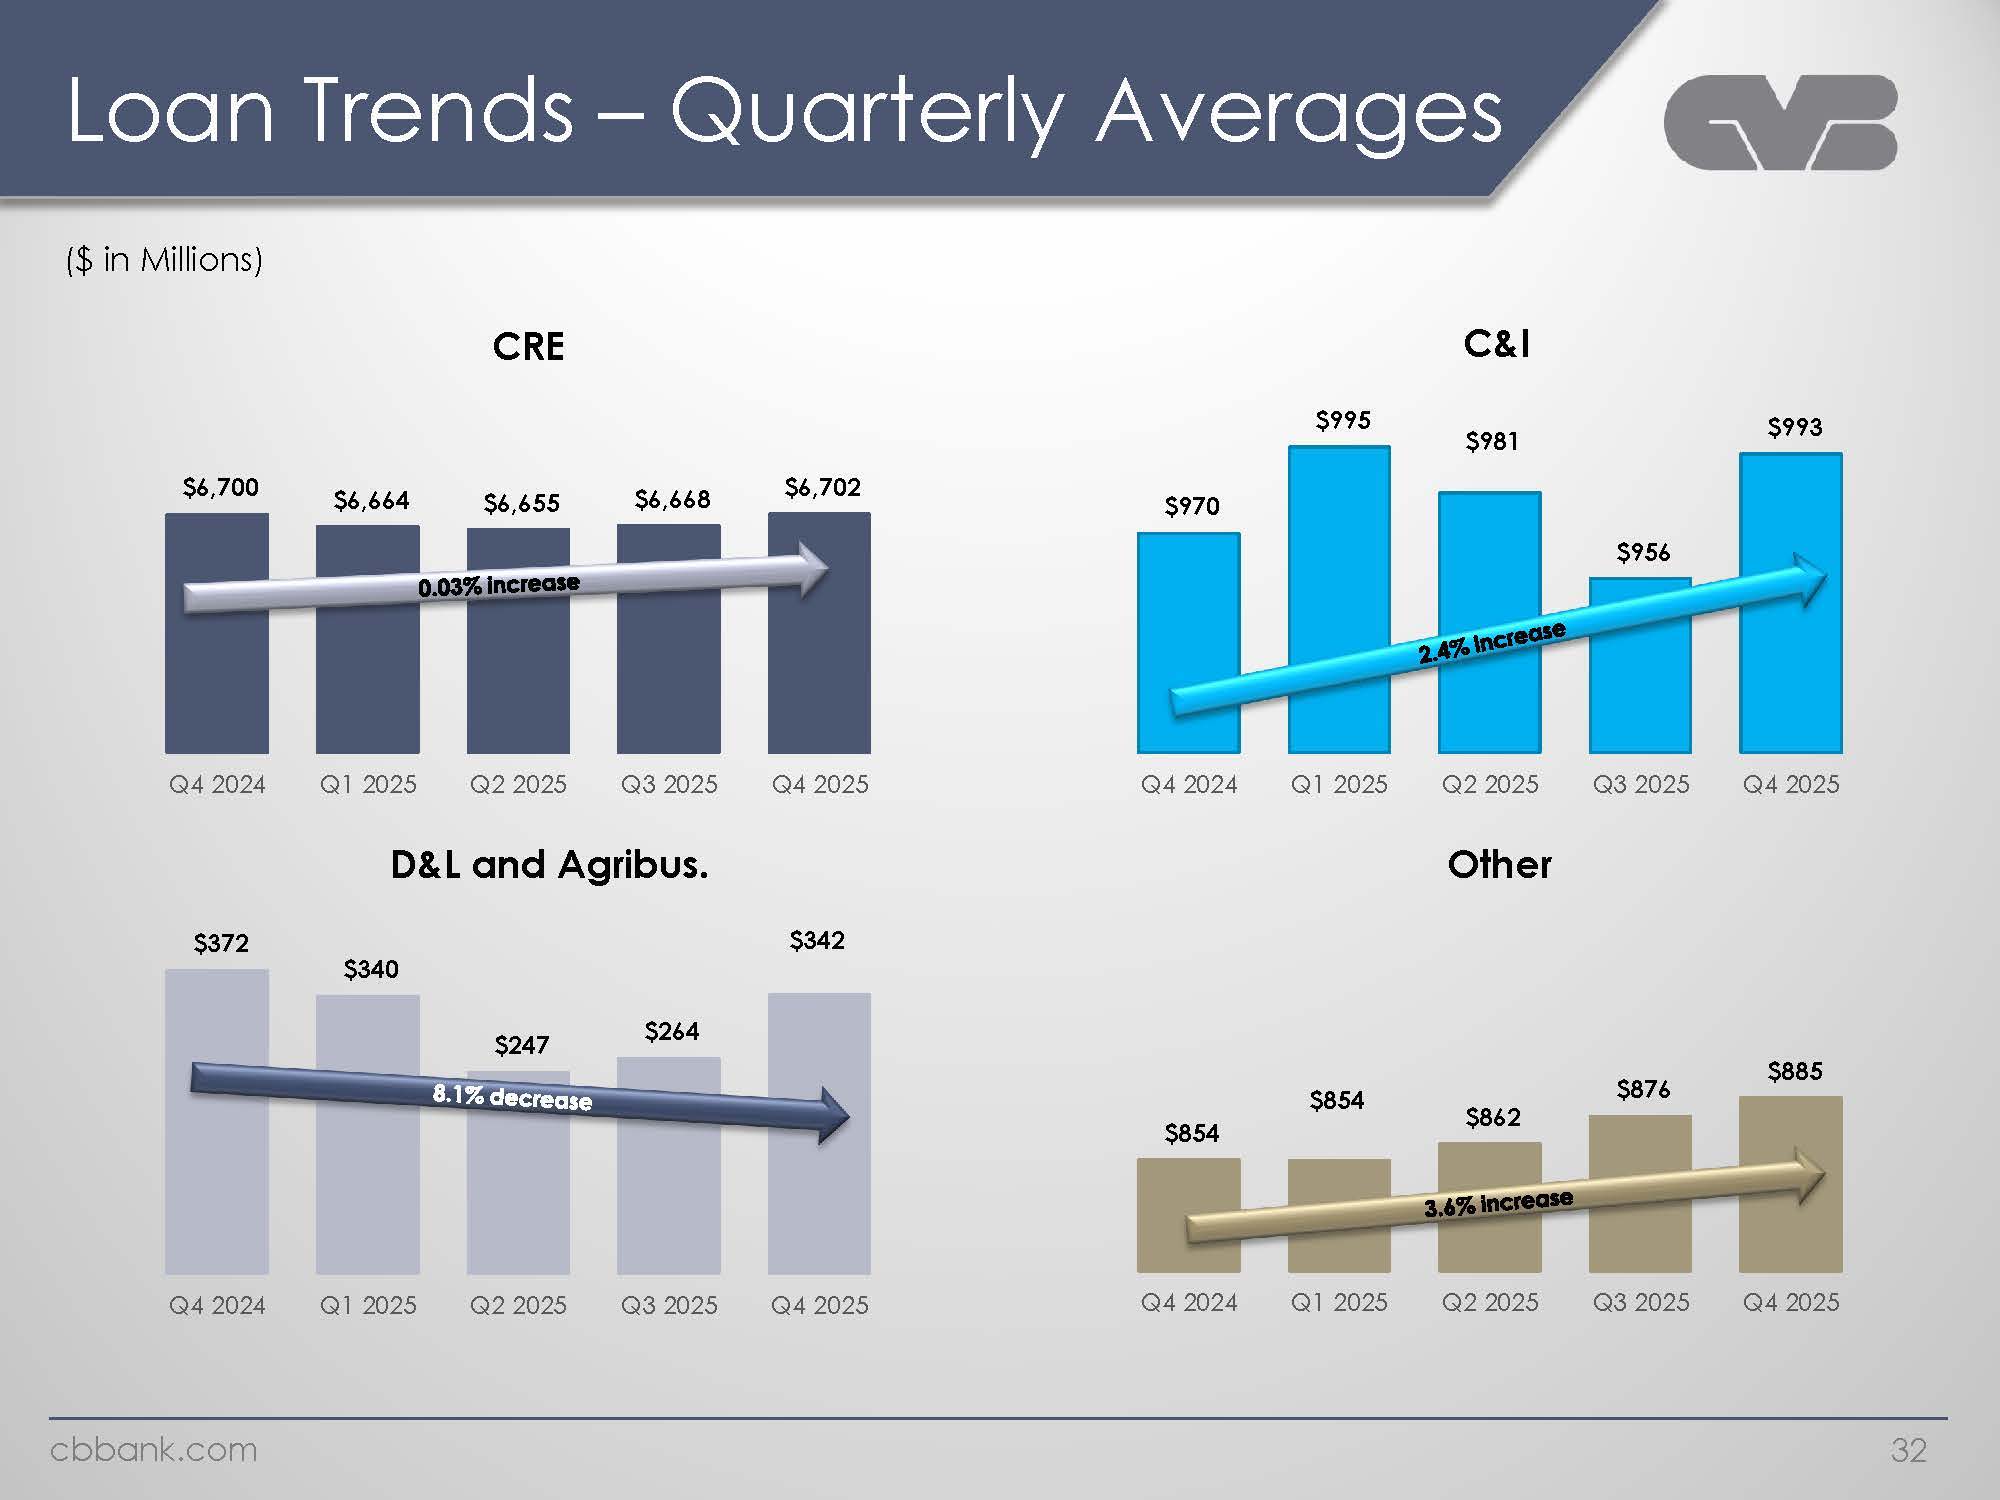
Loan Trend-Quarterly Averages ($ in Millions) CRE $6,700 $6,664 $6,655 $6,668 $6,702 0.003% increase Q4 2024 Q1 2025 Q2 2025 Q3 2025 Q4 2025 C&I $970 $995 $981 $956 $993 2.4% increase Q4 2024 Q1 2025 Q2 2025 Q3 2025 Q4 2025 D&L and Agribus.$372 $340 $247 $264 $342 8.1%decrease Q4 2024 Q1 2025 Q2 2025 Q3 2025 Q4 2025 Other $854 %854 $862 %876 %885 3.6%increase Q4 2024 Q1 2025 Q2 2025 Q3 2025 Q4 2025 cbbank.com 32
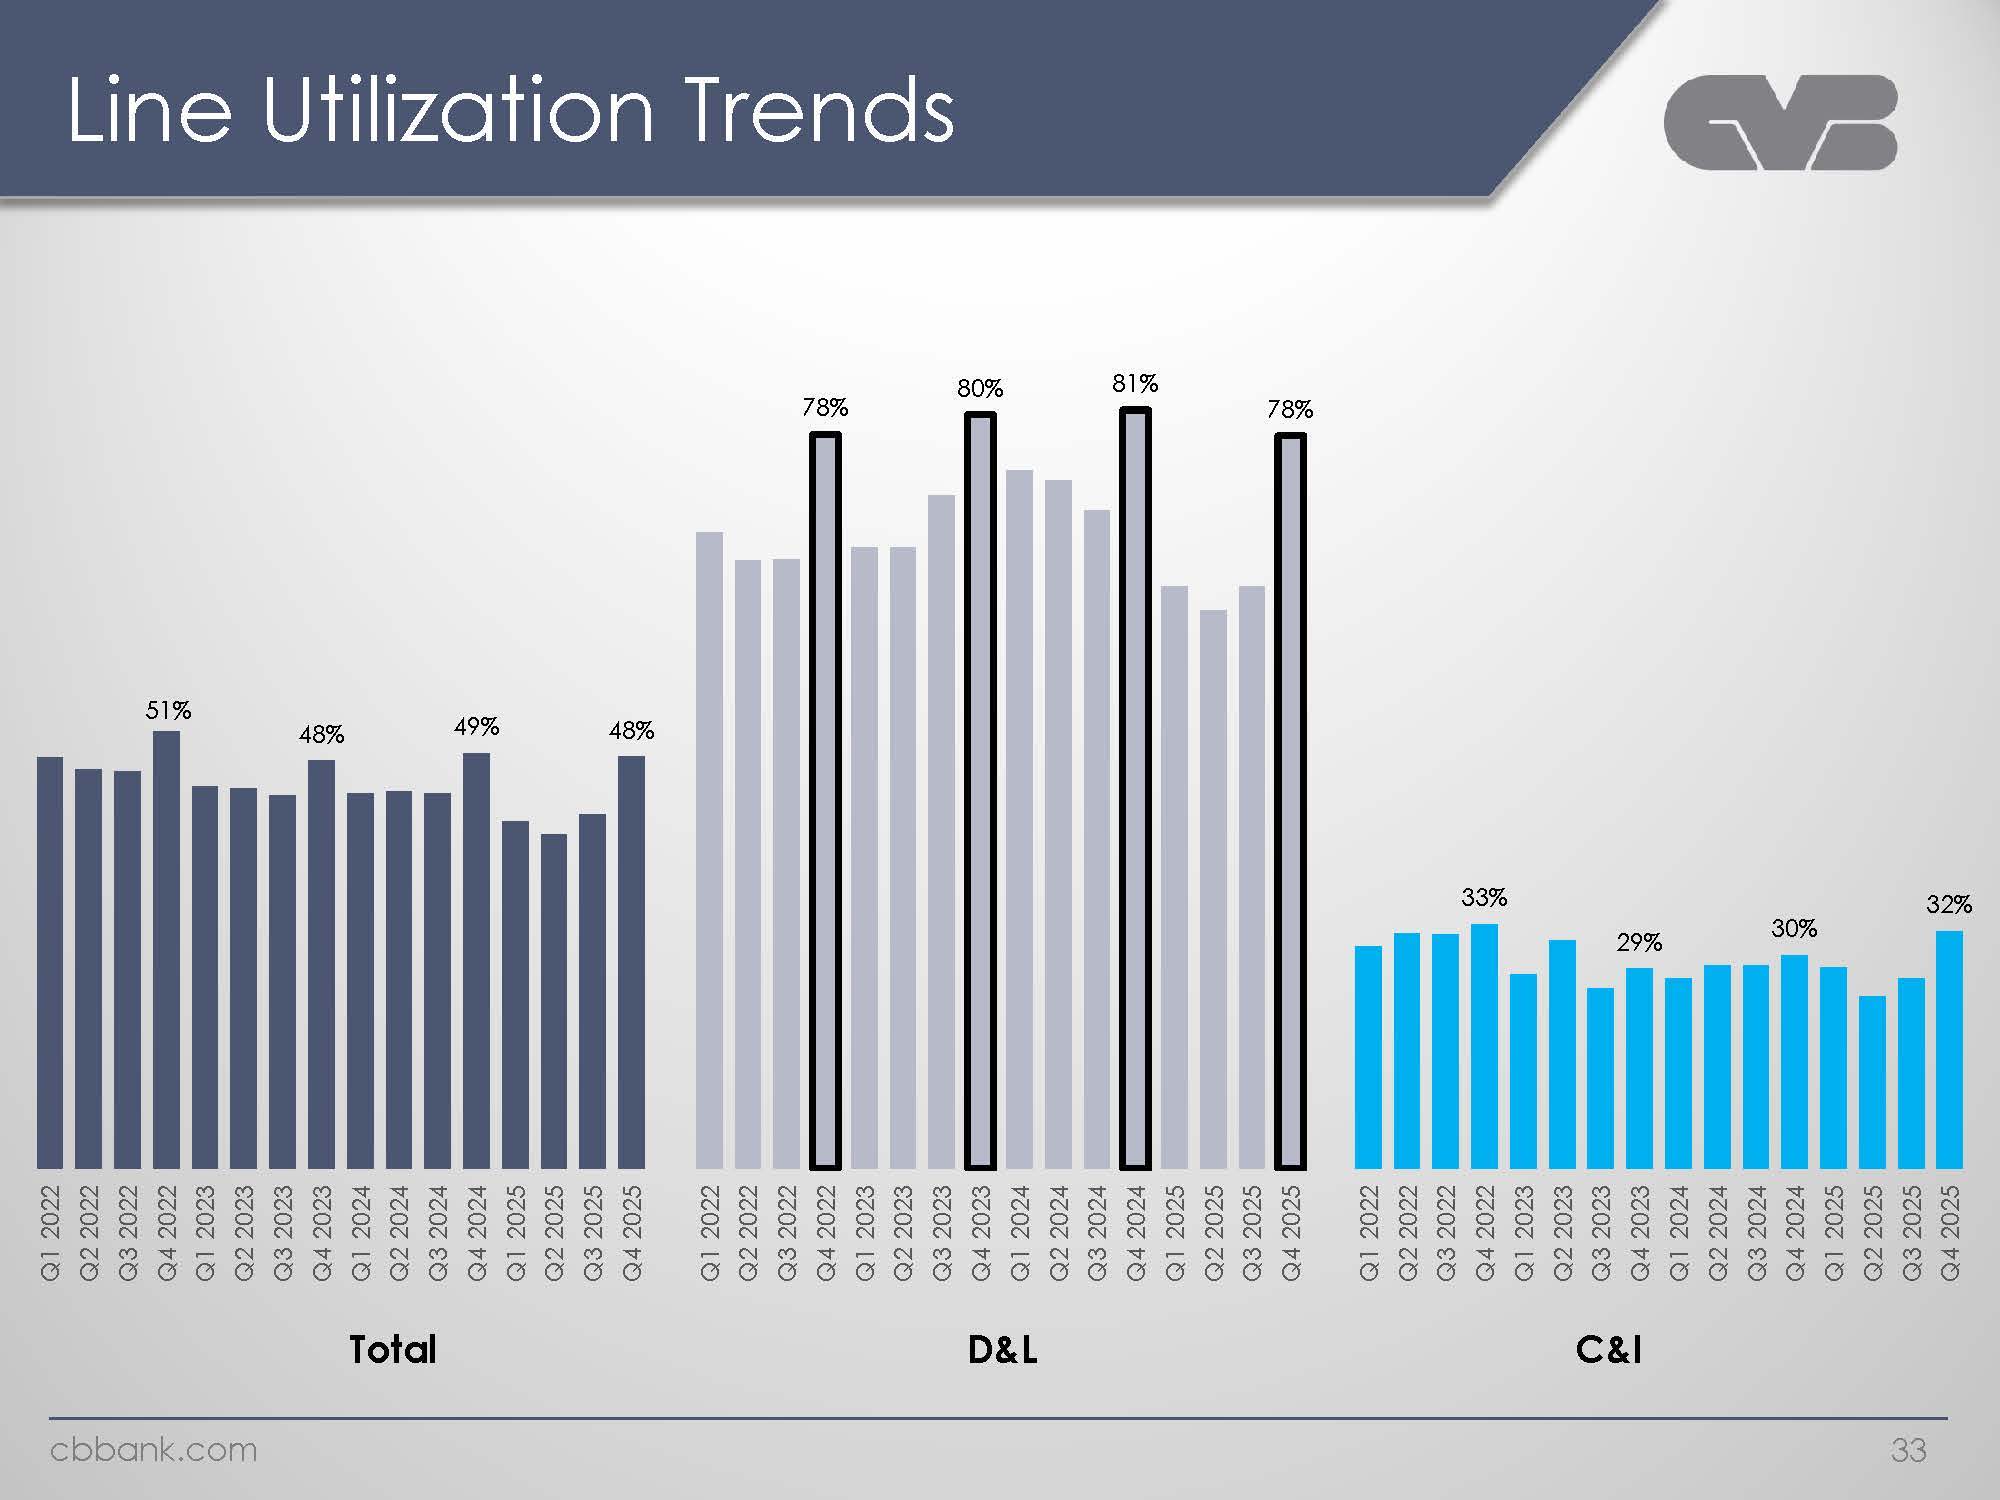
Line Utilization Trends Q1 2022 Q2 2022 Q3 2022 Q4 2022 51% Q1 2023 Q2 2023 Q3 2023 Q4 2023 48% Total Q1 2024 Q2 2024 Q3 2024 Q4 2024 49% Q1 2025 Q2 2025 Q3 2025 Q4 2025 48% Q1 2022 Q2 2022 Q3 2022 Q4 2022 78% D&L Q1 2023 Q2 2023 Q3 2023 Q4 2023 80%Q1 2024 Q2 2024 Q3 2024 Q4 2024 81% Q1 2025 Q2 2025 Q3 2025 Q4 2025 78% Q1 2022 Q2 2022 Q3 2022 Q4 2022 33 %Q1 2023 Q2 2023 Q3 2023 Q4 2023 29%Q1 2024 Q2 2024 Q3 2024 Q4 2024 30% Q1 2025 Q2 2025 Q3 2025 Q4 2025 32% C&I.cbbank.com 33
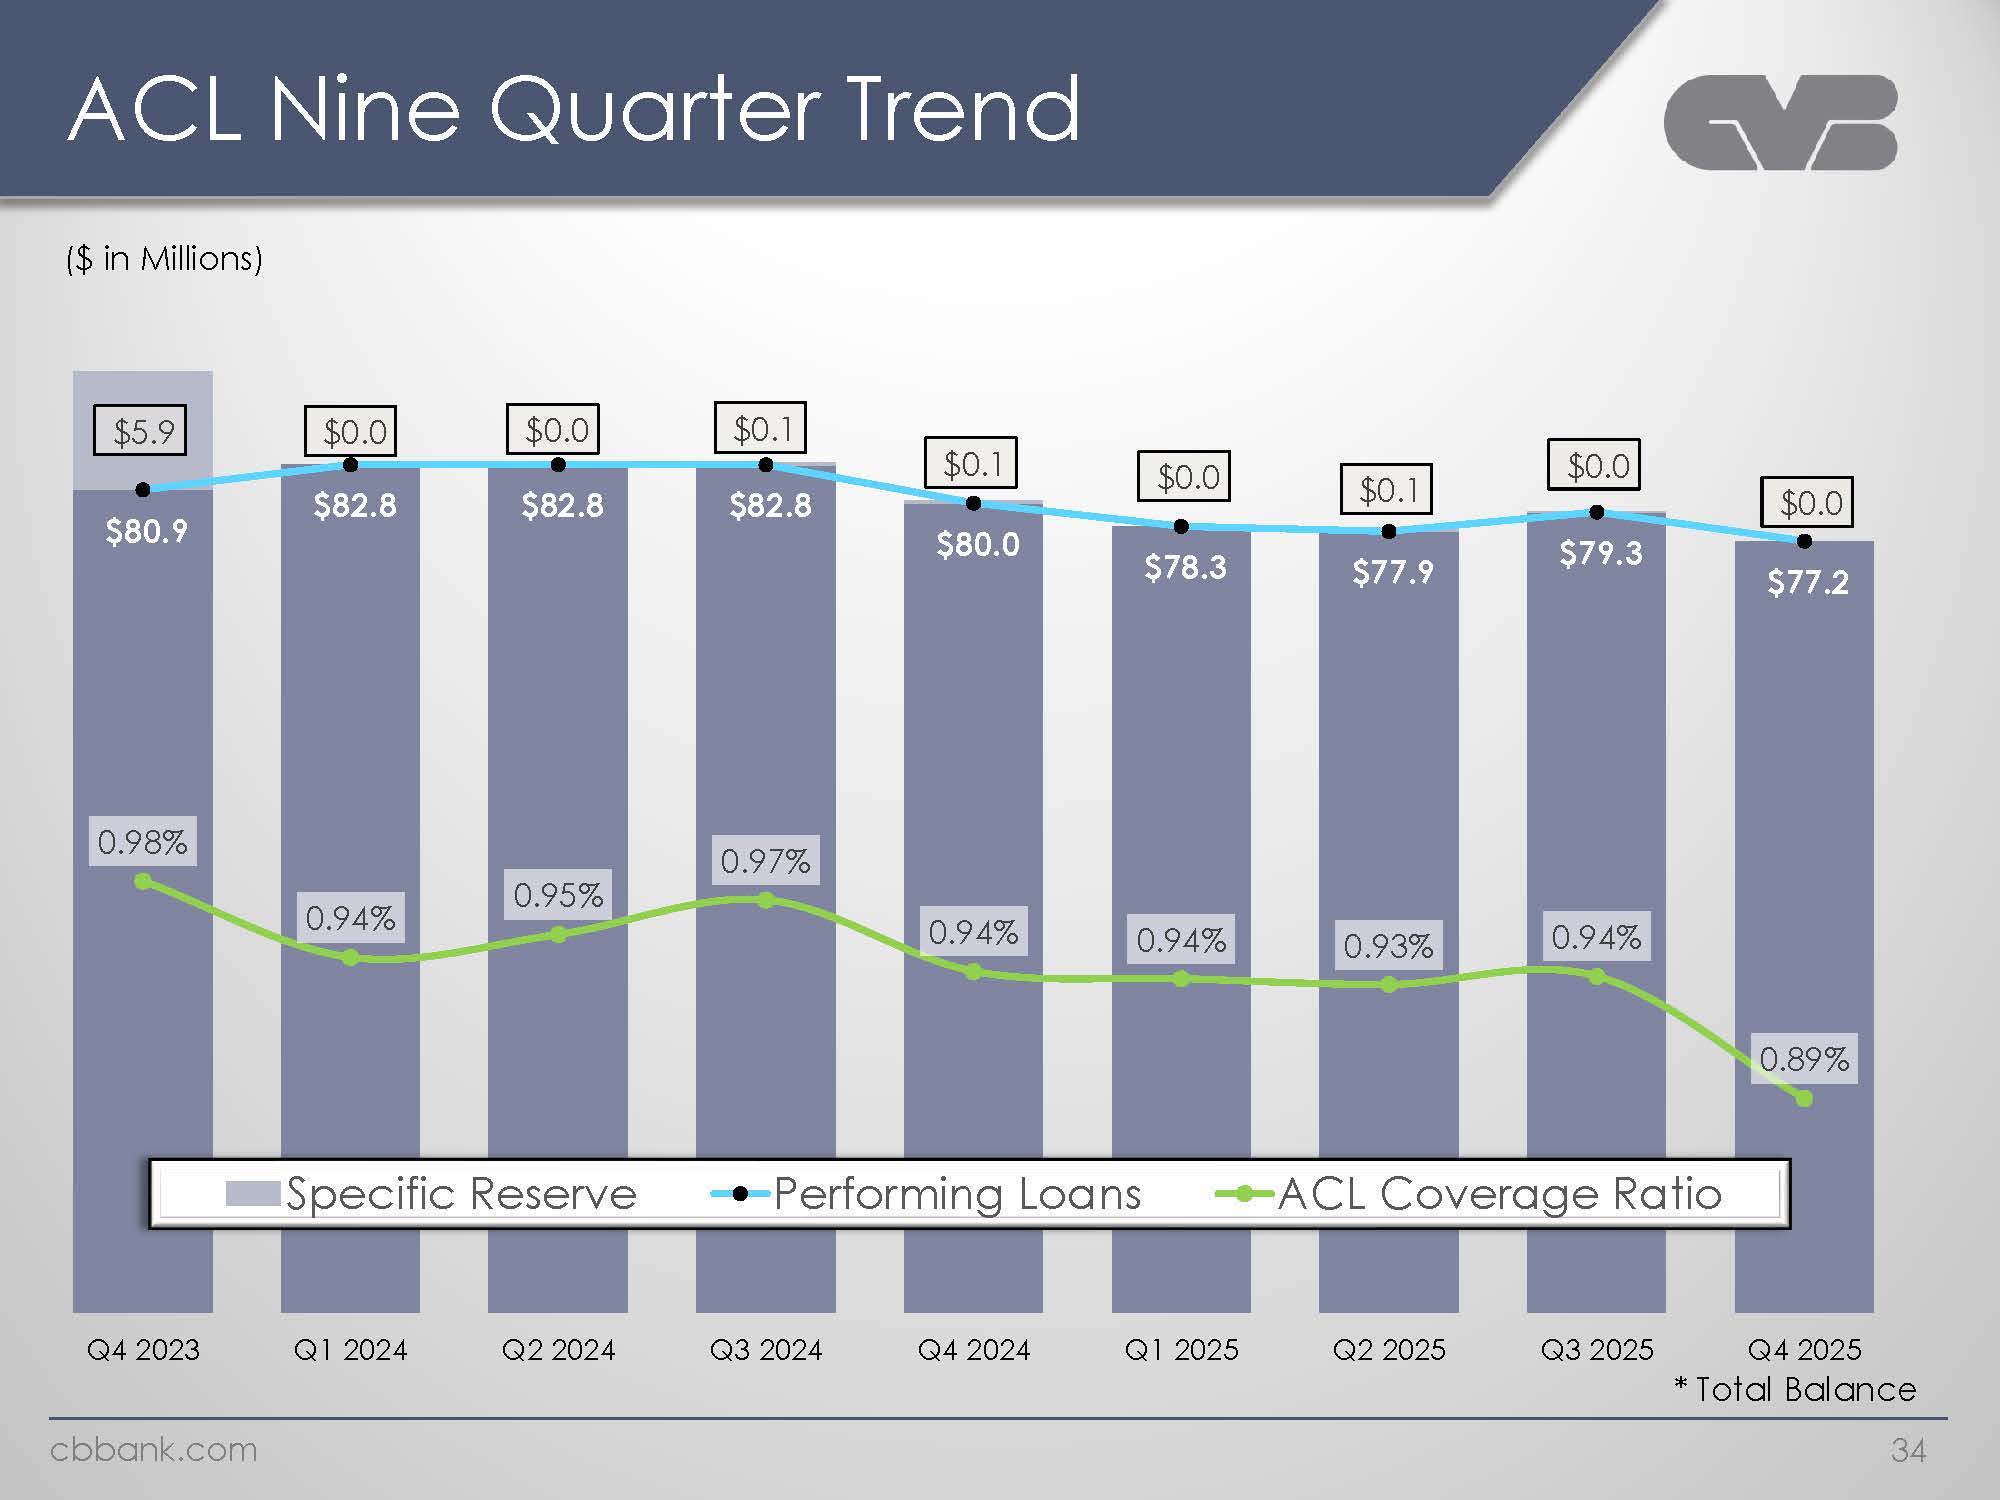
ACL Nine Quarter Trends ($in Million) $5.9 $80.9 0.98% Q4 2023 $ 0.0 $82.8 0.94% Q1 2024 Specific Reserve Performing Loans ACL Coverage Ratio $ 0.0 $82.8 0.95%Q2 2024 $0.1 $82.8 0.97 Q3 2024 $0.1 $80.0 0.94% Q4 2024 $0.0 $78.3 0.94% Q1 2025 $0.1 $77.9 0.93% Q2 2025 $79.3 0.94%Q3 2025 $0.0 $77.2 0.89% Q4 2025 Total Balance cbbank.com 34
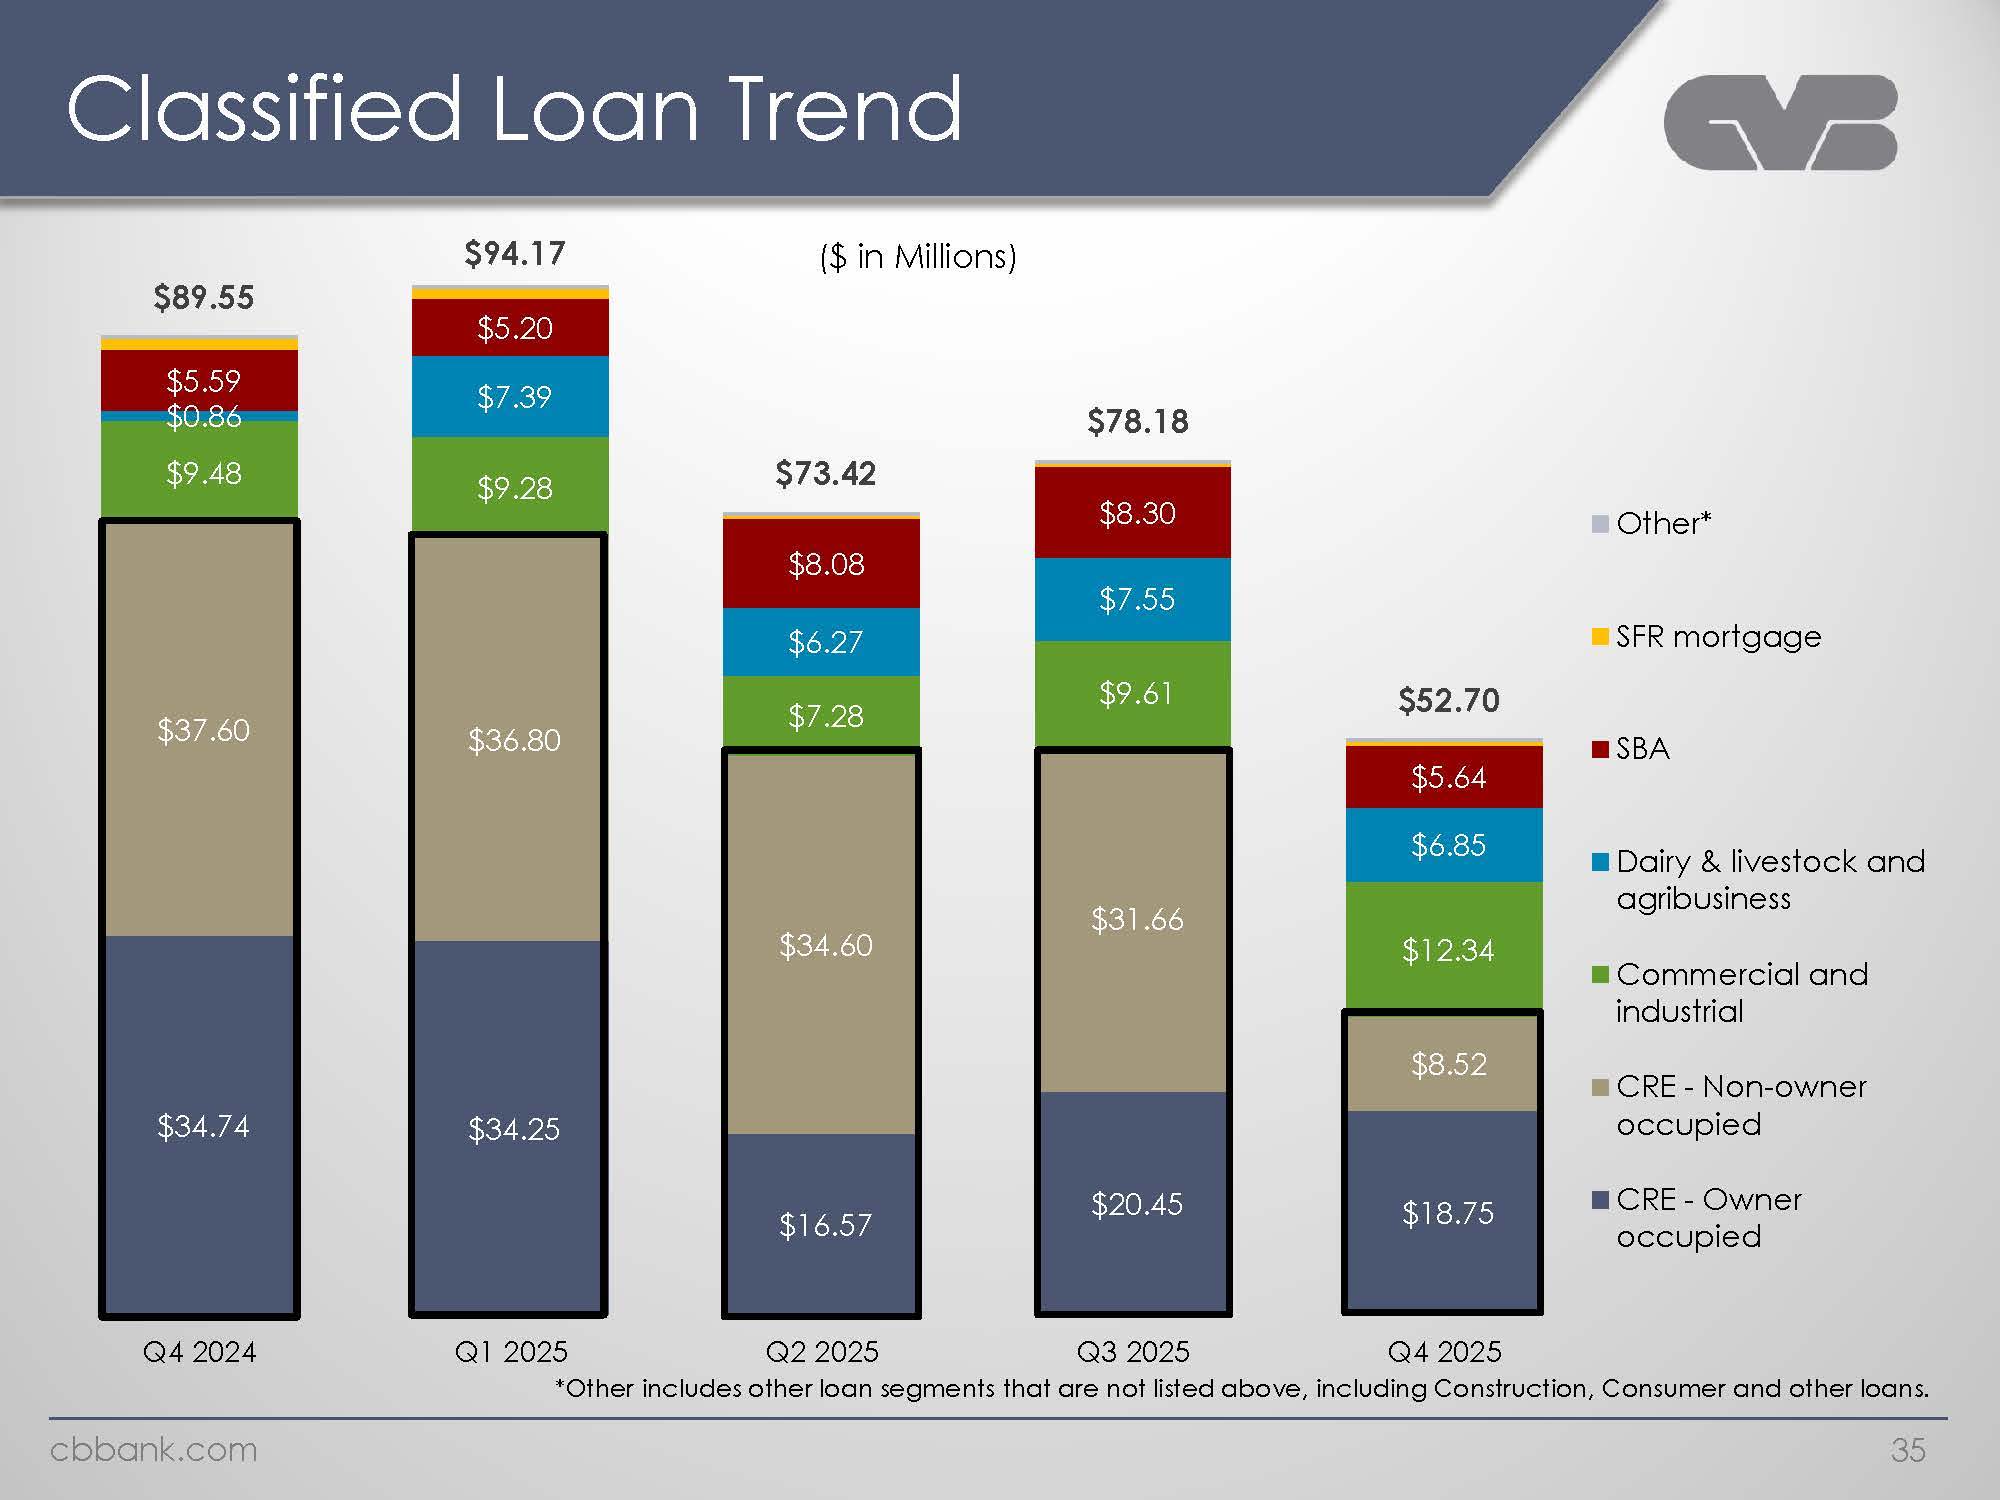
Classified Loan Trend ($ in Millions) $34.74 $34.25 $16.57 $20.45 $18.75 $37.60 $36.80 $34.60 $31.66 $8.52 $9.48 $9.28 $7.28 $9.61 $12.34 $0.86 $7.39 $6.27 $7.55 $6.85 $5.59 $5.20 $8.08 $8.30 $5.64 $89.55 $94.17 $73.42 $78.18 $52.70 Q4 2024 Q1 2025 Q2 2025 Q3 2025 Q4 2025 Other* SFR mortgage SBA Dairy & livestock and agribusiness Commercial and industrial CRE - Non-owner occupied CRE - Owner occupied *Other includes other loan segments that are not listed above, including Construction, Consumer and other loans. cbbank.com 35
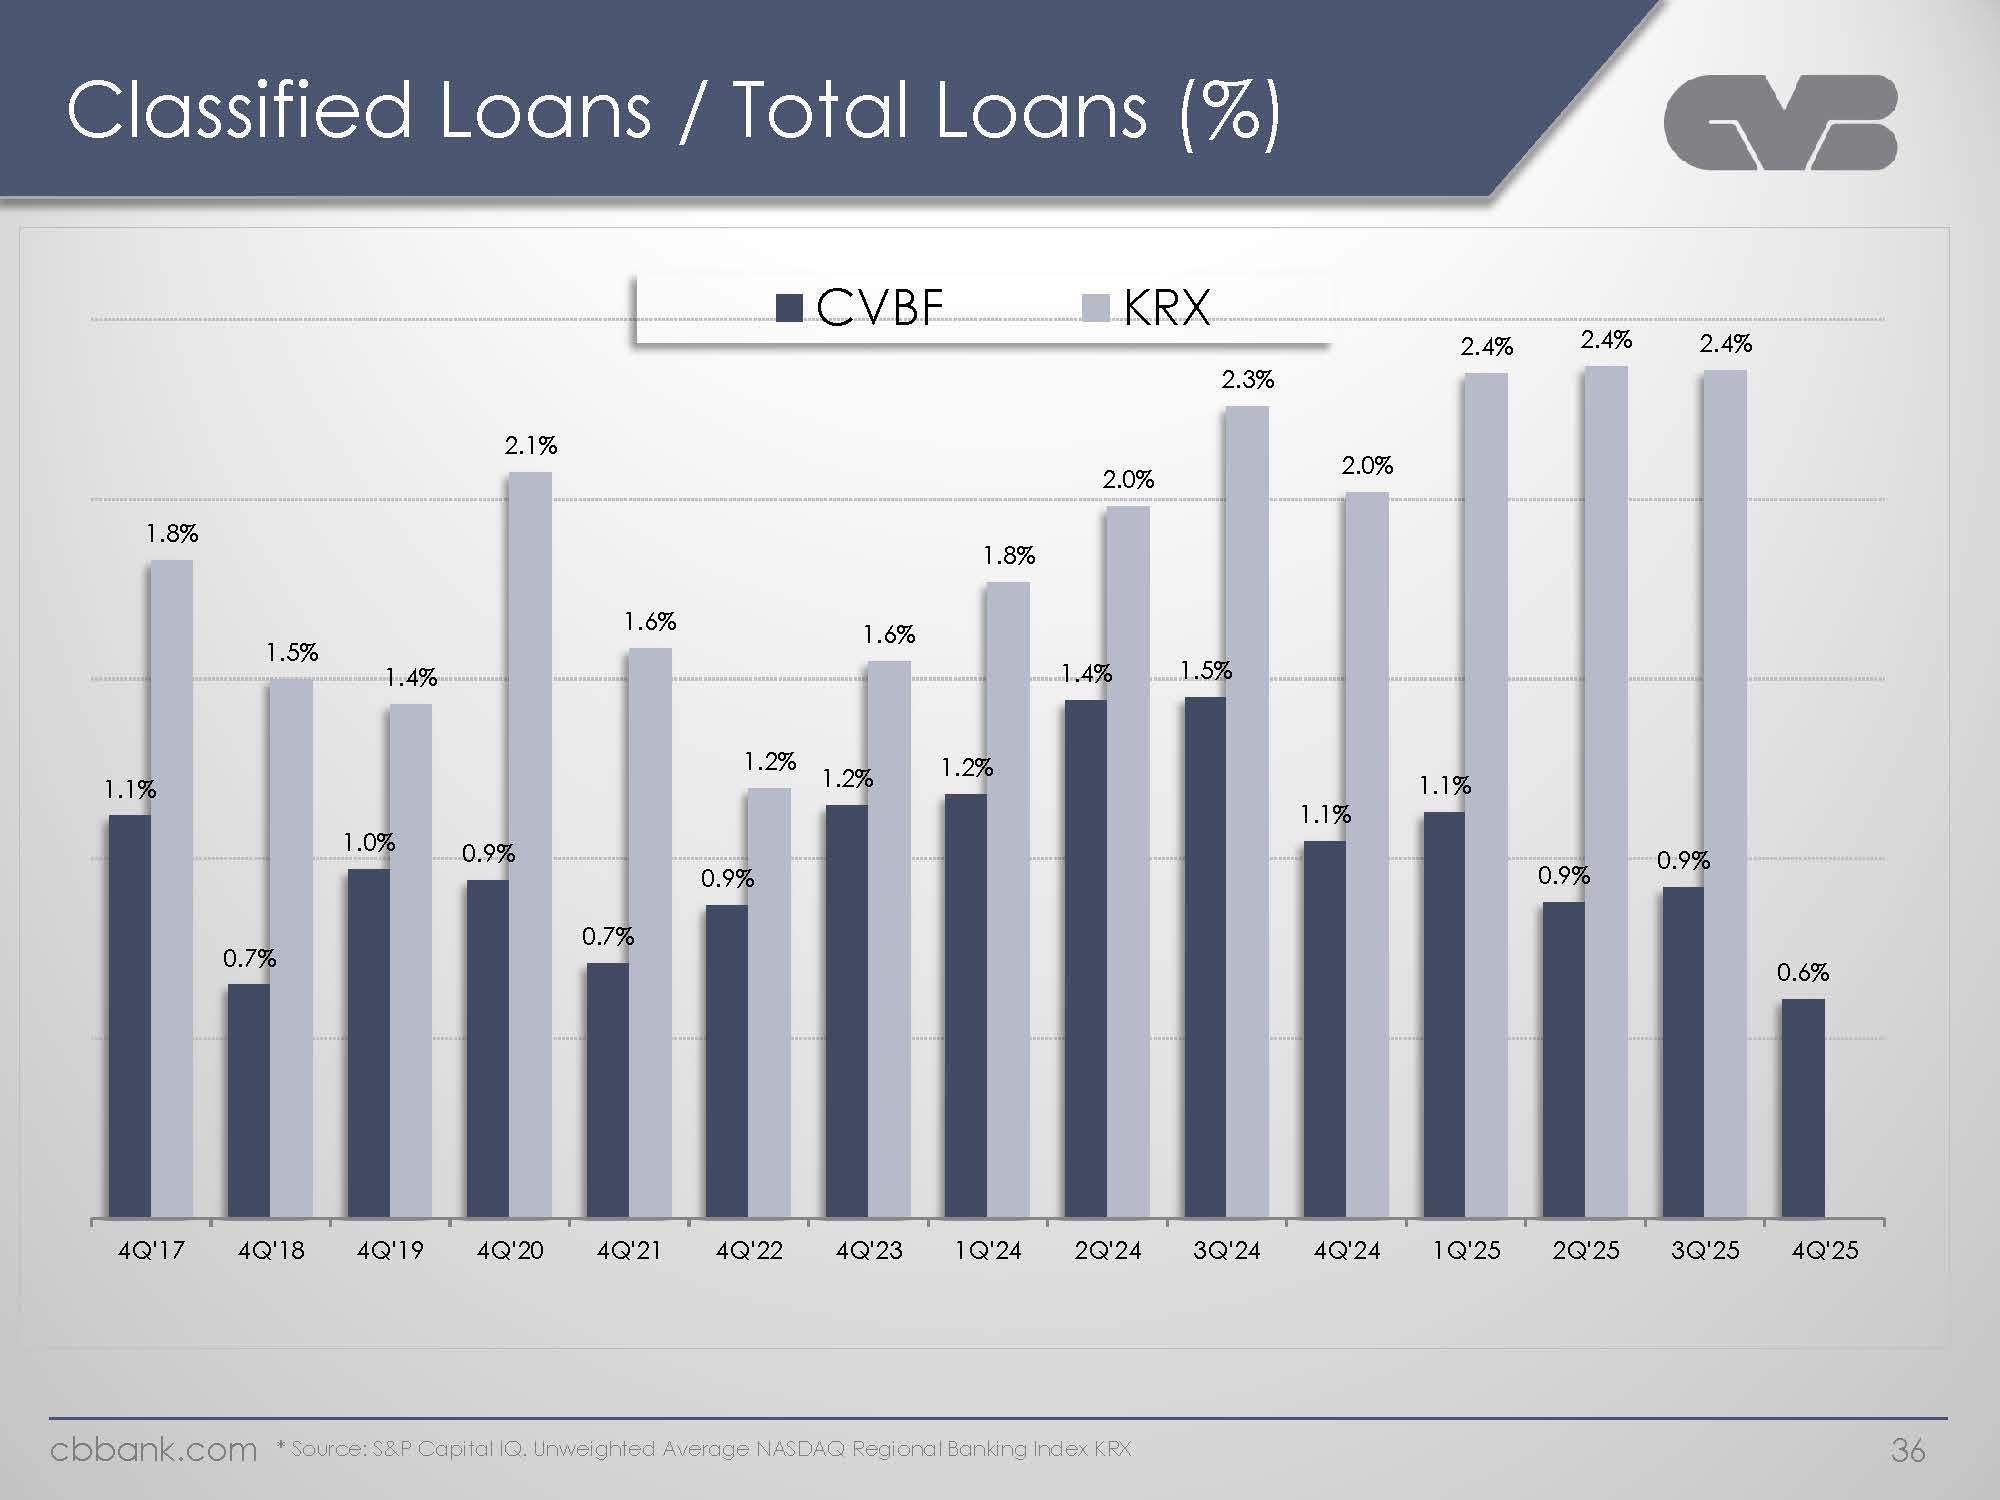
Classified Loans / Total Loans (%) CVBF KRX 1.1%1.8% 4Q’17 0.7% 1.5% 4Q’18 .1.0% 1.4% 4Q’19 0.9% 2.1%4Q’20 0.7%1.6% 4Q’21 0.9% 1.2% 4Q’22 1.2% 1.6%4Q’23 1.2% 1.8%1Q’24 1.4% 2.0%2Q’24 1.5% 2.3% 3Q’24 1.1% 2.0% 4Q’24 1.1% 2.4% 1Q’25 0.9% 2.4% 2Q’25 0.9% 2.4%3Q’25 0.6% 4Q’25 cbbank.com * Source: S&P Capital IQ.Unweighted Average NASDAQ Regional Banking Index KRX 36
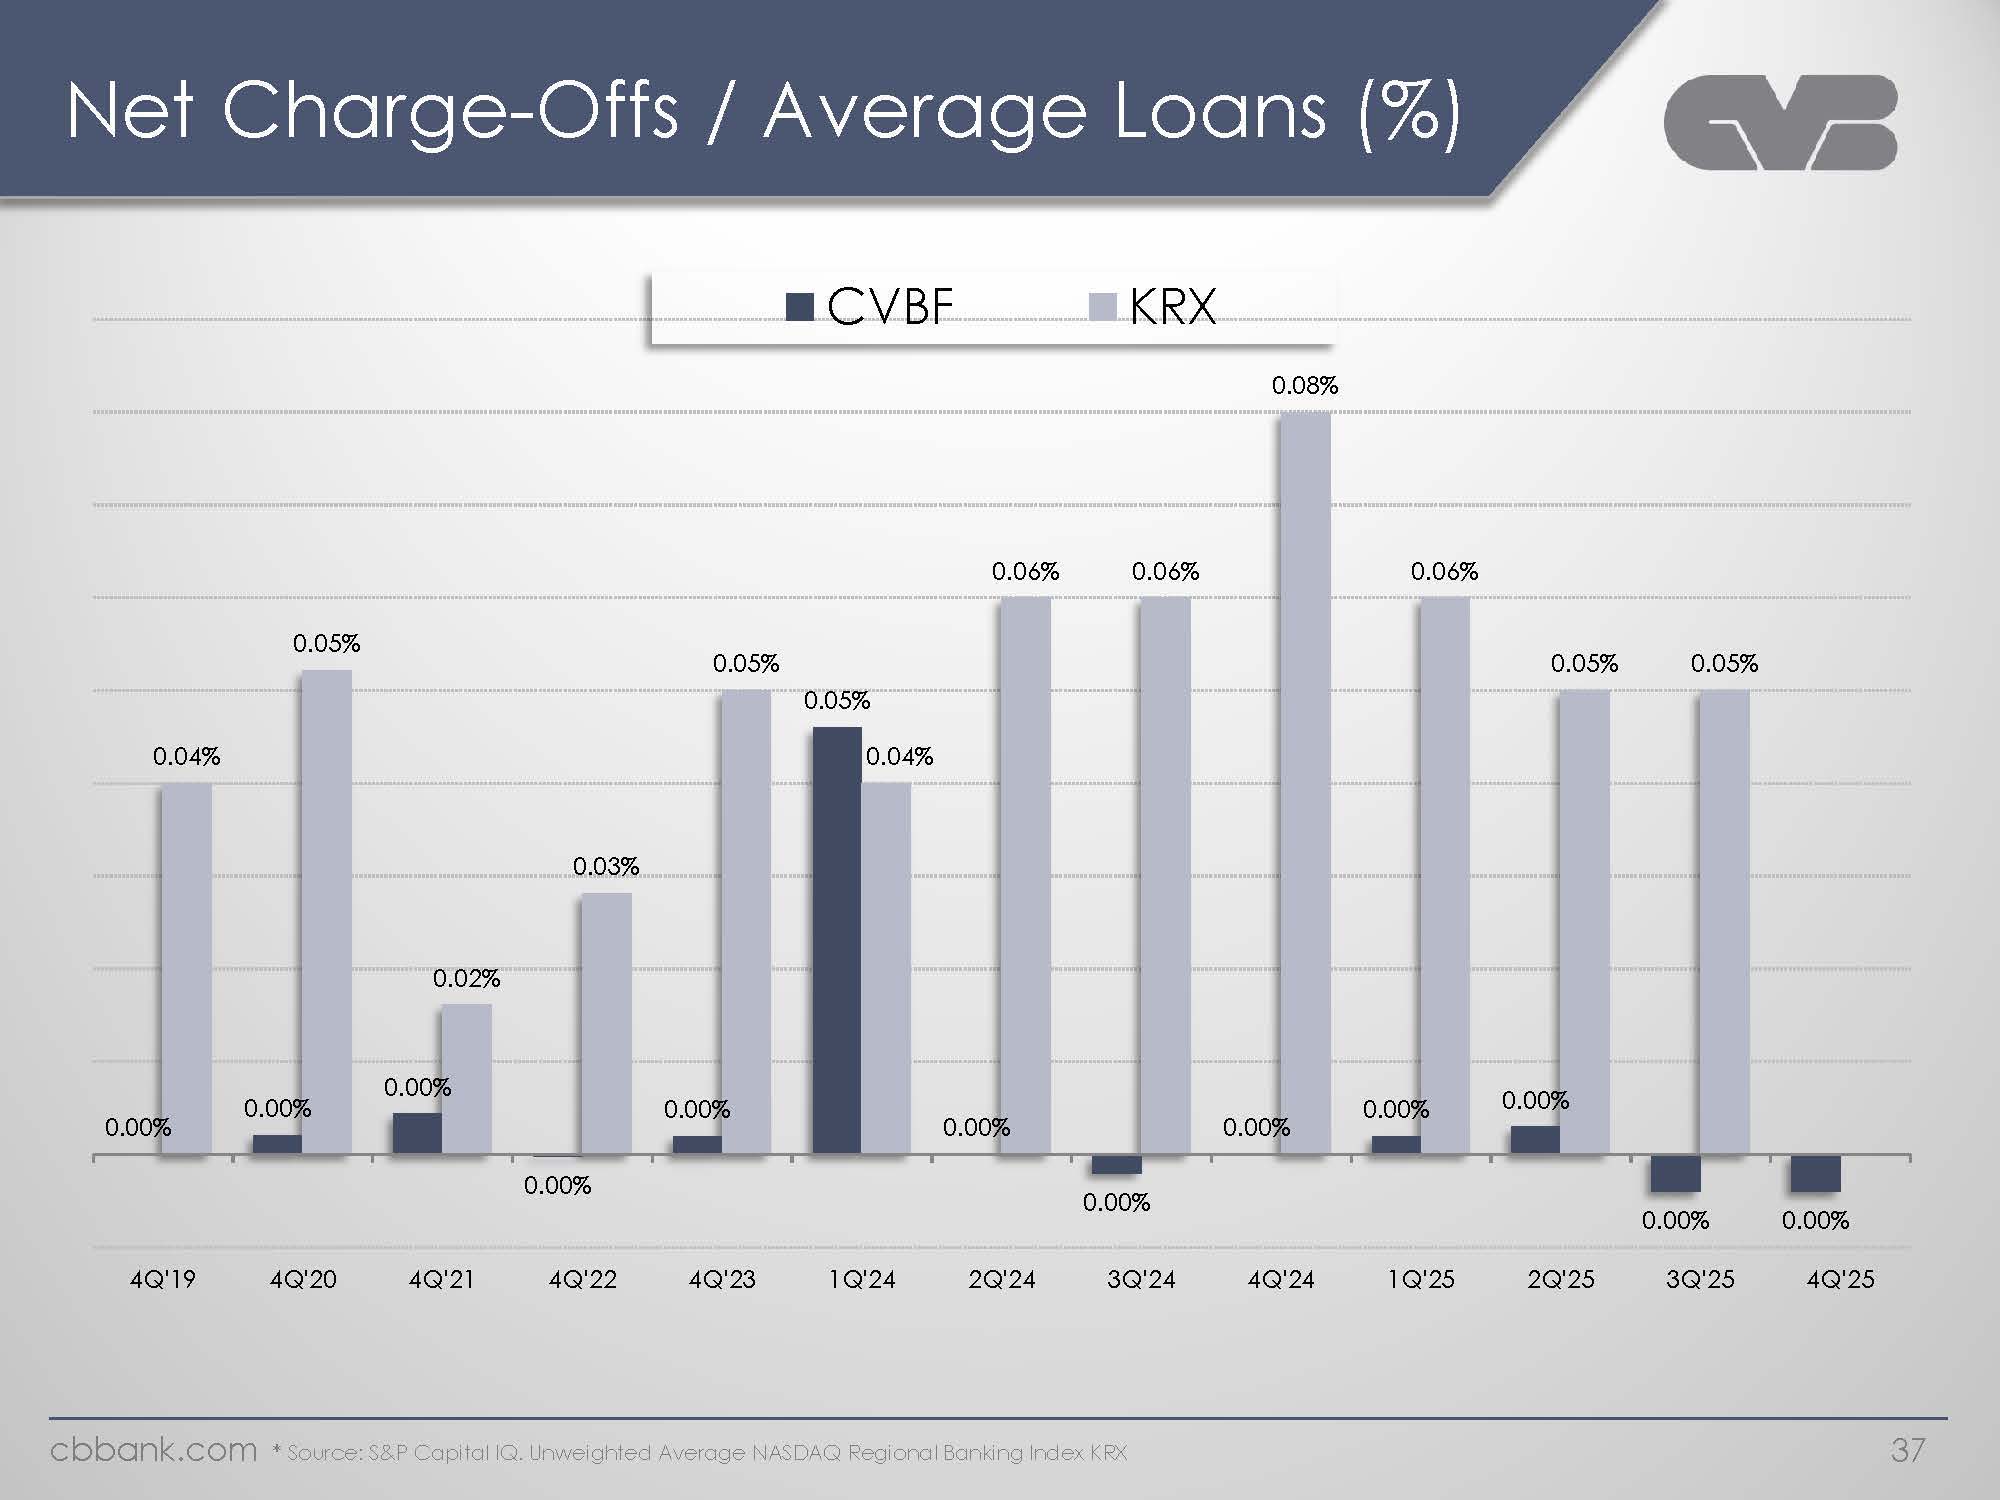
Net Charge-Offs / Average Los (an%) CVBF KRX 0.00% 0.04% 4Q’19 0.00% 0.05% 4Q’20 0.00% 0.02% 4Q’21 0.00%0.03% 4Q’22 0.00% 0.05% 4Q’23 0.05%0.04% 1Q’24 0.00% 0.06% 2Q’24 0.00% 0.06% 3Q’24 0.00% 0.08% 4Q’24 0.00% 0.06% 1Q’25 0.00% 0.05% 2Q’25 0.00% 0.05% 3Q’25 0.00% 4Q’25 cbbank.com * Source: S&P Capital IQ.Unweighted Average NASDAQ Regional Banking Index KRX 37
CVB Financial Corp. Appendix Non-GAAP Reconciliation cbbank.com
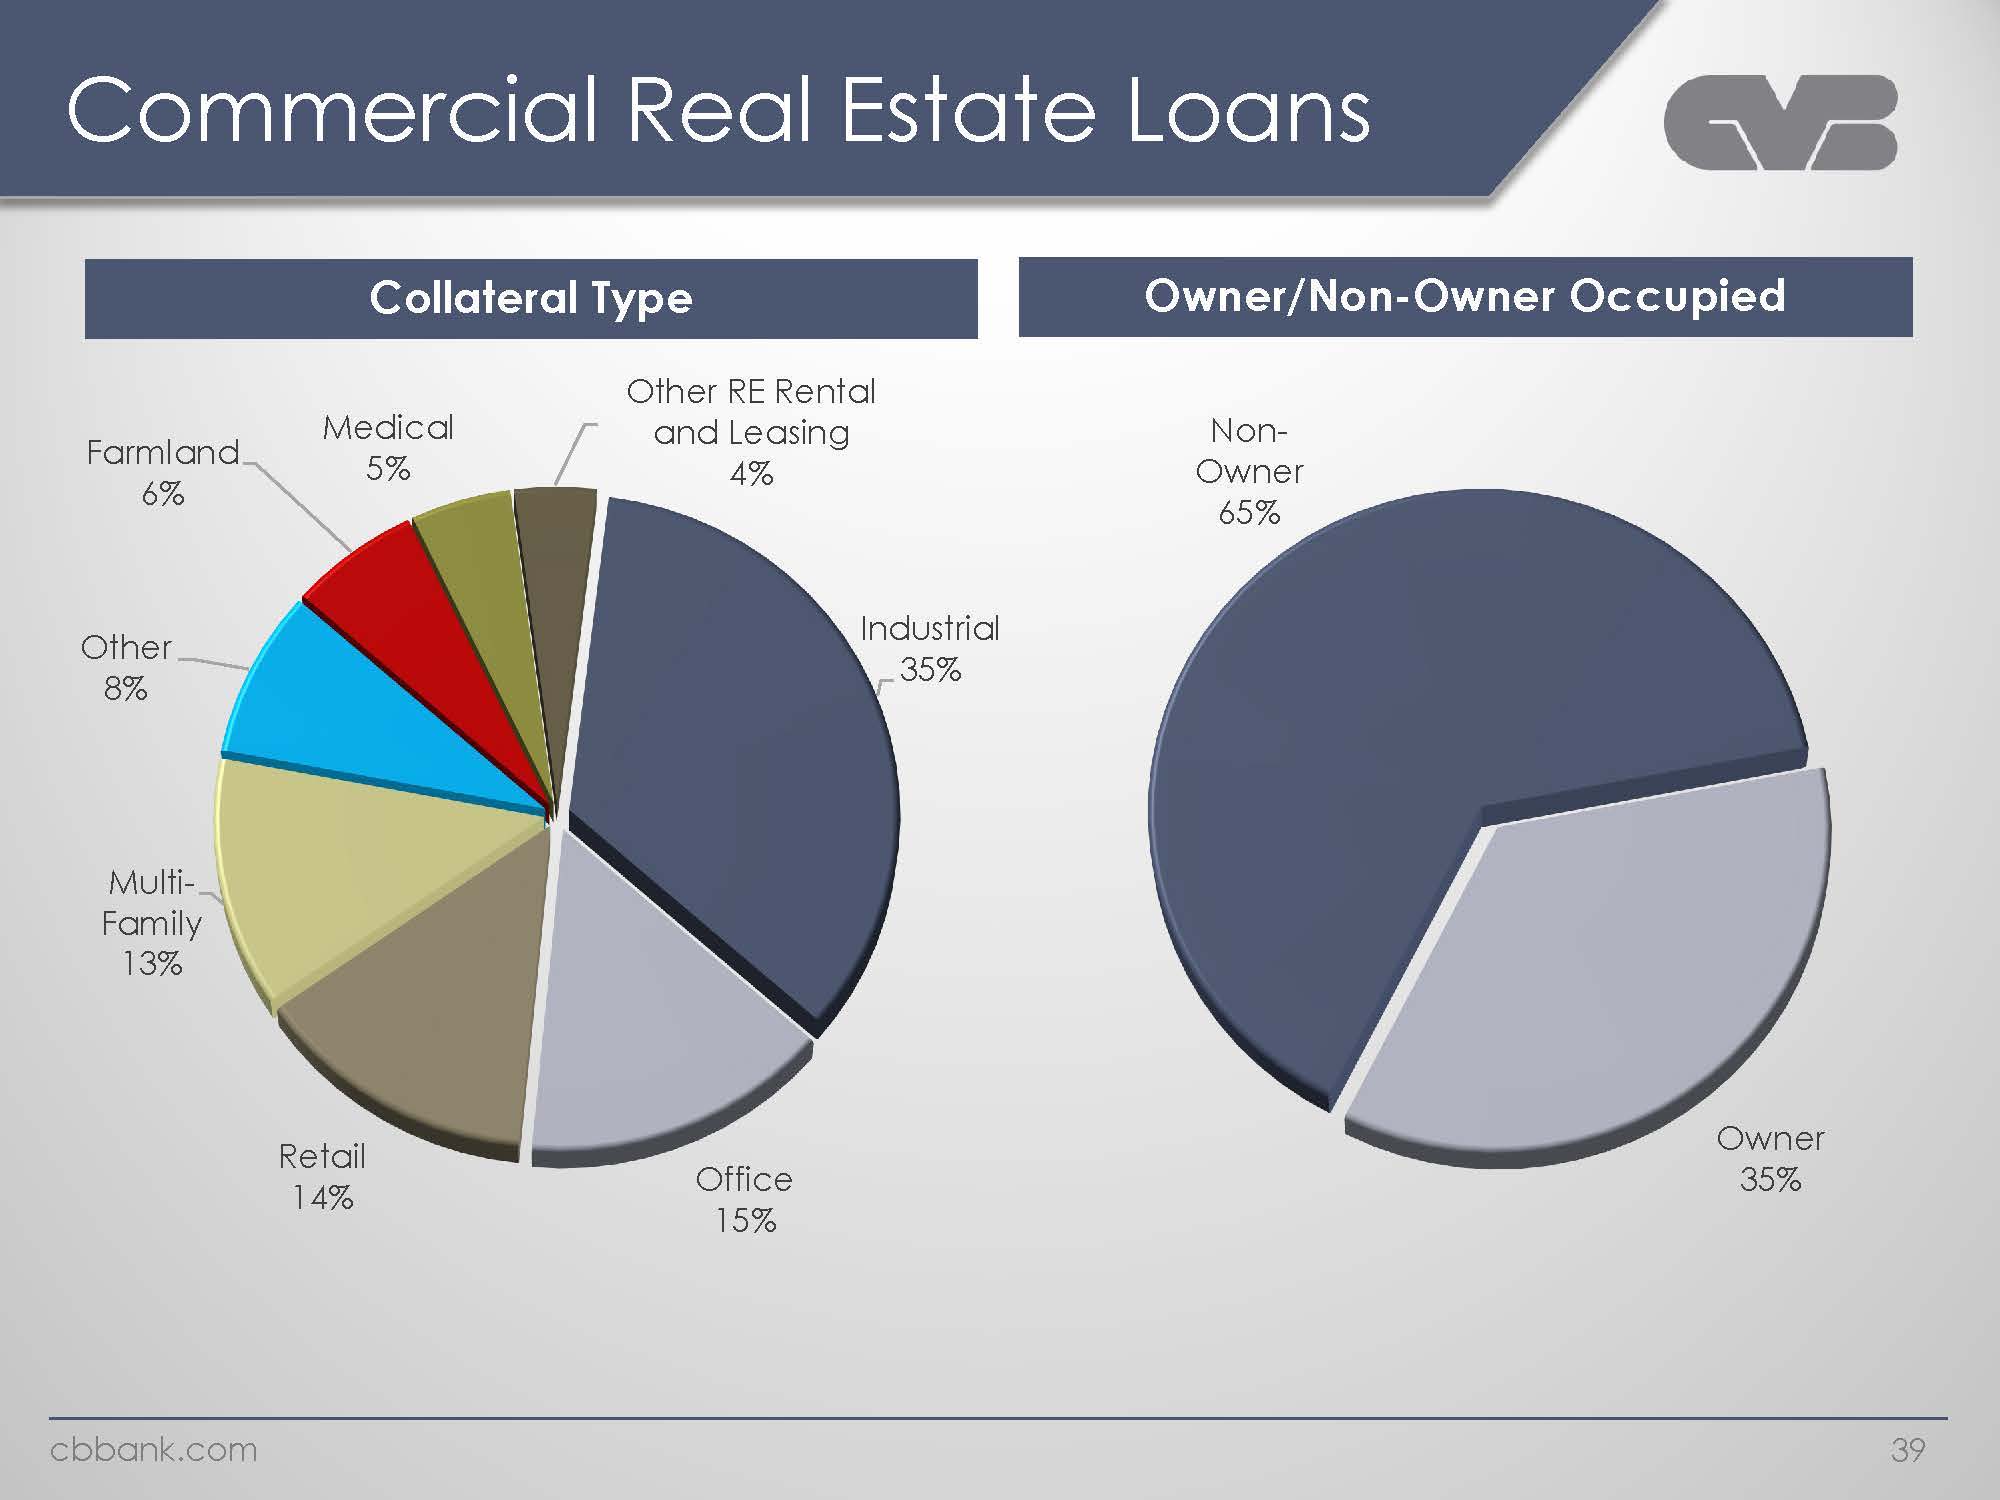
Commercial Real Estate Loans Collateral Type Industrial 35% Office 15% Retail 14% Multi Family 13% Other 8% Farmland 6% Medical 5% Other RE Rental and Leasing 4% Owner/Non-Owner Occupied Non Owner 65% Owner 35% cbbank.com 39
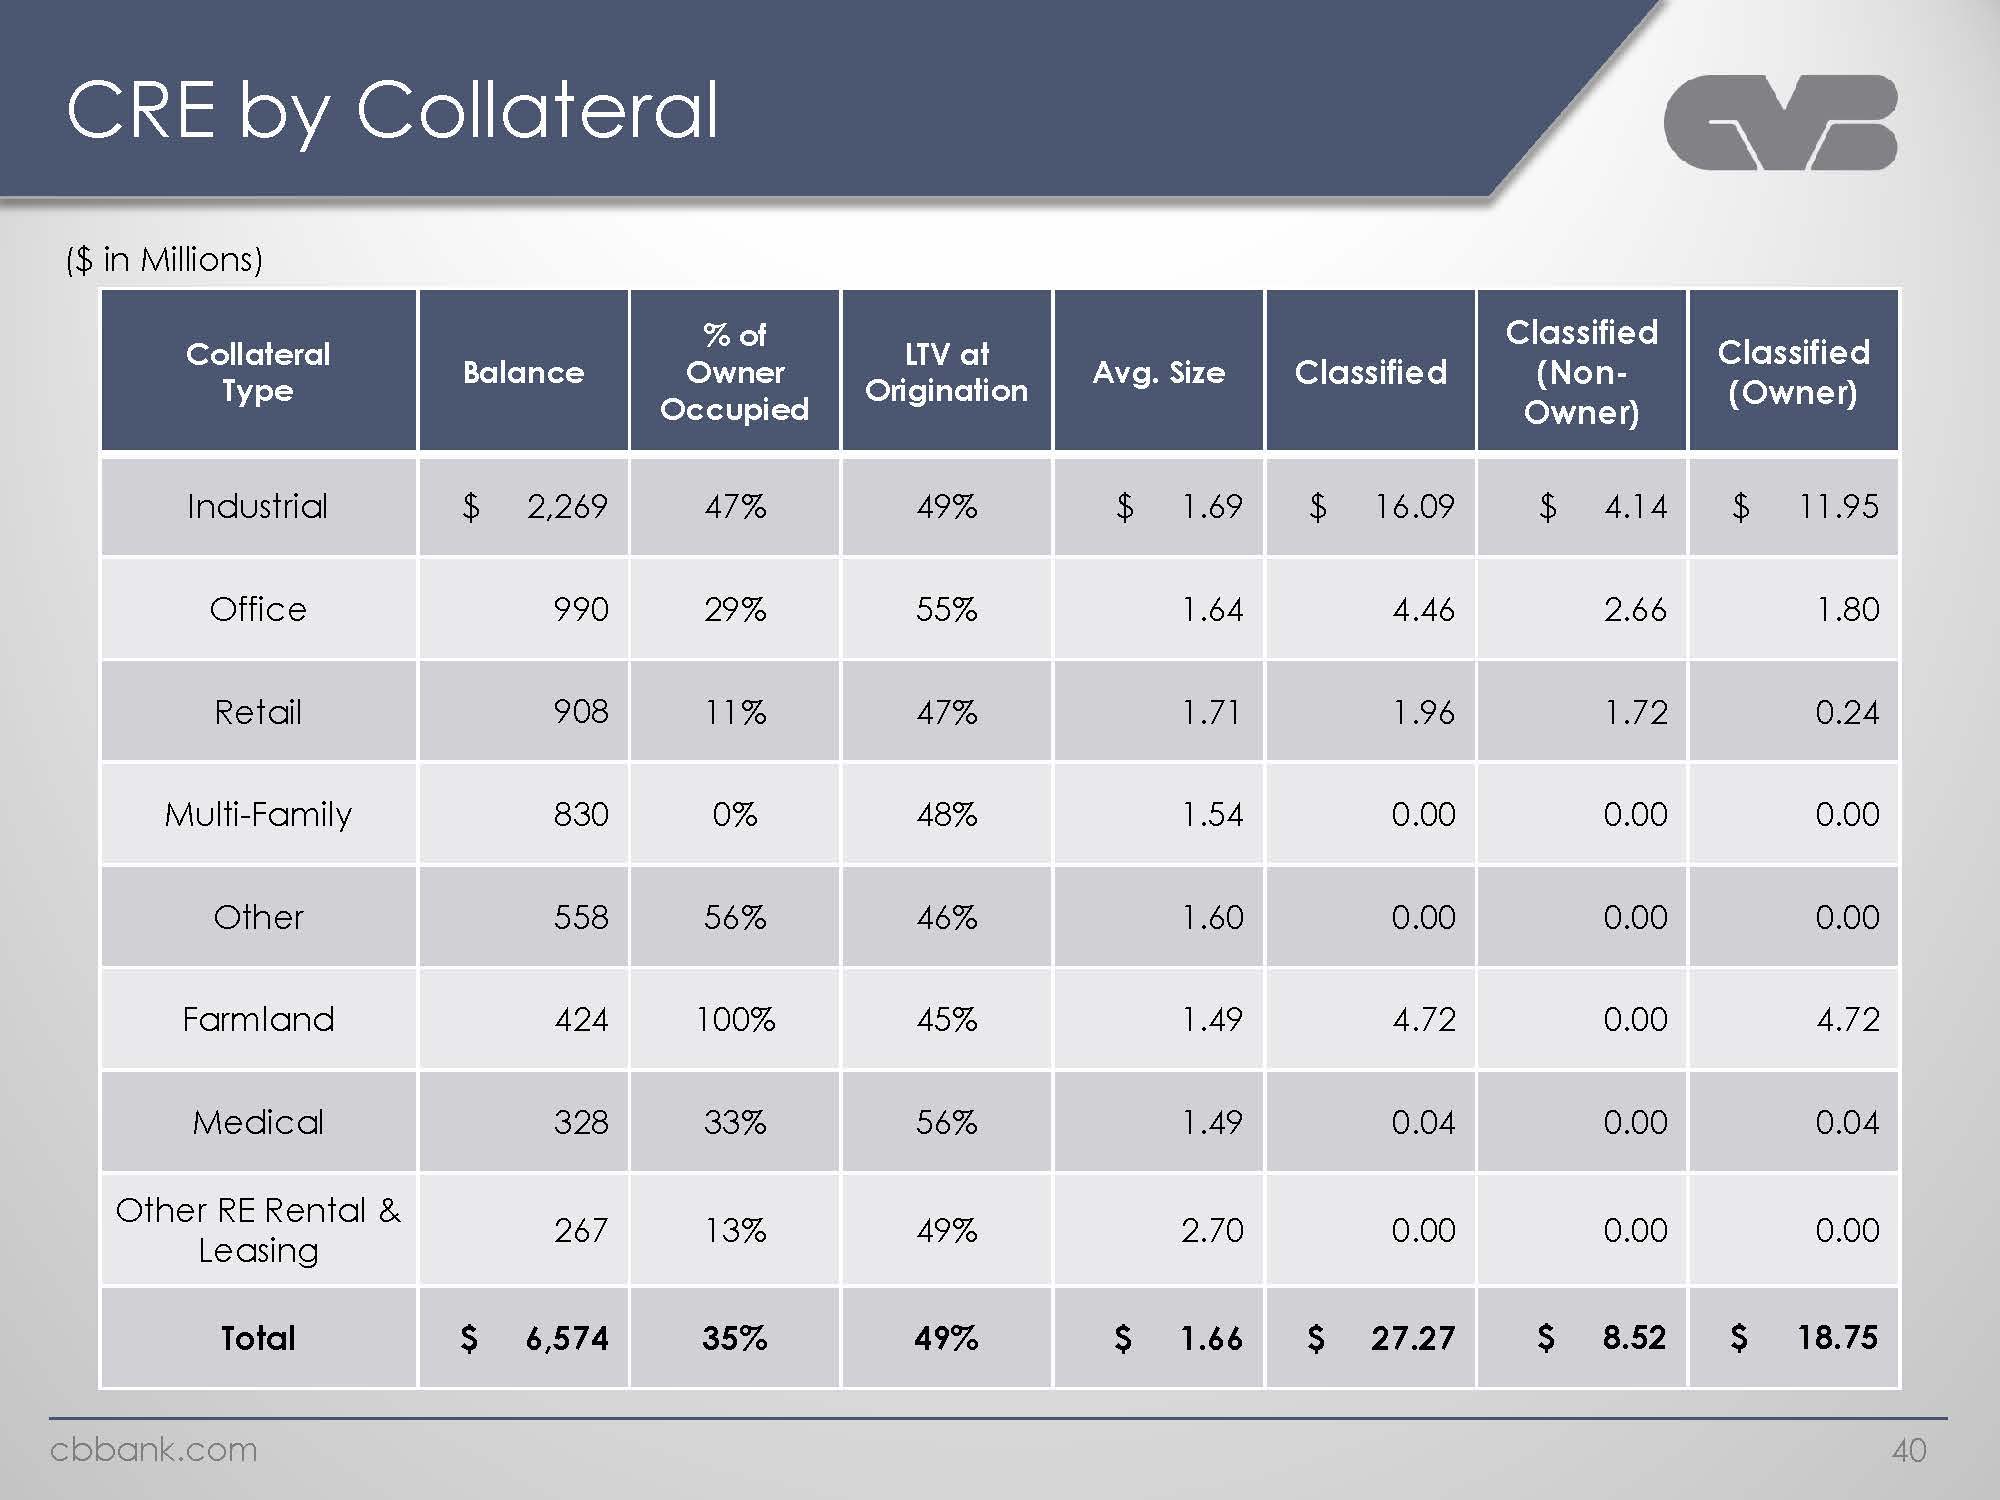
CRE by Collateral ($ in Millions) Collateral Type Balance % of Owner Occupied LTV at Origination Avg. Size Classified Classified (Non- Owner) Classified (Owner) Industrial $ 2,269 47% 49% $ 1.69 $ 16.09 $ 4.14 $ 11.95 Office 990 29% 55% 1.64 4.46 2.66 1.80 Retail 908 11% 47% 1.71 1.96 1.72 0.24 Multi-Family 830 0% 48% 1.54 0.00 0.00 0.00 Other 558 56% 46% 1.60 0.00 0.00 0.00 Farmland 424 100% 45% 1.49 4.72 0.00 4.72 Medical 328 33% 56% 1.49 0.04 0.00 0.04 Other RE Rental & Leasing 267 13% 49% 2.70 0.00 0.00 0.00 Total $ 6,574 35% 49% $ 1.66 $ 27.27 $ 8.52 $ 18.75 cbbank.com 40
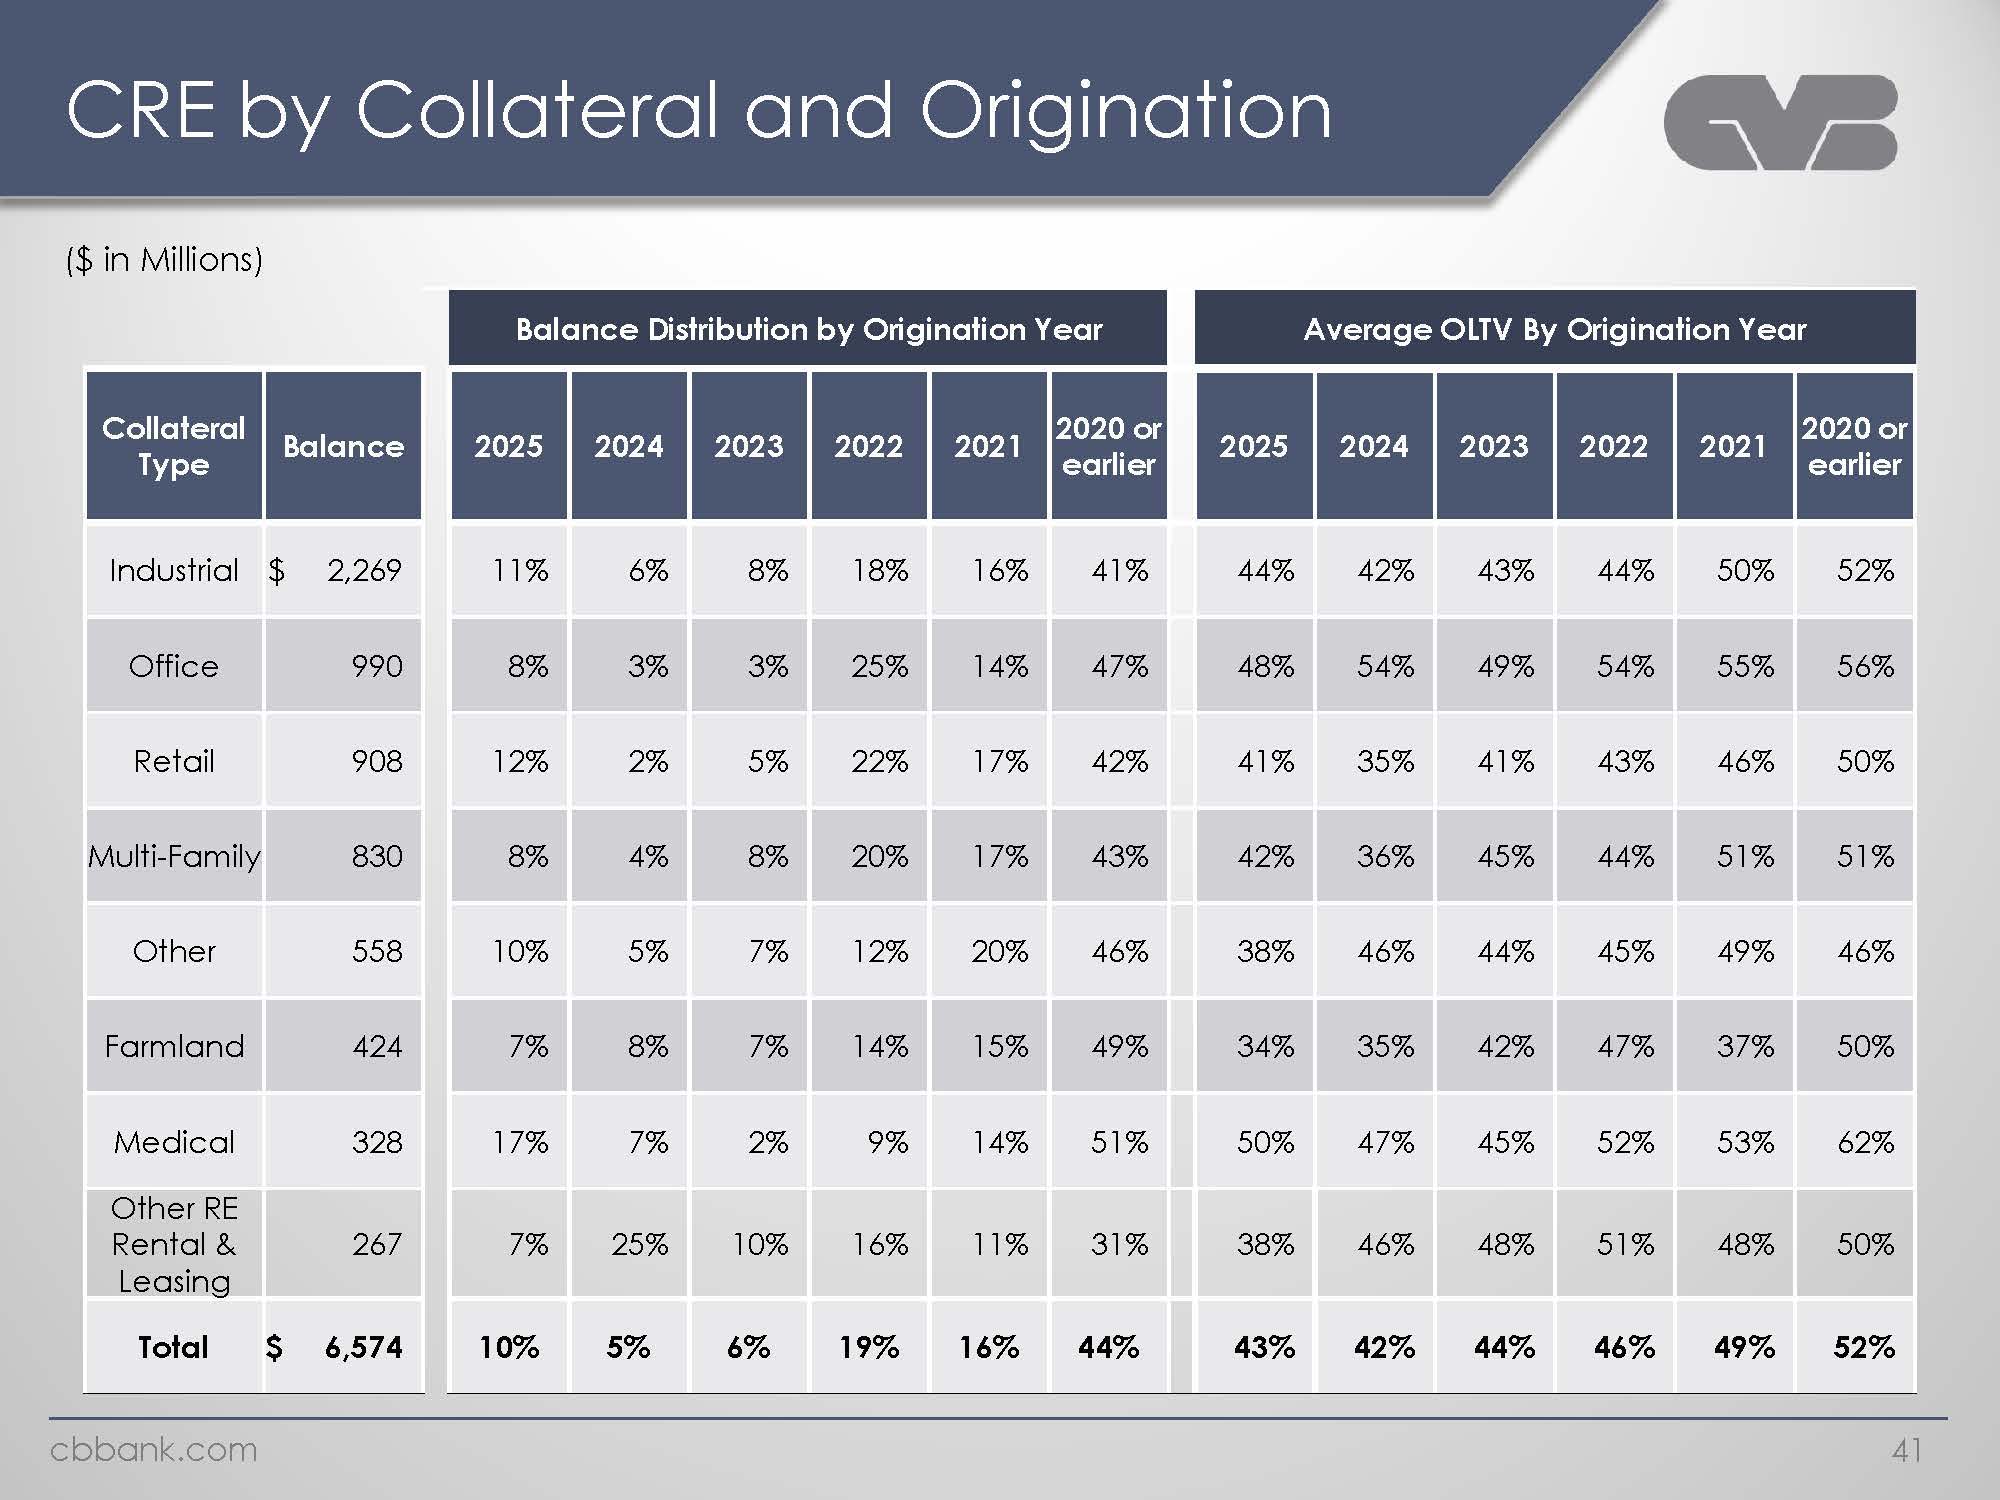
CRE by Collateral and Origination ($ in Millions) Balance Distribution by Origination Year Average OLTV By Origination Year Collateral Type Balance 2025 2024 2023 2022 2021 2020 or earlier 2025 2024 2023 2022 2021 2020 or earlier Industrial $ 2,269 11% 6% 8% 18% 16% 41% 44% 42% 43% 44% 50% 52% Office 990 8% 3% 3% 25% 14% 47% 48% 54% 49% 54% 55% 56% Retail 908 12% 2% 5% 22% 17% 42% 41% 35% 41% 43% 46% 50% Multi-Family 830 8% 4% 8% 20% 17% 43% 42% 36% 45% 44% 51% 51% Other 558 10% 5% 7% 12% 20% 46% 38% 46% 44% 45% 49% 46% Farmland 424 7% 8% 7% 14% 15% 49% 34% 35% 42% 47% 37% 50% Medical 328 17% 7% 2% 9% 14% 51% 50% 47% 45% 52% 53% 62% Other RE Rental & Leasing 267 7% 25% 10% 16% 11% 31% 38% 46% 48% 51% 48% 50% Total $ 6,574 10% 5% 6% 19% 16% 44% 43% 42% 44% 46% 49% 52% cbbank.com 41
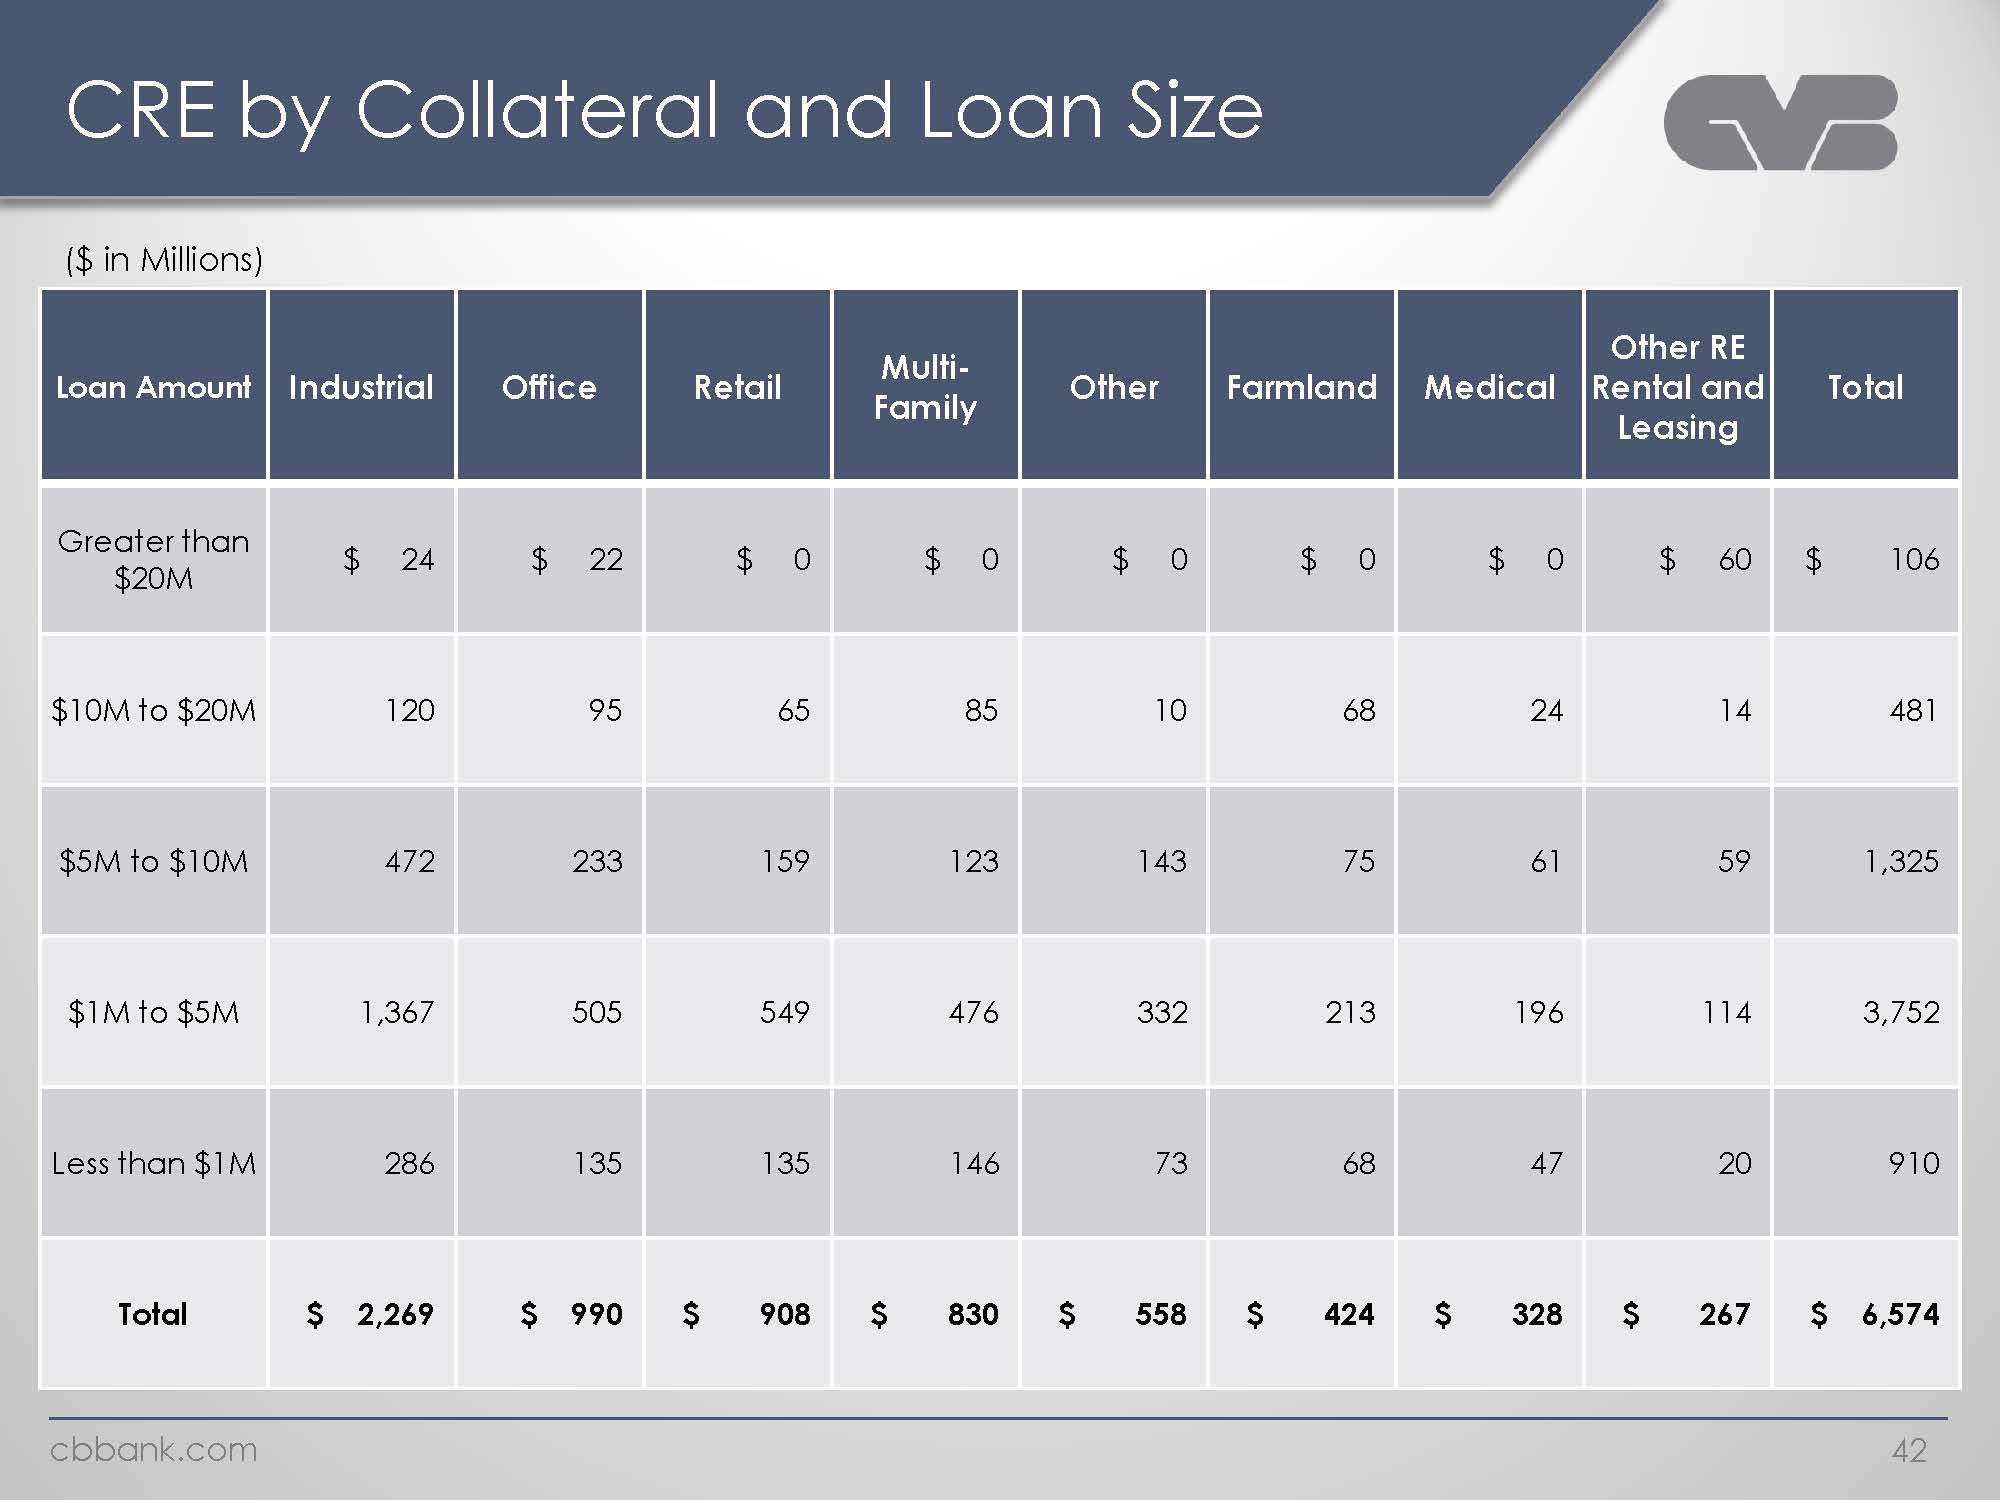
CRE by Collateral and Loan Size ($ in Millions) Loan Amount Greater than $20M $10M to $20M $5M to $10M $1M to $5M Less than $1M Total Industrial $ 24 120 472 1,367 286 $ 2,269 Office $ 22 95 233 505 135 $ 990 Retail $ 0 65 159 549 135 $ 908 Multi-Family $ 0 85 123 476 146 $ 830 Other $ 0 10 143 332 73 $ 558 Farmland $ 0 68 75 213 68 $ 424 Medical $ 0 24 61 196 47 $ 328 Other RE Rental and Leasing $ 60 14 59 114 20 $ 267 Total $ 106 481 1,325 3,752 910 $ 6,574 cbbank.com 42
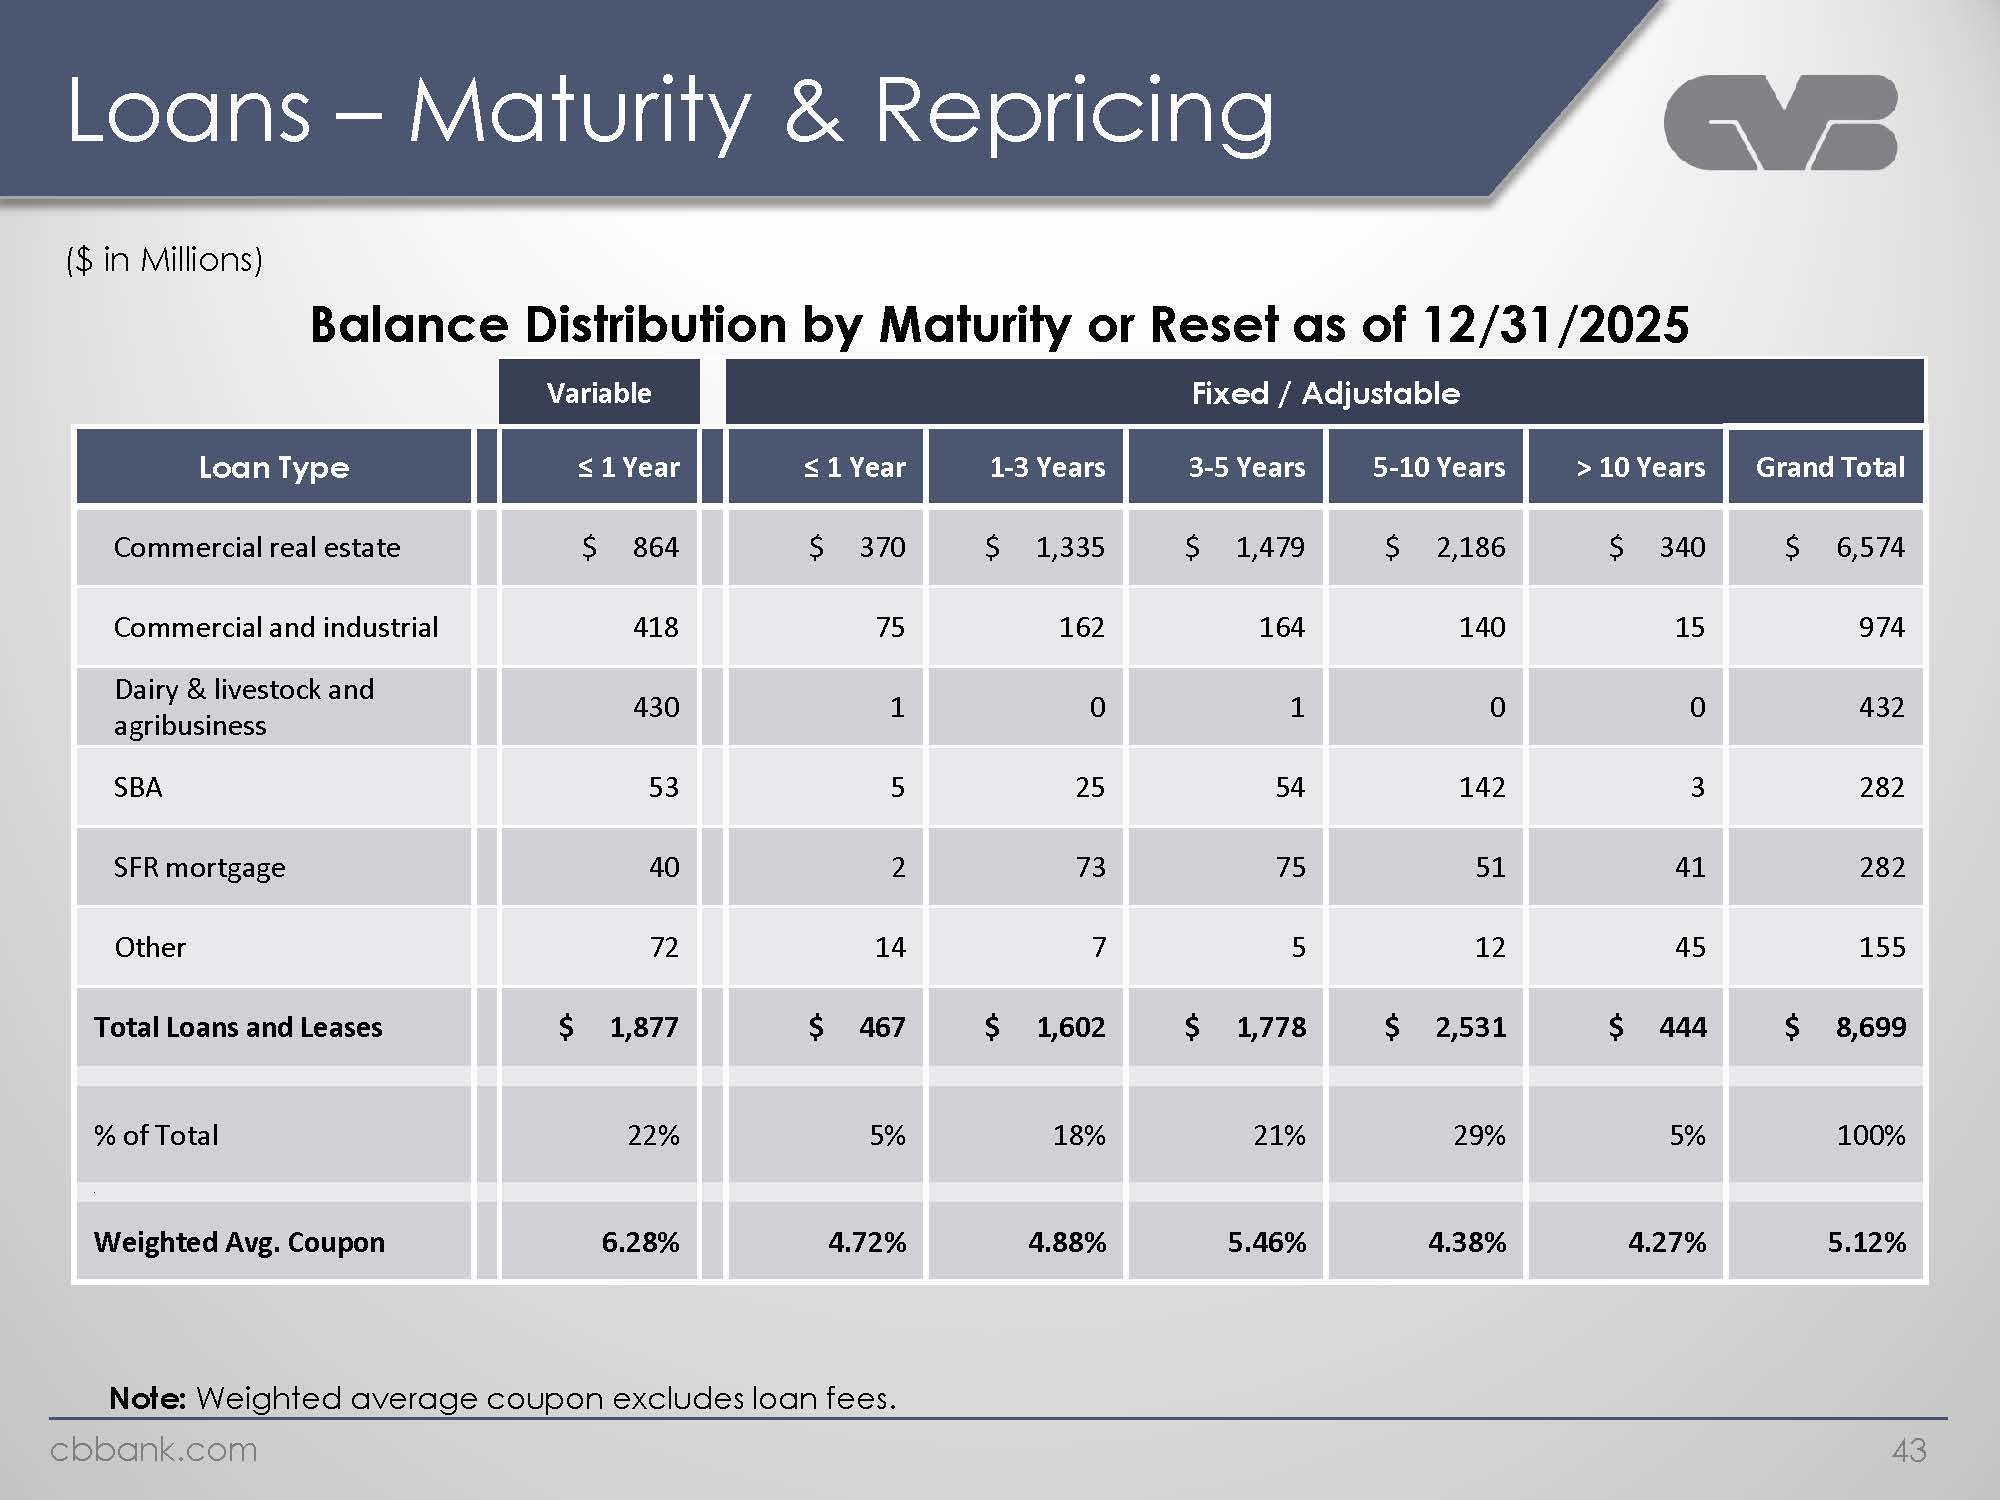
Loans – Maturity & Repricing ($ in Millions) Balance Distribution by Maturity or Reset as of 12/31/2025 Variable Fixed / Adjustable Loan Type Commercial real estate Dairy & livestock and agribusiness SBA SFR mortgage Other Total Loans and Leases % of Total Weighted Avg. Coupon ≤ 1 Year $ 864 418 430 53 40 72 $ 1,877 22% 6.28% ≤ 1 Year $ 370 75 1 5 2 14 $ 467 5% 4.72% 1-3 Years $ 1,335 162 0 25 73 7 $ 1,602 18% 4.88% 3-5 Years $ 1,479 164 1 54 75 5 $ 1,778 21% 5.46% 5-10 Years $ 2,186 140 0 142 51 12 $ 2,531 29% 4.38% > 10 Years $ 340 15 0 3 41 45 $ 444 5% 4.27% Grand Total $ 6,574 974 432 282 282 155 $ 8,699 100% 5.12% Note: Weighted average coupon excludes loan fees. Cbbank.com 43
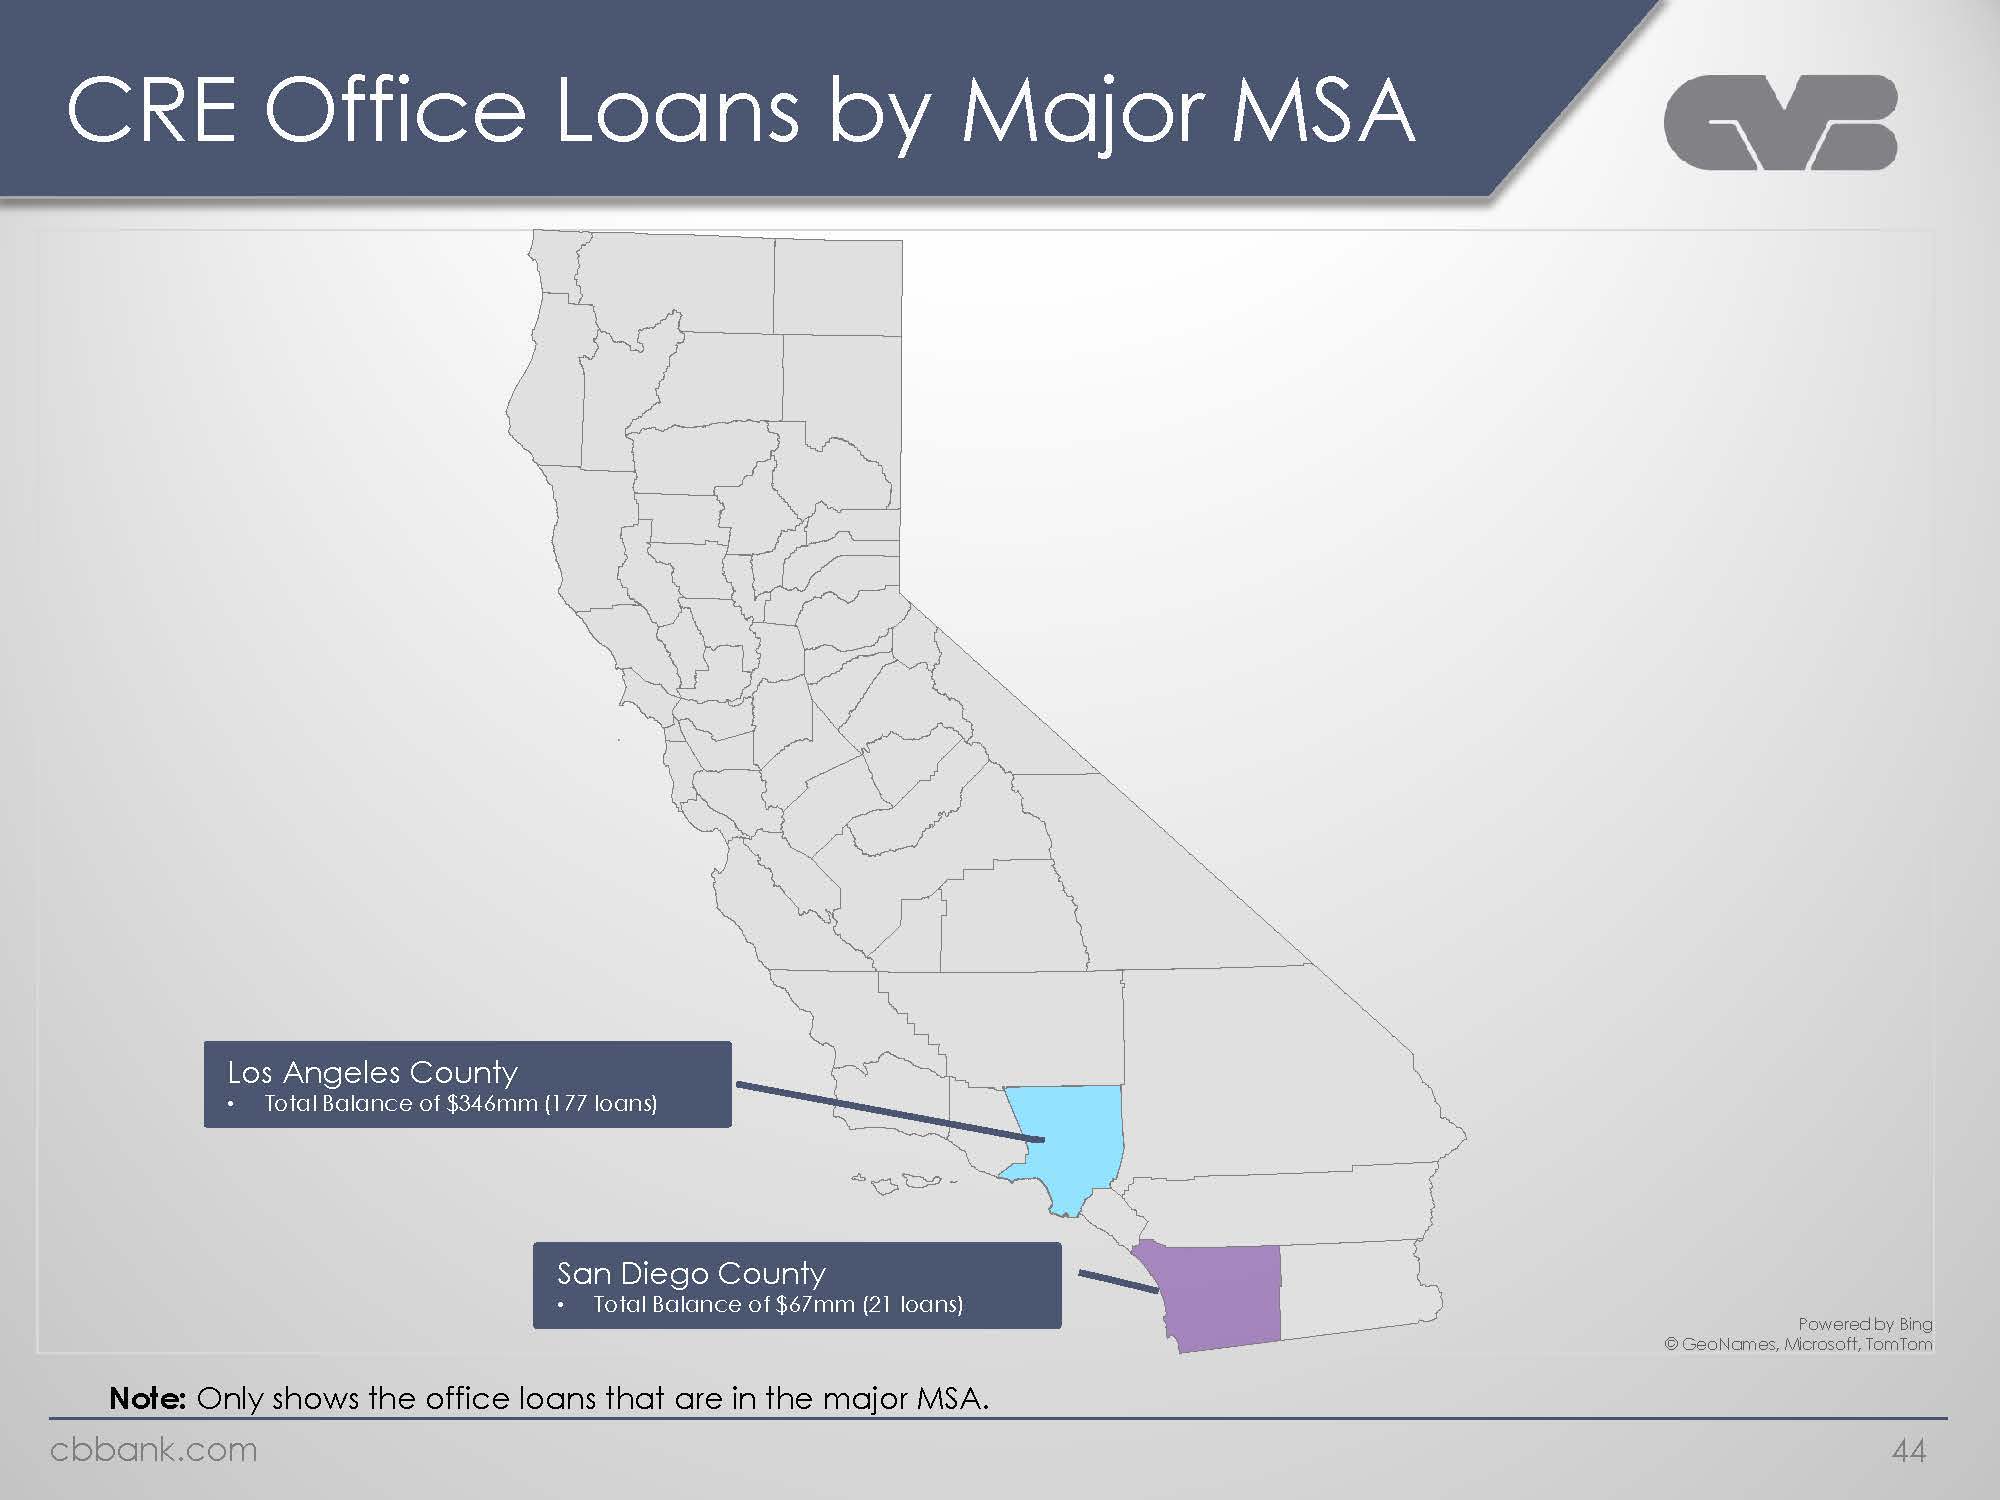
CRE Office Loans by Major MSA Los Angeles County Total Balance of $346mm (177 loans) San Diego County Total Balance of $67mm (21 loans) Powered by Bing @GeoNames, Microsoft, TomTom Note: Only shows the office loans that are in the major MSA. Cbbank.com 44
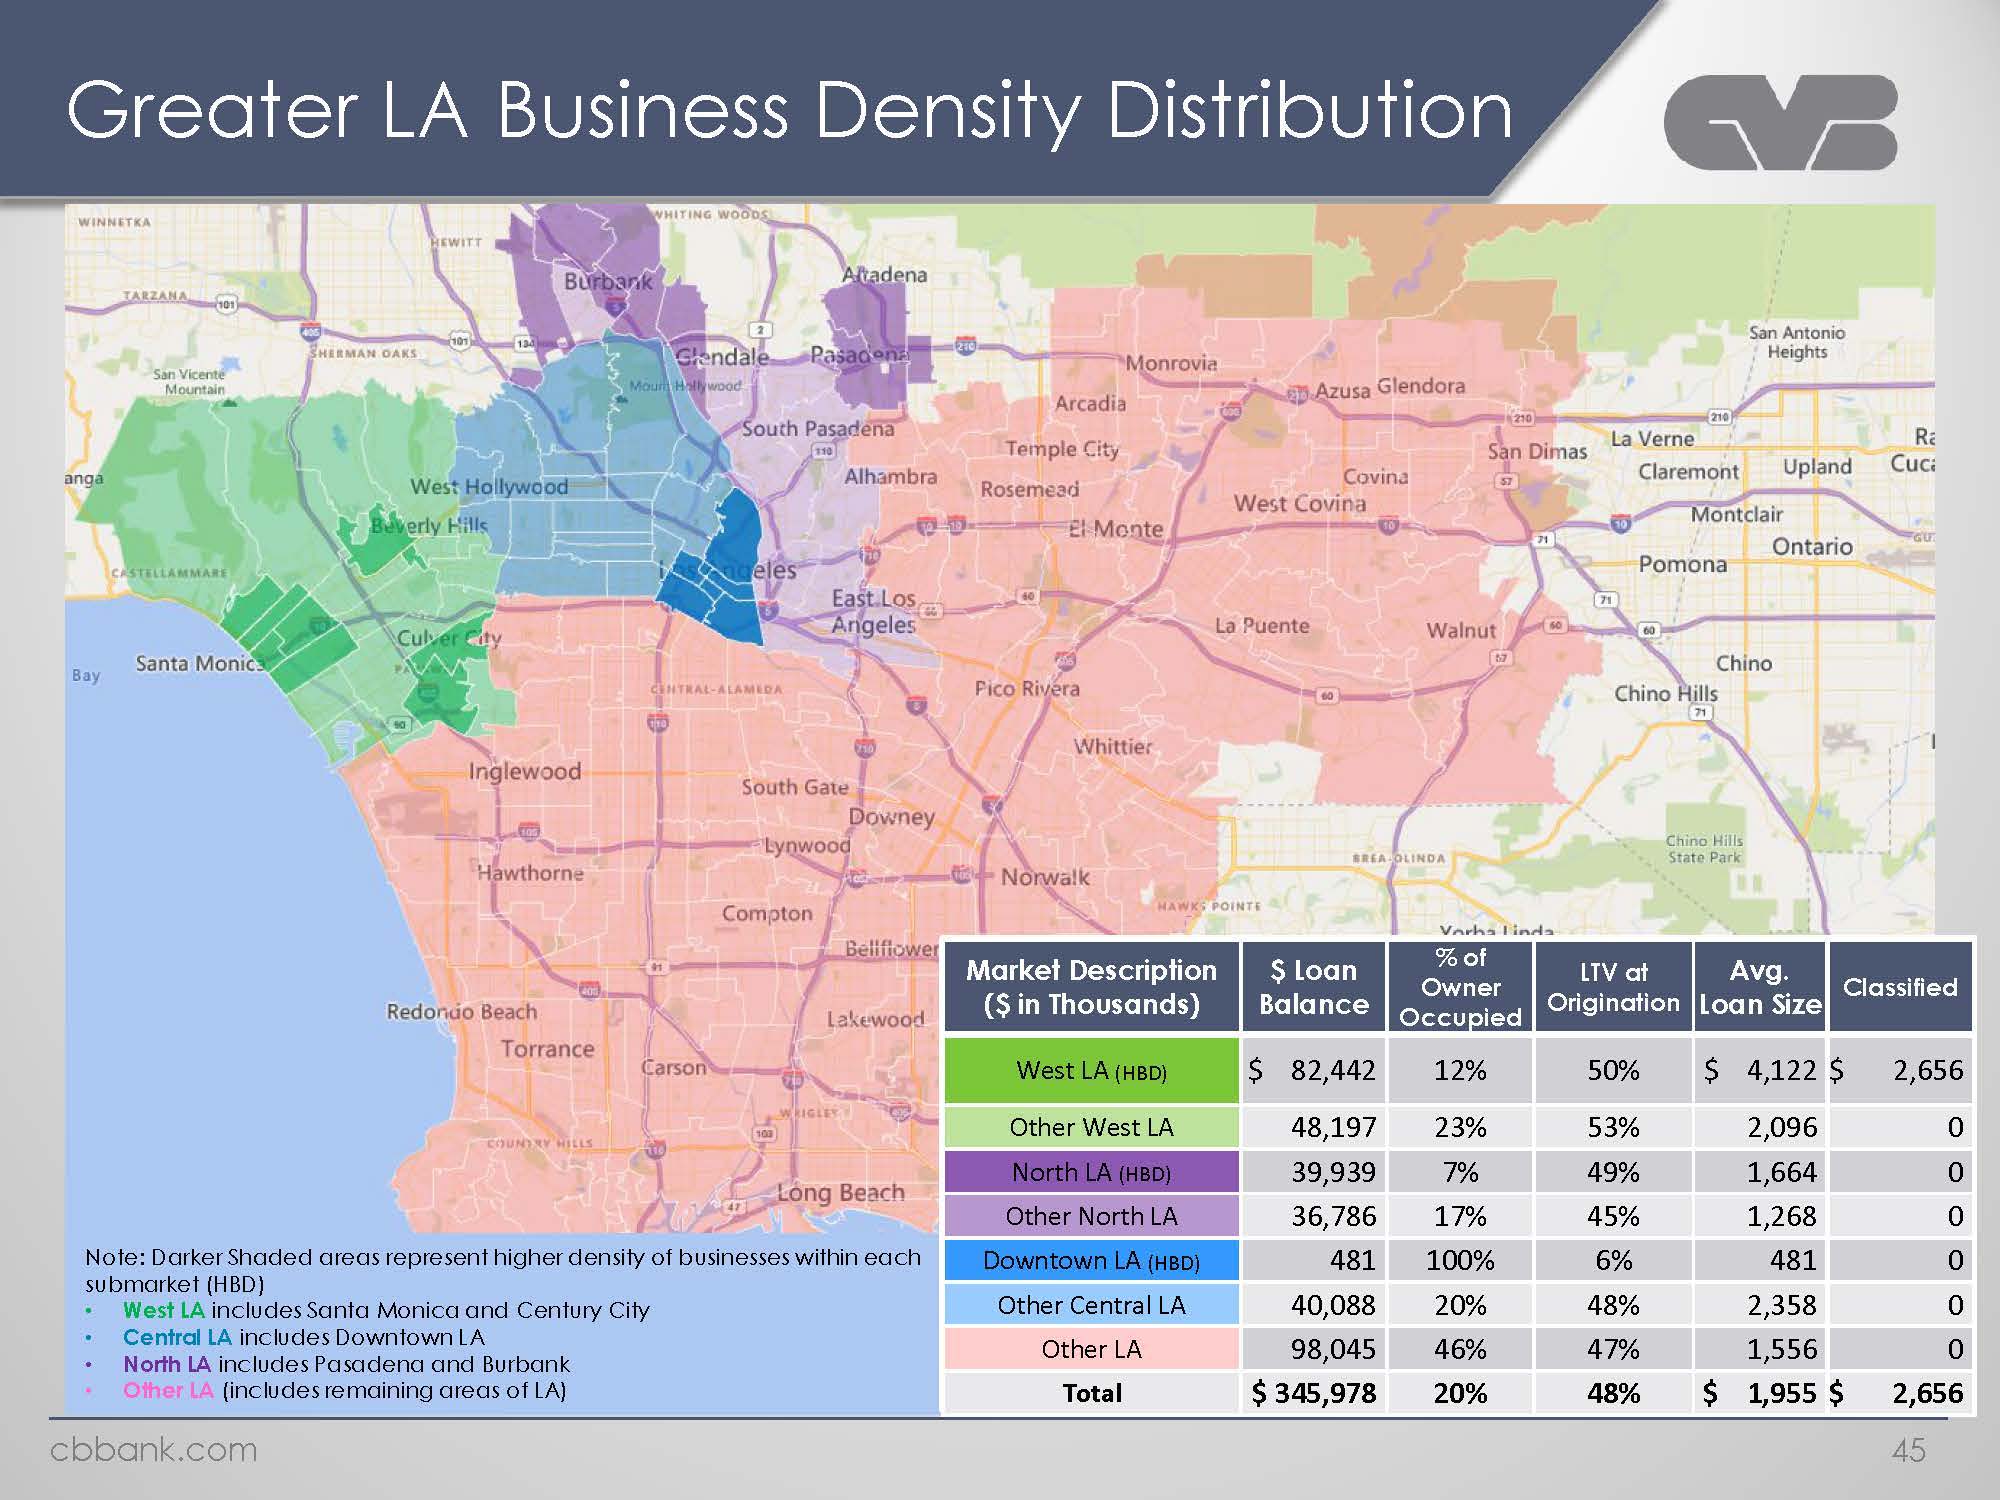
Greater LA Business Density Distribution Note: Darker Shaded areas represent higher density of businesses within each submarket (HBD) West LA includes Santa Monica and Century City Central LA includes Downtown LA North LA includes Pasadena and Burbank Other LA (includes remaining areas of LA) Market Description ($ in Thousands) West LA (HBD) Other West LA North LA (HBD) Other North LA Downtown LA (HBD) Other Central LA Other LA Total $ Loan Balance $ 82,442 48,197 39,939 36,786 481 40,088 98,045 $ 345,978 % of Owner Occupied 12% 23% 7% 17% 100% 20% 46% 20% LTV at Origination 50% 53% 49% 45% 6% 48% 47% 48% Avg. Loan Size $ 4,122 2,096 1,664 1,268 481 2,358 1,556 $ 1,955 Classified $ 2,656 0 0 0 0 0 0 $ 2,656 cbbank.com 45
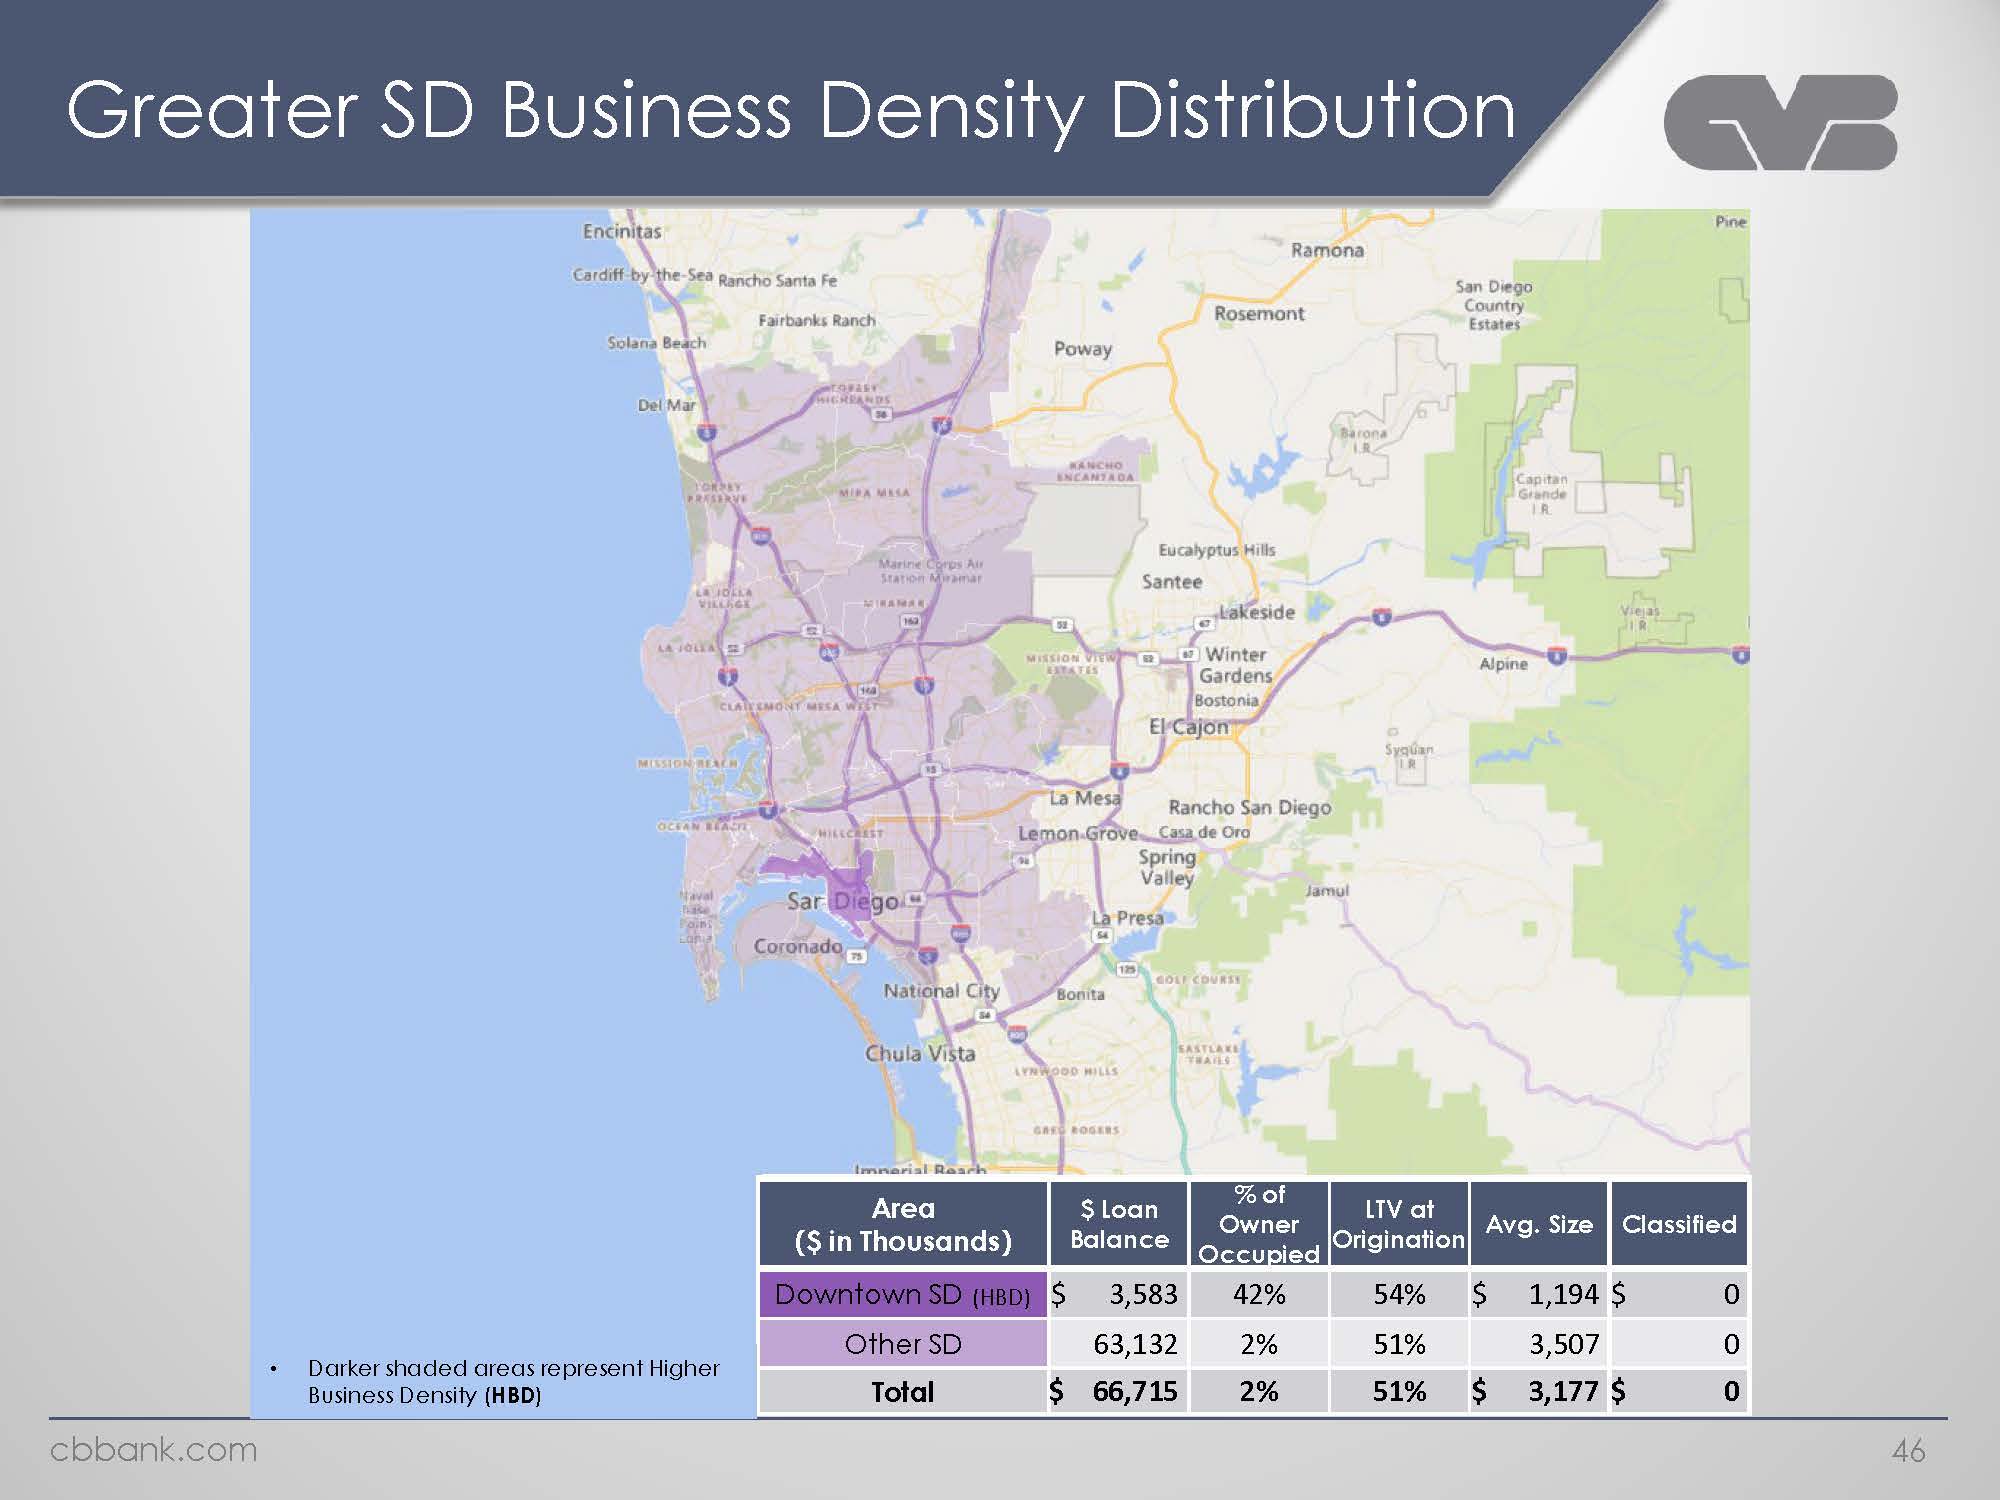
Greater SD Business Density Distribution Darker shaded areas represent Higher Business Density (HBD) Area ($ in Thousands) Downtown SD (HBD) Other SD Total $ Loan Balance $ 3,583 63,132 $ 66,715 % of Owner Occupied 42% 2% 2% LTV at Origination 54% 51% 51% Avg. Size $ 1,194 3,507 $ 3,177 Classified 0 0 0 cbbank.com 46
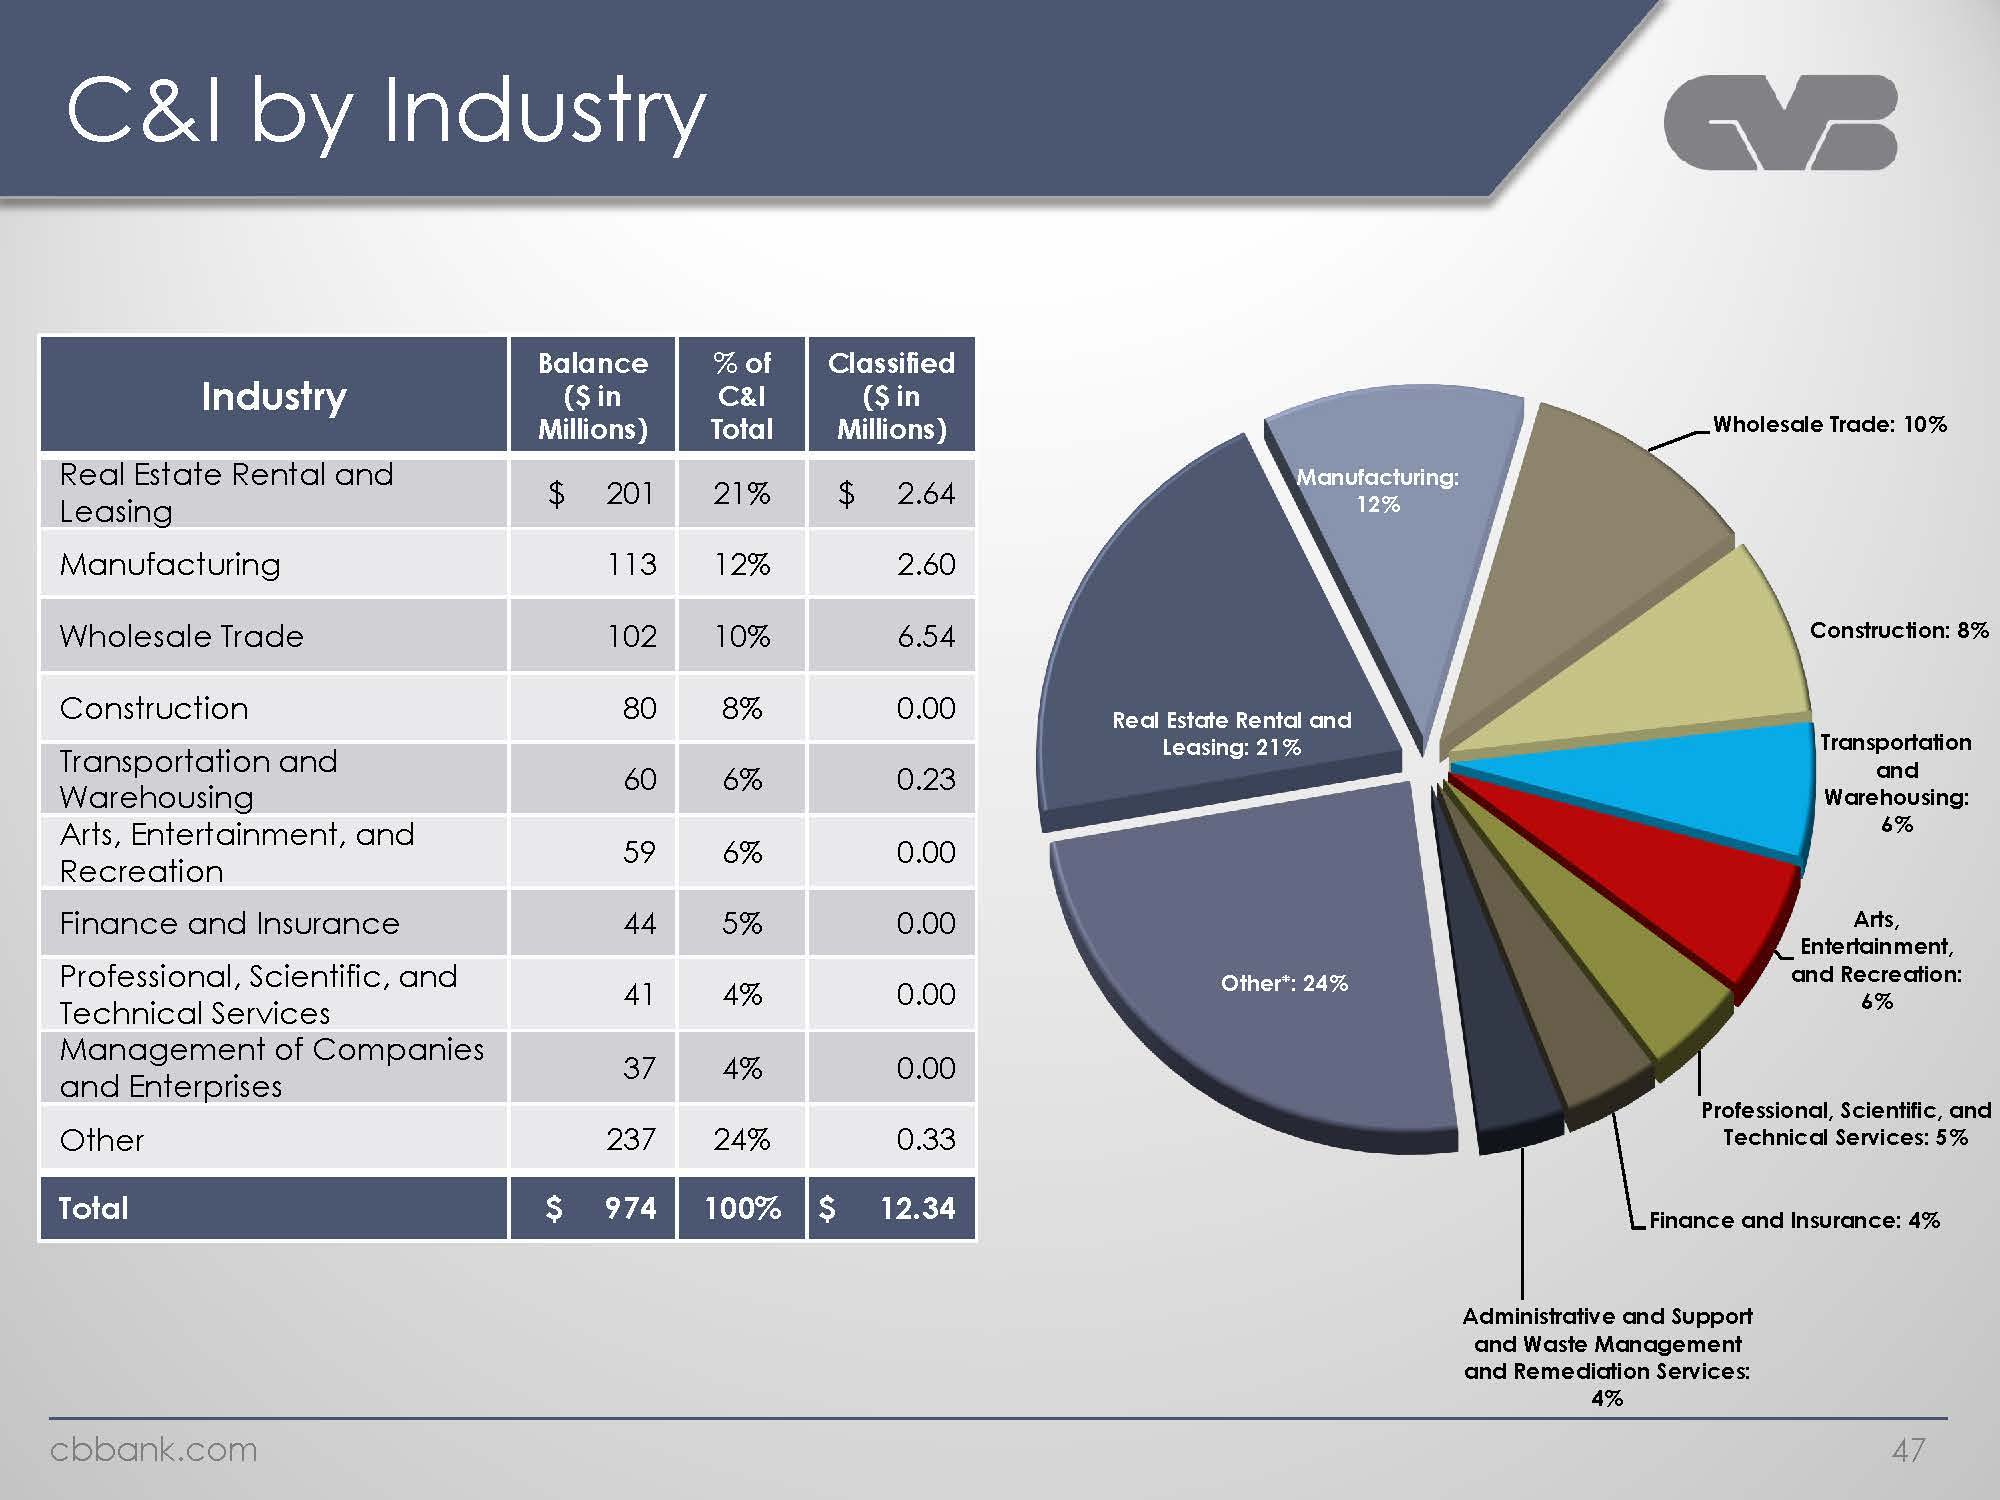
C&I by Industry Industry Real Estate Rental and Leasing Manufacturing Wholesale Trade Construction Transportation and Warehousing Arts, Entertainment, and Recreation Finance and Insurance Professional, Scientific, and Technical Services Management of Companies and Enterprises Other Total Balance ($ in Millions) $ 201 113 102 80 60 59 44 41 37 237 $ 974 % of C&I Total 21% 12% 10% 8% 6% 6% 5% 4% 4% 24% 100% Classified ($ in Millions) $ 2.64 2.60 6.54 0.00 0.23 0.00 0.00 0.00 0.00 0.33 $ 12.34 Manufacturing: 12% Real Estate Rental and Leasing: 21% Other*: 24% Wholesale Trade: 10% Construction: 8% Transportation and Warehousing: 6% Arts, Entertainment, and Recreation: 6% Professional, Scientific, and Technical Services: 5% Finance and Insurance: 4% Administrative and Support and Waste Management and Remediation Services: 4% cbbank.com 47
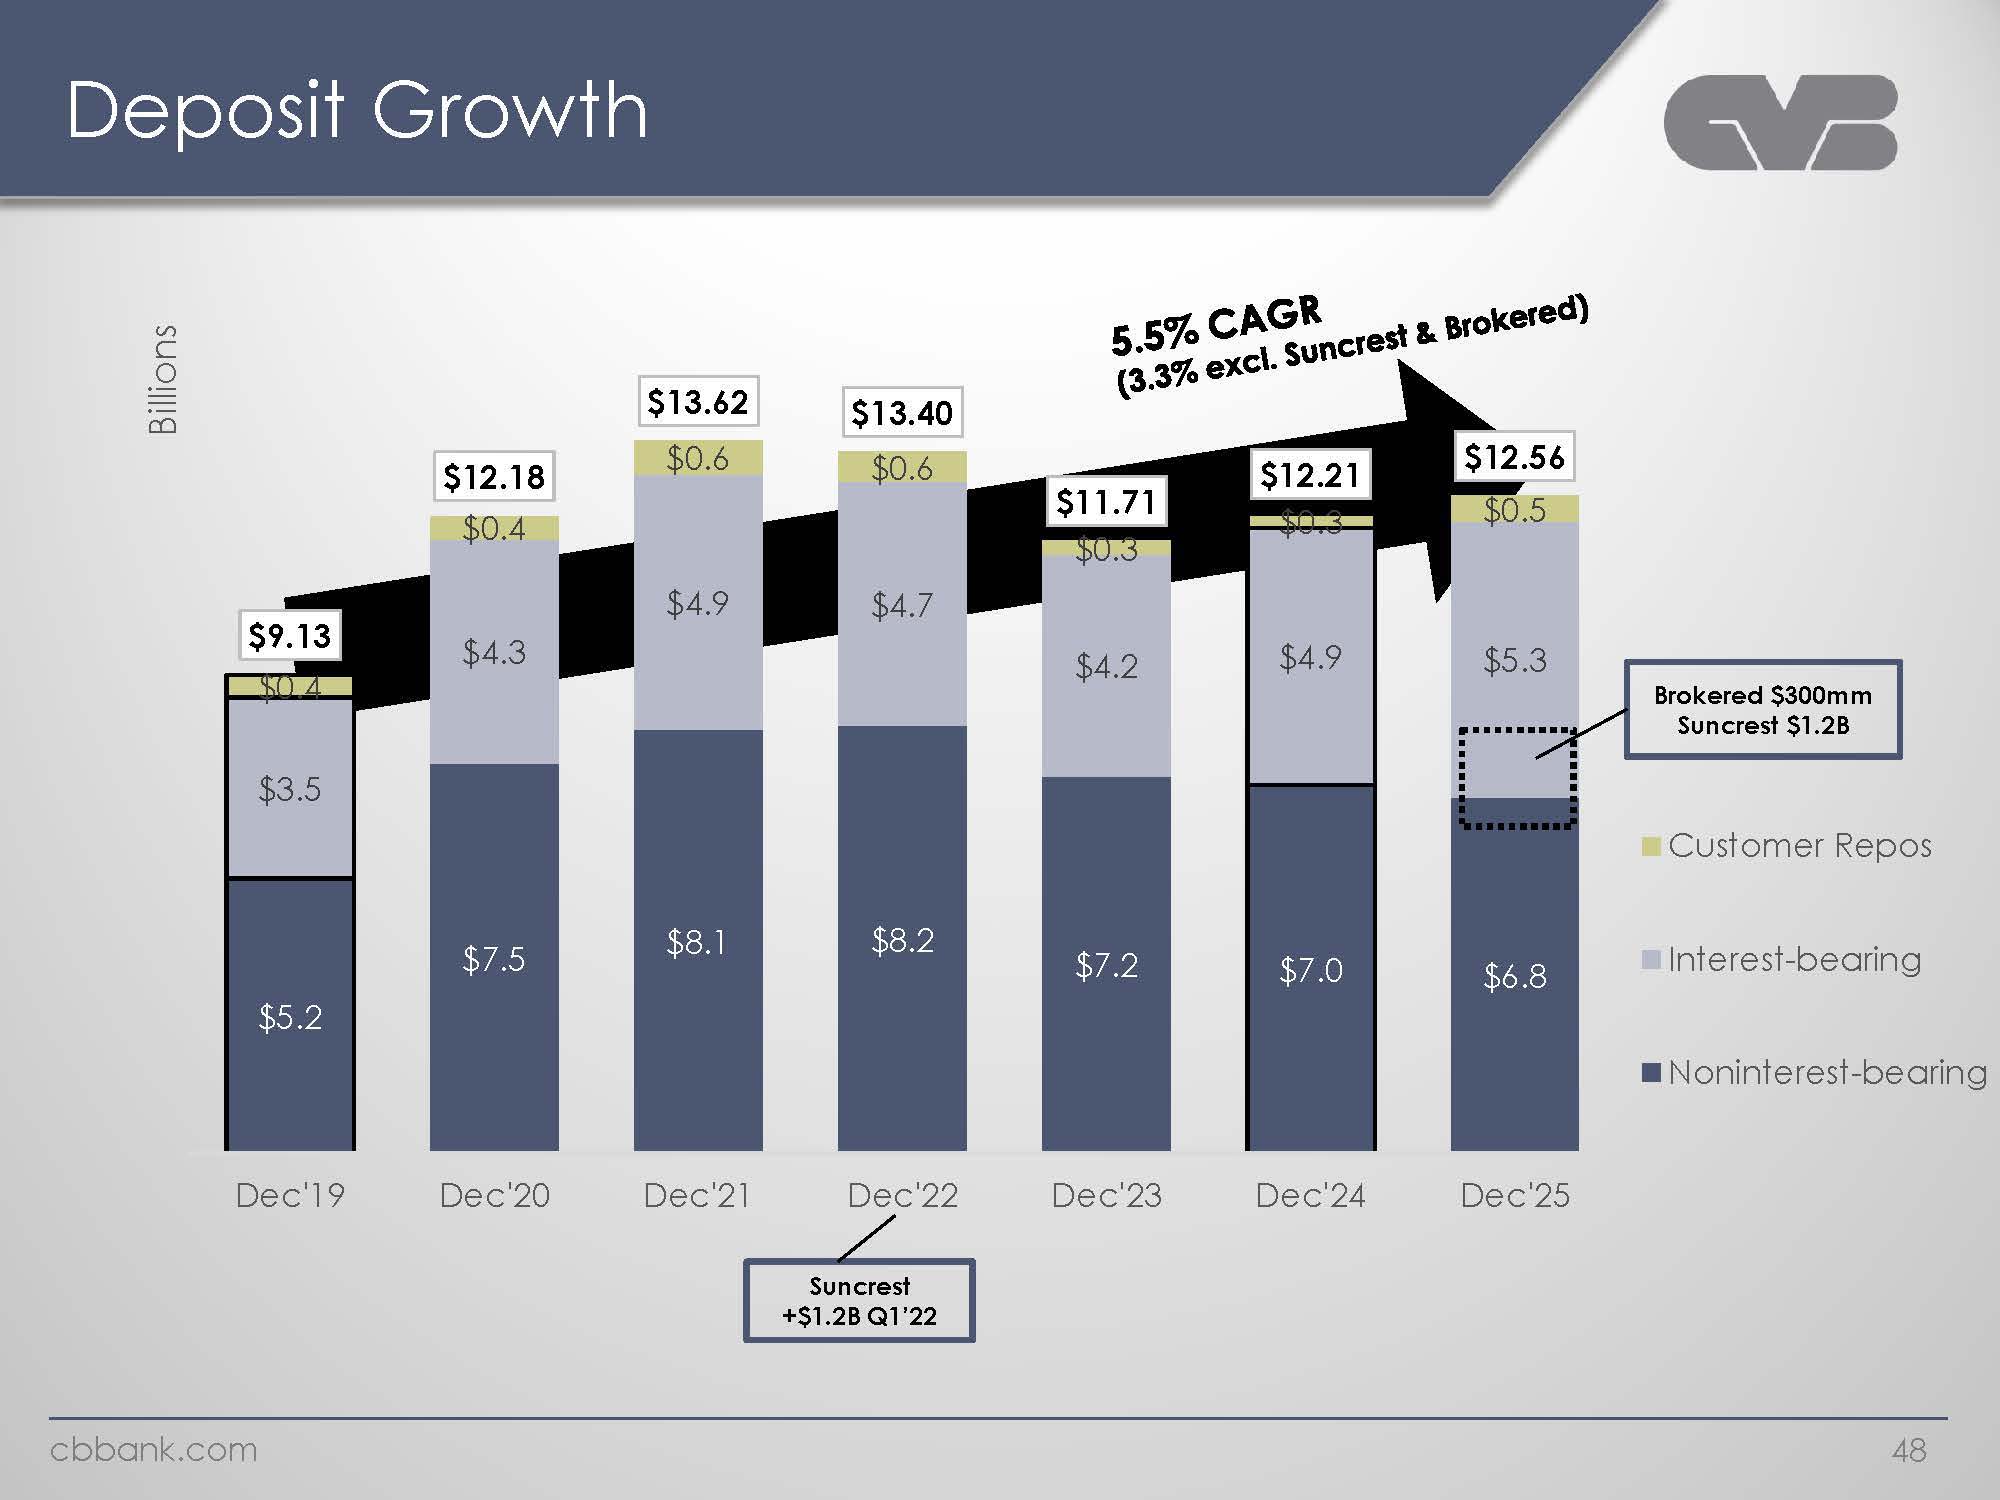
Deposit Growth Billions $9.13 $0.4 $3.5 $5.2 Dec’19 Dec’20 Dec’21 Dec’22 Dec’23 Dec’24 Dec’25 $12.18 $0.4 $4.3 $4.3 $13.62 $0.6 $4.9 $8.1 $13.40 $0.6 $4.7 $8.2 Suncrest +$1.2B Q1’22 5.5% CAGR (3.3% excl. Suncrest & Brokered $11.71 $0.3 $4.2 $7.2 $12.21 $0.3 $4.9 $7.0 $12.56 $0.5 $5.3 $6.8 Brokered $300mm Suncrest $1.2B Customer Repos Interest-bearing Noninterest-bearing cbbank.com 48
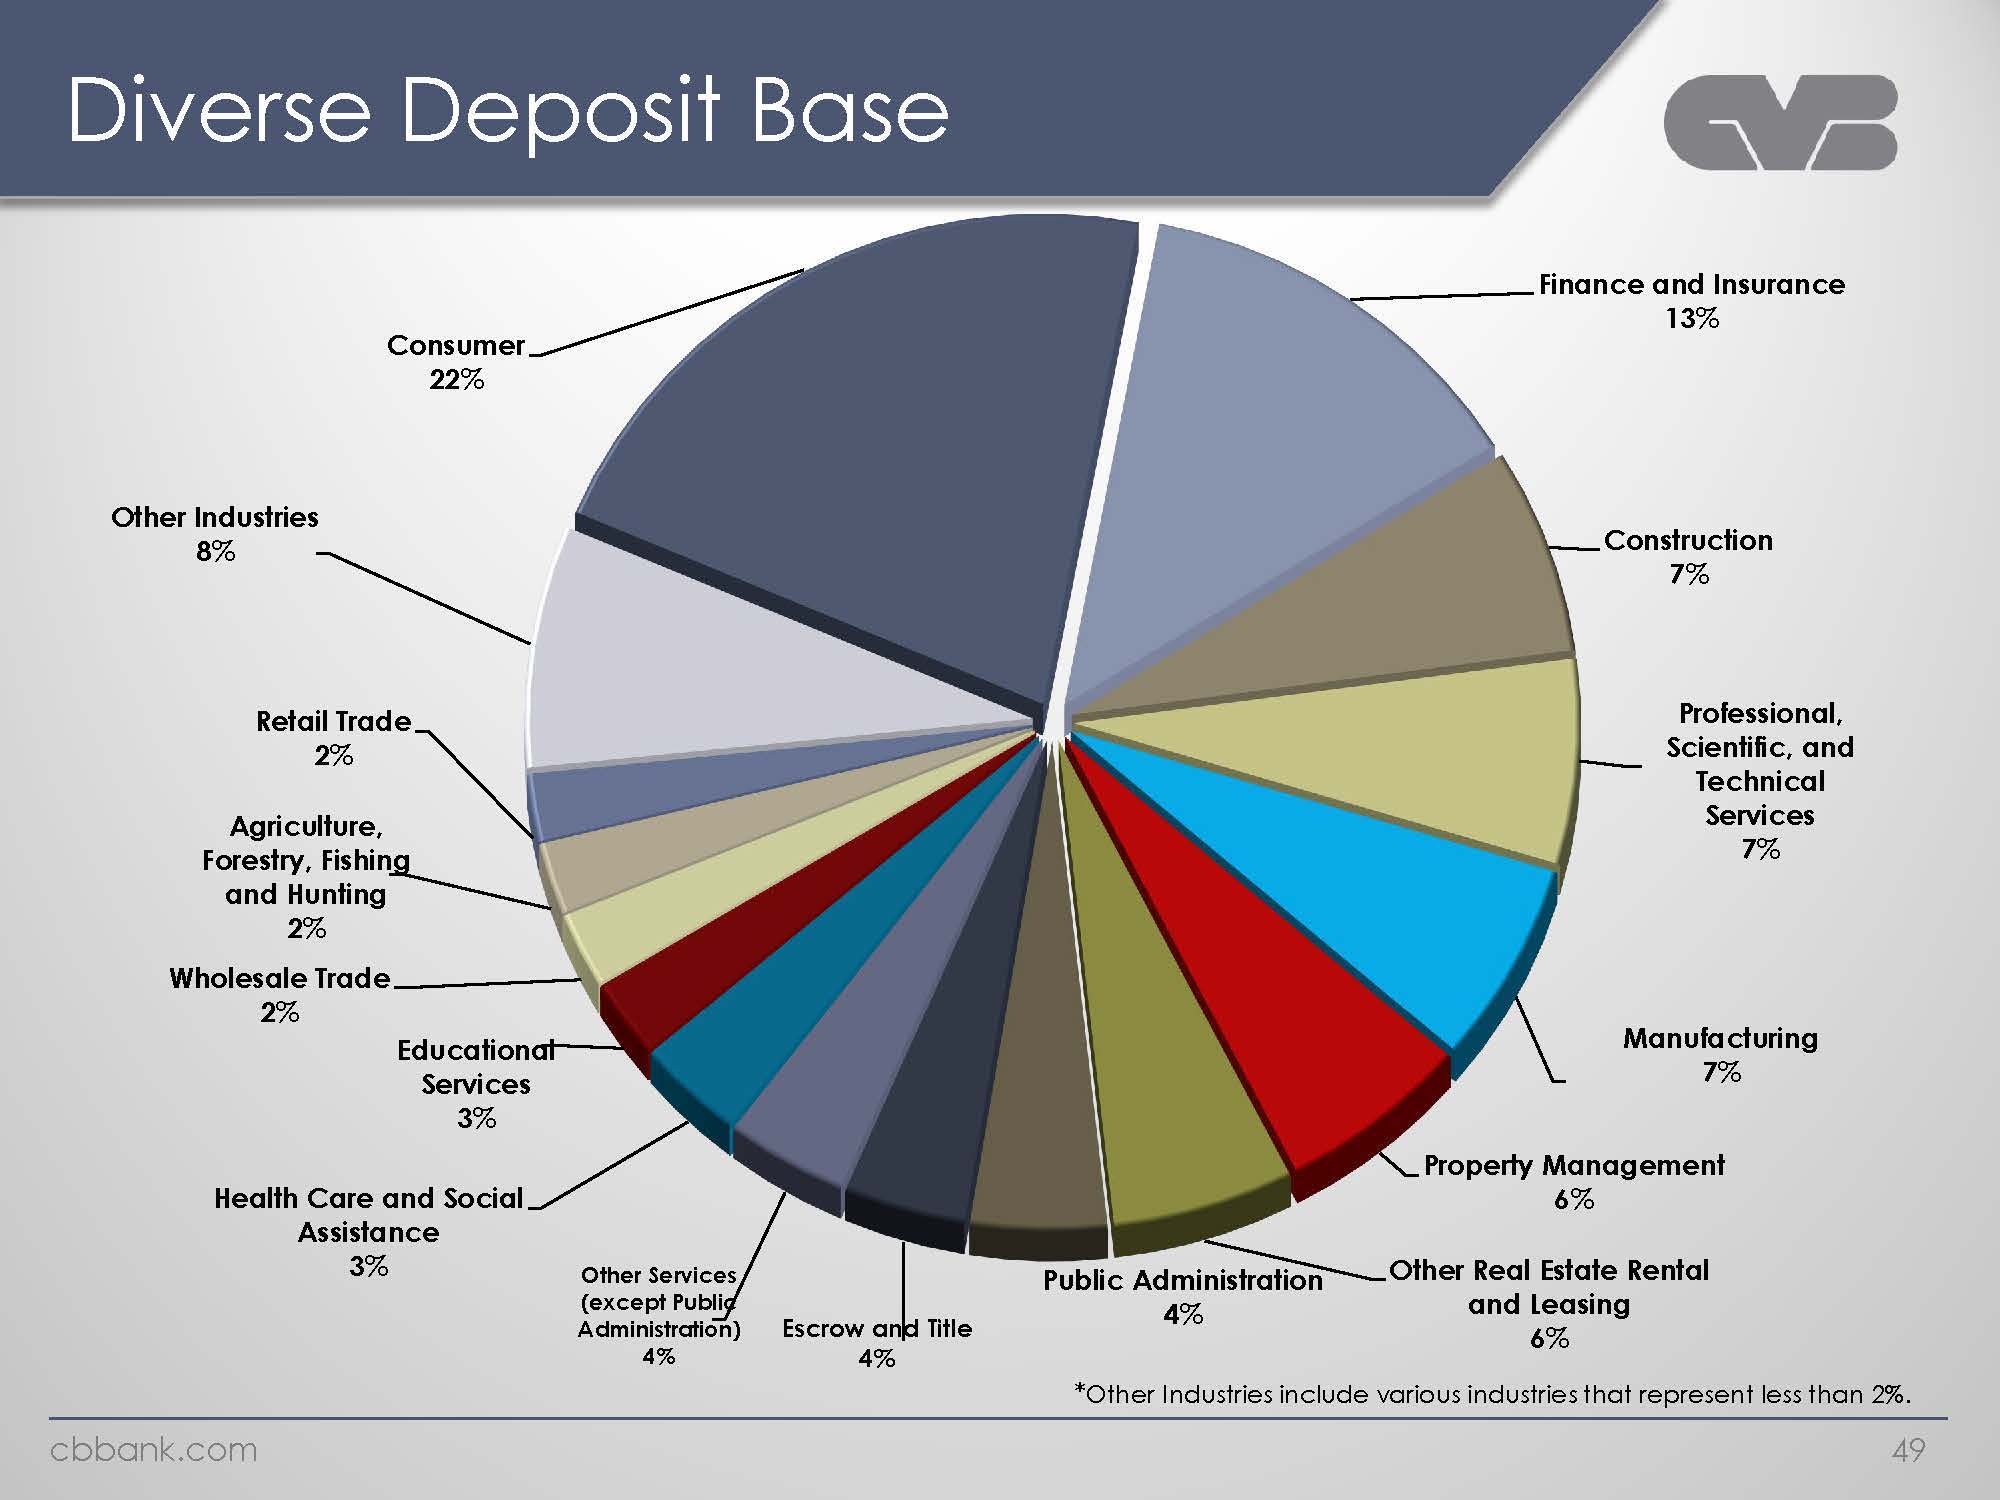
Diverse Deposit Base Consumer 22% Other Industries 8% Retail Trade 2% Agriculture, Forestry, Fishing and Hunting 2% Wholesale Trade 2% Educational Services 3% Health Care and Social Assistance 3% Other Services (except Public Administration) 4% Escrow and Title 4% Public Administration 4% Other Real Estate Rental and Leasing 6% Property Management 6% Manufacturing 7% Professional, Scientific, and Technical Services 7% Construction 7% Finance and Insurance 13% *Other Industries include various industries that represent less than 2%. Cbbank.com 49
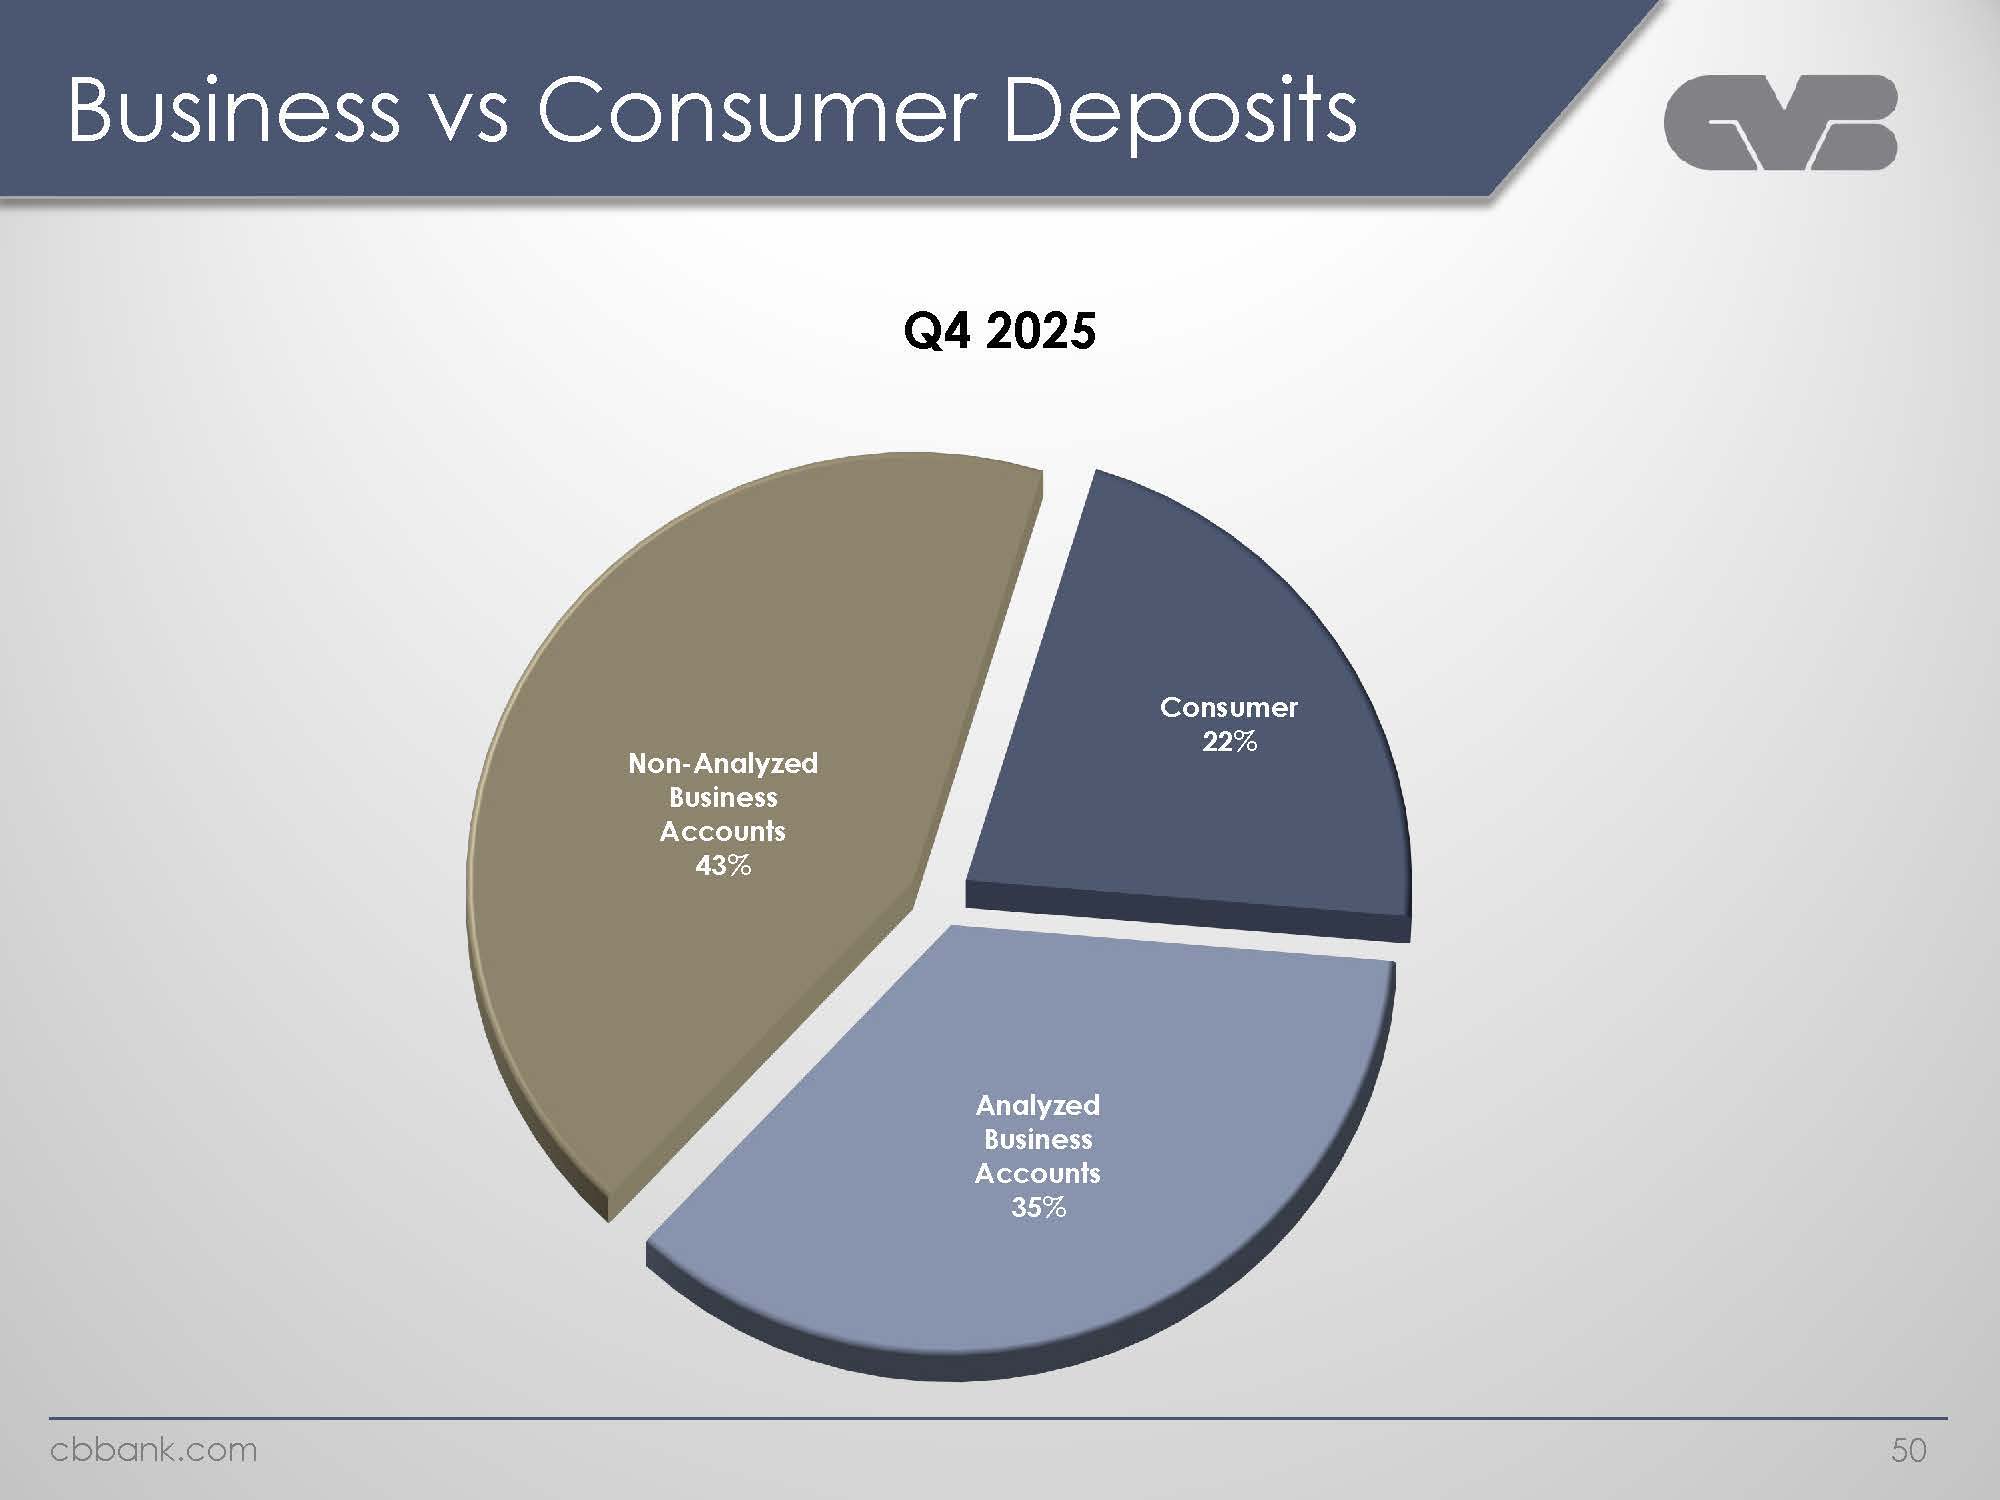
Business vs Consumer Deposits Q4 2025 Non-Analyzed Business Accounts 43% Analyzed Business Accounts 35% Consumer 22% cbbank.com 49
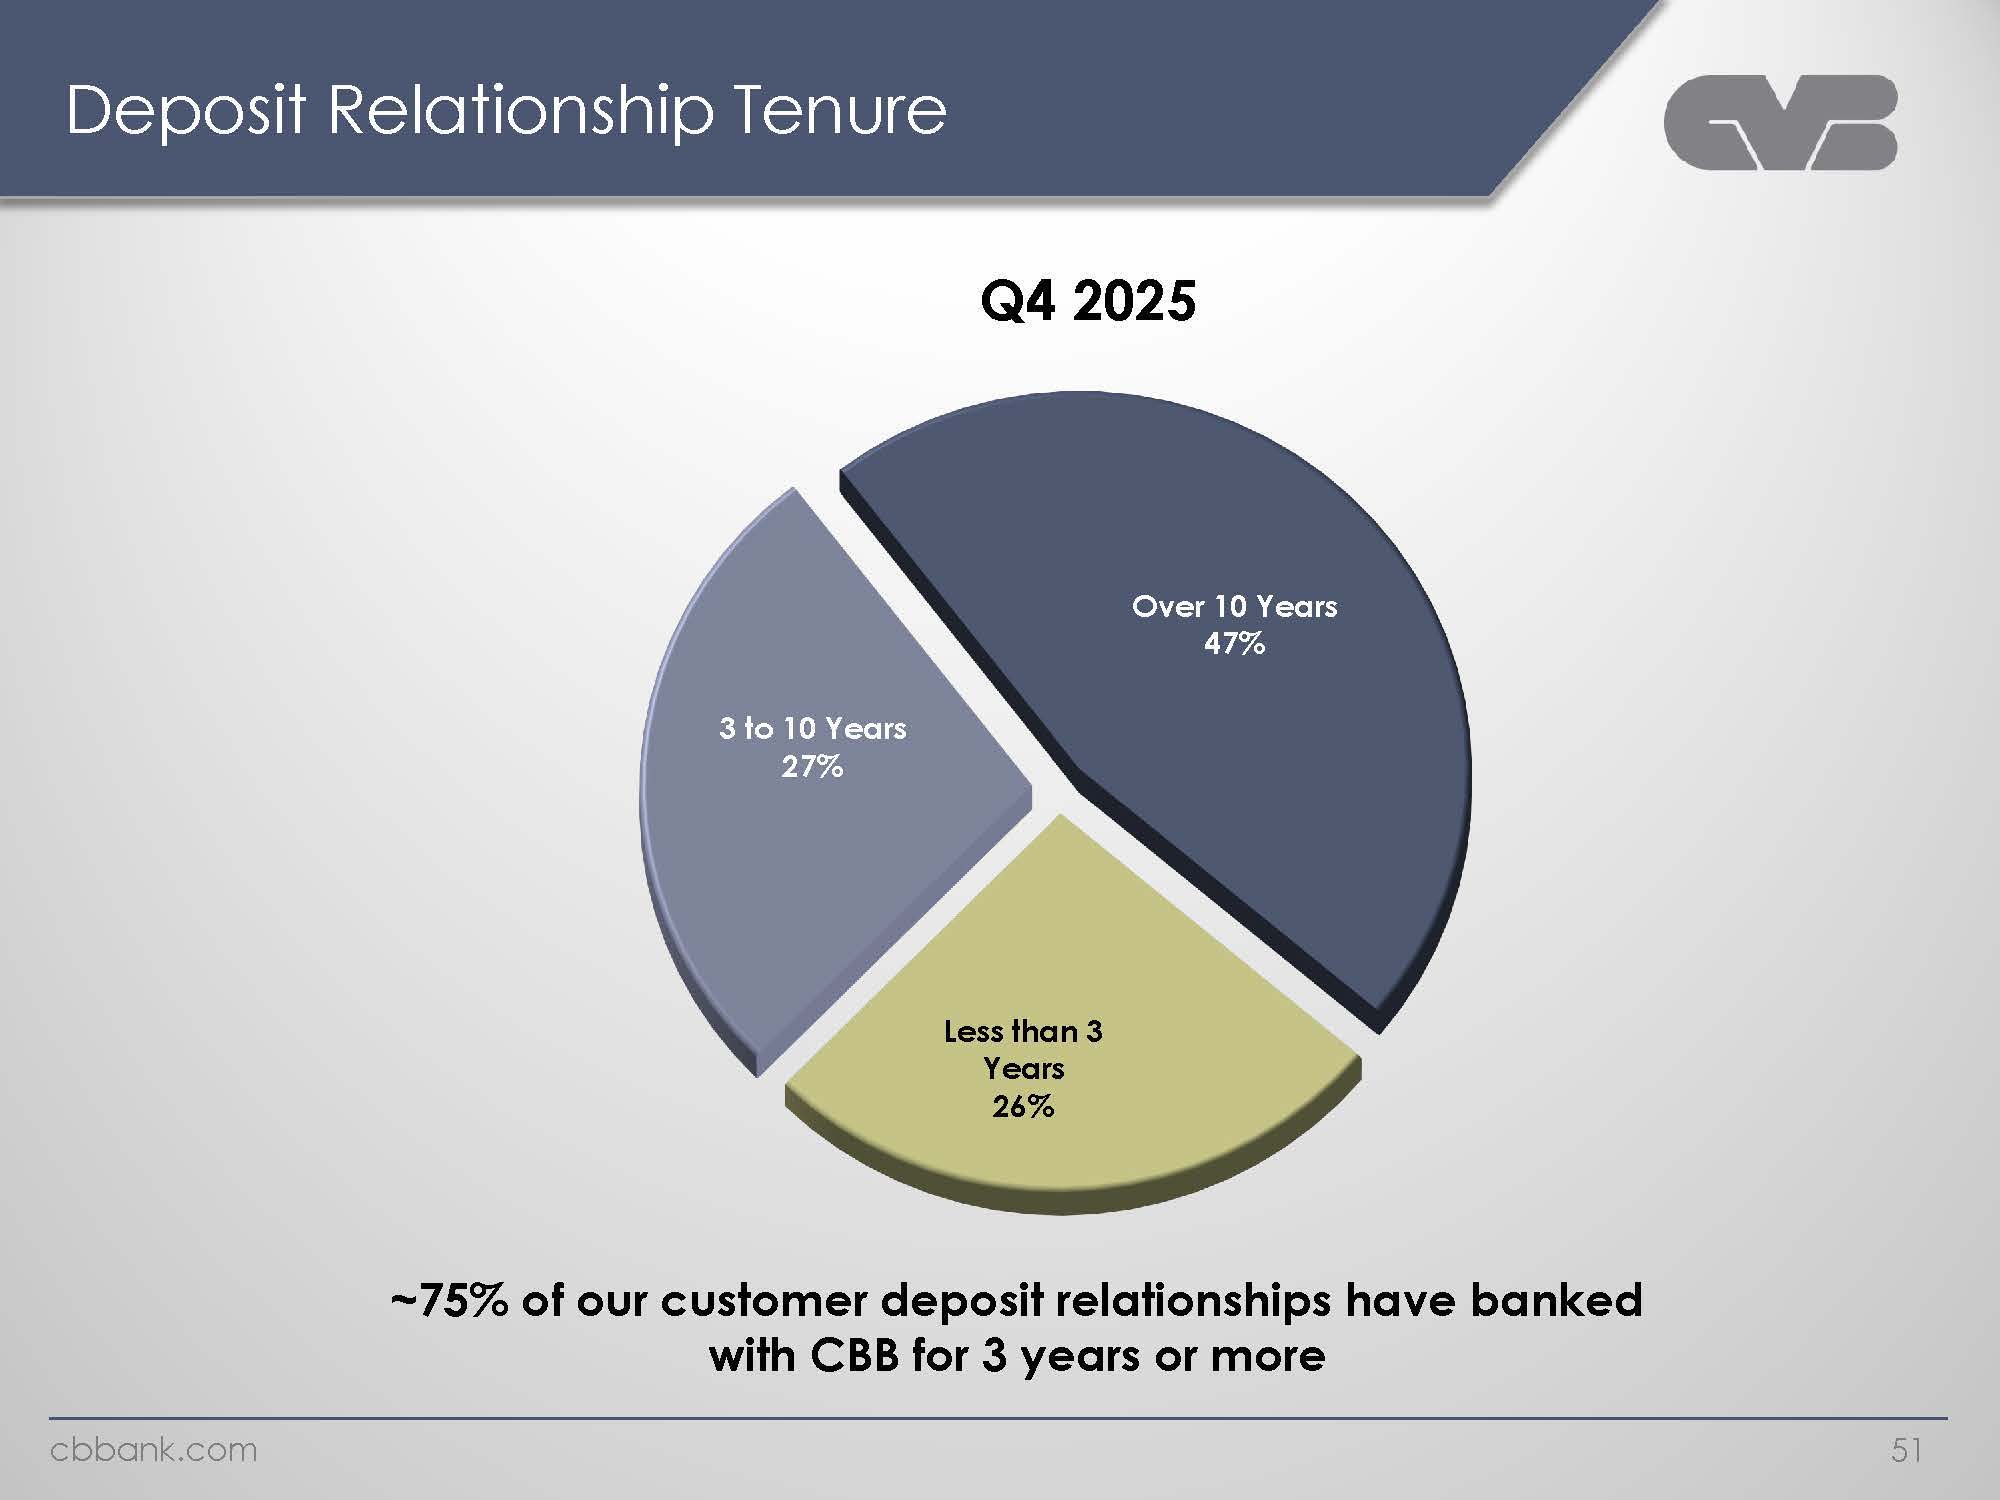
Deposit Relationship Tenure Q4 2025 3 to 10 Years 27% Less than 3 Years 26% Over 10 Years 47% -75% of our customer deposit relationships have banked with CBB for 3 years or more cbbank.com 51
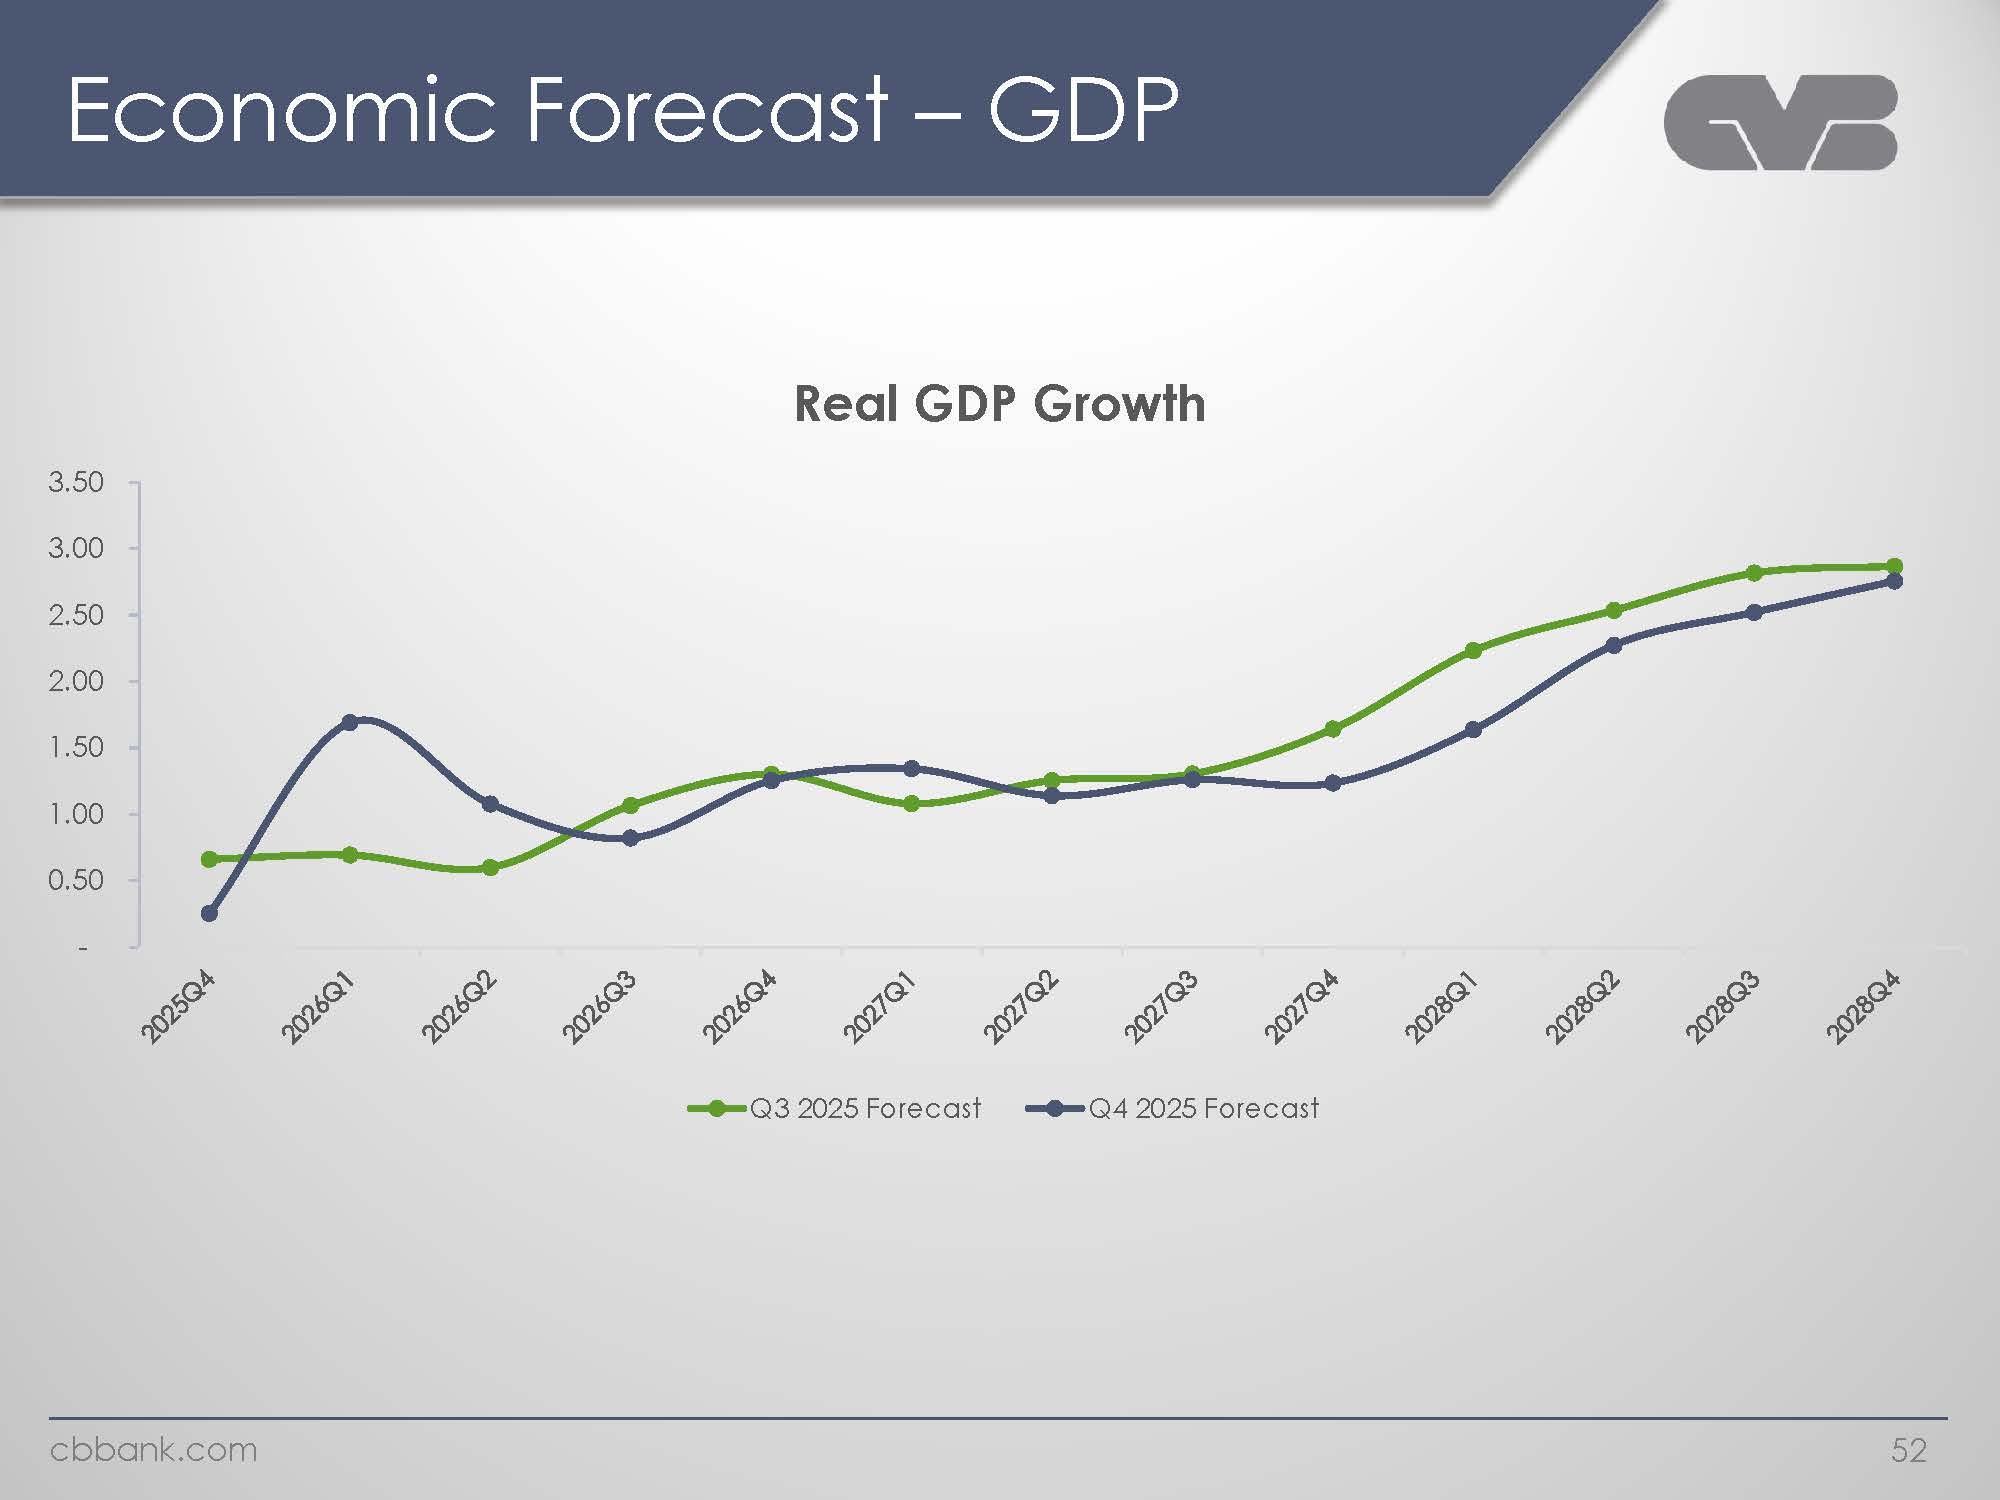
Economic Forecast – GDP Real GDP Growth 3.50 3.00 2.50 2.00 1.50 1.00 0.50 2025Q4 2026Q1 2026Q2 2026Q3 2026Q4 2027Q1 2027Q2 2027Q3 2027Q4 2028Q1 2028Q2 2028Q3 2028Q4 52
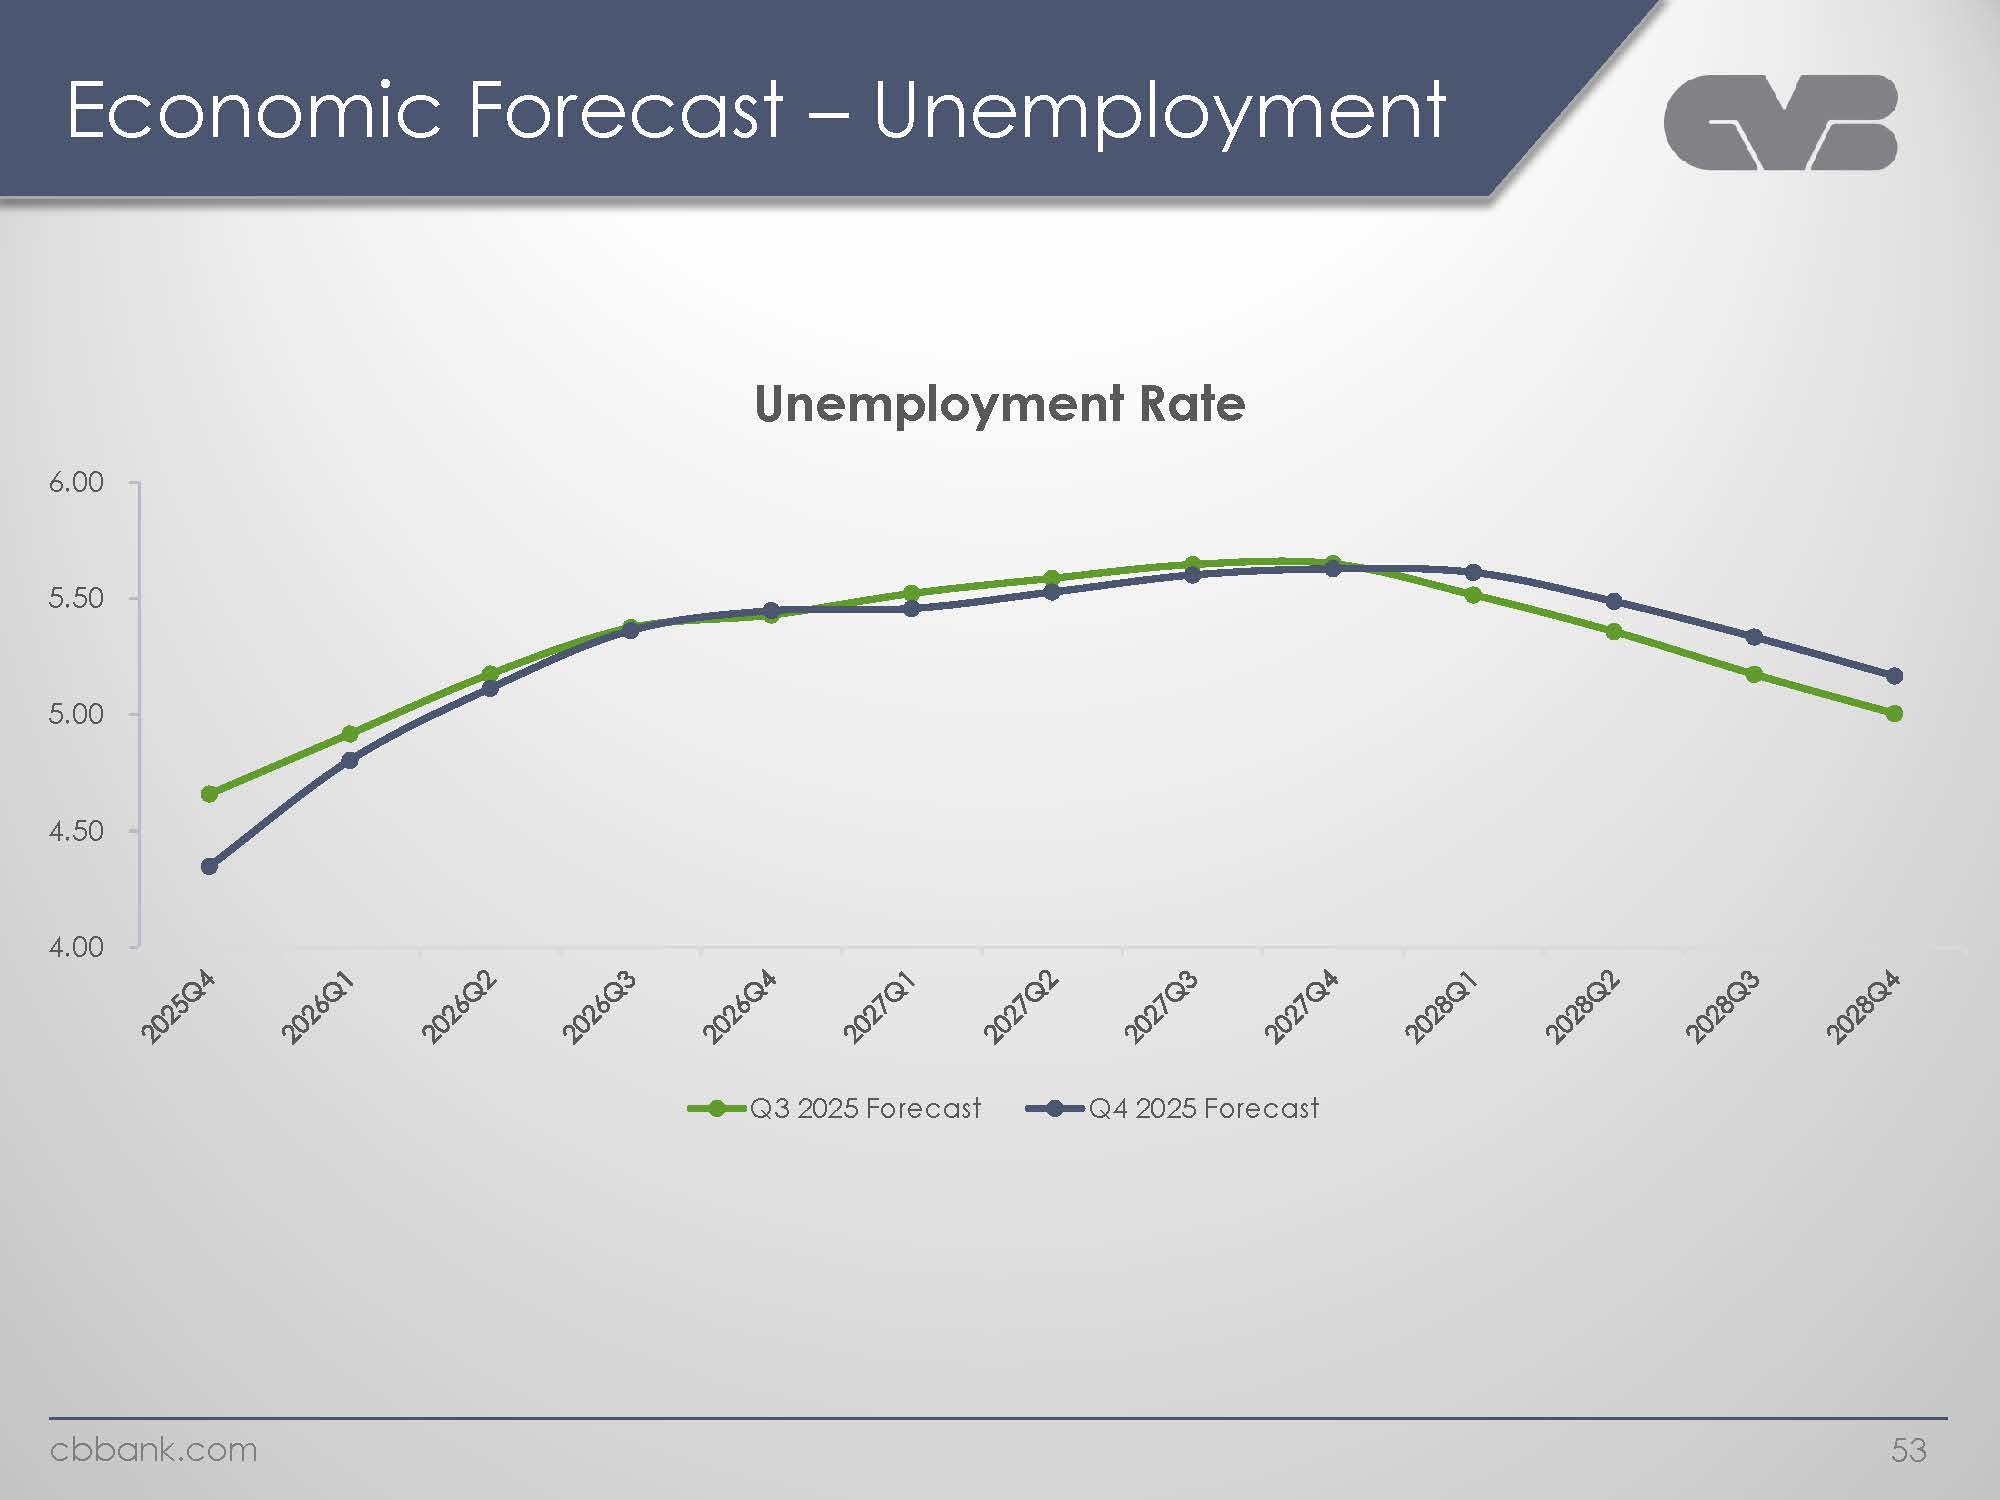
Economic Forecast – Unemployment Unemployment Rate 6.00 5.50 5.00 4.50 4.00 2025Q4 2026Q1 2026Q2 2026Q3 2026Q4 2027Q1 2027Q2 2027Q3 2027Q4 2028Q1 2028Q2 2028Q3 2028Q4 Q3 2025 forecast Q4 2025 Forecast cbbank.com 53
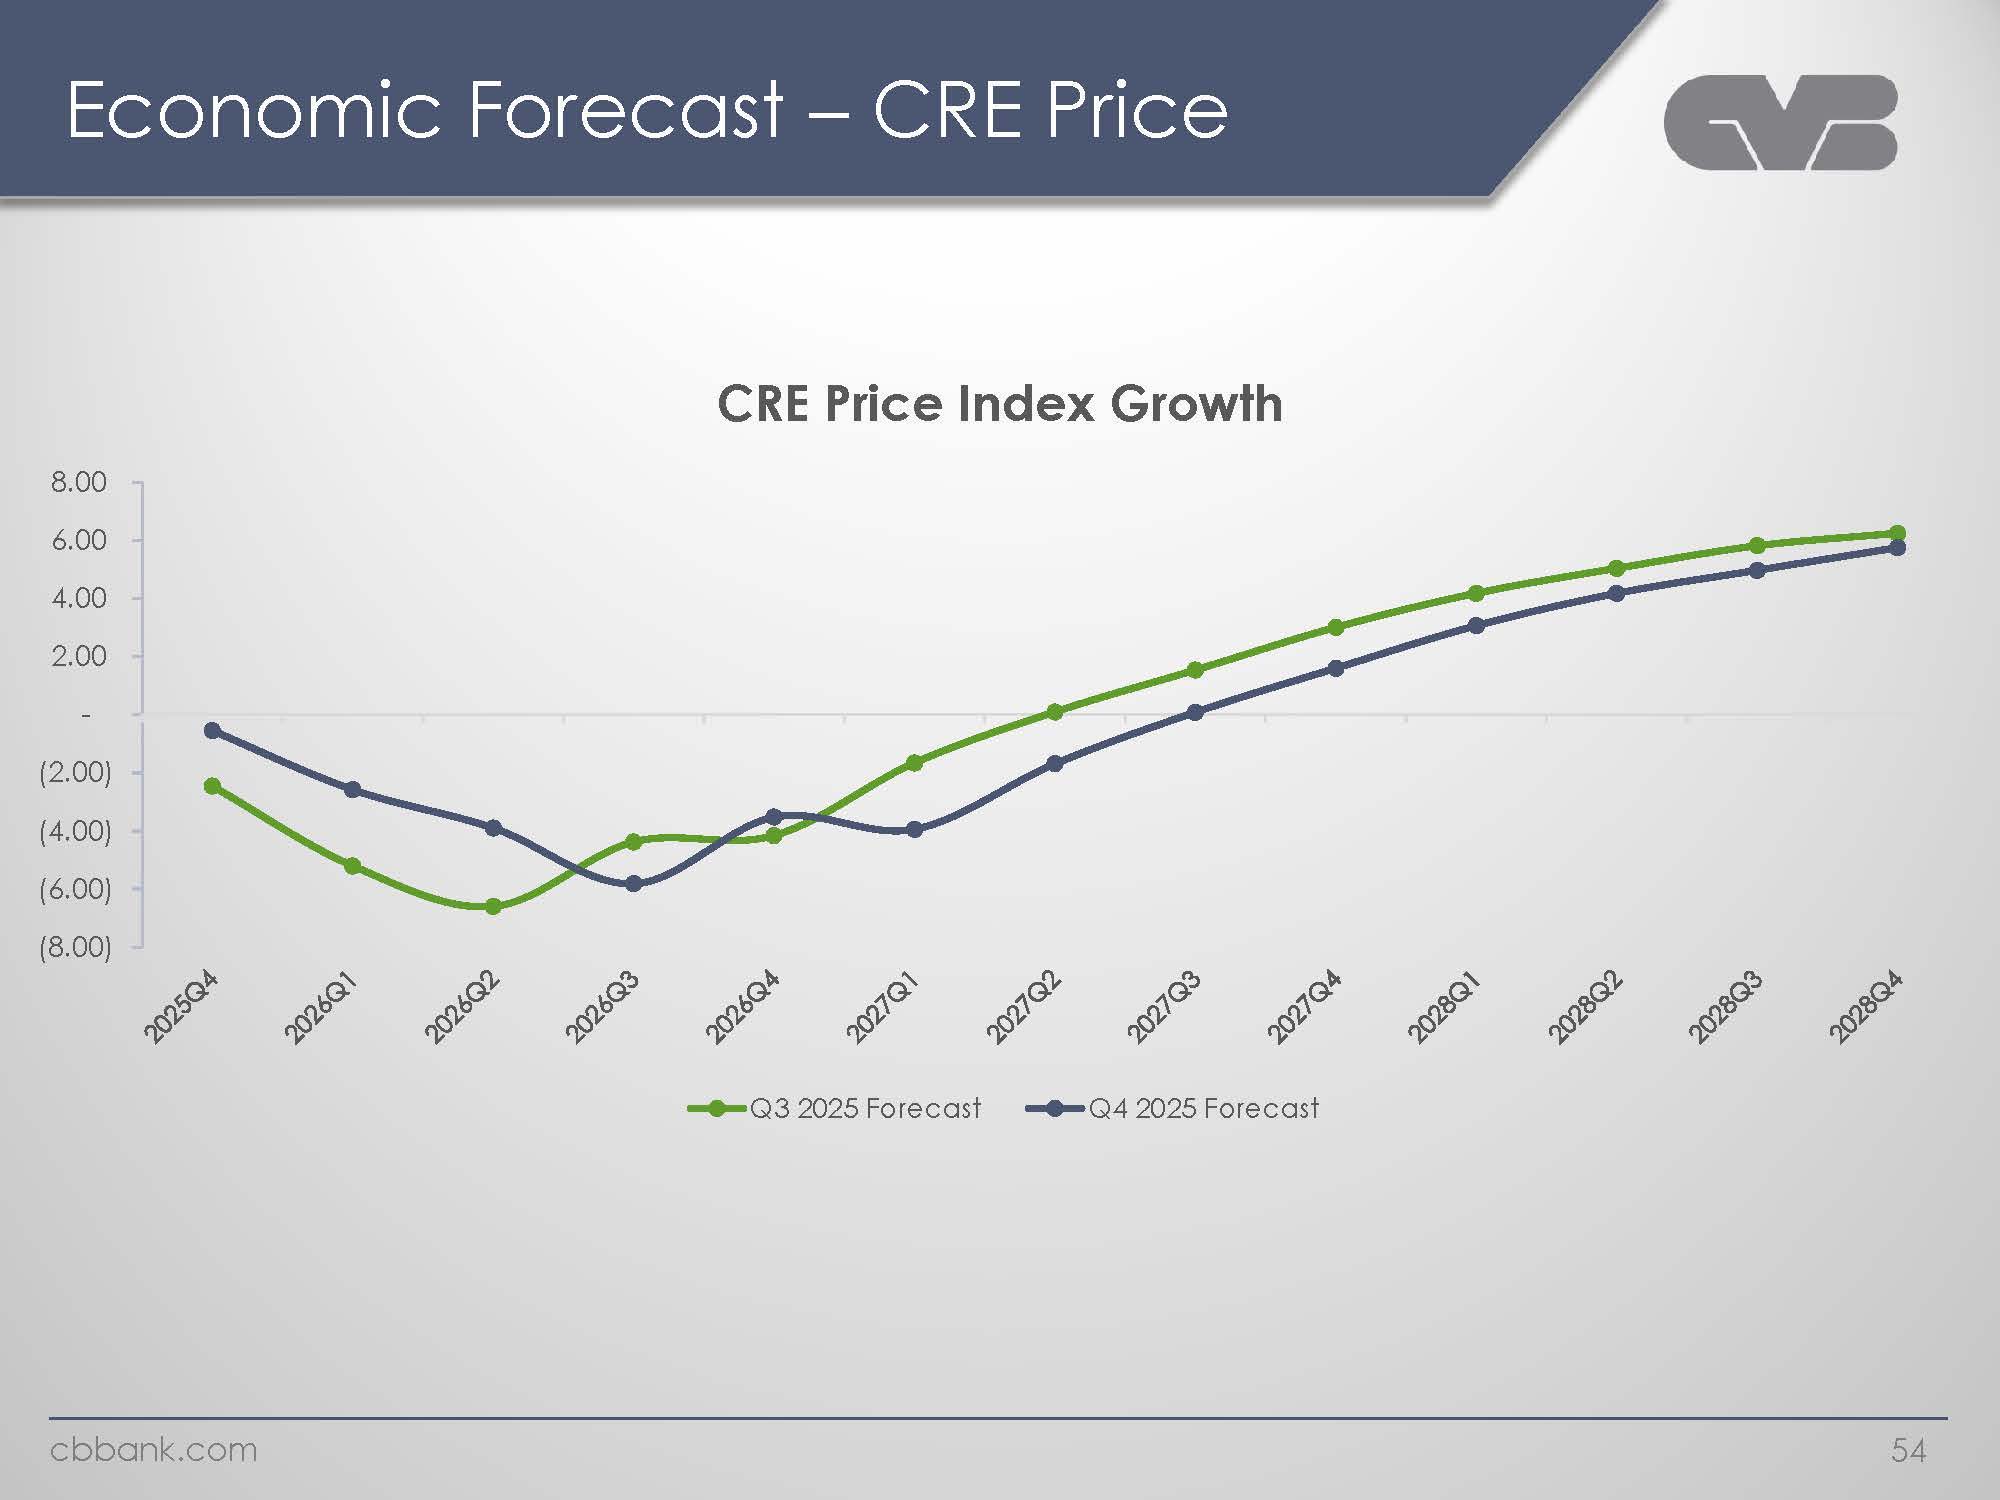
Economic Forecast – CRE Price CRE Price Index Growth 8.00 6.00 4.00 2.00 (2.00) (4.00) (6.00) (8.00) 2025Q4 2026Q1 2026Q2 2026Q3 2026Q4 2027Q1 2027Q2 2027Q3 2027Q4 2028Q1 2028Q2 2028Q3 2028Q4 Q3 2025 Forecast Q4 2025 Forecast cbbank.com 54
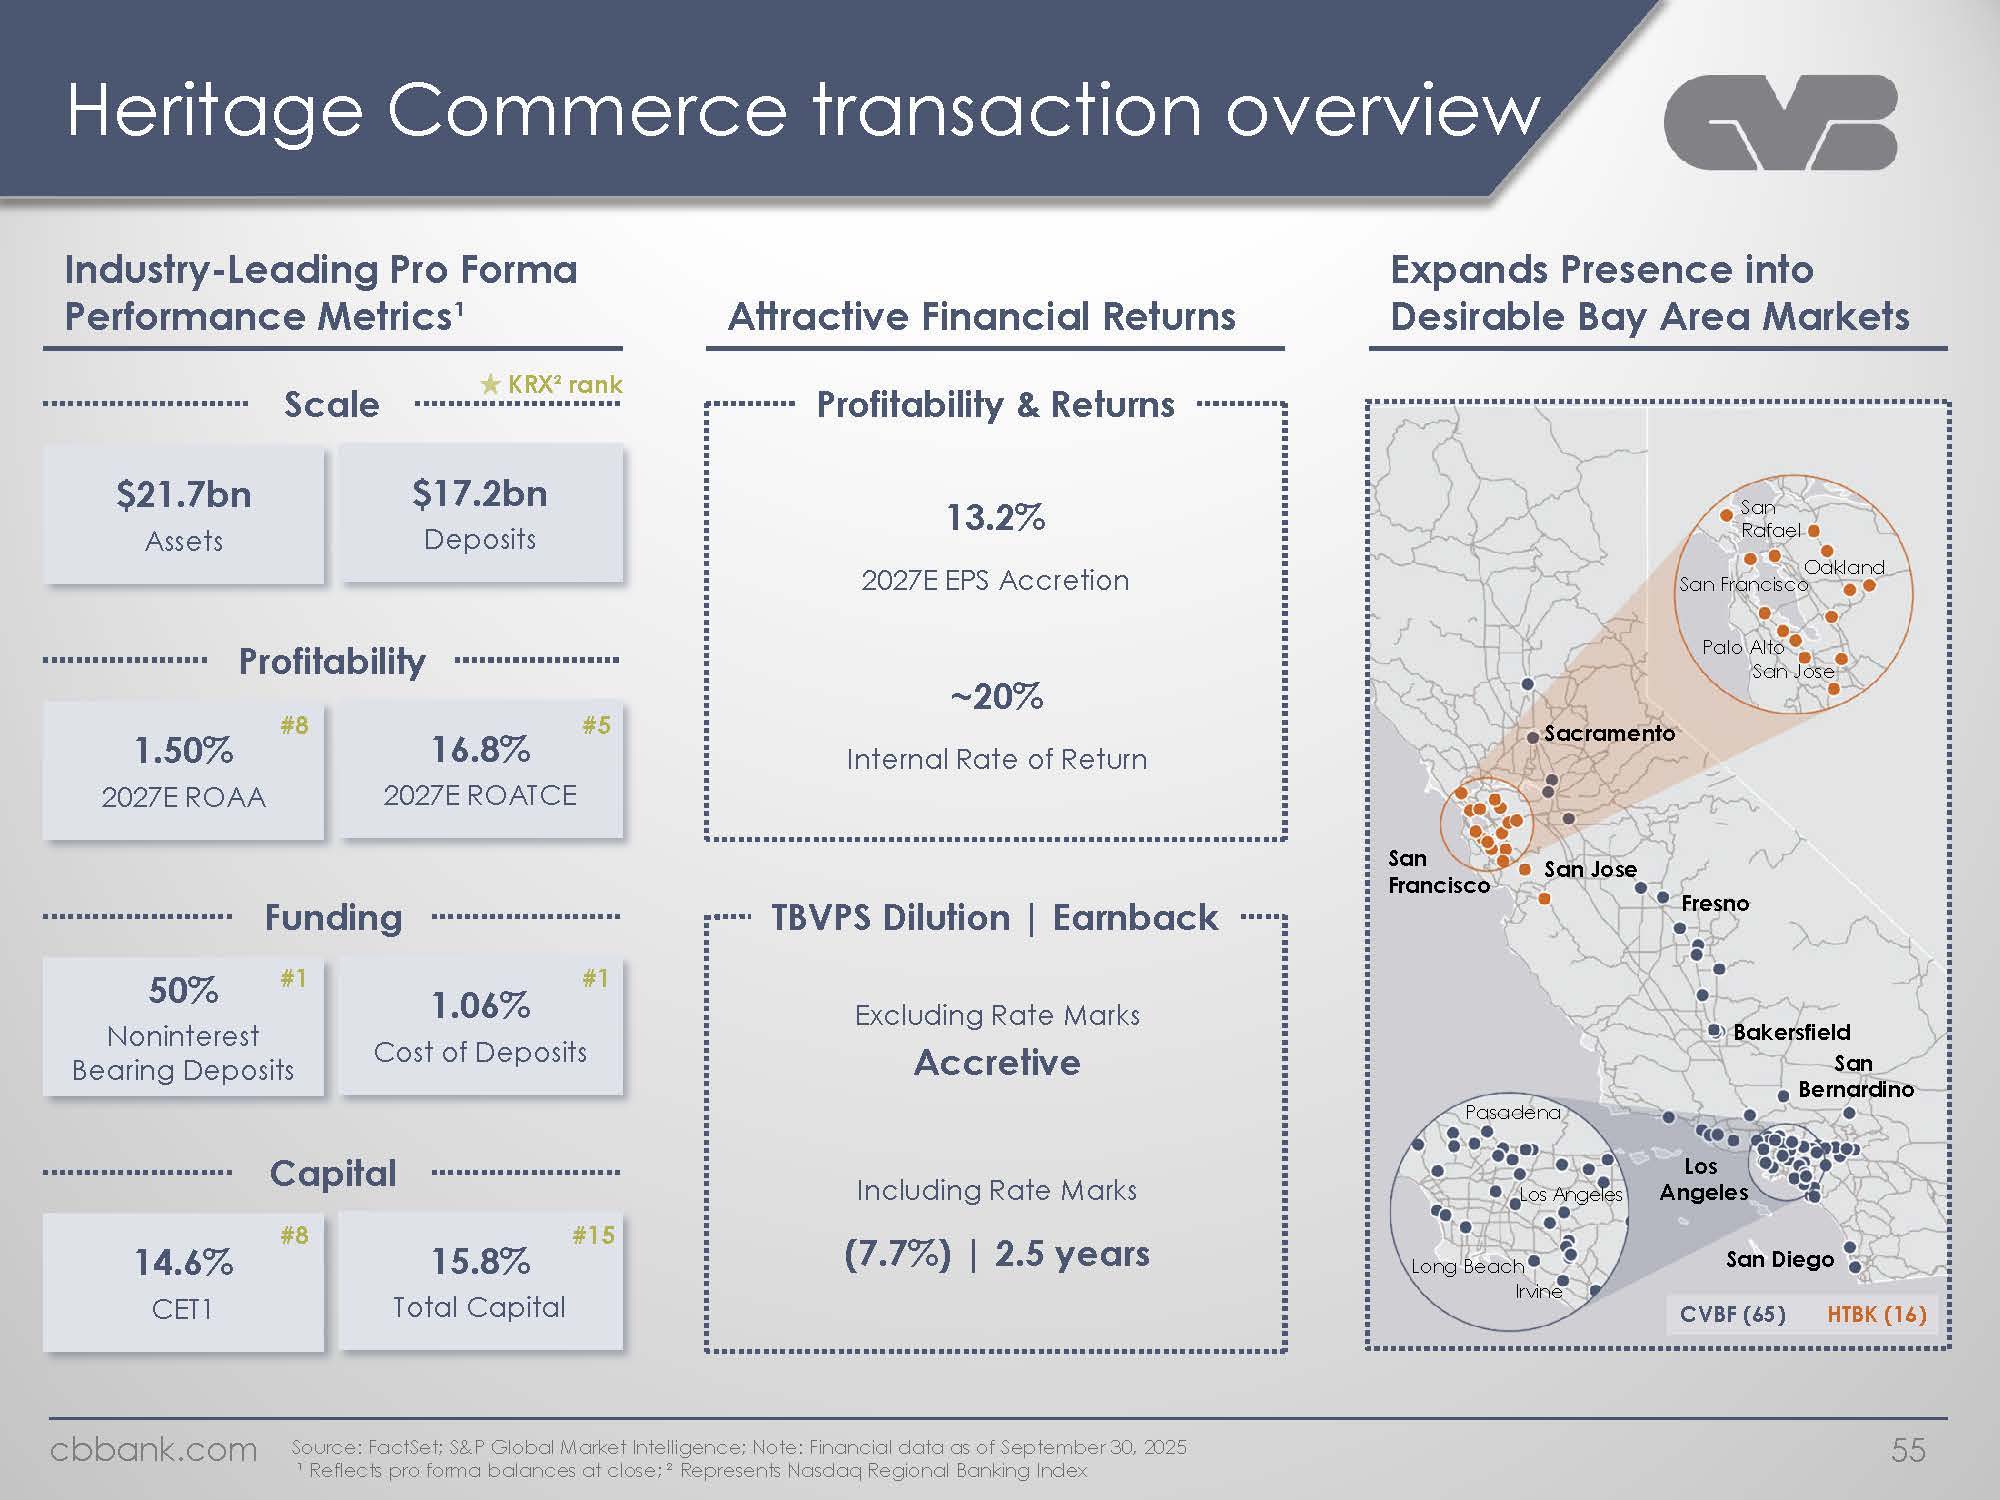
Heritage Commerce transaction overview Industry-Leading Pro Forma Performance Metrics¹ Attractive Financial Returns Expands Presence into Desirable Bay Area Markets Scale KRX² rank $21.7bn Assets $17.2bn Deposits Profitability 1.50% 2027E ROAA 16.8% 2027E ROATCE #8 #5 Funding 50% Noninterest Bearing Deposits 1.06% Cost of Deposits #1 #1 Capital 14.6% CET1 15.8% Total Capital #8 #15 Profitability & Returns 13.2% 2027E EPS Accretion ~20% Internal Rate of Return TBVPS Dilution | Earnback Excluding Rate Marks Accretive Including Rate Marks (7.7%) | 2.5 years Source: FactSet; S&P Global Market Intelligence; Note: Financial data as of September 30, 2025 ¹ Reflects pro forma balances at close; ² Represents Nasdaq Regional Banking Index Expands Presence into Desirable Bay Area Markets cbbank.com 55
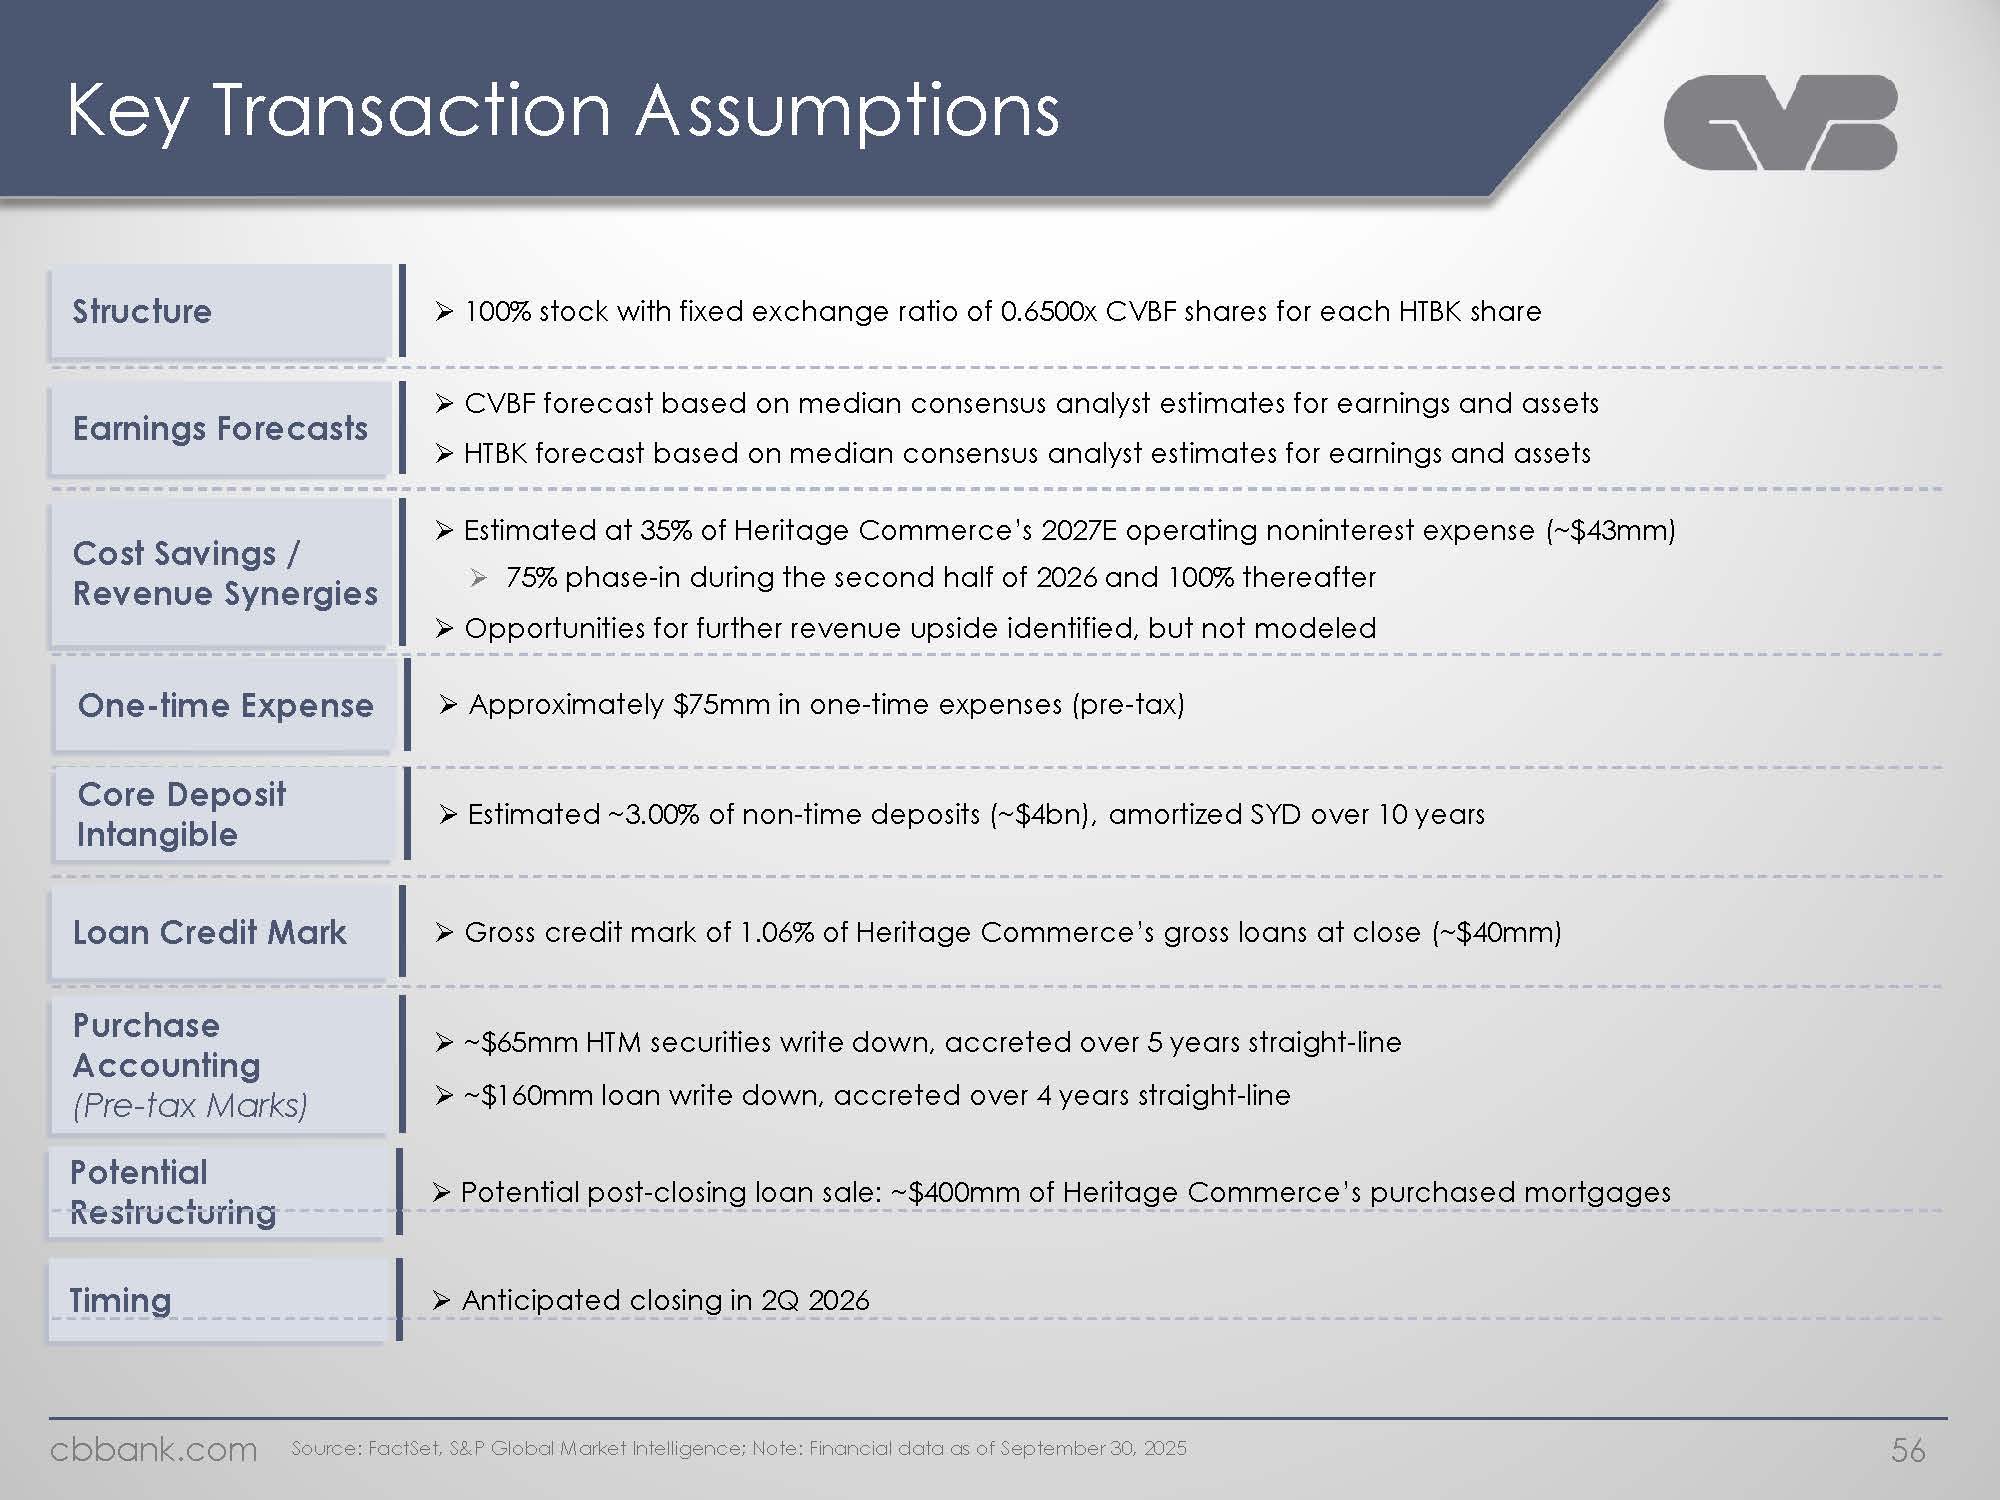
Key Transaction Assumptions Structure 100% stock with fixed exchange ratio of 0.6500x CVBF shares for each HTBK share Earnings Forecasts CVBF forecast based on median consensus analyst estimates for earnings and assets HTBK forecast based on median consensus analyst estimates for earnings and assets Cost Savings / Revenue Synergies Estimated at 35% of Heritage Commerce’s 2027E operating noninterest expense (~$43mm) 75% phase-in during the second half of 2026 and 100% thereafter Opportunities for further revenue upside identified, but not modeled One-time Expense Approximately $75mm in one-time expenses (pre-tax) Core Deposit Intangible Estimated ~3.00% of non-time deposits (~$4bn), amortized SYD over 10 years Loan Credit Mark Gross credit mark of 1.06% of Heritage Commerce’s gross loans at close (~$40mm) Purchase Accounting (Pre-tax Marks) ~$65mm HTM securities write down, accreted over 5 years straight-line~$160mm loan write down, accreted over 4 years straight-line Potential Restructuring Potential post-closing loan sale: ~$400mm of Heritage Commerce’s purchased mortgages Timing Anticipated closing in 2Q 2026 cbbank.com Source: FactSet, S&P Global Market Intelligence; Note: Financial data as of September 30, 2025 56
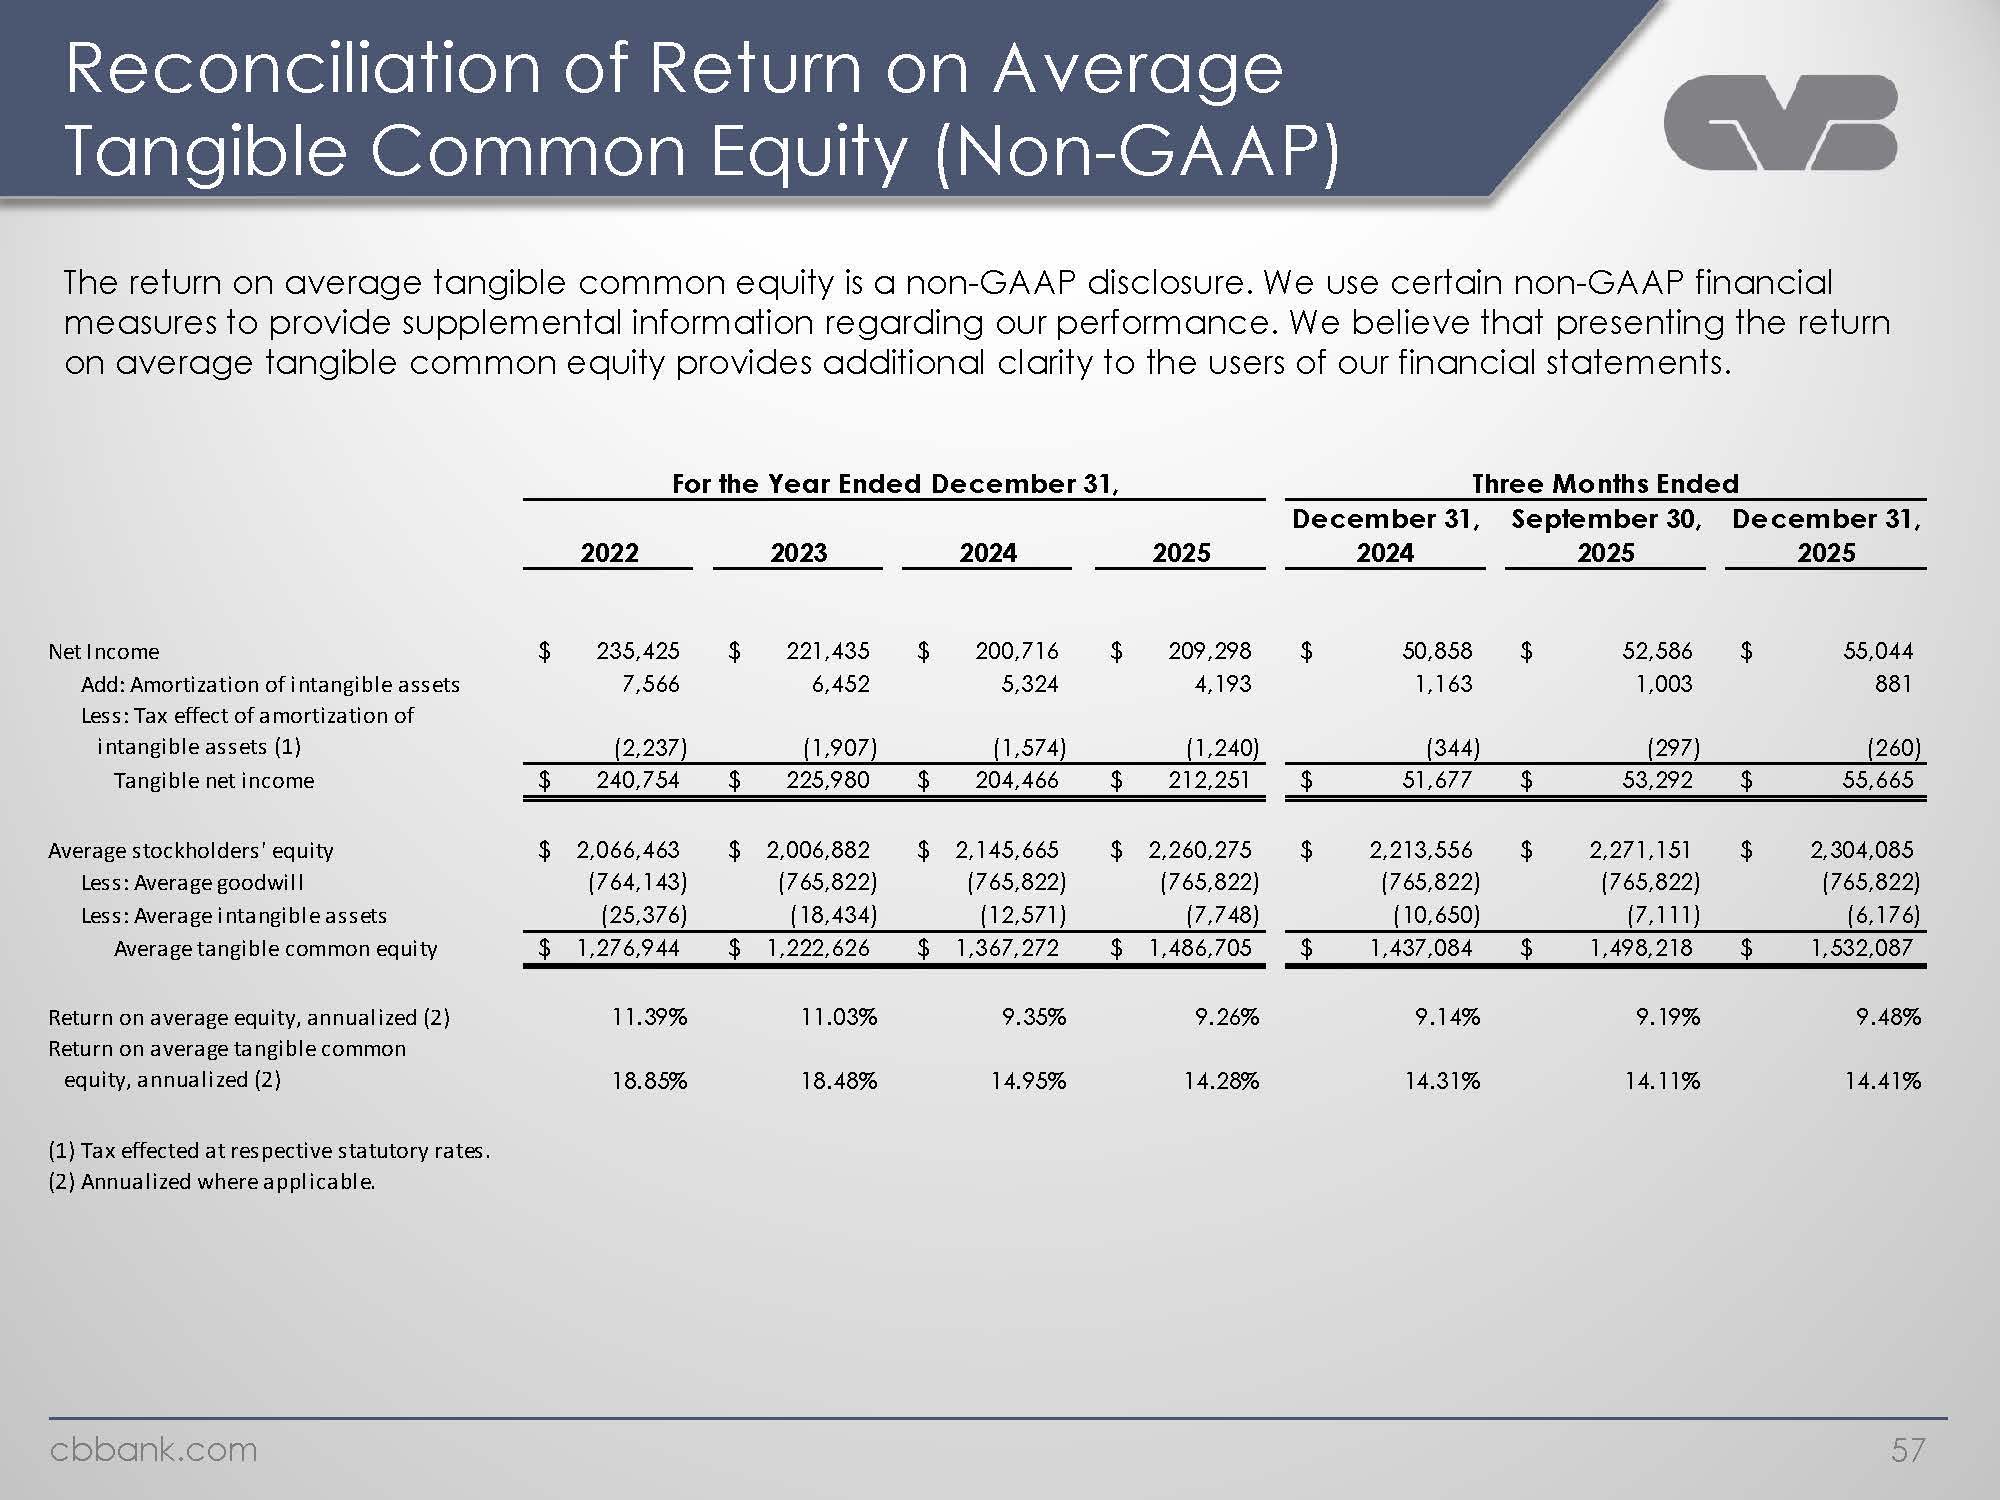
Reconciliation of Return on Average Tangible Common Equity (Non-GAAP) The return on average tangible common equity is a non-GAAP disclosure. We use certain non-GAAP financial measures to provide supplemental information regarding our performance. We believe that presenting the return on average tangible common equity provides additional clarity to the users of our financial statements. For the Year Ended December 31, Three Months Ended December 31, September 30, December 31, 2022 2023 2024 2025 2024 2025 2025 Net Income 235,425 $ 221,435 $ 200,716 $ 209,298 $ 50,858 $ 52,586 $ 55,044 $ Add: Amortization of intangible assets 7,566 6,452 5,324 4,193 1,163 1,003 881 Less: Tax effect of amortization of intangible assets (1) (2,237) (1,907) (1,574) (1,240) (344) (297) (260) Tangible net income 240,754 $ 225,980 $ 204,466 $ 212,251 $ 51,677 $ 53,292 $ 55,665 $ Average stockholders' equity 2,066,463 $ 2,006,882 $ 2,145,665 $ 2,260,275 $ 2,213,556 $ 2,271,151 $ 2,304,085 $ Less: Average goodwill (764,143) (765,822) (765,822) (765,822) (765,822) (765,822) (765,822) Less: Average intangible assets (25,376) (18,434) (12,571) (7,748) (10,650) (7,111) (6,176) Average tangible common equity 1,276,944 $ 1,222,626 $ 1,367,272 $ 1,486,705 $ 1,437,084 $ 1,498,218 $ 1,532,087 $ Return on average equity, annualized (2) 11.39% 11.03% 9.35% 9.26% 9.14% 9.19% 9.48%Return on average tangible common equity, annualized (2) 18.85% 18.48% 14.95% 14.28% 14.31% 14.11% 14.41% (1) Tax effected at respective statutory rates. (2) Annualized where applicable.57
CVB Financial Corp. Copy of presentation at www.cbbank.com