CVB Financial Corp. April 2026 cbbank.com
CVB Financial Corp. April 2026 cbbank.com
Forward Looking Statements Logo CAUTIONARY NOTE REGARDING FORWARD-LOOKING STATEMENTS This presentation contains forward-looking statements that are intended to be covered by the safe harbor for such statements provided by the Private Securities Litigation Reform Act of 1995. These statements are based on the current beliefs and expectations of the management of CVB Financial Corp. and Citizens Business Bank (collectively, the “Company”) and are subject to significant risks and uncertainties that could cause actual results or performance to differ materially from those projected. Words such as “will likely result”, “aims”, “anticipates”, “believes”, “could”, “estimates”, “expects”, “hopes”, “intends”, “may”, “plans”, “projects”, “seeks”, “should”, “will,” “strategy”, “possibility”, and variations of these words and similar expressions help to identify these forward-looking statements, which involve risks and uncertainties that could cause actual results or performance to differ materially from those projected. These forward-looking statements are based on management’s current expectations and beliefs concerning future developments and their potential effects on the Company including, without limitation, plans, strategies, goals and statements about the Company’s outlook regarding revenue and asset growth, financial performance and profitability, capital and liquidity levels, loan and deposit levels, growth and retention, yields and returns, loan diversification and credit management, stockholder value creation, tax rates, the impact of business, economic, or political developments, the impact of monetary, fiscal and trade policies, and the impact of acquisitions we have made or may make, including our recent acquisition of Heritage Commerce Corp (“Heritage”) and its principal banking subsidiary, Heritage Bank of Commerce. Such statements involve inherent risks and uncertainties, many of which are difficult to predict and are generally beyond the control of the Company, and there can be no assurance that future developments affecting the Company will be the same as those anticipated by management. The Company cautions readers that a number of important factors, in addition to those set forth below, could cause actual results to differ materially from those expressed in, or implied or projected by, such forward-looking statements. General risks and uncertainties include, but are not limited to, the following: the strength of the United States economy and the strength of the local economies in which we conduct business; the effects of, and changes in, immigration, trade, tariff, monetary, and fiscal policies and laws, including interest rate policies of the Board of Governors of the Federal Reserve System; inflation/deflation, interest rate, market and monetary fluctuations; the effect of acquisitions we have made or may make, including, without limitation, the failure to achieve the expected revenue growth and/or expense savings from such acquisitions, and/or the failure to effectively integrate an acquisition target, key personnel and customers into our operations; the timely development of competitive new products and services, and the acceptance of these products and services by potential and existing customers; the impact of changes in financial services policies, laws, and regulations, including those concerning banking, taxes, securities, and insurance, and the application thereof by regulatory agencies; the effectiveness of our risk management framework and quantitative models; changes in the level of our nonperforming assets and charge-offs; the effect of changes in accounting policies and practices or accounting standards, as may be adopted from time-to-time by bank regulatory agencies, the U.S. Securities and Exchange Commission (“SEC”), the Public Company Accounting Oversight Board, the Financial Accounting Standards Board or other accounting standards setters; possible credit related impairments or declines in the fair value of loans and securities held by us; possible impairment charges to goodwill, including any impairment that may result from increased volatility in our stock price; changes in consumer or business spending, borrowing, and savings habits; the effects of our lack of a diversified loan portfolio, including the risks of geographic and industry concentrations; periodic fluctuations in commercial or residential real estate prices or values; our ability to attract or retain deposits (including low cost deposits) or to access government or private lending facilities and other sources of liquidity; the possibility that we may reduce or discontinue the payment of dividends on our common stock; changes in the financial performance and/or condition of our borrowers or depositors; changes in the competitive environment among financial and bank holding companies and other financial service providers; technological changes in banking and financial services; systemic or non-systemic bank failures or crises; geopolitical conditions, including acts or threats of terrorism, actions taken by the United States or other governments in response to acts or threats of terrorism, and/or military conflicts, which could impact business and economic conditions in the United States and abroad; catastrophic events or natural disasters, including earthquakes, drought, climate change or extreme weather events that may affect our assets, communications or computer services, customers, employees or third party vendors; public health crises and pandemics, and their effects on the economic and business environments in which we operate, including on our asset credit quality, business operations, and employees, as well as the impact on general economic and financial market conditions; cybersecurity threats and fraud and the costs of defending against them, including the costs of compliance with legislation or regulations to combat fraud and cybersecurity threats; our ability to recruit and retain key executives, board members and other employees, and our ability to comply with federal and state employment laws and regulations; ongoing or unanticipated regulatory or legal proceedings or outcomes; risks associated with our recently completed merger with Heritage, including difficulties and delays in integrating or retaining Heritage’s business, key personnel and customers, and achieving anticipated synergies, cost savings enhanced geographic coverage and other benefits from the transaction; and our ability to manage the risks involved in the foregoing. Additional factors that could cause actual results to differ materially from those expressed in the forward-looking statements are discussed in the Company's 2025 Annual Report on Form 10-K filed with the SEC and available at the SEC’s Internet site (http://www.sec.gov). The Company does not undertake, and specifically disclaims any obligation, to update any forward-looking statements to reflect occurrences or unanticipated events or circumstances after the date of such statements, except as required by law. Any statements about future operating results, such as those concerning accretion and dilution to the Company’s earnings, equity, or shareholder returns, are for illustrative purposes only, are not forecasts, and actual results may differ. Non-GAAP Financial Measures — Certain financial information provided in this earnings release has not been prepared in accordance with U.S. generally accepted accounting principles (“GAAP”) and is presented on a non-GAAP basis. Investors and analysts should refer to the reconciliations included in this earnings release and should consider the Company’s non-GAAP measures in addition to, not as a substitute for or as superior to, measures prepared in accordance with GAAP. These non-GAAP measures may or may not be comparable to similarly titled measures used by other companies. cbank.com 2
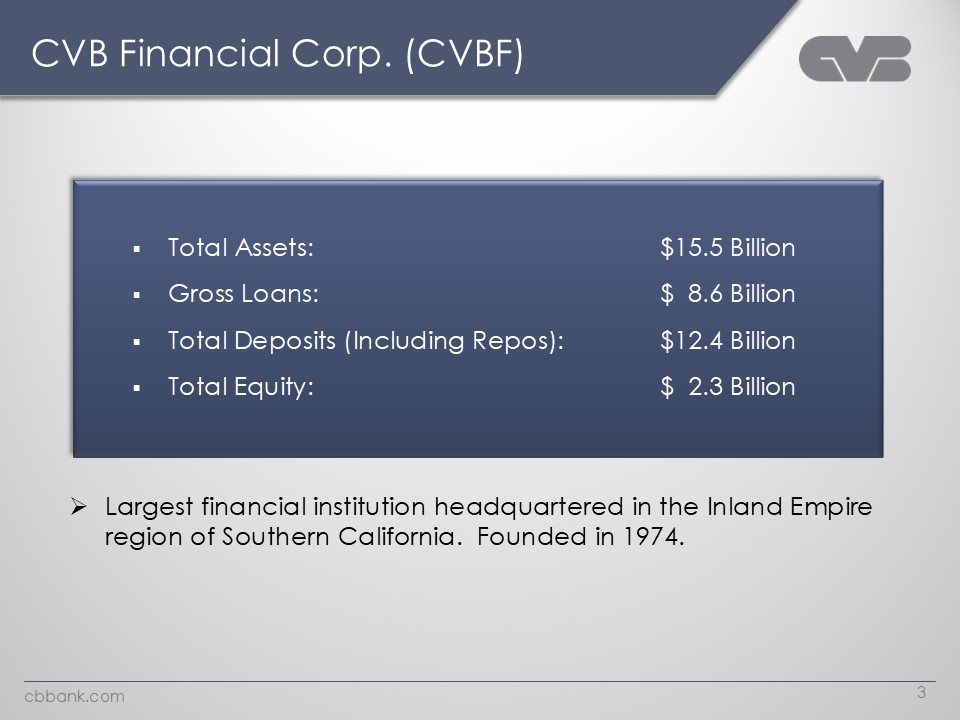
CVB Financial Corp. (CVBF) Logo Total Assets: $15.5 Billion Gross Loans: $ 8.6 Billion Total Deposits (Including Repos): $12.4 Billion Total Equity: $ 2.3 Billion Largest financial institution headquartered in the Inland Empire region of Southern California. Founded in 1974. cbank.com 3
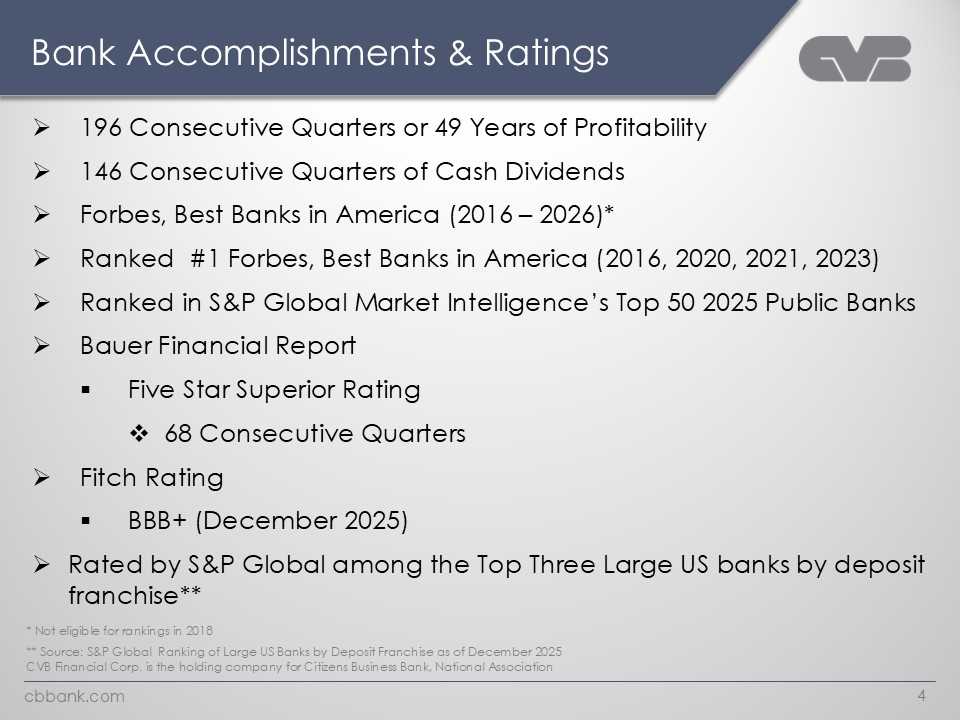
Bank Accomplishments & Ratings Logo 196 Consecutive Quarters or 49 Years of Profitability 146 Consecutive Quarters of Cash Dividends Forbes, Best Banks in America (2016 – 2026)* Ranked #1 Forbes, Best Banks in America (2016, 2020, 2021, 2023) Ranked in S&P Global Market Intelligence’s Top 50 2025 Public Banks Bauer Financial Report Five Star Superior Rating 68 Consecutive Quarters Fitch Rating BBB+ (December 2025) Rated by S&P Global among the Top Three Large US banks by deposit franchise** * Not eligible for rankings in 2018 ** Source: S&P Global Ranking of Large US Banks by Deposit Franchise as of December 2025 CVB Financial Corp. is the holding company for Citizens Business Bank, National Association cbank.com 4
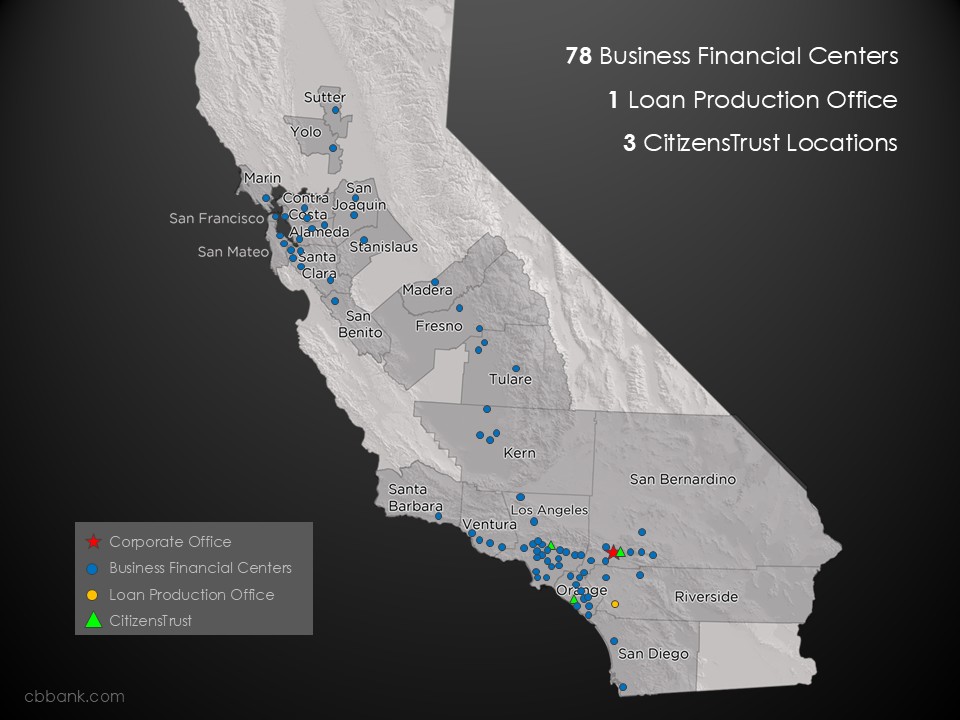
78 Business Financial Centers 1 Loan Production Office 3 CitizensTrust Locations Map Corporate Office Business Financial Centers Loan Production Office CitizensTrust cbank.com
Our Vision Logo Citizens Business Bank will strive to become the premier financial services company operating throughout the state of California, servicing the comprehensive financial needs of successful small to medium sized businesses and their owners. cbank.com 6
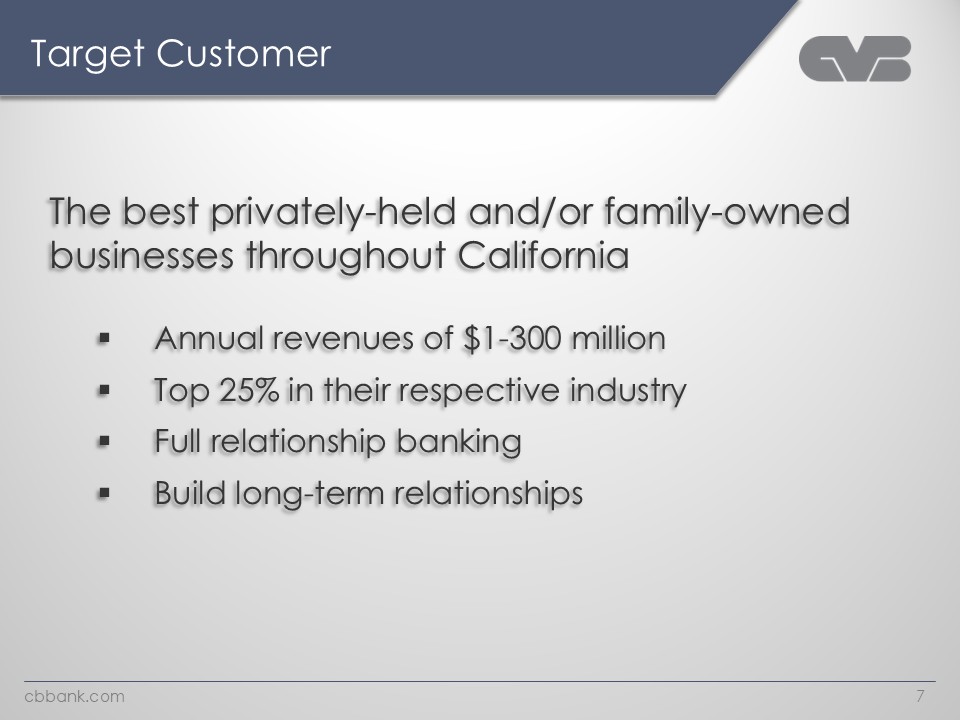
Target Customer Logo The best privately-held and/or family-owned businesses throughout California Annual revenues of $1-300 million Top 25% in their respective industry Full relationship banking Build long-term relationships cbank.com 7
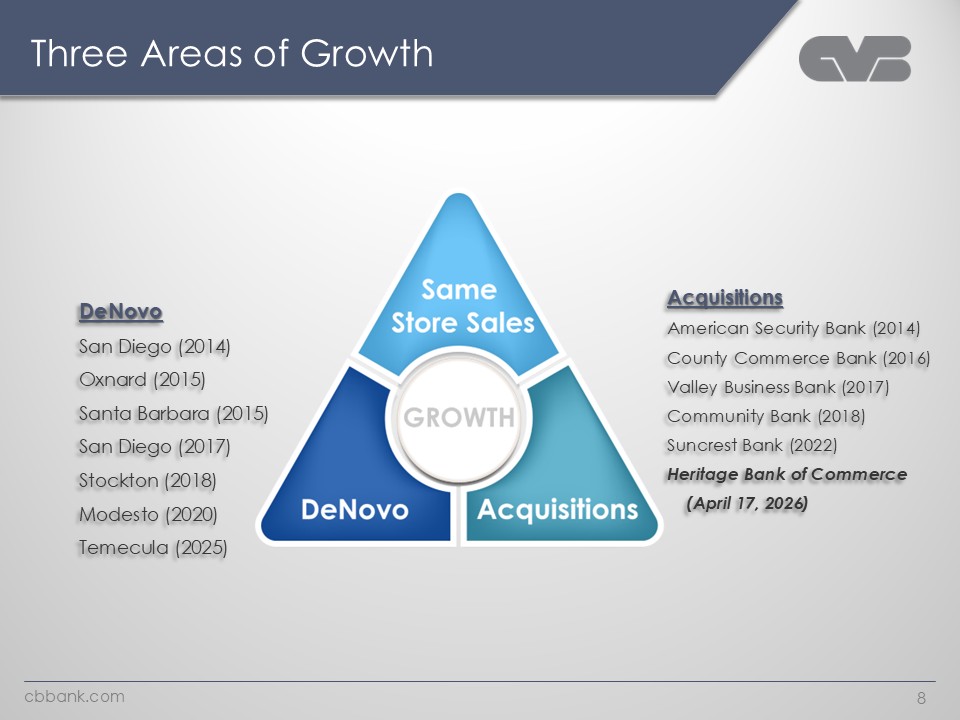
Three Areas of Growth Logo DeNovo San Diego (2014) Oxnard (2015) Santa Barbara (2015) San Diego (2017) Stockton (2018) Modesto (2020) Temecula (2025) Same Store Sales Growth DeNovo Acquisitions Acquisitions American Security Bank (2014) County Commerce Bank (2016) Valley Business Bank (2017) Community Bank (2018) Suncrest Bank (2022) Heritage Bank of Commerce (April 17, 2026) cbank.com 8
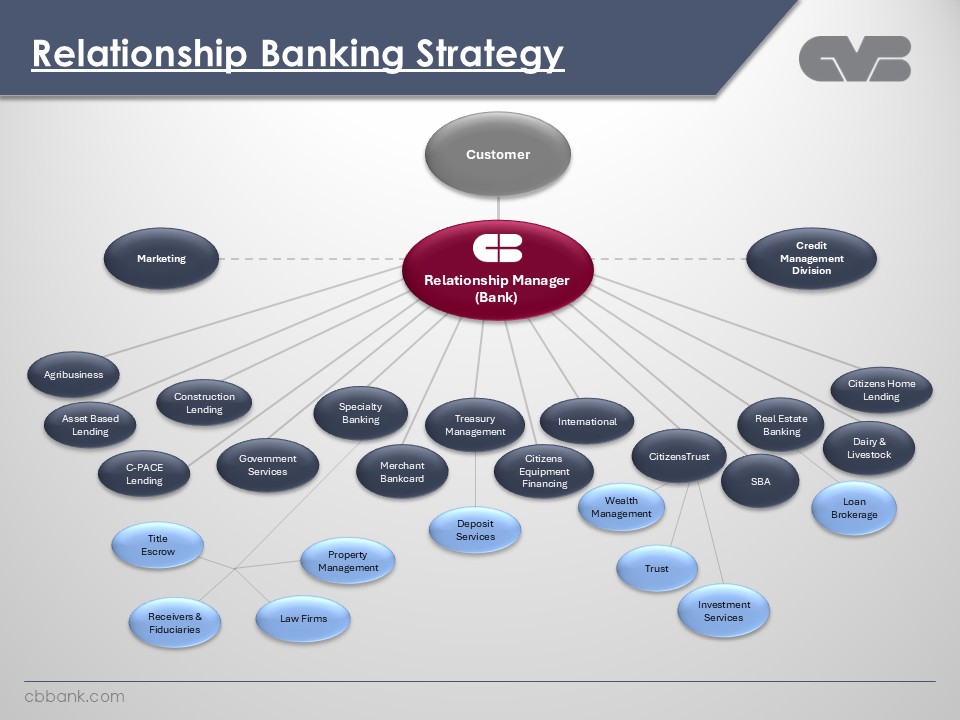
Relationship Banking Strategy Logo Customer Marketing Relationship Manager (Bank) Credit Management Division Agribusiness Asset Based Lending Construction Lending C-PACE Lending Government Services Specialty Banking Merchant Bankcard Treasury Management Citizens Equipment Financing International CitizensTrust SBA Real Estate Banking Dairy & Livestock Citizens Home Lending Title Escrow Receivers & Fiduciaries Law Firms Property Management Deposit Services Wealth Management Trust Investment Services Loan Brokerage cbank.com
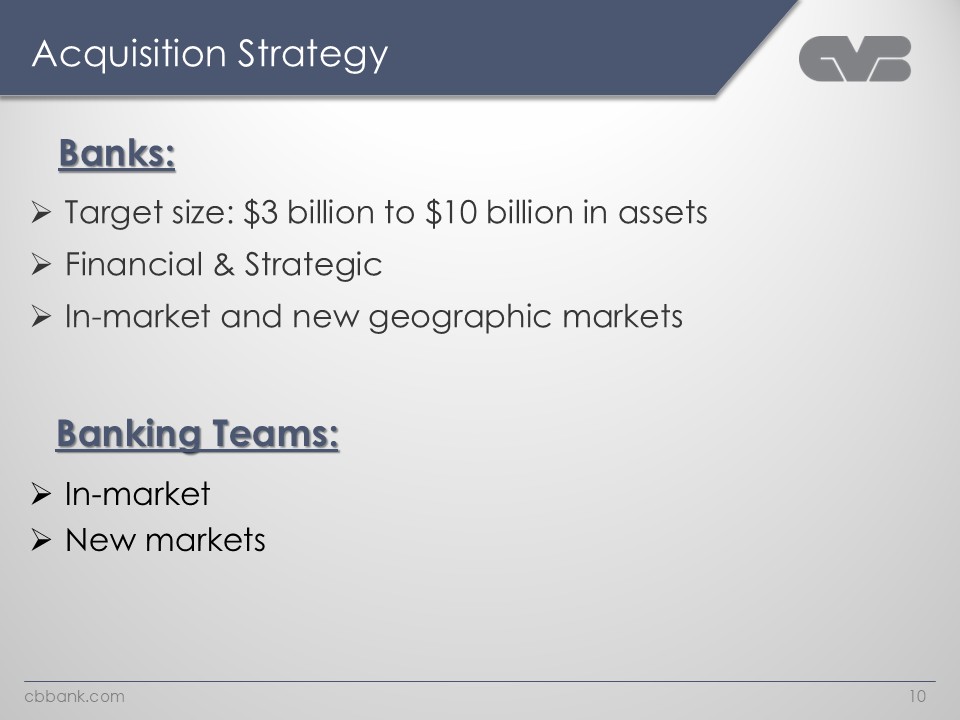
Acquisition Strategy Logo Banks: Target size: $3 billion to $10 billion in assets Financial & Strategic In-market and new geographic markets Banking Teams: In-market New markets cbank.com 10
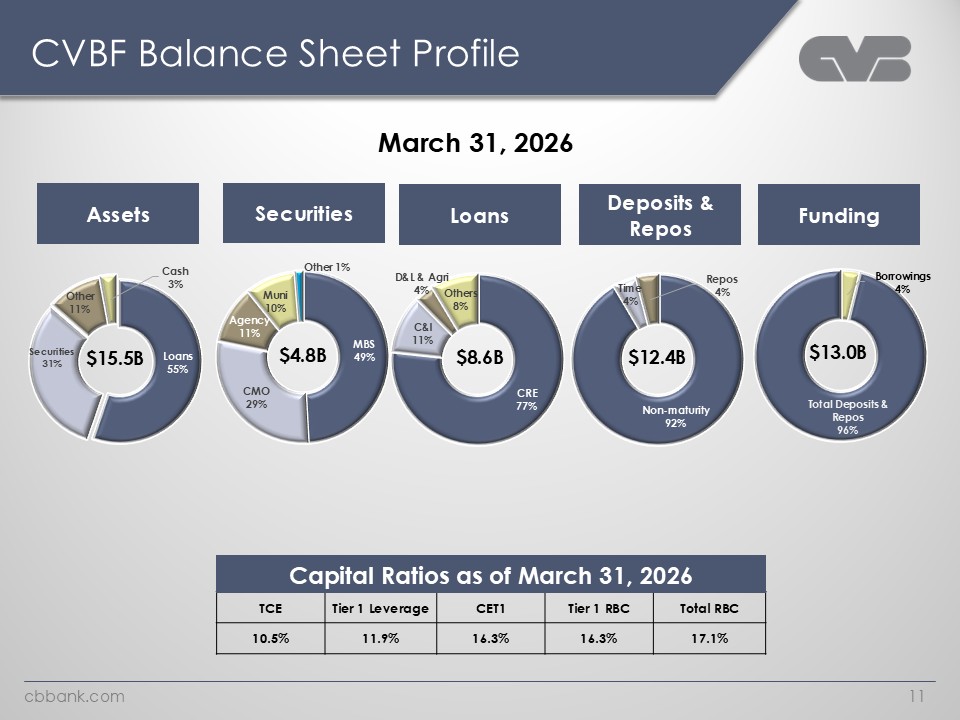
CVBF Balance Sheet Profile March 31, 2026 Assets Secuities Loans Deposits & Funding Other 11% Cash 3% Securities 31% $15.5B Loans 55% Other 1% Muni 10% Agency 11% CMO 29% $4.8B MBS 49% D&L Agri 4% C&I 11% $8.6B CRE 77% Time 4% $12.4B Non-maturity 92% Borrowings $13.0B Total Deposits & Repos 96% Capital Ratios as of March 31, 2026 TCE Tier 1 Leverage CET1 Tier 1 RBC Total RBC 10.5% 11.9% 16.3% 16.3% 17.1% Cbbank. Com 11
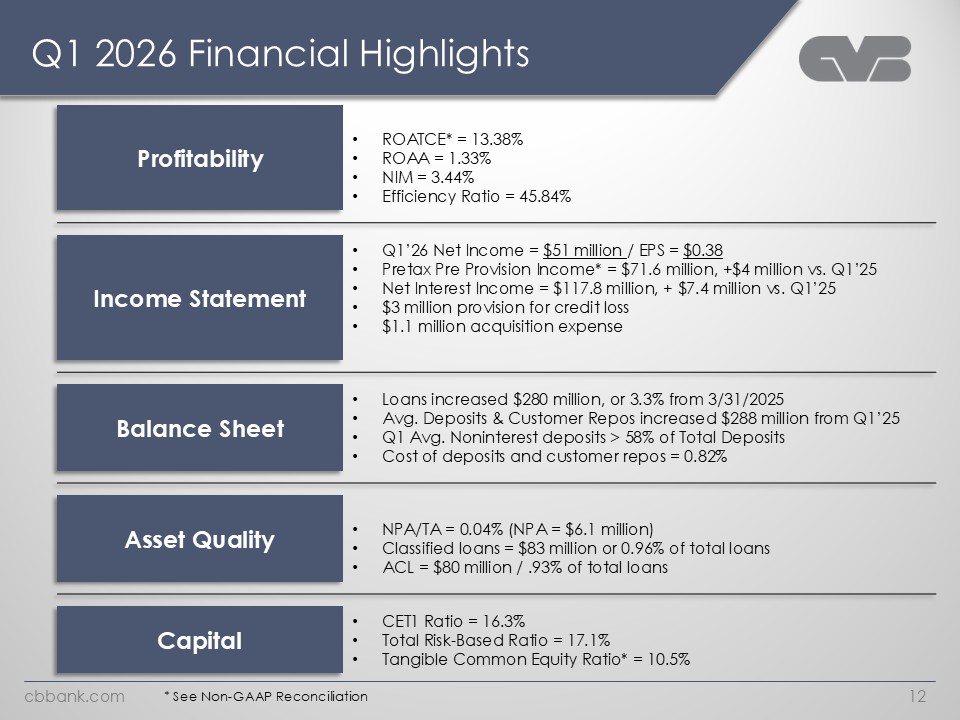
Q1 2026 Financial Highlights Profitabilit ROATCE* = 13.38% ROAA = 1.33% NIM = 3.44% Efficiency Ratio = 45.84% Income Statement Q1’26 Net Income = $51 million / EPS = $0.38 Pretax Pre Provision Income* = $71.6 million, +$4 million vs. Q1’25 Net Interest Income = $117.8 million, + $7.4 million vs. Q1’25 $3 million provision for credit loss $1.1 million acquisition expense Balance Sheet Loans increased $280 million, or 3.3% from 3/31/2025 Avg. Deposits & Customer Repos increased $288 million from Q1’25 Q1 Avg. Noninterest deposits > 58% of Total Deposits Cost of deposits and customer repos = 0.82% Asset Quality NPA/TA = 0.04% (NPA = $6.1 million) Classified loans = $83 million or 0.96% of total loans ACL = $80 million / .93% of total loans Asset Quality NPA/TA = 0.04% (NPA = $6.1 million) Classified loans = $83 million or 0.96% of total loans ACL = $80 million / .93% of total loans Capital CET1 Ratio = 16.3% Total Risk-Based Ratio = 17.1% Tangible Common Equity Ratio* = 10.5% cbbank.com *See Non-GAAP Reconciliation 12
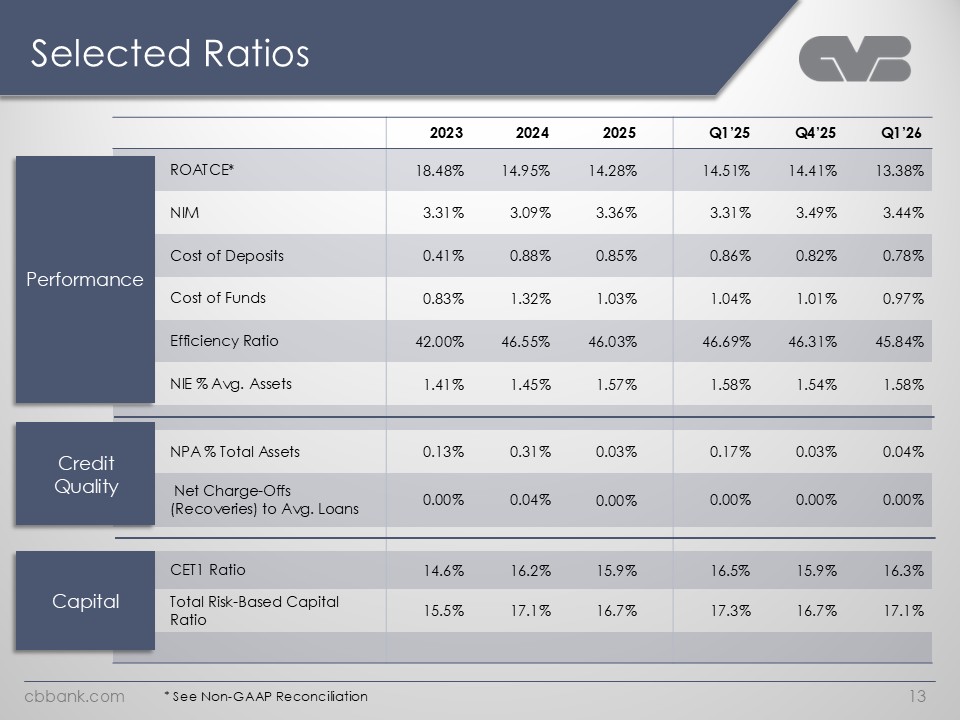
Selected Ratios Performance 2023 2024 2025 Q1’25 Q4’25 Q1’26 ROATCE* 18.48% 14.95% 14.28% 14.51% 14.41% 13.38% NIM 3.31% 3.09% 3.36% 3.31% 3.49% 3.44% Cost of Deposits 0.41% 0.88% 0.85% 0.86% 0.82% 0.78% Cost of Funds 0.83% 1.32% 1.03% 1.04% 1.01% 0.97% Efficiency Ratio 42.00% 46.55% 46.03% 46.69% 46.31% 45.84% NIE % Avg. Assets 1.41% 1.45% 1.57% 1.58% 1.54% 1.58% Credit Quality NPA % Total Assets 0.13% 0.31% 0.03% 0.17% 0.03% 0.04% Net Charge-Offs (Recoveries) to Avg. Loans 0.00% 0.04% 0.00% 0.00% 0.00% 0.00% Capital CET1 Ratio 14.6% 16.2% 15.9% 16.5% 15.9% 16.3% Total Risk-Based Capital Ratio 15.5% 17.1% 16.7% 17.3% 16.7% 17.1% * See Non-GAAP Reconciliation cbbank.com 13
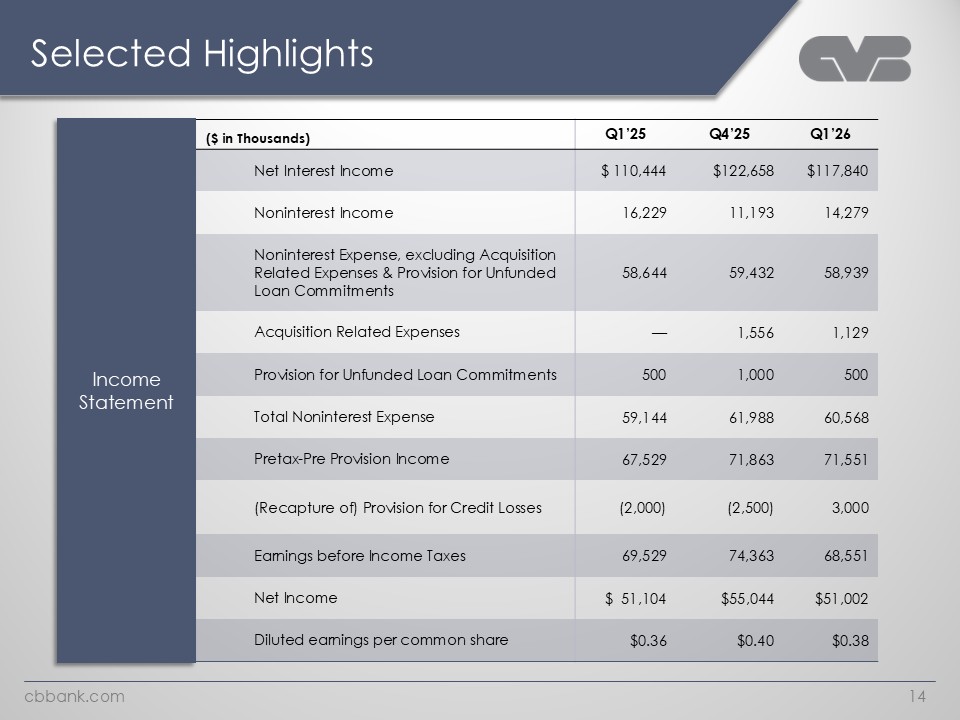
Selected Highlights ($ in Thousands) Net Interest Income Q1’25 Q4’25 Q1’26 $ 110,444 Noninterest Income Noninterest Expense, excluding Acquisition Related Expenses & Provision for Unfunded Loan Commitments 16,229 $122,658 11,193 $117,840 14,279 58,644 Acquisition Related Expenses Income Statement Provision for Unfunded Loan Commitments — 59,432 1,556 58,939 1,129 Total Noninterest Expense Pretax-Pre Provision Income 500 59,144 1,000 61,988 500 60,568 67,529 (Recapture of) Provision for Credit Losses Earnings before Income Taxes (2,000) 71,863 (2,500) 71,551 3,000 69,529 Net Income Diluted earnings per common share $ 51,104 $0.36 74,363 $55,044 $0.40 68,551 $51,002 $0.38 cbbank.com 14
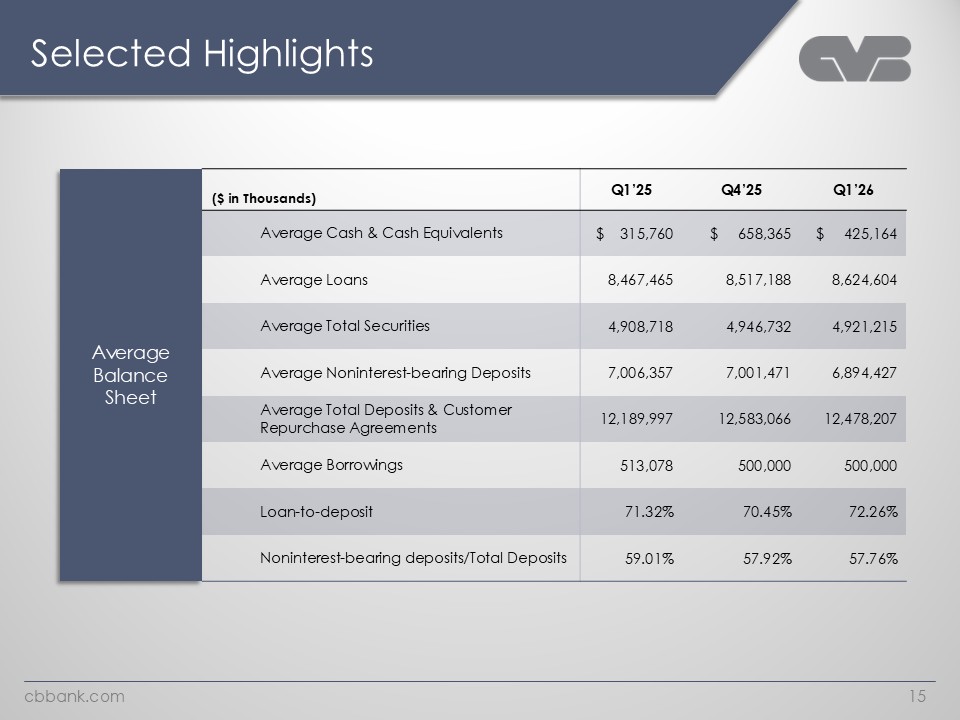
Selected Highlights ($ in Thousands) Average Cash & Cash Equivalents Q1’25 Q4’25 Q1’26 $ Average Loans Average Total Securities Average Balance Sheet 315,760 8,467,465 $ 658,365 8,517,188 $ 425,164 8,624,604 Average Noninterest-bearing Deposits Average Total Deposits & Customer Repurchase Agreements 4,908,718 7,006,357 4,946,732 7,001,471 4,921,215 6,894,427 12,189,997 Average Borrowings Loan-to-deposit Noninterest-bearing deposits/Total Deposits 513,078 71.32% 59.01% 12,583,066 500,000 70.45% 57.92% 12,478,207 500,000 72.26% 57.76% cbbank.com 15
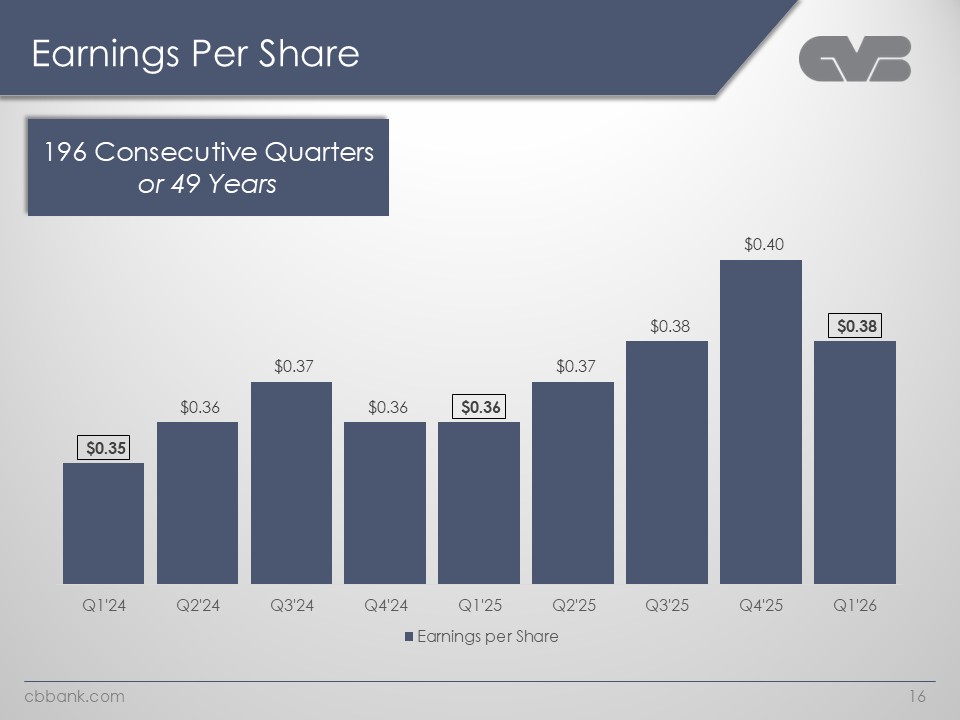
Earnings Per Share 196 Consecutive Quarters or 49 Years $0.35 $0.36 $0.37 $0.36 $0.36 $0.37 $0.38 $0.40 $0.38 Q1'24 Q2'24 Q3'24 Q4'24 Q1'25 Q2'25 Q3'25 Q4'25 Q1'26 Earnings per Share cbbank.com 16
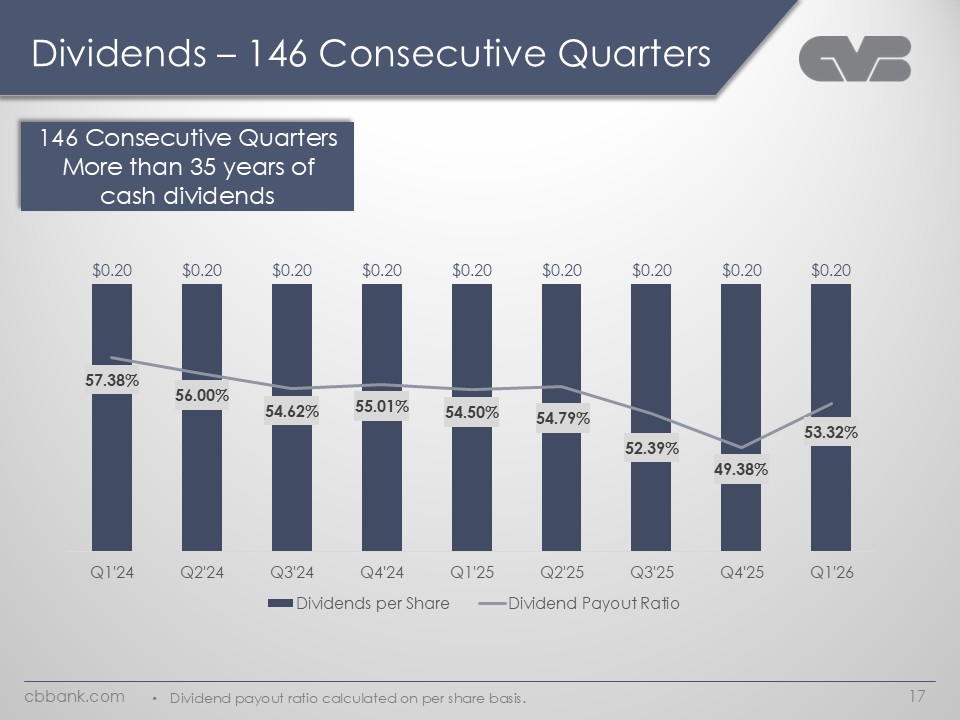
Dividends – 146 Consecutive Quarters 146 Consecutive Quarters More than 35 years of cash dividends $0.20 57.38% $0.20 56.00% $0.20 54.62% $0.20 55.01% $0.20 54.50% $0.20 $0.20 $0.20 $0.20 54.79% Q1'24 Q2'24 Q3'24 Q4'24 Q1'25 Dividends per Share Q2'25 52.39% Q3'25 Dividend Payout Ratio 53.32% 49.38% Q4'25 Q1'26 Dividend payout ratio calculated on per share basis.cabbank.com 17
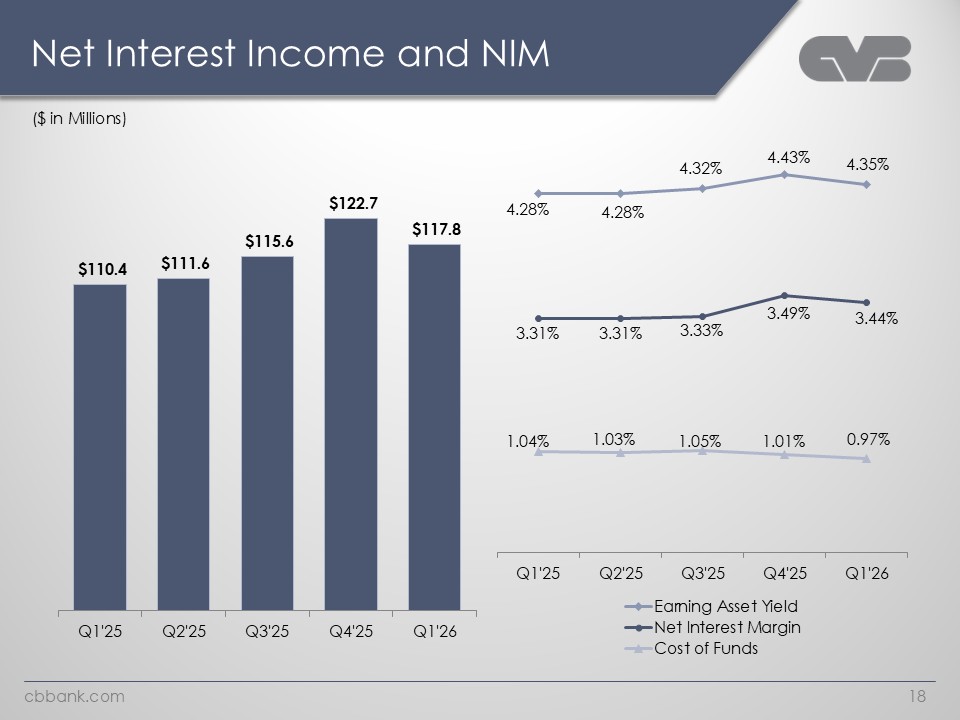
Net Interest Income and NIM 18 ($ in Millions) $110.4 $111.6 $115.6 $122.7 $117.8 4.28% 4.28% 4.32% 4.43% 4.35% 3.31% 3.31% 3.33% 3.49% 3.44% 1.04% 1.03% 1.05% 1.01% 0.97% Q1'25 Q2'25 Q3'25 Q4'25 Q1'26 Q1'25 Q2'25 Q3'25 Q4'25 Q1'26 Earning Asset Yield Net Interest Margin Cost of Funds cbbank.com 18
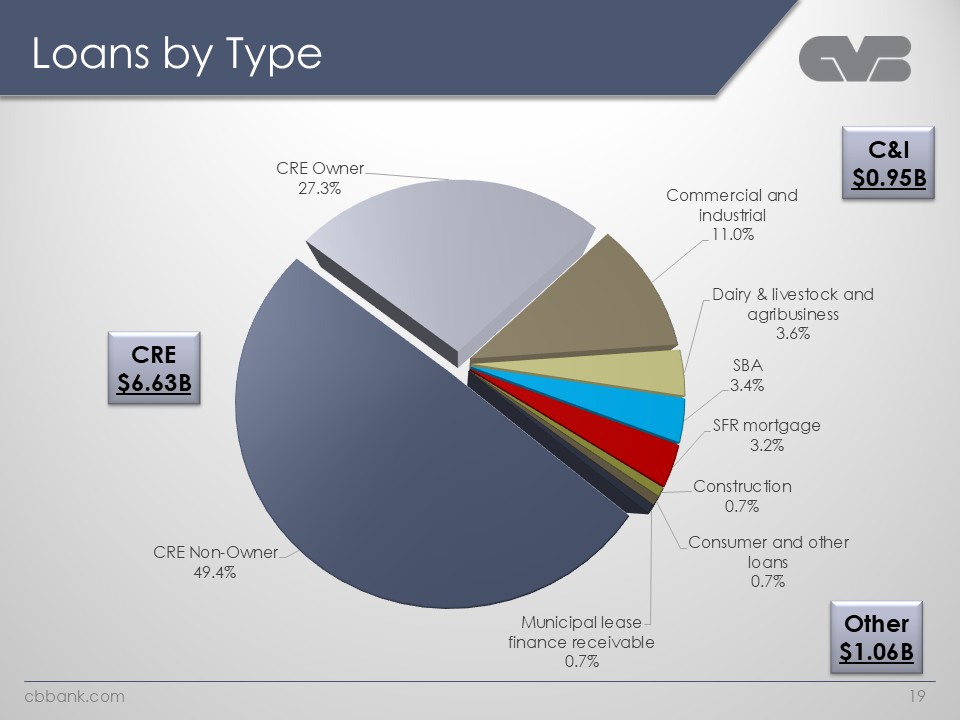
Loans by Type CRE Owner 27.3% Commercial and industrial 11.0% C&I $0.95B Dairy & livestock and agribusiness 3.6% CRE $6.63B CRE Non-Owner 49.4% SBA 3.4% SFR mortgage 3.2% Construction 0.7% Municipal lease finance receivable 0.7% Consumer and other loans 0.7% Other $1.06B cbbank .com 19
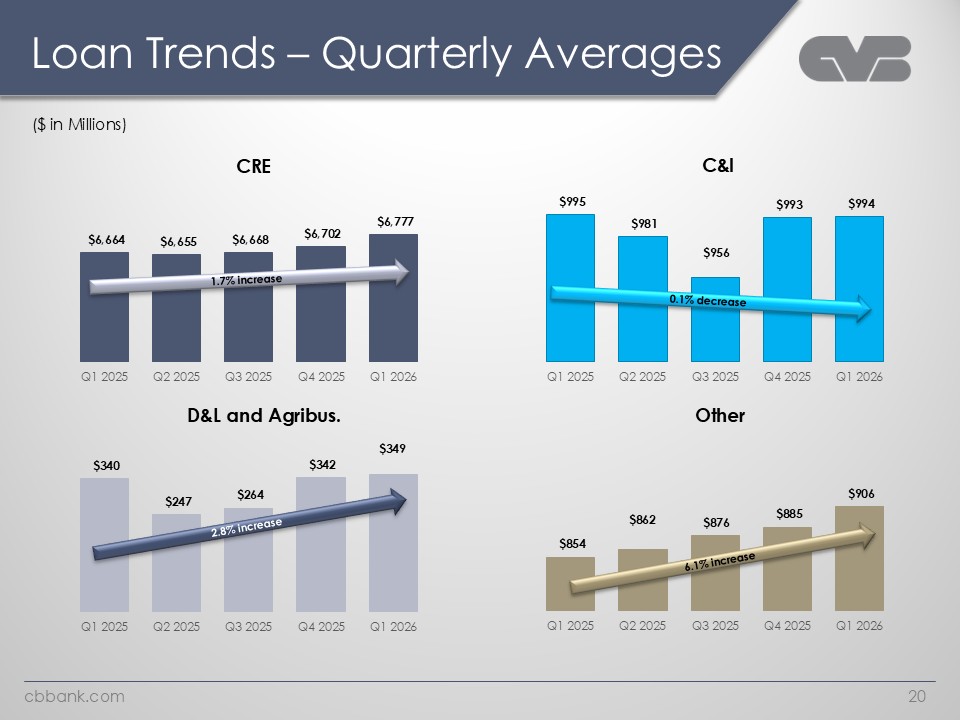
Loan Trends – Quarterly Averages ($ in Millions) CRE $6,664 $6,655 $6,668 $6,702 $6,777 Q1 2025 Q2 2025 Q3 2025 Q4 2025 Q1 2026 C&I $995 $981 $956 $993 $994 Q1 2025 Q2 2025 Q3 2025 Q4 2025 Q1 2026 D&L and Agribus. $340 $247 $264 $342 $349 Q1 2025 Q2 2025 Q3 2025 Q4 2025 Q1 2026 Other $854 $862 $876 $885 $906 Q1 2025 Q2 2025 Q3 2025 Q4 2025 Q1 2026 cabbank.com 20
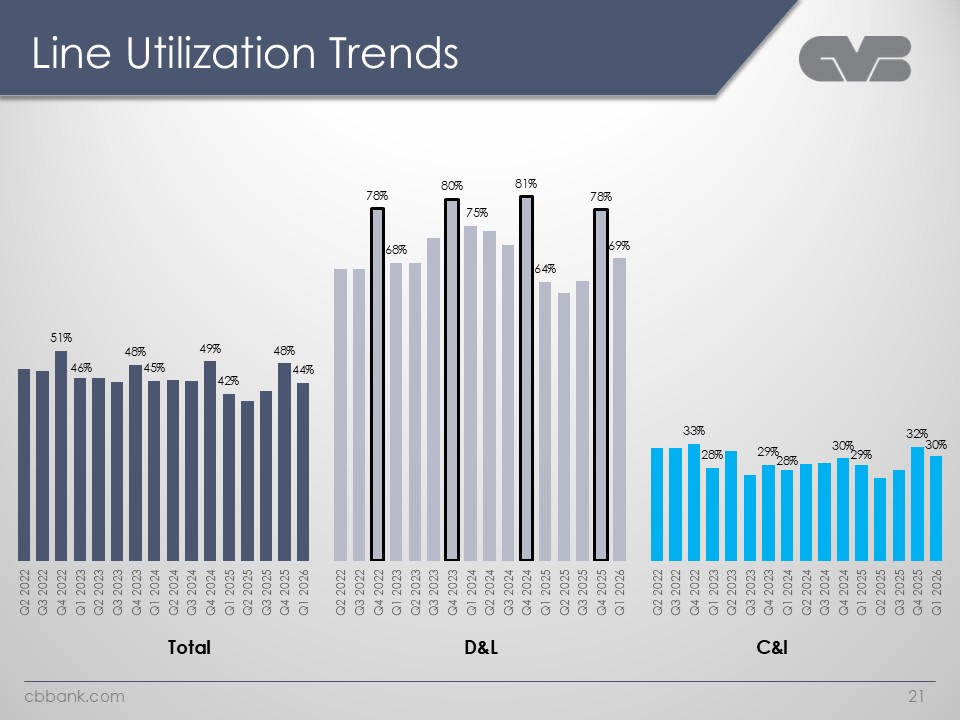
Line Utilization Trends 51% 46% 48% 45% 49% 42% 48% 44% 78% 68% 80% 75% 81% 64% 78% 69% 33% 28% 29% 28% 30% 29% 32% 30% Q2 2022 Q3 2022 Q4 2022 Q1 2023 Q2 2023 Q3 2023 Q4 2023 Q1 2024 Q2 2024 Q3 2024 Q4 2024 Q1 2025 Q2 2025 Q3 2025 Q4 2025 Q1 2026 Q2 2022 Q3 2022 Q4 2022 Q1 2023 Q2 2023 Q3 2023 Q4 2023 Q1 2024 Q2 2024 Q3 2024 Q4 2024 Q1 2025 Q2 2025 Q3 2025 Q4 2025 Q1 2026 Q2 2022 Q3 2022 Q4 2022 Q1 2023 Q2 2023 Q3 2023 Q4 2023 Q1 2024 Q2 2024 Q3 2024 Q4 2024 Q1 2025 Q2 2025 Q3 2025 Q4 2025 Q1 2026 Total D&L C&I cbbank.com 21
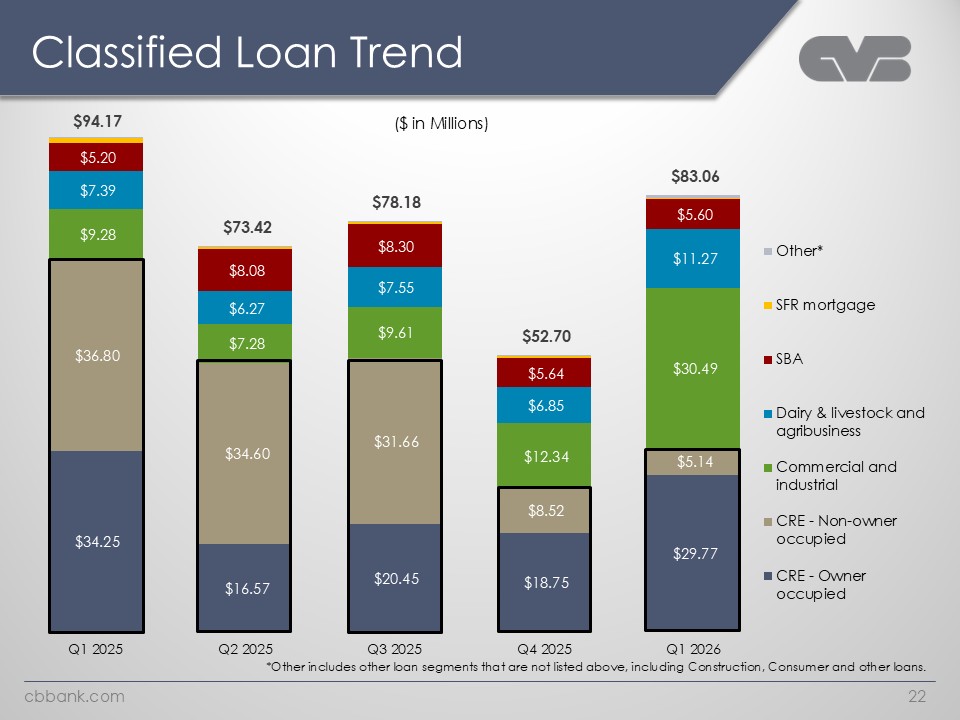
Classified Loan Trend ($ in Millions) $94.17 $5.20 $7.39 $9.28 $36.80 $34.25 Q1.2025 $73.42 $8.08 $6.27 $7.28 $34.60 $16.57 Q2 2025 $78.18 $8.30 $7.55 $9.61 $31.66 $20.45 Q3 2025 $52.70 $5.64 $6.85 $12.34 $8.52 $18.75 Q4 2025 $83.06 $5.60 $11.27 $30.49 $5.14 $29.77 Q1.2026 Other* sfr mortgage sba Dairy & livestock and agribusiness Commercial and industrial CRE - Non-owner occupied CRE - Owner occupied *Other includes other loan segments that are not listed above, including Construction, Consumer and other loans. cbbank.com 22
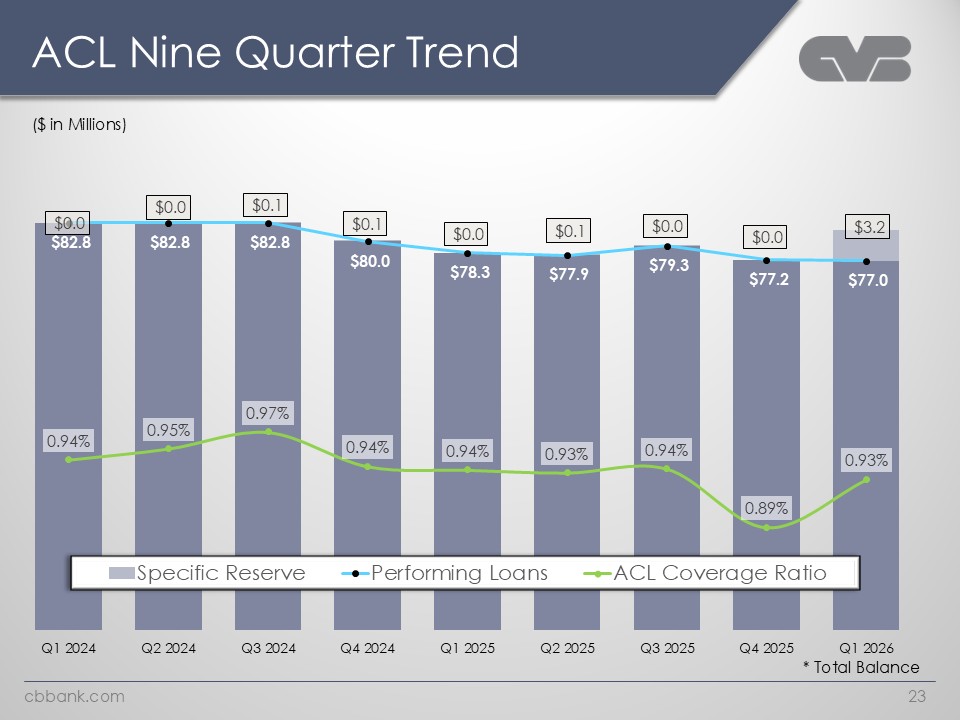
ACL Nine Quarter Trend ($ in Millions) $0.0 $0.0 $0.1 $0.1 $0.0 $0.1 $0.0 $0.0 $3.2 $82.8 $82.8 $82.8 $80.0 $78.3 $77.9 $79.3 $77.2 $77.0 0.94% 0.95% 0.97% 0.94% 0.94% 0.93% 0.94% 0.89% 0.93% Specific Reserve Performing Loans ACL Coverage Ratio Q1 2024 Q2 2024 Q3 2024 Q4 2024 Q1 2025 Q2 2025 Q3 2025 Q4 2025 Q1 2026 * Total Balance cbbank.com 23
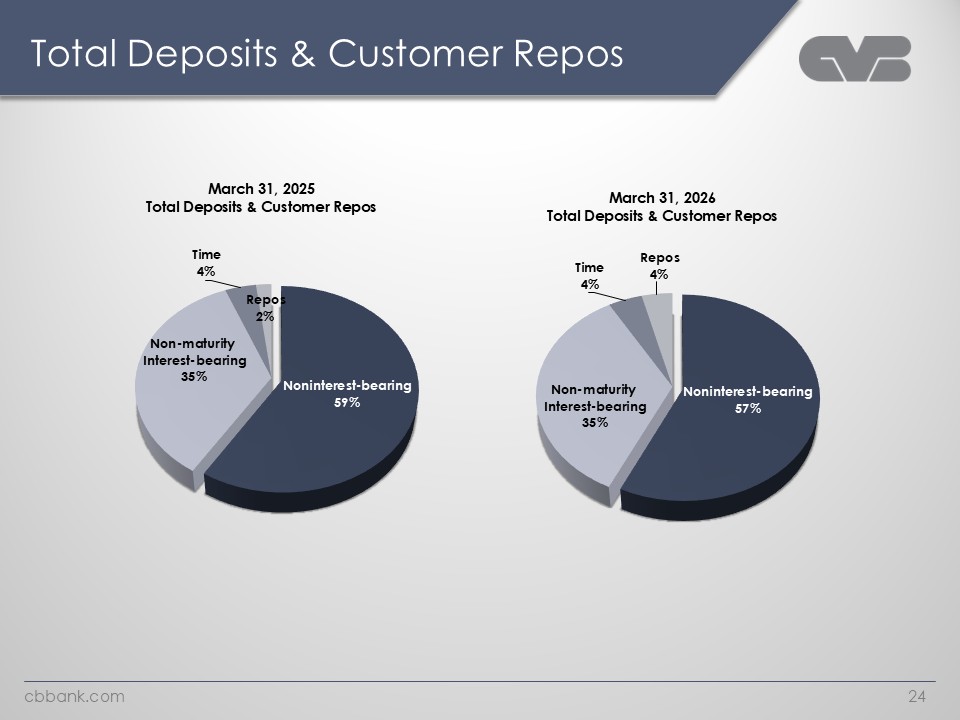
Total Deposits & Customer Repos March 31, 2025 Total Deposits & Customer Repos March 31, 2026 Total Deposits & Customer Repos Time 4% Non-maturity Interest-bearing 35% Repos 2% Noninterest-bearing 59% Time 4% Repos 4% Non-maturity Interest-bearing 35% Noninterest-bearing 57% cbbank.com 24
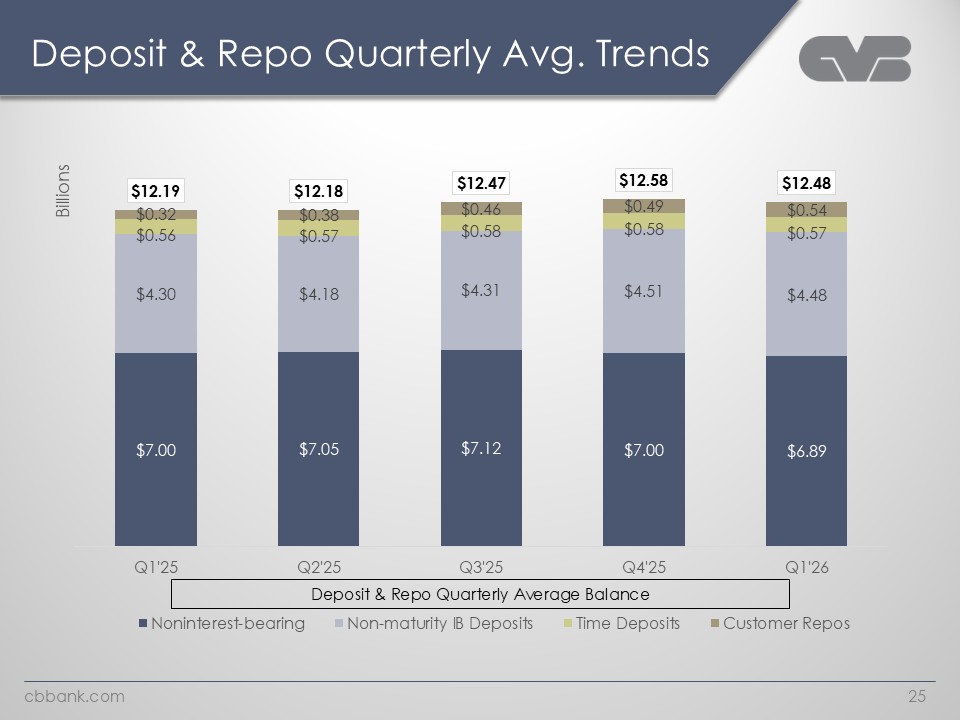
Deposit & Repo Quarterly Avg. Trends Billions $7.00 $7.05 $7.12 $7.00 $6.89 $4.30 $4.18 $4.31 $4.51 $4.48 $0.56 $0.57 $0.58 $0.58 $0.57 $0.32 $0.38 $0.46 $0.49 $0.54 $12.19 $12.18 $12.47 $12.58 $12.48 Q1'25 Q2'25 Q3'25 Q4'25 Q1'26 Deposit & Repo Quarterly Average Balance Noninterest-bearing Non-maturity IB Deposits Time Deposits Customer Repos cbbank.com 25
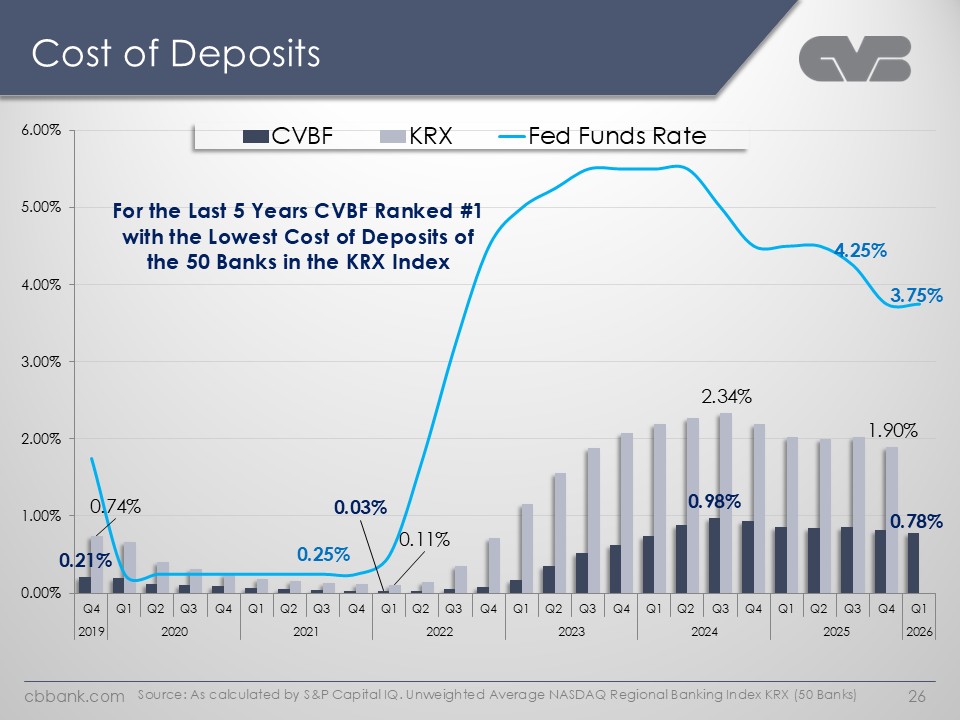
Cost of Deposits CVBF KRX Fed Funds Rate For the Last 5 Years CVBF Ranked #1 with the Lowest Cost of Deposits of the 50 Banks in the KRX Index Q4 Q1 Q2 Q3 Q4 Q1 Q2 Q3 Q4 Q1 Q2 Q3 Q4 Q1 Q2 Q3 Q4 Q1 Q2 Q3 Q4 Q1 Q2 Q3 Q4 Q1 2019 2020 2021 2022 2023 2024 2025 2026 6.00% 5.00% 4.00% 3.00% 2.00% 1.00% 0.00% 0.03% 0.98% 0.78% 0.74% 0.21% 0.11% 2.34% 1.90% 4.25% 3.75% Source: As calculated by S&P Capital IQ. Unweighted Average NASDAQ Regional Banking Index KRX (50 Banks) cbbank.com 26
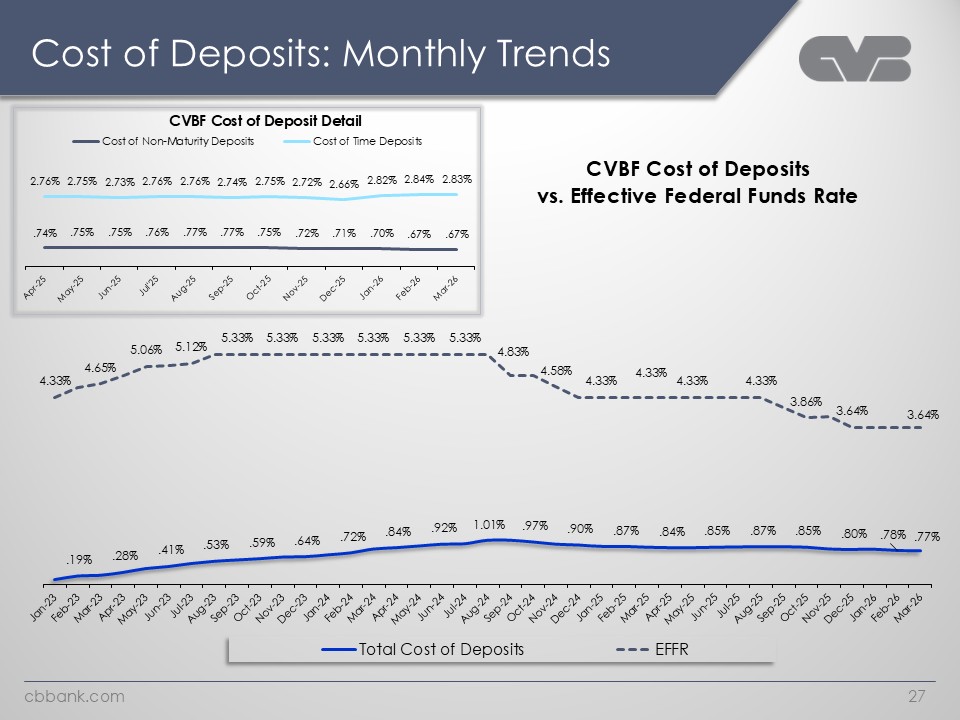
Cost of Deposits: Monthly Trends CVBF Cost of Deposit Detail Cost of Non-Maturity Deposits Cost of Time Deposits 2.76% 2.75% 2.73% 2.76% 2.76% 2.74% 2.75% 2.72% 2.66% 2.82% 2.84% 2.83% .74% .75% .75% .76% .77% .77% .75% .72% .71% .70% .67% .67% CVBF Cost of Deposits vs. Effective Federal Funds Rate 4.33% 4.65% 5.06% 5.12% 5.33% 5.33% 5.33% 5.33% 5.33% 5.33% 4.83% 4.58% 4.33% 4.33% 4.33% 4.33% 3.86% 3.64% 3.64% .19% .28% .41% .53% .59% .64% .72% .84% .92% 1.01% .97% .90% .87% .84% .85% .87% .85% .80% .78% .77% Apr-25 may-25 jun-25 jul’25 aug-25 sep-25 oct-25nov-25 dec-25 jan-26 feb-26 mar-26 jan-23 feb-23 mar-23 apr-23 may-23 jun-23 jul-23 aug-23 sep-23 oct-23 nov-23 dec-23 jan-24 feb-24 mar-24 apr-24 may-24 jun-24 jul-24 aug-24 sep-24 oct-24 nov-24 dec-24 jan-25 feb-25 mar-25 apr-25 may-25 jun-25 jul-25 aug-25 sep-25 oct-25nov-25 dec-25 jan-26 feb-26 mar-26 Total Cost of Deposits effr cbbank.com 27
Cvb financial corp. Acquisition of Heritage Bank of Commerce cbbank.com 28
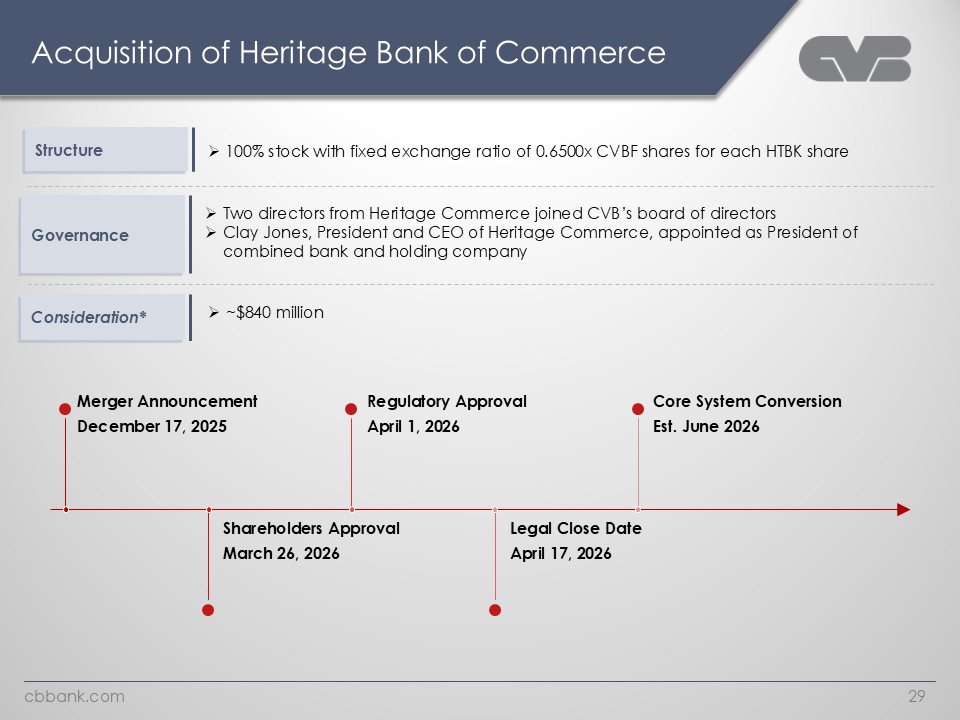
Acquisition of Heritage Bank of Commerce Structure 100% stock with fixed exchange ratio of 0.6500x CVBF shares for each HTBK share GovernanceTwo directors from Heritage Commerce joined CVB’s board of directors Clay Jones, President and CEO of Heritage Commerce, appointed as President of combined bank and holding company Consideration* $840 million Merger Announcement December 17, 2025 Regulatory Approval April 1, 2026 Core System Conversion Est. June 2026 Shareholders Approval March 26, 2026 Legal Close Date April 17, 2026 cbbank.com 29
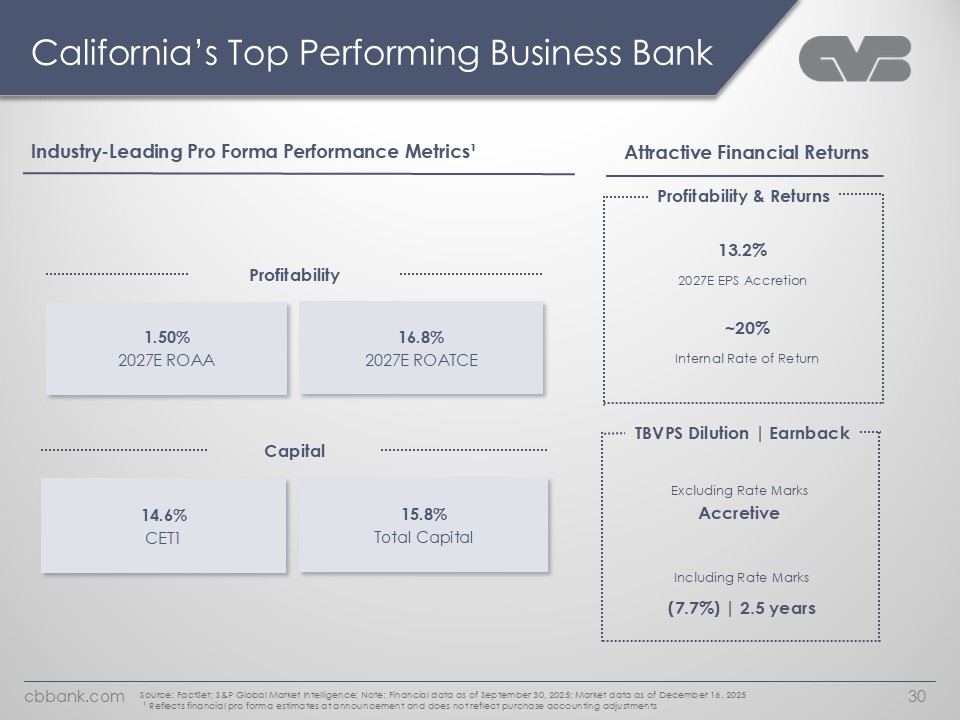
California’s Top Performing Business Bank Industry-Leading Pro Forma Performance Metrics¹ Attractive Financial Returns Profitability 1.50% 2027E ROAA 16.8% 2027E ROATCE Capital 14.6% CET1 15.8%Total Capital Profitability & Returns 13.2% 2027E EPS Accretion ~20%Internal Rate of Return TBVPS Dilution | Earnback Excluding Rate Marks Accretive Including Rate Marks (7.7%) | 2.5 years Source: FactSet; S&P Global Market Intelligence; Note: Financial data as of September 30, 2025; Market data as of December 16, 2025 ¹ Reflects financial pro forma estimates at announcement and does not reflect purchase accounting adjustments cbbank.com 30
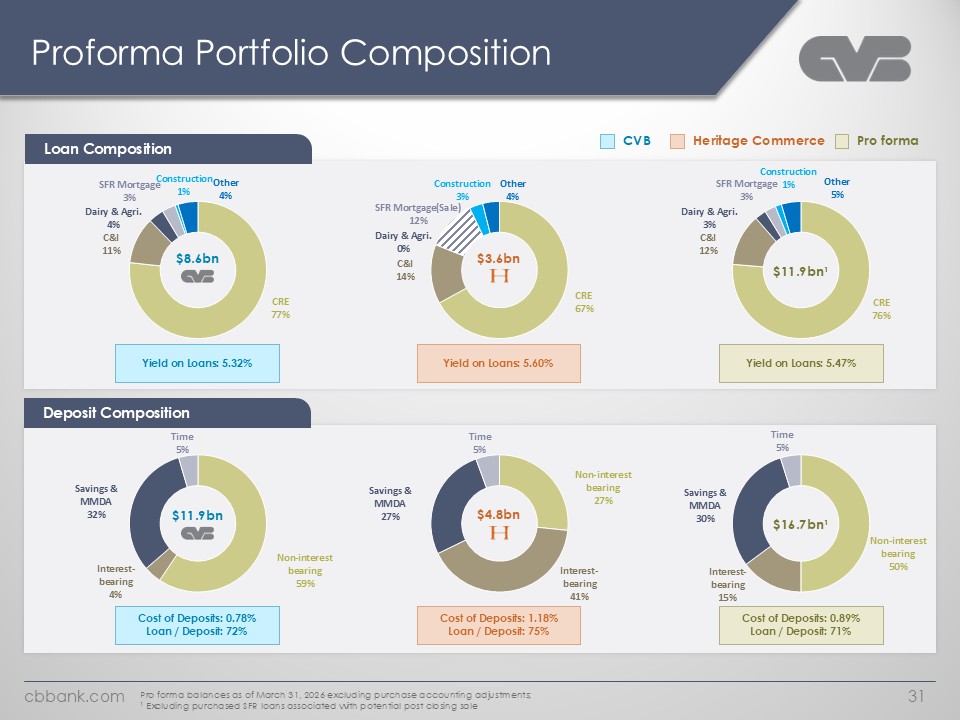
Proforma Portfolio Composition Loan Composition CVB Heritage Commerce Pro forma Dairy & Agri. 4% SFR Mortgage 3% Construction 1% Other 4% C&I 11% Construction 3% Other 4% SFR Mortgage(Sale) 12% Dairy & Agri. 0% C&I 14% $3.6bn $8.6bn $11.9bn¹ Construction 1% SFR Mortgage 3% Dairy & Agri. 3% C&I 12% Other 5% CRE 77% CRE 67% CRE 76% Yield on Loans: 5.32% Yield on Loans: 5.60% Yield on Loans: 5.47% De posit Composition Time 5% Savings & MMDA 32% Interest-bearing 4% Non-interest bearing Cost of Deposits: 0.78% Loan / Deposit: 72%59% $11.9bn Savings & MMDA 27% Time 5% $4.8bn Non-interest bearing 27% Interest-bearing 41% $4.8bn Cost of Deposits: 1.18% Loan / Deposit: 75% Savings & MMDA 30% Time 5% 50% Interest- bearing 15% $16.7bn¹ Non-interest bearing 50% Cost of Deposits: 0.89% Loan / Deposit: 71% Cbbank.com 31 Pro forma balances as of March 31, 2026 excluding purchase accounting adjustments; ¹ Excluding purchased SFR loans associated with potential post closing sale
CVB Financial Corp Appendix & Non-GAAP Reconciliation Cbbank.com
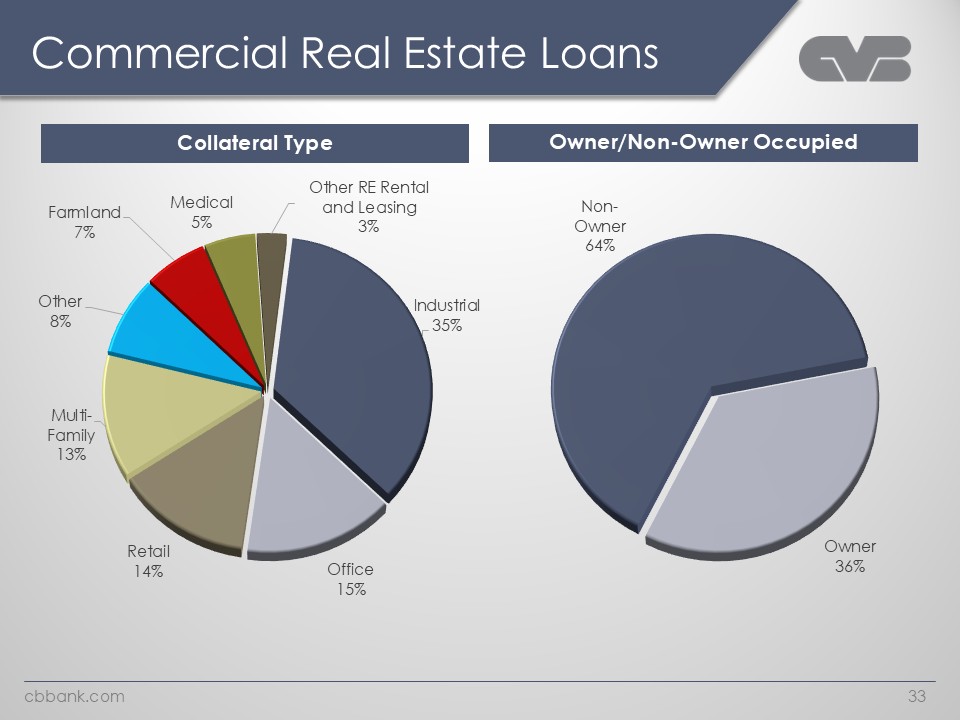
Commercial Real Estate Loans Collateral Type Owner/Non-Owner Occupied Farmland 7% Medical 5% Other RE Rental and Leasing 3% Other 8% Multi- Family 13% Industrial 35% Retail 14% Office 15% Non- Owner 64% Owner 36% 33 cbbank.com
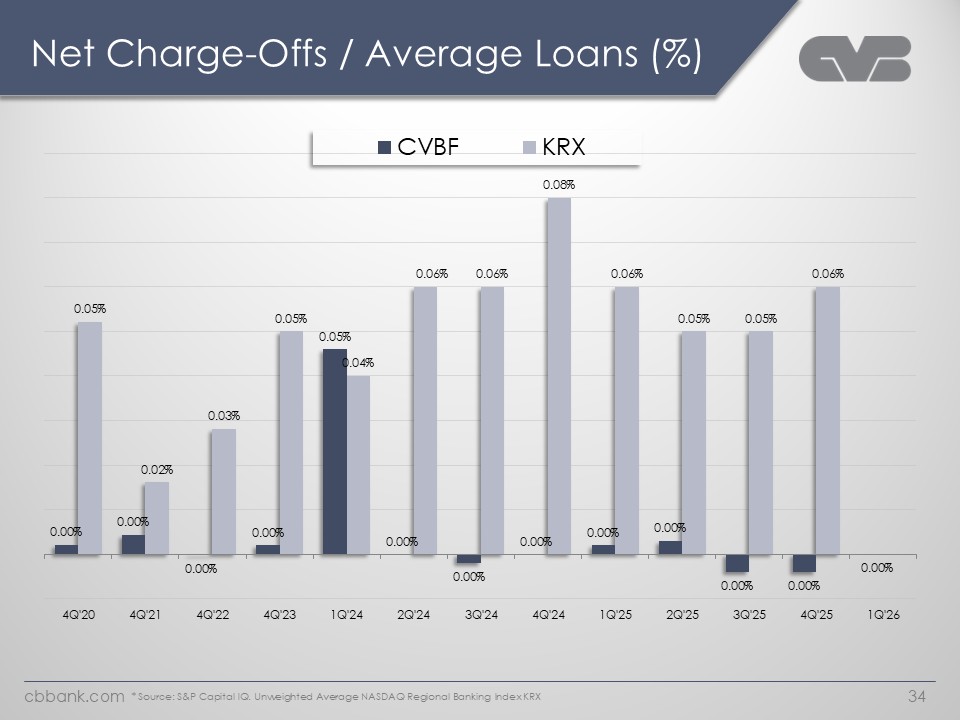
Net Charge-Offs / Average Loans (%) CVBF KRX 0.05% 0.00% 0.00% 0.02% 0.03% 0.05% 0.05% .04% 0.00% 0.00% 0.00% 0.00% 0.00% 0.00% 0.00% 0.00% 0.06% 0.06% 0.08% 0.06% 0.05% 0.05% 0.06% 4Q'20 4Q'21 4Q'22 4Q'23 1Q'24 2Q'24 3Q'24 4Q'24 1Q'25 2Q'25 3Q'25 4Q'25 1Q'26 cbbank.com 34 * Source: S&P Capital IQ. Unweighted Average NASDAQ Regional Banking Index KRX
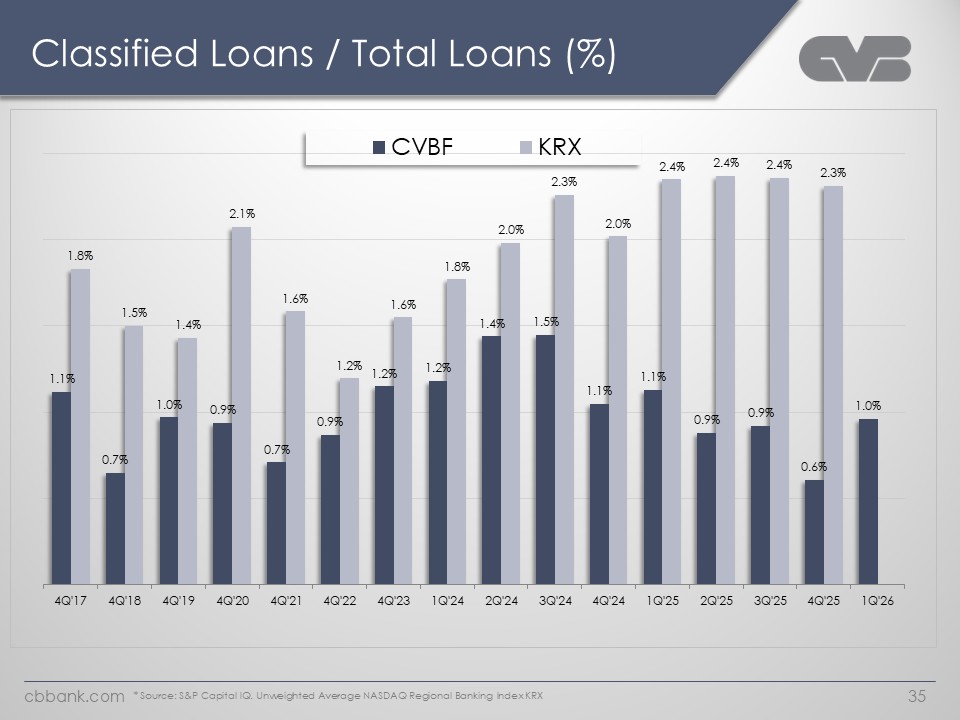
Classified Loans / Total Loans (%) CVBF KRX 1.1% 1.4% 0.7% .0% .9% 0.7% 0.9% 1.2% 1.2% 1.4% 1.5% 1.1% 1.1% 0.9% 0.9% 0.6% 1.0% 1.8% 1.5% 1.4% 2.1% 1.6% 1.2% 1.6% 1.8% 2.0% 2.3% 2.0% 2.4% 2.4% 2.4% 2.3% 4Q'17 4Q'18 4Q'19 4Q'20 4Q'21 4Q'22 4Q'23 1Q'24 2Q'24 3Q'24 4Q'24 1Q'25 2Q'25 3Q'25 4Q'25 1Q'26 ccbank.com 35 * Source: S&P Capital IQ. Unweighted Average NASDAQ Regional Banking Index KRX
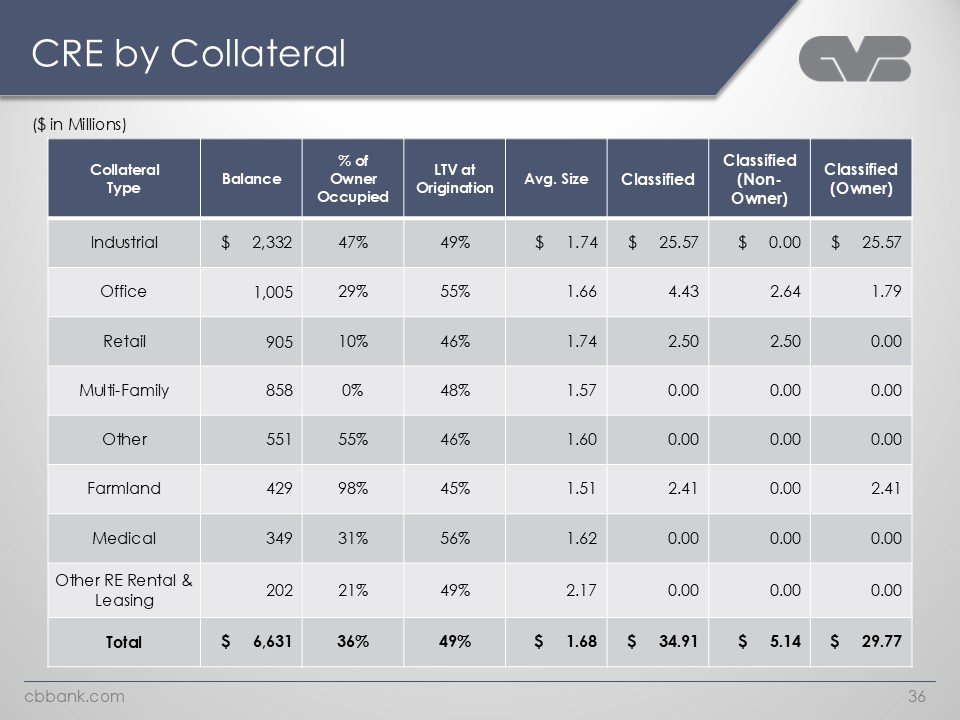
CRE by Collateral ($ in Millions) Collateral type balance % of qwer occupied LTV at origination Avg. Size Classified Classified (non qwner) Classified (owner) Industrial $ 2,332 47% 49% $ 1.74 $ 25.57 $ 0.00 $ 25.57 Office 1,005 29% 55%1.66 4.43 2.64 1.79 Retail 905 10%46% 1.74 2.50 2.50 0.00 Multi-Family 858 0% 48% 1.57 0.00 0.000.00 Other 551 55% 46% 1.60 0.00 0.00 0.00 Farmland 429 98% 45% 1.51 2.41 0.00 2.41 Medical 349 31% 56% 1.62 0.00 0.00 0.00 Other RE Rental & Leasing 202 21% 49% 2.17 0.00 0.00 0.00 Total $ 6,631 36% 49% $ 1.68 $ 34.91 $ 5.14 $ 29.77 cbbank.com 36
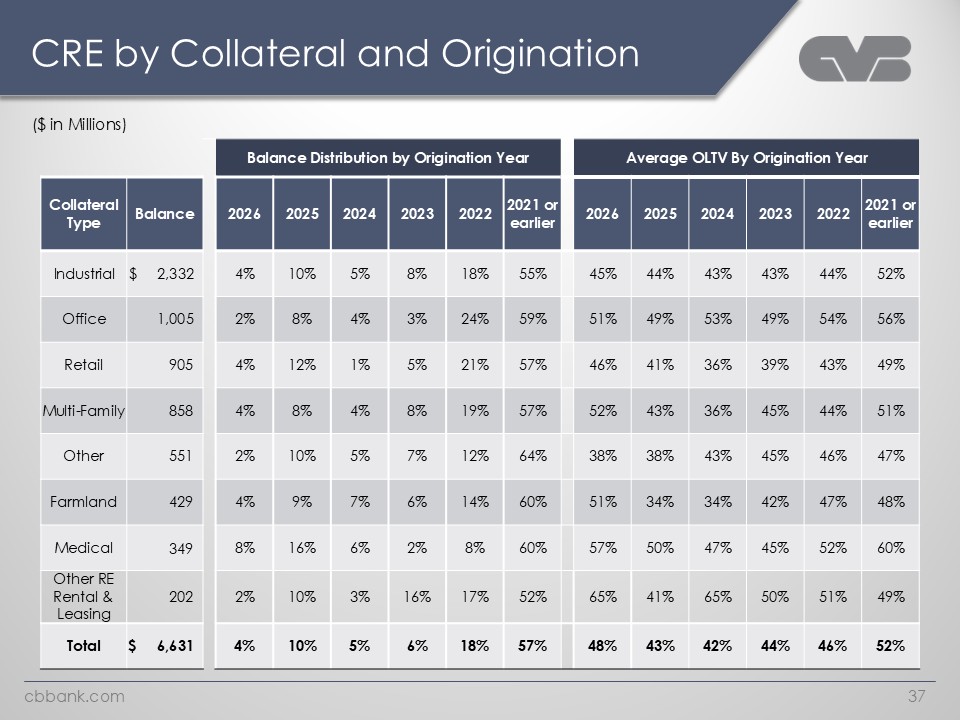
CRE by Collateral and Origination Balance Distribution by Origination Year ($ in Millions) Average OLTV By Origination Year cbbank.com 37 Collateral Type Balance 2026 2025 2024 2023 2022 2021 or earlier 2026 2025 2024 2023 2022 2021 or earlier Industrial $ 2,332 4% 10% 5% 8% 18% 55% 45% 44% 43% 43% 44% 52% Office 1,005 2% 8% 4% 3% 24% 59% 51% 49% 53% 49% 54% 56% Retail 905 4% 12% 1% 5% 21% 57% 46% 41% 36% 39% 43% 49% Multi-Family 858 4% 8% 4% 8% 19% 57% 52% 43% 36% 45% 44% 51% Other 551 2% 10% 5% 7% 12% 64% 38% 38% 43% 45% 46% 47% Farmland 429 4% 9% 7% 6% 14% 60% 51% 34% 34% 42% 47% 48% Medical 349 8% 16% 6% 2% 8% 60% 57% 50% 47% 45% 52% 60% Other RE Rental & Leasing 202 2% 10% 3% 16% 17% 52% 65% 41% 65% 50% 51% 49% Total $ 6,631 4% 10% 5% 6% 18% 57% 48% 43% 42% 44% 46% 52%
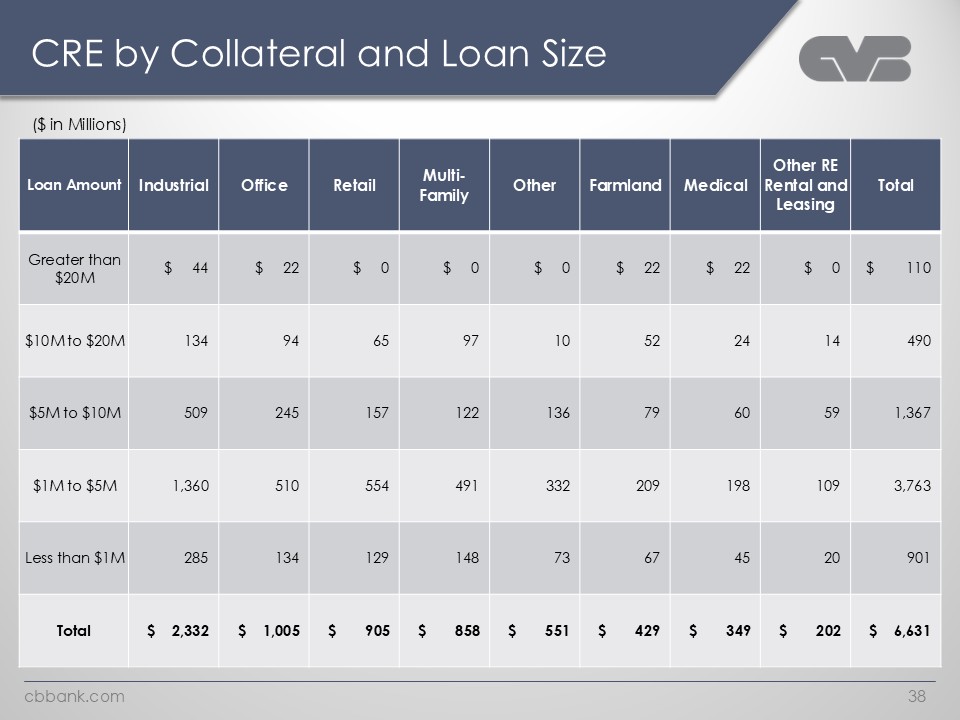
CRE by Collateral and Loan Size ($ in Millions) Loan Amount Industrial Office Retail Multi-Family Other Farmland Medical Other RE Rental and Leasing Total Greater than $20M $ 44 $ 22 $ 0 $ 0 $ 0 $ 22 $ 22 $ 0 $ 110 $10M to $20M 134 94 65 97 10 52 24 14 490 $5M to $10M 509 245 157 122 136 79 60 59 1,367 $1M to $5M 1,360 510 554 491 332 209 198 109 3,763 Less than $1M 285 134 129 148 73 67 45 20 901 Total $ 2,332 $ 1,005 $ 905 $ 858 $ 551 $ 429 $ 349 $ 202 $ 6,631 38 cbbank.com
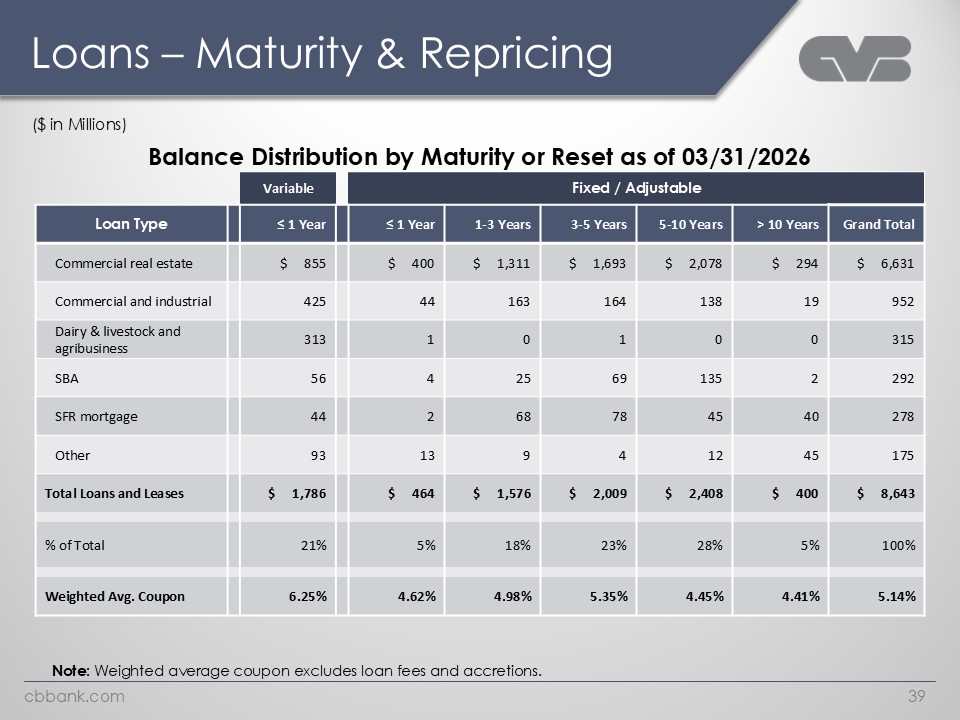
Loans – Maturity & Repricing ($ in Millions) Balance Distribution by Maturity or Reset as of 03/31/2026 Variable Fixed / Adjustable Loan Type ≤ 1 Year ≤ 1 Year 1-3 Years 3-5 Years 5-10 Years > 10 Years Grand Total Commercial real estate $ 855 $ 400 $ 1,311 $ 1,693 $ 2,078 $ 294 $ 6,631 Commercial and industrial 425 44 163 164 138 19 952 Dairy & livestock and agribusiness 313 1 0 1 0 0 315 SBA 56 4 25 69 135 2 292 SFR mortgage 44 2 68 78 45 40 278 Other 93 13 9 4 12 45 175 Total Loans and Leases $ 1,786 $ 464 $ 1,576 $ 2,009 $ 2,408 $ 400 $ 8,643 % of Total 21% 5% 18% 23% 28% 5% 100% z Weighted Avg. Coupon 6.25% 4.62% 4.98% 5.35% 4.45% 4.41% 5.14% Note: Weighted average coupon excludes loan fees and accretions. cbbank.com 39
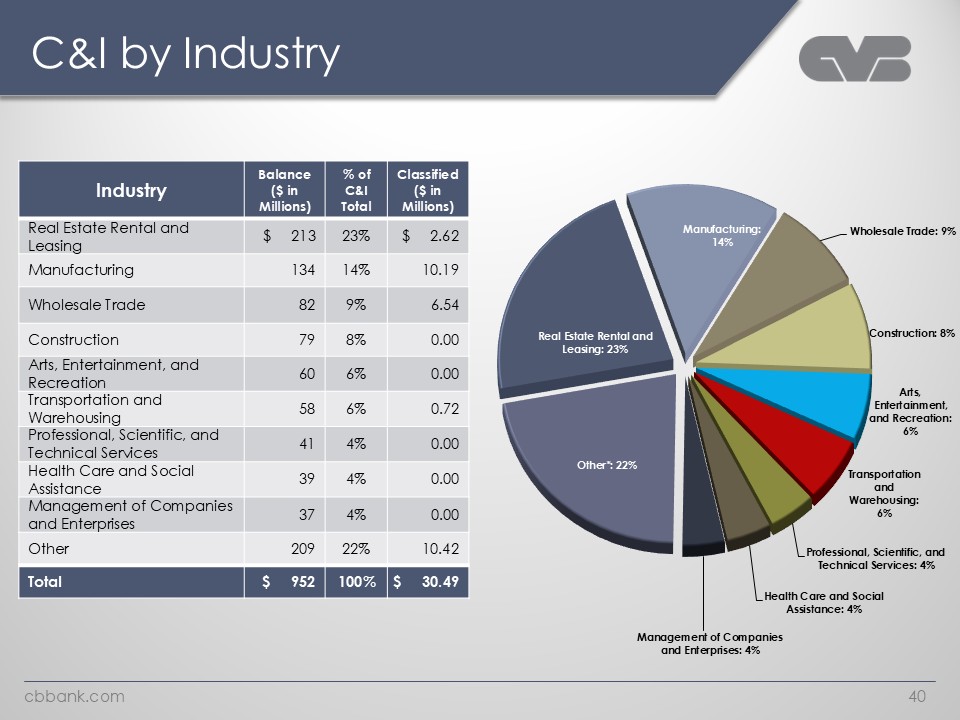
C&I by Industry Industry Balance ($ in Millions) % of C&I Total Classified ($ in Millions) Real Estate Rental and Leasing $ 213 23% $ 2.62 Manufacturing 134 14% 10.19 Wholesale Trade 82 9% 6.54 Construction 79 8% 0.00 Arts, Entertainment, and Recreation 60 6% 0.00 Transportation and Warehousing 58 6% 0.72 Professional, Scientific, and Technical Services 41 4% 0.00 Health Care and Social Assistance 39 4% 0.00 Management of Companies and Enterprises 37 4% 0.00 Other 209 22% 10.42 Total $ 952 100% $ 30.49 Manufacturing: 14% Real Estate Rental and Leasing: 23% Other*: 22% Wholesale Trade: 9% Construction: 8% Arts, Entertainment, and Recreation: 6% Transportation and Warehousing: 6% Professional, Scientific, and Technical Services: 4% Health Care and Social Assistance: 4% Management of Companies and Enterprises: 4% cbbank.com 40
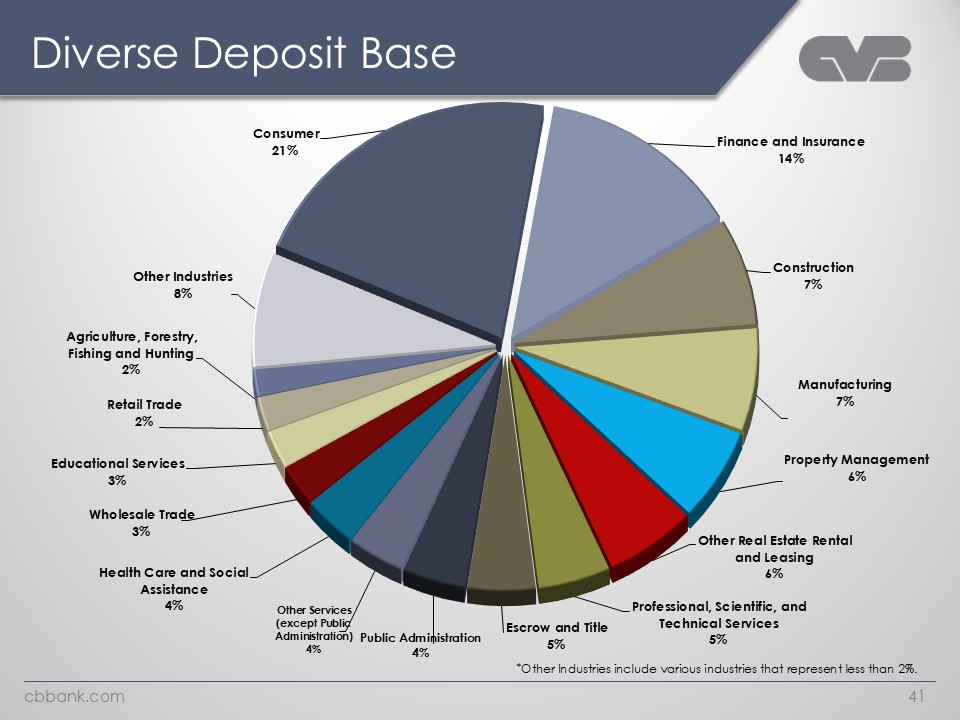
Diverse Deposit Base Consumer 21% Other Industries 8% Agriculture, Forestry, Fishing and Hunting 2% Retail Trade 2% Educational Services 3% Wholesale Trade 3% Health Care and Social Assistance 4% Other Services (except Public Administration) 4% Public Administration 4% Escrow and Title 5% Professional, Scientific, and Technical Services 5% Other Real Estate Rental and Leasing 6% Property Management 6% Manufacturing 7% Construction 7% Finance and Insurance 14% *Other Industries include various industries that represent less than 2%. Cbbank.com 41
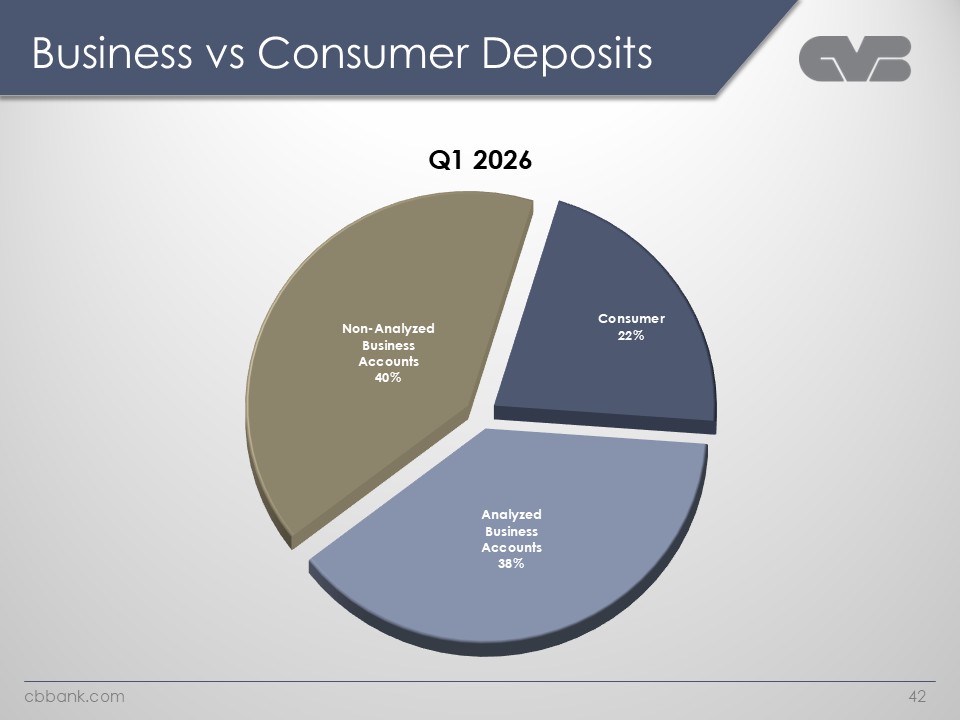
Business vs Consumer Deposits Q1 2026 Non-Analyzed Business Accounts 40% Analyzed Business Accounts 38% Consumer 22% Cbbank.com 42
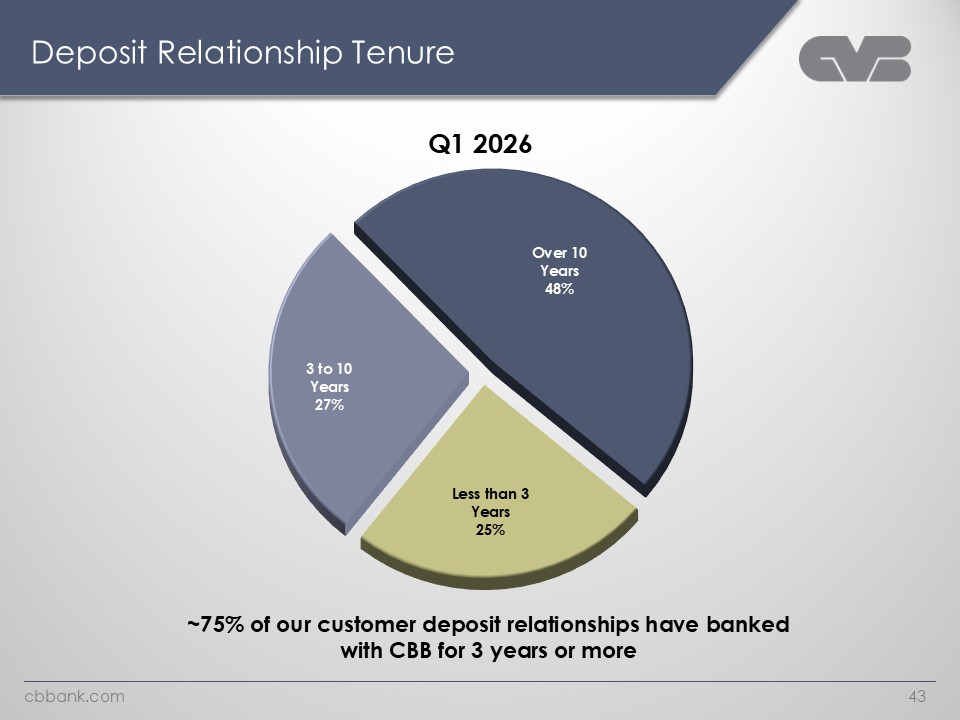
Deposit Relationship Tenure Q1 2026 3 to 10 Years 27% Less than 3 Years 25% Over 10 Years 48% ~75% of our customer deposit relationships have banked with CBB for 3 years or more Cbbank.com 43
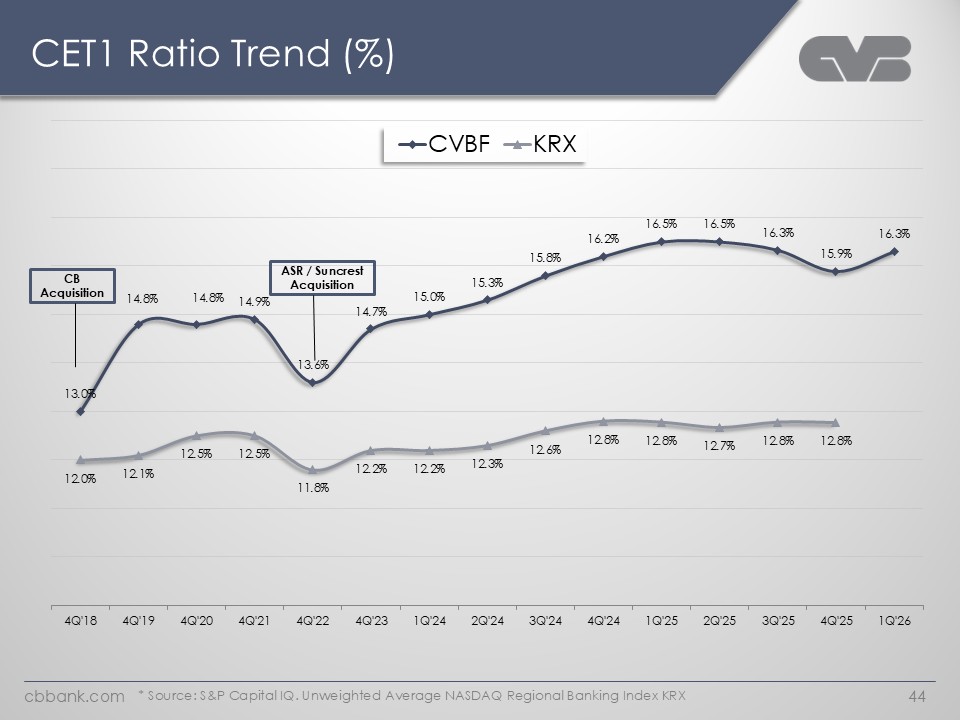
CET1 Ratio Trend (%) CVBF KRX CB Acquisition ASR / Suncrest Acquisition 13.0% 14.8% 14.8% 14.9% 13.6% 14.7% 15.0% 15.3% 15.8% 16.2% 16.5% 16.5% 16.3% 15.9% 16.3% 12.0% 12.1% 12.5% 12.5% 11.8% 12.2% 12.2% 12.3% 12.6% 12.8% 12.8% 12.7% 12.8% 12.8% 4Q'18 4Q'19 4Q'20 4Q'21 4Q'22 4Q'23 1Q'24 2Q'24 3Q'24 4Q'24 1Q'25 2Q'25 3Q'25 4Q'25 1Q'26 * Source: S&P Capital IQ. Unweighted Average NASDAQ Regional Banking Index KRX Cbbank.com 44
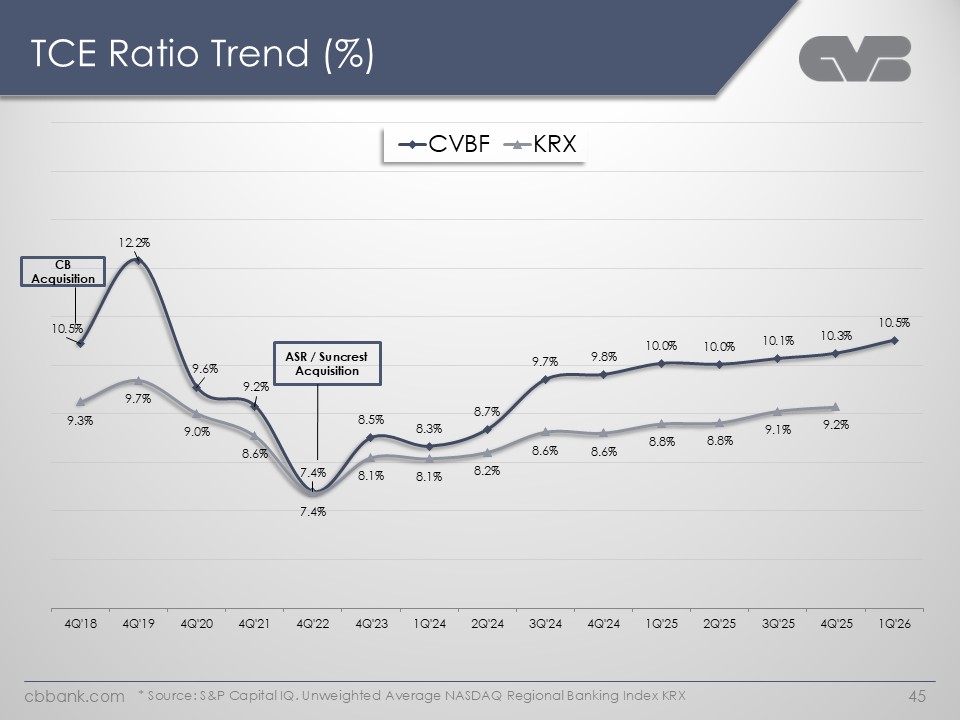
TCE Ratio Trend (%) CVBF KRX CB Acquisition ASR / Suncrest Acquisition 10.5% 12.2% 9.6% 9.2% 7.4% 8.5% 8.3% 8.7% 9.7% 9.8% 10.0% 10.0% 10.1% 10.3% 10.5% 9.3% 9.7% 9.0% 8.6% 7.4% 8.1% 8.1% 8.2% 8.6% 8.6% 8.8% 8.8% 9.1% 9.2% 4Q'18 4Q'19 4Q'20 4Q'21 4Q'22 4Q'23 1Q'24 2Q'24 3Q'24 4Q'24 1Q'25 2Q'25 3Q'25 4Q'25 1Q'26 * Source: S&P Capital IQ. Unweighted Average NASDAQ Regional Banking Index KRX Cbbank.com 45

Economic Forecast – GDP Real GDP Growth 3.50 3.00 2.50 2.00 1.50 1.00 0.50 – 2026Q1 2026Q2 2026Q3 2026Q4 2027Q1 2027Q2 2027Q3 2027Q4 2028Q1 2028Q2 2028Q3 2028Q4 2029Q1 Q4 2025 Forecast Q1 2026 Forecast Cbbank.com 46
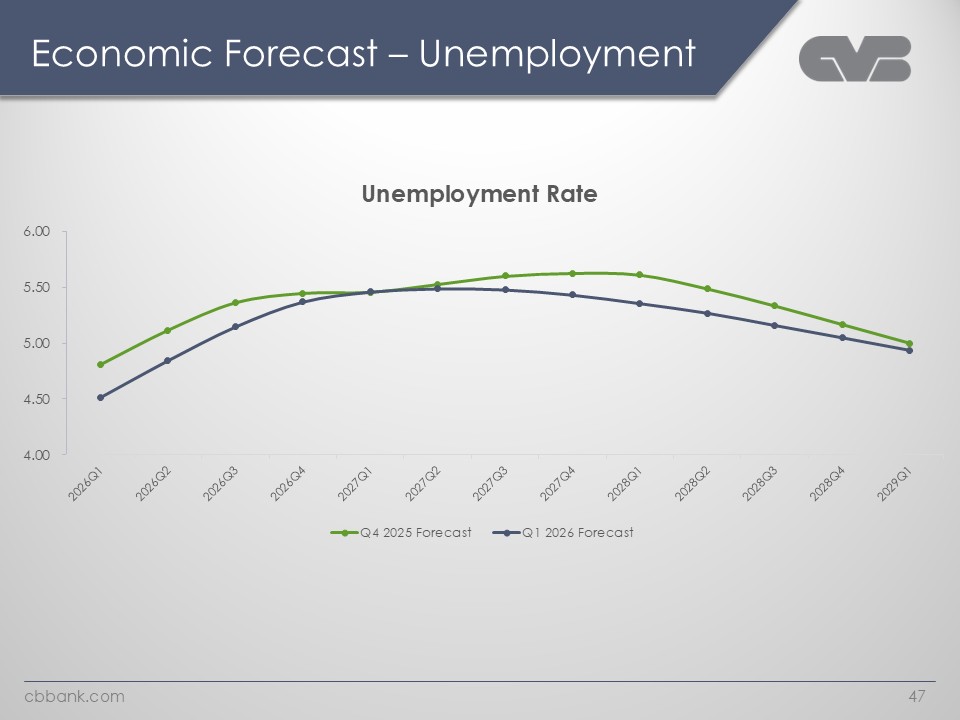
Economic Forecast – Unemployment Unemployment Rate 6.00 5.50 5.00 4.50 4.00 2026Q1 2026Q2 2026Q3 2026Q4 2027Q1 2027Q2 2027Q3 2027Q4 2028Q1 2028Q2 2028Q3 2028Q4 2029Q1 Q4 2025 Forecast Q1 2026 Forecast Cbbank.com 47
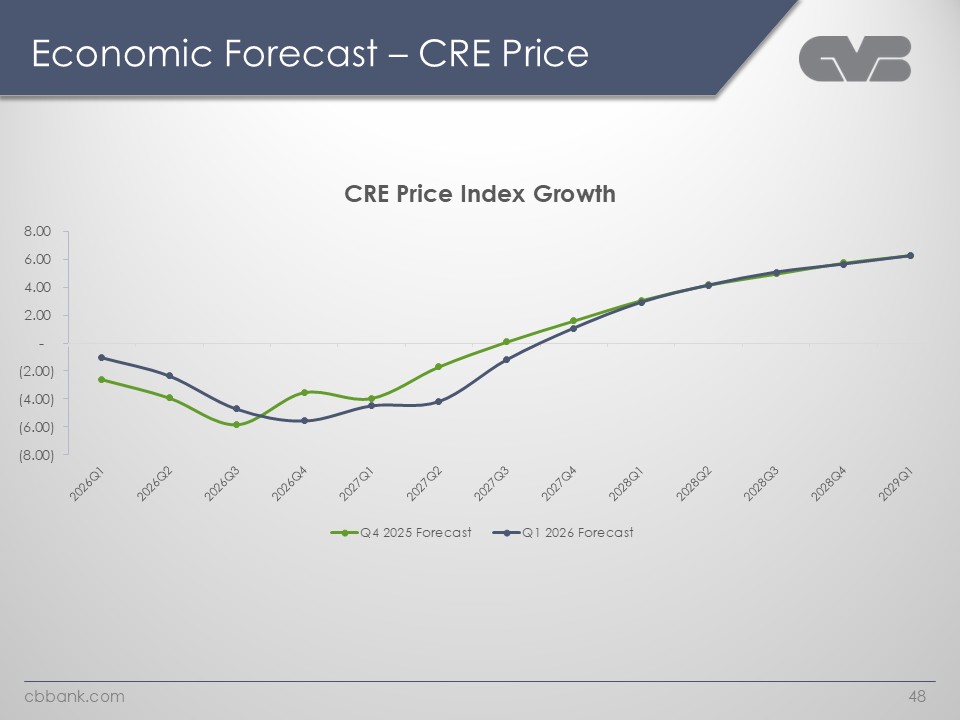
Economic Forecast – CRE Price CRE Price Index Growth 8.00 6.00 4.00 2.00 (2.00) (4.00) (6.00) (8.00) 2026Q1 2026Q2 2026Q3 2026Q4 2027Q1 2027Q2 2027Q3 2027Q4 2028Q1 2028Q2 2028Q3 2028Q4 2029Q1 Q4 2025 Forecast Q1 2026 Forecast Cbbank.com 48
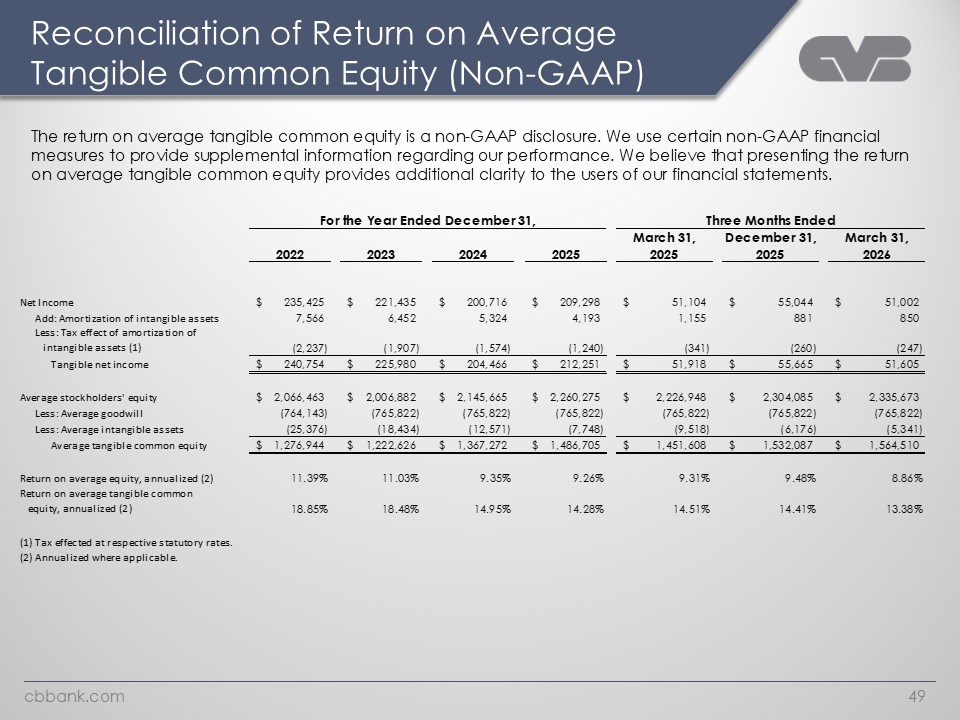
Reconciliation of Return on Average Tangible Common Equity (Non-GAAP) 49 The return on average tangible common equity is a non-GAAP disclosure. We use certain non-GAAP financial measures to provide supplemental information regarding our performance. We believe that presenting the return on average tangible common equity provides additional clarity to the users of our financial statements. For the Year Ended December 31, 2022 2023 2024 2025 Three Months Ended March 31, 2025 December 31, 2025 March 31,2026 Net Income 235,425 $ 221,435 $ 200,716 $ 209,298 $ 51,104 $ 55,044 $ 51,002 $ Add: Amortization of intangible assets 7,566 6,452 5,324 4,193 1,155 881 850 Less: Tax effect of amortization of intangible assets (1) (2,237) (1,907) (1,574) (1,240) (341) (260) (247) Tangible net income 240,754 $ 225,980 $ 204,466 $ 212,251 $ 51,918 $ 55,665 $ 51,605 $ Average stockholders' equity 2,066,463 $ 2,006,882 $ 2,145,665 $ 2,260,275 $ 2,226,948 $ 2,304,085 $ 2,335,673 $ Less: Average goodwill (764,143) (765,822) (765,822) (765,822) (765,822) (765,822) (765,822) Less: Average intangible assets (25,376) (18,434) (12,571) (7,748) (9,518) (6,176) (5,341) Average tangible common equity 1,276,944 $ 1,222,626 $ 1,367,272 $ 1,486,705 $ 1,451,608 $ 1,532,087 $ 1,564,510 $ Return on average equity, annualized (2) 11.39% 11.03% 9.35% 9.26% 9.31% 9.48% 8.86% Return on average tangible common equity, annualized (2) 18.85% 18.48% 14.95% 14.28% 14.51% 14.41% 13.38% (1) Tax effected at respective statutory rates. (2) Annualized where applicable. Cbbank.com 49
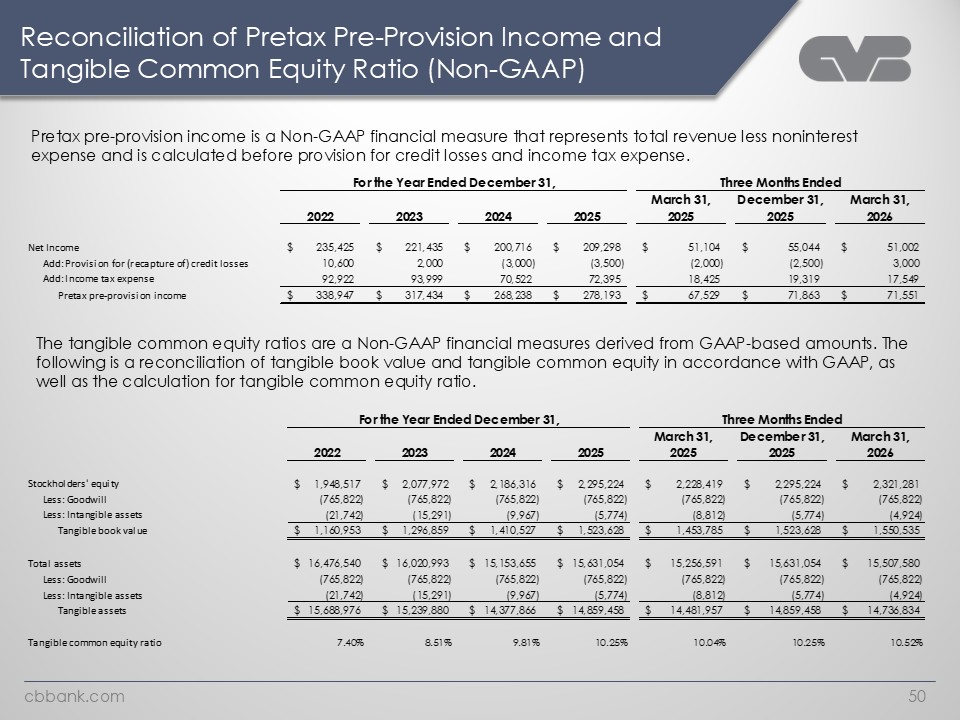
Reconciliation of Pretax Pre-Provision Income and Tangible Common Equity Ratio (Non-GAAP) Pretax pre-provision income is a Non-GAAP financial measure that represents total revenue less noninterest expense and is calculated before provision for credit losses and income tax expense. For the Year Ended December 31, Three Months Ended March 31, December 31, March 31, 2022 2023 2024 2025 2025 2025 2026 Net Income 235,425 $ 221,435 $ 200,716 $ 209,298 $ 51,104 $ 55,044 $ 51,002 $ Add: Provision for (recapture of) credit losses 10,600 2,000 (3,000) (3,500) (2,000) (2,500) 3,000Add: Income tax expense 92,922 93,999 70,522 72,395 18,425 19,319 17,549Pretax pre-provision income 338,947 $ 317,434 $ 268,238 $ 278,193 $ 67,529 $ 71,863 $ 71,551 The tangible common equity ratios are a Non-GAAP financial measures derived from GAAP-based amounts. The following is a reconciliation of tangible book value and tangible common equity in accordance with GAAP, as well as the calculation for tangible common equity ratio. For the Year Ended December 31, Three Months Ended March 31, December 31, March 31, 2022 2023 2024 2025 2025 2025 2026 Stockholders' equity 1,948,517 $ 2,077,972 $ 2,186,316 $ 2,295,224 $ 2,228,419 $ 2,295,224 $ 2,321,281 $ Less: Goodwill (765,822) (765,822) (765,822) (765,822) (765,822) (765,822) (765,822) Less: Intangible assets (21,742) (15,291) (9,967) (5,774) (8,812) (5,774) (4,924) Tangible book value 1,160,953 $ 1,296,859 $ 1,410,527 $ 1,523,628 $ 1,453,785 $ 1,523,628 $ 1,550,535 $ Total assets 16,476,540 $ 16,020,993 $ 15,153,655 $ 15,631,054 $ 15,256,591 $ 15,631,054 $ 15,507,580 $ Less: Goodwill (765,822) (765,822) (765,822) (765,822) (765,822) (765,822) (765,822) Less: Intangible assets (21,742) (15,291) (9,967) (5,774) (8,812) (5,774) (4,924) Tangible assets 15,688,976 $ 15,239,880 $ 14,377,866 $ 14,859,458 $ 14,481,957 $ 14,859,458 $ 14,736,834 $ Tangible common equity ratio 7.40% 8.51% 9.81% 10.25% 10.04% 10.25% 10.52% cbbank.com 50

CVB Financial Corp. Copy of presentation at www.cbbank.com Cbbank.com 50