☒ QUARTERLY REPORT PURSUANT TO SECTION 13 OR 15(d) OF THE SECURITIES EXCHANGE ACT OF 1934
For the quarterly period ended March 31, 2024
OR
☐ TRANSITION REPORT PURSUANT TO SECTION 13 OR 15(d) OF THE SECURITIES EXCHANGE ACT OF 1934
For the transition period from to
Commission File Number: 001-08359
NEW JERSEY RESOURCES CORPORATION
(Exact name of registrant as specified in its charter)
New Jersey
22-2376465
(State or other jurisdiction of incorporation or organization)
(I.R.S. Employer Identification Number)
1415 Wyckoff Road
(732)
938‑1480
Wall
New Jersey
07719
(Registrant's telephone number, including area code)
(Address of principal executive offices)
Securities registered pursuant to Section 12 (b) of the Act:
Title of each class
Trading symbol(s)
Name of each exchange on which registered
Common Stock - $2.50 Par Value
NJR
New York Stock Exchange
Indicate by check mark whether the registrant (1) has filed all reports required to be filed by Section 13 or 15(d) of the Securities Exchange Act of 1934 during the preceding 12 months (or for such shorter period that the registrant was required to file such reports), and (2) has been subject to such filing requirements for the past 90 days.
Yes: ☒ No: ☐
Indicate by check mark whether the registrant has submitted electronically every Interactive Data File required to be submitted pursuant to Rule 405 of Regulation S-T during the preceding 12 months (or for such shorter period that the registrant was required to submit such files).
Yes: ☒ No: ☐
Indicate by check mark whether the registrant is a large accelerated filer, an accelerated filer, a non-accelerated filer, a smaller reporting company or an emerging growth company. See definitions of “large accelerated filer,” “accelerated filer,” “smaller reporting company,” and “emerging growth company” in Rule 12b‑2 of the Exchange Act.
Large accelerated filer
☒
Accelerated filer
☐
Non-accelerated filer
☐
Smaller reporting company
☐
Emerging growth company
☐
If an emerging growth company, indicate by check mark if the registrant has elected not to use the extended transition period for complying with any new or revised financial accounting standards provided pursuant to Section 13(a) of the Exchange Act. o
Indicate by check mark whether the registrant is a shell company (as defined in Rule 12b-2 of the Exchange Act).
Yes: ☐ No: ☒
The number of shares outstanding of $2.50 par value Common Stock as of May 3, 2024 was 98,822,278.
NJR Clean Energy Ventures Corporation or our Clean Energy Ventures segment
CME
Chicago Mercantile Exchange
DRP
NJR Direct Stock Purchase and Dividend Reinvestment Plan
Energy Services or ES
NJR Energy Services Company, LLC or our Energy Services segment
Exchange Act
Securities Exchange Act of 1934, as amended
FASB
Financial Accounting Standards Board
FCM
Futures Commission Merchant
FERC
Federal Energy Regulatory Commission
Financial Margin
A non-GAAP financial measure, which represents revenues earned from the sale of natural gas less costs of natural gas sold including any transportation and storage costs, and excludes certain operations and maintenance expense and depreciation and amortization, as well as any accounting impact from the change in the fair value of certain derivative instruments
Fitch
Fitch Ratings Company
FMB
First Mortgage Bond
GAAP
Generally Accepted Accounting Principles of the United States
Home Services and Other or HSO
Home Services and Other Operations
ICE
Intercontinental Exchange
IIP
Infrastructure Investment Program
ISDA
The International Swaps and Derivatives Association
ITC
Federal Investment Tax Credit
Leaf River
Leaf River Energy Center LLC
M
Million
MGP
Manufactured Gas Plant
MMBtu
Million British Thermal Units
Moody's
Moody's Investors Service, Inc.
Mortgage Indenture
The Amended and Restated Indenture of Mortgage, Deed of Trust and Security Agreement between NJNG and U.S. Bank National Association dated as of September 1, 2014, as amended
MW
Megawatts
MWh
Megawatt Hour
NAESB
The North American Energy Standards Board
NFE
Net Financial Earnings
NJCEP
New Jersey's Clean Energy Program
NJDEP
New Jersey Department of Environmental Protection
NJNG
New Jersey Natural Gas Company or our Natural Gas Distribution segment
NJNG Credit Facility
The $250M unsecured committed credit facility expiring in September 2027
1
New Jersey Resources Corporation
GLOSSARY OF KEY TERMS (cont.)
NJR Credit Facility
The $650M unsecured committed credit facility expiring in September 2027
NJR or The Company
New Jersey Resources Corporation
NJR Retail
NJR Retail Company
NJRHS
NJR Home Services Company
Non-GAAP
Not in accordance with Generally Accepted Accounting Principles of the United States
NPNS
Normal Purchase/Normal Sale
NYMEX
New York Mercantile Exchange
OCI
Other Comprehensive Income
O&M
Operation and Maintenance expenses
OPEB
Other Postemployment Benefit Plans
PPA
Power Purchase Agreement
RAC
Remediation Adjustment Clause
REC
Renewable Energy Certificate
SAVEGREEN
The SAVEGREEN Project®
SBC
Societal Benefits Charge
SG&A
Selling, General and Administrative expenses
SREC
Solar Renewable Energy Certificate
Steckman Ridge
Collectively, Steckman Ridge GP, LLC and Steckman Ridge, LP
Storage and Transportation or S&T
Storage and Transportation segment
TETCO
Texas Eastern Transmission
TREC
Transition Renewable Energy Certificate
Trustee
U.S. Bank National Association
U.S.
The United States of America
USF
Universal Service Fund
Utility Gross Margin
A non-GAAP financial measure, which represents operating revenues less natural gas purchases, sales tax, and regulatory rider expense, and excludes certain operations and maintenance expense and depreciation and amortization
2
New Jersey Resources Corporation
INFORMATION CONCERNING FORWARD-LOOKING STATEMENTS
Certain statements contained in this report, including, without limitation, statements as to management expectations, assumptions and beliefs presented in Part I, Item 2. “Management's Discussion and Analysis of Financial Condition and Results of Operations,” Part I, Item 3. “Quantitative and Qualitative Disclosures About Market Risk,” Part II, Item 1. “Legal Proceedings” and in the notes to the financial statements are forward-looking statements within the meaning of Section 27A of the Securities Act of 1933, as amended, Section 21E of the Exchange Act and the Private Securities Litigation Reform Act of 1995. Forward-looking statements can also be identified by the use of forward-looking terminology such as “anticipate,” “estimate,” “may,” “could,” “might,” “intend,” “expect,” “believe,” “will” “plan,” “should” or comparable terminology and are made based upon management's current expectations, assumptions and beliefs as of this date concerning future developments and their potential effect on us. There can be no assurance that future developments will be in accordance with management's expectations, assumptions or beliefs, or that the effect of future developments on us will be those anticipated by management.
We caution readers that the expectations, assumptions and beliefs that form the basis for forward-looking statements regarding customer growth, customer usage, qualifications for ITCs, RECs, future rate case proceedings, financial condition, results of operations, cash flows, capital requirements, future capital expenditures, market risk, effective tax rate and other matters for fiscal 2024 and thereafter include many factors that are beyond our ability to control or estimate precisely, such as estimates of future market conditions, the behavior of other market participants and changes in the debt and equity capital markets. The factors that could cause actual results to differ materially from our expectations, assumptions and beliefs include, but are not limited to, those discussed in Item 1A. Risk Factors of our Annual Report on Form 10-K for the fiscal year ended September 30, 2023, as well as the following, which are neither presented in order of importance nor weighted:
•our ability to obtain governmental and regulatory approvals, permits, certificates, land-use rights, electric grid connection (in the case of clean energy projects) and/or financing for the construction, development and operation of our unregulated energy investments, pipeline transportation systems and NJNG and S&T infrastructure projects, in a timely manner;
•our ability to address concerns over long-term climate change;
•risks associated with our investments in clean energy projects, including the availability of regulatory incentives and federal tax credits, the availability of viable projects, our eligibility for ITCs, the future market for RECs and electricity prices, our ability to complete construction of the projects and operational risks related to projects in service;
•risks associated with acquisitions and the related integration of acquired assets with our current operations;
•our ability to comply with current and future regulatory requirements;
•risks associated with our pipeline of projects and timely completion of such projects;
•commercial and wholesale credit risks, including the availability of creditworthy customers and counterparties, and liquidity in the wholesale energy trading market;
•volatility of natural gas and other commodity prices and their impact on NJNG customer usage, NJNG’s BGSS incentive programs, ES operations and our risk management efforts;
•the performance of our subsidiaries;
•access to adequate supplies of natural gas and dependence on third-party S&T facilities for natural gas supply;
•the level and rate at which NJNG’s costs and expenses are incurred and the extent to which they are approved for recovery from customers through the regulatory process, including through future base rate case filings;
•impacts of inflation, including the current inflationary environment, and increased natural gas costs;
•the impact of a disallowance of recovery of environmental-related expenditures and other regulatory changes;
•operating risks incidental to handling, storing, transporting and providing customers with natural gas;
•demographic changes in our service territory and their effect on our customer growth;
•changes in rating agency requirements and/or credit ratings and their effect on availability and cost of capital to the Company;
•the impact of events causing volatility in the equity and credit markets on our access to capital, including natural disasters, pandemic illness and other extreme events and risks, political and economic disruption and uncertainty related to Russia’s military invasion of Ukraine, the Israel-Hamas War, and the international community’s responses;
•risks of prolonged constriction of credit availability in the markets and our ability to secure short-term financing;
•our ability to comply with debt covenants;
•the results of legal or administrative proceedings with respect to claims, rates, environmental issues, natural gas cost prudence reviews and other matters;
•risks related to cyberattacks, including ransomware, terrorism, other malicious acts against, or failure of, information technology systems;
•the impact to the asset values and resulting higher costs and funding obligations of our pension and postemployment benefit plans as a result of potential downturns in the financial markets, including, but not limited to, inflationary pressures, recessionary pressures, or rising interest rates, and/or reductions in bond yields;
•accounting effects and other risks associated with hedging activities and use of derivatives contracts;
•our ability to optimize our physical assets;
•weather and economic conditions, including those changes in weather and weather patterns that could be attributable to climate change;
•the costs of compliance with present and future environmental laws, potential climate change-related legislation or any legislation resulting from the 2019 New Jersey Energy Master Plan, as well as future executive orders and the outcomes of regulatory proceedings concerning natural gas;
•uncertainties related to litigation, regulatory, administrative or environmental proceedings;
•changes to tax laws and regulations, including our ability to optimize those changes brought about by the passage of the Inflation Reduction Act of 2022;
•any potential need to record a valuation allowance for our deferred tax assets;
•the delay or prevention of a favorable transaction due to changes in control provisions or laws;
•risks related to our employee workforce and succession planning;
•risks associated with the management of our joint ventures and partnerships; and
•risks associated with keeping pace with technological change, including, but not limited to, cloud computing and generative artificial intelligence.
Forward-looking statements made in this report apply only as of the date of this report. While we periodically reassess material trends and uncertainties affecting our results of operations and financial condition in connection with the preparation of management's discussion and analysis of results of operations and financial condition contained in our Quarterly and Annual Reports on Form 10-Q and Form 10-K, respectively, we do not, by including this statement, assume any obligation to review or revise any particular forward-looking statement referenced herein in light of future events.
3
New Jersey Resources Corporation
Part I
ITEM 1. FINANCIAL STATEMENTS
CONDENSED CONSOLIDATED STATEMENTS OF OPERATIONS (Unaudited)
Three Months Ended
Six Months Ended
March 31,
March 31,
(Thousands, except per share data)
2024
2023
2024
2023
OPERATING REVENUES
Utility
$
462,863
$
400,500
$
755,956
$
757,909
Nonutility
195,050
243,527
369,167
609,685
Total operating revenues
657,913
644,027
1,125,123
1,367,594
OPERATING EXPENSES
Natural gas purchases:
Utility
204,347
156,370
320,467
338,816
Nonutility
105,018
160,364
164,495
392,434
Related parties
1,799
1,770
3,678
3,597
Operation and maintenance
107,223
99,095
201,662
178,596
Regulatory rider expenses
29,229
23,154
48,418
41,405
Depreciation and amortization
40,075
38,090
80,362
74,773
Total operating expenses
487,691
478,843
819,082
1,029,621
OPERATING INCOME
170,222
165,184
306,041
337,973
Other income, net
15,420
4,779
21,761
9,434
Interest expense, net of capitalized interest
31,621
30,261
63,094
59,752
INCOME BEFORE INCOME TAXES AND EQUITY IN EARNINGS OF AFFILIATES
154,021
139,702
264,708
287,655
Income tax provision
33,947
30,586
56,883
63,564
Equity in earnings of affiliates
738
1,131
2,398
2,077
NET INCOME
$
120,812
$
110,247
$
210,223
$
226,168
EARNINGS PER COMMON SHARE
Basic
$1.23
$1.14
$2.14
$2.34
Diluted
$1.22
$1.13
$2.13
$2.32
WEIGHTED AVERAGE SHARES OUTSTANDING
Basic
98,377
96,893
98,123
96,689
Diluted
99,102
97,556
98,839
97,346
CONDENSED CONSOLIDATED STATEMENTS OF COMPREHENSIVE INCOME (Unaudited)
Three Months Ended
Six Months Ended
March 31,
March 31,
(Thousands)
2024
2023
2024
2023
Net income
$
120,812
$
110,247
$
210,223
$
226,168
Other comprehensive income, net of tax
Reclassifications of losses to net income on derivatives designated as hedging instruments, net of tax of $(80), $(80), $(159) and $(159), respectively
262
264
526
527
Adjustment to postemployment benefit obligation, net of tax of $(2,908), $(13), $(2,948) and $(25), respectively
9,624
41
9,755
82
Other comprehensive income, net of tax
$
9,886
$
305
$
10,281
$
609
Comprehensive income
$
130,698
$
110,552
$
220,504
$
226,777
See Notes to Unaudited Condensed Consolidated Financial Statements
4
New Jersey Resources Corporation
Part I
ITEM 1. FINANCIAL STATEMENTS (Continued)
CONDENSED CONSOLIDATED STATEMENTS OF CASH FLOWS (Unaudited)
Six Months Ended
March 31,
(Thousands)
2024
2023
CASH FLOWS FROM OPERATING ACTIVITIES
Net income
$
210,223
$
226,168
Adjustments to reconcile net income to cash flows from operating activities
Unrealized loss (gain) on derivative instruments
20,057
(17,532)
Depreciation and amortization
80,362
74,773
Amortization of acquired wholesale energy contracts
260
1,283
Allowance for equity used during construction
(3,572)
(2,801)
Allowance for doubtful accounts
(24)
(395)
Non cash lease expense
2,130
1,848
Deferred income taxes
49,301
36,072
Equivalent value of ITCs recognized on equipment financing
(10,605)
(899)
Manufactured gas plant remediation costs
(12,577)
(4,362)
Cost of removal - asset retirement obligations
(763)
(644)
Contributions to postemployment benefit plans
(2,191)
(634)
Taxes related to stock-based compensation
1,186
554
Changes in:
Components of working capital
(3,021)
(42,519)
Other noncurrent assets and liabilities
7,836
72,209
Cash flows from operating activities
338,602
343,121
CASH FLOWS USED IN INVESTING ACTIVITIES
Expenditures for:
Utility plant
(160,937)
(157,914)
Solar equipment
(37,083)
(57,699)
Storage and Transportation and other
(21,846)
(30,741)
Cost of removal
(17,436)
(16,757)
Distribution from equity investees in excess of equity in earnings
2,284
1,374
Cash flows used in investing activities
(235,018)
(261,737)
CASH FLOWS USED IN FINANCING ACTIVITIES
Proceeds from long-term debt
50,000
175,000
Payments of long-term debt
(82,790)
(10,534)
Payments of term loan
—
(150,000)
Payments of short-term debt, net
(55,950)
(86,300)
Proceeds from sale leaseback transactions - solar
24,394
61,808
Proceeds from sale leaseback transactions - natural gas meters
8,814
8,441
Payments of common stock dividends
(82,156)
(75,200)
Proceeds from waiver discount issuance of common stock
35,838
17,919
Proceeds from issuance of common stock - DRP
7,522
7,610
Tax withholding payments related to net settled stock compensation
(5,027)
(4,024)
Cash flows used in financing activities
(99,355)
(55,280)
Change in cash, cash equivalents and restricted cash
4,229
26,104
Cash, cash equivalents and restricted cash at beginning of period
1,517
1,452
Cash, cash equivalents and restricted cash at end of period
$
5,746
$
27,556
CHANGES IN COMPONENTS OF WORKING CAPITAL
Receivables
$
(144,321)
$
(8,877)
Inventories
115,166
185,444
Recovery of natural gas costs
(3,853)
(28,825)
Natural gas purchases payable
13,178
(159,016)
Natural gas purchases payable - related parties
—
5
Deferred revenue, current
48,294
1,587
Accounts payable and other
(15,888)
(24,095)
Prepaid expenses
(6,350)
(6,493)
Prepaid and accrued taxes
30,705
51,591
Restricted broker margin accounts
(15,015)
(43,414)
Customers' credit balances and deposits
(20,032)
(7,725)
Other current assets and liabilities
(4,905)
(2,701)
Total
$
(3,021)
$
(42,519)
SUPPLEMENTAL DISCLOSURES OF CASH FLOWS INFORMATION
Cash paid for:
Interest (net of amounts capitalized)
$
60,256
$
57,622
Income taxes
$
6,699
$
1,967
Accrued capital expenditures
$
17,513
$
24,318
See Notes to Unaudited Condensed Consolidated Financial Statements
5
New Jersey Resources Corporation
Part I
ITEM 1. FINANCIAL STATEMENTS (Continued)
CONDENSED CONSOLIDATED BALANCE SHEETS
ASSETS
(Unaudited)
(Thousands)
March 31, 2024
September 30, 2023
PROPERTY, PLANT AND EQUIPMENT
Utility plant, at cost
$
4,012,235
$
3,843,037
Construction work in progress
223,421
237,428
Nonutility plant and equipment, at cost
1,791,100
1,767,306
Construction work in progress
171,396
142,768
Total property, plant and equipment
6,198,152
5,990,539
Accumulated depreciation and amortization, utility plant
(753,750)
(714,087)
Accumulated depreciation and amortization, nonutility plant and equipment
(278,854)
(254,397)
Property, plant and equipment, net
5,165,548
5,022,055
CURRENT ASSETS
Cash and cash equivalents
5,036
954
Customer accounts receivable
Billed
185,069
97,540
Unbilled revenues
74,456
19,100
Allowance for doubtful accounts
(9,576)
(11,036)
Regulatory assets
93,887
73,587
Natural gas in storage, at average cost
80,996
199,501
Materials and supplies, at average cost
30,361
27,022
Prepaid expenses
16,091
9,741
Prepaid taxes
18,299
43,046
Derivatives, at fair value
14,056
30,755
Restricted broker margin accounts
19,310
20,796
Other current assets
25,726
21,071
Total current assets
553,711
532,077
NONCURRENT ASSETS
Investments in equity method investees
101,778
104,134
Regulatory assets
535,104
584,830
Operating lease assets
177,176
175,740
Derivatives, at fair value
910
1,564
Software costs
9,734
8,375
Deferred income taxes
22,848
28,383
Postemployment employee benefit assets
18,618
18,684
Other noncurrent assets
61,950
61,654
Total noncurrent assets
928,118
983,364
Total assets
$
6,647,377
$
6,537,496
See Notes to Unaudited Condensed Consolidated Financial Statements
6
New Jersey Resources Corporation
Part I
ITEM 1. FINANCIAL STATEMENTS (Continued)
CAPITALIZATION AND LIABILITIES
(Unaudited)
(Thousands, except share data)
March 31, 2024
September 30, 2023
CAPITALIZATION
Common stock, $2.50 par value; authorized 150,000,000 shares; outstanding shares March 31, 2024 — 98,744,915; September 30, 2023 — 97,584,455
$
246,367
$
243,458
Premium on common stock
604,009
558,654
Accumulated other comprehensive income (loss), net of tax
322
(9,959)
Treasury stock at cost and other; shares March 31, 2024 — 16,302;
September 30, 2023 — 13,041
22,936
20,748
Retained earnings
1,305,591
1,177,834
Common stock equity
2,179,225
1,990,735
Long-term debt
2,726,221
2,768,017
Total capitalization
4,905,446
4,758,752
CURRENT LIABILITIES
Current maturities of long-term debt
148,375
116,155
Short-term debt
196,150
252,100
Natural gas purchases payable
64,455
51,277
Natural gas purchases payable to related parties
859
859
Deferred revenue
109,698
61,404
Accounts payable and other
127,159
151,790
Dividends payable
41,290
40,981
Accrued taxes
16,048
10,090
Regulatory liabilities
33,163
32,287
New Jersey Clean Energy Program
6,827
15,804
Derivatives, at fair value
10,725
16,145
Operating lease liabilities
4,780
4,772
Restricted broker margin accounts
4,689
8,029
Customers' credit balances and deposits
24,878
44,910
Total current liabilities
789,096
806,603
NONCURRENT LIABILITIES
Deferred income taxes
330,805
285,427
Deferred investment tax credits
2,295
2,434
Deferred revenue
612
659
Derivatives, at fair value
13,791
7,967
Manufactured gas plant remediation
157,813
169,390
Postemployment employee benefit liability
42,333
102,528
Regulatory liabilities
178,276
180,458
Operating lease liabilities
150,971
148,023
Asset retirement obligations
62,817
61,993
Other noncurrent liabilities
13,122
13,262
Total noncurrent liabilities
952,835
972,141
Commitments and contingent liabilities (Note 13)
Total capitalization and liabilities
$
6,647,377
$
6,537,496
See Notes to Unaudited Condensed Consolidated Financial Statements
7
New Jersey Resources Corporation
Part I
ITEM 1. FINANCIAL STATEMENTS (Continued)
CONDENSED CONSOLIDATED STATEMENTS OF COMMON STOCK EQUITY (Unaudited)
(Thousands)
Number of Shares
Common Stock
Premium on Common Stock
Accumulated Other Comprehensive (Loss) Income
Treasury Stock and Other
Retained Earnings
Total
Balance as of September 30, 2023
97,584
$
243,458
$
558,654
$
(9,959)
$
20,748
$
1,177,834
$
1,990,735
Net income
—
—
—
—
—
89,411
89,411
Other comprehensive income
—
—
—
395
—
—
395
Common stock issued:
Incentive compensation plan
116
290
3,451
—
—
—
3,741
Dividend reinvestment plan
94
236
3,552
—
—
—
3,788
Waiver discount
410
1,025
16,894
—
—
—
17,919
Cash dividend declared ($.42 per share)
—
—
—
—
—
(41,176)
(41,176)
Treasury stock and other
(2)
—
—
—
1,388
—
1,388
Balance as of December 31, 2023
98,202
$
245,009
$
582,551
$
(9,564)
$
22,136
$
1,226,069
$
2,066,201
Net income
—
—
—
—
—
120,812
120,812
Other comprehensive income
—
—
—
9,886
—
—
9,886
Common stock issued:
Incentive compensation plan
25
64
1,178
—
—
—
1,242
Dividend reinvestment plan
84
209
3,446
—
—
—
3,655
Waiver discount
435
1,085
16,834
—
—
—
17,919
Cash dividend declared ($.42 per share)
—
—
—
—
—
(41,290)
(41,290)
Treasury stock and other
(1)
—
—
—
800
—
800
Balance as of March 31, 2024
98,745
$
246,367
$
604,009
$
322
$
22,936
$
1,305,591
$
2,179,225
(Thousands)
Number of Shares
Common Stock
Premium on Common Stock
Accumulated Other Comprehensive (Loss) Income
Treasury Stock and Other
Retained Earnings
Total
Balance as of September 30, 2022
96,250
$
241,616
$
519,697
$
(4,826)
$
(6,805)
$
1,067,528
$
1,817,210
Net income
—
—
—
—
—
115,921
115,921
Other comprehensive income
—
—
—
304
—
—
304
Common stock issued:
Incentive compensation plan
92
229
3,243
—
—
—
3,472
Dividend reinvestment plan (1)
93
—
437
—
3,429
—
3,866
Waiver discount
368
—
4,469
—
13,450
—
17,919
Cash dividend declared ($.39 per share)
—
—
—
—
—
(37,665)
(37,665)
Treasury stock and other
—
—
—
—
1,768
—
1,768
Balance as of December 31, 2022
96,803
$
241,845
$
527,846
$
(4,522)
$
11,842
$
1,145,784
$
1,922,795
Net income
—
—
—
—
—
110,247
110,247
Other comprehensive income
—
—
—
305
—
—
305
Common stock issued:
Incentive plan
29
74
1,096
—
—
—
1,170
Dividend reinvestment plan
77
—
877
—
2,794
—
3,671
Cash dividend declared ($.39 per share)
—
—
—
—
—
(37,791)
(37,791)
Treasury stock and other
(8)
—
—
—
439
—
439
Balance as of March 31, 2023
96,901
$
241,919
$
529,819
$
(4,217)
$
15,075
$
1,218,240
$
2,000,836
(1)Certain shares sold through the DRP issued from treasury stock are at average cost, which may differ from the actual market price paid.
8
New Jersey Resources Corporation
Part I
NOTES TO UNAUDITED CONDENSED CONSOLIDATED FINANCIAL STATEMENTS
1. NATURE OF THE BUSINESS
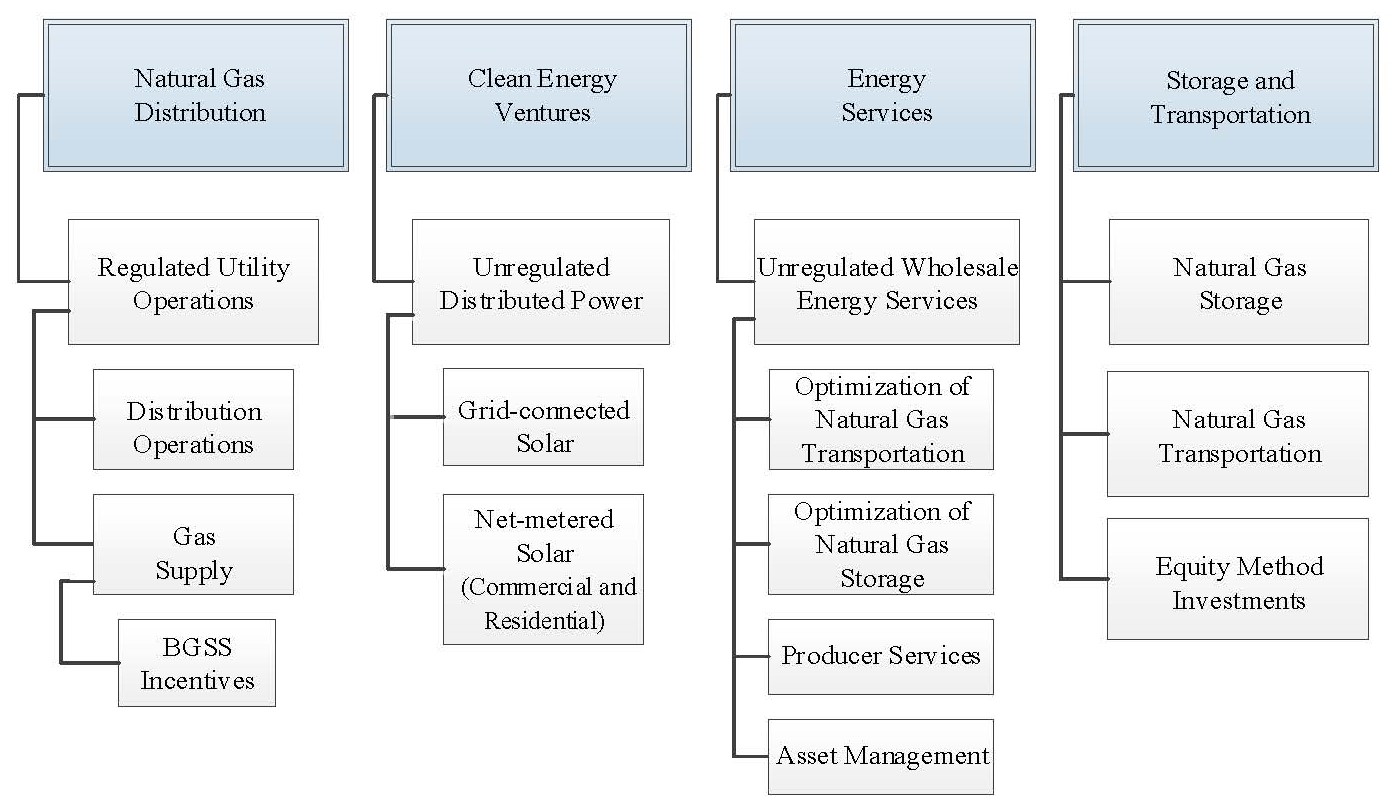
The Company provides regulated natural gas distribution services, transmission and storage services and operates certain unregulated businesses primarily through the following:
NJNG provides natural gas utility service to approximately 581,600 customers throughout Burlington, Middlesex, Monmouth, Morris, Ocean and Sussex counties in New Jersey and is subject to rate regulation by the BPU. NJNG comprises the Natural Gas Distribution segment.
Clean Energy Ventures, the Company's clean energy subsidiary, comprises the CEV segment and invests in, owns and operates clean energy projects, including commercial and residential solar installations located in New Jersey, Rhode Island, New York, Connecticut, Michigan and Indiana.
Energy Services comprises the ES segment. ES maintains and transacts around a portfolio of natural gas transportation and storage capacity contracts and provides physical wholesale energy, retail energy and energy management services in the U.S. and Canada.
NJR Midstream Holdings Corporation, which comprises the S&T segment, invests in energy-related ventures through its subsidiaries. The Company operates natural gas storage and transmission assets through the wholly-owned subsidiaries of Leaf River and Adelphia, and is subject to rate regulation by FERC. The Company holds a 50% combined ownership interest in Steckman Ridge, located in Pennsylvania which is accounted for under the equity method of accounting.
NJR Retail Holdings Corporation has one principal subsidiary, NJRHS, which provides heating, central air conditioning, standby generators, solar and other indoor and outdoor comfort products to residential homes throughout New Jersey. NJRHS is included in HSO.
2. SUMMARY OF SIGNIFICANT ACCOUNTING POLICIES
The accompanying Unaudited Condensed Consolidated Financial Statements have been prepared by the Company in accordance with the rules and regulations of the U.S. Securities and Exchange Commission and GAAP. The September 30, 2023 Balance Sheet data is derived from the audited financial statements of the Company. These Unaudited Condensed Consolidated Financial Statements should be read in conjunction with the consolidated financial statements and the notes thereto included in the Company's 2023 Annual Report on Form 10-K.
The Unaudited Condensed Consolidated Financial Statements include the accounts of NJR and its subsidiaries. In the opinion of management, the accompanying Unaudited Condensed Consolidated Financial Statements reflect all adjustments necessary for a fair presentation of the results of the interim periods presented. These adjustments are of a normal and recurring nature. Because of the seasonal nature of the Company's utility and wholesale energy services operations, in addition to other factors, the financial results for the interim periods presented are not indicative of the results that are to be expected for the fiscal year ending September 30, 2024. Intercompany transactions and accounts have been eliminated.
Use of Estimates
The preparation of financial statements in conformity with GAAP requires the Company to make estimates that affect the reported amounts of assets, liabilities, revenues, expenses and related disclosure of contingencies during the reporting period. On a quarterly basis or more frequently whenever events or changes in circumstances indicate a need, the Company evaluates its estimates, including those related to the calculation of the fair value of derivative instruments, debt, equity method investments, lease liabilities, unbilled revenues, allowance for doubtful accounts, provisions for depreciation and amortization, long-lived assets, regulatory assets and liabilities, income taxes, pensions and other postemployment benefits, contingencies related to environmental matters and litigation. Asset retirement obligations are evaluated periodically as required. The Company’s estimates are based on historical experience and on various other assumptions that are believed to be reasonable under the circumstances, the results of which form the basis for making judgments about the carrying value of assets and liabilities that are not readily apparent from other sources.
The Company has legal, regulatory and environmental proceedings during the normal course of business that can result in loss contingencies. When evaluating the potential for a loss, the Company will establish a reserve if a loss is probable and can be reasonably estimated, in which case it is the Company’s policy to accrue the full amount of such estimates. Where the information is sufficient only to establish a range of probable liability, and no point within the range is more likely than any other, it is the Company’s policy to accrue the lower end of the range. In the normal course of business, estimated amounts are subsequently adjusted to actual results that may differ from estimates.
Revenues
Revenues from the sale of natural gas to NJNG customers are recognized in the period that natural gas is delivered and consumed by customers, including an estimate for unbilled revenue. NJNG records unbilled revenue for natural gas services. Natural gas sales to individual customers are based on meter readings, which are performed on a systematic basis throughout the month. At the end of each month, the amount of natural gas delivered to each customer after the last meter reading through the end of the respective accounting period is estimated, and recognizes unbilled revenues related to these amounts. The unbilled revenue estimates are based on estimated customer usage by customer type, weather effects, unaccounted-for natural gas and the most current tariff rates.
CEV recognizes revenue when SRECs are transferred to counterparties. SRECs are physically delivered through the transfer of certificates as per contractual settlement schedules. The Clean Energy Act of 2018 established guidelines for the closure of the SREC registration program to new applicants in New Jersey. The SREC program officially closed to new qualified solar projects on April 30, 2020.
In December 2019, the BPU established the TREC as the successor to the SREC program. TRECs provide a fixed compensation base multiplied by an assigned project factor in order to determine their value. The project factor is determined by the type and location of the project, as defined.
In July 2021, the BPU established a new successor solar incentive program. The Administratively Determined Incentive Program provides administratively set incentives for net metered residential projects and net metered non-residential projects of 5 MW or less. RECs generated through the production of electricity under this program are known as SREC IIs.
TRECs and SREC IIs generated are required to be purchased monthly by a REC program administrator as appointed by the BPU. Revenue for TRECs and SREC IIs are recognized upon generation and are transferred monthly based upon metered solar electricity activity.
Revenues for ES are recognized when the natural gas is physically delivered to the customer. In addition, changes in the fair value of derivatives that economically hedge the forecasted sales of the natural gas are recognized in operating revenues as they occur. ES also recognizes changes in the fair value of SREC derivative contracts as a component of operating revenues.
During December 2020, ES entered into a series of AMAs with an investment grade public utility to release pipeline capacity associated with certain natural gas transportation contracts, which commenced in November 2021. The AMAs include a series of temporary and permanent releases and revenue under these agreements is recognized as the performance obligations are satisfied. For temporary releases of pipeline capacity, revenue is recognized on a straight-line basis over the agreed upon term. For permanent releases of pipeline capacity, which represent a transfer of contractual rights for such capacity, revenue is recognized upon the transfer of the underlying contractual rights. ES recognized operating revenue of $9.5M during both the three months ended March 31, 2024 and 2023, and$19.0M and $29.5M during the six months ended March 31, 2024 and 2023, respectively, on the Unaudited Condensed Consolidated Statements of Operations. Amounts received in excess of revenue totaling $107.2M and $58.7M are included in deferred revenue on the Unaudited Condensed Consolidated Balance Sheets as of March 31, 2024 and September 30, 2023, respectively.
S&T generates revenues from firm storage contracts and transportation contracts, related usage fees and hub services for the use of storage space, injections and withdrawals from their natural gas storage facility and the delivery of natural gas to customers. Demand fees are recognized as revenue over the term of the related agreement while usage fees and hub services revenues are recognized as services are performed.
Revenues from all other activities are recorded in the period during which products or services are delivered and accepted by customers, or over the related contractual term. See Note 3. Revenue for further information.
Cash and Cash Equivalents
Cash and cash equivalents consist of cash on deposit and temporary investments with maturities of three months or less, and excludes restricted cash related to escrow balances for utility plant projects at NJNG, which are recorded in other noncurrent assets on the Unaudited Condensed Consolidated Balance Sheets.
The following table provides a reconciliation of cash and cash equivalents and restricted cash reported in the Unaudited Condensed Consolidated Balance Sheets to the total amounts in the Unaudited Condensed Consolidated Statements of Cash Flows as follows:
(Thousands)
March 31, 2024
September 30, 2023
March 31, 2023
Balance Sheet
Cash and cash equivalents
$
5,036
$
954
$
27,095
Restricted cash in other noncurrent assets
$
710
$
563
$
461
Statements of Cash Flow
Cash, cash equivalents and restricted cash
$
5,746
$
1,517
$
27,556
Allowance for Doubtful Accounts
The Company segregates financial assets, primarily trade receivables and unbilled revenues due in one year or less, into portfolio segments based on shared risk characteristics, such as geographical location and regulatory environment, for evaluation of expected credit losses. Historical and current information, such as average write-offs, are applied to each portfolio segment to estimate the allowance for losses on uncollectible receivables. Additionally, the allowance for losses on uncollectible receivables is adjusted for reasonable and supportable forecasts of future economic conditions, which can include changing weather, commodity prices, regulations, and macroeconomic factors, such as unemployment rates among others.
Loans Receivable
NJNG currently provides loans, with terms ranging from two to 10 years, to customers that elect to purchase and install certain energy-efficient equipment in accordance with its BPU-approved SAVEGREEN program. The loans are recognized at fair value on the Unaudited Condensed Consolidated Balance Sheets. The Company has $15.8M and $15.1M recorded in other current assets and $43.6M and $39.0M in other noncurrent assets as of March 31, 2024 and September 30, 2023, respectively, on the Unaudited Condensed Consolidated Balance Sheets, related to the loans. The Company regularly evaluates the credit quality and collection profile of its customers. If NJNG determines a loan is impaired, the basis of the loan would be subject to regulatory review for recovery. As of March 31, 2024 and September 30, 2023, the Company has not recorded any impairments for SAVEGREEN loans.
Natural Gas in Storage
The following table summarizes natural gas in storage, at average cost by segment as of:
March 31, 2024
September 30, 2023
($ in thousands)
Natural Gas in Storage
Bcf
Natural Gas in Storage
Bcf
NJNG
$
60,539
9.2
$
175,025
29.1
ES
20,457
11.3
24,476
14.6
Total
$
80,996
20.5
$
199,501
43.7
Software Costs
The Company capitalizes certain costs, such as software design and configuration, coding, testing and installation, that are incurred to purchase or create and implement computer software for internal use. Capitalized costs include external costs of materials and services utilized in developing or obtaining internal-use software and payroll and payroll-related costs for employees who are directly associated with and devote time to the internal-use software project. Maintenance costs are expensed as incurred. Upgrades and enhancements are capitalized if it is probable that such expenditures will result in additional functionality. Amortization is recorded on the straight-line basis over the estimated useful lives.
The following tables present the software costs included in the Unaudited Condensed Consolidated Financial Statements:
(Thousands)
March 31, 2024
September 30, 2023
Balance Sheets
Utility plant, at cost
$
88,234
$
51,282
Construction work in progress
$
45,573
$
55,012
Nonutility plant and equipment, at cost
$
344
$
344
Accumulated depreciation and amortization, utility plant
$
(9,728)
$
(7,480)
Accumulated depreciation and amortization, nonutility plant and equipment
$
(42)
$
(36)
Software costs
$
9,734
$
8,375
Three Months Ended
Six Months Ended
March 31,
March 31,
Statements of Operations
2024
2023
2024
2023
Operation and maintenance
$
2,674
$
3,886
$
5,927
$
7,638
Depreciation and amortization
$
1,265
$
957
$
2,254
$
1,828
Sale Leasebacks
NJNG utilizes sale leaseback arrangements as a financing mechanism to fund certain of its capital expenditures related to natural gas meters, whereby the physical asset is sold concurrent with an agreement to lease the asset back. These agreements include options to renew the lease or repurchase the asset at the end of the term. As NJNG retains control of the natural gas meters, these arrangements do not qualify as a sale. NJNG uses the financing method to account for the transactions. Proceeds from sale leaseback transactions are accounted for as financing arrangements and are included in long-term debt on the Unaudited Condensed Consolidated Balance Sheets.
In addition, for certain of its commercial solar energy projects, the Company enters into lease agreements that provide for the sale of commercial solar energy assets to third parties and the concurrent leaseback of the assets. For sale leaseback transactions where the Company has concluded that the arrangement does not qualify as a sale as the Company retains control of the underlying assets, the Company uses the financing method to account for the transaction. Under the financing method, the Company recognizes the proceeds received from the buyer-lessor that constitute a payment to acquire the solar energy asset as a financing arrangement, which is recorded as a component of debt on the Unaudited Condensed Consolidated Balance Sheets.
The Company continues to operate the solar assets and is responsible for related expenses and entitled to retain the revenue generated from SRECs, TRECs, SREC IIs and energy sales. The ITCs and other tax benefits associated with these solar projects transfer to the buyer; however, the payments are structured so that CEV is compensated for the transfer of the related tax attributes. Accordingly, CEV recognizes the equivalent value of the tax attributes in other income on the Unaudited Condensed Consolidated Statements of Operations over the respective five-year ITC recapture periods, starting with the second year of the lease.
See Note 9. Debtfor more details regarding sale leaseback transactions recorded as financing arrangements.
Accumulated Other Comprehensive Income (Loss)
The following table presents the changes in the components of accumulated other comprehensive income (loss), net of related tax effects during the three months ended March 31, 2024 and 2023:
(Thousands)
Cash Flow Hedges
Postemployment Benefit Obligation
Total
Balance as of December 31, 2023
$
(7,005)
$
(2,559)
$
(9,564)
Other comprehensive income (loss), net of tax
Other comprehensive income, before reclassifications, net of tax of $0, $(3,020), $(3,020), respectively
—
9,992
9,992
Amounts reclassified from accumulated other comprehensive income (loss), net of tax of $(80), $112, $32, respectively
262
(368)
(1)
(106)
Net current-period other comprehensive income, net of tax of $(80), $(2,908), $(2,988), respectively
262
9,624
9,886
Balance as of March 31, 2024
$
(6,743)
$
7,065
$
322
Balance as of December 31, 2022
$
(8,059)
$
3,537
$
(4,522)
Other comprehensive income, net of tax
Amounts reclassified from accumulated other comprehensive income, net of tax of $(80), $(13), $(93)
264
41
(1)
305
Balance as of March 31, 2023
$
(7,795)
$
3,578
$
(4,217)
(1)Included in the computation of net periodic pension cost, a component of operations and maintenance expense on the Unaudited Condensed Consolidated Statements of Operations.
The following table presents the changes in the components of accumulated other comprehensive income (loss), net of related tax effects during the six months ended March 31, 2024 and 2023:
(Thousands)
Cash Flow Hedges
Postemployment Benefit Obligation
Total
Balance as of September 30, 2023
$
(7,269)
$
(2,690)
$
(9,959)
Other comprehensive income (loss), net of tax
Other comprehensive income, before reclassifications, net of tax of $0, $(3,020) and $(3,020), respectively
—
9,992
9,992
Amounts reclassified from accumulated other comprehensive income (loss), net of tax of $(159), $72 and $(87), respectively
526
(237)
(1)
289
Net current-period other comprehensive income, net of tax of $(159), $(2,948), $(3,107), respectively
526
9,755
10,281
Balance as of March 31, 2024
$
(6,743)
$
7,065
$
322
Balance as of September 30, 2022
$
(8,322)
$
3,496
$
(4,826)
Other comprehensive income, net of tax
Amounts reclassified from accumulated other comprehensive income, net of tax of $(159), $(25) and $(184), respectively
527
82
(1)
609
Balance as of March 31, 2023
$
(7,795)
$
3,578
$
(4,217)
(1)Included in the computation of net periodic pension cost, a component of operations and maintenance expense on the Unaudited Condensed Consolidated Statements of Operations.
Reclassification
Certain prior period amounts have been reclassified to conform to the current period presentation. Deferred income taxes and postemployment employee benefit assets previously classified within other noncurrent assets on the Unaudited Condensed Consolidated Balance Sheets have been reclassified to their own categories. Intangible assets, net previously classified in its own category on the Unaudited Condensed Consolidated Balance Sheets has been reclassified into other noncurrent assets. Other noncurrent assets and other noncurrent liabilities previously classified in their own categories on the Unaudited Condensed Consolidated Statements of Cash Flow have been combined into one category.
9
New Jersey Resources Corporation
Part I
NOTES TO UNAUDITED CONDENSED CONSOLIDATED FINANCIAL STATEMENTS (Continued)
Recently Adopted Updates to the Accounting Standards Codification
Business Combinations
In October 2021, the FASB issued ASU No. 2021-08, an amendment to ASC 805, Business Combinations, which requires that an acquirer recognize, and measure contract assets and contract liabilities acquired in a business combination in accordance with Topic 606, Revenue from Contracts with Customers. The guidance was effective for the Company beginning October 1, 2023, and was applied on a prospective basis to new acquisitions following the date of adoption. As the Company has not executed a transaction that would qualify as a business combination, there was no impact on its financial position, results of operations, cash flows and disclosures upon adoption.
Derivatives and Hedging
In March 2022, the FASB issued ASU No. 2022-01, an amendment to ASC 815, Derivatives and Hedging, which addresses fair value hedge accounting of interest rate risk for portfolios of financial assets. This update further clarifies guidance previously released in ASU 2017-12 which established the "last-of-layer" method and this update renames that method as the “portfolio layer” method. The guidance was effective for the Company beginning October 1, 2023. As the Company does not currently apply hedge accounting to any of its risk management activities, there was no impact on its financial position, results of operations, cash flows and disclosures upon adoption.
Financial Instruments
In March 2022, the FASB issued ASU No. 2022-02, an amendment to ASC 326, Financial Instruments-Credit Losses, which eliminates the accounting guidance for creditors in troubled debt restructuring. It also aligns conflicting disclosure requirement guidance in ASC 326 by requiring disclosure of current-period gross write-offs by year of origination. The amendment also adds new disclosures for creditors with loan refinancing and restructuring for borrowers experiencing financial difficulty. The guidance was effective for the Company beginning October 1, 2023. Since the Company has not experienced a troubled debt restructuring, there was no impact on its financial position, results of operations, cash flows and disclosures upon adoption.
Other Recent Updates to the Accounting Standards Codification
Fair Value Measurement
In June 2022, the FASB issued ASU No. 2022-03, an amendment to ASC 820, Fair Value Measurement. The amendment clarifies the fair value principles when measuring the fair value of an equity security subject to a contractual sale restriction. The guidance is effective for the Company on October 1, 2024, and will be applied on a prospective basis. At this time, the Company does not have equity securities subject to contractual sale restrictions, and therefore this amendment would only impact the Company upon adoption if, in the future, it entered into such transactions.
Leases
In March 2023, the FASB issued ASU No. 2023-01, an amendment to ASC 842, Leases, which applies to arrangements between related parties under common control. This update requires that all entities with common control arrangements classify and account for these leases on the same basis as an arrangement with an unrelated party. If the lessee in these types of arrangements continues to control the use of the underlying asset through a lease, the leasehold improvements are to be amortized over the improvements’ useful life to the common control group, regardless of the lease term. The guidance is effective for the Company on October 1, 2024, and the Company will elect to apply it on a prospective basis. At this time, the Company does not have leases that are subject to this amendment, and therefore it would only impact the Company upon adoption if, in the future, it entered into such transactions.
Business Combinations
In August 2023, the FASB issued ASU No. 2023-05, an amendment to ASC 805, Business Combinations, which addresses how a joint venture should recognize contributions received upon its formation. Joint ventures must account for initial assets and liabilities received at fair value on the date the joint venture is formed. The guidance is effective for the Company for joint ventures formed beginning January 1, 2025, and the Company can elect to apply it either prospectively or retrospectively back to a joint venture’s formation date provided adequate information is available. Early adoption is permitted. This amendment would only impact the Company upon adoption if, in the future, it entered into an applicable transaction.
10
New Jersey Resources Corporation
Part I
NOTES TO UNAUDITED CONDENSED CONSOLIDATED FINANCIAL STATEMENTS (Continued)
Segment Reporting
In November 2023, the FASB issued ASU No. 2023-07, an amendment to ASC 280, Segment Reporting, which improves reportable segment disclosure requirements, primarily through enhanced disclosures about significant segment expenses. The update requires entities to disclosure significant segment expenses that are regularly provided to the chief operating decision maker and included within segment profit and loss, and it enhances interim disclosure requirements to conform with annual requirements. This update becomes effective for the Company on October 1, 2024 for the first annual period and on October 1, 2025 for the interim periods. It will be applied retrospectively for the enhanced segment disclosure requirements to all periods presented, with early adoption permitted. The Company is currently evaluating the amendment to understand the impacts on its financial position, results of operations, cash flows and disclosures upon adoption.
Income Taxes
In December 2023, the FASB issued ASU No. 2023-09, an amendment to ASC 740, Income Taxes, which requires disaggregated information about a reporting entity’s effective tax rate reconciliation and income taxes paid. It will provide investors more detailed income tax disclosures that would be useful in making capital allocation decisions. The guidance is effective for the Company on October 1, 2025, and can be applied either prospectively or retrospectively. Early adoption is permitted. The Company is currently evaluating the amendment to understand the impacts on its financial position, results of operations, cash flows and disclosures upon adoption.
3. REVENUE
Revenue is recognized when a performance obligation is satisfied by transferring control of a product or service to a customer. Revenue is measured based on consideration specified in a contract with a customer using the output method of progress. The Company elected to apply the invoice practical expedient for recognizing revenue, whereby the amounts invoiced to customers represent the value to the customer and the Company’s performance completion as of the invoice date. Therefore, the Company does not disclose related unsatisfied performance obligations. The Company also elected the practical expedient to exclude from the transaction price all sales taxes that are assessed by a governmental authority and therefore presents sales tax net in operating revenues on the Unaudited Condensed Consolidated Statements of Operations.
Below is a listing of performance obligations that arise from contracts with customers, along with details on the satisfaction of each performance obligation, the significant payment terms and the nature of the goods and services being transferred, by reporting segment and other business operations:
Revenue Recognized Over Time:
Segment/ Operations
Performance Obligation
Description
NJNG
Natural gas utility sales
NJNG's performance obligation is to provide natural gas to residential, commercial and industrial customers as demanded, based on regulated tariff rates, which are established by the BPU. Revenues from the sale of natural gas are recognized in the period that natural gas is delivered and consumed by customers, including an estimate for quantities consumed but not billed during the period. Payment is due each month for the previous month's deliveries. Natural gas sales to individual customers are based on meter readings, which are performed on a systematic basis throughout the billing period. The unbilled revenue estimates are based on estimated customer usage by customer type, weather effects and the most current tariff rates. NJNG is entitled to be compensated for performance completed until service is terminated.
Customers may elect to purchase the natural gas commodity from NJNG or may contract separately to purchase natural gas directly from third-party suppliers. As NJNG is acting as an agent on behalf of the third-party supplier, revenue is recorded for the delivery of natural gas to the customer.
CEV
Commercial solar electricity
CEV operates wholly-owned solar projects that recognize revenue as electricity is generated and transferred to the customer. The performance obligation is to provide electricity to the customer in accordance with contract terms or the interconnection agreement and is satisfied upon transfer of electricity generated.
Revenue is recognized as invoiced and the payment is due each month for the previous month's services.
11
New Jersey Resources Corporation
Part I
NOTES TO UNAUDITED CONDENSED CONSOLIDATED FINANCIAL STATEMENTS (Continued)
Revenue Recognized Over Time (continued):
Segment/ Operations
Performance Obligation
Description
CEV
Residential solar electricity
CEV provides access to residential rooftop and ground-mount solar equipment to customers who then pay the Company a monthly fee. The performance obligation is to provide electricity to the customer based on generation from the underlying residential solar asset and is satisfied upon transfer of electricity generated.
Revenue is derived from the contract terms and is recognized as invoiced, with the payment due each month for the previous month's services.
CEV
Renewable energy certificates
Certain CEV projects generate TRECs and SREC IIs under the established Administratively Determined Incentive Program. A TREC or SREC II is created for every MWh of electricity produced by a solar generator. The performance obligation of CEV is to generate electricity. TRECs and SREC IIs under the Administratively Determined Incentive Program are purchased monthly by a REC Administrator.
Revenue is recognized upon generation.
ES
Natural gas services
The performance obligation of ES is to provide the customer transportation, storage and asset management services on an as-needed basis. ES generates revenue through management fees, demand charges, reservation fees and transportation charges centered around the buying and selling of the natural gas commodity, representing one series of distinct performance obligations.
Revenue is recognized based upon the underlying natural gas quantities physically delivered and the customer obtaining control. ES invoices customers in line with the terms of the contract and based on the services provided. Payment is due upon receipt of the invoice. For temporary releases of pipeline capacity, revenue is recognized on a straight-line basis over the agreed upon term.
S&T
Natural gas services
The performance obligation of S&T is to provide the customer with storage and transportation services. S&T generates revenues from firm storage contracts and transportation contracts, injection and withdrawal at the storage facility and the delivery of natural gas to customers. Revenue is recognized over time as customers receive the benefits of its service as it is performed on their behalf using an output method based on actual deliveries.
Demand fees are recognized as revenue over the term of the related agreement.
HSO
Service contracts
Home Services enters into service contracts with homeowners to provide maintenance and replacement services of applicable heating, cooling or ventilation equipment. NJR Retail enters into warranty contracts with homeowners for various appliances. All services provided relate to a distinct performance obligation which is to provide services for the specific equipment over the term of the contract.
Revenue is recognized on a straight-line basis over the term of the contract and payment is due upon receipt of the invoice.
Revenue Recognized at a Point in Time:
ES
Natural gas services
For a permanent release of pipeline capacity, the performance obligation of ES is the release of the pipeline capacity associated with certain natural gas transportation contracts and the transfer of the underlying contractual rights to the counterparty.
Revenue is recognized upon the transfer of the underlying contractual rights.
S&T
Natural gas services
The performance obligation of S&T is to provide the customer with storage and transportation services. S&T generates revenues from usage fees and hub services for the use of storage space, injection and withdrawal from the storage facility. Hub services include park and loan transactions and wheeling.
Usage fees and hub services revenues are recognized as services are performed.
HSO
Installations
Home Services installs appliances, including but not limited to, furnaces, air conditioning units, boilers and generators for customers. The distinct performance obligation is the installation of the contracted appliance, which is satisfied at the point in time the item is installed. The transaction price for each installation differs accordingly. Revenue is recognized at a point in time upon completion of the installation, which is when the customer is billed.
12
New Jersey Resources Corporation
Part I
NOTES TO UNAUDITED CONDENSED CONSOLIDATED FINANCIAL STATEMENTS (Continued)
Disaggregated revenues from contracts with customers by product line and by reporting segment and other business operations during the three months ended March 31, 2024 and 2023, are as follows:
(Thousands)
NJNG
CEV
ES
S&T
HSO
Total
2024
Natural gas utility sales (1)
$
371,019
—
—
—
—
$
371,019
Natural gas services
—
—
16,145
23,042
—
39,187
Service contracts
—
—
—
—
9,071
9,071
Installations and maintenance
—
—
—
—
5,834
5,834
Renewable energy certificates
—
2,672
—
—
—
2,672
Electricity sales
—
6,553
—
—
—
6,553
Eliminations (2)
(338)
—
—
(673)
(153)
(1,164)
Revenues from contracts with customers
370,681
9,225
16,145
22,369
14,752
433,172
Alternative revenue programs (3)
7,382
—
—
—
—
7,382
Derivative instruments
84,800
100
(4)
128,717
—
—
213,617
Eliminations (2)
—
—
3,742
—
—
3,742
Revenues out of scope
92,182
100
132,459
—
—
224,741
Total operating revenues
$
462,863
9,325
148,604
22,369
14,752
$
657,913
2023
Natural gas utility sales (1)
$
327,198
—
—
—
—
$
327,198
Natural gas services
—
—
16,836
20,887
—
37,723
Service contracts
—
—
—
—
8,739
8,739
Installations and maintenance
—
—
—
—
4,709
4,709
Renewable energy certificates
—
2,085
—
—
—
2,085
Electricity sales
—
6,084
—
—
—
6,084
Eliminations (2)
(338)
—
—
(1,584)
(183)
(2,105)
Revenues from contracts with customers
326,860
8,169
16,836
19,303
13,265
384,433
Alternative revenue programs (3)
27,270
—
—
—
—
27,270
Derivative instruments
46,370
6,237
(4)
179,894
—
—
232,501
Eliminations (2)
—
—
(177)
—
—
(177)
Revenues out of scope
73,640
6,237
179,717
—
—
259,594
Total operating revenues
$
400,500
14,406
196,553
19,303
13,265
$
644,027
(1)Includes building rent related to the Wall headquarters, which is eliminated in consolidation.
(2)Consists of transactions between subsidiaries that are eliminated in consolidation.
(3)Includes CIP revenue.
(4)Includes SREC revenue.
13
New Jersey Resources Corporation
Part I
NOTES TO UNAUDITED CONDENSED CONSOLIDATED FINANCIAL STATEMENTS (Continued)
Disaggregated revenues from contracts with customers by product line and by reporting segment and other business operations during the six months ended March 31, 2024 and 2023, are as follows:
(Thousands)
NJNG
CEV
ES
S&T
HSO
Total
2024
Natural gas utility sales (1)
$
628,894
—
—
—
—
$
628,894
Natural gas services
—
—
32,413
46,904
—
79,317
Service contracts
—
—
—
—
18,011
18,011
Installations and maintenance
—
—
—
—
11,728
11,728
Renewable energy certificates
—
5,322
—
—
—
5,322
Electricity sales
—
13,267
—
—
—
13,267
Eliminations (2)
(675)
—
—
(1,348)
(153)
(2,176)
Revenues from contracts with customers
628,219
18,589
32,413
45,556
29,586
754,363
Alternative revenue programs (3)
4,845
—
—
—
—
4,845
Derivative instruments
122,892
26,031
(4)
212,117
—
—
361,040
Eliminations (2)
—
—
4,875
—
—
4,875
Revenues out of scope
127,737
26,031
216,992
—
—
370,760
Total operating revenues
$
755,956
44,620
249,405
45,556
29,586
$
1,125,123
2023
Natural gas utility sales (1)
$
615,365
—
—
—
—
$
615,365
Natural gas services
—
—
44,684
47,725
—
92,409
Service contracts
—
—
—
—
17,400
17,400
Installations and maintenance
—
—
—
—
10,314
10,314
Renewable energy certificates
—
3,287
—
—
—
3,287
Electricity sales
—
13,788
—
—
—
13,788
Eliminations (2)
(675)
—
—
(2,708)
(196)
(3,579)
Revenues from contracts with customers
614,690
17,075
44,684
45,017
27,518
748,984
Alternative revenue programs (3)
23,805
—
—
—
—
23,805
Derivative instruments
119,414
10,123
(4)
473,828
—
—
603,365
Eliminations (2)
—
—
(8,560)
—
—
(8,560)
Revenues out of scope
143,219
10,123
465,268
—
—
618,610
Total operating revenues
$
757,909
27,198
509,952
45,017
27,518
$
1,367,594
(1)Includes building rent related to the Wall headquarters, which is eliminated in consolidation.
(2)Consists of transactions between subsidiaries that are eliminated in consolidation.
(3)Includes CIP revenue.
(4)Includes SREC revenue.
14
New Jersey Resources Corporation
Part I
NOTES TO UNAUDITED CONDENSED CONSOLIDATED FINANCIAL STATEMENTS (Continued)
Disaggregated revenues from contracts with customers by customer type and by reporting segment and other business operations during the three months ended March 31, 2024 and 2023, are as follows:
(Thousands)
NJNG
CEV
ES
S&T
HSO
Total
2024
Residential
$
287,824
3,229
—
—
14,684
$
305,737
Commercial and industrial
50,362
5,996
16,145
22,369
68
94,940
Firm transportation
30,680
—
—
—
—
30,680
Interruptible, off-tariff and other
1,815
—
—
—
—
1,815
Revenues out of scope
92,182
100
132,459
—
—
224,741
Total operating revenues
$
462,863
9,325
148,604
22,369
14,752
$
657,913
2023
Residential
$
247,623
3,204
—
—
13,089
$
263,916
Commercial and industrial
49,105
4,965
16,836
19,303
176
90,385
Firm transportation
29,368
—
—
—
—
29,368
Interruptible, off-tariff and other
764
—
—
—
—
764
Revenues out of scope
73,640
6,237
179,717
—
—
259,594
Total operating revenues
$
400,500
14,406
196,553
19,303
13,265
$
644,027
Disaggregated revenues from contracts with customers by customer type and by reporting segment and other business operations during the six months ended March 31, 2024 and 2023, are as follows:
(Thousands)
NJNG
CEV
ES
S&T
HSO
Total
2024
Residential
$
483,447
6,615
—
—
29,487
$
519,549
Commercial and industrial
86,121
11,974
32,413
45,556
99
176,163
Firm transportation
55,115
—
—
—
—
55,115
Interruptible, off-tariff and other
3,536
—
—
—
—
3,536
Revenues out of scope
127,737
26,031
216,992
—
—
370,760
Total operating revenues
$
755,956
44,620
249,405
45,556
29,586
$
1,125,123
2023
Residential
$
464,561
6,497
—
—
27,269
$
498,327
Commercial and industrial
92,900
10,578
44,684
45,017
249
193,428
Firm transportation
55,567
—
—
—
—
55,567
Interruptible, off-tariff and other
1,662
—
—
—
—
1,662
Revenues out of scope
143,219
10,123
465,268
—
—
618,610
Total operating revenues
$
757,909
27,198
509,952
45,017
27,518
$
1,367,594
15
New Jersey Resources Corporation
Part I
NOTES TO UNAUDITED CONDENSED CONSOLIDATED FINANCIAL STATEMENTS (Continued)
Customer Accounts Receivable/Credit Balances and Deposits
The timing of revenue recognition, customer billings and cash collections resulting in accounts receivables, billed and unbilled, and customers’ credit balances and deposits on the Unaudited Condensed Consolidated Balance Sheets during the six months ended March 31, 2024 and 2023, are as follows:
Customer Accounts Receivable
Customers' Credit
(Thousands)
Billed
Unbilled
Balances and Deposits
Balance as of September 30, 2023
$
97,540
$
19,100
$
44,910
Increase (decrease)
87,529
55,356
(20,032)
Balance as of March 31, 2024
$
185,069
$
74,456
$
24,878
Balance as of September 30, 2022
$
222,297
$
13,769
$
33,246
(Decrease) increase
(27,844)
32,271
(7,725)
Balance as of March 31, 2023
$
194,453
$
46,040
$
25,521
The following table provides information about receivables, which are included within accounts receivable, billed and unbilled, and customers’ credit balances and deposits, respectively, on the Unaudited Condensed Consolidated Balance Sheets as of March 31, 2024 and September 30, 2023:
(Thousands)
NJNG
CEV
ES
S&T
HSO
Total
March 31, 2024
Customer accounts receivable
Billed
$
142,088
7,273
25,241
7,749
2,718
$
185,069
Unbilled
69,904
4,552
—
—
—
74,456
Customers' credit balances and deposits
(24,860)
—
—
(18)
—
(24,878)
Total
$
187,132
11,825
25,241
7,731
2,718
$
234,647
September 30, 2023
Customer accounts receivable
Billed
$
55,234
9,962
23,716
6,577
2,051
$
97,540
Unbilled
10,784
8,316
—
—
—
19,100
Customers' credit balances and deposits
(44,898)
—
—
(12)
—
(44,910)
Total
$
21,120
18,278
23,716
6,565
2,051
$
71,730
4. REGULATION
NJNG is subject to cost-based regulation, therefore, it is permitted to recover authorized operating expenses and earn a reasonable return on its utility capital investments based on the BPU's approval. The impact of the ratemaking process and decisions authorized by the BPU allows NJNG to capitalize or defer certain costs that are expected to be recovered from its customers as regulatory assets and to recognize certain obligations representing amounts that are probable future expenditures as regulatory liabilities in accordance with accounting guidance applicable to regulated operations.
NJNG's recovery of costs is facilitated through its base rates, BGSS and other regulatory tariff riders. NJNG is required to make filings to the BPU for review of its BGSS, CIP and other programs and related rates. Annual rate changes are typically requested to be effective at the beginning of the following fiscal year. The current base rates include a weighted average cost of capital of 6.84% and a return on common equity of 9.6%. All rate and program changes are subject to proper notification and BPU review and approval. In addition, NJNG is permitted to implement certain BGSS rate changes on a provisional basis with proper notification to the BPU.
16
New Jersey Resources Corporation
Part I
NOTES TO UNAUDITED CONDENSED CONSOLIDATED FINANCIAL STATEMENTS (Continued)
Regulatory assets and liabilities included on the Unaudited Condensed Consolidated Balance Sheets for NJNG are comprised of the following:
(Thousands)
March 31, 2024
September 30, 2023
Regulatory assets-current
New Jersey Clean Energy Program
$
6,827
$
15,804
Conservation Incentive Program
55,200
50,356
Derivatives at fair value, net
30,444
6,017
Other current regulatory assets
1,416
1,410
Total current regulatory assets
$
93,887
$
73,587
Regulatory assets-noncurrent
Environmental remediation costs:
Expended, net of recoveries
$
69,229
$
66,298
Liability for future expenditures
157,813
169,390
Deferred income taxes
42,626
41,667
SAVEGREEN
88,496
83,589
Postemployment and other benefit costs
7,936
55,274
Cost of removal
118,900
112,362
Other noncurrent regulatory assets
44,943
51,019
Total noncurrent regulatory assets
$
529,943
$
579,599
Regulatory liability-current
Overrecovered natural gas costs
$
31,628
$
30,637
Total current regulatory liabilities
$
31,628
$
30,637
Regulatory liabilities-noncurrent
Tax Act impact (1)
$
177,838
$
180,347
Other noncurrent regulatory liabilities
438
111
Total noncurrent regulatory liabilities
$
178,276
$
180,458
(1)Reflects the re-measurement and subsequent amortization of NJNG's net deferred tax liabilities as a result of the change in federal tax rates enacted in the Tax Act. The Tax Act is an Act to Provide for Reconciliation Pursuant to Titles II and V of the Concurrent Resolution on the Budget for Fiscal Year 2018, previously known as The Tax Cuts and Jobs Act of 2017.
Regulatory assets and liabilities included on the Unaudited Condensed Consolidated Balance Sheets for Adelphia are comprised of the following:
(Thousands)
March 31, 2024
September 30, 2023
Total noncurrent regulatory assets
$
5,161
$
5,231
Total current regulatory liabilities
$
1,535
$
1,650
The assets are comprised primarily of the tax benefit associated with the equity component of AFUDC and the liability consists primarily of scheduling penalties. Recovery of regulatory assets is subject to FERC approval.
Regulatory filings and/or actions that occurred during the current fiscal year include the following:
•On November 9, 2023, NJNG filed a letter petition seeking BPU approval to extend NJNG’s current SAVEGREEN program through December 31, 2024, with an additional $76.9M in order to meet customer demand for this program, which was approved by the BPU on April 30, 2024.
•On December 1, 2023, NJNG filed a petition seeking BPU approval of its 2024 SAVEGREEN program, which would support new energy efficiency, demand response and building decarbonization start-up programs from January 1, 2025 through June 30, 2027. The 2024 SAVEGREEN program includes $245.1M of direct investment, $217.2M in financing options and $20.1M in O&M.
17
New Jersey Resources Corporation
Part I
NOTES TO UNAUDITED CONDENSED CONSOLIDATED FINANCIAL STATEMENTS (Continued)
•On January 31, 2024, NJNG filed a base rate case with the BPU requesting a natural gas revenue increase of $222.6M including a recovery of infrastructure investments, a change in the Company’s overall rate of return on rate base to 7.57% and a change in the return on common equity to 10.42%.
•On March 20, 2024, the BPU approved NJNG's annual SBC filing of RAC expenditures through June 30, 2023, which included an increase to the RAC annual recoveries of approximately $2.4M and an increase to the NJCEP annual recoveries of approximately $5.5M, effective April 1, 2024.
•On March 28, 2024, NJNG submitted its annual IIP filing to the BPU requesting a rate increase for capital expenditures of $43.5M through June 30, 2024, which will result in a $5.6M revenue increase, with a proposed effective date of October 1, 2024.
5. DERIVATIVE INSTRUMENTS
The Company is subject primarily to commodity price risk due to fluctuations in the market price of natural gas, SRECs and electricity. To manage this risk, the Company enters into a variety of derivative instruments including, but not limited to, futures contracts, physical forward contracts, financial options and swaps to economically hedge the commodity price risk associated with its existing and anticipated commitments to purchase and sell natural gas, SRECs and electricity. In addition, the Company is exposed to foreign currency and interest rate risk and may utilize foreign currency derivatives to hedge Canadian dollar denominated natural gas purchases and/or sales and interest rate derivatives to reduce exposure to fluctuations in interest rates. All of these types of contracts are accounted for as derivatives, unless the Company elects NPNS, which is done on a contract-by-contract election. Accordingly, all of the financial and certain of the Company's physical derivative instruments are recorded at fair value on the Unaudited Condensed Consolidated Balance Sheets. For a more detailed discussion of the Company’s fair value measurement policies and level disclosures associated with the Company’s derivative instruments, see Note 6. Fair Value.
Energy Services
ES chooses not to designate its financial commodity and physical forward commodity derivatives as accounting hedges or to elect NPNS. The changes in the fair value of these derivatives are recorded as a component of natural gas purchases or operating revenues, as appropriate for ES, on the Unaudited Condensed Consolidated Statements of Operations as unrealized gains or losses. For ES at settlement, realized gains and losses on all financial derivative instruments are recognized as a component of natural gas purchases and realized gains and losses on all physical derivatives follow the presentation of the related unrealized gains and losses as a component of either natural gas purchases or operating revenues.
ES also enters into natural gas transactions in Canada and, consequently, is exposed to fluctuations in the value of Canadian currency relative to the U.S. dollar. ES may utilize foreign currency derivatives to lock in the exchange rates associated with natural gas transactions denominated in Canadian currency. The derivatives may include currency forwards, futures, or swaps and are accounted for as derivatives. These derivatives are typically used to hedge demand fee payments on pipeline capacity, storage and natural gas purchase agreements.
As a result of ES entering into transactions to borrow natural gas, commonly referred to as “park and loans,” an embedded derivative is recognized relating to differences between the fair value of the amount borrowed and the fair value of the amount that will ultimately be repaid, based on changes in the forward price for natural gas prices at the borrowed location over the contract term. This embedded derivative is accounted for as a forward sale in the month in which the repayment of the borrowed natural gas is expected to occur, and is considered a derivative transaction that is recorded at fair value on the Unaudited Condensed Consolidated Balance Sheets, with changes in value recognized in current period earnings.
Expected production of SRECs is hedged through the use of forward and futures contracts. All contracts require the Company to physically deliver SRECs through the transfer of certificates as per contractual settlement schedules. ES recognizes changes in the fair value of these derivatives as a component of operating revenues. Upon settlement of the contract, the related revenue is recognized when the SREC is transferred to the counterparty.
18
New Jersey Resources Corporation
Part I
NOTES TO UNAUDITED CONDENSED CONSOLIDATED FINANCIAL STATEMENTS (Continued)
Natural Gas Distribution
Changes in fair value of NJNG's financial commodity derivatives are recorded as a component of regulatory assets or liabilities on the Unaudited Condensed Consolidated Balance Sheets. The Company elects NPNS accounting treatment on all physical commodity contracts that NJNG entered into on or before December 31, 2015, and accounts for these contracts on an accrual basis. Accordingly, physical natural gas purchases are recognized in regulatory assets or liabilities on the Unaudited Condensed Consolidated Balance Sheets when the contract settles and the natural gas is delivered. The average cost of natural gas is charged to expense in the current period earnings based on the BGSS factor times the therm sales. NJNG no longer elects NPNS accounting treatment on a portfolio basis. However, since NPNS is a contract-by-contract election, where it makes sense to do so, NJNG can and may elect to treat certain contracts as normal. Because NJNG recovers these amounts through future BGSS rates as increases or decreases to the cost of natural gas in NJNG’s tariff for natural gas service, the changes in fair value of these contracts are deferred as a component of regulatory assets or liabilities on the Unaudited Condensed Consolidated Balance Sheets.
Clean Energy Ventures
The Company elects NPNS accounting treatment on PPA contracts executed by CEV that meet the definition of a derivative and accounts for the contract on an accrual basis. Accordingly, electricity sales are recognized in revenues throughout the term of the PPA as electricity is delivered. NPNS is a contract-by-contract election and where it makes sense to do so, the Company can and may elect to treat certain contracts as normal.
Fair Value of Derivatives
The following table presents the fair value of the Company's derivative assets and liabilities recognized on the Unaudited Condensed Consolidated Balance Sheets as of:
Derivatives at Fair Value
March 31, 2024
September 30, 2023
(Thousands)
Balance Sheet Location
Assets
Liabilities
Assets
Liabilities
Derivatives not designated as hedging instruments:
NJNG:
Physical commodity contracts
Derivatives - current
$
49
$
6
$
43
$
488
Financial commodity contracts
Derivatives - current
1,229
35
6,110
20
ES:
Physical commodity contracts
Derivatives - current
1,384
6,656
6,209
12,757
Derivatives - noncurrent
678
13,014
802
7,870
Financial commodity contracts
Derivatives - current
11,394
4,028
18,393
2,880
Derivatives - noncurrent
232
777
762
97
Total fair value of derivatives
$
14,966
$
24,516
$
32,319
$
24,112
Offsetting of Derivatives
The Company transacts under master netting arrangements or equivalent agreements that allow it to offset derivative assets and liabilities with the same counterparty. However, the Company’s policy is to present its derivative assets and liabilities on a gross basis at the contract level unit of account on the Unaudited Condensed Consolidated Balance Sheets.
19
New Jersey Resources Corporation
Part I
NOTES TO UNAUDITED CONDENSED CONSOLIDATED FINANCIAL STATEMENTS (Continued)
The following table summarizes the reported gross amounts, the amounts that the Company has the right to offset but elects not to, financial collateral and the net amounts the Company could present on the Unaudited Condensed Consolidated Balance Sheets but elects not to.
Asset Derivatives
Liability Derivatives
(Thousands)
Fair Value (1)
Amounts Offset (2)
Collateral Received/Pledged (3)
Net Value (4)
Fair Value (1)
Amounts Offset (2)
Collateral Received/Pledged (3)
Net Value (4)
As of March 31, 2024
ES Contracts
Physical commodity
$
2,062
(539)
—
$
1,523
$
19,670
(539)
(9,865)
$
9,266
Financial commodity
11,626
(4,805)
(6,206)
615
4,805
(4,805)
—
—
Total ES
$
13,688
(5,344)
(6,206)
$
2,138
$
24,475
(5,344)
(9,865)
$
9,266
NJNG Contracts
Physical commodity
$
49
(4)
—
$
45
$
6
(4)
—
$
2
Financial commodity
1,229
(35)
—
1,194
35
(35)
—
—
Total NJNG
$
1,278
(39)
—
$
1,239
$
41
(39)
—
$
2
As of September 30, 2023
ES Contracts
Physical commodity
$
7,011
(1,236)
—
$
5,775
$
20,627
(1,236)
(9,728)
$
9,663
Financial commodity
19,155
(2,977)
(16,178)
—
2,977
(2,977)
—
—
Total ES
$
26,166
(4,213)
(16,178)
$
5,775
$
23,604
(4,213)
(9,728)
$
9,663
NJNG Contracts
Physical commodity
$
43
(3)
—
$
40
$
488
(3)
—
$
485
Financial commodity
6,110
(20)
—
6,090
20
(20)
—
—
Total NJNG
$
6,153
(23)
—
$
6,130
$
508
(23)
—
$
485
(1)Derivative assets and liabilities are presented on a gross basis on the condensed consolidated balance sheets as the Company does not elect balance sheet offsetting under ASC 210-20.
(2)Includes transactions with NAESB netting election, transactions held by FCMs with net margining and transactions with ISDA netting.
(3)Financial collateral includes cash balances at FCMs as well as cash received from or pledged to other counterparties.
(4)Net amounts represent presentation of derivative assets and liabilities if the Company were to elect balance sheet offsetting under ASC 210-20.
ES utilizes financial derivatives to economically hedge the gross margin associated with the purchase of physical natural gas to be used for storage injection and its subsequent sale at a later date. The gains or (losses) on the financial transactions that are economic hedges of the cost of the purchased natural gas are recognized prior to the gains or (losses) on the physical transaction, which are recognized in earnings when the natural gas is delivered. Therefore, mismatches between the timing of the recognition of realized gains or (losses) on the financial derivative instruments and gains or (losses) associated with the actual sale of the natural gas that is being economically hedged along with fair value changes in derivative instruments, creates volatility in the results of ES, although the Company's intended economic results relating to the entire transaction are unaffected.
The following table presents the effect of derivative instruments recognized on the Unaudited Condensed Consolidated Statements of Operations for the periods set forth below:
(Thousands)
Location of gain (loss) recognized in income on derivatives
Amount of gain (loss) recognized in income on derivatives
Three Months Ended
Six Months Ended
March 31,
March 31,
Derivatives not designated as hedging instruments:
2024
2023
2024
2023
ES:
Physical commodity contracts
Operating revenues
$
(3,651)
$
7,208
$
10,379
$
17,246
Physical commodity contracts
Natural gas purchases
(1,424)
(124)
(2,010)
(794)
Financial commodity contracts
Natural gas purchases
(2,459)
29,863
15,623
71,474
Total unrealized and realized (loss) gain
$
(7,534)
$
36,947
$
23,992
$
87,926
20
New Jersey Resources Corporation
Part I
NOTES TO UNAUDITED CONDENSED CONSOLIDATED FINANCIAL STATEMENTS (Continued)
NJNG’s derivative contracts are part of the Company's risk management activities that relate to its natural gas purchases and BGSS incentive programs. At settlement, the resulting gains and/or losses are payable to or recoverable from utility customers and are deferred in regulatory assets or liabilities resulting in no impact to earnings. The following table reflects the gains (losses) associated with NJNG's derivative instruments for the periods set forth below:
Three Months Ended
Six Months Ended
March 31,
March 31,
(Thousands)
2024
2023
2024
2023
NJNG:
Physical commodity contracts
$
(3,920)
$
(203)
$
(4,990)
$
(28,234)
Financial commodity contracts
(3,142)
(38,294)
1,190
(69,957)
Total unrealized and realized loss
$
(7,062)
$
(38,497)
$
(3,800)
$
(98,191)
During fiscal 2020, NJR entered into treasury lock transactions to fix the benchmark treasury rate associated with debt issuances that were finalized in 2020. NJR designates its treasury lock contracts as cash flow hedges; therefore, changes in fair value of the effective portion of the hedges are recorded in OCI and upon settlement of the contracts, realized gains and (losses) are reclassified from OCI to interest expense on the Consolidated Statements of Operations ratable over the term of the associated debt. Pre-tax losses of $0.3M were reclassified during both the three months ended March 31, 2024 and 2023, and pre-tax losses of $0.7M were reclassified during both the six months ended March 31, 2024 and 2023.
NJNG and ES had the following outstanding long (short) derivatives as of:
Natural Gas Distribution
Energy Services
Volumes (Bcf)
Futures
Physical Commodity
Futures
Physical Commodity
March 31, 2024
23.8
5.0
(3.8)
(3.2)
September 30, 2023
32.1
12.1
(6.9)
0.2
Not included in the above table are 1.4M and 1.3M SRECs that were open as of March 31, 2024 and September 30, 2023, respectively, and the notional amount of foreign currency transactions for the periods were immaterial.
Broker Margin
Futures exchanges have contract specific margin requirements that require the posting of cash or cash equivalents relating to traded contracts. Margin requirements consist of initial margin that is posted upon the initiation of a position, maintenance margin that is usually expressed as a percent of initial margin, and variation margin that fluctuates based on the daily marked-to-market relative to maintenance margin requirements.
The Company maintains separate broker margin accounts for NJNG and ES. The balances by reporting segment are as follows:
NJNG, ES, CEV and S&T are exposed to credit risk as a result of their sales/wholesale marketing activities. As a result of the inherent volatility in the prices of natural gas commodities, derivatives and SRECs, the market value of contractual positions with individual counterparties could exceed established credit limits or collateral provided by those counterparties. If a counterparty fails to perform the obligations under its contract then the Company could sustain a loss.
The Company monitors and manages the credit risk of its wholesale operations through credit policies and procedures that management believes reduce overall credit risk. These policies include a review and evaluation of current and prospective counterparties' financial statements and/or credit ratings, daily monitoring of counterparties' credit limits and exposure, daily communication with traders regarding credit status and the use of credit mitigation measures, such as collateral requirements
21
New Jersey Resources Corporation
Part I
NOTES TO UNAUDITED CONDENSED CONSOLIDATED FINANCIAL STATEMENTS (Continued)
and netting agreements. Examples of collateral include letters of credit and cash received for either prepayment or margin deposit. Collateral may be requested due to the Company's election not to extend credit or because exposure exceeds defined thresholds. Most of the Company's wholesale marketing contracts contain standard netting provisions. These contracts include those governed by ISDA and the NAESB. The netting provisions refer to payment netting, whereby receivables and payables with the same counterparty are offset and the resulting net amount is paid to the party to which it is due.
Internally-rated exposure applies to counterparties that are not rated by Fitch or Moody's. In these cases, the counterparty's or guarantor's financial statements are reviewed, and similar methodologies and ratios used by Fitch and/or Moody's are applied to arrive at a substitute rating. Gross credit exposure is defined as the unrealized fair value of physical and financial derivative commodity contracts, plus any outstanding wholesale receivable for the value of natural gas delivered and/or financial derivative commodity contract that has settled for which payment has not yet been received.
The following is a summary of gross credit exposures grouped by investment and noninvestment grade counterparties, as of March 31, 2024. The amounts presented below have not been reduced by any collateral received or netting and exclude accounts receivable for NJNG retail natural gas sales and services and CEV residential solar installations.
(Thousands)
Gross Credit Exposure
Investment grade
$
113,150
Noninvestment grade
9,134
Internally rated investment grade
19,988
Internally rated noninvestment grade
22,477
Total
$
164,749
Conversely, certain of NJNG's and ES' derivative instruments are linked to agreements containing provisions that would require cash collateral payments from the Company if certain events occur. These provisions vary based upon the terms in individual counterparty agreements and can result in cash payments if NJNG's credit rating were to fall below its current level. Specifically, most, but not all, of these additional payments will be triggered if NJNG's debt is downgraded by the major credit agencies, regardless of investment grade status. In addition, some of these agreements include threshold amounts that would result in additional collateral payments if the values of derivative liabilities were to exceed the maximum values provided for in relevant counterparty agreements. Other provisions include payment features that are not specifically linked to ratings but are based on certain financial metrics.
Collateral amounts associated with any of these conditions are determined based on a sliding scale and are contingent upon the degree to which the Company's credit rating and/or financial metrics deteriorate, and the extent to which liability amounts exceed applicable threshold limits. There was approximately $1.4M and $0.1M of derivative instruments with credit-risk-related contingent features that were in a liability position for which collateral is required as of March 31, 2024 and September 30, 2023, respectively. These amounts differ from the respective net derivative liabilities reflected on the Unaudited Condensed Consolidated Balance Sheets because the agreements also include clauses, commonly known as “Rights of Offset,” that would permit the Company to offset its derivative assets against its derivative liabilities for determining additional collateral to be posted, as previously discussed.
6. FAIR VALUE
Fair Value of Assets and Liabilities
The fair value of cash and cash equivalents, accounts receivable, current loan receivables, accounts payable, commercial paper and borrowings under revolving credit facilities are estimated to equal their carrying amounts due to the short maturity of those instruments. Non-current loans receivable are recorded based on what the Company expects to receive, which approximates fair value, in other noncurrent assets on the Unaudited Condensed Consolidated Balance Sheets. The Company regularly evaluates the credit quality and collection profile of its customers to approximate fair value.
22
New Jersey Resources Corporation
Part I
NOTES TO UNAUDITED CONDENSED CONSOLIDATED FINANCIAL STATEMENTS (Continued)
The estimated fair value of long-term debt, including current maturities, excluding natural gas meter finance arrangements, debt issuance costs and solar asset financing obligations, is as follows:
(Thousands)
March 31, 2024
September 30, 2023
Carrying value (1) (2)
$
2,567,845
$
2,587,845
Fair market value
$
2,218,977
$
2,106,536
(1)Excludes NJNG's debt issuance costs of $10.0M and $9.8M as of March 31, 2024 and September 30, 2023, respectively.
(2)Excludes NJR's debt issuance costs of $3.3M and $3.7M as of March 31, 2024 and September 30, 2023, respectively.
The Company enters into sale leaseback transactions for certain commercial solar assets and natural gas meters. These transactions are recorded within long-term debt on the Unaudited Condensed Consolidated Balance Sheets. The carrying value of solar sale leasebacks was $284.2M and $278.4M and the estimated fair value was $282.1M and $268.1M as of March 31, 2024 and September 30, 2023, respectively. The carrying value of the natural gas meter sale leasebacks was $36.0M and $31.4M and the estimated fair value of certain natural gas meter sale leasebacks amounted to $28.3M and $20.9M as of March 31, 2024 and September 30, 2023, respectively.
The Company utilizes a discounted cash flow method to determine the fair value of its debt. Inputs include observable municipal and corporate yields, as appropriate for the maturity of the specific issue and the Company's credit rating. As of March 31, 2024, the Company discloses its debt within Level 2 of the fair value hierarchy.
Fair Value Hierarchy
The Company applies fair value measurement guidance to its financial assets and liabilities, as appropriate, which include financial derivatives and physical commodity contracts qualifying as derivatives, investments in equity securities and other financial assets and liabilities. In addition, authoritative accounting literature prescribes the use of a fair value hierarchy that prioritizes the inputs to valuation techniques used to measure fair value based on the source of the data used to develop the price inputs. The hierarchy gives the highest priority to unadjusted quoted prices in active markets for identical assets or liabilities and the lowest priority to inputs that are based on unobservable market data and includes the following:
Fair Value Hierarchy
Description of Fair Value Level
Fair Value Technique
Level 1
Unadjusted quoted prices for identical assets or liabilities in active markets
The Company’s Level 1 assets and liabilities include exchange-traded natural gas futures and options contracts, listed equities and money market funds. Exchange-traded futures and options contracts include all energy contracts traded on the NYMEX, CME and ICE that the Company refers to internally as basis swaps, fixed swaps, futures and financial options that are cleared through an FCM.
Level 2
Other significant observable inputs, such as interest rates or price data, including both commodity and basis pricing that is observed either directly or indirectly from publications or pricing services
The Company’s Level 2 assets and liabilities include over-the-counter physical forward commodity contracts and swap contracts, SREC forward sales or derivatives that are initially valued using observable quotes and are subsequently adjusted to include time value, credit risk or estimated transport pricing components for which no basis price is available. Level 2 financial derivatives consist of transactions with non-FCM counterparties (basis swaps, fixed swaps and/or options). Inputs are verifiable and do not require significant management judgment. For some physical commodity contracts, the Company utilizes transportation tariff rates that are publicly available and that it considers to be observable inputs that are equivalent to market data received from an independent source. There are no significant judgments or adjustments applied to the transportation tariff inputs and no market perspective is required. Even if the transportation tariff input were considered to be a “model,” it would still be considered to be a Level 2 input as the data is:
•widely accepted and public;
•non-proprietary and sourced from an independent third party; and
•observable and published.
These additional adjustments are generally not considered to be significant to the ultimate recognized values.
Level 3
Inputs derived from a significant amount of unobservable market data
These include the Company’s best estimate of fair value and are derived primarily through the use of internal valuation methodologies.
23
New Jersey Resources Corporation
Part I
NOTES TO UNAUDITED CONDENSED CONSOLIDATED FINANCIAL STATEMENTS (Continued)
Assets and liabilities measured at fair value on a recurring basis are summarized as follows:
Quoted Prices in Active Markets for Identical Assets
Significant Other Observable Inputs
Significant Unobservable Inputs
(Thousands)
(Level 1)
(Level 2)
(Level 3)
Total
As of March 31, 2024
Assets:
Physical commodity contracts
$
—
$
2,111
$
—
$
2,111
Financial commodity contracts
12,855
—
—
12,855
Money market funds
56
—
—
56
Other
2,954
—
—
2,954
Total assets at fair value
$
15,865
$
2,111
$
—
$
17,976
Liabilities:
Physical commodity contracts
$
—
$
19,676
$
—
$
19,676
Financial commodity contracts
4,840
—
—
4,840
Total liabilities at fair value
$
4,840
$
19,676
$
—
$
24,516
Quoted Prices in Active Markets for Identical Assets
Significant Other Observable Inputs
Significant Unobservable Inputs
(Thousands)
(Level 1)
(Level 2)
(Level 3)
Total
As of September 30, 2023
Assets:
Physical commodity contracts
$
—
$
7,054
$
—
$
7,054
Financial commodity contracts
25,265
—
—
25,265
Money market funds
145
—
—
145
Other
2,641
—
—
2,641
Total assets at fair value
$
28,051
$
7,054
$
—
$
35,105
Liabilities:
Physical commodity contracts
$
—
$
21,115
$
—
$
21,115
Financial commodity contracts
2,997
—
—
2,997
Total liabilities at fair value
$
2,997
$
21,115
$
—
$
24,112
7. INVESTMENTS IN EQUITY INVESTEES
The Company holds a 50% equity method investment in Steckman Ridge, a jointly owned and controlled natural gas storage facility located in Bedford County, Pennsylvania. The Company's investment in Steckman Ridge was $101.8M and $104.1M as of March 31, 2024 and September 30, 2023, respectively, which include loans with a total outstanding principal balance of $70.4M for both periods. On October 1, 2023, the Company entered into an Amended and Restated Loan Agreement with Steckman Ridge, which extends the existing loan agreement and moved from London Interbank Offered Rate to Secured Overnight Financing Rate. The loans accrue interest at a variable rate that resets quarterly and are due October 1, 2027.
NJNG and ES have entered into storage and park and loan agreements with Steckman Ridge. See Note 15. Related Party Transactions for more information on these intercompany transactions.
24
New Jersey Resources Corporation
Part I
NOTES TO UNAUDITED CONDENSED CONSOLIDATED FINANCIAL STATEMENTS (Continued)
8. EARNINGS PER SHARE
The following table presents the calculation of the Company's basic and diluted earnings per share for:
Three Months Ended
Six Months Ended
March 31,
March 31,
(Thousands, except per share amounts)
2024
2023
2024
2023
Net income, as reported
$
120,812
$
110,247
$
210,223
$
226,168
Basic earnings per share
Weighted average shares of common stock outstanding-basic
98,377
96,893
98,123
96,689
Basic earnings per common share
$1.23
$1.14
$2.14
$2.34
Diluted earnings per share
Weighted average shares of common stock outstanding-basic
98,377
96,893
98,123
96,689
Incremental shares (1)
725
663
716
657
Weighted average shares of common stock outstanding-diluted
99,102
97,556
98,839
97,346
Diluted earnings per common share
$1.22
$1.13
$2.13
$2.32
(1)Incremental shares consist primarily of unvested stock awards and performance units, which are calculated using the treasury stock method.
9. DEBT
NJR and NJNG finance working capital requirements and capital expenditures through various short-term debt and long-term financing arrangements, including a commercial paper program and committed unsecured credit facilities.
Credit Facilities and Short-term Debt
A summary of NJR's credit facility and NJNG's commercial paper program and credit facility are as follows:
At end of period
(Thousands)
As of date
Total borrowing capacity
Loans outstanding
Weighted average interest rate
Remaining borrowing capacity
Expiration dates
NJRbank revolving credit facilities (1)
March 31, 2024
$
650,000
$
146,150
6.52
%
$
494,519
(2)
September 2027
September 30, 2023
$
650,000
$
217,300
6.53
%
$
426,967
(2)
September 2027
NJNGbank revolving credit facilities (3)
March 31, 2024
$
250,000
$
50,000
5.48
%
$
199,269
(4)
September 2027
September 30, 2023
$
250,000
$
34,800
5.48
%
$
214,469
(4)
September 2027
(1)Committed credit facilities, which require commitment fees of 0.10% on the unused amounts.
(2)Letters of credit outstanding total $9.3M at March 31, 2024 and $5.7M at September 30, 2023, which reduces the amount available by the same amount.
(3)Committed credit facilities, which require commitment fees of 0.075% on the unused amounts.
(4)Letters of credit outstanding total $0.7M at both March 31, 2024 and September 30, 2023, which reduces the amount available by the same amount.
Amounts available under credit facilities are reduced by bank or commercial paper borrowings, as applicable, and any outstanding letters of credit. Neither NJNG nor the results of its operations are obligated or pledged to support the NJR Credit Facility or term loan.
Long-term Debt
NJNG
In September 2023, NJNG entered into a Note Purchase Agreement for $100M aggregate principal amount of its senior notes consisting of $50M of 5.56% senior notes due September 28, 2033, which closed on September 28, 2023, and $50M of 5.85% senior notes due October 30, 2053, which closed on October 30, 2023.
25
New Jersey Resources Corporation
Part I
NOTES TO UNAUDITED CONDENSED CONSOLIDATED FINANCIAL STATEMENTS (Continued)
NJNG received $8.8M and $8.4M during the six months ended March 31, 2024 and 2023, respectively, in connection with the sale leaseback of its natural gas meters. NJNG records the sale leaseback as a financing obligation for accounting purposes and has the option to purchase the meters back at fair value upon expiration of the lease.
Clean Energy Ventures
CEV received proceeds of $24.4M and $61.8M during the six months ended March 31, 2024 and 2023, respectively, in connection with the sale leaseback of commercial solar assets. CEV records the sale leaseback as a financing obligation for accounting purposes and continues to operate the solar assets, including related expenses, retains the revenue generated from SRECs, TRECs and energy sales, and has the option to renew the lease or repurchase the assets sold at the end of the lease term.
10. EMPLOYEE BENEFIT PLANS
Pension and Other Postemployment Benefit Plans
In January 2024, the Company announced changes to its postretirement medical benefits plan. Beginning on January 1, 2025, the Company will replace the existing retiree medical coverage for certain eligible employees age 65 and older and their Medicare-eligible dependents with an employer funded Health Reimbursement Arrangement. Medicare-eligible participants may use the Health Reimbursement Arrangement towards the purchase of supplemental insurance coverage and for other qualified medical expenses. The liability associated with postretirement medical benefits was remeasured as of January 1, 2024, and the expense for the remainder of fiscal 2024 will be recorded using updated assumptions and actuarial calculations. The plan amendment will be amortized over approximately 8 years, which is the average remaining service to retirement for all plan participants.
The following summarizes the changes in the funded status of the plan and the related liabilities recognized on the Consolidated Balance Sheets:
OPEB
(Thousands)
January 1, 2024
September 30, 2023
Change in Benefit Obligation
Benefit obligation at beginning of period
$
203,406
$
173,217
Service cost
642
2,471
Interest cost
2,902
9,146
Plan amendments
(81,283)
—
Plan participants’ contributions (1)
—
552
Actuarial loss
26,871
25,363
Benefits paid, net of retiree subsidies received
(1,614)
(7,343)
Benefit obligation at end of period
$
150,924
$
203,406
Change in plan assets
Fair value of plan assets at beginning of period
$
106,783
$
99,736
Actual return on plan assets
8,995
9,826
Employer contributions
3,181
4,192
Benefits paid, net of plan participants’ contributions (1)
(1,612)
(6,971)
Fair value of plan assets at end of period
$
117,347
$
106,783
Funded status
$
(33,577)
$
(96,623)
Amounts recognized on Consolidated Balance Sheets
Postemployment employee (liability)
Current
$
(1,613)
$
(4,201)
Noncurrent
(31,964)
(92,422)
Total
$
(33,577)
$
(96,623)
(1)Employees hired prior to July 1, 1998, were eligible to elect an additional participant contribution to enhance their benefits. Contributions made during the periods were immaterial.
26
New Jersey Resources Corporation
Part I
NOTES TO UNAUDITED CONDENSED CONSOLIDATED FINANCIAL STATEMENTS (Continued)
The following table summarizes the amounts recognized in regulatory assets and accumulated other comprehensive income (loss):
Regulatory Assets
Accumulated Other Comprehensive Income (Loss)
(Thousands)
OPEB
Balance at September 30, 2023
$
30,046
$
5,498
Amounts arising during the period:
Net actuarial loss
12,706
7,027
Prior service cost
(61,244)
(20,039)
Amounts amortized to net periodic costs:
Net actuarial loss
(355)
(141)
Balance at January 1, 2024
$
(18,847)
$
(7,655)
The amounts in regulatory assets and accumulated other comprehensive income (loss) not yet recognized as components of net periodic benefit cost were as follows:
Regulatory Assets
Accumulated Other Comprehensive Income (Loss)
OPEB
(Thousands)
January 1, 2024
September 30, 2023
January 1, 2024
September 30, 2023
Net actuarial loss
$
42,397
$
30,046
$
12,384
$
5,498
Prior service cost
(61,244)
—
(20,039)
—
Total
$
(18,847)
$
30,046
$
(7,655)
$
5,498
The components of the net periodic cost for pension benefits, including the Company's Pension Equalization Plan, and OPEB costs (principally health care and life insurance) for employees and covered dependents were as follows:
Pension
OPEB
Three Months Ended
Six Months Ended
Three Months Ended
Six Months Ended
March 31,
March 31,
March 31,
March 31,
(Thousands)
2024
2023
2024
2023
2024
2023
2024
2023
Service cost
$
1,244
$
1,351
$
2,488
$
2,701
$
255
$
618
$
897
$
1,236
Interest cost
4,060
3,793
8,120
7,587
1,808
2,287
4,710
4,573
Expected return on plan assets
(5,086)
(4,993)
(10,173)
(9,986)
(2,020)
(1,681)
(3,878)
(3,361)
Recognized actuarial loss
30
75
59
150
1,255
—
1,751
—
Prior service cost (credit) amortization
15
26
31
51
(3,337)
—
(3,337)
—
Net periodic benefit cost
$
263
$
252
$
525
$
503
$
(2,039)
$
1,224
$
143
$
2,448
The Company does not expect to make additional contributions to fund the pension plans during fiscal 2024 based on current actuarial assumptions; however, funding requirements are uncertain and can depend significantly on changes in actuarial assumptions, returns on plan assets and changes in the demographics of eligible employees and covered dependents. In addition, as in the past, the Company may elect to make contributions in excess of the minimum required amount to the plans. There were no discretionary contributions made during the six months ended March 31, 2024 and 2023.
27
New Jersey Resources Corporation
Part I
NOTES TO UNAUDITED CONDENSED CONSOLIDATED FINANCIAL STATEMENTS (Continued)
Assumptions
The weighted average assumptions used to determine the Company’s obligations are as follows:
OPEB
January 1, 2024
September 30, 2023
Obligations:
Discount rate
5.02%/5.01%
(1)
5.97%/5.94%
(1)
Compensation increase
3.00%/3.50%
(1)
3.00%/3.50%
(1)
(1)Percentages for represented and non-represented plans, respectively.
When measuring its projected benefit obligations, the Company uses an aggregate discount rate at which its obligation could be effectively settled. The Company determines a single weighted average discount rate based on a yield curve comprised of rates of return on a population of high quality debt issuances (AA- or better) whose cash flows (via coupons or maturities) match the timing and amount of its expected future benefit payments. The Company measures its service and interest costs using a disaggregated, or spot rate, approach. The Company applies the duration-specific spot rates from the full yield curve, as of the measurement date, to each year’s future benefit payments, which aligns the timing of the plans’ separate future cash flows to the corresponding spot rates on the yield curve.
11. INCOME TAXES
ASC Topic 740, Income Taxes requires the use of an estimated annual effective tax rate for purposes of determining the income tax provision during interim reporting periods. In calculating its estimated annual effective tax rate, the Company considers forecasted annual pre-tax income and estimated permanent book versus tax differences. Adjustments to the effective tax rate and management's estimates will occur as information and assumptions change.
Changes in tax laws or tax rates are recognized in the financial reporting period that includes the enactment date, the date in which the act is signed into law.
NJR evaluates its tax positions to determine the appropriate accounting and recognition of potential future obligations associated with uncertain tax positions. A tax benefit claimed, or expected to be claimed, on a tax return may be recognized only if it is more likely than not that the position will be upheld upon examination by the applicable taxing authority. Interest and penalties related to unrecognized tax benefits, if any, are recognized within income tax expense, and accrued interest and penalties are recognized within other noncurrent liabilities on the Unaudited Condensed Consolidated Balance Sheets.
Effective Tax Rate
The estimated annual effective tax rates were 21.7% and 22.1%, for the six months ended March 31, 2024 and 2023, respectively.
To the extent there are discrete tax items that are not included in the estimated annual effective tax rate, the actual reported effective tax rate may differ from the estimated annual effective tax rate. During the six months ended March 31, 2024 and 2023, discrete items totaled approximately $(1.2)M and $(0.6)M, respectively, related primarily to excess tax benefits associated with the vesting of share-based awards. NJR’s actual reported effective tax rates were 21.3% and 21.9% during the six months ended March 31, 2024 and 2023, respectively.
Other Tax Items
As of March 31, 2024 and September 30, 2023, the Company has tax credit carryforwards of approximately $179.5M and $191.2M, respectively, which each have a life of 20 years. The Company expects to utilize this entire carryforward prior to expiration, which would begin in fiscal 2037.
28
New Jersey Resources Corporation
Part I
NOTES TO UNAUDITED CONDENSED CONSOLIDATED FINANCIAL STATEMENTS (Continued)
As of March 31, 2024 and September 30, 2023, the Company has state income tax net operating losses of approximately $609.1M and $631.2M, respectively. These state net operating losses have carry-forward periods dictated by the state in which they were incurred and range from seven to 20 years, with the majority expiring after 2036. The Company expects to utilize this entire carryforward prior to expiration, except for state income tax attributes for which the Company had a valuation allowance of approximately $0.7M as of both March 31, 2024 and September 30, 2023, for which the Company could not conclude were realizable on a more-likely-than-not basis.
In March 2024, the State of New Jersey commenced an examination of the Company's Corporate Business Tax return for NJR and certain subsidiaries for the fiscal periods ending September 30, 2019 through September 30, 2022.
12. LEASES
Lessee Accounting
The Company determines if an arrangement is a lease at inception based on whether the Company has the right to control the use of an identified asset, the right to obtain substantially all of the economic benefits from the use of the asset and the right to direct the use of the asset. After the criteria are satisfied, the Company accounts for these arrangements as leases in accordance with ASC 842, Leases. Right-of-use assets represent the Company’s right to use the underlying asset for the lease term and lease liabilities represent the Company's obligation to make lease payments arising from the lease. Right-of-use assets and liabilities are recognized at the lease commencement date based on the present value of lease payments over the lease term, including payments at commencement that depend on an index or rate. Most leases in which the Company is the lessee do not have a readily determinable implicit rate, so an incremental borrowing rate, based on the information available at the lease commencement date, is utilized to determine the present value of lease payments. When a secured borrowing rate is not readily available, unsecured borrowing rates are adjusted for the effects of collateral to determine the incremental borrowing rate. The Company uses the implicit rate for agreements in which it is a lessor. The Company has not entered into any material agreements in which it is a lessor. Lease expense and lease income are recognized on a straight-line basis over the lease term for operating leases.
The Company’s lease agreements primarily consist of commercial solar land leases, storage and capacity leases, equipment and real property, including land and office facilities, office equipment and the sale leaseback of certain natural gas meters.
Certain leases contain escalation provisions for inflation metrics. The storage leases contain a variable payment component that relates to the change in the inflation metrics that are not known past the current payment period. The variable components of these lease payments are excluded from the lease payments that are used to determine the related right-of-use lease asset and liability. The variable portion of these leases are recognized as leasing expenses when they are incurred. The capacity lease payments are fully variable and based on the amount of natural gas stored in the storage caverns.
Generally, the Company’s solar land lease terms are between 20 and 50 years and may include multiple options to extend the terms for an additional five to 20 years. The Company’s office leases vary in duration, ranging from two to 11 years and may or may not include extension or early purchase options. The Company’s meter lease terms are between six and 10 years with purchase options available prior to the end of the term. Equipment leases include general office equipment that also vary in duration, with an average term of nine years. The Company's storage and capacity leases have assumed terms of 50 years to coincide with the expected useful lives of the cavern assets with which the leases are associated. The Company's lease terms may include options to extend, purchase the leased asset or terminate a lease and they are included in the lease liability calculation when it is reasonably certain that those options will be exercised. The Company has elected an accounting policy that exempts leases with an original term of one year or less from the recognition requirements of ASC 842, Leases.
The Company has lease agreements with lease and non-lease components and has elected the practical expedient to combine lease and non-lease components for certain classes of leases, such as office buildings, solar land leases and office equipment. Variable payments are not considered material to the Company. The Company’s lease agreements do not contain any material residual value guarantees, material restrictions or material covenants. In July 2021, NJNG entered into 16-year lease agreements, as Lessor, with various NJR subsidiaries, as Lessees, for office space at the Company’s headquarters in Wall, New Jersey, the effects of which are eliminated in consolidation.
29
New Jersey Resources Corporation
Part I
NOTES TO UNAUDITED CONDENSED CONSOLIDATED FINANCIAL STATEMENTS (Continued)
The following table presents the Company's lease costs included in the Unaudited Condensed Consolidated Statements of Operations:
Three Months Ended
Six Months Ended
March 31,
March 31,
(Thousands)
Income Statement Location
2024
2023
2024
2023
Operating lease cost (1)
Operation and maintenance
$
2,524
$
2,307
$
5,064
$
4,724
Finance lease cost
Amortization of right-of-use assets
Depreciation and amortization
552
540
1,080
1,025
Interest on lease liabilities
Interest expense, net of capitalized interest
236
298
488
533
Total finance lease cost
788
838
1,568
1,558
Variable lease cost
Operation and maintenance
246
272
446
495
Total lease cost
$
3,558
$
3,417
$
7,078
$
6,777
(1)Net of capitalized costs.
The following table presents supplemental cash flow information related to leases:
Six Months Ended
March 31,
(Thousands)
2024
2023
Cash paid for amounts included in the measurement of lease liabilities
Operating cash flows for operating leases
$
4,199
$
3,652
Operating cash flows for finance leases
$
488
$
533
Financing cash flows for finance leases
$
3,875
$
3,577
Assets obtained or modified through operating lease liabilities totaled approximately $2.6M and $0.3M during the three months ended March 31, 2024 and 2023, respectively, and totaled approximately $4.1M and $0.4M during the six months ended March 31, 2024 and 2023, respectively.
Assets obtained or modified through other leases, including those which are finance leases and financing transactions for accounting purposes, totaled $8.4M during the six months ended March 31, 2023. There were no assets obtained or modified through finance leases during the three and six months ended March 31, 2024, and the three months ended March 31, 2023.
The following table presents the balance and classifications of the Company's right of use assets and lease liabilities included in the Unaudited Condensed Consolidated Balance Sheets:
(Thousands)
Balance Sheet Location
March 31, 2024
September 30, 2023
Assets
Noncurrent
Operating lease assets
Operating lease assets
$
177,176
$
175,740
Finance lease assets
Utility plant
27,168
28,248
Total lease assets
$
204,344
$
203,988
Liabilities
Current
Operating lease liabilities
Operating lease liabilities
$
4,780
$
4,772
Finance lease liabilities
Current maturities of long-term debt
8,816
8,477
Noncurrent
Operating lease liabilities
Operating lease liabilities
150,971
148,023
Finance lease liabilities
Long-term debt
18,661
22,875
Total lease liabilities
$
183,228
$
184,147
30
New Jersey Resources Corporation
Part I
NOTES TO UNAUDITED CONDENSED CONSOLIDATED FINANCIAL STATEMENTS (Continued)
For operating lease assets and liabilities, the weighted average remaining lease term was 28.6 years and 29.2 years for and the weighted average discount rate used in the valuation over the remaining lease term was 3.6% and 3.5% for March 31, 2024 and September 30, 2023, respectively. For finance lease assets and liabilities, the weighted average remaining lease term was 3.4 years and 3.3 years and the weighted average discount rate used in the valuation over the remaining lease term was 3.3% and 2.7% as of March 31, 2024 and September 30, 2023, respectively.
13. COMMITMENTS AND CONTINGENT LIABILITIES
Cash Commitments
NJNG has entered into long-term contracts, expiring at various dates through September 2039, for the supply, transportation and storage of natural gas. These contracts include annual fixed charges of approximately $227.1M at current contract rates and volumes for the remainder of the fiscal year, which are recoverable through BGSS.
For the purpose of securing storage and pipeline capacity, ES enters into storage and pipeline capacity contracts, which require the payment of certain demand charges by ES to maintain the ability to access such natural gas storage or pipeline capacity, during a fixed time period, which generally ranges from one to 10 years. Demand charges are established by interstate storage and pipeline operators and are regulated by FERC. These demand charges represent commitments to pay storage providers or pipeline companies for the right to store and/or transport natural gas utilizing their respective assets.
Commitments as of March 31, 2024, for natural gas purchases and future demand fees for the next five fiscal year periods are as follows:
(Thousands)
2024
2025
2026
2027
2028
Thereafter
ES:
Natural gas purchases
$
11,801
$
1,964
$
—
$
—
$
—
$
—
Storage demand fees
8,685
15,743
11,413
5,440
3,491
6,780
Pipeline demand fees
31,418
55,870
42,117
25,837
15,301
17,011
Sub-total ES
$
51,904
$
73,577
$
53,530
$
31,277
$
18,792
$
23,791
NJNG:
Natural gas purchases
$
6,546
$
—
$
—
$
—
$
—
$
—
Storage demand fees
22,541
33,105
15,963
11,155
4,874
—
Pipeline demand fees
77,558
202,212
143,787
129,216
113,962
966,909
Sub-total NJNG
$
106,645
$
235,317
$
159,750
$
140,371
$
118,836
$
966,909
Total
$
158,549
$
308,894
$
213,280
$
171,648
$
137,628
$
990,700
Certain pipeline demand fees totaling approximately $4.0M per year, for which ES is the responsible party, are being paid for by the counterparty to a capacity release transaction beginning in November 2021, for a period of 10 years.
31
New Jersey Resources Corporation
Part I
NOTES TO UNAUDITED CONDENSED CONSOLIDATED FINANCIAL STATEMENTS (Continued)
Legal Proceedings
Manufactured Gas Plant Remediation
NJNG is responsible for the remedial cleanup of certain former MGP sites, dating back to gas operations in the late 1800s and early 1900s, which contain contaminated residues from former gas manufacturing operations. NJNG is currently involved in administrative proceedings with the NJDEP and is participating in various studies and investigations by outside consultants, to determine the nature and extent of any such contaminated residues and to develop appropriate programs of remedial action, where warranted, under NJDEP regulations.
NJNG periodically, and at least annually, performs an environmental review of former MGP sites located in Atlantic Highlands, Berkeley, Long Branch, Manchester, Toms River, Freehold and Aberdeen, New Jersey, including a review of potential liability for investigation and remedial action. NJNG estimated at the time of the most recent review that total future expenditures at the former MGP sites for which it is responsible, including potential liabilities for natural resource damages that might be brought by the NJDEP for alleged injury to groundwater or other natural resources concerning these sites, will range from approximately $137.3M to $201.5M. NJNG’s estimate of these liabilities is based upon known facts, existing technology and enacted laws and regulations in place when the review was completed. Where it is probable that costs will be incurred, and the information is sufficient to establish a range of possible liability, NJNG accrues the most likely amount in the range. If no point within the range is more likely than the other, it is NJNG’s policy to accrue the lower end of the range. Accordingly, as of March 31, 2024, NJNG recorded a MGP remediation liability and a corresponding regulatory asset of approximately $157.8M on the Unaudited Condensed Consolidated Balance Sheets based on the most likely amount. The actual costs to be incurred by NJNG are dependent upon several factors, including final determination of remedial action, changing technologies and governmental regulations, the ultimate ability of other responsible parties to pay and insurance recoveries, if any.
NJNG recovers its remediation expenditures, including carrying costs, over rolling seven-year periods pursuant to a RAC approved by the BPU. As of March 31, 2024, $69.2M of previously incurred remediation costs, net of recoveries from customers and insurance proceeds, are included in regulatory assets on the Unaudited Condensed Consolidated Balance Sheets. NJNG will continue to seek recovery of MGP-related costs through the RAC. If any future regulatory position indicates that the recovery of such costs is not probable, the related non-recoverable costs would be charged to income in the period of such determination.
General
The Company is involved, and from time to time in the future may be involved, in a number of pending and threatened judicial, regulatory and arbitration proceedings relating to matters that arise in the ordinary course of business. In view of the inherent difficulty of predicting the outcome of litigation matters, particularly when such matters are in their early stages or where the claimants seek indeterminate damages, the Company cannot state with confidence what the eventual outcome of the pending litigation will be, what the timing of the ultimate resolution of these matters will be, or what the eventual loss, fines or penalties related to each pending matter will be, if any. In accordance with applicable accounting guidance, the Company establishes accruals for litigation for those matters that present loss contingencies as to which it is both probable that a loss will be incurred and the amount of such loss can be reasonably estimated. The Company also discloses contingent matters for which there is a reasonable possibility of a loss. Based upon currently available information, the Company believes that the results of litigation that are currently pending, taken together, will not have a materially adverse effect on the Company’s financial condition, results of operations or cash flows. The actual results of resolving the pending litigation matters may be substantially higher than the amounts accrued.
The foregoing statements about the Company’s litigation are based upon the Company’s judgments, assumptions and estimates and are necessarily subjective and uncertain. The Company has a number of threatened and pending litigation matters at various stages.
32
New Jersey Resources Corporation
Part I
NOTES TO UNAUDITED CONDENSED CONSOLIDATED FINANCIAL STATEMENTS (Continued)
14. REPORTING SEGMENT AND OTHER OPERATIONS DATA
The Company organizes its businesses based on a combination of factors, including its products and its regulatory environment. As a result, the Company manages its businesses through the following reporting segments and other operations: NJNG consists of regulated energy and off-system, capacity and storage management operations; CEV consists of capital investments in clean energy projects; ES consists of unregulated wholesale and retail energy operations; S&T consists of the Company’s investments in natural gas transportation and storage facilities; the HSO business operations consist of heating, cooling and water appliance sales, installations and services, other investments and general corporate activities.
Information related to the Company's various reporting segments and other operations during the three months ended March 31, 2024 and 2023, are as follows:
Segments
(Thousands)
NJNG
CEV
ES
S&T
Subtotal
HSO
Elims
Total
2024
Operating revenues
External customers
$
462,863
9,325
148,604
(1)
22,369
$
643,161
14,752
—
$
657,913
Intercompany
$
338
—
(3,742)
673
$
(2,731)
153
2,578
$
—
Depreciation and amortization
$
27,464
6,931
56
(2)
6,218
$
40,669
271
(865)
$
40,075
Interest income (3)
$
517
—
143
2,518
$
3,178
332
(1,474)
$
2,036
Interest expense, net of capitalized interest
$
14,850
7,182
3,513
5,868
$
31,413
208
—
$
31,621
Income tax provision (benefit)
$
24,476
(1,594)
5,289
619
$
28,790
520
4,637
$
33,947
Equity in earnings of affiliates
$
—
—
—
85
$
85
—
653
$
738
Net financial earnings (loss)
$
107,095
(5,616)
37,644
1,981
$
141,104
384
(2,912)
$
138,576
Capital expenditures
$
97,710
11,317
—
13,523
$
122,550
130
—
$
122,680
2023
Operating revenues
External customers
$
400,500
14,406
196,553
(1)
19,303
$
630,762
13,265
—
$
644,027
Intercompany
$
338
—
177
1,584
$
2,099
183
(2,282)
$
—
Depreciation and amortization
$
25,319
6,465
62
(2)
6,020
$
37,866
224
—
$
38,090
Interest income (3)
$
376
—
380
1,684
$
2,440
734
(938)
$
2,236
Interest expense, net of capitalized interest
$
13,879
7,316
2,749
6,128
$
30,072
189
—
$
30,261
Income tax provision (benefit)
$
23,924
(3,005)
5,916
596
$
27,431
488
2,667
$
30,586
Equity in earnings of affiliates
$
—
—
—
977
$
977
—
154
$
1,131
Net financial earnings (loss)
$
100,697
(9,379)
21,125
2,450
$
114,893
813
(3,396)
$
112,310
Capital expenditures
$
92,600
13,706
—
10,122
$
116,428
760
—
$
117,188
(1)Includes sales to Canada for the ES segment, which are immaterial.
(2)The amortization of acquired wholesale energy contracts is excluded above and is included in natural gas purchases - nonutility on the Unaudited Condensed Consolidated Statements of Operations.
(3)Included in other income, net on the Unaudited Condensed Consolidated Statements of Operations.
33
New Jersey Resources Corporation
Part I
NOTES TO UNAUDITED CONDENSED CONSOLIDATED FINANCIAL STATEMENTS (Continued)
Information related to the Company's various reporting segments and other operations during the six months ended March 31, 2024 and 2023, are as follows:
Segments
(Thousands)
NJNG
CEV
ES
S&T
Subtotal
HSO
Elims
Total
2024
Operating revenues
External customers
$
755,956
44,620
249,405
(1)
45,556
$
1,095,537
29,586
—
$
1,125,123
Intercompany
$
675
—
(4,875)
1,348
$
(2,852)
153
2,699
$
—
Depreciation and amortization
$
54,381
13,853
113
(2)
12,380
$
80,727
500
(865)
$
80,362
Interest income (3)
$
1,095
—
271
4,888
$
6,254
688
(2,880)
$
4,062
Interest expense, net of capitalized interest
$
29,601
14,629
6,639
11,801
$
62,670
424
—
$
63,094
Income tax provision
$
35,132
1,537
12,800
1,651
$
51,120
468
5,295
$
56,883
Equity in earnings of affiliates
$
—
—
—
1,078
$
1,078
—
1,320
$
2,398
Net financial earnings (loss)
$
158,539
4,906
45,475
5,621
$
214,541
(216)
(3,305)
$
211,020
Capital expenditures
$
177,425
37,083
—
21,308
$
235,816
1,486
—
$
237,302
2023
Operating revenues
External customers
$
757,909
27,198
509,952
(1)
45,017
$
1,340,076
27,518
—
$
1,367,594
Intercompany
$
675
—
8,560
2,708
$
11,943
196
(12,139)
$
—
Depreciation and amortization
$
50,209
12,041
119
(2)
11,962
$
74,331
442
—
$
74,773
Interest income (3)
$
789
—
649
3,085
$
4,523
1,388
(1,716)
$
4,195
Interest expense, net of capitalized interest
$
27,588
13,211
5,807
12,835
$
59,441
311
—
$
59,752
Income tax provision (benefit)
$
38,307
(4,842)
25,980
2,539
$
61,984
705
875
$
63,564
Equity in earnings of affiliates
$
—
—
—
1,886
$
1,886
—
191
$
2,077
Net financial earnings (loss)
$
155,361
(12,961)
73,658
8,693
$
224,751
784
(2,941)
$
222,594
Capital expenditures
$
174,671
57,699
—
29,841
$
262,211
900
—
$
263,111
(1)Includes sales to Canada for the ES segment, which are immaterial.
(2)The amortization of acquired wholesale energy contracts is excluded above and is included in natural gas purchases - nonutility on the Unaudited Condensed Consolidated Statements of Operations.
(3)Included in other income, net on the Unaudited Condensed Consolidated Statements of Operations.
The Company's assets for the various reporting segments and business operations are detailed below:
Segments
Intercompany
(Thousands)
NJNG
CEV
ES
S&T
Subtotal
HSO
Assets (1)
Total
March 31, 2024
$
4,527,458
1,124,392
104,094
1,012,899
$
6,768,843
171,594
(293,060)
$
6,647,377
September 30, 2023
$
4,414,829
1,128,577
123,775
1,011,959
$
6,679,140
171,275
(312,919)
$
6,537,496
(1)Consists of transactions between subsidiaries that are eliminated and reclassified in consolidation.
34
New Jersey Resources Corporation
Part I
NOTES TO UNAUDITED CONDENSED CONSOLIDATED FINANCIAL STATEMENTS (Continued)
The Chief Executive Officer, who uses NFE as a measure of profit or loss in measuring the results of the Company's reporting segments and other business operations, is the chief operating decision maker of the Company. A reconciliation of consolidated NFE to consolidated net income is as follows:
Three Months Ended
Six Months Ended
March 31,
March 31,
(Thousands)
2024
2023
2024
2023
Net financial earnings
$
138,576
$
112,310
$
211,020
$
222,594
Less:
Unrealized loss (gain) on derivative instruments and related transactions
25,457
13,971
20,057
(17,532)
Tax effect
(6,049)
(3,320)
(4,767)
4,167
Effects of economic hedging related to natural gas inventory
(2,845)
(11,203)
(19,073)
12,769
Tax effect
676
2,662
4,533
(3,035)
Gain on equity method investment
—
(200)
—
(200)
Tax effect
—
50
—
50
NFE tax adjustment
525
103
47
207
Net income
$
120,812
$
110,247
$
210,223
$
226,168
The Company uses derivative instruments as economic hedges of purchases and sales of physical natural gas inventory. For GAAP purposes, these derivatives are recorded at fair value and related changes in fair value are included in reported earnings. Revenues and cost of natural gas related to physical natural gas flow are recognized when the natural gas is delivered to customers. Consequently, there is a mismatch in the timing of earnings recognition between the economic hedges and physical natural gas flows. Timing differences occur in two ways:
•unrealized gains and losses on derivatives are recognized in reported earnings in periods prior to physical natural gas inventory flows; and
•unrealized gains and losses of prior periods are reclassified as realized gains and losses when derivatives are settled in the same period as physical natural gas inventory movements occur.
NFE is a measure of the earnings based on eliminating these timing differences, to effectively match the earnings effects of the economic hedges with the physical sale of natural gas, SRECs and foreign currency contracts. Consequently, to reconcile between net income and NFE, current period unrealized gains and losses on the derivatives are excluded from NFE as a reconciling item. Realized derivative gains and losses are also included in current period net income. However, NFE includes only realized gains and losses related to natural gas sold out of inventory, effectively matching the full earnings effects of the derivatives with realized margins on physical natural gas flows. Included in the tax effects are current and deferred income tax expense corresponding with the components of NFE. The Company also calculates a quarterly tax adjustment based on an estimated annual effective tax rate for NFE purposes.
15. RELATED PARTY TRANSACTIONS
Effective April 2020, NJNG entered into a 5-year agreement for 3 Bcf of firm storage capacity with Steckman Ridge, which expires on March 31, 2025. Under the terms of the agreement, NJNG incurs demand fees, at market rates, of approximately $9.3M annually, a portion of which is eliminated in consolidation. These fees are recoverable through NJNG’s BGSS mechanism and are included as a component of regulatory assets.
35
New Jersey Resources Corporation
Part I
NOTES TO UNAUDITED CONDENSED CONSOLIDATED FINANCIAL STATEMENTS (Continued)
ES may periodically enter into storage or park and loan agreements with its affiliated FERC-jurisdictional natural gas storage facility, Steckman Ridge. As of March 31, 2024, ES entered into transactions with Steckman Ridge for varying terms, all of which expire by March 31, 2027.
Demand fees, net of eliminations, associated with Steckman Ridge were as follows:
Three Months Ended
Six Months Ended
March 31,
March 31,
(Thousands)
2024
2023
2024
2023
NJNG
$
1,585
$
1,615
$
3,240
$
3,270
ES
214
155
438
327
Total
$
1,799
$
1,770
$
3,678
$
3,597
The following table summarizes demand fees payable to Steckman Ridge as of:
(Thousands)
March 31, 2024
September 30, 2023
NJNG
$
778
$
775
ES
81
84
Total
$
859
$
859
NJNG and ES enter into various AMAs, the effects of which are eliminated in consolidation. Under the terms of these agreements, NJNG releases certain transportation and storage contracts to ES. NJNG and ES had one AMA, which expired on March 31, 2024, and was not renewed.
NJNG entered into two transportation agreements with Adelphia, each for committed capacity of 130,000 Dekatherms per day. The first is for 5 years in Zone South with an expiration date of August 8, 2027, and the second is for 15 years in Zone North, which began on November 1, 2023, with an expiration date of October 31, 2038.
ES had a 5-year agreement for 3 Bcf of firm storage capacity with Leaf River, that expired on March 31, 2024, the effects of which are eliminated in consolidation, and was not renewed.
NJNG and CEV entered into a 15-year sublease and PPA related to an onsite solar array and the related energy output at the Company’s headquarters in Wall, New Jersey, with an expiration date of March 1, 2036, the effects of which are immaterial to the consolidated financial statements.
NJNG entered into 16-year lease agreements, as Lessor, with various NJR subsidiaries, as Lessees, for office space at the Company’s headquarters in Wall, New Jersey, with an expiration date of July 1, 2037, the effects of which are eliminated in consolidation.
NJNG and CEV entered into a 20-year sublease and PPA related to an onsite solar array and the related energy output at the Company’s liquefied natural gas plant in Howell, New Jersey, with an expiration date of June 1, 2042, the effects of which are immaterial to the consolidated financial statements.
The intercompany profits for certain transactions between NJNG and ES and NJNG and Adelphia are not eliminated in accordance with ASC 980, Regulated Operations.
36
New Jersey Resources Corporation
Part I
ITEM 2. MANAGEMENT'S DISCUSSION AND ANALYSIS OF FINANCIAL CONDITION AND RESULTS OF
OPERATIONS
Critical Accounting Estimates
A summary of our critical accounting policies is included in Item 7. Management's Discussion and Analysis of Financial Condition and Results of Operations of our Annual Report on Form 10-K for the period ended September 30, 2023. Our critical accounting policies have not changed from those reported in the 2023 Annual Report on Form 10-K.
NJR is a diversified energy services holding company providing retail natural gas service in New Jersey and wholesale natural gas and related energy services to customers in the U.S. and Canada. In addition, we invest in clean energy projects, storage and transportation assets and provide various repair, sales and installation services. A more detailed description of our organizational structure can be found in Item 1. Business of our 2023 Annual Report on Form 10-K.
Reporting Segments
We have four primary reporting segments as presented in the chart below:
In addition to our four reporting segments above, we have nonutility operations that either provide corporate support services or do not meet the criteria to be treated as a separate reporting segment. These operations, which comprise HSO, include: appliance repair services, sales and installations at NJRHS and commercial real estate holdings at Commercial Realty & Resources Corp.
37
New Jersey Resources Corporation
Part I
ITEM 2. MANAGEMENT’S DISCUSSION AND ANALYSIS OF FINANCIAL CONDITION AND RESULTS OF
OPERATIONS (Continued)
Operating Results
Net income (loss) by reporting segment and other business operations, which are discussed in detail within the operating results sections of each reporting segment and other business operations, are as follows:
Three Months Ended
Six Months Ended
March 31,
March 31,
(Thousands)
2024
2023
2024
2023
Net income (loss)
NJNG
$
107,095
89
%
$
100,697
91
%
$
158,539
75
%
$
155,361
69
%
CEV
(5,616)
(5)
(9,379)
(8)
4,906
2
(12,961)
(6)
ES
17,028
14
19,046
17
40,961
20
83,607
37
S&T
1,981
2
2,600
2
5,621
3
8,843
4
HSO
384
—
813
1
(216)
—
784
—
Eliminations (1)
(60)
—
(3,530)
(3)
412
—
(9,466)
(4)
Total
$
120,812
100
%
$
110,247
100
%
$
210,223
100
%
$
226,168
100
%
(1) Consists of transactions between subsidiaries that are eliminated in consolidation.
Consolidated net income increased approximately $10.6M during the three months ended March 31, 2024, compared with the three months ended March 31, 2023, due primarily to the following factors:
•$6.4M increase in earnings at NJNG due to increased revenues resulting from an increase in customers and higher BGSS incentives; and
•$3.8M increase in earnings at CEV related to the recognition of ITCs associated with solar sale leaseback financing transactions.
Consolidated net income decreased approximately $15.9M during the six months ended March 31, 2024, compared with the six months ended March 31, 2023, due primarily to the following factors:
•$42.6M decrease in earnings at ES due to a period of higher volatility in natural gas prices related to Winter Storm Elliott in December 2022 that did not reoccur; partially offset by
•$17.9M increase in earnings at CEV due to higher SREC and TREC sales and an increase in the recognition of ITCs associated with solar sale leaseback financing transactions.
The primary drivers of the changes noted above are described in more detail in the individual reporting segment and other business operations discussions.
Assets by reporting segment and operations are as follows:
(Thousands)
March 31, 2024
September 30, 2023
Assets
NJNG
$
4,527,458
68
%
$
4,414,829
68
%
CEV
1,124,392
17
1,128,577
17
ES
104,094
2
123,775
2
S&T
1,012,899
15
1,011,959
15
HSO
171,594
3
171,275
3
Intercompany assets (1)
(293,060)
(5)
(312,919)
(5)
Total
$
6,647,377
100
%
$
6,537,496
100
%
(1)Consists of transactions between subsidiaries that are eliminated in consolidation.
Consolidated assets increased approximately $109.9M as of March 31, 2024, compared with September 30, 2023, due primarily to the following factors:
•$115.5M increase in utility plant expenditures, net at NJNG;
•142.9M increase in receivables primarily at NJNG; and
•$28.0M increase in nonutility plant and equipment, net at CEV and S&T; partially offset by
•$118.5M decrease in gas in storage at NJNG and ES;
•$49.7M decrease in noncurrent regulatory assets due primarily to the remeasurement of the Company's other postretirement benefits at NJNG; and
•$24.7M decrease in prepaid taxes at NJNG and HSO.
38
New Jersey Resources Corporation
Part I
ITEM 2. MANAGEMENT’S DISCUSSION AND ANALYSIS OF FINANCIAL CONDITION AND RESULTS OF
OPERATIONS (Continued)
Non-GAAP Financial Measures
Our management uses NFE, a non-GAAP financial measure, when evaluating our operating results. ES economically hedges its natural gas inventory with financial derivative instruments. NFE is a measure of the earnings based on eliminating timing differences surrounding the recognition of certain gains or losses, to effectively match the earnings effects of the economic hedges with the physical sale of natural gas and, therefore, eliminates the impact of volatility to GAAP earnings associated with the derivative instruments. To the extent we utilize forwards, futures, or other derivatives to hedge forecasted SREC production, unrealized gains and losses are also eliminated from NFE. Included in the tax effects are current and deferred income tax expense corresponding with the components of NFE. Included in the tax effects are current and deferred income tax expense corresponding with the components of NFE.
GAAP requires us, during the interim periods, to estimate our annual effective tax rate and use this rate to calculate the year-to-date tax provision. We also determine an annual estimated effective tax rate for NFE purposes and calculate a quarterly tax adjustment based on the differences between our forecasted net income and our forecasted NFE for the fiscal year. Since the annual estimated effective tax rate is based on certain forecasted assumptions, the rate and resulting NFE are subject to change. No adjustment is needed during the fourth quarter, since the actual effective tax rate is calculated at year end.
Non-GAAP financial measures are not in accordance with, or an alternative to, GAAP and should be considered in addition to, and not as a substitute for or a replacement of, the comparable GAAP measure and should be read in conjunction with those GAAP results. Below is a reconciliation of consolidated net income, the most directly comparable GAAP measure, to NFE:
Three Months Ended
Six Months Ended
March 31,
March 31,
(Thousands, except per share data)
2024
2023
2024
2023
Net income
$
120,812
$
110,247
$
210,223
$
226,168
Add:
Unrealized loss (gain) on derivative instruments and related transactions
25,457
13,971
20,057
(17,532)
Tax effect
(6,049)
(3,320)
(4,767)
4,167
Effects of economic hedging related to natural gas inventory (1)
(2,845)
(11,203)
(19,073)
12,769
Tax effect
676
2,662
4,533
(3,035)
Gain on equity method investment
—
(200)
—
(200)
Tax effect
—
50
—
50
NFE tax adjustment
525
103
47
207
Net financial earnings
$
138,576
$
112,310
$
211,020
$
222,594
Basic earnings per share
$
1.23
$
1.14
$
2.14
$
2.34
Add:
Unrealized loss (gain) on derivative instruments and related transactions
0.25
0.14
0.20
(0.18)
Tax effect
(0.06)
(0.03)
(0.05)
0.04
Effects of economic hedging related to natural gas inventory (1)
(0.03)
(0.12)
(0.19)
0.13
Tax effect
0.01
0.03
0.05
(0.03)
NFE tax adjustment
0.01
—
—
—
Basic net financial earnings per share
$
1.41
$
1.16
$
2.15
$
2.30
(1)Effects of hedging natural gas inventory transactions where the economic impact is realized in a future period.
39
New Jersey Resources Corporation
Part I
ITEM 2. MANAGEMENT’S DISCUSSION AND ANALYSIS OF FINANCIAL CONDITION AND RESULTS OF
OPERATIONS (Continued)
NFE by reporting segment and other business operations, which are discussed in detail within the operating results sections of each reporting segment and other business operations, is summarized as follows:
Three Months Ended
Six Months Ended
March 31,
March 31,
(Thousands)
2024
2023
2024
2023
Net financial earnings (loss)
NJNG
$
107,095
77
%
$
100,697
89
%
$
158,539
75
%
$
155,361
70
%
CEV
(5,616)
(4)
(9,379)
(8)
4,906
2
(12,961)
(6)
ES
37,644
27
21,125
19
45,475
22
73,658
33
S&T
1,981
2
2,450
2
5,621
3
8,693
4
HSO
384
—
813
1
(216)
—
784
—
Eliminations(1)
(2,912)
(2)
(3,396)
(3)
(3,305)
(2)
(2,941)
(1)
Total
$
138,576
100
%
$
112,310
100
%
$
211,020
100
%
$
222,594
100
%
(1) Consists of transactions between subsidiaries that are eliminated in consolidation.
Consolidated NFE increased approximately $26.3M during the three months ended March 31, 2024, compared with the three months ended March 31, 2023, due primarily to the following factors:
•$16.5M increase at ES due to higher Financial Margin resulting from periods of cold weather during January 2024;
•$6.4M increase in earnings at NJNG; and
•$3.8M increase in earnings at CEV, as previously discussed.
Consolidated NFE decreased approximately $11.6M during the six months ended March 31, 2024, compared with the six months ended March 31, 2023, due primarily to the following factors:
•$28.2M decrease at ES due to higher volatility in natural gas prices in the prior year, as previously discussed; partially offset by
•$17.9M increase in earnings at CEV, as previously discussed.
Natural Gas Distribution
Overview
Natural Gas Distribution is comprised of NJNG, a natural gas utility that provides regulated natural gas service throughout Burlington, Middlesex, Monmouth, Morris, Ocean, and Sussex counties in New Jersey to approximately 581,600 residential and commercial customers in its service territory and also participates in the off-system sales and capacity release markets. The business is subject to various risks, which may include but are not limited to impacts to customer growth and customer usage, customer collections, the timing and costs of capital expenditures and construction of infrastructure projects, operating and financing costs, fluctuations in commodity prices and customer conservation efforts. In addition, NJNG may be subject to adverse economic conditions such as inflation and rising natural gas costs, certain regulatory actions, environmental remediation and severe weather conditions. It is often difficult to predict the impact of events or trends associated with these risks.
NJNG’s business is seasonal by nature, as weather conditions directly influence the volume of natural gas delivered to customers on an annual basis. Specifically, customer demand substantially increases during the winter months when natural gas is used for heating purposes. As a result, NJNG generates most of its natural gas distribution revenues during the first and second fiscal quarters and is subject to variations in earnings and working capital during the fiscal year.
As a regulated company, NJNG is required to recognize the impact of regulatory decisions on its financial statements. See Note 4. Regulation in the accompanying Unaudited Condensed Consolidated Financial Statements for a more detailed discussion of regulatory actions, including filings related to programs and associated expenditures, as well as rate requests related to recovery of capital investments and operating costs.
40
New Jersey Resources Corporation
Part I
ITEM 2. MANAGEMENT’S DISCUSSION AND ANALYSIS OF FINANCIAL CONDITION AND RESULTS OF
OPERATIONS (Continued)
NJNG’s operations are managed with the goal of providing safe and reliable service, growing its customer base, diversifying its Utility Gross Margin, promoting clean energy programs and mitigating the risks discussed above.
Base Rate Case
On January 31, 2024, NJNG filed a base rate case with the BPU requesting a natural gas revenue increase of $222.6M including a recovery of infrastructure investments, a change in the Company’s overall rate of return on rate base to 7.57% and a change in the return on common equity to 10.42%.
Infrastructure Projects
NJNG has significant annual capital expenditures associated with the management of its natural gas distribution and transmission system, including new utility plant expenditures associated with customer growth and its associated pipeline integrity management and infrastructure programs. Below is a summary of NJNG’s capital expenditures, including accruals, for the six months ended March 31, 2024, and estimates of expected investments for fiscal 2024 and 2025:
Estimated capital expenditures are reviewed on a regular basis and may vary based on the ongoing effects of regulatory oversight, environmental regulations, unforeseen events and the ability to access capital.
NJNG continues to implement BPU-approved infrastructure projects that are designed to enhance the reliability and integrity of NJNG’s natural gas distribution system.
Infrastructure Investment Program
In October 2020, the BPU approved NJNG’s five-year IIP filing for $150.0M of transmission and distribution investments, effective November 1, 2020, which will be recovered through annual filings to adjust base rates.
In September 2023, the BPU approved NJNG's annual IIP filing, which requested a rate increase for capital expenditures of $28.2M through June 30, 2023, which resulted in a $3.2M revenue increase, effective October 1, 2023.
On March 28, 2024, NJNG submitted its annual IIP filing to the BPU requesting a rate increase for capital expenditures of $43.5M through June 30, 2024, which will result in a $5.6M revenue increase, with a proposed effective date of October 1, 2024.
41
New Jersey Resources Corporation
Part I
ITEM 2. MANAGEMENT’S DISCUSSION AND ANALYSIS OF FINANCIAL CONDITION AND RESULTS OF
OPERATIONS (Continued)
Customer Growth
In conducting NJNG's business, management focuses on factors it believes may have significant influence on its future financial results. NJNG's policy is to work with all stakeholders, including customers, regulators and policymakers, to achieve favorable results. These factors include the rate of NJNG's customer growth in its service territory, which can be influenced by political and regulatory policies, the delivered cost of natural gas compared with competing fuels, interest rates and general economic and business conditions.
NJNG's total customers include the following:
March 31, 2024
March 31, 2023
Firm customers
Residential
525,391
516,453
Commercial, industrial & other
33,108
33,160
Residential transport
14,962
17,173
Commercial transport
8,030
7,604
Total firm customers
581,491
574,390
Other
109
110
Total customers
581,600
574,500
During the six months ended March 31, 2024 and 2023, NJNG added 4,058 and 4,064 new customers, respectively. NJNG expects new customer additions, and those customers who added additional natural gas services to their premises to contribute approximately $3.4M of incremental Utility Gross Margin on an annualized basis.
Energy Efficiency Programs
SAVEGREEN conducts home energy audits and provides various grants, incentives and financing alternatives designed to encourage the installation of high-efficiency heating and cooling equipment and other energy efficiency upgrades. Depending on the specific incentive or approval, NJNG recovers costs associated with the programs over a three- to 10-year period through a tariff rider mechanism. In March 2021, the BPU approved a three-year SAVEGREEN program consisting of approximately $126.1M of direct investment, $109.4M in financing options, and approximately $23.4M in O&M.
In September 2023, the BPU approved an increase to the energy efficiency rate for the SAVEGREEN programs established from 2010 through the present, which increased annual recoveries by $9.0M, effective October 1, 2023.
On November 9, 2023, NJNG filed a letter of petition seeking BPU approval to extend NJNG’s current SAVEGREEN program through December 31, 2024, with an additional $76.9M in order to meet customer demand for this program, which was approved by the BPU on April 30, 2024.
On December 1, 2023, NJNG filed a petition seeking BPU approval of its 2024 SAVEGREEN program, which would support new energy efficiency, demand response and building decarbonization start-up programs for two and a half-years starting January 1, 2025 through June 30, 2027. The 2024 SAVEGREEN program filing, which totals $482.4M, includes $245.1M of direct investment, $217.2M in financing options and $20.1M in O&M.
Program recoveries from customers during the six months ended March 31, 2024 and 2023, were $15.1M and $8.5M, respectively. The recovery includes a weighted average cost of capital that ranges from 6.84% to 6.9%, with a return on equity of 9.6% to 9.75%.
42
New Jersey Resources Corporation
Part I
ITEM 2. MANAGEMENT’S DISCUSSION AND ANALYSIS OF FINANCIAL CONDITION AND RESULTS OF
OPERATIONS (Continued)
Conservation Incentive Program/BGSS
The CIP facilitates normalizing NJNG’s Utility Gross Margin for variances not only due to weather but also for other factors affecting customer usage, such as conservation and energy efficiency. Recovery of Utility Gross Margin for the non-weather variance through the CIP is limited to the amount of certain natural gas supply cost savings achieved and is subject to a variable margin revenue test. Additionally, recovery of the CIP Utility Gross Margin is subject to an annual earnings test. An annual review of the CIP must be filed by June 1, coincident with NJNG’s annual BGSS filing, during which NJNG can request rate changes to the CIP.
NJNG's total utility firm gross margin includes the following adjustments related to the CIP mechanism:
Three Months Ended
Six Months Ended
March 31,
March 31,
(Thousands)
2024
2023
2024
2023
Weather (1)
$
22,911
$
36,946
$
33,527
$
39,026
Usage
5,734
(418)
6,682
1,068
Total
$
28,645
$
36,528
$
40,209
$
40,094
(1)Compared with the 20-year average, weather was 12.4% and 10.8% warmer-than-normal during the three and six months ended March 31, 2024 and 21.2% and 13.1% warmer-than-normal during the three and six months ended March 31, 2023.
Recovery of Natural Gas Costs
NJNG’s cost of natural gas is passed through to our customers, without markup, by applying NJNG’s authorized BGSS rate to actual therms delivered. There is no Utility Gross Margin associated with BGSS costs; therefore, changes in such costs do not impact NJNG’s earnings. NJNG monitors its actual natural gas costs in comparison to its BGSS rates to manage its cash flows associated with its allowed recovery of natural gas costs, which is facilitated through BPU-approved deferred accounting and the BGSS pricing mechanism. Accordingly, NJNG occasionally adjusts its periodic BGSS rates or can issue credits or refunds, as appropriate, for its residential and small commercial customers when the commodity cost varies from the existing BGSS rate. BGSS rates for its large commercial customers are adjusted monthly based on NYMEX prices.
NJNG’s residential and commercial markets are currently open to competition, and its rates are segregated between BGSS (i.e., natural gas commodity) and delivery (i.e., transportation) components. NJNG earns Utility Gross Margin through the delivery of natural gas to its customers and, therefore, is not negatively affected by customers who use its transportation service and purchase natural gas from another supplier. Under an existing order from the BPU, BGSS can be provided by suppliers other than the state’s natural gas utilities; however, customers who purchase natural gas from another supplier continue to use NJNG for transportation service.
In April 2023, the BPU approved on a final basis, NJNG’s February 2023 filing for a reduction to the BGSS rate, which reduced annual recoveries by approximately $29.9M, effective March 1, 2023. NJNG’s February 2023 filing also advised the BPU of a bill credit for residential and small commercial customers. Total bill credits given back to customers from March 2023 through May 2023, totaled approximately $32.4M.
In September 2023, the BPU approved, on a provisional basis, NJNG's annual BGSS filing to decrease the annual revenues credited to BGSS by approximately $38.6M, a $7.4M annual decrease related to its balancing charge, and a $27.0M increase to CIP rates, effective October 1, 2023, which was approved on a final basis by the BPU on April 30, 2024. The balancing charge rate includes the cost of balancing natural gas deliveries with customer usage for sales and transportation customers, and balancing charge revenues are credited to BGSS.
BGSS Incentive Programs
NJNG is eligible to receive financial incentives for reducing BGSS costs through a series of Utility Gross Margin-sharing programs that include off-system sales, capacity release and storage incentive programs. These programs are designed to encourage better utilization and hedging of NJNG’s natural gas supply, transportation and storage assets. Depending on the program, NJNG shares 80 or 85% of Utility Gross Margin generated by these programs with firm customers. Utility Gross Margin from incentive programs was approximately $7.9M and $5.8M during the three months ended March 31, 2024 and 2023, respectively, and $13.3M and $14.5M during the six months ended March 31, 2024 and 2023, respectively.
43
New Jersey Resources Corporation
Part I
ITEM 2. MANAGEMENT’S DISCUSSION AND ANALYSIS OF FINANCIAL CONDITION AND RESULTS OF
OPERATIONS (Continued)
Hedging
In order to provide relative price stability to its natural gas supply portfolio, NJNG employs a hedging strategy with the goal of having at least 75% of the Company's projected winter periodic BGSS natural gas sales volumes hedged by each November 1 and at least 25% of the projected periodic BGSS natural gas sales hedged for the following April through March period. The hedging goal is typically achieved with gas in storage and the use of financial instruments to hedge storage injections. NJNG may also use various financial instruments including futures, swaps, options and weather related products to hedge its future delivery obligations.
Commodity Prices
NJNG is affected by the price of natural gas, which can have a significant impact on our cash flows, short-term financing costs, the price of natural gas charged to our customers through the BGSS clause, our ability to collect accounts receivable, which impacts our bad debt expense, and our ability to maintain a competitive advantage over other energy sources. Natural gas commodity prices are shown in the graph below, which illustrates the daily natural gas prices(1) in the Northeast market region, also known as TETCO M-3.
(1) Data sourced from Standard & Poor's Financial Services, LLC Global Platts.
The maximum price per MMBtu was $20.98 and $32.46 and the minimum price was $0.89 and $0.67 for the six months ended March 31, 2024 and 2023, respectively. A more detailed discussion of the impacts of the price of natural gas on operating revenues, natural gas purchases and cash flows can be found in the Operating Results and Cash Flow sections of Item 2. Management's Discussion and Analysis of Financial Condition and Results of Operations.
Societal Benefits Charge
NJNG’s qualifying customers are eligible for the USF program, which is administered by the New Jersey Department of Community Affairs, to help make energy bills more affordable.
In April 2023, the BPU approved, NJNG's annual SBC filing, which included an increase to the RAC annual recoveries of approximately $3.7M and a decrease to the NJCEP annual recoveries of approximately $0.9M, effective May 1, 2023.
In September 2023, the BPU approved NJNG's annual USF filing, which included an increase to the statewide USF rate, of approximately $0.7M, effective October 1, 2023.
44
New Jersey Resources Corporation
Part I
ITEM 2. MANAGEMENT’S DISCUSSION AND ANALYSIS OF FINANCIAL CONDITION AND RESULTS OF
OPERATIONS (Continued)
On March 20, 2024, the BPU approved NJNG's annual SBC filing of RAC expenditures through June 30, 2023, which included an increase to the RAC annual recoveries of approximately $2.4M and an increase to the NJCEP annual recoveries of approximately $5.5M, effective April 1, 2024.
Environmental Remediation
NJNG is responsible for the environmental remediation of former MGP sites, which contain contaminated residues from former gas manufacturing operations that ceased operating at these sites by the mid-1950s and, in some cases, had been discontinued many years earlier. Actual MGP remediation costs may vary from management’s estimates due to the developing nature of remediation requirements, regulatory decisions by the NJDEP and related litigation. NJNG reviews these costs at the end of each fiscal year and adjusts its liability and corresponding regulatory asset as necessary to reflect its expected future remediation obligation. Accordingly, NJNG recognized a regulatory asset and an obligation of $157.8M as of March 31, 2024, a decrease of $11.6M compared with the prior fiscal period. See Note 13. Commitments and Contingent Liabilities for more details.
Other regulatory filings and a more detailed discussion of the filings in this section can be found in Note 4. Regulation in the accompanying Unaudited Condensed Consolidated Financial Statements.
Operating Results
NJNG's operating results are as follows:
Three Months Ended
Six Months Ended
March 31,
March 31,
(Thousands)
2024
2023
2024
2023
Operating revenues (1)
$
463,201
$
400,838
$
756,631
$
758,584
Operating expenses
Natural gas purchases (2)(3)
206,675
158,694
325,119
343,465
Operation and maintenance
59,554
58,475
114,259
108,196
Regulatory rider expense (4)
29,229
23,154
48,418
41,405
Depreciation and amortization
27,464
25,319
54,381
50,209
Total operating expenses
322,922
265,642
542,177
543,275
Operating income
140,279
135,196
214,454
215,309
Other income, net
6,142
3,304
8,818
5,947
Interest expense, net of capitalized interest
14,850
13,879
29,601
27,588
Income tax provision
24,476
23,924
35,132
38,307
Net income
$
107,095
$
100,697
$
158,539
$
155,361
(1)Includes nonutility revenue of approximately $0.3M and $0.7M for both the three and six months ended March 31, 2024 and 2023, for lease agreements with various NJR subsidiaries leasing office space from NJNG at the Company’s headquarters, which are eliminated in consolidation.
(2)Includes the purchased cost of the natural gas, fees paid to pipelines and storage facilities, adjustments as a result of BGSS incentive programs and hedging transactions. These expenses are passed through to customers and are offset by corresponding revenues.
(3)Includes related party transactions of approximately $2.3M for both the three months ended March 31, 2024 and 2023, and $4.7M and $4.6M for thesix months ended March 31, 2024 and 2023, respectively, a portion of which is eliminated in consolidation.
(4)Consists of expenses associated with state-mandated programs, the RAC and energy efficiency programs, and are calculated on a per-therm basis. These expenses are passed through to customers and are offset by corresponding revenues.
Operating Revenues and Natural Gas Purchases
Operating revenues increased 15.6% and natural gas purchases increased 30.2% during the three months ended March 31, 2024, compared with the three months ended March 31, 2023. Operating revenues decreased 0.3% and natural gas purchases decreased 5.3% during the six months ended March 31, 2024, compared with the six months ended March 31, 2023.
45
New Jersey Resources Corporation
Part I
ITEM 2. MANAGEMENT’S DISCUSSION AND ANALYSIS OF FINANCIAL CONDITION AND RESULTS OF
OPERATIONS (Continued)
The factors contributing to the increases and decreases in operating revenues and natural gas purchases are as follows:
Three Months Ended
Six Months Ended
March 31,
March 31,
2024 v. 2023
2024 v. 2023
(Thousands)
Operating revenues
Natural gas purchases
Operating revenues
Natural gas purchases
BGSS incentives
$
38,274
$
36,166
$
2,055
$
3,252
Firm sales
22,938
8,931
14,122
3,861
Average BGSS rates
(28,556)
(28,556)
(56,585)
(56,585)
Bill credits
31,581
31,581
31,581
31,581
CIP adjustments
(7,883)
—
115
—
Riders and other (1)
6,009
(141)
6,759
(455)
Total increase (decrease)
$
62,363
$
47,981
$
(1,953)
$
(18,346)
(1)Rider and other includes changes in rider rates, including those related to Energy Efficiency, NJCEP and other programs, which is offset in regulatory rider expense.
Non-GAAP Financial Measures
Management uses Utility Gross Margin, a non-GAAP financial measure, when evaluating the operating results of NJNG. NJNG's Utility Gross Margin is defined as operating revenues less natural gas purchases, sales tax, and regulatory rider expenses. This measure differs from gross margin as presented on a GAAP basis as it excludes certain operations and maintenance expense and depreciation and amortization. Utility Gross Margin may also not be comparable to the definition of gross margin used by others in the natural gas distribution business and other industries. Management believes that Utility Gross margin provides a meaningful basis for evaluating utility operations since natural gas costs, sales tax and regulatory rider expenses are included in operating revenues and passed through to customers and, therefore, have no effect on Utility Gross Margin. Non-GAAP financial measures are not in accordance with, or an alternative to, GAAP and should be considered in addition to, and not as a substitute for, the comparable GAAP measure.
Utility Gross Margin
A reconciliation of gross margin, the closest GAAP financial measure to NJNG's Utility Gross Margin, is as follows:
Three Months Ended
Six Months Ended
March 31,
March 31,
(Thousands)
2024
2023
2024
2023
Operating revenues
$
463,201
$
400,838
$
756,631
$
758,584
Less:
Natural gas purchases
206,675
158,694
325,119
343,465
Operation and maintenance (1)
29,558
30,711
55,341
57,005
Regulatory rider expense
29,229
23,154
48,418
41,405
Depreciation and amortization
27,464
25,319
54,381
50,209
Gross margin
170,275
162,960
273,372
266,500
Add:
Operation and maintenance (1)
29,558
30,711
55,341
57,005
Depreciation and amortization
27,464
25,319
54,381
50,209
Utility Gross Margin
$
227,297
$
218,990
$
383,094
$
373,714
(1)Excludes SG&A of approximately $30.0M and $27.8M for the three months ended March 31, 2024 and 2023, respectively, and $58.9M and $51.2M for the six months ended March 31, 2024 and 2023, respectively.
46
New Jersey Resources Corporation
Part I
ITEM 2. MANAGEMENT’S DISCUSSION AND ANALYSIS OF FINANCIAL CONDITION AND RESULTS OF
OPERATIONS (Continued)
Utility Gross Margin consists of three components:
•Utility firm gross margin generated from only the delivery component of either a sales tariff or a transportation tariff from residential and commercial customers who receive natural gas service from NJNG;
•BGSS incentive programs, where revenues generated or savings achieved from BPU-approved off-system sales, capacity release or storage incentive programs are shared between customers and NJNG; and
•Utility Gross Margin generated from off-tariff customers, as well as interruptible customers.
The following provides more information on the components of Utility Gross Margin and associated throughput (Bcf) of natural gas delivered to customers:
Three Months Ended
Six Months Ended
March 31,
March 31,
2024
2023
2024
2023
($ in thousands)
Margin
Bcf
Margin
Bcf
Margin
Bcf
Margin
Bcf
Utility Gross Margin/Throughput
Residential
$
163,495
21.0
$
157,276
19.5
$
271,532
34.9
$
261,294
34.2
Commercial, industrial and other
28,676
3.9
30,066
3.8
49,507
6.5
50,845
6.5
Firm transportation
26,490
4.7
25,208
4.5
47,254
8.3
45,688
8.5
Total utility firm gross margin/throughput
218,661
29.6
212,550
27.8
368,293
49.7
357,827
49.2
BGSS incentive programs
7,886
37.1
5,778
20.7
13,267
64.3
14,464
38.6
Interruptible/off-tariff agreements
750
3.3
662
3.0
1,534
6.6
1,423
6.6
Total Utility Gross Margin/Throughput
$
227,297
70.0
$
218,990
51.5
$
383,094
120.6
$
373,714
94.4
Utility Firm Gross Margin
Utility firm gross margin increased approximately $6.1M and $10.5M during the three and six months ended March 31, 2024, compared with the three and six months ended March 31, 2023, due primarily to increased residential customers.
The factors contributing to the change in Utility Gross Margin generated by BGSS incentive programs are as follows:
Three Months Ended
Six Months Ended
March 31,
March 31,
(Thousands)
2024 v. 2023
2024 v. 2023
Off-system sales
$
2,492
$
(434)
Storage
(479)
(798)
Capacity release
95
35
Total increase (decrease)
$
2,108
$
(1,197)
BGSS incentive programs increased during the three months ended March 31, 2024, compared with the three months ended March 31, 2023, due primarily to increased margins from off-system sales due to increased market volatility during periods of cold weather during January 2024. BGSS incentive programs decreased during the six months ended March 31, 2024, compared with the six months ended March 31, 2023, due primarily to decreased margins from storage due to reduced market volatility and off-system sales due to less volatile natural gas prices related to Winter Storm Elliott in December 2022 that did not reoccur.
Net Income
Net income increased approximately $6.4M during the three months ended March 31, 2024, compared with the three months ended March 31, 2023, due primarily to the following factors:
•$8.3M increase in Utility Gross Margin, as previously discussed; and
•$2.8M increase in other income, net due primarily to the remeasurement of the Company's other postretirement benefits along with increased AFUDC equity; partially offset by
•$2.1M increase in depreciation expense as a result of additional utility plant being placed into service; and
•$1.1M increase in O&M due to higher employee related expenses and information technology costs.
47
New Jersey Resources Corporation
Part I
ITEM 2. MANAGEMENT’S DISCUSSION AND ANALYSIS OF FINANCIAL CONDITION AND RESULTS OF
OPERATIONS (Continued)
Net income increased approximately $3.2M during the six months ended March 31, 2024, compared with the six months ended March 31, 2023, due primarily to the following factors:
•$9.4M increase in Utility Gross Margin; and
•$2.9M increase in other income, net; partially offset by
•$6.1M increase in O&M; and
•$4.2M increase in depreciation expense, as previously discussed.
Clean Energy Ventures
Overview
CEV actively pursues opportunities in the renewable energy markets. CEV enters into various agreements to install solar net-metered systems for residential and commercial customers, as well as large commercial grid-connected projects. In addition, CEV enters into various long-term agreements, including PPAs, to supply energy from commercial solar projects.
Capital expenditures related to clean energy projects are subject to change due to a variety of factors that may affect our ability to commence operations at these projects on a timely basis or at all, including logistics associated with the start-up of residential and commercial solar projects, such as timing of construction schedules, the permitting and regulatory process, any delays related to electric grid interconnection, economic trends, unforeseen events and the ability to access capital or allocation of capital to other investments or business opportunities. CEV is also subject to various risks, which may include impacts to residential solar customer growth and customer collections, our ability to identify and develop commercial solar asset investments, impacts to our supply chain and our ability to source materials for construction.
The primary contributors toward the value of qualifying clean energy projects are tax incentives and RECs. Changes in the federal statutes related to the ITC and/or relevant state legislation and regulatory policies affecting the market for solar renewable energy credits, could significantly affect future results.
Solar projects placed in service and related expenditures are as follows:
Three Months Ended
March 31,
($ in Thousands)
2024
2023
Placed in service
Projects
MW
Costs
Projects
MW
Costs
Grid-connected (1)
—
—
$
—
2
28.2
$
76,076
Net-metered:
Commercial (1)
—
—
41
1
5.0
11,159
Sunlight Advantage®
75
1.0
3,069
104
1.2
3,769
Total placed in service
75
1.0
$
3,110
107
34.4
$
91,004
Six Months Ended
March 31,
($ in Thousands)
2024
2023
Placed in service
Projects
MW
Costs
Projects
MW
Costs
Grid-connected (1)
—
—
$
—
3
35.7
$
90,152
Net-metered:
Commercial (1)
1
2.8
7,876
3
15.5
36,489
Sunlight Advantage®
148
1.8
5,777
149
1.8
5,609
Total placed in service
149
4.6
$
13,653
155
53.0
$
132,250
(1)Includes projects subject to sale leaseback arrangements.
48
New Jersey Resources Corporation
Part I
ITEM 2. MANAGEMENT’S DISCUSSION AND ANALYSIS OF FINANCIAL CONDITION AND RESULTS OF
OPERATIONS (Continued)
CEV has approximately 473.5 MW of solar capacity in service. Projects that were placed in service through December 31, 2019, qualified for a 30% federal ITC. The credit declined to 26% for property under construction during 2020 through the end of 2022. In August 2022, the federal ITC was restored to 30% through the end of 2032. There are additional opportunities to increase the credit amount for certain facilities that are placed in service after December 31, 2022, based upon the type of project and location.
CEV may enter into transactions to sell certain of its commercial solar assets concurrent with agreements to lease the assets back over a period of five to 15 years. The Company will continue to operate the solar assets and are responsible for related expenses and entitled to retain the revenue generated from RECs and energy sales. The ITCs and other tax benefits associated with these solar projects transfer to the buyer if applicable; however, the lease payments are structured so that CEV is compensated for the transfer of the related tax incentives. Accordingly, for solar projects financed under sale leasebacks for which the assets were sold during the first 5 years of in-service life, CEV recognizes the equivalent value of the ITC in other income on the Unaudited Condensed Consolidated Statements of Operations over the respective five-year ITC recapture periods, starting with the second year of the lease. CEV received proceeds of approximately $28.7M during the three months ended March 31, 2023, and $24.4M and $61.8M during the six months ended March 31, 2024 and 2023, respectively, in connection with sale leasebacks of commercial solar assets. There were no proceeds received during the three months ended March 31, 2024.
As part of its solar investment portfolio, CEV operates a residential and small commercial solar program, The Sunlight Advantage®, that provides qualifying homeowners and small business owners the opportunity to have a solar system installed at their home or place of business with no installation or maintenance expenses. CEV owns, operates and maintains the system over the life of the contract in exchange for monthly payments.
For solar installations placed in-service in New Jersey prior to April 30, 2020, each MWh of electricity produced creates an SREC that represents the renewable energy attribute of the solar-electricity generated that can be sold to third parties, predominantly load-serving entities that are required to comply with the solar requirements under New Jersey's renewable portfolio standard.
Following the close of the SREC market in New Jersey, the BPU established the TREC as the successor program to the SREC program. TRECs provide a fixed compensation base multiplied by an assigned project factor in order to determine their value. The project factor is determined by the type and location of the project, as defined. All TRECs generated are required to be purchased monthly by a TREC program administrator as appointed by the BPU.
In July 2021, the BPU established a new successor solar incentive program. This Administratively Determined Incentive Program, which we refer to as SREC IIs, provides administratively set incentives for net metered residential projects and net metered non-residential projects of 5 MW or less.
In December 2022, the BPU established the Competitive Solar Incentive Program, which provides incentives to larger solar facilities. It is open to qualifying grid supply solar facilities, non-residential net metered solar installations with a capacity greater than 5MW, and eligible grid supply solar facilities installed in combination with energy storage. Pricing is determined based on a competitive bid solicitation process.
REC activity during the six months ended, consisted of the following:
Beginning inventory balance
RECs
Ending inventory balance
Average
Generated
Delivered
Sale Price
March 31, 2024
SRECs
144,138
151,205
(123,153)
172,190
$211
TRECs (1)
10,120
32,552
(31,536)
11,136
$141
SREC IIs (1)
6,013
7,466
(3,571)
9,908
$89
March 31, 2023
SRECs
116,005
161,775
(47,557)
230,223
$213
TRECs (1)
10,759
20,869
(22,851)
8,777
$140
SREC IIs (1)
247
2,830
(1,382)
1,695
$92
(1)TREC and SREC II inventory balances are due primarily to the timing of generation and when RECs are delivered to state administrator.
49
New Jersey Resources Corporation
Part I
ITEM 2. MANAGEMENT’S DISCUSSION AND ANALYSIS OF FINANCIAL CONDITION AND RESULTS OF
OPERATIONS (Continued)
CEV hedges its expected SREC production through the use of forward sales contracts. The following table reflects the hedged percentage of our projected inventory of SRECs related to its in-service commercial and residential assets:
Energy Year (1)
Percent of SRECs Hedged
2024
99%
2025
89%
2026
88%
2027
51%
2028
27%
(1)Energy years are compliance periods for New Jersey's renewable portfolio standard that run from June 1 to May 31.
There are no direct costs associated with the production of RECs by our solar assets. All related costs are included as a component of O&M on the Unaudited Condensed Consolidated Statements of Operations, including such expenses as facility maintenance and broker fees.
Operating Results
CEV’s financial results are summarized as follows:
Three Months Ended
Six Months Ended
March 31,
March 31,
(Thousands)
2024
2023
2024
2023
Operating revenues
$
9,325
$
14,406
$
44,620
$
27,198
Operating expenses
Operation and maintenance
10,073
12,943
20,123
20,480
Depreciation and amortization
6,931
6,465
13,853
12,041
Total operating expenses
17,004
19,408
33,976
32,521
Operating (loss) income
(7,679)
(5,002)
10,644
(5,323)
Other income (loss), net
7,651
(66)
10,428
731
Interest expense, net
7,182
7,316
14,629
13,211
Income tax (benefit) provision
(1,594)
(3,005)
1,537
(4,842)
Net (loss) income
$
(5,616)
$
(9,379)
$
4,906
$
(12,961)
Net loss decreased approximately $3.8M during the three months ended March 31, 2024, compared with the three months ended March 31, 2023, due primarily to the following factors:
•$7.7M increase in other income, net due primarily to the recognition of ITCs associated with solar sale leaseback financing transactions; partially offset by
•$5.1M decrease in operating revenues due to lower SREC sales.
Net income increased approximately $17.9M during the six months ended March 31, 2024, compared with the six months ended March 31, 2023, due primarily to the following factors:
•$17.4M increase in operating revenues due to higher SREC and TREC sales; and
•$9.7M increase in other income, net due primarily to the recognition of ITCs associated with solar sale leaseback financing transactions; partially offset by
•$6.4M increase in income tax expense related to higher taxable earnings.
50
New Jersey Resources Corporation
Part I
ITEM 2. MANAGEMENT’S DISCUSSION AND ANALYSIS OF FINANCIAL CONDITION AND RESULTS OF
OPERATIONS (Continued)
Energy Services
Overview
ES markets and sells natural gas to wholesale and retail customers and manages natural gas transportation and storage assets throughout major market areas across North America. ES maintains a strategic portfolio of natural gas transportation and storage contracts that it utilizes in conjunction with its market expertise to provide service and value to its customers. Availability of these transportation and storage contracts allows ES to generate market opportunities by capturing price differentials over specific time horizons and between geographic market locations.
ES also provides management of transportation and storage assets for natural gas producers and regulated utilities. These management transactions typically involve the release of producer/utility-owned storage and/or transportation capacity in combination with an obligation to either purchase and/or deliver physical natural gas. In addition to the contractual purchase and/or sale of physical natural gas, ES generates or pays fee-based margin in exchange for its active management and may provide the producer and/or utility with additional margin based on actual results.
In conjunction with the active management of these contracts, ES generates Financial Margin by identifying market opportunities and simultaneously entering into natural gas purchase/sale, storage or transportation contracts and financial derivative contracts. In cases where storage is utilized to fulfill these contracts, these forecast sales and/or purchases are economically hedged through the use of financial derivative contracts. The financial derivative contracts consist primarily of exchange-traded futures, options and swap contracts, and are frequently used to lock in anticipated transactional cash flows and to help manage volatility in natural gas market prices. Generally, when its transportation and storage contracts are exposed to periods of increased market volatility, ES is able to implement strategies that allow it to capture margin by improving the respective time or geographic spreads on a forward basis.
ES accounts for its physical commodity contracts and its financial derivative instruments at fair value on the Unaudited Condensed Consolidated Balance Sheets. Changes in the fair value of physical commodity contracts and financial derivative instruments are included in earnings as a component of operating revenues or natural gas purchases on the Unaudited Condensed Consolidated Statements of Operations. Volatility in reported net income at ES can occur over periods of time due to changes in the fair value of derivatives, as well as timing differences related to certain transactions. Unrealized gains and losses can fluctuate as a result of changes in the price of natural gas, SRECs and foreign currency from the original transaction price. Volatility in earnings can also occur as a result of timing differences between the settlement of financial derivatives and the sale of the underlying physical commodity. For example, when a financial instrument settles and the physical natural gas is injected into inventory, the realized gains and losses associated with the financial instrument are recognized in earnings. However, the gains and losses associated with the physical natural gas are not recognized in earnings until the natural gas inventory is withdrawn from storage and sold, at which time ES realizes the entire margin on the transaction.
During December 2020, ES entered into a series of AMAs with an investment grade public utility to release pipeline capacity associated with certain natural gas transportation contracts. The utility provides certain asset management services and ES may deliver natural gas to the utility in exchange for aggregate net proceeds of approximately $500M, payable through November 1, 2030. The AMAs include a series of initial and permanent releases, which commenced on November 1, 2021. NJR will receive a total of approximately $260M in cash from fiscal 2022 through fiscal 2024 and $34M per year from fiscal 2025 through fiscal 2031 under the agreements. ES recognized operating revenue of approximately $9.5M and $9.5M during the three months ended March 31, 2024 and 2023, respectively, and $19.0M and $29.5M during the six months ended March 31, 2024 and 2023, respectively, on the Unaudited Condensed Consolidated Statements of Operations. Amounts received in excess of revenue totaling $107.2M and $58.7M as of March 31, 2024 and September 30, 2023, respectively, are included in deferred revenue on the Unaudited Condensed Consolidated Balance Sheets.
51
New Jersey Resources Corporation
Part I
ITEM 2. MANAGEMENT’S DISCUSSION AND ANALYSIS OF FINANCIAL CONDITION AND RESULTS OF
OPERATIONS (Continued)
Operating Results
ES’ financial results are summarized as follows:
Three Months Ended
Six Months Ended
March 31,
March 31,
(Thousands)
2024
2023
2024
2023
Operating revenues (1)
$
144,862
$
196,730
$
244,530
$
518,512
Operating expenses
Natural gas purchases (including demand charges (2)(3))
105,634
161,114
165,800
394,401
Operation and maintenance
13,639
8,322
18,747
9,445
Depreciation and amortization
56
62
113
119
Total operating expenses
119,329
169,498
184,660
403,965
Operating income
25,533
27,232
59,870
114,547
Other income, net
297
479
530
847
Interest expense, net
3,513
2,749
6,639
5,807
Income tax provision
5,289
5,916
12,800
25,980
Net income
$
17,028
$
19,046
$
40,961
$
83,607
(1)Includes related party transactions of approximately $(3.7)M and $0.2M during the three months ended March 31, 2024 and 2023, respectively, and approximately $(4.9)M and $8.6M during the six months ended March 31, 2024 and 2023, respectively, which are eliminated in consolidation.
(2)Costs associated with pipeline and storage capacity are expensed over the term of the related contracts, which generally varies from less than one year to 10 years.
(3)Includes related party transactions of approximately $0.3M and $0.2M during the three months ended March 31, 2024 and 2023, respectively, and approximately $0.6M and $0.5M during the six months ended March 31, 2024 and 2023, respectively, a portion of which is eliminated in consolidation.
ES' portfolio of financial derivative instruments are composed of:
Six Months Ended
March 31,
(in Bcf)
2024
2023
Net short futures and swaps contracts
3.8
5.6
During the six months ended March 31, 2024 and 2023, the net short position resulted in an unrealized gain of approximately $6.8M and $8.9M, respectively.
Operating revenues decreased approximately $51.9M and $274.0M and natural gas purchases decreased approximately $55.5M and $228.6M during the three and six months ended March 31, 2024, compared with the three and six months ended March 31, 2023, respectively, due primarily to a decrease in natural gas prices of 35% and 47%, respectively. The decrease for the six months is also related to the prior year volatility resulting from Winter Storm Elliott, which occurred during December 2022.
Future results at ES are contingent upon natural gas market price volatility driven by variations in both the supply and demand balances caused by weather and other factors. As a result, variations in weather patterns in the key market areas served may affect earnings during the fiscal year. Changes in market fundamentals, such as an increase in supply and decrease in demand due to warmer temperatures, and reduced volatility can negatively impact ES' earnings. See Item 2. Management's Discussion and Analysisof Financial Condition and Results of Operations - Natural Gas Distribution forTETCO M-3 Daily Prices, which illustrates the daily natural gas prices in the Northeast market region.
52
New Jersey Resources Corporation
Part I
ITEM 2. MANAGEMENT’S DISCUSSION AND ANALYSIS OF FINANCIAL CONDITION AND RESULTS OF
OPERATIONS (Continued)
Net income decreased approximately $2.0M during the three months ended March 31, 2024, compared with the three months ended March 31, 2023, due primarily to the following factors:
•$51.9M decrease in operating revenues, as previously discussed;
•$5.3M increase in O&M due to higher employee related expenses and a reduction in the reserve for bad debt in the prior year; partially offset by
•$55.5M decrease in natural gas purchases, as previously discussed.
Net income decreased approximately $42.6M during the six months ended March 31, 2024, compared with the six months ended March 31, 2023, due primarily to the following factors:
•$274.0M decrease in operating revenues, as previously discussed;
•$9.3M increase in O&M due to higher employee related expenses and a reduction in the reserve for bad debt in the prior year; partially offset by
•$228.6M decrease in natural gas purchases, as previously discussed; and
•$13.2M decrease in income tax expense related to lower taxable earnings.
Non-GAAP Financial Measures
Management uses Financial Margin and NFE, non-GAAP financial measures, when evaluating the operating results of ES. Financial Margin and NFE are based on removing timing differences associated with certain derivative instruments. GAAP also requires us, during the interim periods, to estimate our annual effective tax rate and use this rate to calculate the year-to-date tax provision. We also determine an annual estimated effective tax rate for NFE purposes and calculate a quarterly tax adjustment based on the differences between our forecasted net income and our forecasted NFE for the fiscal year. This adjustment is applied to ES, as the adjustment primarily relates to timing differences associated with certain derivative instruments which impacts the estimate of the annual effective tax rate for NFE. No adjustment is needed during the fourth quarter, since the actual effective tax rate is calculated at year end.
Management views these measures as representative of the overall expected economic result and uses these measures to compare ES' results against established benchmarks and earnings targets as these measures eliminate the impact of volatility on GAAP earnings as a result of timing differences associated with the settlement of derivative instruments. To the extent that there are unanticipated impacts from changes in the market value related to the effectiveness of economic hedges, ES' actual non-GAAP results can differ from the results anticipated at the outset of the transaction. Non-GAAP financial measures are not in accordance with, or an alternative to, GAAP and should be considered in addition to, and not as a substitute for, the comparable GAAP measure.
When ES reconciles the most directly comparable GAAP measure to both Financial Margin and NFE, the current period unrealized gains and losses on derivatives are excluded as a reconciling item. Financial Margin and NFE also exclude the effects of economic hedging of the value of our natural gas in storage and, therefore, only include realized gains and losses related to natural gas withdrawn from storage, effectively matching the full earnings effects of the derivatives with realized margins on the related physical natural gas flows. Financial Margin differs from gross margin as defined on a GAAP basis as it excludes certain operations and maintenance expense and depreciation and amortization as well as the effects of derivatives as discussed above.
53
New Jersey Resources Corporation
Part I
ITEM 2. MANAGEMENT’S DISCUSSION AND ANALYSIS OF FINANCIAL CONDITION AND RESULTS OF
OPERATIONS (Continued)
Financial Margin
A reconciliation of gross margin, the closest GAAP financial measure, to ES' Financial Margin is as follows:
Three Months Ended
Six Months Ended
March 31,
March 31,
(Thousands)
2024
2023
2024
2023
Operating revenues (1)
$
144,862
$
196,730
$
244,530
$
518,512
Less:
Natural gas purchases
105,634
161,114
165,800
394,401
Operation and maintenance (2)
13,102
7,668
17,791
11,123
Depreciation and amortization
56
62
113
119
Gross margin
26,070
27,886
60,826
112,869
Add:
Operation and maintenance (2)
13,102
7,668
17,791
11,123
Depreciation and amortization
56
62
113
119
Unrealized loss (gain) on derivative instruments and related transactions
29,198
13,795
24,932
(26,091)
Effects of economic hedging related to natural gas inventory (3)
(2,845)
(11,203)
(19,073)
12,769
Financial Margin
$
65,581
$
38,208
$
84,589
$
110,789
(1)Includes unrealized losses (gains) related to an intercompany transaction between NJNG and ES that have been eliminated in consolidation of approximately $(3.7)M and $0.2M during the three months ended March 31, 2024 and 2023, respectively, and approximately $(4.9)M and $8.6M during the six months ended March 31, 2024 and 2023, respectively.
(2)Excludes SG&A of approximately $0.5M and $0.7M during the three months ended March 31, 2024 and 2023, respectively, and approximately $1.0M and $(1.7)M during the six months ended March 31, 2024 and 2023, respectively.
(3)Effects of hedging natural gas inventory transactions where the economic impact is realized in a future period.
Financial Margin increased approximately $27.4M during the three months ended March 31, 2024, compared with the three months ended March 31, 2023, respectively, due primarily to higher natural gas price volatility during periods of cold weather in January 2024. Financial Margin decreased approximately $26.2M during the six months ended March 31, 2024, compared with the six months ended March 31, 2023, respectively, due primarily to higher natural gas price volatility in December 2022 due to Winter Storm Elliott, as previously discussed.
Net Financial Earnings
A reconciliation of ES's net income, the most directly comparable GAAP financial measure, to NFE is as follows:
Three Months Ended
Six Months Ended
March 31,
March 31,
(Thousands)
2024
2023
2024
2023
Net income
$
17,028
$
19,046
$
40,961
$
83,607
Add:
Unrealized loss (gain) on derivative instruments and related transactions
29,198
13,795
24,932
(26,091)
Tax effect (1)
(6,938)
(3,278)
(5,925)
6,201
Effects of economic hedging related to natural gas inventory
(2,845)
(11,203)
(19,073)
12,769
Tax effect
676
2,662
4,533
(3,035)
Net income to NFE tax adjustment
525
103
47
207
Net financial earnings
$
37,644
$
21,125
$
45,475
$
73,658
(1)Includes taxes related to an intercompany transaction between NJNG and ES that have been eliminated in consolidation of approximately $0.9M during the three months ended March 31, 2024, and approximately $1.2M and $(2.0)M during the six months ended March 31, 2024 and 2023, respectively. Taxes that have been eliminated in consolidation were immaterial for the three months ended March 31, 2023.
NFE increased approximately $16.5M during the three months ended March 31, 2024, compared with the three months ended March 31, 2023, respectively, due primarily to an increase in Financial Margin, as previously discussed. NFE decreased approximately $28.2M during the six months ended March 31, 2024, compared with the six months ended March 31, 2023, respectively, due primarily to a decrease in Financial Margin, as previously discussed.
54
New Jersey Resources Corporation
Part I
ITEM 2. MANAGEMENT’S DISCUSSION AND ANALYSIS OF FINANCIAL CONDITION AND RESULTS OF
OPERATIONS (Continued)
Future results are subject to the ability of ES to expand its wholesale sales and service activities and are contingent upon many other factors, including an adequate number of appropriate and credit qualified counterparties in an active and liquid natural marketplace, volatility in the natural gas market due to weather or other fundamental market factors impacting supply and/or demand, transportation, storage and/or other market arbitrage opportunities, sufficient liquidity in the overall energy trading market, and continued access to liquidity in the capital markets.
Storage and Transportation
Overview
S&T invests in natural gas assets, such as natural gas transportation and storage facilities. We believe that acquiring, owning and developing these storage and transportation assets, which operate under a tariff structure that has either cost- or market-based rates, can provide us a growth opportunity. S&T is subject to various risks, including the construction, development and operation of our transportation and storage assets, obtaining necessary governmental, environmental and regulatory approvals, our ability to obtain necessary property rights and our ability to obtain financing at reasonable costs for the construction, operation and maintenance of our assets.
S&T is comprised of Leaf River, a 32.2M Dth salt dome natural gas storage facility that operates under market-based rates and Adelphia, an existing 84-mile pipeline in southeastern Pennsylvania that operates under cost of service rates but can enter into negotiated rates with counterparties. S&T also has a 50% ownership interest in Steckman Ridge, a storage facility that operates under market-based rates.
Operating Results
The financial results of S&T are summarized as follows:
Three Months Ended
Six Months Ended
March 31,
March 31,
(Thousands)
2024
2023
2024
2023
Operating revenues (1)
$
23,042
$
20,887
$
46,904
$
47,725
Operating expenses
Natural gas purchases
351
377
627
1,182
Operation and maintenance
10,563
7,790
20,663
15,264
Depreciation and amortization
6,218
6,020
12,380
11,962
Total operating expenses
17,132
14,187
33,670
28,408
Operating income
5,910
6,700
13,234
19,317
Other income, net
2,473
1,647
4,761
3,014
Interest expense, net
5,868
6,128
11,801
12,835
Income tax provision
619
596
1,651
2,539
Equity in earnings of affiliates
85
977
1,078
1,886
Net income
$
1,981
$
2,600
$
5,621
$
8,843
(1)Includes related party transactions of approximately $0.7M and $1.6M during the three months ended March 31, 2024 and 2023, respectively, and approximately $1.3M and $2.7M during the six months ended March 31, 2024 and 2023, respectively, which are eliminated in consolidation.
Net income remained relatively consistent during the three months ended March 31, 2024, compared with the three months ended March 31, 2023, and decreased approximately $3.2M during the six months ended March 31, 2024, compared with the six months ended March 31, 2023, respectively, due primarily to the following factors:
•$5.4M increase in O&M due to increased compensation costs and contractor expenses; partially offset by
•$1.7M increase in other income, net due to increased interest income from the outstanding loan with Steckman Ridge, as a result of higher interest rates.
55
New Jersey Resources Corporation
Part I
ITEM 2. MANAGEMENT’S DISCUSSION AND ANALYSIS OF FINANCIAL CONDITION AND RESULTS OF
OPERATIONS (Continued)
Non-GAAP Financial Measures
Management uses NFE, a non-GAAP financial measure, when evaluating the operating results of S&T. Certain transactions associated with equity method investments and their impact, including impairment charges, which are non-cash charges, and the return of capital in excess of the carrying value of our investment, are excluded for NFE purposes. The details of such adjustments can be found in the table below. Non-GAAP financial measures are not in accordance with, or an alternative to GAAP, and should be considered in addition to, and not as a substitute for the comparable GAAP measure.
A reconciliation of S&T's net income, the most directly comparable GAAP financial measure to NFE, is as follows:
Three Months Ended
Six Months Ended
March 31,
March 31,
(Thousands)
2024
2023
2024
2023
Net income
$
1,981
$
2,600
$
5,621
$
8,843
Add:
Gain on equity method investment
—
(200)
—
(200)
Tax effect
—
50
—
50
Net financial earnings
$
1,981
$
2,450
$
5,621
$
8,693
NFE remained relatively consistent during the three months ended March 31, 2024, compared with the three months ended March 31, 2023, and decreased approximately $3.1M during the six months ended March 31, 2024, compared with the six months ended March 31, 2023, respectively, due primarily to a decrease in net income, as previously discussed.
Home Services and Other
Overview
The financial results of HSO consist primarily of the operating results of NJRHS. NJRHS provides service, sales and installation of appliances to service contract customers and has been focused on growing its installation business and expanding its service contract customer base. HSO also includes organizational expenses incurred at NJR and home warranty contract income at NJR Retail.
Operating Results
The condensed financial results of HSO are summarized as follows:
Three Months Ended
Six Months Ended
March 31,
March 31,
(Thousands)
2024
2023
2024
2023
Operating revenues
$
14,905
$
13,448
$
29,739
$
27,714
Income before income taxes
$
904
$
1,301
$
252
$
1,489
Income tax provision
520
488
468
705
Net income (loss)
$
384
$
813
$
(216)
$
784
Net income (loss) remained relatively consistent during the three and six months ended March 31, 2024, compared with the three and six months ended March 31, 2023.
56
New Jersey Resources Corporation
Part I
ITEM 2. MANAGEMENT’S DISCUSSION AND ANALYSIS OF FINANCIAL CONDITION AND RESULTS OF
OPERATIONS (Continued)
Liquidity and Capital Resources
Our objective is to maintain an efficient consolidated capital structure that reflects the different characteristics of each reporting segment and business operations and provides adequate financial flexibility for accessing capital markets as required. Our consolidated capital structure was as follows:
March 31, 2024
September 30, 2023
Common stock equity
41
%
39
%
Long-term debt
52
54
Short-term debt
7
7
Total
100
%
100
%
Common Stock Equity
We satisfy our external common equity requirements, if any, through issuances of our common stock, including the proceeds from stock issuances under our DRP. The DRP allows us, at our option, to use treasury shares or newly issued shares to raise capital. NJR raised approximately $3.7M and $3.8M of equity through the DRP during the three months ended March 31, 2024 and 2023, respectively, and $7.5M and $7.6M during the six months ended March 31, 2024 and 2023, respectively. During the three months ended March 31, 2024, we raised approximately $17.9M of equity by issuing approximately 435,000 shares through the waiver discount feature of the DRP. During the six months ended March 31, 2024 and 2023, we raised approximately $35.8M and $17.9M of equity by issuing approximately 845,000 and 368,000 shares through the waiver discount feature of the DRP, respectively. There were no shares issued through the waiver discount feature during the three months ended March 31, 2023.
In 1996, the Board of Directors authorized us to implement a share repurchase program, which was expanded seven times since the inception of the program, authorizing a total of 19.5M shares of common stock for repurchase. Since inception, we repurchased a total of approximately 17.8M of those shares and may repurchase an additional 1.7M shares under the approved program. There were no shares repurchased during the three and six months ended March 31, 2024 and 2023.
Debt
NJR and its unregulated subsidiaries generally rely on cash flows generated from operating activities and the utilization of committed credit facilities to provide liquidity to meet working capital and short-term debt financing requirements. NJNG also relies on the issuance of commercial paper for short-term funding. NJR and NJNG, as borrowers, respectively, periodically access the capital markets to fund long-life assets through the issuance of long-term debt securities.
We believe that our existing borrowing availability, equity proceeds and cash flows from operations will be sufficient to satisfy our working capital, capital expenditures and dividend requirements for at least the next 12 months. NJR, NJNG, CEV, S&T and ES currently anticipate that each of their financing requirements for the next 12 months will be met primarily through the issuance of short and long-term debt and meter or solar asset sale leasebacks.
We believe that as of March 31, 2024, NJR and NJNG were, and currently are, in compliance with all existing debt covenants, both financial and non-financial.
Short-Term Debt
We use our short-term borrowings primarily to finance ES' short-term liquidity needs, S&T investments, share repurchases and, on an initial basis, CEV's investments. ES' use of high-volume storage facilities and anticipated pipeline park-and-loan arrangements, combined with related economic hedging activities in the volatile wholesale natural gas market, create significant short-term cash requirements.
As of March 31, 2024, NJR had a revolving credit facility totaling $650M, with $494.5M available under the facility.
57
New Jersey Resources Corporation
Part I
ITEM 2. MANAGEMENT’S DISCUSSION AND ANALYSIS OF FINANCIAL CONDITION AND RESULTS OF
OPERATIONS (Continued)
NJNG satisfies its debt needs by issuing short-term and long-term debt based on its financial profile. The seasonal nature of NJNG's operations creates large short-term cash requirements, primarily to finance natural gas purchases and customer accounts receivable. NJNG obtains working capital for these requirements, and for the temporary financing of construction and MGP remediation expenditures and energy tax payments, based on its financial profile, through the issuance of commercial paper supported by the NJNG Credit Facility or through short-term bank loans under the NJNG Credit Facility.
NJNG’s commercial paper is sold through several commercial banks under an issuing and paying agency agreement and is supported by the $250M NJNG Credit Facility. As of March 31, 2024, there was $199.3M available under the NJNG Credit Facility, including amounts allocated to the backstop under the commercial paper program and the issuance of letters of credit.
Short-term borrowings were as follows:
Three Months Ended
Six Months Ended
(Thousands)
March 31, 2024
NJR
Notes Payable to banks:
Balance at end of period
$
146,150
$
146,150
Weighted average interest rate at end of period
6.52
%
6.52
%
Average balance for the period
$
193,668
$
202,848
Weighted average interest rate for average balance
6.55
%
6.55
%
Month end maximum for the period
$
210,500
$
230,000
NJNG
Commercial Paper and Notes Payable to banks:
Balance at end of period
$
50,000
$
50,000
Weighted average interest rate at end of period
5.48
%
5.48
%
Average balance for the period
$
53,412
$
62,517
Weighted average interest rate for average balance
5.48
%
5.48
%
Month end maximum for the period
$
87,400
$
106,700
Due to the seasonal nature of natural gas prices and demand, and because inventory levels are built up during its natural gas injection season (April through October), NJR and NJNG's short-term borrowings tend to peak in the November through January time frame.
NJR
In August 2022, NJR entered into a First Amendment to NJR's Second Amended and Restated Credit Agreement governing a $650M NJR Credit Facility with a maturity date of September 2, 2027. The NJR Credit Facility is subject to a one-year extension beyond that date and includes an accordion feature, which allows NJR, in the absence of a default or event of default, to increase from time to time, with the existing or new lenders, the revolving credit commitments under the NJR Credit Facility in increments of $50M with the total revolving credit commitments not exceeding $750M. The NJR Credit Facility also permits the borrowing of revolving loans and swingline loans, as well as a $75M sublimit for the issuance of letters of credit. Certain of NJR’s unregulated subsidiaries have guaranteed all of NJR’s obligations under the NJR Credit Facility. The credit facility is used primarily to finance its share repurchases, to satisfy ES’ short-term liquidity needs and to finance, on an initial basis, unregulated investments.
As of March 31, 2024, NJR had eight letters of credit outstanding totaling $9.3M, which reduced the amount available under the NJR Credit Facility by the same amount. NJR does not anticipate that these letters of credit will be drawn upon by the counterparties.
Based on its average borrowings during fiscal 2024, NJR’s average interest rate was 6.55%, resulting in interest expense of approximately $6.7M. Based on average borrowings of $202.8M during the period, a 100 basis point change in the underlying average interest rate would have caused a change in interest expense of approximately $1.0M during fiscal 2024.
Neither NJNG nor its assets are obligated or pledged to support the NJR Credit Facility.
58
New Jersey Resources Corporation
Part I
ITEM 2. MANAGEMENT’S DISCUSSION AND ANALYSIS OF FINANCIAL CONDITION AND RESULTS OF
OPERATIONS (Continued)
NJNG
In August 2022, NJNG amended the Second Amended and Restated Credit Agreement governing a $250M NJNG Credit Facility with a maturity date of September 2, 2027. The NJNG Credit Facility is subject to a one-year extension beyond that date and includes an accordion feature, which would allow NJNG, in the absence of a default or event of default, to increase from time to time, with the existing or new lenders, the revolving credit commitments under the NJNG Credit Facility in minimum increments of $50M up to a maximum of $100M. The NJNG Credit Facility also permits the borrowing of revolving loans and swingline loans, as well as a $30M sublimit for the issuance of letters of credit.
As of March 31, 2024, NJNG had two letters of credit outstanding for $0.7M, which reduced the amount available under the NJNG Credit Facility by the same amount. NJNG does not anticipate that these letters of credit will be drawn upon by the counterparties.
Based on its average borrowings during fiscal 2024, NJNG’s average interest rate was 5.48%, resulting in interest expense of $1.7M. Based on average borrowings of $62.5M during the period, a 100 basis point change in the underlying average interest rate would have caused a change in interest expense of approximately $0.3M during fiscal 2024.
Short-Term Debt Covenants
Borrowings under the NJR Credit Facility, term loan credit agreement and the NJNG Credit Facility are conditioned upon compliance with a maximum leverage ratio (consolidated total indebtedness to consolidated total capitalization as defined in the applicable agreements), of not more than .70 to 1.00 for NJR and .65 to 1.00 for NJNG. These revolving credit facilities and term loan credit agreement contain customary representations and warranties for transactions of this type. They also contain customary events of default and certain covenants that will limit NJR's or NJNG's ability, beyond agreed upon thresholds, to, among other things:
•incur additional debt;
•incur liens and encumbrances;
•make dispositions of assets;
•enter into transactions with affiliates; and
•merge, consolidate, transfer, sell or lease all or substantially all of the borrower's or guarantors' assets.
These covenants are subject to a number of exceptions and qualifications set forth in the applicable agreements.
Default Provisions
The agreements governing our long-term and short-term debt obligations include provisions that, if not complied with, could require early payment or similar actions. Default events include, but are not limited to, the following:
•defaults for non-payment;
•defaults for breach of representations and warranties;
•defaults for insolvency;
•defaults for non-performance of covenants;
•cross-defaults to other debt obligations of the borrower; and
•guarantor defaults.
The occurrence of an event of default under these agreements could result in all loans and other obligations of the borrower becoming immediately due and payable and the termination of the credit facilities or term loan.
59
New Jersey Resources Corporation
Part I
ITEM 2. MANAGEMENT’S DISCUSSION AND ANALYSIS OF FINANCIAL CONDITION AND RESULTS OF
OPERATIONS (Continued)
Long-Term Debt
NJR
As of March 31, 2024, NJR had the following outstanding:
•$100M of 3.48% senior notes due November 7, 2024;
•$100M of 3.54% senior notes due August 18, 2026;
•$110M of 4.38% senior notes due June 23, 2027;
•$100M of 3.96% senior notes due June 8, 2028;
•$150M of 3.29% senior notes due July 17, 2029;
•$130M of 3.60% senior notes due July 23, 2032;
•$130M of 3.50% senior notes due July 23, 2030;
•$120M of 3.13% senior notes due September 1, 2031;
•$80M of 3.25% senior notes due September 1, 2033;
•$50M of 3.64% senior notes due September 19, 2034; and
•$50M of 6.14% senior notes due December 15, 2032.
Neither NJNG nor its assets are obligated or pledged to support NJR's long-term debt.
NJNG
As of March 31, 2024, NJNG's long-term debt consisted of approximately $1.4B in fixed-rate debt issuances secured by the Mortgage Indenture, with maturities ranging from 2025 to 2061, and approximately $26.1M in sale leasebacks of natural gas meters with various maturities ranging from 2025 to 2030.
On September 28, 2023, NJNG entered into a Note Purchase Agreement for $100M aggregate principal amount of its senior notes consisting of $50M of 5.56% senior notes due September 28, 2033, which closed on September 28, 2023, and $50M of 5.85% senior notes due October 30, 2053, which closed on October 30, 2023.
Senior notes are secured by an equal principal amount of NJNG’s FMBs issued under NJNG’s Mortgage Indenture.
NJR is not obligated directly or contingently with respect to the NJNG’s fixed-rate debt issuances.
Long-Term Debt Covenants and Default Provisions
The NJR and NJNG long-term debt instruments contain customary representations and warranties for transactions of their type. They also contain customary events of default and certain covenants that will limit NJR or NJNG's ability beyond agreed upon thresholds to, among other things:
•incur additional debt (including a covenant that limits the amount of consolidated total debt of the borrower at the end of a fiscal quarter to 70% for NJR and 65% for NJNG of the consolidated total capitalization of the borrower, as those terms are defined in the applicable agreements, and a covenant limiting priority debt to 20% of the borrower's consolidated total capitalization, as those terms are defined in the applicable agreements);
•incur liens and encumbrances;
•make loans and investments;
•make dispositions of assets;
•make dividends or restricted payments;
•enter into transactions with affiliates; and
•merge, consolidate, transfer, sell or lease substantially all of the borrower's assets.
The aforementioned covenants are subject to a number of exceptions and qualifications set forth in the applicable note purchase agreements.
60
New Jersey Resources Corporation
Part I
ITEM 2. MANAGEMENT’S DISCUSSION AND ANALYSIS OF FINANCIAL CONDITION AND RESULTS OF
OPERATIONS (Continued)
In addition, the FMBs issued by NJNG under the Mortgage Indenture are subject to certain default provisions. Events of Default, as defined in the Mortgage Indenture, consist mainly of:
•failure for 30 days to pay interest when due;
•failure to pay principal or premium when due and payable;
•failure to make sinking fund payments when due;
•failure to comply with any other covenants of the Mortgage Indenture after 30 days' written notice from the Trustee;
•failure to pay or provide for judgments in excess of $30M in aggregate amount within 60 days of the entry thereof; or
•certain events that are or could be the basis of a bankruptcy, reorganization, insolvency or receivership proceeding.
Upon the occurrence and continuance of such an Event of Default, the Mortgage Indenture, subject to any provisions of law applicable thereto, provides that the Trustee may take possession and conduct the business of NJNG, may sell the trust estate, or proceed to foreclose the lien of the Mortgage Indenture. The interest rate on defaulted principal and interest, to the extent permitted by law, on the FMBs issued under the Mortgage Indenture is the rate stated in the applicable supplement or, if no such rate is stated, 6% per annum.
Sale Leaseback
NJNG received approximately $8.8M and $8.4M during the six months ended March 31, 2024 and 2023, respectively, in connection with the sale leaseback of its natural gas meters. NJNG utilizes sale leaseback arrangements as a financing mechanism to fund certain of its capital expenditures related to natural gas meters, whereby the physical asset is sold concurrent with an agreement to lease the asset back. These agreements include options to renew the lease or repurchase the asset at the end of the term. As NJNG retains control of the natural gas meters, these arrangements do not qualify as a sale. NJNG uses the financing method to account for the transactions. NJNG continues to evaluate this sale leaseback program based on current market conditions. Natural gas meters are excluded from the lien on NJNG property under the Mortgage Indenture.
CEV enters into transactions to sell the commercial solar assets concurrent with agreements to lease the assets back over a period of five to 15 years. The Company has concluded that these arrangements do not qualify as a sale for accounting purposes, as the Company retains control of the underlying assets, and are therefore treated as financing obligations, which are typically secured by the renewable energy facility asset and its future cash flows from RECs and energy sales. ITCs and other tax benefits associated with these solar projects are transferred to the buyer, if applicable; however, the lease payments are structured so that CEV is compensated for the transfer of the related tax incentives. CEV continues to operate the solar assets, including related expenses, and retain the revenue generated from RECs and energy sales, and has the option to renew the lease or repurchase the assets sold at the end of the lease term. During the six months ended March 31, 2024 and 2023, CEV received proceeds of approximately $24.4M and $61.8M, respectively, in connection with the sale leaseback of commercial solar projects. The proceeds received were recognized as a financing obligation on the Unaudited Condensed Consolidated Balance Sheets.
Contractual Obligations and Capital Expenditures
As of March 31, 2024, there were NJR guarantees covering approximately $137.0M of natural gas purchases and ES demand fee commitments and ten outstanding letters of credit totaling approximately $10.0M, as previously mentioned, not yet reflected in accounts payable on the Unaudited Condensed Consolidated Balance Sheets.
Estimated capital expenditures are reviewed on a regular basis and may vary based on the ongoing effects of regulatory constraints, environmental regulations, unforeseen events, and the ability to access capital.
NJNG's total capital expenditures are projected to be between $387M and $440M during fiscal 2024. Total capital expenditures spent or accrued during the six months ended March 31, 2024, were approximately $177.2M. NJNG expects to fund its obligations with a combination of cash flows from operations, cash on hand, issuance of commercial paper, available capacity under its revolving credit facility and the issuance of long-term debt. As of March 31, 2024, NJNG's future MGP expenditures are estimated to be approximately $157.8M. For a more detailed description of MGP expenditures see Note 13. Commitments and Contingent Liabilities in the accompanying Unaudited Condensed Consolidated Financial Statements.
61
New Jersey Resources Corporation
Part I
ITEM 2. MANAGEMENT’S DISCUSSION AND ANALYSIS OF FINANCIAL CONDITION AND RESULTS OF
OPERATIONS (Continued)
During the six months ended March 31, 2024, our S&T segment had capital expenditures spent or accrued for Adelphia totaling approximately $3.1M and capital expenditures spent or accrued for Leaf River totaling approximately $15.8M. During fiscal 2024, we expect expenditures related to Adelphia to be between $8M and $12M and expenditures related to Leaf River to be between $36M and $46M.
During the six months ended March 31, 2024, total capital expenditures spent or accrued related to the purchase and installation of solar equipment were approximately $34.9M. CEV's expenditures include clean energy projects that support our goal to promote renewable energy. Accordingly, CEV enters into agreements to install solar equipment involving both residential and commercial projects. We estimate solar-related capital expenditures during fiscal 2024 to be between $140M and $204M.
Capital expenditures related to clean energy projects are subject to change due to a variety of factors that may affect our ability to commence operations at these projects on a timely basis or at all, including sourcing projects that meet our investment criteria, logistics associated with the start-up of residential and commercial solar projects, such as timing of construction schedules, the permitting and regulatory process, any delays related to electric grid interconnection, economic trends or unforeseen events and the ability to access capital or allocation of capital to other investments or business opportunities.
ES does not currently anticipate any significant capital expenditures during fiscal 2024 and 2025.
During December 2020, ES entered into a series of AMAs with an investment grade public utility to release pipeline capacity associated with certain natural gas transportation contracts. The utility provides certain asset management services and ES may deliver natural gas to the utility in exchange for aggregate net proceeds of approximately $500M, payable through November 1, 2030. The AMAs include a series of initial and permanent releases, which commenced on November 1, 2021. NJR will receive approximately $260M in cash from fiscal 2022 through fiscal 2024 and $34M per year from fiscal 2025 through fiscal 2031 under the agreements. ES recognized operating revenue of approximately $19.0M and $29.5M during the three and six months ended March 31, 2024 and 2023, respectively, on the Unaudited Condensed Consolidated Statements of Operations. Amounts received in excess of revenue totaling $107.2M and $58.7M as of March 31, 2024 and September 30, 2023, respectively, are included in deferred revenue on the Unaudited Condensed Consolidated Balance Sheets.
Cash Flows
Operating Activities
Cash flows from operating activities during the six months ended March 31, 2024, totaled approximately $338.6M, compared with approximately $343.1M during the six months ended March 31, 2023. Operating cash flows are primarily affected by variations in working capital, which can be impacted by several factors, including:
•seasonality of our business;
•fluctuations in wholesale natural gas prices and other energy prices, including changes in derivative asset and liability values;
•timing of storage injections and withdrawals;
•the deferral and recovery of natural gas costs;
•changes in contractual assets utilized to optimize margins related to natural gas transactions;
•broker margin requirements;
•impact of unusual weather patterns on our wholesale business;
•timing of the collections of receivables and payments of current liabilities;
•volumes of natural gas purchased and sold; and
•timing of SREC deliveries.
Cash flows from operating activities decreased approximately $4.5M during the six months ended March 31, 2024, compared with the six months ended March 31, 2023, due primarily to a decrease in cash received to date from certain ES AMAs along with changes in the mix of working capital components.
Investing Activities
Cash flows used in investing activities totaled approximately $235.0M during the six months ended March 31, 2024, compared with approximately $261.7M during the six months ended March 31, 2023. The decrease of approximately $26.7M was due primarily to decreased solar asset expenditures and lower capital expenditures for S&T.
62
New Jersey Resources Corporation
Part I
ITEM 2. MANAGEMENT’S DISCUSSION AND ANALYSIS OF FINANCIAL CONDITION AND RESULTS OF
OPERATIONS (Continued)
Financing Activities
Financing cash flows generally are seasonal in nature and are impacted by the volatility in pricing in the natural gas and other energy markets. NJNG's inventory levels are built up during its natural gas injection season (April through October) and reduced during withdrawal season (November through March) in response to the supply requirements of its customers. Changes in financing cash flows can also be impacted by natural gas management and marketing activities at ES and clean energy investments at CEV.
Cash flows used in financing activities totaled approximately $99.4M during the six months ended March 31, 2024, compared with approximately $55.3M during the six months ended March 31, 2023. The increase of approximately $44.1M is due primarily to a decrease in long-term debt proceeds of $125.0M along with a $70.0M payment of long-term debt and a decrease in solar sale leaseback proceeds of $37.4M, partially offset by reduced net short-term debt payments of $30.4M and increased proceeds from the waiver discount program of $17.9M.
Credit Ratings
The table below summarizes NJNG's credit ratings as of March 31, 2024, issued by two rating entities, Moody's and Fitch:
Moody's
Fitch
Corporate Rating
N/A
A-
Commercial Paper
P-2
F-2
Senior Secured
A1
A+
Ratings Outlook
Stable
Stable
The Moody's ratings and outlook were reaffirmed on September 29, 2023. Fitch ratings and outlook were reaffirmed on April 15, 2024. NJNG's Moody's and Fitch ratings are investment-grade ratings. NJR is not rated by Moody’s or Fitch.
Although NJNG is not party to any lending agreements that would accelerate the maturity date of any obligation caused by a failure to maintain any specific credit rating, if such ratings are downgraded below investment grade, borrowing costs could increase, as would the costs of maintaining certain contractual relationships and future financing and our access to capital markets would be reduced. Even if ratings are downgraded without falling below investment grade, NJR and NJNG could face increased borrowing costs under their credit facilities. A rating set forth above is not a recommendation to buy, sell or hold NJR's or NJNG's securities and may be subject to revision or withdrawal at any time. Each rating set forth above should be evaluated independently of any other rating.
The timing and mix of any external financings will target a common equity ratio that is consistent with maintaining NJNG's current short-term and long-term credit ratings.
Financial Risk Management
Commodity Market Risks
Natural gas is a nationally traded commodity. Its prices are determined effectively by the NYMEX, ICE and over-the-counter markets. The prices on the NYMEX, CME, ICE and over-the-counter markets generally reflect the national balance of natural gas supply and demand, but are also significantly influenced from time to time by other events.
Our regulated and unregulated businesses are subject to market risk due to fluctuations in the price of natural gas. To economically hedge against such fluctuations, we have entered into forwards, futures, options and swap agreements. To manage these derivative instruments, we have well-defined risk management policies and procedures that include daily monitoring of volumetric limits and monetary guidelines. Our natural gas businesses are conducted through two of our operating subsidiaries. NJNG is a regulated utility that uses futures, options and swaps to provide relative price stability, and its recovery of natural gas costs is governed by the BPU. ES uses futures, options, swaps and physical contracts to economically hedge purchases and sales of natural gas.
63
New Jersey Resources Corporation
Part I
ITEM 3. QUANTITATIVE AND QUALITATIVE DISCLOSURES ABOUT MARKET RISK (Continued)
The following table reflects the changes in the fair market value of financial derivatives related to natural gas purchases and sales:
Balance
Increase
Less
Balance
(Thousands)
September 30, 2023
in Fair Market Value
Amounts Settled
March 31, 2024
NJNG
$
6,090
8,238
13,134
$
1,194
ES
16,178
29,331
38,688
6,821
Total
$
22,268
37,569
51,822
$
8,015
There were no changes in methods of valuations during the six months ended March 31, 2024.
The following is a summary of fair market value of financial derivatives as of March 31, 2024, excluding foreign exchange contracts discussed below, by method of valuation and by maturity for each fiscal year period:
(Thousands)
2024
2025
2026 - 2028
After 2028
Total Fair Value
Price based on ICE
$
5,888
2,368
(261)
20
$
8,015
The following is a summary of financial derivatives by type as of March 31, 2024:
Volume Bcf
Price per MMBtu(1)
Amounts included in Derivatives (Thousands)
NJNG
Futures
23.8
$1.64 - $3.58
$
1,194
ES
Futures
(3.8)
$0.68 - $4.22
6,821
Total
$
8,015
(1) Million British thermal units
The following table reflects the changes in the fair market value of physical commodity contracts:
Balance
Increase
Less
Balance
(Thousands)
September 30, 2023
(Decrease) in Fair Market Value
Amounts Settled
March 31, 2024
NJNG - Prices based on other external data
$
(445)
(1,585)
(2,073)
$
43
ES - Prices based on other external data
(13,616)
6,396
10,388
(17,608)
Total
$
(14,061)
4,811
8,315
$
(17,565)
Our market price risk is predominately linked with changes in the price of natural gas at the Henry Hub, the delivery point for the NYMEX natural gas futures contracts. Based on price sensitivity analysis, an illustrative 10% movement in the natural gas futures contract price, for example, increases (decreases) the reported derivative fair value of all open, unadjusted Henry Hub natural gas futures and fixed price swap positions by approximately $1.6M. This analysis does not include potential changes to reported credit adjustments embedded in the $7.3M reported fair value.
Derivative Fair Value Sensitivity Analysis
(Thousands)
Henry Hub Futures and Fixed Price Swaps
Percent increase in NYMEX natural gas futures prices
0%
5%
10%
15%
20%
Estimated change in derivative fair value
$
—
$
(809)
$
(1,617)
$
(2,425)
$
(3,233)
Ending derivative fair value
$
7,327
$
6,518
$
5,710
$
4,902
$
4,094
Percent decrease in NYMEX natural gas futures prices
0%
(5)%
(10)%
(15)%
(20)%
Estimated change in derivative fair value
$
—
$
809
$
1,617
$
2,425
$
3,233
Ending derivative fair value
$
7,327
$
8,136
$
8,944
$
9,752
$
10,560
64
New Jersey Resources Corporation
Part I
ITEM 3. QUANTITATIVE AND QUALITATIVE DISCLOSURES ABOUT MARKET RISK (Continued)
Wholesale Credit Risk
The following is a summary of gross and net credit exposures, grouped by investment and non-investment grade counterparties, as of March 31, 2024. Gross credit exposure for ES is defined as the unrealized fair value of derivative and energy trading contracts plus any outstanding wholesale receivable for the value of natural gas or power delivered and/or financial derivative commodity contract that has settled for which payment has not yet been received. Gross credit exposure for S&T is defined as demand and estimated usage fees for contracted services and/or market value of loan balances for which payment has not yet been received. Net credit exposure is defined as gross credit exposure reduced by collateral received from counterparties and/or payables, where netting agreements exist. The amounts presented below exclude accounts receivable for NJNG retail natural gas sales and services.
ES', CEV's and S&T's counterparty credit exposure as of March 31, 2024, is as follows:
(Thousands)
Gross Credit Exposure
Net Credit Exposure
Investment grade
$
98,726
$
94,533
Noninvestment grade
7,471
1,095
Internally rated investment grade
19,605
19,394
Internally rated noninvestment grade
22,333
15,380
Total
$
148,135
$
130,402
NJNG's counterparty credit exposure as of March 31, 2024, is as follows:
(Thousands)
Gross Credit Exposure
Net Credit Exposure
Investment grade
$
14,424
$
13,261
Noninvestment grade
1,663
—
Internally rated investment grade
383
—
Internally rated noninvestment grade
144
1
Total
$
16,614
$
13,262
Due to the inherent volatility in the market price for natural gas, electricity and SRECs, the market value of contractual positions with individual counterparties could exceed established credit limits or collateral provided by those counterparties. If a counterparty failed to perform the obligations under its contract (for example, failed to make payment for natural gas received), we could sustain a loss. This loss would comprise the loss on natural gas delivered but not paid for and/or the cost of replacing natural gas not delivered or received at a price that exceeds the original contract price. Any such loss could have a material impact on our financial condition, results of operations or cash flows.
Effects of Interest Rate and Foreign Currency Rate Fluctuations
We are also exposed to changes in interest rates on our debt hedges, variable rate debt and changes in foreign currency rates for our business conducted in Canada using Canadian dollars. We do not believe an immediate 10% increase or decrease in interest rates or foreign currency rates would have a material effect on our operating results or cash flows.
Information regarding NJR's interest rate risk can be found in Item 7A. Quantitative and Qualitative Disclosures About Market Risks and the Liquidity and Capital Resources - Debt section of Item 7. Management's Discussion and Analysis of Financial Condition and Results of Operations.
Effects of Inflation
Any change in price levels has an effect on operating results due to the capital-intensive and regulated nature of our utility subsidiary. The Company’s operations are sensitive to increases in the rate of inflation because of its operational and capital spending requirements in both its regulated and non-regulated businesses. We attempt to minimize the effects of inflation through cost control, productivity improvements and regulatory actions, when appropriate. See Item 1A. Risk Factors for additional information related to the impact of recent increases in inflation rates.
65
New Jersey Resources Corporation
Part I
ITEM 4. CONTROLS AND PROCEDURES
Disclosure Controls and Procedures
Under the supervision and with the participation of our management, including our principal executive officer and principal financial officer, we conducted an evaluation of the effectiveness of the design and operation of our disclosure controls and procedures (as defined in Rules 13a-15(e) and 15d-15(e) under the Exchange Act), as of the end of the period covered by this report. Based on this evaluation, our principal executive officer and principal financial officer concluded that, as of end of the period covered by this report, our disclosure controls and procedures are effective, to ensure that information required to be disclosed by us in the reports that we file or submit under the Exchange Act, is recorded, processed, summarized and reported, within the time periods specified in the SEC's rules and forms, and that such information is accumulated and communicated to our management, including our principal executive officer and principal financial officer, as appropriate, to allow timely decisions regarding required disclosure.
Changes in Internal Control over Financial Reporting
There has been no change in internal control over financial reporting (as such term is defined in Exchange Act Rule 13a-15(f)) that occurred during the quarter ended March 31, 2024, that has materially affected, or is reasonably likely to materially affect, internal control over financial reporting.
66
New Jersey Resources Corporation
Part II
ITEM 1. LEGAL PROCEEDINGS
Information regarding reportable legal proceedings is contained in Part I, Item 3. Legal Proceedings in our Annual Report on Form 10-K for the year ended September 30, 2023, and is set forth in Part I, Item 1, Note 13. Commitments and Contingent Liabilities-Legal Proceedings on the Unaudited Condensed Consolidated Financial Statements, which is incorporated by reference. No legal proceedings became reportable during the quarter ended March 31, 2024, and there have been no material developments during such quarter regarding any previously reported legal proceedings, which have not been previously disclosed.
ITEM 1A. RISK FACTORS
While we attempt to identify, manage and mitigate risks and uncertainties associated with our business to the extent practical, under the circumstances, some level of risk and uncertainty will always be present. Part I, Item 1A. Risk Factors of our 2023 Annual Report on Form 10-K includes a detailed discussion of our risk factors. Those risks and uncertainties have the potential to materially affect our financial condition and results of operations. There have been no material changes in our risk factors from those previously disclosed in Part I, Item 1A, of our 2023 Annual Report on Form 10-K.
ITEM 2. UNREGISTERED SALE OF EQUITY SECURITIES AND USE OF PROCEEDS
The following table sets forth our repurchase activity for the quarter ended March 31, 2024:
Period
Total Number of Shares (or Units) Purchased
Average Price Paid per Share (or Unit)
Total Number of Shares (or Units) Purchased as Part of Publicly Announced Plans or Programs
Maximum Number (or Approximate Dollar Value) of Shares (or Units) That May Yet Be Purchased Under the Plans or Programs
01/01/24 - 01/31/24
—
—
—
1,685,053
02/01/24 - 02/29/24
—
—
—
1,685,053
03/01/24 - 03/31/24
—
—
—
1,685,053
Total
—
—
—
1,685,053
The stock repurchase plan, which was authorized by our Board of Directors, became effective in September 1996 and as of March 31, 2024, included 19.5M shares of common stock for repurchase, of which, approximately 1.7M shares remained available for repurchase. The stock repurchase plan will expire when we have repurchased all shares authorized for repurchase thereunder, unless the repurchase plan is earlier terminated by action of our Board of Directors or further shares are authorized for repurchase.
ITEM 5. OTHER INFORMATION
Rule 10b5-1 Trading Plans
During the three months ended March 31, 2024, no director or officer (as defined by Rule 16a-1(f) of the Exchange Act) of the Company adopted or terminated a “Rule 10b5-1 trading arrangement” or “non-Rule 10b5-1 trading arrangement,” as each term is defined in Item 408(a) of Regulation S-K, except as follows:
On February 23, 2024, Stephen D. Westhoven, our President and Chief Executive Officer and a director, adopted a Rule 10b5-1 trading arrangement, which is intended to satisfy the affirmative defense of Rule 10b5-1(c). The Rule 10b5-1 trading arrangement provides for sales of up to 50,000 shares of our common stock beginning on May 23, 2024 until December 31, 2024, or once all of the shares have been sold. Actual sale transactions will be disclosed publicly in filings with the SEC in accordance with applicable securities laws, rules and regulations.
Interactive Data File (Form 10-Q, for the fiscal period ended March 31, 2024, furnished in iXBRL (Inline eXtensible Business Reporting Language))
104+
Cover Page Interactive Data File included in Exhibit 101
________________________________
+ Filed herewith.
† This certificate accompanies this report pursuant to Section 906 of the Sarbanes-Oxley Act of 2002 and shall not be deemed filed by NJR for purposes of Section 18 or any other provision of the Exchange Act.
68
New Jersey Resources Corporation
Part II
SIGNATURES
Pursuant to the requirements of the Securities Exchange Act of 1934, the registrant has duly caused this report to be signed on its behalf by the undersigned, thereunto duly authorized.