
Fiscal 2025 Fourth Quarter and Year End Financial Results November 2025 Investor Presentation
Forward-Looking Statements and Non-GAAP Measures Forward-Looking Statements This presentation
contains forward-looking statements within the meaning of Section 27A of the Securities Act of 1933, as amended, Section 21E of the Securities Exchange Act of 1934, as amended, and the Private Securities Litigation Reform Act of 1995. NJR
cautions readers that the assumptions forming the basis for forward-looking statements include many factors that are beyond NJR’s ability to control or estimate precisely, such as expectations regarding future market conditions and the behavior
of other market participants. Words such as “anticipates,” “estimates,” “expects,” “projects,” “may,” “will,” “intends,” “plans,” “believes,” “should” and similar expressions may identify forward-looking statements and such forward-looking
statements are made based upon management’s current expectations, assumptions and beliefs as of this date concerning future developments and their potential effect upon NJR. There can be no assurance that future developments will be in
accordance with management’s expectations, assumptions and beliefs or that the effect of future developments on NJR will be those anticipated by management. Forward-looking statements in this earnings presentation include, but are not limited
to, statements regarding NJR’s NFEPS guidance for fiscal 2026, including NFEPS guidance by Segment, long-term growth targets and guidance range and anticipated drivers of such growth targets, long-term annual growth projections and targets, our
CIP, IIP and SAVEGREEN programs, NFEPS expectations from utility operations, Capital Plan expectations, the inclusion of our 5-year capital expenditure projections through 2030, our credit metrics, projections of dividend and financing
activities, customer growth at NJNG, future NJR and NJNG capital expenditures, potential CEV capital projects, project pipeline, changes to tax laws and regulations, including those changes brought about by the passage of the Inflation
Reduction Act of 2022 and the One Big Beautiful Bill Act, total shareholder return projections, dividend growth, CEV revenue and service projections, our debt repayment schedule, contributions from Leaf River as well as its potential cavern
expansion, Steckman Ridge and Adelphia Gateway, SREC Hedging and long option strategies and Asset Management Agreements, our Energy Efficiency Expansion as approved by the BPU, our current and future base rate cases, our solar project pipeline
and commercial solar growth goals, emissions reduction strategies and clean energy goals, changing interest rates, and other legal and regulatory expectations, and statements that include other projections, predictions, expectations or beliefs
about future events or results or otherwise are not statements of historical fact. Additional information and factors that could cause actual results to differ materially from NJR’s expectations are contained in NJR’s filings with the SEC,
including NJR’s Annual Reports on Form 10-K and subsequent Quarterly Reports on Form 10-Q, recent Current Reports on Form 8-K, and other SEC filings, which are available at the SEC’s web site, http://www.sec.gov. Information included in this
presentation is representative as of today only and while NJR periodically reassesses material trends and uncertainties affecting NJR’s results of operations and financial condition in connection with its preparation of management’s discussion
and analysis of results of operations and financial condition contained in its Quarterly and Annual Reports filed with the SEC, NJR does not, by including this statement, assume any obligation to review or revise any particular forward-looking
statement referenced herein in light of new information future events or otherwise, except as required by law. Non-GAAP Measures This presentation includes the non-GAAP financial measures NFE/net financial loss, NFE per basic share, financial
margin, utility gross margin, adjusted funds from operations and adjusted debt. A reconciliation of these non-GAAP financial measures to the most directly comparable financial measures calculated and reported in accordance with GAAP can be
found in the appendix to this presentation. As an indicator of NJR’s operating performance, these measures should not be considered an alternative to, or more meaningful than, net income or operating revenues as determined in accordance with
GAAP. This information has been provided pursuant to the requirements of SEC Regulation G. NFE and financial margin exclude unrealized gains or losses on derivative instruments related to NJR’s unregulated subsidiaries and certain realized
gains and losses on derivative instruments related to natural gas that has been placed into storage at Energy Services, net of applicable tax adjustments as described below. Financial margin also differs from gross margin as defined on a GAAP
basis as it excludes certain operations and maintenance expense and depreciation and amortization [expenses] as well as the effects of derivatives as discussed above. Volatility associated with the change in value of these financial instruments
and physical commodity reported on the income statement in the current period. In order to manage its business, NJR views its results without the impacts of the unrealized gains and losses, and certain realized gains and losses, caused by
changes in value of these financial instruments and physical commodity contracts prior to the completion of the planned transaction because it shows changes in value currently instead of when the planned transaction ultimately is settled. An
annual estimated effective tax rate is calculated for NFE purposes and any necessary quarterly tax adjustment is applied to NJR Energy Services Company. NJNG’s utility gross margin is defined as operating revenues less natural gas purchases,
sales tax, and regulatory rider expense. This measure differs from gross margin as presented on a GAAP basis as it excludes certain operations and maintenance expense and depreciation and amortization. Utility gross margin may also not be
comparable to the definition of gross margin used by others in the natural gas distribution business and other industries. Management believes that utility gross margin provides a meaningful basis for evaluating utility operations since natural
gas costs, sales tax and regulatory rider expenses are included in operating revenues and passed through to customers and, therefore, have no effect on utility gross margin. Adjusted funds from operations is cash flows from operating
activities, plus components of working capital, cash paid for interest (net of amounts capitalized), capitalized interest, the incremental change in SAVEGREEN loans, grants, rebates, and related investments, and operating lease
expense. Adjusted debt is total long-term and short-term debt, net of cash and cash equivalents, excluding solar asset financing obligations but including solar contractually committed payments for sale lease-backs, debt issuance costs, and
other Fitch credit metric adjustments. Adjusted EBITDA is earnings, including equity in earnings of affiliates, before interest, income taxes, depreciation and amortization, and Other Income, net, which includes non-cash earnings of AFUDC from
our wholly owned subsidiaries Leaf River and Adelphia Gateway. Management uses NFE/net financial loss, utility gross margin, financial margin, adjusted funds from operations and adjusted debt as supplemental measures to other GAAP results to
provide a more complete understanding of the Company’s performance. Management believes these non-GAAP measures are more reflective of the Company’s business model, provide transparency to investors and enable period-to-period comparability of
financial performance. In providing NFE guidance, management is aware that there could be differences between reported GAAP earnings and NFE/net financial loss due to matters such as, but not limited to, the positions of our energy-related
derivatives. Management is not able to reasonably estimate the aggregate impact or significance of these items on reported earnings and therefore is not able to provide a reconciliation to the corresponding GAAP equivalent for its operating
earnings guidance without unreasonable efforts. In addition, in making forecasts relating to S&T’s Adjusted EBITDA and adjusted funds from operations and adjusted debt, management is aware that there could be differences between reported
GAAP earnings, cash flows from operations and total long-term and short-term debt due to matters such as, but not limited to, the unpredictability and variability of future earnings, working capital and cash positions. Management is not able to
reasonably estimate the aggregate impact or significance of these items on reported GAAP measures and therefore is not able to provide a reconciliation to the corresponding GAAP equivalent for such forecasts without unreasonable efforts.
NFE/net financial loss, utility gross margin and financial margin are discussed more fully in Item 7 of our Report on Form 10-K and, we have provided presentations of the most directly comparable GAAP financial measure and a reconciliation of
our non-GAAP financial measures, NFE/net financial loss, utility gross margin, financial margin, adjusted funds from operations and adjusted debt, to the most directly comparable GAAP financial measures, in the appendix to this presentation.
This information has been provided pursuant to the requirements of SEC Regulation G.
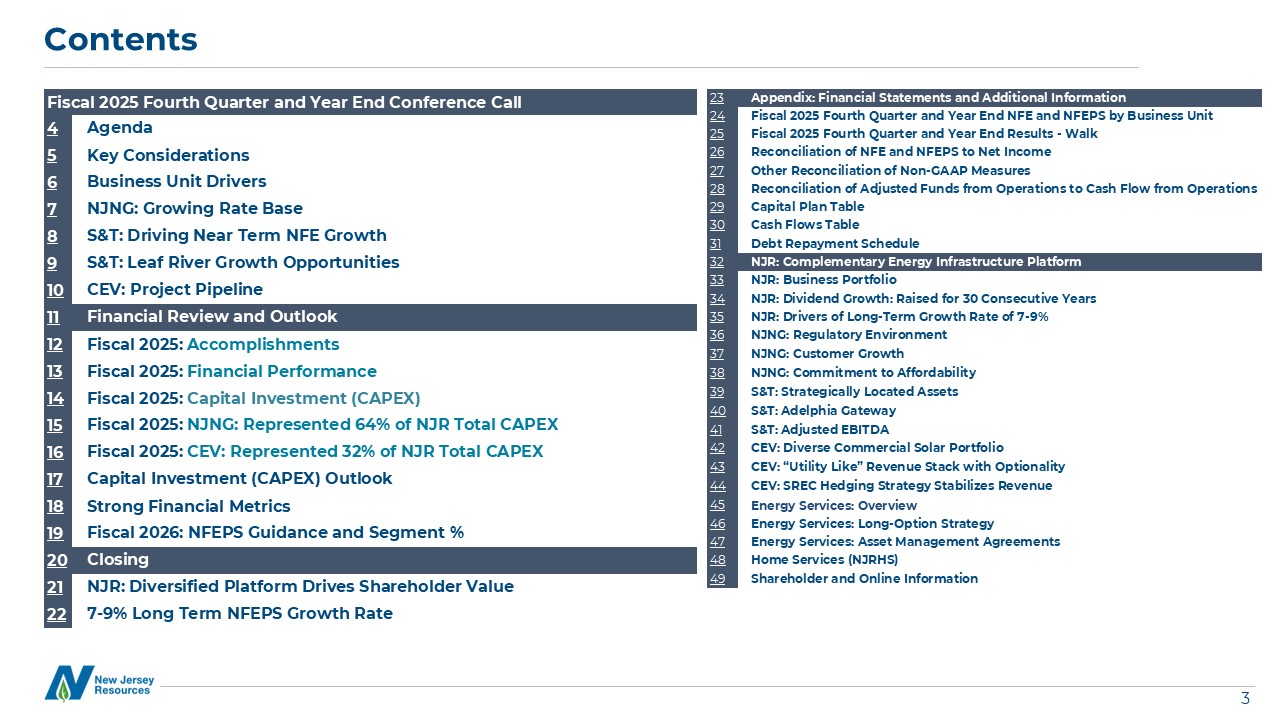
Contents Fiscal 2025 Fourth Quarter and Year End Conference Call 4 Agenda 5 Key
Considerations 6 Business Unit Drivers 7 NJNG: Growing Rate Base 8 S&T: Driving Near Term NFE Growth 9 S&T: Leaf River Growth Opportunities 10 CEV: Project Pipeline 11 Financial Review and Outlook 12 Fiscal 2025:
Accomplishments 13 Fiscal 2025: Financial Performance 14 Fiscal 2025: Capital Investment (CAPEX) 15 Fiscal 2025: NJNG: Represented 64% of NJR Total CAPEX 16 Fiscal 2025: CEV: Represented 32% of NJR Total CAPEX 17 Capital Investment
(CAPEX) Outlook 18 Strong Financial Metrics 19 Fiscal 2026: NFEPS Guidance and Segment % 20 Closing 21 NJR: Diversified Platform Drives Shareholder Value 22 7-9% Long Term NFEPS Growth Rate 23 Appendix: Financial Statements and
Additional Information 24 Fiscal 2025 Fourth Quarter and Year End NFE and NFEPS by Business Unit 25 Fiscal 2025 Fourth Quarter and Year End Results - Walk 26 Reconciliation of NFE and NFEPS to Net Income 27 Other Reconciliation of
Non-GAAP Measures 28 Reconciliation of Adjusted Funds from Operations to Cash Flow from Operations 29 Capital Plan Table 30 Cash Flows Table 31 Debt Repayment Schedule 32 NJR: Complementary Energy Infrastructure Platform 33 NJR:
Business Portfolio 34 NJR: Dividend Growth: Raised for 30 Consecutive Years 35 NJR: Drivers of Long-Term Growth Rate of 7-9% 36 NJNG: Regulatory Environment 37 NJNG: Customer Growth 38 NJNG: Commitment to Affordability 39 S&T:
Strategically Located Assets 40 S&T: Adelphia Gateway 41 S&T: Adjusted EBITDA 42 CEV: Diverse Commercial Solar Portfolio 43 CEV: “Utility Like” Revenue Stack with Optionality 44 CEV: SREC Hedging Strategy Stabilizes
Revenue 45 Energy Services: Overview 46 Energy Services: Long-Option Strategy 47 Energy Services: Asset Management Agreements 48 Home Services (NJRHS) 49 Shareholder and Online Information
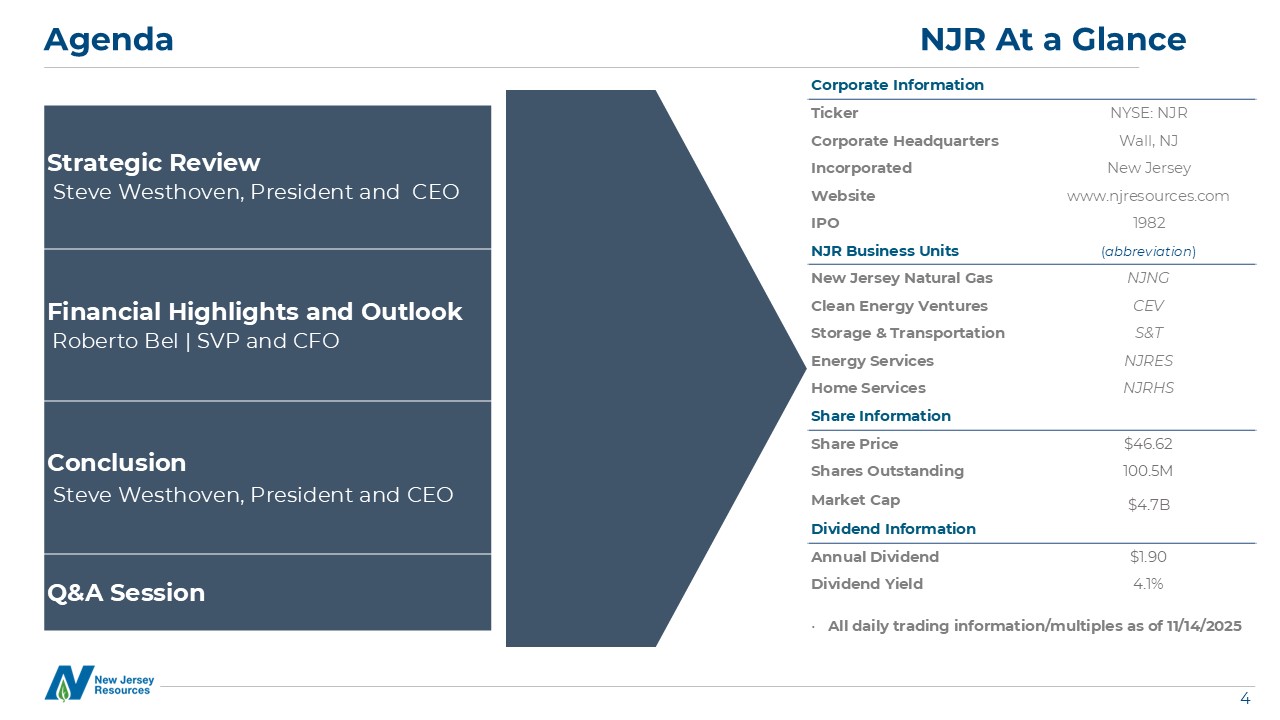
Strategic Review Steve Westhoven, President and CEO Financial Highlights and Outlook Roberto
Bel | SVP and CFO Conclusion Steve Westhoven, President and CEO Q&A Session Agenda NJR At a Glance Corporate Information Ticker NYSE: NJR Corporate Headquarters Wall, NJ Incorporated New
Jersey Website www.njresources.com IPO 1982 NJR Business Units (abbreviation) New Jersey Natural Gas NJNG Clean Energy Ventures CEV Storage & Transportation S&T Energy Services NJRES Home Services NJRHS Share
Information Share Price $46.62 Shares Outstanding 100.5M Market Cap $4.7B Dividend Information Annual Dividend $1.90 Dividend Yield 4.1% All daily trading information/multiples as of 11/14/2025
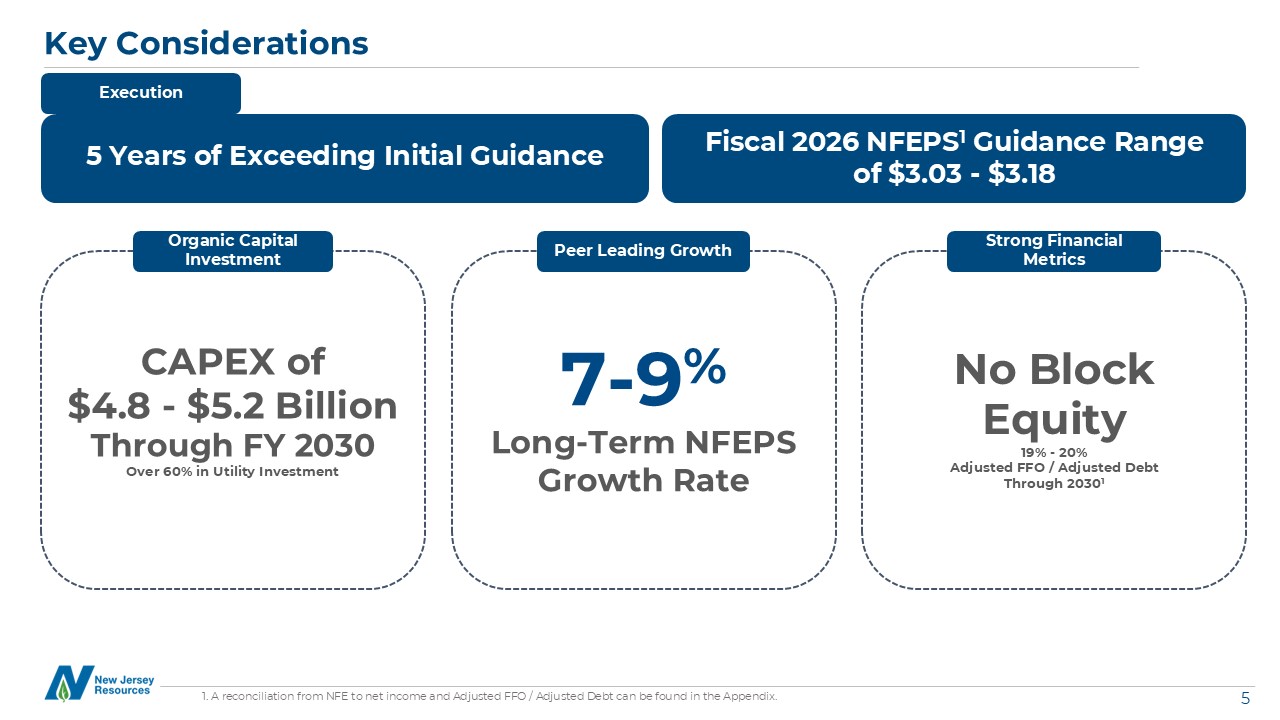
Key Considerations 1. A reconciliation from NFE to net income and Adjusted FFO / Adjusted Debt can
be found in the Appendix. 5 Years of Exceeding Initial Guidance 7-9% Long-Term NFEPS Growth Rate CAPEX of $4.8 - $5.2 Billion Through FY 2030 Over 60% in Utility Investment No Block Equity 19% - 20% Adjusted FFO / Adjusted Debt
Through 20301 Peer Leading Growth Organic Capital Investment Strong Financial Metrics Fiscal 2026 NFEPS1 Guidance Range of $3.03 - $3.18 Execution
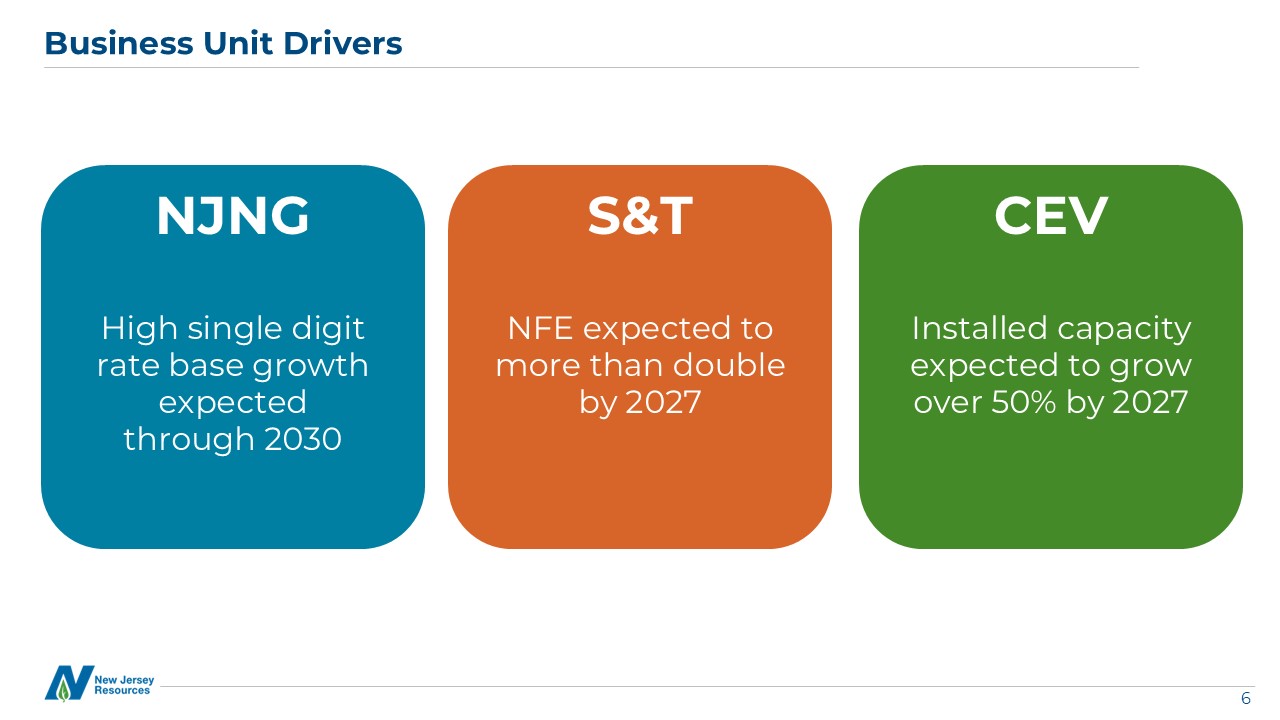
Business Unit Drivers NJNG High single digit rate base growth expected through
2030 CEV Installed capacity expected to grow over 50% by 2027 S&T NFE expected to more than double by 2027
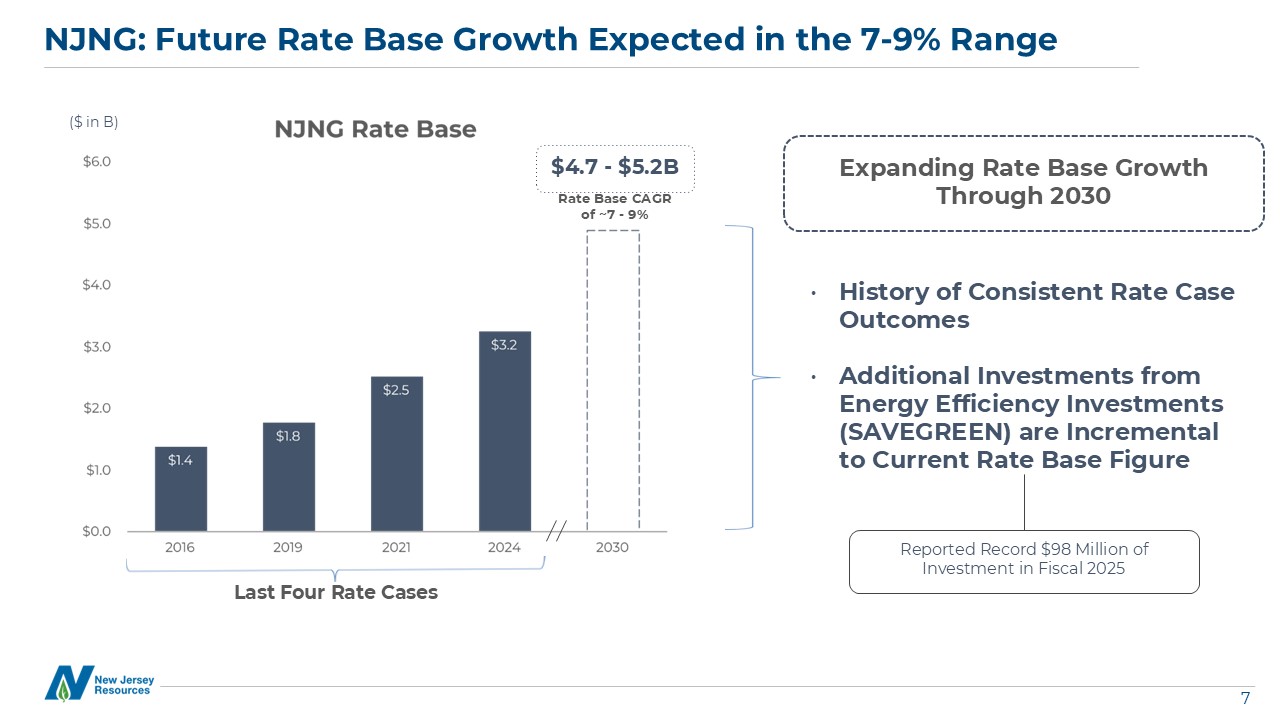
NJNG: Future Rate Base Growth Expected in the 7-9% Range Expanding Rate Base Growth Through
2030 History of Consistent Rate Case Outcomes Additional Investments from Energy Efficiency Investments (SAVEGREEN) are Incremental to Current Rate Base Figure Last Four Rate Cases $4.7 - $5.2B ($ in B) Rate Base CAGR of ~7 - 9%
Reported Record $98 Million of Investment in Fiscal 2025
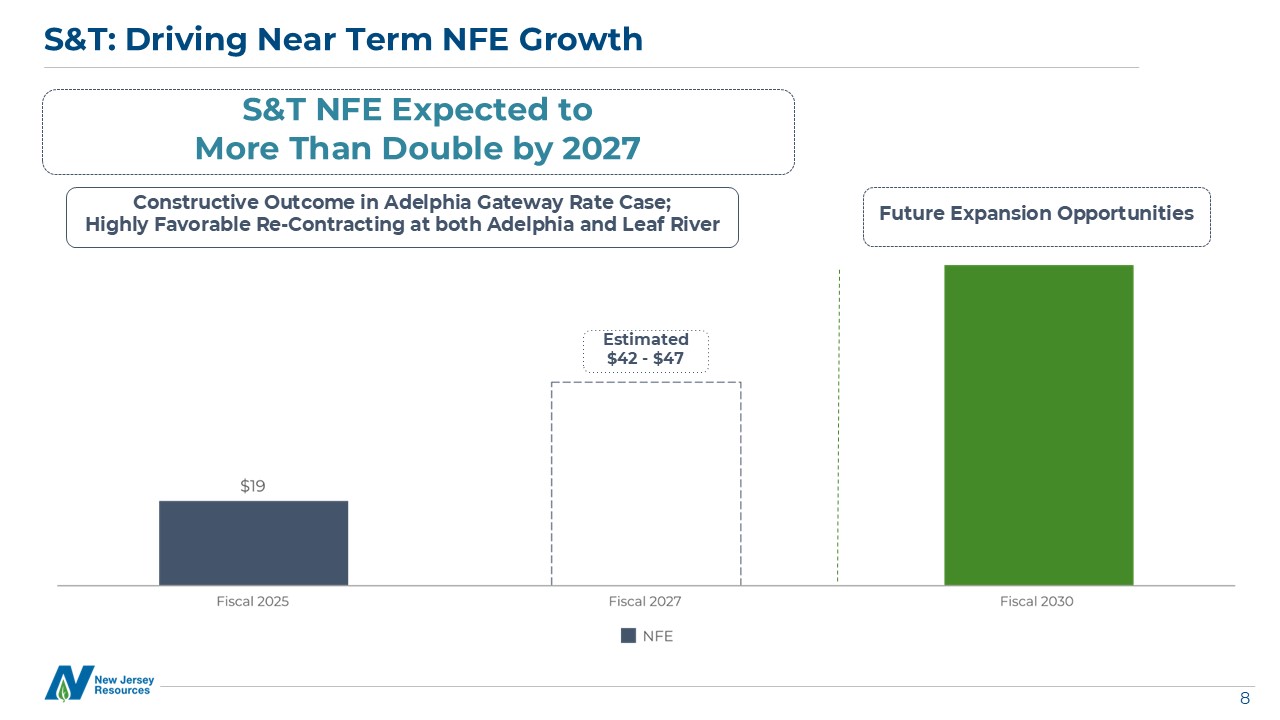
S&T: Driving Near Term NFE Growth Constructive Outcome in Adelphia Gateway Rate Case; Highly
Favorable Re-Contracting at both Adelphia and Leaf River S&T NFE Expected to More Than Double by 2027 Estimated $42 - $47 Future Expansion Opportunities
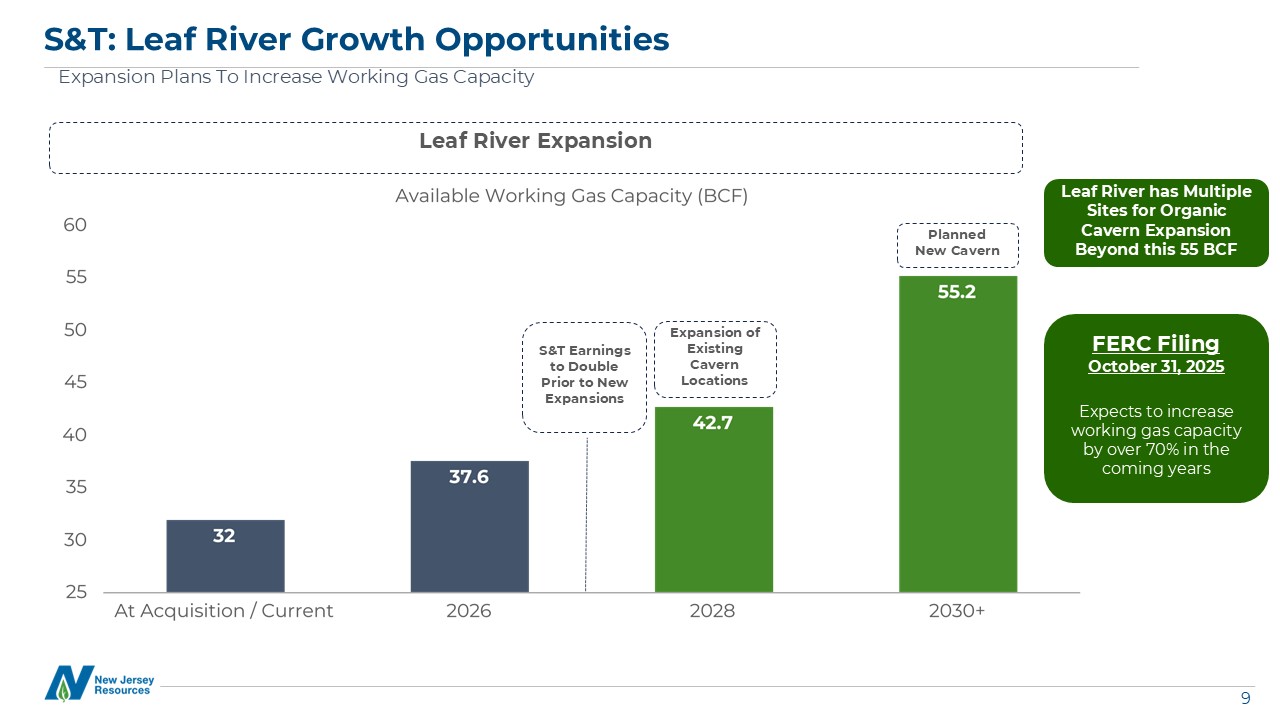
S&T: Leaf River Growth Opportunities Expansion Plans To Increase Working Gas Capacity Leaf
River Expansion Expansion of Existing Cavern Locations Planned New Cavern Leaf River has Multiple Sites for Organic Cavern Expansion Beyond this 55 BCF S&T Earnings to Double Prior to New Expansions FERC Filing October 31,
2025 Expects to increase working gas capacity by over 70% in the coming years
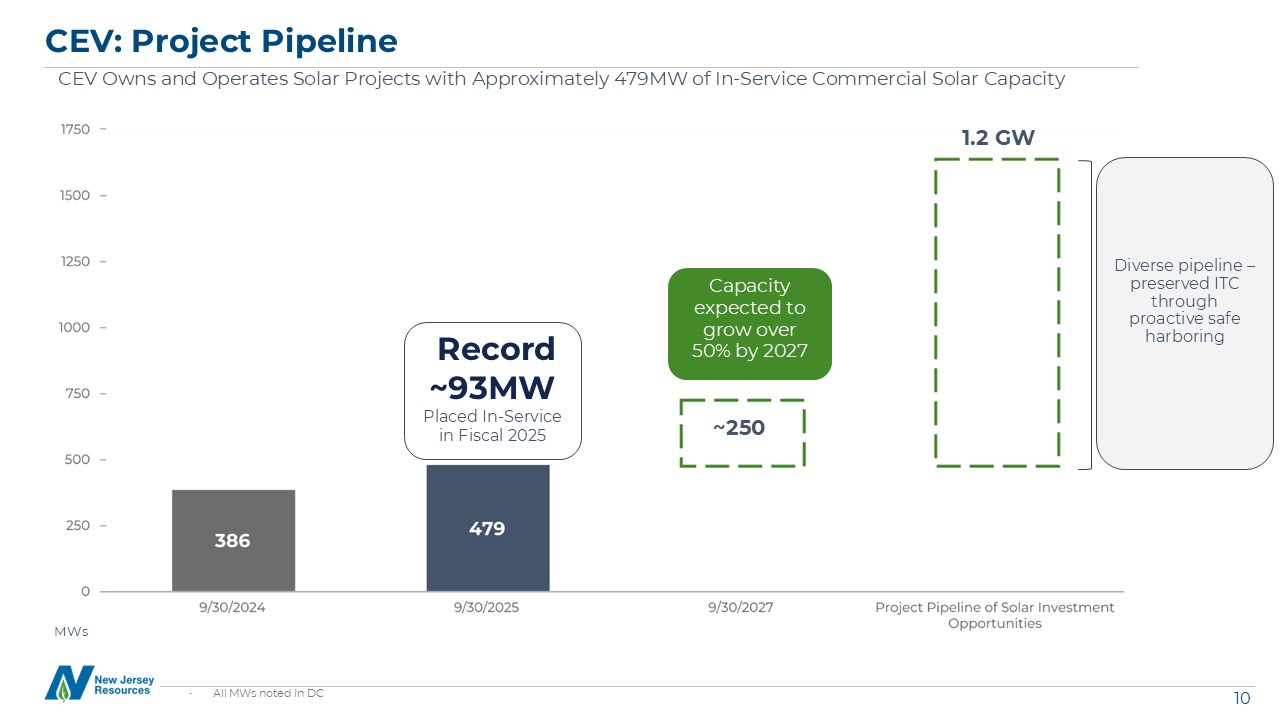
CEV: Project Pipeline CEV Owns and Operates Solar Projects with Approximately 479MW of In-Service
Commercial Solar Capacity MWs Record ~93MW Placed In-Service in Fiscal 2025 1.2 GW Diverse pipeline – preserved ITC through proactive safe harboring Capacity expected to grow over 50% by 2027 All MWs noted in DC ~250

11 11 Financial Review
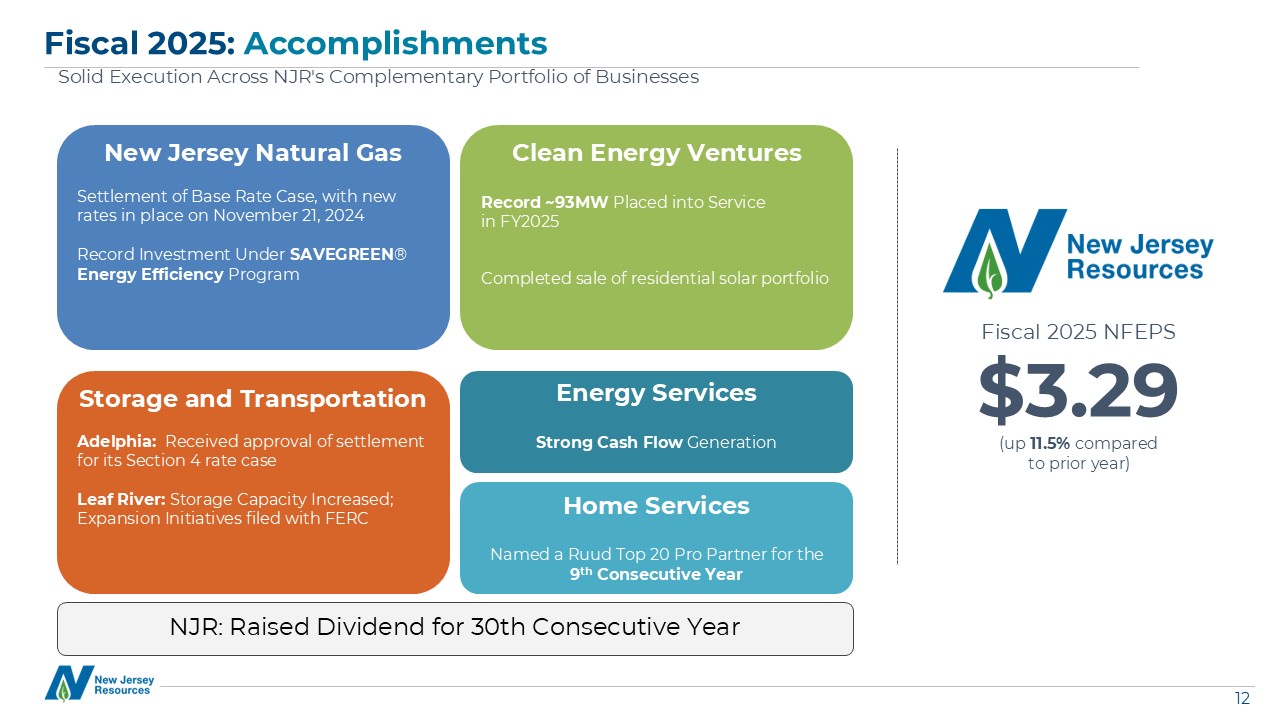
Fiscal 2025: Accomplishments Solid Execution Across NJR’s Complementary Portfolio of
Businesses New Jersey Natural Gas Settlement of Base Rate Case, with new rates in place on November 21, 2024 Record Investment Under SAVEGREEN® Energy Efficiency Program Clean Energy Ventures Record ~93MW Placed into Service in
FY2025 Completed sale of residential solar portfolio Storage and Transportation Adelphia: Received approval of settlement for its Section 4 rate case Leaf River: Storage Capacity Increased; Expansion Initiatives filed with FERC Energy
Services Strong Cash Flow Generation Fiscal 2025 NFEPS $3.29 (up 11.5% compared to prior year) NJR: Raised Dividend for 30th Consecutive Year Home Services Named a Ruud Top 20 Pro Partner for the 9th Consecutive Year
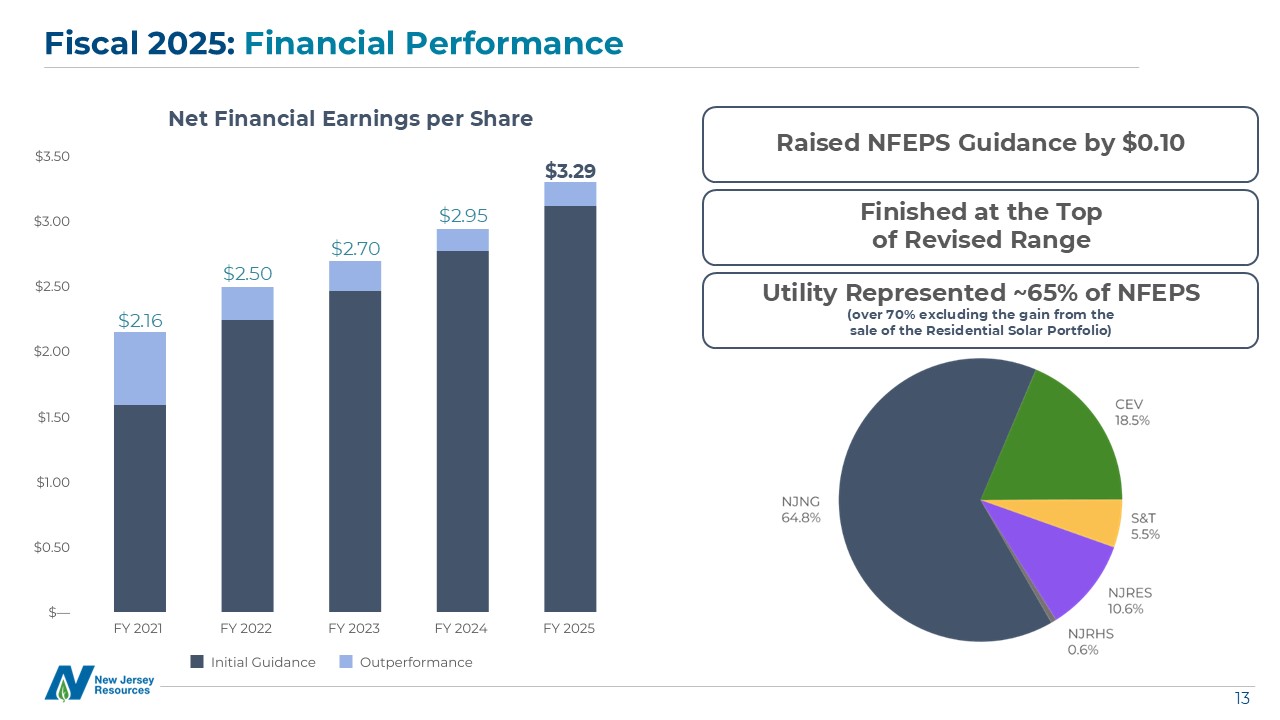
Fiscal 2025: Financial Performance Net Financial Earnings per Share $3.29 $2.95 Raised NFEPS
Guidance by $0.10 Finished at the Top of Revised Range $2.16 Utility Represented ~65% of NFEPS (over 70% excluding the gain from the sale of the Residential Solar Portfolio) $2.50 $2.70
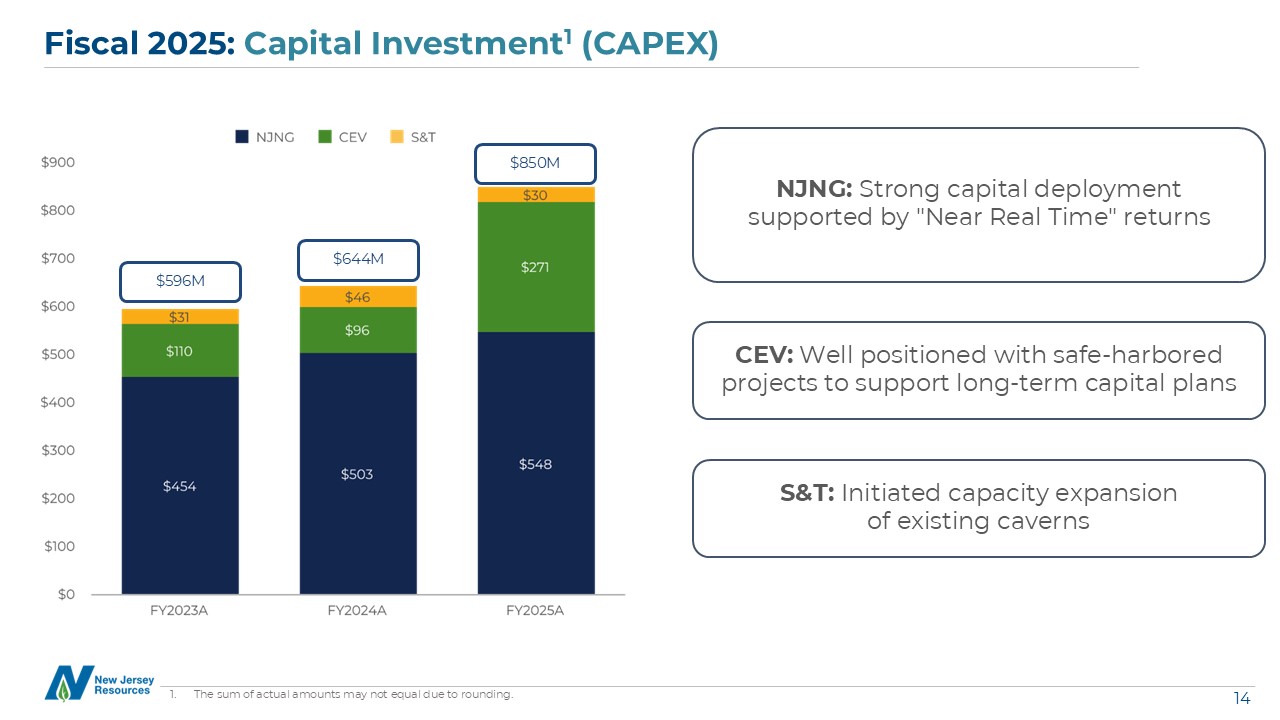
Fiscal 2025: Capital Investment1 (CAPEX) NJNG: Strong capital deployment supported by “Near Real
Time” returns CEV: Well positioned with safe-harbored projects to support long-term capital plans S&T: Initiated capacity expansion of existing caverns $596M $644M $850M The sum of actual amounts may not equal due to rounding.
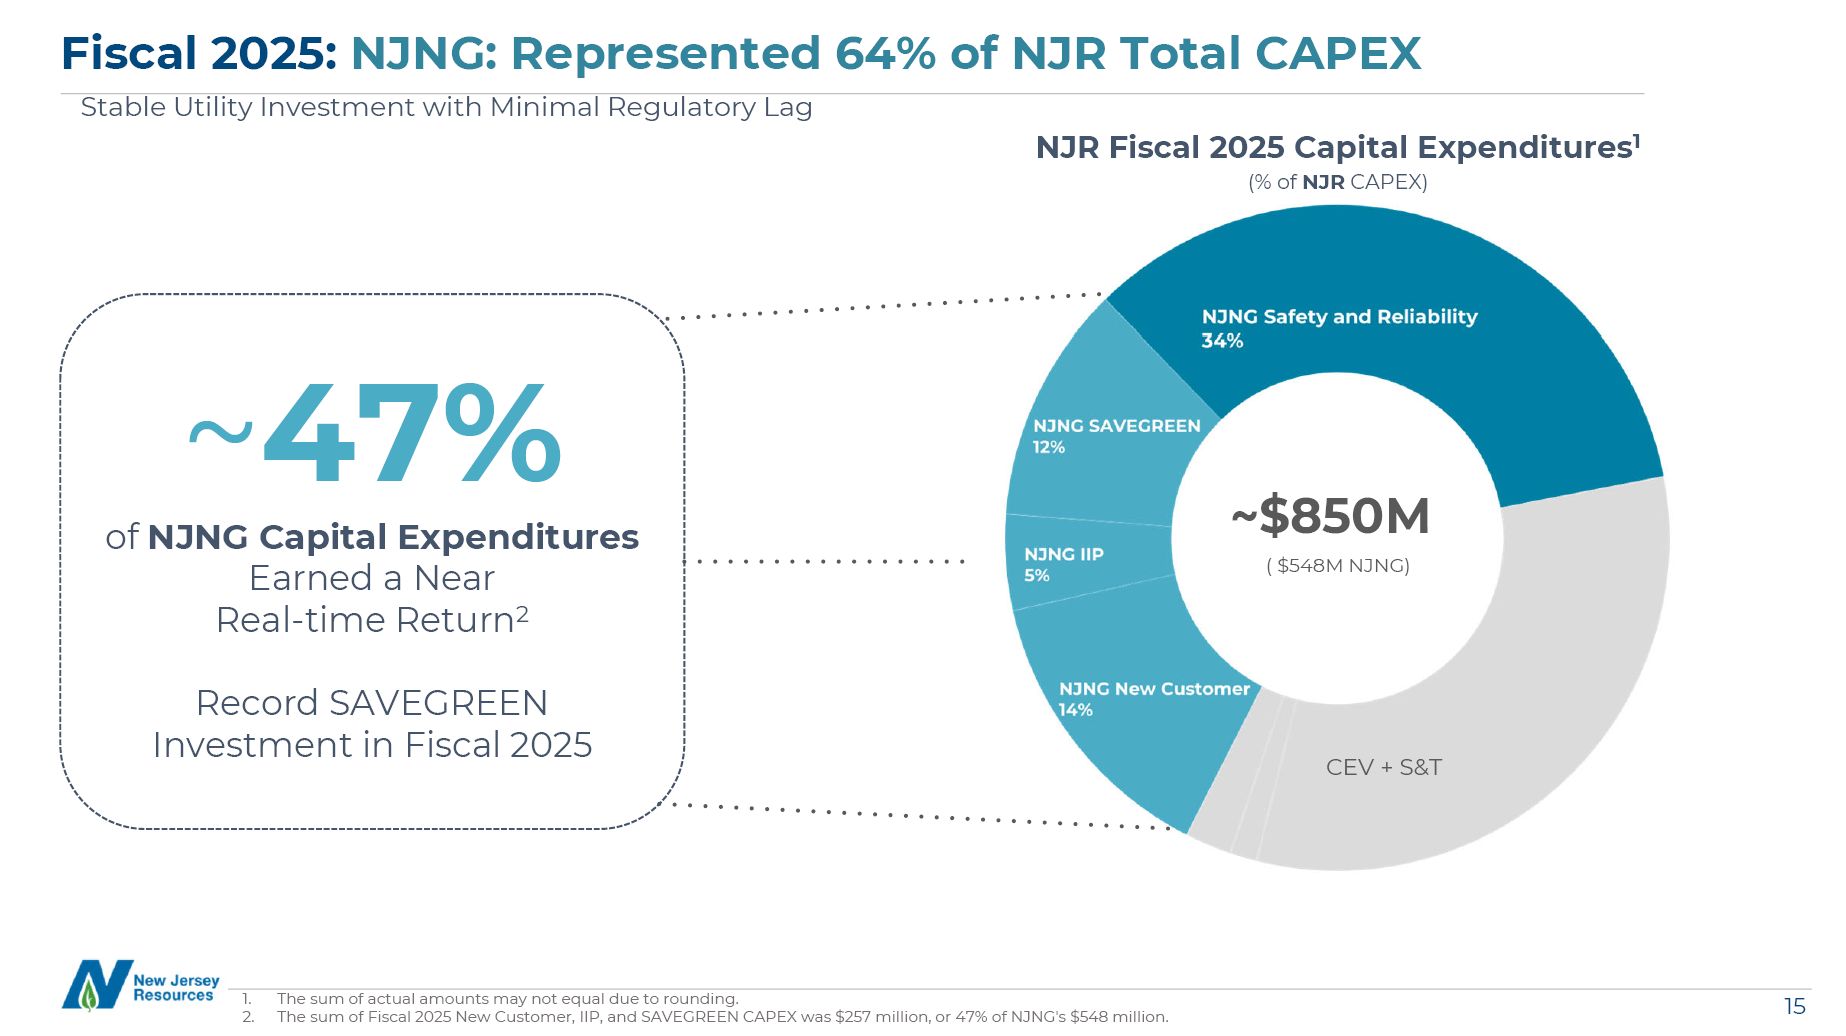
Fiscal 2025: NJNG: Represented 64% of NJR Total CAPEX Stable Utility Investment with Minimal
Regulatory Lag NJR Fiscal 2025 Capital Expenditures1 (% of NJR CAPEX) ~47% of NJNG Capital Expenditures Earned a Near Real-time Return2 Record SAVEGREEN Investment in Fiscal 2025 ~$850M CEV + S&T ( $548M NJNG) The sum of actual
amounts may not equal due to rounding. The sum of Fiscal 2025 New Customer, IIP, and SAVEGREEN CAPEX was $257 million, or 47% of NJNG’s $548 million.
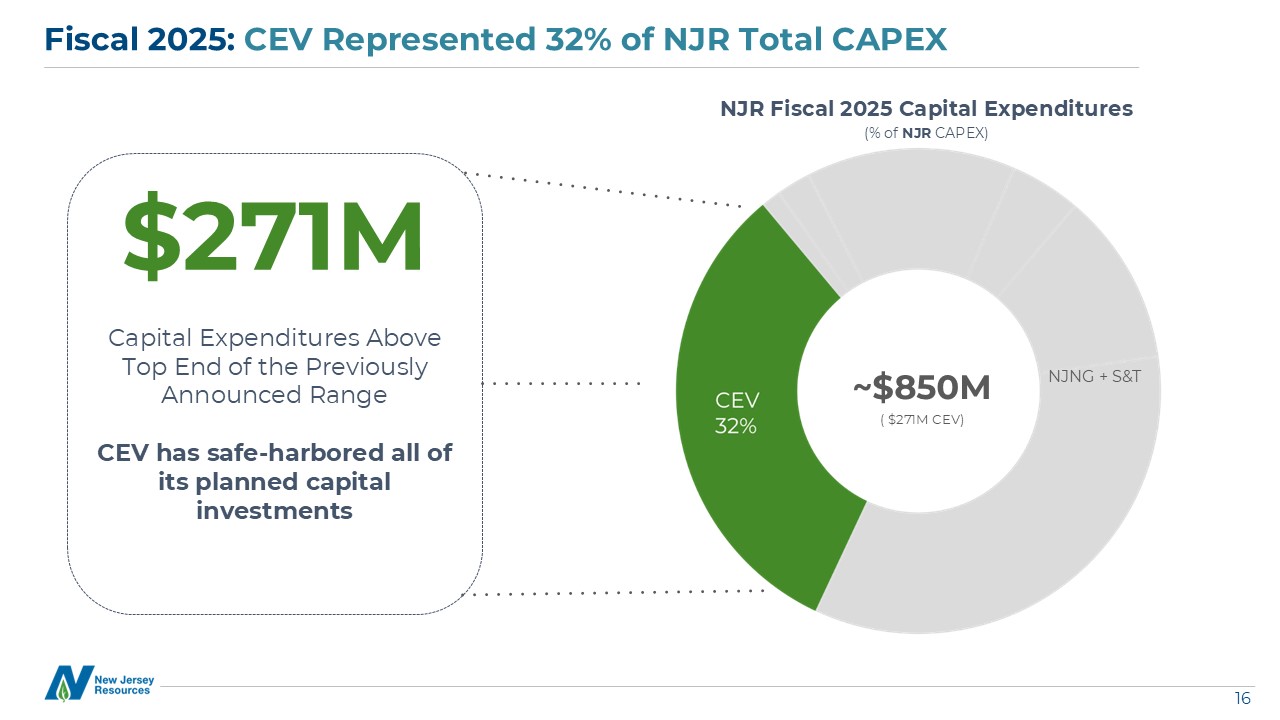
~$850M Fiscal 2025: CEV Represented 32% of NJR Total CAPEX NJR Fiscal 2025 Capital
Expenditures (% of NJR CAPEX) $271M Capital Expenditures Above Top End of the Previously Announced Range CEV has safe-harbored all of its planned capital investments NJNG + S&T ( $271M CEV)
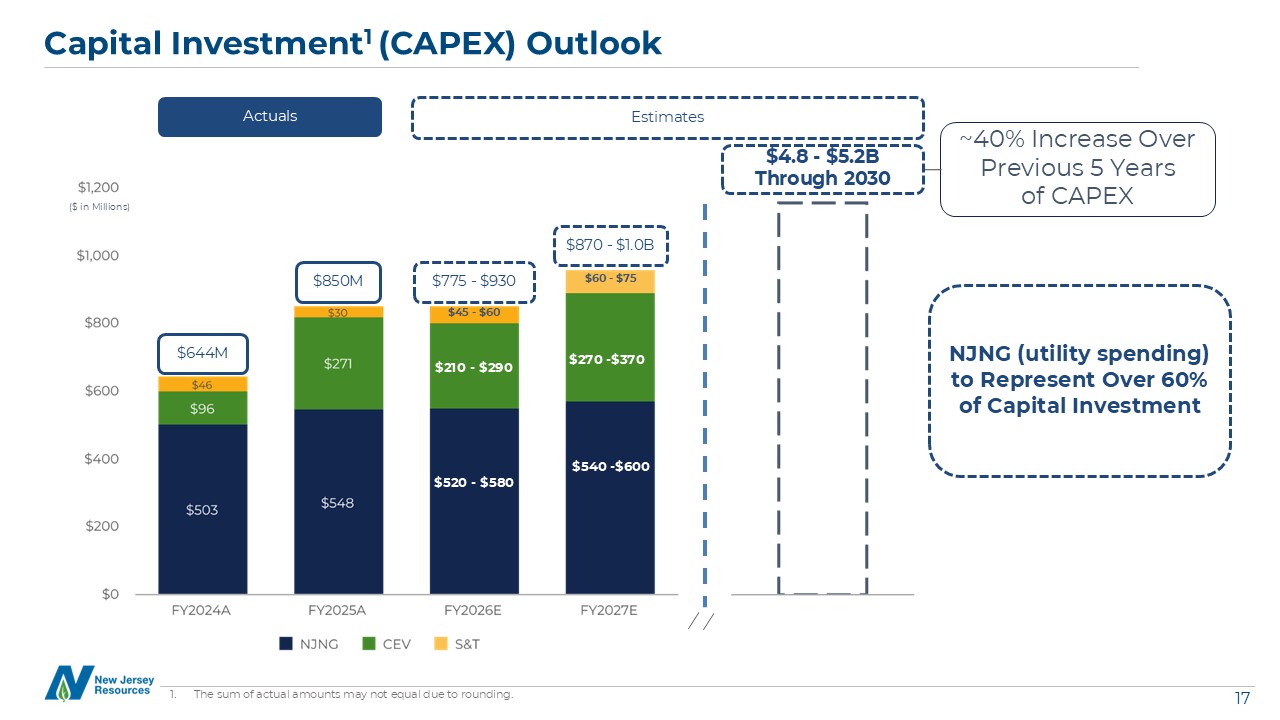
Capital Investment1 (CAPEX) Outlook $775 - $930 Actuals Estimates $4.8 - $5.2B Through
2030 $870 - $1.0B NJNG (utility spending) to Represent Over 60% of Capital Investment $45 - $60 $60 - $75 $210 - $290 $270 -$370 $520 - $580 $540 -$600 $850M $644M ($ in Millions) ~40% Increase Over Previous 5 Years of CAPEX The
sum of actual amounts may not equal due to rounding.
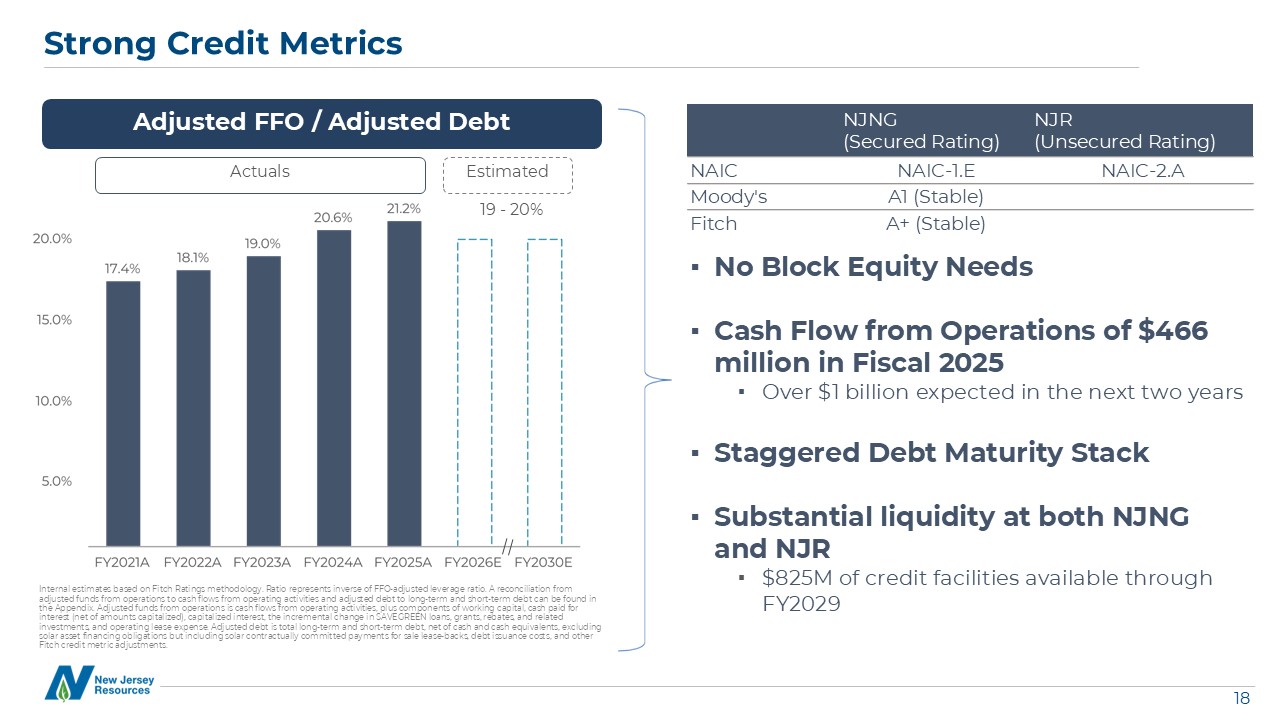
No Block Equity Needs Cash Flow from Operations of $466 million in Fiscal 2025 Over $1 billion
expected in the next two years Staggered Debt Maturity Stack Substantial liquidity at both NJNG and NJR $825M of credit facilities available through FY2029 Strong Credit Metrics Adjusted FFO / Adjusted Debt NJNG (Secured
Rating) NJR (Unsecured Rating) NAIC NAIC-1.E NAIC-2.A Moody’s A1 (Stable) Fitch A+ (Stable) Internal estimates based on Fitch Ratings methodology. Ratio represents inverse of FFO-adjusted leverage ratio. A reconciliation from adjusted
funds from operations to cash flows from operating activities and adjusted debt to long-term and short-term debt can be found in the Appendix. Adjusted funds from operations is cash flows from operating activities, plus components of working
capital, cash paid for interest (net of amounts capitalized), capitalized interest, the incremental change in SAVEGREEN loans, grants, rebates, and related investments, and operating lease expense. Adjusted debt is total long-term and
short-term debt, net of cash and cash equivalents, excluding solar asset financing obligations but including solar contractually committed payments for sale lease-backs, debt issuance costs, and other Fitch credit metric adjustments.
Actuals Estimated 19 - 20%
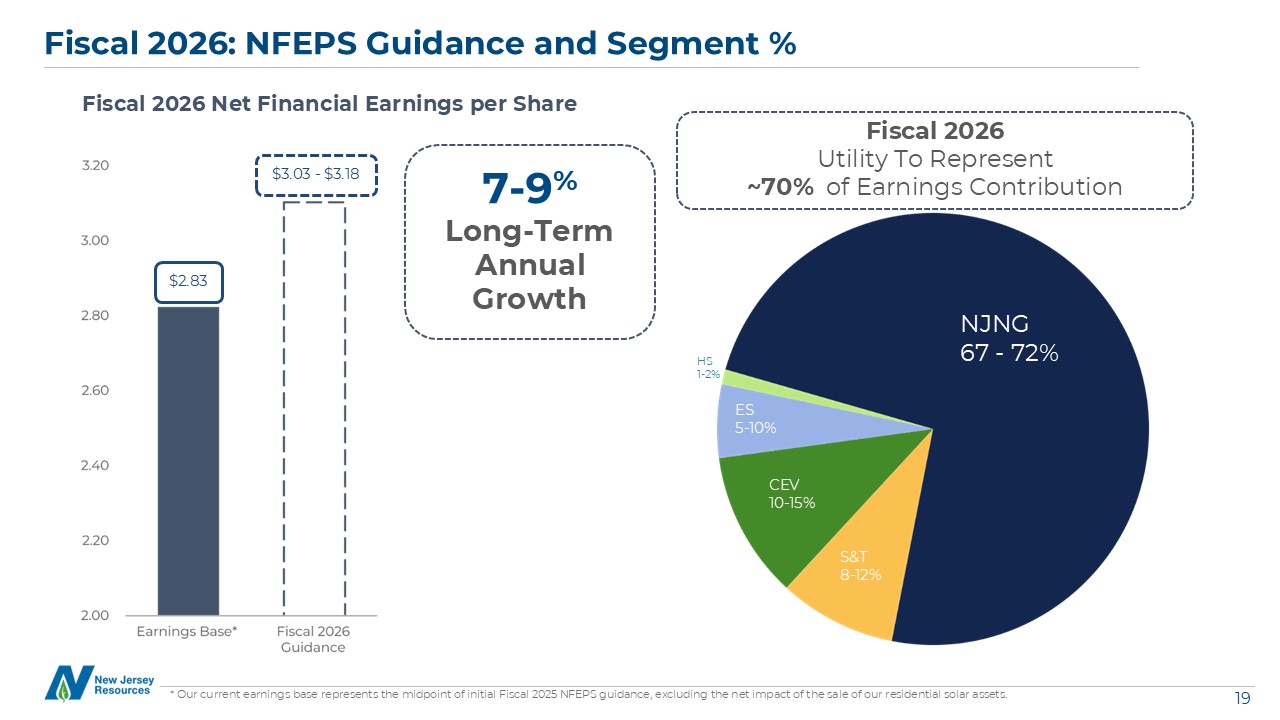
Fiscal 2026: NFEPS Guidance and Segment % Fiscal 2026 Net Financial Earnings per
Share 7-9% Long-Term Annual Growth $3.03 - $3.18 Fiscal 2026 Utility To Represent ~70% of Earnings Contribution NJNG 67 - 72% S&T 8-12% CEV 10-15% ES 5-10% HS 1-2% $2.83 * Our current earnings base represents the
midpoint of initial Fiscal 2025 NFEPS guidance, excluding the net impact of the sale of our residential solar assets.

20 20 Closing
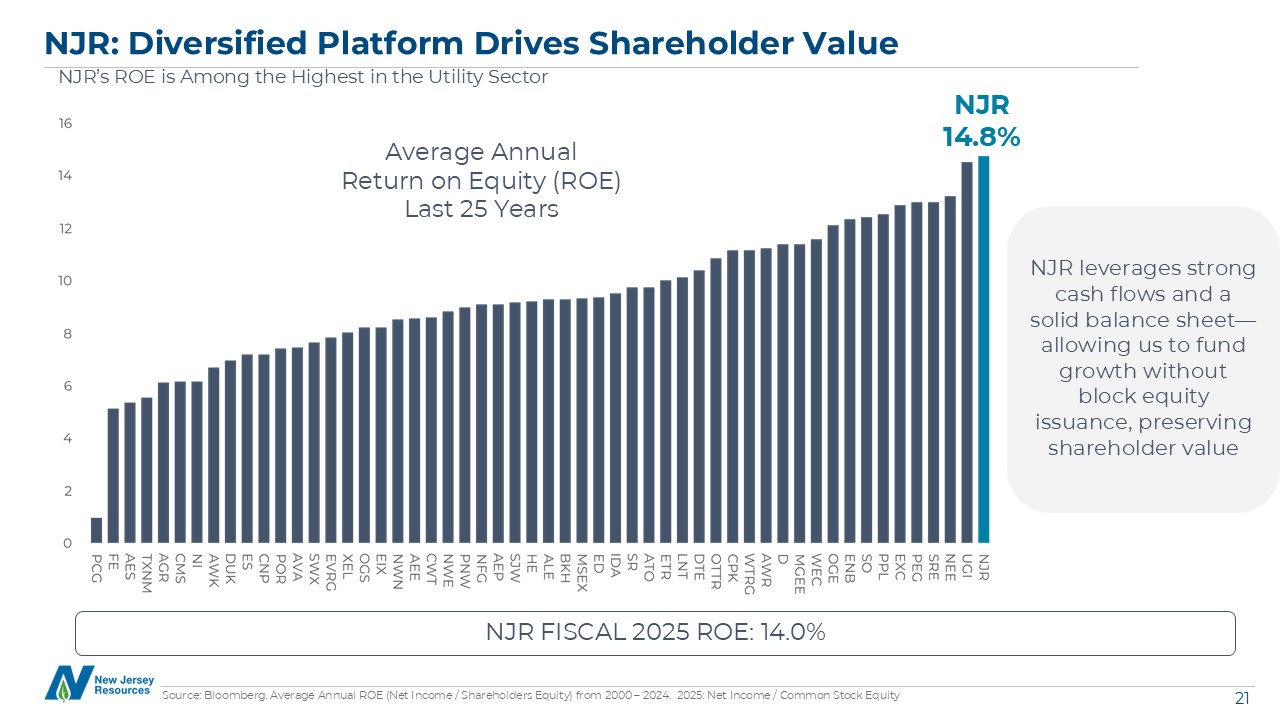
NJR: Diversified Platform Drives Shareholder Value NJR’s ROE is Among the Highest in the Utility
Sector NJR FISCAL 2025 ROE: 14.0% NJR leverages strong cash flows and a solid balance sheet—allowing us to fund growth without block equity issuance, preserving shareholder value NJR 14.8% Average Annual Return on Equity (ROE) Last 25
Years Source: Bloomberg. Average Annual ROE (Net Income / Shareholders Equity) from 2000 – 2024. 2025: Net Income / Common Stock Equity
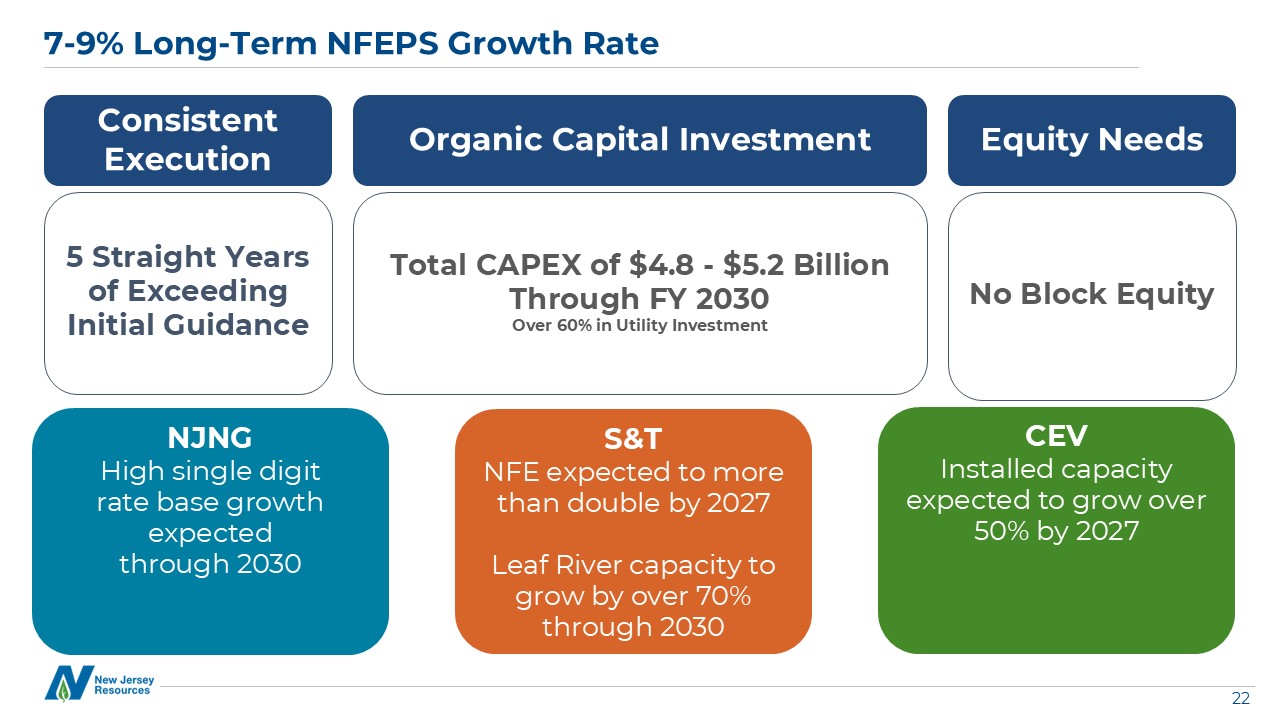
7-9% Long-Term NFEPS Growth Rate 5 Straight Years of Exceeding Initial Guidance Total CAPEX of
$4.8 - $5.2 Billion Through FY 2030 Over 60% in Utility Investment No Block Equity Consistent Execution Organic Capital Investment Equity Needs NJNG High single digit rate base growth expected through 2030 CEV Installed capacity
expected to grow over 50% by 2027 S&T NFE expected to more than double by 2027 Leaf River capacity to grow by over 70% through 2030
Appendix: Financial Statements and Additional Information 23 24 Fiscal 2025 Fourth Quarter and
Year End NFE and NFEPS by Business Unit 25 Fiscal 2025 Fourth Quarter and Year End Results - Walk 26 Reconciliation of NFE and NFEPS to Net Income 27 Other Reconciliation of Non-GAAP Measures 28 Reconciliation of Adjusted Funds from
Operations to Cash Flow from Operations 29 Capital Plan Table - Two Year Detailed 30 Cash Flows - Two Year Projected 31 Debt Repayment Schedule
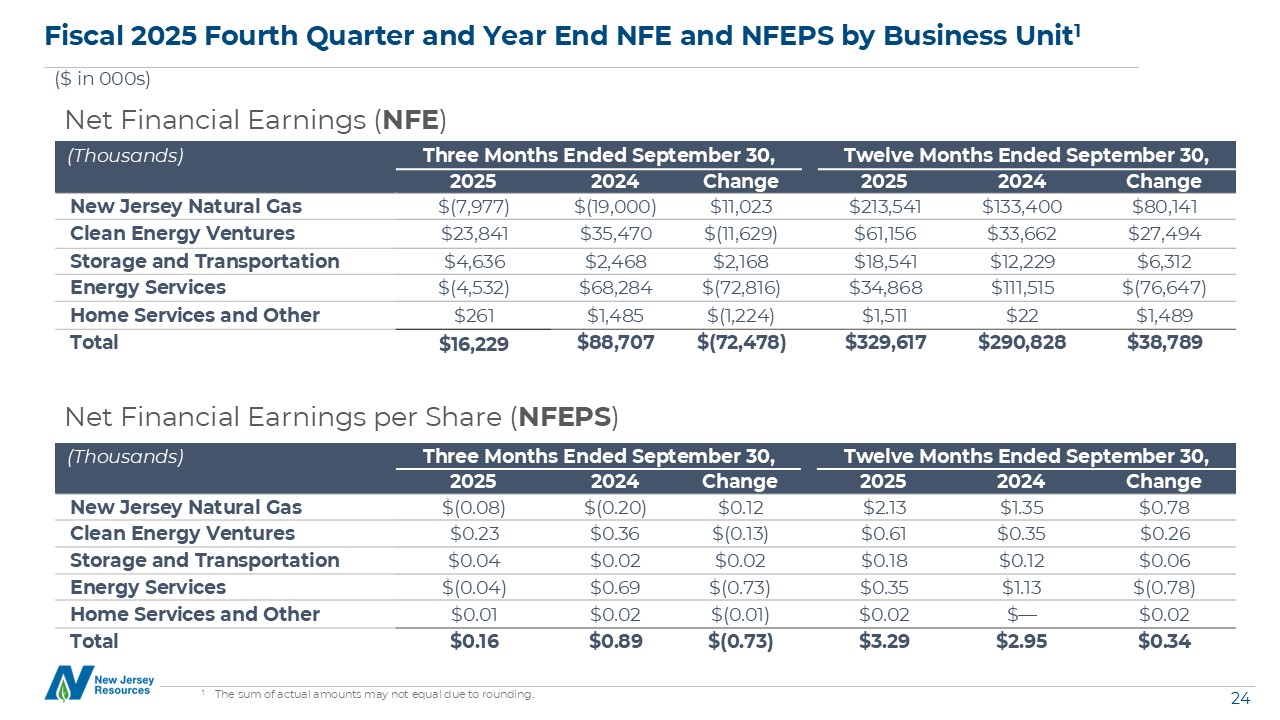
Fiscal 2025 Fourth Quarter and Year End NFE and NFEPS by Business Unit1 ($ in 000s) Net Financial
Earnings (NFE) Net Financial Earnings per Share (NFEPS) (Thousands) Three Months Ended September 30, Twelve Months Ended September 30, 2025 2024 Change 2025 2024 Change New Jersey Natural
Gas $(7,977) $(19,000) $11,023 $213,541 $133,400 $80,141 Clean Energy Ventures $23,841 $35,470 $(11,629) $61,156 $33,662 $27,494 Storage and Transportation $4,636 $2,468 $2,168 $18,541 $12,229 $6,312 Energy
Services $(4,532) $68,284 $(72,816) $34,868 $111,515 $(76,647) Home Services and Other $261 $1,485 $(1,224) $1,511 $22 $1,489 Total $16,229 $88,707 $(72,478) $329,617 $290,828 $38,789 (Thousands) Three Months Ended
September 30, Twelve Months Ended September 30, 2025 2024 Change 2025 2024 Change New Jersey Natural Gas $(0.08) $(0.20) $0.12 $2.13 $1.35 $0.78 Clean Energy Ventures $0.23 $0.36 $(0.13) $0.61 $0.35 $0.26 Storage and
Transportation $0.04 $0.02 $0.02 $0.18 $0.12 $0.06 Energy Services $(0.04) $0.69 $(0.73) $0.35 $1.13 $(0.78) Home Services and Other $0.01 $0.02 $(0.01) $0.02 $— $0.02 Total $0.16 $0.89 $(0.73) $3.29 $2.95 $0.34 1
The sum of actual amounts may not equal due to rounding.
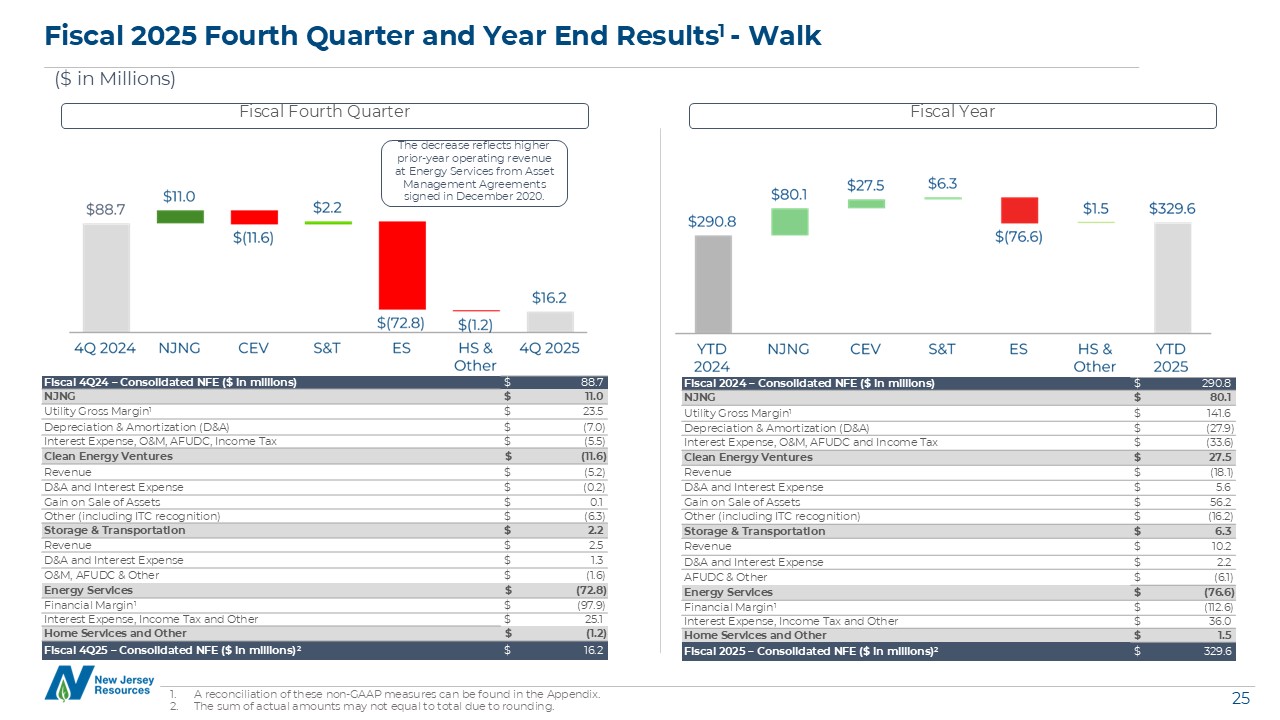
A reconciliation of these non-GAAP measures can be found in the Appendix. The sum of actual amounts
may not equal to total due to rounding. Fiscal 2025 Fourth Quarter and Year End Results1 - Walk ($ in Millions) Fiscal Fourth Quarter Fiscal Year Fiscal 2024 – Consolidated NFE ($ in millions) $ 290.8 NJNG $ 80.1 Utility Gross
Margin1 $ 141.6 Depreciation & Amortization (D&A) $ (27.9) Interest Expense, O&M, AFUDC and Income Tax $ (33.6) Clean Energy Ventures $ 27.5 Revenue $ (18.1) D&A and Interest Expense $ 5.6 Gain on Sale of
Assets $ 56.2 Other (including ITC recognition) $ (16.2) Storage & Transportation $ 6.3 Revenue $ 10.2 D&A and Interest Expense $ 2.2 AFUDC & Other $ (6.1) Energy Services $ (76.6) Financial Margin1 $ (112.6)
Interest Expense, Income Tax and Other $ 36.0 Home Services and Other $ 1.5 Fiscal 2025 – Consolidated NFE ($ in millions)2 $ 329.6 Fiscal 4Q24 – Consolidated NFE ($ in millions) $ 88.7 NJNG $ 11.0 Utility Gross Margin1 $ 23.5
Depreciation & Amortization (D&A) $ (7.0) Interest Expense, O&M, AFUDC, Income Tax $ (5.5) Clean Energy Ventures $ (11.6) Revenue $ (5.2) D&A and Interest Expense $ (0.2) Gain on Sale of Assets $ 0.1 Other
(including ITC recognition) $ (6.3) Storage & Transportation $ 2.2 Revenue $ 2.5 D&A and Interest Expense $ 1.3 O&M, AFUDC & Other $ (1.6) Energy Services $ (72.8) Financial Margin1 $ (97.9) Interest Expense,
Income Tax and Other $ 25.1 Home Services and Other $ (1.2) Fiscal 4Q25 – Consolidated NFE ($ in millions)2 $ 16.2 The decrease reflects higher prior-year operating revenue at Energy Services from Asset Management Agreements signed in
December 2020.
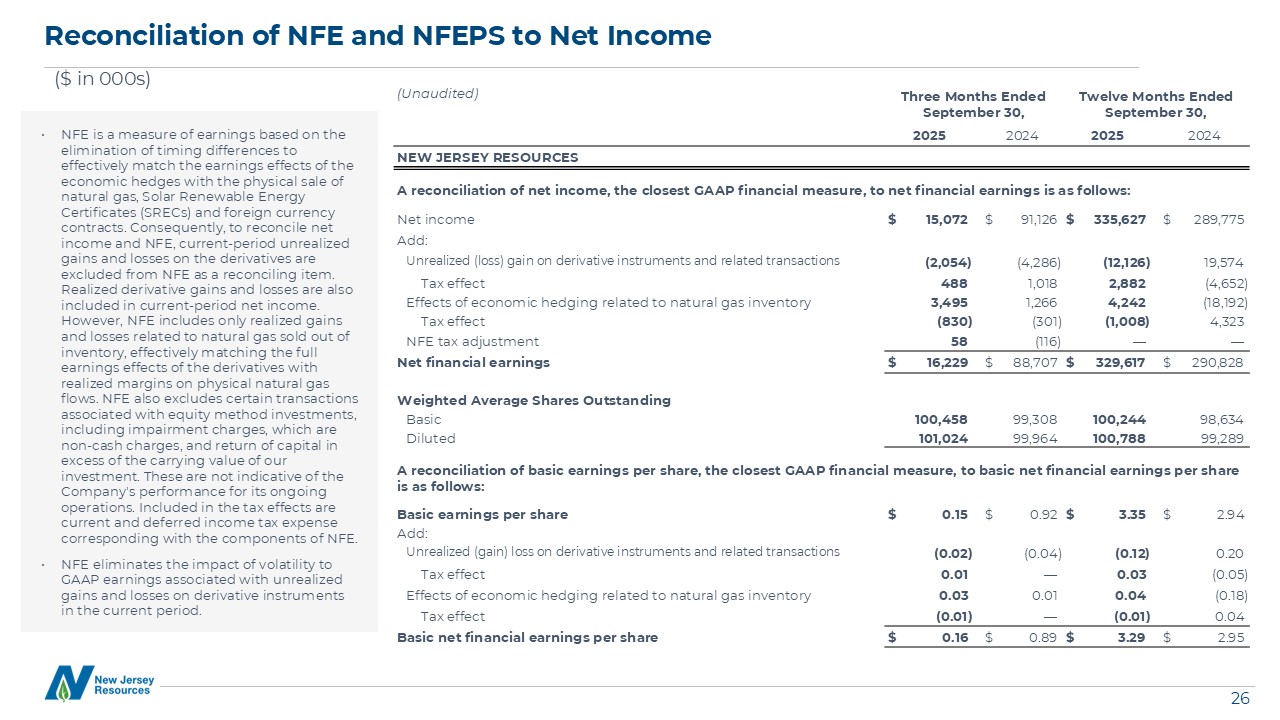
Reconciliation of NFE and NFEPS to Net Income ($ in 000s) NFE is a measure of earnings based on
the elimination of timing differences to effectively match the earnings effects of the economic hedges with the physical sale of natural gas, Solar Renewable Energy Certificates (SRECs) and foreign currency contracts. Consequently, to reconcile
net income and NFE, current-period unrealized gains and losses on the derivatives are excluded from NFE as a reconciling item. Realized derivative gains and losses are also included in current-period net income. However, NFE includes only
realized gains and losses related to natural gas sold out of inventory, effectively matching the full earnings effects of the derivatives with realized margins on physical natural gas flows. NFE also excludes certain transactions associated
with equity method investments, including impairment charges, which are non-cash charges, and return of capital in excess of the carrying value of our investment. These are not indicative of the Company’s performance for its ongoing operations.
Included in the tax effects are current and deferred income tax expense corresponding with the components of NFE. NFE eliminates the impact of volatility to GAAP earnings associated with unrealized gains and losses on derivative instruments in
the current period. (Unaudited) Three Months Ended September 30, Twelve Months Ended September 30, 2025 2024 2025 2024 NEW JERSEY RESOURCES A reconciliation of net income, the closest GAAP financial measure, to net financial earnings
is as follows: Net income $ 15,072 $ 91,126 $ 335,627 $ 289,775 Add: Unrealized (loss) gain on derivative instruments and related transactions (2,054) (4,286) (12,126) 19,574 Tax effect 488 1,018 2,882
(4,652) Effects of economic hedging related to natural gas inventory 3,495 1,266 4,242 (18,192) Tax effect (830) (301) (1,008) 4,323 NFE tax adjustment 58 (116) — — Net financial earnings $ 16,229 $ 88,707
$ 329,617 $ 290,828 Weighted Average Shares Outstanding Basic 100,458 99,308 100,244 98,634 Diluted 101,024 99,964 100,788 99,289 A reconciliation of basic earnings per share, the closest GAAP financial measure,
to basic net financial earnings per share is as follows: Basic earnings per share $ 0.15 $ 0.92 $ 3.35 $ 2.94 Add: Unrealized (gain) loss on derivative instruments and related transactions (0.02) (0.04) (0.12) 0.20 Tax
effect 0.01 — 0.03 (0.05) Effects of economic hedging related to natural gas inventory 0.03 0.01 0.04 (0.18) Tax effect (0.01) — (0.01) 0.04 Basic net financial earnings per share $ 0.16 $ 0.89 $ 3.29 $
2.95
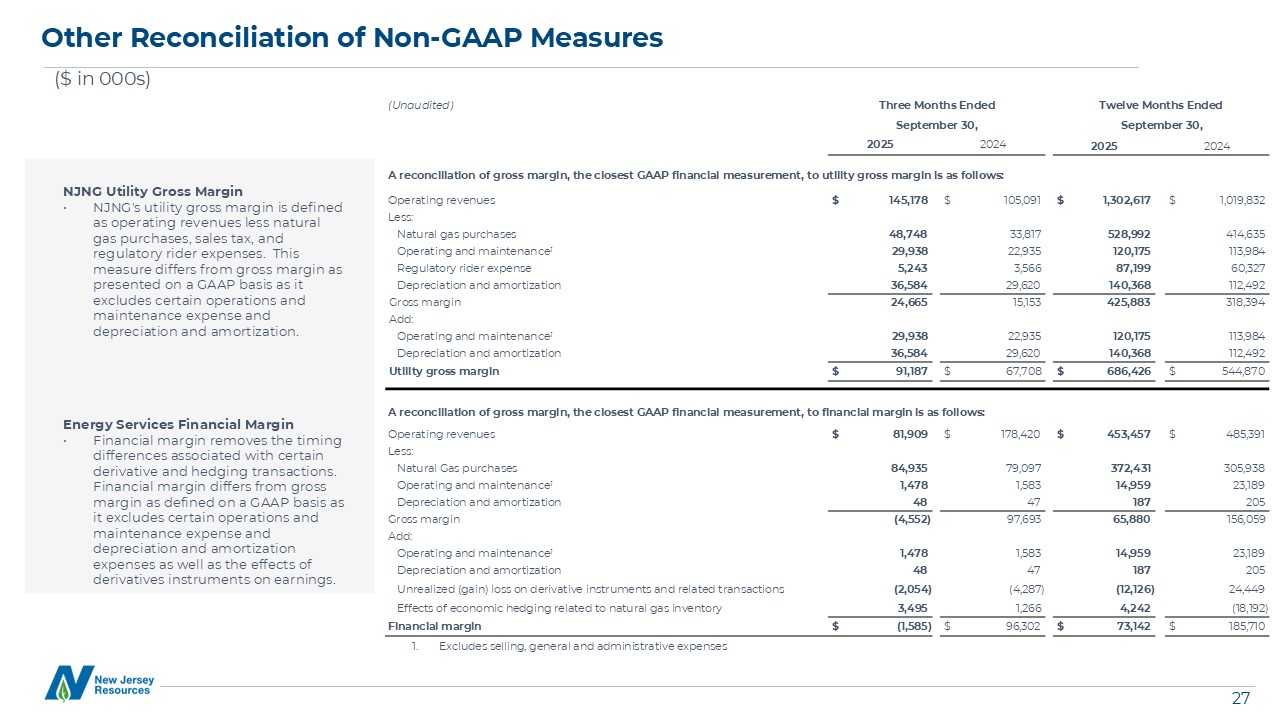
Other Reconciliation of Non-GAAP Measures NJNG Utility Gross Margin NJNG’s utility gross margin is
defined as operating revenues less natural gas purchases, sales tax, and regulatory rider expenses. This measure differs from gross margin as presented on a GAAP basis as it excludes certain operations and maintenance expense and depreciation
and amortization. Energy Services Financial Margin Financial margin removes the timing differences associated with certain derivative and hedging transactions. Financial margin differs from gross margin as defined on a GAAP basis as it
excludes certain operations and maintenance expense and depreciation and amortization expenses as well as the effects of derivatives instruments on earnings. ($ in 000s) (Unaudited) Three Months Ended Twelve Months Ended September
30, September 30, 2025 2024 2025 2024 A reconciliation of gross margin, the closest GAAP financial measurement, to utility gross margin is as follows: Operating revenues $ 145,178 $ 105,091 $ 1,302,617 $ 1,019,832 Less: Natural
gas purchases 48,748 33,817 528,992 414,635 Operating and maintenance1 29,938 22,935 120,175 113,984 Regulatory rider expense 5,243 3,566 87,199 60,327 Depreciation and amortization 36,584 29,620
140,368 112,492 Gross margin 24,665 15,153 425,883 318,394 Add: Operating and maintenance1 29,938 22,935 120,175 113,984 Depreciation and amortization 36,584 29,620 140,368 112,492 Utility gross
margin $ 91,187 $ 67,708 $ 686,426 $ 544,870 A reconciliation of gross margin, the closest GAAP financial measurement, to financial margin is as follows: Operating revenues $ 81,909 $ 178,420 $ 453,457 $ 485,391
Less: Natural Gas purchases 84,935 79,097 372,431 305,938 Operating and maintenance1 1,478 1,583 14,959 23,189 Depreciation and amortization 48 47 187 205 Gross margin (4,552) 97,693 65,880
156,059 Add: Operating and maintenance1 1,478 1,583 14,959 23,189 Depreciation and amortization 48 47 187 205 Unrealized (gain) loss on derivative instruments and related transactions (2,054) (4,287)
(12,126) 24,449 Effects of economic hedging related to natural gas inventory 3,495 1,266 4,242 (18,192) Financial margin $ (1,585) $ 96,302 $ 73,142 $ 185,710 Excludes selling, general and administrative expenses
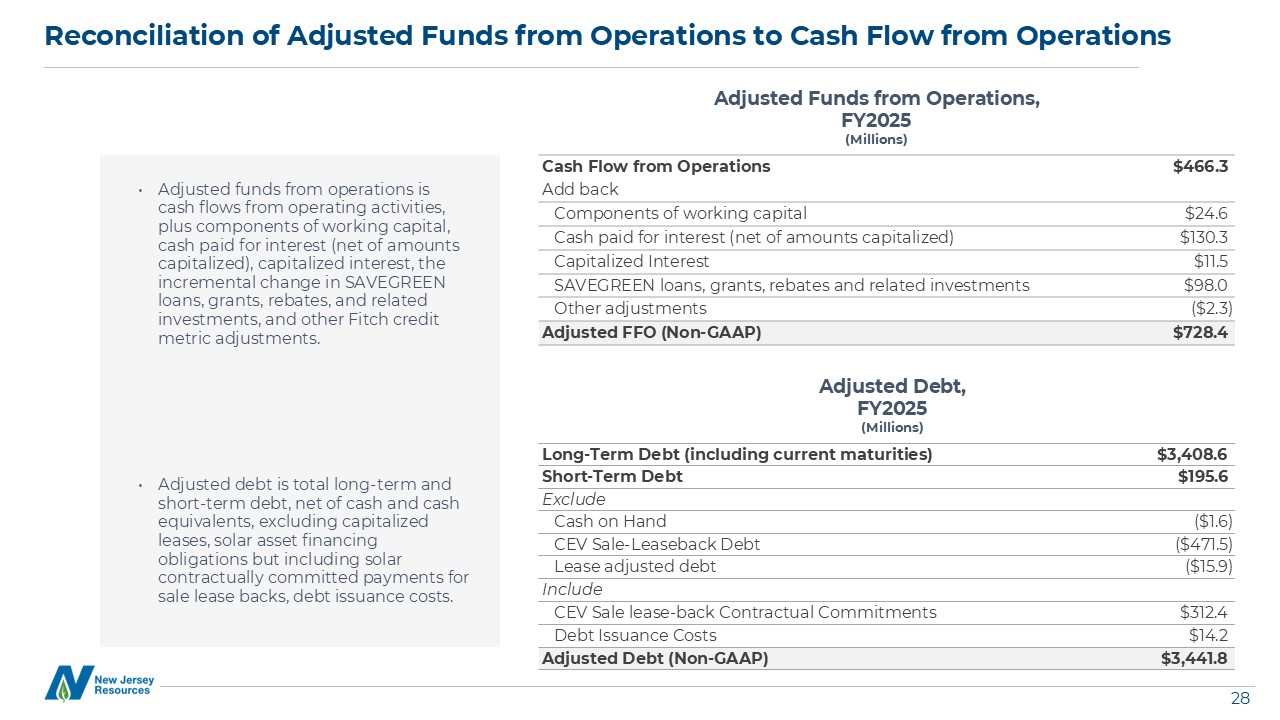
Reconciliation of Adjusted Funds from Operations to Cash Flow from Operations Adjusted funds from
operations is cash flows from operating activities, plus components of working capital, cash paid for interest (net of amounts capitalized), capitalized interest, the incremental change in SAVEGREEN loans, grants, rebates, and related
investments, and other Fitch credit metric adjustments. Adjusted debt is total long-term and short-term debt, net of cash and cash equivalents, excluding capitalized leases, solar asset financing obligations but including solar contractually
committed payments for sale lease backs, debt issuance costs. Cash Flow from Operations $466.3 Add back Components of working capital $24.6 Cash paid for interest (net of amounts capitalized) $130.3 Capitalized Interest $11.5
SAVEGREEN loans, grants, rebates and related investments $98.0 Other adjustments ($2.3) Adjusted FFO (Non-GAAP) $728.4 Long-Term Debt (including current maturities) $3,408.6 Short-Term Debt $195.6 Exclude Cash on Hand
($1.6) CEV Sale-Leaseback Debt ($471.5) Lease adjusted debt ($15.9) Include CEV Sale lease-back Contractual Commitments $312.4 Debt Issuance Costs $14.2 Adjusted Debt (Non-GAAP) $3,441.8 Adjusted Debt, FY2025
(Millions) Adjusted Funds from Operations, FY2025 (Millions)
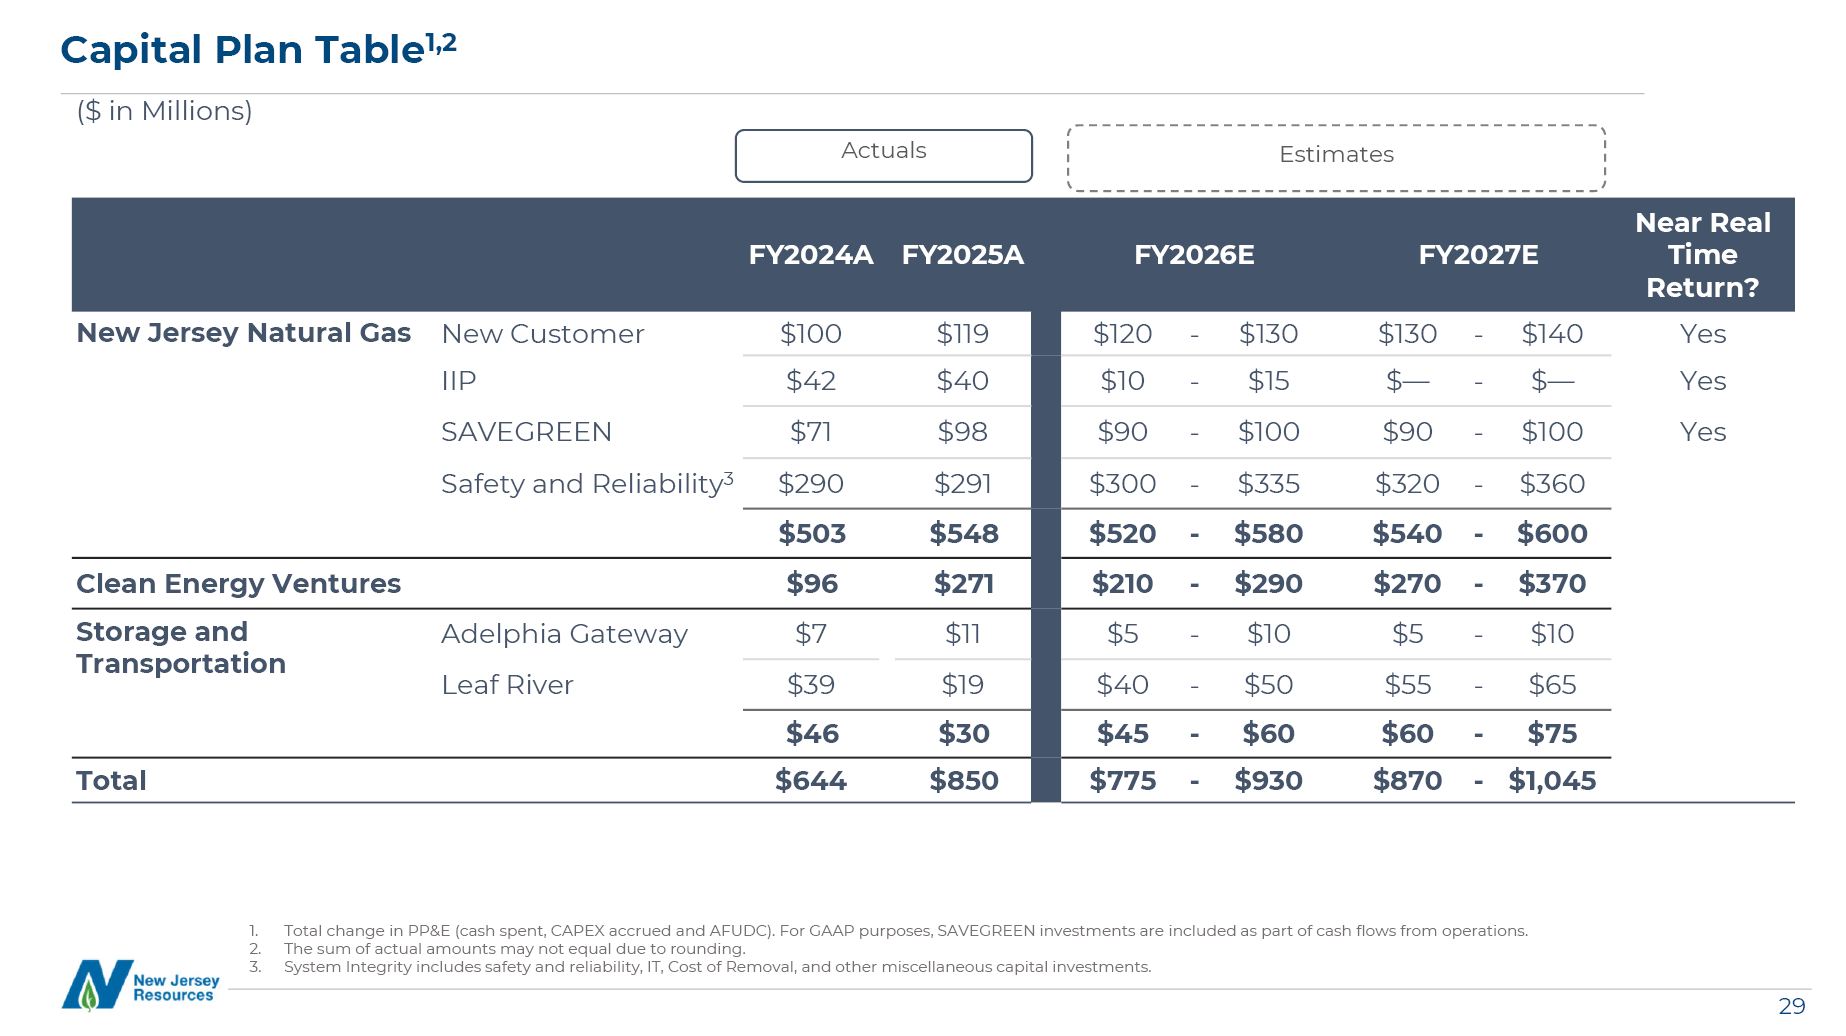
Capital Plan Table1,2 ($ in Millions) Total change in PP&E (cash spent, CAPEX
accrued and AFUDC). For GAAP purposes, SAVEGREEN investments are included as part of cash flows from operations. The sum of actual amounts may not equal due to rounding. System Integrity includes safety and reliability, IT, Cost of Removal,
and other miscellaneous capital investments. Actuals Estimates FY2024A FY2025A FY2026E FY2027E Near Real Time Return? New Jersey Natural Gas New
Customer $100 $119 $120 - $130 $130 - $140 Yes IIP $42 $40 $10 - $15 $— - $— Yes SAVEGREEN $71 $98 $90 - $100 $90 - $100 Yes Safery and
Reliability3 $290 $291 $300 - $335 $320 - $360 $503 $548 $520 - $580 $540 - $600 Clean Energy Ventures $96 $271 $210 - $290 $270 - $370 Storage and Transportation Adelphia
Gateway $7 $11 $5 - $10 $5 - $10 Leaf River $39 $19 $40 - $50 $55 - $65 $46 $30 $45 - $60 $60 - $75 Total $644 $850 $775 - $930 $870 - $1,045
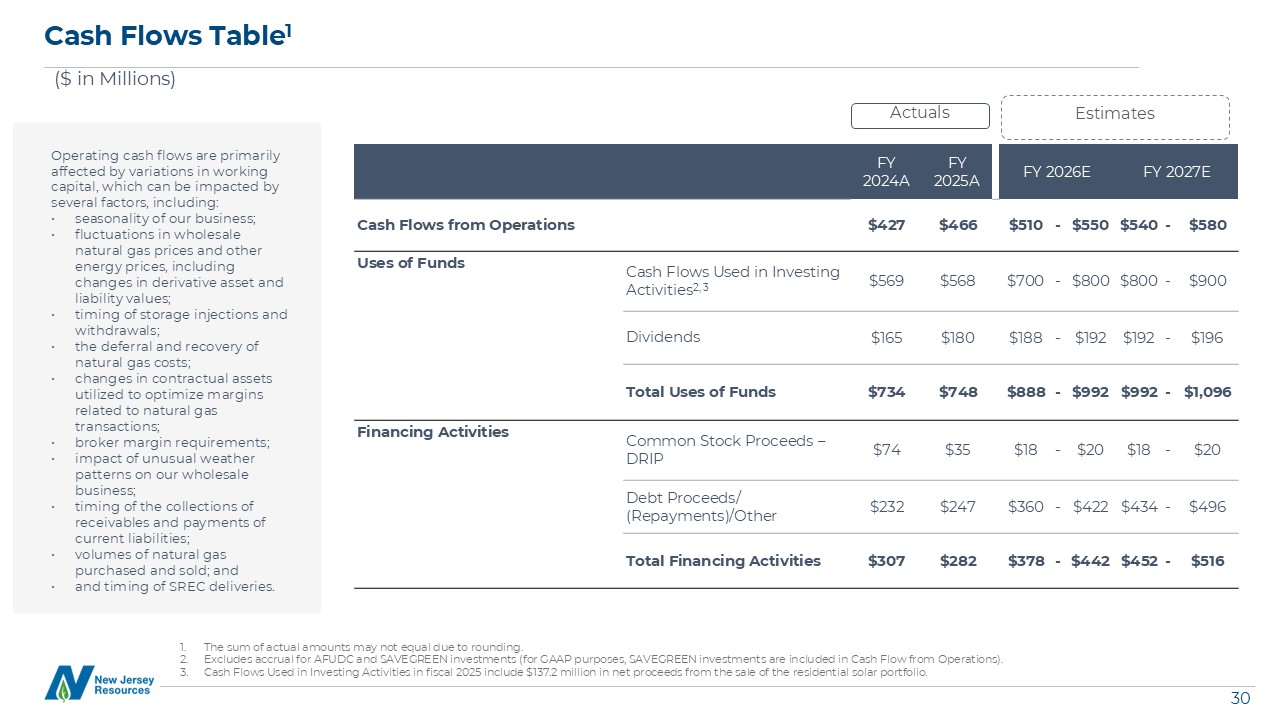
The sum of actual amounts may not equal due to rounding. Excludes accrual for AFUDC and SAVEGREEN
investments (for GAAP purposes, SAVEGREEN investments are included in Cash Flow from Operations). Cash Flows Used in Investing Activities in fiscal 2025 include $137.2 million in net proceeds from the sale of the residential solar portfolio.
Cash Flows Table1 ($ in Millions) Actuals Estimates Operating cash flows are primarily affected by variations in working capital, which can be impacted by several factors, including: seasonality of our business; fluctuations in
wholesale natural gas prices and other energy prices, including changes in derivative asset and liability values; timing of storage injections and withdrawals; the deferral and recovery of natural gas costs; changes in contractual assets
utilized to optimize margins related to natural gas transactions; broker margin requirements; impact of unusual weather patterns on our wholesale business; timing of the collections of receivables and payments of current
liabilities; volumes of natural gas purchased and sold; and and timing of SREC deliveries. FY 2024A FY 2025A FY 2026E FY 2027E Cash Flows from Operations $427 $466 $510 - $550 $540 - $580 Uses of Funds Cash Flows Used in
Investing Activities2, 3 $569 $568 $700 - $800 $800 - $900 Dividends $165 $180 $188 - $192 $192 - $196 Total Uses of Funds $734 $748 $888 - $992 $992 - $1,096 Financing Activities Common Stock Proceeds –
DRIP $74 $35 $18 - $20 $18 - $20 Debt Proceeds/ (Repayments)/Other $232 $247 $360 - $422 $434 - $496 Total Financing Activities $307 $282 $378 - $442 $452 - $516
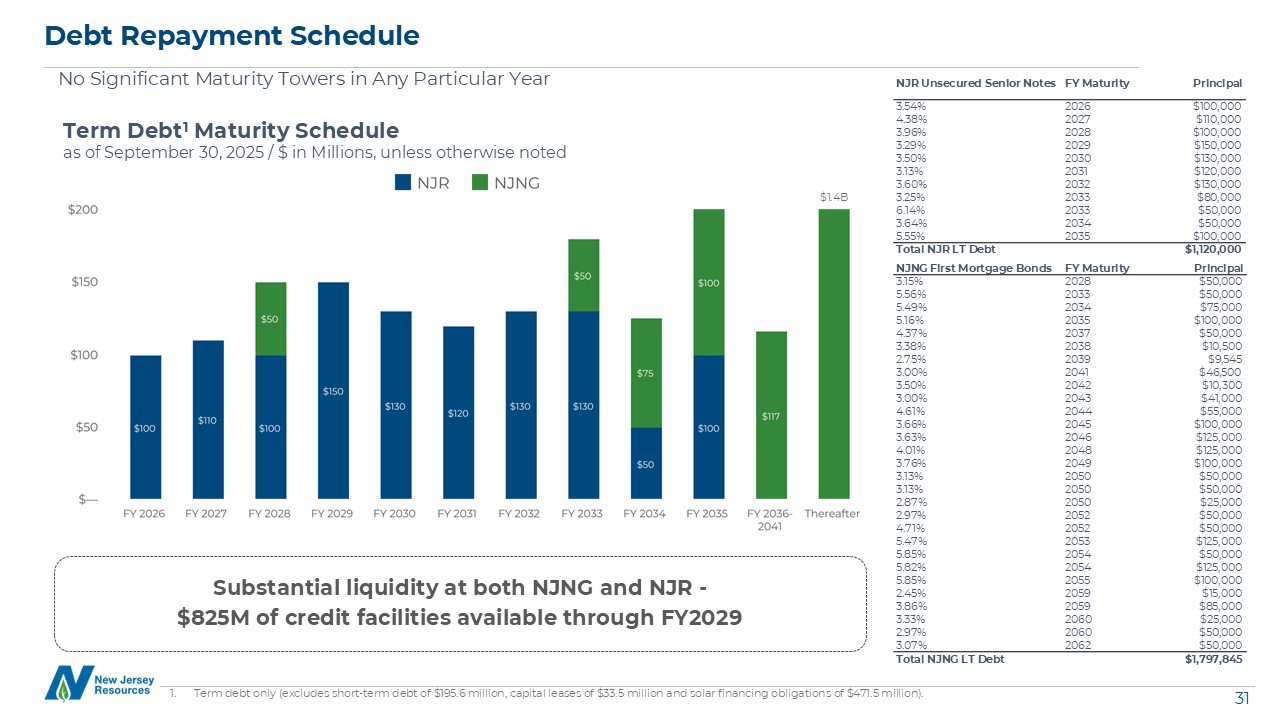
Debt Repayment Schedule No Significant Maturity Towers in Any Particular Year Term debt only
(excludes short-term debt of $195.6 million, capital leases of $33.5 million and solar financing obligations of $471.5 million). NJR Unsecured Senior Notes FY Maturity Principal 3.54% 2026 $100,000 4.38% 2027 $110,000
3.96% 2028 $100,000 3.29% 2029 $150,000 3.50% 2030 $130,000 3.13% 2031 $120,000 3.60% 2032 $130,000 3.25% 2033 $80,000 6.14% 2033 $50,000 3.64% 2034 $50,000 5.55% 2035 $100,000 Total NJR LT Debt
$1,120,000 NJNG First Mortgage Bonds FY Maturity Principal 3.15% 2028 $50,000 5.56% 2033 $50,000 5.49% 2034 $75,000 5.16% 2035 $100,000 4.37% 2037 $50,000 3.38% 2038 $10,500 2.75% 2039 $9,545
3.00% 2041 $46,500 3.50% 2042 $10,300 3.00% 2043 $41,000 4.61% 2044 $55,000 3.66% 2045 $100,000 3.63% 2046 $125,000 4.01% 2048 $125,000 3.76% 2049 $100,000 3.13% 2050 $50,000 3.13% 2050 $50,000
2.87% 2050 $25,000 2.97% 2052 $50,000 4.71% 2052 $50,000 5.47% 2053 $125,000 5.85% 2054 $50,000 5.82% 2054 $125,000 5.85% 2055 $100,000 2.45% 2059 $15,000 3.86% 2059 $85,000 3.33% 2060 $25,000
2.97% 2060 $50,000 3.07% 2062 $50,000 Total NJNG LT Debt $1,797,845 Substantial liquidity at both NJNG and NJR - $825M of credit facilities available through FY2029 Term Debt1 Maturity Schedule as of September 30, 2025 / $
in Millions, unless otherwise noted $1.4B
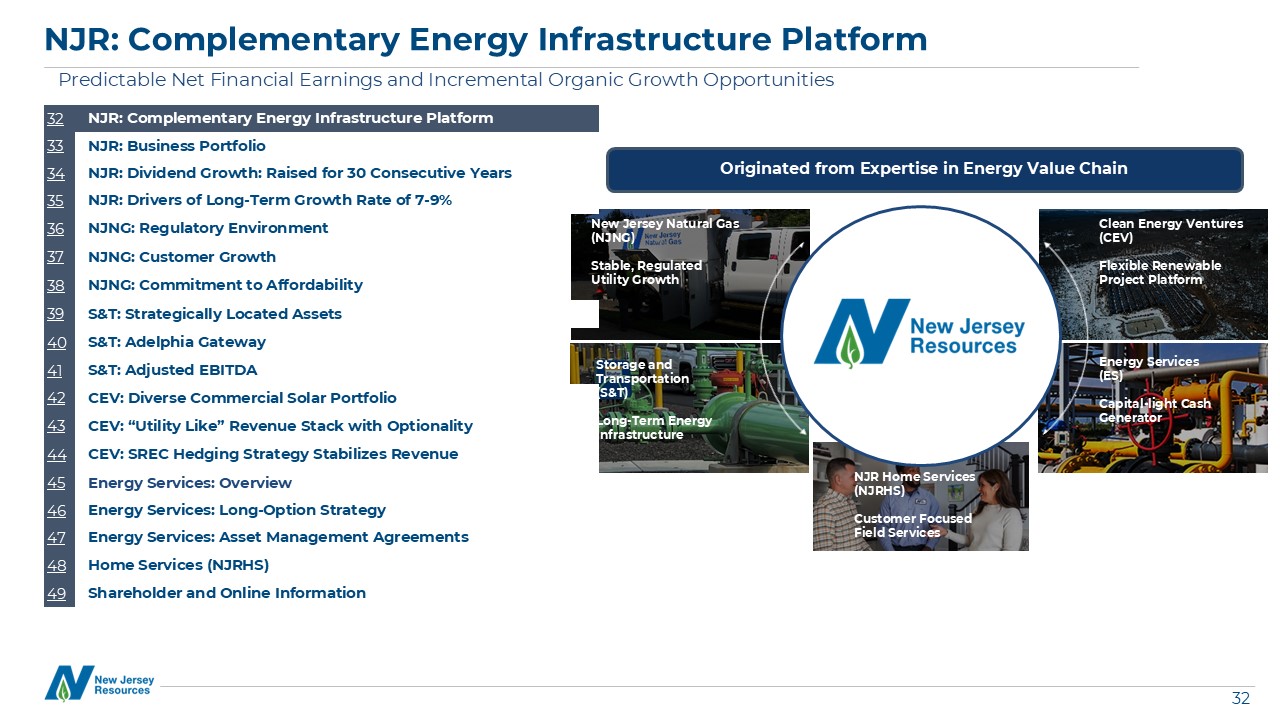
Originated from Expertise in Energy Value Chain Clean Energy Ventures (CEV) Flexible Renewable
Project Platform Storage and Transportation (S&T) Long-Term Energy Infrastructure Energy Services (ES) Capital-light Cash Generator NJR Home Services (NJRHS) Customer Focused Field Services New Jersey Natural Gas (NJNG) Stable,
Regulated Utility Growth NJR: Complementary Energy Infrastructure Platform Predictable Net Financial Earnings and Incremental Organic Growth Opportunities 32 NJR: Complementary Energy Infrastructure Platform 33 NJR: Business Portfolio
34 NJR: Dividend Growth: Raised for 30 Consecutive Years 35 NJR: Drivers of Long-Term Growth Rate of 7-9% 36 NJNG: Regulatory Environment 37 NJNG: Customer Growth 38 NJNG: Commitment to Affordability 39 S&T: Strategically
Located Assets 40 S&T: Adelphia Gateway 41 S&T: Adjusted EBITDA 42 CEV: Diverse Commercial Solar Portfolio 43 CEV: “Utility Like” Revenue Stack with Optionality 44 CEV: SREC Hedging Strategy Stabilizes Revenue 45 Energy
Services: Overview 46 Energy Services: Long-Option Strategy 47 Energy Services: Asset Management Agreements 48 Home Services (NJRHS) 49 Shareholder and Online Information
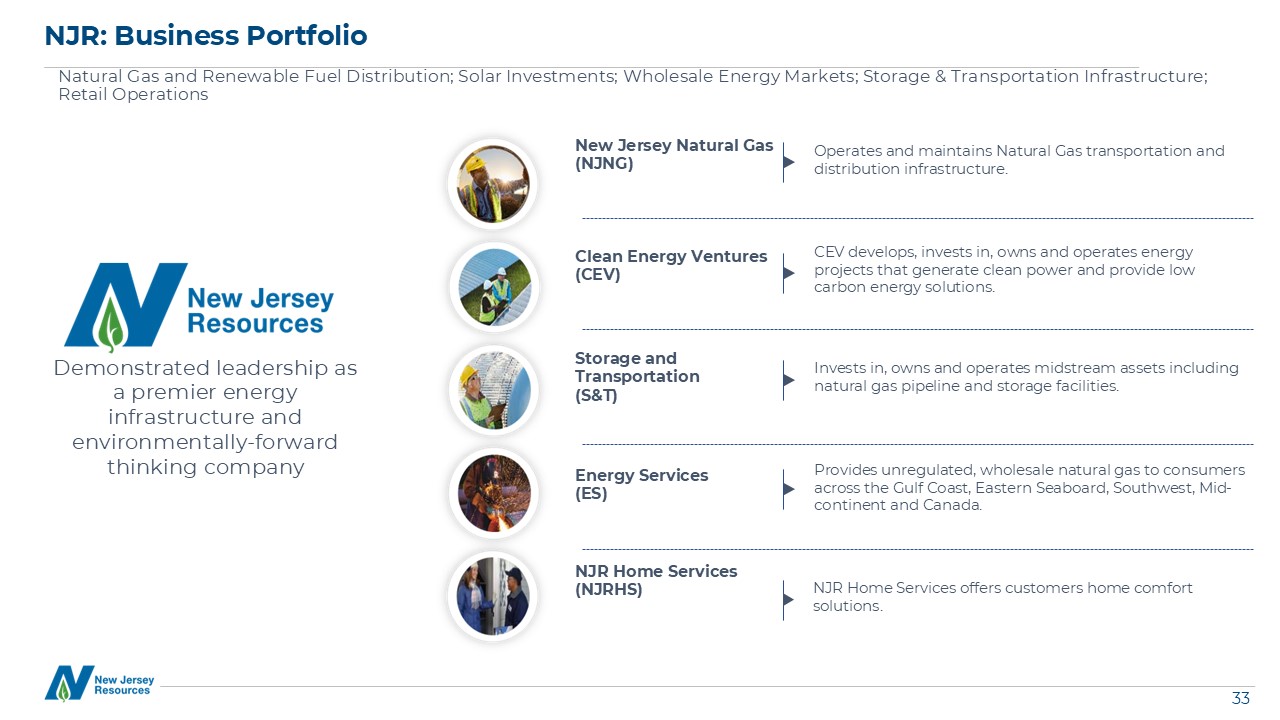
NJR Home Services offers customers home comfort solutions. NJR: Business Portfolio Natural Gas
and Renewable Fuel Distribution; Solar Investments; Wholesale Energy Markets; Storage & Transportation Infrastructure; Retail Operations Operates and maintains Natural Gas transportation and distribution infrastructure. New Jersey Natural
Gas (NJNG) Clean Energy Ventures (CEV) Storage and Transportation (S&T) Energy Services (ES) NJR Home Services (NJRHS) CEV develops, invests in, owns and operates energy projects that generate clean power and provide low carbon
energy solutions. Invests in, owns and operates midstream assets including natural gas pipeline and storage facilities. Provides unregulated, wholesale natural gas to consumers across the Gulf Coast, Eastern Seaboard, Southwest,
Mid-continent and Canada. Demonstrated leadership as a premier energy infrastructure and environmentally-forward thinking company
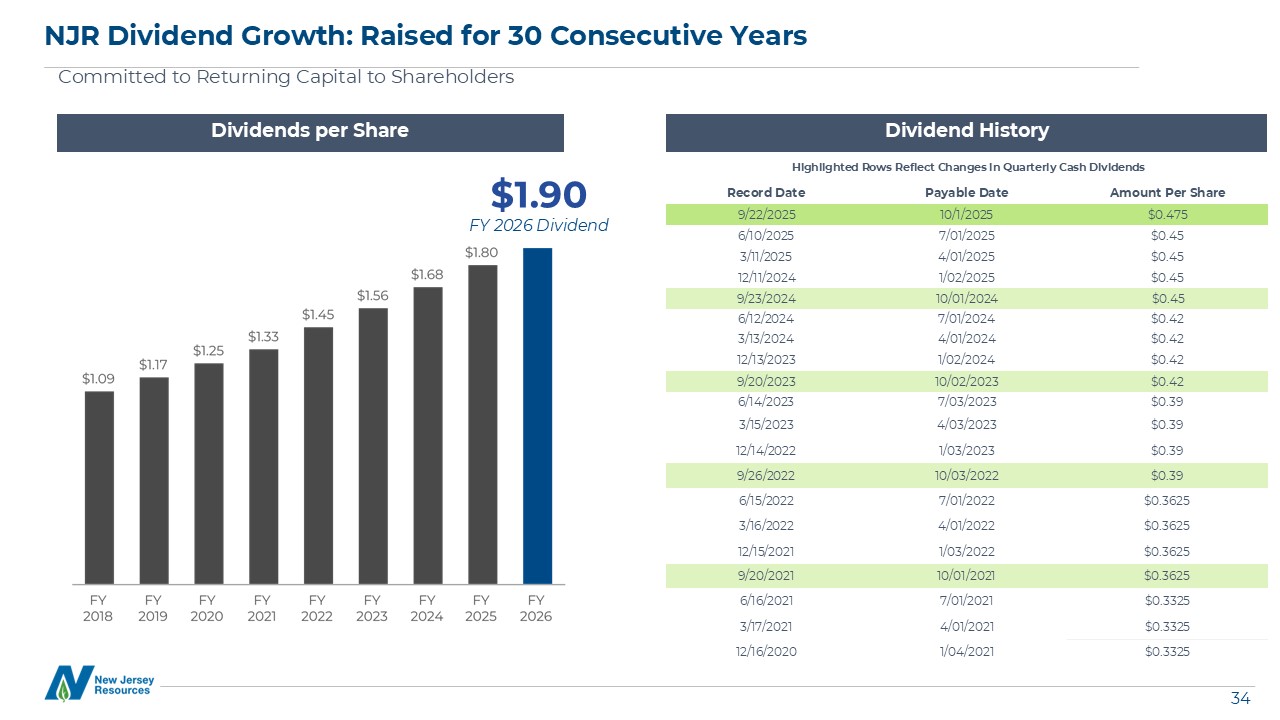
NJR Dividend Growth: Raised for 30 Consecutive Years Committed to Returning Capital to
Shareholders Dividend History Dividends per Share Record Date Payable Date Amount Per
Share 9/22/2025 10/1/2025 $0.475 6/10/2025 7/01/2025 $0.45 3/11/2025 4/01/2025 $0.45 12/11/2024 1/02/2025 $0.45 9/23/2024 10/01/2024 $0.45 6/12/2024 7/01/2024 $0.42 3/13/2024 4/01/2024 $0.42 12/13/2023 1/02/2024 $0.42 9/20/2023 10/02/2023 $0.42 6/14/2023 7/03/2023 $0.39 3/15/2023 4/03/2023 $0.39 12/14/2022 1/03/2023 $0.39 9/26/2022 10/03/2022 $0.39 6/15/2022 7/01/2022 $0.3625 3/16/2022 4/01/2022 $0.3625 12/15/2021 1/03/2022 $0.3625 9/20/2021 10/01/2021 $0.3625 6/16/2021 7/01/2021 $0.3325 3/17/2021 4/01/2021 $0.3325 12/16/2020 1/04/2021 $0.3325 Highlighted
Rows Reflect Changes in Quarterly Cash Dividends $1.90 FY 2026 Dividend
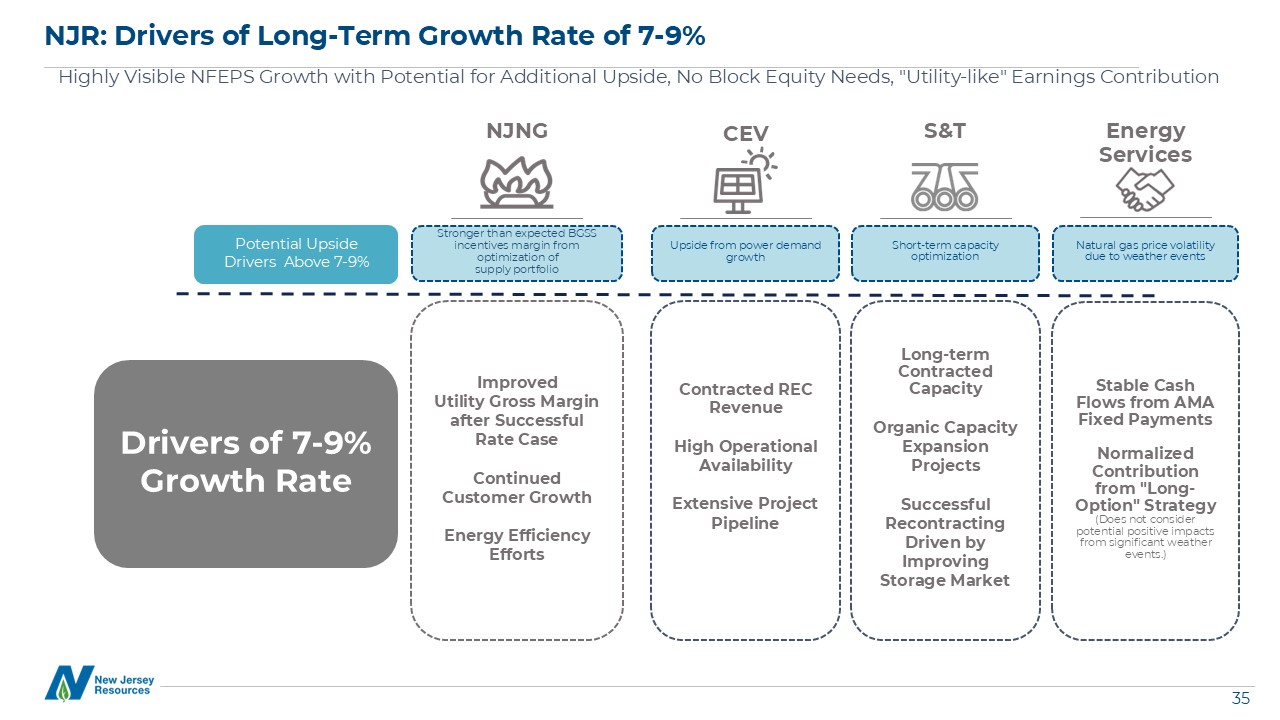
NJR: Drivers of Long-Term Growth Rate of 7-9% Highly Visible NFEPS Growth with Potential for
Additional Upside, No Block Equity Needs, “Utility-like” Earnings Contribution NJNG CEV S&T Energy Services Improved Utility Gross Margin after Successful Rate Case Continued Customer Growth Energy Efficiency Efforts Drivers of
7-9% Growth Rate Potential Upside Drivers Above 7-9% Contracted REC Revenue High Operational Availability Extensive Project Pipeline Stronger than expected BGSS incentives margin from optimization of supply portfolio Upside from
power demand growth Long-term Contracted Capacity Organic Capacity Expansion Projects Successful Recontracting Driven by Improving Storage Market Short-term capacity optimization Stable Cash Flows from AMA Fixed Payments Normalized
Contribution from “Long-Option” Strategy (Does not consider potential positive impacts from significant weather events.) Natural gas price volatility due to weather events
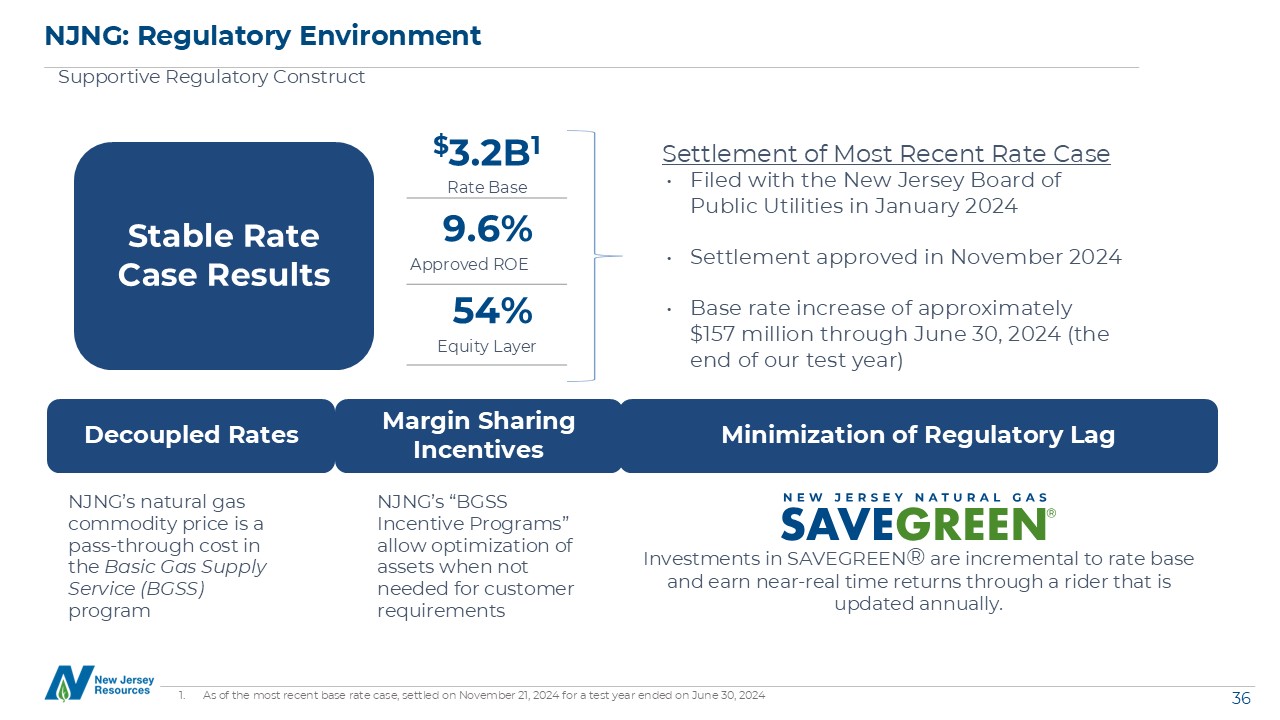
NJNG: Regulatory Environment $3.2B1 Rate Base 9.6% Approved ROE As of the most recent base rate
case, settled on November 21, 2024 for a test year ended on June 30, 2024 54% Equity Layer Supportive Regulatory Construct Stable Rate Case Results Decoupled Rates Minimization of Regulatory Lag Margin Sharing Incentives Filed with the
New Jersey Board of Public Utilities in January 2024 Settlement approved in November 2024 Base rate increase of approximately $157 million through June 30, 2024 (the end of our test year) Settlement of Most Recent Rate Case Investments in
SAVEGREEN® are incremental to rate base and earn near-real time returns through a rider that is updated annually. NJNG’s natural gas commodity price is a pass-through cost in the Basic Gas Supply Service (BGSS) program NJNG’s “BGSS Incentive
Programs” allow optimization of assets when not needed for customer requirements
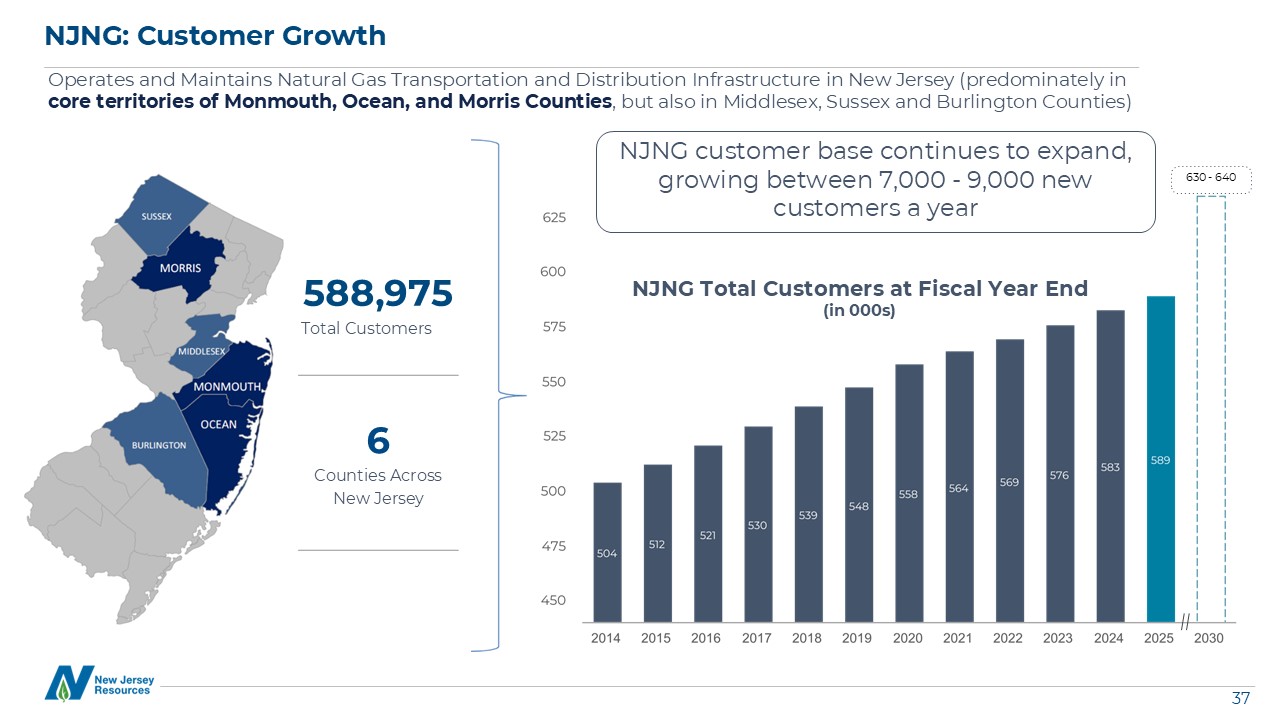
NJNG: Customer Growth Operates and Maintains Natural Gas Transportation and Distribution
Infrastructure in New Jersey (predominately in core territories of Monmouth, Ocean, and Morris Counties, but also in Middlesex, Sussex and Burlington Counties) 588,975 Total Customers 6 Counties Across New Jersey NJNG Total Customers
at Fiscal Year End (in 000s) 630 - 640 NJNG customer base continues to expand, growing between 7,000 - 9,000 new customers a year
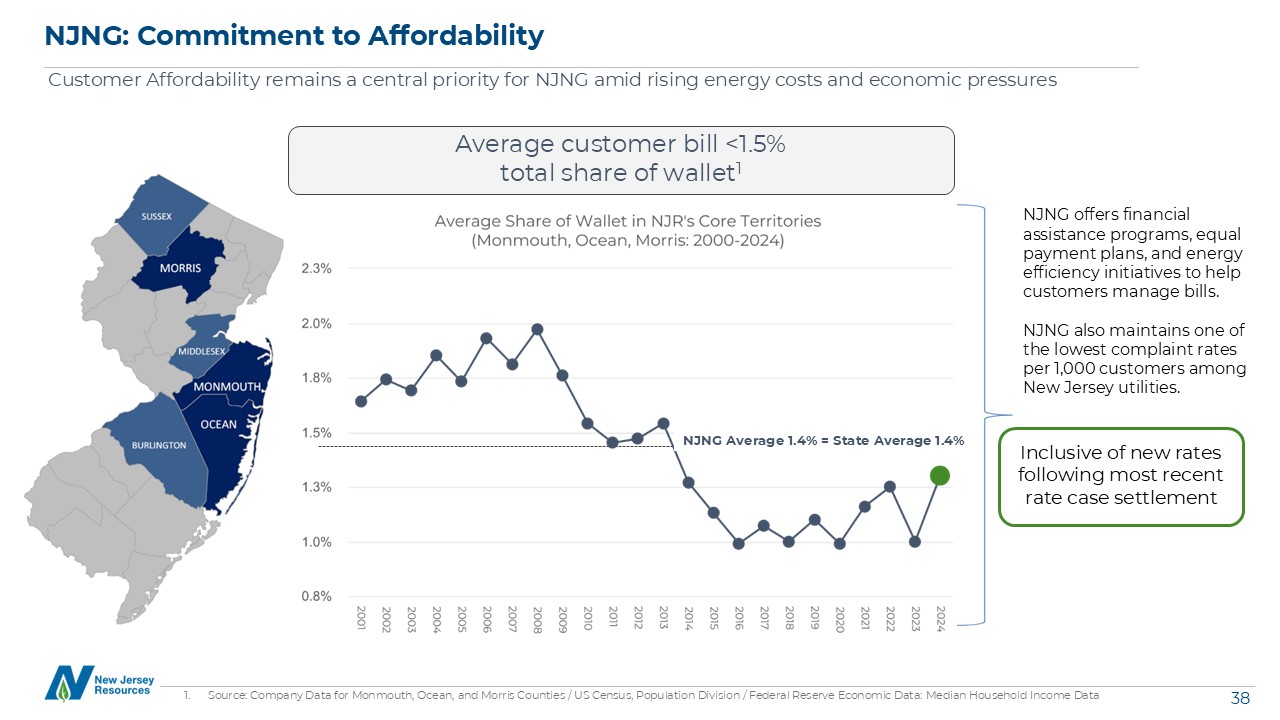
NJNG: Commitment to Affordability Customer Affordability remains a central priority for NJNG amid
rising energy costs and economic pressures Average customer bill <1.5% total share of wallet1 NJNG offers financial assistance programs, equal payment plans, and energy efficiency initiatives to help customers manage bills. NJNG also
maintains one of the lowest complaint rates per 1,000 customers among New Jersey utilities. NJNG Average 1.4% = State Average 1.4% Source: Company Data for Monmouth, Ocean, and Morris Counties / US Census, Population Division / Federal
Reserve Economic Data: Median Household Income Data Inclusive of new rates following most recent rate case settlement
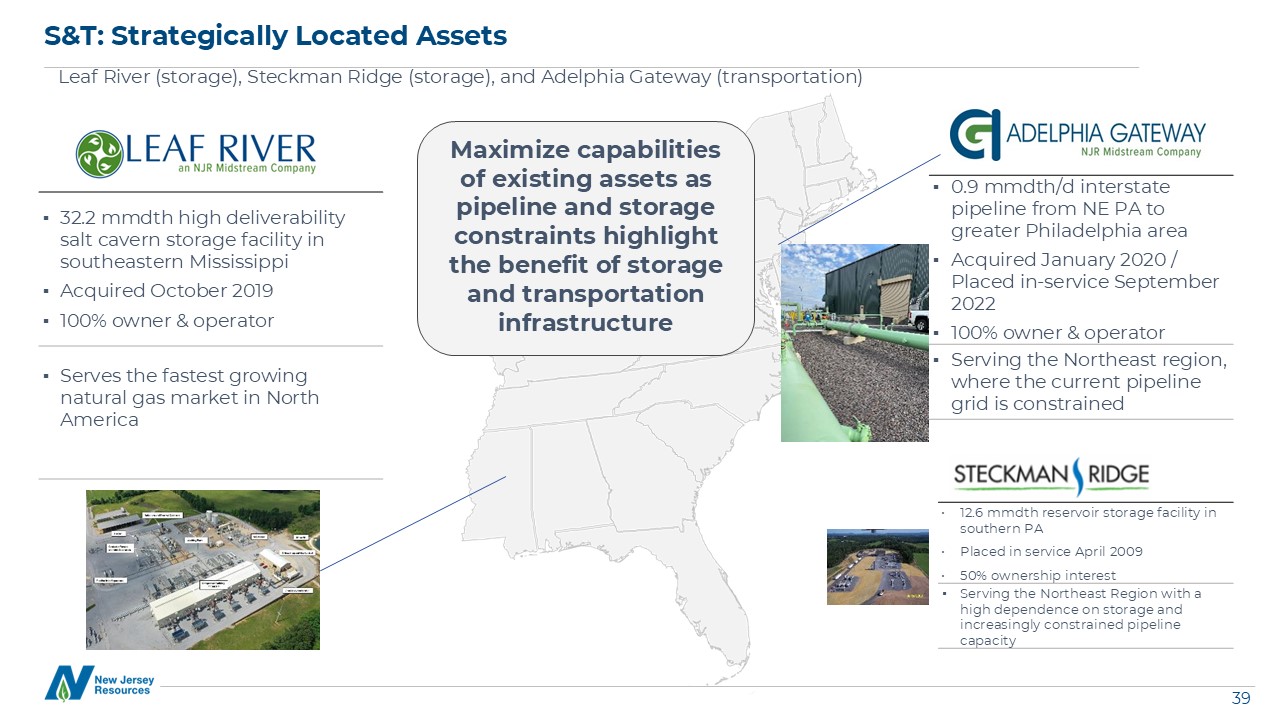
S&T: Strategically Located Assets Leaf River (storage), Steckman Ridge (storage), and Adelphia
Gateway (transportation) 32.2 mmdth high deliverability salt cavern storage facility in southeastern Mississippi Acquired October 2019 100% owner & operator Serves the fastest growing natural gas market in North America 12.6 mmdth
reservoir storage facility in southern PA Placed in service April 2009 50% ownership interest Serving the Northeast Region with a high dependence on storage and increasingly constrained pipeline capacity 0.9 mmdth/d interstate pipeline from
NE PA to greater Philadelphia area Acquired January 2020 / Placed in-service September 2022 100% owner & operator Serving the Northeast region, where the current pipeline grid is constrained Maximize capabilities of existing assets as
pipeline and storage constraints highlight the benefit of storage and transportation infrastructure
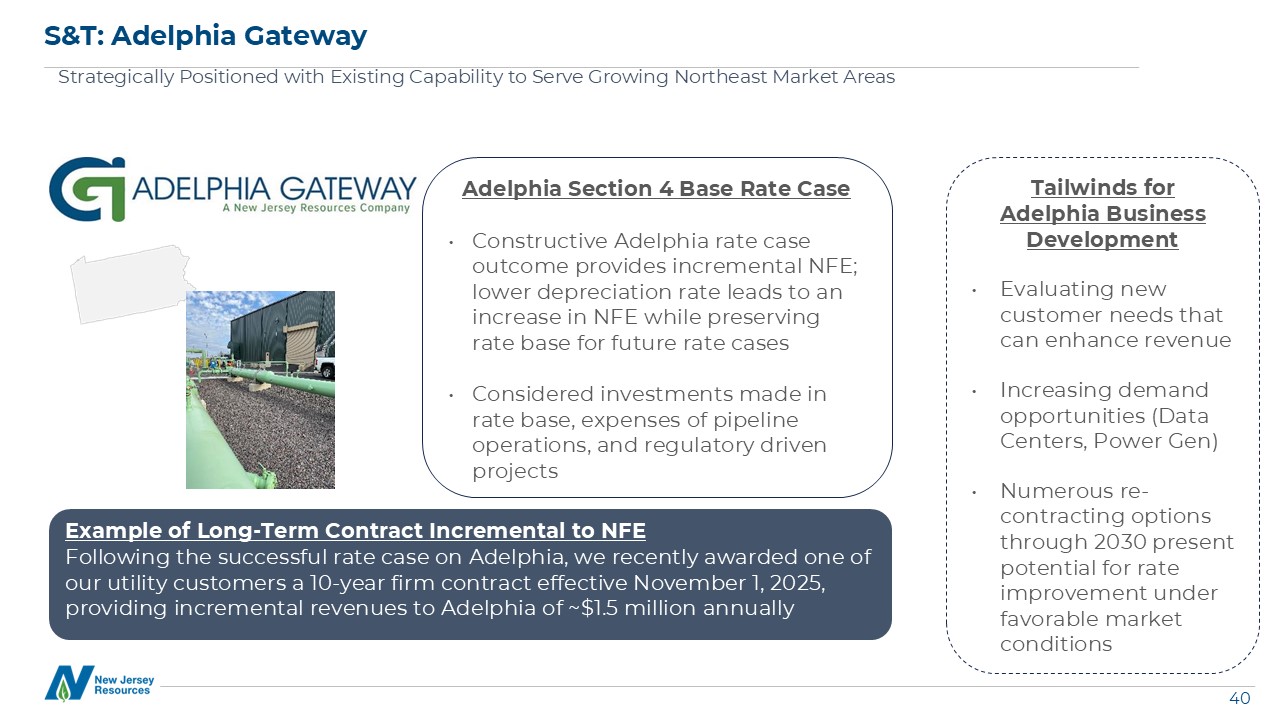
S&T: Adelphia Gateway Strategically Positioned with Existing Capability to Serve Growing
Northeast Market Areas Adelphia Section 4 Base Rate Case Constructive Adelphia rate case outcome provides incremental NFE; lower depreciation rate leads to an increase in NFE while preserving rate base for future rate cases Considered
investments made in rate base, expenses of pipeline operations, and regulatory driven projects Tailwinds for Adelphia Business Development Evaluating new customer needs that can enhance revenue Increasing demand opportunities (Data
Centers, Power Gen) Numerous re-contracting options through 2030 present potential for rate improvement under favorable market conditions Example of Long-Term Contract Incremental to NFE Following the successful rate case on Adelphia, we
recently awarded one of our utility customers a 10-year firm contract effective November 1, 2025, providing incremental revenues to Adelphia of ~$1.5 million annually
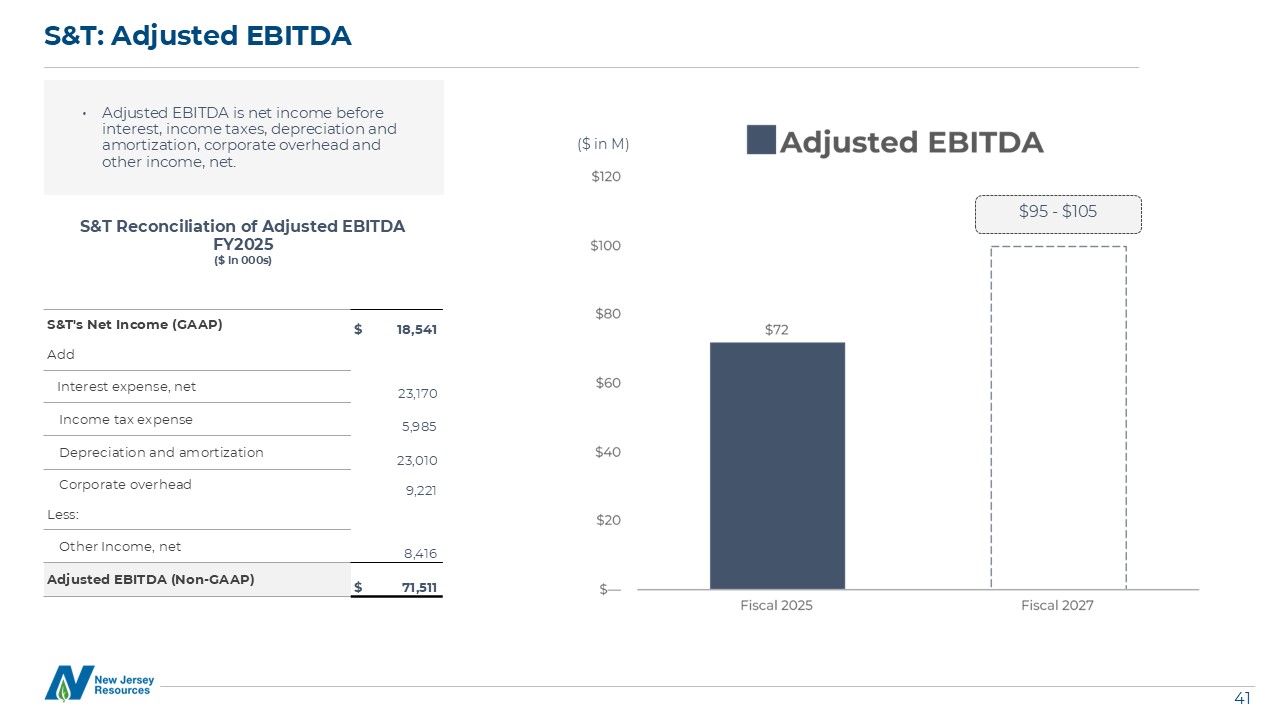
S&T: Adjusted EBITDA Adjusted EBITDA is net income before interest, income taxes, depreciation
and amortization, corporate overhead and other income, net. S&T’s Net Income (GAAP) $ 18,541 Add Interest expense, net 23,170 Income tax expense 5,985 Depreciation and amortization 23,010 Corporate overhead 9,221
Less: Other Income, net 8,416 Adjusted EBITDA (Non-GAAP) $ 71,511 S&T Reconciliation of Adjusted EBITDA FY2025 ($ in 000s) ($ in M) $95 - $105
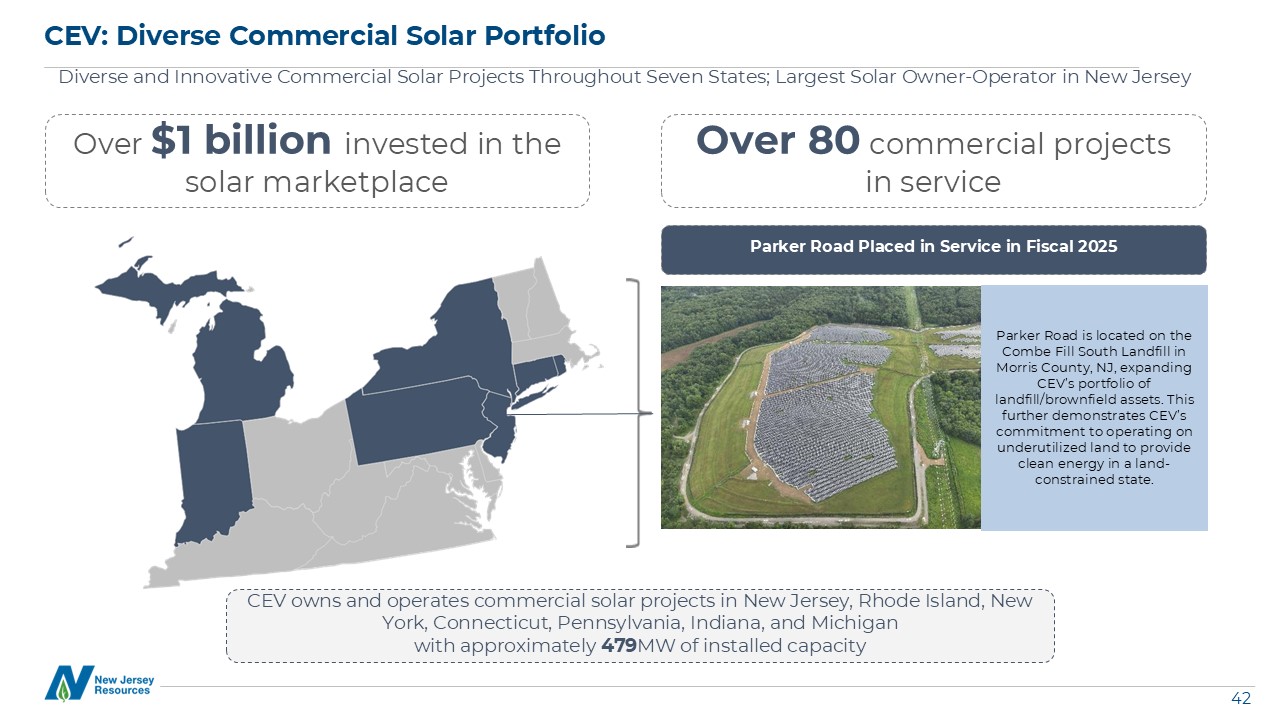
CEV: Diverse Commercial Solar Portfolio Diverse and Innovative Commercial Solar Projects Throughout
Seven States; Largest Solar Owner-Operator in New Jersey CEV owns and operates commercial solar projects in New Jersey, Rhode Island, New York, Connecticut, Pennsylvania, Indiana, and Michigan with approximately 479MW of installed capacity
Over $1 billion invested in the solar marketplace Over 80 commercial projects in service Parker Road Placed in Service in Fiscal 2025 Parker Road is located on the Combe Fill South Landfill in Morris County, NJ, expanding CEV’s
portfolio of landfill/brownfield assets. This further demonstrates CEV’s commitment to operating on underutilized land to provide clean energy in a land-constrained state.
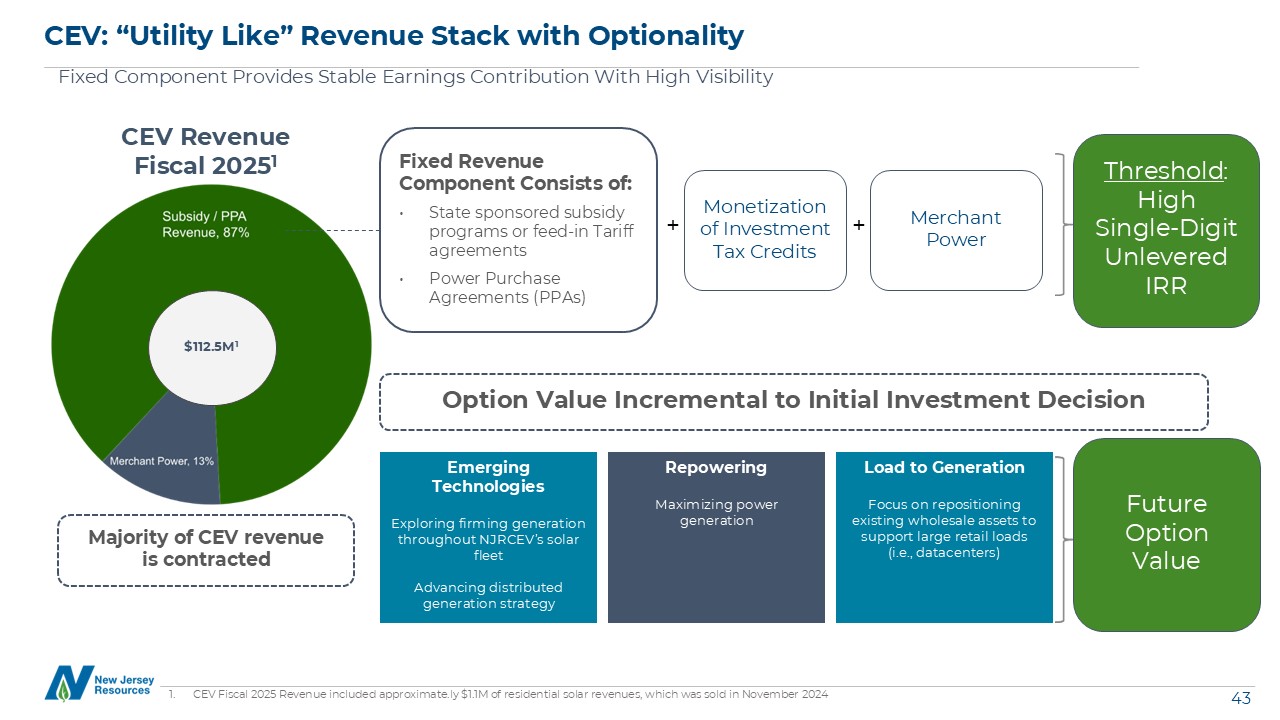
CEV: “Utility Like” Revenue Stack with Optionality Fixed Component Provides Stable Earnings
Contribution With High Visibility CEV Revenue Fiscal 20251 Majority of CEV revenue is contracted Fixed Revenue Component Consists of: State sponsored subsidy programs or feed-in Tariff agreements Power Purchase Agreements (PPAs) CEV
Fiscal 2025 Revenue included approximate.ly $1.1M of residential solar revenues, which was sold in November 2024 Monetization of Investment Tax Credits Merchant Power Threshold: High Single-Digit Unlevered IRR + + Option Value
Incremental to Initial Investment Decision Emerging Technologies Exploring firming generation throughout NJRCEV’s solar fleet Advancing distributed generation strategy Repowering Maximizing power generation Future Option Value Load to
Generation Focus on repositioning existing wholesale assets to support large retail loads (i.e., datacenters) $112.5M1
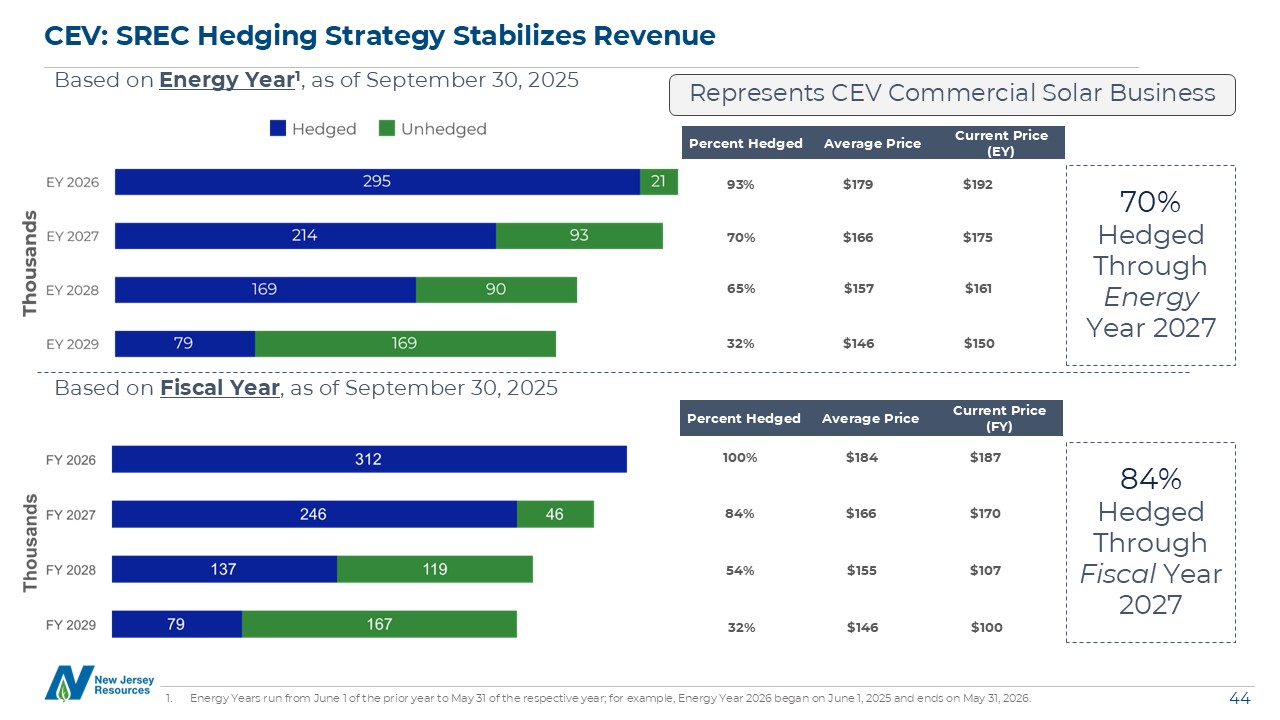
CEV: SREC Hedging Strategy Stabilizes Revenue Based on Energy Year1, as of September 30,
2025 Energy Years run from June 1 of the prior year to May 31 of the respective year; for example, Energy Year 2026 began on June 1, 2025 and ends on May 31, 2026. Based on Fiscal Year, as of September 30, 2025 84% Hedged Through Fiscal
Year 2027 70% Hedged Through Energy Year 2027 Percent Hedged Average Price Current Price (EY) 93% $179 $192 70% $166 $175 65% $157 $161 32% $146 $150 Percent Hedged Average Price Current Price
(FY) 100% $184 $187 84% $166 $170 54% $155 $107 32% $146 $100 Represents CEV Commercial Solar Business
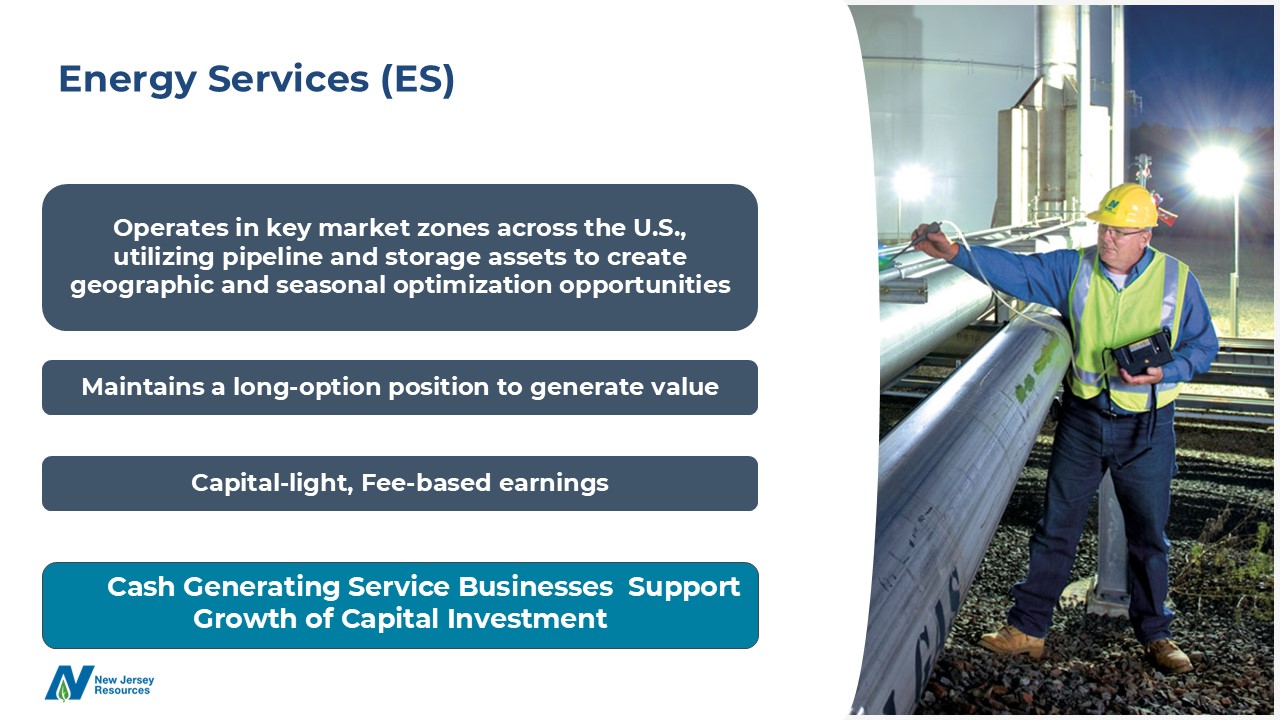
45 45 Energy Services (ES) Operates in key market zones across the U.S., utilizing pipeline and
storage assets to create geographic and seasonal optimization opportunities Maintains a long-option position to generate value Capital-light, Fee-based earnings Cash Generating Service Businesses Support Growth of Capital Investment
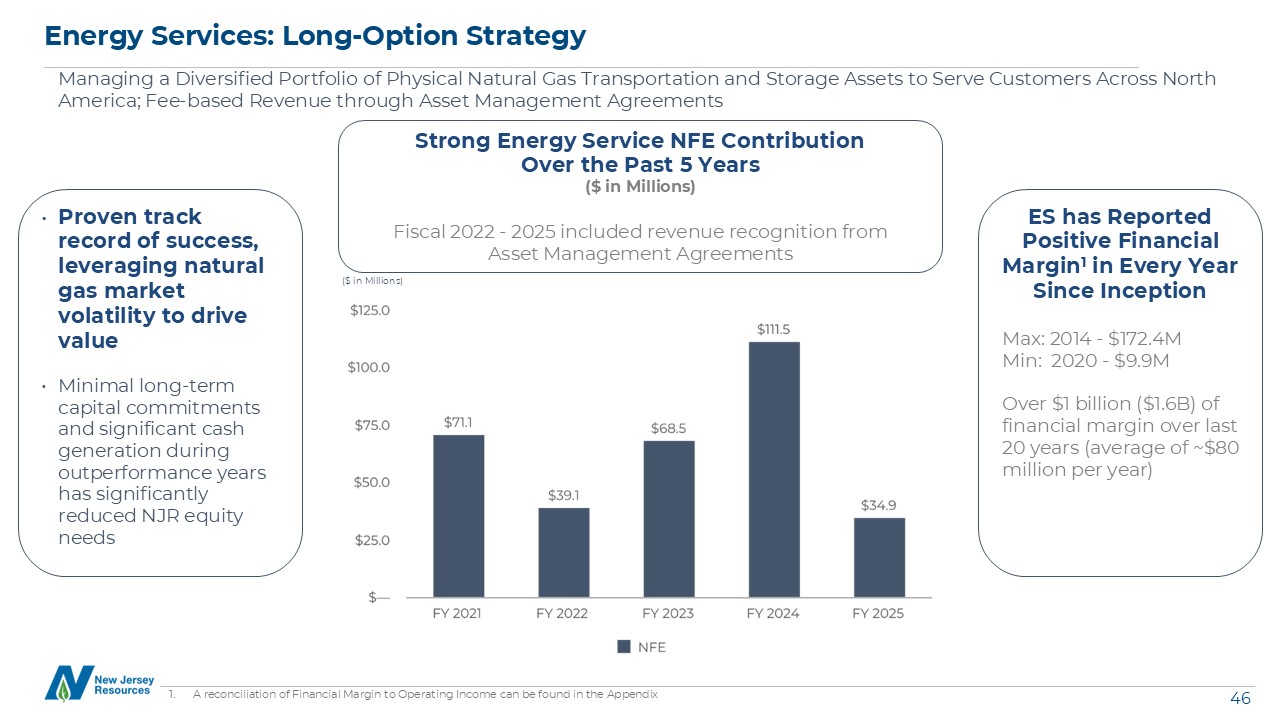
Energy Services: Long-Option Strategy Managing a Diversified Portfolio of Physical Natural Gas
Transportation and Storage Assets to Serve Customers Across North America; Fee-based Revenue through Asset Management Agreements Proven track record of success, leveraging natural gas market volatility to drive value Minimal long-term
capital commitments and significant cash generation during outperformance years has significantly reduced NJR equity needs A reconciliation of Financial Margin to Operating Income can be found in the Appendix Strong Energy Service NFE
Contribution Over the Past 5 Years ($ in Millions) Fiscal 2022 - 2025 included revenue recognition from Asset Management Agreements ES has Reported Positive Financial Margin1 in Every Year Since Inception Max: 2014 - $172.4M Min: 2020
- $9.9M Over $1 billion ($1.6B) of financial margin over last 20 years (average of ~$80 million per year) ($ in Millions)
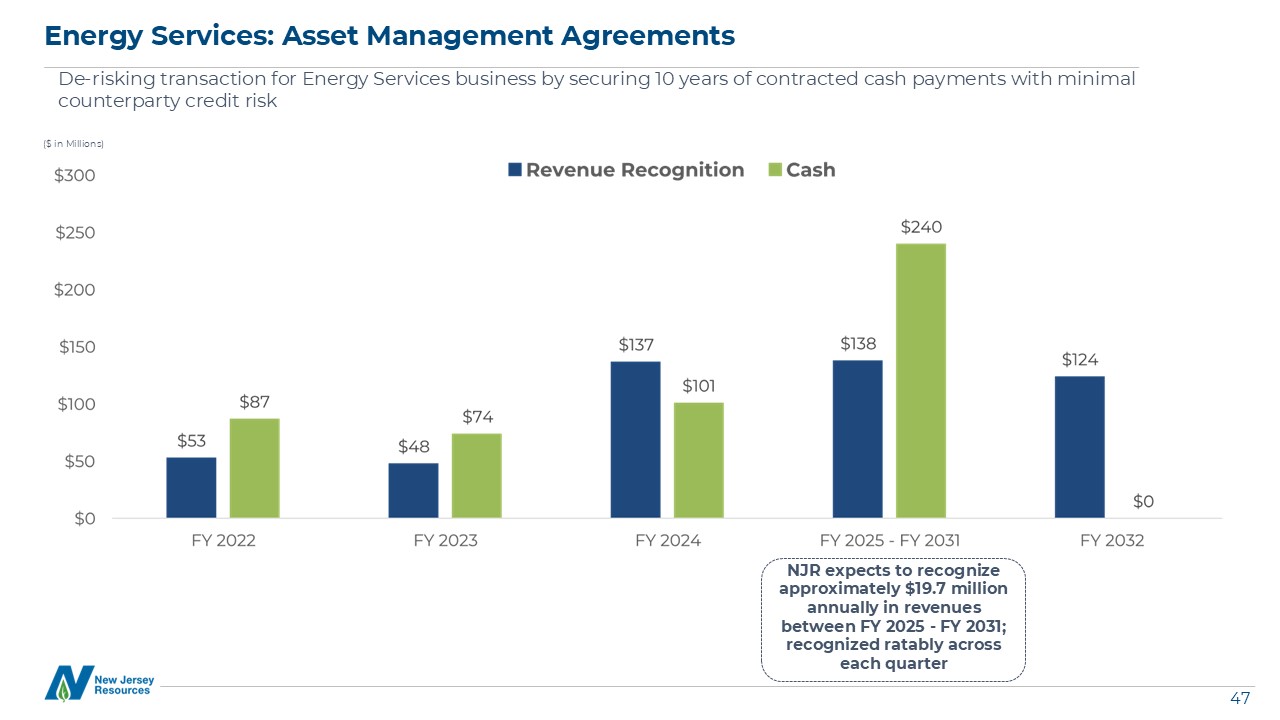
Energy Services: Asset Management Agreements De-risking transaction for Energy Services business
by securing 10 years of contracted cash payments with minimal counterparty credit risk NJR expects to recognize approximately $19.7 million annually in revenues between FY 2025 - FY 2031; recognized ratably across each quarter ($ in
Millions)

Home Services (NJRHS) Delivering Home Comfort Solutions ~ 150 licensed technicians, installers,
plumbers, electricians and skilled workers Provides residential service contracts for heating, cooling, water heating, electrical and standby generators Equipment sales and installations, solar lease and purchase plans, plumbing and
electrical services and repairs and indoor air quality products Ruud Top Twenty Pro Partner Contractor for the 9th consecutive year Completed 79,000 service calls and 4,000 HVAC, plumbing and generator installations in Fiscal 2025 Maintains
a nearly five-star customer satisfaction rating* * Rating determined by Shopper Approved. See njrhomeservices.com/reviews for more information. Celebrating its 25th Anniversary! Cash Generating Service Businesses Support Growth of Capital
Investment
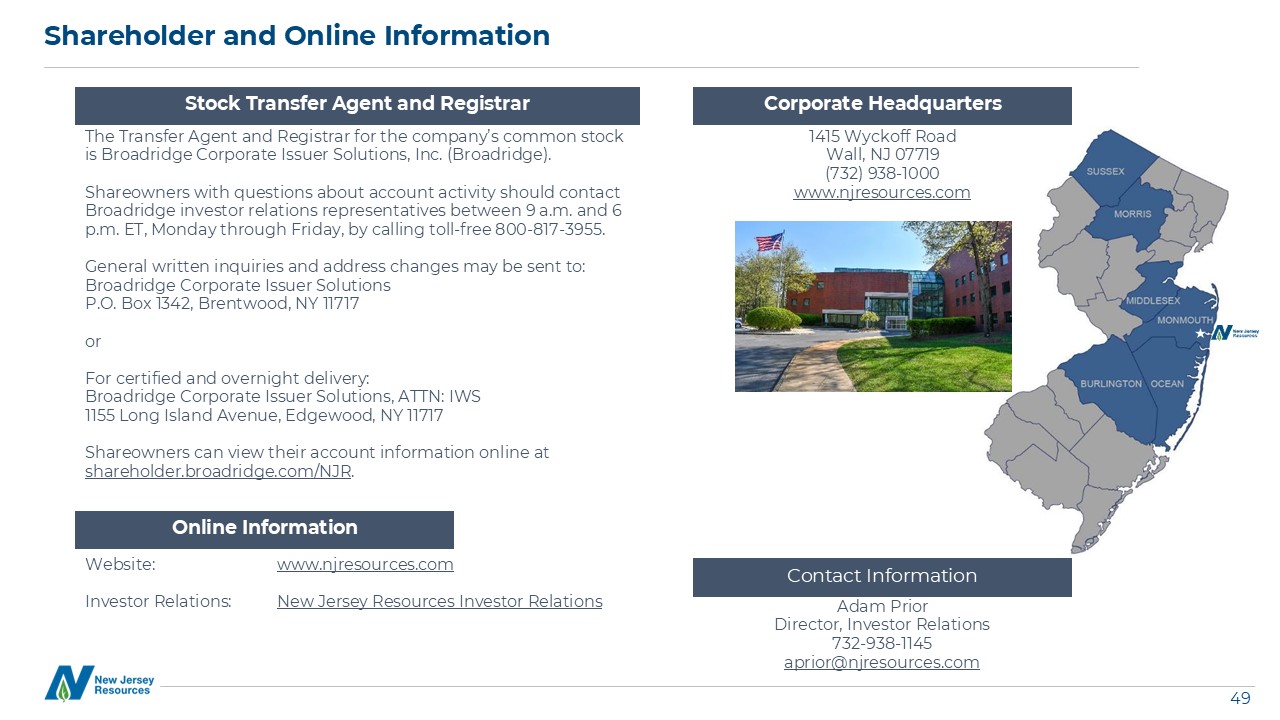
The Transfer Agent and Registrar for the company’s common stock is Broadridge Corporate Issuer
Solutions, Inc. (Broadridge). Shareowners with questions about account activity should contact Broadridge investor relations representatives between 9 a.m. and 6 p.m. ET, Monday through Friday, by calling toll-free 800-817-3955. General
written inquiries and address changes may be sent to: Broadridge Corporate Issuer Solutions P.O. Box 1342, Brentwood, NY 11717 or For certified and overnight delivery: Broadridge Corporate Issuer Solutions, ATTN: IWS 1155 Long Island
Avenue, Edgewood, NY 11717 Shareowners can view their account information online at shareholder.broadridge.com/NJR. Website: www.njresources.com Investor Relations: New Jersey Resources Investor Relations Contact Information Adam
Prior Director, Investor Relations 732-938-1145 aprior@njresources.com 1415 Wyckoff Road Wall, NJ 07719 (732) 938-1000 www.njresources.com Corporate Headquarters Online Information Shareholder and Online Information Stock Transfer
Agent and Registrar