| 1 Loan Portfolio Disclosures AS OF SEPTEMBER 30, 2025 .2 |
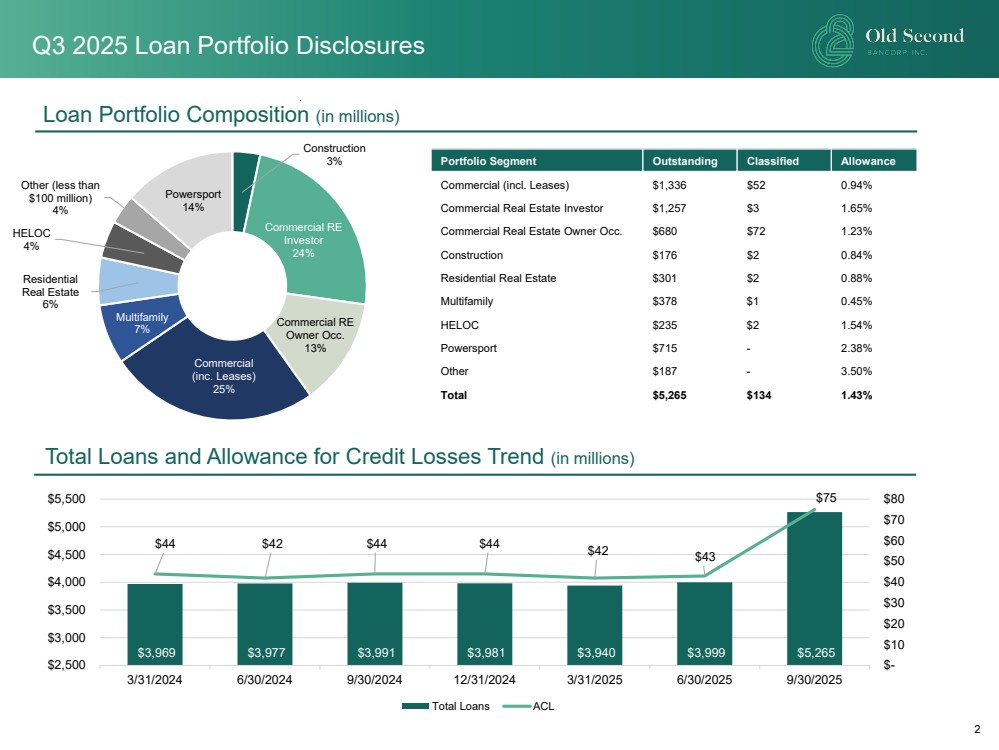
| 2 Portfolio Segment Outstanding Classified Allowance Commercial (incl. Leases) $1,336 $52 0.94% Commercial Real Estate Investor $1,257 $3 1.65% Commercial Real Estate Owner Occ. $680 $72 1.23% Construction $176 $2 0.84% Residential Real Estate $301 $2 0.88% Multifamily $378 $1 0.45% HELOC $235 $2 1.54% Powersport $715 - 2.38% Other $187 - 3.50% Total $5,265 $134 1.43% Construction 3% Commercial RE Investor 24% Commercial RE Owner Occ. 13% Commercial (inc. Leases) 25% Multifamily 7% Residential Real Estate 6% HELOC 4% Other (less than $100 million) 4% Powersport 14% Loan Portfolio Composition (in millions) Q3 2025 Loan Portfolio Disclosures Total Loans and Allowance for Credit Losses Trend (in millions) $3,969 $3,977 $3,991 $3,981 $3,940 $3,999 $5,265 $44 $42 $44 $44 $42 $43 $75 $- $10 $20 $30 $40 $50 $60 $70 $80 $2,500 $3,000 $3,500 $4,000 $4,500 $5,000 $5,500 3/31/2024 6/30/2024 9/30/2024 12/31/2024 3/31/2025 6/30/2025 9/30/2025 Total Loans ACL |
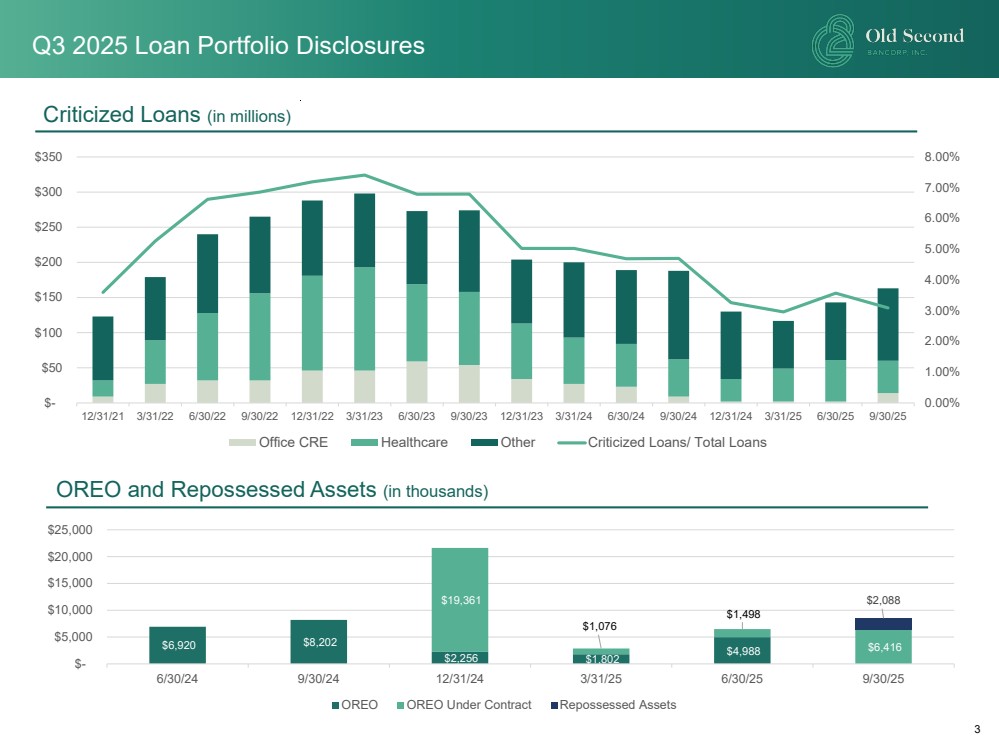
| 3 Criticized Loans (in millions) 0.00% 1.00% 2.00% 3.00% 4.00% 5.00% 6.00% 7.00% 8.00% $- $50 $100 $150 $200 $250 $300 $350 12/31/21 3/31/22 6/30/22 9/30/22 12/31/22 3/31/23 6/30/23 9/30/23 12/31/23 3/31/24 6/30/24 9/30/24 12/31/24 3/31/25 6/30/25 9/30/25 Office CRE Healthcare Other Criticized Loans/ Total Loans Q3 2025 Loan Portfolio Disclosures $6,920 $8,202 $2,256 $1,802 $4,988 $19,361 $1,076 $1,498 $6,416 $2,088 $- $5,000 $10,000 $15,000 $20,000 $25,000 6/30/24 9/30/24 12/31/24 3/31/25 6/30/25 9/30/25 OREO OREO Under Contract Repossessed Assets OREO and Repossessed Assets (in thousands) |
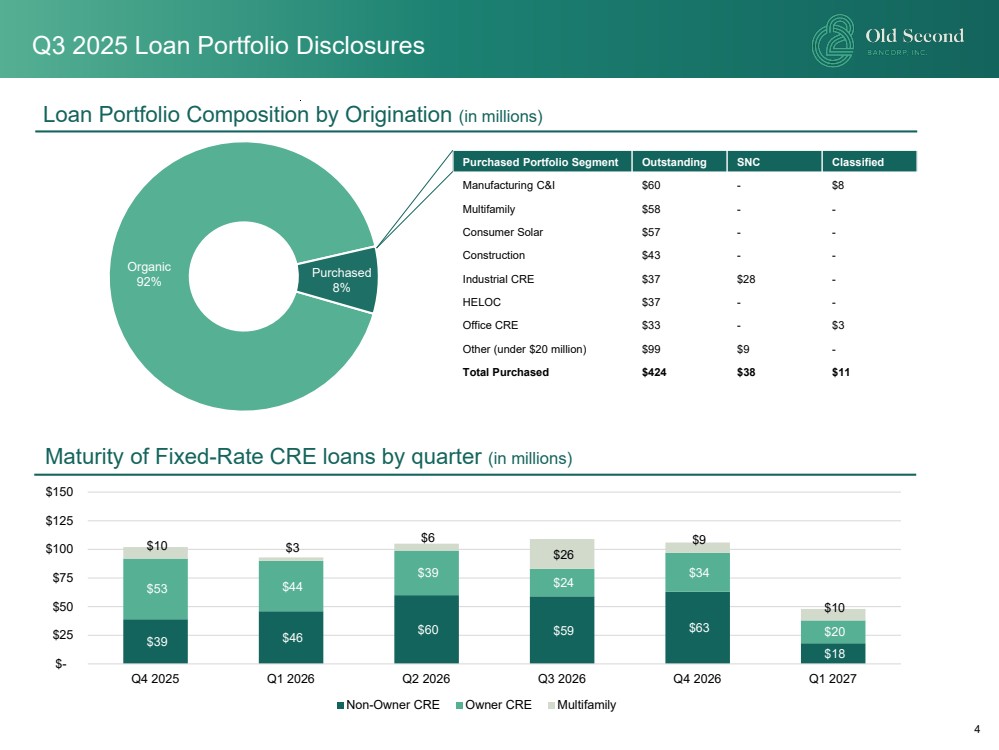
| 4 Loan Portfolio Composition by Origination (in millions) Maturity of Fixed-Rate CRE loans by quarter (in millions) Purchased Portfolio Segment Outstanding SNC Classified Manufacturing C&I $60 - $8 Multifamily $58 - - Consumer Solar $57 - - Construction $43 - - Industrial CRE $37 $28 - HELOC $37 - - Office CRE $33 - $3 Other (under $20 million) $99 $9 - Total Purchased $424 $38 $11 Organic 92% Purchased 8% $39 $46 $60 $59 $63 $18 $53 $44 $39 $24 $34 $20 $10 $3 $6 $26 $9 $10 $- $25 $50 $75 $100 $125 $150 Q4 2025 Q1 2026 Q2 2026 Q3 2026 Q4 2026 Q1 2027 Non-Owner CRE Owner CRE Multifamily Q3 2025 Loan Portfolio Disclosures |
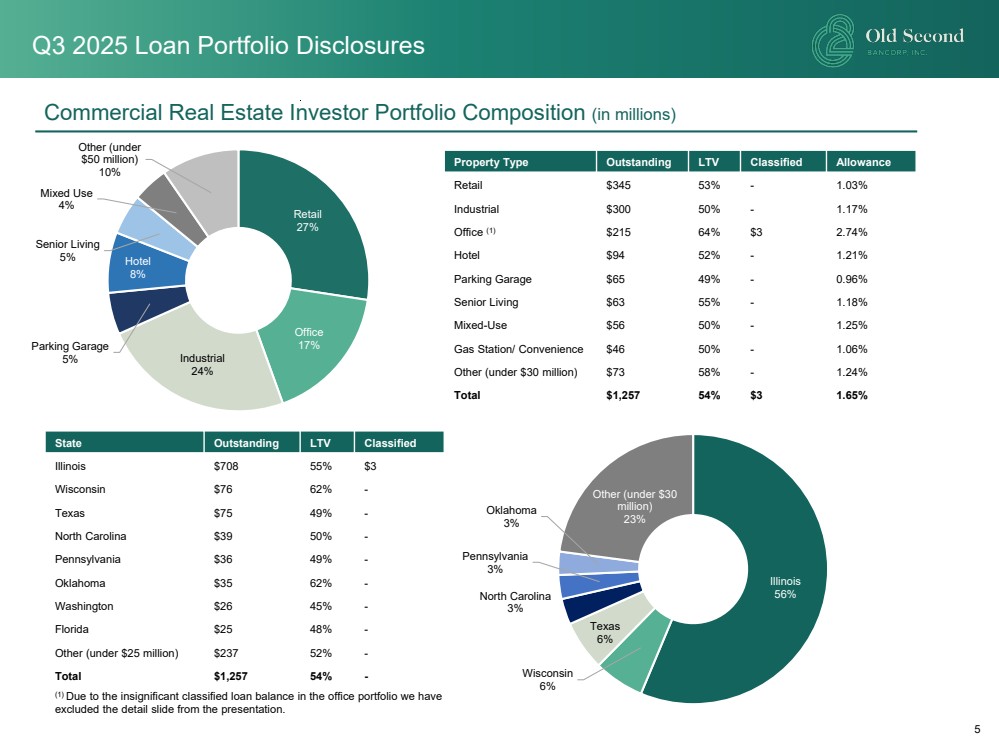
| 5 Property Type Outstanding LTV Classified Allowance Retail $345 53% - 1.03% Industrial $300 50% - 1.17% Office (1) $215 64% $3 2.74% Hotel $94 52% - 1.21% Parking Garage $65 49% - 0.96% Senior Living $63 55% - 1.18% Mixed-Use $56 50% - 1.25% Gas Station/ Convenience $46 50% - 1.06% Other (under $30 million) $73 58% - 1.24% Total $1,257 54% $3 1.65% Commercial Real Estate Investor Portfolio Composition (in millions) Retail 27% Office 17% Industrial 24% Parking Garage 5% Hotel 8% Senior Living 5% Mixed Use 4% Other (under $50 million) 10% Illinois 56% Wisconsin 6% Texas 6% North Carolina 3% Pennsylvania 3% Oklahoma 3% Other (under $30 million) 23% State Outstanding LTV Classified Illinois $708 55% $3 Wisconsin $76 62% - Texas $75 49% - North Carolina $39 50% - Pennsylvania $36 49% - Oklahoma $35 62% - Washington $26 45% - Florida $25 48% - Other (under $25 million) $237 52% - Total $1,257 54% - Q3 2025 Loan Portfolio Disclosures (1) Due to the insignificant classified loan balance in the office portfolio we have excluded the detail slide from the presentation. |
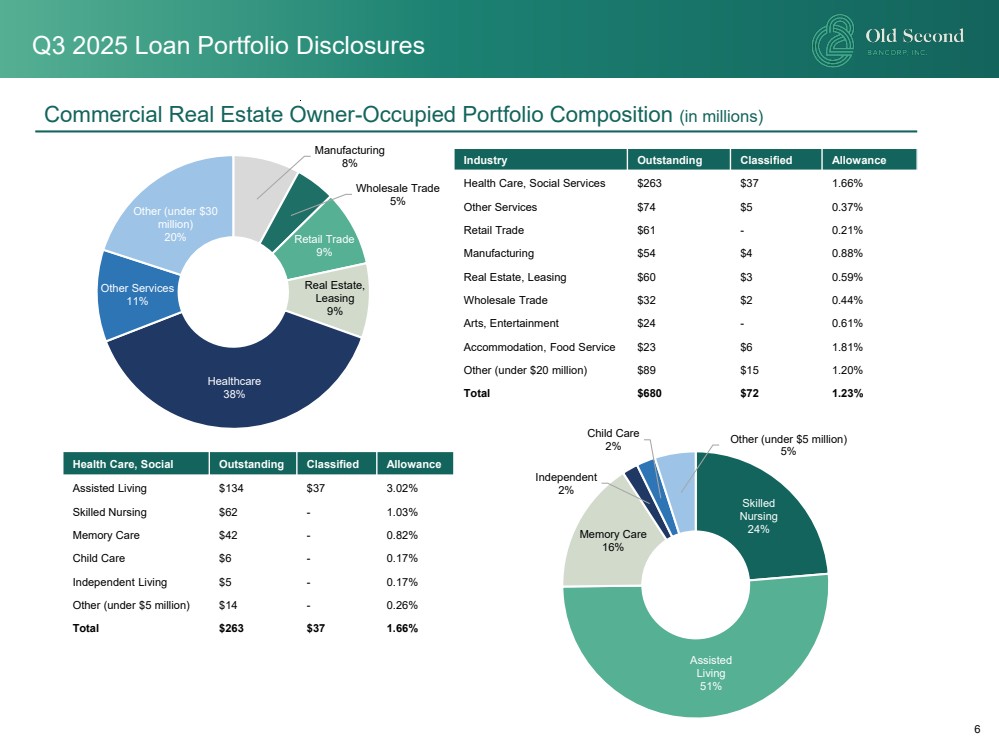
| 6 Industry Outstanding Classified Allowance Health Care, Social Services $263 $37 1.66% Other Services $74 $5 0.37% Retail Trade $61 - 0.21% Manufacturing $54 $4 0.88% Real Estate, Leasing $60 $3 0.59% Wholesale Trade $32 $2 0.44% Arts, Entertainment $24 - 0.61% Accommodation, Food Service $23 $6 1.81% Other (under $20 million) $89 $15 1.20% Total $680 $72 1.23% Manufacturing 8% Wholesale Trade 5% Retail Trade 9% Real Estate, Leasing 9% Healthcare 38% Other Services 11% Other (under $30 million) 20% Commercial Real Estate Owner-Occupied Portfolio Composition (in millions) Health Care, Social Outstanding Classified Allowance Assisted Living $134 $37 3.02% Skilled Nursing $62 - 1.03% Memory Care $42 - 0.82% Child Care $6 - 0.17% Independent Living $5 - 0.17% Other (under $5 million) $14 - 0.26% Total $263 $37 1.66% Skilled Nursing 24% Assisted Living 51% Memory Care 16% Independent 2% Child Care 2% Other (under $5 million) 5% Q3 2025 Loan Portfolio Disclosures |
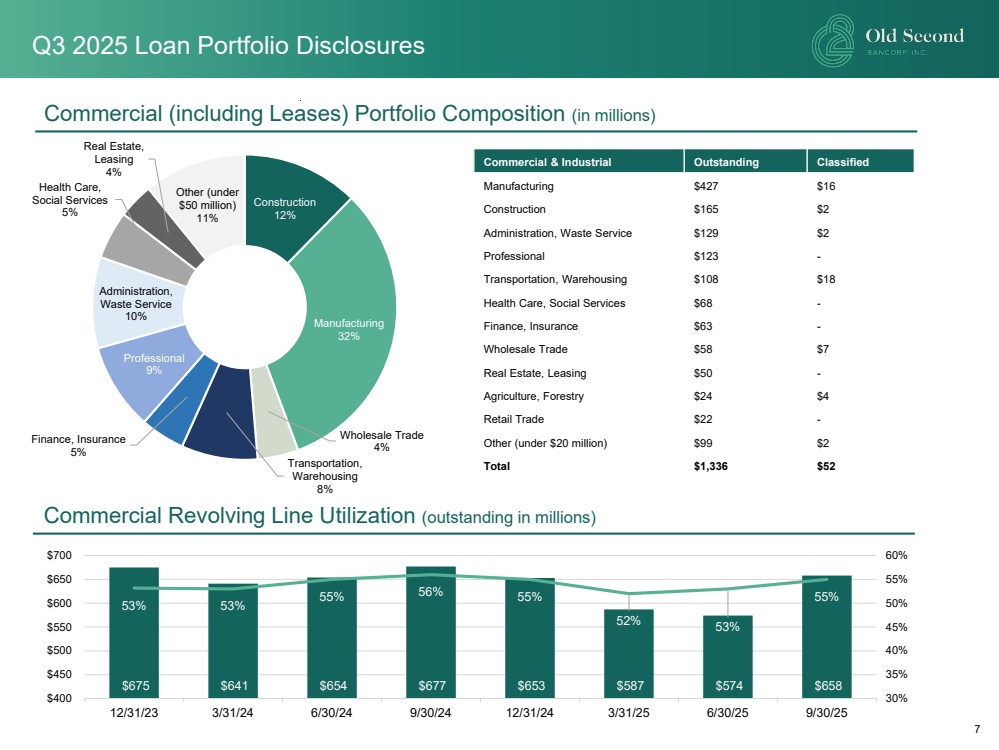
| 7 Commercial & Industrial Outstanding Classified Manufacturing $427 $16 Construction $165 $2 Administration, Waste Service $129 $2 Professional $123 - Transportation, Warehousing $108 $18 Health Care, Social Services $68 - Finance, Insurance $63 - Wholesale Trade $58 $7 Real Estate, Leasing $50 - Agriculture, Forestry $24 $4 Retail Trade $22 - Other (under $20 million) $99 $2 Total $1,336 $52 Commercial (including Leases) Portfolio Composition (in millions) Construction 12% Manufacturing 32% Wholesale Trade 4% Transportation, Warehousing 8% Finance, Insurance 5% Professional 9% Administration, Waste Service 10% Health Care, Social Services 5% Real Estate, Leasing 4% Other (under $50 million) 11% Commercial Revolving Line Utilization (outstanding in millions) $675 $641 $654 $677 $653 $587 $574 $658 53% 53% 55% 56% 55% 52% 53% 55% 30% 35% 40% 45% 50% 55% 60% $400 $450 $500 $550 $600 $650 $700 12/31/23 3/31/24 6/30/24 9/30/24 12/31/24 3/31/25 6/30/25 9/30/25 Q3 2025 Loan Portfolio Disclosures |
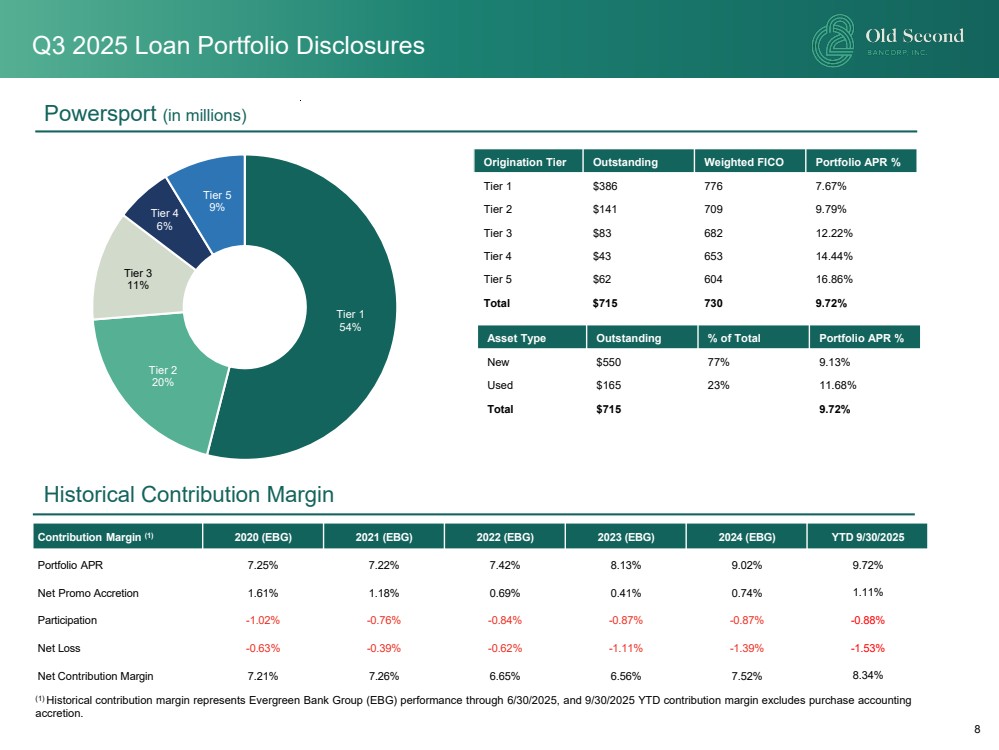
| 8 Origination Tier Outstanding Weighted FICO Portfolio APR % Tier 1 $386 776 7.67% Tier 2 $141 709 9.79% Tier 3 $83 682 12.22% Tier 4 $43 653 14.44% Tier 5 $62 604 16.86% Total $715 730 9.72% Powersport (in millions) Tier 1 54% Tier 2 20% Tier 3 11% Tier 4 6% Tier 5 9% Historical Contribution Margin Q3 2025 Loan Portfolio Disclosures Contribution Margin (1) 2020 (EBG) 2021 (EBG) 2022 (EBG) 2023 (EBG) 2024 (EBG) YTD 9/30/2025 Portfolio APR 7.25% 7.22% 7.42% 8.13% 9.02% 9.72% Net Promo Accretion 1.61% 1.18% 0.69% 0.41% 0.74% 1.11% Participation -1.02% -0.76% -0.84% -0.87% -0.87% -0.88% Net Loss -0.63% -0.39% -0.62% -1.11% -1.39% -1.53% Net Contribution Margin 7.21% 7.26% 6.65% 6.56% 7.52% 8.34% (1) Historical contribution margin represents Evergreen Bank Group (EBG) performance through 6/30/2025, and 9/30/2025 YTD contribution margin excludes purchase accounting accretion. Asset Type Outstanding % of Total Portfolio APR % New $550 77% 9.13% Used $165 23% 11.68% Total $715 9.72% |
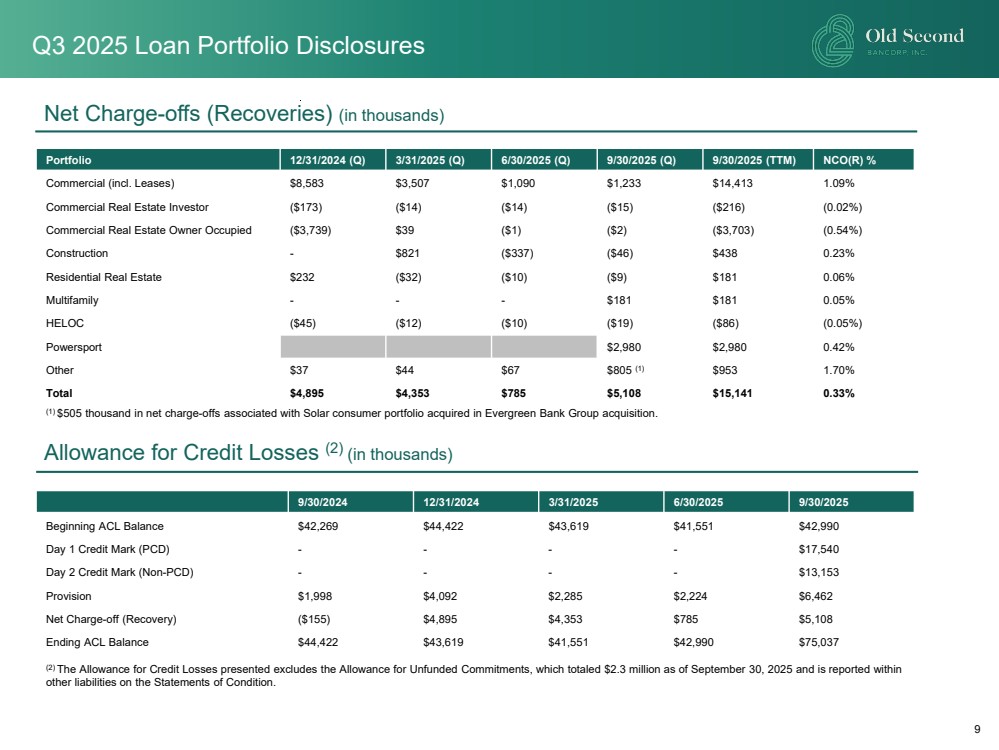
| 9 Net Charge-offs (Recoveries) (in thousands) Portfolio 12/31/2024 (Q) 3/31/2025 (Q) 6/30/2025 (Q) 9/30/2025 (Q) 9/30/2025 (TTM) NCO(R) % Commercial (incl. Leases) $8,583 $3,507 $1,090 $1,233 $14,413 1.09% Commercial Real Estate Investor ($173) ($14) ($14) ($15) ($216) (0.02%) Commercial Real Estate Owner Occupied ($3,739) $39 ($1) ($2) ($3,703) (0.54%) Construction - $821 ($337) ($46) $438 0.23% Residential Real Estate $232 ($32) ($10) ($9) $181 0.06% Multifamily - - - $181 $181 0.05% HELOC ($45) ($12) ($10) ($19) ($86) (0.05%) Powersport $2,980 $2,980 0.42% Other $37 $44 $67 $805 (1) $953 1.70% Total $4,895 $4,353 $785 $5,108 $15,141 0.33% 9/30/2024 12/31/2024 3/31/2025 6/30/2025 9/30/2025 Beginning ACL Balance $42,269 $44,422 $43,619 $41,551 $42,990 Day 1 Credit Mark (PCD) - - - - $17,540 Day 2 Credit Mark (Non-PCD) - - - - $13,153 Provision $1,998 $4,092 $2,285 $2,224 $6,462 Net Charge-off (Recovery) ($155) $4,895 $4,353 $785 $5,108 Ending ACL Balance $44,422 $43,619 $41,551 $42,990 $75,037 Allowance for Credit Losses (2) (in thousands) Q3 2025 Loan Portfolio Disclosures (2) The Allowance for Credit Losses presented excludes the Allowance for Unfunded Commitments, which totaled $2.3 million as of September 30, 2025 and is reported within other liabilities on the Statements of Condition. (1) $505 thousand in net charge-offs associated with Solar consumer portfolio acquired in Evergreen Bank Group acquisition. |