| 1 Loan Portfolio Disclosures AS OF MARCH 31, 2026 .2 |

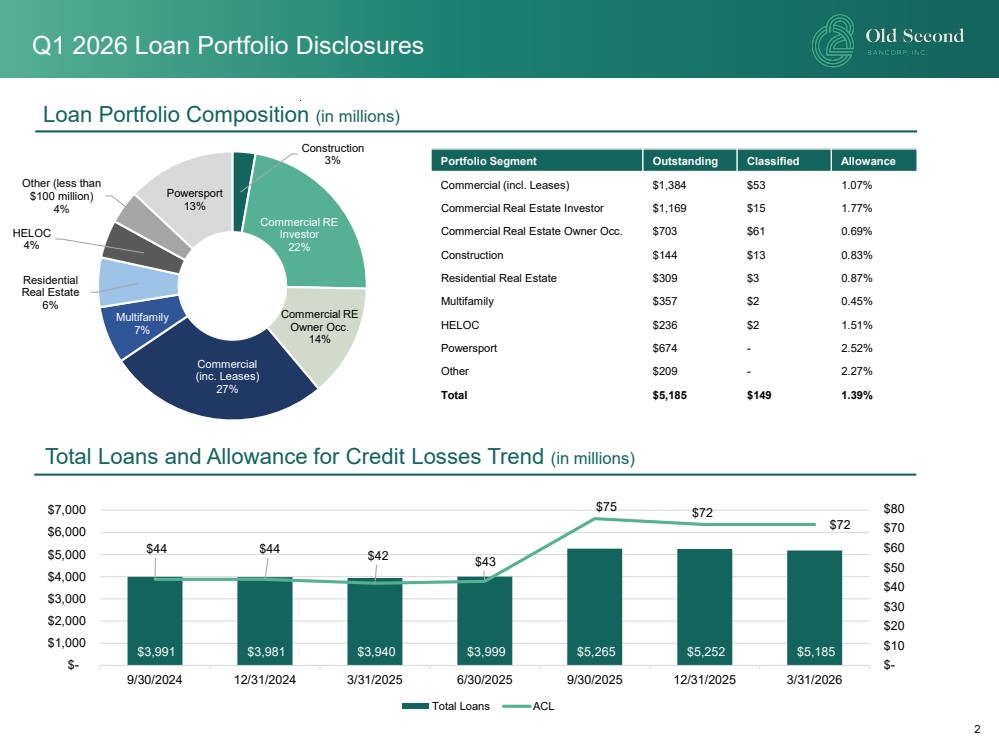
| 2 Portfolio Segment Outstanding Classified Allowance Commercial (incl. Leases) $1,384 $53 1.07% Commercial Real Estate Investor $1,169 $15 1.77% Commercial Real Estate Owner Occ. $703 $61 0.69% Construction $144 $13 0.83% Residential Real Estate $309 $3 0.87% Multifamily $357 $2 0.45% HELOC $236 $2 1.51% Powersport $674 - 2.52% Other $209 - 2.27% Total $5,185 $149 1.39% Construction 3% Commercial RE Investor 22% Commercial RE Owner Occ. 14% Commercial (inc. Leases) 27% Multifamily 7% Residential Real Estate 6% HELOC 4% Other (less than $100 million) 4% Powersport 13% Loan Portfolio Composition (in millions) Q1 2026 Loan Portfolio Disclosures Total Loans and Allowance for Credit Losses Trend (in millions) $3,991 $3,981 $3,940 $3,999 $5,265 $5,252 $5,185 $44 $44 $42 $43 $75 $72 $72 $- $10 $20 $30 $40 $50 $60 $70 $80 $- $1,000 $2,000 $3,000 $4,000 $5,000 $6,000 $7,000 9/30/2024 12/31/2024 3/31/2025 6/30/2025 9/30/2025 12/31/2025 3/31/2026 Total Loans ACL |
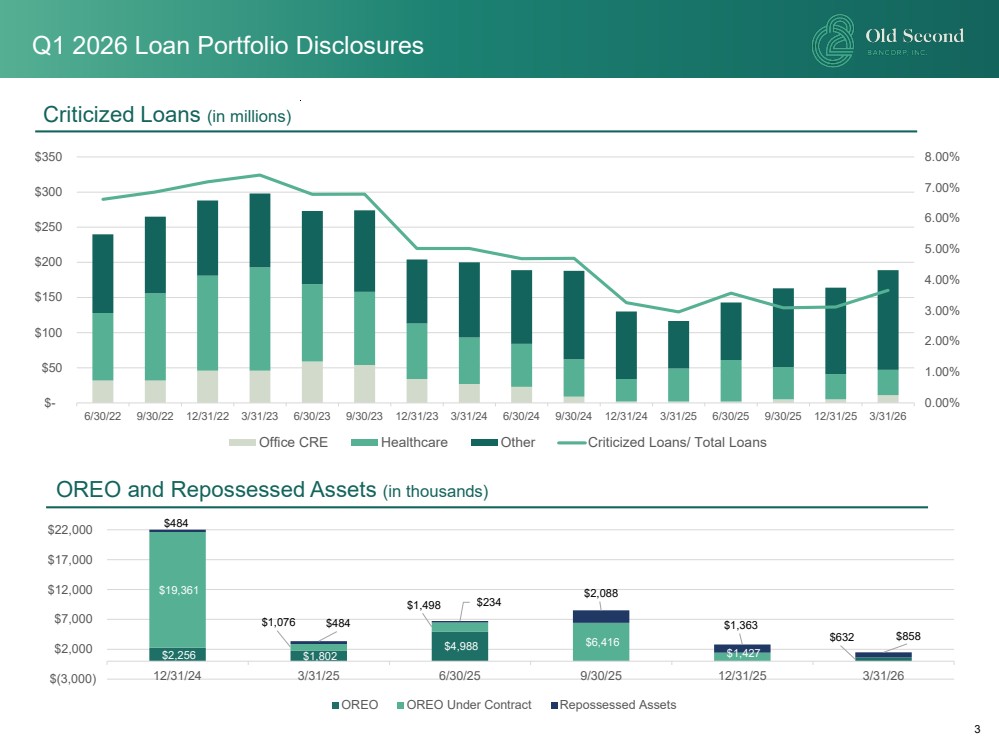
| 3 Criticized Loans (in millions) 0.00% 1.00% 2.00% 3.00% 4.00% 5.00% 6.00% 7.00% 8.00% $- $50 $100 $150 $200 $250 $300 $350 6/30/22 9/30/22 12/31/22 3/31/23 6/30/23 9/30/23 12/31/23 3/31/24 6/30/24 9/30/24 12/31/24 3/31/25 6/30/25 9/30/25 12/31/25 3/31/26 Office CRE Healthcare Other Criticized Loans/ Total Loans Q1 2026 Loan Portfolio Disclosures $2,256 $1,802 $4,988 $632 $19,361 $1,076 $1,498 $6,416 $1,427 $484 $484 $234 $2,088 $1,363 $858 $(3,000) $2,000 $7,000 $12,000 $17,000 $22,000 12/31/24 3/31/25 6/30/25 9/30/25 12/31/25 3/31/26 OREO OREO Under Contract Repossessed Assets OREO and Repossessed Assets (in thousands) |
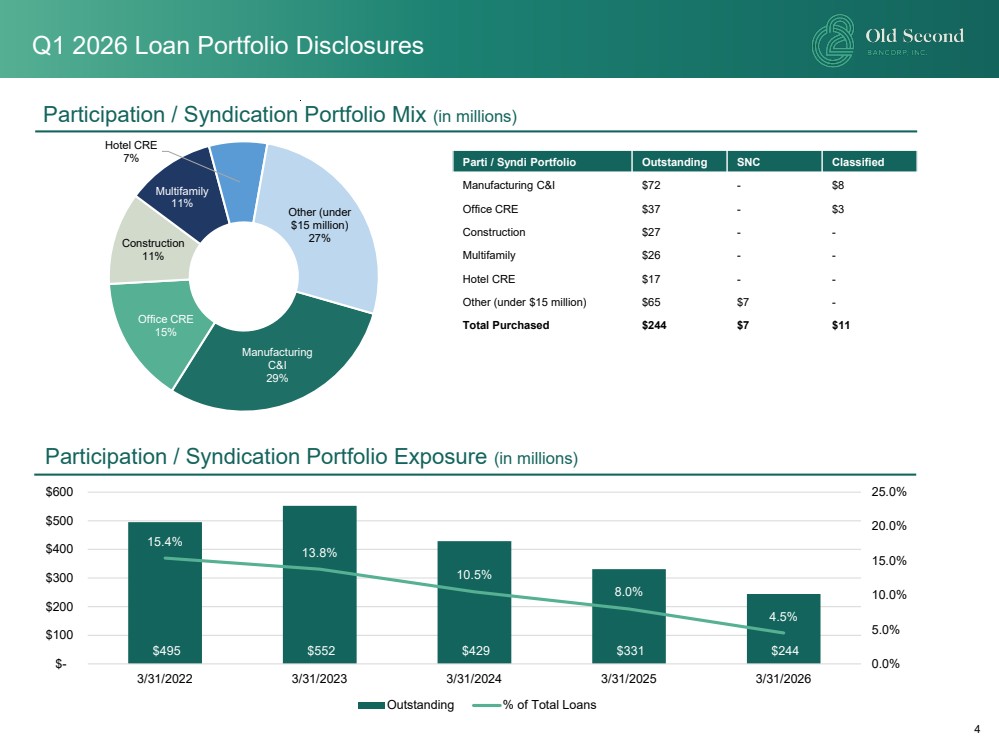
| 4 Participation / Syndication Portfolio Mix (in millions) Participation / Syndication Portfolio Exposure (in millions) Parti / Syndi Portfolio Outstanding SNC Classified Manufacturing C&I $72 - $8 Office CRE $37 - $3 Construction $27 - - Multifamily $26 - - Hotel CRE $17 - - Other (under $15 million) $65 $7 - Total Purchased $244 $7 $11 Manufacturing C&I 29% Office CRE 15% Construction 11% Multifamily 11% Hotel CRE 7% Other (under $15 million) 27% $495 $552 $429 $331 $244 15.4% 13.8% 10.5% 8.0% 4.5% 0.0% 5.0% 10.0% 15.0% 20.0% 25.0% $- $100 $200 $300 $400 $500 $600 3/31/2022 3/31/2023 3/31/2024 3/31/2025 3/31/2026 Outstanding % of Total Loans Q1 2026 Loan Portfolio Disclosures |
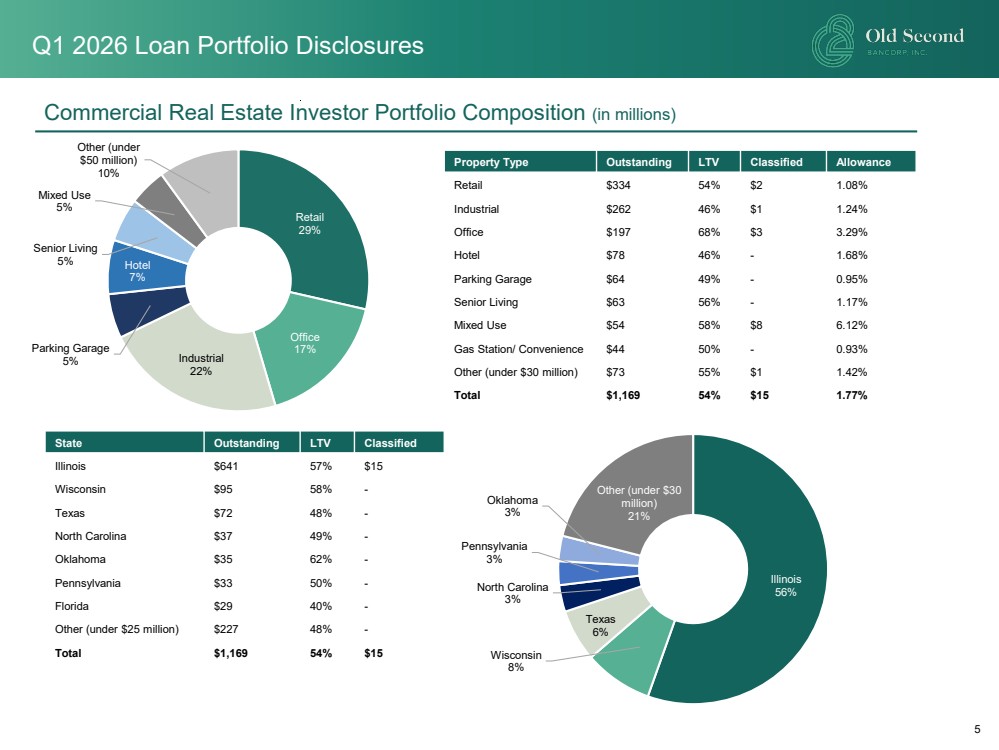
| 5 Property Type Outstanding LTV Classified Allowance Retail $334 54% $2 1.08% Industrial $262 46% $1 1.24% Office $197 68% $3 3.29% Hotel $78 46% - 1.68% Parking Garage $64 49% - 0.95% Senior Living $63 56% - 1.17% Mixed Use $54 58% $8 6.12% Gas Station/ Convenience $44 50% - 0.93% Other (under $30 million) $73 55% $1 1.42% Total $1,169 54% $15 1.77% Commercial Real Estate Investor Portfolio Composition (in millions) Retail 29% Office 17% Industrial 22% Parking Garage 5% Hotel 7% Senior Living 5% Mixed Use 5% Other (under $50 million) 10% Illinois 56% Wisconsin 8% Texas 6% North Carolina 3% Pennsylvania 3% Oklahoma 3% Other (under $30 million) 21% State Outstanding LTV Classified Illinois $641 57% $15 Wisconsin $95 58% - Texas $72 48% - North Carolina $37 49% - Oklahoma $35 62% - Pennsylvania $33 50% - Florida $29 40% - Other (under $25 million) $227 48% - Total $1,169 54% $15 Q1 2026 Loan Portfolio Disclosures |
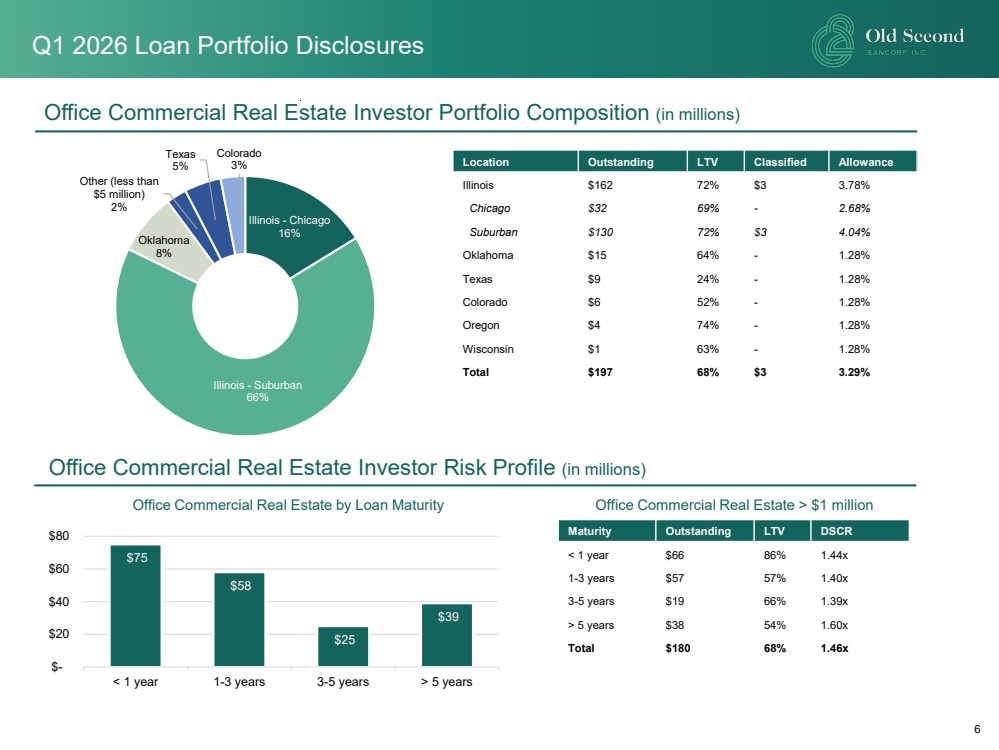
| 6 Location Outstanding LTV Classified Allowance Illinois $162 72% $3 3.78% Chicago $32 69% - 2.68% Suburban $130 72% $3 4.04% Oklahoma $15 64% - 1.28% Texas $9 24% - 1.28% Colorado $6 52% - 1.28% Oregon $4 74% - 1.28% Wisconsin $1 63% - 1.28% Total $197 68% $3 3.29% Office Commercial Real Estate Investor Portfolio Composition (in millions) Illinois - Chicago 16% Illinois - Suburban 66% Oklahoma 8% Other (less than $5 million) 2% Texas 5% Colorado 3% Office Commercial Real Estate Investor Risk Profile (in millions) Q1 2026 Loan Portfolio Disclosures $75 $58 $25 $39 $- $20 $40 $60 $80 < 1 year 1-3 years 3-5 years > 5 years Maturity Outstanding LTV DSCR < 1 year $66 86% 1.44x 1-3 years $57 57% 1.40x 3-5 years $19 66% 1.39x > 5 years $38 54% 1.60x Total $180 68% 1.46x Office Commercial Real Estate by Loan Maturity Office Commercial Real Estate > $1 million |
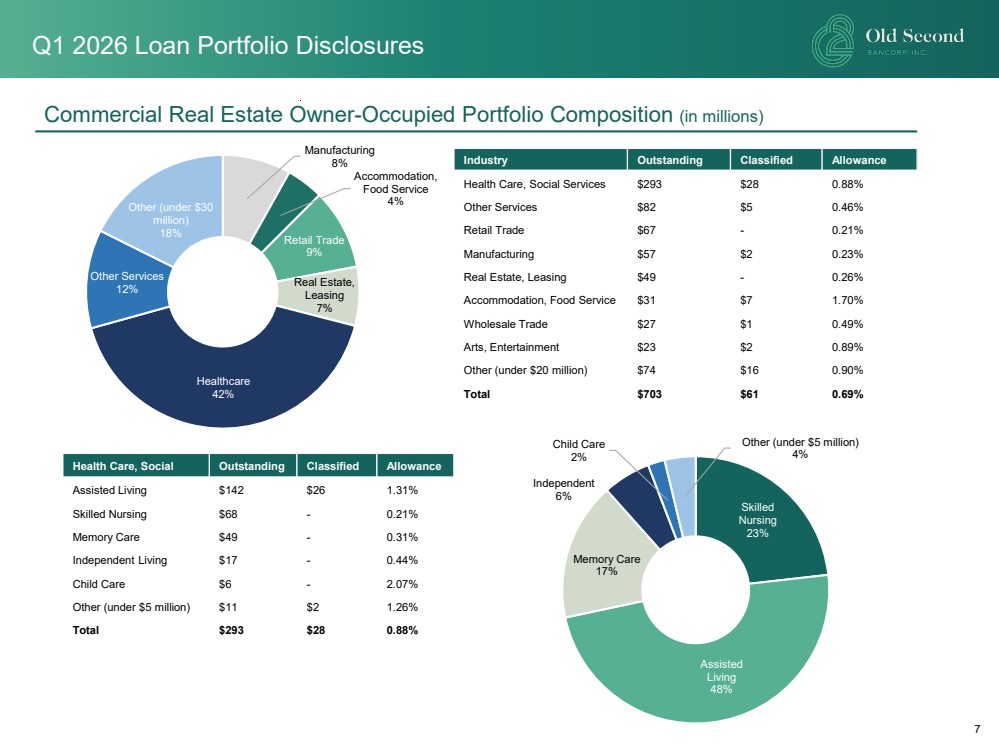
| 7 Industry Outstanding Classified Allowance Health Care, Social Services $293 $28 0.88% Other Services $82 $5 0.46% Retail Trade $67 - 0.21% Manufacturing $57 $2 0.23% Real Estate, Leasing $49 - 0.26% Accommodation, Food Service $31 $7 1.70% Wholesale Trade $27 $1 0.49% Arts, Entertainment $23 $2 0.89% Other (under $20 million) $74 $16 0.90% Total $703 $61 0.69% Manufacturing 8% Accommodation, Food Service 4% Retail Trade 9% Real Estate, Leasing 7% Healthcare 42% Other Services 12% Other (under $30 million) 18% Commercial Real Estate Owner-Occupied Portfolio Composition (in millions) Health Care, Social Outstanding Classified Allowance Assisted Living $142 $26 1.31% Skilled Nursing $68 - 0.21% Memory Care $49 - 0.31% Independent Living $17 - 0.44% Child Care $6 - 2.07% Other (under $5 million) $11 $2 1.26% Total $293 $28 0.88% Skilled Nursing 23% Assisted Living 48% Memory Care 17% Independent 6% Child Care 2% Other (under $5 million) 4% Q1 2026 Loan Portfolio Disclosures |
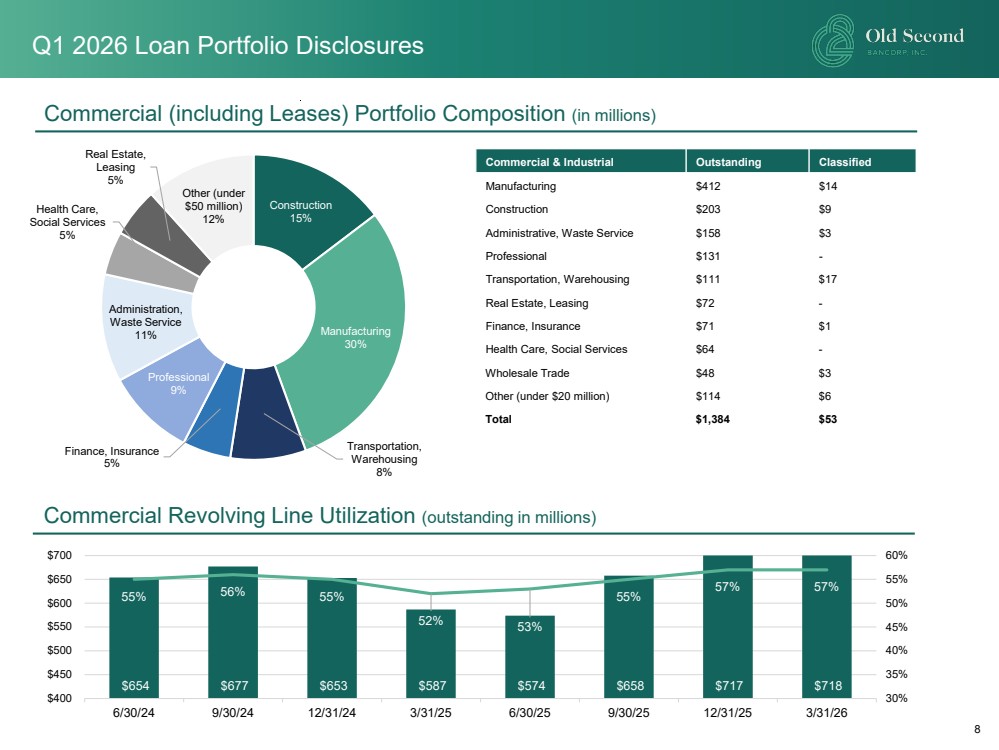
| 8 Commercial & Industrial Outstanding Classified Manufacturing $412 $14 Construction $203 $9 Administrative, Waste Service $158 $3 Professional $131 - Transportation, Warehousing $111 $17 Real Estate, Leasing $72 - Finance, Insurance $71 $1 Health Care, Social Services $64 - Wholesale Trade $48 $3 Other (under $20 million) $114 $6 Total $1,384 $53 Commercial (including Leases) Portfolio Composition (in millions) Construction 15% Manufacturing 30% Transportation, Warehousing 8% Finance, Insurance 5% Professional 9% Administration, Waste Service 11% Health Care, Social Services 5% Real Estate, Leasing 5% Other (under $50 million) 12% Commercial Revolving Line Utilization (outstanding in millions) $654 $677 $653 $587 $574 $658 $717 $718 55% 56% 55% 52% 53% 55% 57% 57% 30% 35% 40% 45% 50% 55% 60% $400 $450 $500 $550 $600 $650 $700 6/30/24 9/30/24 12/31/24 3/31/25 6/30/25 9/30/25 12/31/25 3/31/26 Q1 2026 Loan Portfolio Disclosures |
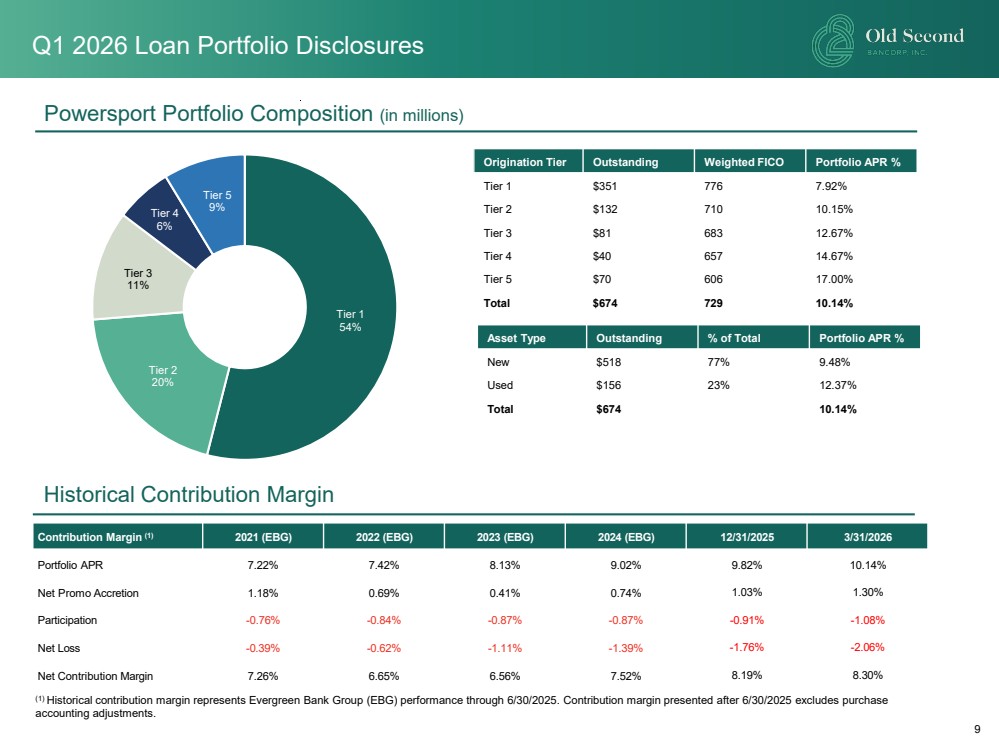
| 9 Origination Tier Outstanding Weighted FICO Portfolio APR % Tier 1 $351 776 7.92% Tier 2 $132 710 10.15% Tier 3 $81 683 12.67% Tier 4 $40 657 14.67% Tier 5 $70 606 17.00% Total $674 729 10.14% Powersport Portfolio Composition (in millions) Tier 1 54% Tier 2 20% Tier 3 11% Tier 4 6% Tier 5 9% Historical Contribution Margin Q1 2026 Loan Portfolio Disclosures Contribution Margin (1) 2021 (EBG) 2022 (EBG) 2023 (EBG) 2024 (EBG) 12/31/2025 3/31/2026 Portfolio APR 7.22% 7.42% 8.13% 9.02% 9.82% 10.14% Net Promo Accretion 1.18% 0.69% 0.41% 0.74% 1.03% 1.30% Participation -0.76% -0.84% -0.87% -0.87% -0.91% -1.08% Net Loss -0.39% -0.62% -1.11% -1.39% -1.76% -2.06% Net Contribution Margin 7.26% 6.65% 6.56% 7.52% 8.19% 8.30% (1) Historical contribution margin represents Evergreen Bank Group (EBG) performance through 6/30/2025. Contribution margin presented after 6/30/2025 excludes purchase accounting adjustments. Asset Type Outstanding % of Total Portfolio APR % New $518 77% 9.48% Used $156 23% 12.37% Total $674 10.14% |
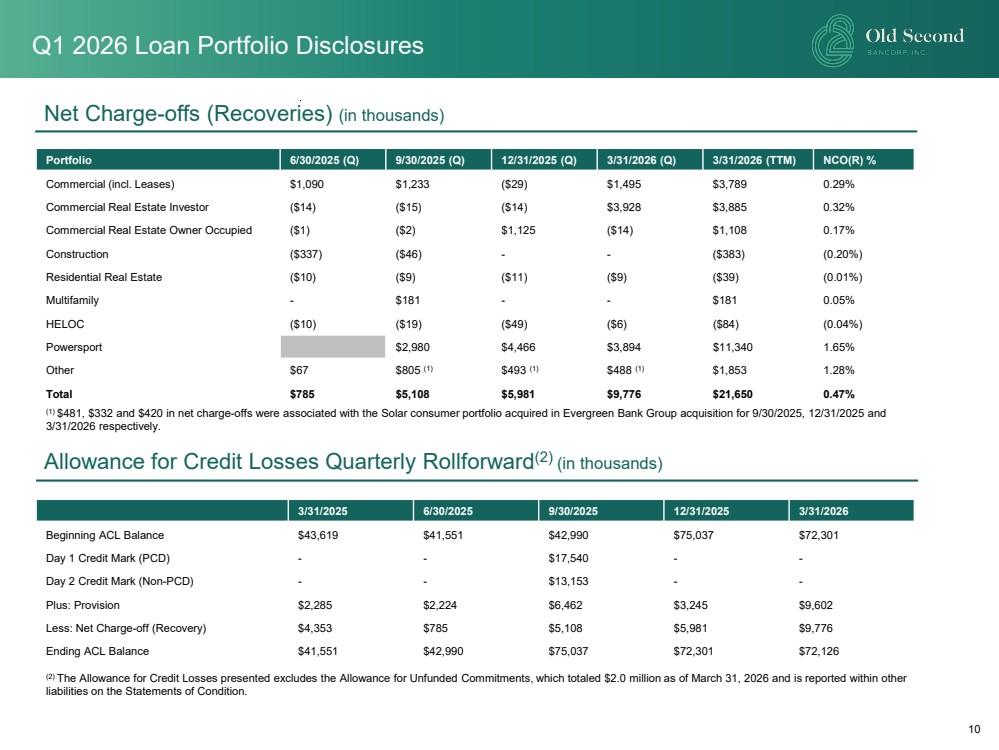
| 10 Net Charge-offs (Recoveries) (in thousands) Portfolio 6/30/2025 (Q) 9/30/2025 (Q) 12/31/2025 (Q) 3/31/2026 (Q) 3/31/2026 (TTM) NCO(R) % Commercial (incl. Leases) $1,090 $1,233 ($29) $1,495 $3,789 0.29% Commercial Real Estate Investor ($14) ($15) ($14) $3,928 $3,885 0.32% Commercial Real Estate Owner Occupied ($1) ($2) $1,125 ($14) $1,108 0.17% Construction ($337) ($46) - - ($383) (0.20%) Residential Real Estate ($10) ($9) ($11) ($9) ($39) (0.01%) Multifamily - $181 - - $181 0.05% HELOC ($10) ($19) ($49) ($6) ($84) (0.04%) Powersport $2,980 $4,466 $3,894 $11,340 1.65% Other $67 $805 (1) $493 (1) $488 (1) $1,853 1.28% Total $785 $5,108 $5,981 $9,776 $21,650 0.47% 3/31/2025 6/30/2025 9/30/2025 12/31/2025 3/31/2026 Beginning ACL Balance $43,619 $41,551 $42,990 $75,037 $72,301 Day 1 Credit Mark (PCD) - - $17,540 - - Day 2 Credit Mark (Non-PCD) - - $13,153 - - Plus: Provision $2,285 $2,224 $6,462 $3,245 $9,602 Less: Net Charge-off (Recovery) $4,353 $785 $5,108 $5,981 $9,776 Ending ACL Balance $41,551 $42,990 $75,037 $72,301 $72,126 Allowance for Credit Losses Quarterly Rollforward(2) (in thousands) Q1 2026 Loan Portfolio Disclosures (2) The Allowance for Credit Losses presented excludes the Allowance for Unfunded Commitments, which totaled $2.0 million as of March 31, 2026 and is reported within other liabilities on the Statements of Condition. (1) $481, $332 and $420 in net charge-offs were associated with the Solar consumer portfolio acquired in Evergreen Bank Group acquisition for 9/30/2025, 12/31/2025 and 3/31/2026 respectively. |