© 2026 Fulton Financial Corporation. All rights reserved. Investor Presentation Data as of or for the period ended June 30, 2026, unless otherwise noted Please refer to the Glossary of Terms on slide [24] for the definitions of acronyms and capitalized terms used in this presentation. Certain financial measures in this presentation have been derived by methods other than generally accepted accounting principles (“GAAP”). These non-GAAP financial measures are reconciled to the most comparable GAAP measures at the end of this presentation.
© 2026 Fulton Financial Corporation. All rights reserved. Forward-Looking Statements 2 This presentation contains forward-looking statements with respect to the Corporation’s financial condition, results of operations and business. Forward-looking statements are any statement that does not relate to historical or current facts and can be identified by the use of words such as "may," "should," "will," "could," "estimates," "predicts," "potential," "continue," "anticipates," "believes," "plans," "expects," "future," "intends," “projects,” the negative of these terms and other comparable terminology. These forward-looking statements may include projections of, or guidance on, the Corporation’s future financial performance, expected levels of future expenses, including future credit losses, anticipated growth strategies, descriptions of new business initiatives and anticipated trends in the Corporation’s business or financial results. Management's "2026 Operating Guidance" contained herein is comprised of forward-looking statements. Forward-looking statements are neither historical facts, nor assurance of future performance. Instead, the statements are based on current beliefs, expectations and assumptions regarding the future of the Corporation’s business, plans and strategies, projections, anticipated events and trends, the economy and other future conditions. Because forward-looking statements relate to the future, they are subject to inherent uncertainties, risks and changes in circumstances that are difficult to predict and many of which are outside of the Corporation’s control, and actual results and financial condition may differ materially from those indicated in the forward-looking statements. Therefore, you should not unduly rely on any of these forward-looking statements. Any forward-looking statement is based only on information currently available and speaks only as of the date when made. The Corporation undertakes no obligation, other than as required by law, to update or revise any forward-looking statements, whether as a result of new information, future events or otherwise. Numerous factors could cause the Corporation's actual results to differ materially from those described in the forward-looking statements, including, but not limited to, the following: the impact of adverse conditions in the economy and financial markets; trade policies and the imposition of tariffs and retaliatory tariffs; the impacts of events affecting the financial services industry; the effects of actions by the federal government, including those of the Board of Governors of the Federal Reserve System and other governme nt agencies, that impact the money supply and market interest rates; the effects of market interest rates and the relative balances of interest rate-sensitive assets to interest rate-sensitive liabilities on net interest margin and net interest income; the composition of the Corporation's loan portfolio and potential exposure to increased credit risk; the effects of changes in interest rates; investment securities gains and losses, including declines in the fair value of securities; disruptions in liquidity markets; capital and liquidity strategies; the Corporation's ability to generate capital internally or raise capital on favorable terms; the effects of competition; possible goodwill impairment charges; the impact of operational risks; the loss of, or failure to safeguard, confidential or proprietary information; the Corporation's failure to identify and promptly address cybersecurity risks; the impact of failures of the Corporation's third-party vendors to perform in accordance with contractual arrangements; the effects of concerns about other financial institutions on the Corporation; potential losses in connection with repurchase and indemnification payments related to sold loans; the effec ts of climate change on the Corporation's business and results of operations; the effects of increases in non-performing assets; the determination of the allowance for credit losses; the effects of the extensive level of regulation and supervision to which the Corporation and Fulton Bank are subject; changes in law, regulation and government policy; the continuing impact of the Dodd-Frank Wall Street Reform and Consumer Protection Act; potential negative consequences resulting from regulatory violations, investigations and examinations; the effects of adverse outcomes in litigation and governmental or administrative proceedings; the effects of changes in U.S. federal, state or local tax laws; the effects of the significant amounts of time and expense associated with regulatory compliance and risk management; the Corporation's ability to realize anticipated reductions in non-interest expense and increases in revenue from strategic initiatives implemented from time to time; risks related to the acquisition of Blue Foundry Bancorp; completed and potential future acquisitions may affect costs and the Corporation may not be able to successfully integrate the acquired business or realize the anticipated benefits from such acquisitions; geopolitical conditions, including acts or threats of terrorism, actions taken by the United States or other governments in response to acts or threats of terrorism, military conflicts, wars and other international hostilities; public health crises and pandemics; the Corporation's ability to achieve its growth plans; the Corporation's ability to attract and retain talented personnel; the effects of competition from financial service companies and other companies offering bank services; the Corporation's ability to keep pace with technological changes; the Corporation's reliance on its subsidiaries for substantially all of its revenues; and the effects of negative publicity on the Corporation's reputation. For additional information about factors that could cause actual results to differ materially from those described in forward-looking statements, refer to the sections entitled "Risk Factors" and "Management's Discussion and Analysis of Financial Condition and Results of Operations" in the Corporation’s Annual Report on Form 10-K for the year ended December 31, 2025, Quarterly Report on Form 10-Q for the quarter ended March 31, 2026 and other current and periodic reports, which have been, or will be, filed with the SEC and are, or will be, available in the Investor Relations se ction of the Corporation's website (www.fultonbank.com) and on the SEC's website (www.sec.gov).
© 2026 Fulton Financial Corporation. All rights reserved. QUARTERLY FINANCIAL PERFORMANCE 3
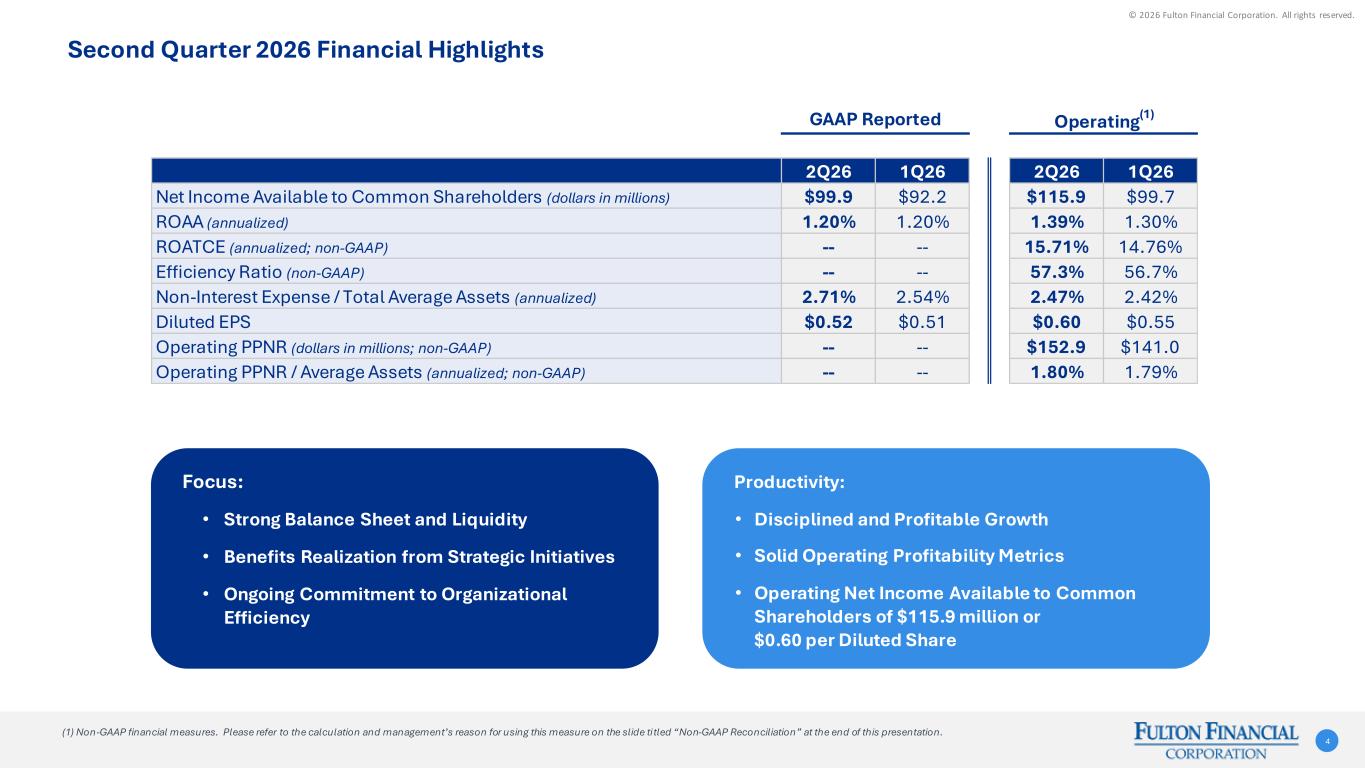
© 2026 Fulton Financial Corporation. All rights reserved. 2Q26 1Q26 2Q26 1Q26 Net Income Available to Common Shareholders (dollars in millions) $99.9 $92.2 $115.9 $99.7 ROAA (annualized) 1.20% 1.20% 1.39% 1.30% ROATCE (annualized; non-GAAP) -- -- 15.71% 14.76% Efficiency Ratio (non-GAAP) -- -- 57.3% 56.7% Non-Interest Expense / Total Average Assets (annualized) 2.71% 2.54% 2.47% 2.42% Diluted EPS $0.52 $0.51 $0.60 $0.55 Operating PPNR (dollars in millions; non-GAAP) -- -- $152.9 $141.0 Operating PPNR / Average Assets (annualized; non-GAAP) -- -- 1.80% 1.79% GAAP Reported Operating(1) Second Quarter 2026 Financial Highlights 4 (1) Non-GAAP financial measures. Please refer to the calculation and management’s reason for using this measure on the slide titled “Non-GAAP Reconciliation” at the end of this presentation. Focus: • Strong Balance Sheet and Liquidity • Benefits Realization from Strategic Initiatives • Ongoing Commitment to Organizational Efficiency Productivity: • Disciplined and Profitable Growth • Solid Operating Profitability Metrics • Operating Net Income Available to Common Shareholders of $115.9 million or $0.60 per Diluted Share
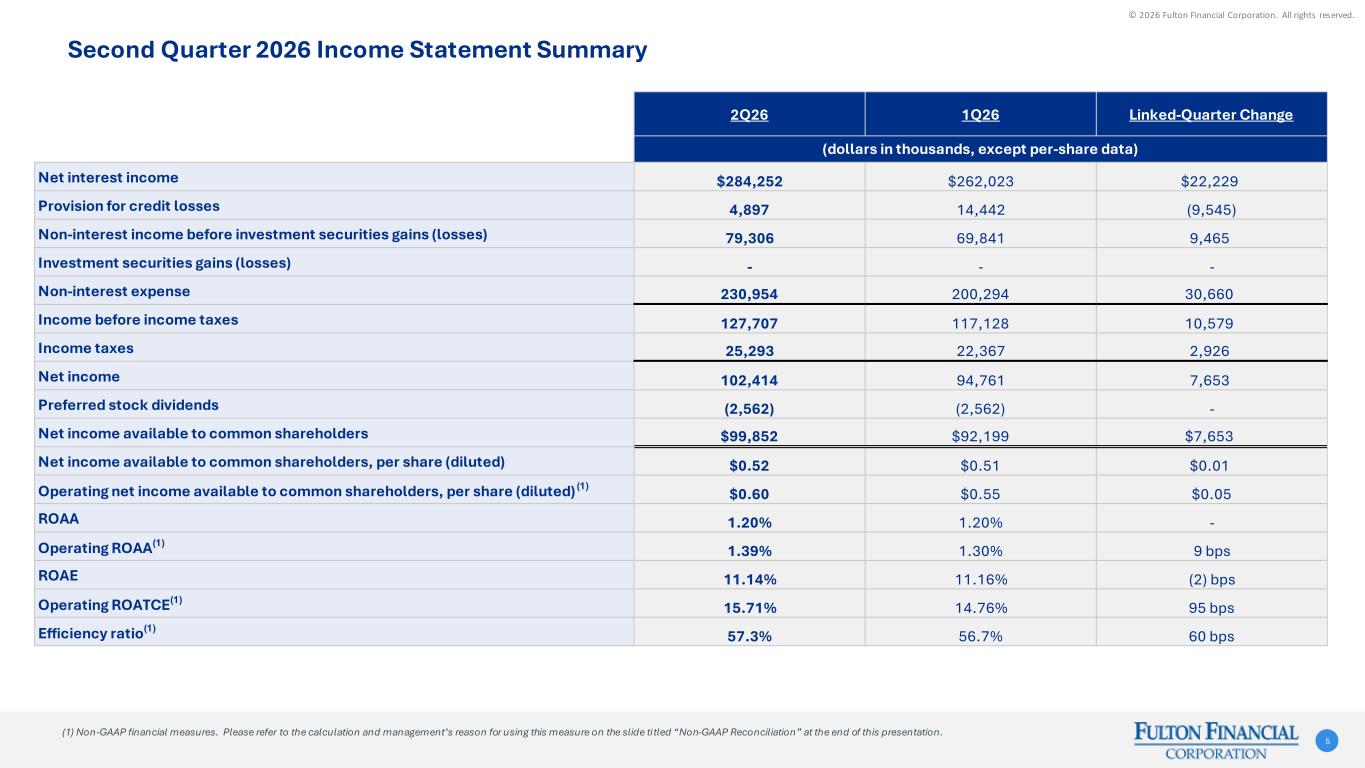
© 2026 Fulton Financial Corporation. All rights reserved. 2Q26 1Q26 Linked-Quarter Change Net interest income $284,252 $262,023 $22,229 Provision for credit losses 4,897 14,442 (9,545) Non-interest income before investment securities gains (losses) 79,306 69,841 9,465 Investment securities gains (losses) - - - Non-interest expense 230,954 200,294 30,660 Income before income taxes 127,707 117,128 10,579 Income taxes 25,293 22,367 2,926 Net income 102,414 94,761 7,653 Preferred stock dividends (2,562) (2,562) - Net income available to common shareholders $99,852 $92,199 $7,653 Net income available to common shareholders, per share (diluted) $0.52 $0.51 $0.01 Operating net income available to common shareholders, per share (diluted) (1) $0.60 $0.55 $0.05 ROAA 1.20% 1.20% - Operating ROAA(1) 1.39% 1.30% 9 bps ROAE 11.14% 11.16% (2) bps Operating ROATCE(1) 15.71% 14.76% 95 bps Efficiency ratio(1) 57.3% 56.7% 60 bps (dollars in thousands, except per-share data) Second Quarter 2026 Income Statement Summary 5 (1) Non-GAAP financial measures. Please refer to the calculation and management’s reason for using this measure on the slide titled “Non-GAAP Reconciliation” at the end of this presentation.
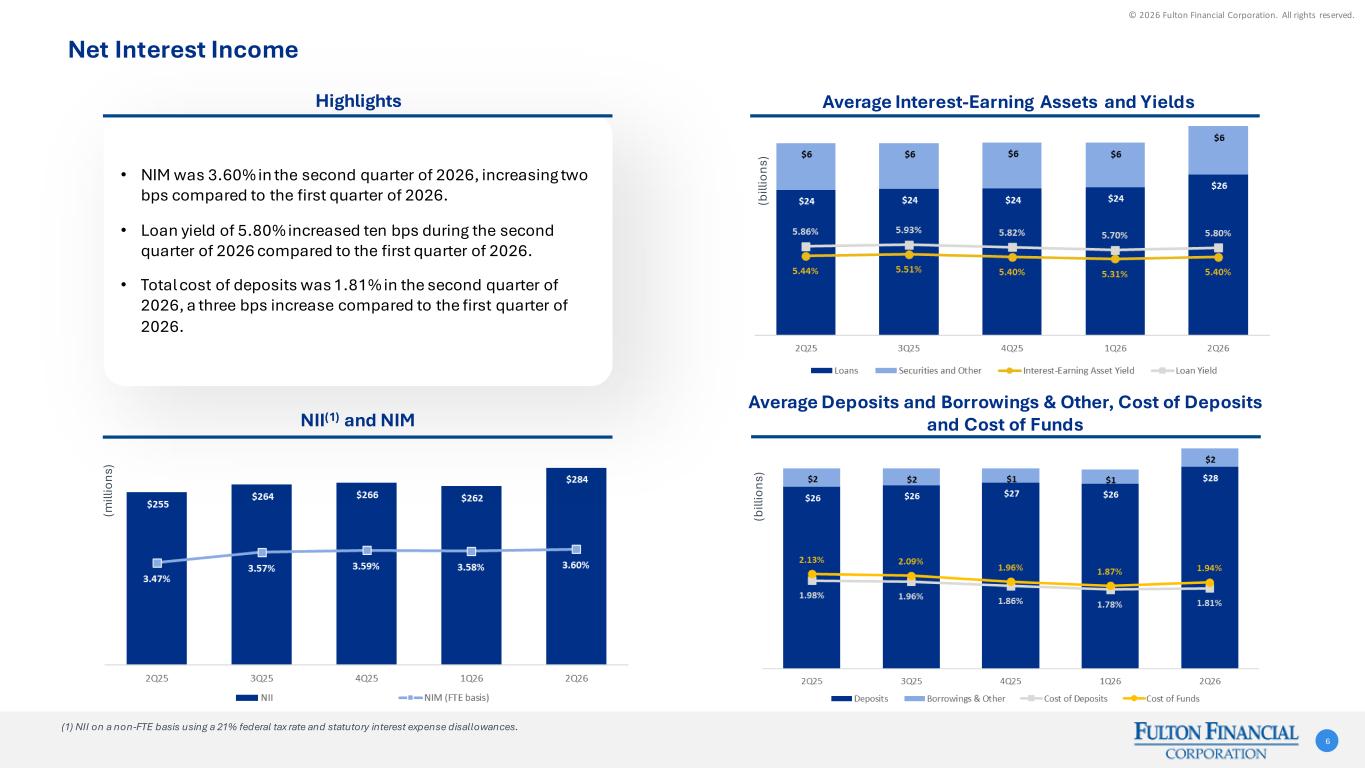
© 2026 Fulton Financial Corporation. All rights reserved. Net Interest Income 6 • NIM was 3.60% in the second quarter of 2026, increasing two bps compared to the first quarter of 2026. • Loan yield of 5.80% increased ten bps during the second quarter of 2026 compared to the first quarter of 2026. • Total cost of deposits was 1.81% in the second quarter of 2026, a three bps increase compared to the first quarter of 2026. Average Interest-Earning Assets and YieldsHighlights Average Deposits and Borrowings & Other, Cost of Deposits and Cost of FundsNII(1) and NIM (1) NII on a non-FTE basis using a 21% federal tax rate and statutory interest expense disallowances. (m ill io ns ) (b ill io ns ) (b ill io ns )
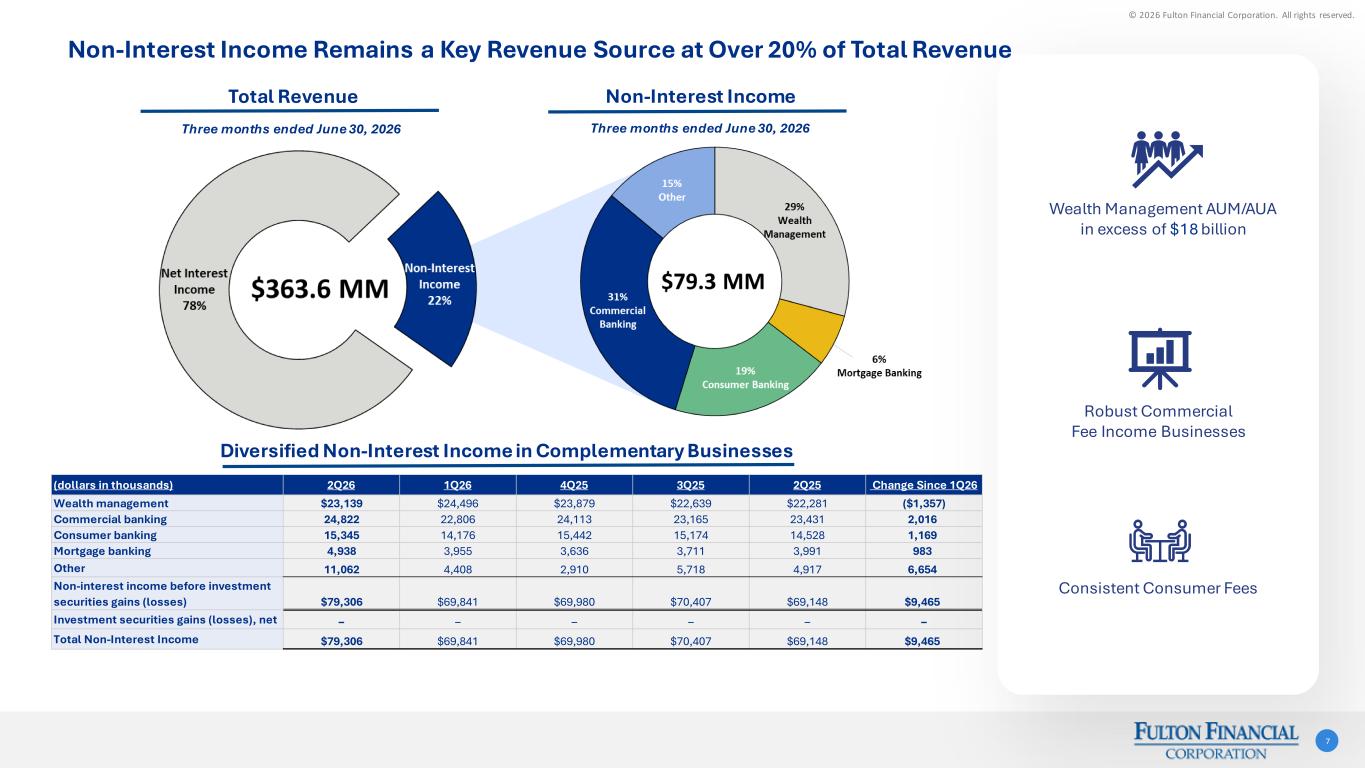
© 2026 Fulton Financial Corporation. All rights reserved. Wealth management $23,139 $24,496 $23,879 $22,639 $22,281 ($1,357) Commercial banking 24,822 22,806 24,113 23,165 23,431 2,016 Consumer banking 15,345 14,176 15,442 15,174 14,528 1,169 Mortgage banking 4,938 3,955 3,636 3,711 3,991 983 Other 11,062 4,408 2,910 5,718 4,917 6,654 Non-interest income before investment securities gains (losses) $79,306 $69,841 $69,980 $70,407 $69,148 $9,465 Investment securities gains (losses), net – – – – – – Total Non-Interest Income $79,306 $69,841 $69,980 $70,407 $69,148 $9,465 Change Since 1Q262Q26(dollars in thousands) 1Q26 4Q25 3Q25 2Q25 Non-Interest Income Remains a Key Revenue Source at Over 20% of Total Revenue 7 Wealth Management AUM/AUA in excess of $18 billion Robust Commercial Fee Income Businesses Consistent Consumer Fees Three months ended June 30, 2026 Three months ended June 30, 2026 Total Revenue Non-Interest Income Diversified Non-Interest Income in Complementary Businesses
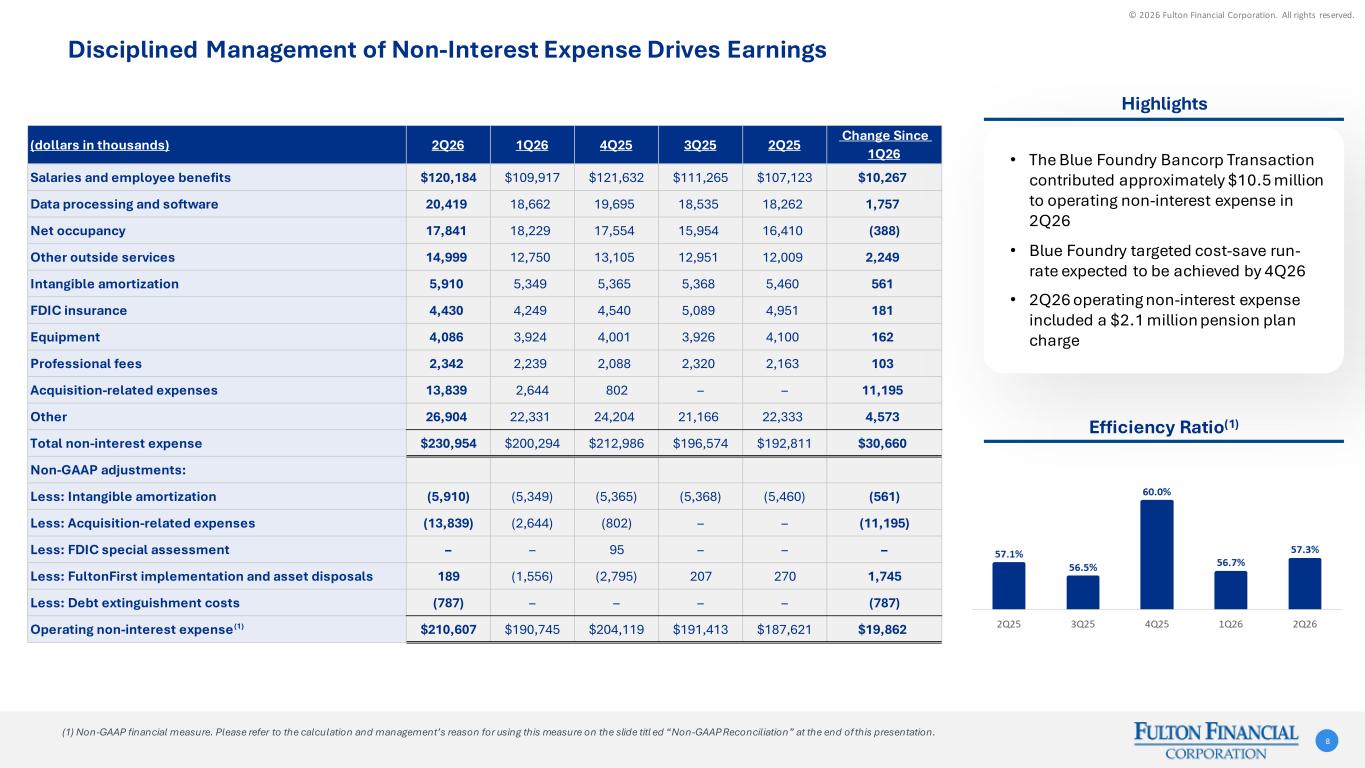
© 2026 Fulton Financial Corporation. All rights reserved. Salaries and employee benefits $120,184 $109,917 $121,632 $111,265 $107,123 $10,267 Data processing and software 20,419 18,662 19,695 18,535 18,262 1,757 Net occupancy 17,841 18,229 17,554 15,954 16,410 (388) Other outside services 14,999 12,750 13,105 12,951 12,009 2,249 Intangible amortization 5,910 5,349 5,365 5,368 5,460 561 FDIC insurance 4,430 4,249 4,540 5,089 4,951 181 Equipment 4,086 3,924 4,001 3,926 4,100 162 Professional fees 2,342 2,239 2,088 2,320 2,163 103 Acquisition-related expenses 13,839 2,644 802 – – 11,195 Other 26,904 22,331 24,204 21,166 22,333 4,573 Total non-interest expense $230,954 $200,294 $212,986 $196,574 $192,811 $30,660 Non-GAAP adjustments: Less: Intangible amortization (5,910) (5,349) (5,365) (5,368) (5,460) (561) Less: Acquisition-related expenses (13,839) (2,644) (802) – – (11,195) Less: FDIC special assessment – – 95 – – – Less: FultonFirst implementation and asset disposals 189 (1,556) (2,795) 207 270 1,745 Less: Debt extinguishment costs (787) – – – – (787) Operating non-interest expense(1) $210,607 $190,745 $204,119 $191,413 $187,621 $19,862 (dollars in thousands) 2Q26 1Q26 4Q25 3Q25 2Q25 Change Since 1Q26 Efficiency Ratio(1) Disciplined Management of Non-Interest Expense Drives Earnings 8 (1) Non-GAAP financial measure. Please refer to the calculation and management’s reason for using this measure on the slide titl ed “Non-GAAP Reconciliation” at the end of this presentation. • The Blue Foundry Bancorp Transaction contributed approximately $10.5 million to operating non-interest expense in 2Q26 • Blue Foundry targeted cost-save run- rate expected to be achieved by 4Q26 • 2Q26 operating non-interest expense included a $2.1 million pension plan charge Highlights
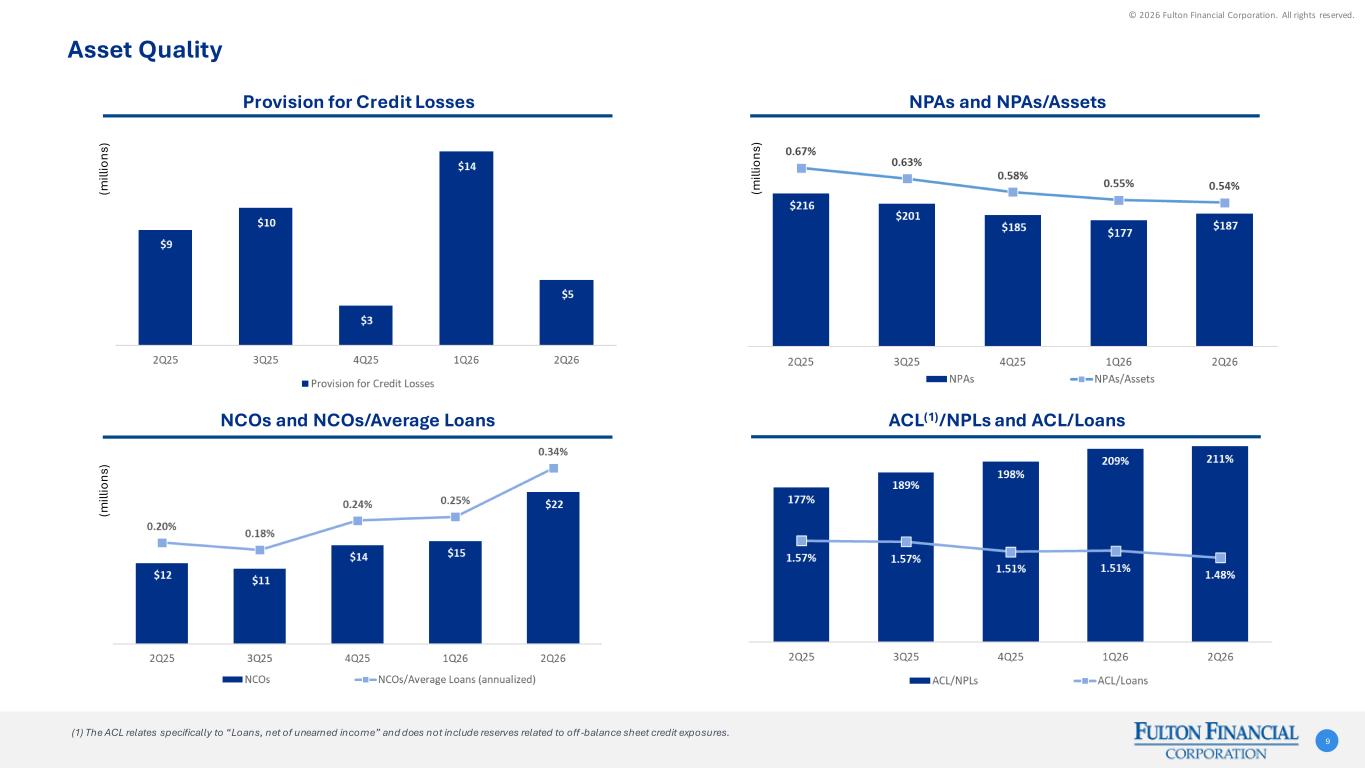
© 2026 Fulton Financial Corporation. All rights reserved. Asset Quality 9 NPAs and NPAs/AssetsProvision for Credit Losses ACL(1)/NPLs and ACL/LoansNCOs and NCOs/Average Loans (m ill io ns ) (m ill io ns ) (m ill io ns ) (1) The ACL relates specifically to “Loans, net of unearned income” and does not include reserves related to off -balance sheet credit exposures.
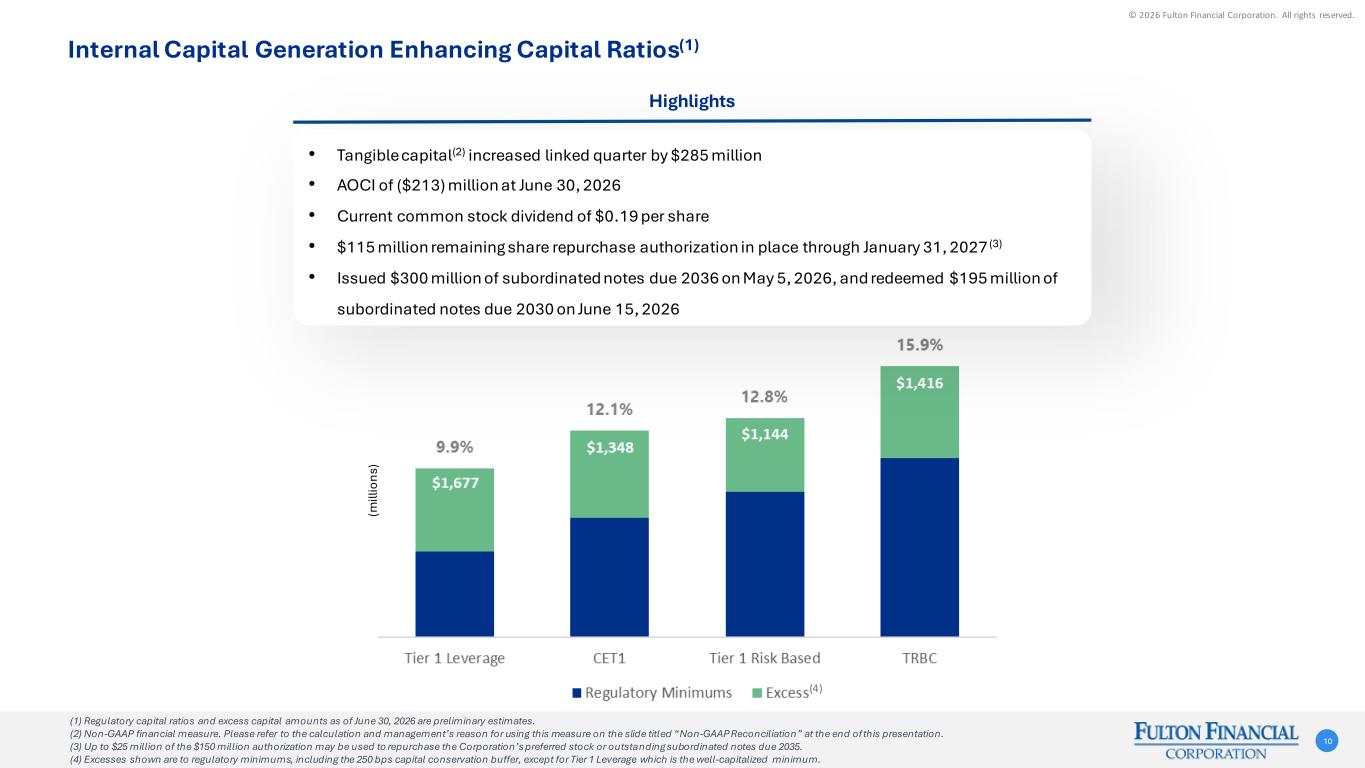
© 2026 Fulton Financial Corporation. All rights reserved. Internal Capital Generation Enhancing Capital Ratios(1) 10 (4) (m ill io ns ) • Tangible capital(2) increased linked quarter by $285 million • AOCI of ($213) million at June 30, 2026 • Current common stock dividend of $0.19 per share • $115 million remaining share repurchase authorization in place through January 31, 2027 (3) • Issued $300 million of subordinated notes due 2036 on May 5, 2026, and redeemed $195 million of subordinated notes due 2030 on June 15, 2026 Highlights (1) Regulatory capital ratios and excess capital amounts as of June 30, 2026 are preliminary estimates. (2) Non-GAAP financial measure. Please refer to the calculation and management’s reason for using this measure on the slide titled “Non-GAAP Reconciliation” at the end of this presentation. (3) Up to $25 million of the $150 million authorization may be used to repurchase the Corporation’s preferred stock or outstanding subordinated notes due 2035. (4) Excesses shown are to regulatory minimums, including the 250 bps capital conservation buffer, except for Tier 1 Leverage which is the well-capitalized minimum.
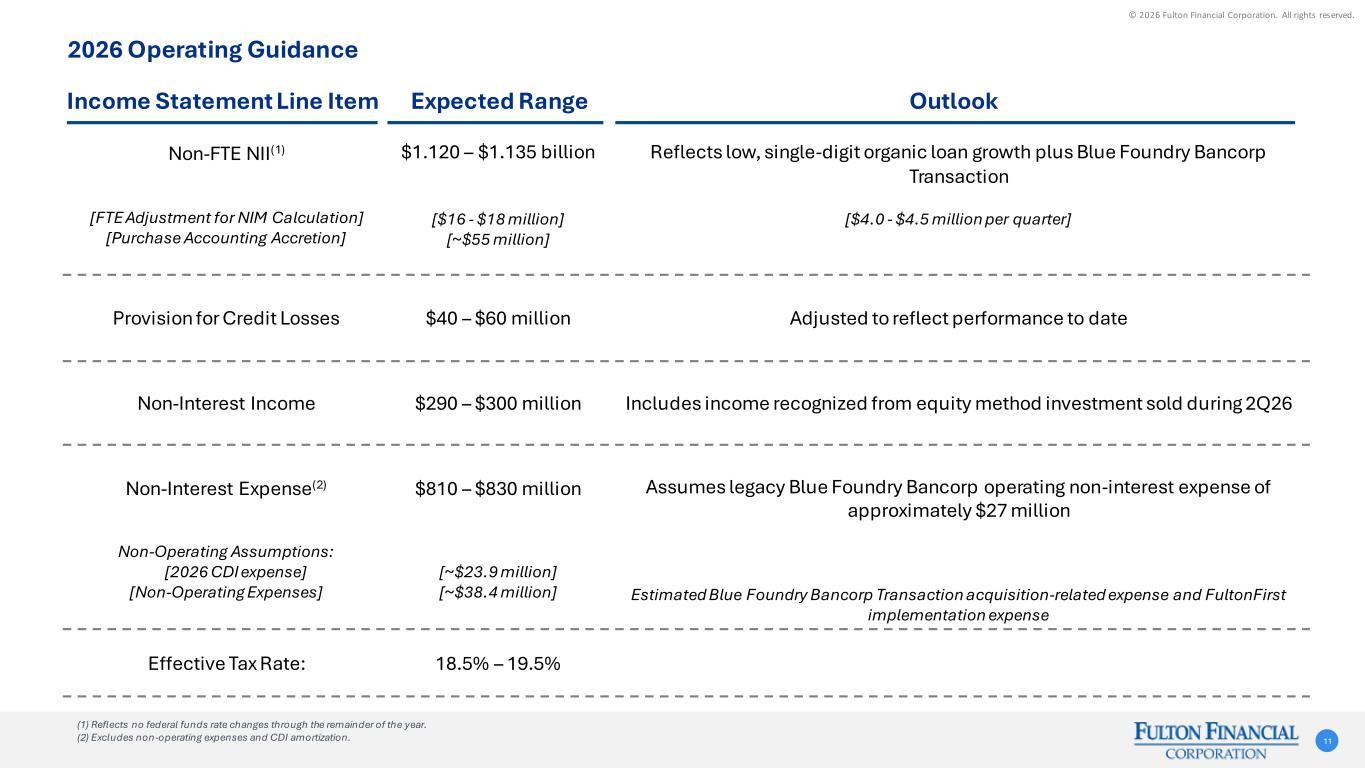
© 2026 Fulton Financial Corporation. All rights reserved. 2026 Operating Guidance 11 Non-FTE NII(1) [FTE Adjustment for NIM Calculation] [Purchase Accounting Accretion] $1.120 – $1.135 billion [$16 - $18 million] [~$55 million] Reflects low, single-digit organic loan growth plus Blue Foundry Bancorp Transaction [$4.0 - $4.5 million per quarter] Provision for Credit Losses $40 – $60 million Adjusted to reflect performance to date Non-Interest Income $290 – $300 million Includes income recognized from equity method investment sold during 2Q26 Non-Interest Expense(2) Non-Operating Assumptions: [2026 CDI expense] [Non-Operating Expenses] $810 – $830 million [~$23.9 million] [~$38.4 million] Assumes legacy Blue Foundry Bancorp operating non-interest expense of approximately $27 million Estimated Blue Foundry Bancorp Transaction acquisition-related expense and FultonFirst implementation expense Effective Tax Rate: 18.5% – 19.5% Income Statement Line Item Expected Range Outlook (1) Reflects no federal funds rate changes through the remainder of the year. (2) Excludes non-operating expenses and CDI amortization.
© 2026 Fulton Financial Corporation. All rights reserved. CORPORATE HIGHLIGHTS 12
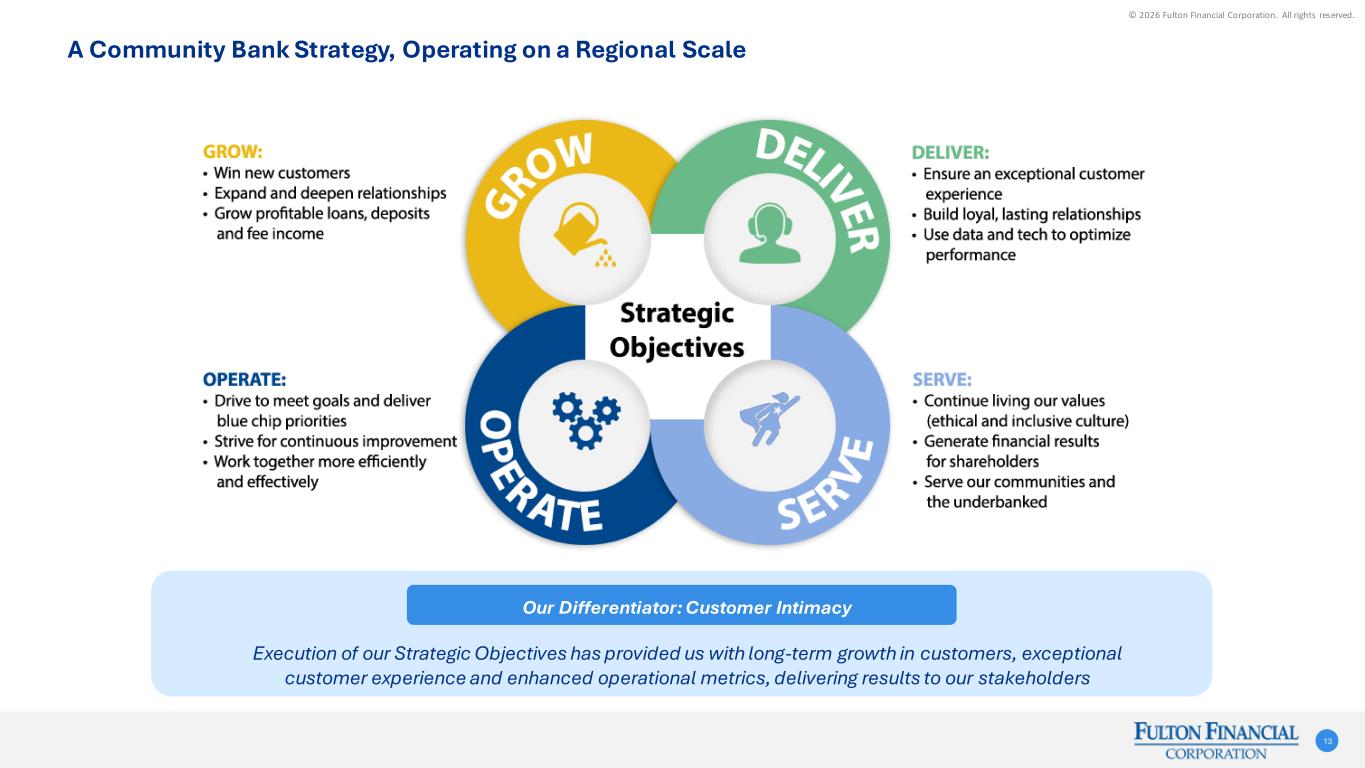
© 2026 Fulton Financial Corporation. All rights reserved. A Community Bank Strategy, Operating on a Regional Scale 13 Execution of our Strategic Objectives has provided us with long-term growth in customers, exceptional customer experience and enhanced operational metrics, delivering results to our stakeholders Our Differentiator: Customer Intimacy
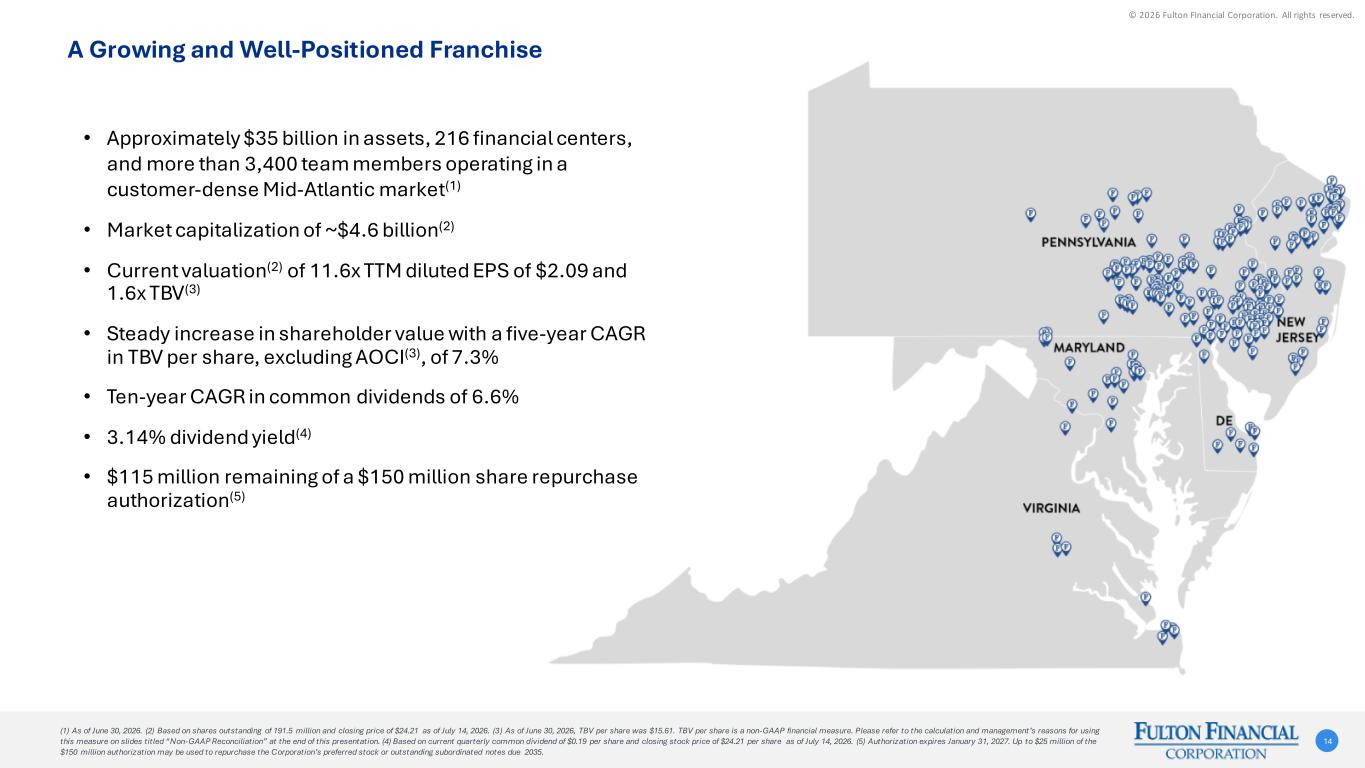
© 2026 Fulton Financial Corporation. All rights reserved. • Approximately $35 billion in assets, 216 financial centers, and more than 3,400 team members operating in a customer-dense Mid-Atlantic market(1) • Market capitalization of ~$4.6 billion(2) • Current valuation(2) of 11.6x TTM diluted EPS of $2.09 and 1.6x TBV(3) • Steady increase in shareholder value with a five-year CAGR in TBV per share, excluding AOCI(3), of 7.3% • Ten-year CAGR in common dividends of 6.6% • 3.14% dividend yield(4) • $115 million remaining of a $150 million share repurchase authorization(5) (1) As of June 30, 2026. (2) Based on shares outstanding of 191.5 million and closing price of $24.21 as of July 14, 2026. (3) As of June 30, 2026, TBV per share was $15.61. TBV per share is a non-GAAP financial measure. Please refer to the calculation and management’s reasons for using this measure on slides titled “Non-GAAP Reconciliation” at the end of this presentation. (4) Based on current quarterly common dividend of $0.19 per share and closing stock price of $24.21 per share as of July 14, 2026. (5) Authorization expires January 31, 2027. Up to $25 million of the $150 million authorization may be used to repurchase the Corporation’s preferred stock or outstanding subordinated notes due 2035. A Growing and Well-Positioned Franchise 14
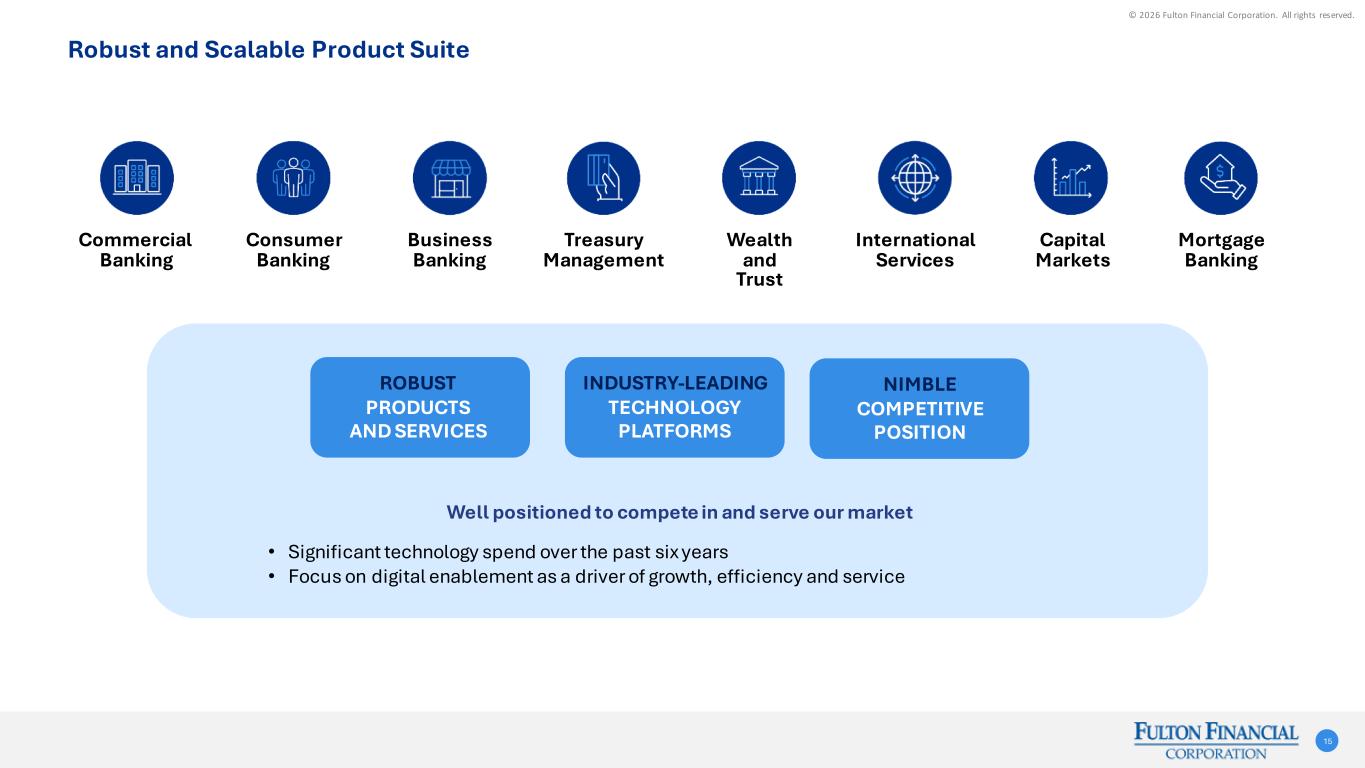
© 2026 Fulton Financial Corporation. All rights reserved. Robust and Scalable Product Suite 15 Commercial Banking Consumer Banking Business Banking Treasury Management Wealth and Trust International Services Capital Markets Mortgage Banking • Significant technology spend over the past six years • Focus on digital enablement as a driver of growth, efficiency and service Well positioned to compete in and serve our market ROBUST PRODUCTS AND SERVICES INDUSTRY-LEADING TECHNOLOGY PLATFORMS NIMBLE COMPETITIVE POSITION
© 2026 Fulton Financial Corporation. All rights reserved. We Do What is Right - Corporate Social Responsibility 16 • Our most recent Corporate Social Responsibility Report with key metrics is available at fultonbank.com/about-fulton-bank. • Integrity is fundamental to governance at Fulton. The Corporation’s established Board governance and oversight support management’s efforts to build maturity and capability that drives impact. • The Climate Impact Working Group underscores the Corporation’s commitment to progressing its understanding of, and reporting on, climate-related risks and activities. PROTECTING THE ENVIRONMENT Environment The Corporation is committed to practicing environmental stewardship in its everyday operations. Operational measures like waste reduction and smart energy use, as well as financing sustainable projects, are core to these efforts. CORPORATE GOVERNANCE Governance Core values and guiding behavior lead the Corporation to demonstrate the highest professional and ethical standards in all business activities. The Corporation operates under a robust board- and management-level enterprise risk management structure. CHANGING LIVES FOR THE BETTER Employees The Corporation is committed to creating a workforce culture that is welcoming, engaging and inclusive. Customers Fulton Bank has a proven track record of fair and responsible banking – rated “Outstanding” for Community Reinvestment Act performance. Community Employees live and work in the communities we serve and want to see these communities thrive. Through the “Fulton Forward® initiative, the Corporation gives back by paying it forward. READ THE REPORT
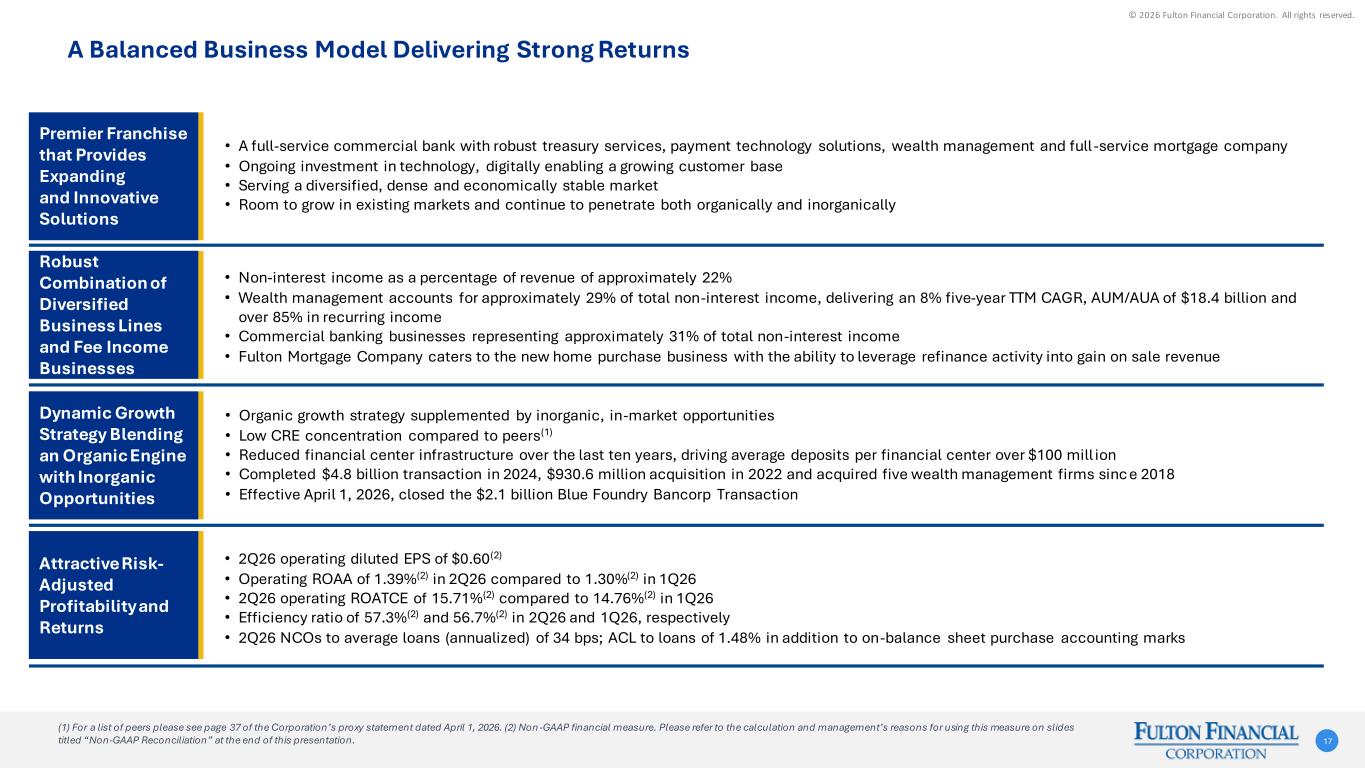
© 2026 Fulton Financial Corporation. All rights reserved. A Balanced Business Model Delivering Strong Returns 17 • Non-interest income as a percentage of revenue of approximately 22% • Wealth management accounts for approximately 29% of total non-interest income, delivering an 8% five-year TTM CAGR, AUM/AUA of $18.4 billion and over 85% in recurring income • Commercial banking businesses representing approximately 31% of total non-interest income • Fulton Mortgage Company caters to the new home purchase business with the ability to leverage refinance activity into gain on sale revenue • A full-service commercial bank with robust treasury services, payment technology solutions, wealth management and full -service mortgage company • Ongoing investment in technology, digitally enabling a growing customer base • Serving a diversified, dense and economically stable market • Room to grow in existing markets and continue to penetrate both organically and inorganically • Organic growth strategy supplemented by inorganic, in-market opportunities • Low CRE concentration compared to peers(1) • Reduced financial center infrastructure over the last ten years, driving average deposits per financial center over $100 mill ion • Completed $4.8 billion transaction in 2024, $930.6 million acquisition in 2022 and acquired five wealth management firms sinc e 2018 • Effective April 1, 2026, closed the $2.1 billion Blue Foundry Bancorp Transaction • 2Q26 operating diluted EPS of $0.60(2) • Operating ROAA of 1.39%(2) in 2Q26 compared to 1.30%(2) in 1Q26 • 2Q26 operating ROATCE of 15.71%(2) compared to 14.76%(2) in 1Q26 • Efficiency ratio of 57.3%(2) and 56.7%(2) in 2Q26 and 1Q26, respectively • 2Q26 NCOs to average loans (annualized) of 34 bps; ACL to loans of 1.48% in addition to on-balance sheet purchase accounting marks Premier Franchise that Provides Expanding and Innovative Solutions Robust Combination of Diversified Business Lines and Fee Income Businesses Dynamic Growth Strategy Blending an Organic Engine with Inorganic Opportunities Attractive Risk- Adjusted Profitability and Returns (1) For a list of peers please see page 37 of the Corporation’s proxy statement dated April 1, 2026. (2) Non -GAAP financial measure. Please refer to the calculation and management’s reasons for using this measure on slides titled “Non-GAAP Reconciliation” at the end of this presentation.
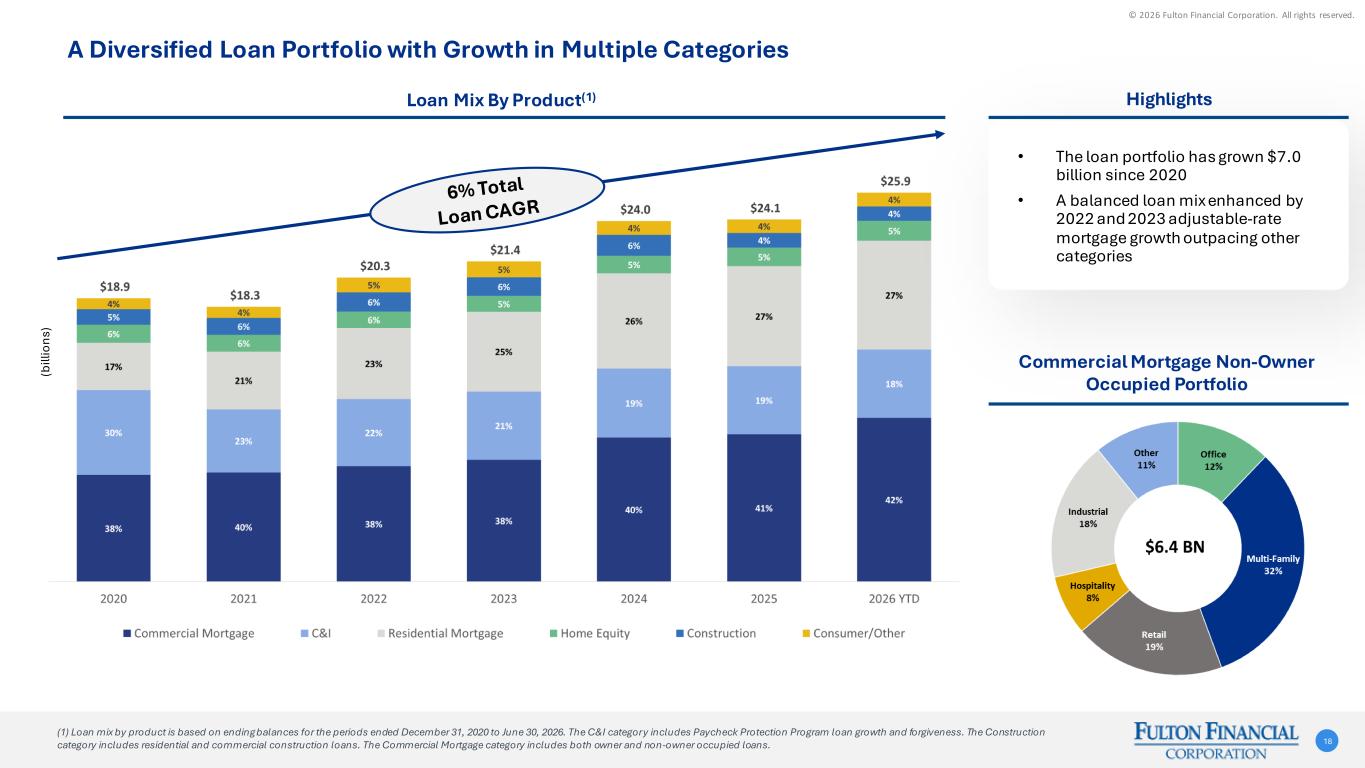
© 2026 Fulton Financial Corporation. All rights reserved. A Diversified Loan Portfolio with Growth in Multiple Categories 18 Loan Mix By Product(1) Highlights • The loan portfolio has grown $7.0 billion since 2020 • A balanced loan mix enhanced by 2022 and 2023 adjustable-rate mortgage growth outpacing other categories Commercial Mortgage Non-Owner Occupied Portfolio 18 (b ill io ns ) (1) Loan mix by product is based on ending balances for the periods ended December 31, 2020 to June 30, 2026. The C&I category includes Paycheck Protection Program loan growth and forgiveness. The Construction category includes residential and commercial construction loans. The Commercial Mortgage category includes both owner and non-owner occupied loans.
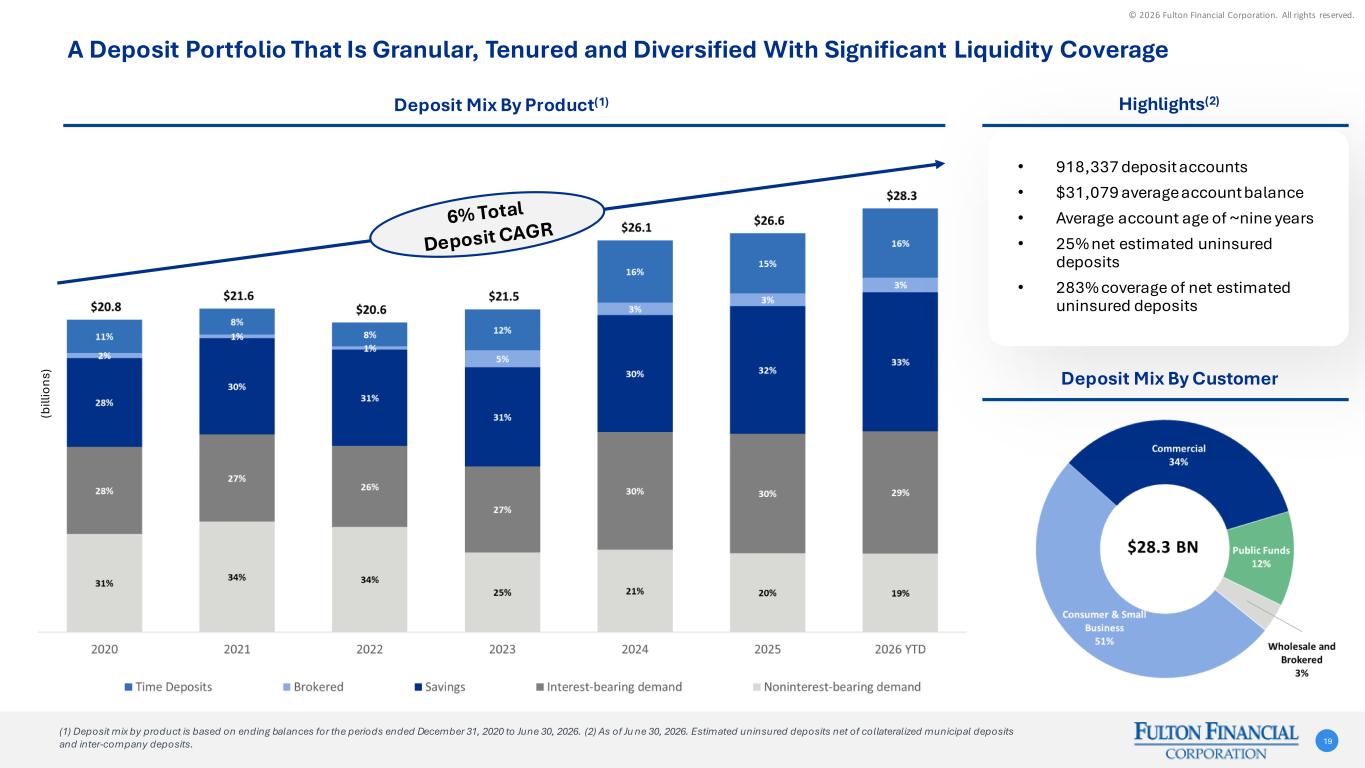
© 2026 Fulton Financial Corporation. All rights reserved. A Deposit Portfolio That Is Granular, Tenured and Diversified With Significant Liquidity Coverage Deposit Mix By Product(1) Highlights(2) • 918,337 deposit accounts • $31,079 average account balance • Average account age of ~nine years • 25% net estimated uninsured deposits • 283% coverage of net estimated uninsured deposits Deposit Mix By Customer 19 (b ill io ns ) (1) Deposit mix by product is based on ending balances for the periods ended December 31, 2020 to June 30, 2026. (2) As of Ju ne 30, 2026. Estimated uninsured deposits net of collateralized municipal deposits and inter-company deposits.
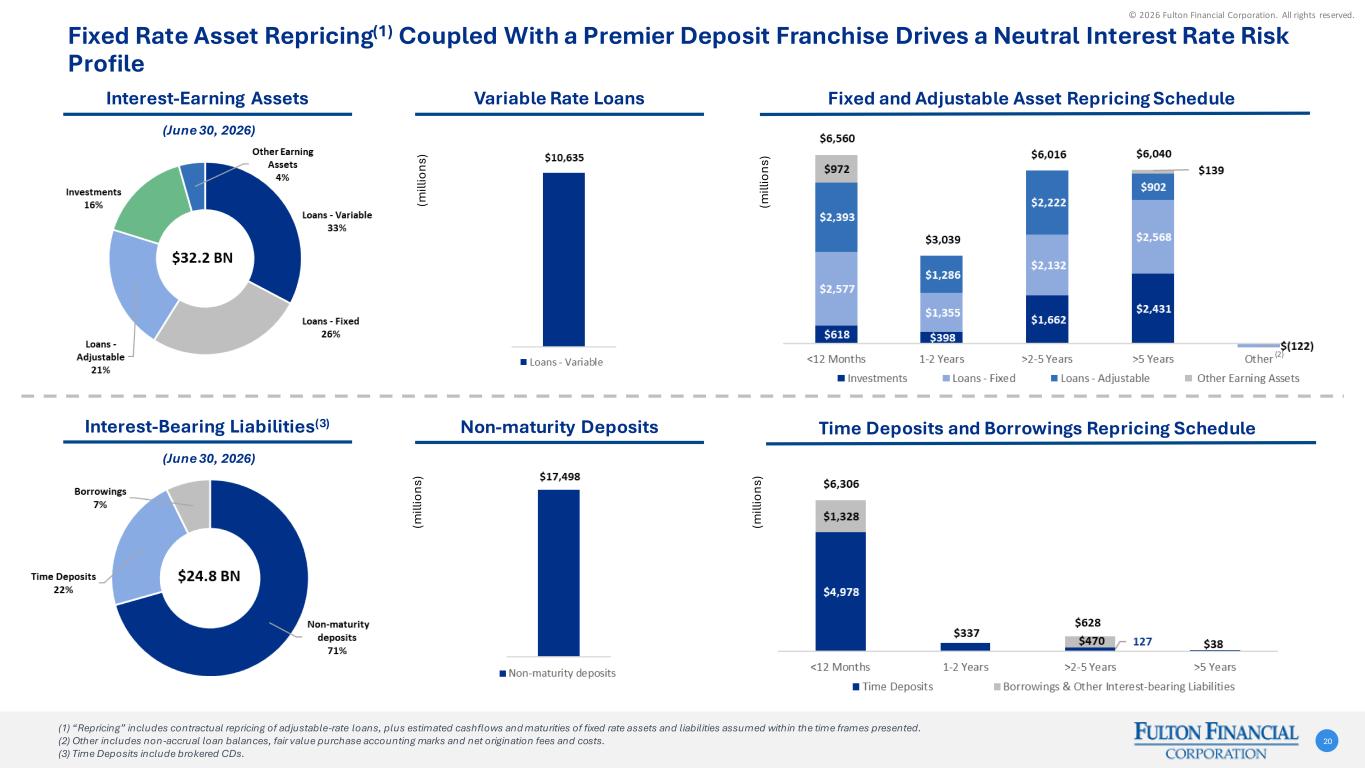
© 2026 Fulton Financial Corporation. All rights reserved. Fixed Rate Asset Repricing(1) Coupled With a Premier Deposit Franchise Drives a Neutral Interest Rate Risk Profile 20 Interest-Earning Assets 20 (June 30, 2026) Interest-Bearing Liabilities(3) (June 30, 2026) Variable Rate Loans Non-maturity Deposits Fixed and Adjustable Asset Repricing Schedule (m ill io ns ) (m ill io ns ) (m ill io ns ) (m ill io ns ) Time Deposits and Borrowings Repricing Schedule (2) (1) “Repricing” includes contractual repricing of adjustable-rate loans, plus estimated cashflows and maturities of fixed rate assets and liabilities assumed within the time frames presented. (2) Other includes non-accrual loan balances, fair value purchase accounting marks and net origination fees and costs. (3) Time Deposits include brokered CDs.
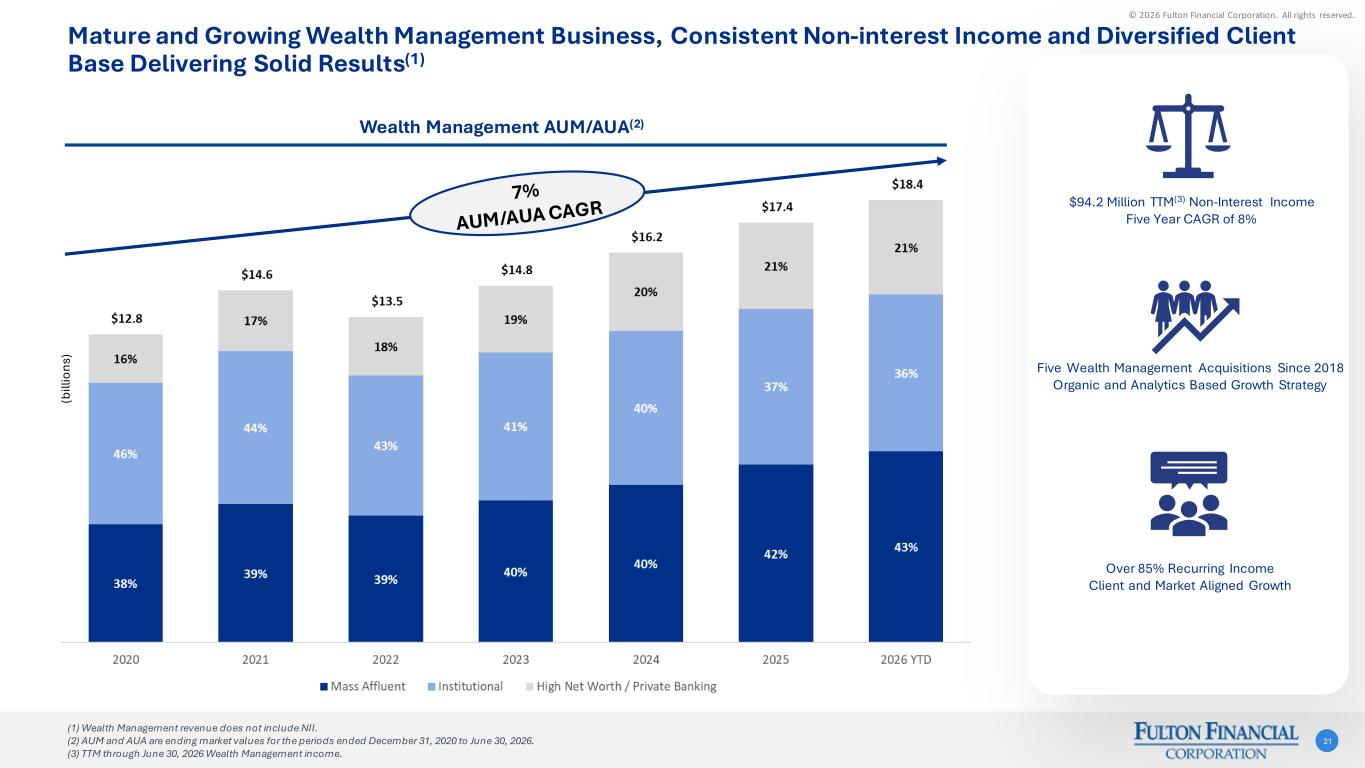
© 2026 Fulton Financial Corporation. All rights reserved. Mature and Growing Wealth Management Business, Consistent Non-interest Income and Diversified Client Base Delivering Solid Results(1) 21 Over 85% Recurring Income Client and Market Aligned Growth $94.2 Million TTM(3) Non-Interest Income Five Year CAGR of 8% Five Wealth Management Acquisitions Since 2018 Organic and Analytics Based Growth Strategy Wealth Management AUM/AUA(2) (b ill io ns ) (1) Wealth Management revenue does not include NII. (2) AUM and AUA are ending market values for the periods ended December 31, 2020 to June 30, 2026. (3) TTM through June 30, 2026 Wealth Management income.
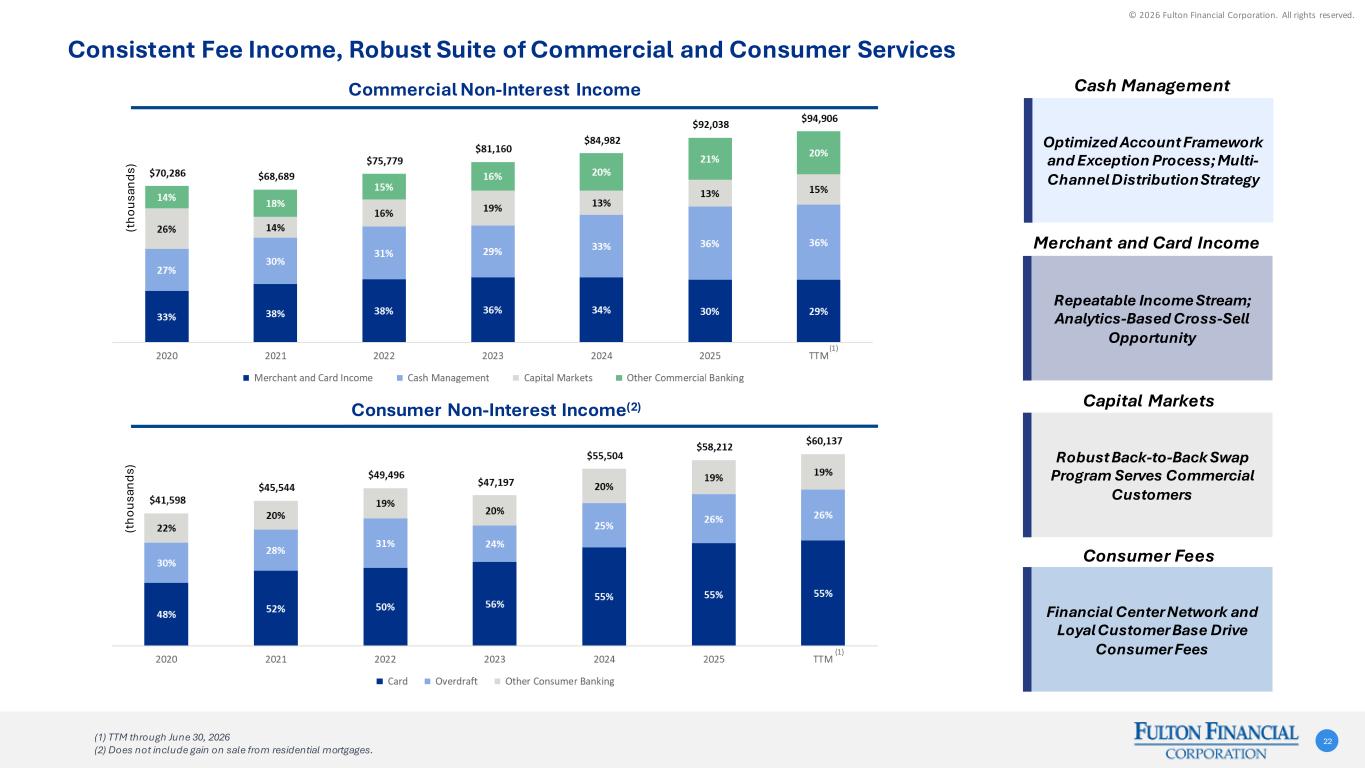
© 2026 Fulton Financial Corporation. All rights reserved. Consistent Fee Income, Robust Suite of Commercial and Consumer Services 22 Repeatable Income Stream; Analytics-Based Cross-Sell Opportunity Optimized Account Framework and Exception Process; Multi- Channel Distribution Strategy Robust Back-to-Back Swap Program Serves Commercial Customers Financial Center Network and Loyal Customer Base Drive Consumer Fees Merchant and Card Income Cash Management Capital Markets Consumer Fees Commercial Non-Interest Income Consumer Non-Interest Income(2) (t ho us an ds ) (t ho us an ds ) (1) TTM through June 30, 2026 (2) Does not include gain on sale from residential mortgages. (1) (1)
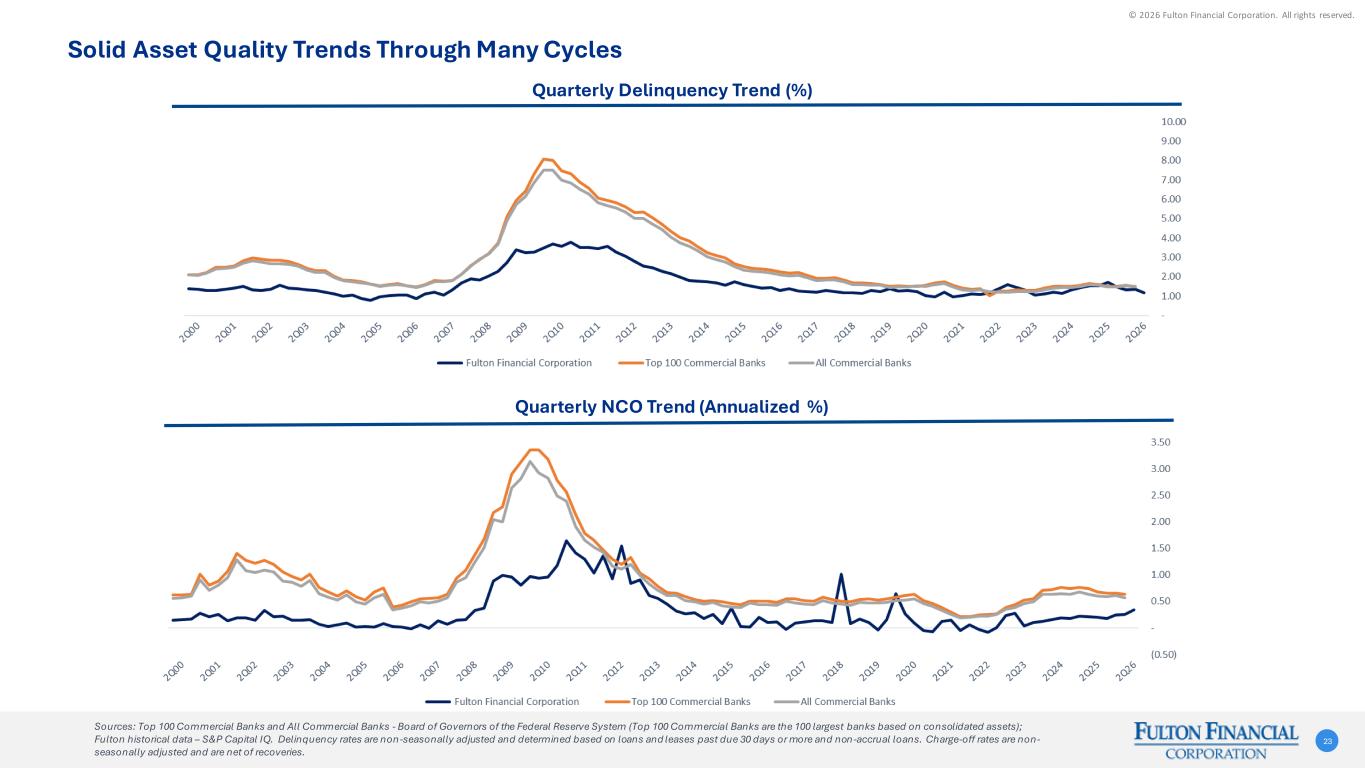
© 2026 Fulton Financial Corporation. All rights reserved. Solid Asset Quality Trends Through Many Cycles 23 Quarterly Delinquency Trend (%) Quarterly NCO Trend (Annualized %) Sources: Top 100 Commercial Banks and All Commercial Banks - Board of Governors of the Federal Reserve System (Top 100 Commercial Banks are the 100 largest banks based on consolidated assets); Fulton historical data – S&P Capital IQ. Delinquency rates are non-seasonally adjusted and determined based on loans and leases past due 30 days or more and non-accrual loans. Charge-off rates are non- seasonally adjusted and are net of recoveries.
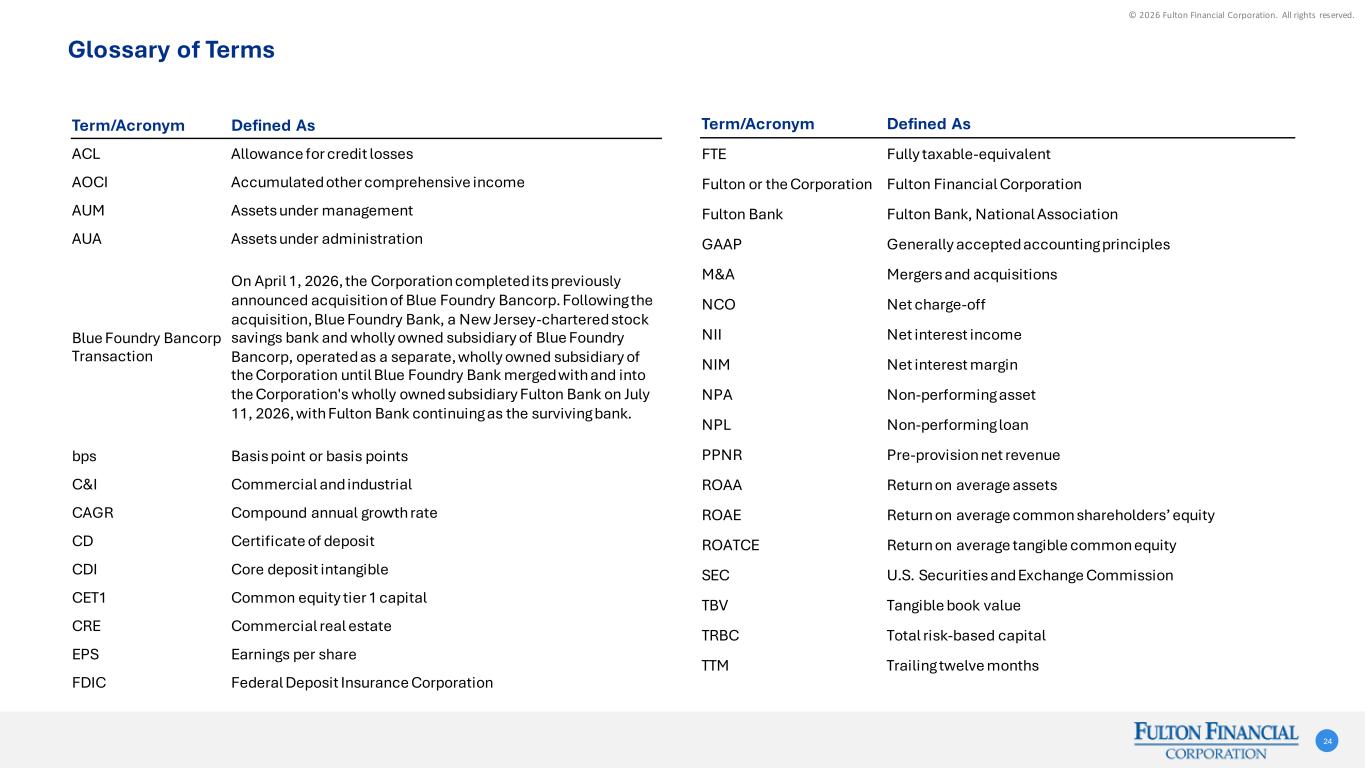
© 2026 Fulton Financial Corporation. All rights reserved. Glossary of Terms 24 Term/Acronym Defined As ACL Allowance for credit losses AOCI Accumulated other comprehensive income AUM Assets under management AUA Assets under administration Blue Foundry Bancorp Transaction On April 1, 2026, the Corporation completed its previously announced acquisition of Blue Foundry Bancorp. Following the acquisition, Blue Foundry Bank, a New Jersey-chartered stock savings bank and wholly owned subsidiary of Blue Foundry Bancorp, operated as a separate, wholly owned subsidiary of the Corporation until Blue Foundry Bank merged with and into the Corporation's wholly owned subsidiary Fulton Bank on July 11, 2026, with Fulton Bank continuing as the surviving bank. bps Basis point or basis points C&I Commercial and industrial CAGR Compound annual growth rate CD Certificate of deposit CDI Core deposit intangible CET1 Common equity tier 1 capital CRE Commercial real estate EPS Earnings per share FDIC Federal Deposit Insurance Corporation Term/Acronym Defined As FTE Fully taxable-equivalent Fulton or the Corporation Fulton Financial Corporation Fulton Bank Fulton Bank, National Association GAAP Generally accepted accounting principles M&A Mergers and acquisitions NCO Net charge-off NII Net interest income NIM Net interest margin NPA Non-performing asset NPL Non-performing loan PPNR Pre-provision net revenue ROAA Return on average assets ROAE Return on average common shareholders’ equity ROATCE Return on average tangible common equity SEC U.S. Securities and Exchange Commission TBV Tangible book value TRBC Total risk-based capital TTM Trailing twelve months

© 2026 Fulton Financial Corporation. All rights reserved. NON-GAAP RECONCILIATION 25
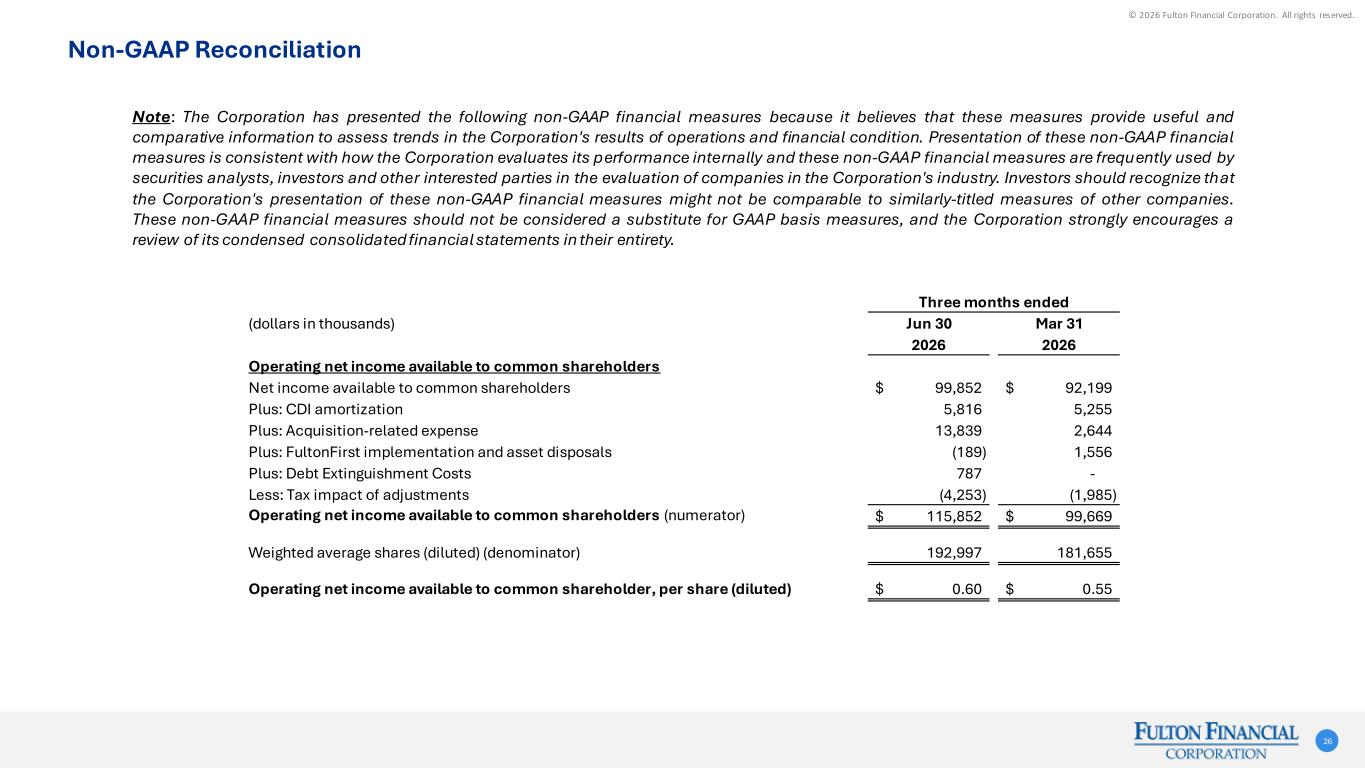
© 2026 Fulton Financial Corporation. All rights reserved. Three months ended (dollars in thousands) Jun 30 Mar 31 2026 2026 Operating net income available to common shareholders Net income available to common shareholders 99,852$ 92,199$ Plus: CDI amortization 5,816 5,255 Plus: Acquisition-related expense 13,839 2,644 Plus: FultonFirst implementation and asset disposals (189) 1,556 Plus: Debt Extinguishment Costs 787 - Less: Tax impact of adjustments (4,253) (1,985) Operating net income available to common shareholders (numerator) 115,852$ 99,669$ Weighted average shares (diluted) (denominator) 192,997 181,655 Operating net income available to common shareholder, per share (diluted) 0.60$ 0.55$ Non-GAAP Reconciliation 26 Note: The Corporation has presented the following non-GAAP financial measures because it believes that these measures provide useful and comparative information to assess trends in the Corporation's results of operations and financial condition. Presentation of these non-GAAP financial measures is consistent with how the Corporation evaluates its performance internally and these non-GAAP financial measures are frequently used by securities analysts, investors and other interested parties in the evaluation of companies in the Corporation's industry. Investors should recognize that the Corporation's presentation of these non-GAAP financial measures might not be comparable to similarly-titled measures of other companies. These non-GAAP financial measures should not be considered a substitute for GAAP basis measures, and the Corporation strongly encourages a review of its condensed consolidated financial statements in their entirety.
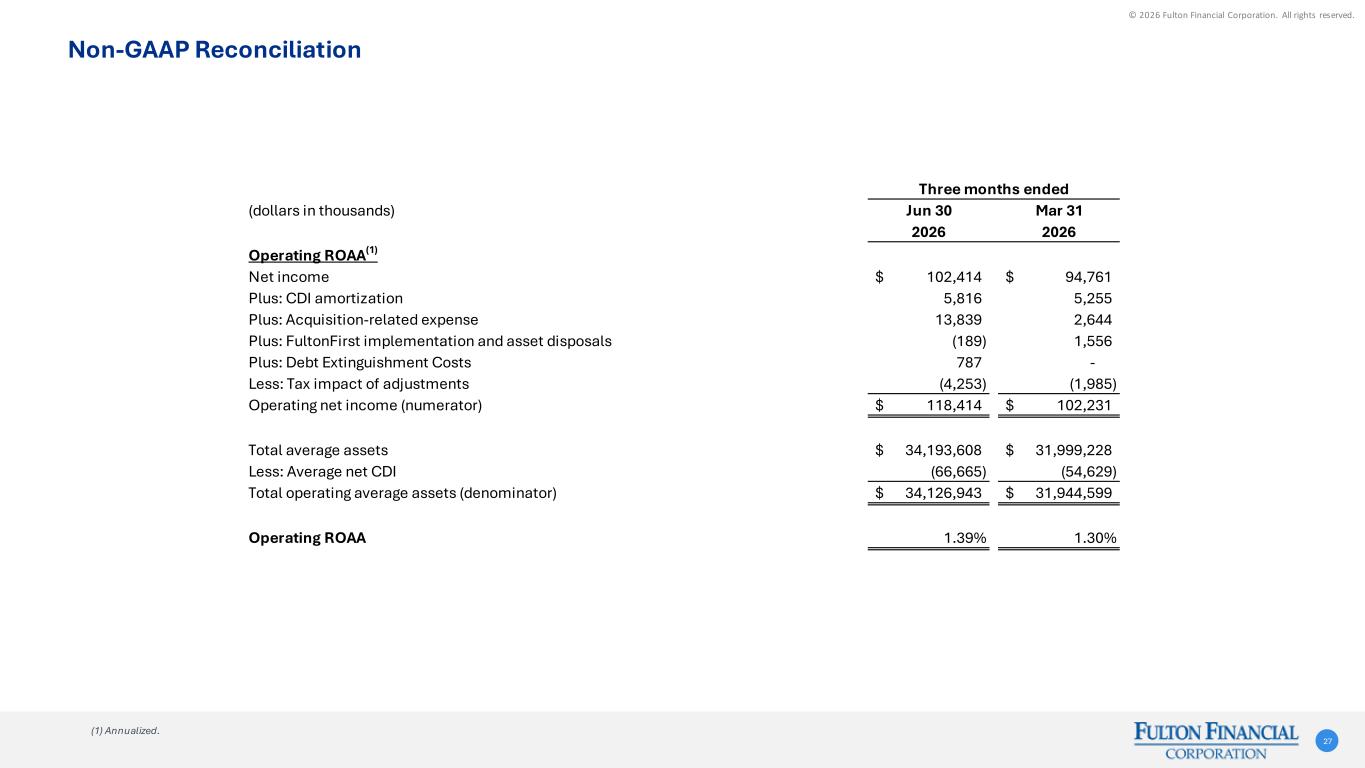
© 2026 Fulton Financial Corporation. All rights reserved. Three months ended (dollars in thousands) Jun 30 Mar 31 2026 2026 Operating ROAA(1) Net income 102,414$ 94,761$ Plus: CDI amortization 5,816 5,255 Plus: Acquisition-related expense 13,839 2,644 Plus: FultonFirst implementation and asset disposals (189) 1,556 Plus: Debt Extinguishment Costs 787 - Less: Tax impact of adjustments (4,253) (1,985) Operating net income (numerator) 118,414$ 102,231$ Total average assets 34,193,608$ 31,999,228$ Less: Average net CDI (66,665) (54,629) Total operating average assets (denominator) 34,126,943$ 31,944,599$ Operating ROAA 1.39% 1.30% Non-GAAP Reconciliation 27 (1) Annualized.
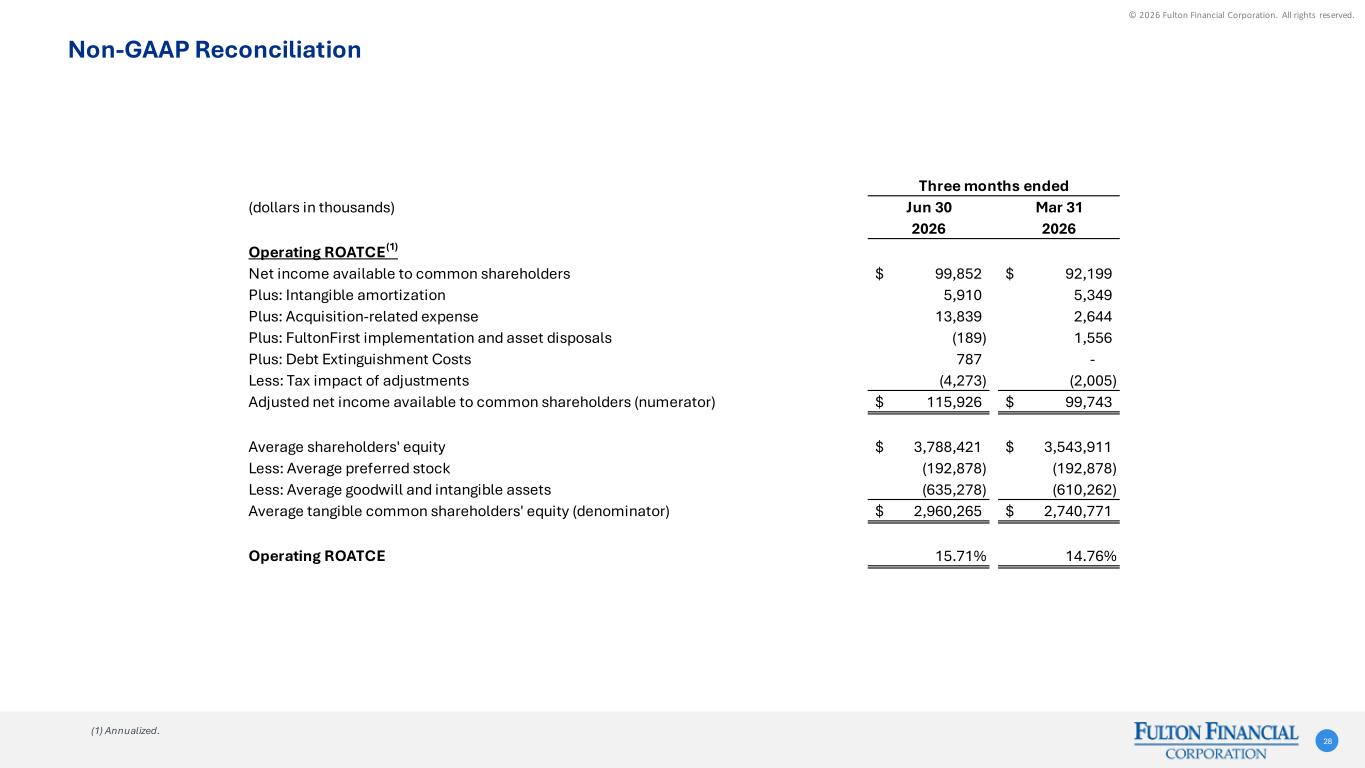
© 2026 Fulton Financial Corporation. All rights reserved. Three months ended (dollars in thousands) Jun 30 Mar 31 2026 2026 Operating ROATCE(1) Net income available to common shareholders 99,852$ 92,199$ Plus: Intangible amortization 5,910 5,349 Plus: Acquisition-related expense 13,839 2,644 Plus: FultonFirst implementation and asset disposals (189) 1,556 Plus: Debt Extinguishment Costs 787 - Less: Tax impact of adjustments (4,273) (2,005) Adjusted net income available to common shareholders (numerator) 115,926$ 99,743$ Average shareholders' equity 3,788,421$ 3,543,911$ Less: Average preferred stock (192,878) (192,878) Less: Average goodwill and intangible assets (635,278) (610,262) Average tangible common shareholders' equity (denominator) 2,960,265$ 2,740,771$ Operating ROATCE 15.71% 14.76% Non-GAAP Reconciliation 28 (1) Annualized.
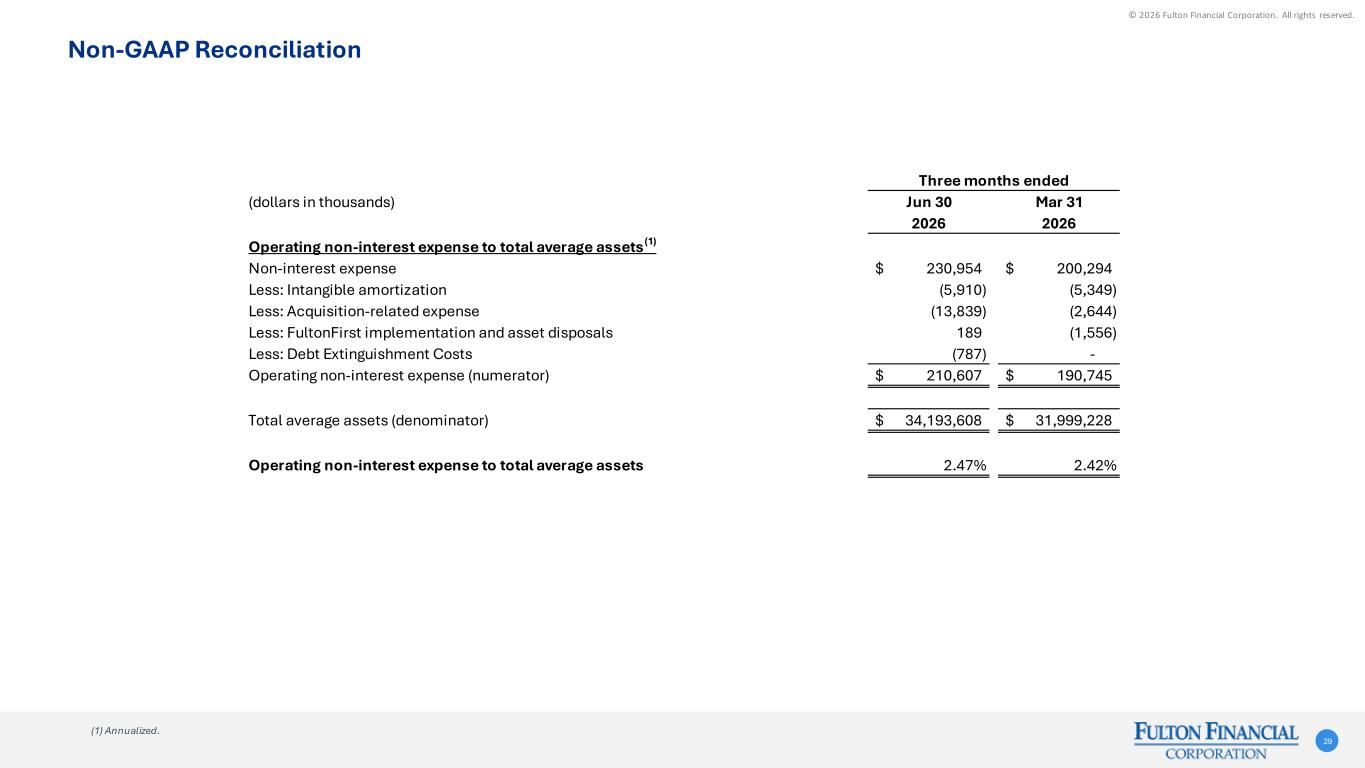
© 2026 Fulton Financial Corporation. All rights reserved. Three months ended (dollars in thousands) Jun 30 Mar 31 2026 2026 Operating non-interest expense to total average assets (1) Non-interest expense 230,954$ 200,294$ Less: Intangible amortization (5,910) (5,349) Less: Acquisition-related expense (13,839) (2,644) Less: FultonFirst implementation and asset disposals 189 (1,556) Less: Debt Extinguishment Costs (787) - Operating non-interest expense (numerator) 210,607$ 190,745$ Total average assets (denominator) 34,193,608$ 31,999,228$ Operating non-interest expense to total average assets 2.47% 2.42% Non-GAAP Reconciliation 29 (1) Annualized.
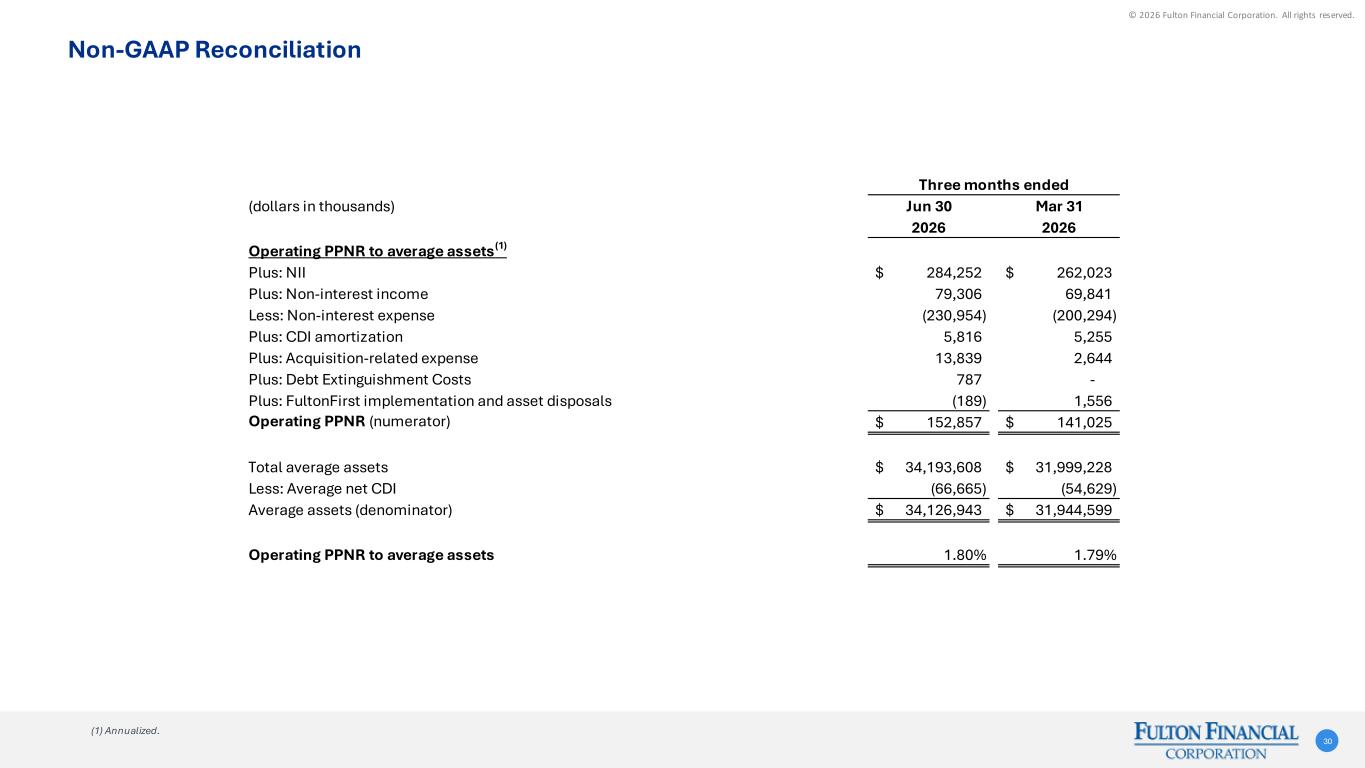
© 2026 Fulton Financial Corporation. All rights reserved. Three months ended (dollars in thousands) Jun 30 Mar 31 2026 2026 Operating PPNR to average assets(1) Plus: NII 284,252$ 262,023$ Plus: Non-interest income 79,306 69,841 Less: Non-interest expense (230,954) (200,294) Plus: CDI amortization 5,816 5,255 Plus: Acquisition-related expense 13,839 2,644 Plus: Debt Extinguishment Costs 787 - Plus: FultonFirst implementation and asset disposals (189) 1,556 Operating PPNR (numerator) 152,857$ 141,025$ Total average assets 34,193,608$ 31,999,228$ Less: Average net CDI (66,665) (54,629) Average assets (denominator) 34,126,943$ 31,944,599$ Operating PPNR to average assets 1.80% 1.79% Non-GAAP Reconciliation 30 (1) Annualized.
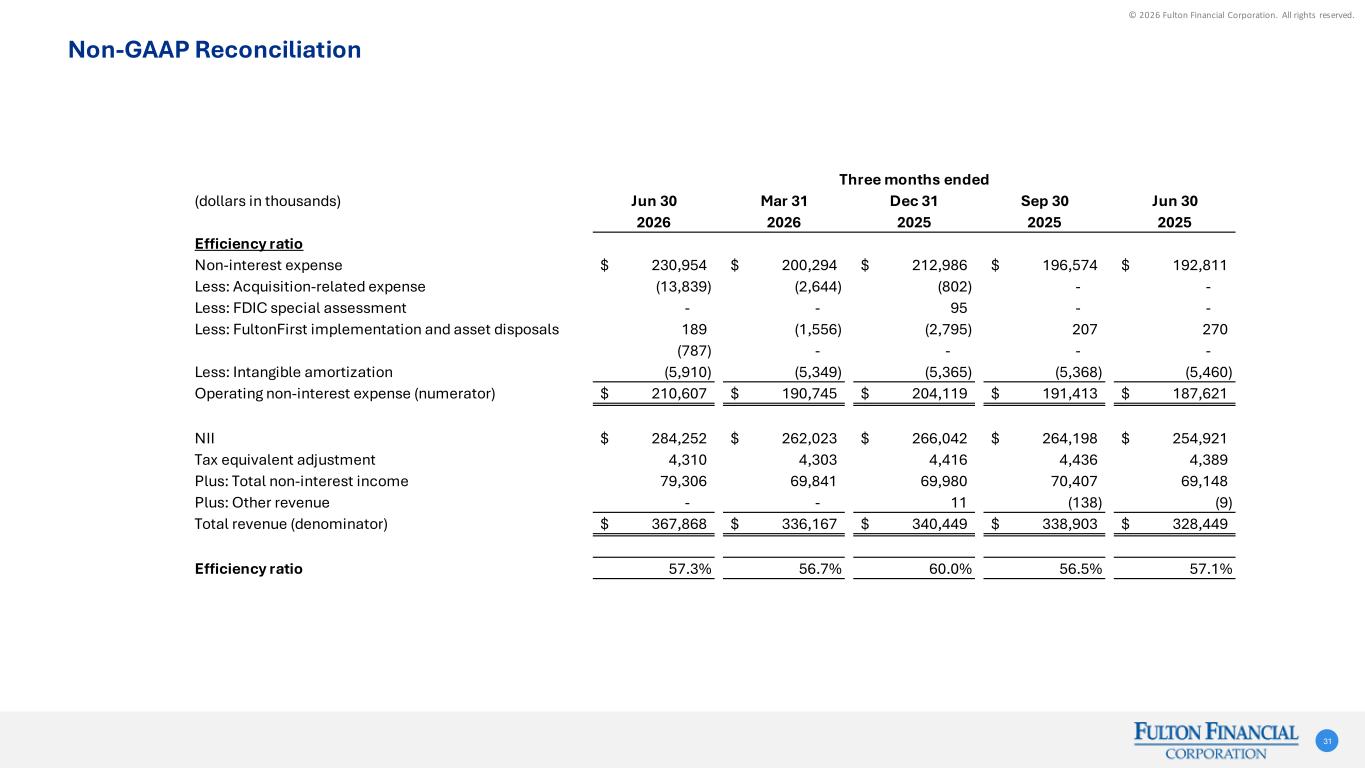
© 2026 Fulton Financial Corporation. All rights reserved. (dollars in thousands) Jun 30 Mar 31 Dec 31 Sep 30 Jun 30 2026 2026 2025 2025 2025 Efficiency ratio Non-interest expense 230,954$ 200,294$ 212,986$ 196,574$ 192,811$ Less: Acquisition-related expense (13,839) (2,644) (802) - - Less: FDIC special assessment - - 95 - - Less: FultonFirst implementation and asset disposals 189 (1,556) (2,795) 207 270 (787) - - - - Less: Intangible amortization (5,910) (5,349) (5,365) (5,368) (5,460) Operating non-interest expense (numerator) 210,607$ 190,745$ 204,119$ 191,413$ 187,621$ NII 284,252$ 262,023$ 266,042$ 264,198$ 254,921$ Tax equivalent adjustment 4,310 4,303 4,416 4,436 4,389 Plus: Total non-interest income 79,306 69,841 69,980 70,407 69,148 Plus: Other revenue - - 11 (138) (9) Total revenue (denominator) 367,868$ 336,167$ 340,449$ 338,903$ 328,449$ Efficiency ratio 57.3% 56.7% 60.0% 56.5% 57.1% Three months ended Non-GAAP Reconciliation 31
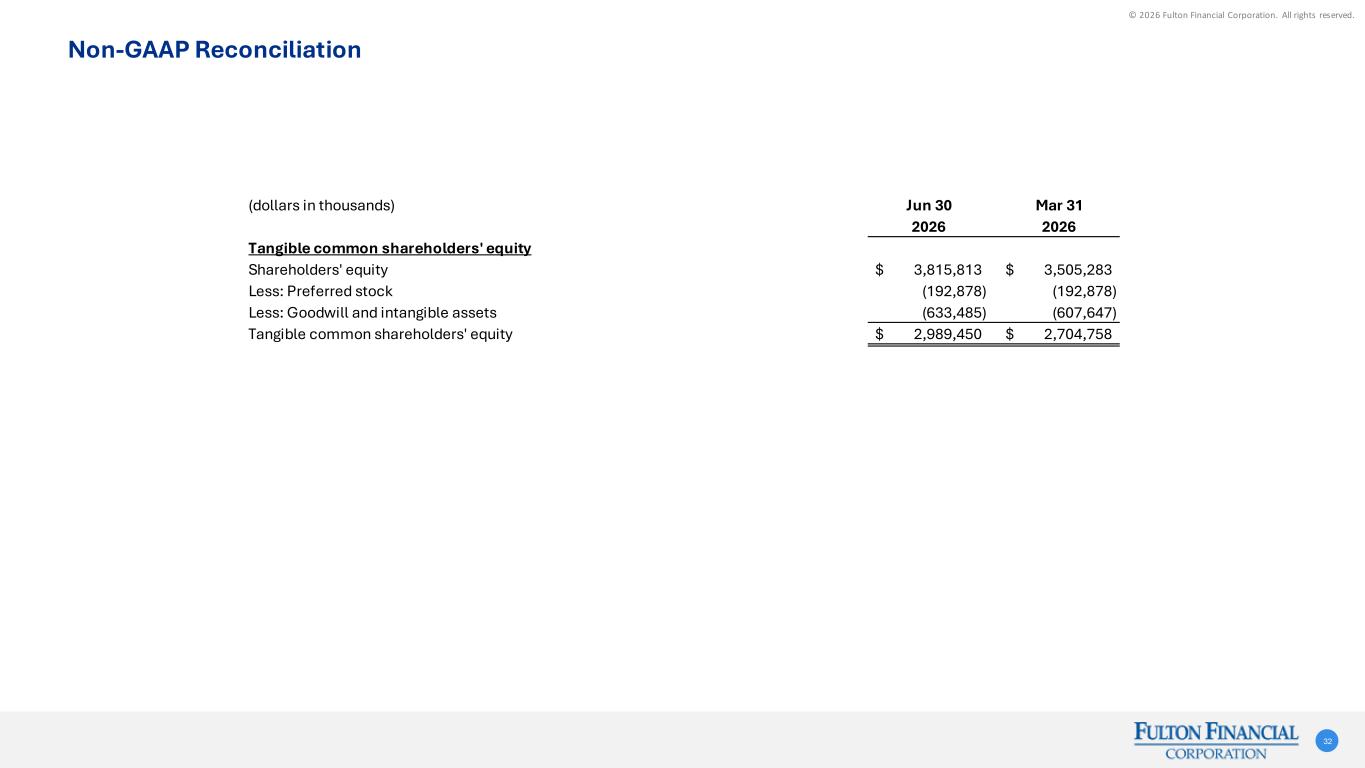
© 2026 Fulton Financial Corporation. All rights reserved. (dollars in thousands) Jun 30 Mar 31 2026 2026 Tangible common shareholders' equity Shareholders' equity 3,815,813$ 3,505,283$ Less: Preferred stock (192,878) (192,878) Less: Goodwill and intangible assets (633,485) (607,647) Tangible common shareholders' equity 2,989,450$ 2,704,758$ Non-GAAP Reconciliation 32
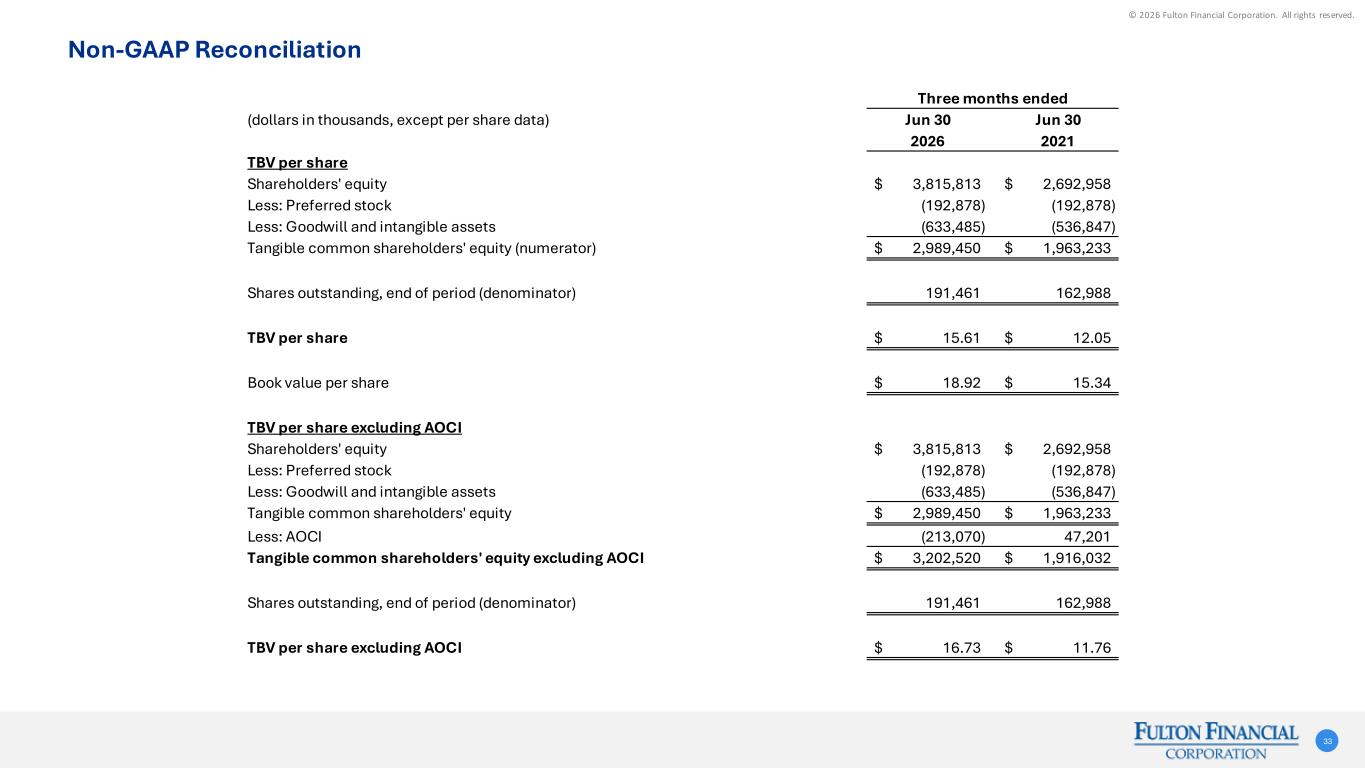
© 2026 Fulton Financial Corporation. All rights reserved. Three months ended (dollars in thousands, except per share data) Jun 30 Jun 30 2026 2021 TBV per share Shareholders' equity 3,815,813$ 2,692,958$ Less: Preferred stock (192,878) (192,878) Less: Goodwill and intangible assets (633,485) (536,847) Tangible common shareholders' equity (numerator) 2,989,450$ 1,963,233$ Shares outstanding, end of period (denominator) 191,461 162,988 TBV per share 15.61$ 12.05$ Book value per share 18.92$ 15.34$ TBV per share excluding AOCI Shareholders' equity 3,815,813$ 2,692,958$ Less: Preferred stock (192,878) (192,878) Less: Goodwill and intangible assets (633,485) (536,847) Tangible common shareholders' equity 2,989,450$ 1,963,233$ Less: AOCI (213,070) 47,201 Tangible common shareholders' equity excluding AOCI 3,202,520$ 1,916,032$ Shares outstanding, end of period (denominator) 191,461 162,988 TBV per share excluding AOCI 16.73$ 11.76$ Non-GAAP Reconciliation 33