☑ QUARTERLY REPORT PURSUANT TO SECTION 13 OR 15(d) OF THE
SECURITIES EXCHANGE ACT OF 1934
For the Quarterly Period Ended March 31, 2026
OR
☐TRANSITION REPORT PURSUANT TO SECTION 13 OR 15(d) OF THE
SECURITIES EXCHANGE ACT OF 1934
For the Transition Period From __________ to __________
Commission File Number: 1-09720
PAR TECHNOLOGY CORPORATION
(Exact name of registrant as specified in its charter)
Delaware
16-1434688
(State or other jurisdiction of incorporation or organization)
(I.R.S. Employer Identification No.)
PAR Technology Park, 8383 Seneca Turnpike, New Hartford, New York13413-4991
(Address of principal executive offices, including zip code)
(315) 738-0600
(Registrant’s telephone number, including area code)
Securities registered pursuant to Section 12(b) of the Act:
Title of each class
Trading Symbol
Name of each exchange on which registered
Common Stock, $0.02 par value
PAR
New York Stock Exchange
Indicate by check mark whether the registrant: (1) has filed all reports required to be filed by Section 13 or 15(d) of the Securities Exchange Act of 1934 during the preceding 12 months (or for such shorter period that the registrant was required to file such reports), and (2) has been subject to such filing requirements for the past 90 days. Yes ☑ No ☐
Indicate by check mark whether the registrant has submitted electronically every Interactive Data File required to be submitted pursuant to Rule 405 of Regulation S-T (§232.405 of this chapter) during the preceding 12 months (or for such shorter period that the registrant was required to submit such files). Yes ☑ No ☐
Indicate by check mark whether the registrant is a large accelerated filer, an accelerated filer, a non-accelerated filer, a smaller reporting company, or an emerging growth company. See the definitions of “large accelerated filer”, “accelerated filer”, “smaller reporting company”, and “emerging growth company” in Rule 12b-2 of the Exchange Act.
Large Accelerated Filer ☑
Accelerated Filer ☐
Non-Accelerated Filer ☐
Smaller Reporting Company ☐
Emerging Growth Company ☐
If an emerging growth company, indicate by check mark if the registrant has elected not to use the extended transition period for complying with any new or revised financial accounting standards provided pursuant to Section 13(a) of the Exchange Act. ☐
Indicate by check mark whether the registrant is a shell company (as defined in Rule 12b-2 of the Exchange Act). Yes ☐ No ☑
As of May 5, 2026, 41,246,199 shares of the registrant’s common stock, $0.02 par value, were outstanding.
Unless the context indicates otherwise, references in this Quarterly Report to "we," "us," "our," the "Company," and "PAR" mean PAR Technology Corporation and its consolidated subsidiaries.
“PAR®,” “PAR POSTM”, “Punchh®,” “PAR OrderingTM”, “PAR OPS®,” “Data Central®,” “DelagetTM,” “PAR RetailTM,” “PAR® Pay”, and other trademarks identifying our products and services appearing in this Quarterly Report belong to us. Solely for convenience, our trademarks referred to in this Form 10-Q may appear without the ® or TM symbols, but such references are not intended to indicate in any way that we will not assert, to the fullest extent under applicable law, our rights to these trademarks. This Quarterly Report may also contain trade names
and trademarks of other companies. Our use of such other companies’ trade names or trademarks is not intended to imply any endorsement or sponsorship by these companies of us or our products or services.
FORWARD-LOOKING STATEMENTS
This Quarterly Report contains “forward-looking statements” within the meaning of Section 21E of the Securities Exchange Act of 1934, as amended (the “Exchange Act”), Section 27A of the Securities Act of 1933, as amended (the “Securities Act”), and the Private Securities Litigation Reform Act of 1995. Forward-looking statements are not historical in nature, but rather are predictive of PAR's future operations, financial condition, financial results, business strategies, and prospects. Forward-looking statements are generally identified by words such as “believe,” “could," "would," "should," "will," “continue,” "anticipate," “expect,” “plan,” "intend," "estimate," “future," “may,” “potential,” and similar expressions.
Forward-looking statements are based on management's current expectations and assumptions and are inherently uncertain. Actual results and outcomes could differ materially from those expressed in or implied by forward-looking statements, including forward-looking statements relating to and our expectations regarding:
•our plans, strategies, and objectives for future operations and the growth of our business, including our service and product offerings, our go-to-market strategies, and the expected development, demand, performance, market share, and competitive performance of our products and services;
•our ability to achieve and sustain profitability;
•our future revenues, gross margins, expenses, cash flows, and other financial measures;
•annual recurring revenue (ARR), active sites, subscription service gross margins, net loss, net income (loss) per share, and other key performance indicators and non-GAAP financial measures;
•the availability and terms of product and component supplies for our hardware products;
•the timing and expected benefits of acquisitions, divestitures, and capital markets transactions;
•our human capital strategies and engagement;
•macroeconomic trends, geopolitical events, tariffs, and trade disputes and the expected impact of those trends and events on our business, financial condition, results of operations, and cash flows;
•claims, disputes, or other litigation matters; and
•assumptions underlying any of the foregoing.
Factors, risks, trends, and uncertainties that could cause our actual results to differ materially from those expressed in or implied by forward-looking statements include:
•our ability to successfully develop, acquire, and transition new products and services, while enhancing existing ones to meet evolving customer needs and emerging technological trends, including our effective use of artificial intelligence (AI) in product development and integration of AI tools into our product and service offerings;
•our ability to add and maintain active sites;
•our ability to retain and add integration partners;
•macroeconomic trends, such as the effects of inflation, recession, interest rate fluctuations, and changes in consumer confidence and discretionary spending; and geopolitical events affecting countries where we operate or our customers or suppliers operate;
•our ability to retain and manage suppliers, secure alternative suppliers, and manage inventory levels and costs, navigate manufacturing disruptions or logistics challenges, shipping delays and shipping costs;
•the impact of changes in import/export regulations, including tariffs, and trade disputes between the United States and other countries where we operate or our customers or suppliers operate;
•the effects, costs, and timing of acquisitions, divestitures, and capital markets transactions;
•our ability to integrate acquisitions into our operations and the timing, complexity, and costs associated with integrations;
•our ability to attract, develop, and retain qualified employees to develop and expand our business, execute product installations, and respond to customer service level needs;
•the protection of our intellectual property;
•our ability to generate sufficient cash flow or access additional financing sources as needed to repay outstanding debts, including amounts owed under our outstanding convertible notes;
•legal, reputational, and financial risks if we fail to protect customer and/or our data from security breaches and/or cyber attacks;
•the impact of future pandemics, epidemics, or other outbreaks of disease;
•changes in estimates and assumptions we make in connection with the preparation of our financial statements, or in building our business and operations plan and in executing our strategies;
•our ability to maintain proper and effective internal control over financial reporting;
•our ability to execute our business and operations plan, implement our strategies, and manage our business continuity risks, including service interruptions and disruptions or delays in product assembly and fulfillment;
•potential impacts, liabilities, and costs from pending or potential investigations, claims, and disputes; and
•other factors, risks, trends, and uncertainties disclosed in our filings with the Securities and Exchange Commission ("SEC"), particularly those listed under the heading "Risk Factors" in our Annual Report on Form 10-K for the fiscal year ended December 31, 2025 and this Quarterly Report.
We undertake no obligation to update or revise any forward-looking statements, whether as a result of new information, future events, or otherwise, except as may be required under applicable securities law.
(In thousands, except share and per share amounts)
(unaudited)
Assets
March 31, 2026
December 31, 2025
Current assets:
Cash and cash equivalents
$
77,232
$
79,565
Cash held on behalf of customers
13,552
14,120
Short-term investments
575
579
Accounts receivable – net
87,882
81,706
Inventories
30,927
27,436
Other current assets
29,801
29,525
Total current assets
239,969
232,931
Property, plant and equipment – net
12,770
13,286
Goodwill
897,110
898,035
Intangible assets – net
219,711
203,370
Lease right-of-use assets
9,121
8,176
Other assets
12,464
13,346
Total Assets
$
1,391,145
$
1,369,144
Liabilities and Shareholders’ Equity
Current liabilities:
Current portion of long-term debt
$
2,869
$
19,954
Accounts payable
36,821
39,332
Accrued salaries and benefits
16,260
25,186
Accrued expenses
10,838
12,380
Customers payable
13,552
14,120
Lease liabilities – current portion
1,903
1,899
Customer deposits and deferred service revenue
31,888
27,867
Total current liabilities
114,131
140,738
Lease liabilities – net of current portion
7,367
6,435
Deferred service revenue – noncurrent
1,762
1,841
Long-term debt
421,685
374,070
Other long-term liabilities
19,773
20,910
Total liabilities
564,718
543,994
Commitments and Contingencies (Note 11)
Shareholders’ equity:
Preferred stock, $0.02 par value, 1,000,000 shares authorized
—
—
Common stock, $0.02 par value, 116,000,000 shares authorized, 42,819,032 and 42,226,765 shares issued, 41,246,199 and 40,653,932 outstanding at March 31, 2026 and December 31, 2025, respectively
848
836
Additional paid-in capital
1,245,562
1,226,039
Accumulated deficit
(380,573)
(364,404)
Accumulated other comprehensive loss
(10,518)
(8,429)
Treasury stock, at cost, 1,572,833 and 1,572,833 shares at March 31, 2026 and December 31, 2025, respectively
(28,892)
(28,892)
Total shareholders’ equity
826,427
825,150
Total Liabilities and Shareholders’ Equity
$
1,391,145
$
1,369,144
See accompanying notes to unaudited interim condensed consolidated financial statements
NOTES TO INTERIM CONDENSED CONSOLIDATED FINANCIAL STATEMENTS
(unaudited)
Note 1 — Summary of Business and Significant Accounting Policies
Nature of Business
The Company, through its consolidated subsidiaries, operates in one segment, Restaurant/Retail. Refer to "Note 12 — Segment and Related Information" for further detail on our segment. The Restaurant/Retail segment provides leading omnichannel cloud-based software and hardware solutions to the restaurant and retail industries.
Our product and service offerings include point-of-sale, customer engagement and loyalty, digital ordering and delivery, operational intelligence, payment processing, hardware, and related technologies, solutions, and services. We provide enterprise restaurants, franchisees, and other foodservice outlets with operational efficiencies through a data-driven network with integration capabilities from front- and back-of-house to customer fulfillment. Our subscription services are grouped into two product lines: Engagement Cloud and Operator Cloud. Engagement Cloud includes: PAR Engagement — a unified suite that combines Punchh and PAR Ordering solutions — for customer loyalty, engagement, and omnichannel digital ordering and delivery; Plexure, for international customer loyalty and engagement; PAR Retail, which provides customer loyalty and engagement solutions for convenience and fuel retailers; and Bridg, an identity resolution and shopper intelligence platform. Operator Cloud includes PAR POS and TASK for front-of-house, PAR Pay for payments, and PAR OPS — a suite of back-of-house solutions that combines Delaget and Data Central product offerings. The accompanying condensed consolidated financial statements include the Company's accounts and those of its consolidated subsidiaries. All intercompany transactions have been eliminated in consolidation.
Basis of Presentation
The accompanying financial statements of PAR Technology Corporation and its consolidated subsidiaries have been prepared in accordance with accounting principles generally accepted in the United States of America (“GAAP”) for interim financial statements and the instructions to Form 10-Q and Regulation S-X pertaining to interim financial statements as promulgated by the SEC. In the opinion of management, the Company's financial statements include all normal and recurring adjustments necessary in order to make the financial statements not misleading and to provide a fair presentation of the Company's financial results for the interim period included in this Quarterly Report. Interim results are not necessarily indicative of results for the full year or any future periods. The information included in this Quarterly Report should be read in conjunction with the Company's audited consolidated financial statements and notes thereto included in the Company’s Annual Report on Form 10-K for the fiscal year ended December 31, 2025 (the “2025 Annual Report”).
The results of operations of the Company's Government segment are reported as discontinued operations in the condensed consolidated statements of operations for all periods presented. All results and information in the condensed consolidated financial statements are presented as continuing operations and exclude the Government segment unless otherwise noted specifically as discontinued operations.
Use of Estimates
The preparation of the financial statements requires management of the Company to make a number of estimates and assumptions relating to the reported amount of assets and liabilities and the disclosure of contingent assets and liabilities at the date of the financial statements and the reported amounts of revenues and expenses during the period. Significant items subject to these estimates and assumptions include revenue recognition, stock-based compensation, the recognition and measurement of assets acquired and liabilities assumed in business combinations and asset acquisitions at fair value, identifiable intangible assets and goodwill, valuation allowances for receivables, and valuation of excess and obsolete inventories. Actual results could differ from those estimates.
Cash and Cash Equivalents and Cash Held on Behalf of Customers
Cash and cash equivalents and cash held on behalf of customers consist of the following:
(in thousands)
March 31, 2026
December 31, 2025
Cash and cash equivalents
Cash
$
75,211
$
77,405
Money market funds
2,021
2,160
Cash held on behalf of customers
13,552
14,120
Total cash and cash equivalents and cash held on behalf of customers
$
90,784
$
93,685
The Company maintained bank balances that, at times, exceeded the federally insured limit during the three months ended March 31, 2026. The Company did not experience losses relating to these deposits and management does not believe that the Company is exposed to any significant credit risk with respect to these amounts.
Other Current Assets and Other Assets
Other current assets consist of the following:
(in thousands)
March 31, 2026
December 31, 2025
Prepaid expenses
$
18,526
$
16,984
Current portion of deferred implementation costs
3,345
3,477
Current portion of deferred commissions
3,974
3,419
Income taxes receivable
2,586
3,409
Other
1,370
2,236
Total other current assets
$
29,801
$
29,525
Other assets consist of the following:
(in thousands)
March 31, 2026
December 31, 2025
Deferred implementation costs
$
2,214
$
2,578
Deferred commissions
6,180
5,591
Deferred taxes
1,600
1,592
Other
2,470
3,585
Total other assets
$
12,464
$
13,346
The following table summarizes amortization expense for deferred implementation costs and deferred commissions:
Other long-term liabilities include deferred tax liabilities of $18.3 million and $18.4 million at March 31, 2026 and December 31, 2025, respectively.
Recently Adopted Accounting Pronouncements
In November 2024, the FASB issued ASU 2024-04, Induced Conversions of Convertible Debt Instruments, which is intended to clarify the assessment of whether a transaction should be accounted for as an induced conversion or extinguishment of convertible debt. ASU 2024-04 became effective for fiscal years beginning after December 15, 2025, and interim reporting periods within those annual reporting periods. The adoption of ASU 2024-04 did not have an impact on the Company's condensed consolidated financial statements or related disclosures. Refer to "Note 7 — Debt" for further information regarding the Company's convertible debt transactions.
Accounting Pronouncements Not Yet Adopted
There were no recent accounting pronouncements or changes in accounting pronouncements during the three months ended March 31, 2026 that are of significance or potential significance to the Company.
Note 2 — Revenue Recognition
Deferred Revenue
Deferred revenue is as follows:
(in thousands)
March 31, 2026
December 31, 2025
Current
$
29,668
$
25,913
Non-current
1,762
1,841
Total
$
31,430
$
27,754
Most performance obligations greater than one year relate to service and support contracts that the Company expects to fulfill within 36 months. The Company expects to fulfill 100% of service and support contracts within 60 months.
The changes in deferred revenue, inclusive of both current and long-term, are as follows:
(in thousands)
2026
2025
Beginning balance - January 1
$
27,754
$
24,695
Acquired deferred revenue (refer to "Note 3 - Acquisitions")
92
809
Recognition of deferred revenue
(40,808)
(41,091)
Deferral of revenue
44,296
45,283
Impact of foreign currency translation on deferred revenue
96
1,379
Ending balance - March 31
$
31,430
$
31,075
The above tables exclude customer deposits of $2.2 million and $1.8 million as of the three months ended March 31, 2026 and 2025, respectively. During the three months ended March 31, 2026 and 2025, the Company recognized revenue included in deferred revenue at the beginning of each respective period of $12.0 million and $11.4 million.
The Company disaggregates revenue from contracts with customers by major product line because the Company believes it best depicts how the nature, amount, timing, and uncertainty of revenue and cash flows are affected by contract terms and economic factors.
Three Months Ended March 31, 2026
Three Months Ended March 31, 2025
(in thousands)
Point in time
Over time
Point in time
Over time
Subscription service
$
—
$
78,522
$
—
$
68,410
Hardware
29,254
—
21,843
—
Professional service
6,220
9,977
4,163
9,443
Total
$
35,474
$
88,499
$
26,006
$
77,853
Note 3 — Acquisitions
Bridg Asset Acquisition
On January 23, 2026, the Company entered into an Asset Purchase Agreement by and among the Company, DB Sub, LLC, a Delaware limited liability company and an indirectly wholly owned subsidiary of the Company ("DB Sub"), and Cardlytics, Inc., a Delaware corporation ("Cardlytics"), pursuant to which the Company agreed to acquire, through DB Sub, substantially all of Cardlytics' point-of-sale data analytics, loyalty marketing, and retail media network business assets offered through the Bridg platform (the "Bridg Asset Acquisition"). The Company also agreed to assume certain liabilities associated with the acquired assets. On March 24, 2026 (the "Bridg Closing Date"), the Bridg Asset Acquisition closed and the Company issued 1,810,222 shares of common stock as consideration, which was determined by dividing the $27.5 million purchase price by the volume weighted average price of a share of common stock on the New York Stock Exchange for the fifteen consecutive trading days ending on the trading day immediately prior to the Bridg Closing Date. The Company acquired the assets to expand its Engagement Cloud product and service offerings.
The total consideration for the Bridg Asset Acquisition was approximately $25.1 million, consisting of $24.8 million of equity consideration, determined using the $13.72 closing price per share of the Company's common stock on the Bridg Closing Date, and $0.3 million of acquisition expenses related to the Bridg Asset Acquisition that were capitalized as a component of the cost of the assets acquired.
The transaction was accounted for as an asset acquisition in accordance with ASC Topic 805, Business Combinations, whereby the purchase price is allocated to the assets acquired and liabilities assumed based on their relative fair values as of the Bridg Closing Date, and no goodwill is recognized. The preliminary fair value determinations were based on management's estimates and assumptions, with the assistance of valuation consultants. The preliminary purchase price allocation is subject to revision as management finalizes its valuation procedures.
The following table presents management's preliminary purchase price allocation:
The Company identified two acquired intangible assets in the Bridg Asset Acquisition: developed technology and customer relationships. The preliminary fair value of developed technology was determined utilizing the “relief from royalty” approach, which is a form of the income approach that attributes savings recognized from not having to pay a royalty for the use of an asset. The Company applied a seven year economic life, a fair and reasonable royalty rate of 10.0%, and a discount rate of 23.5% in determining the Bridg developed technology intangible preliminary fair value. The preliminary fair value of the customer relationship intangible asset was determined utilizing the “multi-period excess earnings method,” which method is predicated upon the calculation of the net present value of after-tax net cash flows respectively attributable to each asset. The Company applied a 20.0% estimated annual attrition rate and discount rate of 23.5% in determining the Bridg customer relationships intangible preliminary fair value. The estimated useful life of each of the foregoing identifiable intangible assets was preliminarily determined to be: seven years for developed technology and seven years for customer relationships.
Note 4 — Accounts Receivable, net
At March 31, 2026 and December 31, 2025, the Company had current expected credit losses of $6.4 million and $5.3 million, respectively, against accounts receivable.
Changes in the current expected credit loss for the three months ended March 31 were:
(in thousands)
2026
2025
Beginning Balance - January 1
$
5,295
$
3,392
Provisions
1,479
1,109
Write-offs
(414)
(385)
Ending Balance - March 31
$
6,360
$
4,116
Note 5 — Inventories, net
Inventories are used in the manufacture and service of our hardware products. The components of inventories, net consist of the following:
(in thousands)
March 31, 2026
December 31, 2025
Finished goods
$
19,997
$
18,129
Work in process
234
242
Component parts
9,964
8,360
Service parts
732
705
Inventories, net
$
30,927
$
27,436
At March 31, 2026 and December 31, 2025, the Company had excess and obsolescence reserves of $8.3 million and $7.6 million, respectively, against inventories.
Note 6 — Identifiable Intangible Assets and Goodwill
The components of identifiable intangible assets are:
(in thousands)
March 31, 2026
December 31, 2025
Estimated Useful Life
Weighted-Average Amortization Period
Acquired developed technology
$
199,635
$
183,840
3 - 7 years
4.57 years
Internally developed software costs
43,848
43,233
3 years
1.89 years
Customer relationships
128,033
119,046
5 - 15 years
9.57 years
Trade names
3,210
3,210
2 - 8 years
6.31 years
Non-competition agreements
7,230
7,230
1 - 5 years
3.41 years
381,956
356,559
Impact of currency translation on intangible assets
(1,377)
(983)
Less: accumulated amortization
(175,213)
(164,471)
205,366
191,105
Internally developed software costs not meeting general release threshold
3,145
1,065
Trademarks, trade names (non-amortizable)
11,200
11,200
Indefinite
$
219,711
$
203,370
Software costs placed into service during the three months ended March 31, 2026 and 2025 were $0.6 million and $1.8 million, respectively.
The following table summarizes amortization expense for identifiable intangible assets:
Three Months Ended March 31,
(in thousands)
2026
2025
Amortization of acquired developed technology
$
6,435
$
6,209
Amortization of internally developed software
1,046
1,430
Amortization of identifiable intangible assets recorded in cost of sales
$
7,481
$
7,639
Amortization expense recorded in operating expenses
$
3,431
$
3,259
Impact of foreign currency translation on intangible assets
$
(169)
$
733
The expected future amortization of intangible assets, assuming straight-line amortization of capitalized software development costs and acquisition related intangibles, excluding software development costs not meeting the general release threshold, is as follows:
The following table summarizes changes in the carrying balance of goodwill:
(in thousands)
2026
2025
Beginning balance - January 1
$
898,035
$
887,459
Delaget Acquisition ASC 805 measurement period adjustment
—
125
Foreign currency translation
(925)
2,909
Ending balance - March 31
$
897,110
$
890,493
Note 7 — Debt
Pursuant to privately negotiated agreements dated January 14, 2026, on January 23, 2026, the Company acquired $17.1 million aggregate principal amount of its remaining outstanding 2.875% Convertible Senior Notes due 2026 (the "2026 Notes") in exchange for 485,186 shares of the Company's common stock, plus approximately $134,000 in cash for accrued and unpaid interest on the principal amount of 2026 Notes exchanged to, but excluding, the closing date (the “Notes Exchange”). The difference between the fair value of the original conversion terms and the fair value of the induced conversion terms at the time of settlement resulted in an inducement loss on settlement of convertible notes of approximately $3.5 million, which is recorded in gain (loss) on extinguishment of debt, net in the Company's condensed consolidated statements of operations. Following the Notes Exchange, an aggregate of $2.9 million principal amount of the 2026 Notes remained outstanding.
On March 17, 2026, the Company completed a private offering of $265.0 million aggregate principal amount of 4.00% Convertible Senior Notes due 2031 (the "2031 Notes"), which amount includes $15.0 million aggregate principal amount of 2031 Notes issued pursuant to the initial purchasers' full exercise of their option to purchase additional 2031 Notes. The 2031 Notes were issued pursuant to an indenture, dated March 17, 2026, between the Company and U.S. Bank Trust Company, National Association, as trustee. The 2031 Notes bear an interest of 4.00% per year, payable semiannually in arrears on March 15 and September 15 of each year, beginning September 15, 2026. Interest accrues on the 2031 Notes from the last date to which interest has been paid or duly provided for or, if no interest has been paid or duly provided for, from March 17, 2026. Unless earlier converted, redeemed, or repurchased, the 2031 Notes mature on March 15, 2031. The 2031 Notes are convertible into Company common stock at an initial conversion rate of 52.5762 shares per $1,000 principal amount. The Company incurred debt issuance costs of $8.0 million related to the offering of the 2031 Notes.
On March 17, 2026, the Company used a portion of the net proceeds from its sale of the 2031 Notes to repurchase $212.0 million aggregate principal amount of the Company's 1.50% Convertible Senior Notes due 2027 (the "2027 Notes") for approximately $207.5 million, consisting of $206.2 million paid to retire the principal and $1.3 million of accrued and unpaid interest. The Company recognized a $3.9 million gain on extinguishment of debt as a result of repurchasing a portion of the 2027 Notes at a price below their carrying value, partially offset by the write-off of unamortized debt issuance costs. This gain is included in gain (loss) on extinguishment of debt, net in the Company's condensed consolidated statements of operations. Following the repurchase, an aggregate of $53.0 million principal amount of the 2027 Notes remained outstanding.
The following table summarizes information about the net carrying amounts of long-term debt as of March 31, 2026:
(in thousands)
2026 Notes
2027 Notes
2030 Notes
2031 Notes
Total
Principal amount outstanding
$
2,870
$
53,000
$
115,000
$
265,000
$
435,870
Unamortized debt issuance cost
(1)
(483)
(2,948)
(7,884)
(11,316)
Total long-term debt
2,869
52,517
112,052
257,116
424,554
Less: current portion of long-term debt
(2,869)
—
—
—
(2,869)
Total non-current portion of long-term debt
$
—
$
52,517
$
112,052
$
257,116
$
421,685
The following table summarizes information about the net carrying amounts of long-term debt as of December 31, 2025:
(in thousands)
2026 Notes
2027 Notes
2030 Notes
Total
Principal amount outstanding
$
20,000
$
265,000
$
115,000
$
400,000
Unamortized debt issuance cost
(46)
(2,789)
(3,141)
(5,976)
Total long-term debt
19,954
262,211
111,859
394,024
Less: current portion of long-term debt
(19,954)
—
—
(19,954)
Total non-current portion of long-term debt
$
—
$
262,211
$
111,859
$
374,070
The following table summarizes interest expense recognized on long-term debt:
Three Months Ended March 31,
(in thousands)
2026
2025
Contractual interest expense
$
1,681
$
2,060
Amortization of debt issuance costs
598
553
Amortization of discount
—
35
Total interest expense
$
2,279
$
2,648
The following table summarizes the future principal payments as of March 31, 2026:
(in thousands)
2026, remaining
$
2,870
2027
53,000
2028
—
2029
—
2030
115,000
Thereafter
265,000
Total
$
435,870
Note 8 — Stockholders' Equity
On January 23, 2026, the Company issued 485,186 shares of its common stock as part of the Notes Exchange related to the induced conversion of a portion of the 2026 Notes. Refer to "Note 7 — Debt" for additional information about the Notes Exchange.
On February 26, 2026, the Company announced that its Board of Directors authorized a share repurchase program pursuant to which the Company may repurchase up to $100.0 million of its common stock in open market purchases, privately negotiated transactions, block trades, accelerated share repurchase transactions, or by other means, including under Rule 10b5-1 plans. In addition, any repurchases under this share repurchase program will be subject to prevailing market conditions, liquidity and cash flow considerations, applicable securities laws
requirements (including under Rule 10b-18 and Rule 10b5-1 of the Exchange Act), and other factors. The share repurchase program does not obligate the Company to acquire any particular amount of its common stock, it may be suspended, modified, or terminated at any time at the Company’s discretion, and it expires February 26, 2028. When shares are repurchased and retired, the Company reduces common stock for the par value of the shares repurchased, with the excess of the purchase price over par value recorded as a reduction of additional paid-in capital.
On March 17, 2026, the Company used a portion of the net proceeds from its sale of the 2031 Notes to repurchase approximately 2.1 million shares of its common stock in privately negotiated transactions with or through one or more affiliates of the initial purchasers at a price of $15.85 per share, for a total of approximately $33.1 million. As of March 31, 2026, the Company was authorized to purchase a remaining $66.9 million of its common stock under its share repurchase program.
On March 24, 2026, the Company issued 1,810,222shares of common stock related to the Bridg Asset Acquisition. Refer to "Note 3 — Acquisitions" for additional information about the Bridg Asset Acquisition.
Note 9 — Stock-Based Compensation
Stock-based compensation expense, net of forfeitures and adjustments of $0.7 million and $0.1 million for the three months ended March 31, 2026 and 2025, respectively, was as follows:
Three Months Ended March 31,
(in thousands)
2026
2025
Cost of sales
$
312
$
290
Sales and marketing
309
326
General and administrative
5,605
5,664
Research and development
977
901
Total
$
7,203
$
7,181
At March 31, 2026, the aggregate unrecognized compensation expense related to unvested equity awards was $39.6 million, which is expected to be recognized as compensation expense in fiscal years 2026 through 2029.
A summary of stock option activity for the three months ended March 31, 2026 is below:
(in thousands, except for weighted average exercise price)
Options outstanding
Weighted average exercise price
Outstanding at January 1, 2026
812
$
17.54
Exercised
(5)
$
10.28
Canceled/forfeited
(1)
$
27.61
Outstanding at March 31, 2026
806
$
17.58
A summary of unvested restricted stock units activity for the three months ended March 31, 2026 is below:
(in thousands, except for weighted average award value)
A total of 330,000 shares of Company common stock were made available for purchase under the Company's 2021 Employee Stock Purchase Plan ("ESPP"), subject to adjustment as provided for in the ESPP. As of March 31, 2026, 62,870 shares of common stock were purchased under the ESPP since inception. No shares were purchased under the ESPP during the three months ended March 31, 2026.
Note 10 — Net Loss Per Share
Net loss per share is calculated in accordance with ASC Topic 260, Earnings per Share, which specifies the computation, presentation, and disclosure requirements for earnings per share (“EPS”). It requires the presentation of basic and diluted EPS. Basic EPS excludes all dilution and is based upon the weighted average number of shares of common stock outstanding during the period. Diluted EPS reflects the potential dilution that would occur if convertible securities or other contracts to issue common stock were exercised. As of March 31, 2026, there were 806,179 anti-dilutive stock options outstanding compared to 705,000 as of March 31, 2025. As of March 31, 2026, there were 778,477 anti-dilutive restricted stock units outstanding compared to 1,216,000 as of March 31, 2025. As of March 31, 2026, there were 19,324,965 anti-dilutive shares potentially issuable upon conversion of the Company's outstanding convertible notes, calculated using the maximum conversion rates per the respective indentures.
Note 11 — Commitments and Contingencies
Purchase Commitments
As of March 31, 2026, our non-cancellable purchase commitments totaled $78.1 million, consisting of $63.8 milliondue within the next 12 months and $14.3 million due thereafter. These primarily consist of unconditional purchase commitments for inventory, software licensing, external labor, and third-party cloud services.
Legal Proceedings
From time to time, the Company is party to legal proceedings arising in the ordinary course of business. Based on information currently available, and based on its evaluation of such information, the Company believes the legal proceedings in which it is currently involved are not material or are not likely to result in a material adverse effect on the Company’s business, financial condition or results of operations, or cannot currently be estimated.
The Company operates in one segment. There have been no changes to the Company’s reportable segment, the identification of the Chief Operating Decision Maker, or the methodology used to assess segment performance since the filing of our 2025 Annual Report.
The following table presents revenues and significant segment expenses:
Three Months Ended March 31,
(in thousands)
2026
2025
Total revenues, net
$
123,973
$
103,859
Less:
Subscription service cost of sales(1)
27,247
21,178
Hardware cost of sales(1)
22,853
16,385
Professional service cost of sales(1)
11,587
10,002
Sales and marketing(1)
11,975
11,456
General and administrative(1)
23,444
21,541
Research and development(1)
20,944
18,829
Depreciation and amortization
8,581
8,623
Stock-based compensation
7,203
7,181
Transaction costs
594
1,155
Amortization of identifiable intangible assets
3,431
3,259
Operating loss
$
(13,886)
$
(15,750)
Other segment items(2)
(2,283)
(8,600)
Net (loss) income
$
(16,169)
$
(24,350)
(1) These amounts exclude stock-based compensation expense, depreciation and amortization expense, and transaction costs, which are presented separately as additional significant segment expenses.
(2) Other segment items include other income (expense), net; gain (loss) on extinguishment of debt, net; interest expense, net; provision for income taxes; and net income from discontinued operations. See the condensed consolidated statements of operations for additional information on these amounts.
The following table presents revenues by geographic area based on the location of the customer:
Three Months Ended March 31,
(in thousands)
2026
2025
United States
$
102,903
$
87,535
International
21,070
16,324
Total
$
123,973
$
103,859
The following table presents long-lived assets, which consist of property, plant, and equipment, net and lease right-of-use assets, by geographic area based on the location of the assets:
Customers accounting for 10% or more of the Company’s total revenues are summarized as follows:
Three Months Ended March 31,
2026
2025
McDonald’s Corporation
25
%
19
%
All Others
75
%
81
%
Total
100
%
100
%
No other customer within "All Others" accounted for 10% or more of the Company’s total revenue for the three months ended March 31, 2026 or 2025.
Note 13 — Fair Value of Financial Instruments
The Company’s financial instruments have been recorded at fair value using available market information and valuation techniques. The fair value hierarchy is based upon three levels of input, which are:
Level 1 — quoted prices in active markets for identical assets or liabilities (observable)
Level 2 — inputs other than Level 1 that are observable, either directly or indirectly, such as quoted prices for similar assets or liabilities, quoted prices in inactive markets, or other inputs that are observable market data for essentially the full term of the asset or liability (observable)
Level 3 — unobservable inputs that are supported by little or no market activity, but are significant to determining the fair value of the asset or liability (unobservable)
The Company’s financial instruments primarily consist of cash and cash equivalents, cash held on behalf of customers, short-term investments, and debt instruments. The carrying amounts of cash and cash equivalents, cash held on behalf of customers, and short-term investments as of March 31, 2026 and December 31, 2025 were considered representative of their fair values because of their short-term nature and are classified as Level 1 of the fair value hierarchy. Debt instruments are recorded at principal amount net of unamortized debt issuance cost (refer to "Note 7 — Debt" for additional information). The estimated fair value of the 2026 Notes, the 2027 Notes, the 1.00% Convertible Senior Notes due 2030 (the "2030 Notes"), and the 2031 Notes (together with the 2026 Notes,
the 2027 Notes, and the 2030 Notes, the "Senior Notes") at March 31, 2026 was $2.9 million, $49.2 million, $89.6 million, and $275.8 million, respectively. The estimated fair value of the 2026 Notes, 2027 Notes, and 2030 Notes at December 31, 2025 was $20.7 million, $260.7 million, and $98.6 million, respectively. The valuation techniques used to determine the fair value of the Company's long-term debt are classified in Level 2 of the fair value hierarchy as they are derived from broker quotations.
Item 2. MANAGEMENT'S DISCUSSION AND ANALYSIS OF FINANCIAL CONDITION AND RESULTS OF OPERATIONS
The following discussion and analysis of our financial condition and results of operations should be read in conjunction with our financial statements and the notes thereto included under "Part I, Item 1. Financial Statements (unaudited)" of this Quarterly Report and our audited consolidated financial statements and the notes thereto included under "Part II, Item 8. Financial Statements and Supplementary Data" of the 2025 Annual Report. This discussion contains forward-looking statements that involve risks and uncertainties. Our actual results could differ materially from the results contemplated by these forward-looking statements due to a number of factors, including those discussed under "Forward-Looking Statements".
OVERVIEW
Q1 2026 Operating Performance Highlights
Organic -Year-over-year
growth of 11.3%
Total - Year-over-year
growth of 16.4%
GAAP - Year-over-year decrease of 220 basis points (bps)
Non-GAAP - Year-over-year decrease of 350 bps
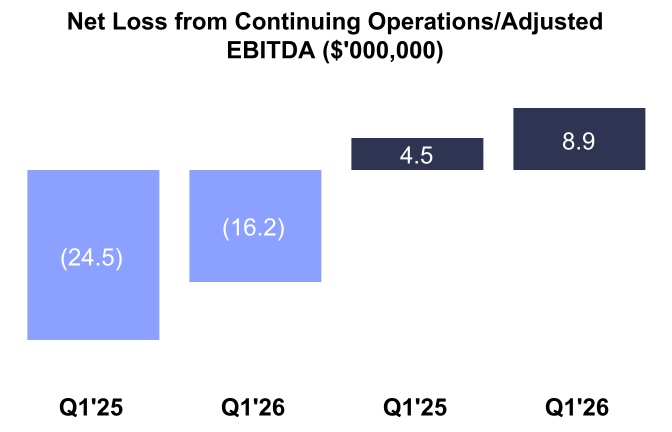
Net Loss from Cont. Ops.
Year-over-year improvement of $8.4 million
Adjusted EBITDA
Year-over-year improvement of $4.4 million
Refer to "Key Performance Indicators and Non-GAAP Financial Measures" below for important information on key performance indicators and non-GAAP financial measures, including annual recurring revenue ("ARR"), non-GAAP subscription service gross margin percentage, and adjusted EBITDA. We use these key performance indicators and non-GAAP financial measures to evaluate our performance.
The tariff and supply chain environment remains complex and evolving. Beginning in the second quarter of 2025, the U.S. government implemented a series of significant new tariffs, including under the International Emergency Economic Powers Act ("IEEPA"), affecting imports from several countries where we source certain components and hardware products. Other countries responded with retaliatory actions or plans for retaliatory actions. On February 20, 2026, the U.S. Supreme Court held that IEEPA does not authorize the President to impose tariffs, though the administrative process for seeking refunds remains under development and subject to considerable uncertainty. Following the ruling, the administration announced a replacement, time-limited 10% global ad valorem tariff effective February 24, 2026, which has subsequently been subject to legal challenge. In March 2026, the U.S. Trade Representative was directed to initiate new investigations for the purpose of building the legal foundation for a second round of durable, country-specific tariffs. The resulting situation remains uncertain and fluid.
Additionally, increased demand for hardware products and components from AI data center construction around the world continues to create uncertainty as to whether these products will be available or available in needed quantities and quality or at favorable or competitive prices. We continue to monitor macroeconomic trends and uncertainties in light of continuing changes to global trade policies and supply chain pressures, which may have adverse effects on our hardware revenue and hardware gross margin.
As a result of these events, we anticipate increased supply chain challenges, commodity cost volatility, and consumer and economic uncertainty. Management continues to evaluate and implement mitigating actions, including potential supply chain resiliency movements, cost or pricing measures and alternative shipping practices, if needed, as the macroeconomic environment evolves.
For the three months ended March 31, 2026 compared to the three months ended March 31, 2025
Total revenues were $124.0 million for the three months ended March 31, 2026, an increase of $20.1 million or 19.4% compared to $103.9 million for the three months ended March 31, 2025.
Subscription service revenues were $78.5 million for the three months ended March 31, 2026, an increase of $10.1 million or 14.8% compared to $68.4 million for the three months ended March 31, 2025. The increase was primarily driven by increased Engagement Cloud subscription service revenues of $6.2 million, primarily driven by growth in average revenue per site through cross-selling initiatives, upselling, and price increases. Operator Cloud subscription service revenues increased $3.9 million, primarily driven by growth in active sites.
Hardware revenues were $29.3 million for the three months ended March 31, 2026, an increase of $7.4 million or 33.9% compared to $21.8 million for the three months ended March 31, 2025. The increase was primarily driven by increased revenues from sales of terminals of $3.8 million, peripherals (scanners, printers, and components) of $0.9 million, kiosks of $0.9 million, and an increase in international sales of $0.8 million. These increases were substantially driven by the timing of tier-one enterprise customer hardware refresh cycles and the onboarding of Operator Cloud customers purchasing hardware. Hardware revenues will continue to be affected by the timing of the aforementioned drivers.
Professional service revenues were $16.2 million for the three months ended March 31, 2026, an increase of $2.6 million or 19.0% compared to $13.6 million for the three months ended March 31, 2025. The increase was primarily driven by a $2.3 million increase in installation revenues associated with the onboarding of Tier 1 Operator Cloud customers.
Gross Margin
Three Months Ended March 31,
Gross Margin Percentage
Increase (decrease)
(in thousands)
2026
2025
2026
2025
2026 vs 2025
Subscription service
$
43,669
$
39,510
55.6
%
57.8
%
(220)
bps
Hardware
6,326
5,375
21.6
%
24.6
%
(300)
bps
Professional service
4,506
3,457
27.8
%
25.4
%
240
bps
Total gross margin
$
54,501
$
48,342
44.0
%
46.5
%
(250)
bps
For the three months ended March 31, 2026 compared to the three months ended March 31, 2025
Total gross margin as a percentage of revenue for the three months ended March 31, 2026, decreased to 44.0% from 46.5% for the three months ended March 31, 2025.
Subscription service margin as a percentage of subscription service revenue for the three months ended March 31, 2026, decreased to 55.6% from 57.8% for the three months ended March 31, 2025. The decrease primarily reflects a change in subscription service revenue mix, as product and service offerings with comparatively lower gross margins represented a greater proportion of revenue, consistent with the mix shift that began in the second quarter of 2025.
Hardware margin as a percentage of hardware revenue for the three months ended March 31, 2026, decreased to 21.6% from 24.6% for the three months ended March 31, 2025. The decrease was driven by a shift in hardware product mix and higher tariff-related costs compared to the prior year. While pricing adjustments initiated in the third quarter of 2025 have partially mitigated these cost increases, they have not fully offset the impact, resulting in continued margin compression. The Company plans to implement additional pricing actions and will continue to evaluate its pricing strategy on a quarterly basis.
Professional service margin as a percentage of professional service revenue for the three months ended March 31, 2026, increased to 27.8% from 25.4% for the three months ended March 31, 2025. The increase was primarily driven by improved margins in our hardware service repair operations and field operations as a result of reduced third-party spending and improved cost management.
Sales and Marketing Expense ("S&M")
Three Months Ended March 31,
Percentage of total revenue
Increase (decrease)
(in thousands)
2026
2025
2026
2025
2026 vs 2025
Sales and marketing
$
12,285
$
11,782
9.9
%
11.3
%
4.3
%
For the three months ended March 31, 2026 compared to the three months ended March 31, 2025
S&M expenses were $12.3 million for the three months ended March 31, 2026, an increase of $0.5 million or 4.3% compared to $11.8 million for the three months ended March 31, 2025. The increase was primarily driven by a $0.8 million increase in marketing expenses and a $0.3 million increase in severance costs related to non-recurring restructuring events, partially offset by a $0.4 million decrease in recurring compensation costs and a $0.2 million decrease in contracted services.
General and Administrative Expense ("G&A")
Three Months Ended March 31,
Percentage of total revenue
Increase (decrease)
(in thousands)
2026
2025
2026
2025
2026 vs 2025
General and administrative
$
30,696
$
29,284
24.8
%
28.2
%
4.8
%
For the three months ended March 31, 2026 compared to the three months ended March 31, 2025
G&A expenses were $30.7 million for the three months ended March 31, 2026, an increase of $1.4 million or 4.8% compared to $29.3 million for the three months ended March 31, 2025. The increase was primarily driven by a $1.2 million increase in severance costs related to non-recurring restructuring events.
Research and Development Expenses ("R&D")
Three Months Ended March 31,
Percentage of total revenue
Increase (decrease)
(in thousands)
2026
2025
2026
2025
2026 vs 2025
Research and development
$
21,975
$
19,767
17.7
%
19.0
%
11.2
%
For the three months ended March 31, 2026 compared to the three months ended March 31, 2025
R&D expenses were $22.0 million for the three months ended March 31, 2026, an increase of $2.2 million or 11.2% compared to $19.8 million for the three months ended March 31, 2025. The increase was primarily driven by a $0.8 million increase in outsourced development costs and a $0.6 million increase in recurring compensation costs, reflecting continued investment in product development, including AI-enabled functionality and other enhancements to our product and service offerings. The residual increase was primarily driven by a $0.6 million increase in severance costs related to non-recurring restructuring events.
For the three months ended March 31, 2026 compared to the three months ended March 31, 2025
Amortization of identifiable intangible assets was $3.4 million for the three months ended March 31, 2026, relatively unchanged from $3.3 million for the three months ended March 31, 2025.
Other Income (Expense), Net
Three Months Ended March 31,
Percentage of total revenue
Increase (decrease)
(in thousands)
2026
2025
2026
2025
2026 vs 2025
Other income (expense), net
$
827
$
(91)
0.7
%
(0.1)
%
>200%
For the three months ended March 31, 2026 compared to the three months ended March 31, 2025
Other income, net was $0.8 million for the three months ended March 31, 2026, a change of $0.9 million compared to other expense, net of $0.1 million for the three months ended March 31, 2025. The change was primarily driven by foreign currency fluctuations, with net foreign currency gains recognized in the current period compared to net losses in the prior period.
Interest Expense, Net
Three Months Ended March 31,
Percentage of total revenue
Increase (decrease)
(in thousands)
2026
2025
2026
2025
2026 vs 2025
Interest expense, net
$
(1,932)
$
(1,634)
(1.6)
%
(1.6)
%
18.2
%
For the three months ended March 31, 2026 compared to the three months ended March 31, 2025
Interest expense, net was $1.9 million for the three months ended March 31, 2026, relatively unchanged from $1.6 million for the three months ended March 31, 2025.
Gain (Loss) on Extinguishment of Debt, Net
Three Months Ended March 31,
Percentage of total revenue
Increase (decrease)
(in thousands)
2026
2025
2026
2025
2026 vs 2025
Gain (loss) on extinguishment of debt, net
$
380
$
(5,791)
0.3
%
(5.6)
%
(106.6)
%
For the three months ended March 31, 2026 compared to the three months ended March 31, 2025
Gain on extinguishment of debt, net was $0.4 million for the three months ended March 31, 2026, related to the $3.9 million gain recognized on the repurchase of a portion of the 2027 Notes, partially offset by the $3.5 million loss recognized on the induced conversion of a portion of the 2026 Notes. For the three months ended March 31, 2025, loss on extinguishment of debt, net was $5.8 million, related to the early repayment of the Credit Facility.
For the three months ended March 31, 2026 compared to the three months ended March 31, 2025
Provision for income taxes was $1.6 million for the three months ended March 31, 2026, relatively unchanged from $1.3 million for the three months ended March 31, 2025.
Net Income from Discontinued Operations
Three Months Ended March 31,
Percentage of total revenue
Increase (decrease)
(in thousands)
2026
2025
2026
2025
2026 vs 2025
Net income from discontinued operations
$
—
$
197
—
%
0.2
%
(100.0)
%
For the three months ended March 31, 2026 compared to the three months ended March 31, 2025
There was no income from discontinued operations for the three months ended March 31, 2026, compared to $0.2 million for the three months ended March 31, 2025, stemming from a $0.2 million gain recognized from the divestiture of RRC as a result of a favorable net working capital settlement.
Key Performance Indicators and Non-GAAP Financial Measures:
We monitor certain key performance indicators and non-GAAP financial measures in the evaluation and management of our business; certain key performance indicators and non-GAAP financial measures are provided in this Quarterly Report because we believe they are useful in facilitating period-to-period comparisons of our business performance. Key performance indicators and non-GAAP financial measures do not reflect and should be viewed independently of our financial performance determined in accordance with GAAP. Key performance indicators and non-GAAP financial measures are not forecasts or indicators of future or expected results and should not have undue reliance placed upon them by investors.
Key Performance Indicators
Within this Quarterly Report the Company makes reference to annual recurring revenue, or ARR, and active sites, which are both key performance indicators. The Company uses ARR and active sites as key performance indicators of the scale of our subscription services for both new and existing customers.
ARR is the annualized revenue from our subscription services, which includes subscription fees for our SaaS solutions and related support, managed platform development services, and transaction-based fees for payment processing services. We generally calculate ARR by annualizing the monthly recurring revenue for all active sites as of the last day of each month for the respective reporting period. ARR is an operating measure, it does not reflect our revenue determined in accordance with GAAP, and ARR should be viewed independently of, and not combined with or substituted for, our revenue and other financial information determined in accordance with GAAP. Further, ARR is not a forecast of future revenue and investors should not place undue reliance on ARR as an indicator of our future or expected results.
Beginning in the first quarter of 2026, the Company revised its methodology for classifying organic and inorganic ARR. Under the revised methodology, inorganic ARR is defined as ARR attributable to an acquisition as of the acquisition date. Any change to ARR subsequent to that date is classified as organic ARR. Management believes this methodology provides investors with useful information differentiating ARR acquired in a transaction from ARR changes driven by operating performance after acquisition. Prior to this change, ARR contributions from acquisitions were classified as inorganic for the first twelve months following acquisition. Our reported ARR is based on a constant currency, using the exchange rates established at the beginning of the year and consistently applied
throughout the period and to comparative periods presented. The table below presents our ARR on a constant currency basis, calculated using the exchange rates set at the beginning of 2026. Using the exchange rates established during the prior period, Engagement Cloud ARR and Operator Cloud ARR as of March 31, 2025 were $1.0 million and $0.6 million lower, respectively, than the constant currency ARR reported below.
Active sites represent locations active on our subscription services as of the last day of the respective reporting period. Our key performance indicators ARR and active sites are presented as two subscription service product lines:
•Engagement Cloud consisting of PAR Engagement (Punchh and PAR Ordering), PAR Retail, Plexure, and Bridg product offerings.
•Operator Cloud consisting of PAR POS, PAR Pay, PAR OPS (Data Central and Delaget), and TASK product offerings.
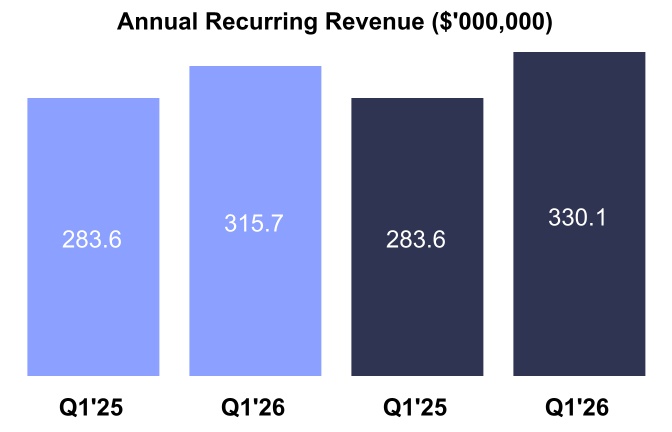
Annual Recurring Revenue
As of March 31,
Increase (decrease)
(in thousands)
2026
2025
2026 vs 2025
Engagement Cloud:
Organic
$
183,920
$
165,862
10.9
%
Inorganic*
14,383
—
—
%
Total Engagement Cloud
198,303
165,862
19.6
%
Operator Cloud:
Organic
131,791
117,764
11.9
%
Inorganic
—
—
—
%
Total Operator Cloud
131,791
117,764
11.9
%
Total
$
330,094
$
283,626
16.4
%
*Inorganic Engagement Cloud ARR represents Bridg ARR only as of March 24, 2026.
Active Sites
As of March 31,
Increase (decrease)
(in thousands)
2026
2025
2026 vs 2025
Engagement Cloud:
Organic
105.0
120.6
(12.9)
%
Inorganic*
34.0
—
—
%
Total Engagement Cloud
139.0
120.6
15.3
%
Operator Cloud:
Organic
60.3
59.0
2.2
%
Inorganic
—
—
—
%
Total Operator Cloud
60.3
59.0
2.2
%
*Inorganic Engagement Cloud active sites represent Bridg active sites only as of March 24, 2026.
In addition to disclosing financial results in accordance with GAAP, this Quarterly Report contains references to the non-GAAP financial measures below. We believe these non-GAAP financial measures provide investors with useful supplemental information about our operating performance, enable comparison of financial trends and results between periods where certain items may vary independent of business performance, and allow for greater transparency with respect to key metrics used by management in operating our business and measuring our performance. Our non-GAAP financial measures reflect adjustments based on one or more of the following items below. The income tax effect of the below adjustments were not tax-effected due to the valuation allowance on all of our net deferred tax assets.
Our non-GAAP financial measures should not be considered a substitute for, or superior to, financial measures calculated in accordance with GAAP, and the financial results calculated in accordance with GAAP and reconciliations from these results should be carefully evaluated. Additionally, these measures may not be comparable to similarly titled measures disclosed by other companies.
Non-GAAP Measure or Adjustment
Definition
Usefulness to management and investors
Non-GAAP subscription service gross margin percentage
Represents subscription service gross margin percentage adjusted to exclude amortization from acquired and internally developed software, stock-based compensation, and severance.
We believe that non-GAAP subscription service gross margin percentage and adjusted EBITDA provide useful perspectives with respect to the Company's core operating performance and ongoing cash earnings by adjusting for certain non-cash and non-recurring charges that may not be indicative of our financial performance.
Adjusted EBITDA
Represents net loss before income taxes, interest expense, and depreciation and amortization adjusted to exclude discontinued operations, stock-based compensation, transaction costs, severance, litigation expense, (gain) loss on extinguishment of debt, net, and other (income) expense, net.
Non-GAAP diluted net income (loss) per share
Represents net loss per share excluding amortization of acquired intangible assets, non-recurring income taxes, non-cash interest, discontinued operations, stock-based compensation, transaction costs, severance, litigation expense, (gain) loss on extinguishment of debt, net, and other (income) expense, net.
We believe that adjusting our diluted net loss per share to remove non-cash and non-recurring charges provides a useful perspective with respect to the Company's operating performance as well as comparisons to past and competitor operating results.
Stock-based compensation
Consists of non-cash charges related to our employee equity incentive plans.
We exclude stock-based compensation because management does not view these non-cash charges as part of our core operating performance. This adjustment facilitates a useful evaluation of our current operating performance as well as comparisons to past and competitor operating results.
Transaction costs
Adjustment reflects non-recurring professional fees incurred in transaction due diligence and integration.
We exclude professional fees incurred in corporate development because management does not view these non-recurring charges, which are inconsistent in size and are significantly impacted by the timing and valuation of our transactions, as part of our core operating performance. This adjustment facilitates a useful evaluation of our current operating performance, comparisons to past and competitor operating results, and additional means to evaluate expense trends.
Adjustment reflects severance tied to non-recurring restructuring events included in cost of sales, sales and marketing expense, general and administrative expense, and research and development expense.
We exclude these non-recurring adjustments because management does not view these costs as part of our core operating performance. These adjustments facilitate a useful evaluation of our current operating performance as well as comparisons to past and competitor operating results.
Litigation expense
Adjustment reflects non-recurring legal fees incurred in connection with certain litigation matters.
(Gain) loss on extinguishment of debt, net
Adjustment reflects gain recognized on the repurchase of a portion of the 2027 Notes, partially offset by loss recognized on the induced conversion of a portion of the 2026 Notes, and loss recognized on early repayment of former credit facility with Blue Owl Capital Corporation as administrative agent and collateral agent and Blue Owl Credit Advisors, LLC as lead arranger and bookrunner (the "Credit Facility").
Discontinued operations
Adjustment reflects income from discontinued operations related to the divestiture of our Government segment.
Other (income) expense, net
Adjustment reflects foreign currency transaction gains and losses and other non-recurring income and expenses recorded in other income (expense), net in the accompanying statements of operations.
Non-cash interest
Adjustment reflects non-cash amortization of issuance costs and discount related to the Company's long-term debt.
We exclude these non-cash and non-recurring adjustments for purposes of calculating non-GAAP diluted net income (loss) per share because management does not view these costs as part of our core operating performance. These adjustments facilitate a useful evaluation of our current operating performance, comparisons to past and competitor operating results, and additional means to evaluate expense trends.
Acquired intangible assets amortization
Adjustment reflects amortization expense of acquired developed technology included within cost of sales and amortization expense of acquired intangible assets.
The tables below provide reconciliations between net loss and adjusted EBITDA, diluted net loss per share and non-GAAP diluted net income (loss) per share, and subscription service gross margin percentage and non-GAAP subscription service gross margin percentage. Amounts presented in the reconciliations and other tables presented herein may not sum due to rounding.
(in thousands)
Three Months Ended March 31,
Reconciliation of Net Loss to Adjusted EBITDA
2026
2025
Net loss
$
(16,169)
$
(24,350)
Discontinued operations
—
(197)
Net loss from continuing operations
(16,169)
(24,547)
Provision for income taxes
1,558
1,281
Interest expense, net
1,932
1,634
Depreciation and amortization
12,012
11,882
Stock-based compensation
7,203
7,181
Transaction costs
594
1,155
Severance
2,669
72
Litigation expense
356
—
(Gain) loss on extinguishment of debt, net
(380)
5,791
Other (income) expense, net
(827)
91
Adjusted EBITDA
$
8,948
$
4,540
(in thousands, except per share amounts)
Three Months Ended March 31,
Reconciliation between GAAP and Non-GAAP Diluted Net Income (Loss) per share
2026
2025
Diluted net loss per share
$
(0.39)
$
(0.60)
Discontinued operations
—
(0.01)
Diluted net loss per share from continuing operations
Reconciliation between GAAP and Non-GAAP Subscription Service Gross Margin Percentage
2026
2025
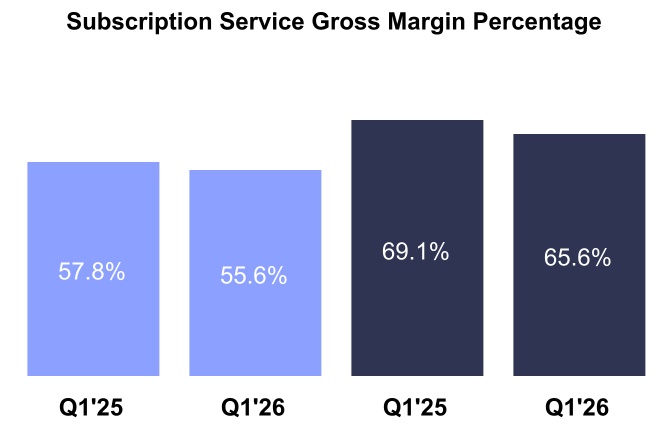
Subscription Service Gross Margin Percentage
55.6
%
57.8
%
Subscription Service Gross Margin
$
43,669
$
39,510
Depreciation and amortization
7,422
7,595
Stock-based compensation
184
127
Severance
208
—
Non-GAAP Subscription Service Gross Margin
$
51,483
$
47,232
Non-GAAP Subscription Service Gross Margin Percentage
65.6
%
69.1
%
LIQUIDITY AND CAPITAL RESOURCES
Our primary sources of liquidity are cash and cash equivalents. As of March 31, 2026, we had cash and cash equivalents of $77.2 million. Cash and cash equivalents consist of highly liquid investments with maturities of 90 days or less, including money market funds.
Cash used in operating activities was $16.6 million for the three months ended March 31, 2026, compared to $17.2 million for the three months ended March 31, 2025. The decrease in cash used in operating activities was primarily driven by improved profitability from our core operations, partially offset by an increased investment in inventory to support anticipated customer demand.
Cash used in investing activities was $3.0 million for the three months ended March 31, 2026 compared to $5.7 million for the three months ended March 31, 2025. Cash used in investing activities during the three months ended March 31, 2026 included capital expenditures of $2.4 million for developed technology costs associated with our software platforms and capital expenditures of $0.3 million for fixed assets. The greater amount of cash used in investing activities during the three months ended March 31, 2025 was largely driven by the GoSkip Asset Acquisition.
Cash provided by financing activities was $17.8 million for the three months ended March 31, 2026, compared to $10.7 million for the three months ended March 31, 2025. Cash provided by financing activities during the three months ended March 31, 2026 primarily consisted of the net proceeds from the sale of the 2031 Notes of $257.1 million (net of issuance costs), partially offset by $206.2 million used to repurchase a portion of the 2027 Notes and $33.1 million used to repurchase shares of the Company's common stock. Cash provided by financing activities during the three months ended March 31, 2025 primarily consisted of the net proceeds from the sale of the 2030 Notes of $111.1 million (net of issuance costs), partially offset by the repayment in full of $93.6 million principal amount outstanding under the Credit Facility plus accrued interest and prepayment premium. We do not have any off-balance sheet arrangements or obligations.
Over the next 12 months our total contractual obligations are $84.2 million, consisting of purchase commitments for normal operations (purchase of inventory, software licensing, use of external labor, and third-party cloud services) of $63.8 million, interest payments of $14.9 million and principal payments of $2.9 million related to long-term debt, and facility lease obligations of $2.6 million. We believe our existing cash and cash equivalents, together with cash flows expected to be generated by our operations, will be sufficient to fund these commitments.
Our non-current contractual obligations are $510.1 million, consisting of purchase commitments for normal operations (purchase of inventory, software licensing, use of external labor, and third-party cloud services) of $14.3 million, interest payments of $54.1 million and principal payments of $433.0 million related to long-term debt, and facility leases of $8.7 million. Refer to “Note 7 — Debt” of the notes to interim condensed consolidated financial statements in "Part I, Item 1. Financial Statements (unaudited)" of this Quarterly Report for additional information. We believe our existing cash and cash equivalents, together with cash flows expected to be generated by our operations, and if necessary, equity, equity-linked, or debt financing arrangements, will be sufficient to fund these commitments. Our actual cash needs will depend on many factors, including our rate of revenue growth, growth of our SaaS revenues, the timing and extent of spending to support our product development and acquisition integration efforts, the timing of introductions of new products and enhancements to existing products, market acceptance of our products, and the factors described above in "Part I, Item 2. Management's Discussion and
Analysis of Financial Condition and Results of Operations”, elsewhere in this Quarterly Report, in the 2025 Annual Report, and in our other filings with the SEC.
From time to time, we may seek to raise additional capital through equity, equity-linked, and debt financing arrangements. In addition, our board of directors and management regularly evaluate our business, strategy, and financial plans and prospects. As part of this evaluation, the board of directors and management periodically consider strategic alternatives to maximize value for our shareholders, including strategic transactions such as an acquisition, or a sale or spin-off of non-strategic company assets or businesses. We cannot provide assurance that any additional financing or strategic alternatives will be available to us on acceptable terms or at all.
CRITICAL ACCOUNTING POLICIES AND ESTIMATES
Our financial statements are based on the application of accounting principles generally accepted in the United States of America. GAAP requires the use of estimates, assumptions, judgments and subjective interpretations of accounting principles that have an impact on the assets, liabilities, revenue, and expense amounts reported. We believe our use of estimates and underlying accounting assumptions adhere to GAAP and are consistently applied. Valuations based on estimates are reviewed for reasonableness and adequacy on a consistent basis. Significant items subject to these estimates and assumptions include revenue recognition, the recognition and measurement of assets acquired and liabilities assumed in business combinations and asset acquisitions at fair value, identifiable intangible assets and goodwill, valuation allowances for receivables, and valuation of excess and obsolete inventories. Actual results could differ from these estimates. Our estimates are subject to uncertainties, including those associated with market conditions, risks and trends. Refer to "Part II, Item 1A. Risk Factors" of this Quarterly Report for additional information. Our critical accounting policies have not changed materially from the discussion of those policies included under “Critical Accounting Policies and Estimates” in our 2025 Annual Report.
Item 3. QUANTITATIVE AND QUALITATIVE DISCLOSURES ABOUT MARKET RISK
Foreign Currency Exchange Risk
Our primary exposures relate to certain non-dollar denominated sales and operating expenses in Canada, Europe, Asia, and Australia. These primary currencies are the Great British Pound, the Euro, the Swiss Franc, the Serbian Dinar, the Australian dollar, the New Zealand dollar, the Singapore dollar, the Canadian dollar, the Indian Rupee, the Japanese Yen, the Polish Zloty, and the Chinese Renminbi. Accordingly, changes in exchange rates may negatively affect our revenue and net loss as expressed in U.S. dollars. We also have foreign currency risk related to foreign currency transactions and monetary assets and liabilities, including intercompany balances denominated in currencies that are not the functional currency. We have experienced and will continue to experience fluctuations in our net loss as a result of gains (losses) on these foreign currency transactions and the remeasurement of monetary assets and liabilities. As of March 31, 2026, the impact of foreign currency exchange rate changes on our revenues and net loss was not material. Additionally, as of March 31, 2026, we estimated that a 10 percent change in exchange rates against the U.S. dollar would not have a material impact on earnings, cash flows, or fair values over a one-year period, and we have not engaged in any foreign currency hedging transactions.
Interest Rate Risk
As of March 31, 2026, we had $2.9 million, $53.0 million, $115.0 million, and $265.0 millionin aggregate principal amount outstanding on the 2026 Notes, the 2027 Notes, the 2030 Notes, and the 2031 Notes, respectively.
We carry the Senior Notes at face value less unamortized debt issuance costs on the condensed consolidated balance sheets. The fair value of the Senior Notes are subject to interest rate risk, market risk, and other factors due to their conversion features. In particular, the fair value of the Senior Notes changes when interest rates change or the market price of our stock fluctuates, with the fair value of the Senior Notes generally increasing as our stock price increases and generally decreasing as our stock price declines. Despite the effects of interest rate and market value changes on the Senior Notes’ fair value, we have no financial statement risk associated with changes in interest rates related to the Senior Notes because they bear interest at fixed rates. At March 31, 2026, a hypothetical 10 percent change in interest rates would not have a material impact on earnings or cash flows over a one-year period.
Our management, with the participation of our Chief Executive Officer and Chief Financial Officer, evaluated the effectiveness of our disclosure controls and procedures (as defined in Rules 13a-15(e) and 15d-15(e) under the Exchange Act) as of March 31, 2026. Based on that evaluation, our Chief Executive Officer and Chief Financial Officer concluded that our disclosure controls and procedures were effective as of March 31, 2026.
Changes in Internal Control Over Financial Reporting
Our management, with the participation of our Chief Executive Officer and Chief Financial Officer, did not identify any changes that occurred in our internal control over financial reporting during the quarter ended March 31, 2026, that have materially affected, or are reasonably likely to materially affect, our internal control over financial reporting.
Part II - OTHER INFORMATION
Item 1. LEGAL PROCEEDINGS
The information in "Note 11 — Commitments and Contingencies” of the notes to interim condensed consolidated financial statements in Part I, Item 1. "Financial Statements (unaudited)" is incorporated herein by reference. We do not believe that we have any pending litigation that would have a material adverse effect on our financial condition or results of operations.
Item 1A. RISK FACTORS
The risks described in the Part I, Item 1A. "Risk Factors” section of our 2025 Annual Report could materially and adversely affect our business, financial condition, and results of operations, and the trading price of our common stock could decline. Except as modified, updated, or supplemented below, there have been no material changes to the Risk Factors described in our 2025 Annual Report.
The trading price and volume of our common stock has experienced, and may continue to experience, volatility, which could result in losses for our shareholders.
The trading price and volume of our common stock has experienced, and may continue to experience, volatility, which could result in losses for our shareholders. Additionally, such volatility could limit our ability to finance strategic transactions, including acquisitions, using our common stock, potentially impacting our ability to pursue valuable opportunities. A number of factors can impact the trading price of our common stock, including:
•the actual or perceived impact of uncertainties, volatility, and economic disruption created by macroeconomic conditions and geopolitical events, including, inflation, recession, interest rate fluctuations, actual and potential shifts in and uncertainties with respect to U.S. and foreign trade policies (including new or increased tariffs or other trade restrictions implemented by the U.S. or retaliatory trade measures or tariffs implemented by other countries), actual or anticipated military or political conflicts (including the Russian-Ukraine war, tensions with China and between China and Taiwan, hostilities in the Middle East) and global pandemics or other public health crises, on our business, our customers, and the industries in which we operate;
•actual or anticipated fluctuations in our financial condition and results of operations (including shortfalls or changes in expectations about, our revenue, gross margins, earnings, ARR, sales of our product and service offerings or other key performance metrics;
•the performance and prospects of major customers;
•our quarterly or annual financial results or those of other companies operating in our industries;
•the impact if our operating results or key metrics fall below the expectations of investors or securities analysts or below any guidance we may provide to the market;
•investor perception of us and the industries in which we operate;
•the contents of published research reports about us or the industries in which we operate;
•any increased indebtedness we may incur in the future;
•operating and stock performance of other companies that investors deem comparable to us (and changes in their market valuations) and overall performance of the equity markets;
•announcements by us or our competitors of significant contracts, acquisitions, dispositions, strategic relationships, or capital commitments; and
•litigation and governmental investigations.
In addition, the market for technology stocks or the stock market in general has experienced and may continue to experience uneven investor confidence, which may cause the trading price for our common stock to decline for reasons unrelated to our operating performance.
Item 2. UNREGISTERED SALES OF EQUITY SECURITIES AND USE OF PROCEEDS
In February 2026, the Company announced that its Board of Directors authorized a share repurchase program pursuant to which the Company may repurchase up to $100.0 million of its common stock in open market purchases, privately negotiated transactions, block trades, accelerated share repurchase transactions, or by other means, including under Rule 10b5-1 plans. As of March 31, 2026, the Company had repurchased 2,089,905shares of its common stock in privately negotiated transactions with or through one or more affiliates of the initial purchasers at a price of $15.85 per share, for a total of approximately $33.1 million under this program.
All share repurchases were made under this publicly announced program, and there are no other programs under which the Company repurchases shares. The table below presents a summary of the Company's purchases of its common stock for the time periods presented:
Period
Total Number of Shares Purchased
Average Price Paid Per Share
Total Number of Shares Purchased as Part of Publicly Announced Plans or Programs
Approximate Dollar Value of Shares That May Yet Be Purchased Under the Plans or Programs
January 1, 2026 - January 31, 2026
—
—
—
—
February 1, 2026 - February 28, 2026
—
—
—
—
March 1, 2026 - March 31, 2026
2,089,905
$
15.85
2,089,905
$
66,875,000
Total
2,089,905
2,089,905
Item 5. OTHER INFORMATION
Director and Officer Trading Arrangements
During the three months ended March 31, 2026, none of the Company’s directors or officers (as defined in Rule 16a-1(f) of the Exchange Act) adopted, modified, or terminated a “Rule 10b5-1 trading arrangement” or “non-Rule 10b5-1 trading arrangement” (as defined in Item 408 of Regulation S-K), except as follows:
On March 3, 2026, Cathy King, our Chief Legal Officer and Corporate Secretary, modified her March 14, 2025, trading plan to change the price limits for sales under the plan and extend the plan end date. The modified plan is intended to satisfy the affirmative defense of Rule 10b5-1(c), provides for the sale of up to 20,000 shares upon the exercise of stock options, and will expire on July 29, 2026, subject to early termination for certain specified events set forth in the plan.
Pursuant to the requirements of the Securities Exchange Act of 1934, the registrant has duly caused this report to be signed on its behalf by the undersigned thereunto duly authorized.